apwg trends report
TRANSCRIPT
4th Quarter
2016
October – December 2016
Published Feb. 23, 2017
Phishing Activity Trends Report
Unifying the
Global Response
To Cybercr ime
Phishing Activity Trends Report
4th Quarter 2016
w w w . a p w g . o r g • i n f o @ a p w g . o r g
2
Phishing Activity Trends Report, 4th Quarter 2016
Table of Contents
Statistical Highlights for 4th Quarter 2016 3
Phishing E-mail Reports and Phishing Site Trends 4
Brand-Domain Pairs Measurement 6
Brands & Industries Targeted by
Phishing Attacks 7
Use of Domain Names for Phishing 8
Phishing and Identity Theft in Brazil 10
Crimeware and Malware 13
APWG Phishing Trends Report Contributors 14
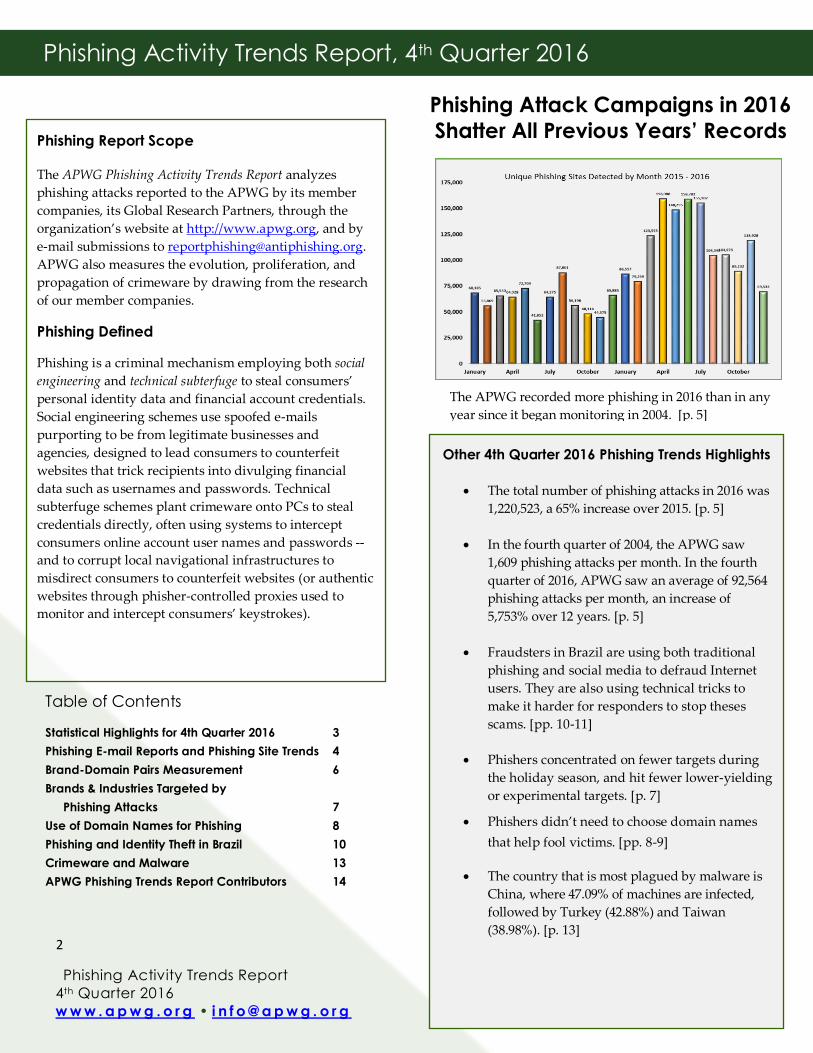
The APWG recorded more phishing in 2016 than in any
year since it began monitoring in 2004. [p. 5]
Phishing Attack Campaigns in 2016
Shatter All Previous Years’ Records
Phishing Report Scope
The APWG Phishing Activity Trends Report analyzes
phishing attacks reported to the APWG by its member
companies, its Global Research Partners, through the
organization’s website at http://www.apwg.org, and by
e-mail submissions to [email protected].
APWG also measures the evolution, proliferation, and
propagation of crimeware by drawing from the research
of our member companies.
Phishing Defined
Phishing is a criminal mechanism employing both social
engineering and technical subterfuge to steal consumers’
personal identity data and financial account credentials.
Social engineering schemes use spoofed e-mails
purporting to be from legitimate businesses and
agencies, designed to lead consumers to counterfeit
websites that trick recipients into divulging financial
data such as usernames and passwords. Technical
subterfuge schemes plant crimeware onto PCs to steal
credentials directly, often using systems to intercept
consumers online account user names and passwords --
and to corrupt local navigational infrastructures to
misdirect consumers to counterfeit websites (or authentic
websites through phisher-controlled proxies used to
monitor and intercept consumers’ keystrokes).
Other 4th Quarter 2016 Phishing Trends Highlights
• The total number of phishing attacks in 2016 was
1,220,523, a 65% increase over 2015. [p. 5]
• In the fourth quarter of 2004, the APWG saw
1,609 phishing attacks per month. In the fourth
quarter of 2016, APWG saw an average of 92,564
phishing attacks per month, an increase of
5,753% over 12 years. [p. 5]
• Fraudsters in Brazil are using both traditional
phishing and social media to defraud Internet
users. They are also using technical tricks to
make it harder for responders to stop theses
scams. [pp. 10-11]
• Phishers concentrated on fewer targets during
the holiday season, and hit fewer lower-yielding
or experimental targets. [p. 7]
• Phishers didn’t need to choose domain names
that help fool victims. [pp. 8-9]
• The country that is most plagued by malware is
China, where 47.09% of machines are infected,
followed by Turkey (42.88%) and Taiwan
(38.98%). [p. 13]
Phishing Activity Trends Report
4th Quarter 2016
w w w . a p w g . o r g • i n f o @ a p w g . o r g
3
Phishing Activity Trends Report, 4th Quarter 2016
The APWG continues to refine its tracking and reporting methodology and to incorporate new data sources into our
reports. APWG tracks and reports the number of unique phishing reports (email campaigns) it receives, in addition
to the number of unique phishing sites found. An e-mail campaign is a unique e-mail sent out to multiple users,
directing them to a specific phishing web site (multiple campaigns may point to the same web site). APWG counts
unique phishing report e-mails as those found in a given month that have the same subject line in the e-mail.
The APWG also tracks the number of unique phishing websites. This is now determined by the unique base URLs of
the phishing sites. (A single phishing site may be advertised as thousands of customized URLS, all leading to
basically the same attack destination.) APWG additionally tracks crimeware instances (unique software applications
as determined by MD5 hash of the crimeware sample), as well as unique sites that are distributing crimeware
(typically via browser drive-by exploits). The APWG Phishing Activity Trends Report also includes statistics on rogue
anti-virus software, desktop infection rates, and related topics.
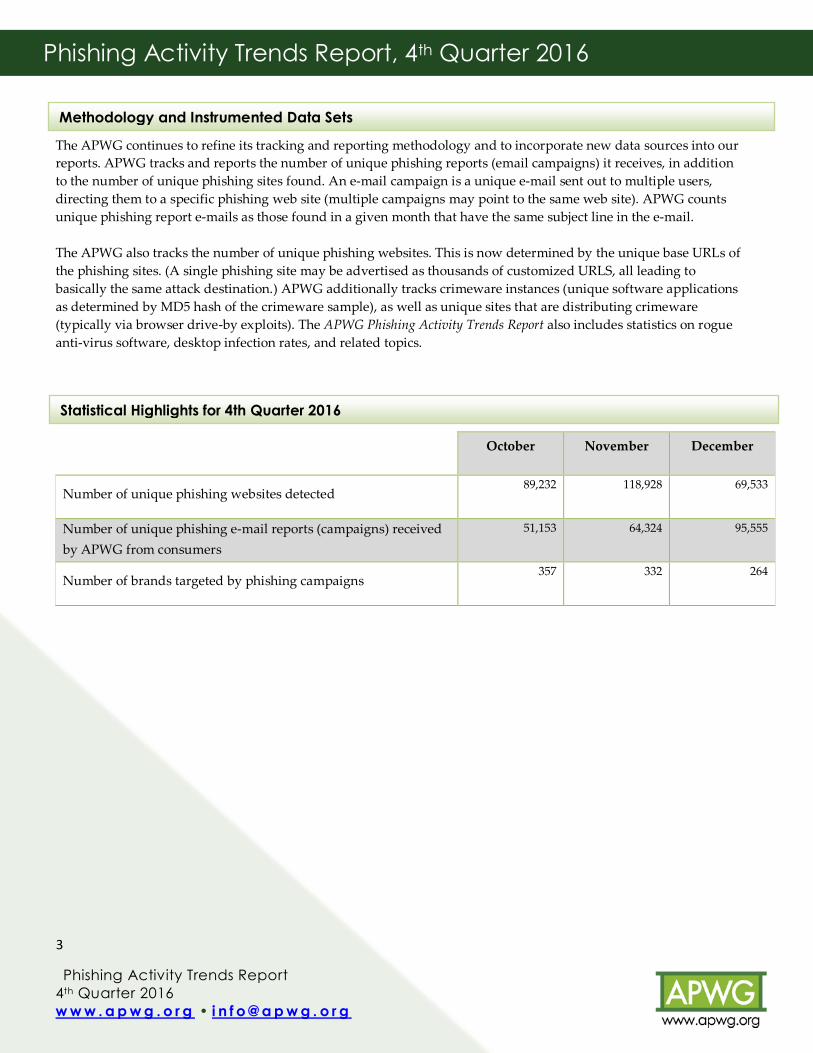
October November December
Number of unique phishing websites detected 89,232 118,928 69,533
Number of unique phishing e-mail reports (campaigns) received
by APWG from consumers
51,153 64,324 95,555
Number of brands targeted by phishing campaigns 357 332 264
Methodology and Instrumented Data Sets
Statistical Highlights for 4th Quarter 2016
Phishing Activity Trends Report
4th Quarter 2016
w w w . a p w g . o r g • i n f o @ a p w g . o r g
4
Phishing Activity Trends Report, 4th Quarter 2016
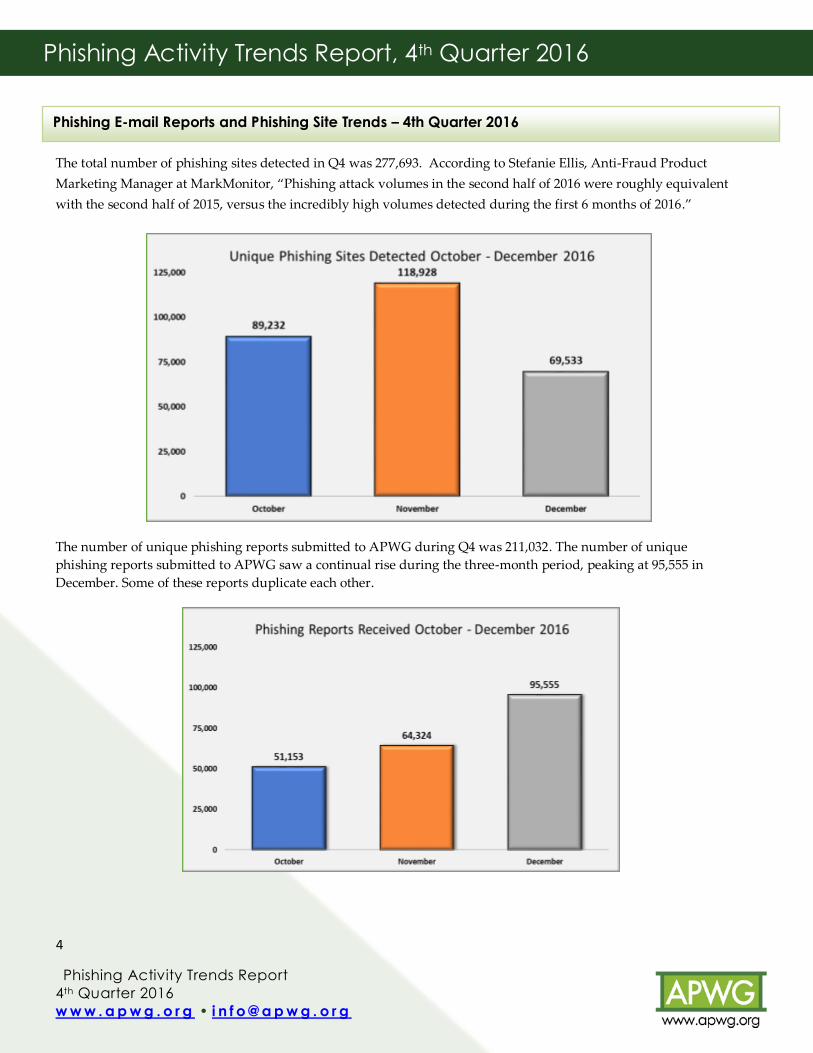
The total number of phishing sites detected in Q4 was 277,693. According to Stefanie Ellis, Anti-Fraud Product
Marketing Manager at MarkMonitor, “Phishing attack volumes in the second half of 2016 were roughly equivalent
with the second half of 2015, versus the incredibly high volumes detected during the first 6 months of 2016.”
The number of unique phishing reports submitted to APWG during Q4 was 211,032. The number of unique
phishing reports submitted to APWG saw a continual rise during the three-month period, peaking at 95,555 in
December. Some of these reports duplicate each other.
Phishing E-mail Reports and Phishing Site Trends – 4th Quarter 2016
Phishing Activity Trends Report
4th Quarter 2016
w w w . a p w g . o r g • i n f o @ a p w g . o r g
5
Phishing Activity Trends Report, 4th Quarter 2016
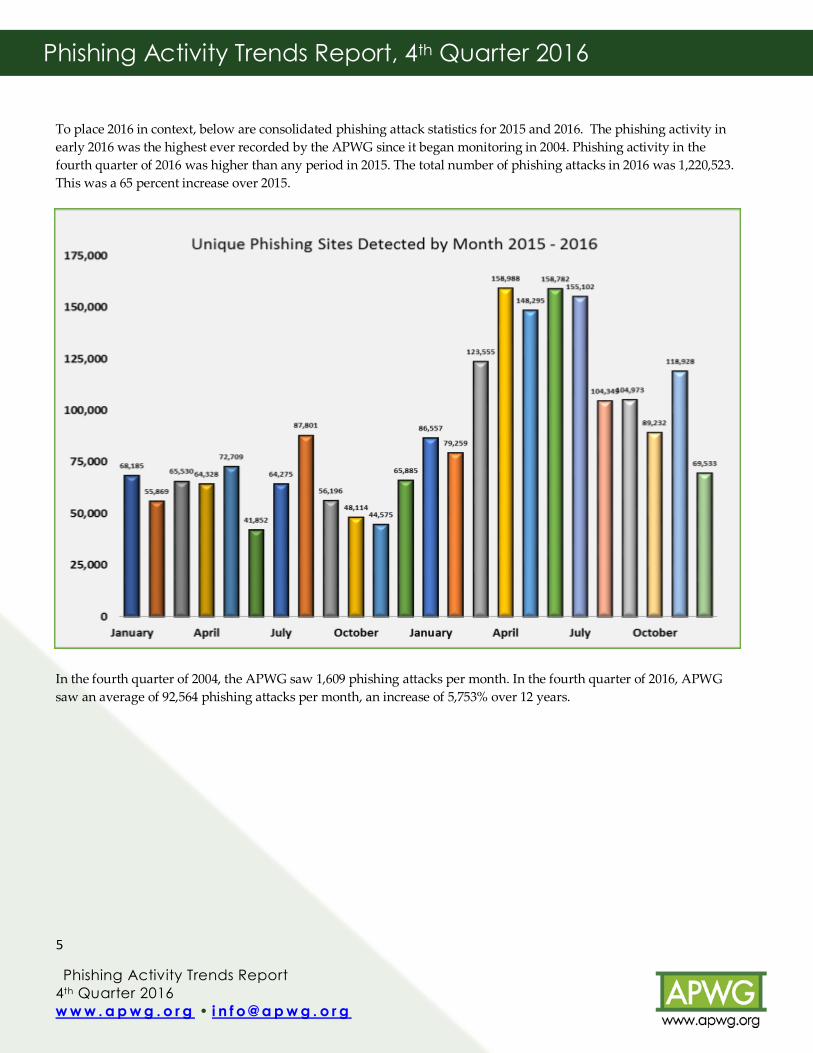
To place 2016 in context, below are consolidated phishing attack statistics for 2015 and 2016. The phishing activity in
early 2016 was the highest ever recorded by the APWG since it began monitoring in 2004. Phishing activity in the
fourth quarter of 2016 was higher than any period in 2015. The total number of phishing attacks in 2016 was 1,220,523.
This was a 65 percent increase over 2015.
In the fourth quarter of 2004, the APWG saw 1,609 phishing attacks per month. In the fourth quarter of 2016, APWG
saw an average of 92,564 phishing attacks per month, an increase of 5,753% over 12 years.
Phishing Activity Trends Report
4th Quarter 2016
w w w . a p w g . o r g • i n f o @ a p w g . o r g
6
Phishing Activity Trends Report, 4th Quarter 2016
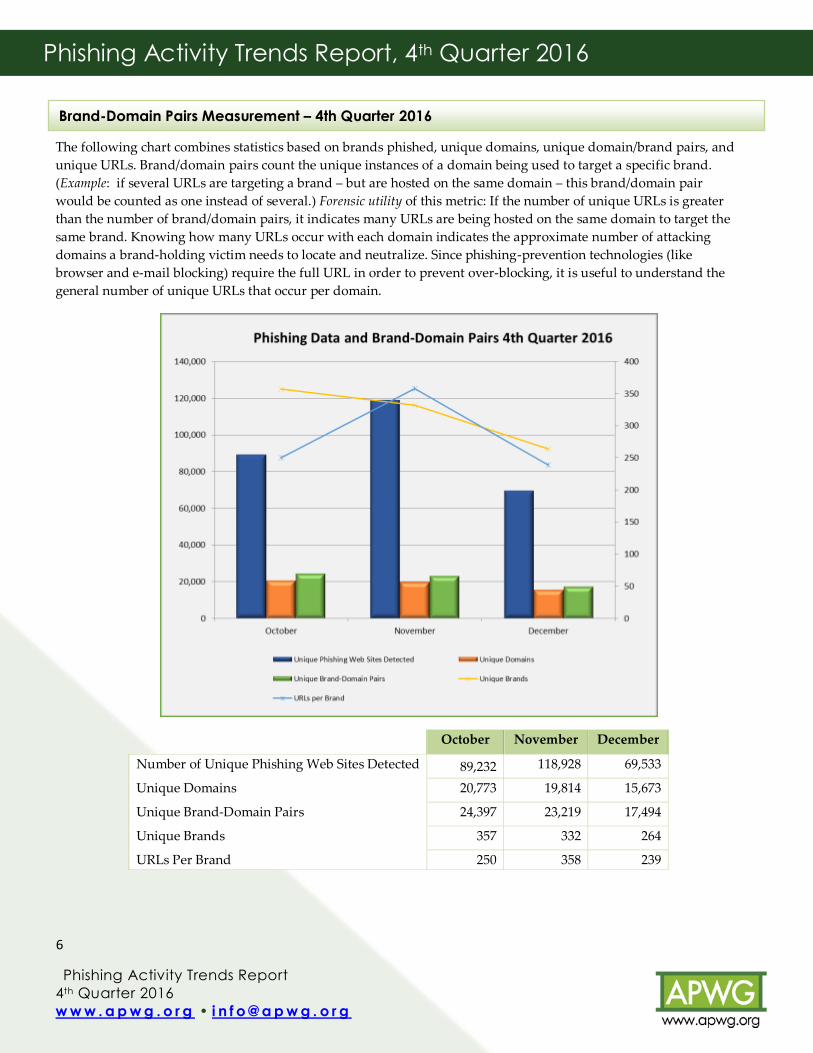
The following chart combines statistics based on brands phished, unique domains, unique domain/brand pairs, and
unique URLs. Brand/domain pairs count the unique instances of a domain being used to target a specific brand.
(Example: if several URLs are targeting a brand – but are hosted on the same domain – this brand/domain pair
would be counted as one instead of several.) Forensic utility of this metric: If the number of unique URLs is greater
than the number of brand/domain pairs, it indicates many URLs are being hosted on the same domain to target the
same brand. Knowing how many URLs occur with each domain indicates the approximate number of attacking
domains a brand-holding victim needs to locate and neutralize. Since phishing-prevention technologies (like
browser and e-mail blocking) require the full URL in order to prevent over-blocking, it is useful to understand the
general number of unique URLs that occur per domain.
October November December
Number of Unique Phishing Web Sites Detected 89,232 118,928 69,533
Unique Domains 20,773 19,814 15,673
Unique Brand-Domain Pairs 24,397 23,219 17,494
Unique Brands 357 332 264
URLs Per Brand 250 358 239
Brand-Domain Pairs Measurement – 4th Quarter 2016
Phishing Activity Trends Report
4th Quarter 2016
w w w . a p w g . o r g • i n f o @ a p w g . o r g
7
Phishing Activity Trends Report, 4th Quarter 2016
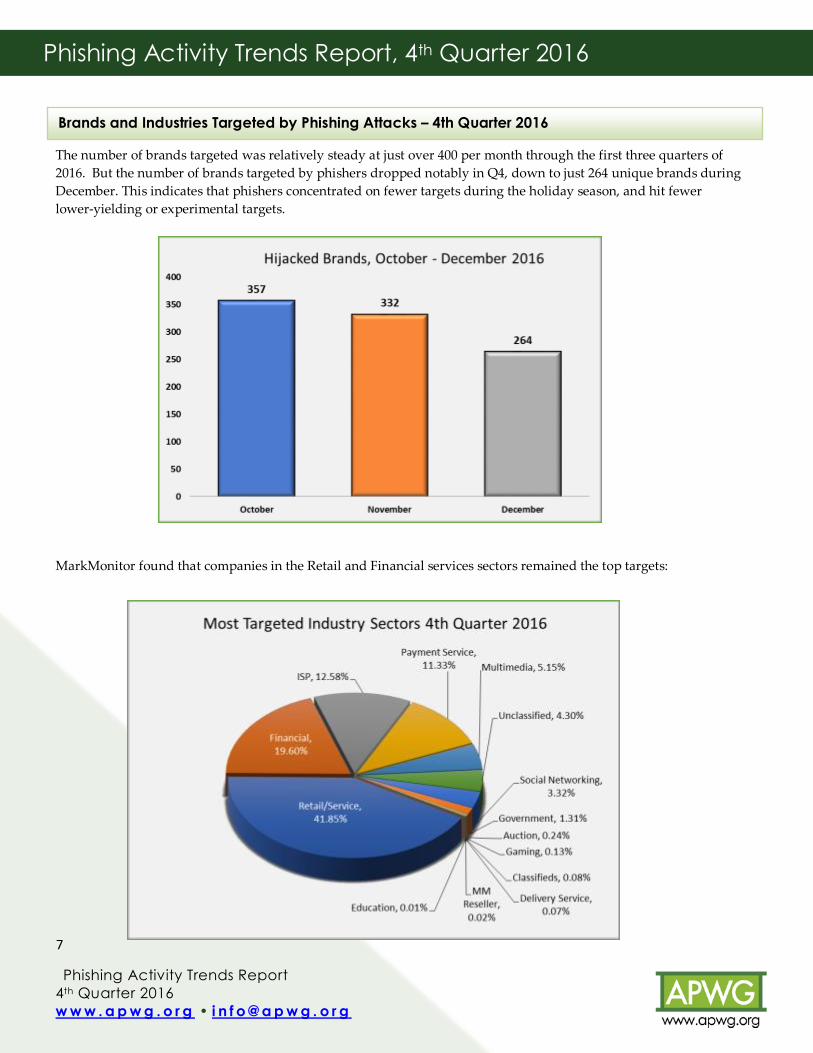
The number of brands targeted was relatively steady at just over 400 per month through the first three quarters of
2016. But the number of brands targeted by phishers dropped notably in Q4, down to just 264 unique brands during
December. This indicates that phishers concentrated on fewer targets during the holiday season, and hit fewer
lower-yielding or experimental targets.
MarkMonitor found that companies in the Retail and Financial services sectors remained the top targets:
Brands and Industries Targeted by Phishing Attacks – 4th Quarter 2016
Phishing Activity Trends Report
4th Quarter 2016
w w w . a p w g . o r g • i n f o @ a p w g . o r g
8
Phishing Activity Trends Report, 4th Quarter 2016
New to this report are insights from APWG member company RiskIQ, a digital threat management firm providing
discovery, intelligence and mitigation of threats associated with an organization’s digital presence. RiskIQ’s analysts
examined the thousands of phishing attack URLs that were submitted to the APWG’s data clearinghouse in 4Q2016.
This reveals where phishers obtained domain names and how the phishers conducting their attacks.
These were the top-10 TLDs where phishing attacks occurred in 4Q2016:
Phishing Domains by TLD, 4Q2016
October November December
.com 6,317 .com 6,757 .com 6,579
.net 596 .net 604 .net 523
.org 570 .org 577 .tk 484
com.br 430 com.br 426 .org 432
.ru 349 .info 350 .info 398
IP addresses 218 .ru 349 com.br 315
.info 216 .tk 345 .top 310
com.ve 200 .ga 314 .ga 302
co.uk 189 .ml 227 .cf 300
.online 168 IP addresses 226 .ml 298
other TLDs 4,359 other TLDs 4,652 other TLDs 4,843
TOTAL 13,612 14,827 14,784
Some of these domains were compromised – the phishers broke into their web servers to plant phishing URLs on
existing web sites. Other domains were likely registered by phishers specifically to support new phishing sites, but
analysis of how many sites fell into which category were not available for this report.
.COM is the largest TLD by far, and contains the most web sites of any TLD, so it expected that .COM will top the
above lists. Domains in .TK, .GA, .ML, and .CF TLDs are offered for free. Most to all of the domains used for
phishing in those TLDs were probably malicious registrations, made by phishers for the purpose of phishing. The
.TOP and .ONLINE TLDs are young, and contain relatively few unique websites; more research will be needed to
understand why these TLDs appear to be attracting relatively larger volumes of reported phishing sites. Further
research is also needed to understand why .BR domains get compromised more often than other ccTLDs that are
larger by zone size.
To gain insight into how phishers use domain names, RiskIQ then analyzed how many domains used for phishing
contained either the name of the target brand or a confusingly similar variation, using sophisticated algorithms
checking for visual and binary similarities as well as computing sequences, permutations and typographical errors.
This tells us whether or not phishers tried to fool Internet users by registering domain names that are confusing—for
example pay5al.com, pay.pal.com, or paypal.sign-in.online, which look like legitimate site Paypal.com.
Use of Domain Names for Phishing – 4th Quarter 2016
Phishing Activity Trends Report
4th Quarter 2016
w w w . a p w g . o r g • i n f o @ a p w g . o r g
9
Phishing Activity Trends Report, 4th Quarter 2016
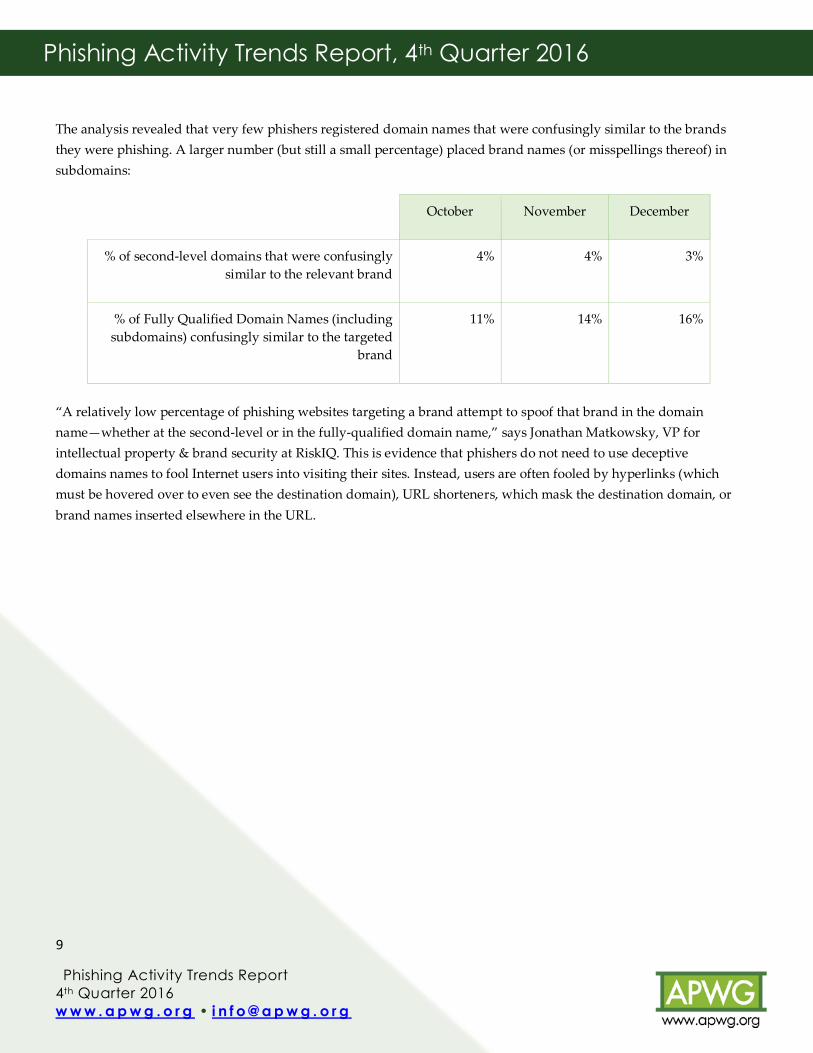
The analysis revealed that very few phishers registered domain names that were confusingly similar to the brands
they were phishing. A larger number (but still a small percentage) placed brand names (or misspellings thereof) in
subdomains:
October November December
% of second-level domains that were confusingly
similar to the relevant brand
4% 4% 3%
% of Fully Qualified Domain Names (including
subdomains) confusingly similar to the targeted
brand
11% 14% 16%
“A relatively low percentage of phishing websites targeting a brand attempt to spoof that brand in the domain
name—whether at the second-level or in the fully-qualified domain name,” says Jonathan Matkowsky, VP for
intellectual property & brand security at RiskIQ. This is evidence that phishers do not need to use deceptive
domains names to fool Internet users into visiting their sites. Instead, users are often fooled by hyperlinks (which
must be hovered over to even see the destination domain), URL shorteners, which mask the destination domain, or
brand names inserted elsewhere in the URL.
Phishing Activity Trends Report
4th Quarter 2016
w w w . a p w g . o r g • i n f o @ a p w g . o r g
10
Phishing Activity Trends Report, 4th Quarter 2016
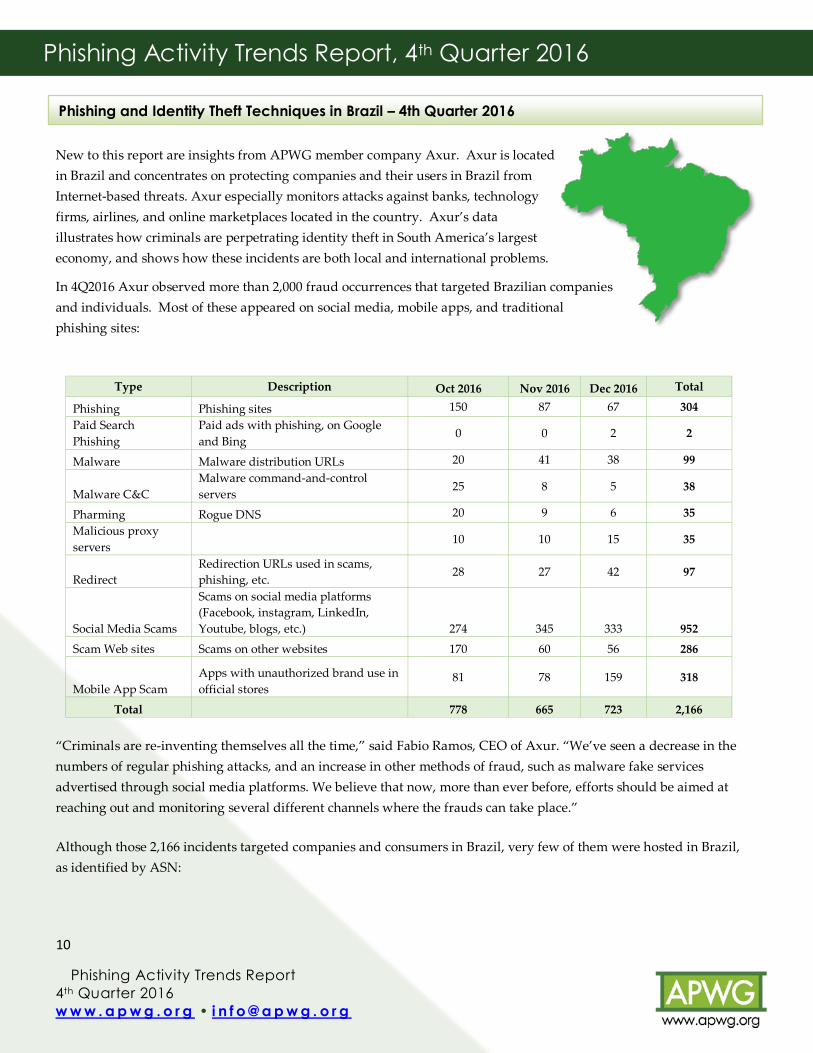
New to this report are insights from APWG member company Axur. Axur is located
in Brazil and concentrates on protecting companies and their users in Brazil from
Internet-based threats. Axur especially monitors attacks against banks, technology
firms, airlines, and online marketplaces located in the country. Axur’s data
illustrates how criminals are perpetrating identity theft in South America’s largest
economy, and shows how these incidents are both local and international problems.
In 4Q2016 Axur observed more than 2,000 fraud occurrences that targeted Brazilian companies
and individuals. Most of these appeared on social media, mobile apps, and traditional
phishing sites:
Type Description Oct 2016 Nov 2016 Dec 2016 Total
Phishing Phishing sites 150 87 67 304
Paid Search
Phishing
Paid ads with phishing, on Google
and Bing 0 0 2 2
Malware Malware distribution URLs 20 41 38 99
Malware C&C
Malware command-and-control
servers 25 8 5 38
Pharming Rogue DNS 20 9 6 35
Malicious proxy
servers 10 10 15 35
Redirect
Redirection URLs used in scams,
phishing, etc. 28 27 42 97
Social Media Scams
Scams on social media platforms
(Facebook, instagram, LinkedIn,
Youtube, blogs, etc.) 274 345 333 952
Scam Web sites Scams on other websites 170 60 56 286
Mobile App Scam
Apps with unauthorized brand use in
official stores 81 78 159 318
Total 778 665 723 2,166
“Criminals are re-inventing themselves all the time,” said Fabio Ramos, CEO of Axur. “We’ve seen a decrease in the
numbers of regular phishing attacks, and an increase in other methods of fraud, such as malware fake services
advertised through social media platforms. We believe that now, more than ever before, efforts should be aimed at
reaching out and monitoring several different channels where the frauds can take place.”
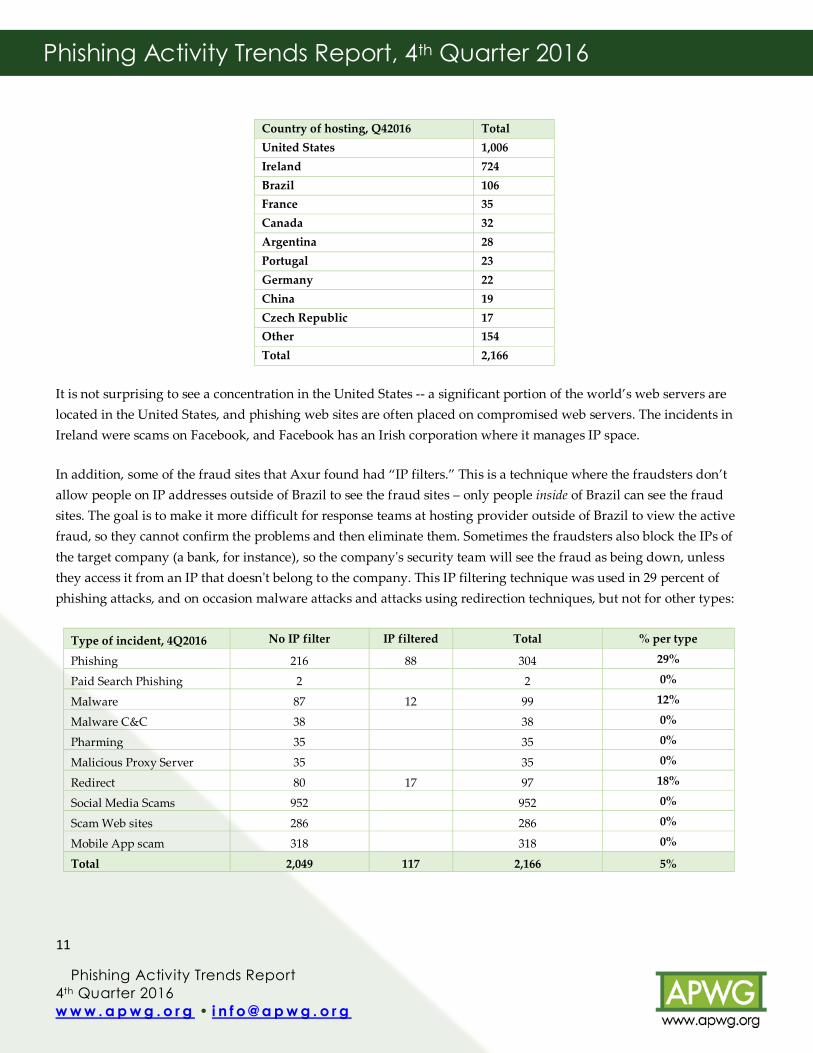
Although those 2,166 incidents targeted companies and consumers in Brazil, very few of them were hosted in Brazil,
as identified by ASN:
Phishing and Identity Theft Techniques in Brazil – 4th Quarter 2016
Phishing Activity Trends Report
4th Quarter 2016
w w w . a p w g . o r g • i n f o @ a p w g . o r g
11
Phishing Activity Trends Report, 4th Quarter 2016
Country of hosting, Q42016 Total
United States 1,006
Ireland 724
Brazil 106
France 35
Canada 32
Argentina 28
Portugal 23
Germany 22
China 19
Czech Republic 17
Other 154
Total 2,166
It is not surprising to see a concentration in the United States -- a significant portion of the world’s web servers are
located in the United States, and phishing web sites are often placed on compromised web servers. The incidents in
Ireland were scams on Facebook, and Facebook has an Irish corporation where it manages IP space.
In addition, some of the fraud sites that Axur found had “IP filters.” This is a technique where the fraudsters don’t
allow people on IP addresses outside of Brazil to see the fraud sites – only people inside of Brazil can see the fraud
sites. The goal is to make it more difficult for response teams at hosting provider outside of Brazil to view the active
fraud, so they cannot confirm the problems and then eliminate them. Sometimes the fraudsters also block the IPs of
the target company (a bank, for instance), so the company's security team will see the fraud as being down, unless
they access it from an IP that doesn't belong to the company. This IP filtering technique was used in 29 percent of
phishing attacks, and on occasion malware attacks and attacks using redirection techniques, but not for other types:
Type of incident, 4Q2016 No IP filter IP filtered Total % per type
Phishing 216 88 304 29%
Paid Search Phishing 2 2 0%
Malware 87 12 99 12%
Malware C&C 38 38 0%
Pharming 35 35 0%
Malicious Proxy Server 35 35 0%
Redirect 80 17 97 18%
Social Media Scams 952 952 0%
Scam Web sites 286 286 0%
Mobile App scam 318 318 0%
Total 2,049 117 2,166 5%
Phishing Activity Trends Report
4th Quarter 2016
w w w . a p w g . o r g • i n f o @ a p w g . o r g
12
Phishing Activity Trends Report, 4th Quarter 2016
Axur’s data illustrates that even when the victims are in a very specific region, criminals use Internet infrastructure
around the globe in order to carry out their attacks. This cross-border crime can only be disrupted by timely
cooperation between the private entities that can detect and shut down the problems: hosting providers, victim
companies, security response companies, and domain registries and registrars.
Phishing Activity Trends Report
4th Quarter 2016
w w w . a p w g . o r g • i n f o @ a p w g . o r g
13
Phishing Activity Trends Report, 4th Quarter 2016
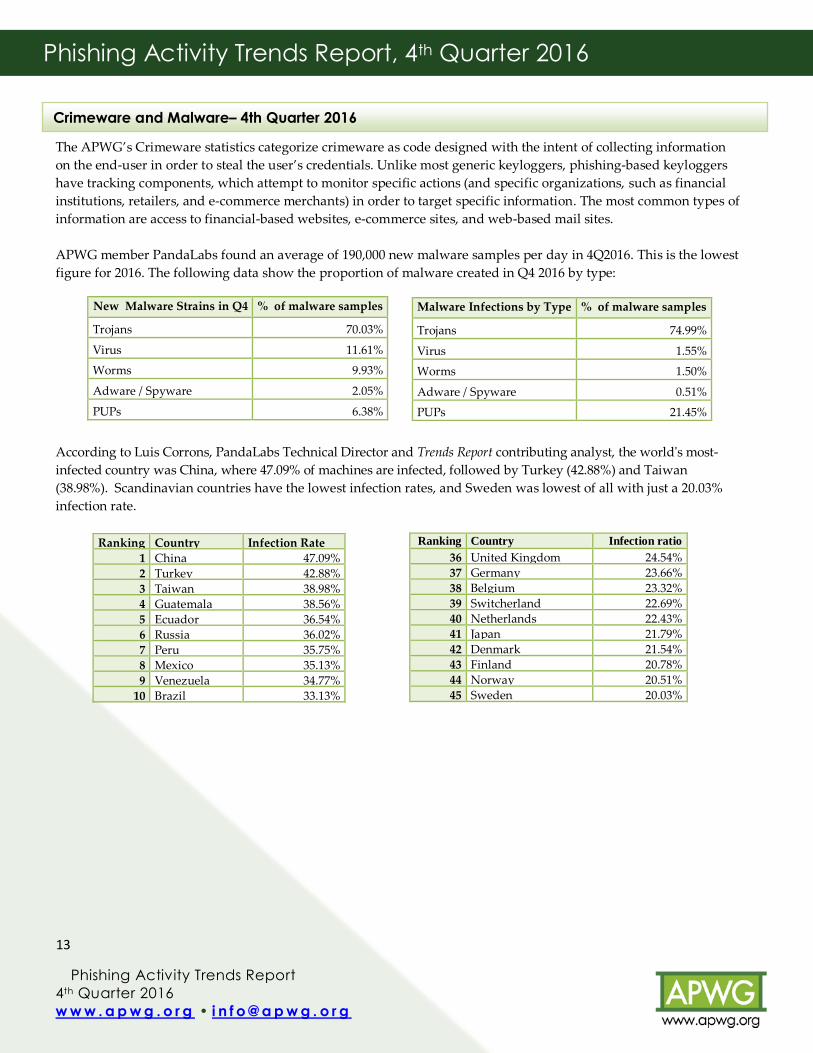
The APWG’s Crimeware statistics categorize crimeware as code designed with the intent of collecting information
on the end-user in order to steal the user’s credentials. Unlike most generic keyloggers, phishing-based keyloggers
have tracking components, which attempt to monitor specific actions (and specific organizations, such as financial
institutions, retailers, and e-commerce merchants) in order to target specific information. The most common types of
information are access to financial-based websites, e-commerce sites, and web-based mail sites.
APWG member PandaLabs found an average of 190,000 new malware samples per day in 4Q2016. This is the lowest
figure for 2016. The following data show the proportion of malware created in Q4 2016 by type:
According to Luis Corrons, PandaLabs Technical Director and Trends Report contributing analyst, the world's most-
infected country was China, where 47.09% of machines are infected, followed by Turkey (42.88%) and Taiwan
(38.98%). Scandinavian countries have the lowest infection rates, and Sweden was lowest of all with just a 20.03%
infection rate.
Crimeware and Malware– 4th Quarter 2016
New Malware Strains in Q4 % of malware samples
Trojans 70.03%
Virus 11.61%
Worms 9.93%
Adware / Spyware 2.05%
PUPs 6.38%
Ranking Country Infection ratio
36 United Kingdom 24.54%
37 Germany 23.66%
38 Belgium 23.32%
39 Switcherland 22.69%
40 Netherlands 22.43%
41 Japan 21.79%
42 Denmark 21.54%
43 Finland 20.78%
44 Norway 20.51%
45 Sweden 20.03%
Ranking Country Infection Rate
1 China 47.09%
2 Turkey 42.88%
3 Taiwan 38.98%
4 Guatemala 38.56%
5 Ecuador 36.54%
6 Russia 36.02%
7 Peru 35.75%
8 Mexico 35.13%
9 Venezuela 34.77%
10 Brazil 33.13%
Malware Infections by Type % of malware samples
Trojans 74.99%
Virus 1.55%
Worms 1.50%
Adware / Spyware 0.51%
PUPs 21.45%
Phishing Activity Trends Report
4th Quarter 2016
w w w . a p w g . o r g • i n f o @ a p w g . o r g
14
Phishing Activity Trends Report, 4th Quarter 2016
APWG Phishing Activity Trends Report Contributors
Panda Security’s mission is to keep
our customers' information and IT
assets safe from security threats,
providing the most effective
protection with minimum resource
consumption.
MarkMonitor, a global leader in
enterprise brand protection, offers
comprehensive solutions and
services that safeguard brands,
reputation and revenue from
online risks.
iThreat provides risk data,
intelligence tools, and analysis to
help its clients protect their
intellectual & Internet properties.
About the APWG
Founded in 2003, the Anti-Phishing Working Group (APWG) is a not-for-profit industry association focused on
eliminating the identity theft and frauds that result from the growing problem of phishing, crimeware, and e-
mail spoofing. Membership is open to qualified financial institutions, retailers, ISPs, solutions providers, the law
enforcement community, government agencies, multi-lateral treaty organizations, and NGOs. There are more
than 2,000 enterprises worldwide participating in the APWG.
APWG maintains it public website, <http://www.antiphishing.org>; the website of the STOP. THINK.
CONNECT. Messaging Convention <http://www.stopthinkconnect.org> and the APWG’s research website
<http://www.ecrimeresearch.org>. These are resources about the problem of phishing and Internet frauds– and
resources for countering these threats. The APWG, a 501(c)6 tax-exempted corporation, was founded by
Tumbleweed Communications, financial services institutions and e-commerce providers. APWG’s first meeting
was in November 2003 in San Francisco and was incorporated in 2004 as an independent corporation controlled
by its board of directors, its executives and its steering committee.
The APWG Phishing Activity Trends Report is published by the APWG. For further information about the APWG, please contact
APWG Deputy Secretary General Foy Shiver at +1.404.434.7282 or [email protected]. For media inquiries related to the content of this
report, please contact APWG Secretary General Peter Cassidy at +1.617.669.1123; Stefanie Ellis at [email protected];
Luis Corrons of Panda at [email protected]; Fabricio Pessôa of Axur, at +55.51.30122987, [email protected]; or
Kari Walker for RiskIQ at +1.703.928.9996, [email protected], +1.703.928.9996.
PWG thanks its contributing members, above, for the data and analyses in this report0.
RiskIQ is a digital threat
management company enabling
organizations to discover,
understand and mitigate known,
unknown, & malicious exposures
across all digital channels.
Axur works to identify and fight
the threats in the cyberspace that
interfere with the interests of
companies, governments ,and
individuals.
Editing & analysis by Greg Aaron, iThreat Cyber Group. Design & editing by Ronnie Manning, Mynt Public Relations.