apv dairy technology dairy technology - magyarország · apv dairy technology your local contact:...
TRANSCRIPT

AP
V D
airy Te
chn
olo
gy
Your local contact:
APVPasteursvej 1 DK-8600 Silkeborg, Denmark Phone: +45 70 278 278 Fax: +45 70 278 330
For more information about our worldwide locations, approvals, certifications, and local representatives, please visit www.apv.com.
Copyright ©2002, 2008 SPX Corporation9002-01-07-2008-GBThe information contained in this document, including any specifications and other product details, are subject to change without notice. While we have taken care to ensure the information is accurate at the time of going to press, we assume no responsibility for errors or omissions nor for any damages resulting from the use of the information contained herein.
Dairy Technology
1072948 Omslag.indd 1 04/07/08 9:00:48
Table of contents
MILKComposition of Danish Cow’s Milk 2002 . . . . . . . . . . 3Density of Milk . . . . . . . . . . . . . . . . . . . . . . . . . . . . . . 3Yields from Whole Milk etc . . . . . . . . . . . . . . . . . . . . . 4Determination of Fat Content in Milk and Cream . . . . 4Determination of Protein Content in Milk and Cream 6Detection of Preservatives and Antibiotics in Milk . . . 7Acidity of Milk . . . . . . . . . . . . . . . . . . . . . . . . . . . . . . . 7The Phosphatase Test . . . . . . . . . . . . . . . . . . . . . . . . 10Standardisation of Whole Milk and Cream . . . . . . . . . 10Standard Deviation . . . . . . . . . . . . . . . . . . . . . . . . . . . 13Calculating the Extent of Random Sampling . . . . . . . 14
GENEREL MILK PROCESSINGPasteurisation . . . . . . . . . . . . . . . . . . . . . . . . . . . . . . . 17Homogenisation . . . . . . . . . . . . . . . . . . . . . . . . . . . . . 18
UHT/ESL TREATMENT OF MILKUHT/ESL . . . . . . . . . . . . . . . . . . . . . . . . . . . . . . . . . . . 21ESL - Extended Shelf Life . . . . . . . . . . . . . . . . . . . . . 21UHT - Ultra High Temperature . . . . . . . . . . . . . . . . . . 24High Heat Infusion Steriliser . . . . . . . . . . . . . . . . . . . . 31
BUTTERComposition of Butter . . . . . . . . . . . . . . . . . . . . . . . . 33Yields . . . . . . . . . . . . . . . . . . . . . . . . . . . . . . . . . . . . . 33Buttermaking . . . . . . . . . . . . . . . . . . . . . . . . . . . . . . . 33Calculating Butter Yield . . . . . . . . . . . . . . . . . . . . . . . 36Churning Recovery . . . . . . . . . . . . . . . . . . . . . . . . . . . 36Adjusting Moisture Content in Butter . . . . . . . . . . . . . 39Determination of Salt Content in Butter . . . . . . . . . . . 39lodine Value and Refractive Index . . . . . . . . . . . . . . . 40Fluctuations in lodine Value and
Temperature Treatment of Cream . . . . . . . . . . . . . . 40
CHEESECheese Varieties . . . . . . . . . . . . . . . . . . . . . . . . . . . . . 42Cheesemaking . . . . . . . . . . . . . . . . . . . . . . . . . . . . . . 43Standardisation of Cheesemilk and Calculation of
Cheese Yield . . . . . . . . . . . . . . . . . . . . . . . . . . . . . . 43Utilisation Value of Skimmilk in Cheesemaking . . . . . 47Strength, Acidity and Temperature of Brine for Salt ing 48
1072948 Indmad.indd 1 03/07/08 14:28:33
2
MEMBRANE FILTRATIONDefinitions . . . . . . . . . . . . . . . . . . . . . . . . . . . . . . . . . . 50Membrane Processes . . . . . . . . . . . . . . . . . . . . . . . . 50Microparticulation and LeanCreme™ . . . . . . . . . . . . 54Membrane Elements . . . . . . . . . . . . . . . . . . . . . . . . . 59CIP . . . . . . . . . . . . . . . . . . . . . . . . . . . . . . . . . . . . . . . 61Milk and Whey Composition . . . . . . . . . . . . . . . . . . . 65
CLEANING AND DISINFECTINGCIP Cleaning in General . . . . . . . . . . . . . . . . . . . . . . . 68Cleaning Methods . . . . . . . . . . . . . . . . . . . . . . . . . . . 71CIP Cleaning Programs for Pipes and Tanks . . . . . . . 72CIP Cleaning Programs for Plate Pasteurisers . . . . . . 74General Comments to Defects/Faults
in CIP Cleaning . . . . . . . . . . . . . . . . . . . . . . . . . . . . 77Manual Cleaning . . . . . . . . . . . . . . . . . . . . . . . . . . . . . 77Check of the Cleaning Effect . . . . . . . . . . . . . . . . . . . 77Control of Cleaning Solutions . . . . . . . . . . . . . . . . . . . 79Dairy Effluent . . . . . . . . . . . . . . . . . . . . . . . . . . . . . . . 82
TECHNICAL INFORMATIONStainless Steel Pipes . . . . . . . . . . . . . . . . . . . . . . . . . 84Friction Loss Equivalent in m
Straight Stainless Steel Pipe for One Fitting . . . . . 85Velocity in Stainless Steel Pipes . . . . . . . . . . . . . . . . . 85Volume in Stainless Steel Pipes . . . . . . . . . . . . . . . . . 86Friction Loss in m H2O per 100 m Straight
Pipe with Different Pipe Dimensions and Capacities (Non-stainless steel) . . . . . . . . . . . . . . . . . . . . . . . . 87
UNITS OF MEASURE The MKSA System . . . . . . . . . . . . . . . . . . . . . . . . . . 89The SI Unit System . . . . . . . . . . . . . . . . . . . . . . . . . . . 91Tables showing conversion Factors between
SI Units and other Common Unit Systems . . . . . . . 93Input and Output of Electric Motors . . . . . . . . . . . . . . 98Fuel Table . . . . . . . . . . . . . . . . . . . . . . . . . . . . . . . . . . 99Saturated Steam Table . . . . . . . . . . . . . . . . . . . . . . . . 100Prefixes with Symbols used in Forming
Decimal Multiples and Submultiples . . . . . . . . . . . 103Thermometric Scales . . . . . . . . . . . . . . . . . . . . . . . . . 104Conversion Table . . . . . . . . . . . . . . . . . . . . . . . . . . . . 105
1072948 Indmad.indd 2 03/07/08 14:28:33

3
MILK
Composition of Danish Cow’s Milk 2002
Fat . . . . . . . . . . . . . . . . . . . . . . . . . . . . . approx . 4 .3%Protein . . . . . . . . . . . . . . . . . . . . . . . . . . - 3 .4%Lactose . . . . . . . . . . . . . . . . . . . . . . . . . . - 4 .8%Ash . . . . . . . . . . . . . . . . . . . . . . . . . . . . . - 0 .7%Citric acid . . . . . . . . . . . . . . . . . . . . . . . . - 0 .2%Water . . . . . . . . . . . . . . . . . . . . . . . . . . . - 86 .6%
Density of Milk The density of milk is equivalent to the weight in kilos of 1 litre of milk at a temperature of 15°C .The easiest way to determine the density is to use a spe-cial type of hydrometer called a lactometer . The upper part of the lactometer is provided with a scale showing the lactometer degree, which, when added as the second and third decimal to 1 .000 kg, indicates the density of milk, ie, a lactometer degree of 30 corresponds to a density of 1 .030 kg/litre .The lactometer is lowered into the milk and when it has come to rest, the lactometer degree can be read on the scale at the surface level of the milk .As milk contains fat and as the density depends on the physical state of the fat, the milk should be healed to 40°C and then cooled to 15°C before the density is determined . If the, determination of the density is not carried out at exactly 15°C, the reading must be converted by means of a correction table .The density of milk depends upon its composition, and can be calculated as follows:
100 % fat + % protein + % lactose+acid + % ash + % water
0 .93 1 .45 1 .53 2 .80 1 .0
Density:1 litre whole milk . . . . . . . . . . . . . . . . . approx . 1 .032 kg - skimmilk . . . . . . . . . . . . . . . . . . . - 1 .035 kg - buttermilk . . . . . . . . . . . . . . . . . . - 1 .033 kg - skimmed whey 6 .5% TS . . . . . . - 1 .025 kg - cream with 20% fat . . . . . . . . . . - 1 .013 kg - cream with 30% fat . . . . . . . . . . - 1 .002 kg - cream with 40% fat . . . . . . . . . . - 0 .993 kg
1072948 Indmad.indd 3 03/07/08 14:28:33

4
Yields from Whole Milk etc.100 kg standardised whole milk yields:with 4 .0 % fat approx . 4 .75 kg butter - 4 .0 % - - 13 .0 - whole milk powder - 3 .0 % - - 9 .5 - 45% cheese *) - 2 .5 % - - 9 .1 - 40% - *) - 1 .6 % - - 8 .3 - 30% - *) - 1 .0 % - - 8 .0 - 20% - *) - 0 .45 % - - 7 .4 - 10% - *)
100 kg skimmilk with 9.5% solids yields: approx . 9 .8 kg skimmilk powder - 6 .9 - skimmilk cheese *) - 7 .5 - raw casein - 3 .5 - dried casein
100 kg buttermilk with 9.0% solids yields: approx . 9 .3 kg buttermilk powder
100 kg unskimmed whey with approx. 7.0% solids yields: approx . 0 .4 kg whey butter - 7 .2 - whey cheese
100 kg skimmed whey with approx. 6.5% solids yields: approx . 6 .7 kg whey powder - 3,5 - raw lactose - 3 .0 - refined lactose - 8 .0 - lactic acid - 2 .2 - WPC 35 - 1 .2 - WPC 60 - 0 .9 - WPC 80*) ripened cheese
Determination of Fat Content in Milk and CreamRöse-Gottlieb (RG)The fat globule membranes are destroyed by ammonia and heat, and the phospholipids are dissolved with etha-nol . After heat treatment, the fat is extracted with a mixture of diethyl ether and light petroleum . Then the solvents are removed by evaporation and the fat content is determined by weighing the mass left after evaporation .
Schmid-Bondzynski-Ratzloff (SBR)This method uses hydrochloric acid instead of ammonia to destroy the fat globule membranes and is used for cheese samples .
1072948 Indmad.indd 4 03/07/08 14:28:34
5
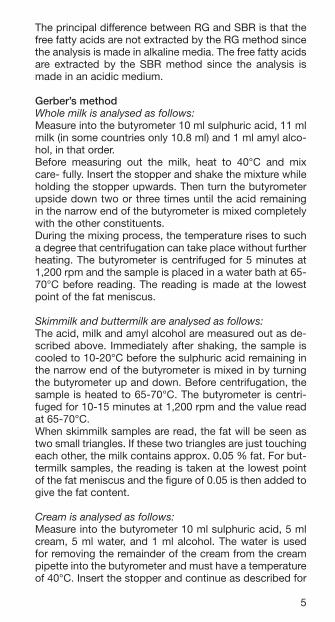
The principal difference between RG and SBR is that the free fatty acids are not extracted by the RG method since the analysis is made in alkaline media . The free fatty acids are extracted by the SBR method since the analysis is made in an acidic medium .
Gerber’s method Whole milk is analysed as follows:Measure into the butyrometer 10 ml sulphuric acid, 11 ml milk (in some countries only 10 .8 ml) and 1 ml amyl alco-hol, in that order .Before measuring out the milk, heat to 40°C and mix care- fully . Insert the stopper and shake the mixture while holding the stopper upwards . Then turn the butyrometer upside down two or three times until the acid remaining in the narrow end of the butyrometer is mixed completely with the other constituents .During the mixing process, the temperature rises to such a degree that centrifugation can take place without further heating . The butyrometer is centrifuged for 5 minutes at 1,200 rpm and the sample is placed in a water bath at 65-70°C before reading . The reading is made at the lowest point of the fat meniscus .
Skimmilk and buttermilk are analysed as follows:The acid, milk and amyl alcohol are measured out as de-scribed above . Immediately after shaking, the sample is cooled to 10-20°C before the sulphuric acid remaining in the narrow end of the butyrometer is mixed in by turning the butyrometer up and down . Before centrifugation, the sample is heated to 65-70°C . The butyrometer is centri-fuged for 10-15 minutes at 1,200 rpm and the value read at 65-70°C .When skimmilk samples are read, the fat will be seen as two small triangles . If these two triangles are just touching each other, the milk contains approx . 0 .05 % fat . For but-termilk samples, the reading is taken at the lowest point of the fat meniscus and the figure of 0 .05 is then added to give the fat content .
Cream is analysed as follows:Measure into the butyrometer 10 ml sulphuric acid, 5 ml cream, 5 ml water, and 1 ml alcohol . The water is used for removing the remainder of the cream from the cream pipette into the butyrometer and must have a temperature of 40°C . Insert the stopper and continue as described for
1072948 Indmad.indd 5 03/07/08 14:28:34
6
whole milk . Before a reading is taken, the bottom of the fat column must be set at zero on the butyrometer by turning the rubber stopper to move it up or down .
MilkoscanThe Danish company N . Foss Electric has developed an instrument, the Milkoscan, for rapid and simultaneous, determination of fat, protein, lactose and water .In this instrument, the sample is diluted and homogenised . Then the mixture passes through a flow cuvette where the different components are measured by their infrared ab-sorption .
Fat at 5 .73 µmProtein at 6 .40 µm Lactose at 9 .55 µm
The value for water is calculated on the basis of the sum of the values for fat, protein, and lactose plus a constant value for mineral content .The instrument requires exact calibration and must be thermostatically controlled .
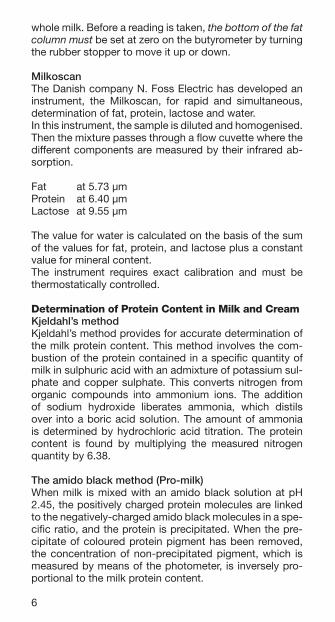
Determination of Protein Content in Milk and Cream Kjeldahl’s methodKjeldahl’s method provides for accurate determination of the milk protein content . This method involves the com-bustion of the protein contained in a specific quantity of milk in sulphuric acid with an admixture of potassium sul-phate and copper sulphate . This converts nitrogen from organic compounds into ammonium ions . The addition of sodium hydroxide liberates ammonia, which distils over into a boric acid solution . The amount of ammonia is determined by hydrochloric acid titration . The protein content is found by multiplying the measured nitrogen quantity by 6 .38 .
The amido black method (Pro-milk)When milk is mixed with an amido black solution at pH 2 .45, the positively charged protein molecules are linked to the negatively-charged amido black molecules in a spe-cific ratio, and the protein is precipitated . When the pre-cipitate of coloured protein pigment has been removed, the concentration of non-precipitated pigment, which is measured by means of the photometer, is inversely pro-portional to the milk protein content .
1072948 Indmad.indd 6 03/07/08 14:28:34
7
This method has been automated in an instrument, the Pro- milk, from N . Foss Electric . The instrument filters out the protein pigment by means of special synthetic filters and a photometer displays the protein percentage directly .
Detection of Preservatives and Antibiotics in MilkThe growth of lactic acid bacteria may be inhibited by the presence in the milk of ordinary antiseptics (such as boric acid, borax, benzoic acid, salicylic acid, salicylates, for-malin, hydrogen peroxide) or antibiotics (penicillin, aureo-mycin, etc) . In order to find out which of the above men-tioned substances is present, it is necessary to test for each of them - which is both costly and time-consuming .However, tests for rapid determination f antibiotics, espe-cially penicillin, in milk have been developed . One of these is the Dutch Delvotest P .A special substrate containing Bacillus colidolactis, which is highly sensitive to penicillin and to some extent also to other antibiotics, is inoculated with the suspected milk . After 2 1/2 hours, the quantity of acid produced will be sufficient to change the colour in the dissolved pH indica-tor from red to yellow . This method gives a definite de-termination of the penicillin concentration down to 0 .06 I .U ./ml .Rapid detention of slow-ripening milk can be achieved by a comparison of the acidification process in the suspect-ed sample with that in a sample of mixed milk .Both samples are heat-treated at 90-95°C for approx . 15 minutes, cooled to approx . 25°C, and mixed with 2% starter .After 6-8 hours there will be a distinct difference in the titres (or pH) of the two samples if one of them contains antibiotics or other growth-inhibiting substances .
Acidity of MilkNormally, fresh milk has a slightly acid reaction . The acid-ity is determined by measuring either the titrated acidity, i .e ., the total content of free and bound acids, or by meas-uring the pH value, which indicates the true acidity (the hydrogen ion concentration) .The titrated acidity of fresh milk is 16-18, and pH is 6 .6-6 .8 .
1072948 Indmad.indd 7 03/07/08 14:28:34
8
TitrationNormally, the titrated acidity of milk is indicated by the number of ml of a 0 .1 n sodium hydroxide solution re-quired to neutralise 100 ml of milk, using phenolphthalein as an indicator .By means of a pipette, 25 ml of milk is measured into an Erlenmeyer flask . To this 13 drops of a 5% alcoholic phenolphthalein solution is added, and from a burette 0 .1 n sodium hydroxide solution is added, drop by drop, into the flask until the colour of the liquid changes from white to a uniform pale red . Since for practical reasons only 25 ml of milk is used in the analysis, the figure obtained must be multiplied by four .Consequently, supposing that the quantity of sodium hydroxide solution used was 5 ml, the titratable acidity would be:
5 × 4 = 20
The normal titratable acidity of fresh milk is 16-18 . If the titratable acidity increases to 30 or more, the casein con-tent will be precipitated when the milk is heated .When cultured milk or buttermilk is titrated, part of the milk will stick to the inside of the pipette . This residue is washed into the Erlenmeyer flask by milk taken from the flask after neutralisation takes place and the red colour starts to appear . Titration then proceeds as explained above .The acidity of cream is determined by the same proce-dure .When the final result is calculated, the fat content of the cream must be taken into account . Supposing that the lat-ter is 30% and that the quantity of sodium hydroxide so-lution used was 2 .8 ml, the titratable acidity of the cream would be:
2 .8 × 4 × = 16100100-30
The acidity of milk is expressed in various ways in various countries .Soxhlet Henkel degrees (S.H.) give the number of ml of a 0 .25 n NaOH solution necessary to neutralise 100 ml of milk, using phenolphthalein as an indicator .Thörner degrees of acidity indicate the number of ml of a 0 .1 n NAOH solution required to neutralise 100 ml of milk
1072948 Indmad.indd 8 03/07/08 14:28:35
9
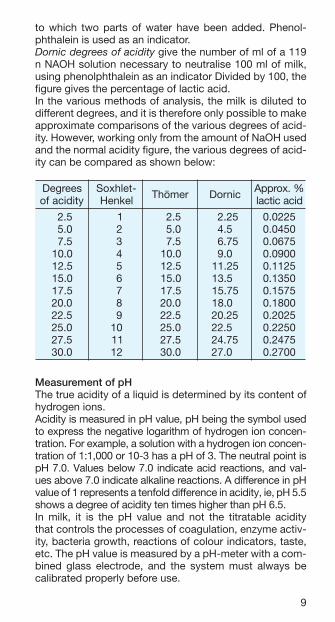
to which two parts of water have been added . Phenol-phthalein is used as an indicator .Dornic degrees of acidity give the number of ml of a 119 n NAOH solution necessary to neutralise 100 ml of milk, using phenolphthalein as an indicator Divided by 100, the figure gives the percentage of lactic acid .In the various methods of analysis, the milk is diluted to different degrees, and it is therefore only possible to make approximate comparisons of the various degrees of acid-ity . However, working only from the amount of NaOH used and the normal acidity figure, the various degrees of acid-ity can be compared as shown below:
seergeDytidicafo
-telhxoSlekneH remöhT cinroD %.xorppA
dicacitcal
0 5.20 0.50 5.7
0.015.210.515.710.025.220.525.720.03
010203040506070809
011121
0 5.20 0.50 5.7
0.015.210.515.710.025.220.525.720.03
0 52.20 5.4 00 57.60 0.9 0
52.115.31 0
57.510.81 052.02
5.22 057.42
0.72 0
5220.00540.05760.00090.05211.00531.05751.00081.05202.00522.05742.00072.0
Measurement of pH The true acidity of a liquid is determined by its content of hydrogen ions .Acidity is measured in pH value, pH being the symbol used to express the negative logarithm of hydrogen ion concen-tration . For example, a solution with a hydrogen ion concen-tration of 1:1,000 or 10-3 has a pH of 3 . The neutral point is pH 7 .0 . Values below 7 .0 indicate acid reactions, and val-ues above 7 .0 indicate alkaline reactions . A difference in pH value of 1 represents a tenfold difference in acidity, ie, pH 5 .5 shows a degree of acidity ten times higher than pH 6 .5 .In milk, it is the pH value and not the titratable acidity that controls the processes of coagulation, enzyme activ-ity, bacteria growth, reactions of colour indicators, taste, etc . The pH value is measured by a pH-meter with a com-bined glass electrode, and the system must always be calibrated properly before use .
1072948 Indmad.indd 9 03/07/08 14:28:36

10
The Phosphatase TestThe phosphatase test is used to control the effect of HTST pasteurisation and batch pasteurisation of milk . Milk pas-teurised by one of these methods must be healed in such a way that, when the phosphatase test is applied, a maxi-mum of 0 .010 mg free phenol is liberated per ml milk .However, the heat treatment must not be so effective that the reaction of the milk to Storch’s test (peroxidase test) is negative .
The phosphatase test is performed as follows:Measure 1 ml milk into two test tubes, marked A and B . Transfer test tube B to a 80”C water bath for 5 minutes and then cool . To the milk in test tube A, add 5 ml dis-tilled water saturated with chloroform and 5 ml substrate solution (prepared by dissolving one small “Ewos” phos-phatase tablet l in 25 ml of a solution consisting of 9 .2 g pure an- hydrous sodium carbonate and 13 .6 g sodium bicarbonate in 1 litre distilled water saturated with chlo-roform) .To test tube B, add 5 ml diluted phenol solution (0 .010 mg phenol in 5 ml) and 5 ml substrate solution . Shake both test tubes and leave them in a water bath at 38-40°C for one hour . Then, to both tubes, add exactly six drops of phenol reagent (three “Ewos” phosphatase tablets II in 10 ml 93% alcohol), and shake the tubes vigorously . Leave the two test tubes at room temperature for 15 minutes and compare them . Only if the contents of test tube A appear paler in colour than the contents of test tube B can the milk be considered sufficiently heated .If the milk fails this test, a sample for control testing should be sent to an authorised research institute, which will carry out the phosphatase test in such a way that colour is extracted after incubation . The colour extinction is a measure of the content of phenol and can be measured in a Pullfricphotometer .
Standardisation of Whole Milk and CreamIn many countries, milk and cream sold for consumption must contain a legally fixed fat percentage, although slight variations are usually allowed .In Denmark, for example, the fat content of heat-treated whole milk must be 3 .5%, in low-fat milk 1 .5% and 0 .5%, and in skimmilk 0 .1% . The various types of cream must have a fat content of 9, 13, 18, or 36%, respectively .In order to comply with these regulations, it is necessary
1072948 Indmad.indd 10 03/07/08 14:28:36

11
to standardise the fat content . This can be done in various ways depending on the stage at which standardisation is carried out .Standardisation before or during heat treatment is to be preferred as the danger of subsequent contamination is thereby reduced . Standardisation will normally take place automatically during the separating and pasteurising process . It may, however, be done manually as a batch process, in which case the table below may be used .
Table for standardisation of Whole Milknitaf%
elohwklim
klimdesidradnatsnitaf%
0 0.4 0 0 9.3 0 0 8.3 0 0 7.3 0 0 6.3 0 0 5.3 0 0 4.3 0 0 3.3 0 0 2.3 0 0 1.3 0 0 0.3 0
5.4 7.21 0 6.51 0 7.81 0 9.12 0 4.52 0 0.03 0 8.23 0 9.63 0 3.14 0 9.54 0 8.05 04.4 1.01 0 0.31 0 0.61 0 2.91 0 5.22 0 0.62 0 9.92 0 8.33 0 1.83 0 6.24 0 5.74 03.4 0 6.7 0 4.01 0 3.31 0 4.61 0 7.91 0 2.32 0 9.62 0 8.03 0 9.43 0 3.93 0 1.44 02.4 0 1.5 0 0 8.7 0 7.01 0 7.31 0 9.61 0 3.02 0 9.32 0 7.72 0 7.13 0 1.63 0 7.04 01.4 0 5.2 0 0 2.5 0 0 0.8 0 0.11 0 0.41 0 4.71 0 9.02 0 6.42 0 6.82 0 8.23 0 3.73 00.4 0 6.2 0 0 3.5 0 0 2.8 0 3.11 0 5.41 0 9.71 0 5.12 0 4.52 0 5.92 0 9.33 09.3 0 83.0 0 7.2 0 0 5.5 0 0 5.8 0 6.11 0 9.41 0 5.81 0 2.22 0 2.62 0 5.03 08.3 0 77.0 0 83.0 0 7.2 0 0 6.5 0 0 7.8 0 9.11 0 4.51 0 0.91 0 0.32 0 1.72 07.3 0 51.1 0 77.0 0 83.0 0 8.2 0 0 8.5 0 0 0.9 0 3.21 0 9.51 0 7.91 0 7.32 06.3 0 45.1 0 51.1 0 67.0 0 83.0 0 9.2 0 0 0.6 0 0 2.9 0 7.21 0 4.61 0 3.02 05.3 0 29.1 0 35.1 0 51.1 0 67.0 0 83.0 0 0.3 0 0 1.6 0 0 5.9 0 1.31 0 9.61 04.3 0 13.2 0 29.1 0 35.1 0 41.1 0 67.0 0 83.0 0 1.3 0 0 3.6 0 0 8.9 0 6.31 03.3 0 96.2 0 03.2 0 19.1 0 25.1 0 41.1 0 57.0 0 83.0 0 1.3 0 0 6.6 0 2.01 02.3 0 80.3 0 86.2 0 92.2 0 09.1 0 25.1 0 31.1 0 57.0 0 73.0 0 3.3 0 0 8.6 01.3 0 64.3 0 70.3 0 76.2 0 82.2 0 98.1 0 15.1 0 31.1 0 57.0 0 73.0 0 4.3 00.3 0 58.3 0 54.3 0 50.3 0 66.2 0 72.2 0 98.1 0 05.1 0 21.1 0 57.0 0 73.0
The figures above the shaded lines indicate the amount in kg of skimmilk to be added per 100 kg whole milk when the fat content is too high .The figures below the shaded lines indicate the amount in kg of cream with 30% fat to be added per 100 kg whole milk when the fat content is too low .
Batch StandardisationFor batch standardisation the following equations may be used .
Fat content to be reduced:To reduce the fat content in y kg whole milk, add x kg skimmilk .
x kg skimmilk = y (% fat in whole milk - % fat required) % fat required - % fat in skimmilk
To obtain z kg standardised milk, mix y kg whole milk with x kg skimmilk .
1072948 Indmad.indd 11 03/07/08 14:28:39
12
y kg whole milk = z (% fat required - % fat in skimmilk) % fat in whole milk - % fat in skimmilk
x kg skimmilk = z - y
Fat content to be increased:To increase the fat content in y kg low-fat milk, add x kg cream (or high-fat milk) .
x kg cream = y (% fat required - % fat in low-fat milk) % fat in cream - % fat required
To obtain z kg standardised milk, mix y kg low-fat milk with x kg cream (or high-fat milk) .
y kg low-fat milk = z (% fat in cream - % fat required % fat in cream - % fat in low-fat milk
x kg cream = z - y
ln-line StandardisationFor in-line standardisation the following equations may be used .
Fat content to be reduced:To obtain z kg standardised milk, use y kg whole milk . Surplus cream x kg .
y kg z (% fat in surplus cream - % fat required)whole = % fat in surplus cream - % fat in whole milk milk
x kg surplus cream = y - z
To obtain x kg surplus cream, use y kg whole milk . Stand-ardised milk z kg .
y kg z (% fat in cream - % fat in standardised milk)whole = % fat in whole milk - % fat in standardised milkmilk z kg standardised milk = y - x
y kg whole milk used will result in z kg standardised milk and x kg surplus cream .
1072948 Indmad.indd 12 03/07/08 14:28:39
13
z kg y (% fat in surplus cream - % fat in shole milk)stand . = % fat in surplus cream - % fat in stand . milkmilk
x kg surplus cream = y - z
Fat content to be increased:Standard in-line systems cannot be used for this pur-pose . The fat content of skimmilk is normally estimated at 0 .05% .
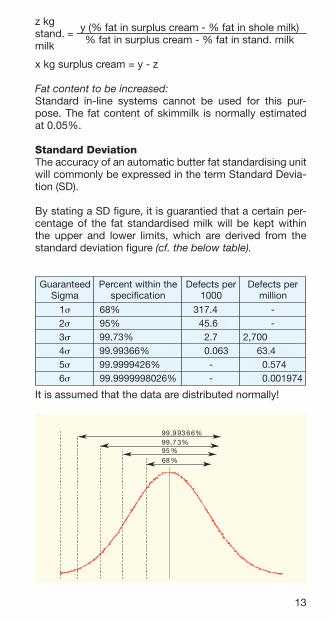
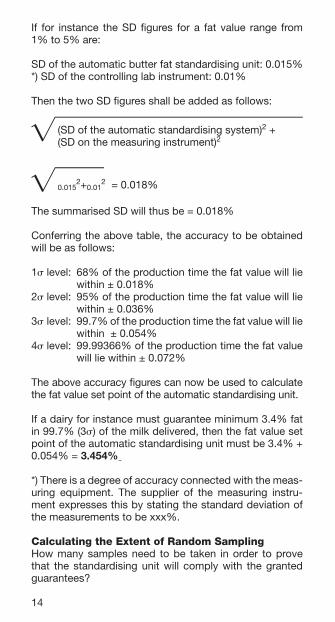
Standard DeviationThe accuracy of an automatic butter fat standardising unit will commonly be expressed in the term Standard Devia-tion (SD) .
By stating a SD figure, it is guarantied that a certain per-centage of the fat standardised milk will be kept within the upper and lower limits, which are derived from the standard deviation figure (cf. the below table).
deetnarauGamgiS
ehtnihtiwtnecrePnoitacificeps
repstcefeD0001
repstcefeDnoillim
1 %86 .0000000000 4.713 00 -2 %59 .0000000000 0 6.54 00 -3 %37.99 00000000 00 7.2 00 2, 007 000000.4 99 . %66399 00000 00 360.0 00, 4.36 000005 99 . %6249999 000 - 000, 475.0 0006 99 . %6208999999 - 000, 479100.0
It is assumed that the data are distributed normally!
68 %95 %99 ,7 3%99 ,9 93 6 6%
1072948 Indmad.indd 13 03/07/08 14:28:40
14
If for instance the SD figures for a fat value range from 1% to 5% are:
SD of the automatic butter fat standardising unit: 0 .015% *) SD of the controlling lab instrument: 0 .01%
Then the two SD figures shall be added as follows:
(SD of the automatic standardising system)2 + (SD on the measuring instrument)2
0 .0152+0 .01
2 = 0 .018%
The summarised SD will thus be = 0 .018%
Conferring the above table, the accuracy to be obtained will be as follows:
1s level: 68% of the production time the fat value will lie within ± 0 .018%
2s level: 95% of the production time the fat value will lie within ± 0 .036%
3s level: 99 .7% of the production time the fat value will lie within ± 0 .054%
4s level: 99 .99366% of the production time the fat value will lie within ± 0 .072%
The above accuracy figures can now be used to calculate the fat value set point of the automatic standardising unit .
If a dairy for instance must guarantee minimum 3 .4% fat in 99 .7% (3s) of the milk delivered, then the fat value set point of the automatic standardising unit must be 3 .4% + 0 .054% = 3.454%
*) There is a degree of accuracy connected with the meas-uring equipment . The supplier of the measuring instru-ment expresses this by stating the standard deviation of the measurements to be xxx% .
Calculating the Extent of Random SamplingHow many samples need to be taken in order to prove that the standardising unit will comply with the granted guarantees?
1072948 Indmad.indd 14 03/07/08 14:28:41
15
Various methods are available for calculating the extent of a random sampling – this is a simple method .From the below chart the relation between the Number of Degree of Freedom Required (the number of samples taken) to estimate the standard deviation within P% of Its True Value with Confidence Coefficient g can be read .
A Confidence Coefficient g = 95 would normally apply for the dairy and food industry .
Example (above example continued): Verification of the SD guarantee of 0.018%:- Number of samples 30 and - Confidence Coefficient (g = 95)
Referring to the below chart, 25% (P%) deviation from Its True Value (0 .0018%) must be allowed for .
Due to the analysis uncertainty, the calculated SD of the 30 random samples must thus be better than 0 .018% + 25% = 0 .023% .
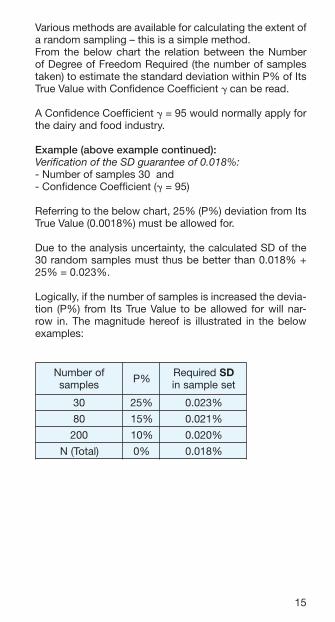
Logically, if the number of samples is increased the devia-tion (P%) from Its True Value to be allowed for will nar-row in . The magnitude hereof is illustrated in the below examples:
forebmuNselpmas %P deriuqeR DS
teselpmasni
03 %52 %320.0
08 %51 %120.0
002 %01 %020.0
)latoT(N %0 %810.0
1072948 Indmad.indd 15 03/07/08 14:28:41
16
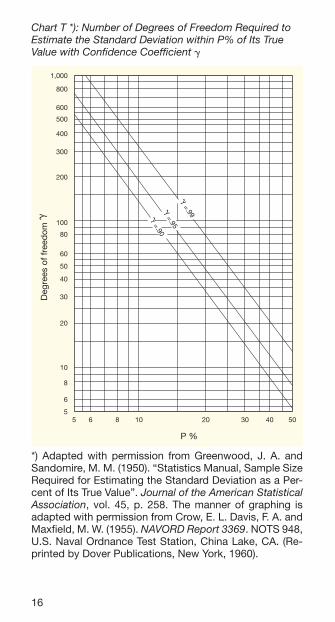
Chart T *): Number of Degrees of Freedom Required to Estimate the Standard Deviation within P% of Its True Value with Confidence Coefficient g
1,000
800
600
500
400
300
200
100
80
60
50
40
30
20
10
8
6
5
Deg
rees
of f
reed
om g
5 6 8 10 20 30 40 50
P %
g = .99g
= .95
g = .90
*) Adapted with permission from Greenwood, J . A . and Sandomire, M . M . (1950) . “Statistics Manual, Sample Size Required for Estimating the Standard Deviation as a Per-cent of Its True Value” . Journal of the American Statistical Association, vol . 45, p . 258 . The manner of graphing is adapted with permission from Crow, E . L . Davis, F . A . and Maxfield, M . W . (1955) . NAVORD Report 3369 . NOTS 948, U .S . Naval Ordnance Test Station, China Lake, CA . (Re-printed by Dover Publications, New York, 1960) .
1072948 Indmad.indd 16 03/07/08 14:28:42
17
GENEREL MILK PROCESSING
PasteurisationPasteurisation is a heat treatment applied to milk in order to avoid public health hazards arising from pathogenic micro-organisms associated with milk . The process also increas-es the sheIf life of the product . Pasteurisation is intended to create only minimal chemical, physical and organoleptic changes in products to be kept in cold storage .
Pasteurisation temperature and timeThe temperature/time combinations stated below are sim-ilar in effect and all have the minimum bactericidal effect required for pasteurisation .
Pasteurised milk and skimmilk 63°C/30 min . 72°C/15 sec .
Pasteurised cream (10% fat): 75°C/15 sec . - - (35% fat): 80°C/15 sec .
Pasteurised, concentrated milk,ice cream mix, sweetened products, etc . 80°C/25 sec .
In each case the product is subsequently cooled to 10°C or less - preferably to 4°C .In some countries, local legislation specifies minimum temperature/time combinations .
In many countries, the phosphatase test is used to deter- mine whether the pasteurisation process has been carried out correctly . A negative phosphatase test is considered to be equivalent to less than 2 .2 microgrammes of phenol liberated by 1 ml of sample or less than 10 microgrammes para-nitrophenol liberated by 1 ml of sample .In order to minimise the risk of failure in the pasteurisation process, the system should have an automatic control system for:(1) Pasteurisation temperature. Temperature recorder and flow diversion valve at the outlet of the temperature holder for diverting the flow back to the balance tank in case of pasteurisation temperatures below the legal requirement . (2) Holding time at pasteurisation temperature. Capacity control system which activates the flow diversion valve in case the capacity exceeds the maximum for which the holding tube is designed .
1072948 Indmad.indd 17 03/07/08 14:28:42
18
(3) Pressure differential control. The system will activate the flow diversion valve if the pressure on the raw-milk side of the regenerator exceeds a set minimum below the pressure on the pasteurised side, thus preventing possi-ble leakage of raw milk into the pasteurised milk .
Calculation of residence time in holding tubeThe mean residence time (t) in the holding tube can be calculated as follows:
t = length of tube x volume per metre capacity per second
Values for volume per metre can be found in the table Volume in Stainless Steel Pipes .
The individual particles spend different times in the hold-ing tube and this results in residence time variations . To avoid bacteriological problems, it is necessary to heat even the fastest particles long enough .The holding tube must have an efficiency of at least 0 .8 (tmin/tmean) and this can best be achieved by avoiding a laminar flow, ie, ensuring a turbulent flow at a Reynolds Number >12,000 and choosing a ratio of length (m)/dia-meter >200 for the holding tube .
HomogenisationMilk products are usually homogenised to prevent separa-tion during storage . Other dairy products are homogenised to improve water binding, reduce free fat etc . Homogeni-sation takes place in a high-pressure homogeniser, which is basically a positive pump equipped with a narrow slit called the homogenising valve . The milk is forced through the homogenising valve at high pressure and this process causes disruption of the fat globules . Advanced types of homogenising valves have been constructed for optimum homogenising efficiency in various processes .
In a pasteurisation plant the homogeniser is typically placed upstream before the final heat treatment in a heat exchanger . Homogenisation of milk must take place at a temperature above the melting point of the milk fat . This means that the homogeniser is often placed after the first regenerative section . In indirect UHT milk plants (Fig . 3 on page 21) the homogeniser is also generally placed up-stream .
1072948 Indmad.indd 18 03/07/08 14:28:42
19
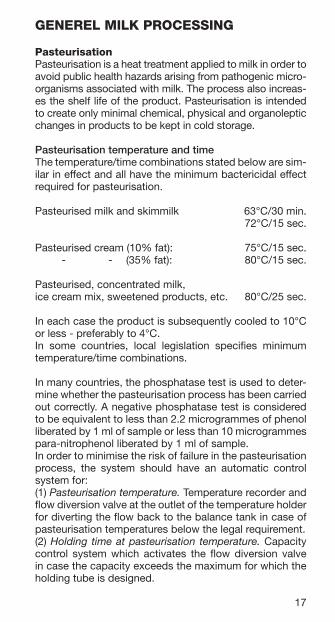
Fig. 1: The particle size distribution of fat globules in milk before and after homogenisation at 200 BAR total pres-sure with 30 BAR on the 2nd stage (volume weighted dis-tributions).
However, in indirect UHT cream systems where the fat-content is higher than approx . 10% (possibly as low as 6%), and in milk products with higher protein content, the homogeniser is preferably placed downstream . In direct UHT systems the homogeniser is always placed down-stream on the aseptic side after UHT treatment (Fig . 4 on page 22 and fi g . 8 on page 31) .
Total homogenisation is most commonly applied for pas-teurised milk and always used with UHT milk . In these cases, the fat content is standardised prior to homog-enisation . Two-stage homogenisation with a SEO or XFD homogenising valve or single-stage homogenisation with a LW homogenising valve at a total pressure of 100 – 150 BAR is often suffi cient for the required stability of pas-teurised milk . For UHT milk a total pressure of 200 – 250 BAR is recommended (Fig . 1) . For very high fl ow rates, two-stage homogenisation with a patented MicroGap ho-mogenising valve is recommended . The MicroGap ena-bles reduction of the total pressure by approx . 20 – 30% (Fig . 2 on page 20) .
1072948 Indmad.indd 19 03/07/08 14:28:44
20
95%-Fractile (Milk) vs. Homogenising Pressure
0
0.5
1
1.5
2
2.5
3
3.5
60 80 100 120 140 160 180 200
Pressure (BAR)
95%
fra
ctile
dia
met
er (
µm
)
Conventional Two-stage Homogenising Valve arrangement
MicroGap
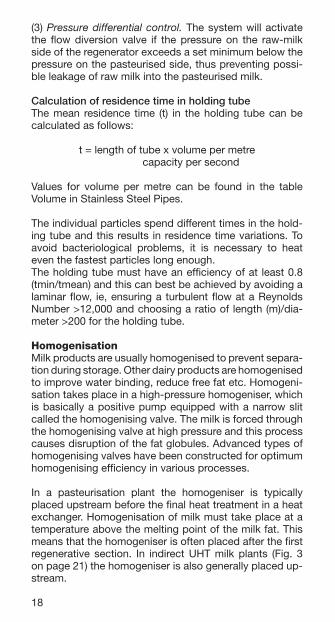
Fig. 4: Micro-Gap valve compared with conventional two-stage valve arrangement (95%-Fractile from volume-weighted particle size distributions, analysed by Helos Sympatec particle sizer).
Another option is partial homogenisation in order to save operating costs . This can enable a reduction of total power consumption during homogenisation by approx . 65% as only about one third of the milk volume is passed through the homogeniser . This type of homogenisation is only applied for pasteurised milk (never for UHT milk) . In partial homogenisation, 1/3 of the volume consists of ho-mogenised cream with up to max . 12% fat, while 2/3 of the volume consists of skimmed milk, which is bypassed and added to the homogenised cream .
1072948 Indmad.indd 20 03/07/08 14:28:45

21
UHT/ESL TREATMENT OF MILK
UHT/ESLAPV is focussed on being the leader within the UHT/ESL technology and has the largest product range within UHT:
Indirect: Plate UHT Plant Tubular UHT Plant (Figure 3) Direct: Injection UHT Plant Infusion UHT Plant
In addition to the 4 main systems, APV has developed the following variations:
ESL - Extended Shelf Life Pure LacTM
Combi UHT (2-4 systems in one) High Heat Infusion Instant Infusion
PRODUCT FILLING
4
8
5
10
6
79
5ºC
75ºC
21 1
95ºC 140ºC
25ºC
STEAM
COOLINGWATER
1. Tubular regenerativepreheaters
2. Homogeniser3. Holding tubes
4. Tubular final heater5. Tubular regenerative
cooler6. Final cooler
7. Sterile tank8. CIP unit9. Sterilising loop10. Water Heater
3 3
Fig. 3: Flow diagram for Tubular Steriliser
ESL - Extended Shelf Life In many parts of the world the production of fresh milk presents a problem in regard to keeping quality . This is due to inadequate cold chains, poor raw material and/or insuffi-cient process and filling technology . Until recently, the only solution has been to produce UHT milk with a shelf life of 3 - 6 months at ambient temperature . In order to try to improve the shelf life of ordinary pasteurised milk, various attempts
1072948 Indmad.indd 21 03/07/08 14:28:47

22
have been made to increase the pasteurisation tempera-ture and this led to the extended shelf life concept .
The term extended shelf life or ESL is being applied more and more frequently . There is no single general definition of ESL . Basically, what it means is the capability to ex-tend the shelf life of a product beyond its traditional well-known and generally accepted shelf life without causing any significant degradation in product quality . A typical temperature/time combination for high-temperature pas-teurisation of ESL milk is 125 - 130°C for 2 - 4 seconds . This is also known in the USA as ultrapasteurisation .
APV has during the last years developed a pa tented proc-ess where the temperature may be raised to as high as 140°C, but only for fractions of a second . This is the basis for the Pure-LacTM process .
The APV infusion ESL is based on the theory that a high temperature/ultra short holding time will provide an effi-cient kill rate as well as a very low chemical degradation .
1. Plate preheaters2. Steam infusion chamber3. Holding tube
4. Flash vessel5. Aseptic homogeniser6. Plate coolers
7. Aseptic tank8. Non aseptic cooler9. Condenser
6 6
143ºC 75ºC 25ºC <25ºC
FILLING
5
7
VACUUM
STEAM
COOLINGWATER
2
STEAM
75ºC
COOLING
COOLING
WATER
WATER
4
9
3
1
PRODUCT
5ºC
8 COOLINGWATER
Fig. 3: Flow Diagram for Steam Infusion Steriliser
This means that a very high temperature for a very short time will result in a high-quality ESL product, with long shelf life and a taste like low pasteurised milk .
1072948 Indmad.indd 22 03/07/08 14:28:50
23
Temperature
Time
135ºCPure-LacTM
120ºCHigh pasteurisation
72ºCLow pasteurisation
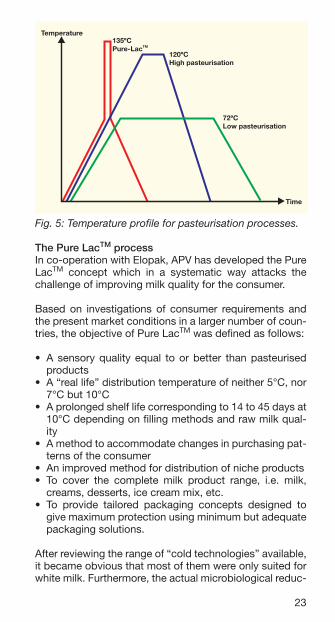
Fig. 5: Temperature profile for pasteurisation processes.
The Pure LacTM processIn co-operation with Elopak, APV has developed the Pure LacTM concept which in a systematic way attacks the challenge of improving milk quality for the consumer .
Based on investigations of consumer requirements and the present market conditions in a larger number of coun-tries, the objective of Pure LacTM was defined as follows:
• A sensoryquality equal toorbetter thanpasteurisedproducts
• A“reallife”distributiontemperatureofneither5°C,nor7°C but 10°C
• Aprolongedshelflifecorrespondingto14to45daysat10°C depending on filling methods and raw milk qual-ity
• Amethodtoaccommodatechangesinpurchasingpat-terns of the consumer
• Animprovedmethodfordistributionofnicheproducts• To cover the complete milk product range, i.e. milk,
creams, desserts, ice cream mix, etc .• To provide tailored packaging concepts designed to
give maximum protection using minimum but adequate packaging solutions .
After reviewing the range of “cold technologies” available, it became obvious that most of them were only suited for white milk . Furthermore, the actual microbiological reduc-
1072948 Indmad.indd 23 03/07/08 14:28:51
24
tion rate for some of the processes was inadequate to provide sufficient safety for shelf life of more than 14 days at 10°C .
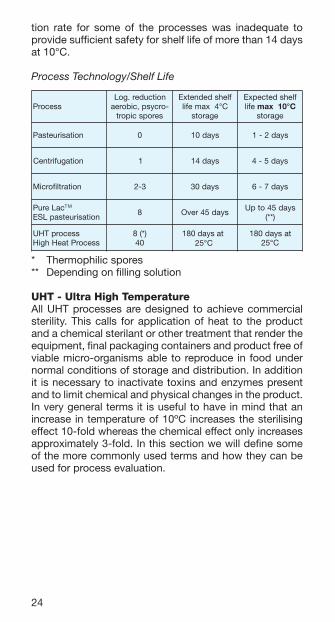
Process Technology/Shelf Life
ssecorPnoitcuder.goL-orcysp,ciborea
seropsciport
flehsdednetxEC°4xamefil
egarots
flehsdetcepxEefil C°01xam
egarots
noitasiruetsaP 0 syad01 syad2-1
noitagufirtneC 1 syad41 syad5-4
noitartliforciM 2-3 syad03 syad7-6
caLeruP MT
noitasiruetsapLSE8 syad54revO
syad54otpU)**(
ssecorpTHUssecorPtaeHhgiH
)*(804
180 days at 25°C
tasyad081C°52
* Thermophilic spores** Depending on filling solution
UHT - Ultra High TemperatureAll UHT processes are designed to achieve commercial sterility . This calls for application of heat to the product and a chemical sterilant or other treatment that render the equipment, final packaging containers and product free of viable micro-organisms able to reproduce in food under normal conditions of storage and distribution . In addition it is necessary to inactivate toxins and enzymes present and to limit chemical and physical changes in the product . In very general terms it is useful to have in mind that an increase in temperature of 10ºC increases the sterilising effect 10-fold whereas the chemical effect only increases approximately 3-fold . In this section we will define some of the more commonly used terms and how they can be used for process evaluation .
1072948 Indmad.indd 24 03/07/08 14:28:52
25
0
50
100
150
Time
ºC
Direct Infusion
High Heat Infusion
Indirect UHT
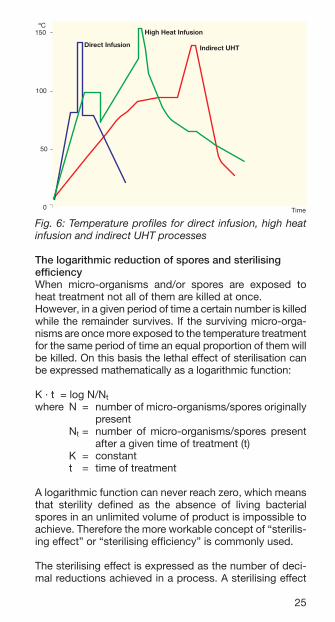
Fig. 6: Temperature profiles for direct infusion, high heat infusion and indirect UHT processes
The logarithmic reduction of spores and sterilising efficiencyWhen micro-organisms and/or spores are exposed to heat treatment not all of them are killed at once .However, in a given period of time a certain number is killed while the remainder survives . If the surviving micro-orga-nisms are once more exposed to the temperature treatment for the same period of time an equal proportion of them will be killed . On this basis the lethal effect of sterilisation can be expressed mathematically as a logarithmic function:
K · t = log N/Nt where N = number of micro-organisms/spores originally
present Nt = number of micro-organisms/spores present
after a given time of treatment (t) K = constant t = time of treatment
A logarithmic function can never reach zero, which means that sterility defined as the absence of living bacterial spores in an unlimited volume of product is impossible to achieve . Therefore the more workable concept of “sterilis-ing effect” or “sterilising efficiency” is commonly used .
The sterilising effect is expressed as the number of deci-mal reductions achieved in a process . A sterilising effect
1072948 Indmad.indd 25 03/07/08 14:28:53

26
of 9 indicates that out of 109 bacterial spores fed into the process only 1 (10°) will survive .
Spores of Bacillus subtilis or Bacillus stearothermophilus are normally used as test organisms to determine the ef-ficiency of UHT systems because they form fairly heat resistant spores .
Terms and expressions to characterise heat treatment processesQ10 value. The sterilising effect of heat sterilisation increas-es rapidly with the increase in temperature as described above . This also applies to chemical reactions which take place as a consequence of an increase in temperature . The Q10 value has been introduced as an expression of this increase in speed of reactions and specifies how many times the speed of a reaction increases when the temperature is raised by 10ºC . Q10 for flavour changes is in the order of 2 to 3 which means that a temperature in-crease of 10ºC doubles or triples the speed of the chemi-cal reactions .A Q10value calculated for killing bacterial spores would range from 8 to 30, depending on the sensitivity of a par-ticular strain to the heat treatment .
D-Value . This is also called the decimal reduction time and is defined as the time required to reduce the number of micro-organisms to one-tenth of the original value, i .e . corresponding to a reduction of 90% .
Z-Value . This is defined as the temperature change, which gives a 10-fold change in the D-value .
F0 value . This is defined as the total integrated lethal ef-fect and is expressed in terms of minutes at a selected reference temperature of 121 .1ºC . F0 can be calculated as follows:
F0 = 10(T - 121 .1) /z x t / 60, where
T = processing temperature (ºC)
z = Z-value (ºC)
t = processing time (seconds)
1072948 Indmad.indd 26 03/07/08 14:28:53

27
F0 = 1 after the product has been heated to 121 .1 ºC for one minute . To obtain commercially sterile milk from good quality raw milk, for example, an F0 value of minimum 5 to 6 is required .
B* and C* Values . In the case of milk treatment, some countries are using the following terms:
• Bacteriologicaleffect: B* (known as B star)
• Chemicaleffect C* (known as C star)
B* is based on the assumption that commercial sterility is achieved at 135ºC for 10 .1 seconds with a correspond-ing Z-value of 10 .5ºC; this reference process is giving a B* value of 1 .0, representing a reduction of thermophilic spore count of 109 per unit (log 9 reduction) . The B* value for a process is calculated similarly to the F0 value:
B* = 10 ( T - 135 ) / 10 .5 x t / 10 .1, where
T = processing temperature (ºC)
t = processing time (seconds)
The C* value is based on the conditions for a 3 percent destruction of thiamine (vitamin B1); this is equivalent to 135ºC for 30 .5 seconds with a Z-value of 31 .4ºC . Conse-quently the C* value can be calculated as follows:
C* = 10 ( T - 135 ) /31 .4 x t / 30 .5
Fig . 6 shows that a UHT process is deemed to be satisfac-tory with regard to keeping quality and organoleptic qua-lity of the product when B* is > 1 and C* is < 1 .
The B* and C* calculations may be used for designing UHT plants for milk and other heat sensitive products . The B* and C* values also include the bacteriological and chemical effects of the heating up and cooling down times and are therefore important in designing a plant with mini-mum chemical change and maximum sterilising effect . The more severe the heat treatment is, the higher the C* value will be . For different UHT plants the C* value corre-
1072948 Indmad.indd 27 03/07/08 14:28:53

28
sponding to a sterilising effect of B* = 1 will vary greatly . A C* value of below 1 is generally accepted for an average design UHT plant . Improved designs will have C* values significantly lower than 1 .
The APV Steam Infusion Steriliser has a C* value of 0 .15 .
Residence time Particular attention must be paid to the residence time in a holding cell or tube and the actual dimensioning will de-pend on several factors such as turbulent versus laminar flow, foaming, air content and steam bubbles . Since there is a tendency to ope-rate at reduced residence time in order to minimise the chemical degradation (C* value < 1) it becomes increasingly important to know the exact residence time .
In APV the infusion system has been designed with a special pump mounted directly below the infusion chamber which ensures a sufficient over-pressure in the holding tube in or-der to have a single phase flow free from air and steam bub-bles . This principle enables APV to define and monitor the holding time and temperature precisely and makes it the only direct steam heating system, which allows true validation of flow and temperature at the point of heat transfer .
Commercial sterilityThe expression of commercial sterility has been men-tioned previously and it has been pointed out that com-plete sterility in its strictest sense is not possible . In wor-king with UHT products commercial sterility is used as a more practical term, and a commercially sterile product is defined as one which is free from micro-organisms which grow under the prevailing conditions .
Chemical and bacteriological changes at high temperaturesThe heating of milk and other food products to high tem-peratures results in a range of complex chemical reactions causing changes in colour (browning), development of off-flavours and formation of sediments . These unwanted reactions are largely avoided through heat treatment at a higher temperature for a very short time . It is important to seek the optimum time/temperature combination, which provides sufficient kill effect on spores but, at the same time, limits the heat damage, in order to comply with mar-ket requirements for the final product .
1072948 Indmad.indd 28 03/07/08 14:28:53
29
Raw material qualityIt is important that all raw materials are of very high quality, as the quality of the final product will be directly affected . Raw materials must be free from dirt and have a very low bacteria spore count, and any powders must be easy to dissolve .
All powder products must be dissolved prior to UHT treat-ment because bacteria spores can survive in dry powder particles even at UHT temperatures . Undissolved powder particles will also damage homogenising valves causing sterility problems .
Heat stability . The question of heat stability is an important parameter in UHT processing . Different products have different heat stability and although the UHT plant will be chosen on this basis, it is desirable to be able to measure the heat stability of the products to be UHT treated . For most products this is possible by applying the alcohol test . When samples of milk are mixed with equal volumes of an ethyl alcohol solution, the proteins become unstable and the milk flocculates . The higher the concentration of ethyl alcohol is without flocculation, the better the heat stability of the milk . Production and shelf life problems are usually avoided provided the milk remains stable at an alcohol concentration of 75% .High heat stability is important because of the need to produce stable homogeneous products, but also to pre-vent operational problems as e .g . fouling in the UHT plant . This will decrease running hours between CIP cleanings and thereby increase product waste, water, chemical and energy consumption . Generally it will also disrupt smooth operation and increase the risk of insterility .
Shelf life. The shelf life of a product is generally defined as the time for which the product can be stored without the quality falling below a certain minimum acceptable level . This is not a very sharp and exact definition and it depends to a large extent on the perception of “mini-mum acceptable quality” . Having defined this, it will be raw material quality, processing and packaging conditions and conditions during distribution and storage which will determine the shelf life of the product .
Milk is a good example of how wide a span the concept of shelf life covers:
1072948 Indmad.indd 29 03/07/08 14:28:53

30
Product Shelf life StoragePasteurised milk 5 - 10 days refrigerated ESL/Pure-LacTM 20 - 45 days refrigeratedUHT milk 3 - 6 months ambient temperature
The usual organoleptic factors limiting shelf life are de-teriorated taste, smell and colour, while the physical and
2.7 2.6 2.5 2.4 2.3
1T
4000
2000
3000
1000
800
900
600
700
400
500
200
300
100
80
60
70
90
40
50
20
30
10
8
6
4
5
7
9
2
3
1110100 120 130 140 150 160ºC
loss of thiamine = 80%
threshold range of discolouration
loss of thiamine = 3% / C*=1
HM
F 1 µmol/l
HMF 100 µm
ol/l
HMF 10 µm
ol/l
60%
40%
10%
loss of lysine = 1%
lactulose 600 mg/l
lactulose 400 mg/l
20%
region ofsterilisation
thermal death value = 9
thermophilic spores / B
*=1
UHT-region
Hea
ting
time
or e
quiv
alen
t hea
ting
time
in s
econ
ds
·10 in K3 -1
Fig. 7: Bacteriological and chemical changes of heated milk
1072948 Indmad.indd 30 03/07/08 14:28:54

31
chemical limiting factors are incipient gelling, increase in viscosity, sedimentation and cream lining .
High Heat Infusion SteriliserThe growing incidents of heat resistant spores (HRS) is challenging traditional UHT technologies and setting new targets . The HRS are extremely heat resistant and require a minimum of 145 - 150ºC for 3 - 10 seconds to achieve commercial sterility . If the temperature is increased to this level in a traditional indirect UHT plant it would have an adverse effect on the product quality and the overall run-ning time of the plant . Furthermore, it would result in high-er product losses during start and stop and more frequent CIP cycles would have to be applied . Using the traditional direct steam infusion system would result in higher energy consumption and increased capital cost . On this basis, APV developed the new High Heat Infusion system .
The flow diagram in fig . 8 illustrates the principle design including the most important processing parameters while fig . 8 shows the temperature/time profile in comparison to conventional infusion and indirect systems .Note that the vacuum chamber has been installed prior to the infusion chamber . This design facilitates improve-ment in energy recovery and it is possible to achieve 75% regeneration compared to 40% with conventional infusion systems and 80 - 85% with indirect tubular systems . The killing rate is F0 = 40 - 70 .
PRODUCT
FILLING
64
9
VACUUM
COOLINGWATER
5
STEAM
711 7
5ºC 60ºC
2
90ºC 125ºC
2
810 8
150ºC 75ºC 25ºC
STEAMSTEAM
1. Tubular preheaters2. Holding tube3. Flash vessel (non aseptic)
4.5. Steam infusion chamber6.
Non aseptic flavour dosing (option)
Homogeniser (aseptic)
7.8.9.10.
Tubular coolersTubular HeatersAseptic tankNon aseptic cooler
COOLINGWATER
3
Fig. 8: Flow diagram for High Heat Infusion Steriliser
1072948 Indmad.indd 31 03/07/08 14:29:00
32
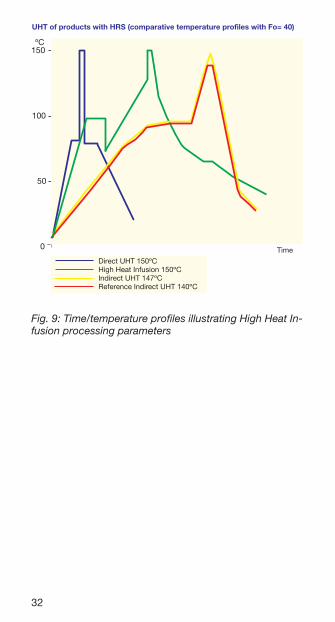
UHT of products with HRS (comparative temperature profiles with Fo= 40)
0
50
100
150
Time
ºC
Direct UHT 150ºCHigh Heat Infusion 150ºCIndirect UHT 147ºCReference Indirect UHT 140ºC
Fig. 9: Time/temperature profiles illustrating High Heat In-fusion processing parameters
1072948 Indmad.indd 32 03/07/08 14:29:01
33
BUTTER
Composition of ButterButter must comply with certain regulations:Fat . . . . . . . . . . . . . . . . . . . . . Min . 80% (82%)Moisture . . . . . . . . . . . . . . . . . Max . 16%Milk solids non-fat (MSNF) . . . Max . 2%Salt (NaCl):
Mildly salted . . . . . . . . . . . approx . 1%Strongly salted . . . . . . . . . - 2%
Acidity:Sweet cream butter . . . . . . pH 6 .7Cultured butter . . . . . . . . . pH 4 .6Mildly cultured butter . . . . pH 5 .3
Buttermilk normally contains:Sweet buttermilk . . . . . . . . . . 0 .5-0 .7% fat . . . . . . . . . . . . . . . . . . . . . . . . approx . 8 .5% MSNFCultured buttermilk . . . . . . . . . 0 .4-0 .6% fat . . . . . . . . . . . . . . . . . . . . . . . . approx . 8 .3% MSNF
Yields1 kg butter can be made from: approx . 20 kg milk with 4 .2% fat - 2 .2 kg cream with 38% fat - 2 .0 kg cream with 42% fat
ButtermakingButtermaking may be carried out either as a batch pro-cess in a butter churn or as a continuous process in a continuous buttermaking machine .In addition to cream treatment, buttermaking comprises the following stages:
(1) churning of cream into butter grains and buttermilk; (2) separation of butter grains and buttermilk;(3) working of the butter grains into a cohesive mass;(4) addition and distribution of salt;(5) adjustment and distribution of moisture;(6) final working, under vacuum, to minimise the air con-
tent .
A continuous buttermaking machine has existed for many years . It was invented by a German professor, Dr . Fritz . However, this machine was deficient in a number of re-spects . It could be used only for the treatment of sweet
1072948 Indmad.indd 33 03/07/08 14:29:01

34
cream, and there were problems with the production of salted butter .
APV manufactures continuous butter making machines with capacities ranging from 500 kg to 12,000 kg butter/hour .The APV continuous buttermaking machine can produce all types of butter: cultured and sweet, salted and unsalt-ed . Furthermore, the machine can produce butter accord-ing to the “NIZO” as well as to the “IBC” method . Blended products (e .g . Bregott) in which some of the butter fat has been replaced by vegetable fats can also be produced .The APV continuous buttermaking machine also guaran-tees that products are of the highest possible quality, and that the operating economy is the best obtainable .The APV continuous buttermaking machine is designed according to the following principles:
(1) The churning section is, in principle, designed in ac-cordance with the system of Dr . Fritz . The section consists of a horizontal cylinder and a rotating beater . The beater velocity is infinitely variable between 0 and 1,400 rpm . Since the churning process lasts only 1-2 seconds, it is important to adjust the beater velocity to obtain optimum butter grain size . The moisture content of the butter and the fat content of the buttermilk also depend on the beater velocity .(2) The separating section consists of a horizontal rotating cylinder . The velocity is infinitely variable .The first part of the cylinder is equipped with baffle plates for further treatment of the mixture of butter grains and buttermilk which is fed in from the churning section .The second part of the cylinder is designed as a sieve for buttermilk drainage . It is equipped with a very fine-ly meshed wire screen, which retains even small butter grains . The buttermilk drainage from the butter grains is very efficient and the rotation of the strainer drum pre-vents butter clogging .(3) The working section consists of two inclined sections (I and II) with augers for transport of the butler, and work-ing elements in the form of perforated plates and mixing vanes . The velocity of each of the two sections is infinitely variable .In the production of salted butter, a salt slurry (40-60%) is pumped into working section I where it is worked into the butter .
1072948 Indmad.indd 34 03/07/08 14:29:01
35
5
3
34
1
2
Butter
Water
Buttermilk
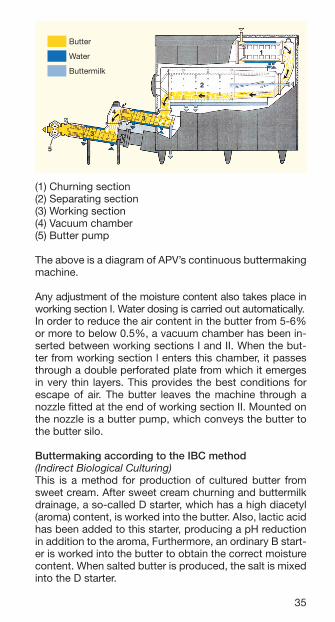
(1) Churning section (2) Separating section(3) Working section(4) Vacuum chamber(5) Butter pump
The above is a diagram of APV’s continuous buttermaking machine .
Any adjustment of the moisture content also takes place in working section I . Water dosing is carried out automatically .In order to reduce the air content in the butter from 5-6% or more to below 0 .5%, a vacuum chamber has been in-serted between working sections I and II . When the but-ter from working section l enters this chamber, it passes through a double perforated plate from which it emerges in very thin layers . This provides the best conditions for escape of air . The butter leaves the machine through a nozzle fitted at the end of working section II . Mounted on the nozzle is a butter pump, which conveys the butter to the butter silo .
Buttermaking according to the IBC method(Indirect Biological Culturing)This is a method for production of cultured butter from sweet cream . After sweet cream churning and buttermilk drainage, a so-called D starter, which has a high diacetyl (aroma) content, is worked into the butter . Also, lactic acid has been added to this starter, producing a pH reduction in addition to the aroma, Furthermore, an ordinary B start-er is worked into the butter to obtain the correct moisture content . When salted butter is produced, the salt is mixed into the D starter .
1072948 Indmad.indd 35 03/07/08 14:29:03
36
A similar production method is the well known “NIZO” method .The above methods provide for more flexible cream treat-ment since the incubation temperatures for the starters do not have to be taken into account . Besides, the produc-tion of cultured buttermilk is avoided (sweet buttermilk is much more usable in other products than cultured but-termilk) . Finally, butter produced according to this method has a longer shelf life .
Calculating Butter YieldThe yield of butter from whole milk can be calculated us-ing the following equations . (Loss and overweight are not considered .) .
kg cream = kg milk x (% fat in milk - % fat in skimmilk) % fat in cream - % fat in skimmilk
kg butter = kg cream x (% fat in cream - % fat in buttermilk) % fat in butter - % fat in buttermilk
If the fat percentage in skimmilk, buttermilk and butter is not known, the following estimated values rnay be used:
Skimmilk = 00 .05% fatButtermilk = 00 .4% fatButter = 82 .5% fat
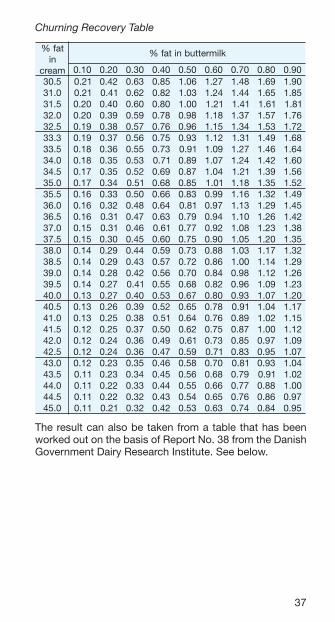
Churning RecoveryThe churning recovery value (CRV) is equal to the amount of fat remaining in the buttermilk expressed as a percent-age of the total fat content of the cream before churning . It can be worked out from the following equation:
CRV = (100-7/6 x % fat in cream) x % fat in buttermilk % fat in cream
In other words, the only data required are the cream and buttermilk fat percentages .
1072948 Indmad.indd 36 03/07/08 14:29:03
37
Churning Recovery Table
taf%ni
maerc
klimrettubnitaf%
01.0 02.0 03.0 04.0 05.0 06.0 07.0 08.0 09.05.03 12.0 24.0 36.0 58.0 60.1 72.1 84.1 96.1 09.10.13 12.0 14.0 26.0 28.0 30.1 42.1 44.1 56.1 58.15.13 02.0 04.0 06.0 08.0 00.1 12.1 14.1 16.1 18.10.23 02.0 93.0 95.0 87.0 89.0 81.1 73.1 75.1 67.15.23 91.0 83.0 75.0 67.0 69.0 51.1 43.1 35.1 27.13.33 91.0 73.0 65.0 57.0 39.0 21.1 13.1 94.1 86.15.33 81.0 63.0 55.0 37.0 19.0 90.1 72.1 64.1 46.10.43 81.0 53.0 35.0 17.0 98.0 70.1 42.1 24.1 06.15.43 71.0 53.0 25.0 96.0 78.0 40.1 12.1 93.1 65.10.53 71.0 43.0 15.0 86.0 58.0 10.1 81.1 53.1 25.15.53 61.0 33.0 05.0 66.0 38.0 99.0 61.1 23.1 94.10.63 61.0 23.0 84.0 46.0 18.0 79.0 31.1 92.1 54.15.63 61.0 13.0 74.0 36.0 97.0 49.0 01.1 62.1 24.10.73 51.0 13.0 64.0 16.0 77.0 29.0 80.1 32.1 83.15.73 51.0 03.0 54.0 06.0 57.0 09.0 50.1 02.1 53.10.83 41.0 92.0 44.0 95.0 37.0 88.0 30.1 71.1 23.15.83 41.0 92.0 34.0 75.0 27.0 68.0 00.1 41.1 92.10.93 41.0 82.0 24.0 65.0 07.0 48.0 89.0 21.1 62.15.93 41.0 72.0 14.0 55.0 86.0 28.0 69.0 90.1 32.10.04 31.0 72.0 04.0 35.0 76.0 08.0 39.0 70.1 02.15.04 31.0 62.0 93.0 25.0 56.0 87.0 19.0 40.1 71.10.14 31.0 52.0 83.0 15.0 46.0 67.0 98.0 20.1 51.15.14 21.0 52.0 73.0 05.0 26.0 57.0 78.0 00.1 21.10.24 21.0 42.0 63.0 94.0 16.0 37.0 58.0 79.0 90.15.24 21.0 42.0 63.0 74.0 95.0 17.0 38.0 59.0 70.10.34 21.0 32.0 53.0 64.0 85.0 07.0 18.0 39.0 40.15.34 11.0 32.0 43.0 54.0 65.0 86.0 97.0 19.0 20.10.44 11.0 22.0 33.0 44.0 55.0 66.0 77.0 88.0 00.15.44 11.0 22.0 23.0 34.0 45.0 56.0 67.0 68.0 79.00.54 11.0 12.0 23.0 24.0 35.0 36.0 47.0 48.0 59.0
The result can also be taken from a table that has been worked out on the basis of Report No . 38 from the Danish Government Dairy Research Institute . See below .
1072948 Indmad.indd 37 03/07/08 14:29:06

38
Table for adjustment of Moisture Content in Butter
retaw%tneserp
ehtnehwrettubgk001repgkniretawfonoitiddA:swollofsasierutsiom%derised
0.61 9.51 8.51 7.51 6.51 5.519.51 21.08.51 42.0 21.07.51 63.0 42.0 21.06.51 74.0 63.0 42.0 21.05.51 95.0 74.0 63.0 42.0 21.04.51 17.0 95.0 74.0 63.0 42.0 21.03.51 38.0 17.0 95.0 74.0 53.0 42.02.51 49.0 38.0 17.0 95.0 74.0 53.01.51 60.1 49.0 28.0 17.0 95.0 74.00.51 81.1 60.1 49.0 28.0 17.0 95.09.41 92.1 81.1 60.1 49.0 28.0 17.08.41 14.1 92.1 71.1 60.1 49.0 28.07.41 25.1 14.1 92.1 71.1 60.1 49.06.41 46.1 25.1 14.1 92.1 71.1 50.15.41 57.1 46.1 25.1 04.1 92.1 71.14.41 78.1 57.1 46.1 25.1 04.1 92.13.41 89.1 78.1 57.1 36.1 25.1 04.12.41 01.2 89.1 78.1 57.1 36.1 25.11.41 12.2 01.2 89.1 68.1 57.1 36.10.41 33.2 12.2 90.2 89.1 68.1 47.19.31 44.2 23.2 12.2 90.2 79.1 68.18.31 55.2 44.2 23.2 02.2 90.2 79.17.31 76.2 55.2 34.2 23.2 02.2 90.26.31 87.2 66.2 55.2 34.2 23.2 02.25.31 98.2 87.2 66.2 45.2 34.2 13.24.31 00.3 98.2 77.2 66.2 45.2 34.23.31 11.3 00.3 88.2 77.2 56.2 45.22.31 22.3 11.3 00.3 88.2 77.2 56.21.31 43.3 22.3 11.3 99.2 88.2 67.20.31 54.3 33.3 22.3 01.3 99.2 78.29.21 65.3 44.3 33.3 22.3 01.3 99.28.21 76.3 65.3 44.3 33.3 12.3 01.37.21 87.3 76.3 55.3 44.3 23.3 12.36.21 98.3 87.3 66.3 55.3 34.3 23.35.21 00.4 98.4 77.3 66.3 45.3 34.34.21 11.4 00.4 88.3 77.3 56.3 45.33.21 22.4 11.4 99.3 88.3 67.3 56.32.21 33.4 12.4 01.4 99.3 78.3 67.31.21 44.4 23.4 12.4 01.4 89.3 78.30.21 55.4 34.4 23.4 12.4 90.4 89.3
1072948 Indmad.indd 38 03/07/08 14:29:08
39
Adjusting Moisture Content in ButterConventional ChurnsThe churning of the cream should be carried out in such a way that the moisture content of the butter is slightly below the maximum permitted amount . A test of the mois-ture content should be made as soon as the butter has been worked sufficiently .When the amount of butler is known, the table above can be used .If desired, the following equation may also be used:
kg water to be added = kg butter x (% MD - % MP) 100 - % MP
where: MD = Moisture desired MP = Moisture present
Continuous Buttermaking MachinesThe churning of the cream should be carried out in such a way that the moisture content of the butter - without any addition of water - is below the maximum permitted amount .The moisture content of the butter and the regulation of the water dosing pump will normally be automatically con-trolled .When salted butter is manufactured, a salt slurry is contin-uously dosed into the butter . This, however, will increase the moisture content of the butter, reducing the amount of water to be added .
Determination of Salt Content in ButterThere are several ways of determining the salt content of butter . The analysis can most conveniently be carried out with a 10-gramme sample that has already been used for determination of the moisture content of the butter .The butter is melted and poured into a 150 ml beaker . The butter residue is washed into the beaker by means of 50-100 ml of water at 70°C . After addition of 10 drops of satu-rated potassium chromate solution, titration takes place with the use of a 0 .17 n silver nitrate solution (AgNO3), added gradually until the colour changes from yellow to brownish . The salt content is then determined in accord-ance with the following equation:
ml of silver nitrate solution used x 0 .1 = percentage of salt .
1072948 Indmad.indd 39 03/07/08 14:29:09
40
lodine Value and Refractive IndexThe iodine value is defined as the number of grammes of iodine that can be absorbed in 100 g butterfat . The refrac-tive index stales the angle of refraction measured in a so- called refractometer, when a ray of light passes from the air through melted butterfat . Both the iodine value and the re-fractive index are an indication of the content of unsaturat-ed fatty acids (the most important being oleic acid), which have a lower melting point than saturated fatty acids .The relation between the iodine value and the refractive index is given in the table below .
eulavenidoI xednIevitcarfeR
tafdraH
62 6.0472 9.0482 2.1492 4.1403 7.1413 0.2423 2.2433 5.2443 7.2453 0.3463 3.34
taftfoS
73 5.3483 8.3493 1.4404 3.4414 6.4424 8.44
Fluctuations in lodine Value and Temperature Treatment of CreamMilk fat contains, on average, 35% oleic acid (iodine value approx . 35), but this percentage is subject to large sea-sonal fluctuations: the iodine value is high in the summer and low in the winter .The iodine value depends primarily on the fat content of the feed and on the composition and melting point of this fat . It is therefore possible to influence the iodine value and thereby the firmness of the butter through feeding . It is usually difficult to regulate the various ingredients that make up coarse feed . Roots, for example, give hard andbrittle butter, while grass and hay give butter of a good consistency . On the other hand, concentrated feed should be chosen only after taking into account the fat content
1072948 Indmad.indd 40 03/07/08 14:29:09
41
and particularly the composition of the fat (iodine value) . For example, feeding with soya beans, linseed and rape seed cakes, etc, gives butterfat with a high iodine value, whereas the iodine value is lower when feeding with co-conut and palm cakes .Other conditions being equal, Jersey cows yield butter-fat with a lower iodine value than, for example, Holsteins, but this difference can be adjusted by choosing the right feed . By means of temperature treatment of the cream, it is possible to change the structure of the butter in order to improve its consistency . The temperatures used should be determined partly on the basis of the iodine value of the butterfat and partly on the basis of the temperature at which the butter will be consumed . It is therefore nec-essary for the creamery to know the iodine value of the butterfat used, and this value should be determined once a month .In periods with iodine values above 35, the 19-16-8 meth-od or a modification, for example, 23-12-8, should be used .In periods with iodine values below 32, the 8-19-16 meth-od or a modification, for example, 8-20-12, should be used .In transitional periods (iodine values between 32 and 35), a 12-19-12 treatment can be used in the autumn, whereas in the spring, the normal high iodine treatment should be started straightaway .
1072948 Indmad.indd 41 03/07/08 14:29:10
42
CHEESE
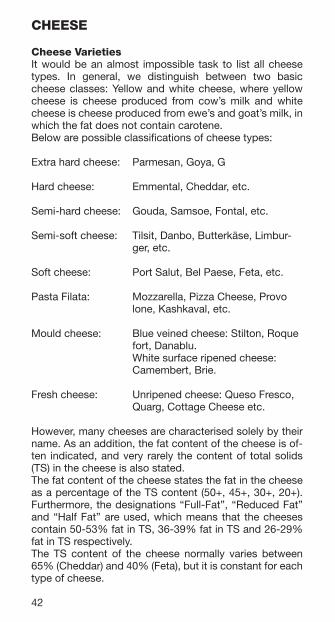
Cheese VarietiesIt would be an almost impossible task to list all cheese types . In general, we distinguish between two basic cheese classes: Yellow and white cheese, where yellow cheese is cheese produced from cow’s milk and white cheese is cheese produced from ewe’s and goat’s milk, in which the fat does not contain carotene . Below are possible classifications of cheese types:
Extra hard cheese: Parmesan, Goya, G
Hard cheese: Emmental, Cheddar, etc .
Semi-hard cheese: Gouda, Samsoe, Fontal, etc .
Semi-soft cheese: Tilsit, Danbo, Butterkäse, Limbur- ger, etc .
Soft cheese: Port Salut, Bel Paese, Feta, etc .
Pasta Filata: Mozzarella, Pizza Cheese, Provo lone, Kashkaval, etc .
Mould cheese: Blue veined cheese: Stilton, Roque fort, Danablu .
White surface ripened cheese: Camembert, Brie .
Fresh cheese: Unripened cheese: Queso Fresco, Quarg, Cottage Cheese etc .
However, many cheeses are characterised solely by their name . As an addition, the fat content of the cheese is of-ten indicated, and very rarely the content of total solids (TS) in the cheese is also stated .The fat content of the cheese states the fat in the cheese as a percentage of the TS content (50+, 45+, 30+, 20+) . Furthermore, the designations “Full-Fat”, “Reduced Fat” and “Half Fat” are used, which means that the cheeses contain 50-53% fat in TS, 36-39% fat in TS and 26-29% fat in TS respectively .The TS content of the cheese normally varies between 65% (Cheddar) and 40% (Feta), but it is constant for each type of cheese .
1072948 Indmad.indd 42 03/07/08 14:29:10
43
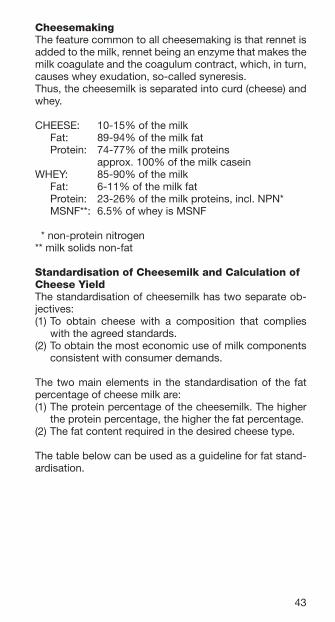
CheesemakingThe feature common to all cheesemaking is that rennet is added to the milk, rennet being an enzyme that makes the milk coagulate and the coagulum contract, which, in turn, causes whey exudation, so-called syneresis .Thus, the cheesemilk is separated into curd (cheese) and whey .
CHEESE: 10-15% of the milkFat: 89-94% of the milk fatProtein: 74-77% of the milk proteins
approx . 100% of the milk caseinWHEY: 85-90% of the milk
Fat: 6-11% of the milk fatProtein: 23-26% of the milk proteins, incl . NPN* MSNF**: 6 .5% of whey is MSNF
* non-protein nitrogen** milk solids non-fat
Standardisation of Cheesemilk and Calculation of Cheese YieldThe standardisation of cheesemilk has two separate ob-jectives:(1) To obtain cheese with a composition that complies
with the agreed standards .(2) To obtain the most economic use of milk components
consistent with consumer demands .
The two main elements in the standardisation of the fat percentage of cheese milk are:(1) The protein percentage of the cheesemilk . The higher
the protein percentage, the higher the fat percentage .(2) The fat content required in the desired cheese type .
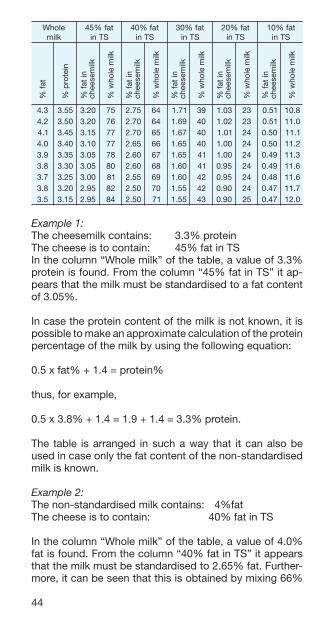
The table below can be used as a guideline for fat stand-ardisation .
1072948 Indmad.indd 43 03/07/08 14:29:10
44
elohWklim
taf%54STni
taf%04STni
taf%03STni
taf%02STni
taf%01STni
3 .4 55 .3 02 .3 57 57 .2 46 17 .1 93 30 .1 32 15 .0 8 .012 .4 05 .3 02 .3 67 07 .2 46 96 .1 04 20 .1 32 15 .0 0 .111 .4 54 .3 51 .3 77 07 .2 56 76 .1 04 10 .1 42 05 .0 1 .110 .4 04 .3 01 .3 77 56 .2 66 56 .1 04 00 .1 42 05 .0 2 .119 .3 53 .3 50 .3 87 06 .2 76 56 .1 14 00 .1 42 94 .0 3 .118 .3 03 .3 50 .3 08 06 .2 86 06 .1 14 59 .0 42 94 .0 6 .117 .3 52 .3 00 .3 18 55 .2 96 06 .1 24 59 .0 42 84 .0 6 .118 .3 02 .3 59 .2 28 05 .2 07 55 .1 24 09 .0 42 74 .0 7 .115 .3 51 .3 59 .2 48 05 .2 17 55 .1 34 09 .0 52 74 .0 0 .21
% fa
t
% p
rote
in
% fa
t in
chee
sem
ilk
% w
hole
milk
% fa
t in
chee
sem
ilk
% w
hole
milk
% fa
t in
chee
sem
ilk
% w
hole
milk
% fa
t in
chee
sem
ilk
% w
hole
milk
% fa
t in
chee
sem
ilk
% w
hole
milk
Example 1:The cheesemilk contains: 3 .3% proteinThe cheese is to contain: 45% fat in TSIn the column “Whole milk” of the table, a value of 3 .3% protein is found . From the column “45% fat in TS” it ap-pears that the milk must be standardised to a fat content of 3 .05% .
In case the protein content of the milk is not known, it is possible to make an approximate calculation of the protein percentage of the milk by using the following equation:
0 .5 x fat% + 1 .4 = protein%
thus, for example,
0 .5 x 3 .8% + 1 .4 = 1 .9 + 1 .4 = 3 .3% protein .
The table is arranged in such a way that it can also be used in case only the fat content of the non-standardised milk is known .
Example 2: The non-standardised milk contains: 04%fatThe cheese is to contain: 40% fat in TS
In the column “Whole milk” of the table, a value of 4 .0% fat is found . From the column “40% fat in TS” it appears that the milk must be standardised to 2 .65% fat . Further-more, it can be seen that this is obtained by mixing 66%
1072948 Indmad.indd 44 03/07/08 14:29:11
45
non-standardised milk with a fat content of 4 .0% with 34% skimmilk .
Cheese samples should be analysed regularly to make sure that the cheesemilk has contained the correct per-centage of fat, and this should be adjusted on the basis of the chemical composition of the milk, which varies with the seasons .It is important that care is taken when stirring the cheese-milk and when carrying out the fat analysis, as a reading error of 0 .1% means an error of 1 .5% fat in TS in a 45% cheese, and more in cheeses of the low-fat type .If samples are taken for analysis of fresh, unsalted cheese, it must be taken into account that the salt increases the TS in the cheese by approximately 2%, reducing the fat in TS by approximately 1 .5% .The final determination of fat in TS can only be carried out after 4-6 weeks when the salt has spread throughout the cheese, but even then, variations of more than 1% fat in TS can be found in cheeses from the same vat . It is therefore advisable to operate with a safety margin of at least 1% for ripened cheese and consequently 1 .5% more for the fresh cheese .Instead of using the table for adjusting the fat content in the cheesemilk, the actual fat percentage can be calcu-lated . Several equations can be used for this calculation, but the one used in the following gives a very high degree of accuracy .
(1) Cheese to be produced: Moisture . . . . . . . . . . . . . . . . . 41 .5% Fat in TS . . . . . . . . . . . . . . . . . 51 .0% Salt (NaCl) . . . . . . . . . . . . . . . . 1 .5%
(2) Raw milk: Fat . . . . . . . . . . . . . . . . . . . . . . 4 .0% Protein . . . . . . . . . . . . . . . . . . . 3 .4%
(3) Retention figures: Fat . . . . . . . . . . . . . . . . . . . . . . 91 .0% Protein . . . . . . . . . . . . . . . . . . . 76 .5% Protein in MSNF in cheese . . . 87 .6%
1072948 Indmad.indd 45 03/07/08 14:29:11

46
(4) Calculations:
(4 .1) Cheese . . . . . . . . . . . . . . . . . . 100 .0% = 1,000 .0 g Moisture . . . . . . . . . . . . . . . . . 41 .5% = 415 .0 g TS . . . . . . . . . . . . . . . . . . . . . . 58 .5% = 585 .0 g Fat in TS . . . . . . . . . . . . . . . . . 51 .0% = 298 .4 g
Solids non-fat . . . . . . . . . . . . . = 286 .6 g Salt (NaCl) . . . . . . . . . . . . . . . . 1 .5% = 15 .0 g
MSNF . . . . . . . . . . . . . . . . . . . = 271 .6 g Protein in MSNF . . . . . . . . . . . 87 .6% = 237 .9 g
(4 .2) Kg milk/kg cheese: Fat Protein 1,000 g cheese: 298 .4 g = 91% 237 .9 g = 76 .5% Whey: 29 .5 g = 9% 73 .1 g = 23 .5%
Cheesemilk: 327 .9 g = 100% 311 .0 g = 100 .0%
Protein in fat-free milk = 3 .4 x 100 = 3 .54% (100 - 4)
Per 1,000 g cheese: Fat-free = 311 .0 x 100 = 8,785 .3 g milk 3 .54
Fat . . . . . . . . . . . . . . = 327 .9 g Cheesemilk . . . . . . . = 9,113 .2 g = 9 .1132 kg milk/kg cheese (4 .3) Fat percentage in cheesemilk:
327 .9 x 100 = 3 .60% 9 .113
(4 .4) Cheese yield:
100 = 10 .97% 9 .113
1072948 Indmad.indd 46 03/07/08 14:29:11
47
Equations often used for the calculation of cheese yields are:
Cheddar Y = (0 .9 F + 0 .78 P - 0 .1) x 1 .09 1 - M
Mozzarella: Y = (0 .88 F + 0 .78 P - 0 .02) x 1 .12 1 - M
Cheddar Y = (0 .77 F + 0 .78 P - 0 .2) x 1 .10 1 - M
where: Y = Yield in per cent F = Fat percentage in milk P = Protein percentage in milk M = Moisture per kg cheese, 38% = 0 .38 kg
Cheese yield is influenced by the loss of fat and curd fines in the whey . However, with modem production equipment and correct processing technology, it is possible to re-duce the fat loss to less than 7 .0% and the loss of curd fines to approx . 100 mg/kg whey .
Utilisation Value of Skimmilk in CheesemakingFor this calculation, the figures from the cheese yield cal-culation are used as an example:
kg cheesemilk per kg cheese . . . . . . . . . . . . . . . . . 9 .1132kg fat in cheesemilk . . . . . . . . . . . . . . . . . . . . . . . . 0 .3279
kg skimmilk . . . . . . . . . . . . . . . . . . . . . . . . . . . . . . . 8 .7853
kg fat in whey . . . . . . . . . . . . . . . . . . . . . . . . . . . . . 0 .0295kg whey . . . . . . . . . . . . . . . . . . . .9 .1132 -1 .000 = 8 .1132
fat in whey . . . . . . . . . . . . . . . . . 0 .0295 x 100 = 0 .36% 8 .1132
The fat in whey may be reduced to 0 .05% by means of separation .
In the following example, the values used are:Cheese = 23 .00 krone/kg*Whey = 00 .30 krone/kgButter fat = 27 .00 krone/kg
* 1 Danish krone = 100 øre
1072948 Indmad.indd 47 03/07/08 14:29:11
48
Income per kg cheese:1 kg cheese . . . . . . . . . . . . . 2,300 .0 øre8 .11 kg whey at 30 øre/kg . . 243 øre
fat from whey separation: 8 .11 x (0 .36 -0 .05) x 2 .700 = 69 .0 øre 2,612 .0 øre 100
Costs per kg cheese:butter value 0 .3279 x 2,700 = 885 .0 øreoperating costs . . . . . . . . . . . 500 .0 øre whey separation 8 .11 x 0 .986 = 8 .0 øre 1,393 .0 øre
Value of skimmilk per kg cheese . . . . . . . . . 976 .2 øre
Utilisation value of skimmilk . . . 1,219 .0 = 138 .8 øre 8 .7853
Strength, Acidity and Temperature of Brine for Salt ing The saturated brine which is normally used for salting cheese occasionally produces too hard a rind, but this can be counteracted by using a weaker solution . The solution should, however, contain at least 20% salt, correspond-ing to 10°BÈ . The strength of the brine should be checked every day: otherwise there is a risk that the solution may become too weak . If this happens, the cheese protein ex-uded through the whey will quickly decompose, and the increase in the growth of bacteria will cause defects not only in the rind but also in the interior of the cheese .
The strength of the brine should be measured with a hy-drometer indicating degrees Baumè . When the brine has been in use for a certain time, the hydrometer will show a deviation of 1-2°BÈ because of the substances dissolved in the brine . In practice, this means that, when measuring the strength of a 2-3 months old brine solution, degrees Baumè can be considered equal to the salt percentage .The acidity of the brine should be about the same as that of the cheese, i .e . approx . pH 5 .2, but in a freshly made solution it will usually be somewhat higher depending upon the acidity of the water supply . It will usually take a week for the acidity to fail to the desired pH level, but to avoid any risk of damaging the cheese rinds during this time, the pH value should immediately be brought to the desired level by the addition of hydrochloric acid to the solution . By means
1072948 Indmad.indd 48 03/07/08 14:29:12
49
of a simple analysis of the creamery’s water supply, any laboratory will be able to state the amount of hydrochloric acid required .The temperature of the brine, in particular, controls the speed at which the salt is absorbed by the cheese, and should be 10-12°C the whole year round . It is therefore often necessary to cool the brine in the summer and heat it in the winter .Strictly speaking, brine can be used for an indefinite time provided that the content of saltpetre (KNO3) or bacteria and moulds does not become too high .If the brine contains considerably more than 100,000 bac-teria or moulds per ml, it should be sterilised by boiling or by adding 1/2 litre sodium hypochlorite per 1,000 litres brine . Sodium hypochlorite can also be added regularly once a month, and this will ensure that the content of harmful bacteria in the brine is kept low . When used for the manufacture of rindless cheese, the brine should be sterilised regularly .
1072948 Indmad.indd 49 03/07/08 14:29:12
50
MEMBRANE FILTRATION
DefinitionsMembrane filtration processes are pressure-driven mo-lecular separation processes to obtain either concentra-tion, fractionation, clarification and/or even a sterilisation of a liquid . The separation is determined by the membrane characteristics (molecular weight cut-off value – MWCO) and the molecular size of the individual components present in the liquid .
Membrane filtration changes the volume and/or the com-position of a liquid, as the feed is divided into two new liquids of altered chemical/microbiological composition:1) the retentate (what is rejected and concentrated by the membrane, e .g . proteins) and2) the permeate (i .e . filtrate, what is passing through the membrane, e .g . water and minerals) .
The volume of permeate produced by a certain membrane surface area per hour is called flux (measured in l/m2/h or simply “lmh”) . The volumetric concentration factor (VCF or CF) is the ratio between the incoming feed volume and the outcoming retentate volume .Rejection is 100%, when the component is fully concen-trated by the membrane (cannot pass the membrane), and the rejection is 0%, when the component passes freely through the membrane, giving an identical concentration on both sides of the membrane .
The driving pressure is the transmembrane pressure (TMP), which is the pressure difference between the mean pressure on the retentate side (high) and the mean pres-sure on the permeate side (low or zero) .
All membrane filtration processes are cross-flow filtra-tion (feed flow parallel to the membrane surface, also called tangential flow), since a high velocity and shear rate across the membrane surface is essential to prevent build-up of retained materials, which reduces run times and flux and may alter the separation characteristics . High cross-flow velocities are especially important in UF and MF systems .
Membrane ProcessesConcentration: In true concentration all total solids are re-
1072948 Indmad.indd 50 03/07/08 14:29:12

51
tained since only water can pass through the membrane (as in evaporation and drying processes) . Example: Re-verse Osmosis (RO) .
Fractionation: Changing the chemical composition by concentrating some components, while others remain un-changed . Example: Nanofiltration (NF), Ultrafiltration (UF), Microfiltration fractionation (MFF) .
Clarification: Changing a turbid liquid into a clear solution by removing all suspended and turbid particles . Example: Ultrafiltration (UF) and Microfiltration (MF)
Sterilisation: Removing all microorganisms from a liquid . Example: Microfiltration (MF) .
Reverse OsmosisIn reverse osmosis practically all total solids compo-nents are rejected by the membrane allowing only water to pass through the membrane . Since also practically all ions (apart from H+ and OH-) are rejected by the mem-brane, the osmotic pressure in the retentate will increase, why high-pressure pumps are needed to overcome the osmotic pressure . The amount of permeate produced is often referred to as “recovery” . 90% recovery means that 90% of the feed is recovered as permeate (equal to 10x concentration) .
Low molecular components like organic acids and NPN-components are not fully rejected by the membrane, es-pecially when they appear uncharged (non-ionic), typically in acidic environments . This is the reason why COD levels in the permeate are higher processing acid products (e .g . lactic acid whey) compared to sweet products (e .g . sweet whey) .
Max . achievable solids by RO are in the range of 17-23% TS for whey and UF permeates .
1072948 Indmad.indd 51 03/07/08 14:29:12
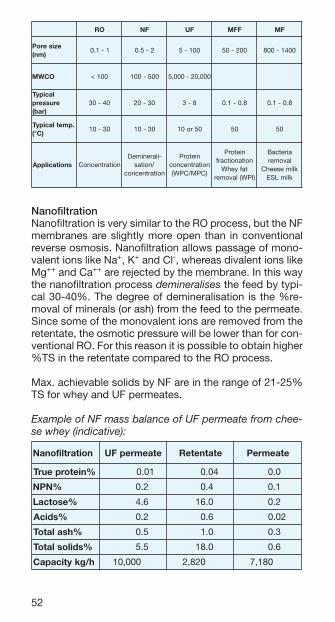
52
OR FN FU FFM FM
eziseroP)mn(
1-1.0 2-5.0 001-5 002-05 0041-008
OCWM 001< 005-001 000,02-000,5
lacipyTerusserp
)rab(04-03 03-02 8-3 8.0-1.0 8.0-1.0
.pmetlacipyT)C°(
03-01 03-01 05ro01 05 05
snoitacilppA noitartnecnoC-ilarenimeD
/noitasnoitartnecnoc
nietorPnoitartnecnoc)CPM/CPW(
nietorPnoitanoitcarf
tafyehW)IPW(lavomer
airetcaBlavomer
klimeseehCklimLSE
NanofiltrationNanofiltration is very similar to the RO process, but the NF membranes are slightly more open than in conventional reverse osmosis . Nanofiltration allows passage of mono-valent ions like Na+, K+ and Cl-, whereas divalent ions like Mg++ and Ca++ are rejected by the membrane . In this way the nanofiltration process demineralises the feed by typi-cal 30-40% . The degree of demineralisation is the %re-moval of minerals (or ash) from the feed to the permeate . Since some of the monovalent ions are removed from the retentate, the osmotic pressure will be lower than for con-ventional RO . For this reason it is possible to obtain higher %TS in the retentate compared to the RO process .
Max . achievable solids by NF are in the range of 21-25% TS for whey and UF permeates .
Example of NF mass balance of UF permeate from chee-se whey (indicative):
noitartlifonaN etaemrepFU etatneteR etaemreP
%nietorpeurT 00,00 10.0 00,0 40.0 00,0 0.0 0
%NPN 00,00 2.0 0 00,0 4.0 0 00,0 1.0 0
%esotcaL 00,00 6.4 0 0,0 0.61 0 00,0 2.0 0
%sdicA 00,00 2.0 0 00,0 6.0 0 00,0 20.0
%hsalatoT 00,00 5.0 0 00,0 0.1 0 00,0 3.0 0
%sdiloslatoT 00,00 5.5 0 0,0 0.81 0 00,0 6.0 0
h/gkyticapaC 000,01 00. 028,2 00. 081,7 00.
1072948 Indmad.indd 52 03/07/08 14:29:14
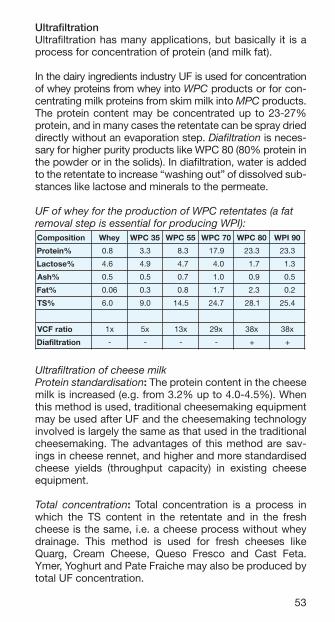
53
UltrafiltrationUltrafiltration has many applications, but basically it is a process for concentration of protein (and milk fat) .
In the dairy ingredients industry UF is used for concentration of whey proteins from whey into WPC products or for con-centrating milk proteins from skim milk into MPC pro ducts . The protein content may be concentrated up to 23-27% protein, and in many cases the retentate can be spray dried directly without an evaporation step . Dia fil tra tion is neces-sary for higher purity products like WPC 80 (80% protein in the powder or in the solids) . In diafiltration, water is added to the retentate to increase “washing out” of dissolved sub-stances like lactose and minerals to the permeate .
UF of whey for the production of WPC retentates (a fat removal step is essential for producing WPI):
noitisopmoC yehW 53CPW 55CPW 07CPW 08CPW 09IPW
%nietorP 8.0 0 3.3 0 3.8 9.71 3.32 3.32
%esotcaL 6.4 0 9.4 0 7.4 0 0.4 0 7.1 0 3.1
%hsA 5.0 0 5.0 0 7.0 0 0.1 0 9.0 0 5.0
%taF 60.0 3.0 0 8.0 0 7.1 0 3.2 0 2.0
%ST 0.6 0 0.9 5.41 7.42 1.82 4.52
oitarFCV x1 x5 x31 x92 x83 x83
noitartlifaiD - - - - + +
Ultrafiltration of cheese milkProtein standardisation: The protein content in the cheese milk is increased (e .g . from 3 .2% up to 4 .0-4 .5%) . When this method is used, traditional cheesemaking equipment may be used after UF and the cheesemaking technology involved is largely the same as that used in the traditional cheesemaking . The advantages of this method are sav-ings in cheese rennet, and higher and more standardised cheese yields (throughput capacity) in existing cheese equipment .
Total concentration: Total concentration is a process in which the TS content in the retentate and in the fresh cheese is the same, i .e . a cheese process without whey drainage . This method is used for fresh cheeses like Quarg, Cream Cheese, Queso Fresco and Cast Feta . Ymer, Yoghurt and Pate Fraiche may also be produced by total UF concentration .
1072948 Indmad.indd 53 03/07/08 14:29:15

54
MicroparticulationMicroparticulation is a thermal and mechanical treatment process that is used to denature whey protein concen-trate (WPC) and form ideal protein particle sizes similar to fat globules in milk . Due to the increasing demand for reduced-fat products, microparticulated whey protein is an attractive option in the dairy and food industries to en-hance taste and texture in reduced-fat products, and also as a multi-functional protein source .APV has developed a unique microparticulation proc-ess, the APV LeanCreme™ process that comprises an ultrafiltration system for the production of WPC and a microparticulation system . The APV LeanCremeTM proc-ess is designed for optimum denaturation and results in a product called LeanCremeTM . In more detail, the LeanCre-meTM process comprises a plate heat exchanger (PHE) for preheating the WPC and a number of ASA’s (APV Shear Agglomerators – purpose-built, scraped surface heat ex-changers), a holding tube, an ASA for the first cooling, and a PHE for the second cooling in the regeneration section . During the APV LeanCremeTM process the particle size is controlled very accurately by the ASA’s .
Holding cell
MP Plant
UF Plant
Membraneloops
Permeate
Whey WPC60
LeanCreme™
ApplicationsCooling
Cooling
Heating
PHEpreheatingASA ASA
Fig. 10: The APV LeanCreme™ process
Particle size distributionLeanCremeTM particle quality is mainly a question of par-ticle size distribution, which is determined and controlled in the process . The curves in the graph below show how the ASA speed has a direct influence on the characteris-tics of two different LeanCreme™ qualities .
1072948 Indmad.indd 54 03/07/08 14:29:16
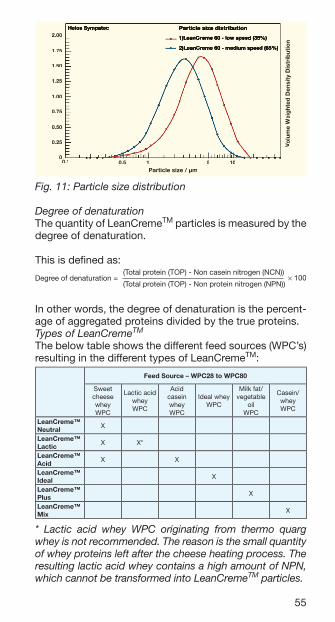
55
Particle size / µm
Volu
me
WVo
lum
e W
Vei
ght
ed D
ensi
ty D
istr
ibut
ion
olu
me
Wei
ght
ed D
ensi
ty D
istr
ibut
ion
olu
me
W
Particle size distribution
1)LeanCreme 60 - low speed (35%)
2)LeanCreme 60 - medium speed (65%)
Helos Sympatec
0.10
0.25
0.50
0.75
1.00
1.25
1.50
1.75
2.00
0.5 1 5 10
Fig. 11: Particle size distribution
Degree of denaturationThe quantity of LeanCremeTM particles is measured by the degree of denaturation .
This is defi ned as:
Degree of denaturation = × 100(Total protein (TOP) - Non casein nitrogen (NCN))
(Total protein (TOP) - Non protein nitrogen (NPN))
In other words, the degree of denaturation is the percent-age of aggregated proteins divided by the true proteins .Types of LeanCremeTM
The below table shows the different feed sources (WPC’s) resulting in the different types of LeanCremeTM:
Feed Source – WPC28 to WPC80
Sweet cheese wheyWPC
Lactic acid whey WPC
Acid casein whey WPC
Ideal whey WPC
Milk fat/ vegetable
oilWPC
Casein/wheyWPC
LeanCreme™ Neutral X
LeanCreme™ Lactic X X*
LeanCreme™ Acid X X
LeanCreme™ Ideal X
LeanCreme™ Plus X
LeanCreme™ Mix X
* Lactic acid whey WPC originating from thermo quarg whey is not recommended. The reason is the small quantity of whey proteins left after the cheese heating process. The resulting lactic acid whey contains a high amount of NPN, which cannot be transformed into LeanCremeTM particles.
1072948 Indmad.indd 55 03/07/08 14:29:19

56
The range of WPC grades that can be microparticulated lies within WPC28 to WPC80 .
ApplicationsThe LeanCreme™ is applicable in the following four seg-ments: Cheese, white line (fresh dairy products), ice cream and whey-based ingredients .
The APV LeanCremeTM process results in a product with superior functionality and physical properties . This has been proven in several tests comparing APV LeanCre-me™ to other microparticulated products .
Characteristics and Advantages APV LeanCreme™ has a creamy mouth feel due to the particle size, the viscosity increase and the functional and binding properties in different food systems . Furthermore, it has high water binding properties . The functional prop-erties are maintained as the product is made in only one process step, thus avoiding over-processing . One of the really important advantages is superior accuracy in particle size distribution, which is especially important for a high recovery degree in cheese and optimal function in general . The recovery of LeanCreme™ in cheese is approx . 75-82% which has been verified in actual plants . The recovery is limited by the content of NPN and GMP (glyco macro pep-tide) . These two proteins are not affected by heat and can therefore not be transformed into LeanCremeTM particles .
A constant product quality is ensured via a high reproduc-ibility of particle size distribution . Flexible particle size dis-tribution enables customisation of LeanCreme™ products for different applications, e .g . yoghurt and ice cream with particle sizes of 1 to 2 microns and cheeses with particle sizes of 5 microns .
Finally, APV LeanCreme™ has excellent texture and taste in both low-fat and full-fat cheese after maturation, which has been verified from actual plants .
MicrofiltrationBasically, there are two microfiltration processes: Bacte-ria removal/”cold sterilisation” (MF) and fractionation (also called microfiltration fractionation – MFF) . In microfiltra-tion applications it is important to operate with low TMP (< 1 bar) .
1072948 Indmad.indd 56 03/07/08 14:29:20

57
Bacteria removal (MF)In “cold sterilisation” using ceramic membranes with 0 .8 -1 .4 micron pore size, it is possible to achieve a 3 .0-4 .0 log reduction of total plate counts . Feed liquids which can be processed are skim milk, whey and WPC . Whole milk can- not be microfiltered due to the presence of milk fat globules, which may block the MF pores . Since only bac-teria are removed, this means theoretically no fractiona-tion takes place . However, aggregated protein particles/mi-celles and large fat globules may be partially rejected by the membrane .
With MF it is possible to produce ESL milk with shelf life up to 28 days at 5°C, or to combine MF with HHT/UHT processes, where the UHT thermal load can be reduced (since MF remove HRS spores) to make new types of mar-ket milk products . For cheese milk, MF is used to remove Clostridia spores so nitrate addition to the cheese milk can be avoided . For raw milk cheese (of non-pasteurised milk), MF operating at <40°C removes critical patogenic bacteria like Listeria and Salmonella by app . 3-3 .5 log reduction .
Cheese brine can also be clarified and sanitised, but for this application SW/organic membranes are often used instead of ceramics . Cheese brines may often contain a large number of yeast and mould, but by means of MF the content can be reduced to < 10/ml without changing the chemical composition of the brine (which happens during pasteurisation) .
Fractionation (MFF)In the protein fractionation processes using ceramic or organic membranes with 0 .1-0 .2 micron pore size, large proteins (casein micelles) are separated from the small soluble proteins (whey proteins) . In this way it is possible to concentrate the micelles, which may have applications in production of cheese, fermented products and modi-fied MPC powder . It may be possible to produce casein-ate only using membranes .
In the whey-defatting process similar membranes are used to remove all fat and aggregated whey proteins from whey or WPC products so as to produce WPI products with less than 1% fat in the powder . Since the pore size is very small for fractionation processes, the permeate is theoretically sterile .
1072948 Indmad.indd 57 03/07/08 14:29:20

58
During the defatting process, a protein loss to the reten-tate should be expected . The protein recovery may be in the range of 70-85% . APV holds a patent to increase the recovery (> 85%) .
APV presently holds four patents in MF applications:1) special handling of retentate to avoid heat treating2) special MF module (UTP design) made solely of stain-
less steel3) double microfiltration to increase food safety4) whey defatting with high protein recovery
Pre-treatmentsMembranes (especially SW elements) are sensitive to sus-pended particles, and cleaning of the membranes may be difficult if these particles are not removed before the mem-brane filtration plant . Therefore a clarification step for whey is necessary to remove cheese fines, and a separator is necessary to remove whey fat . It is also recommended to pasteurise the feed to prevent high bacteria counts in the retentate . A bag filter or metal strainer may also be installed to protect membranes from large particles in the feed .
Calcium phosphate precipitation may occur when concen-trating dairy liquids . This phenomenon can be prevented by lowering the pH (pH adjustment to 5 .9-6 .0), reducing temperature and avoiding high VCF .
Capacity, Run Time and FoulingA membrane is always exposed to fouling, which will lower the permeate flux and thus the plant capacity . In RO/NF processes this fouling may be compensated by gradually increasing the pressure (TMP) to ensure constant plant ca-pacity . This is more difficult for UF membranes, since rais-ing the feed pressure will increase the flux for a short period only, after which it drops back again to the level obtained before the feed pressure was raised . A UF plant may start up at 20-50% higher capacity than the designed, average capacity . Usually after 3-4 hours the average capacity is reached and in the remaining production time, the flux de-crease will be less significant . To obtain constant capacity, overflowing of initial surplus permeate into the feed tank or putting some loops on hold are ways of compensating for the fouling and the reduced plant capacity . Microfiltration plants are usually operated at a constant capacity, since the TMP is minimised to avoid fouling .
1072948 Indmad.indd 58 03/07/08 14:29:20
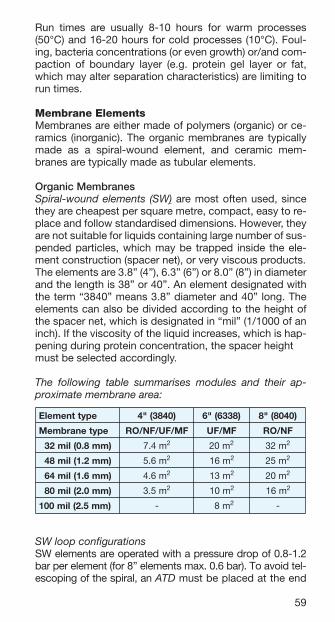
59
Run times are usually 8-10 hours for warm processes (50°C) and 16-20 hours for cold processes (10°C) . Foul-ing, bacteria concentrations (or even growth) or/and com-paction of boundary layer (e .g . protein gel layer or fat, which may alter separation characteristics) are limiting to run times .
Membrane ElementsMembranes are either made of polymers (organic) or ce-ramics (inorganic) . The organic membranes are typically made as a spiral-wound element, and ceramic mem-branes are typically made as tubular elements .
Organic MembranesSpiral-wound elements (SW) are most often used, since they are cheapest per square metre, compact, easy to re-place and follow standardised dimensions . However, they are not suitable for liquids containing large number of sus-pended particles, which may be trapped inside the ele-ment construction (spacer net), or very viscous products .The elements are 3 .8” (4”), 6 .3” (6”) or 8 .0” (8”) in diameter and the length is 38” or 40” . An element designated with the term “3840” means 3 .8” diameter and 40” long . The elements can also be divided according to the height of the spacer net, which is designated in “mil” (1/1000 of an inch) . If the viscosity of the liquid increases, which is hap-pening during protein concentration, the spacer heightmust be selected accordingly .
The following table summarises modules and their ap-proximate membrane area:
epyttnemelE )0483("4 )8336("6 )0408("8
epytenarbmeM FM/FU/FN/OR FM/FU FN/OR
0 )mm8.0(lim23 m4.7 2 m02 2 m23 2
0 )mm2.1(lim84 m6.5 2 m61 2 m52 2
0 )mm6.1(lim46 m6.4 2 m31 2 m02 2
0 )mm0.2(lim08 m5.3 2 m01 2 m61 2
)mm5.2(lim001 - 0 m8 2 -
SW loop configurationsSW elements are operated with a pressure drop of 0 .8-1 .2 bar per element (for 8” elements max . 0 .6 bar) . To avoid tel-escoping of the spiral, an ATD must be placed at the end
1072948 Indmad.indd 59 03/07/08 14:29:21

60
and between the elements . SW elements can be mounted in series inside a housing (also called pressure vessel or module) . Spacer height, flux curves, pump performances and pressure drops determine the configuration of a SW plant .
Plate & frame (P&F), module 37 (M37) is the only P&F mod ule still in use and only for high viscosity products like cream cheese (Philadelphia type) . This module can go high in protein% (more than 29%), when operated with a positive pump up to 12 bar . The crossflow rate should be 25 l/plate/min .When assembling new membranes, the module should be compressed applying 240kN (or 24 tons) of pressure (or until the module stops leaking!) . The M37 module is increasingly challenged by newer module types, like spe-cially designed SW elements and tubular ceramic mem-branes .
Inorganic Membranes (Ceramics)Unlike the polymeric membranes (especially RO/NF), the ceramic material is very resistant to heat and chemicals, and ceramic membranes will last for typically 5-10 years or more . However, they are much more expensive, and generally require more pumping energy . Due to the ce-ramic nature, they are sensitive to mechanical vibrations (should always be installed vertically) and thermal shock .
Tubular membranesAPV’s experience is largely based on the French “Exekia” membrane (formerly SCT) . The membranes are tubular, with the feed circulating inside tubular channels . The di-ameter of these channels is 3, 4 and 6 mm, which is se-lected according to the viscosity of the product . The main application for ceramics is MF, since the ceramic element can be operated with permeate back-pressure, so as to achieve a low TMP, which is crucial for successful results . Two products are available: The standard element, where UTP operation is required (permeate recirculation to cre-ate permeate back-pressure) and the newer GP element, where the permeate back pressure/resistance is integrated inside the membrane structure (GP = Gradient Pressure) .
Available MF pore sizes are: 0 .1 – 0 .2 – 0 .5 – 0 .8 – 1 .4 – 2 – 3 – 5 microns, which are alumina membranes on alumina structure . UF pore sizes available are: 20 – 50 – 100 nm,
1072948 Indmad.indd 60 03/07/08 14:29:21

61
which are zirconia material on alumina structure . For UF processes it is not necessary to control a low TMP .
Exekia Membralox membranes and their membrane areas:
ØezislennahCmm3
)LG03-73P(mm4
)LG04-91P(mm6
)LG06-91P(
m(gnisuohP1 2) 53.0 42.0 63.0
m(gnisuohP3 2) 50.1 27.0 80.1
m(gnisuohP7 2) 54.2 86.1 elbaliavatoN
m(gnisuohP21 2) elbaliavatoN elbaliavatoN 23.4
m(gnisuohP91 2) 56.6 65.4 )P22(29.7
CIPCleaning of membranes is nothing like cleaning of stand-ard dairy equipment made of stainless steel . Membrane elements are often organic polymeric membranes made of materials, which only tolerate certain cleaning limits in terms of pH and temperature (and desinfectants/oxidis-ers) . Therefore it is almost always necessary to use for-mulated cleaning products including enzymatic products from approved suppliers like Henkel, Ecolab, Diversey-Lever, Novadan and others . In the table below some limits are listed for different membrane materials .
lairetamenarbmeMedimayloP
)FN/OR(enohplusyloP
)FU(enohplusyloP
)tHpFU(cimareC)FU/FM(
gnikcab/troppuS retseyloP retseyloP enelyporpyloP animulA
)C°(pmetxaM 05 05 07 )lacitircton(58
etargnilooC lacitirctoN lacitirctoN lacitirctoN nim/°01xaM
egnarHP 5.11-5.1 5.11-5.1 31-1 41-1
enirolhceerF oN mpp002xaM mpp002xaM lacitirctoN
dicacirohpsohP seY seY seY oN
stnatcafruS cinoinaylnO cinoinaylnO cinoinaylnO lacitirctoN
noitatinaS etiflusib%2.0 etiflusib%2.0 etiflusib%2.0 dicacirtin%5.0
Water flux: After installation and cleaning of new membranes, the water flux should be registered to be used for future reference . Organic membranes always stabilise within the first few weeks . Cleaning of membranes should always be followed by a water flux reading, which must be recorded at the same pressure, temperature, time and cleaning step, so the cleaning efficiency can be monitored .
CIP Water Quality GuidelinesFor optimal cleaning and flushing of membranes, the wa-ter used should be within the following specifications
1072948 Indmad.indd 61 03/07/08 14:29:23

62
retemaraP stinUFN/ORcinagro
enarbmem
FM/FUcinagro
enarbmem
FM/FUcimarec
enarbmem)eF(norI l/gm 50 .0< 50 .0< 1 .0<
)nM(esenagnaM l/gm 20 .0< 20 .0< 50 .0<
)lA(muinimulA l/gm 50 .0< 1 .0< 1 .0<
)2OiS(aciliS l/gm 51< 51< 51<
)lCOH/2lC(enirolhC l/gm 1 .0< *5< *5<
ssendraHnamreG Hd° 51< 51< 51<
xednIgniluoF IDS 3< 3< 3<
ytidibruT UTN 1< 1< 1<
C°22tnuocetalplatoTC°73tnuocetalplatoT
lmreplmrep
0001<01<
0001<01<
0001<01<
smrofiloC lm001rep 1< 1< 1<
*) The chlorine content should be max 5 mg/l in order to avoid development of chlorous gas when cleaning with acid .
The above-listed requirements are based upon the various requirements stated by our membrane manufacturers .If the silica content is less than 5 mg/l, higher levels of iron (max . 0 .2 mg/l) and manganese (max . 0 .05 mg/l) may be accepted in some cases .If water hardness is higher than 15°dH, it may still be ac-cepted, but the CIP procedure will have to be modified accordingly (higher dosage concentrations, extra addition of EDTA/NTA, etc .)
Water sourceWater classified as “Drinking Water” (potable) is generally acceptable, on the condition that the above-listed specifi-cations are fulfilled . Softened water is also acceptable, but the conductivity should be min . 5 µS/cm, in order not to prolong flushing time resulting in unacceptably high water consumption .RO permeate and evaporator condensate may contain some organic acids (COD > 20 mg/l) . It should be stored at cold temperature and for as short time as possible before use . For intermediate flushing this water is fine . For final flushing there will be a risk of bacteria growth, when the plant is left closed down . This risk is reduced if the last cleaning step involves chlorine .Some customers are adding antifoaming agents to their evaporator condensate . Antifoaming agents may block the membranes irreversibly and cannot be accepted in the water .
1072948 Indmad.indd 62 03/07/08 14:29:24
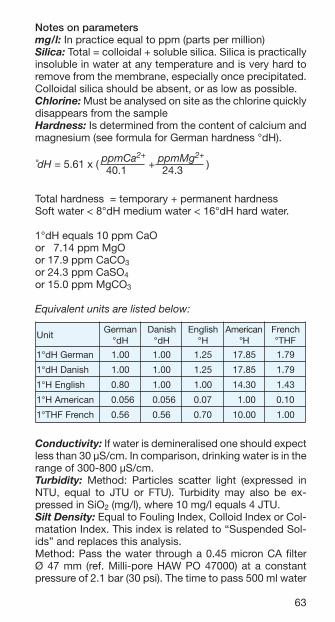
63
Notes on parametersmg/l: In practice equal to ppm (parts per million)Silica: Total = colloidal + soluble silica . Silica is practically insoluble in water at any temperature and is very hard to remove from the membrane, especially once precipitated . Colloidal silica should be absent, or as low as possible . Chlorine: Must be analysed on site as the chlorine quickly disappears from the sampleHardness: Is determined from the content of calcium and magnesium (see formula for German hardness °dH) .
˚dH = 5 .61 x ( ppmCa2+ + ppmMg2+
) 40 .1 24 .3
Total hardness = temporary + permanent hardnessSoft water < 8°dH medium water < 16°dH hard water .
1°dH equals 10 ppm CaOor 07 .14 ppm MgOor 17 .9 ppm CaCO3 or 24 .3 ppm CaSO4 or 15 .0 ppm MgCO3
Equivalent units are listed below:
tinUnamreG
Hd°hsinaD
Hd°hsilgnE
H°naciremA
H°hcnerF
FHT°
namreGHd°1 00.1 00.1 52.1 58.71 97.1
hsinaDHd°1 00.1 00.1 52.1 58.71 97.1
hsilgnEH°1 08.0 00.1 00.1 03.41 34.1
naciremAH°1 650.0 650.0 70.0 00.1 01.0
hcnerFFHT°1 65.0 65.0 07.0 00.01 00.1
Conductivity: If water is demineralised one should expect less than 30 µS/cm . In comparison, drinking water is in the range of 300-800 µS/cm .Turbidity: Method: Particles scatter light (expressed in NTU, equal to JTU or FTU) . Turbidity may also be ex-pressed in SiO2 (mg/l), where 10 mg/l equals 4 JTU .Silt Density: Equal to Fouling Index, Colloid Index or Col-matation Index . This index is related to “Suspended Sol-ids” and replaces this analysis . Method: Pass the water through a 0 .45 micron CA filter Ø 47 mm (ref . Milli-pore HAW PO 47000) at a constant pressure of 2 .1 bar (30 psi) . The time to pass 500 ml water
1072948 Indmad.indd 63 03/07/08 14:29:25
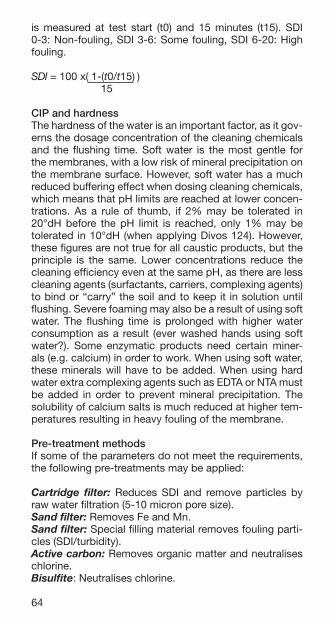
64
is measured at test start (t0) and 15 minutes (t15) . SDI 0-3: Non-fouling, SDI 3-6: Some fouling, SDI 6-20: High fouling .
SDI = 100 x ( 1-(t0/t15) ) 15
CIP and hardnessThe hardness of the water is an important factor, as it gov-erns the dosage concentration of the cleaning chemicals and the flushing time . Soft water is the most gentle for the membranes, with a low risk of mineral precipitation on the membrane surface . However, soft water has a much reduced buffering effect when dosing cleaning chemicals, which means that pH limits are reached at lower concen-trations . As a rule of thumb, if 2% may be tolerated in 20°dH before the pH limit is reached, only 1% may be tolerated in 10°dH (when applying Divos 124) . However, these figures are not true for all caustic products, but the principle is the same . Lower concentrations reduce the cleaning efficiency even at the same pH, as there are less cleaning agents (surfactants, carriers, complexing agents) to bind or “carry” the soil and to keep it in solution until flushing . Severe foaming may also be a result of using soft water . The flushing time is prolonged with higher water consumption as a result (ever washed hands using soft water?) . Some enzymatic products need certain miner-als (e .g . calcium) in order to work . When using soft water, these minerals will have to be added . When using hard water extra complexing agents such as EDTA or NTA must be added in order to prevent mineral precipitation . The solubility of calcium salts is much reduced at higher tem-peratures resulting in heavy fouling of the membrane .
Pre-treatment methodsIf some of the parameters do not meet the requirements, the following pre-treatments may be applied:
Cartridge filter: Reduces SDI and remove particles by raw water filtration (5-10 micron pore size) .Sand filter: Removes Fe and Mn .Sand filter: Special filling material removes fouling parti-cles (SDI/turbidity) .Active carbon: Removes organic matter and neutralises chlorine .Bisulfite: Neutralises chlorine .
1072948 Indmad.indd 64 03/07/08 14:29:26

65
Ion exchange: Removes SiO2, Al, Fe, Mn, softens hard water .Chlorination: Kills bacteria (e .g . from surface water) . One hour chlorination followed by dechlorination is recom-mended .
Milk and Whey Composition
Raw milk quality (Denmark, 2001):
artxE ssalcts1 ssalcdn2 ssalcdr3
lm/stnuoclatoT 0 000.03< 0 000.001-000.03 000.003-000.001 000.003>
lm/slleccitamoS 000.003< 000.004-000.003 000.056-000.004 000.056>
l/seropsciboreanA 004< 004< 0011-004 0011>
C°tniopgnizeerF 615.0-ot345.0-
scitoibitnA evitageN
Composition of milk in Northern Europe (average values):
klimwaR)9991LN/KD(
klimmikS)2002ynamreG(
TAF %3.4 %60.0
)nietorplatot(POT %4.3 %36.3
)83.6xNPN(NPN %91.0 %91.0
)nietorpeurt(PRT %12.3 %44.3
)snietorpyehweurt(PWT %55.0 %06.0
)niesac(SAC %66.2 %48.2
)dicacirtic(DCA %81.0 %02.0
)esotcal(CAL %56.4 %48.4
)hsalatot(AOT %37.0 %77.0
)sdiloslatot(ST %3.31 %05.9
oitarPRT/SAC %48-38 %6.28
oitarPOT/SAC %97-77 %2.87
oitarPOT/PWT %5.51-5.61
oitarPOT/NPN %5.6-0.5 %2.5
1072948 Indmad.indd 65 03/07/08 14:29:28
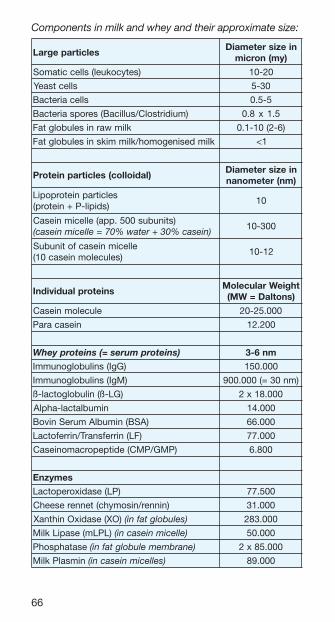
66
Components in milk and whey and their approximate size:
selcitrapegraLniezisretemaiD
)ym(norcim
)setycokuel(slleccitamoS 02-01
sllectsaeY 03-5
sllecairetcaB 5-5.0
)muidirtsolC/sullicaB(seropsairetcaB 5.1x8.0
klimwarniselubolgtaF )6-2(01-1.0
klimdesinegomoh/klimmiksniselubolgtaF 1<
)ladiolloc(selcitrapnietorPniezisretemaiD)mn(retemonan
selcitrapnietorpopiL)sdipil-P+nietorp(
01
)stinubus005.ppa(ellecimniesaC)niesac%03+retaw%07=ellecimniesac(
003-01
ellecimniesacfotinubuS)selucelomniesac01(
21-01
snietorplaudividnIthgieWraluceloM
)snotlaD=WM(
elucelomniesaC 000.52-02
niesacaraP 002.21
)snietorpmures=(snietorpyehW mn6-3)GgI(snilubolgonummI 000.051
)MgI(snilubolgonummI )mn03=(000.009
)GL-ß(nilubolgotcal-ß 000.81x2
nimublatcal-ahplA 000.41
)ASB(nimublAmureSnivoB 000.66
)FL(nirrefsnarT/nirrefotcaL 000.77
)PMG/PMC(editpeporcamoniesaC 008.6
semyznE)PL(esadixorepotcaL 005.77
)ninner/nisomyhc(tennereseehC 000.13
)OX(esadixOnihtnaX )selubolgtafni( 000.382
)LPLm(esapiLkliM )ellecimniesacni( 000.05
esatahpsohP )enarbmemelubolgtafni( 000.58x2
nimsalPkliM )sellecimniesacni( 000.98
)NPN(negortiNnietorP-noNthgieWraluceloM
)snotlad=WM(
)nimativ(nilohC 121
sdicaonimA 002-57
seditpeP 0051-002
N-aerU 06
ninitaerc/nitaerC 131
sdicA/setardyhobraCesotcaL 243
esoculG 081
esotcalaG 081
esolutcaL 243
dicacitcaL 09
dicacirtiC 291
dicacitecA 06
degrahcylevitisop–slareniM)+aN(muidoS 32
)++gM(muisengaM 42
)+K(muissatoP 93
elbulos)++aC(muiclaC 04
degrahcylevitagen–slareniM)-lC(edirolhC 53
elbulos)—4OP(etahpsohP 59
)—4OS(etahpluS 69
)-3OCH(etanobraC 16
1072948 Indmad.indd 66 03/07/08 14:29:30
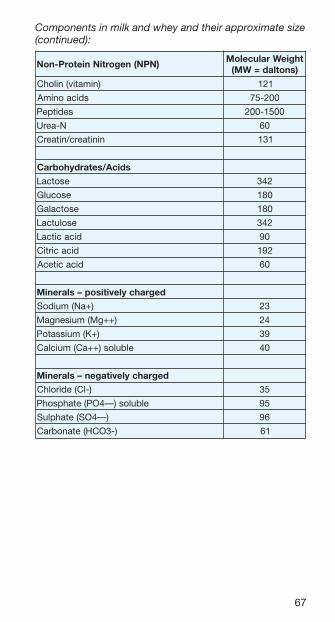
67
Components in milk and whey and their approximate size (continued):
selcitrapegraLniezisretemaiD
)ym(norcim
)setycokuel(slleccitamoS 02-01
sllectsaeY 03-5
sllecairetcaB 5-5.0
)muidirtsolC/sullicaB(seropsairetcaB 5.1x8.0
klimwarniselubolgtaF )6-2(01-1.0
klimdesinegomoh/klimmiksniselubolgtaF 1<
)ladiolloc(selcitrapnietorPniezisretemaiD)mn(retemonan
selcitrapnietorpopiL)sdipil-P+nietorp(
01
)stinubus005.ppa(ellecimniesaC)niesac%03+retaw%07=ellecimniesac(
003-01
ellecimniesacfotinubuS)selucelomniesac01(
21-01
snietorplaudividnIthgieWraluceloM
)snotlaD=WM(
elucelomniesaC 000.52-02
niesacaraP 002.21
)snietorpmures=(snietorpyehW mn6-3)GgI(snilubolgonummI 000.051
)MgI(snilubolgonummI )mn03=(000.009
)GL-ß(nilubolgotcal-ß 000.81x2
nimublatcal-ahplA 000.41
)ASB(nimublAmureSnivoB 000.66
)FL(nirrefsnarT/nirrefotcaL 000.77
)PMG/PMC(editpeporcamoniesaC 008.6
semyznE)PL(esadixorepotcaL 005.77
)ninner/nisomyhc(tennereseehC 000.13
)OX(esadixOnihtnaX )selubolgtafni( 000.382
)LPLm(esapiLkliM )ellecimniesacni( 000.05
esatahpsohP )enarbmemelubolgtafni( 000.58x2
nimsalPkliM )sellecimniesacni( 000.98
)NPN(negortiNnietorP-noNthgieWraluceloM
)snotlad=WM(
)nimativ(nilohC 121
sdicaonimA 002-57
seditpeP 0051-002
N-aerU 06
ninitaerc/nitaerC 131
sdicA/setardyhobraCesotcaL 243
esoculG 081
esotcalaG 081
esolutcaL 243
dicacitcaL 09
dicacirtiC 291
dicacitecA 06
degrahcylevitisop–slareniM)+aN(muidoS 32
)++gM(muisengaM 42
)+K(muissatoP 93
elbulos)++aC(muiclaC 04
degrahcylevitagen–slareniM)-lC(edirolhC 53
elbulos)—4OP(etahpsohP 59
)—4OS(etahpluS 69
)-3OCH(etanobraC 16
1072948 Indmad.indd 67 03/07/08 14:29:31
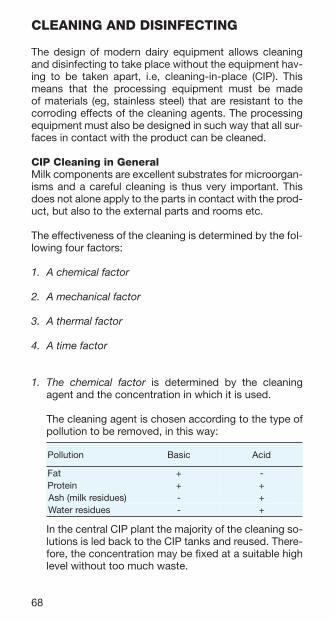
68
CLEANING AND DISINFECTING
The design of modern dairy equipment allows cleaning and disinfecting to take place without the equipment hav-ing to be taken apart, i .e, cleaning-in-place (CIP) . This means that the processing equipment must be made of materials (eg, stainless steel) that are resistant to the corroding effects of the cleaning agents . The processing equipment must also be designed in such way that all sur-faces in contact with the product can be cleaned .
CIP Cleaning in GeneralMilk components are excellent substrates for microorgan-isms and a careful cleaning is thus very important . This does not alone apply to the parts in contact with the prod-uct, but also to the external parts and rooms etc .
The effectiveness of the cleaning is determined by the fol-lowing four factors:
1. A chemical factor
2. A mechanical factor
3. A thermal factor
4. A time factor
1. The chemical factor is determined by the cleaning agent and the concentration in which it is used .
The cleaning agent is chosen according to the type of pollution to be removed, in this way:
noitulloP cisaB dicA
taF + -nietorP + +
)seudiserklim(hsA - +seudiserretaW - +
In the central CIP plant the majority of the cleaning so-lutions is led back to the CIP tanks and reused . There-fore, the concentration may be fixed at a suitable high level without too much waste .
1072948 Indmad.indd 68 03/07/08 14:29:32
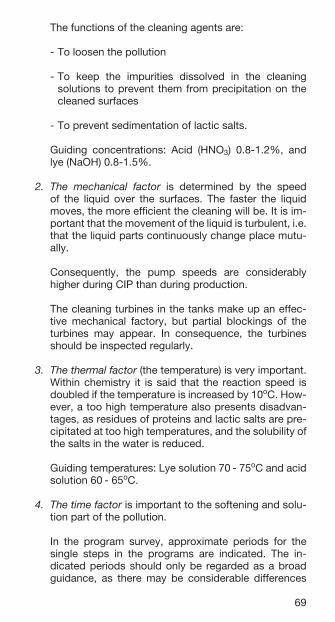
69
The functions of the cleaning agents are:
- To loosen the pollution
- To keep the impurities dissolved in the cleaning solutions to prevent them from precipitation on the cleaned surfaces
- To prevent sedimentation of lactic salts .
Guiding concentrations: Acid (HNO3) 0 .8-1 .2%, and lye (NaOH) 0 .8-1 .5% .
2. The mechanical factor is determined by the speed of the liquid over the surfaces . The faster the liquid moves, the more efficient the cleaning will be . It is im-portant that the movement of the liquid is turbulent, i .e . that the liquid parts continuously change place mutu-ally .
Consequently, the pump speeds are considerably higher during CIP than during production .
The cleaning turbines in the tanks make up an effec-tive mechanical factory, but partial blockings of the turbines may appear . In consequence, the turbines should be inspected regularly .
3. The thermal factor (the temperature) is very important . Within chemistry it is said that the reaction speed is doubled if the temperature is increased by 10oC . How-ever, a too high temperature also presents disadvan-tages, as residues of proteins and lactic salts are pre-cipitated at too high temperatures, and the solubility of the salts in the water is reduced .
Guiding temperatures: Lye solution 70 - 75oC and acid solution 60 - 65oC .
4. The time factor is important to the softening and solu-tion part of the pollution .
In the program survey, approximate periods for the single steps in the programs are indicated . The in-dicated periods should only be regarded as a broad guidance, as there may be considerable differences
1072948 Indmad.indd 69 03/07/08 14:29:32
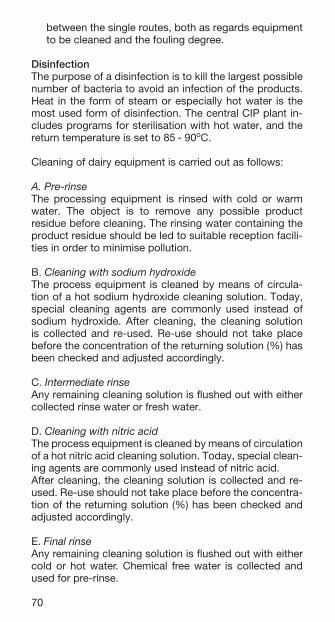
70
between the single routes, both as regards equipment to be cleaned and the fouling degree .
DisinfectionThe purpose of a disinfection is to kill the largest possible number of bacteria to avoid an infection of the products . Heat in the form of steam or especially hot water is the most used form of disinfection . The central CIP plant in-cludes programs for sterilisation with hot water, and the return temperature is set to 85 - 90oC .
Cleaning of dairy equipment is carried out as follows:
A. Pre-rinseThe processing equipment is rinsed with cold or warm water . The object is to remove any possible product residue before cleaning . The rinsing water containing the product residue should be led to suitable reception facili-ties in order to minimise pollution .
B . Cleaning with sodium hydroxideThe process equipment is cleaned by means of circula-tion of a hot sodium hydroxide cleaning solution . Today, special cleaning agents are commonly used instead of sodium hydroxide . After cleaning, the cleaning solution is collected and re-used . Re-use should not take place before the concentration of the returning solution (%) has been checked and adjusted accordingly .
C . Intermediate rinseAny remaining cleaning solution is flushed out with either collected rinse water or fresh water .
D . Cleaning with nitric acidThe process equipment is cleaned by means of circulation of a hot nitric acid cleaning solution . Today, special clean-ing agents are commonly used instead of nitric acid .After cleaning, the cleaning solution is collected and re-used . Re-use should not take place before the concentra-tion of the returning solution (%) has been checked and adjusted accordingly .
E . Final rinseAny remaining cleaning solution is flushed out with either cold or hot water . Chemical free water is collected and used for pre-rinse .
1072948 Indmad.indd 70 03/07/08 14:29:32

71
F . DisinfectionThis is carried out immediately before the product plant is put into operation . Disinfection can be carried out thermally or chemically . The CIP plant is normally designed to allow for disinfection by circulation of either hot water at 90-95°C or a solution of e .g . hydrogen peroxide . Today special agents for disinfection is widely used in place of hydrogen peroxide . Disinfection must always be followed by a rinse with clean and drinkable water .
Cleaning MethodsCleaning agents:The following cleaning agents can be used for CIP-clean-ing .
Lye, NaOH, Sodium hydroxide:- 30% concentrated solution .
Acid, HNO3,Nitric acid:- 30% concentrated solution .- 62% concentrated solution .
Hydrochloric acid, (HCl), and/or chlorine-containing clea-ning agents, (Cl ), must never be used .
Normally used cleaning solutions:
Lye: NaOH - Solution for cleaning of tanks and pipes 0 .8-1 .2% Above corresponds to a titter of 20 .0-30 .0
Lye: NaOH - Solution for cleaning of pasteuriser 1 .2-1 .5% Above corresponds to a titter of 30 .0-37 .5
Acid: HNO3 - Solution for cleaning of tanks and pipes . 0 .8-1 .0% Above corresponds to a titter of 12 .7-15 .9
Acid: HNO3 - Solution for cleaning of pasteuriser 0 .8-1 .2% Above corresponds to a titter of 12 .7-19 .0
Note: Titter corresponds to ml 0 .1 N (NaOH or HCL), per 10 ml against phenolphthalein (8 .4) .
1072948 Indmad.indd 71 03/07/08 14:29:32
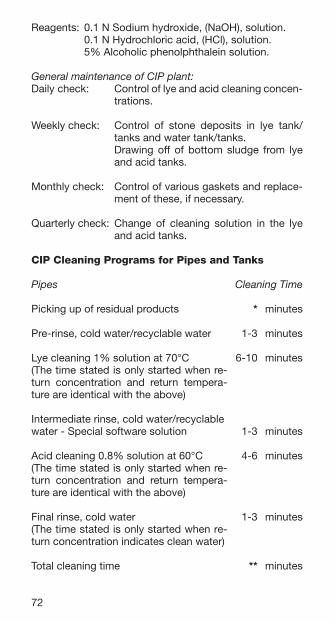
72
Reagents: 0 .1 N Sodium hydroxide, (NaOH), solution . 0 .1 N Hydrochloric acid, (HCl), solution . 5% Alcoholic phenolphthalein solution .
General maintenance of CIP plant:Daily check: Control of lye and acid cleaning concen-
trations .
Weekly check: Control of stone deposits in lye tank/tanks and water tank/tanks .
Drawing off of bottom sludge from lye and acid tanks .
Monthly check: Control of various gaskets and replace-ment of these, if necessary .
Quarterly check: Change of cleaning solution in the lye and acid tanks .
CIP Cleaning Programs for Pipes and Tanks
Pipes Cleaning Time
Picking up of residual products * minutes
Pre-rinse, cold water/recyclable water 1-3 minutes
Lye cleaning 1% solution at 70°C 6-10 minutes(The time stated is only started when re-turn concentration and return tempera-ture are identical with the above)
Intermediate rinse, cold water/recyclable water - Special software solution 1-3 minutes
Acid cleaning 0 .8% solution at 60°C 4-6 minutes(The time stated is only started when re-turn concentration and return tempera-ture are identical with the above)
Final rinse, cold water 1-3 minutes(The time stated is only started when re-turn concentration indicates clean water)
Total cleaning time ** minutes
1072948 Indmad.indd 72 03/07/08 14:29:33
73
Hot water sterilisation at 85°C 3-5 minutes(The time stated is only started when return temperature is identical with the above)
Cold water disinfection with hydrogen peroxide, H2O2, solution 200 ppm .
*)Time is dependent on the physical conditions in and around various pipes/pipelines to be cleaned .
**)Time is dependent on the physical conditions in and around various pipes/pipelines to be cleaned as well as the software to control cleaning of pipes/pipelines .
Above times are stated as efficient cleaning times and should be seen as recommendable values . These values may change dependent on the physical conditions in and around various pipes/pipelines as well as the complexity of various products with regard to the physical/chemical conditions, as well as the complexity of various physical/chemical as well as microbiological deposits .
Tanks Cleaning Time
Picking up of residual products * minutes
Pre-rinse, cold water/recyclable water 1-3 minutes
Lye cleaning 1% solution at 70°C 10-15 minutes(The time stated is only started when re-turn concentration and return tempera-ture are identical with the above)
Intermediate rinse, cold water/recyclable water - special software solution 1-3 minutes
Acid cleaning 0 .8% solution at 50-60°C 4-6 minutes(The time stated is only started when re-turn concentration and return tempera-ture are identical with the above)
1072948 Indmad.indd 73 03/07/08 14:29:33
74
Final rinse, cold water 0 .5-1 minute(The time stated is only started when re-turn concentration indicates clean water)
Total cleaning time ** minutes
Hot water sterilisation at 85°C 3-5 minutes(The time stated is only started when return temperature is identical with the above)
Cold water disinfection with hydrogen peroxide, H2O2, solution 200 ppm
*)Time is dependent on the physical conditions in and around various tanks to be cleaned (tank dimension) .
**)Time is dependent on the physical conditions in and around various tanks to be cleaned (tank dimension), as well as the software to control cleaning of tank/tanks .
Above times are stated as efficient cleaning times and should be seen as recommendable values . These values may change dependent on the physical conditions in and around various tanks (tank dimensions) as well as the complexity of various products with regard to the physical/chemical conditions, as well as the complexity of various physical/chemical as well as microbiological deposits .
CIP Cleaning Programs for Plate Pasteurisers
Pasteurisers Cleaning Time
Picking up of residual products * minutes
Pre-rinse, cold water/recyclable water 5-10 minutes
Lye cleaning 1 .5% solution at 70°C 45-60 minutes(The time stated is only started when re-turn concentration and return tempera-ture are identical with the above)
Intermediate rinse, cold water/recyclable water - special software solution 5-10 minutes
1072948 Indmad.indd 74 03/07/08 14:29:33
75
Acid cleaning 0 .8% solution at 50-60°C 20-30 minutes(The time stated is only started when re-turn concentration and return tempera-ture are identical with the above)
Final rinse, cold water 2-5 minutes(The time stated is only started when re-turn concentration indicates clean water)
Total cleaning time ** minutes
Hot water sterilisation at 85°C 15-20 minutes(The time stated is only started when return temperature is identical with the above)
Cold water disinfection with hydrogen peroxide, H2O2, solution 200 ppm .
*)Time is dependent on the physical conditions in and around various pasteuriser/pasteuriser plants to be cleaned .
**)Time is dependent on the physical conditions in and around various pasteuriser/pasteuriser plants to be cleaned as well as the software to control cleaning of pas-teuriser/pasteuriser plants .
Above times are stated as efficient cleaning times and should be seen as recommendable values . These values may change dependent on the physical conditions in and around various pasteuriser/pasteuriser plants as well as the complexity of various products with regard to the physical/chemical conditions, as well as the complexity of various physical/chemical as well as microbiological deposits .
Pasteurisers CIP*
Continuous buttermaking machines CIP** special
Ultrafiltration plants (UF) CIP*** special
Evaporators CIP
1072948 Indmad.indd 75 03/07/08 14:29:33
76
*) As a consequence of both a higher detergent concen-tration and a longer cleaning period compared with the cleaning of pipes and tanks, it may be appropriate to clean the pasteurisation plant independently of the CIP plant for pipes and milk tanks .At the end of the production run, the pasteurisers, in-cluding pumps, valves and pipes, are flushed out with cold water until the water is clear and free of milk at the outlet .A closed circulating flow is then established by lead-ing the water from the outlet back to the balance tank and slowly adding approx . 3 .5-4 .0 l 30% sodium hydroxide (NaOH) per 100 kg water in the system . If the sodium hydroxide is in dry form, it should be dis-solved in approx . 10 l cold water per kg NaOH before it is added to the balance tank .Warning: NaOH should always be mixed slowly into cold water - never water into NaOH as it will boil up with explosive force . Always use facial protection when working with concentrated detergents . If the volume of the plant is unknown, the concentration must be checked as described below .If the water is very hard, 300-500 g trisodium phos-phate should also be added .The temperature is raised to 70-75°C and circulation is continued for at least 45-60 minutes .The NaOH solution is flushed out with water and the circulating flow is re-established . Then, approx . 2 .5 l nitric acid (30%) is added slowly and circulated for 20-30 minutes at 60-65°C after which the acid is flushed out with water .Before start-up of the next production run, the pas-teurisation system is disinfected by circulation of hot water at 90°C for 15-20 minutes . Cooling and pasteur-ising temperatures are adjusted to normal production before the water is forced out with milk .
**) CIP of buttermaking machines is always carried out without the use of the ordinary CIP plant, because rel-atively large amounts of fat residue must be removed by the detergent and because the cleaning of butter-making equipment must give the machine surfaces a protective coating, which serves to prevent the butter from adhering to the surfaces . For cleaning, an inter-nal circulating flow is established .
***) CIP of a UF plant is always carried out by means of an internal circulating flow as special detergents are used
1072948 Indmad.indd 76 03/07/08 14:29:33

77
in order to prevent any damage to the membranes, which would reduce the permeate flow .
General Comments to Defects/Faults in CIP CleaningIn case of unsatisfactory cleaning, the following defects/faults may be the cause:
1 . CIP flow speed too low2 . Cleaning time too short3 . Cleaning concentration (lye or/and acid) too low4 . Cleaning temperature too high/low5 . Time of production without cleaning too long6 . Etc .
Manual CleaningCIP is automatic cleaning, but firstly the external surfaces are not cleaned by CIP, secondly there will always be a few machine parts that have to be cleaned every day . Futher-more, requirements for disassembling of large machine parts, a .o . plate heat exchangers and pipe connections, will arise at intervals .
Dirty surfaces, e .g . due to leakage, must be cleaned every day with hot soapy water and rinsed with clean water .
Cleaning also includes the rooms, and plans for regular manual cleaning of both rooms and equipment should be worked out .
A visual control of the effectiveness of the cleaning may be difficult . Although a surface seems clean, there may be a large number of bacteria per cm2 .
Check of the Cleaning EffectHygienic controlApart from the daily visual control with the hygienic con-dition of the production equipment and the production rooms, microbiological examinations should be made for determination of the state of cleaning effect, for instance by means of the swabbing method .
Equipment:1 . Swabs made of cotton wool coiled around the end of
a small stick .
1072948 Indmad.indd 77 03/07/08 14:29:33
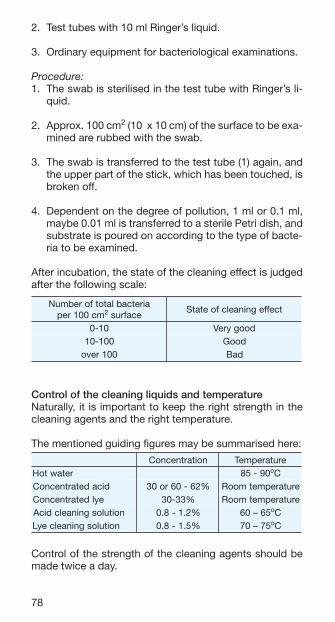
78
2 . Test tubes with 10 ml Ringer’s liquid .
3 . Ordinary equipment for bacteriological examinations .
Procedure:1 . The swab is sterilised in the test tube with Ringer’s li-
quid .
2 . Approx . 100 cm2 (10 x 10 cm) of the surface to be exa-mined are rubbed with the swab .
3 . The swab is transferred to the test tube (1) again, and the upper part of the stick, which has been touched, is broken off .
4 . Dependent on the degree of pollution, 1 ml or 0 .1 ml, maybe 0 .01 ml is transferred to a sterile Petri dish, and substrate is poured on according to the type of bacte-ria to be examined .
After incubation, the state of the cleaning effect is judged after the following scale:
airetcablatotforebmuNmc001rep 2 ecafrus
tceffegninaelcfoetatS
01-0 doogyreV001-01 dooG001revo daB
Control of the cleaning liquids and temperatureNaturally, it is important to keep the right strength in the cleaning agents and the right temperature .
The mentioned guiding figures may be summarised here:
noitartnecnoC erutarepmeTretawtoH 09-58 oC
dicadetartnecnoC %26-06ro03 erutarepmetmooReyldetartnecnoC %33-03 erutarepmetmooR
noitulosgninaelcdicA %2.1-8.0 56–06 oCnoitulosgninaelceyL %5.1-8.0 57–07 oC
Control of the strength of the cleaning agents should be made twice a day .
1072948 Indmad.indd 78 03/07/08 14:29:35
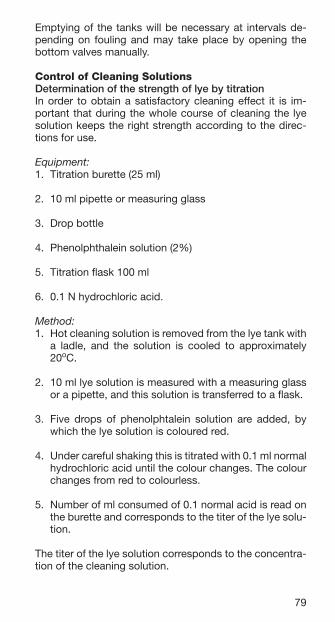
79
Emptying of the tanks will be necessary at intervals de-pending on fouling and may take place by opening the bottom valves manually .
Control of Cleaning SolutionsDetermination of the strength of lye by titration In order to obtain a satisfactory cleaning effect it is im-portant that during the whole course of cleaning the lye solution keeps the right strength according to the direc-tions for use .
Equipment:1 . Titration burette (25 ml)
2 . 10 ml pipette or measuring glass
3 . Drop bottle
4 . Phenolphthalein solution (2%)
5 . Titration flask 100 ml
6 . 0 .1 N hydrochloric acid .
Method:1 . Hot cleaning solution is removed from the lye tank with
a ladle, and the solution is cooled to approximately 20oC .
2 . 10 ml lye solution is measured with a measuring glass or a pipette, and this solution is transferred to a flask .
3 . Five drops of phenolphtalein solution are added, by which the lye solution is coloured red .
4 . Under careful shaking this is titrated with 0 .1 ml normal hydrochloric acid until the colour changes . The colour changes from red to colourless .
5 . Number of ml consumed of 0 .1 normal acid is read on the burette and corresponds to the titer of the lye solu-tion .
The titer of the lye solution corresponds to the concentra-tion of the cleaning solution .
1072948 Indmad.indd 79 03/07/08 14:29:35

80
The concentration in the cleaning solution can be calcu-lated as follows:
Concentration in %: a x b x c = xx .x % 100
Where:a = ml titration fluid until colour change/10 ml solution
b = normality of titration fluid (0 .1)
c = molecular weight (NaOH = 40 .0)
Example:Concentration in % 25 .0 x 0 .1 x 40 .0 = 1 .00 % 100
Determination of the strength of the acid by titrationAcid cleaning solutions containing nitric acid (technically clean, approximately 62%) are used at the dairies with mechanical cleaning of pipes and tanks of completely stainless material . Acid solutions dissolve calcium oxide coatings, and lye solutions dissolve protein coatings . This is why combined cleaning is used, e .g . lye solution at first, then acid solution, or in reverse order, depending on which cleaning technique gives the best result on the spot .
Equipment:1 . Titration equipment (see under lye solution) .
2 . 0 .1 N sodium hydroxide .
Method:1 . The acid solution is removed from the acid container,
and this solution is cooled to approximately 20oC .
2 . 10 ml acid solution is measured with a measuring glass or a pipette, and this solution is transferred to a titra-tion flask .
3 . Five drops of phenolphtalein solution are added .
4 . Under careful shaking this is titrated with 0 .1 normal sodium hydroxide until the colour changes . The colour changes from colourless to red .
1072948 Indmad.indd 80 03/07/08 14:29:35

81
5 . Number of ml consumed of 0 .1 normal lye is read on the burette and corresponds to the titer of the acid so-lution .
The titer of the acid solution corresponds to the concen-tration of the cleaning solution .
The concentration in the cleaning solution can be calcu-lated as follows:Concentration in %: a x b x c = xx .x % 100
Where:a = ml titration fluid until colour change/10 ml solution
b = normality of titration fluid (0 .1)
c = molecular weight (HNO3 = 63 .02)
Example:Concentration in % 15 .9 x 0 .1 x 63 .02 = 1 .00 % 100
In order to make the calculation easier it is possible to work out tables for the lye or acid strength and titer, e .g . from 0 .1%-2% so that it is possible to read the lye or acid strength directly . (see Table: Concentration of Cleaning Solution)
To compare the strength of the cleaning solution and the conductivity measured in milli-siemens mS please look in the manual of Henkel P3-LMIT 08 .
1072948 Indmad.indd 81 03/07/08 14:29:35

82
Concentration of Cleaning Solution eyLHOaN
edixordyHmuidoS
-necnoCnoitart
dicAONH 3
dicacirtiNnoitartiT
n1.0LCH
lm01/lm
%03HOaNl001/l
%%03
3ONHl001/l
%263ONHl001/l
noitartiT1.0
HOaNnlm01/lm
0 5.2 52.0 1.0 03.0 01.0 0 06.10 0.5 05.0 2.0 55.0 52.0 0 02.30 5.7 57.0 3.0 58.0 53.0 0 08.4
0.01 00.1 4.0 51.1 54.0 0 03.65.21 52.1 5.0 04.1 06.0 0 09.70.51 05.1 6.0 07.1 07.0 0 05.95.71 57.1 7.0 00.2 08.0 01.110.02 00.2 8.0 52.2 59.0 07.215.22 52.2 9.0 55.2 50.1 03.410.52 05.2 0.1 08.2 51.1 09.515.72 57.2 1.1 01.3 03.1 05.710.03 00.3 2.1 04.3 04.1 00.915.23 52.3 3.1 56.3 05.1 06.020.53 05.3 4.1 59.3 56.1 02.225.73 57.3 5.1 52.4 57.1 08.320.04 00.4 6.1 05.4 58.1 04.525.24 52.4 7.1 08.4 00.2 00.720.54 05.4 8.1 01.5 01.2 06.825.74 57.4 9.1 53.5 02.2 01.030.05 00.5 0.2 56.5 53.2 07.13
Dairy EffluentIncreasing discharge costs make it important to have knowledge of both the quantity of effluent and the content of pollutants . The pollutants in dairy effluent are primarily the organic substances fat, protein, and lactose, but ni-trate and phosphate are also important substances .Two methods are used to determine the content of or-ganic material in effluent: BOD and COD . The result is expressed in mg oxygen per litre .BOD (Biological Oxygen Demand) is determined by the de-mand of dissolved oxygen for oxydising the organic mate-rial in an aqueous sample of the effluent in 5 days at 20°C .COD (Chemical Oxygen Demand) is determined by treat-ing a sample with a potassium dichromate solution and neutralising excess dichromate by titration with ferrous ammonium sulphate .
1072948 Indmad.indd 82 03/07/08 14:29:37

83
It is not possible to convert BOD directly to COD as the values for the two methods are dependent on the varying composition of the organic matter . For dairy effluent the following conversion can be used as a guideline:1 mg BOD = 1 .3-1 .5 mg COD1 mg COD = 0 .75-0 .67 mg BOD
The table below lists COD values and thus the “pollution degree” of whole milk, skimmilk, and whey:
-buSecnats
klimelohW klimmikS yehW
tnetnoCl/gm
gmgk/DOC
tnetnoCl/gm
gmgk/DOC
tnetnoCl/gm
gmgk/DOC
taF 000,04 000,021 ,00 004 0 002,1 ,00 004 0 002,1nietorP 000,43 0 000,64 000,43 042,64 000,01 006,31esotcaL 000,64 0 000,25 000,74 011,35 000,74 011,35
,latoT.xorppa
000,022 000,001 000,07
A term often used to describe the “pollution degree” is “person equivalent” (p .e .) . One p .e . corresponds to 250 l of water polluted to a COD value of 600 . In other words, 1 p .e . corresponds to 250 x 600 = 150,000 mg COD .
Example:A dairy receives a daily quantity of 300,000 litres of milk . The loss is estimated to be 1%, ie, 3,000 l/day .
COD: 3,000 x 218 = 4,360 p .e . 150,000
Or, in other words, effluent pollution equal to the pollution from 4,360 people .
1072948 Indmad.indd 83 03/07/08 14:29:38
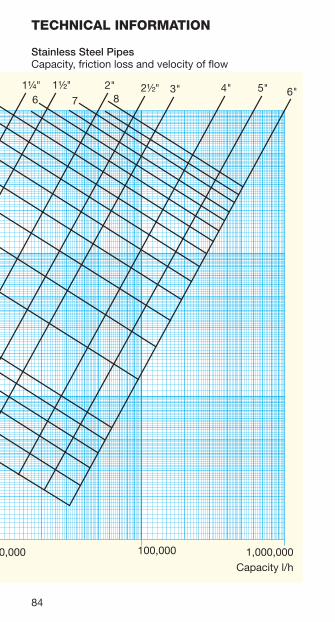
84
TECHNICAL INFORMATION
Stainless Steel PipesCapacity, friction loss and velocity of flow
O .D . Tube size
10
100
0 .5
1 .0
0 .11,000 10,000 100,000 1,000,000
Capacity l/h
Fric
tion
loss
. Met
res
H20
per
100
met
res
pip
e
Velocitym/sec .
1
1 .5
2 .5
3 .5
2
3
45 6 7 8
1¼"1" 1½" 2" 2½" 3" 4" 5" 6"
1072948 Indmad.indd 84 03/07/08 14:29:38
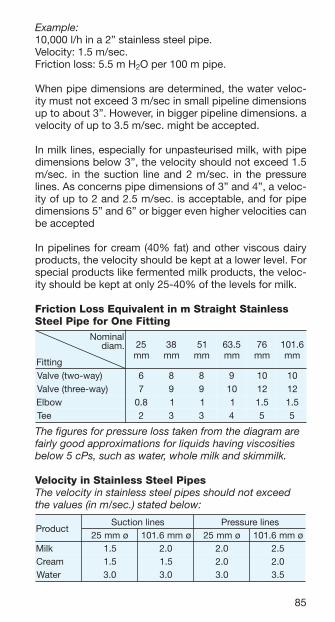
85
Example:10,000 l/h in a 2” stainless steel pipe . Velocity: 1 .5 m/sec .Friction loss: 5 .5 m H2O per 100 m pipe .
When pipe dimensions are determined, the water veloc-ity must not exceed 3 m/sec in small pipeline dimensions up to about 3” . However, in bigger pipeline dimensions . a velocity of up to 3 .5 m/sec . might be accepted .
In milk lines, especially for unpasteurised milk, with pipe dimensions below 3”, the velocity should not exceed 1 .5 m/sec . in the suction line and 2 m/sec . in the pressure lines . As concerns pipe dimensions of 3” and 4”, a veloc-ity of up to 2 and 2 .5 m/sec . is acceptable, and for pipe dimensions 5” and 6” or bigger even higher velocities can be accepted
In pipelines for cream (40% fat) and other viscous dairy products, the velocity should be kept at a lower level . For special products like fermented milk products, the veloc-ity should be kept at only 25-40% of the levels for milk .
Friction Loss Equivalent in m Straight Stainless Steel Pipe for One Fitting
.maidlanimoN
gnittiF
52mm
83mm
15mm
5 .36mm
67mm
6 .101mm
)yaw-owt(evlaV 6 8 8 9 01 01)yaw-eerht(evlaV 7 9 9 01 21 21
woblE 8 .0 1 1 1 5 .1 5 .1eeT 2 3 3 4 5 5
The figures for pressure loss taken from the diagram are fairly good approximations for liquids having viscosities below 5 cPs, such as water, whole milk and skimmilk.
Velocity in Stainless Steel PipesThe velocity in stainless steel pipes should not exceed the values (in m/sec.) stated below:
tcudorPsenilnoitcuS senilerusserP
ømm52 ømm6.101 ømm52 ømm6.101kliM 5.1 0.2 0.2 5.2
maerC 5.1 5.1 0.2 0.2retaW 0.3 0.3 0.3 5.3
1072948 Indmad.indd 85 03/07/08 14:29:40
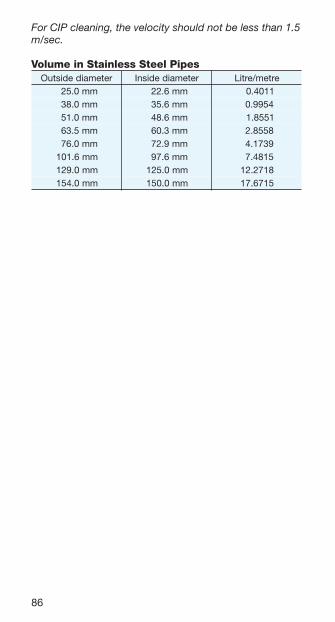
86
For CIP cleaning, the velocity should not be less than 1.5 m/sec.
Volume in Stainless Steel PipesretemaidedistuO retemaidedisnI ertem/ertiL
0 mm0.52 0 mm6.22 0 1104.00 mm0.83 0 mm6.53 0 4599.00 mm0.15 0 mm6.84 0 1558.10 mm5.36 0 mm3.06 0 8558.20 mm0.67 0 mm9.27 0 9371.4
mm6.101 0 mm6.79 0 5184.7mm0.921 mm0.521 8172.21mm0.451 mm0.051 5176.71
1072948 Indmad.indd 86 03/07/08 14:29:41
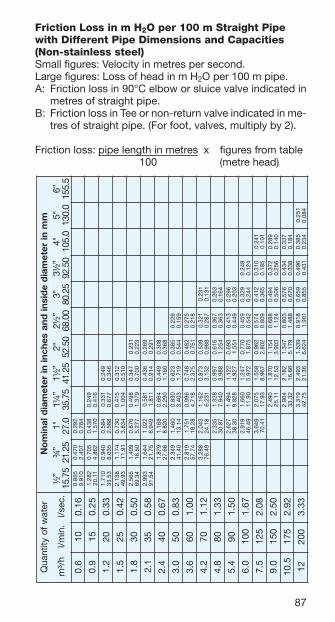
87
Friction Loss in m H2O per 100 m Straight Pipe with Different Pipe Dimensions and Capacities (Non-stainless steel)Small figures: Velocity in metres per second .Large figures: Loss of head in m H2O per 100 m pipe .A: Friction loss in 90°C elbow or sluice valve indicated in
metres of straight pipe .B: Friction loss in Tee or non-return valve indicated in me-
tres of straight pipe . (For foot, valves, multiply by 2) .
Friction loss: pipe length in metres x figures from table 100 (metre head)
retaw
foytitnau
Qm
mni
retemai
de
disnidna
sehcnini
retemai
dlanim
oN
h/³m
.nim/l
.ces/l”
½57.51
”¾
52.12"10.72
”¼1
57.53”
½152.14
"205.25
”½2
00.86"352.08
”½3
05.29"40.501
"50.031
"65.551
6.001
61.0558.0019.9
074.0704.2
292.0487.0
9.051
52.0282.111.02
507.0268.4
834.0075.1
942.0614.0
2.102
33.0017.135.33
049.0530.8
485.0885.2
133.0776.0
942.0643.0
5.152
24.0831.239.94
471.119.11
037.0438.3
514.0400.1
213.0015.0
8.103
05.0565.243.96
904.105.61
678.0772.5
894.0973.1
743.0007.0
132.0322.0
1.253
85.0399.245.19
446.157.12
220.1949.6
185.0118.1
634.0419.0
962.0192.0
4.204
76.0978.166.72
861.1028.8
466.0092.2
944.0061.1
803.0863.0
0.305
38.0943.204.14
064.141.31
038.0304.3
326.0917.1
583.0445.0
922.0951.0
6.306
00.1918.247.75
157.182.81
699.0817.4
847.0573.2
264.0157.0
572.0812.0
2.407
21.1882.394.67
340.281.42
261.1132.6
378.0231.3
935.0889.0
123.0782.0
132.0131.0
8.408
33.1533.278.03
823.1049.7
799.0889.3
616.0452.1
763.0363.0
362.0461.0
4.509
05.1726.203.83
494.1828.9
221.1729.4
396.0155.1
314.0944.0
692.0302.0
0.6001
76.1919.294.64
066.109.11
742.1279.5
077.0578.1
954.0245.0
923.0442.0
842.0421.0
5.7521
80.2946.314.07
570.239.71
855.1769.8
269.0208.2
475.0908.0
214.0563.0
013.0581.0
142.0101.0
0.9051
05.2094.211.52
078.135.21
451.1309.3
886.0421.1
494.0605.0
273.0652.0
982.0041.0
5.01571
29.2409.223.33
281.266.61
743.1971.5
308.0884.1
675.0076.0
434.0833.0
733.0481.0
21002
33.3913.357.24
394.263.12
935.1426.6
819.0109.1
956.0558.0
694.0134.0
583.0432.0
152.0480.0
51052
71.4941.468.46
711.323.23
429.130.01
741.1068.2
328.0282.1
026.0646.0
184.0053.0
413.0621.0
81003
00.5047.325.54
903.240.41
773.1900.4
869.0297.1
447.0309.0
775.0884.0
773.0571.0
362.0470.0
42004
76.6789.471.87
870.340.42
638.1828.6
713.1350.3
299.0035.1
077.0928.0
205.0492.0
153.0421.0
03005
38.8848.317.63
592.204.01
746.1226.4
042.1513.2
269.0452.1
826.0544.0
934.0781.0
63006
0.01816.448.15
357.226.41
679.1505.6
884.1162.3
551.1757.1
357.0326.0
625.0062.0
24007
7.11212.325.91
603.2396.8
637.1653.4
743.1543.2
978.0138.0
416.0743.0
84008
3.31176.302.52
536.281.11
489.1285.5
045.1900.3
500.1660.1
207.0544.0
45009
0.51031.415.13
569.279.31
232.2389.6
237.1267.3
031.1823.1
097.0555.0
060001
7.61985.434.83
492.360.71
084.2125.8
529.1595.4
652.1616.1
778.0476.0
570521
8.02711.401.62
001.300.31
604.2010.7
075.1854.2
790.1720.1
090051
0.52149.479.63
027.324.81
788.2298.9
388.1864.3
613.1444.1
5010571
2.92043.467.42
863.303.31
791.2566.4
535.1439.1
0210002
3.33069.449.13
058.361.71
115.2599.6
457.1694.2
0510052
7.14218.462.62
931.3612.9
391.2708.3
0810003
0.05767.350.31
236.2714.5
0420004
7.66320.527.22
905.3629.8
0030005
3.38683.424.41
A0.1
0.11.1
2.13.1
4.15.1
6.16.1
7.10.2
5.2
B0.4
0.40.4
0.50.5
0.50.6
0.60.6
0.70.8
0.9
1072948 Indmad.indd 87 03/07/08 14:29:46
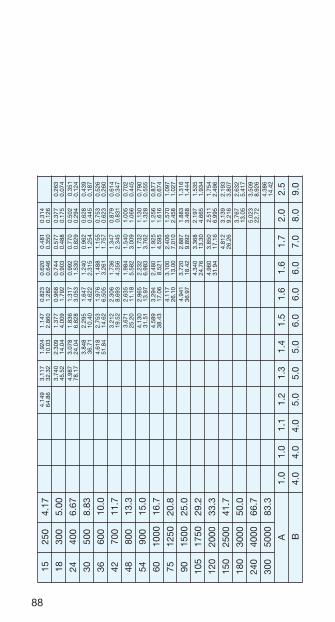
88
retaw
foytitnau
Qm
mni
retemai
de
disnidna
sehcnini
retemai
dlanim
oN
h/³m
.nim/l
.ces/l”
½57.51
”¾
52.12"10.72
”¼1
57.53”
½152.14
"205.25
”½2
00.86"352.08
”½3
05.29"40.501
"50.031
"65.551
6.001
61.0558.0019.9
074.0704.2
292.0487.0
9.051
52.0282.111.02
507.0268.4
834.0075.1
942.0614.0
2.102
33.0017.135.33
049.0530.8
485.0885.2
133.0776.0
942.0643.0
5.152
24.0831.239.94
471.119.11
037.0438.3
514.0400.1
213.0015.0
8.103
05.0565.243.96
904.105.61
678.0772.5
894.0973.1
743.0007.0
132.0322.0
1.253
85.0399.245.19
446.157.12
220.1949.6
185.0118.1
634.0419.0
962.0192.0
4.204
76.0978.166.72
861.1028.8
466.0092.2
944.0061.1
803.0863.0
0.305
38.0943.204.14
064.141.31
038.0304.3
326.0917.1
583.0445.0
922.0951.0
6.306
00.1918.247.75
157.182.81
699.0817.4
847.0573.2
264.0157.0
572.0812.0
2.407
21.1882.394.67
340.281.42
261.1132.6
378.0231.3
935.0889.0
123.0782.0
132.0131.0
8.408
33.1533.278.03
823.1049.7
799.0889.3
616.0452.1
763.0363.0
362.0461.0
4.509
05.1726.203.83
494.1828.9
221.1729.4
396.0155.1
314.0944.0
692.0302.0
0.6001
76.1919.294.64
066.109.11
742.1279.5
077.0578.1
954.0245.0
923.0442.0
842.0421.0
5.7521
80.2946.314.07
570.239.71
855.1769.8
269.0208.2
475.0908.0
214.0563.0
013.0581.0
142.0101.0
0.9051
05.2094.211.52
078.135.21
451.1309.3
886.0421.1
494.0605.0
273.0652.0
982.0041.0
5.01571
29.2409.223.33
281.266.61
743.1971.5
308.0884.1
675.0076.0
434.0833.0
733.0481.0
21002
33.3913.357.24
394.263.12
935.1426.6
819.0109.1
956.0558.0
694.0134.0
583.0432.0
152.0480.0
51052
71.4941.468.46
711.323.23
429.130.01
741.1068.2
328.0282.1
026.0646.0
184.0053.0
413.0621.0
81003
00.5047.325.54
903.240.41
773.1900.4
869.0297.1
447.0309.0
775.0884.0
773.0571.0
362.0470.0
42004
76.6789.471.87
870.340.42
638.1828.6
713.1350.3
299.0035.1
077.0928.0
205.0492.0
153.0421.0
03005
38.8848.317.63
592.204.01
746.1226.4
042.1513.2
269.0452.1
826.0544.0
934.0781.0
63006
0.01816.448.15
357.226.41
679.1505.6
884.1162.3
551.1757.1
357.0326.0
625.0062.0
24007
7.11212.325.91
603.2396.8
637.1653.4
743.1543.2
978.0138.0
416.0743.0
84008
3.31176.302.52
536.281.11
489.1285.5
045.1900.3
500.1660.1
207.0544.0
45009
0.51031.415.13
569.279.31
232.2389.6
237.1267.3
031.1823.1
097.0555.0
060001
7.61985.434.83
492.360.71
084.2125.8
529.1595.4
652.1616.1
778.0476.0
570521
8.02711.401.62
001.300.31
604.2010.7
075.1854.2
790.1720.1
090051
0.52149.479.63
027.324.81
788.2298.9
388.1864.3
613.1444.1
5010571
2.92043.467.42
863.303.31
791.2566.4
535.1439.1
0210002
3.33069.449.13
058.361.71
115.2599.6
457.1694.2
0510052
7.14218.462.62
931.3612.9
391.2708.3
0810003
0.05767.350.31
236.2714.5
0420004
7.66320.527.22
905.3629.8
0030005
3.38683.424.41
A0.1
0.11.1
2.13.1
4.15.1
6.16.1
7.10.2
5.2
B0.4
0.40.4
0.50.5
0.50.6
0.60.6
0.70.8
0.9
1072948 Indmad.indd 88 03/07/08 14:29:49
89
UNITS OF MEASURE
The MKSA System The unit of weight is one kilogramme (kg) .
The unit of force is one kilogramme-force (kgf) .In certain countries the designation kilopond (kp) is used . 1 kp = 1 kgf .The unit of length is one metre (m) .
The unit of time is one second (s) .
The unit of temperature is one degree Celsius (IC) .
The terminal unit is one kilocalorie (kcal) .One kilocalorie (kcal) is equal to the amount of heat re-quired to heat or cool 1 kg water one degree Celsius .
The specific gravity (density) is equal to the weight in grammes (g) of one cubic centimetre (cm3) of a sub-stance .
The unit of work, one kilogramme-force metre (kgfm) is equal to the energy required to raise one kilogramme to a height of one metre .
The unit of effect, one horse power (hp), is equal to a work performance of 75 kilogramme-force metres per second (kgfm/s) .
One horse power hour (hph) is equal to the work that can be carried out by one horse power (hp) in one hour .
Specific heat is equal to the number of kilocalories re-quired to heat 1 kg of a substance 1°C .
Example: water 1 iron 0 .114 copper 0 .09 air 0 .24
The latent heat of fusion is equal to the number of kilocalo-ries required to change I kg of solid substance to liquid when it has previously been heated to melting point .
Example: ice 80
1072948 Indmad.indd 89 03/07/08 14:29:49

90
The thermal conductivity coefficient is equal to the number of kilocalories that are transmitted in one hour through a 1 m² cross section of a 1 m thick plate when the tempera-ture difference is 1°C .
The latent heat of evaporation is equal to the number of kilocalories necessary to change 1 kg of liquid to vapour of the same temperature .
Example: water at 100°C: 607 water at 100°C: 536
The degree of humidity, relative humidity, is equal to the relation between the actual water vapour content of the air, and the amount of water vapour the air can hold at the temperature in question .
The absolute humidity is equal to the weight in grammes of the water vapour contained in 1 cubic metre of air .
The dew point is equal to the temperature reached when air is cooled to saturation point .
A technical atmosphere, 1 at, is equal to a pressure of: (1) 1 kgf per cm²(2) a 10 m column of water (H2O) at 0°C, or(3) 73 .6 em mercury (Hg) .1 ata is absolute pressure,1 ato is the pressure above atmospheric pressure (i .e . 1 ato = 2 bar) .
A normal atmosphere, 1 atm, is equal to a pressure of:(1) 1 .033 kgf/cm²(2) 1013 millibars of 76 .0 cm mercury (Hg) .
The unit current intensity, one ampere (A), is equal to a current which, when passed through a solution of nitrate of silver, is capable of depositing silver at the rate of 1 .118 milligrammes per second .
The unit of resistance, one ohm (Ω), is equal to the resist-ance in a column of mercury, 106 .3 cm long and with a cross section of 1 mm², at a temperature of 0°C .
The unit of potential, one volt (V), is equal to the differ-ence in electrical potential between two separate points
1072948 Indmad.indd 90 03/07/08 14:29:49

91
on a conductor with a resistance of 1 ohm, and where the electric current is one ampere .
The unit of power, one watt (W), is equal to the energy pro-duced when the strength of the electric current is I ampere and the potential difference 1 volt .
The unit of electric energy, one kilowatt hour (kWh) is equal to the energy that is (produced or used) by 1 kilowatt (kW) working for 1 hour (h) .
Conversion TablePower, heat flow rate
ph s/mfgk WI h/lack)*ph 1 57 637 236
s/mfgk 01x33.1 2- 1 18.9 34.8W 01x63.1 3- 201.0 1 068.0
h/lack 01x85.1 3- 911.0 61.1 1
Energy, work, quantity of heat
hph mfgk hWk lackhph 1 01x07.2 5- 637.0 236mfgk 01x57.3 6- 1 01x57.2 6- 01x43.2 3-
hWk 63.1 01x763.0 6- 1 068lack 01x85.1 3- 724 01x61.1 3- 1
* metric
The SI Unit SystemSI (Système International d’Unités) is a metric system of international units which lends itself to simplification and systemisation . The SI system is gaining popularity throughout the world and forms the basis of the first truly international system of measurement . Such units as me-tre, kilogramme, litre, etc, will eventually be used world-wide . There is a definite advantage in applying the same units for all sizes, irrespective of the area measured . For example, the unit of power (Watt) can be used for electric motors and combustion engines . Horsepower will gradu-ally disappear from the language . Thanks to uniformity and systemisation, no conversion factors will be required under the SI unit system .SI includes a range of basic units, derivatives, multiples and sub-multiples . There are also supplementary units, primarily associated with subdivision of the 24-hour day .
1072948 Indmad.indd 91 03/07/08 14:29:51
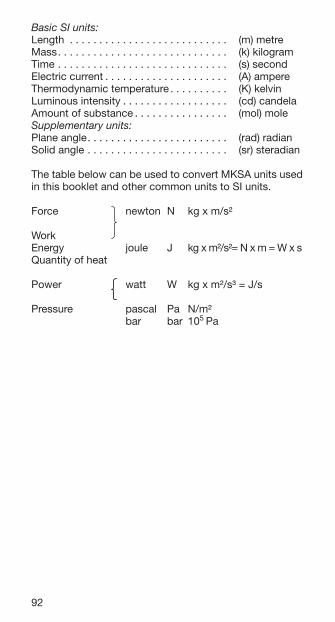
92
Basic SI units:Length . . . . . . . . . . . . . . . . . . . . . . . . . . . (m) metre Mass . . . . . . . . . . . . . . . . . . . . . . . . . . . . . (k) kilogram Time . . . . . . . . . . . . . . . . . . . . . . . . . . . . . (s) second Electric current . . . . . . . . . . . . . . . . . . . . . (A) ampere Thermodynamic temperature . . . . . . . . . . (K) kelvin Luminous intensity . . . . . . . . . . . . . . . . . . (cd) candela Amount of substance . . . . . . . . . . . . . . . . (mol) mole Supplementary units:Plane angle . . . . . . . . . . . . . . . . . . . . . . . . (rad) radian Solid angle . . . . . . . . . . . . . . . . . . . . . . . . (sr) steradian
The table below can be used to convert MKSA units used in this booklet and other common units to SI units .
Force newton N kg x m/s²
Work Energy joule J kg x m²/s²= N x m = W x sQuantity of heat
Power watt W kg x m²/s³ = J/s
Pressure pascal Pa N/m² bar bar 105 Pa
1072948 Indmad.indd 92 03/07/08 14:29:51
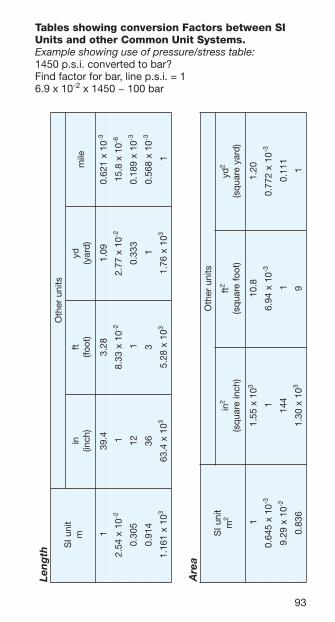
93
Tables showing conversion Factors between SI Units and other Common Unit Systems.Example showing use of pressure/stress table:1450 p .s .i . converted to bar?Find factor for bar, line p .s .i . = 16 .9 x 10-2 x 1450 ~ 100 bar
htg
neL
tinuIS
m
stinureht
O
ni)hcni(
tf)toof(
dy)
dray(eli
m
14.93
82.390.1
01x
126.03-
01x
45.22-
101
x33.8
2-01
x77.2
2-01
x8.51
6-
503.021
1333.0
01x
981.03-
419.063
31
01x
865.03-
01x
161.13
01x
4.363
01x
82.53
01x
67.13
1
aerA
tinuIS
m2
stinureht
O
ni2
)hcnierau
qs(tf2
)tooferau
qs(dy
2
)dray
erauqs(
101
x55.1
38.01
02.1
01x
546.03-
101
x49.6
3-01
x277.0
3-
01x
92.92-
4411
111.0
638.001
x03.1
39
1
1072948 Indmad.indd 93 03/07/08 14:29:53
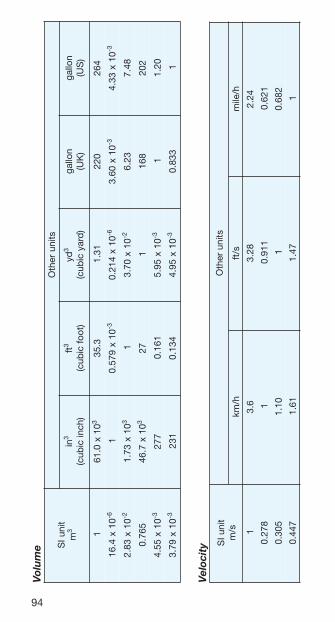
94
em
uloV
tinuIS
m3
stinureht
O
ni3
)hcnici
buc(tf3
)toofci
buc(dy
3
)dray
cibuc(
nollag)
KU(
nollag)
SU(
101
x0.16
33.53
13.1022
462
01x
4.616-
101
x975.0
3-01
x412.0
6-01
x06.3
3-01
x33.4
3-
01x
38.22-
01x
37.13
101
x07.3
2-32.6
84.7
567.001
x7.64
372
1861
202
01x
55.43-
772161.0
01x
59.53-
102.1
01x
97.33-
132431.0
01x
59.43-
338.01
yticoleV
tinuIS
s/m
stinureht
O
h/mk
s/tfh/eli
m
16.3
82.342.2
872.01
119.0126.0
503.001.1
1286.0
744.016.1
74.11
1072948 Indmad.indd 94 03/07/08 14:29:55
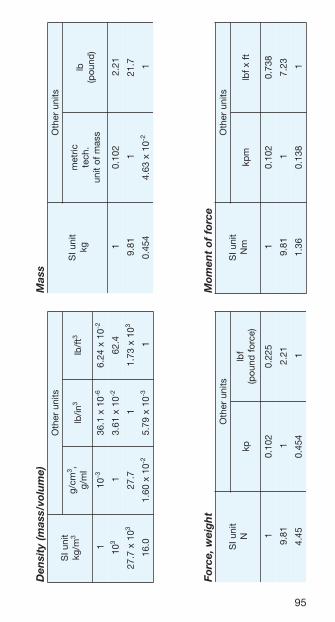
95
)em
ulov/ssam(
ytisne
D
tinuIS
m/gk3
stinureht
O
mc/g3 , l
m/gni/
bl3
tf/bl
3
101
3-01
x1.63
6-01
x42.6
2-
013
101
x16.3
2-4.26
01x
7.723
7.721
01x
37.13
0.6101
x06.1
2-01
x97.5
3-1
ssaM
tinuIS
gk
stinureht
O
cirtem
.hcetssa
mfo
tinu
bl)
dnuop(
1201.0
12.2
18.91
7.12
454.001
x36.4
2-1
th
giew,ecroF
tinuIS
N
stinureht
O
pkf
bl)ecrof
dnuop(
1201.0
522.0
18.91
12.2
54.4454.0
1
ecroffo
tne
moM
tinuIS
mN
stinureht
O
mpk
tfx
fbl
1201.0
837.0
18.91
32.7
63.1831.0
1
1072948 Indmad.indd 95 03/07/08 14:29:58
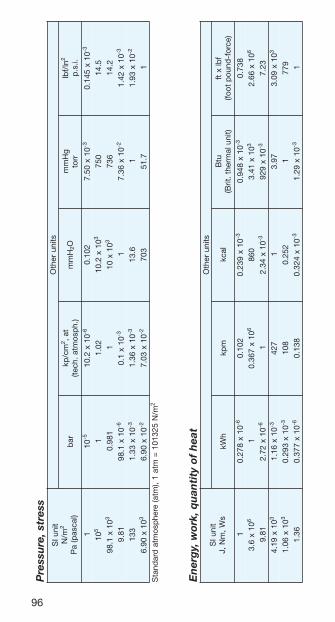
96
taeh
foytit
nau
q,krow,y
gren
E
tinuIS
sW,
mN,J
stinureht
O
hWk
mpk
lackut
B)tinula
mreht.tirB(
fbl
xtf
)ecrof-dnuo
ptoof(
101
x872.0
6-201.0
01x
932.03-
01x
849.03-
837.001
x6.3
61
01x
763.06
06801
x14.3
301
x66.2
6
18.901
x27.2
6-1
01x
43.23-
01x
9293-
32.701
x91.4
301
x61.1
3-724
179.3
01x
90.33
01x
60.13
01x
392.03-
801252.0
1977
63.101
x773.0
6-831.0
01x
423.03-
01x
92.13-
1
sserts,erusser
PtinuI
Sm/
N2
)lacsap(
aP
stinureht
O
rab
mc/pk
2ta,
).hpso
mta.hcet(H
mm
2Og
Hm
mrrot
nl/fbl
2 .i.s.p
101
5-01
x2.01
6-201.0
01x
05.73-
01x
541.03-
015
120.1
01x
2.013
0575.41
01x
1.893
189.01
01x
013
6372.41
18.901
x1.89
6-01
x1.0
3-1
01x
63.72-
01x
24.13-
33101
x33.1
3-01
x63.1
3-6.31
101
x39.1
2-
01x
09.63
01x
09.62-
01x
30.72-
3077.15
1m/
N523101
=mta
1,)mta(
erehpso
mtadra
dnatS
2
1072948 Indmad.indd 96 03/07/08 14:30:01

97
etarwolf
taeh,re
woP
tinuIS
s/J,s/m
N,W
stinureht
O
s/m
pkh/lack
h/utB
ph)re
wopesroh.tir
B(Kh
)rewo
pesroh.rtem(
1201.0
068.014.3
01x
43.13-
01x
63.13-
18.91
34.85.33
01x
23.12-
01x
33.12-
61.1911.0
179.3
01x
65.13-
01x
85.13-
392.001
x99.2
2-252.0
101
x393.0
3-01
x993.0
3-
6470.67
14601
x55.2
31
10.1
63.757
23601
x15.2
3689.0
1
1072948 Indmad.indd 97 03/07/08 14:30:02

98
Input and Output of Electric Motors
tnerrucgnitanretlA
esahp1 sesahp3
=)Wk(tupnitnerruCsocxIxU socxIxUx3
0001 0001
)ph(tuptuolacinahceMsocxIxU socxIxUx3
637 637
U = Voltage; for thre-phase networks, U represents tension between two phases I = Amperage cos ϕ: See table below n: See table below
3 =1 .73
kW, hp and Full-load Current for 3x380 Volt, 50 Cycle Electric Motors, and Approximate Values of cos j and n (at 1500 rpm)
Wk phdaol-lluFtnerruc
.pmasoc ϕ n
73.0 5.0 0.1 37.0 5.0755.0 57.0 54.1 57.0 0.1757.0 0.1 58.1 87.0 0.271.1 5.1 6.2 28.0 0.775.1 0.2 4.3 38.0 0.872.2 0.3 9.4 38.0 0.870.3 0.4 3.6 48.0 0.977.3 0.5 8.7 48.0 0.080.4 5.5 0.9 48.0 0.285.5 5.7 5.11 48.0 0.485.7 0.01 0.51 58.0 0.680.11 0.51 0.22 68.0 0.780.51 0.02 0.92 68.0 0.885.81 0.52 0.63 78.0 0.980.22 0.03 0.24 88.0 0.090.03 0.04 0.65 09.0 0.190.73 0.05 0.96 68.0 0.290.54 0.06 0.38 78.0 0.290.55 0.57 0.401 78.0 0.290.57 0.001 0.631 78.0 0.29
1072948 Indmad.indd 98 03/07/08 14:30:04
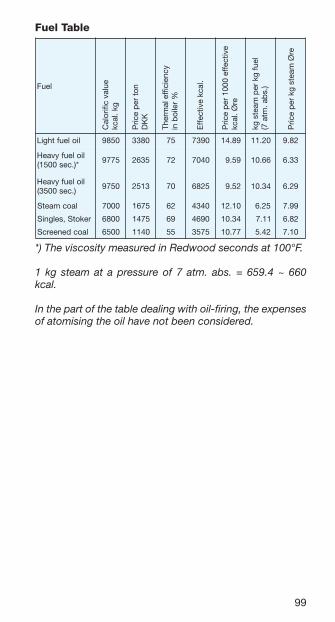
99
Fuel Table
leuF
lioleufthgiL 0589 0833 57 0937 98 .41 02 .11 28 .9
lioleufyvaeH*) .ces0051(
5779 5362 27 0407 95 .9 66 .01 33 .6
lioleufyvaeH) .ces0053(
0579 3152 07 5286 25 .9 43 .01 92 .6
laocmaetS 0007 5761 26 0434 01 .21 52 .6 99 .7
rekotS,selgniS 0086 5741 96 0964 43 .01 11 .7 28 .6
laocdeneercS 0056 0411 55 5753 77 .01 24 .5 01 .7
Cal
orifi
c va
lue
kcal
. kg
Pric
e p
er t
onD
KK
Ther
mal
eff
icie
ncy
in b
oile
r %
Eff
ectiv
e kc
al .
Pric
e p
er 1
000
effe
ctiv
e kc
al . Ø
re
kg s
team
per
kg
fuel
(7
atm
. ab
s .)
Pric
e p
er k
g st
eam
Øre
*) The viscosity measured in Redwood seconds at 100°F.
1 kg steam at a pressure of 7 atm. abs. = 659.4 ~ 660 kcal.
In the part of the table dealing with oil-firing, the expenses of atomising the oil have not been considered.
1072948 Indmad.indd 99 03/07/08 14:30:05
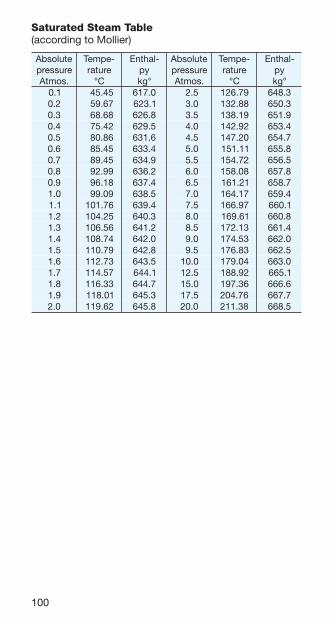
100
Saturated Steam Table(according to Mollier)
etulosbAerusserp.somtA
-epmeTerutar
C°
-lahtnEyp°gk
etulosbAerusserp.somtA
-epmeTerutar
C°
-lahtnEyp°gk
1.0 0 54.54 0.716 0 5.2 97.621 3.8462.0 0 76.95 1.326 0 0.3 88.231 3.0563.0 0 86.86 8.626 0 5.3 91.831 9.1564.0 0 24.57 5.926 0 0.4 29.241 4.3565.0 0 68.08 6.136 0 5.4 02.741 7.4566.0 0 54.58 4.336 0 0.5 11.151 8.5567.0 0 54.98 9.436 0 5.5 27.451 5.6568.0 0 99.29 2.636 0 0.6 80.851 8.7569.0 0 81.69 4.736 0 5.6 12.161 7.8560.1 0 90.99 5.836 0 0.7 71.461 4.9561.1 67.101 4.936 0 5.7 79.661 1.0662.1 52.401 3.046 0 0.8 16.961 8.0663.1 65.601 2.146 0 5.8 31.271 4.1664.1 47.801 0.246 0 0.9 35.471 0.2665.1 97.011 8.246 0 5.9 38.671 5.2666.1 37.211 5.346 0.01 40.971 0.3667.1 75.411 1.446 5.21 29.881 1.5668.1 33.611 7.446 0.51 63.791 6.6669.1 10.811 3.546 5.71 67.402 7.7660.2 26.911 8.546 0.02 83.112 5.866
1072948 Indmad.indd 100 03/07/08 14:30:07
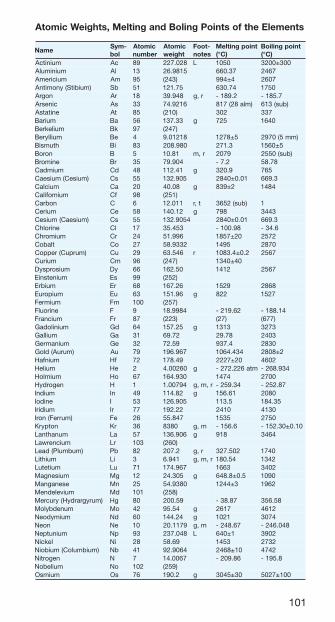
101
stnemelEehtfostnioPgniloBdnagnitleM,sthgieWcimotA
emaN-myS
lobcimotArebmun
cimotAthgiew
-tooFseton
tniopgnitleM)C°(
tniopgnilioB)C°(
muinitcA cA 98 820.722 L 0501 003±0023muinimulA lA 31 5189.62 73.066 7642muiciremA mA 59 )342( 4±499 7062
)muibitS(ynomitnA bS 15 57.121 47.036 0571nogrA rA 81 849.93 r,g 2.981- 7.581-
cinesrA sA 33 6129.47 )mla82(718 )bus(316enitatsA tA 58 )012( 203 733
muiraB aB 65 33.731 g 527 0461muilekreB kB 79 )742(
muillyreB eB 4 81210.9 5±8721 )mm5(0792htumsiB iB 38 089.802 3.172 5±0651
noroB B 5 18.01 r,m 9702 )bus(0552enimorB rB 53 409.97 2.7- 87.85muimdaC dC 84 14.211 g 9.023 567
)muiseC(muiseaC sC 55 509.231 10.0±0482 3.966muiclaC aC 02 80.04 g 2±938 4841
muimofilaC fC 89 )152(nobraC C 6 110.21 t,r )bus(2563 1
muireC eC 85 21.041 g 897 3443)muiseaC(muiseC sC 55 4509.231 10.0±0482 3.966
enirolhC lC 71 354.53 89.001- 6.43-muimorhC rC 42 699.15 02±7581 2752
tlaboC oC 72 2339.85 5941 0782)murpuC(reppoC uC 92 645.36 r 2.0±4.3801 7652
muiruC mC 69 )742( 04±0431muisorpsyD yD 66 05.261 2141 7652
muinetsniE sE 99 )252(muibrE rE 86 62.761 9251 8682
muiporuE uE 36 69.151 g 228 7251muimreF mF 001 )752(eniroulF F 9 4899.81 26.912- 41.881-muicnarF rF 78 )322( )72( )776(
muinilodaG dG 46 52.751 g 3131 3723muillaG aG 13 27.96 87.92 3042
muinamreG eG 23 95.27 4.739 0382)muruA(dloG uA 97 769.691 434.4601 2±8082
muinfaH fH 27 94.871 02±7222 2064muileH eH 2 06200.4 g mta622.272- 439.862-
muimloH oH 76 039.461 4741 0072negordyH H 1 49700.1 r,m,g 43.952- 78.252-
muidnI nI 94 28.411 g 16.651 0802enidoI I 35 509.621 5.311 53.481muidirI rI 77 22.291 0142 0314
)murreF(norI eF 62 748.55 5351 0572notpyrK rK 63 0838 m,g 6.651- 01.0±03.251-
munahtnaL aL 75 609.631 g 819 4643muicnerwaL rL 301 )062(
)mubmulP(daeL bP 28 2.702 r,g 205.723 0471muihtiL iL 3 149.6 r,m,g 45.081 2431
muitetuL uL 17 769.471 3661 2043muisengaM gM 21 503.42 g 5.0±8.846 0901esenagnaM nM 52 0839.45 3±4421 2691muiveledneM dM 101 )852(
)murygrardyH(yrucreM gH 08 95.002 78.83- 85.653munedbyloM oM 24 45.59 g 7162 2164
muimydoeN dN 06 42.441 g 1201 4703noeN eN 01 9711.02 m,g 76.842- 840.642-
muinutpeN pN 39 840.732 L 1±046 2093lekciN iN 82 96.85 3541 2372
)muibmuloC(muiboiN bN 14 4609.29 01±8642 2474negortiN N 7 7600.41 68.902- 8.591-muileboN oN 201 )952(
muimsO sO 67 2.091 g 03±5403 001±7205
1072948 Indmad.indd 101 03/07/08 14:30:12
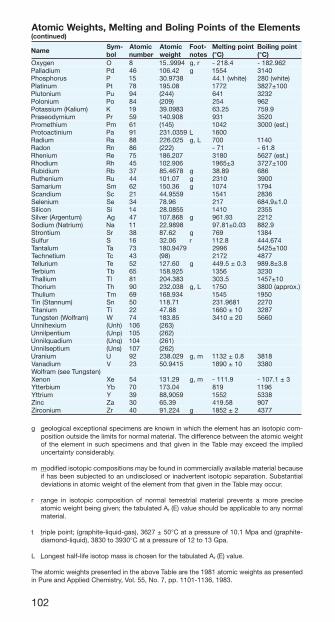
102
stnemelEehtfostnioPgniloBdnagnitleM,sthgieWcimotA)deunitnoc(
emaN-myS
lobcimotArebmun
cimotAthgiew
-tooFseton
tniopgnitleM)C°(
tniopgnilioB)C°(
negyxO O 8 4999..51 r,g 4.812- 269.281-muidallaP dP 64 24.601 g 4551 0413
surohpsohP P 51 8379.03 )etihw(1.44 )etihw(082munitalP tP 87 80.591 2771 001±7283
muinotulP uP 49 )442( 146 2323muinoloP oP 48 )902( 452 269
)muilaK(muissatoP K 91 3890.93 52.36 9.957muimydoesarP rP 95 809.041 139 0253
muihtemorP mP 16 )541( 2401 ).tse(0003muinitcaotorP aP 19 9530.132 L 0061
muidaR aR 88 520.622 L,g 007 0411nodaR nR 68 )222( 17- 8.16-
muinehR eR 57 702.681 0813 ).tse(7265muidohR hR 54 609.201 3±5691 001±7273muidibuR bR 73 8764.58 g 98.83 686
muinehtuR uR 44 70.101 g 0132 0093muiramaS mS 26 63.051 g 4701 4971muidnacS cS 12 9559.44 1451 6382
muineleS eS 43 69.87 712 0.1±9.486nociliS iS 41 5580.82 0141 5532
)mutnegrA(revliS gA 74 868.701 g 39.169 2122)muirtaN(muidoS aN 11 8989.22 30.0±18.79 9.288
muitnortS rS 83 26.78 g 967 4831rufluS S 61 60.23 r 8.211 476.444
mulatnaT aT 37 9749.081 6992 001±5245muitenhceT cT 34 )89( 2712 7784
muirulleT eT 25 06.721 g 3.0±5.944 8.3±8.989muibreT bT 56 529.851 6531 0323muillahT lT 18 383.402 5.303 01±7541muirohT hT 09 830.232 L,g 0571 ).xorppa(0083muiluhT mT 96 439.861 5451 0591
)munnatS(niT nS 05 17.811 1869.132 0722muinatiT iT 22 88.74 01±0661 7823
)marfloW(netsgnuT W 47 58.381 02±0143 0665muixehinnU )hnU( 601 )362(
muitneplinnU )pnU( 501 )262(muidauqlinnU )qnU( 401 )162(
muitpeslinnU )snU( 701 )262(muinarU U 29 920.832 m,g 8.0±2311 8183
muidanaV V 32 5149.05 01±0981 0833)netsgnuTees(marfloW
noneX eX 45 92.131 m,g 9.111- 3±1.701-muibrettY bY 07 40.371 918 6911
muirttY Y 93 9509,88 2551 8335cniZ aZ 03 93.56 85.914 709
muinocriZ rZ 04 422.19 g 2±2581 7734
g geological exceptional specimens are known in which the element has an isotopic com-position outside the limits for normal material . The difference between the atomic weight of the element in such specimens and that given in the Table may exceed the implied uncertainty considerably .
m modified isotopic compositions may be found in commercially available material because if has been subjected to an undisclosed or inadvertent isotopic separation . Substantial deviations in atomic weight of the element from that given in the Table may occur .
r range in isotopic composition of normal terrestrial material prevents a more precise atomic weight being given; the tabulated Ar (E) value should be applicable to any normal material .
t triple point; (graphite-liquid-gas), 3627 ± 50°C at a pressure of 10 .1 Mpa and (graphite-diamond-liquid), 3830 to 3930°C at a pressure of 12 to 13 Gpa .
L Longest half-life isotop mass is chosen for the tabulated Ar (E) value .
The atomic weights presented in the above Table are the 1981 atomic weights as presented in Pure and Applied Chemistry, Vol . 55, No . 7, pp . 1101-1136, 1983 .
1072948 Indmad.indd 102 03/07/08 14:30:15

103
Prefixes with Symbols used in Forming Decimal Multiples and Submultiples
emaN lobmySehthcihwybrotcaF
deilpitlumsitinuaxe E 01 81
atep P 01 51
aret T 01 21
agig G 01 9
agem M 01 6
olik k 01 3
otceh h 01 2
aced ad 01iced d 01 1-
itnec c 01 2-
illim m 01 3-
orcim µ 01 6-
onan n 01 9-
ocip p 01 21-
otmef f 01 51-
otta a 01 81-
The symbol representing the prefix is fixed to the unit sym-bol and raises the latter to the stated power:
Example: 12000 N = 12 x 103 N = 12 kN
0 .00394 m = 3 .94 x 10-3 m = 3 .94 mm 140000 N/m2 = 140 x 103 N/m2 = 140 kN/m2
or 1 .4 x 105 N/m2 = 1 .4 bar 0 .0003 s = 0 .3 x 10-3 s = 0 .3 ms
1072948 Indmad.indd 103 03/07/08 14:30:17
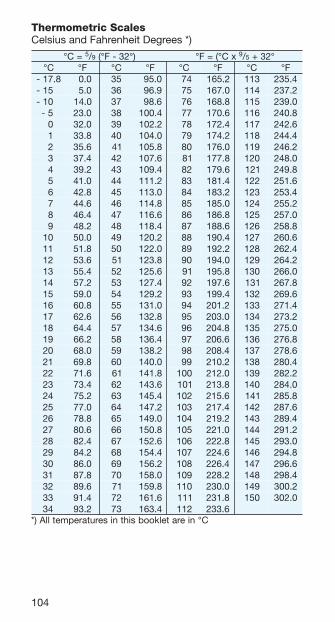
104
Thermometric ScalesCelsius and Fahrenheit Degrees *)
=C° 5/9 )°23-F°( xC°(=F° 9/5 °23+C° F° C° F° C° F° C° F°
8.71- 0 0.0 53 0 0.59 0 47 2.561 311 4.53251- 0. 0 0.5 63 0 9.69 0 57 0.761 411 2.73201- 0. 0.41 73 0 6.89 0 67 8.861 511 0.932
0 5- 0. 0.32 83 4.001 0 77 6.071 611 8.0421- 0 0. 0.23 93 2.201 0 87 4.271 711 6.2421- 1 0. 8.33 04 0.401 0 97 2.471 811 4.4421- 2 0. 6.53 14 8.501 0 08 0.671 911 2.6421- 3 0. 4.73 24 6.701 0 18 8.771 021 0.8421- 4 0. 2.93 34 4.901 0 28 6.971 121 8.9421- 5 0. 0.14 44 2.111 0 38 4.181 221 6.1521- 6 0. 8.24 54 0.311 0 48 2.381 321 4.3521- 7 0. 6.44 64 8.411 0 58 0.581 421 2.5521- 8 0. 4.64 74 6.611 0 68 8.681 521 0.7521- 9 0. 2.84 84 4.811 0 78 6.881 621 8.852
- 01 0. 0.05 94 2.021 0 88 4.091 721 6.062- 11 0. 8.15 05 0.221 0 98 2.291 821 4.262- 21 0. 6.35 15 8.321 0 09 0.491 921 2.462- 31 0. 4.55 25 6.521 0 19 8.591 031 0.662- 41 0. 2.75 35 4.721 0 29 6.791 131 8.762- 51 0. 0.95 45 2.921 0 39 4.991 231 6.962- 61 0. 8.06 55 0.131 0 49 2.102 331 4.172- 71 0. 6.26 65 8.231 0 59 0.302 431 2.372- 81 0. 4.46 75 6.431 0 69 8.402 531 0.572- 91 0. 2.66 85 4.631 0 79 6.602 631 8.672- 02 0. 0.86 95 2.831 0 89 4.802 731 6.872- 12 0. 8.96 06 0.041 0 99 2.012 831 4.082- 22 0. 6.17 16 8.141 001 0.212 931 2.282- 32 0. 4.37 26 6.341 101 8.312 041 0.482- 42 0. 2.57 36 4.541 201 6.512 141 8.582- 52 0. 0.77 46 2.741 301 4.712 241 6.782- 62 0. 8.87 56 0.941 401 2.912 341 4.982- 72 0. 6.08 66 8.051 501 0.122 441 2.192- 82 0. 4.28 76 6.251 601 8.222 541 0.392- 92 0. 2.48 86 4.451 701 6.422 641 8.492- 03 0. 0.68 96 2.651 801 4.622 741 6.692- 13 0. 8.78 07 0.851 901 2.822 841 4.892- 23 0. 6.98 17 8.951 011 0.032 941 2.003- 33 0. 4.19 27 6.161 111 8.132 051 0.203- 43 0. 2.39 37 4.361 211 6.332
C°nieratelkoobsihtniserutarepmetllA)*
1072948 Indmad.indd 104 03/07/08 14:30:20
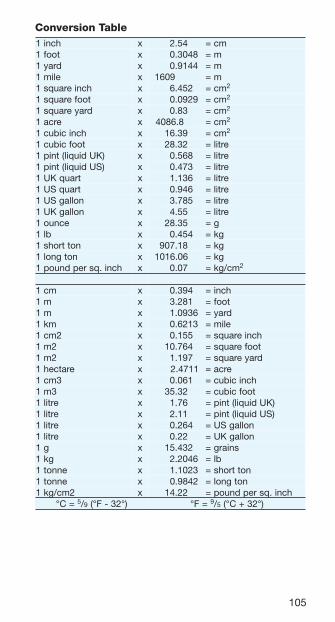
105
Conversion Tablehcni1 x 000 45.2 00 mc=toof1 x 000 8403.0 m=dray1 x 000 4419.0 m=elim1 x 9061 0000. m=
hcnierauqs1 x 000 254.6 0 mc= 2
tooferauqs1 x 000 9290.0 mc= 2
drayerauqs1 x 000 38.0 06 mc= 2
erca1 x 8.6804 000 mc= 2
hcnicibuc1 x 00 93.61 00 mc= 2
toofcibuc1 x 00 23.82 00 ertil=)KUdiuqil(tnip1 x 000 865.0 0 ertil=)SUdiuqil(tnip1 x 000 374.0 0 ertil=
trauqKU1 x 000 631.1 0 ertil=trauqSU1 x 000 649.0 0 ertil=nollagSU1 x 000 587.3 0 ertil=nollagKU1 x 000 55.4 00 ertil=
ecnuo1 x 00 53.82 00 g=bl1 x 000 454.0 0 gk=
nottrohs1 x 0 81.709 00 gk=notgnol1 x 60.6101 00 gk=
hcni.qsrepdnuop1 x 000 70.0 00 mc/gk= 2
mc1 x 000 493.0 0 hcni=m1 x 000 182.3 0 toof=m1 x 000 6390.1 dray=mk1 x 000 3126.0 elim=
2mc1 x 000 551.0 0 hcnierauqs=2m1 x 00 467.01 0 tooferauqs=2m1 x 000 791.1 0 drayerauqs=
eratceh1 x 000 1174.2 erca=3mc1 x 000 160.0 0 hcnicibuc=
3m1 x 00 23.53 00 toofcibuc=ertil1 x 000 67.1 00 )KUdiuqil(tnip=ertil1 x 000 11.2 00 )SUdiuqil(tnip=ertil1 x 000 462.0 0 nollagSU=ertil1 x 000 22.0 00 nollagKU=
g1 x 00 234.51 0 sniarg=gk1 x 000 6402.2 bl=
ennot1 x 000 3201.1 nottrohs=ennot1 x 000 2489.0 notgnol=
2mc/gk1 x 00 22.41 00 hcni.qsrepdnuop==C° 5/9 )°23-F°( =F° 9/5 )°23+C°(
1072948 Indmad.indd 105 03/07/08 14:30:23

NOTES
1072948 Indmad.indd 106 03/07/08 14:30:23

1072948 Indmad.indd 107 03/07/08 14:30:23

1072948 Indmad.indd 108 03/07/08 14:30:23

AP
V D
airy Te
chn
olo
gy
Your local contact:
APVPasteursvej 1 DK-8600 Silkeborg, Denmark Phone: +45 70 278 278 Fax: +45 70 278 330
For more information about our worldwide locations, approvals, certifications, and local representatives, please visit www.apv.com.
Copyright ©2002, 2008 SPX Corporation9002-01-07-2008-GBThe information contained in this document, including any specifications and other product details, are subject to change without notice. While we have taken care to ensure the information is accurate at the time of going to press, we assume no responsibility for errors or omissions nor for any damages resulting from the use of the information contained herein.
Dairy Technology
1072948 Omslag.indd 1 04/07/08 9:00:48