apteligent data report google io edition
TRANSCRIPT
MONTHLY DATA REPORT: GOOGLE IOMay 2016
© Apteligent 2016
IntroductionIn celebration of Google IO 2016, this month’s data report focuses on the Android
ecosystem. We’ve analyzed Android fragmentation (or lack thereof!), Google Fi device
usage, crashes that are isolated to specific devices and operating systems, and Android TV
vs Apple TV usage. We finish by telling you which device manufacturers are the quickest to
push out Android updates to their users.
ANDROID IS NOT FRAGMENTEDOne of the major criticisms of Android is the fragmentation of its operating system
versions. Releasing an Android update involves lengthy approval processes and
coordination between Google, carriers, and OEMs. Google in particular has been investing
a lot of time and effort to reducing this approval time. They’ve also taken steps to work
around the system by pushing updates through Google Play Services.
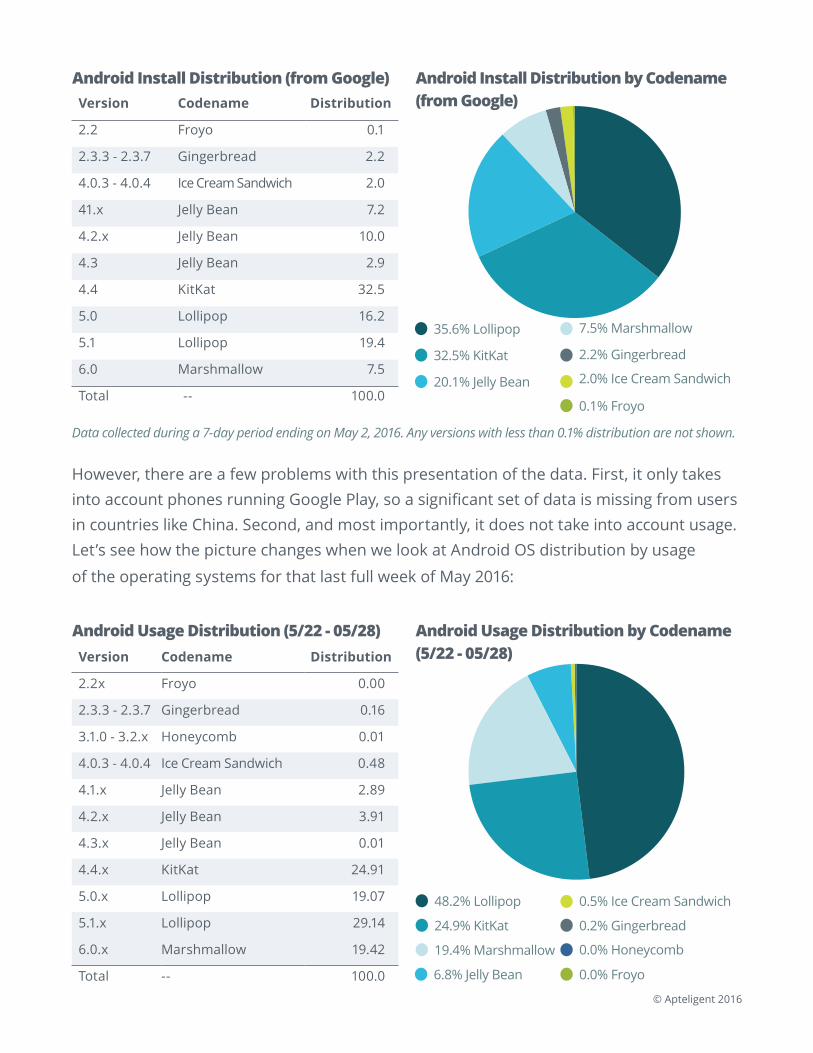
Google releases a monthly breakdown of Android operating system distribution, and the
picture they paint definitely appears to be one of fragmentation:
© Apteligent 2016
35.6% Lollipop
20.1% Jelly Bean
32.5% KitKat 2.2% Gingerbread
0.1% Froyo
2.0% Ice Cream Sandwich
7.5% Marshmallow
Data collected during a 7-day period ending on May 2, 2016. Any versions with less than 0.1% distribution are not shown.
Version Codename Distribution
2.2 Froyo 0.1
2.3.3 - 2.3.7 Gingerbread 2.2
4.0.3 - 4.0.4 Ice Cream Sandwich 2.0
41.x Jelly Bean 7.2
4.2.x Jelly Bean 10.0
4.3 Jelly Bean 2.9
4.4 KitKat 32.5
5.0 Lollipop 16.2
5.1 Lollipop 19.4
6.0 Marshmallow 7.5
Total -- 100.0
Android Install Distribution (from Google) Android Install Distribution by Codename (from Google)
24.9% KitKat 0.2% Gingerbread
19.4% Marshmallow 0.0% Honeycomb
0.0% Froyo6.8% Jelly Bean
48.2% Lollipop 0.5% Ice Cream Sandwich
Version Codename Distribution
2.2x Froyo 0.00
2.3.3 - 2.3.7 Gingerbread 0.16
3.1.0 - 3.2.x Honeycomb 0.01
4.0.3 - 4.0.4 Ice Cream Sandwich 0.48
4.1.x Jelly Bean 2.89
4.2.x Jelly Bean 3.91
4.3.x Jelly Bean 0.01
4.4.x KitKat 24.91
5.0.x Lollipop 19.07
5.1.x Lollipop 29.14
6.0.x Marshmallow 19.42
Total -- 100.0
Android Usage Distribution (5/22 - 05/28) Android Usage Distribution by Codename (5/22 - 05/28)
However, there are a few problems with this presentation of the data. First, it only takes into account phones running Google Play, so a significant set of data is missing from users in countries like China. Second, and most importantly, it does not take into account usage. Let’s see how the picture changes when we look at Android OS distribution by usage
of the operating systems for that last full week of May 2016:
© Apteligent 2016
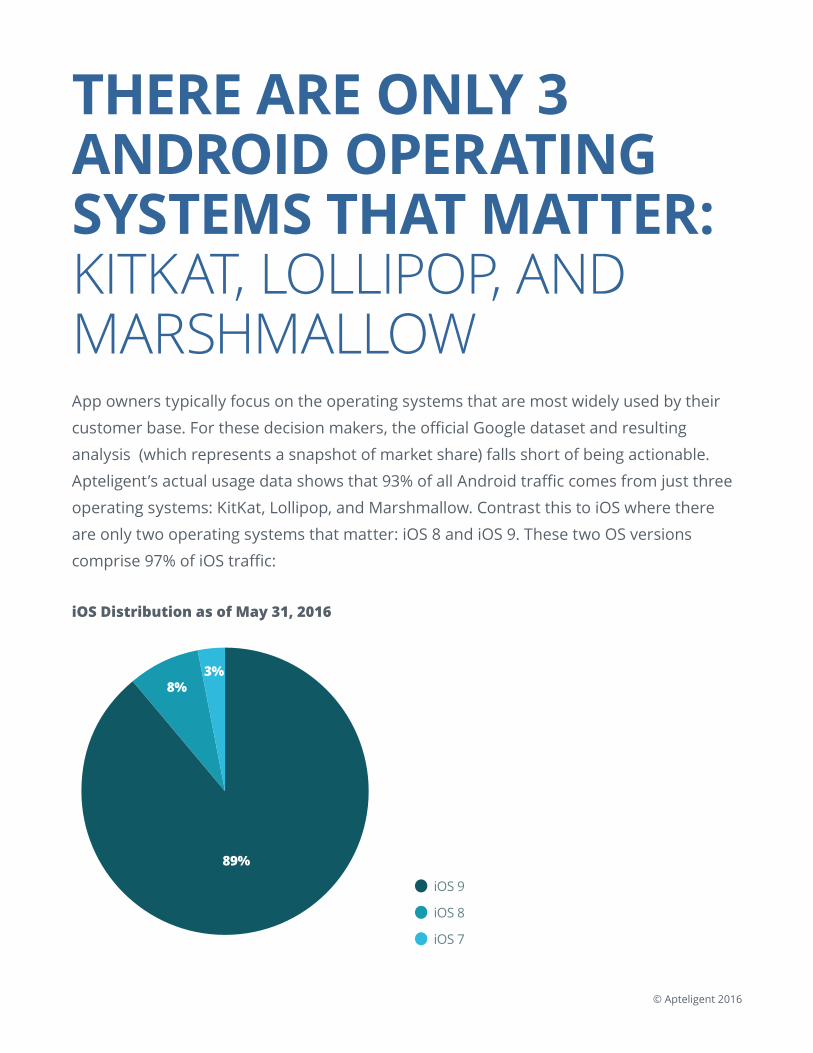
THERE ARE ONLY 3 ANDROID OPERATING SYSTEMS THAT MATTER: KITKAT, LOLLIPOP, AND MARSHMALLOWApp owners typically focus on the operating systems that are most widely used by their
customer base. For these decision makers, the official Google dataset and resulting
analysis (which represents a snapshot of market share) falls short of being actionable.
Apteligent’s actual usage data shows that 93% of all Android traffic comes from just three
operating systems: KitKat, Lollipop, and Marshmallow. Contrast this to iOS where there
are only two operating systems that matter: iOS 8 and iOS 9. These two OS versions
comprise 97% of iOS traffic:
iOS Distribution as of May 31, 2016
iOS 9
iOS 7
iOS 8
89%
8%3%
© Apteligent 2016
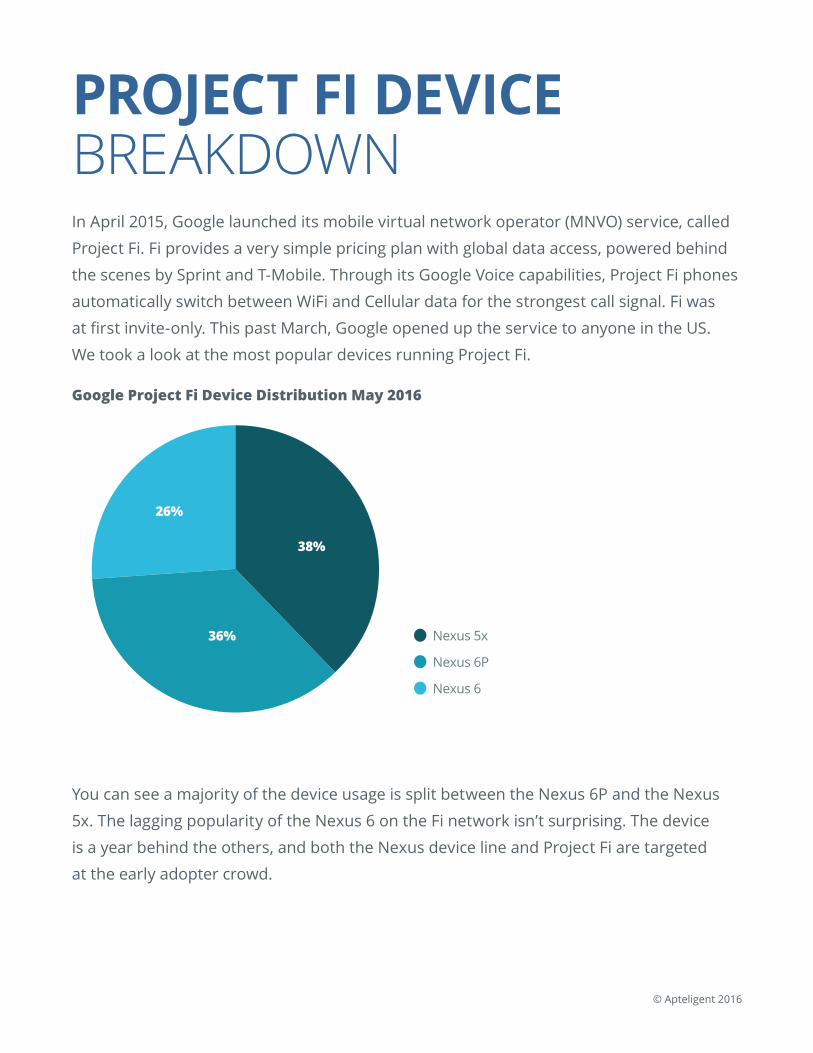
PROJECT FI DEVICE BREAKDOWNIn April 2015, Google launched its mobile virtual network operator (MNVO) service, called
Project Fi. Fi provides a very simple pricing plan with global data access, powered behind
the scenes by Sprint and T-Mobile. Through its Google Voice capabilities, Project Fi phones
automatically switch between WiFi and Cellular data for the strongest call signal. Fi was
at first invite-only. This past March, Google opened up the service to anyone in the US.
We took a look at the most popular devices running Project Fi.
Google Project Fi Device Distribution May 2016
Nexus 5x
Nexus 6
Nexus 6P
38%
36%
26%
You can see a majority of the device usage is split between the Nexus 6P and the Nexus
5x. The lagging popularity of the Nexus 6 on the Fi network isn’t surprising. The device
is a year behind the others, and both the Nexus device line and Project Fi are targeted
at the early adopter crowd.
© Apteligent 2016
Is More Data Generated by Apple Devices on Project Fi than from Android devices?It’s a little known fact that an additional Google Fi data-only SIM can be acquired that
works on certain Apple device, including the iPad Air 2, Mini 4, and iPad Pro. Those three
devices are about seven times more popular than all of the eligible Android devices
combined. So, we’ll go out on a limb and state that it is very likely that more data is
generated from Apple devices on Project Fi than on Android devices! For more (non-
speculative) information, Google publishes an eligible devices list.
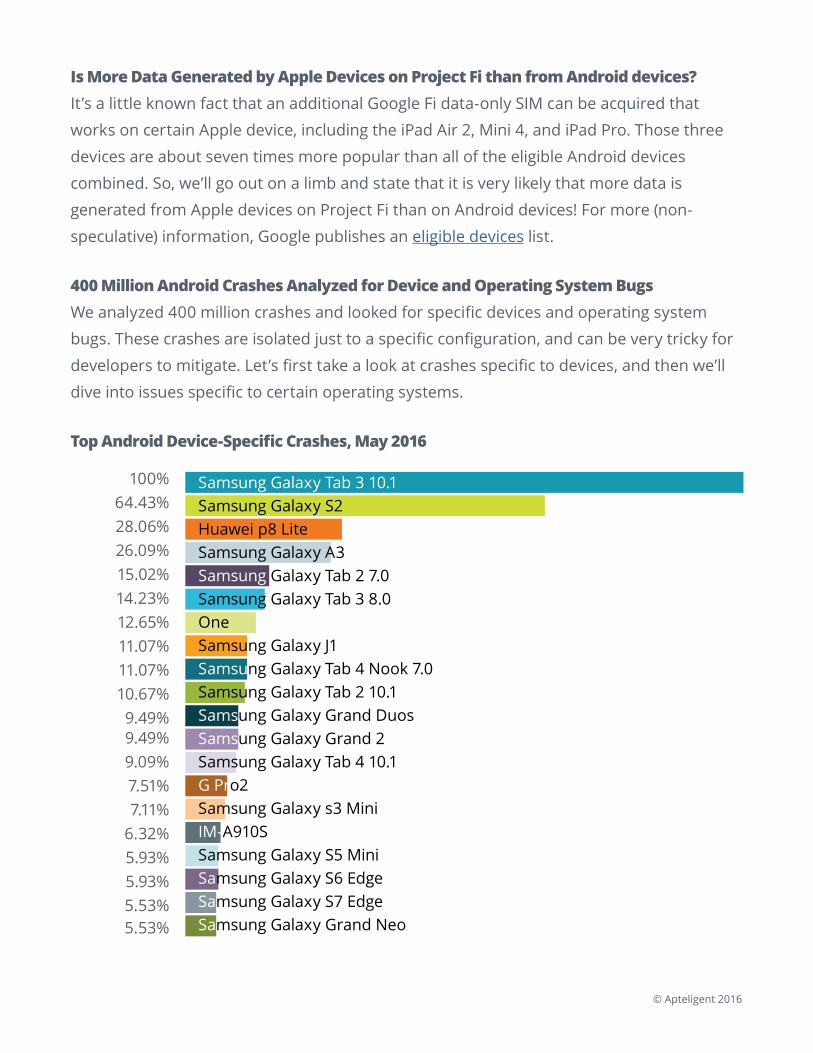
400 Million Android Crashes Analyzed for Device and Operating System BugsWe analyzed 400 million crashes and looked for specific devices and operating system
bugs. These crashes are isolated just to a specific configuration, and can be very tricky for
developers to mitigate. Let’s first take a look at crashes specific to devices, and then we’ll
dive into issues specific to certain operating systems.
Top Android Device-Specific Crashes, May 2016
100%
14.23%
9.49%
6.32%
64.43%
12.65%
9.49%
5.93%
28.06%
11.07%
9.09%
5.93%
26.09%
11.07%
7.51%
5.53%
15.02%
10.67%
7.11%
5.53%
Samsung Galaxy Tab 3 10.1Samsung Galaxy S2Huawei p8 LiteSamsung Galaxy A3Samsung Galaxy Tab 2 7.0Samsung Galaxy Tab 3 8.0OneSamsung Galaxy J1Samsung Galaxy Tab 4 Nook 7.0Samsung Galaxy Tab 2 10.1Samsung Galaxy Grand DuosSamsung Galaxy Grand 2Samsung Galaxy Tab 4 10.1G Pro2Samsung Galaxy s3 MiniIM-A910SSamsung Galaxy S5 MiniSamsung Galaxy S6 EdgeSamsung Galaxy S7 EdgeSamsung Galaxy Grand Neo
© Apteligent 2016
The top 3 devices with the most device-specific bugs are the Samsung Galaxy Tab 3
10.1, the Samsung Galaxy S2, and the Huawei P8 Lite. The overall numbers are still small
relative to the total crash population. We normalized our dataset to account for device
usage by dividing the device-specific crashes by the total number of crashes for a given
device. In our analysis, the Samsung Galaxy Tab 3 10.1 device-specific crashes represents
0.025% of all crashes we saw for the Galaxy Tab 3 10.1. This is the highest percentage we
saw in the sample.
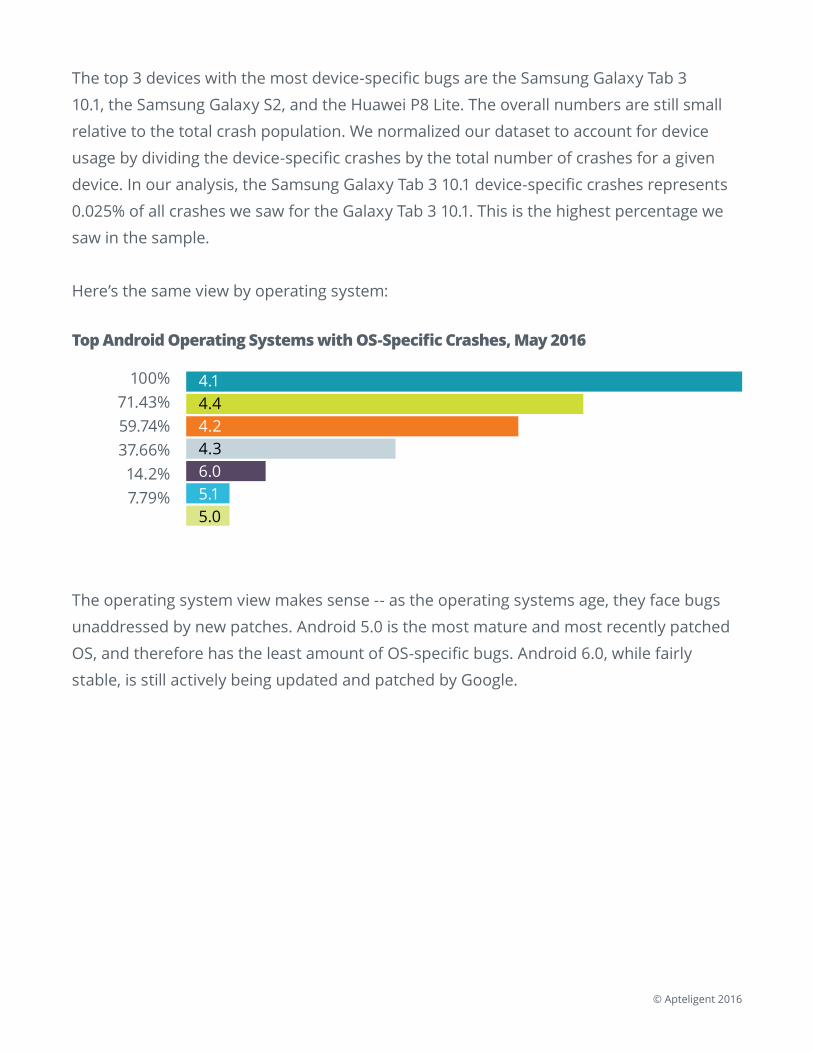
Here’s the same view by operating system:
Top Android Operating Systems with OS-Specific Crashes, May 2016
100%
7.79%
71.43%59.74%37.66%14.2%
4.14.44.24.36.05.15.0
The operating system view makes sense -- as the operating systems age, they face bugs
unaddressed by new patches. Android 5.0 is the most mature and most recently patched
OS, and therefore has the least amount of OS-specific bugs. Android 6.0, while fairly
stable, is still actively being updated and patched by Google.
© Apteligent 2016
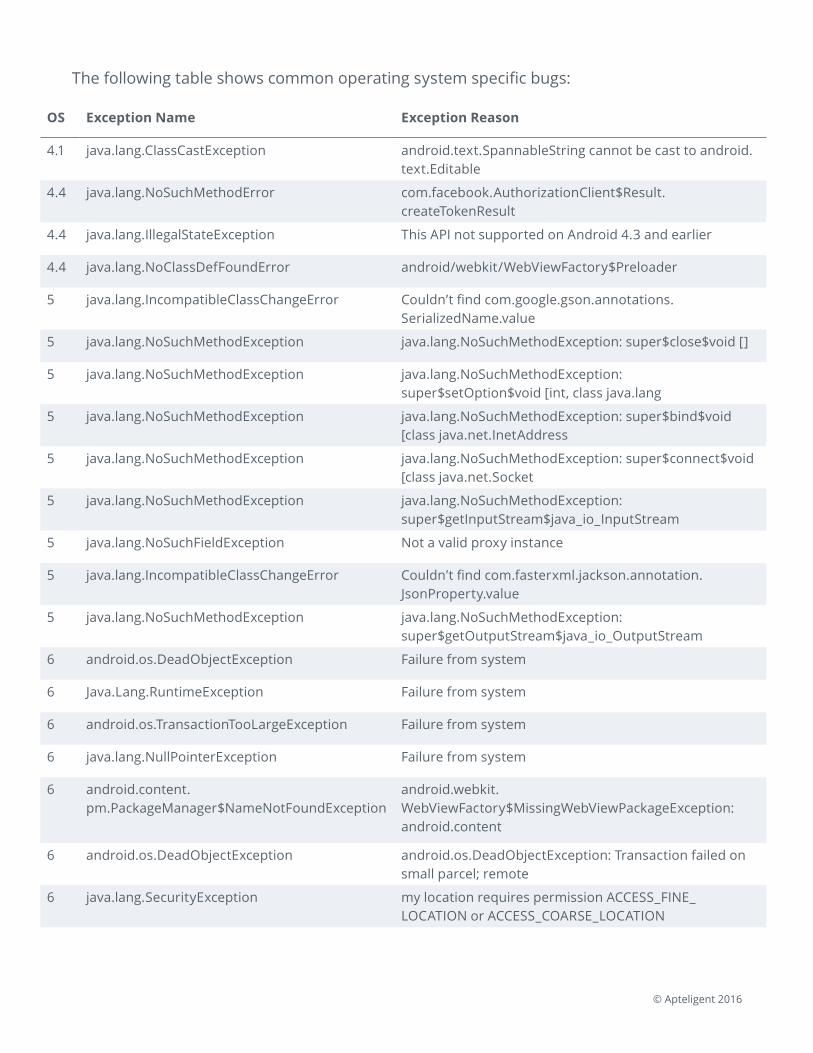
The following table shows common operating system specific bugs:
OS Exception Name Exception Reason
4.1 java.lang.ClassCastException android.text.SpannableString cannot be cast to android.text.Editable
4.4 java.lang.NoSuchMethodError com.facebook.AuthorizationClient$Result.createTokenResult
4.4 java.lang.IllegalStateException This API not supported on Android 4.3 and earlier
4.4 java.lang.NoClassDefFoundError android/webkit/WebViewFactory$Preloader
5 java.lang.IncompatibleClassChangeError Couldn’t find com.google.gson.annotations.SerializedName.value
5 java.lang.NoSuchMethodException java.lang.NoSuchMethodException: super$close$void []
5 java.lang.NoSuchMethodException java.lang.NoSuchMethodException: super$setOption$void [int, class java.lang
5 java.lang.NoSuchMethodException java.lang.NoSuchMethodException: super$bind$void [class java.net.InetAddress
5 java.lang.NoSuchMethodException java.lang.NoSuchMethodException: super$connect$void [class java.net.Socket
5 java.lang.NoSuchMethodException java.lang.NoSuchMethodException: super$getInputStream$java_io_InputStream
5 java.lang.NoSuchFieldException Not a valid proxy instance
5 java.lang.IncompatibleClassChangeError Couldn’t find com.fasterxml.jackson.annotation.JsonProperty.value
5 java.lang.NoSuchMethodException java.lang.NoSuchMethodException: super$getOutputStream$java_io_OutputStream
6 android.os.DeadObjectException Failure from system
6 Java.Lang.RuntimeException Failure from system
6 android.os.TransactionTooLargeException Failure from system
6 java.lang.NullPointerException Failure from system
6 android.content.pm.PackageManager$NameNotFoundException
android.webkit.WebViewFactory$MissingWebViewPackageException: android.content
6 android.os.DeadObjectException android.os.DeadObjectException: Transaction failed on small parcel; remote
6 java.lang.SecurityException my location requires permission ACCESS_FINE_LOCATION or ACCESS_COARSE_LOCATION
For example, there is a bug impacting WebViews on Android 5 (Lollipop), a java.lang.
NoClassDefFoundError on the android/webkit/WebViewFactory$Preloader. This is caused
by the WebView package updating via Google Play as someone tries to use an app that
leverages a WebView. The last entry in the table, java.lang.SecurityException, is related
to the new runtime permission system in Android 6 Marshmallow, causing issues
for developers.
We’ll dive more into this crash data in the coming months with best practices to mitigate these
types of issues, and provide further analysis of operating system and device-specific bugs.
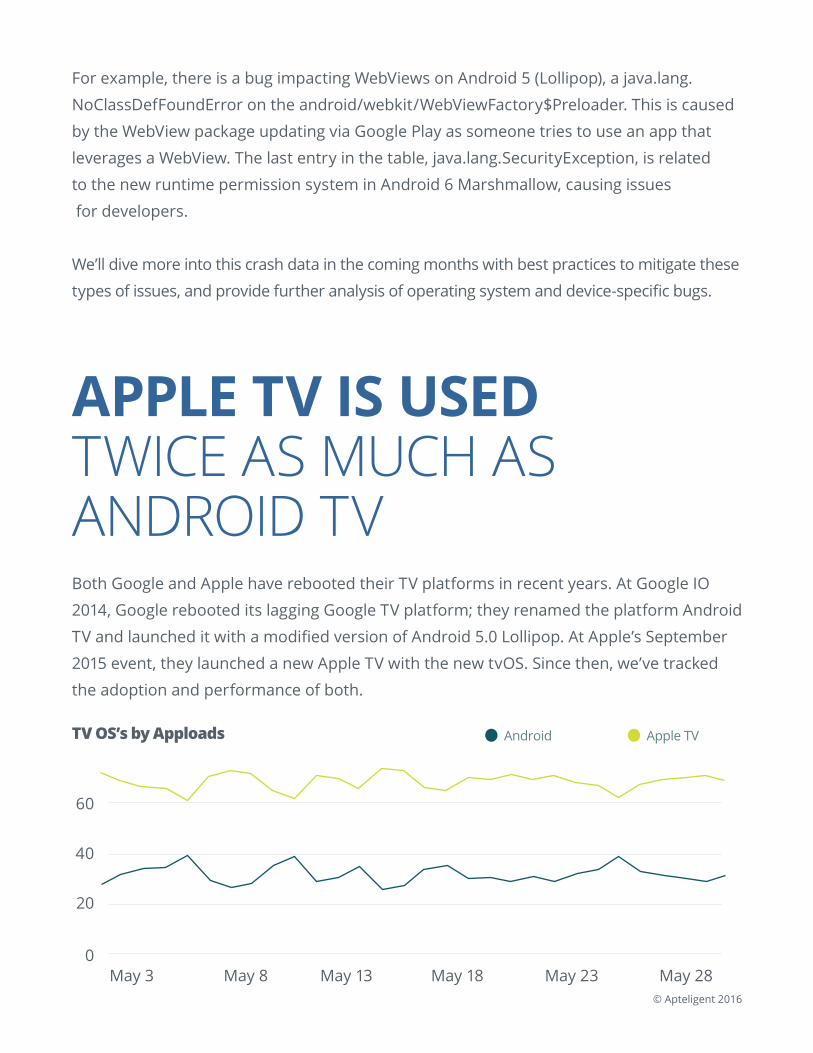
APPLE TV IS USED TWICE AS MUCH AS ANDROID TVBoth Google and Apple have rebooted their TV platforms in recent years. At Google IO
2014, Google rebooted its lagging Google TV platform; they renamed the platform Android
TV and launched it with a modified version of Android 5.0 Lollipop. At Apple’s September
2015 event, they launched a new Apple TV with the new tvOS. Since then, we’ve tracked
the adoption and performance of both.
TV OS’s by Apploads
© Apteligent 2016
60
40
20
0May 3 May 8 May 13 May 18 May 23 May 28
Android Apple TV
© Apteligent 2016
We’ve found that on average, Apple TV is used over twice as much as Android TV.
However, Android TV is used more consistently throughout the weekdays and weekends,
while Apple TV usage increases about 30% on weekends. This is mostly likely a result of
Google’s effort to embed the OS directly into smart TVs, which the company believes to
be an approach that provides a more consistent, ongoing experience for its users. Toward
the end of May, Google quietly removed the Nexus Player from the Google Store. We
take this to be further evidence of Google’s desire to prioritize TV OEMs as a competitive
response to Apple’s focus on a standalone set-top box. As Google continues to work with
TV manufacturers, we expect the gap to further close against Apple TV.
ANDROID TV APPS TWICE AS STABLE AS REGULAR ANDROID APPSOne other interesting tidbit on Android TV performance. We found that apps running on
Android TV are about twice as stable as apps running on Android phones/tablets. The
average crash rate for May on Android TV was 1.5%, while the average for Lollipop and
Marshmallow was close to 3%. We believe that a primary driver of this difference is the
stability of a network connection for the smart TV. When you connect to a cloud service
for content directly from your TV, you’re not taking your TV through a tunnel or dealing
with connectivity changes between WiFi and cellular. Apteligent data shows that network
issues often lead to crashes and errors, and network issues tend to be mitigated by the
direct ethernet or home WiFi connections that are relatively more stable.
© Apteligent 2016
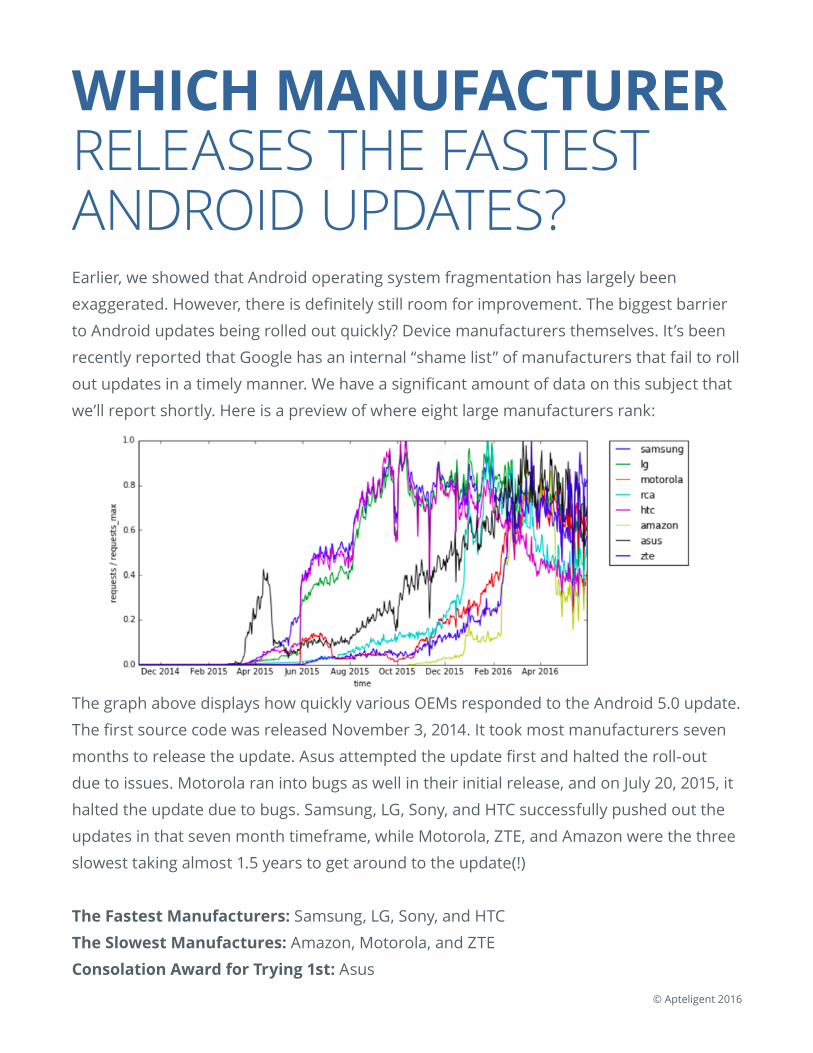
WHICH MANUFACTURER RELEASES THE FASTEST ANDROID UPDATES?Earlier, we showed that Android operating system fragmentation has largely been
exaggerated. However, there is definitely still room for improvement. The biggest barrier
to Android updates being rolled out quickly? Device manufacturers themselves. It’s been
recently reported that Google has an internal “shame list” of manufacturers that fail to roll
out updates in a timely manner. We have a significant amount of data on this subject that
we’ll report shortly. Here is a preview of where eight large manufacturers rank:
The graph above displays how quickly various OEMs responded to the Android 5.0 update.
The first source code was released November 3, 2014. It took most manufacturers seven
months to release the update. Asus attempted the update first and halted the roll-out
due to issues. Motorola ran into bugs as well in their initial release, and on July 20, 2015, it
halted the update due to bugs. Samsung, LG, Sony, and HTC successfully pushed out the
updates in that seven month timeframe, while Motorola, ZTE, and Amazon were the three
slowest taking almost 1.5 years to get around to the update(!)
The Fastest Manufacturers: Samsung, LG, Sony, and HTC
The Slowest Manufactures: Amazon, Motorola, and ZTE
Consolation Award for Trying 1st: Asus
© Apteligent 2016
We plan to do a future report on device manufacturers. For immediate information,
contact us at [email protected], or check back in the future on data.apteligent.com/
research for the report.
A note on our dataOur data is benchmarked across tens of thousands of mobile apps representing hundreds of
millions of application launches. Adoption rate is based on app loads, which means it is based
on actual usage of the operating system. You may see slightly different numbers reported in
the future by Apple, which are solely based on activations vs actual device usage.
You can find mobile industry benchmarks updated daily at data.apteligent.com.
In addition, every month we publish a recap of the trends and movements in the industry.
ABOUT APTELIGENT If you develop an app, or are responsible for the success of a mobile app, Apteligent’s
lightweight SDK helps you optimize user experience by identifying performance issues,
such as crashes and network failures, that impact user behavior.
The company’s solution provides a real-time global view of apps across iOS, Android, Windows
Phone 10, Hybrid and HTML5. Trusted by three of the top five credit card issuers, three of the
top five media companies, three of the top five retailers, and two of the top three hotel chains
with the success of their strategic mobile app initiatives. Apteligent is leading the drive to the
App Economy.
www.apteligent.com | @apteligent | [email protected]