apresentação do powerpoint - portugal 2030 · gender inequality and fertility link a positive...
TRANSCRIPT
Demographic Challenges
Tomas Sobotka
Vienna Institute of Demography (Austrian Academy of Sciences), Wittgenstein Centre for Demography and Global Human Capital
Background
Demographic Changes in Portugal and in Europe
High attention of media; especially migration and
births/population decline as well as family changes
Scope for policy interventions
Both challenges and opportunities (e.g., ageing & longevity,
migration); recognised by the European Commission
especially since the early 2000s
Agenda
Review of past trends and the likely future developments
Key challenges, especially those relevant for government policies
Portugal within Southern European, EU & OECD context
Going beyond demographic trends: intersection of emerging
demographic and societal challenges
Agenda
Review of past trends and the likely future developments
Key challenges, especially those relevant for government policies
Portugal within Southern European, EU & OECD context
Going beyond demographic trends: intersection of emerging
demographic and societal challenges
1 Demographic trends and challenges
• Fertility / birth rates, Migration, Mortality, health, Population ageing,
Future population prospects
2 A broader view on selected population & societal challenges
• Regional disparities in population change, Employment and working life,
Gender (in)equality, Intergenerational inequalities
Demographic Trends and Challenges

Birth rates, Fertility
A cross-over in the number of births & deaths after 2008
0
20
40
60
80
100
120
140
160
180
200
19
75
19
78
19
81
19
84
19
87
19
90
19
93
19
96
19
99
20
02
20
05
20
08
20
11
20
14
Nu
mb
er
of
live
bir
ths
and
de
ath
s (t
ho
usa
nd
)
Live births
Deaths
1976: 186 712
2014:82 367
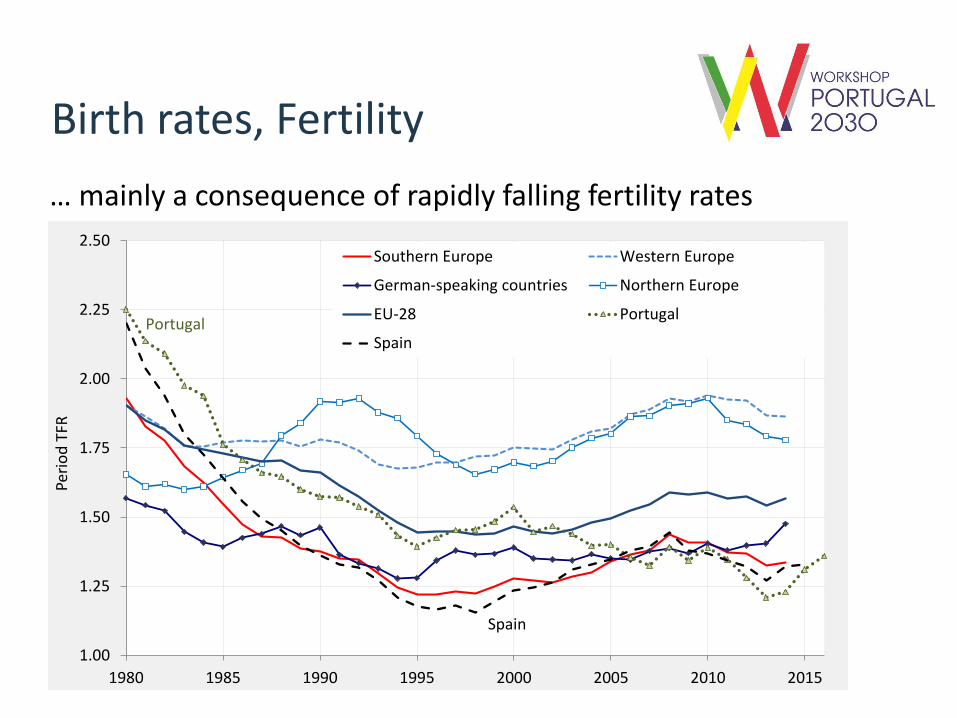
Birth rates, Fertility
… mainly a consequence of rapidly falling fertility rates
1.00
1.25
1.50
1.75
2.00
2.25
2.50
1980 1985 1990 1995 2000 2005 2010 2015
Peri
od
TFR
Southern Europe Western Europe
German-speaking countries Northern Europe
EU-28 Portugal
SpainPortugal
Spain
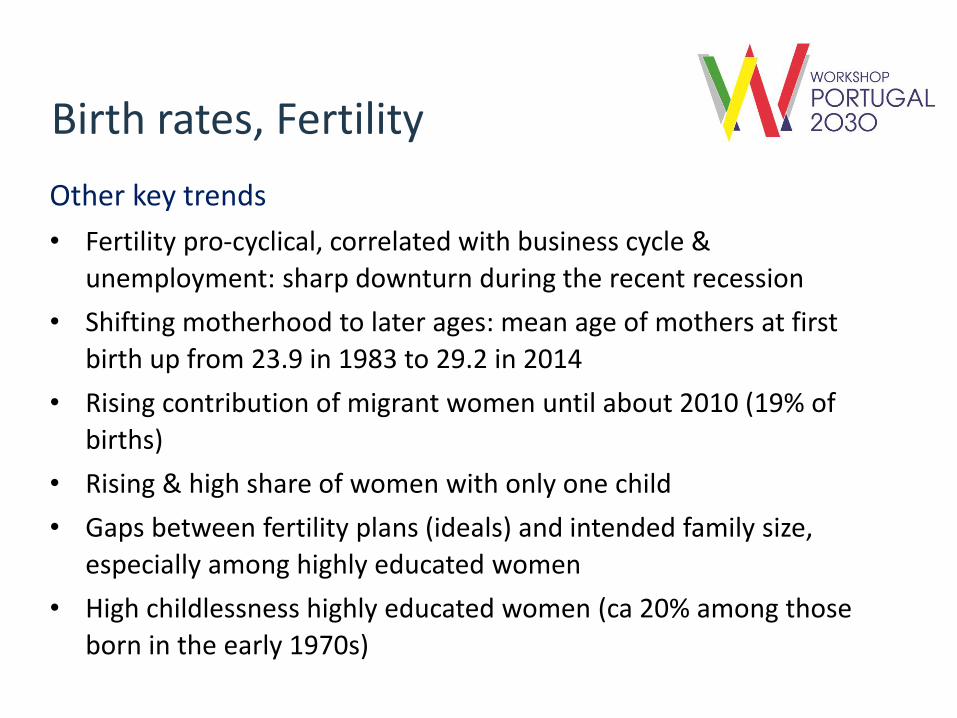
Birth rates, Fertility
Other key trends
• Fertility pro-cyclical, correlated with business cycle &
unemployment: sharp downturn during the recent recession
• Shifting motherhood to later ages: mean age of mothers at first
birth up from 23.9 in 1983 to 29.2 in 2014
• Rising contribution of migrant women until about 2010 (19% of
births)
• Rising & high share of women with only one child
• Gaps between fertility plans (ideals) and intended family size,
especially among highly educated women
• High childlessness highly educated women (ca 20% among those
born in the early 1970s)
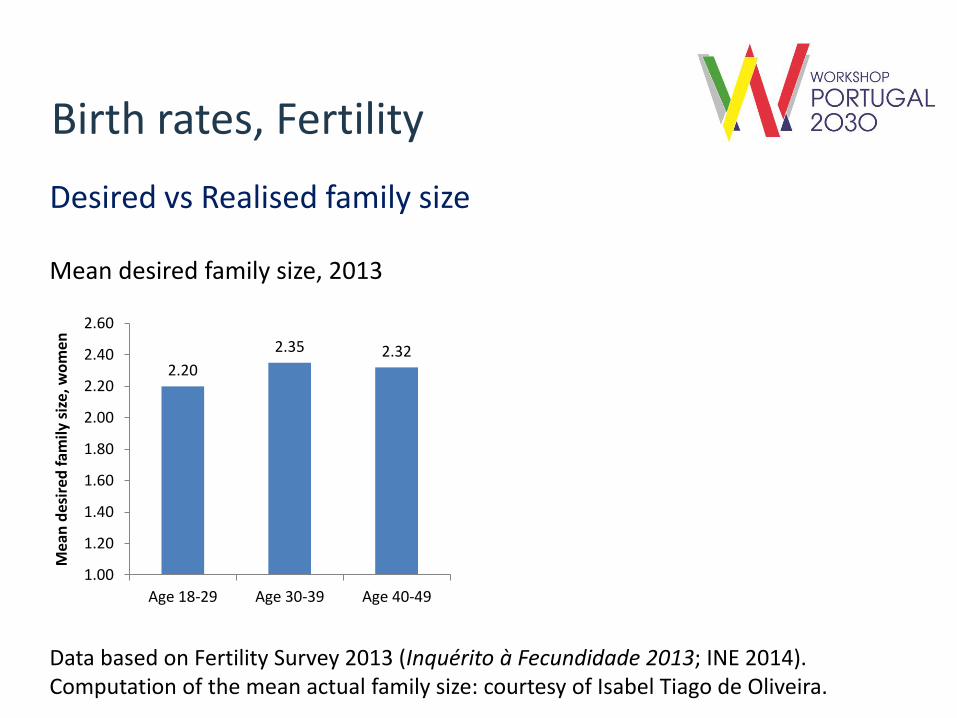
Birth rates, Fertility
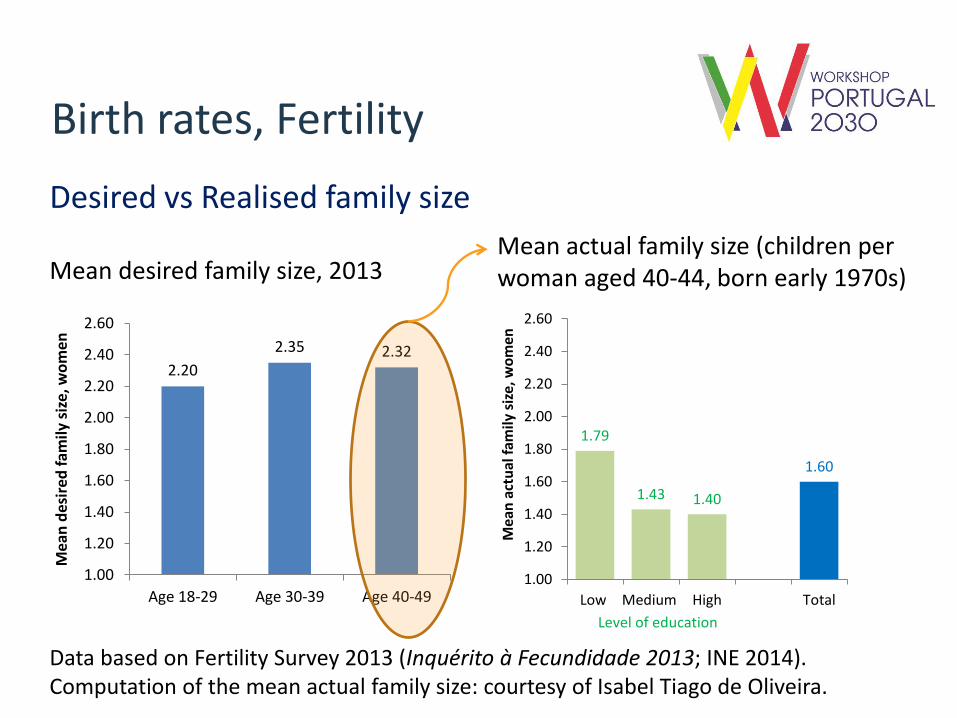
Desired vs Realised family size
2.20
2.35 2.32
1.00
1.20
1.40
1.60
1.80
2.00
2.20
2.40
2.60
Age 18-29 Age 30-39 Age 40-49
Me
an d
esi
red
fam
ily s
ize
, wo
men
Mean desired family size, 2013
Data based on Fertility Survey 2013 (Inquérito à Fecundidade 2013; INE 2014). Computation of the mean actual family size: courtesy of Isabel Tiago de Oliveira.
Birth rates, Fertility
Desired vs Realised family size
2.20
2.35 2.32
1.00
1.20
1.40
1.60
1.80
2.00
2.20
2.40
2.60
Age 18-29 Age 30-39 Age 40-49
Me
an d
esi
red
fam
ily s
ize
, wo
men
Mean desired family size, 2013
1.79
1.43 1.40
1.60
1.00
1.20
1.40
1.60
1.80
2.00
2.20
2.40
2.60
Low Medium High Total
Mea
n a
ctu
al f
amily
siz
e, w
om
en
Level of education
Mean actual family size (children per woman aged 40-44, born early 1970s)
Data based on Fertility Survey 2013 (Inquérito à Fecundidade 2013; INE 2014). Computation of the mean actual family size: courtesy of Isabel Tiago de Oliveira.
Birth rates, Fertility
Key challenges
• Very low birth rates, trend strengthened during the recent recession
• Huge gaps between reproductive plans and actual fertility
• High share of women with one child as a response to difficulties of
reconciling work and family life
• Risk of rising infertility due to delayed motherhood (especially highly
educated)

Birth rates, Fertility
Key challenges• Very low birth rates, trend strengthened during the recent recession
• Huge gaps between reproductive plans and actual fertility
• High share of women with one child as a response to difficulties of reconciling work and family life
• Risk of rising infertility due to delayed motherhood (especially highly educated)
Selected underlying factors• Economic uncertainty, unstable jobs (especially among young adults)
• Low public spending on families: in 2011 1.4% GDP (OECD average 2.6%), especially on public childcare (0.45% vs. 0.95%)
• Lower satisfaction with childcare provision and quality; high prevalence of informal childcare
• Low income & high incidence of child poverty
• Limited access to affordable housing, most young people living with parents
• Prevailing unequal division of household work and childcare
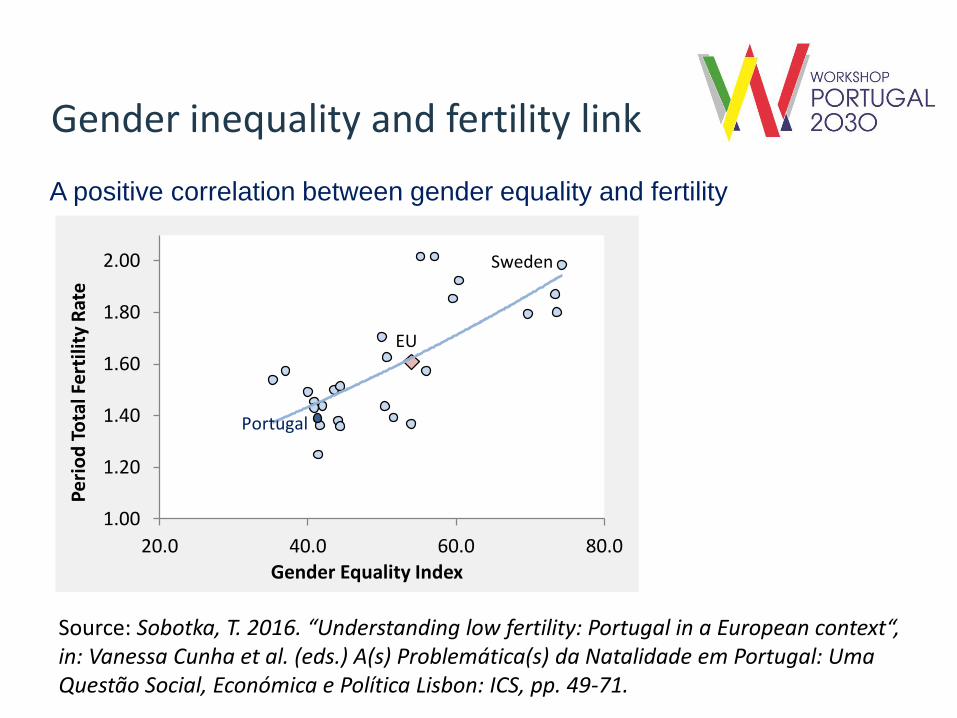
Gender inequality and fertility link
A positive correlation between gender equality and fertility
Source: Sobotka, T. 2016. “Understanding low fertility: Portugal in a European context“, in: Vanessa Cunha et al. (eds.) A(s) Problemática(s) da Natalidade em Portugal: Uma Questão Social, Económica e Política Lisbon: ICS, pp. 49-71.
1.00
1.20
1.40
1.60
1.80
2.00
20.0 40.0 60.0 80.0
Per
iod
To
tal F
erti
lity
Rat
e
Gender Equality Index
Sweden
EU
Portugal
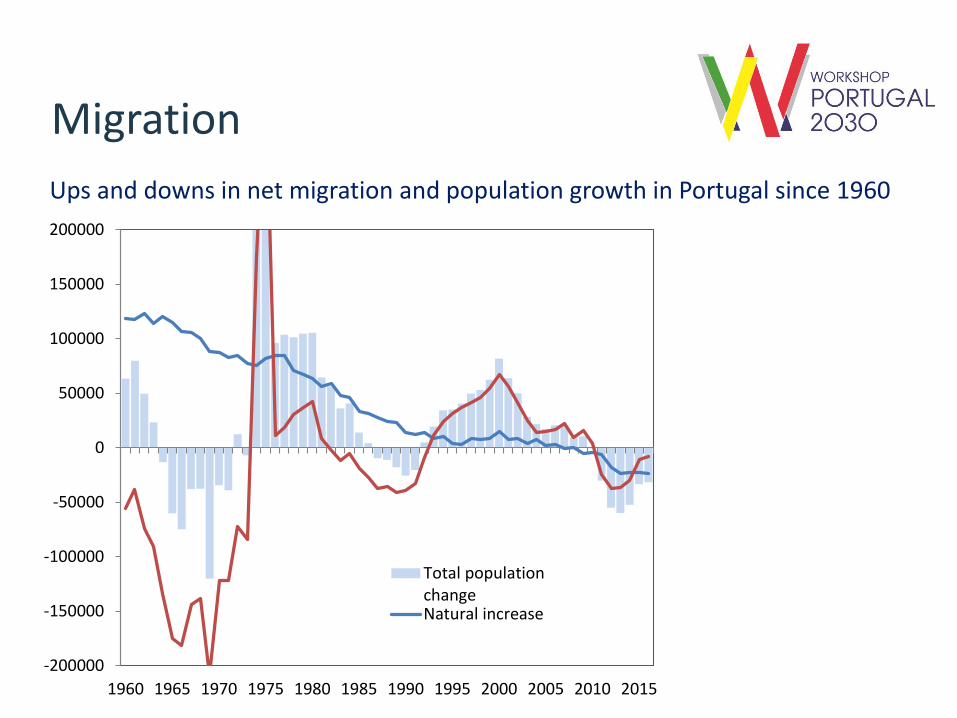
Migration
Ups and downs in net migration and population growth in Portugal since 1960
-200000
-150000
-100000
-50000
0
50000
100000
150000
200000
1960 1965 1970 1975 1980 1985 1990 1995 2000 2005 2010 2015
Total populationchangeNatural increase
Migration
Key trends• Most unstable component of population change; most difficult to predict
• Affected by the events in receiving as well as sending countries
• Difficult to record; incomplete data in many countries
• Substantial illegal/undocumented migration
• Pro-cyclical; outmigration during the recent recession (also Spain, Greece)
• Mostly positive migration balance in Portugal after 1990; turnarounds also in other countries of Southern Europe
• Key component of population trends in EU countries since the 1990s
• Young age profile: migrants contributing to filling the gaps in labourmarket, but also to the “population renewal” (births) via higher fertility & younger age structure
• Diversity of migration streams
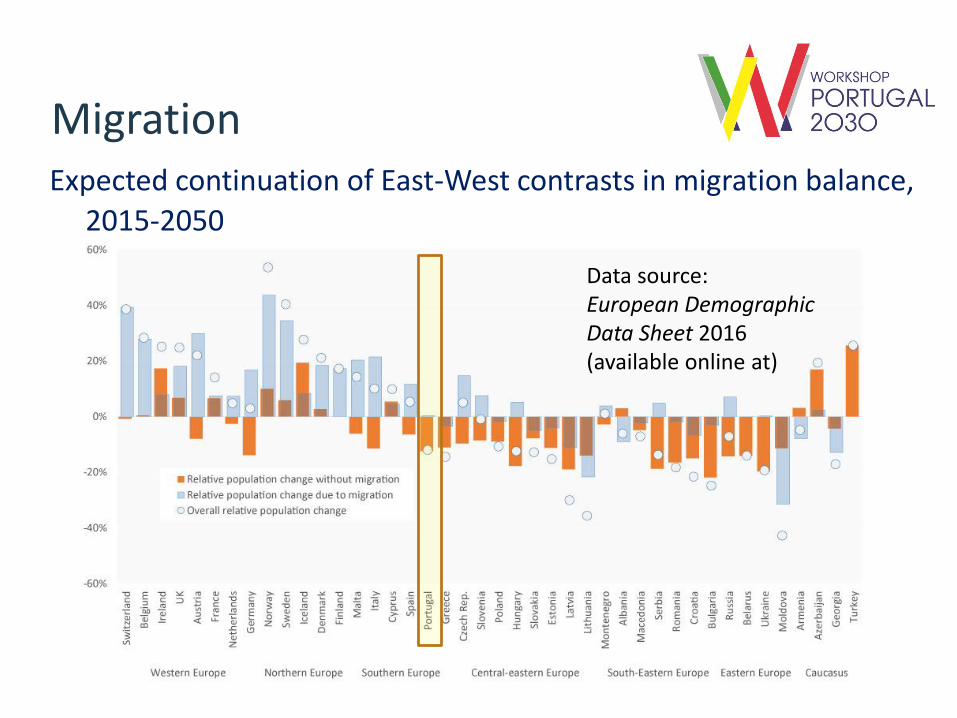
• East-West contrast in migration balance in Europe; sharp losses in the East
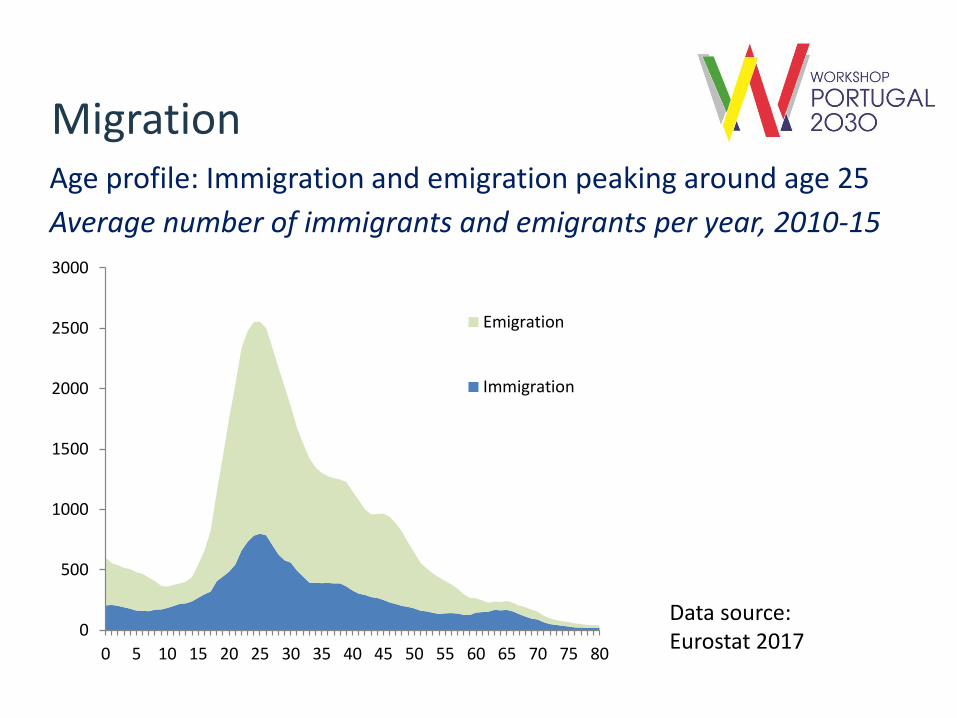
MigrationAge profile: Immigration and emigration peaking around age 25
Average number of immigrants and emigrants per year, 2010-15
0
500
1000
1500
2000
2500
3000
0 5 10 15 20 25 30 35 40 45 50 55 60 65 70 75 80
Emigration
Immigration
Data source:Eurostat 2017
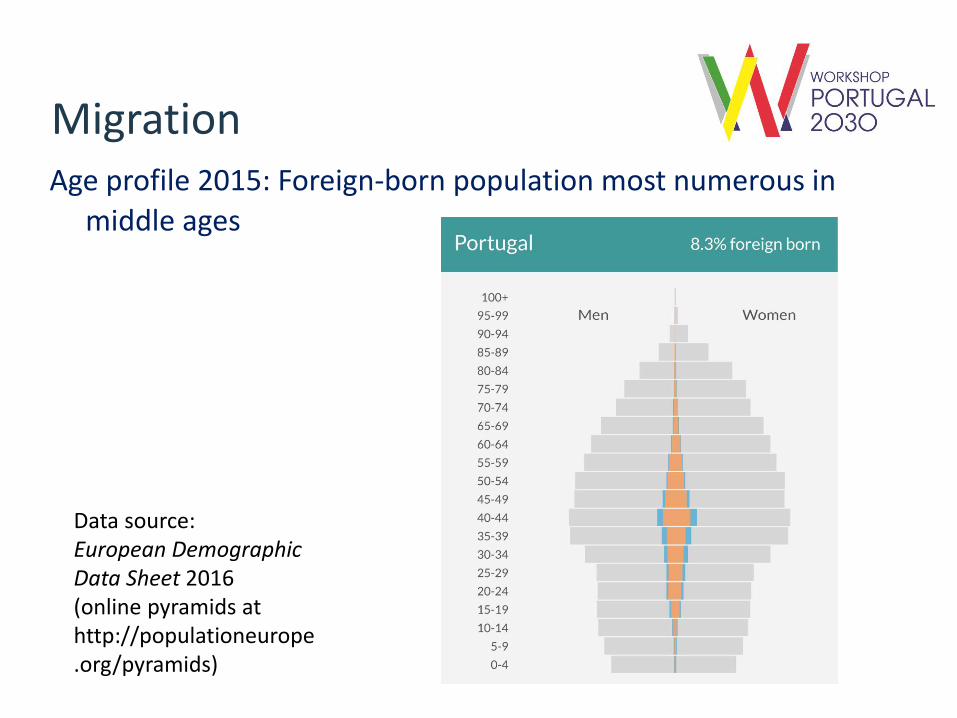
MigrationAge profile 2015: Foreign-born population most numerous in
middle ages
Data source:European Demographic Data Sheet 2016(online pyramids at http://populationeurope.org/pyramids)
Migration
Key challenges
• Instability, often driven by the events in the countries of origin (including
political instability, economic crises, wars, famine, disasters)
• Huge potential for immigration to Europe (Gallup poll 2017: Desire to leave
strongest in Sub-Saharan Africa (31%) and Central-eastern Europe (27%)
• Difficulty to enact effective migration policies and to enforce them
• Need for Europe-wide solutions
• Diversity of countries of origin: linguistic & historical links (Angola, Brazil…)
• Dealing with undocumented/illegal migrants
• Tapping the skills of migrants, supporting their education, work integration and
good assimilation into the society; dealing with migrants’ “overqualification”
• Prioritising migrants by education & language skills and other characteristics?
• Local resentment to migration explored in political campaigns, elections
• Dealing with the “brain drain”
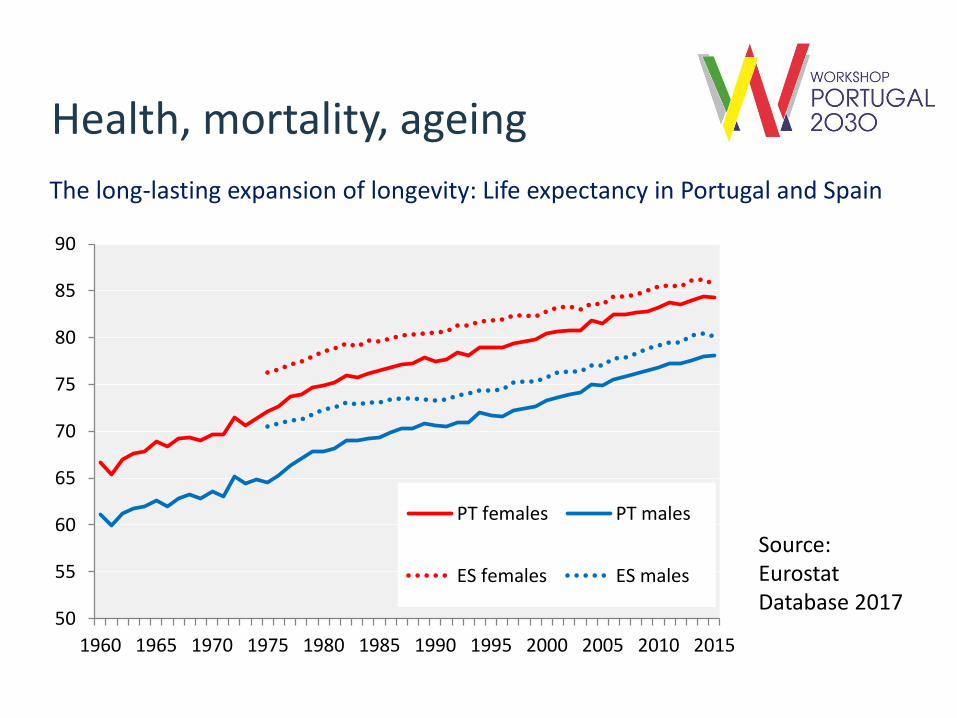
Health, mortality, ageing
The long-lasting expansion of longevity: Life expectancy in Portugal and Spain
50
55
60
65
70
75
80
85
90
1960 1965 1970 1975 1980 1985 1990 1995 2000 2005 2010 2015
PT females PT males
ES females ES males
Source:Eurostat Database 2017

Health, mortality, ageing
More years spent in good health: Estimated Healthy life expectancy based on self-perceived health
Source:Eurostat Database 2017
50
55
60
65
70
75
80
85
90
1995 2000 2005 2010 2015
Life expectancy F
Life expectancy M
Healthy Life expectancy F
Healthy Life expectancy M
Health, mortality, ageing
Key trends
• Continuing rise in life expectancy; “catching up” with Spain
• Also longer life in good health (different measures)
• A gradual narrowing of the LE gap between M and F after 1996
• Sharp increases in the number of very old people (80+) and
centenarians

Health, mortality, ageing
Key challenges
• Rather poor self-reported health in EU comparison
• High prevalence of diabetes (self-reported), especially among low-
educated population
• High prevalence of dementia
• Rising obesity
• Low levels of physical activity among adults, especially women
• Keeping equitable access to high-quality healthcare

Health, mortality, ageing
Self-reported health, adult population
Source: Health at a Glance, Europe 2016 (OECD 2016)
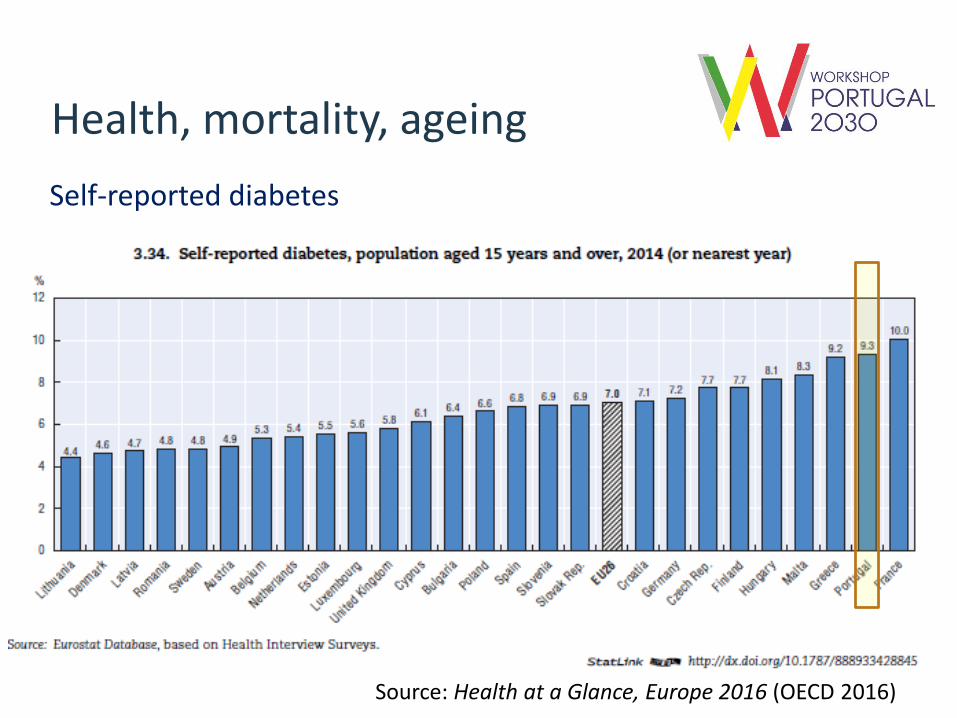
Health, mortality, ageing
Self-reported diabetes
Source: Health at a Glance, Europe 2016 (OECD 2016)

Health, mortality, ageing
Moderate physical activity, population aged 15+
Source: Health at a Glance, Europe 2016 (OECD 2016)
Projected population trends
Key issues & challenges
• Overall population size will decline without immigration (from 10.3 mill. in 2016 to 9.1 mill. in 2050 according to the Wittgenstein Centre (2016)
• Life expectancy likely to surpass 90 for women and 85 for men by 2050
• Number of births likely to fall further in medium-term (echo of the past fertility declines, especially in the 1980s)
• Uncertain migration trends: migration might be considerably higher than projected
• Conventional indicators of population ageing will increase sharply irrespective of fertility & migration trends, driven by longevity
• A need for continuous adjustments in retirement patterns & labourforce participation
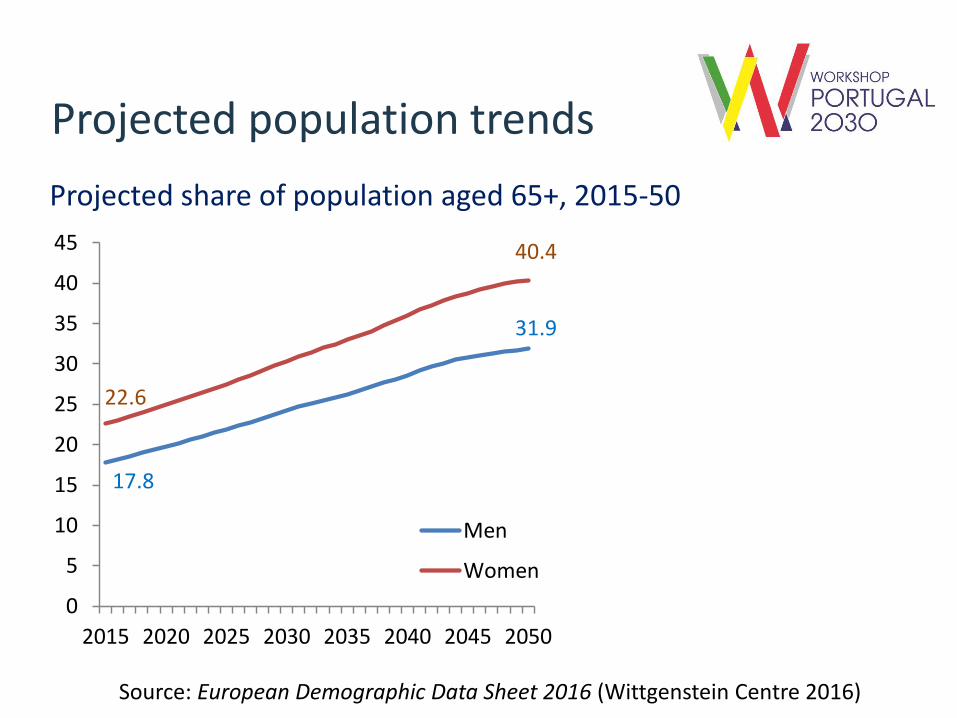
Projected population trends
Projected share of population aged 65+, 2015-50
Source: European Demographic Data Sheet 2016 (Wittgenstein Centre 2016)
17.8
31.9
22.6
40.4
0
5
10
15
20
25
30
35
40
45
2015 2020 2025 2030 2035 2040 2045 2050
Men
Women

Migration
Data source:European Demographic Data Sheet 2016(available online at)
Expected continuation of East-West contrasts in migration balance,
2015-2050
Migration
Data source:European Demographic Data Sheet 2016(available online at)
Expected continuation of East-West contrasts in migration balance,
2015-2050
A broader view on selected population & societal challenges
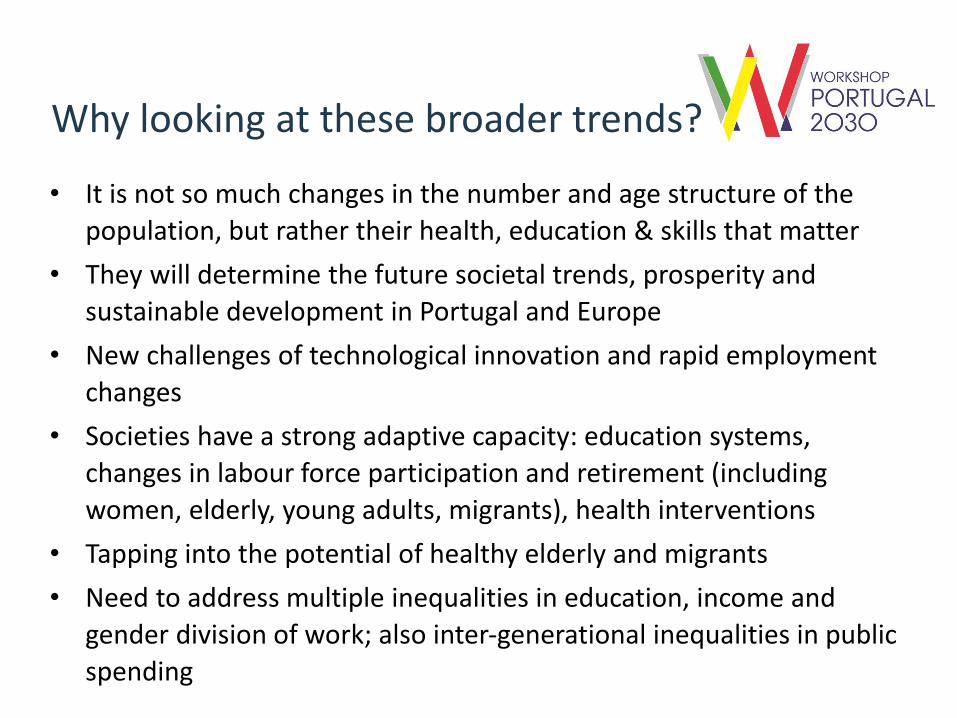
Why looking at these broader trends?
• It is not so much changes in the number and age structure of the
population, but rather their health, education & skills that matter
• They will determine the future societal trends, prosperity and
sustainable development in Portugal and Europe
• New challenges of technological innovation and rapid employment
changes
• Societies have a strong adaptive capacity: education systems,
changes in labour force participation and retirement (including
women, elderly, young adults, migrants), health interventions
• Tapping into the potential of healthy elderly and migrants
• Need to address multiple inequalities in education, income and
gender division of work; also inter-generational inequalities in public
spending
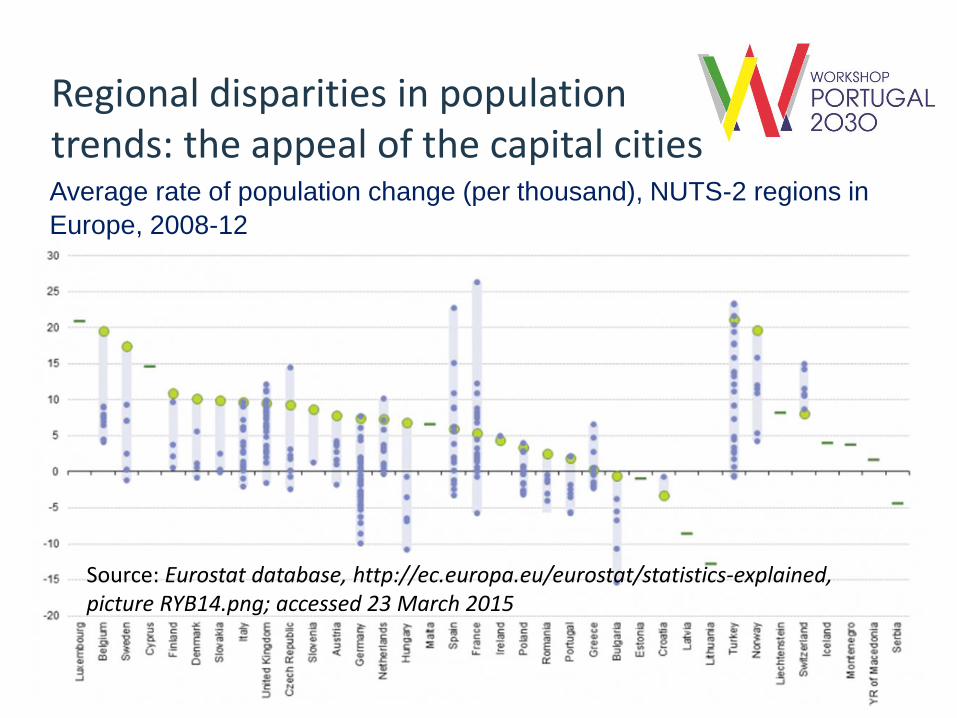
Regional disparities in population trends: the appeal of the capital citiesAverage rate of population change (per thousand), NUTS-2 regions in
Europe, 2008-12
Source: Eurostat database, http://ec.europa.eu/eurostat/statistics-explained, picture RYB14.png; accessed 23 March 2015

Changing retirement ages
Average effective retirement age, Portugal compared with EU average
(1970-2016)
Source: OECD database; http://www.oecd.org/employment/emp/ageingandemploymentpolicies-statisticsonaverageeffectiveageofretirement.htm (acccessed 28 November 2017)
50
55
60
65
70
75
1970 1975 1980 1985 1990 1995 2000 2005 2010 2015
Men: PTMen: EUWomen: PTWomen: EU

The elderly bias in public spending
The elderly bias indicator of social spending, 2007-2008
SOURCE: Vanhuysse, P. 2013. Intergenerational Justice in Aging Societies. A Cross-national Comparison of 29 OECD Countries. Gütersloh: Bertelsmann Stiftung, p. 27.

High poverty among kids & the young
Share of people living with less than 50% of median income, 2014
Source: Society at a Glance. OECD Social Indicators 2016, p. 105
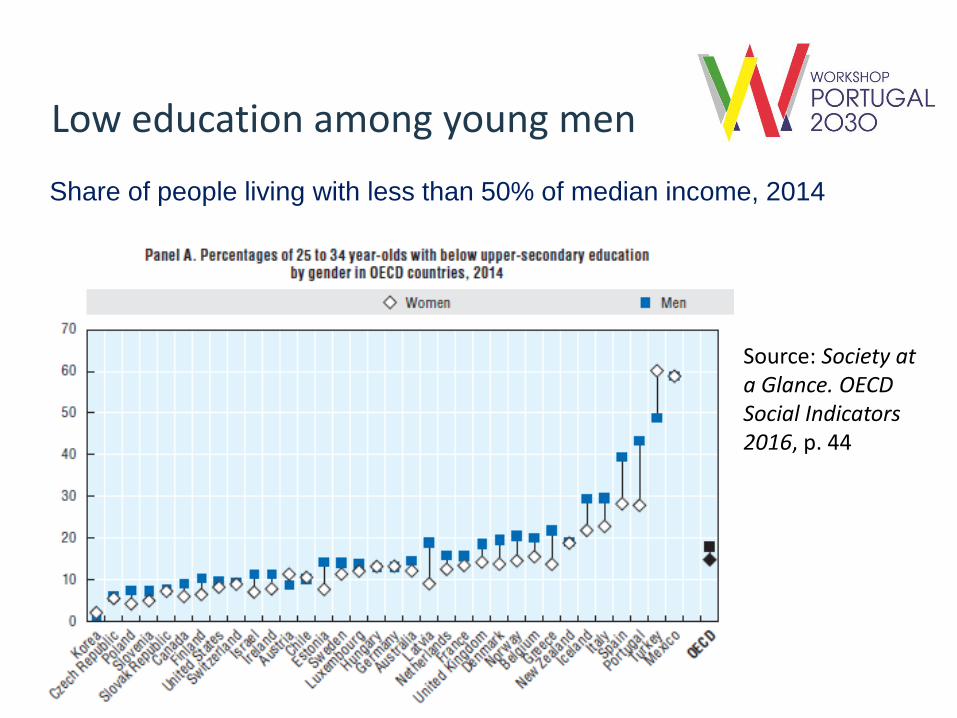
Low education among young men
Share of people living with less than 50% of median income, 2014
Source: Society at a Glance. OECD Social Indicators 2016, p. 44
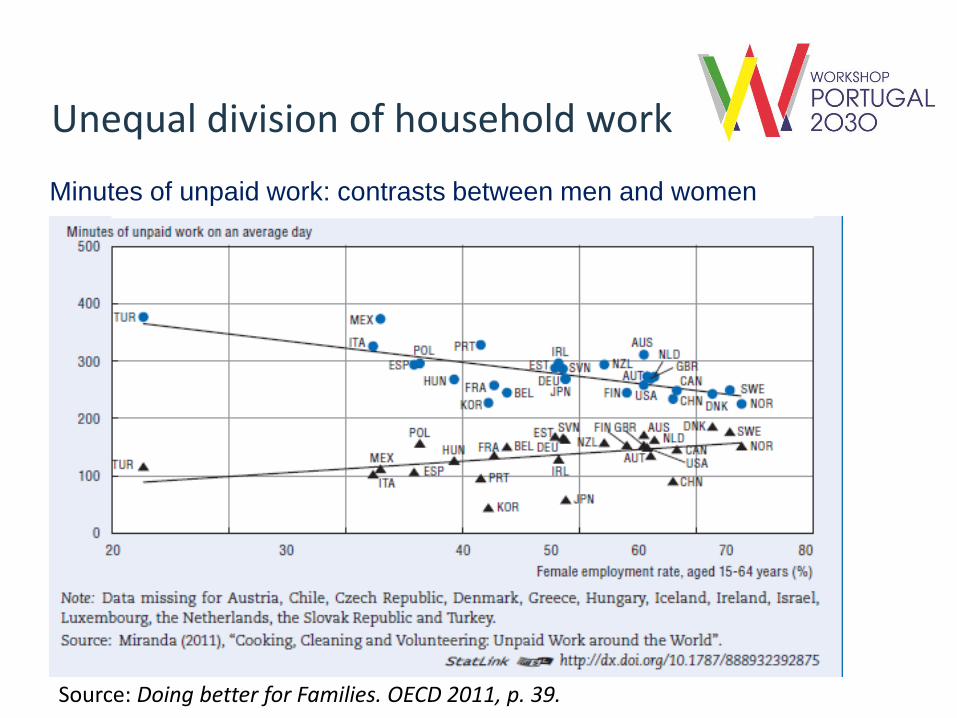
Unequal division of household work
Minutes of unpaid work: contrasts between men and women
Source: Doing better for Families. OECD 2011, p. 39.