applying lime to raise soil ph for crop production ... · buffer —material that is resistant to...
TRANSCRIPT

1
Soil acidification, or a decrease in soil pH, is a natural process that is accelerated by crop production practices, primarily the use of
nitrogen (N) fertilizers such as urea, ammonium sul-fate, or other fertilizers containing ammonium-N.
As soil acidification occurs, soil chemical and biological properties change. One chemical change is increased solubility of aluminum (Al) and man-ganese (Mn), both of which can be toxic to plants. Plants vary in their tolerance of Al and Mn, creating crop-specific soil pH requirements. Adding lime (Figure 1) increases soil pH (reduces acidity), adds calcium (Ca) and/or magnesium (Mg), and reduces the solubility of Al and Mn in the soil.
Soil pH managementThe first step is to determine the soil pH required
for your crop. The pH at which yield is diminished varies among crops. Table 1 provides minimum soil pH recommendations for western Oregon crops. Crop-specific guidance is provided in Oregon State University (OSU) and Pacific Northwest (PNW) Extension nutrient management guides. Other pub-lications in this series (Soil Acidity in Oregon and
Table 1.—Minimum soil pH values recommended for crops grown in western Oregon.a
CropMinimum
pHAlfalfa 6.5Beans and cucurbits 5.8Blueberries, rhododendrons, and azaleas 4.5Cereals or small grainsb 5.5–5.8Christmas trees 5.0Corn Grain or silage 5.5 Sweet corn 5.8Forage and seed legumes Crimson/subterranean clovers, vetchb 5.5–6.0 Red clover for forage or seed 6.0 White clover for forage or seed 5.8Garlic 6.5Hops 5.7Pasture, seed, and turf grassb 5.5–5.8Peppermint 5.6–6.0Shade, ornamental, fruit, and nut treesb, c 5.5–5.8Vegetables, brassica (broccoli, etc.) 6.3Vegetables, assorted for small acreage 6.5d
aWhen soil pH is below the minimum value, crop yields may be reduced.bRange is given, as specific minimum pH values vary among crop species.cSoil pH for red maple should not exceed 6.0.dUse this value when a small area with a variety of vegetables is produced, especially when growing garlic, onions, spinach, radish, brassicas, and greens such as lettuce and arugula.
Nicole P. Anderson, field crops Extension agent; John M. Hart, Extension soil scientist emeritus; Dan M. Sullivan, Extension soil scientist; Neil W. Christensen, professor of soil science emeritus; Donald A. Horneck, Extension agronomist; and Gene J. Pirelli, regional Extension livestock and forage specialist; all of Oregon State University.
N.P. Anderson, J.M. Hart, D.M. Sullivan, N.W. Christensen, D.A. Horneck, and G.J. Pirelli
EM 9057 • May 2013
Applying Lime to Raise Soil pH for Crop Production (Western Oregon)
Figure 1.—Lime application in Marion County, OR, about 1960.
continues on page 3
OSU
Mar
ion
Coun
ty E
xten
sion
offi
ce
arch
ives
Archival copy. For current information, see the OSU Extension Catalog: https://catalog.extension.oregonstate.edu/em9057
2
Publication summary
This publication describes how to estimate lime application rate and lists criteria for choos-ing liming materials (source), lime application method (placement), and how often to apply lime (frequency).
Lime application rate is determined using the lime requirement test (SMP buffer method). For established perennial or no-till crops, a top-dress lime application (1 to 2 t/a) may be benefi-cial. When very different soils are present within a field, variable-rate lime application is usually advantageous.
Liming materials vary in effectiveness. The carbonate in traditional aglime (calcium or mag-nesium carbonate) reacts with soil acidity to neutralize it.
Liming materials have very limited move-ment into the soil without incorporation. Tillage increases effectiveness of all lime materials by mixing them into the rooting zone.
Evaluate liming materials based on effective-ness (lime score) and cost. Calculate product cost per ton of 100-score lime.
By-product lime products can be a cost-effective substitute for traditional aglime. Their characteristics should be evaluated carefully. For certified organic crops, use only lime approved by your certification agency.
Lime application method (placement) takes two forms. Lime is either applied and left on the soil surface or incorporated. In the absence of till-age, soil pH increases only in the top inch or 2 of soil since lime’s limited solubility means that the liming material must contact acidic soil before it will react and change soil pH.
Frequency of lime application is determined primarily by cation exchange capacity (CEC) and crop management practices, especially N fertil-izer rate. Soil pH declines faster in sandy (low CEC) soils than in soil with moderate to high clay content. The typical rate of pH decline is approximately 0.1 pH unit per year when 100 lb ammonium N/a is applied.
For annual crop rotations, apply lime about a year before planting the crop that is most sensitive to soil acidity. For perennial crops, soil test and apply lime prior to tillage for crop establishment.
Related publications
This publication is the first in a three-part series. We recom-mend you use them in combination.
Soil Acidity in Oregon, EM 9061 (in press)• Discusses why soil pH management is critical to long-term
soil productivity.• Explains the mechanisms whereby acidity injures crops.• Gives historical perspective of what is known about soil
acidity problems in Oregon soils and crops.• Explains how to use soil and plant tissue testing to diagnose
soil acidity problems.Eastern Oregon Liming Guide, EM 9060• Provides recommendations for lime application for dryland
and irrigated cropping systems in eastern Oregon.
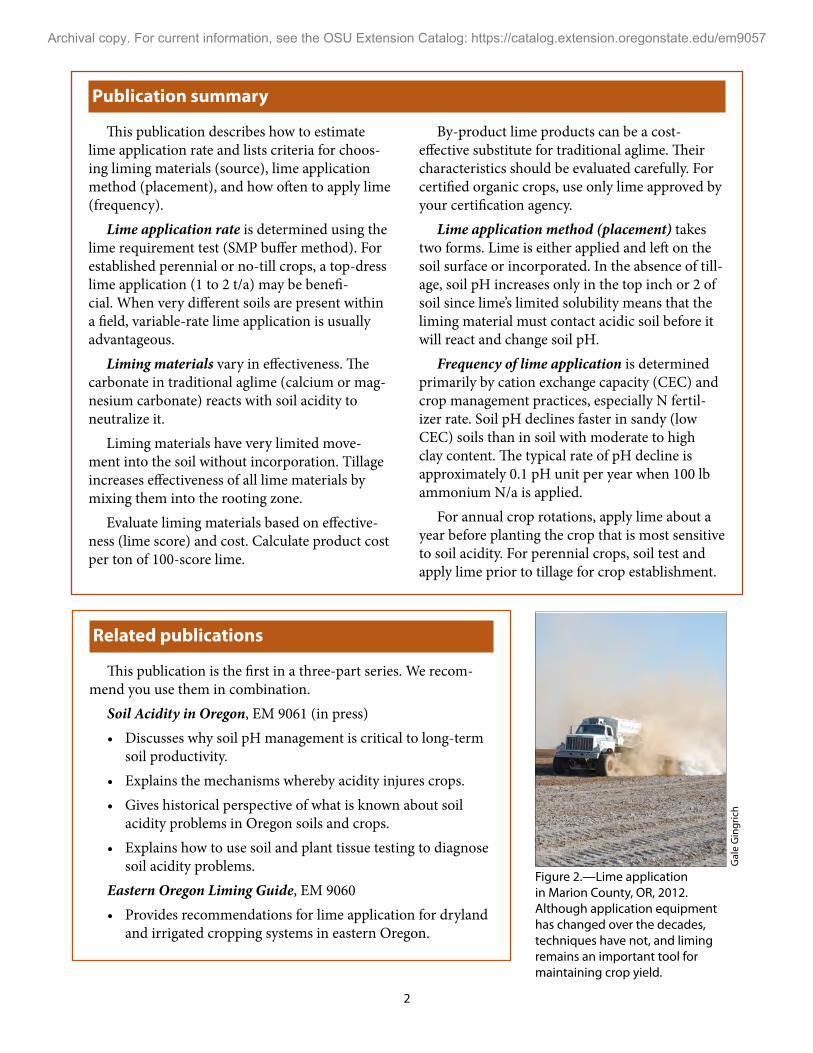
Figure 2.—Lime application in Marion County, OR, 2012. Although application equipment has changed over the decades, techniques have not, and liming remains an important tool for maintaining crop yield.
Gal
e G
ingr
ich
Archival copy. For current information, see the OSU Extension Catalog: https://catalog.extension.oregonstate.edu/em9057

3
Eastern Oregon Liming Guide) also provide target soil pH values for many Oregon crops.
Next, use soil testing to monitor soil pH and determine whether lime application is needed to achieve your target pH. Collect soil samples at the same time each year to minimize seasonal variation. For annual crops established with tillage, moni-tor soil pH in the 0- to 6-inch or 0- to 8-inch depth (also the recommended depth for other routine soil analyses).
In annual crops established without tillage, and in perennial crops, soil acidity usually is greatest (pH is lowest) near the soil surface. Therefore, a separate soil sample taken from the 0- to 2-inch depth can help in estimating lime need. See OSU Extension publication EM 9014, Evaluating Soil Nutrients and pH by Depth in Situations of Limited or No Tillage in Western Oregon, for soil sampling recommendations for perennial or no-till cropping systems.
Raising soil pH with limeSoil acidification is reversed by adding a liming
material. Liming materials are oxides, hydroxides, carbonates, and silicates of Ca and/or Mg. The anion in liming materials (chemically speaking, a “base”) reacts with soil acidity (H) to neutralize it (Figure 3).The most common liming material, “aglime,” sup-plies carbonate as the base.
Calcium alone does not increase soil pH. For example, gypsum (calcium sulfate) and other addi-tives contain Ca but do not contain a basic anion (carbonate, hydroxide, oxide, or silicate). Therefore, they do not neutralize soil acidity.
Terms used in this publication
Ion—a molecule in which the total number of electrons is not equal to the total number of protons, giving it a net charge
Cation—a positively charged ionAnion—a negatively charged ionN—nitrogen Ammoniacal N—NH4
+-NAl—aluminum Mn—manganeseCa—calcium H—hydrogenMg—magnesium K—potassiumThe cations, Al+3, Mn+2, Ca+2, Mg+2, H+, and K+ are used in this publication without charge desig-nations except when used in chemical reactions.CEC—cation exchange capacity, the sum
of cations electrostatically attracted to 100 grams of soil expressed in milliequiva-lents (meq)
Equivalent—amount of a substance that will react with 1 gram of hydrogen
Milliequivalent (meq)—1⁄1,000 of an equivalentCCE—calcium carbonate equivalentBuffer—material that is resistant to pH changeSlaked lime—calcium oxide that has been
mixed with water, creating calcium hydroxide
Prilled or pelleted lime—finely ground agri-cultural lime that has been mixed into a slurry with a water-soluble binding agent and pelletized
Figure 3.—Soil acidity reacts with lime to form water and carbon dioxide. The carbon dioxide gas is lost to the atmosphere. This chemical reaction continues until all of the lime has reacted. Figure by Dan Sullivan.
Archival copy. For current information, see the OSU Extension Catalog: https://catalog.extension.oregonstate.edu/em9057
4
Liming decisionsManagement decisions related to liming can be
grouped into four categories:• Lime application rate—how much lime is
needed to neutralize soil acidity? • Liming materials—what source of liming
material should be used?• Application method—how should lime be
applied?• Frequency of application—how often should
lime be applied?These decisions are discussed separately in this
publication, but keep in mind that they often are interrelated.
Lime application rateThe amount of lime needed is estimated by a lime
requirement test using the SMP buffer (see infor-mation below). Other lime requirement tests are offered by soil testing laboratories, but only the SMP test results have been validated by OSU Extension research for use with lime recommendation tables and figures in this publication.
As with most soil tests, the value reported using the SMP buffer is only an index; it means nothing by itself. To interpret the SMP test for lime requirement, use either Figure 5 or Table 3 (page 6). Figure 5 and Table 3 are appropriate for only a limited range of target soil pH values. Consult crop-specific OSU Extension guides for additional lime rate information.
SMP buffer test
Why the name?
The SMP buffer test is named after Shoemaker, McLean, and Pratt, the soil scientists who pub-lished the method in 1961.
Use
Lime reacts with H; therefore, the amount of both soluble and exchangeable H must be mea-sured or estimated to determine lime rate. When soil is mixed with water to measure soil pH in a laboratory, very little H is in soil solution. Most of the H is exchangeable, or electrostatically attracted to the soil particles. The SMP buffer measures H attracted to the soil particles as well as the soluble H.
Information about the SMP buffer and western Oregon soil formed from volcanic ash, such as the Sifton series, is found in Appendix C (page 20).
Accuracy
The accuracy of lime requirements estimated by the SMP test was assessed with incubation studies of western Oregon soils. The correlation between lime requirement measured by SMP and lime requirement found by adding lime to soil was acceptable. Because the SMP test is not
perfect, and because soil sampling techniques add variability, we recommend that you use SMP as a guide for lime requirement. Measuring soil pH after lime application verifies the adequacy of the lime application rate. “Lime to apply” recommen-dations given in Figure 5 and Table 3 (page 6) are usually accurate to ± 0.5 ton lime.
Future of the SMP
Since some of the chemicals used to make the SMP test are hazardous (chromium and para-nitrophenol), substitute lime requirement tests have been developed. One method, the Sikora Buffer, has recently been developed by Frank Sikora at the University of Kentucky.
Soil test data using the Sikora Buffer have been evaluated via the North American Proficiency Testing (NAPT) program for several years. In NAPT evaluations to date, lime requirement determined by Sikora and SMP buffer tests have approximately a 1:1 correlation. This result shows the two methods provide the same or very simi-lar results. The Sikora Buffer may be suitable for Oregon soils, but it has not been extensively eval-uated. Refer to the references by Sikora listed at the end of this publication for more information about the Sikora Buffer.
continues on page 6
Archival copy. For current information, see the OSU Extension Catalog: https://catalog.extension.oregonstate.edu/em9057
5
Soil CEC and liming
The amount of lime needed to increase soil pH varies with cation exchange capacity (CEC), which is a measure of cations attracted to soil particles. Soil CEC is related to a combination of factors, including soil texture, type of clay pres-ent, and soil organic matter content. As clay and organic matter content increase, CEC increases. In turn, the amount of hydrogen ions (H) that need to be neutralized by lime also increases. Thus, variation in CEC provides the basis for vari-able lime application rates.
The SMP lime requirement test was developed so that a single test can be used to make lime rec-ommendations for soils that differ substantially in CEC.
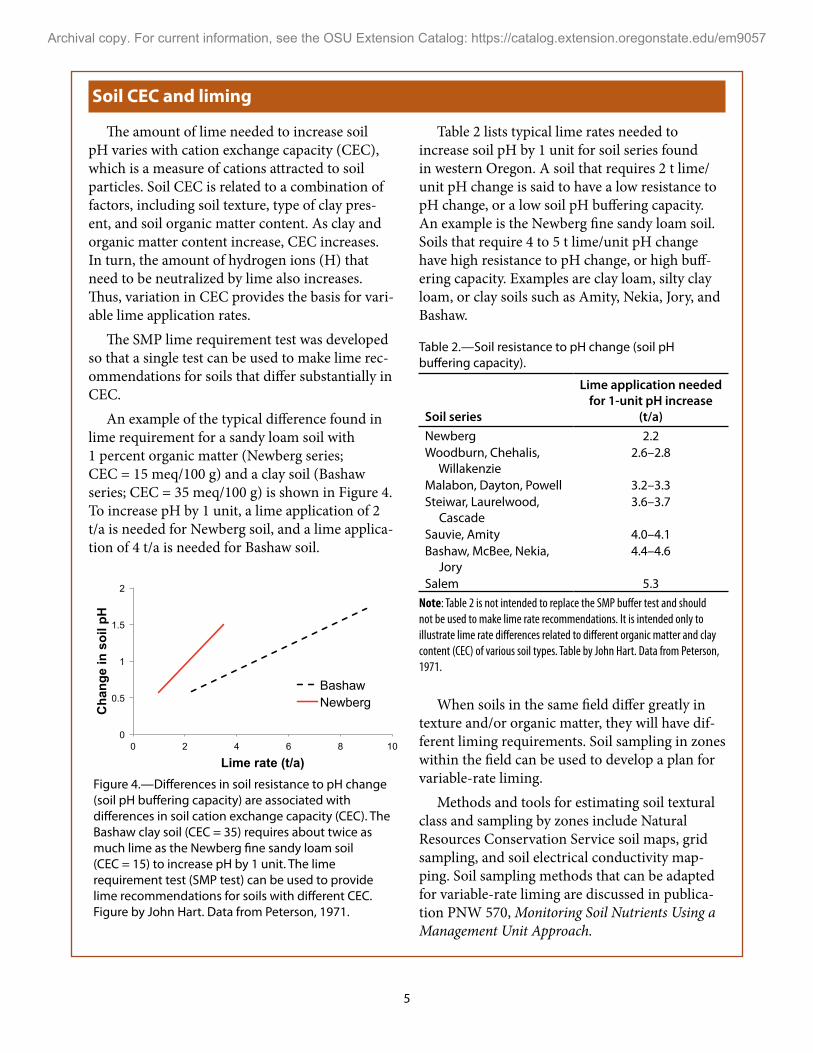
An example of the typical difference found in lime requirement for a sandy loam soil with 1 percent organic matter (Newberg series; CEC = 15 meq/100 g) and a clay soil (Bashaw series; CEC = 35 meq/100 g) is shown in Figure 4. To increase pH by 1 unit, a lime application of 2 t/a is needed for Newberg soil, and a lime applica-tion of 4 t/a is needed for Bashaw soil.
Table 2 lists typical lime rates needed to increase soil pH by 1 unit for soil series found in western Oregon. A soil that requires 2 t lime/unit pH change is said to have a low resistance to pH change, or a low soil pH buffering capacity. An example is the Newberg fine sandy loam soil. Soils that require 4 to 5 t lime/unit pH change have high resistance to pH change, or high buff-ering capacity. Examples are clay loam, silty clay loam, or clay soils such as Amity, Nekia, Jory, and Bashaw.
Table 2.—Soil resistance to pH change (soil pH buffering capacity).
Soil series
Lime application needed for 1-unit pH increase
(t/a)Newberg 2.2Woodburn, Chehalis, Willakenzie
2.6–2.8
Malabon, Dayton, Powell 3.2–3.3Steiwar, Laurelwood, Cascade
3.6–3.7
Sauvie, Amity 4.0–4.1Bashaw, McBee, Nekia, Jory
4.4–4.6
Salem 5.3Note: Table 2 is not intended to replace the SMP buffer test and should not be used to make lime rate recommendations. It is intended only to illustrate lime rate differences related to different organic matter and clay content (CEC) of various soil types. Table by John Hart. Data from Peterson, 1971.
When soils in the same field differ greatly in texture and/or organic matter, they will have dif-ferent liming requirements. Soil sampling in zones within the field can be used to develop a plan for variable-rate liming.
Methods and tools for estimating soil textural class and sampling by zones include Natural Resources Conservation Service soil maps, grid sampling, and soil electrical conductivity map-ping. Soil sampling methods that can be adapted for variable-rate liming are discussed in publica-tion PNW 570, Monitoring Soil Nutrients Using a Management Unit Approach.
0
0.5
1
1.5
2
0 2 4 6 8 10
Cha
nge
in s
oil p
H
Lime rate (t/a)
Bashaw Newberg
Figure 4.—Differences in soil resistance to pH change (soil pH buffering capacity) are associated with differences in soil cation exchange capacity (CEC). The Bashaw clay soil (CEC = 35) requires about twice as much lime as the Newberg fine sandy loam soil (CEC = 15) to increase pH by 1 unit. The lime requirement test (SMP test) can be used to provide lime recommendations for soils with different CEC. Figure by John Hart. Data from Peterson, 1971.
Archival copy. For current information, see the OSU Extension Catalog: https://catalog.extension.oregonstate.edu/em9057
6
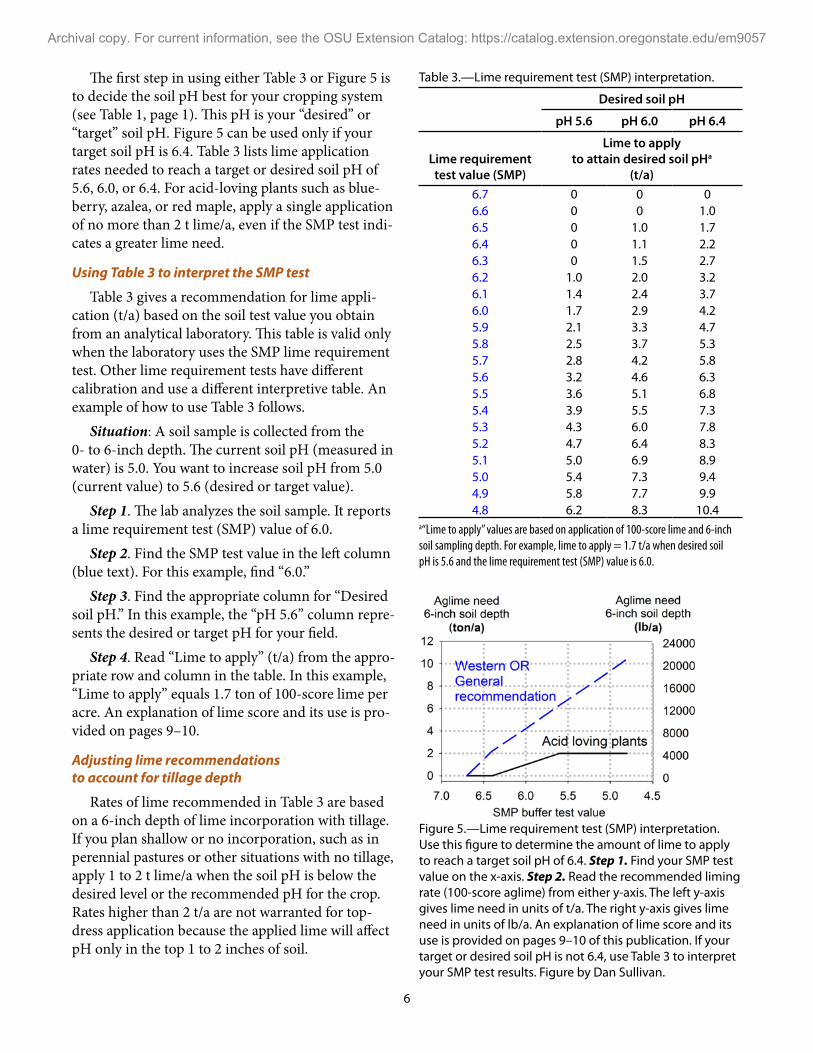
The first step in using either Table 3 or Figure 5 is to decide the soil pH best for your cropping system (see Table 1, page 1). This pH is your “desired” or “target” soil pH. Figure 5 can be used only if your target soil pH is 6.4. Table 3 lists lime application rates needed to reach a target or desired soil pH of 5.6, 6.0, or 6.4. For acid-loving plants such as blue-berry, azalea, or red maple, apply a single application of no more than 2 t lime/a, even if the SMP test indi-cates a greater lime need.
Using Table 3 to interpret the SMP test
Table 3 gives a recommendation for lime appli-cation (t/a) based on the soil test value you obtain from an analytical laboratory. This table is valid only when the laboratory uses the SMP lime requirement test. Other lime requirement tests have different calibration and use a different interpretive table. An example of how to use Table 3 follows.
Situation: A soil sample is collected from the 0- to 6-inch depth. The current soil pH (measured in water) is 5.0. You want to increase soil pH from 5.0 (current value) to 5.6 (desired or target value).
Step 1. The lab analyzes the soil sample. It reports a lime requirement test (SMP) value of 6.0.
Step 2. Find the SMP test value in the left column (blue text). For this example, find “6.0.”
Step 3. Find the appropriate column for “Desired soil pH.” In this example, the “pH 5.6” column repre-sents the desired or target pH for your field.
Step 4. Read “Lime to apply” (t/a) from the appro-priate row and column in the table. In this example, “Lime to apply” equals 1.7 ton of 100-score lime per acre. An explanation of lime score and its use is pro-vided on pages 9–10.
Adjusting lime recommendations to account for tillage depth
Rates of lime recommended in Table 3 are based on a 6-inch depth of lime incorporation with tillage. If you plan shallow or no incorporation, such as in perennial pastures or other situations with no tillage, apply 1 to 2 t lime/a when the soil pH is below the desired level or the recommended pH for the crop. Rates higher than 2 t/a are not warranted for top-dress application because the applied lime will affect pH only in the top 1 to 2 inches of soil.
Table 3.—Lime requirement test (SMP) interpretation.
Desired soil pH
pH 5.6 pH 6.0 pH 6.4
Lime requirement test value (SMP)
Lime to apply to attain desired soil pHa
(t/a)6.7 0 0 06.6 0 0 1.06.5 0 1.0 1.76.4 0 1.1 2.26.3 0 1.5 2.76.2 1.0 2.0 3.26.1 1.4 2.4 3.76.0 1.7 2.9 4.25.9 2.1 3.3 4.75.8 2.5 3.7 5.35.7 2.8 4.2 5.85.6 3.2 4.6 6.35.5 3.6 5.1 6.85.4 3.9 5.5 7.35.3 4.3 6.0 7.85.2 4.7 6.4 8.35.1 5.0 6.9 8.95.0 5.4 7.3 9.44.9 5.8 7.7 9.94.8 6.2 8.3 10.4
a“Lime to apply” values are based on application of 100-score lime and 6-inch soil sampling depth. For example, lime to apply = 1.7 t/a when desired soil pH is 5.6 and the lime requirement test (SMP) value is 6.0.
Figure 5.—Lime requirement test (SMP) interpretation. Use this figure to determine the amount of lime to apply to reach a target soil pH of 6.4. Step 1. Find your SMP test value on the x-axis. Step 2. Read the recommended liming rate (100-score aglime) from either y-axis. The left y-axis gives lime need in units of t/a. The right y-axis gives lime need in units of lb/a. An explanation of lime score and its use is provided on pages 9–10 of this publication. If your target or desired soil pH is not 6.4, use Table 3 to interpret your SMP test results. Figure by Dan Sullivan.
Archival copy. For current information, see the OSU Extension Catalog: https://catalog.extension.oregonstate.edu/em9057
7
Liming materialsAfter selecting a lime rate, the next decision is to
choose a lime material (Table 4). For most situations, choose a product that gives the most liming value (determined by lime score) per dollar (see page 10). Other factors to consider include product availabil-ity, need for Mg fertilization, desired speed of acid neutralization, and ease of application.
Liming materials are available as a powdery ground material, granule or prill, or fluid. Traditional agricultural lime (aglime, lime, ground limestone, or calcitic lime) is a finely ground mate-rial that passes through a 40-mesh sieve. It is primarily calcium carbonate.
Another mined and ground material is dolomite (dolomitic lime). In addition to calcium carbonate, it also contains magnesium carbonate. It is a common liming material for acidic soil deficient in Mg.
Calcium hydroxides and oxides (quick lime and burnt lime) are manufactured from carbonate lime. They react with acidity more rapidly than lime-stone, changing soil pH in days rather than weeks. Drawbacks of these products include cost and diffi-culty in handling and application due to their caustic nature. Their rapid reaction time also creates the potential to raise pH above the maximum value for the crop.
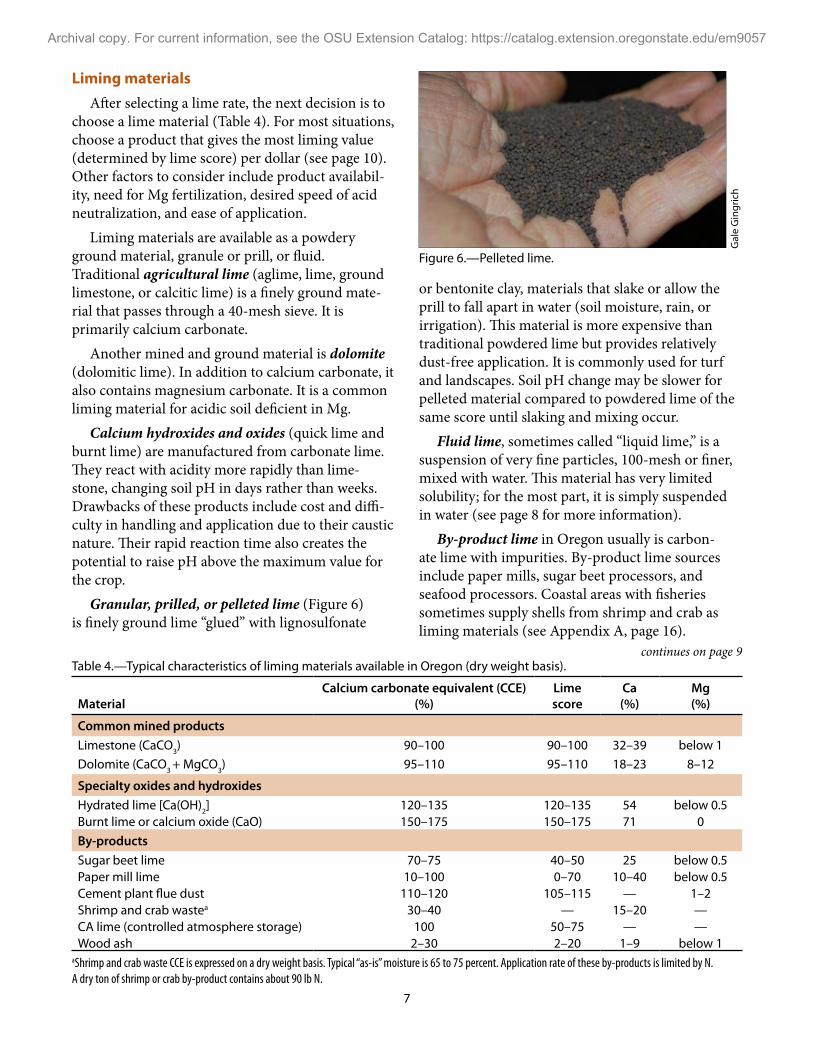
Granular, prilled, or pelleted lime (Figure 6) is finely ground lime “glued” with lignosulfonate
Table 4.—Typical characteristics of liming materials available in Oregon (dry weight basis).
MaterialCalcium carbonate equivalent (CCE)
(%)Lime score
Ca (%)
Mg (%)
Common mined productsLimestone (CaCO3) 90–100 90–100 32–39 below 1Dolomite (CaCO3 + MgCO3) 95–110 95–110 18–23 8–12
Specialty oxides and hydroxidesHydrated lime [Ca(OH)2] 120–135 120–135 54 below 0.5Burnt lime or calcium oxide (CaO) 150–175 150–175 71 0By-productsSugar beet lime 70–75 40–50 25 below 0.5Paper mill lime 10–100 0–70 10–40 below 0.5Cement plant flue dust 110–120 105–115 — 1–2Shrimp and crab wastea 30–40 — 15–20 —CA lime (controlled atmosphere storage) 100 50–75 — —Wood ash 2–30 2–20 1–9 below 1
aShrimp and crab waste CCE is expressed on a dry weight basis. Typical “as-is” moisture is 65 to 75 percent. Application rate of these by-products is limited by N. A dry ton of shrimp or crab by-product contains about 90 lb N.
or bentonite clay, materials that slake or allow the prill to fall apart in water (soil moisture, rain, or irrigation). This material is more expensive than traditional powdered lime but provides relatively dust-free application. It is commonly used for turf and landscapes. Soil pH change may be slower for pelleted material compared to powdered lime of the same score until slaking and mixing occur.
Fluid lime, sometimes called “liquid lime,” is a suspension of very fine particles, 100-mesh or finer, mixed with water. This material has very limited solubility; for the most part, it is simply suspended in water (see page 8 for more information).
By-product lime in Oregon usually is carbon-ate lime with impurities. By-product lime sources include paper mills, sugar beet processors, and seafood processors. Coastal areas with fisheries sometimes supply shells from shrimp and crab as liming materials (see Appendix A, page 16).
Figure 6.—Pelleted lime.
continues on page 9
Gal
e G
ingr
ich
Archival copy. For current information, see the OSU Extension Catalog: https://catalog.extension.oregonstate.edu/em9057
8
Fluid lime products
Fluid (liquid) lime products are marketed as alternatives to aglime. The difference between aglime (60- to 100-mesh) and fluid lime is that fluid lime particles are smaller. Cost per ton of material may be similar (e.g., $60/ton), but because of lower lime score (lime score = 60), the neutralizing power of a ton of fluid lime is about half that of a ton of aglime (lime score = 100).
Unlike other liquid fertilizer products such as UAN-32, which are water soluble, fluid lime is a suspension of fine aglime particles. Thus, unlike a soluble N fertilizer, fluid lime particles have very little ability to move into soil. Instead, they mostly stay where they were applied, usually on the soil surface.
The best use of fluid lime is pH maintenance for perennial crops where low rates of lime are needed or where traditional application equip-ment is difficult to use.
Description
• Finely ground carbonates that can be applied as a slurry
• Chemically identical to aglime• Typical lime score of 60 because of water
addition
Utility
• Can be applied evenly at low application rate (less than 1 t/a).
• Useful when very rapid soil pH increase is needed near the soil surface (i.e., the root-ing zone).
• Can be applied more easily than aglime in nonconventional situations (e.g., orchards).
Limitations
• The cost per pound of fluid lime (based on 100-score liming material) is higher than that of aglime.
• More frequent applications are needed to maintain soil pH at the desired value.
• Fluid lime will not move into the soil with water because it is a suspension, not a solution.
Aglime vs. gypsum
Both gypsum (CaSO4) and lime (CaCO3) con-tain Ca; therefore, both materials add Ca to the soil. Both materials can reduce the toxic proper-ties of soil Al. Unlike lime, however, gypsum does not neutralize soil acidity or change soil pH.
Gypsum is about 100 times more soluble than lime (Table 5). The greater solubility of gypsum allows it to move into the subsoil over the course of several years. Field trials on acidic soils with low CEC demonstrated that gypsum ameliorates the effects of subsoil acidity (e.g., reduces Al toxicity) when applied at high rates, usually 8 to 10 t/a.
Most of these studies have been conducted on highly weathered (low CEC) soils in the south-eastern United States, Hawaii, and other warm or tropical climates. Treating subsoil Al toxicity
with gypsum has not been evaluated in Oregon because subsoil acidity has not been a widespread limitation for crop production here.
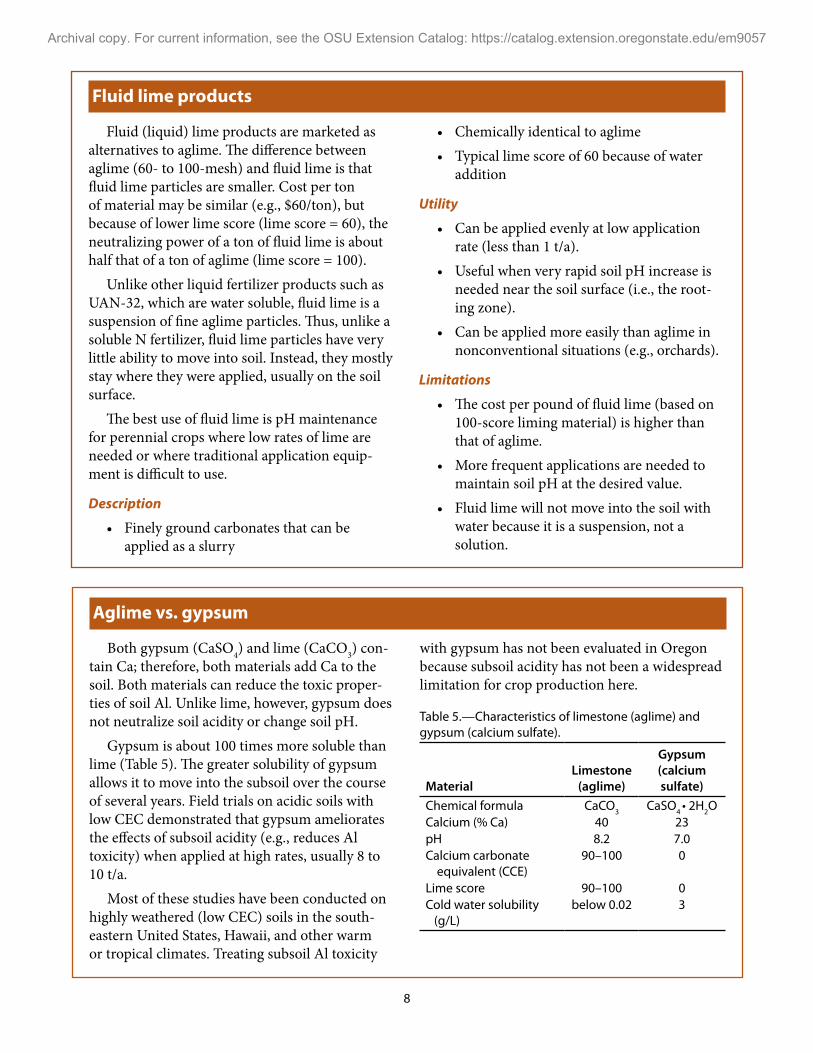
Table 5.—Characteristics of limestone (aglime) and gypsum (calcium sulfate).
MaterialLimestone
(aglime)
Gypsum (calcium sulfate)
Chemical formula CaCO3 CaSO4 • 2H2OCalcium (% Ca) 40 23pH 8.2 7.0Calcium carbonate equivalent (CCE)
90–100 0
Lime score 90–100 0Cold water solubility (g/L)
below 0.02 3
Archival copy. For current information, see the OSU Extension Catalog: https://catalog.extension.oregonstate.edu/em9057
9
Lime score
Lime score is used to adjust lime application rate based on the acid-neutralizing potential of a particu-lar product (see page 7). Lime recommendations in this and other OSU Extension publications are for 100-score lime. As lime score decreases, lime applica-tion rate must increase to obtain the same neutralizing potential as an application of 100-score material.
The quality of liming material is expressed as lime score and is defined in Oregon Administrative Rules (OAR) 603-059-0025. Lime score is a number between 0 and 125+ that combines the chemical composition (neutralizing value) or calcium carbon-ate equivalent (CCE), moisture (mf), and fineness or particle size (ff).
Calcium carbonate equivalent (CCE). Effective-ness of liming materials is expressed relative to pure, dry calcium carbonate (lime score = 100). Because some liming materials are more effective than cal-cium carbonate per unit dry weight, they may have a lime score greater than 100. Table 4 (page 7) gives CCE for common liming materials found in Oregon.
Moisture factor (mf). This factor is a correction for the amount of water in a liming material. Calcitic and dolomitic liming materials stored in a covered area usually contain less than 5 percent moisture. Some by-product materials may contain more than 20 percent moisture.
Lime for certified organic farming
When choosing lime products for certified organic farming, consult with your organic certification agency to con-firm National Organic Program (NOP) compliance. Mined agricultural lime-stone, dolomitic lime, oyster shell lime, and other nonsynthetic liming materi-als generally are allowed under NOP certification. To be an effective liming material, oyster shells must be ground to the same size as traditional mined cal-citic or dolomitic limestone.
Hydrated lime or slaked lime is con-sidered a “synthetic” liming material and is prohibited under NOP certification.
Fineness factor (ff). Fineness of a liming mate-rial is a factor governing the rate of reaction or soil pH increase. Liming materials have very low water solubility. The neutralizing reaction occurs when the surface of lime particles contacts soil and water. As the surface area of a liming material increases, so does the potential for a neutralizing reaction to occur. Fine material has a large surface area, so its rate of reaction with soil acidity is higher than that of a coarser material. Particle size determina-tion is made for products registered by the Oregon Department of Agriculture (ODA). Coarse particles reduce lime score. (See Appendix B, page 19, for ODA contact information.)
Fineness of a liming material is measured by the amount of material passing through mesh screens or sieves. The screen mesh or sieve size is the number of wires in a 1-inch length of screen. The larger the number of the mesh or sieve size, the more wires per inch, resulting in smaller holes. For example, a 20-mesh screen contains 400 openings per square inch, and the openings are 0.03 inch on a side. A 60-mesh screen contains 900 openings per square inch, and the openings are 0.0098 inch on a side.
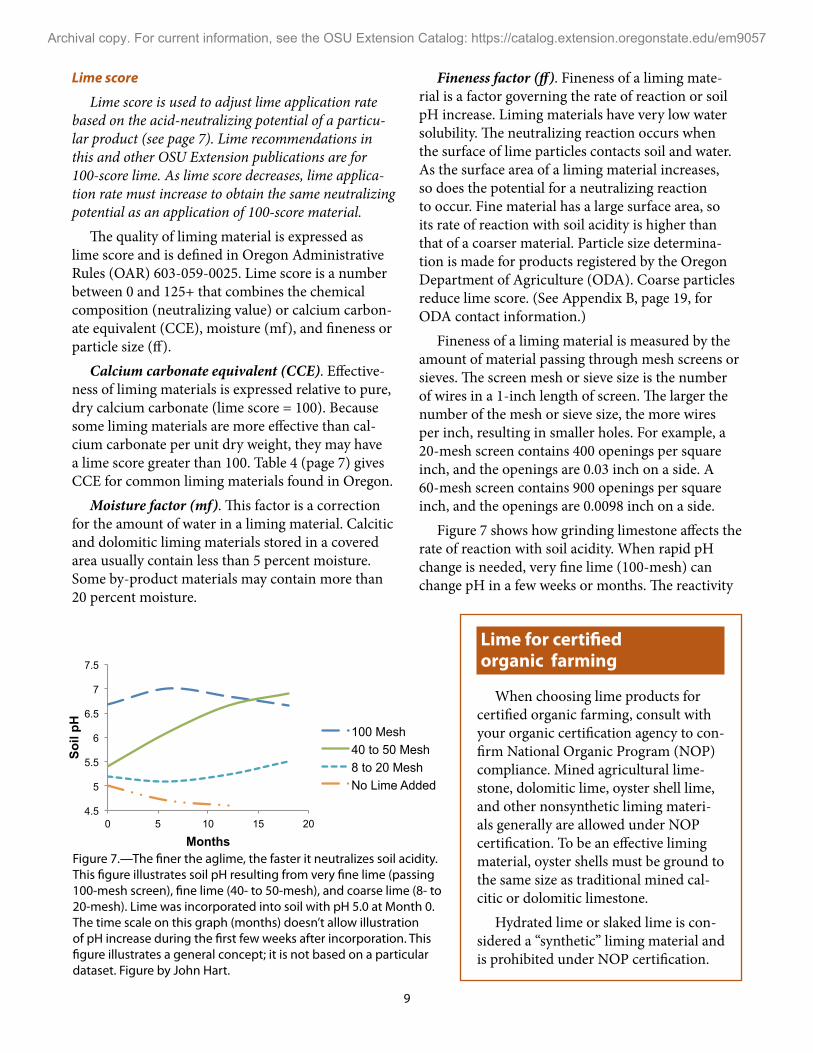
Figure 7 shows how grinding limestone affects the rate of reaction with soil acidity. When rapid pH change is needed, very fine lime (100-mesh) can change pH in a few weeks or months. The reactivity
4.5
5
5.5
6
6.5
7
7.5
0 5 10 15 20
Soil
pH
Months
100 Mesh 40 to 50 Mesh 8 to 20 Mesh No Lime Added
Figure 7.—The finer the aglime, the faster it neutralizes soil acidity. This figure illustrates soil pH resulting from very fine lime (passing 100-mesh screen), fine lime (40- to 50-mesh), and coarse lime (8- to 20-mesh). Lime was incorporated into soil with pH 5.0 at Month 0. The time scale on this graph (months) doesn’t allow illustration of pH increase during the first few weeks after incorporation. This figure illustrates a general concept; it is not based on a particular dataset. Figure by John Hart.
Archival copy. For current information, see the OSU Extension Catalog: https://catalog.extension.oregonstate.edu/em9057
10
rate does not increase greatly for particle sizes smaller than 100-mesh. Many particles present in aglime are about 40- to 50-mesh. These particles require about a year for complete reaction, but a measurable change in soil pH usually occurs within a few months of application. Coarse particles (8- to 20-mesh) react very slowly.
A mix of particle size is desirable in liming mate-rials. While fine particles are useful for rapidly increasing soil pH, coarser particles react for a year or more to maintain soil pH.
Calculating lime score
Lime score is calculated by multiplying these three factors as shown below.
Lime score = CCE × mf × ffwhere:
CCE = calcium carbonate equivalent (pure calcium carbonate = 100)
mf = moisture factor (0 to 1; dry lime = 1) ff = particle size fineness factor (0 to 1; based
on screening lime to determine particle size distribution)
Example: A liming material has the following analysis:
Calcium carbonate equivalent (CCE) = 92Moisture factor (mf) = 0.85Fineness factor (ff) = 0.88
This material has a lime score of 69, calculated as:Lime score = CCE × mf × ff = 92 × 0.85 × 0.88= 69
Using lime score to adjust application rates and compare costs
The lime score of a liming material is used to determine application rate, given a target application rate of 100-score lime. Example: A paper mill lime product has lime score of 70. To deliver the equivalent of 1 t/a of 100-score lime, 1.4 t/a of paper mill lime is needed, as shown below:
Liming product rate needed: = (Desired rate of 100-score lime) × 100 ÷
( product lime score)= 1 t/a × 100 ÷ 70= 1.4 t paper mill lime/a
Application cost for products can be compared using lime score. Example: An application rate of 1 t/a of 100-score lime is needed. We use the per-ton cost and the application rate to compare the per-acre cost of two materials: 100-score aglime (at a cost of $65/t) and a 70-score by-product material (at a cost of $40/t).
Cost of material for 100-score lime (1 t/a):= rate × cost/t= 1 t/a of 100-score lime × $65/t= $65/a
Cost of material for 70-score lime (to supply equiva-lent of 1 t/a of 100-score lime):= rate × cost/t= 1.4 t/a of 70-score lime × $40/t= $56/a
Method of lime applicationRegardless of whether it is powdered, prilled, or
fluid, lime is usually applied to the soil surface and either left on the surface or incorporated. In the absence of tillage, soil pH increases only in the top inch or 2 of soil since the limited solubility of lime means that the liming material must contact acidic soil before it will react and change soil pH.
Top-dressing
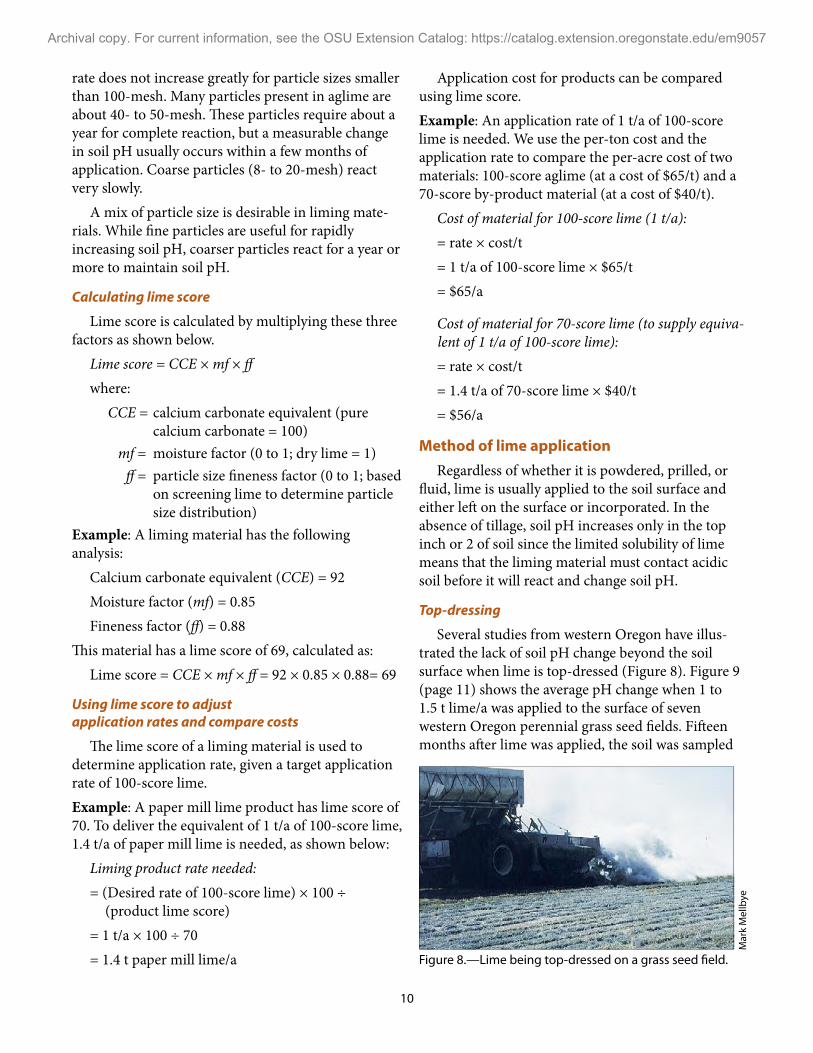
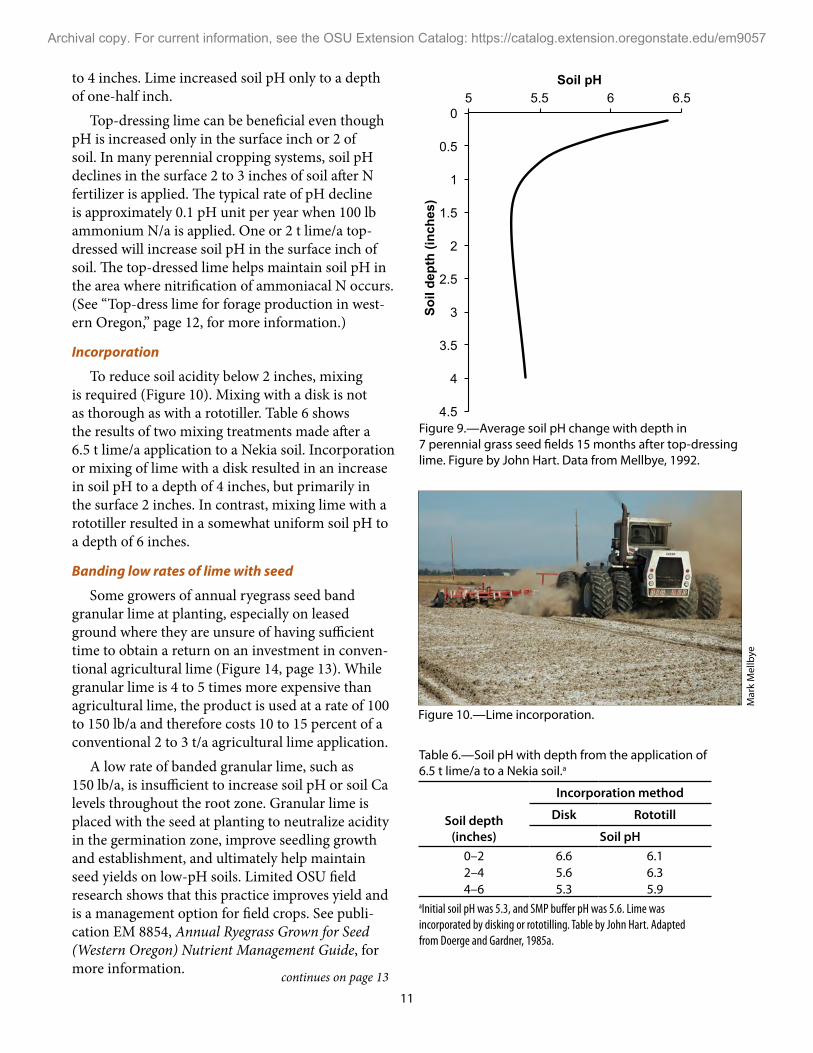
Several studies from western Oregon have illus-trated the lack of soil pH change beyond the soil surface when lime is top-dressed (Figure 8). Figure 9 (page 11) shows the average pH change when 1 to 1.5 t lime/a was applied to the surface of seven western Oregon perennial grass seed fields. Fifteen months after lime was applied, the soil was sampled
Figure 8.—Lime being top-dressed on a grass seed field.
Mar
k M
ellb
ye
Archival copy. For current information, see the OSU Extension Catalog: https://catalog.extension.oregonstate.edu/em9057
11
to 4 inches. Lime increased soil pH only to a depth of one-half inch.
Top-dressing lime can be beneficial even though pH is increased only in the surface inch or 2 of soil. In many perennial cropping systems, soil pH declines in the surface 2 to 3 inches of soil after N fertilizer is applied. The typical rate of pH decline is approximately 0.1 pH unit per year when 100 lb ammonium N/a is applied. One or 2 t lime/a top-dressed will increase soil pH in the surface inch of soil. The top-dressed lime helps maintain soil pH in the area where nitrification of ammoniacal N occurs. (See “Top-dress lime for forage production in west-ern Oregon,” page 12, for more information.)
Incorporation
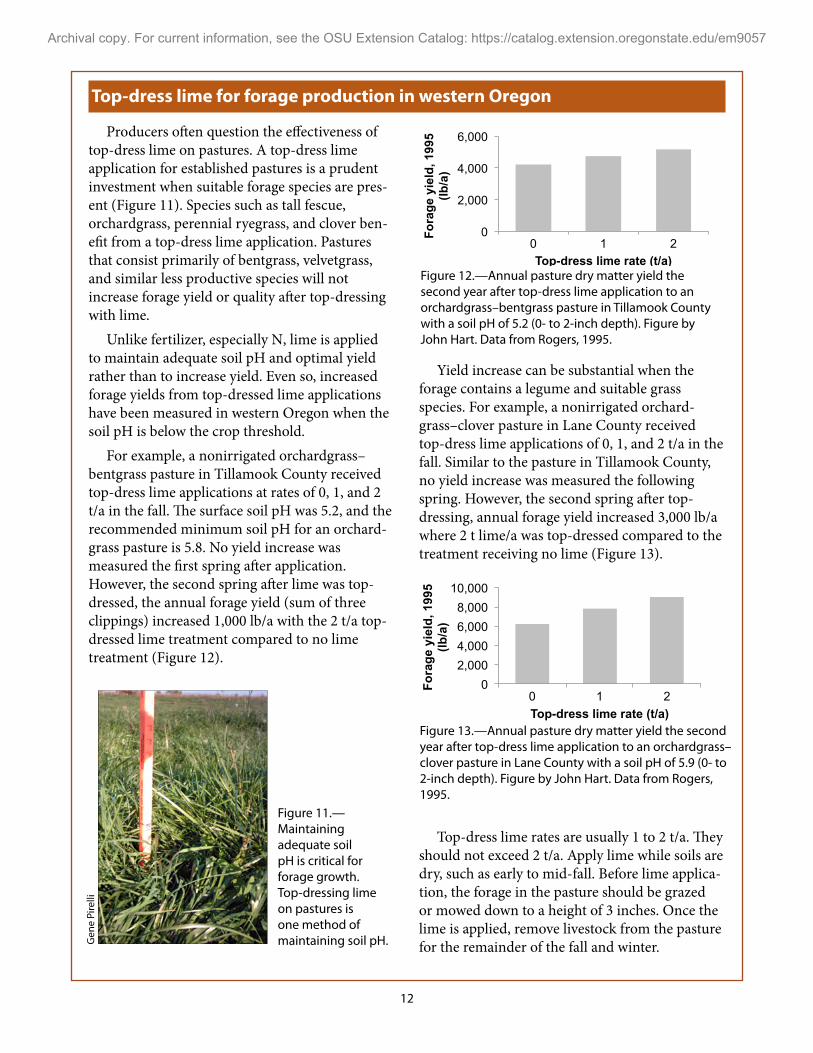
To reduce soil acidity below 2 inches, mixing is required (Figure 10). Mixing with a disk is not as thorough as with a rototiller. Table 6 shows the results of two mixing treatments made after a 6.5 t lime/a application to a Nekia soil. Incorporation or mixing of lime with a disk resulted in an increase in soil pH to a depth of 4 inches, but primarily in the surface 2 inches. In contrast, mixing lime with a rototiller resulted in a somewhat uniform soil pH to a depth of 6 inches.
Banding low rates of lime with seed
Some growers of annual ryegrass seed band granular lime at planting, especially on leased ground where they are unsure of having sufficient time to obtain a return on an investment in conven-tional agricultural lime (Figure 14, page 13). While granular lime is 4 to 5 times more expensive than agricultural lime, the product is used at a rate of 100 to 150 lb/a and therefore costs 10 to 15 percent of a conventional 2 to 3 t/a agricultural lime application.
A low rate of banded granular lime, such as 150 lb/a, is insufficient to increase soil pH or soil Ca levels throughout the root zone. Granular lime is placed with the seed at planting to neutralize acidity in the germination zone, improve seedling growth and establishment, and ultimately help maintain seed yields on low-pH soils. Limited OSU field research shows that this practice improves yield and is a management option for field crops. See publi-cation EM 8854, Annual Ryegrass Grown for Seed (Western Oregon) Nutrient Management Guide, for more information.
0
0.5
1
1.5
2
2.5
3
3.5
4
4.5
5 5.5 6 6.5
Soil
dept
h (in
ches
)
Soil pH
Table 6.—Soil pH with depth from the application of 6.5 t lime/a to a Nekia soil.a
Soil depth (inches)
Incorporation method
Disk Rototill
Soil pH0–2 6.6 6.12–4 5.6 6.34–6 5.3 5.9
aInitial soil pH was 5.3, and SMP buffer pH was 5.6. Lime was incorporated by disking or ro totilling. Table by John Hart. Adapted from Doerge and Gardner, 1985a.
Figure 9.—Average soil pH change with depth in 7 perennial grass seed fields 15 months after top-dressing lime. Figure by John Hart. Data from Mellbye, 1992.
continues on page 13
Figure 10.—Lime incorporation.
Mar
k M
ellb
ye
Archival copy. For current information, see the OSU Extension Catalog: https://catalog.extension.oregonstate.edu/em9057
12
Top-dress lime for forage production in western Oregon
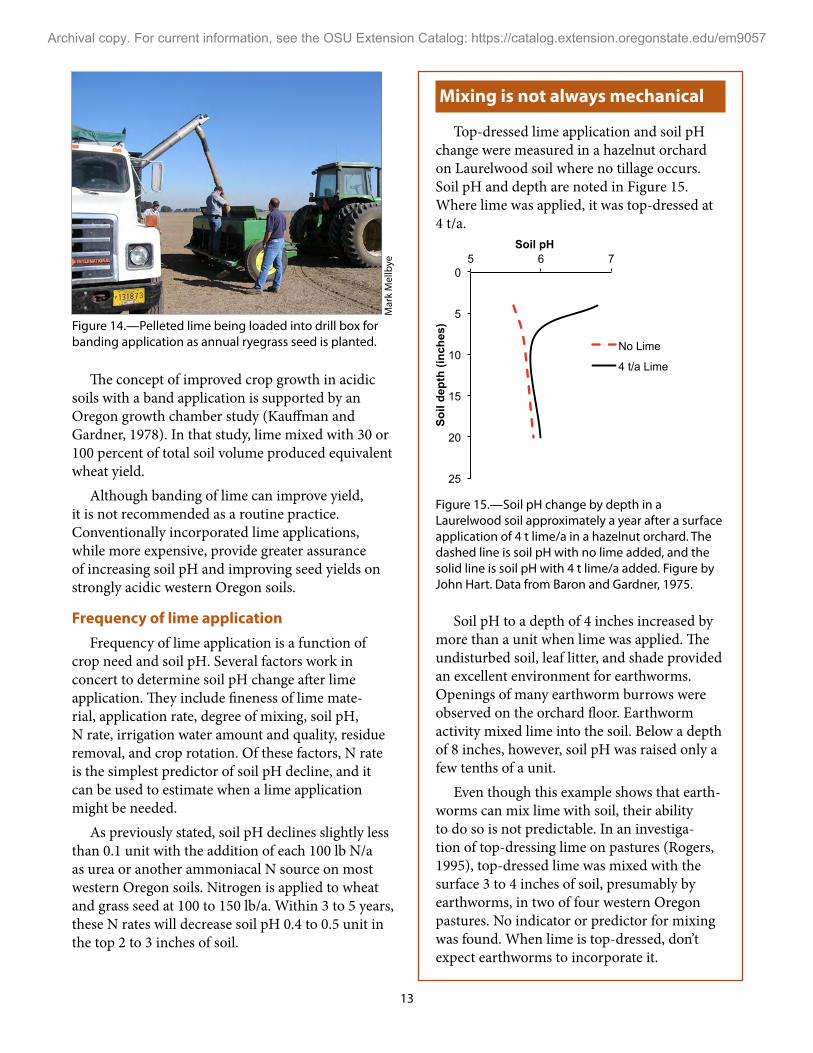
Producers often question the effectiveness of top-dress lime on pastures. A top-dress lime application for established pastures is a prudent investment when suitable forage species are pres-ent (Figure 11). Species such as tall fescue, orchardgrass, perennial ryegrass, and clover ben-efit from a top-dress lime application. Pastures that consist primarily of bentgrass, velvetgrass, and similar less productive species will not increase forage yield or quality after top-dressing with lime.
Unlike fertilizer, especially N, lime is applied to maintain adequate soil pH and optimal yield rather than to increase yield. Even so, increased forage yields from top-dressed lime applications have been measured in western Oregon when the soil pH is below the crop threshold.
For example, a nonirrigated orchardgrass–bentgrass pasture in Tillamook County received top-dress lime applications at rates of 0, 1, and 2 t/a in the fall. The surface soil pH was 5.2, and the recommended minimum soil pH for an orchard-grass pasture is 5.8. No yield increase was measured the first spring after application. However, the second spring after lime was top-dressed, the annual forage yield (sum of three clippings) increased 1,000 lb/a with the 2 t/a top-dressed lime treatment compared to no lime treatment (Figure 12).
Yield increase can be substantial when the forage contains a legume and suitable grass species. For example, a nonirrigated orchard-grass–clover pasture in Lane County received top-dress lime applications of 0, 1, and 2 t/a in the fall. Similar to the pasture in Tillamook County, no yield increase was measured the following spring. However, the second spring after top-dressing, annual forage yield increased 3,000 lb/a where 2 t lime/a was top-dressed compared to the treatment receiving no lime (Figure 13).
0 2,000 4,000 6,000 8,000
10,000
0 1 2
Fora
ge y
ield
, 199
5 (lb
/a)
Top-dress lime rate (t/a)
Top-dress lime rates are usually 1 to 2 t/a. They should not exceed 2 t/a. Apply lime while soils are dry, such as early to mid-fall. Before lime applica-tion, the forage in the pasture should be grazed or mowed down to a height of 3 inches. Once the lime is applied, remove livestock from the pasture for the remainder of the fall and winter.
0
2,000
4,000
6,000
0 1 2
Fora
ge y
ield
, 199
5
(lb/a
)
Top-dress lime rate (t/a) Figure 12.—Annual pasture dry matter yield the second year after top-dress lime application to an orchardgrass–bentgrass pasture in Tillamook County with a soil pH of 5.2 (0- to 2-inch depth). Figure by John Hart. Data from Rogers, 1995.
Figure 11.—Maintaining adequate soil pH is critical for forage growth. Top-dressing lime on pastures is one method of maintaining soil pH. G
ene
Pire
lli
Figure 13.—Annual pasture dry matter yield the second year after top-dress lime application to an orchardgrass–clover pasture in Lane County with a soil pH of 5.9 (0- to 2-inch depth). Figure by John Hart. Data from Rogers, 1995.
Archival copy. For current information, see the OSU Extension Catalog: https://catalog.extension.oregonstate.edu/em9057
13
The concept of improved crop growth in acidic soils with a band application is supported by an Oregon growth chamber study (Kauffman and Gardner, 1978). In that study, lime mixed with 30 or 100 percent of total soil volume produced equivalent wheat yield.
Although banding of lime can improve yield, it is not recommended as a routine practice. Conventionally incorporated lime applications, while more expensive, provide greater assurance of increasing soil pH and improving seed yields on strongly acidic western Oregon soils.
Frequency of lime applicationFrequency of lime application is a function of
crop need and soil pH. Several factors work in concert to determine soil pH change after lime application. They include fineness of lime mate-rial, application rate, degree of mixing, soil pH, N rate, irrigation water amount and quality, residue removal, and crop rotation. Of these factors, N rate is the simplest predictor of soil pH decline, and it can be used to estimate when a lime application might be needed.
As previously stated, soil pH declines slightly less than 0.1 unit with the addition of each 100 lb N/a as urea or another ammoniacal N source on most western Oregon soils. Nitrogen is applied to wheat and grass seed at 100 to 150 lb/a. Within 3 to 5 years, these N rates will decrease soil pH 0.4 to 0.5 unit in the top 2 to 3 inches of soil.
Mixing is not always mechanical
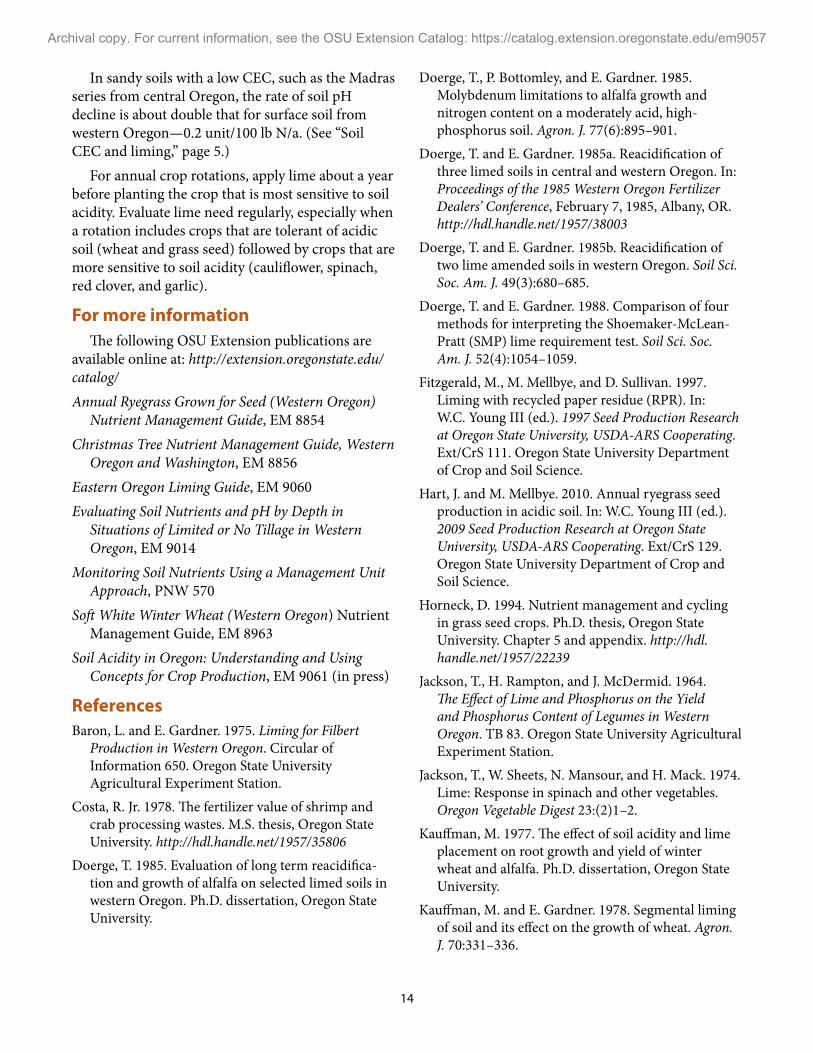
Top-dressed lime application and soil pH change were measured in a hazelnut orchard on Laurelwood soil where no tillage occurs. Soil pH and depth are noted in Figure 15. Where lime was applied, it was top-dressed at 4 t/a.
0
5
10
15
20
25
5 6 7
Soil
dept
h (in
ches
)
Soil pH
No Lime
4 t/a Lime
Figure 15.—Soil pH change by depth in a Laurelwood soil approximately a year after a surface application of 4 t lime/a in a hazelnut orchard. The dashed line is soil pH with no lime added, and the solid line is soil pH with 4 t lime/a added. Figure by John Hart. Data from Baron and Gardner, 1975.
Soil pH to a depth of 4 inches increased by more than a unit when lime was applied. The undisturbed soil, leaf litter, and shade provided an excellent environment for earthworms. Openings of many earthworm burrows were observed on the orchard floor. Earthworm activity mixed lime into the soil. Below a depth of 8 inches, however, soil pH was raised only a few tenths of a unit.
Even though this example shows that earth-worms can mix lime with soil, their ability to do so is not predictable. In an investiga-tion of top-dressing lime on pastures (Rogers, 1995), top-dressed lime was mixed with the surface 3 to 4 inches of soil, presumably by earthworms, in two of four western Oregon pastures. No indicator or predictor for mixing was found. When lime is top-dressed, don’t expect earthworms to incorporate it.
Figure 14.—Pelleted lime being loaded into drill box for banding application as annual ryegrass seed is planted.
Mar
k M
ellb
ye
Archival copy. For current information, see the OSU Extension Catalog: https://catalog.extension.oregonstate.edu/em9057
14
In sandy soils with a low CEC, such as the Madras series from central Oregon, the rate of soil pH decline is about double that for surface soil from western Oregon—0.2 unit/100 lb N/a. (See “Soil CEC and liming,” page 5.)
For annual crop rotations, apply lime about a year before planting the crop that is most sensitive to soil acidity. Evaluate lime need regularly, especially when a rotation includes crops that are tolerant of acidic soil (wheat and grass seed) followed by crops that are more sensitive to soil acidity (cauliflower, spinach, red clover, and garlic).
For more informationThe following OSU Extension publications are
available online at: http://extension.oregonstate.edu/catalog/Annual Ryegrass Grown for Seed (Western Oregon)
Nutrient Management Guide, EM 8854Christmas Tree Nutrient Management Guide, Western
Oregon and Washington, EM 8856Eastern Oregon Liming Guide, EM 9060Evaluating Soil Nutrients and pH by Depth in
Situations of Limited or No Tillage in Western Oregon, EM 9014
Monitoring Soil Nutrients Using a Management Unit Approach, PNW 570
Soft White Winter Wheat (Western Oregon) Nutrient Management Guide, EM 8963
Soil Acidity in Oregon: Understanding and Using Concepts for Crop Production, EM 9061 (in press)
ReferencesBaron, L. and E. Gardner. 1975. Liming for Filbert
Production in Western Oregon. Circular of Information 650. Oregon State University Agricultural Experiment Station.
Costa, R. Jr. 1978. The fertilizer value of shrimp and crab processing wastes. M.S. thesis, Oregon State University. http://hdl.handle.net/1957/35806
Doerge, T. 1985. Evaluation of long term reacidifica-tion and growth of alfalfa on selected limed soils in western Oregon. Ph.D. dissertation, Oregon State University.
Doerge, T., P. Bottomley, and E. Gardner. 1985. Molybdenum limitations to alfalfa growth and nitrogen content on a moderately acid, high- phosphorus soil. Agron. J. 77(6):895–901.
Doerge, T. and E. Gardner. 1985a. Reacidification of three limed soils in central and western Oregon. In: Proceedings of the 1985 Western Oregon Fertilizer Dealers’ Conference, February 7, 1985, Albany, OR. http://hdl.handle.net/1957/38003
Doerge, T. and E. Gardner. 1985b. Reacidification of two lime amended soils in western Oregon. Soil Sci. Soc. Am. J. 49(3):680–685.
Doerge, T. and E. Gardner. 1988. Comparison of four methods for interpreting the Shoemaker-McLean-Pratt (SMP) lime requirement test. Soil Sci. Soc. Am. J. 52(4):1054–1059.
Fitzgerald, M., M. Mellbye, and D. Sullivan. 1997.Liming with recycled paper residue (RPR). In: W.C. Young III (ed.). 1997 Seed Production Research at Oregon State University, USDA-ARS Cooperating. Ext/CrS 111. Oregon State University Department of Crop and Soil Science.
Hart, J. and M. Mellbye. 2010. Annual ryegrass seed production in acidic soil. In: W.C. Young III (ed.). 2009 Seed Production Research at Oregon State University, USDA-ARS Cooperating. Ext/CrS 129. Oregon State University Department of Crop and Soil Science.
Horneck, D. 1994. Nutrient management and cycling in grass seed crops. Ph.D. thesis, Oregon State University. Chapter 5 and appendix. http://hdl.handle.net/1957/22239
Jackson, T., H. Rampton, and J. McDermid. 1964. The Effect of Lime and Phosphorus on the Yield and Phosphorus Content of Legumes in Western Oregon. TB 83. Oregon State University Agricultural Experiment Station.
Jackson, T., W. Sheets, N. Mansour, and H. Mack. 1974. Lime: Response in spinach and other vegetables.Oregon Vegetable Digest 23:(2)1–2.
Kauffman, M. 1977. The effect of soil acidity and lime placement on root growth and yield of winter wheat and alfalfa. Ph.D. dissertation, Oregon State University.
Kauffman, M. and E. Gardner. 1978. Segmental liming of soil and its effect on the growth of wheat. Agron. J. 70:331–336.
Archival copy. For current information, see the OSU Extension Catalog: https://catalog.extension.oregonstate.edu/em9057

15
Mellbye, M. 1988. The effect of surface liming on soil pH and calcium. Handout, Soil Acidity and Liming Symposium, Oregon State University, Corvallis.
Mellbye, M. 1992. Surface limed soil—six years later. OSU Extension Update (Linn County), Vol. XI, No. 9, p. 6. http://hdl.handle.net/1957/38002
Mellbye, M. 1996. Effect of recycled paper residue soil amendment (RPR) on ryegrass seed yields. In: W.C. Young III (ed.). 1996 Seed Production Research at Oregon State University, USDA-ARS Cooperating. Ext/CrS 110. Oregon State University Department of Crop and Soil Science.
Myer, R. 1999. Agricultural Use of Wood Ash in California. Publication 21573. University of California.
Peterson, P. 1971. Liming requirement of selected Willamette Valley soils. M.S. thesis, Oregon State University. http://hdl.handle.net/1957/35805
Rogers, J. 1995. The effect of top-dressed lime upon pasture production and quality. M.S. thesis, Oregon State University. http://hdl.handle.net/1957/18986
Sikora, F. 2006. A buffer that mimics the SMP buffer for determining lime requirement of soil. Soil Sci. Soc. Am. J. 70:474–486.
Sikora, F. 2007. Replacing SMP Buffer with Sikora Buffer for Determining Lime Requirement of Soil. Publication 6. SERA IEG-6 (USDA-NIFA multistate group). http://soils.rs.uky.edu/sikora_smptechreport.htm
Stevens, G., D. Dunn, and B. Phipps. 2001. How to diagnose soil acidity and alkalinity problems in crops: A comparison of soil pH test kits. J. of Extension. http://www.joe.org/joe/2001august/tt3.php
Stevens, G., A. Wrather, H. Wilson, and D. Dunn. 2002. Soil sampling fields with four types of probes. Crop Management. doi:10.1094/CM-2002-1025-01-RS
Young, W. III, M. Mellbye, G. Gingrich, T. Silberstein, T. Chastain, and J. Hart. 2000. Defining optimum nitrogen fertilization practices for grass seed production systems in the Willamette Valley. In: W.C. Young III (ed.). 2000 Seed Production Research at Oregon State University, USDA-ARS Cooperating. Ext/CrS 115. Oregon State University Department of Crop and Soil Science.
Archival copy. For current information, see the OSU Extension Catalog: https://catalog.extension.oregonstate.edu/em9057
16
What are by-products?By-product lime products are derived from
industrial processes such as paper manufacturing, refining sugar beets, or processing shrimp and crab. By-product lime products may be sold and applied by agrichemical (fertilizer) dealers, or they may be managed by a third party land application contractor who works for the by-product generator (factory or mill).
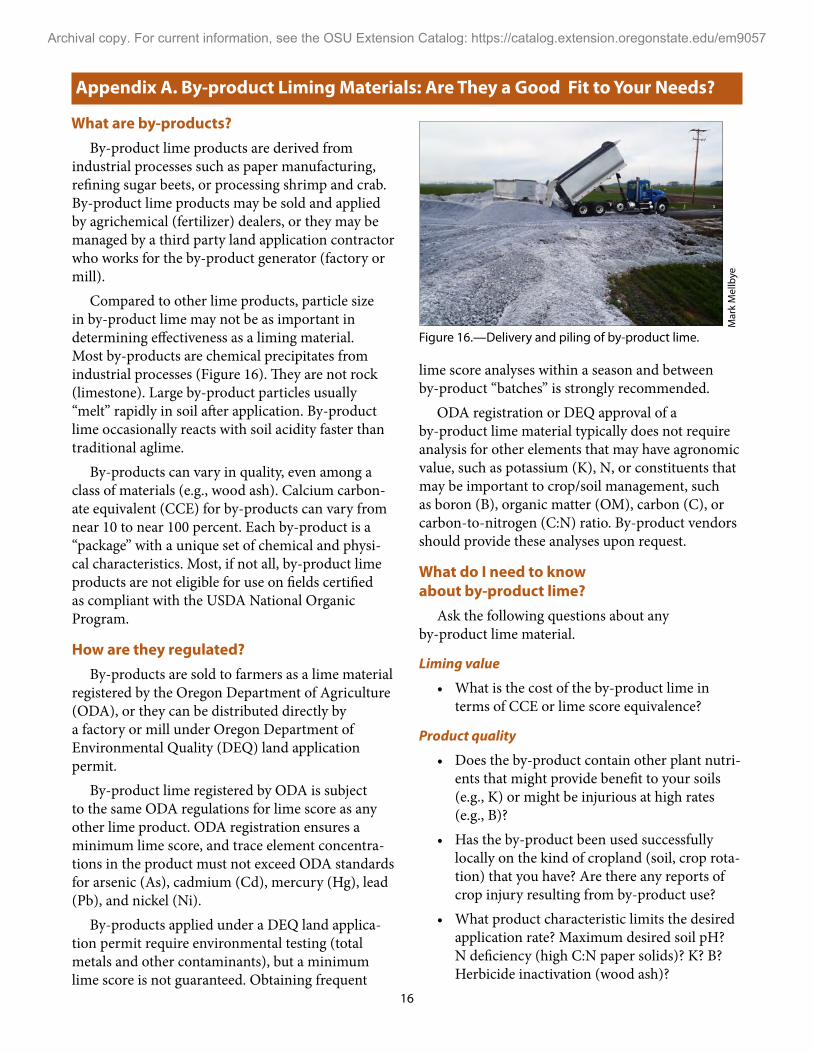
Compared to other lime products, particle size in by-product lime may not be as important in determining effectiveness as a liming material. Most by-products are chemical precipitates from industrial processes (Figure 16). They are not rock (limestone). Large by-product particles usually “melt” rapidly in soil after application. By-product lime occasionally reacts with soil acidity faster than traditional aglime.
By-products can vary in quality, even among a class of materials (e.g., wood ash). Calcium carbon-ate equivalent (CCE) for by-products can vary from near 10 to near 100 percent. Each by-product is a “package” with a unique set of chemical and physi-cal characteristics. Most, if not all, by-product lime products are not eligible for use on fields certified as compliant with the USDA National Organic Program.
How are they regulated?By-products are sold to farmers as a lime material
registered by the Oregon Department of Agriculture (ODA), or they can be distributed directly by a factory or mill under Oregon Department of Environmental Quality (DEQ) land application permit.
By-product lime registered by ODA is subject to the same ODA regulations for lime score as any other lime product. ODA registration ensures a minimum lime score, and trace element concentra-tions in the product must not exceed ODA standards for arsenic (As), cadmium (Cd), mercury (Hg), lead (Pb), and nickel (Ni).
By-products applied under a DEQ land applica-tion permit require environmental testing (total metals and other contaminants), but a minimum lime score is not guaranteed. Obtaining frequent
Appendix A. By-product Liming Materials: Are They a Good Fit to Your Needs?
lime score analyses within a season and between by-product “batches” is strongly recommended.
ODA registration or DEQ approval of a by-product lime material typically does not require analysis for other elements that may have agronomic value, such as potassium (K), N, or constituents that may be important to crop/soil management, such as boron (B), organic matter (OM), carbon (C), or carbon-to-nitrogen (C:N) ratio. By-product vendors should provide these analyses upon request.
What do I need to know about by-product lime?
Ask the following questions about any by-product lime material.
Liming value
• What is the cost of the by-product lime in terms of CCE or lime score equivalence?
Product quality
• Does the by-product contain other plant nutri-ents that might provide benefit to your soils (e.g., K) or might be injurious at high rates (e.g., B)?
• Has the by-product been used successfully locally on the kind of cropland (soil, crop rota-tion) that you have? Are there any reports of crop injury resulting from by-product use?
• What product characteristic limits the desired application rate? Maximum desired soil pH? N deficiency (high C:N paper solids)? K? B? Herbicide inactivation (wood ash)?
Figure 16.—Delivery and piling of by-product lime.
Mar
k M
ellb
ye
Archival copy. For current information, see the OSU Extension Catalog: https://catalog.extension.oregonstate.edu/em9057
17
Logistics• How much flexibility will you have in the
timing of by-product application?• What is the minimum application rate for the
by-product, using available equipment, and how much 100-score lime is supplied at the minimum application rate?
• What additional management practices might be necessary after application?
Lime by-products in OregonNot all by-products are created equal. The most
common lime by-products used in Oregon can be grouped into three general categories:
• High-CCE products derived from quick lime (calcium hydroxide)
• Wood ash• Paper clarifier solids High-CCE products derived from “quick lime”
(calcium hydroxide) are the most useful liming by-products. They have CCE greater than 40 percent. Examples include sugar beet lime and other materi-als derived from precipitated quick lime. Quick lime is used in industrial processes such as paper making and sugar refining to achieve a high pH (12). The recovered lime from these factory processes con-sists mainly of carbonates (same active ingredient as aglime).
Beet lime and other high-value by-products are usually purchased from the factory by fertilizer dealerships and then custom applied to farm fields. These products are a reliable lime source. No signifi-cant product quality issues have been reported.
Wood ash (from hog fuel boilers or biomass-to-energy facilities) is available across the state. This product has a lime score of 2 to 20. Wood ash can vary considerably in composition and utility. Although called wood ash, it can contain residues of other materials that are burned together with forest by-products.
Some ash acts like low-grade activated charcoal, binding soil-active herbicides and making them inef-fective in killing weeds. Burn temperature affects this property, known as herbicide sorption.
Chemical composition of ash varies depending on the origin of the ash within a facility. The highest
concentration of trace element contaminants such as arsenic (As) and B are usually found in fly ash (from smokestack scrubbers).
Because of the nonuniformity and unpredict-ability of ash characteristics, caution is warranted when using wood ash. We recommend that you obtain a complete analysis, consult with those having experience with the ash, and evaluate product perfor-mance on limited acreage before using it for routine application.
Paper clarifier solids, sometimes called “paper sludge,” are a mixture of wood fiber, carbonates derived from quick lime, and inert materials. It is col-lected in settling basins (clarifiers) at mills producing cardboard or other paper products. The more wood fiber present, the lower the lime score. CCE is usually 10 to 20 percent. The organic matter content in paper solids (cellulose) is similar to that found in straw, and paper fiber has a high C:N ratio (greater than 100:1). Herbicide sorption (from added organic matter) has not been reported following paper solids application.
The major management problem related to paper solids application is providing sufficient and properly timed N for the first crop after application. As paper fiber decomposes in soil, the microbes performing decomposition compete with the crop for N. During the first growing season after paper solids application, extra N fertilizer is needed to compensate for N con-sumed by the decomposition process.
Because paper fiber degrades slowly, extra N fertilizer application is usually required in both fall and spring when growing fall-seeded winter annual crops such as annual ryegrass (for seed). Even with supplemental N fertilizer application, a reduction in first-year seed yield can occur because the timing of N availability to the grass seed crop is altered by the decomposing paper solids.
Microbial activity differs between fields and crop years; therefore, the decomposition rate of paper clar-ifier solids varies. Furthermore, each factory source of paper solids is unique in its rate of decomposition and its need for supplemental N fertilizer.
University field research to support appropriate N fertilizer recommendations following paper clari-fier solids application is generally lacking. In most cases, N fertilizer rate and timing are based on grower experience. A single-year trial on Woodburn soil, with oats, determined that 1 to 3 lb N (from fertilizer)
Archival copy. For current information, see the OSU Extension Catalog: https://catalog.extension.oregonstate.edu/em9057
18
was needed per dry ton of paper solids to compen-sate for N immobilization (Fasth and Karow, 1994, unpublished). In the second growing season after application, a paper solids application had no effect on grass seed crop N uptake (Fitzgerald et al., 1997).
High rates of paper solids application can be det-rimental to crop establishment on poorly drained soils because the paper solids increase the water-holding capacity of soil. This problem has been most evident in fields without drainage tile where the
water table is at the surface for extended periods in winter and spring.
Meadowfoam seems to be especially susceptible to stand loss in this situation. Some portions of annual ryegrass fields also had little or no seedling emergence, sometimes accompanied by a red slime on the soil surface. Red slime was an iron-reducing bacteria that flourished in anaerobic soil (without oxygen) containing large quantities of organic matter (from the paper solids).
Archival copy. For current information, see the OSU Extension Catalog: https://catalog.extension.oregonstate.edu/em9057
19
Oregon Department of Agriculture (ODA)
The ODA Fertilizer Program inspects and registers lime products distributed in Oregon. Lime products must be registered with ODA before they can be distributed in Oregon. Lime products are monitored and regulated to provide:
• Uniform and accurate product labeling• Assurance, through sampling and analysis, that
products provide the nutrients and other ben-efits claimed
• Protection for Oregon’s environment and natural resources from heavy metals and other contaminants
Appendix B. State Regulation of Liming Products
For questions about lime product regulation in Oregon, please contact:
Oregon Department of Agriculture Fertilizer Program
635 Capitol Street NESalem, OR 97301-2532Phone: 503-986-4635Fax: 503-986-4735http://www.oregon.gov/ODA/PEST/Pages/fertilizer.
aspxOregon Department of Environmental Quality (DEQ)
In addition to ODA, lime by-products derived from industrial manufacturing processes may be regulated by either the DEQ Solid Waste Division or the DEQ Water Quality Division. Lime by-products derived from an industry’s wastewater treatment system (e.g., clarifier solids) are regulated by the Water Quality Division. Lime by-products derived from other industrial processes (e.g., wood ash resulting from combustion of wood chips in a boiler) are regulated by the Solid Waste Division.
Archival copy. For current information, see the OSU Extension Catalog: https://catalog.extension.oregonstate.edu/em9057
20
Even though the SMP test measures many more times the H concentration than do soil pH tests, the SMP value is usually only about 0.8 unit higher than soil pH. The higher value for the SMP measurements results from the 7.5 pH of the solution.
The typical difference between soil pH and SMP buffer pH is not seen in some soils, such as the Sifton series. The difference between soil pH and SMP buffer pH for this soil can be as small as 0.2 unit, and sometimes the buffer pH is lower than soil pH. Other soil series formed in mixtures of volcanic ash, such as the Parkdale and associated soils in the Hood River Valley, may behave similarly.
The relationship between soil pH and SMP buffer pH for the Sifton soil does not indicate that the SMP test inadequately measures lime need. This soil’s mineralogy differs from other western Oregon soils.
Appendix C. Considerations for Soils with Volcanic Ash in Parent Material
This difference increases both buffer capacity and lime requirement. The recommended rate of lime in Table 3 (page 6) is not economical. Use a lower rate of lime than that recommended by Table 3, con-centrate it with limited mixing (shallow rather than deep disking), and monitor soil pH after application.
A small area of Sifton soils is found in Columbia, Multnomah, and Lane counties. The largest area, approximately 5,500 acres, is located in Marion County on high terraces in the Stayton Basin and along Mill Creek between Turner and Salem.
Sifton soils formed in gravelly alluvium contain-ing volcanic ash in the upper part. They have a thick, black gravelly loam A horizon over dark brown grav-elly loam subsoil.
Archival copy. For current information, see the OSU Extension Catalog: https://catalog.extension.oregonstate.edu/em9057
21
© 2013 Oregon State University. Extension work is a cooperative program of Oregon State University, the U.S. Department of Agriculture, and Oregon coun-ties. Oregon State University Extension Service offers educational programs, activities, and materials without discrimination based on age, color, disability, gender identity or expression, genetic information, marital status, national origin, race, religion, sex, sexual orientation, or veteran’s status. Oregon State University Extension Service is an Equal Opportunity Employer.
Published May 2013. This publication replaces OSU Extension publication FG 52, Fertilizer and Lime Materials Fertilizer Guide.
AcknowledgmentsWe appreciate careful and thoughtful review
comments for this publication from Sam Angima, Oregon State University; Gerard Birkhauser, Washington State University; Tabitha Brown, Washington State University; Craig Cogger, Washington State University; Brian Cruickshank, Wilco; William Fasth, Brown and Caldwell; Melissa Fery, Oregon State University; Matt Haynes, Oregon Department of Agriculture; Tom Miller, Fitzmaurice Fertilizer; Joe Moade, Crop Production Services; Steve Salisbury, Wilbur-Ellis Company; Eric Shumaker, Wilbur-Ellis Company; and Donald Wysocki, Oregon State University.
The authors thank Mark Mellbye for his contribu-tions to this publication. In addition to photos, some of the data Mark collected about soil pH manage-ment in western Oregon grass seed cropping systems during his tenure as an OSU Extension agent is used in this publication.
We thank Gale Gingrich, OSU area Extension agronomist emeritus, for supplying photos.
Photos: All photos copyright Oregon State University.
Archival copy. For current information, see the OSU Extension Catalog: https://catalog.extension.oregonstate.edu/em9057