applied spectroscopy in pulsed power...
TRANSCRIPT
Applied spectroscopy in pulsed power plasmasa…
G. A. Rochau,1,b� J. E. Bailey,1 and Y. Maron2
1Sandia National Laboratories, Albuquerque, New Mexico 87185-1196, USA2Faculty of Physics, Weizmann Institute of Science, Rehovot 76100, Israel
�Received 20 November 2009; accepted 14 December 2009; published online 11 March 2010�
Applied spectroscopy is a powerful diagnostic tool for high energy density plasmas produced withmodern pulsed power facilities. These facilities create unique plasma environments with a broadrange of electron densities �1013–1023 cm−3� and temperatures �100–103 eV� immersed in strongmagnetic ��100 T� and electric �up to 1 GV/m� fields. This paper surveys the application of plasmaspectroscopy to diagnose a variety of plasma conditions generated by pulsed power sourcesincluding: magnetic field penetration into plasma, measuring the time-dependent spatial distributionof 1 GV/m electric fields, opacity measurements approaching stellar interior conditions,characteristics of a radiating shock propagating at 330 km/s, and determination of plasma conditionsin imploded capsule cores at 150 Mbar pressures. These applications provide insight intofundamental properties of nature in addition to their importance for addressing challenging pulsedpower science problems. © 2010 American Institute of Physics. �doi:10.1063/1.3309722�
I. INTRODUCTION
The conditions and environment of a plasma affect theionization state of the constituent elements, the bound atomicenergy states, and the distribution of electrons among thebound states. Observing electron transitions between thebound energy states �recording either emission or absorptionspectra� provides a measure of the ionization and bound en-ergy state distributions that can be used to infer the plasmaconditions. The information encoded in the measured spectracan include the plasma composition, electron temperature,ion temperature, electron density, ion velocity, and electricand magnetic field strengths. Thus, detailed spectroscopicdata can, in principle, provide a wealth of information. De-coding this information requires line intensity, line shape,and line position analysis through the comparison of the re-corded spectra with synthetic spectra computed from themodern theories of atoms in plasmas. Accurate determinationof plasma conditions from recorded spectra therefore de-pends on the accuracy of atomic theory, the theory of atomsin plasma, and the coupling of these theories with radiationtransport.
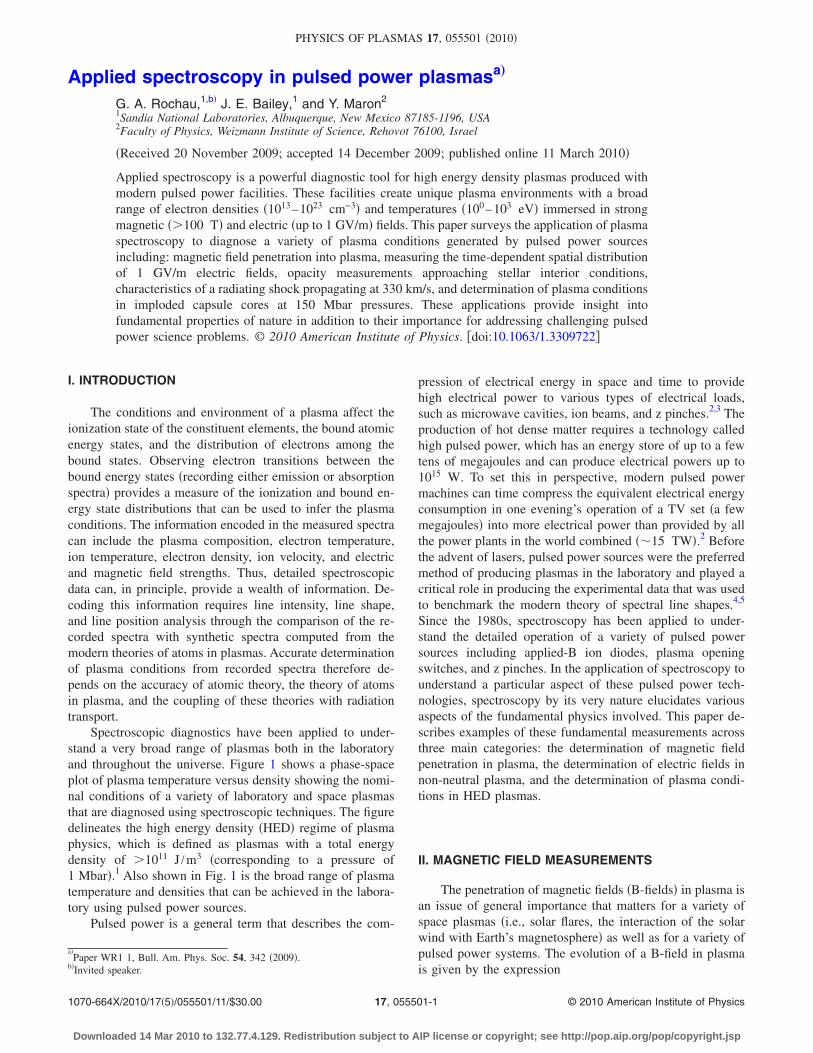
Spectroscopic diagnostics have been applied to under-stand a very broad range of plasmas both in the laboratoryand throughout the universe. Figure 1 shows a phase-spaceplot of plasma temperature versus density showing the nomi-nal conditions of a variety of laboratory and space plasmasthat are diagnosed using spectroscopic techniques. The figuredelineates the high energy density �HED� regime of plasmaphysics, which is defined as plasmas with a total energydensity of �1011 J /m3 �corresponding to a pressure of1 Mbar�.1 Also shown in Fig. 1 is the broad range of plasmatemperature and densities that can be achieved in the labora-tory using pulsed power sources.
Pulsed power is a general term that describes the com-
pression of electrical energy in space and time to providehigh electrical power to various types of electrical loads,such as microwave cavities, ion beams, and z pinches.2,3 Theproduction of hot dense matter requires a technology calledhigh pulsed power, which has an energy store of up to a fewtens of megajoules and can produce electrical powers up to1015 W. To set this in perspective, modern pulsed powermachines can time compress the equivalent electrical energyconsumption in one evening’s operation of a TV set �a fewmegajoules� into more electrical power than provided by allthe power plants in the world combined ��15 TW�.2 Beforethe advent of lasers, pulsed power sources were the preferredmethod of producing plasmas in the laboratory and played acritical role in producing the experimental data that was usedto benchmark the modern theory of spectral line shapes.4,5
Since the 1980s, spectroscopy has been applied to under-stand the detailed operation of a variety of pulsed powersources including applied-B ion diodes, plasma openingswitches, and z pinches. In the application of spectroscopy tounderstand a particular aspect of these pulsed power tech-nologies, spectroscopy by its very nature elucidates variousaspects of the fundamental physics involved. This paper de-scribes examples of these fundamental measurements acrossthree main categories: the determination of magnetic fieldpenetration in plasma, the determination of electric fields innon-neutral plasma, and the determination of plasma condi-tions in HED plasmas.
II. MAGNETIC FIELD MEASUREMENTS
The penetration of magnetic fields �B-fields� in plasma isan issue of general importance that matters for a variety ofspace plasmas �i.e., solar flares, the interaction of the solarwind with Earth’s magnetosphere� as well as for a variety ofpulsed power systems. The evolution of a B-field in plasmais given by the expression
a�Paper WR1 1, Bull. Am. Phys. Soc. 54, 342 �2009�.
b�Invited speaker.
PHYSICS OF PLASMAS 17, 055501 �2010�
1070-664X/2010/17�5�/055501/11/$30.00 © 2010 American Institute of Physics17, 055501-1
Downloaded 14 Mar 2010 to 132.77.4.129. Redistribution subject to AIP license or copyright; see http://pop.aip.org/pop/copyright.jsp
dB
dt=
�
�0�2B − � � � J � B
ene� + � � �vi � B� , �1�
where B is the magnetic field vector, J is the current, vi is theion velocity, ne is the electron density, e is the electroncharge, � is the plasma resistivity, and �0 is the permeabilityof free space. The right hand side of Eq. �1� has three terms:The first is the diffusion term, the second is the Hall term,and the third is the convection term. Any of these terms candominate the B-field evolution depending on the conditionsof the plasma and can be influenced by both spatial varia-tions in the plasma properties and instabilities. Understand-ing the process that dominates in a particular plasma requiresdetermining the speed of the B-field penetration and/or theB-field distribution.
Zeeman splitting is the most commonly used spectro-scopic method for B-field measurements. In Zeeman split-ting, an external B-field interacts with the total orbital angu-lar momentum of the various energy states in the atomthrough the magnetic moment, which is quantum mechani-cally described by the quantum number M. Under the influ-ence of the B-field, the bound energy states shift by anamount proportional to the product of the quantum numberM with the magnetic field strength. When electrons transitionfrom these split energy levels, one observes a splitting of thespectral line proportional to the strength of the B-field. Oneimportant aspect of these Zeeman split components is thatthey come in two different polarizations. Those transitionswith no change in M between the upper and lower levels arelinearly polarized �the � components� resulting from electricdipole oscillations along the B-field direction. Those transi-tions with a change in M of �1 are circularly polarized �the� components� resulting from oscillations perpendicular tothe B-field direction. Observations made along the B-fielddirection will therefore only include the � components,which are more affected by the magnetic field.
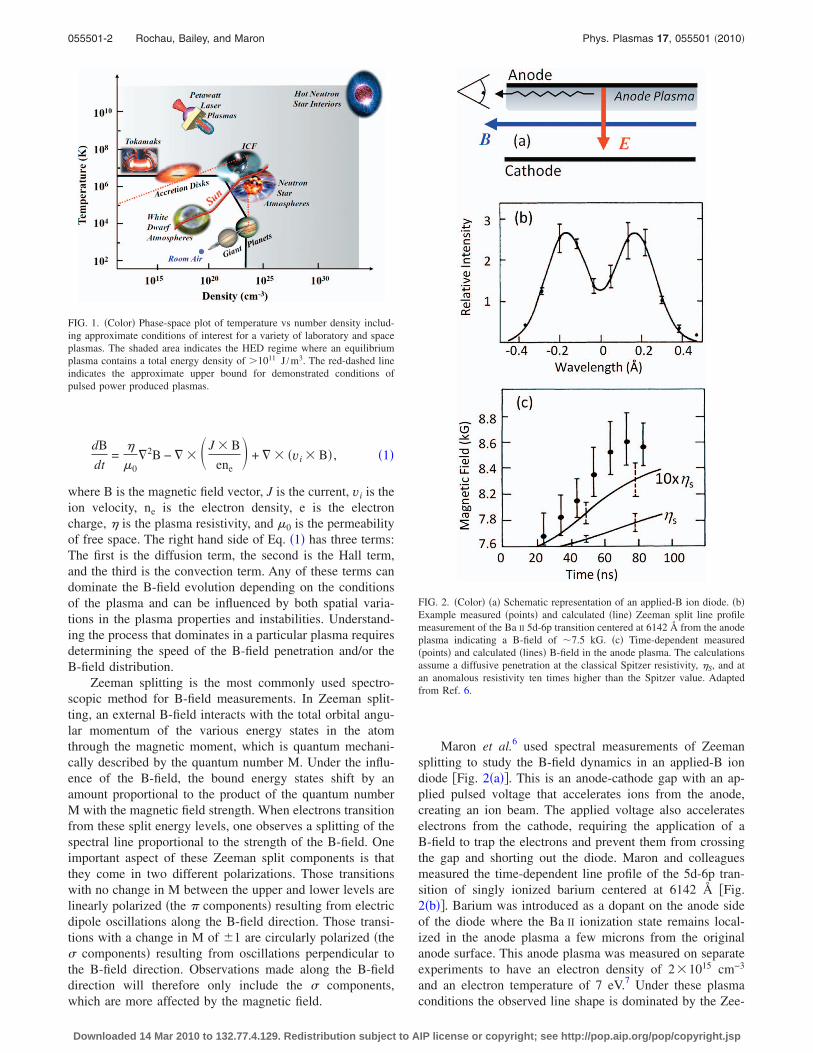
Maron et al.6 used spectral measurements of Zeemansplitting to study the B-field dynamics in an applied-B iondiode �Fig. 2�a��. This is an anode-cathode gap with an ap-plied pulsed voltage that accelerates ions from the anode,creating an ion beam. The applied voltage also accelerateselectrons from the cathode, requiring the application of aB-field to trap the electrons and prevent them from crossingthe gap and shorting out the diode. Maron and colleaguesmeasured the time-dependent line profile of the 5d-6p tran-sition of singly ionized barium centered at 6142 Å �Fig.2�b��. Barium was introduced as a dopant on the anode sideof the diode where the Ba II ionization state remains local-ized in the anode plasma a few microns from the originalanode surface. This anode plasma was measured on separateexperiments to have an electron density of 2�1015 cm−3
and an electron temperature of 7 eV.7 Under these plasmaconditions the observed line shape is dominated by the Zee-
FIG. 1. �Color� Phase-space plot of temperature vs number density includ-ing approximate conditions of interest for a variety of laboratory and spaceplasmas. The shaded area indicates the HED regime where an equilibriumplasma contains a total energy density of �1011 J /m3. The red-dashed lineindicates the approximate upper bound for demonstrated conditions ofpulsed power produced plasmas.
FIG. 2. �Color� �a� Schematic representation of an applied-B ion diode. �b�Example measured �points� and calculated �line� Zeeman split line profilemeasurement of the Ba II 5d-6p transition centered at 6142 Å from the anodeplasma indicating a B-field of �7.5 kG. �c� Time-dependent measured�points� and calculated �lines� B-field in the anode plasma. The calculationsassume a diffusive penetration at the classical Spitzer resistivity, �S, and atan anomalous resistivity ten times higher than the Spitzer value. Adaptedfrom Ref. 6.
055501-2 Rochau, Bailey, and Maron Phys. Plasmas 17, 055501 �2010�
Downloaded 14 Mar 2010 to 132.77.4.129. Redistribution subject to AIP license or copyright; see http://pop.aip.org/pop/copyright.jsp
man splitting. Several mechanisms can influence spectralline profiles so determining their relative impact is an impor-tant consideration when using line shapes for plasma diag-nostics. The measurements are made along the direction ofthe applied magnetic field so that only the � line componentsare observed, resulting in a measured line profile that is sym-metrically split by a relative amount that depends on theB-field strength. Figure 2�c� shows the time-dependentB-field within a few microns of the original anode surface.The field is observed to increase over the applied 7.6 kG.This increase is caused by E�B drifting electrons, whichcreate a diamagnetic field that decreases the field strengthnear the cathode, requiring an increase in the field on theanode side in order to conserve magnetic flux. Magnetic dif-fusion is expected to dominate the field penetration for thisgeometry at these conditions, but a classical Spitzer resistiv-ity predicts a much slower diffusion speed than was mea-sured. Maron et al. must assume an anomalous resistivitygreater than ten times the Spitzer value in order to explainthe data. This anomalous resistivity was later explained asbeing caused by instabilities in the anode plasma that in-crease the collision frequency and therefore, also theresistivity.8,9 These measurements are an example of howreal world effects, such as instabilities, can significantly alterthe field penetration over a simple idealized picture.
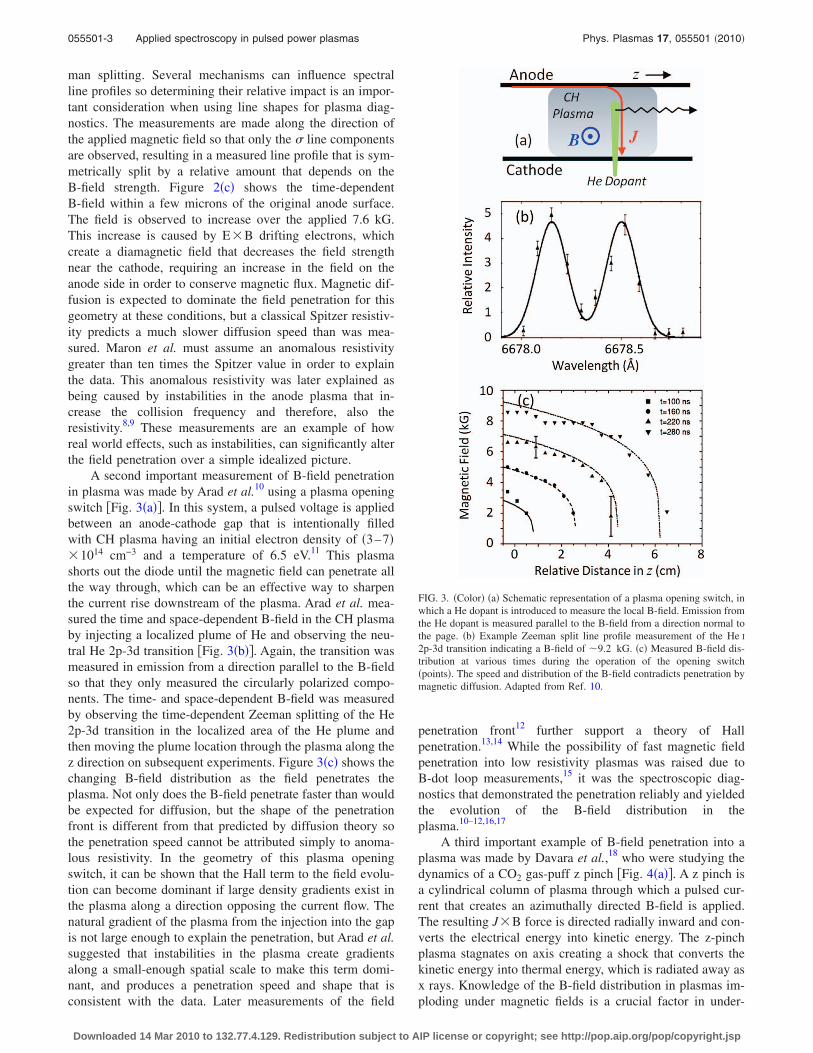
A second important measurement of B-field penetrationin plasma was made by Arad et al.10 using a plasma openingswitch �Fig. 3�a��. In this system, a pulsed voltage is appliedbetween an anode-cathode gap that is intentionally filledwith CH plasma having an initial electron density of �3–7��1014 cm−3 and a temperature of 6.5 eV.11 This plasmashorts out the diode until the magnetic field can penetrate allthe way through, which can be an effective way to sharpenthe current rise downstream of the plasma. Arad et al. mea-sured the time and space-dependent B-field in the CH plasmaby injecting a localized plume of He and observing the neu-tral He 2p-3d transition �Fig. 3�b��. Again, the transition wasmeasured in emission from a direction parallel to the B-fieldso that they only measured the circularly polarized compo-nents. The time- and space-dependent B-field was measuredby observing the time-dependent Zeeman splitting of the He2p-3d transition in the localized area of the He plume andthen moving the plume location through the plasma along thez direction on subsequent experiments. Figure 3�c� shows thechanging B-field distribution as the field penetrates theplasma. Not only does the B-field penetrate faster than wouldbe expected for diffusion, but the shape of the penetrationfront is different from that predicted by diffusion theory sothe penetration speed cannot be attributed simply to anoma-lous resistivity. In the geometry of this plasma openingswitch, it can be shown that the Hall term to the field evolu-tion can become dominant if large density gradients exist inthe plasma along a direction opposing the current flow. Thenatural gradient of the plasma from the injection into the gapis not large enough to explain the penetration, but Arad et al.suggested that instabilities in the plasma create gradientsalong a small-enough spatial scale to make this term domi-nant, and produces a penetration speed and shape that isconsistent with the data. Later measurements of the field
penetration front12 further support a theory of Hallpenetration.13,14 While the possibility of fast magnetic fieldpenetration into low resistivity plasmas was raised due toB-dot loop measurements,15 it was the spectroscopic diag-nostics that demonstrated the penetration reliably and yieldedthe evolution of the B-field distribution in theplasma.10–12,16,17
A third important example of B-field penetration into aplasma was made by Davara et al.,18 who were studying thedynamics of a CO2 gas-puff z pinch �Fig. 4�a��. A z pinch isa cylindrical column of plasma through which a pulsed cur-rent that creates an azimuthally directed B-field is applied.The resulting J�B force is directed radially inward and con-verts the electrical energy into kinetic energy. The z-pinchplasma stagnates on axis creating a shock that converts thekinetic energy into thermal energy, which is radiated away asx rays. Knowledge of the B-field distribution in plasmas im-ploding under magnetic fields is a crucial factor in under-
FIG. 3. �Color� �a� Schematic representation of a plasma opening switch, inwhich a He dopant is introduced to measure the local B-field. Emission fromthe He dopant is measured parallel to the B-field from a direction normal tothe page. �b� Example Zeeman split line profile measurement of the He I
2p-3d transition indicating a B-field of �9.2 kG. �c� Measured B-field dis-tribution at various times during the operation of the opening switch�points�. The speed and distribution of the B-field contradicts penetration bymagnetic diffusion. Adapted from Ref. 10.
055501-3 Applied spectroscopy in pulsed power plasmas Phys. Plasmas 17, 055501 �2010�
Downloaded 14 Mar 2010 to 132.77.4.129. Redistribution subject to AIP license or copyright; see http://pop.aip.org/pop/copyright.jsp
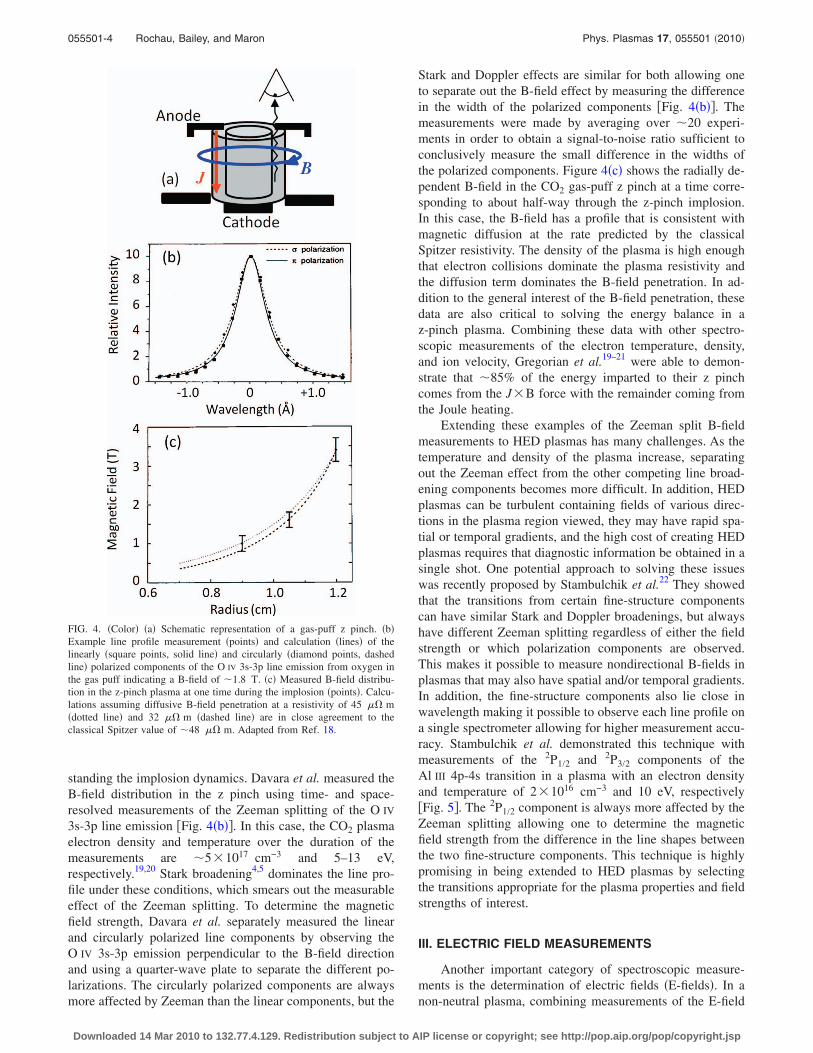
standing the implosion dynamics. Davara et al. measured theB-field distribution in the z pinch using time- and space-resolved measurements of the Zeeman splitting of the O IV
3s-3p line emission �Fig. 4�b��. In this case, the CO2 plasmaelectron density and temperature over the duration of themeasurements are �5�1017 cm−3 and 5–13 eV,respectively.19,20 Stark broadening4,5 dominates the line pro-file under these conditions, which smears out the measurableeffect of the Zeeman splitting. To determine the magneticfield strength, Davara et al. separately measured the linearand circularly polarized line components by observing theO IV 3s-3p emission perpendicular to the B-field directionand using a quarter-wave plate to separate the different po-larizations. The circularly polarized components are alwaysmore affected by Zeeman than the linear components, but the
Stark and Doppler effects are similar for both allowing oneto separate out the B-field effect by measuring the differencein the width of the polarized components �Fig. 4�b��. Themeasurements were made by averaging over �20 experi-ments in order to obtain a signal-to-noise ratio sufficient toconclusively measure the small difference in the widths ofthe polarized components. Figure 4�c� shows the radially de-pendent B-field in the CO2 gas-puff z pinch at a time corre-sponding to about half-way through the z-pinch implosion.In this case, the B-field has a profile that is consistent withmagnetic diffusion at the rate predicted by the classicalSpitzer resistivity. The density of the plasma is high enoughthat electron collisions dominate the plasma resistivity andthe diffusion term dominates the B-field penetration. In ad-dition to the general interest of the B-field penetration, thesedata are also critical to solving the energy balance in az-pinch plasma. Combining these data with other spectro-scopic measurements of the electron temperature, density,and ion velocity, Gregorian et al.19–21 were able to demon-strate that �85% of the energy imparted to their z pinchcomes from the J�B force with the remainder coming fromthe Joule heating.
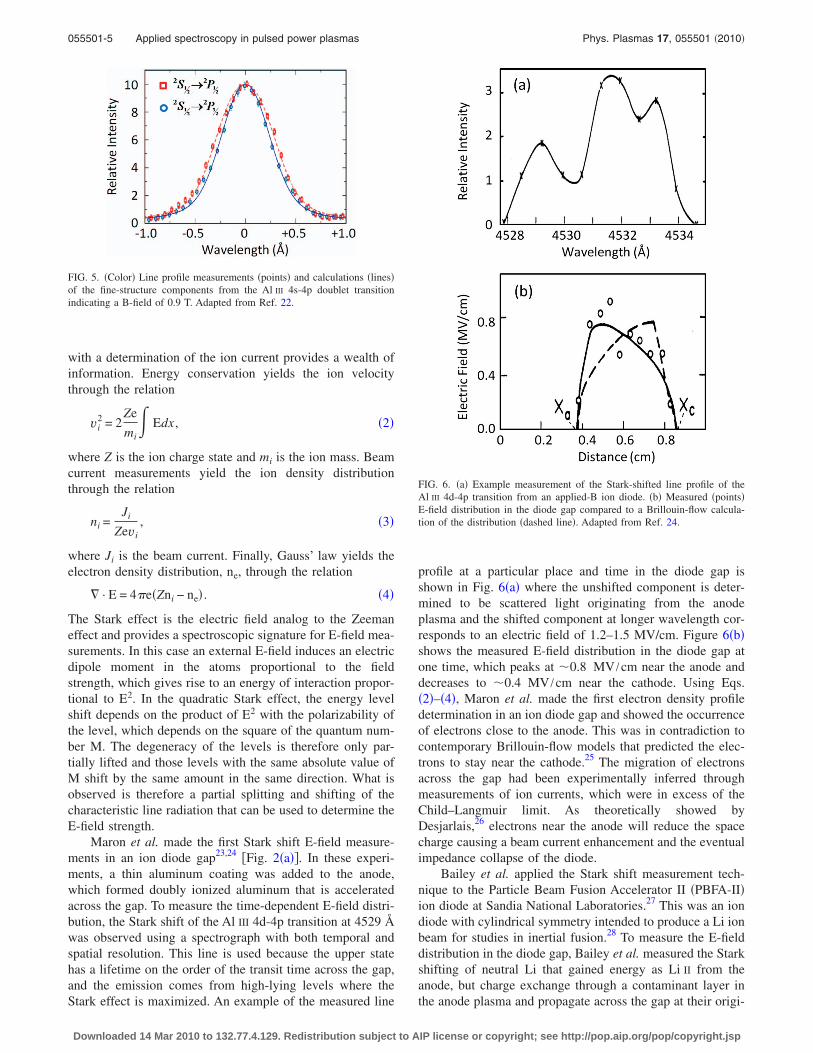
Extending these examples of the Zeeman split B-fieldmeasurements to HED plasmas has many challenges. As thetemperature and density of the plasma increase, separatingout the Zeeman effect from the other competing line broad-ening components becomes more difficult. In addition, HEDplasmas can be turbulent containing fields of various direc-tions in the plasma region viewed, they may have rapid spa-tial or temporal gradients, and the high cost of creating HEDplasmas requires that diagnostic information be obtained in asingle shot. One potential approach to solving these issueswas recently proposed by Stambulchik et al.22 They showedthat the transitions from certain fine-structure componentscan have similar Stark and Doppler broadenings, but alwayshave different Zeeman splitting regardless of either the fieldstrength or which polarization components are observed.This makes it possible to measure nondirectional B-fields inplasmas that may also have spatial and/or temporal gradients.In addition, the fine-structure components also lie close inwavelength making it possible to observe each line profile ona single spectrometer allowing for higher measurement accu-racy. Stambulchik et al. demonstrated this technique withmeasurements of the 2P1/2 and 2P3/2 components of theAl III 4p-4s transition in a plasma with an electron densityand temperature of 2�1016 cm−3 and 10 eV, respectively�Fig. 5�. The 2P1/2 component is always more affected by theZeeman splitting allowing one to determine the magneticfield strength from the difference in the line shapes betweenthe two fine-structure components. This technique is highlypromising in being extended to HED plasmas by selectingthe transitions appropriate for the plasma properties and fieldstrengths of interest.
III. ELECTRIC FIELD MEASUREMENTS
Another important category of spectroscopic measure-ments is the determination of electric fields �E-fields�. In anon-neutral plasma, combining measurements of the E-field
FIG. 4. �Color� �a� Schematic representation of a gas-puff z pinch. �b�Example line profile measurement �points� and calculation �lines� of thelinearly �square points, solid line� and circularly �diamond points, dashedline� polarized components of the O IV 3s-3p line emission from oxygen inthe gas puff indicating a B-field of �1.8 T. �c� Measured B-field distribu-tion in the z-pinch plasma at one time during the implosion �points�. Calcu-lations assuming diffusive B-field penetration at a resistivity of 45 �� m�dotted line� and 32 �� m �dashed line� are in close agreement to theclassical Spitzer value of �48 �� m. Adapted from Ref. 18.
055501-4 Rochau, Bailey, and Maron Phys. Plasmas 17, 055501 �2010�
Downloaded 14 Mar 2010 to 132.77.4.129. Redistribution subject to AIP license or copyright; see http://pop.aip.org/pop/copyright.jsp
with a determination of the ion current provides a wealth ofinformation. Energy conservation yields the ion velocitythrough the relation
vi2 = 2
Ze
mi� Edx , �2�
where Z is the ion charge state and mi is the ion mass. Beamcurrent measurements yield the ion density distributionthrough the relation
ni =Ji
Zevi, �3�
where Ji is the beam current. Finally, Gauss’ law yields theelectron density distribution, ne, through the relation
� · E = 4�e�Zni − ne� . �4�
The Stark effect is the electric field analog to the Zeemaneffect and provides a spectroscopic signature for E-field mea-surements. In this case an external E-field induces an electricdipole moment in the atoms proportional to the fieldstrength, which gives rise to an energy of interaction propor-tional to E2. In the quadratic Stark effect, the energy levelshift depends on the product of E2 with the polarizability ofthe level, which depends on the square of the quantum num-ber M. The degeneracy of the levels is therefore only par-tially lifted and those levels with the same absolute value ofM shift by the same amount in the same direction. What isobserved is therefore a partial splitting and shifting of thecharacteristic line radiation that can be used to determine theE-field strength.
Maron et al. made the first Stark shift E-field measure-ments in an ion diode gap23,24 �Fig. 2�a��. In these experi-ments, a thin aluminum coating was added to the anode,which formed doubly ionized aluminum that is acceleratedacross the gap. To measure the time-dependent E-field distri-bution, the Stark shift of the Al III 4d-4p transition at 4529 Åwas observed using a spectrograph with both temporal andspatial resolution. This line is used because the upper statehas a lifetime on the order of the transit time across the gap,and the emission comes from high-lying levels where theStark effect is maximized. An example of the measured line
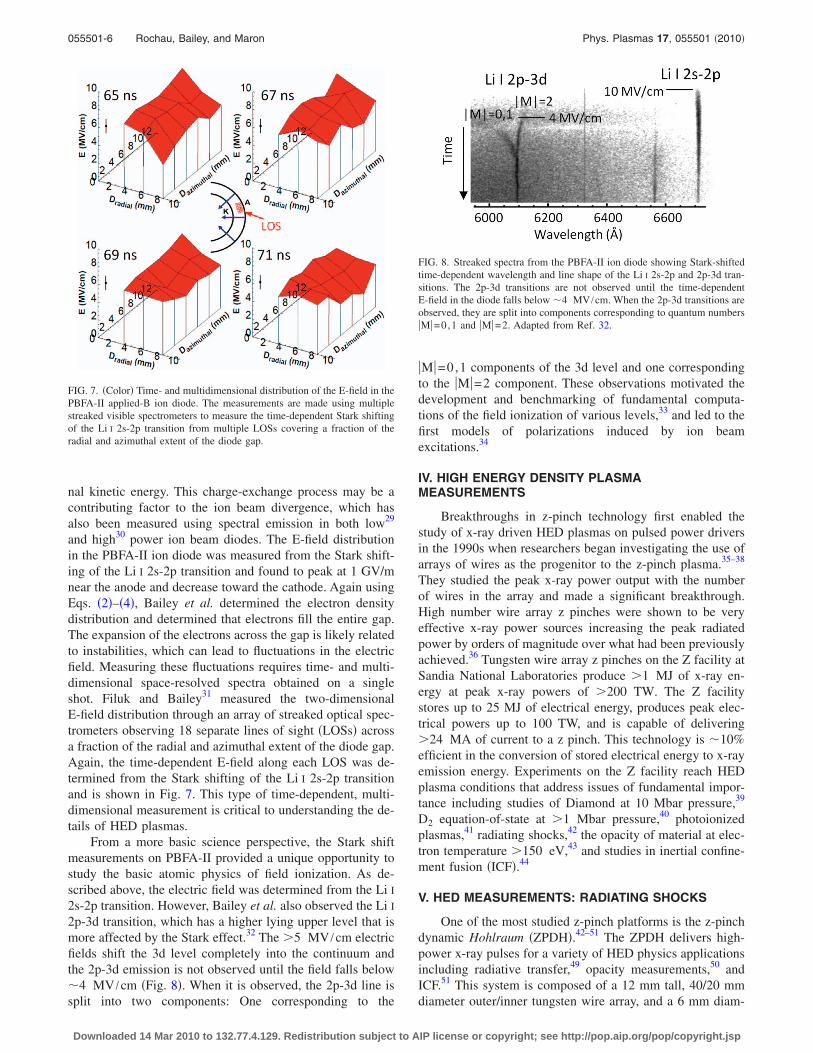
profile at a particular place and time in the diode gap isshown in Fig. 6�a� where the unshifted component is deter-mined to be scattered light originating from the anodeplasma and the shifted component at longer wavelength cor-responds to an electric field of 1.2–1.5 MV/cm. Figure 6�b�shows the measured E-field distribution in the diode gap atone time, which peaks at �0.8 MV /cm near the anode anddecreases to �0.4 MV /cm near the cathode. Using Eqs.�2�–�4�, Maron et al. made the first electron density profiledetermination in an ion diode gap and showed the occurrenceof electrons close to the anode. This was in contradiction tocontemporary Brillouin-flow models that predicted the elec-trons to stay near the cathode.25 The migration of electronsacross the gap had been experimentally inferred throughmeasurements of ion currents, which were in excess of theChild–Langmuir limit. As theoretically showed byDesjarlais,26 electrons near the anode will reduce the spacecharge causing a beam current enhancement and the eventualimpedance collapse of the diode.
Bailey et al. applied the Stark shift measurement tech-nique to the Particle Beam Fusion Accelerator II �PBFA-II�ion diode at Sandia National Laboratories.27 This was an iondiode with cylindrical symmetry intended to produce a Li ionbeam for studies in inertial fusion.28 To measure the E-fielddistribution in the diode gap, Bailey et al. measured the Starkshifting of neutral Li that gained energy as Li II from theanode, but charge exchange through a contaminant layer inthe anode plasma and propagate across the gap at their origi-
FIG. 5. �Color� Line profile measurements �points� and calculations �lines�of the fine-structure components from the Al III 4s-4p doublet transitionindicating a B-field of 0.9 T. Adapted from Ref. 22.
FIG. 6. �a� Example measurement of the Stark-shifted line profile of theAl III 4d-4p transition from an applied-B ion diode. �b� Measured �points�E-field distribution in the diode gap compared to a Brillouin-flow calcula-tion of the distribution �dashed line�. Adapted from Ref. 24.
055501-5 Applied spectroscopy in pulsed power plasmas Phys. Plasmas 17, 055501 �2010�
Downloaded 14 Mar 2010 to 132.77.4.129. Redistribution subject to AIP license or copyright; see http://pop.aip.org/pop/copyright.jsp
nal kinetic energy. This charge-exchange process may be acontributing factor to the ion beam divergence, which hasalso been measured using spectral emission in both low29
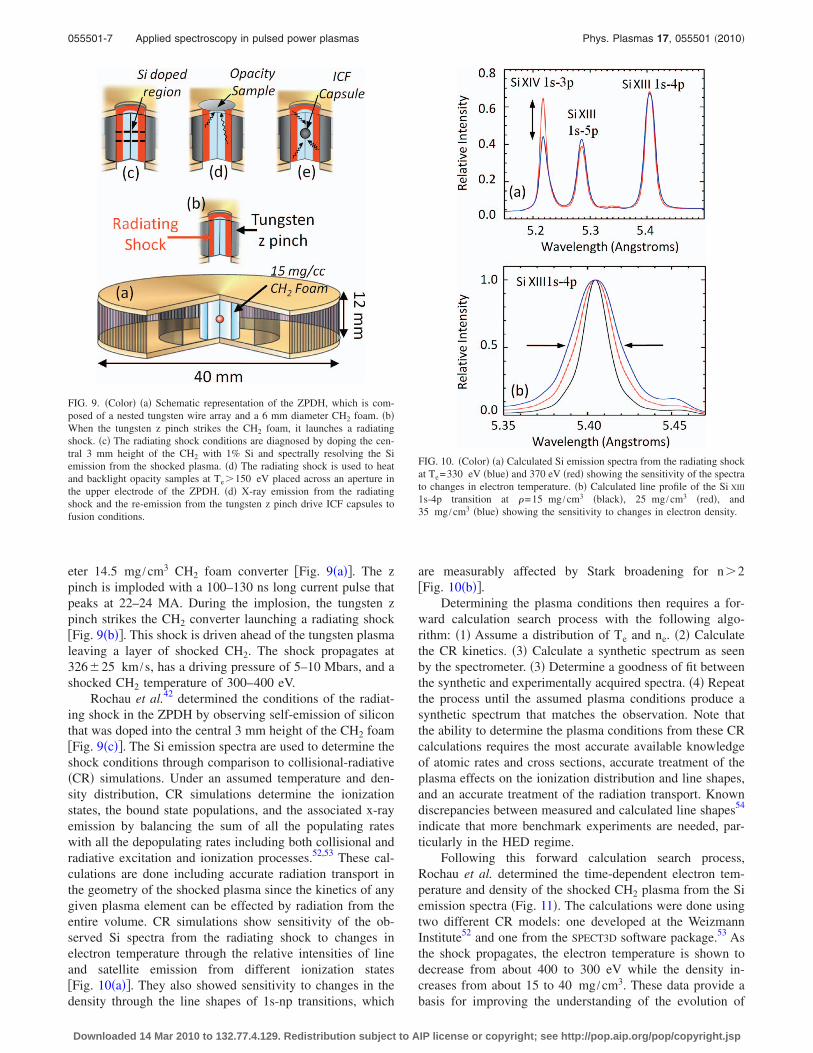
and high30 power ion beam diodes. The E-field distributionin the PBFA-II ion diode was measured from the Stark shift-ing of the Li I 2s-2p transition and found to peak at 1 GV/mnear the anode and decrease toward the cathode. Again usingEqs. �2�–�4�, Bailey et al. determined the electron densitydistribution and determined that electrons fill the entire gap.The expansion of the electrons across the gap is likely relatedto instabilities, which can lead to fluctuations in the electricfield. Measuring these fluctuations requires time- and multi-dimensional space-resolved spectra obtained on a singleshot. Filuk and Bailey31 measured the two-dimensionalE-field distribution through an array of streaked optical spec-trometers observing 18 separate lines of sight �LOSs� acrossa fraction of the radial and azimuthal extent of the diode gap.Again, the time-dependent E-field along each LOS was de-termined from the Stark shifting of the Li I 2s-2p transitionand is shown in Fig. 7. This type of time-dependent, multi-dimensional measurement is critical to understanding the de-tails of HED plasmas.
From a more basic science perspective, the Stark shiftmeasurements on PBFA-II provided a unique opportunity tostudy the basic atomic physics of field ionization. As de-scribed above, the electric field was determined from the Li I
2s-2p transition. However, Bailey et al. also observed the Li I
2p-3d transition, which has a higher lying upper level that ismore affected by the Stark effect.32 The �5 MV /cm electricfields shift the 3d level completely into the continuum andthe 2p-3d emission is not observed until the field falls below�4 MV /cm �Fig. 8�. When it is observed, the 2p-3d line issplit into two components: One corresponding to the
M=0,1 components of the 3d level and one correspondingto the M=2 component. These observations motivated thedevelopment and benchmarking of fundamental computa-tions of the field ionization of various levels,33 and led to thefirst models of polarizations induced by ion beamexcitations.34
IV. HIGH ENERGY DENSITY PLASMAMEASUREMENTS
Breakthroughs in z-pinch technology first enabled thestudy of x-ray driven HED plasmas on pulsed power driversin the 1990s when researchers began investigating the use ofarrays of wires as the progenitor to the z-pinch plasma.35–38
They studied the peak x-ray power output with the numberof wires in the array and made a significant breakthrough.High number wire array z pinches were shown to be veryeffective x-ray power sources increasing the peak radiatedpower by orders of magnitude over what had been previouslyachieved.36 Tungsten wire array z pinches on the Z facility atSandia National Laboratories produce �1 MJ of x-ray en-ergy at peak x-ray powers of �200 TW. The Z facilitystores up to 25 MJ of electrical energy, produces peak elec-trical powers up to 100 TW, and is capable of delivering�24 MA of current to a z pinch. This technology is �10%efficient in the conversion of stored electrical energy to x-rayemission energy. Experiments on the Z facility reach HEDplasma conditions that address issues of fundamental impor-tance including studies of Diamond at 10 Mbar pressure,39
D2 equation-of-state at �1 Mbar pressure,40 photoionizedplasmas,41 radiating shocks,42 the opacity of material at elec-tron temperature �150 eV,43 and studies in inertial confine-ment fusion �ICF�.44
V. HED MEASUREMENTS: RADIATING SHOCKS
One of the most studied z-pinch platforms is the z-pinchdynamic Hohlraum �ZPDH�.42–51 The ZPDH delivers high-power x-ray pulses for a variety of HED physics applicationsincluding radiative transfer,49 opacity measurements,50 andICF.51 This system is composed of a 12 mm tall, 40/20 mmdiameter outer/inner tungsten wire array, and a 6 mm diam-
FIG. 7. �Color� Time- and multidimensional distribution of the E-field in thePBFA-II applied-B ion diode. The measurements are made using multiplestreaked visible spectrometers to measure the time-dependent Stark shiftingof the Li I 2s-2p transition from multiple LOSs covering a fraction of theradial and azimuthal extent of the diode gap.
FIG. 8. Streaked spectra from the PBFA-II ion diode showing Stark-shiftedtime-dependent wavelength and line shape of the Li I 2s-2p and 2p-3d tran-sitions. The 2p-3d transitions are not observed until the time-dependentE-field in the diode falls below �4 MV /cm. When the 2p-3d transitions areobserved, they are split into components corresponding to quantum numbersM=0,1 and M=2. Adapted from Ref. 32.
055501-6 Rochau, Bailey, and Maron Phys. Plasmas 17, 055501 �2010�
Downloaded 14 Mar 2010 to 132.77.4.129. Redistribution subject to AIP license or copyright; see http://pop.aip.org/pop/copyright.jsp
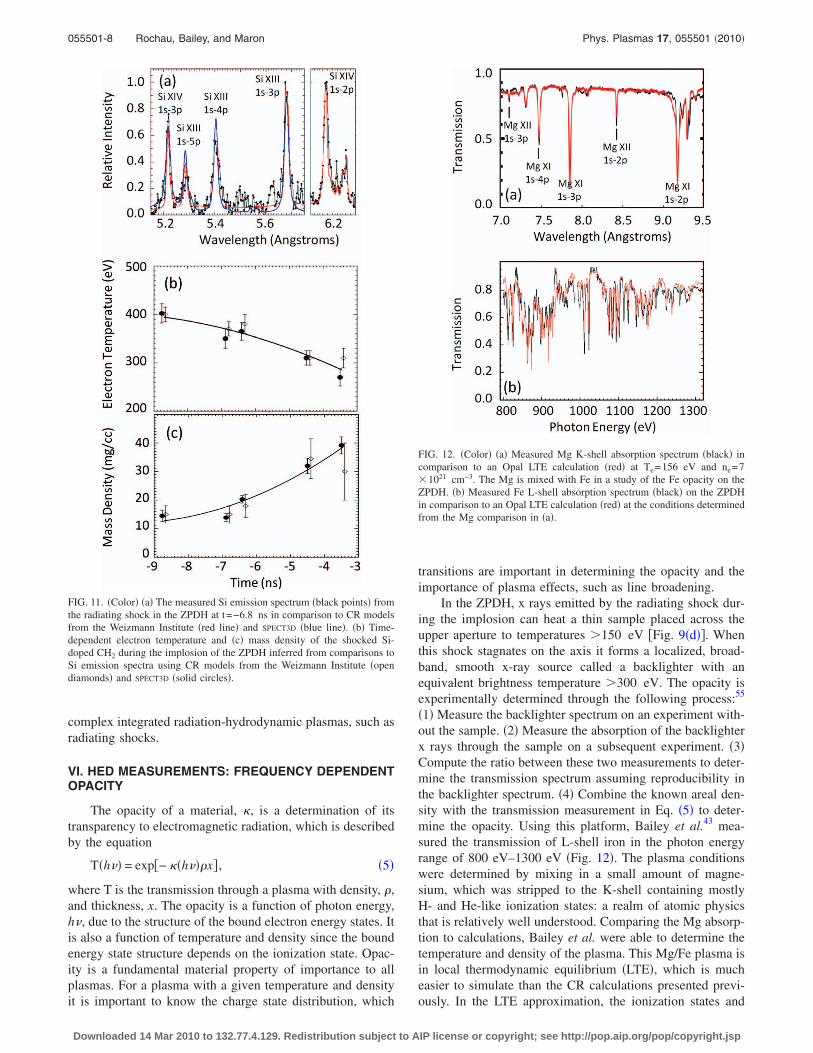
eter 14.5 mg /cm3 CH2 foam converter �Fig. 9�a��. The zpinch is imploded with a 100–130 ns long current pulse thatpeaks at 22–24 MA. During the implosion, the tungsten zpinch strikes the CH2 converter launching a radiating shock�Fig. 9�b��. This shock is driven ahead of the tungsten plasmaleaving a layer of shocked CH2. The shock propagates at326�25 km /s, has a driving pressure of 5–10 Mbars, and ashocked CH2 temperature of 300–400 eV.
Rochau et al.42 determined the conditions of the radiat-ing shock in the ZPDH by observing self-emission of siliconthat was doped into the central 3 mm height of the CH2 foam�Fig. 9�c��. The Si emission spectra are used to determine theshock conditions through comparison to collisional-radiative�CR� simulations. Under an assumed temperature and den-sity distribution, CR simulations determine the ionizationstates, the bound state populations, and the associated x-rayemission by balancing the sum of all the populating rateswith all the depopulating rates including both collisional andradiative excitation and ionization processes.52,53 These cal-culations are done including accurate radiation transport inthe geometry of the shocked plasma since the kinetics of anygiven plasma element can be effected by radiation from theentire volume. CR simulations show sensitivity of the ob-served Si spectra from the radiating shock to changes inelectron temperature through the relative intensities of lineand satellite emission from different ionization states�Fig. 10�a��. They also showed sensitivity to changes in thedensity through the line shapes of 1s-np transitions, which
are measurably affected by Stark broadening for n�2�Fig. 10�b��.
Determining the plasma conditions then requires a for-ward calculation search process with the following algo-rithm: �1� Assume a distribution of Te and ne. �2� Calculatethe CR kinetics. �3� Calculate a synthetic spectrum as seenby the spectrometer. �3� Determine a goodness of fit betweenthe synthetic and experimentally acquired spectra. �4� Repeatthe process until the assumed plasma conditions produce asynthetic spectrum that matches the observation. Note thatthe ability to determine the plasma conditions from these CRcalculations requires the most accurate available knowledgeof atomic rates and cross sections, accurate treatment of theplasma effects on the ionization distribution and line shapes,and an accurate treatment of the radiation transport. Knowndiscrepancies between measured and calculated line shapes54
indicate that more benchmark experiments are needed, par-ticularly in the HED regime.
Following this forward calculation search process,Rochau et al. determined the time-dependent electron tem-perature and density of the shocked CH2 plasma from the Siemission spectra �Fig. 11�. The calculations were done usingtwo different CR models: one developed at the WeizmannInstitute52 and one from the SPECT3D software package.53 Asthe shock propagates, the electron temperature is shown todecrease from about 400 to 300 eV while the density in-creases from about 15 to 40 mg /cm3. These data provide abasis for improving the understanding of the evolution of
FIG. 9. �Color� �a� Schematic representation of the ZPDH, which is com-posed of a nested tungsten wire array and a 6 mm diameter CH2 foam. �b�When the tungsten z pinch strikes the CH2 foam, it launches a radiatingshock. �c� The radiating shock conditions are diagnosed by doping the cen-tral 3 mm height of the CH2 with 1% Si and spectrally resolving the Siemission from the shocked plasma. �d� The radiating shock is used to heatand backlight opacity samples at Te�150 eV placed across an aperture inthe upper electrode of the ZPDH. �d� X-ray emission from the radiatingshock and the re-emission from the tungsten z pinch drive ICF capsules tofusion conditions.
FIG. 10. �Color� �a� Calculated Si emission spectra from the radiating shockat Te=330 eV �blue� and 370 eV �red� showing the sensitivity of the spectrato changes in electron temperature. �b� Calculated line profile of the Si XIII
1s-4p transition at =15 mg /cm3 �black�, 25 mg /cm3 �red�, and35 mg /cm3 �blue� showing the sensitivity to changes in electron density.
055501-7 Applied spectroscopy in pulsed power plasmas Phys. Plasmas 17, 055501 �2010�
Downloaded 14 Mar 2010 to 132.77.4.129. Redistribution subject to AIP license or copyright; see http://pop.aip.org/pop/copyright.jsp
complex integrated radiation-hydrodynamic plasmas, such asradiating shocks.
VI. HED MEASUREMENTS: FREQUENCY DEPENDENTOPACITY
The opacity of a material, , is a determination of itstransparency to electromagnetic radiation, which is describedby the equation
T�h�� = exp�− �h��x� , �5�
where T is the transmission through a plasma with density, ,and thickness, x. The opacity is a function of photon energy,h�, due to the structure of the bound electron energy states. Itis also a function of temperature and density since the boundenergy state structure depends on the ionization state. Opac-ity is a fundamental material property of importance to allplasmas. For a plasma with a given temperature and densityit is important to know the charge state distribution, which
transitions are important in determining the opacity and theimportance of plasma effects, such as line broadening.
In the ZPDH, x rays emitted by the radiating shock dur-ing the implosion can heat a thin sample placed across theupper aperture to temperatures �150 eV �Fig. 9�d��. Whenthis shock stagnates on the axis it forms a localized, broad-band, smooth x-ray source called a backlighter with anequivalent brightness temperature �300 eV. The opacity isexperimentally determined through the following process:55
�1� Measure the backlighter spectrum on an experiment with-out the sample. �2� Measure the absorption of the backlighterx rays through the sample on a subsequent experiment. �3�Compute the ratio between these two measurements to deter-mine the transmission spectrum assuming reproducibility inthe backlighter spectrum. �4� Combine the known areal den-sity with the transmission measurement in Eq. �5� to deter-mine the opacity. Using this platform, Bailey et al.43 mea-sured the transmission of L-shell iron in the photon energyrange of 800 eV–1300 eV �Fig. 12�. The plasma conditionswere determined by mixing in a small amount of magne-sium, which was stripped to the K-shell containing mostlyH- and He-like ionization states: a realm of atomic physicsthat is relatively well understood. Comparing the Mg absorp-tion to calculations, Bailey et al. were able to determine thetemperature and density of the plasma. This Mg/Fe plasma isin local thermodynamic equilibrium �LTE�, which is mucheasier to simulate than the CR calculations presented previ-ously. In the LTE approximation, the ionization states and
FIG. 11. �Color� �a� The measured Si emission spectrum �black points� fromthe radiating shock in the ZPDH at t=−6.8 ns in comparison to CR modelsfrom the Weizmann Institute �red line� and SPECT3D �blue line�. �b� Time-dependent electron temperature and �c� mass density of the shocked Si-doped CH2 during the implosion of the ZPDH inferred from comparisons toSi emission spectra using CR models from the Weizmann Institute �opendiamonds� and SPECT3D �solid circles�.
FIG. 12. �Color� �a� Measured Mg K-shell absorption spectrum �black� incomparison to an Opal LTE calculation �red� at Te=156 eV and ne=7�1021 cm−3. The Mg is mixed with Fe in a study of the Fe opacity on theZPDH. �b� Measured Fe L-shell absorption spectrum �black� on the ZPDHin comparison to an Opal LTE calculation �red� at the conditions determinedfrom the Mg comparison in �a�.
055501-8 Rochau, Bailey, and Maron Phys. Plasmas 17, 055501 �2010�
Downloaded 14 Mar 2010 to 132.77.4.129. Redistribution subject to AIP license or copyright; see http://pop.aip.org/pop/copyright.jsp
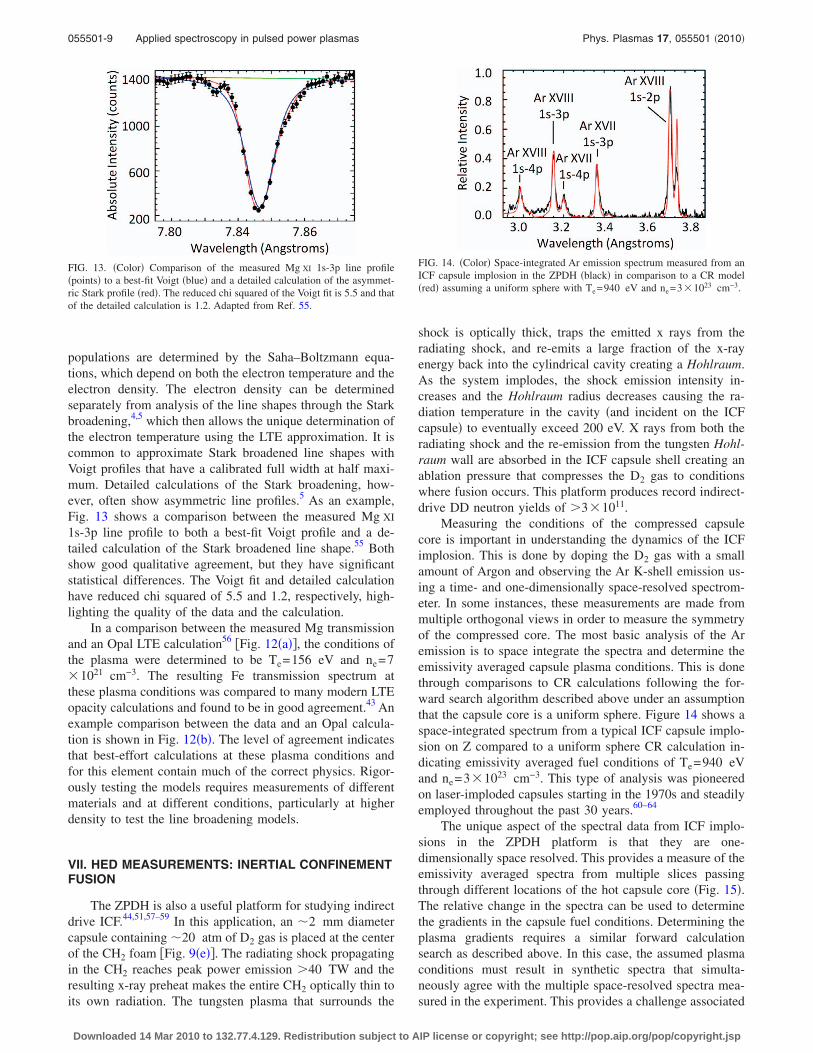
populations are determined by the Saha–Boltzmann equa-tions, which depend on both the electron temperature and theelectron density. The electron density can be determinedseparately from analysis of the line shapes through the Starkbroadening,4,5 which then allows the unique determination ofthe electron temperature using the LTE approximation. It iscommon to approximate Stark broadened line shapes withVoigt profiles that have a calibrated full width at half maxi-mum. Detailed calculations of the Stark broadening, how-ever, often show asymmetric line profiles.5 As an example,Fig. 13 shows a comparison between the measured Mg XI
1s-3p line profile to both a best-fit Voigt profile and a de-tailed calculation of the Stark broadened line shape.55 Bothshow good qualitative agreement, but they have significantstatistical differences. The Voigt fit and detailed calculationhave reduced chi squared of 5.5 and 1.2, respectively, high-lighting the quality of the data and the calculation.
In a comparison between the measured Mg transmissionand an Opal LTE calculation56 �Fig. 12�a��, the conditions ofthe plasma were determined to be Te=156 eV and ne=7�1021 cm−3. The resulting Fe transmission spectrum atthese plasma conditions was compared to many modern LTEopacity calculations and found to be in good agreement.43 Anexample comparison between the data and an Opal calcula-tion is shown in Fig. 12�b�. The level of agreement indicatesthat best-effort calculations at these plasma conditions andfor this element contain much of the correct physics. Rigor-ously testing the models requires measurements of differentmaterials and at different conditions, particularly at higherdensity to test the line broadening models.
VII. HED MEASUREMENTS: INERTIAL CONFINEMENTFUSION
The ZPDH is also a useful platform for studying indirectdrive ICF.44,51,57–59 In this application, an �2 mm diametercapsule containing �20 atm of D2 gas is placed at the centerof the CH2 foam �Fig. 9�e��. The radiating shock propagatingin the CH2 reaches peak power emission �40 TW and theresulting x-ray preheat makes the entire CH2 optically thin toits own radiation. The tungsten plasma that surrounds the
shock is optically thick, traps the emitted x rays from theradiating shock, and re-emits a large fraction of the x-rayenergy back into the cylindrical cavity creating a Hohlraum.As the system implodes, the shock emission intensity in-creases and the Hohlraum radius decreases causing the ra-diation temperature in the cavity �and incident on the ICFcapsule� to eventually exceed 200 eV. X rays from both theradiating shock and the re-emission from the tungsten Hohl-raum wall are absorbed in the ICF capsule shell creating anablation pressure that compresses the D2 gas to conditionswhere fusion occurs. This platform produces record indirect-drive DD neutron yields of �3�1011.
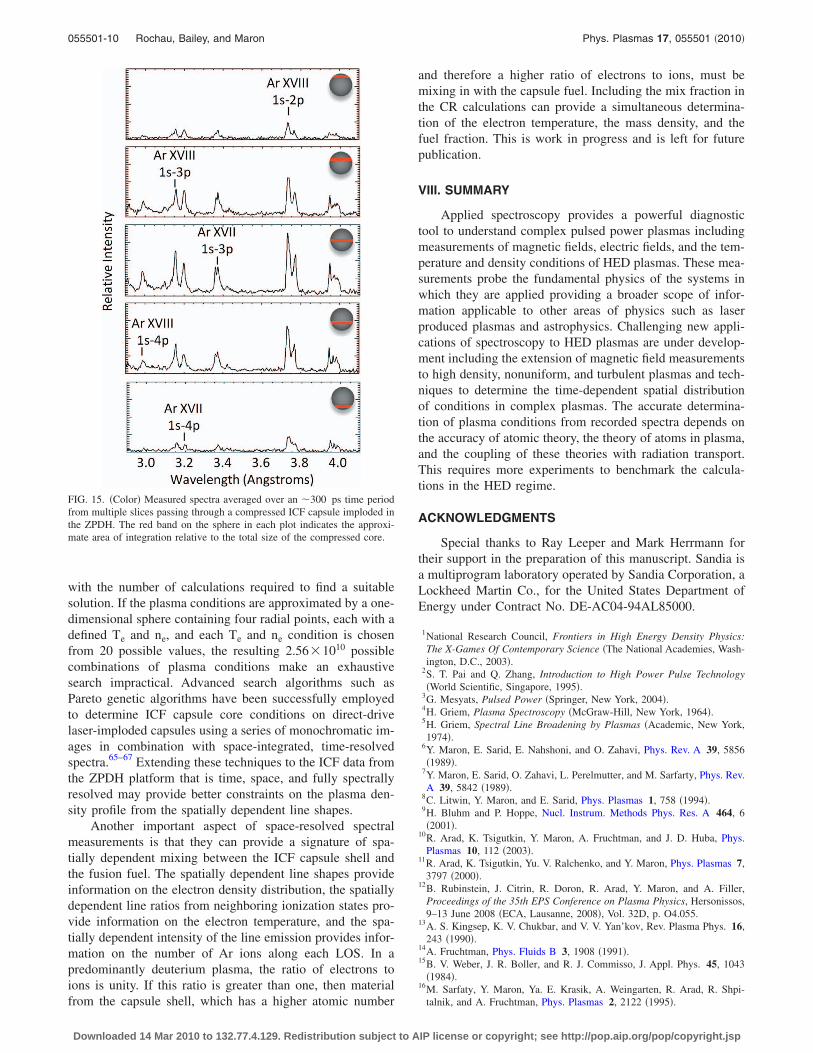
Measuring the conditions of the compressed capsulecore is important in understanding the dynamics of the ICFimplosion. This is done by doping the D2 gas with a smallamount of Argon and observing the Ar K-shell emission us-ing a time- and one-dimensionally space-resolved spectrom-eter. In some instances, these measurements are made frommultiple orthogonal views in order to measure the symmetryof the compressed core. The most basic analysis of the Aremission is to space integrate the spectra and determine theemissivity averaged capsule plasma conditions. This is donethrough comparisons to CR calculations following the for-ward search algorithm described above under an assumptionthat the capsule core is a uniform sphere. Figure 14 shows aspace-integrated spectrum from a typical ICF capsule implo-sion on Z compared to a uniform sphere CR calculation in-dicating emissivity averaged fuel conditions of Te=940 eVand ne=3�1023 cm−3. This type of analysis was pioneeredon laser-imploded capsules starting in the 1970s and steadilyemployed throughout the past 30 years.60–64
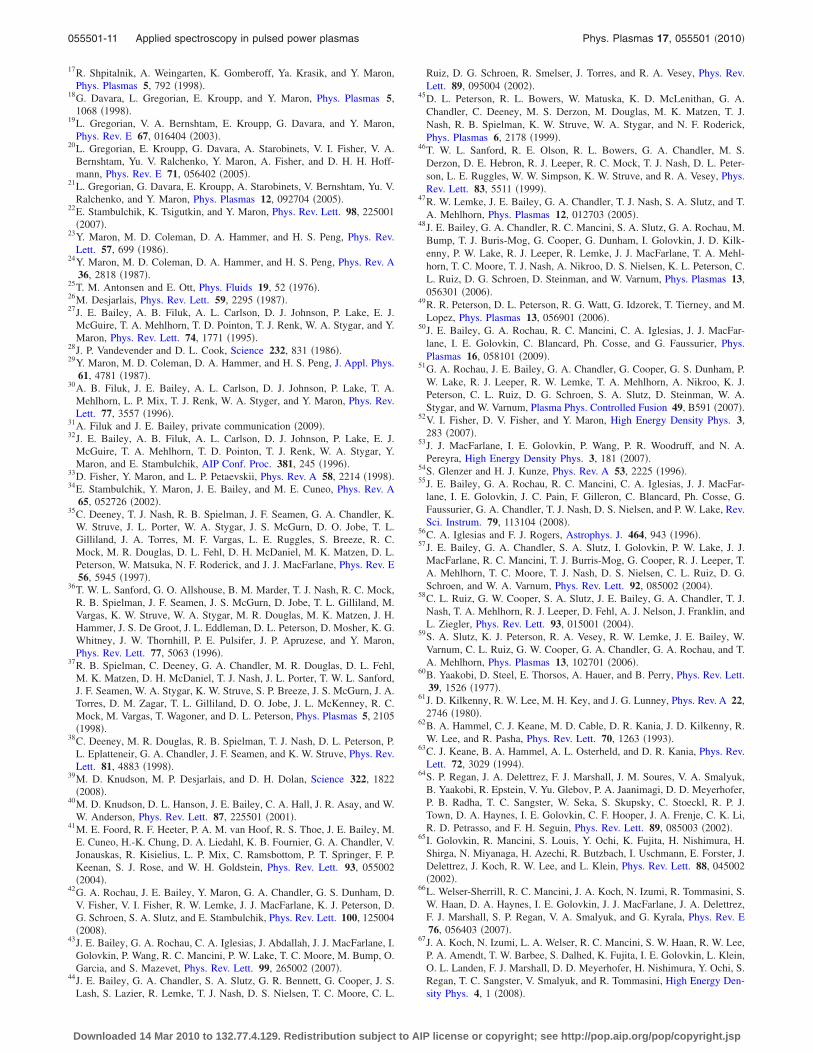
The unique aspect of the spectral data from ICF implo-sions in the ZPDH platform is that they are one-dimensionally space resolved. This provides a measure of theemissivity averaged spectra from multiple slices passingthrough different locations of the hot capsule core �Fig. 15�.The relative change in the spectra can be used to determinethe gradients in the capsule fuel conditions. Determining theplasma gradients requires a similar forward calculationsearch as described above. In this case, the assumed plasmaconditions must result in synthetic spectra that simulta-neously agree with the multiple space-resolved spectra mea-sured in the experiment. This provides a challenge associated
FIG. 13. �Color� Comparison of the measured Mg XI 1s-3p line profile�points� to a best-fit Voigt �blue� and a detailed calculation of the asymmet-ric Stark profile �red�. The reduced chi squared of the Voigt fit is 5.5 and thatof the detailed calculation is 1.2. Adapted from Ref. 55.
FIG. 14. �Color� Space-integrated Ar emission spectrum measured from anICF capsule implosion in the ZPDH �black� in comparison to a CR model�red� assuming a uniform sphere with Te=940 eV and ne=3�1023 cm−3.
055501-9 Applied spectroscopy in pulsed power plasmas Phys. Plasmas 17, 055501 �2010�
Downloaded 14 Mar 2010 to 132.77.4.129. Redistribution subject to AIP license or copyright; see http://pop.aip.org/pop/copyright.jsp
with the number of calculations required to find a suitablesolution. If the plasma conditions are approximated by a one-dimensional sphere containing four radial points, each with adefined Te and ne, and each Te and ne condition is chosenfrom 20 possible values, the resulting 2.56�1010 possiblecombinations of plasma conditions make an exhaustivesearch impractical. Advanced search algorithms such asPareto genetic algorithms have been successfully employedto determine ICF capsule core conditions on direct-drivelaser-imploded capsules using a series of monochromatic im-ages in combination with space-integrated, time-resolvedspectra.65–67 Extending these techniques to the ICF data fromthe ZPDH platform that is time, space, and fully spectrallyresolved may provide better constraints on the plasma den-sity profile from the spatially dependent line shapes.
Another important aspect of space-resolved spectralmeasurements is that they can provide a signature of spa-tially dependent mixing between the ICF capsule shell andthe fusion fuel. The spatially dependent line shapes provideinformation on the electron density distribution, the spatiallydependent line ratios from neighboring ionization states pro-vide information on the electron temperature, and the spa-tially dependent intensity of the line emission provides infor-mation on the number of Ar ions along each LOS. In apredominantly deuterium plasma, the ratio of electrons toions is unity. If this ratio is greater than one, then materialfrom the capsule shell, which has a higher atomic number
and therefore a higher ratio of electrons to ions, must bemixing in with the capsule fuel. Including the mix fraction inthe CR calculations can provide a simultaneous determina-tion of the electron temperature, the mass density, and thefuel fraction. This is work in progress and is left for futurepublication.
VIII. SUMMARY
Applied spectroscopy provides a powerful diagnostictool to understand complex pulsed power plasmas includingmeasurements of magnetic fields, electric fields, and the tem-perature and density conditions of HED plasmas. These mea-surements probe the fundamental physics of the systems inwhich they are applied providing a broader scope of infor-mation applicable to other areas of physics such as laserproduced plasmas and astrophysics. Challenging new appli-cations of spectroscopy to HED plasmas are under develop-ment including the extension of magnetic field measurementsto high density, nonuniform, and turbulent plasmas and tech-niques to determine the time-dependent spatial distributionof conditions in complex plasmas. The accurate determina-tion of plasma conditions from recorded spectra depends onthe accuracy of atomic theory, the theory of atoms in plasma,and the coupling of these theories with radiation transport.This requires more experiments to benchmark the calcula-tions in the HED regime.
ACKNOWLEDGMENTS
Special thanks to Ray Leeper and Mark Herrmann fortheir support in the preparation of this manuscript. Sandia isa multiprogram laboratory operated by Sandia Corporation, aLockheed Martin Co., for the United States Department ofEnergy under Contract No. DE-AC04-94AL85000.
1National Research Council, Frontiers in High Energy Density Physics:The X-Games Of Contemporary Science �The National Academies, Wash-ington, D.C., 2003�.
2S. T. Pai and Q. Zhang, Introduction to High Power Pulse Technology�World Scientific, Singapore, 1995�.
3G. Mesyats, Pulsed Power �Springer, New York, 2004�.4H. Griem, Plasma Spectroscopy �McGraw-Hill, New York, 1964�.5H. Griem, Spectral Line Broadening by Plasmas �Academic, New York,1974�.
6Y. Maron, E. Sarid, E. Nahshoni, and O. Zahavi, Phys. Rev. A 39, 5856�1989�.
7Y. Maron, E. Sarid, O. Zahavi, L. Perelmutter, and M. Sarfarty, Phys. Rev.A 39, 5842 �1989�.
8C. Litwin, Y. Maron, and E. Sarid, Phys. Plasmas 1, 758 �1994�.9H. Bluhm and P. Hoppe, Nucl. Instrum. Methods Phys. Res. A 464, 6�2001�.
10R. Arad, K. Tsigutkin, Y. Maron, A. Fruchtman, and J. D. Huba, Phys.Plasmas 10, 112 �2003�.
11R. Arad, K. Tsigutkin, Yu. V. Ralchenko, and Y. Maron, Phys. Plasmas 7,3797 �2000�.
12B. Rubinstein, J. Citrin, R. Doron, R. Arad, Y. Maron, and A. Filler,Proceedings of the 35th EPS Conference on Plasma Physics, Hersonissos,9–13 June 2008 �ECA, Lausanne, 2008�, Vol. 32D, p. O4.055.
13A. S. Kingsep, K. V. Chukbar, and V. V. Yan’kov, Rev. Plasma Phys. 16,243 �1990�.
14A. Fruchtman, Phys. Fluids B 3, 1908 �1991�.15B. V. Weber, J. R. Boller, and R. J. Commisso, J. Appl. Phys. 45, 1043
�1984�.16M. Sarfaty, Y. Maron, Ya. E. Krasik, A. Weingarten, R. Arad, R. Shpi-
talnik, and A. Fruchtman, Phys. Plasmas 2, 2122 �1995�.
FIG. 15. �Color� Measured spectra averaged over an �300 ps time periodfrom multiple slices passing through a compressed ICF capsule imploded inthe ZPDH. The red band on the sphere in each plot indicates the approxi-mate area of integration relative to the total size of the compressed core.
055501-10 Rochau, Bailey, and Maron Phys. Plasmas 17, 055501 �2010�
Downloaded 14 Mar 2010 to 132.77.4.129. Redistribution subject to AIP license or copyright; see http://pop.aip.org/pop/copyright.jsp
17R. Shpitalnik, A. Weingarten, K. Gomberoff, Ya. Krasik, and Y. Maron,Phys. Plasmas 5, 792 �1998�.
18G. Davara, L. Gregorian, E. Kroupp, and Y. Maron, Phys. Plasmas 5,1068 �1998�.
19L. Gregorian, V. A. Bernshtam, E. Kroupp, G. Davara, and Y. Maron,Phys. Rev. E 67, 016404 �2003�.
20L. Gregorian, E. Kroupp, G. Davara, A. Starobinets, V. I. Fisher, V. A.Bernshtam, Yu. V. Ralchenko, Y. Maron, A. Fisher, and D. H. H. Hoff-mann, Phys. Rev. E 71, 056402 �2005�.
21L. Gregorian, G. Davara, E. Kroupp, A. Starobinets, V. Bernshtam, Yu. V.Ralchenko, and Y. Maron, Phys. Plasmas 12, 092704 �2005�.
22E. Stambulchik, K. Tsigutkin, and Y. Maron, Phys. Rev. Lett. 98, 225001�2007�.
23Y. Maron, M. D. Coleman, D. A. Hammer, and H. S. Peng, Phys. Rev.Lett. 57, 699 �1986�.
24Y. Maron, M. D. Coleman, D. A. Hammer, and H. S. Peng, Phys. Rev. A36, 2818 �1987�.
25T. M. Antonsen and E. Ott, Phys. Fluids 19, 52 �1976�.26M. Desjarlais, Phys. Rev. Lett. 59, 2295 �1987�.27J. E. Bailey, A. B. Filuk, A. L. Carlson, D. J. Johnson, P. Lake, E. J.
McGuire, T. A. Mehlhorn, T. D. Pointon, T. J. Renk, W. A. Stygar, and Y.Maron, Phys. Rev. Lett. 74, 1771 �1995�.
28J. P. Vandevender and D. L. Cook, Science 232, 831 �1986�.29Y. Maron, M. D. Coleman, D. A. Hammer, and H. S. Peng, J. Appl. Phys.
61, 4781 �1987�.30A. B. Filuk, J. E. Bailey, A. L. Carlson, D. J. Johnson, P. Lake, T. A.
Mehlhorn, L. P. Mix, T. J. Renk, W. A. Styger, and Y. Maron, Phys. Rev.Lett. 77, 3557 �1996�.
31A. Filuk and J. E. Bailey, private communication �2009�.32J. E. Bailey, A. B. Filuk, A. L. Carlson, D. J. Johnson, P. Lake, E. J.
McGuire, T. A. Mehlhorn, T. D. Pointon, T. J. Renk, W. A. Stygar, Y.Maron, and E. Stambulchik, AIP Conf. Proc. 381, 245 �1996�.
33D. Fisher, Y. Maron, and L. P. Petaevskii, Phys. Rev. A 58, 2214 �1998�.34E. Stambulchik, Y. Maron, J. E. Bailey, and M. E. Cuneo, Phys. Rev. A
65, 052726 �2002�.35C. Deeney, T. J. Nash, R. B. Spielman, J. F. Seamen, G. A. Chandler, K.
W. Struve, J. L. Porter, W. A. Stygar, J. S. McGurn, D. O. Jobe, T. L.Gilliland, J. A. Torres, M. F. Vargas, L. E. Ruggles, S. Breeze, R. C.Mock, M. R. Douglas, D. L. Fehl, D. H. McDaniel, M. K. Matzen, D. L.Peterson, W. Matsuka, N. F. Roderick, and J. J. MacFarlane, Phys. Rev. E56, 5945 �1997�.
36T. W. L. Sanford, G. O. Allshouse, B. M. Marder, T. J. Nash, R. C. Mock,R. B. Spielman, J. F. Seamen, J. S. McGurn, D. Jobe, T. L. Gilliland, M.Vargas, K. W. Struve, W. A. Stygar, M. R. Douglas, M. K. Matzen, J. H.Hammer, J. S. De Groot, J. L. Eddleman, D. L. Peterson, D. Mosher, K. G.Whitney, J. W. Thornhill, P. E. Pulsifer, J. P. Apruzese, and Y. Maron,Phys. Rev. Lett. 77, 5063 �1996�.
37R. B. Spielman, C. Deeney, G. A. Chandler, M. R. Douglas, D. L. Fehl,M. K. Matzen, D. H. McDaniel, T. J. Nash, J. L. Porter, T. W. L. Sanford,J. F. Seamen, W. A. Stygar, K. W. Struve, S. P. Breeze, J. S. McGurn, J. A.Torres, D. M. Zagar, T. L. Gilliland, D. O. Jobe, J. L. McKenney, R. C.Mock, M. Vargas, T. Wagoner, and D. L. Peterson, Phys. Plasmas 5, 2105�1998�.
38C. Deeney, M. R. Douglas, R. B. Spielman, T. J. Nash, D. L. Peterson, P.L. Eplatteneir, G. A. Chandler, J. F. Seamen, and K. W. Struve, Phys. Rev.Lett. 81, 4883 �1998�.
39M. D. Knudson, M. P. Desjarlais, and D. H. Dolan, Science 322, 1822�2008�.
40M. D. Knudson, D. L. Hanson, J. E. Bailey, C. A. Hall, J. R. Asay, and W.W. Anderson, Phys. Rev. Lett. 87, 225501 �2001�.
41M. E. Foord, R. F. Heeter, P. A. M. van Hoof, R. S. Thoe, J. E. Bailey, M.E. Cuneo, H.-K. Chung, D. A. Liedahl, K. B. Fournier, G. A. Chandler, V.Jonauskas, R. Kisielius, L. P. Mix, C. Ramsbottom, P. T. Springer, F. P.Keenan, S. J. Rose, and W. H. Goldstein, Phys. Rev. Lett. 93, 055002�2004�.
42G. A. Rochau, J. E. Bailey, Y. Maron, G. A. Chandler, G. S. Dunham, D.V. Fisher, V. I. Fisher, R. W. Lemke, J. J. MacFarlane, K. J. Peterson, D.G. Schroen, S. A. Slutz, and E. Stambulchik, Phys. Rev. Lett. 100, 125004�2008�.
43J. E. Bailey, G. A. Rochau, C. A. Iglesias, J. Abdallah, J. J. MacFarlane, I.Golovkin, P. Wang, R. C. Mancini, P. W. Lake, T. C. Moore, M. Bump, O.Garcia, and S. Mazevet, Phys. Rev. Lett. 99, 265002 �2007�.
44J. E. Bailey, G. A. Chandler, S. A. Slutz, G. R. Bennett, G. Cooper, J. S.Lash, S. Lazier, R. Lemke, T. J. Nash, D. S. Nielsen, T. C. Moore, C. L.
Ruiz, D. G. Schroen, R. Smelser, J. Torres, and R. A. Vesey, Phys. Rev.Lett. 89, 095004 �2002�.
45D. L. Peterson, R. L. Bowers, W. Matuska, K. D. McLenithan, G. A.Chandler, C. Deeney, M. S. Derzon, M. Douglas, M. K. Matzen, T. J.Nash, R. B. Spielman, K. W. Struve, W. A. Stygar, and N. F. Roderick,Phys. Plasmas 6, 2178 �1999�.
46T. W. L. Sanford, R. E. Olson, R. L. Bowers, G. A. Chandler, M. S.Derzon, D. E. Hebron, R. J. Leeper, R. C. Mock, T. J. Nash, D. L. Peter-son, L. E. Ruggles, W. W. Simpson, K. W. Struve, and R. A. Vesey, Phys.Rev. Lett. 83, 5511 �1999�.
47R. W. Lemke, J. E. Bailey, G. A. Chandler, T. J. Nash, S. A. Slutz, and T.A. Mehlhorn, Phys. Plasmas 12, 012703 �2005�.
48J. E. Bailey, G. A. Chandler, R. C. Mancini, S. A. Slutz, G. A. Rochau, M.Bump, T. J. Buris-Mog, G. Cooper, G. Dunham, I. Golovkin, J. D. Kilk-enny, P. W. Lake, R. J. Leeper, R. Lemke, J. J. MacFarlane, T. A. Mehl-horn, T. C. Moore, T. J. Nash, A. Nikroo, D. S. Nielsen, K. L. Peterson, C.L. Ruiz, D. G. Schroen, D. Steinman, and W. Varnum, Phys. Plasmas 13,056301 �2006�.
49R. R. Peterson, D. L. Peterson, R. G. Watt, G. Idzorek, T. Tierney, and M.Lopez, Phys. Plasmas 13, 056901 �2006�.
50J. E. Bailey, G. A. Rochau, R. C. Mancini, C. A. Iglesias, J. J. MacFar-lane, I. E. Golovkin, C. Blancard, Ph. Cosse, and G. Faussurier, Phys.Plasmas 16, 058101 �2009�.
51G. A. Rochau, J. E. Bailey, G. A. Chandler, G. Cooper, G. S. Dunham, P.W. Lake, R. J. Leeper, R. W. Lemke, T. A. Mehlhorn, A. Nikroo, K. J.Peterson, C. L. Ruiz, D. G. Schroen, S. A. Slutz, D. Steinman, W. A.Stygar, and W. Varnum, Plasma Phys. Controlled Fusion 49, B591 �2007�.
52V. I. Fisher, D. V. Fisher, and Y. Maron, High Energy Density Phys. 3,283 �2007�.
53J. J. MacFarlane, I. E. Golovkin, P. Wang, P. R. Woodruff, and N. A.Pereyra, High Energy Density Phys. 3, 181 �2007�.
54S. Glenzer and H. J. Kunze, Phys. Rev. A 53, 2225 �1996�.55J. E. Bailey, G. A. Rochau, R. C. Mancini, C. A. Iglesias, J. J. MacFar-
lane, I. E. Golovkin, J. C. Pain, F. Gilleron, C. Blancard, Ph. Cosse, G.Faussurier, G. A. Chandler, T. J. Nash, D. S. Nielsen, and P. W. Lake, Rev.Sci. Instrum. 79, 113104 �2008�.
56C. A. Iglesias and F. J. Rogers, Astrophys. J. 464, 943 �1996�.57J. E. Bailey, G. A. Chandler, S. A. Slutz, I. Golovkin, P. W. Lake, J. J.
MacFarlane, R. C. Mancini, T. J. Burris-Mog, G. Cooper, R. J. Leeper, T.A. Mehlhorn, T. C. Moore, T. J. Nash, D. S. Nielsen, C. L. Ruiz, D. G.Schroen, and W. A. Varnum, Phys. Rev. Lett. 92, 085002 �2004�.
58C. L. Ruiz, G. W. Cooper, S. A. Slutz, J. E. Bailey, G. A. Chandler, T. J.Nash, T. A. Mehlhorn, R. J. Leeper, D. Fehl, A. J. Nelson, J. Franklin, andL. Ziegler, Phys. Rev. Lett. 93, 015001 �2004�.
59S. A. Slutz, K. J. Peterson, R. A. Vesey, R. W. Lemke, J. E. Bailey, W.Varnum, C. L. Ruiz, G. W. Cooper, G. A. Chandler, G. A. Rochau, and T.A. Mehlhorn, Phys. Plasmas 13, 102701 �2006�.
60B. Yaakobi, D. Steel, E. Thorsos, A. Hauer, and B. Perry, Phys. Rev. Lett.39, 1526 �1977�.
61J. D. Kilkenny, R. W. Lee, M. H. Key, and J. G. Lunney, Phys. Rev. A 22,2746 �1980�.
62B. A. Hammel, C. J. Keane, M. D. Cable, D. R. Kania, J. D. Kilkenny, R.W. Lee, and R. Pasha, Phys. Rev. Lett. 70, 1263 �1993�.
63C. J. Keane, B. A. Hammel, A. L. Osterheld, and D. R. Kania, Phys. Rev.Lett. 72, 3029 �1994�.
64S. P. Regan, J. A. Delettrez, F. J. Marshall, J. M. Soures, V. A. Smalyuk,B. Yaakobi, R. Epstein, V. Yu. Glebov, P. A. Jaanimagi, D. D. Meyerhofer,P. B. Radha, T. C. Sangster, W. Seka, S. Skupsky, C. Stoeckl, R. P. J.Town, D. A. Haynes, I. E. Golovkin, C. F. Hooper, J. A. Frenje, C. K. Li,R. D. Petrasso, and F. H. Seguin, Phys. Rev. Lett. 89, 085003 �2002�.
65I. Golovkin, R. Mancini, S. Louis, Y. Ochi, K. Fujita, H. Nishimura, H.Shirga, N. Miyanaga, H. Azechi, R. Butzbach, I. Uschmann, E. Forster, J.Delettrez, J. Koch, R. W. Lee, and L. Klein, Phys. Rev. Lett. 88, 045002�2002�.
66L. Welser-Sherrill, R. C. Mancini, J. A. Koch, N. Izumi, R. Tommasini, S.W. Haan, D. A. Haynes, I. E. Golovkin, J. J. MacFarlane, J. A. Delettrez,F. J. Marshall, S. P. Regan, V. A. Smalyuk, and G. Kyrala, Phys. Rev. E76, 056403 �2007�.
67J. A. Koch, N. Izumi, L. A. Welser, R. C. Mancini, S. W. Haan, R. W. Lee,P. A. Amendt, T. W. Barbee, S. Dalhed, K. Fujita, I. E. Golovkin, L. Klein,O. L. Landen, F. J. Marshall, D. D. Meyerhofer, H. Nishimura, Y. Ochi, S.Regan, T. C. Sangster, V. Smalyuk, and R. Tommasini, High Energy Den-sity Phys. 4, 1 �2008�.
055501-11 Applied spectroscopy in pulsed power plasmas Phys. Plasmas 17, 055501 �2010�
Downloaded 14 Mar 2010 to 132.77.4.129. Redistribution subject to AIP license or copyright; see http://pop.aip.org/pop/copyright.jsp