applied materials science - materialesup | just … · applied materials science ... professor,...
TRANSCRIPT


Deborah D.L. Chung
AppliedMaterialsScience
Applications of EngineeringMaterials in Structural, Electronics,
Thermal, and Other Industries
Boca Raton London New York Washington, D.C.CRC Press

This book contains information obtained from authentic and highly regarded sources. Reprinted materialis quoted with permission, and sources are indicated. A wide variety of references are listed. Reasonableefforts have been made to publish reliable data and information, but the author and the publisher cannotassume responsibility for the validity of all materials or for the consequences of their use.
Neither this book nor any part may be reproduced or transmitted in any form or by any means, electronicor mechanical, including photocopying, microfilming, and recording, or by any information storage orretrieval system, without prior permission in writing from the publisher.
All rights reserved. Authorization to photocopy items for internal or personal use, or the personal orinternal use of specific clients, may be granted by CRC Press LLC, provided that $.50 per page photo-copied is paid directly to Copyright Clearance Center, 222 Rosewood Drive, Danvers, MA 01923 USA.The fee code for users of the Transactional Reporting Service is ISBN 0-8493-1073-3/01/$0.00+$.50.The fee is subject to change without notice. For organizations that have been granted a photocopy licenseby the CCC, a separate system of payment has been arranged.
The consent of CRC Press LLC does not extend to copying for general distribution, for promotion, forcreating new works, or for resale. Specific permission must be obtained in writing from CRC Press LLCfor such copying.
Direct all inquiries to CRC Press LLC, 2000 N.W. Corporate Blvd., Boca Raton, Florida 33431.
Trademark Notice: Product or corporate names may be trademarks or registered trademarks, and areused only for identification and explanation, without intent to infringe.
Visit the CRC Press Web site at www.crcpress.com
© 2001 by Chapman & Hall/CRC CRC Press LLC St. Lucie Press Lewis Publishers Auerbach is an imprint of CRC Press LLC
No claim to original U.S. Government worksInternational Standard Book Number 0-8493-1073-3
Library of Congress Card Number ??-?????Printed in the United States of America 1 2 3 4 5 6 7 8 9 0
Printed on acid-free paper
Library of Congress Cataloging-in-Publication Data
McLachlan, AlanMolecular biology of the hepatitis B virus / Alan McLachlan
p. cm.Includes bibliographical references and index.ISBN 0-8493-1073-31. Hepatitis B virus. 2. Biology—molecular. I. McLachlan, Alan. II. Title.
[DNLM: 1. Hepatitis B virus. QW 710 G289h]QR749.H64G78 2000616′.0149—dc20 ??-?????
CIPCatalog record is available from the Library of Congress
©2001 CRC Press LLC

Dedication
To the memory of my nanny,Ms. Kwai-Sheung Ng (1893–1986)
©2001 CRC Press LLC

The Author
Deborah D. L. Chung is Niagara Mohawk Power Corporation Endowed ChairProfessor, Director of the Composite Materials Research Laboratory, and Professorof Mechanical and Aerospace Engineering at the State University of New York(SUNY) in Buffalo. She holds a Ph.D. in materials science and an S.M. degree fromthe Massachusetts Institute of Technology (M.I.T.), as well as an M.S. in engineeringscience and a B.S. in engineering and applied science from the California Instituteof Technology.
Dr. Chung is a Fellow of ASM International and of the American Carbon Society,and is past recipient of the Teacher of the Year Award from Tau Beta Pi; the TeetorEducational Award from the Society of Automotive Engineers; the Hardy GoldMedal from the American Institute of Mining, Metallurgical, and Petroleum Engi-neers; and the Ladd Award from Carnegie Mellon University.
Dr. Chung has written or cowritten 322 articles published in journals (88 oncarbon, 107 on cement-matrix composites, 31 on metal-matrix composites, 62 onpolymer-matrix composites, 12 on metal-semiconductor interfaces, 5 on silicon, and17 on other topics). She is the author of three books, including Carbon FiberComposites (Butterworth, 1994) and Composite Materials for Electronic Functions(Trans Tech, 2000), and has edited two books including Materials for ElectronicPackaging (Butterworth, 1995).
Dr. Chung is the holder of 16 patents and has given 125 invited lectures. Herresearch has covered many materials, including lightweight structural, construction,smart, adsorption, battery electrode, solar cell, and electronic packaging materials.
©2001 CRC Press LLC
Preface
Materials constitute the foundation of technology. They include metals, polymers,ceramics, semiconductors, and composite materials. The fundamental concepts ofmaterials science are crystal structures, imperfections, phase diagrams, materialsprocessing, and materials properties. They are taught in most universities to mate-rials, mechanical, aerospace, electrical, chemical, and civil engineering undergrad-uate students. However, students need to know not only the fundamental concepts,but also how materials are applied in the real world. Since a large proportion ofundergraduate students in engineering go on to become engineers in various indus-tries, it is important for them to learn about applied materials science.
Due to the multifunctionality of many materials and the breadth of industrialneeds, this book covers structural, electronic, thermal, electrochemical, and otherapplications of materials in a cross-disciplinary fashion. The materials include met-als, ceramics, polymers, cement, carbon, and composites. The topics are scientificallyrich and technologically relevant. Each is covered in a tutorial and up-to-date mannerwith numerous references cited. The book is suitable for use as a textbook forundergraduate and graduate courses, or as a reference book. The reader should havebackground in fundamental materials science (at least one course), although somefundamental concepts pertinent to the topics in the chapters are covered in theappendices.
©2001 CRC Press LLC

Contents
Chapter 1 Introduction to Materials Applications
1.1 Classes of Materials1.2 Structural Applications1.3 Electronic Applications1.4 Thermal Applications1.5 Electrochemical Applications1.6 Environmental Applications1.7 Biomedical ApplicationsBibliography
Chapter 2 Materials for Thermal Conduction
2.1 Introduction2.2 Materials of High Thermal Conductivity
2.2.1 Metals, Diamond, and Ceramics2.2.2 Metal-Matrix Composites
2.2.2.1 Aluminum-Matrix Composites2.2.2.2 Copper-Matrix Composites2.2.2.3 Beryllium-Matrix Composites
2.2.3 Carbon-Matrix Composites2.2.4 Carbon and Graphite2.2.5 Ceramic-Matrix Composites
2.3 Thermal Interface Materials2.4 ConclusionReferences
Chapter 3 Polymer-Matrix Composites for Microelectronics
3.1 Introduction3.2 Applications in Microelectronics3.3 Polymer-Matrix Composites
3.3.1 Polymer-Matrix Composites with Continuous Fillers.3.3.2 Polymer-Matrix Composites with Discontinuous Fillers
3.4 SummaryReferences
©2001 CRC Press LLC

Chapter 4 Materials for Electromagnetic Interference Shielding
4.1 Introduction4.2 Mechanisms of Shielding4.3 Composite Materials for Shielding4.4 Emerging Materials for Shielding4.5 ConclusionReferences
Chapter 5 Cement-Based Electronics
5.1 Introduction5.2 Background on Cement-Matrix Composites5.3 Cement-Based Electrical Circuit Elements
5.3.1 Conductor5.3.2 Diode
5.4 Cement-Based Sensors5.4.1 Strain Sensor5.4.2 Damage Sensor5.4.3 Thermistor
5.5 Cement-Based Thermoelectric Device 5.6 ConclusionReferences
Chapter 6 Self-Sensing of Carbon Fiber Polymer-Matrix Structural Composites
6.1 Introduction 6.2 Background6.3 Sensing Strain6.4 Sensing Damage6.5 Sensing Temperature6.6 Sensing Bond Degradation6.7 Sensing Structural Transitions
6.7.1 DSC Analysis6.7.2 DC Electrical Resistance Analysis
6.8 Sensing Composite Fabrication Process6.9 ConclusionReferences
Chapter 7 Structural Health Monitoring by Electrical Resistance Measurement
7.1 Introduction7.2 Carbon Fiber Polymer-Matrix Structural Composites7.3 Cement-Matrix Composites 7.4 Joints
7.4.1 Joints Involving Composite and Concrete by Adhesion
©2001 CRC Press LLC

7.4.2 Joints Involving Composites by Adhesion7.4.3 Joints Involving Steels by Fastening7.4.4 Joints Involving Concrete by Pressure Application7.4.5 Joints Involving Composites by Fastening
7.5 ConclusionReferences
Chapter 8 Modification of the Surface of Carbon Fibers for Use as a Reinforcement in Composite Materials
8.1 Introduction to Surface Modification8.2 Introduction to Carbon Fiber Composites8.3 Surface Modification of Carbon Fibers for Polymer-Matrix
Composites8.4 Surface Modification of Carbon Fibers for Metal-Matrix
CompositesReferences
Chapter 9 Corrosion Control of Steel-Reinforced Concrete
9.1 Introduction9.2 Steel Surface Treatment9.3 Admixtures In Concrete9.4 Surface Coating on Concrete9.5 Cathodic Protection9.6 Steel Replacement9.7 ConclusionAcknowledgmentReferences
Chapter 10 Applications of Submicron-Diameter Carbon Filaments
10.1 Introduction10.2 Structural Applications10.3 Electromagnetic Interference Shielding, Electromagnetic Reflection,
and Surface Electrical Conduction10.4 DC Electrical Conduction 10.5 Field Emission10.6 Electrochemical Application10.7 Thermal Conduction10.8 Strain Sensors10.9 Porous Carbons10.10 Catalyst Support10.11 ConclusionAcknowledgmentReferences
©2001 CRC Press LLC

Chapter 11 Improving Cement-Based Materials by Using Silica Fume
11.1 Introduction11.2 Workability11.3 Mechanical Properties11.4 Vibration Damping Capacity11.5 Sound Absorption11.6 Freeze-Thaw Durability11.7 Abrasion Resistance 11.8 Shrinkage11.9 Air Void Content and Density11.10 Permeability11.11 Steel Rebar Corrosion Resistance11.12 Alkali-Silica Reactivity Reduction11.13 Chemical Attack Resistance11.14 Bond Strength to Steel Rebar11.15 Creep Rate11.16 Coefficient of Thermal Expansion11.17 Specific Heat11.18 Thermal Conductivity11.19 Fiber Dispersion11.20 ConclusionReferences
Appendix A Electrical Behavior of Various Types of Materials
Appendix B Temperature Dependence of Electrical Resistivity
Appendix C Electrical Measurement
Appendix D Dielectric Behavior
Appendix E Electromagnetic Measurement
Appendix F Thermoelectric Behavior
Appendix G Nondestructive Evaluation
Appendix H Electrochemical Behavior
Appendix I The pn Junction
Appendix J Carbon Fibers
©2001 CRC Press LLC

Introduction to Materials Applications
CONTENTS
1.1 Classes of Materials1.2 Structural Applications1.3 Electronic Applications1.4 Thermal Applications1.5 Electrochemical Applications1.6 Environmental Applications1.7 Biomedical ApplicationsBibliography
SYNOPSIS Engineering materials constitute the foundation of technology, whetherthe technology pertains to structural, electronic, thermal, electrochemical, environ-mental, biomedical, or other applications. The history of human civilization evolvedfrom the Stone Age to the Bronze Age, the Iron Age, the Steel Age, and to the SpaceAge (contemporaneous with the Electronic Age). Each age is marked by the adventof certain materials. The Iron Age brought tools and utensils. The Steel Age broughtrails and the Industrial Revolution. The Space Age brought structural materials (e.g.,composite materials) that are both strong and lightweight. The Electronic Agebrought semiconductors. Modern materials include metals, polymers, ceramics,semiconductors, and composite materials. This chapter provides an overview of theclasses and applications of materials.
RELEVANT APPENDICES: A, B
1.1 CLASSES OF MATERIALS
Metals, polymers, ceramics, semiconductors, and composite materials constitute themain classes of materials.
Metals (including alloys) consist of atoms and are characterized by metallicbonding (i.e., the valence electrons of each atom are delocalized and shared among
1
©2001 CRC Press LLC

all the atoms). Most of the elements in the Periodic Table are metals. Examples ofalloys are Cu-Zn (brass), Fe-C (steel), and Sn-Pb (solder). Alloys are classifiedaccording to the majority element present. The main classes of alloys are iron-basedalloys for structures; copper-based alloys for piping, utensils, thermal conduction,electrical conduction, etc.; and aluminum-based alloys for lightweight structures andmetal-matrix composites. Alloys are almost always in the polycrystalline form.
Ceramics are inorganic compounds such as Al2O3 (for spark plugs and forsubstrates for microelectronics), SiO2 (for electrical insulation in microelectronics),Fe3O4 (ferrite for magnetic memories used in computers), silicates (clay, cement,glass, etc.), and SiC (an abrasive). The main classes of ceramics are oxides, carbides,nitrides, and silicates. Ceramics are typically partly crystalline and partly amorphous.They consist of ions (often atoms as well) and are characterized by ionic bondingand often covalent bonding.
Polymers in the form of thermoplastics (nylon, polyethylene, polyvinyl chloride,rubber, etc.) consist of molecules that have covalent bonding within each moleculeand van der Waals’ forces between them. Polymers in the form of thermosets (e.g.,epoxy, phenolics, etc.) consist of a network of covalent bonds. Polymers are amor-phous, except for a minority of thermoplastics. Due to the bonding, polymers aretypically electrical and thermal insulators. However, conducting polymers can beobtained by doping, and conducting polymer-matrix composites can be obtained bythe use of conducting fillers.
Semiconductors have the highest occupied energy band (the valence band, wherethe valence electrons reside energetically) full such that the energy gap between thetop of the valence band and the bottom of the empty energy band (the conductionband) is small enough for some fraction of the valence electrons to be excited fromthe valence band to the conduction band by thermal, optical, or other forms of energy.Conventional semiconductors, such as silicon, germanium, and gallium arsenide(GaAs, a compound semiconductor), are covalent network solids. They are usuallydoped in order to enhance electrical conductivity. They are used in the form of singlecrystals without dislocations because grain boundaries and dislocations woulddegrade electrical behavior.
Composite materials are multiphase materials obtained by artificial combinationof different materials to attain properties that the individual components cannotattain. An example is a lightweight structural composite obtained by embeddingcontinuous carbon fibers in one or more orientations in a polymer matrix. The fibersprovide the strength and stiffness while the polymer serves as the binder. Anotherexample is concrete, a structural composite obtained by combining cement (thematrix, i.e., the binder, obtained by a reaction known as hydration, between cementand water), sand (fine aggregate), gravel (coarse aggregate), and, optionally, otheringredients known as admixtures. Short fibers and silica fume (a fine SiO2 particu-late) are examples of admixtures. In general, composites are classified according totheir matrix materials. The main classes of composites are polymer-matrix, cement-matrix, metal-matrix, carbon-matrix, and ceramic-matrix.
Polymer-matrix and cement-matrix composites are the most common due to thelow cost of fabrication. Polymer-matrix composites are used for lightweight struc-tures (aircraft, sporting goods, wheelchairs, etc.) in addition to vibration damping,
©2001 CRC Press LLC

electronic enclosures, asphalt (composite with pitch, a polymer, as the matrix), andsolder replacement. Cement-matrix composites in the form of concrete (with fineand coarse aggregates), steel-reinforced concrete, mortar (with fine aggregate, butno coarse aggregate), or cement paste (without any aggregate) are used for civilstructures, prefabricated housing, architectural precasts, masonry, landfill cover,thermal insulation, and sound absorption. Carbon-matrix composites are importantfor lightweight structures (like the Space Shuttle) and components (such as aircraftbrakes) that need to withstand high temperatures, but they are relatively expensivebecause of the high cost of fabrication. Carbon-matrix composites suffer from theirtendency to be oxidized (2C + O2 → 2CO), thereby becoming vapor. Ceramic-matrixcomposites are superior to carbon-matrix composites in oxidation resistance, butthey are not as well developed. Metal-matrix composites with aluminum as thematrix are used for lightweight structures and low-thermal-expansion electronicenclosures, but their applications are limited by the high cost of fabrication and bygalvanic corrosion.
Not included in the five categories above is carbon, which can be in the commonform of graphite, diamond, or fullerene (a recently discovered form). They are notceramics because they are not compounds.
Graphite, a semimetal, consists of carbon atom layers stacked in the AB sequencesuch that the bonding is covalent due to sp2 hybridization and metallic (two-dimen-sionally delocalized 2pz electrons) within a layer, and is van der Waals between thelayers. This bonding makes graphite very anisotropic, so it is a good lubricant dueto the ease of the sliding of the layers with respect to one another. Graphite is alsoused for pencils because of this property. Moreover, graphite is an electrical andthermal conductor within the layers, but an insulator in the direction perpendicularto the layers. The electrical conductivity is valuable in its use for electrochemicalelectrodes. Graphite is chemically quite inert; however, due to anisotropy, it canundergo a reaction (known as intercalation) in which a foreign species called theintercalate is inserted between the carbon layers.
Disordered carbon (called turbostratic carbon) also has a layered structure, but,unlike graphite, it does not have the AB stacking order and the layers are bent. Uponheating, disordered carbon becomes more ordered, as the ordered form (graphite)has the lowest energy. Graphitization refers to the ordering process that leads tographite. Conventional carbon fibers are mostly disordered carbon such that thecarbon layers are along the fiber axis. Flexible graphite is formed by compressinga collection of intercalated graphite flakes that have been exfoliated (allowed toexpand over 100 times along the direction perpendicular to the layers, typicallythrough heating after intercalation). The exfoliated flakes are held together bymechanical interlocking because there is no binder. Flexible graphite is typically inthe form of sheets, which are resilient in the direction perpendicular to the sheets.This resilience allows flexible graphite to be used as gaskets for fluid sealing.
Diamond is a covalent network solid exhibiting the diamond crystal structuredue to sp3 hybridization (akin to silicon). It is used as an abrasive and as a thermalconductor. Its thermal conductivity is the highest among all materials; however, itis an electrical insulator. Due to its high material cost, diamond is typically used inthe form of powder or thin-film coating. Diamond is to be distinguished from
©2001 CRC Press LLC
diamond-like carbon (DLC), which is amorphous carbon that is sp3-hybridized.Diamond-like carbon is mechanically weaker than diamond, but it is less expensive.
Fullerenes are molecules (C60) with covalent bonding within each molecule.Adjacent molecules are held by van der Waals’ forces; however, fullerenes are notpolymers. Carbon nanotubes are derivatives of the fullerenes, as they are essentiallyfullerenes with extra carbon atoms at the equator. The extra atoms cause thefullerenes to be longer. For example, ten extra atoms (one equatorial band of atoms)exist in the molecule C70. Carbon nanotubes can be single-wall or multiwall, depend-ing on the number of carbon layers.
1.2 STRUCTURAL APPLICATIONS
Structural applications are applications that require mechanical performance(strength, stiffness, and vibration damping ability) in the material, which may ormay not bear the load in the structure. In case the material bears the load, themechanical property requirements are particularly exacting. An example is a buildingin which steel-reinforced concrete columns bear the load of the structure and unre-inforced concrete architectural panels cover the face of the building. Both thecolumns and the panels serve structural applications and are structural materials,though only the columns bear the load. Mechanical strength and stiffness are requiredof the panels, but the requirements are more stringent for the columns.
Structures include buildings, bridges, piers, highways, landfill cover, aircraft,automobiles (body, bumper, drive shaft, window, engine components, and brakes),bicycles, wheelchairs, ships, submarines, machinery, satellites, missiles, tennis rack-ets, fishing rods, skis, pressure vessels, cargo containers, furniture, pipelines, utilitypoles, armored vehicles, utensils, fasteners, etc.
In addition to mechanical properties, a structural material may be required tohave other properties, such as low density (lightweight) for fuel saving in the caseof aircraft and automobiles, for high speed in the case of racing bicycles, and forhandleability in the case of wheelchairs and armored vehicles. Another propertyoften required is corrosion resistance, which is desirable for the durability of allstructures, particularly automobiles and bridges. Yet another property that may berequired is the ability to withstand high temperatures and/or thermal cycling, as heatmay be encountered by the structure during operation, maintenance, or repair.
A relatively new trend is for a structural material to be able to serve functionsother than the structural function. The material becomes multifunctional, therebylowering cost and simplifying design. An example of a nonstructural function is thesensing of damage. Such sensing, also called structural health monitoring, is valuablefor the prevention of hazards. It is particularly important to aging aircraft and bridges.The sensing function can be attained by embedding sensors (such as optical fibers,the damage or strain of which affects the light throughput) in the structure. However,embedding usually causes degradation of the mechanical properties, and the embed-ded devices are costly and poor in durability compared to the structural material.Another way to attain the sensing function is to detect the change in property (e.g.,the electrical resistivity) of the structural material due to damage. In this way, thestructural material serves as its own sensor and is said to be “self-sensing.”
©2001 CRC Press LLC
Mechanical performance is basic to the selection of a structural material. Desir-able properties are high strength, high modulus (stiffness), high ductility, hightoughness (energy absorbed in fracture), and high capacity for vibration damping.Strength, modulus, and ductility can be measured under tension, compression, orflexure at various loading rates as dictated by the type of loading on the structure.A high compressive strength does not imply a high tensile strength. Brittle materialstend to be stronger under compression than under tension because of microcracks.High modulus does not imply high strength, as modulus describes elastic deforma-tion behavior, whereas strength describes fracture behavior. Low toughness does notimply a low capacity for vibration damping, as damping (energy dissipation) maybe due to slipping at interfaces in the material rather than the shear of a viscoelasticphase. Other desirable mechanical properties are fatigue resistance, creep resistance,wear resistance, and scratch resistance.
Structural materials are predominantly metal-based, cement-based, and polymer-based, although they also include carbon-based and ceramic-based materials, whichare valuable for high-temperature structures. Among the metal-based structural mate-rials, steel and aluminum alloys are dominant. Steel is advantageous in high strength,whereas aluminum is advantageous in low density. For high-temperature applica-tions, intermetallic compounds (such as NiAl) have emerged, though their brittlenessis a disadvantage. Metal-matrix composites are superior to the corresponding metalmatrices in high modulus, high creep resistance, and low thermal expansion coeffi-cient, but they are expensive due to the processing cost.
Among the cement-based structural materials, concrete is dominant. Althoughconcrete is an old material, improvement in long-term durability is needed, assuggested by the degradation of bridges and highways across the U.S. The improve-ment pertains to the decrease in drying shrinkage (shrinkage of the concrete duringcuring or hydration), as shrinkage can cause cracks. It also relates to the decreasein fluid permeability because water permeating into steel-reinforced concrete cancause corrosion of the reinforcing steel. Another area of improvement is freeze-thawdurability, which is the ability of the concrete to withstand temperature variationsbetween 0˚C and below (the freezing of water in concrete) and those above 0˚C (thethawing of water in concrete).
Among polymer-based structural materials, fiber-reinforced polymers are dom-inant due to their combination of high strength and low density. All polymer-basedmaterials suffer from the inability to withstand high temperatures. This inability maybe due to the degradation of the polymer itself or, in the case of a polymer-matrixcomposite, thermal stress resulting from the thermal expansion mismatch betweenthe polymer matrix and the fibers. (The coefficient of thermal expansion is typicallymuch lower for the fibers than for the matrix.)
Most structures involve joints, which may be formed by welding, brazing,soldering, the use of adhesives, or by fastening. The structural integrity of joints iscritical to the integrity of the overall structure.
As structures can degrade or be damaged, repair may be needed. Repair ofteninvolves a repair material, which may be the same as or different from the originalmaterial. For example, a damaged concrete column may be repaired by removingthe damaged portion and patching with a fresh concrete mix. A superior but much
©2001 CRC Press LLC
more costly way involves the abovementioned patching, followed by wrapping thecolumn with continuous carbon or glass fibers and using epoxy as the adhesivebetween the fibers and the column. Due to the tendency of the molecules of athermoplastic polymer to move upon heating, the joining of two thermoplastic partscan be attained by liquid-state or solid-state welding. In contrast, the molecules ofa thermosetting polymer do not move, so repair of a thermoset structure needs toinvolve other methods, such as adhesives.
Corrosion resistance is desirable for all structures. Metals, due to their electricalconductivity, are particularly prone to corrosion. In contrast, polymers and ceramics,because of their poor conductivity, are much less prone to corrosion. Techniques ofcorrosion protection include the use of a sacrificial anode (a material that is moreactive than the material to be protected, so that it is the part that corrodes) andcathodic protection (the application of a voltage that causes electrons to go into thematerial to be protected, thereby making the material a cathode). The first techniqueinvolves attaching the sacrificial anode material to the material to be protected. Thesecond technique involves applying an electrical contact material on the surface ofthe material to be protected and passing an electric current through wires embeddedin the electrical contact. The electrical contact material must be a good conductorand must be able to adhere to the material to be protected. It must also be wearresistant and scratch resistant.
Vibration damping is desirable for most structures. It is commonly attained byattaching to or embedding in the structure a viscoelastic material, such as rubber.Upon vibration, shear deformation of the viscoelastic material causes energy dissi-pation. However, due to the low strength and modulus of the viscoelastic materialcompared to the structural material, the presence of the viscoelastic material (espe-cially if it is embedded) lowers the strength and modulus of the structure. A betterway to attain vibration damping is to modify the structural material itself, so that itmaintains its high strength and modulus while providing damping. If a compositematerial is the structural material, the modification can involve the addition of afiller (particles or fibers) with a very small size, so that the total filler-matrix interfacearea is large and slippage at the interface during vibration provides a mechanism ofenergy dissipation.
1.3 ELECTRONIC APPLICATIONS
Electronic applications include electrical, optical, and magnetic applications, as theelectrical, optical, and magnetic properties of materials are largely governed byelectrons. There is overlap among these three areas of application.
Electrical applications pertain to computers, electronics, electrical circuitry(resistors, capacitors, and inductors), electronic devices (diodes and transistors),optoelectronic devices (solar cells, light sensors, and light-emitting diodes for con-version between electrical energy and optical energy), thermoelectric devices (heat-ers, coolers, and thermocouples for conversion between electrical energy and thermalenergy), piezoelectric devices (strain sensors and actuators for conversion betweenelectrical energy and mechanical energy), robotics, micromachines (or microelec-tromechanical systems, MEMS), ferroelectric computer memories, electrical inter-
©2001 CRC Press LLC

connections (solder joints, thick-film conductors, and thin-film conductors), dielec-trics (electrical insulators in bulk, thick-film, and thin-film forms), substrates forthick films and thin films, heat sinks, electromagnetic interference (EMI) shielding,cables, connectors, power supplies, electrical energy storage, motors, electrical con-tacts and brushes (sliding contacts), electrical power transmission, and eddy currentinspection (the use of a magnetically induced electrical current to indicate flaws ina material).
Optical applications have to do with lasers, light sources, optical fibers (materialsof low optical absorptivity for communication and sensing), absorbers, reflectorsand transmitters of electromagnetic radiation of various wavelengths (for opticalfilters, low-observable or Stealth aircraft, radomes, transparencies, optical lenses,etc.), photography, photocopying, optical data storage, holography, and color control.
Magnetic applications relate to transformers, magnetic recording, magnetic com-puter memories, magnetic field sensors, magnetic shielding, magnetically levitatedtrains, robotics, micromachines, magnetic particle inspection (the use of magneticparticles to indicate the location of flaws in a magnetic material), magnetic energystorage, magnetostriction (strain in a material due to the application of a magneticfield), magnetorheological fluids (for vibration damping that is controlled by amagnetic field), magnetic resonance imaging (MRI, for patient diagnosis in hospi-tals), and mass spectrometry (for chemical analysis).
All classes of materials are used for electronic applications. Semiconductors areat the heart of electronic and optoelectronic devices. Metals are used for electricalinterconnections, EMI shielding, cables, connectors, electrical contacts, and electri-cal power transmission. Polymers are used for dielectrics and cable jackets. Ceramicsare used for capacitors, thermoelectric devices, piezoelectric devices, dielectrics, andoptical fibers.
Microelectronics refers to electronics involving integrated circuits. Due to theavailability of high-quality single crystalline semiconductors, the most critical prob-lems the microelectronic industry faces do not pertain to semiconductors, but arerelated to electronic packaging, including chip carriers, electrical interconnections,dielectrics, heat sinks, etc. Section 3.2 provides more details on electronic packagingapplications.
Because of the miniaturization and increasing power of microelectronics, heatdissipation is critical to performance and reliability. Materials for heat transfer fromelectronic packages are needed. Ceramics and polymers are both dielectrics, butceramics are advantageous because of their higher thermal conductivity comparedto polymers. Materials that are electrically insulating but thermally conducting areneeded. Diamond is the best material that exhibits such properties, but it is expensive.
Because of the increasing speed of computers, signal propagation delay needsto be minimized by the use of dielectrics with low values of the relative dielectricconstant. (A dielectric with a high value of the relative dielectric constant and thatis used to separate two conductor lines acts like a capacitor, thereby causing signalpropagation delay.) Polymers have the advantage over ceramics because of their lowvalue of the relative dielectric constant.
Electronic materials are in the following forms: bulk (single crystalline, poly-crystalline, or, less commonly, amorphous), thick film (typically over 10 µm thick,
©2001 CRC Press LLC

obtained by applying a paste on a substrate by screen printing such that the pastecontains the relevant material in particle form, together with a binder and a vehicle),or thin film (typically less than 1500 Å thick, obtained by vacuum evaporation,sputtering, chemical vapor deposition, molecular beam epitaxy, or other techniques).Semiconductors are typically in bulk single-crystalline form (cut into slices called“wafers,” each of which may be subdivided into “chips”), although bulk polycrys-talline and amorphous forms are emerging for solar cells due to the importance oflow cost. Conductor lines in microelectronics are mostly in thick-film and thin-filmforms.
The dominant material for electrical connections is solder (Sn-Pb alloy). How-ever, the difference in CTE between the two members that are joined by the soldercauses the solder to experience thermal fatigue upon thermal cycling encounteredduring operation. Thermal fatigue can lead to failure of the solder joint. Polymer-matrix composites in paste form and containing electrically conducting fillers arebeing developed to replace solder. Another problem lies in the poisonous lead usedin solder to improve the rheology of the liquid solder. Lead-free solders are beingdeveloped.
Heat sinks are materials with high thermal conductivity that are used to dissipateheat from electronics. Because they are joined to materials of a low CTE (e.g., aprinted circuit board in the form of a continuous fiber polymer-matrix composite),they need to have a low CTE also. Hence, materials exhibiting both a high thermalconductivity and a low CTE are needed for heat sinks. Copper is a metal with ahigh thermal conductivity, but its CTE is too high. Therefore, copper is reinforcedwith continuous carbon fibers, molybdenum particles, or other fillers of low CTE.
1.4 THERMAL APPLICATIONS
Thermal applications are applications that involve heat transfer, whether by conduc-tion, convection, or radiation. Heat transfer is needed in heating of buildings; inindustrial processes such as casting and annealing, cooking, de-icing, etc., and incooling of buildings, refrigeration of food and industrial materials, cooling of elec-tronics, removal of heat generated by chemical reactions such as the hydration ofcement, removal of heat generated by friction or abrasion as in a brake and as inmachining, removal of heat generated by the impingement of electromagnetic radi-ation, removal of heat from industrial processes such as welding, etc.
Conduction refers to the heat flow from points of higher temperature to pointsof lower temperature in a material. It typically involves metals because of their highthermal conductivity.
Convection is attained by the movement of a hot fluid. If the fluid is forced tomove by a pump or a blower, the convection is known as forced convection. If thefluid moves due to differences in density, the convection is known as natural or freeconvection. The fluid can be a liquid (oil) or a gas (air) and must be able to withstandthe heat involved. Fluids are outside the scope of this book.
Radiation, i.e., blackbody radiation, is involved in space heaters. It refers to thecontinual emission of radiant energy from the body. The energy is in the form ofelectromagnetic radiation, typically infrared. The dominant wavelength of the emit-
©2001 CRC Press LLC

ted radiation decreases with increasing temperature of the body. The higher thetemperature, the greater the rate of emission of radiant energy per unit area of thesurface. This rate is proportional to T4, where T is the absolute temperature. It isalso proportional to the emissivity of the body, and the emissivity depends on thematerial of the body. In particular, it increases with increasing roughness of thesurface.
Heat transfer can be attained by the use of more than one mechanism. Forexample, both conduction and forced convection are involved when a fluid is forcedto flow through the interconnected pores of a solid, which is a thermal conductor.
Conduction is tied more to material development than convection or radiation.Materials for thermal conduction are specifically addressed in Chapter 2.
Thermal conduction can involve electrons, ions, and/or phonons. Electrons andions move from a point of higher temperature to a point of lower temperature, therebytransporting heat. Due to the high mass of ions compared to electrons, electronsmove much more easily. Phonons are lattice vibrational waves, the propagation ofwhich also leads to the transport of heat. Metals conduct by electrons because theyhave free electrons. Diamond conducts by phonons because free electrons are notavailable, and the low atomic weight of carbon intensifies the lattice vibrations.Diamond is the material with the highest thermal conductivity. In contrast, polymersare poor conductors because free electrons are not available and the weak secondarybonding (van der Waals’ forces) between the molecules makes it difficult for thephonons to move from one molecule to another. Ceramics tend to be more conductivethan polymers due to ionic and covalent bonding, making it possible for the phononsto propagate. Moreover, ceramics tend to have more mobile electrons or ions thanpolymers, and the movement of electrons and/or ions contributes to thermal con-duction. On the other hand, ceramics tend to be poorer than metals in thermalconductivity because of the low concentration of free electrons (if any) in ceramicscompared to metals.
1.5 ELECTROCHEMICAL APPLICATIONS
Electrochemical applications are applications that pertain to electrochemical reac-tions. An electrochemical reaction involves an oxidation reaction (such asFe → Fe2+ + 2e–) in which electrons are generated, and a reduction reaction (suchas O2 + 2H2O + 4e– → 4OH–) in which electrons are consumed. The electrode thatreleases electrons is the anode; the electrode that receives electrons is the cathode.
When the anode and cathode are electrically connected, electrons move fromthe anode to the cathode. Both the anode and cathode must be electronic conductors.As the electrons move in the wire from the anode to the cathode, ions move in anionic conductor (called the electrolyte) placed between the anode and the cathodesuch that cations (positive ions) generated by the oxidation of the anode move inthe electrolyte from the anode to the cathode.
Whether an electrode behaves as an anode or a cathode depends on its propensityfor oxidation. The electrode that has the higher propensity serves as the anode, whilethe other electrode serves as the cathode. On the other hand, a voltage can be appliedbetween the anode and the cathode at the location of the wire such that the positive
©2001 CRC Press LLC

end of the voltage is at the anode side. The positive end attracts electrons, thusforcing the anode to be oxidized, even when it may not be more prone to oxidationthan the cathode.
The oxidation reaction is associated with corrosion of the anode. For example,the oxidation reaction Fe → Fe2+ + 2e– causes iron atoms to be corroded away,becoming Fe2+ ions, which go into the electrolyte. The hindering of the oxidationreaction results in corrosion protection.
Electrochemical reactions are relevant not only to corrosion, but also to batteries,fuel cells, and industrial processes (such as the reduction of Al2O3 to make Al) thatmake use of electrochemical reactions. The burning of fossil fuels such as coal andgasoline causes pollution of the environment. In contrast, batteries and fuel cellscause fewer environmental problems.
A battery involves an anode and a cathode that are inherently different in theirpropensities for oxidation. When the anode and cathode are open-circuited at thewire, a voltage difference is present between them such that the negative end of thevoltage is at the anode side. This is because the anode wants to release electrons,but the electrons cannot come out because of the open circuit condition. This voltagedifference is the output of the battery, which is a source of direct current (DC).
A unit involving an anode and a cathode is called a “galvanic cell.” A batteryconsists of a number of galvanic cells connected in series, so that the battery voltageis the sum of the voltages of the individual cells.
An example of a battery is the lead storage battery used in cars. Lead (Pb) isthe anode, while lead dioxide (PbO2, in the form of a coating on the lead) is thecathode. Sulfuric acid (H2SO4) is the electrolyte. The oxidation reaction (anodereaction) is
Pb + HSO–4 → PbSO4 + H+ + 2e–
The reduction reaction (cathode reaction) is
PbO2 + HSO–4 + 3H+ + 2e– → PbSO4 + 2H2O
Discharge is the state of operation of the battery. The PbSO4 is a solid reactionproduct that adheres to the electrodes, hindering further reaction. A battery needsto be charged by forcing current through the battery in the opposite direction, therebybreaking down PbSO4, i.e., making the above reactions go in the reverse direction.In a car, the battery is continuously charged by an alternator.
Another example of a battery is the alkaline version of the dry cell battery. Thisbattery comprises a zinc anode and an MnO2 cathode. Because MnO2 is not anelectrical conductor, carbon powder (an electrical conductor) is mixed with the MnO2
powder in forming the cathode. The electrolyte is either KOH or NaOH. The anodereaction is
Zn + 2OH– → ZnO + H2O + 2e–
©2001 CRC Press LLC
The cathode reaction is
2MnO2 + H2O + 2e– → Mn2O3 + 2OH–
A fuel cell is a galvanic cell in which the reactants are continuously supplied.An example is the hydrogen-oxygen fuel cell. The anode reaction is
2H2 + 4OH– → 4H2O + 4e–
The cathode reaction is
4e– + O2 + 2H2O → 4OH–
The overall cell reaction (the anode and cathode reactions added together) is
2H2 (g) + O2 (g) → 2H2O (l)
which is the formation of water from the reaction of hydrogen and oxygen.During cell operation, hydrogen gas is fed to a porous carbon plate that contains
a catalyst that helps the anode reaction. The carbon is an electrical conductor, whichallows electrons generated by the anode reaction to flow. The porous carbon is knownas a “current collector.” Simultaneously, oxygen gas is fed to another porous carbonplate that contains a catalyst. The two carbon plates are electrically connected by awire; electrons generated by the anode reaction at one plate flow through the wireand enter the other carbon plate for consumption in the cathode reaction. As thisoccurs, the OH– ions generated by the cathode reaction move through the electrolyte(KOH) between the two carbon plates, and then are consumed in the anode reactionat the other carbon plate. The overall cell reaction produces H2O, which comes outof the cell at an opening located at the electrolyte between the two carbon plates.The useful output of the cell is the electric current associated with the flow ofelectrons in the wire from one plate to the other.
Materials required for electrochemical applications include the electrodes, cur-rent collector (such as the porous carbon plates of the fuel cell mentioned above),conductive additive (such as carbon powder mixed with the MnO2 powder in a drycell), and electrolyte. An electrolyte can be a liquid or a solid, as long as it is anionic conductor. The interface between the electrolyte and an electrode is intimateand greatly affects cell performance. The ability to recharge a cell is governed bythe reversibility of the cell reactions. In practice, the reversibility is not complete,leading to low charge-discharge cycle life.
1.6 ENVIRONMENTAL APPLICATIONS
Environmental applications are applications that pertain to protecting the environ-ment from pollution. The protection can involve the removal of a pollutant or thereduction in the amount of pollutant generated. Pollutant removal can be attained
©2001 CRC Press LLC

by extraction through adsorption on the surface of a solid (e.g., activated carbon)with surface porosity. It can also be attained by planting trees, which take in CO2
gas. Pollutant generation can be reduced by changing the materials and/or processesused in industry by using biodegradable materials (materials that can be degradedby Nature so that their disposal is not necessary), by using materials that can berecycled, or by changing the energy source from fossil fuels to batteries, fuel cells,solar cells, and/or hydrogen.
Materials have been developed mainly for structural, electronic, thermal, or otherapplications without much consideration of disposal or recycling problems. It is nowrecognized that such considerations must be included during the design and devel-opment of materials rather than after the materials have been developed.
Materials for adsorption are central to the development of materials for envi-ronmental applications. They include carbons, zeolites, aerogels, and other porousmaterials. Desirable qualities include large adsorption capacity, pore size largeenough for relatively large molecules and ions to lodge in, ability to be regeneratedor cleaned after use, fluid dynamics for fast movement of the fluid from which thepollutant is to be removed, and, in some cases, selective adsorption of certain species.
Activated carbon fibers are superior to activated carbon particles in fluid dynam-ics due to the channels between the fibers. However, they are much more expensive.
Pores on the surface of a material must be accessible from the outside in orderto serve as adsorption sites. In general, the pores can be macropores (> 500 Å),mesopores (between 20 and 500 Å), micropores (between 8 and 20 Å), or micro-micropores (less than 8 Å). Activated carbons typically have micropores and micro-micropores.
Electronic pollution is an environmental problem that has begun to be important.It arises from the electromagnetic waves (particularly radio waves) that are presentin the environment due to radiation sources such as cellular telephones. Such radi-ation can interfere with digital electronics such as computers, thereby causing haz-ards and affecting society’s operation. To alleviate this problem, radiation sourcesand electronics are shielded by materials that reflect and/or absorb radiation. Chapter4 addresses shielding materials.
1.7 BIOMEDICAL APPLICATIONS
Biomedical applications pertain to the diagnosis and treatment of conditions, dis-eases, and disabilities, as well as their prevention. They include implants (hips, heartvalves, skin, and teeth), surgical and diagnostic devices, pacemakers (devices forelectrical control of heartbeats), electrodes for collecting or sending electrical oroptical signals for diagnosis or treatment, wheelchairs, devices for helping thedisabled, exercise equipment, pharmaceutical packaging (for controlled release of adrug to the body or for other purposes), and instrumentation for diagnosis andchemical analysis (such as equipment for analyzing blood and urine). Implants areparticularly challenging; they need to be made of materials that are biocompatible(compatible with fluids such as blood), corrosion resistant, wear resistant, and fatigueresistant, and must be able to maintain these properties over tens of years.
©2001 CRC Press LLC

BIBLIOGRAPHY
Askeland, Donald R., The Science and Engineeing of Materials, 3rd Ed., PWS Pub. Co.,Boston (1994).
Callister, William D., Jr., Materials Science and Engineering: An Introduction, 5th Ed., Wiley,New York (2000).
Chung, D.D.L., Carbon Fiber Composites, Butterworth-Heinemann, Boston (1994).Chung, D.D.L., Ed., Materials for Electronic Packaging, Butterworth-Heinemann, Boston
(1995).Coletta, Vincent P., College Physics, Mosby, St. Louis (1995).Ohring, Milton, Engineering Materials Science, Academic Press, San Diego (1995).Schaffer, James P., Saxena, Ashok, Antolovich, Stephen D., Sanders, Thomas H., Jr., and
Warner, Steven B., The Science and Design of Engineering Materials, 2nd Ed.,McGraw-Hill, Boston (1995).
Shackelford, James F., Introduction to Materials Science for Engineers, 5th Ed., Prentice Hall,Upper Saddle River, NJ (2000).
Smith, William F., Principles of Materials Science and Engineering, 3rd Ed., McGraw-Hill,New York (1996).
White, Mary Anne, Properties of Materials, Oxford University Press, New York (1999).Zumdahl, Steven S., Chemistry, 3rd Ed., D.C. Heath and Company, Lexington, MA (1993).
©2001 CRC Press LLC
Materials for Thermal Conduction
CONTENTS
2.1 Introduction2.2 Materials of High Thermal Conductivity
2.2.1 Metals, Diamond, and Ceramics2.2.2 Metal-Matrix Composites
2.2.2.1 Aluminum-Matrix Composites2.2.2.2 Copper-Matrix Composites 2.2.2.3 Beryllium-Matrix Composites
2.2.3 Carbon-Matrix Composites2.2.4 Carbon and Graphite2.2.5 Ceramic-Matrix Composites
2.3 Thermal Interface Materials2.4 ConclusionReferences
SYNOPSIS Materials for thermal conduction are reviewed. They include materialsexhibiting high thermal conductivity (such as metals, carbons, ceramics, and com-posites), and thermal interface materials (such as polymer-based and silicate-basedpastes and solder).
2.1 INTRODUCTION
The transfer of heat by conduction is involved in the use of a heat sink to dissipateheat from an electronic package, the heating of an object on a hot plate, the operationof a heat exchanger, the melting of ice on an airport runway by resistance heating,the heating of a cooking pan on an electric range, and in numerous industrialprocesses that involve heating or cooling. Effective transfer of heat by conductionrequires materials of high thermal conductivity. In addition, it requires a good thermalcontact between the two surfaces in which heat transfer occurs. Without good thermalcontacts, the use of expensive thermal conducting materials for the components is awaste. The attainment of a good thermal contact requires a thermal interface material,
2
©2001 CRC Press LLC

such as a thermal grease, which must be thin between the mating surfaces, mustconform to the topography of the mating surfaces, and should preferably have a highthermal conductivity. This chapter is a review of materials for thermal conduction,including materials of high thermal conductivity and thermal interface materials.
2.2 MATERIALS OF HIGH THERMAL CONDUCTIVITY
2.2.1 METALS, DIAMOND, AND CERAMICS
Table 2.1 provides the thermal conductivity of various metals. Copper is mostcommonly used when materials of high thermal conductivity are required. However,copper suffers from a high value of the coefficient of thermal expansion (CTE). Alow CTE is needed when the adjoining component has a low CTE. When the CTEsof the two adjoining materials are sufficiently different and the temperature is varied,thermal stress occurs and may even cause warpage. This is the case when copper isused as a heat sink for a printed wiring board, which is a continuous fiber polymer-matrix composite that has a lower CTE than copper. Molybdenum and tungsten havelow CTE, but their thermal conductivity is poor compared to copper.
The alloy Invar® (64Fe-36Ni) is outstandingly low in CTE among metals, butit is very poor in thermal conductivity. Diamond is most attractive, as it has veryhigh thermal conductivity and low CTE, but it is expensive. Aluminum is not asconductive as copper, but it has a low density, which is attractive for aircraft elec-tronics and applications (e.g., laptop computers) which require low weight.2,3 Alu-minum nitride is not as conductive as copper, but it is attractive in its low CTE.Diamond and most ceramic materials are very different from metals in their electricalinsulation abilities. In contrast, metals are conducting both thermally and electrically.
TABLE 2.1Thermal Properties and Density of Various Materials
MaterialThermal Conductivity
(W/m.K)Coefficient of ThermalExpansion (10–6 °C–1)
Density(g/cm3)
Aluminum 247 23 2.7Gold 315 14 19.32Copper 398 17 8.9Lead 30 39 11Molybdenum 142 4.9 10.22Tungsten 155 4.5 19.3Invar 10 1.6 8.05Kovar 17 5.1 8.36Diamond 2000 0.9 3.51Beryllium oxide 260 6 3Aluminum nitride 320 4.5 3.3Silicon carbide 270 3.7 3.3
©2001 CRC Press LLC

For applications that require thermal conductivity and electrical insulation, diamondand appropriate ceramic materials can be used, but metals cannot.
2.2.2 METAL-MATRIX COMPOSITES
One way to lower the CTE of a metal is to form a metal-matrix composite1 by usinga low CTE filler. Ceramic particles such as AlN and SiC are used for this purposebecause of their combination of high thermal conductivity and low CTE. As thefiller usually has lower CTE and lower thermal conductivity than the metal matrix,the higher the filler volume fraction in the composite, the lower the CTE, and thelower the thermal conductivity.
Metal-matrix composites with discontinuous fillers are attractive for their pro-cessability into various shapes. However, layered composites in the form of a matrix-filler-matrix sandwich are useful for planar components. Discontinuous fillers aremost commonly ceramic particles. The filler sheets are usually low-CTE metal alloysheets (e.g., Invar® or 64Fe-36Ni, and Kovar® or 54Fe-29Ni-17Co). Aluminum andcopper are common metal matrices because of their high conductivity.
2.2.2.1 Aluminum-Matrix Composites
Aluminum is the most dominant matrix for metal-matrix composites for both struc-tural and electronic applications. This is because of its low cost and low meltingpoint (660°C), facilitating composite fabrication by methods that involve melting.
Liquid-phase methods for the fabrication of metal-matrix composites includeliquid metal infiltration, which usually involves using pressure from a piston orcompressed gas to push the molten metal into the pores of a porous preform com-prising the filler (particles that are not sintered) and a small amount of a binder.4-6
Pressureless infiltration is less common, but is possible.7,8 The binder prevents thefiller particles from moving during infiltration, and also provides sufficient compres-sive strength to the preform so that it will not be deformed during infiltration. Thismethod thus provides near-net-shape fabrication, i.e., the shape and size of thecomposite product are the same as those of the preform. Since machining of thecomposite is far more difficult than that of the preform, near-net-shape fabricationis desirable.
In addition to near-net-shape fabrication capability, liquid metal fabrication isadvantageous in that it provides composites with high filler volume fractions (up to70%). A high filler volume fraction is necessary to attain a low enough CTE(< 10 × 10–6/°C) in the composite, even if the filler is a low-CTE ceramic (e.g., SiC),since the aluminum matrix has a relatively high CTE.9,10 However, to attain a highvolume fraction using liquid metal infiltration, the binder used must be in a smallamount (so as to not clog the pores in the preform) and still be effective. Hence, thebinder technology11-13 is critical.
The ductility of a composite decreases as the filler volume fraction increases,so a composite with a low enough CTE is quite brittle. Although the brittleness isnot acceptable for structural applications, it is acceptable for electronic applications.
©2001 CRC Press LLC

Another liquid-phase technique is stir casting,1 which involves stirring the fillerin the molten metal and then casting. This method suffers from the nonuniformdistribution of the filler in the composite due to the difference in density betweenfiller and molten metal, and the consequent tendency of the filler to either float orsink in the molten metal prior to solidification. Stir casting also suffers from theincapability of producing composites with high filler volume fractions.
Yet another liquid-phase technique is plasma spraying,14 which involves sprayinga mixture of molten metal and filler onto a substrate. This method suffers from therelatively high porosity of the resulting composite and the consequent need fordensification by hot isostatic pressing or other methods, which are expensive.
A solid-phase technique is powder metallurgy, which involves mixing the matrixmetal powder and filler and the subsequent sintering under heat and pressure.14 Thismethod is relatively difficult for the aluminum matrix because aluminum has aprotective oxide, and the oxide layer on the surface of each aluminum particle hinderssintering. Furthermore, this method is usually limited to low-volume fractions ofthe filler.
The most common filler used is silicon carbide (SiC) particles due to the lowcost and low CTE of SiC.15 However, SiC suffers from its reactivity with aluminum.The reaction is
3SiC + 4Al → 3Si + Al4C3
It becomes more severe as the composite is heated. The aluminum carbide is a brittlereaction product that lines the filler-matrix interface of the composite, thus weak-ening the interface. Silicon, the other reaction product, dissolves in the aluminummatrix, lowering the melting temperature of the matrix and causing nonuniformityin the phase distribution and mechanical property distribution.16 Also, the reactionconsumes a part of the SiC filler.17
A way to diminish this reaction is to use an Al-Si alloy matrix, since the siliconin the alloy matrix promotes the opposite reaction. However, the Al-Si matrix is lessductile than the Al matrix, causing the mechanical properties of the Al-Si matrixcomposite to be very poor compared to those of the corresponding Al-matrix com-posite. Therefore, the use of an Al-Si alloy matrix is not a solution to the problem.
An effective solution is to replace Si-C by aluminum nitride (AlN) particles,which do not react with aluminum, resulting in superior mechanical properties inthe composite.18 The fact that AlN has a higher thermal conductivity than SiC helpsthe thermal conductivity of the composite. Since the cost of the composite fabricationprocess dominates the cost of producing composites, the higher material cost of AlNcompared to SiC does not matter, especially for electronic packaging. Aluminumoxide (Al2O3) also does not react with aluminum, but it is low in thermal conductivityand suffers from particle agglomeration.18
Other than ceramics such as SiC and AlN, a filler used in aluminum-matrixcomposites is carbon in the form of fibers of diameter around 10 µm19-23 and, lesscommonly, filaments of diameter less than 1 µm.24 Carbon also suffers from reactivitywith aluminum to form aluminum carbide. However, fibers are more effective than
©2001 CRC Press LLC
particles for reducing the CTE of the composite. Carbon fibers can even be contin-uous in length. Moreover, carbon, especially when graphitized, is much more ther-mally conductive than ceramics. In fact, carbon fibers that are sufficiently graphiticare even more thermally conductive than the metal matrix, so the thermal conduc-tivity of the composite increases with increasing fiber volume fraction. However,these fibers are expensive. The mesophase-pitch-based carbon fiber K-1100 fromBP Amoco Chemicals exhibits longitudinal thermal conductivity of 1000 W/m.K.25,26
Both carbon and SiC form a galvanic couple with aluminum, which is the anode.It is the component in the composite that is corroded. The corrosion becomes moresevere in the presence of heat and/or moisture.
The thermal conductivity of aluminum-matrix composites depends on the fillerand its volume fraction, the alloy matrix heat treatment condition, and the filler-matrix interface.18,27
To increase the thermal conductivity of SiC aluminum-matrix composite, adiamond film can be deposited on the composite. 28 The thermal conductivity ofsingle crystal diamond is 2000–2500 W/m.K, though a diamond film is not singlecrystalline.
2.2.2.2 Copper-Matrix Composites
Because copper is heavy, the filler does not have to be lightweight. Thus, low CTEbut heavy metals such as tungsten,29,30 molydenum, 31,32 and Invar®33-35 are used asfillers. These metals (except Invar) have the advantage that they are quite conductivethermally and are available in particle and sheet forms; they are suitable for partic-ulate as well as layered36,37 composites. Another advantage of the metal fillers isbetter wettability of molten matrix metal with metal fillers than with ceramic fillers,which is important if the composite is fabricated by a liquid phase method.
An advantage of copper over aluminum is its nonreactivity with carbon, socarbon is a highly suitable filler for copper. Additional advantages are that carbonis lightweight and its fibers are available in a continuous form. Furthermore, copperis a rather noble metal, as shown by its position in the Electromotive Series, so itdoes not suffer from the corrosion that plagues aluminum. Carbon used as a fillerin copper is in the form of fibers of diameter around 10 µm.22,38-45 As carbon fibersthat are sufficiently graphitic are even more thermally conductive than copper, thethermal conductivity of a copper-matrix composite can exceed that of copper. Lesscommon fillers for copper are ceramics such as silicon carbide, titanium diboride(TiB2), and alumina.46-48
The melting point of copper is much higher than that of aluminum, so thefabrication of copper-matrix composites is commonly done by powder metallurgy,although liquid metal infiltration is also used.22,49,50 In the case of liquid metalinfiltration, the metal matrix is often a copper alloy (e.g., Cu-Ag) chosen for reducedmelting temperature and good castability.50
Powder metallurgy conventionally involves mixing the metal matrix powder andthe filler, and subsequently pressing and then sintering under either heat or both heatand pressure. The problem with this method is that it is limited to low-volume
©2001 CRC Press LLC
fractions of the filler. In order to attain high-volume fractions, a less conventionalmethod of powder metallurgy is recommended. This method involves coating thematrix metal on the filler units, followed by pressing and sintering.32,46,51,52 Themixing of matrix metal powder with the coated filler is not necessary, although itcan be done to decrease the filler volume fraction in the composite. The metal coatingon the filler forces the distribution of matrix metal to be uniform, even when themetal volume fraction is low (i.e., when the filler volume fraction is high). With theconventional method, the matrix metal distribution is not uniform when the fillervolume fraction is high, causing porosity and the presence of filler agglomerates, ineach of which the filler units directly touch one another; this microstructure resultsin low thermal conductivity and poor mechanical properties.
Continuous carbon fiber copper-matrix composites can be made by coating thefibers with copper and then diffusion bonding (i.e., sintering).38,40,44,53-55 This methodis akin to the abovementioned less conventional method of powder metallurgy.
Less common fillers used in copper include diamond powder,50,56 aluminosilicatefibers,57 and Ni-Ti alloy rod.58 The Ni-Ti alloy is attractive for its negative CTE of–21 × 10–6/°C. The coating of a carbon fiber copper-matrix composite with a diamondfilm has been undertaken to enhance thermal conductivity.43
2.2.2.3 Beryllium-Matrix Composites
Beryllium oxide (BeO) has a high thermal conductivity (Table 2.1). Beryllium-matrixBeO-platelet composites with 20-60 vol.% BeO exhibit low density (2.30 g/cm3 at40 vol.% BeO, compared to 2.9 g/cm3 for Al/SiC at 40 vol.% SiC), high thermalconductivity (232 W/m.K at 40 vol.% BeO, compared to 130 W/m.K for Al/SiC at40 vol.% SiC), low CTE (7.5 × 10⁻⁶/°C at 40 vol.% BeO, compared to 12.1 × 10⁻⁶/°Cat 40 vol.% SiC), and high modulus (317 GPa at 40 vol.% BeO, compared to 134 GPafor Al/SiC at 40 vol.% SiC).59,60
2.2.3 CARBON-MATRIX COMPOSITES
Carbon is an attractive matrix for composites for thermal conduction because of itsthermal conductivity and low CTE. Furthermore, it is corrosion resistant and light-weight. Yet another advantage of the carbon matrix is its compatibility with carbonfibers, in contrast to the common reactivity between a metal matrix and its fillers.Hence, carbon fibers are the dominant filler for carbon-matrix composites. Compos-ites with both filler and matrix of carbon are called carbon-carbon composites.61
Their primary applications are heat sinks,62 thermal planes,63 and substrates.64 Thereis considerable competition between carbon-carbon composites and metal-matrixcomposites for the same applications.
The main drawback of carbon-matrix composites is their high cost of fabrication,which involves making a pitch-matrix or resin-matrix composite and subsequentcarbonization of the pitch or resin by heating at 1000–1500°C in an inert atmosphere.After carbonization, the porosity is substantial in the carbon matrix, so pitch or resinis impregnated into the composite and carbonization is carried out again. Quite afew impregnation-carbonization cycles are needed to reduce the porosity to an
©2001 CRC Press LLC

acceptable level, resulting in high cost. Graphitization by heating at 2000–3000°Cin an inert atmosphere may follow carbonization in order to increase thermal con-ductivity, which increases with the degree of graphitization. However, graphitizationis an expensive step. Some or all of the impregnation-carbonization cycles may bereplaced by chemical vapor infiltration (CVI), in which a carbonaceous gas infiltratesthe composite and decomposes to form carbon.
Carbon-carbon composites have been made by using conventional carbon fibersof diameters around 10 µm.62,63,65 and by using carbon filaments grown catalyticallyfrom carbonaceous gases and of diameters less than 1 µm.24 By using graphitizedcarbon fibers, thermal conductivities exceeding that of copper can be reached.
To increase thermal conductivity, carbon-carbon composites have been impreg-nated with copper66,67 and have been coated with a diamond film.68
2.2.4 CARBON AND GRAPHITE
An all-carbon material (called ThermalGraph®, a tradename of BP Amoco Chemi-cals), made by consolidating oriented precursor carbon fibers without a binder andsubsequent carbonization and optional graphitization, exhibits thermal conductivityranging from 390 to 750 W/m.K in the fiber direction of the material.
Another material is pyrolytic graphite (called TPG) encased in a structuralshell.69 The graphite, highly textured with the c-axes of the grains perpendicular tothe plane of the graphite, has an in-plane thermal conductivity of 1700 W/m.K (fourtimes that of copper), but it is mechanically weak because of the tendency to shearin the plane of the graphite. The structural shell serves to strengthen by hinderingshear.
Pitch-derived carbon foams, with thermal conductivity up to 150 W/m.K aftergraphitization, are attractive for their high specific thermal conductivity (thermalconductivity divided by the density).70
2.2.5 CERAMIC-MATRIX COMPOSITES
The SiC matrix is attractive due to its high CTE compared to the carbon matrix,though it is not as thermally conductive as carbon. The CTE of carbon-carboncomposites is too low (0.25 × 10⁻⁶/°C), resulting in reduced fatigue life in chip-on-board (COB) applications with silica chips (CTE = 2.6 × 10⁻⁶/°C). The SiC-matrixcarbon fiber composite is made from a carbon-carbon composite by converting thematrix from carbon to SiC.65 To improve the thermal conductivity of the SiC-matrixcomposite, coatings in the form of chemical vapor-deposited AlN or Si have beenused. The SiC-matrix metal (Al or Al-Si) composite, as made by a liquid-exchangeprocess, also exhibits relatively high thermal conductivity.71
Borosilicate glass matrix is attractive due to its low dielectric constant (4.1 at 1MHz for B2O3-SiO2-Al2O3-Na2O glass) compared to 8.9 for AlN, 9.4 for alumina(90%), 42 for SiC, 6.8 for BeO, 7.1 for cubic boron nitride, 5.6 for diamond, and5.0 for glass-ceramic. A low value of the dielectric constant is desirable for electronicpackaging applications. On the other hand, glass has a low thermal conductivity, sofillers with relatively high thermal conductivity are used with the glass matrix. Anexample is continuous SiC fibers, the glass-matrix composites of which are made
©2001 CRC Press LLC

by tape casting followed by sintering.72 Another example is aluminum nitride withinterconnected pores (about 28 vol.%), the composites of which are obtained byglass infiltration to a depth of about 100 µm.72-74
2.3 THERMAL INTERFACE MATERIALS
The improvement of a thermal contact involves the use of a thermal interfacematerial, such as a thermal fluid, a thermal grease (paste), a resilient thermalconductor, or solder that is applied in the molten state. A thermal fluid, thermalgrease, or molten solder is spread on the mating surfaces. A resilient thermalconductor is sandwiched by the mating surfaces and held in place by pressure.Thermal fluids are most commonly mineral oil. Thermal greases (pastes) are usuallyconducting particle-filled silicone. Resilient thermal conductors are conducting par-ticle-filled elastomers. Of these four types of thermal interface materials, thermalgreases (based on polymers, particularly silicone) and solder are by far the mostcommon. Resilient thermal conductors are not as well developed as thermal fluidsor greases.
As the materials to be interfaced are good thermal conductors, the effectivenessof a thermal interface material is enhanced by high thermal conductivity and lowthickness of the interface material, and low thermal contact resistance between theinterface material and each mating surface. As the mating surfaces are not perfectlysmooth, the interface material must be able to flow or deform so as to conform tothe topography of the mating surfaces. If the interface material is a fluid, grease, orpaste, it should have a high fluidity (workability) in order to conform and to havea small thickness after mating. On the other hand, the thermal conductivity of thegrease or paste increases with increasing filler content, and this is accompanied bya decrease in workability. Without a filler, as in the case of an oil, thermal conduc-tivity is poor. A thermal interface material in the form of a resilient thermal conductorsheet (e.g., felt consisting of conducting fibers held together without a binder, anda resilient polymer-matrix composite containing a thermally conducting filler) cannotbe as thin or conformable as one in the form of a fluid, grease, or paste, so itseffectiveness requires a very high thermal conductivity.
Solder is commonly used as a thermal interface material for enhancing thethermal contact between two surfaces. This is because it can melt at rather lowtemperatures and the molten solder can flow and spread itself thinly on the adjoiningsurfaces, resulting in high thermal contact conductance at the interface between thesolder and each of the adjoining surfaces. Furthermore, solder in the metallic solidstate is a good thermal conductor. In spite of its high thermal conductivity, thethickness of the solder greatly influences its effectiveness as a thermal interfacematerial. When solder is used as a thermal interface material between copper sur-faces, increasing the thickness of solder from 10 to 30 µm increases the heat transfertime by 25%. The effect is akin to replacing solder with an interface material thatis 80% lower in thermal conductivity. It is also akin to decreasing the thermal contactconductance of the solder-copper interface by 70%.75
Thermal pastes are predominantly based on polymers, particularly silicone,76-79
although thermal pastes based on sodium silicate have been reported to be superior
©2001 CRC Press LLC

in providing high thermal contact conductance.80 The superiority of sodium-silicate-based pastes over silicone-based pastes is primarily due to the low viscosity ofsodium silicate compared to silicone, and the importance of high fluidity in the pasteso that it can conform to the topography of the surfaces it interfaces.
A particularly attractive thermal paste is based on polyethylene glycol (PEG, apolymer) of a low molecular weight (400 amu).81 These pastes are superior tosilicone-based pastes and are as good as sodium-silicate-based pastes because of thelow viscosity of PEG and the contribution to thermal conduction of lithium ions (adopant) in the paste. Compared to sodium-silicate-based pastes, PEG-based pastesare advantageous in their long-term compliance, in contrast to the long-term rigidityof sodium silicate. Compliance is attractive for decreasing thermal stress, which cancause thermal fatigue.
Table 2.2 presents the thermal contact conductance for different thermal interfacematerials. Included in the comparison are results obtained with the same testingmethod on silicone-based paste, sodium-silicate-based pastes, and solder.80,81 PEG(i.e., A) gives much higher thermal contact conductance (11.0 × 10⁴ W/m2.°C) thansilicone (3.08 × 10⁴ W/m2.°C), due to its relatively low viscosity, but the conductanceis lower than that given by sodium silicate (14.1 × 10⁴ W/m2.°C) in spite of its lowviscosity because of the molecular nature of PEG. The addition of the Li salt (1.5wt.%) to PEG (i.e., to obtain C) raises the conductance from 11.0 × 10⁴ to 12.3 ×10⁴ W/m2.°C, even though the viscosity is increased. The further addition of waterand DMF (i.e., F) raises the conductance to 16.0 × 10⁴ W/m2.°C and decreases theviscosity. Thus, the addition of water and DMF is very influential, as water andDMF help the dissociation of the lithium salt. The further addition of BN particles(18.0 vol.%) (i.e., F2) raises the conductance to 18.9 × 10⁴ W/m2.°C. The positiveeffect of BN is also shown by comparing the results of C and D (which are withoutwater or DMF) and by comparing the results of A and B (which are without Li+).In the absence of the lithium salt, water and DMF also help, though not greatly, asshown by comparing A and J. The viscosity increases with the lithium salt content,as shown by comparing J, E, F, G, H, and I.
Comparison of E, F, G, H, and I shows that the optimum lithium salt contentfor the highest conductance is 1.5 wt.%. That an intermediate lithium salt contentgives the highest conductance is probably because of the enhancement of the thermalconductivity by the Li+ ions and the increase of the viscosity. Both high conductivityand low viscostiy are desirable for a high-contact conductance. Comparison of F1,F2, F3, and F4 shows that the optimum BN content is 18.0 vol.%, as also indicatedby comparing G1, G2, G3, and G4. Among all the PEG-based pastes, the highestconductance is given by F2, as it has the optimum lithium salt content as well as theoptimum BN content. An optimum BN content also occurs for BN-filled sodium-silicate-based pastes.80 It is due to the increase in both thermal conductivity andviscosity as the BN content increases. The best PEG-based paste (i.e., F2) is similarto the best sodium-silicate-based paste in conductance. Both are better than BN-filled silicone, but both are slightly inferior to solder. Although solder gives thehighest conductance, it suffers from the need for heating during soldering. In con-trast, heating is not needed for the use of PEG-based, silicone-based, or silicate-based pastes.
©2001 CRC Press LLC

2.4 CONCLUSIONMaterials for thermal conduction include those exhibiting high thermal conductivity, aswell as thermal interface materials. The former includes metals, diamond, carbon, graph-ite, ceramics, metal-matrix composites, carbon-matrix composites, and ceramic-matrixcomposites. The latter includes polymer-based pastes, silicate-based pastes, and solder.
TABLE 2.2Thermal Contact Conductance for Various Thermal Interface Materials between Copper Disks at 0.46 Ma Contact Pressure80,81
Thermal Interface Material
Description DesignationInterface Material
Thickness (µm)(±10)
Thermal Contact Conductance
(104 W/m2.°C)
Viscosity(cps)
(± 0.3)
PEG A <25 11.0 ± 0.3 127b
PEG + BN (18 vol.%) B 25 12.3 ± 0.3 /PEG + Li salt (1.5 wt.%) C <25 12.3 ± 0.3 143b
PEG + Li salt (1.5 wt.%)+ BN (18 vol.%)
D 25 13.4 ± 0.4 /
PEG + water + DMF J <25 12.5 ± 0.2 75.6b
J + Li salt (0.75 wt.%) E <25 11.4 ± 0.3 79.7b
J + Li salt (1.5 wt.%) F <25 16.0 ± 0.5 85.6b
J + Li salt (3.0 wt.%) G <25 11.6 ± 0.2 99.0b
J + Li salt (4.5 wt. %) H <25 9.52 ± 0.25 117b
J + Li salt (6.0 wt.%) I <25 7.98 ± 0.16 120b
F + BN (16.0 vol.%) F1 25 18.5 ± 0.8 /F + BN (18.0 vol.%) F2 25 18.9 ± 0.8 /F + BN (19.5 vol. %) F3 25 15.3 ± 0.2 /F + BN (21.5 vol.%) F4 25 14.0 ± 0.5 /G + BN (16.0 vol.%) G1 25 17.0 ± 0.5 /G + BN (18.0 vol.%) G2 25 17.3 ± 0.6 /G + BN (19.5 vol.%) G3 25 14.9 ± 0.6 /G + BN (21.5 vol.%) G4 25 13.4 ± 0.4 /H + BN (18.0 vol.%) H1 25 13.9 ± 0.4 /Solder / 25 20.8 ± 0.6a /Sodium silicate + BN (16.0 vol. %)
/ 25 18.2 ± 0.7 /
Sodium silicate + BN (17.3 vol. %)
/ 25 15.5 ± 0.4 /
Sodium silicate / <25 14.1 ± 0.5 206c
Silicone/BN / 25 10.9 ± 1.5 /Silicone / <25 3.08 ± 0.03 8800d
None / / 0.681 ± 0.010 /
a At zero contact pressure (not 0.46 MPa)b Measured using the Ubbelohde methodc Measured using the Ostwald methodd Value provided by the manufacturer
©2001 CRC Press LLC
REFERENCES
1. P.K. Rohatgi, Defence Sci. J., 43(4), 323-349 (1993).2. W.M. Peck, American Society of Mechanical Engineers, Heat Transfer Division,
HTD, 329(7), 245-253 (1996).3. A.L. Geiger and M. Jackson, Adv. Mater. Proc., 136(1), 6 (1989).4. S. Lai and D.D.L. Chung, J. Mater. Sci., 29, 3128-3150 (1994).5. X. Yu, G. Zhang and R. Wu, J. Mater. Eng., 6, 9-12 (June 1994).6. B.E. Novich and R.W. Adams, Proc. 1995 Int. Electronics Packaging Conf., Int.
Electronics Packaging Society, pp. 220-227 (1995).7. X.F. Yang and X.M. Xi, J. Mater. Res., 10(10), 2415-2417 (1995).8. J.A. Hornor and G.E. Hannon, 6th Int. Electronics Packaging Conf., pp. 295-307
(1992).9. Y.-L. Shen, A. Needleman and S. Suresh, Met. Mater. Trans., 5A(4), 839-850 (1994).
10. Y.-L. Shen, Mater. Sci. Eng. A, 2, 269-275 (Sept. 1998).11. J. Chiou and D.D.L. Chung, J. Mater. Sci., 28, 1435-1446 (1993).12. J. Chiou and D.D.L. Chung, J. Mater. Sci., 28, 1447-1470 (1993).13. J. Chiou and D.D.L. Chung, J. Mater. Sci., 28, 1471-1487 (1993).14. M.E. Smagorinski, P.G. Tsantrizos, S. Grenier, A. Cavasin, T. Brzezinski and G. Kim,
Mater. Sci. Eng. A, 1, 86-90 (Mar. 1998).15. K. Schmidt, C. Zweben and R. Arsenault, ASTM Special Technical Publication, No.
1080, pp. 155-164 (1990).16. S. Lai and D.D.L. Chung, J. Mater. Sci., 29, 2998-3016 (1994).17. S. Lai and D.D.L. Chung, J. Mater. Chem., 6, 469-477 (1996).18. S. Lai and D.D.L. Chung, J. Mater. Sci., 29, 6181-6198 (1994).19. S. Wagner, M. Hook and E. Perkoski, Proc. Electricon ’93, Electronics Manufacturing
Productivity Facility, pp. 11/1-11/14 (1993).20. O.J. Ilegbusi, (Paper) ASME, 93-WA/EEP-28, pp. 1-7 (1993).21. M.A. Lambert and L.S. Fletcher, HTD Vol. 292, Heat Transfer in Electronic Systems,
ASME, pp. 115-122 (1994).22. M.A. Lambert and L.S. Fletcher, J. Heat Transfer Trans., 118(2), 478-480 (1996).23. M.A. Kinna, 6th Int. SAMPE Electronics Conf., pp. 547-555 (1992).24. J.-M. Ting, M.L. Lake and D.R. Duffy, J. Mater. Res., 10(6), 1478-1484 (1995).25. T.F. Fleming, C.D. Levan and W.C. Riley, Proc. Technical Conf., Int. Electronics
Packaging Conf., pp. 493-503 (1995).26. T.F. Fleming and W.C. Riley, Proc. SPIE — The Int. Soc. for Optical Eng., Vol. 1997,
pp. 136-147 (1993).27. H. Wang and S.H.J. Lo, J. Mater. Sci. Lett., 15(5), 369-371 (1996).28. R.E. Morgan, S.L. Ehlers and J. Sosniak, 6th Int. SAMPE Electronics Conf., pp. 320-
333 (1992).29. S. Yoo, M.S. Krupashankara, T.S. Sudarshan and R.J. Dowding, Mater. Sci. Tech.,
14(2), 170-174 (1998).30. Anonymous, Metal Powder Report, 4, 28-31 (1997).31. T.W. Kirk, S.G. Caldwell and J.J. Oakes, Particulate Materials and Processes,
Advances in Powder Metallurgy, Metal Powder Industries Federation, Vol. 9, pp.115-122 (1992).
32. P. Yih and D.D.L. Chung, J. Electron. Mater., 24(7), 841-851 (1995).33. S. Jha, 1995 Proc. 45th Electronic Components & Technology Conf., IEEE, pp.
542-547 (1995).34. R. Chanchani and P.M. Hall, IEEE Trans. Components Hybrids Manuf. Technol.,
13(4), 743-750 (1990).
©2001 CRC Press LLC

35. C. Woolger, Materials World, 4(6), 332-333 (1996).36. R. Chanchani and P.M. Hall, Proc. 40th Electronic Components and Technology
Conference, IEEE, pp. 94-102 (1990).37. J.R. Hanson and J.L. Hauser, Electron. Packaging Prod., 26(11), 48-51 (1986).38. J. Korab, G. Korb and P. Sebo, Proc. IEEE/CPMT Int. Electronics Manufacturing
Technology (IEMT) Symp., pp. 104-108 (1998).39. J. Korab, G. Korb, P. Stefanik and H.P. Degischer, Composites, Part A, 30(8),
1023-1026 (1999).40. G. Korb, J. Koráb and G. Groboth, Composites, Part A, 29A, 1563-1567 (1998).41. M.A. Kinna, 6th Int. SAMPE Electronics Conf., pp., 547-555 (1992).42. M.A. Lambert and L.S. Fletcher, HTD Vol. 292, Heat Transfer in Electronic Systems,
ASME, pp. 115-122 (1994).43. C.H. Stoessel, C. Pan, J.C. Withers, D. Wallace and R.O. Loutfy, Mater. Res. Soc.
Symp. Proc., Vol. 390, pp. 147-152 (1995).44. Y. LePetitcorps, J.M. Poueylaud, L. Albingre, B. Berdeu, P. Lobstein and J.F. Silvain,
Key Engineering Materials, 127-131, 327-334 (1997).45. K. Prakasan, S. Palaniappan and S. Seshan, Composites, Part A, 28(12), 1019-1022
(1997).46. P. Yih and D.D.L. Chung, Int. J. Powder Met., 31(4), 335-340 (1995).47. M. Ruhle, Key Engineering Materials, 116-117, 1-40 (1996).48. M. Ruhle, J. Eur. Ceramic Soc., 16(3), 353-365 (1996).49. K. Prakasan, S. Palaniappan and S. Seshan, Composites, Part A, 28(12), 1019-1022
(1997).50. J.A. Kerns, N.J. Colella, D. Makowiecki and H.L. Davidson, Int. J. Microcircuits
Electron. Packaging, 19(3), 206-211 (1996).51. P. Yih and D.D.L. Chung, J. Mater. Sci., 32(7), 1703-1709 (1997).52. P. Yih and D.D.L. Chung, J. Mater. Sci., 32(11), 2873-2894 (1997).53. C.H. Stoessel, J.C. Withers, C. Pan, D. Wallace and R.O. Loutfy, Surf. Coatings Tech.,
76-77, 640-644 (1995).54. Y.Z. Wan, Y.L. Wang, G.J. Li, H.L. Luo and G.X. Cheng, J. Mater. Sci. Lett., 16,
1561-1563 (1997).55. D.A. Foster, 34th Int. SAMPE Symp. Exhib., Book 2, pp. 1401-1410 (1989).56. H.L. Davidson, N.J. Colella, J.A. Kerns and D. Makowiecki, 1995 Proc. 45th Elec-
tronic Components & Technology Conf., IEEE, pp. 538-541 (1995).57. K. Prakasan, S. Palaniappan and S. Seshan, Composites, Part A, 28(12), 1019-1022
(1997).58. H. Mavoori and S. Jin, JOM, 50(6), 70-72 (1998).59. T.B. Parsonage, 7th Int. SAMPE Electronics Conf., pp. 280-295 (1994).60. T.B. Parsonage, National Electronic Packaging and Production Conf. — Proc. Tech-
nical Program (West and East), pp. 325-334 (1996).61. K.M. Kearns, Proc. Int. SAMPE Symp. Exhib., 43(2), 1362-1369 (1998).62. W.H. Pfeifer, J.A. Tallon, W.T. Shih, B.L. Tarasen and G.B. Engle, 6th Int. SAMPE
Electronics Conf., pp. 734-747 (1992).63. W.T. Shih, F.H. Ho and B.B. Burkett, 7th Int. SAMPE Electronics Conf., pp. 296-309
(1994).64. W. Kowbel, X. Xia and J.C. Withers, 43rd Int. SAMPE Symp., pp. 517-527 (1998).65. W. Kowbel, X. Xia, C. Bruce and J.C. Withers, Mater. Res. Soc. Symp. Proc., Vol.
515, pp. 141-146 (1998).66. S.K. Datta, S.M. Tewari, J.E. Gatica, W. Shih and L. Bentsen, Met. Mater. Trans. A,
30A, 175-181 (1999).
©2001 CRC Press LLC
67. W.T. Shih, Proc. Int. Electronics Packaging Conf., pp. 211-219 (1995).68. J.-M. Ting and M.L. Lake, Diamond and Related Materials, 3(10), 1243-1248 (1994.69. M.J. Montesano, Mat. Tech., 11(3), 87-91 (1996).70. J. Klett, C. Walls and T. Burchell, Ext. Abstr. Program — 24th Bienn. Conf. Carbon,
pp. 132-133 (1999).71. L. Hozer, Y.-M. Chiang, S. Ivanova and I. Bar-On, J. Mater. Res., 12(7), 1785-1789
(1997).72. P.N. Kumta, J. Mater. Sci., 31(23), 6229-6240 (1996).73. P.N. Kumta, T. Mah, P.D. Jero and R.J. Kerans, Mater. Lett., 21(3-4), 329-333 (1994).74. J.Y. Kim and P.N. Kumta, Proc. IEEE 1998 National Aerospace and Electronics Conf.,
pp. 656-665 (1998).75. X. Luo and D.D.L. Chung, J. Electron. Packaging, in press.76. S.W. Wilson, A.W. Norris, E.B. Scott and M.R. Costello, National Electronic Pack-
aging and Production Conference, Proc. Technical Program, Vol. 2, pp. 788-796(1996).
77. A.L. Peterson, Proc. 40th Electronic Components and Technology Conf., IEEE, Vol.1, pp. 613-619 (1990).
78. X. Lu, G. Xu, P.G. Hofstra and R.C. Bajcar, J. Polymer Sci., 36(13), 2259-2265(1998).
79. T. Sasaski, K. Hisano, T. Sakamoto, S. Monma, Y. Fijimori, H. Iwasaki and M.Ishizuka, Japan IEMT Symp. Proc. IEEE/CPMT Int. Electronic Manufacturing Tech-nology (IEMT) Symp., pp. 236-239 (1995).
80. Y. Xu, X. Luo and D.D.L. Chung, J. Electron. Packaging, 122(2), 128-131 (2000).81. Y. Xu, X. Luo and D.D.L. Chung, J. Electron. Packaging, in press.
©2001 CRC Press LLC

Polymer-Matrix Composites for Microelectronics
CONTENTS
3.1 Introduction3.2 Applications in Microelectronics3.3 Polymer-Matrix Composites
3.3.1 Polymer-Matrix Composites with Continuous Fillers3.3.2 Polymer-Matrix Composites with Discontinuous Fillers
3.4 SummaryReferences
SYNOPSIS Polymer-matrix composite materials for microelectronics are reviewedin terms of the science and applications. They include those with continuous and dis-continuous fillers in the form of particles and fibers, as designed for high thermal con-ductivity, low thermal expansion, low dielectric constant, high/low electricalconductivity, and electromagnetic interference shielding. Applications include heatsinks, housings, printed wiring boards, substrates, lids, die attach, encapsulation,interconnections, and thermal interface materials.
RELEVANT APPENDICES: A, B, C
3.1 INTRODUCTION
Composite materials are usually designed for use as structural materials. With therapid growth of the electronics industry, they are finding more and more electronicapplications. Due to the vast difference in property requirements between structuraland electronic composites, the design criteria are different. While structural com-posites emphasize high strength and high modulus, electronic composites emphasizehigh thermal conductivity, low thermal expansion, low dielectric constant, high/low
3
©2001 CRC Press LLC
electrical conductivity, and/or electromagnetic interference (EMI) shielding effec-tiveness, depending on the particular electronic application. Low density is desirablefor both aerospace structures and aerospace electronics. Structural composites stressprocessability into large parts, such as panels, whereas electronic composites empha-size processability into small parts, such as stand-alone films and coatings. Becauseof the small size of the parts, material costs tend to be less of a concern for electroniccomposites than for structural composites. For example, electronic composites canuse expensive fillers such as silver particles, which provide high electrical conduc-tivity.
3.2 APPLICATIONS IN MICROELECTRONICS
The applications of polymer-matrix composites in microelectronics include inter-connections, printed circuit boards, substrates, encapsulations, interlayer dielectrics,die attach, electrical contacts, connectors, thermal interface materials, heat sinks,lids, and housings. In general, the integrated circuit chips are attached to a substrateor a printed circuit board on which the interconnection lines have been written oneach layer of the multilayer substrate or board. To increase the interconnectiondensity, another multilayer involving thinner layers of conductors and interlayerdielectrics may be applied to the substrate before the chip is attached. By means ofsoldered joints, wires connect between electrical contact pads on the chip andelectrical contact pads on the substrate or board. The chip may be encapsulated witha dielectric for protection. It may also be covered by a thermally conducting (metal)lid. The substrate or board is attached to a heat sink. A thermal interface materialmay then be placed between the substrate or board and the heat sink to enhance thequality of the thermal contact. The whole assembly may be placed in a thermallyconducting housing.
A printed circuit board is a sheet for the attachment of chips, whether mountedon substrates, chip carriers, or otherwise, and for drawing interconnections. It is apolymer-matrix composite that is electrically insulating and has four conductor lines(interconnections) on one or both sides. Multilayer boards have lines on each insidelayer so that interconnections on different layers may be connected by short con-ductor columns called electrical vias. Printed circuit boards for mounting pin-inserting-type packages need to have lead insertion holes punched through them.Printed circuit boards for surface-mounting-type packages need no holes. Surface-mounting-type packages, whether with leads, leaded chip carriers, without leads, orleadless chip carriers (LLCCs), can be mounted on both sides of a circuit board,whereas pin-inserting-type packages can only be mounted on one side. In surfacemounting technology (SMT), the surfaces of conductor patterns are connectedtogether electrically without employing holes. Solder is used to make electricalconnections between a surface-mounting-type package (leaded or leadless) and acircuit board. A lead insertion hole for pin-inserting-type packages is a plated-through hole, a hole on whose wall a metal is deposited to form a conductingpenetrating connection. After pin insertion, the space between the wall and the pinis filled by solder to form a solder joint. Another type of plated-through hole is avia hole, which connects different conductor layers without the insertion of a lead.
©2001 CRC Press LLC
A substrate, also called a chip carrier, is a sheet on which one or more chipsare attached and interconnections are drawn. In the case of a multilayer substrate,interconnections are also drawn on each layer inside the substrate such that inter-connections in different layers are connected, if desired, by electrical vias. A sub-strate is usually an electrical insulator. Substrate materials include ceramics (Al2O3,AlN, mullite, or glass ceramics), polymers (polyimide), semiconductors (silicon),and metals (aluminum). The most common substrate material is Al2O3. As the sin-tering of Al2O3 requires temperatures greater than 1000°C, the metal interconnectionsneed to be refractory, such as tungsten or molybdenum. The disadvantages oftungsten and molybdenum lie in higher electrical resistivity compared to copper. Inorder to make use of more conductive metals (e.g., Cu, Au, and Ag-Pd) as theinterconnections, ceramics that sinter at temperatures below 1000°C can be used inplace of Al2O3. The competition between ceramics and polymers for substrates isincreasingly keen. Ceramics and polymers are both electrically insulating; ceramicsare advantageous in that they have higher thermal conductivity than polymers;polymers are advantageous in that they have lower dielectric constant than ceramics.A high thermal conductivity is attractive for heat dissipation; a low dielectric constantis appealing for a smaller capacitive effect, hence a smaller signal delay. Metals aredesirable for their very high thermal conductivity compared to ceramics and poly-mers.
An interconnection is a conductor line for signal transmission, power, or ground.It is usually in the form of a thick film of thickness > 1 µm. It can be on a chip, asubstrate, or a printed circuit board. The thick film is made by either screen printingor plating. Thick-film conductor pastes containing silver particles and glass frit(binder that functions by the viscous flow of glass upon heating) are widely used toform thick-film conductor lines on substrates by screen printing and subsequentfiring. These films suffer from the reduction of electrical conductivity by the presenceof the glass, and by the porosity in the film after firing. The choice of a metal in athick-film paste depends on the need for withstanding air oxidation in the heatingencountered in subsequent processing, which can be the firing of the green thick-film together with the green ceramic substrate (a process known as cofiring). It isduring cofiring that bonding and sintering take place. Copper is an excellent con-ductor, but it oxidizes readily when heated in air. The choice of metal also dependson the temperature encountered in subsequent processing. Refractory metals, suchas tungsten and molybdenum, are suitable for interconnections heated to high tem-peratures (> 1000°C), for example during Al2O3 substrate processing.
A z-axis anisotropic electrical conductor film is a film that is electrically con-ducting only in the z-axis, i.e., in the direction perpendicular to the plane of thefilm. As one z-axis film can replace a whole array of solder joints, z-axis films arevaluable for solder replacement, processing cost reduction, and repairabilityimprovement in surface-mount technology.
An interlayer dielectric is a dielectric film separating the interconnection layerssuch that the two kinds of layers alternate and form a thin-film multilayer. Thedielectric is a polymer, usually spun on or sprayed, or a ceramic applied by chemicalvapor deposition (CVD). The most common multilayer involves polyimide as thedielectric and copper interconnections, plated, sputtered, or electron-beam deposited.
©2001 CRC Press LLC

A die attach is a material for joining a die (a chip) to a substrate. It can be ametal alloy (a solder paste), a polymeric adhesive (a thermoset or a thermoplast),or a glass. Die attach materials are usually applied by screen printing. A solder isattractive in its high thermal conductivity, which enhances heat dissipation. However,its application requires the use of heat and a flux. The flux subsequently needs tobe removed chemically. The defluxing process adds cost and is undesirable for theenvironment (the ozone layer) due to the chlorinated chemicals used. A polymer orglass has poor thermal conductity, but this can be alleviated by the use of thermallyconductive filler such as silver particles. A thermoplast provides a reworkable joint,whereas a thermoset does not. Furthermore, a thermoplast is more ductile than athermoset. Moreover, a solder suffers from its tendency to experience thermal fatiguedue to the thermal expansion mismatch between the chip and the substrate, and theresulting work hardening and cracking of the solder. In addition, the footprint leftby a solder tends to be larger than the footprint left by a polymer because of theease with which the molten solder flows.
An encapsulation is an electrically insulating conformal coating on a chip forprotection against moisture and mobile ions. An encapsulation can be a polymer(epoxy, polyimide, polyimide siloxane, silicone gel, Parylene, or benzocyclobutene),which can be filled with SiO2, BN, A1N, or other electrically insulating ceramicparticles for decreasing the thermal expansion and increasing thermal conductivity.1-3
The decrease of thermal expansion is needed because a neat polymer typically hasa much higher coefficient thermal expansion than a semiconductor chip. An encap-sulation can also be a ceramic (e.g., SiO2, Si3Ni4, or silicon oxynitride). In electronicpackaging, encapsulation is a step performed after both die bonding and wire bondingand before the packaging, using a molding material. The molding material is typi-cally a polymer, such as epoxy. However, it can also be a ceramic, such as Si3N4,cordierite (magnesium silicate), SiO2, etc. A ceramic is advantageous in its lowcoefficient of thermal expansion and higher thermal conductivity, but it is much lessconvenient to apply than a polymer.
A lid is a cover for a chip that offers physical protection. The chip is typicallymounted in a well in a ceramic substrate and the lid covers the well. A lid ispreferably a metal because of the need to dissipate heat. It is joined to the ceramicsubstrate by soldering, using a solder preform (e.g., Au-Sn) shaped like a gasket.Due to the low coefficient of thermal expansion, Kovar® (54Fe-29Ni-17Co) is usedfor the lid. For the same reason, Kovar is often used for the can in which a substrateis mounted. Although Kovar has a low coefficient of thermal expansion(5.3 × 10⁻⁶ °C–1 at 20–200oC), it also has a low thermal conductivity of 17 W m–1 K–1.
A heat sink is a thermal conductor that conducts and radiates heat away fromthe circuitry. It is typically bonded to a printed circuit board. The thermal resistanceof the bond and that of the heat sink govern the effectiveness of heat dissipation. Aheat sink that matches the coefficient of thermal expansion of the circuit board isdesirable for resistance to thermal cycling.
Insufficiently fast dissipation of heat is the most critical problem that limits thereliability and performance of microelectronics.4 The problem becomes more severeas electronics are miniaturized. The problem also accentuates as power (voltage andcurrent) increases. Excessive heating from insufficient heat dissipation causes ther-
©2001 CRC Press LLC

mal stress in the electronic package, which may cause warpage of the semiconductorchip. The problem is also compounded by thermal fatigue, which results from cyclicheating and thermal expansion mismatches. Since there are many solder joints inan electronic package, solder joint failure is a big reliability concern. For thesereasons, thermal management has become a key issue within the field of electronicpackaging. Thermal management refers to the use of materials, devices, and pack-aging schemes to attain efficient heat dissipation.
The use of materials with high thermal conductivity and low thermal expansionfor heat sinks, lids, housings, substrates, and die attach is an important avenue foralleviating the heat dissipation problem. For this purpose, metal-matrix composites(such as silicon carbide particle aluminum-matrix composites) and polymer-matrixcomposites (such as silver particle-filled epoxy) have been developed. However,another method, which has received much less attention, is the improvement of thethermal contact between the various components in an electronic package. The higherthermal conductivity of the individual components cannot effectively help heatdissipation unless thermal contacts between the components are good. Without goodthermal contacts, the use of expensive thermal conducting materials is a waste.
The improvement of a thermal contact involves the use of a thermal interfacematerial, such as a thermal fluid, a thermal grease, or a resilient thermal conductor.A thermal fluid or grease is spread on the mating surfaces. A resilient thermalconductor is sandwiched by the mating surfaces and held in place by pressure. Athermal fluid is most commonly mineral oil. Thermal greases are usually conductingparticle-filled silicone. Resilient thermal conductors are conducting particle-filledelastomers. Of these three types of thermal interface materials, thermal greases areby far the most common. Resilient thermal conductors are not as well developed asthermal fluids or greases.
As the materials to be interfaced are good thermal conductors, the effectivenessof a thermal interface material is enhanced by high thermal conductivity and lowthickness of the interface material, and low thermal contact resistance between theinterface material and each mating surface. As the mating surfaces are not perfectlysmooth, the interface material must be able to flow or deform so as to conform totheir topology. If the interface material is a fluid, grease, or paste, it should have ahigh fluidity in order to conform and to have a small thickness after mating. On theother hand, the thermal conductivity of the grease or paste increases with increasingfiller content, and this is accompanied by decrease in workability. Without a filler,as in the case of an oil, thermal conductivity is poor. A thermal interface materialin the form of a resilient thermal conductor sheet cannot usually be as thin orconformable as one in the form of a fluid, grease, or paste, so its effectivenessrequires a very high thermal conductivity.
3.3 POLYMER-MATRIX COMPOSITES
Polymer-matrix composites with continuous or discontinuous fillers are used forelectronic packaging and thermal management. Composites with continuous fillersare used as substrates, heat sinks, and enclosures. Composites with discontinuousfillers are used for die attach, electrically/thermally conducting adhesives, encapsu-
©2001 CRC Press LLC

lations, thermal interface materials, and electrical interconnections. Composites withdiscontinuous fillers can be in a paste form during processing, thus allowing appli-cation by printing and injection molding. Composites with continuous fillers cannotundergo paste processing, but the continuous fillers provide lower thermal expansionand higher conductivity than discontinuous fillers.
Composites can have thermoplastic or thermosetting matrices. Thermoplasticmatrices have the advantage that a connection can be reworked by heating for thepurpose of repair, whereas thermosetting matrices do not allow reworking. On theother hand, controlled-order thermosets are attractive for their thermal stability anddielectric properties.5 Polymers exhibiting low dielectric constant, low dissipationfactor, low coefficient of thermal expansion, and compliance are preferred.6
Composites can be electrically conducting or electrically insulating; the electri-cal conductivity is provided by a conductive filler. The composites can be bothelectrically and thermally conducting, as attained by the use of metal or graphitefillers. They can also be electrically insulating but thermally conducting, as conveyedby the use of diamond, aluminum nitride, boron nitride, or alumina fillers.7,8 Anelectrically conducting composite can be isotropically conducting9,10 or anisotropi-cally conducting.11 A z-axis conductor is an example of an anisotropic conductor.
3.3.1 POLYMER-MATRIX COMPOSITES WITH CONTINUOUS FILLERS
Epoxy-matrix composites with continuous glass fibers and made by lamination areused for printed wiring boards because of the electrically insulating property of glassfibers, and the good adhesive behavior and established industrial usage of epoxy.Aramid (Kevlar™) fibers can be used instead of glass fibers to provide lowerdielectric constant.12 Alumina (Al2O3) fibers can be used for increasing the thermalconductivity.13 By selecting the fiber orientation and loading in the composite, thedielectric constant can be decreased and the thermal conductivity increased.14 Byimpregnating the yarns or fabrics with a silica-based sol and subsequent firing, thethermal expansion can be reduced.15 Matrices other than epoxy can be used, suchas polyimide and cyanate ester.16
For heat sinks and enclosures, conducting fibers are used since they enhancethermal conductivity and the ability to shield electromagnetic interference. EMIshielding is particularly important for enclosures.17 Carbon fibers are most commonlyused for these applications due to their conductivity, low thermal expansion, andwide availability as a structural reinforcement. For high thermal conductivity, carbonfibers made from mesophase pitch18-24 or copper plated carbon fibers are pre-ferred.25-27 For EMI shielding, both uncoated carbon fibers28,29 and metal-coatedcarbon fibers30,31 have been used.
For avionic electronic enclosures, low density is essential for saving aircraftfuel. Aluminum is the traditional material for this application. Because of mechan-ical, electrical, environmental, manufacturing/producibility, and design-to-cost cri-teria, carbon fiber reinforced epoxy has been judged more attractive than aluminum,glass fiber reinforced epoxy, glass fiber reinforced epoxy with aluminum interlayer,beryllium, aluminum-beryllium, and SiC particle reinforced aluminum.32 A relatedapplication is thermal management of satellites, for which the thermal management
©2001 CRC Press LLC
materials need to be integrated from the satellite structure down to the electronicdevice packaging.33 Continuous carbon fibers are suitable for this application dueto their high thermal conductivity, low density, high strength, and high modulus.
3.3.2 POLYMER-MATRIX COMPOSITES WITH DISCONTINUOUS FILLERS
Polymer-matrix composites with discontinuous fillers are widely used in electron-ics,34 despite their poor mechanical properties compared to composites with contin-uous fibers. This is because materials in electronics do not need to be mechanicallystrong and discontinuous fillers enable processing through the paste form that isparticularly suitable for making films, whether standalone or on a substrate.
Screen printing is a common method for patterning a film on a substrate. In thecase of an electrically conducting paste, the pattern is an array of electrical inter-connections and electrical contact pads on the substrate. As screen printing involvesthe paste going through a screen, screen printable pastes contain particles and nofiber, and the particles must be sufficiently small, typically less than 10 µm. Thelarger the particles, the poorer the patternability, i.e., the edge of a printed line isnot sufficiently well defined. In applications not requiring patternability, such asthermal interface materials, short fibers are advantageous in that the connectivity ofthe short fibers is superior to that of particles at the same volume fraction. For aconducting composite, better connectivity of the filler units means higher conduc-tivity for the composite. Instead of using short fibers, one may use elongated particlesor flakes for the sake of the connectivity. In general, the higher the aspect ratio, thebetter the connectivity for the same volume fraction. The use of elongated particlesor flakes can provide an aspect ratio larger than one, while retaining patternability.It is an attractive compromise.
In case of a conducting composite, the greater the volume fraction of the con-ducting filler, the higher the conductivity of the composite, since the polymer matrixis insulating. However, the greater the filler volume fraction, the higher the viscosityof the paste, and the poorer its processability. To attain a high filler volume fractionwhile maintaining processability, a polymer of low viscosity is preferred, and goodwettability of the filler by the matrix, as provided by filler surface treatments and/orthe use of surfactants, is desirable.
The matrix used in making a polymer-matrix composite can be in the form ofa liquid (a thermosetting resin) or a solid (a thermoplastic powder) during the mixingof the matrix and the filler. In the case of the matrix in the form of a powder, thedistribution of the filler units in the resulting composite depends on the size of thematrix powder particles; the filler units line the interface between adjacent matrixparticles and the filler volume fraction needed for percolation (i.e., the filler unitstouching one another to form a continuous path)35 decreases with increasing matrixparticle size. The reaching of percolation is accompanied by a large increase inconductivity. However, a large matrix particle size is detrimental to processability,so a compromise is needed.
In the case of the matrix in the form of a thermoplastic powder, the percolationattained may be degraded or destroyed after subsequent composite fabrication
©2001 CRC Press LLC
involving flow of the thermoplastic under heat and pressure. In this case, a thermo-plastic that flows less is preferred for attaining high conductivity in the resultingcomposite.36
A less common way to attain percolation in a given direction is to apply anelectric or magnetic field to align the filler units along the direction. For thistechnique to be possible, the filler units must be polarizable electrically or magnet-ically. Such alignment is one of the techniques used to produce z-axis conductors.
In percolation, the filler units touch one another to form continuous paths, butthere is considerable contact resistance at the interfaces between them. To decreasethis contact resistance, thereby increasing the conductivity of the composite, onecan increase the size of the filler units so the amount of interface area is decreased,provided percolation is maintained. A less common but more effective way is tobond the filler units together at their junctions by using a solid (like solder) thatmelts and wets the surface of the filler during composite fabrication. The low-melting-point solid can be in the form of particles added to the composite mix, orin the form of a coating on the filler units. In this way, a three-dimensionallyinterconnected conducting network is formed after composite fabrication.37
An intimate interface between the filler and the matrix is important to theconductivity of a composite, even though the filler is conducting and the matrix maybe perfectly insulating. This is because conduction may involve a path from a fillerunit to an adjacent one through a thin film of the matrix by means of tunneling. Inthe case of the matrix being slightly conducting (but not as conducting as the filler),the conduction path involves both the filler and the matrix, and the filler-matrixinterface is even more important. This interface may be improved by filler surfacetreatments prior to incorporating the filler in the composite, or by the use of asurfactant.38
The difference in thermal expansion coefficient between filler and matrix, andthe fact that composite fabrication occurs at an elevated temperature, cause thermalstress during cooling of the fabricated composite. The thermal expansion coefficientof a polymer is relatively high, so the filler units are usually under compression aftercooling. Compression helps to tighten the filler-matrix interface, though the com-pressive stress in the filler and the tensile stress in the matrix may degrade theperformance and durability of the composite.
In case of the matrix being conducting, but not as conducting as the filler, asfor conducting polymer matrices,39,40 percolation is not essential for the compositeto be conducting, though percolation would greatly enhance conductivity. Below thepercolation threshold (the filler volume fraction above which percolation occurs),the conductivity of the composite is enhanced by a uniform distribution of the fillerunits since the chance increases of having a conduction path that involves more fillerand less matrix as filler distribution becomes more uniform. Uniformity is neverperfect; it is described by the degree of dispersion of the filler. The degree ofdispersion can be enhanced by rigorous agitation during mixing of the filler andmatrix, or by the use of a dispersant. In the case of a matrix in the form of particlesthat are coarser than the filler units, the addition of fine particles to the mix alsohelps dispersion of the filler.41
©2001 CRC Press LLC

Because the thermal expansion coefficient of a polymer is relatively high, thepolymer matrix expands more than the filler during the heating of a polymer-matrixcomposite. This results in the proximity between adjacent filler units changing withtemperature, decreasing the conductivity of the composite.42 This phenomenon isdetrimental to the thermal stability of composites.
Corrosion and surface oxidation of the filler are the most common causes ofdegradation that decreases the conductivity of the composite. Thus, oxidation-resis-tant fillers are essential. Silver and gold are oxidation resistant, but copper is not.Due to the high cost of silver and gold, the coating of copper, nickel, or other lower-cost metal fillers by gold or silver is common for improving oxidation resistance.The most common filler by far is silver particles.43,44
A z-axis anisotropic electrical conductor film is electrically conducting in thedirection perpendicular to the film, but is insulating in all other directions. This filmis technologically valuable for use as an interconnection material in electronicpackaging, as it electrically connects the electrical contact pads touching one sideof the film with the corresponding contact pads touching the direct opposite side ofthe film. Even though the film is in one piece, it contains numerous z-axis conductingpaths, so it can provide numerous interconnections. If each contact pad is largeenough to span a few z-axis conducting paths, no alignment is needed between thecontact pad array and the z-axis film, whether the conducting paths are ordered orrandom in their distribution.45-59 In this situation, in order to attain a high density ofinterconnections, the cross-section of each z-axis conducting path must be small.However, if each contact pad is only large enough to span one z-axis conductingpath, alignment is needed between the contact pad array and the z-axis film, andthis means the conducting paths in the z-axis film must be ordered in the same wayas the contact pad array.60
An example of an application of a z-axis conductor film is in the interconnectionsbetween the leads from (or contact pads on) a surface-mount electronic device andthe contact pads on the substrate beneath the device. In this application, one pieceof z-axis film can replace a whole array of solder joints, so the processing cost canbe reduced. Furthermore, the problem of thermal fatigue of the solder joints can beavoided by this replacement. Another example is in the vertical interconnections inthree-dimensional electronic packaging.
A z-axis film is a polymer-matrix composite containing conducting units thatform the z-axis conducting paths. The conducting units are usually particles, suchas metal particles and metal-coated polymer particles. The particles can be clusteredso that each cluster corresponds to one conducting path.45-47,51 Metal columns,52 metalparticle columns (e.g., gold-plated nickel),50,51 and individual metal-coated polymerparticles49 have been used to provide z-axis conducting paths. Particle columns wereformed by magnetic alignment. Using particle columns, Reference 46 attained aconducting path width of 400 µm and a pitch (center-to-center distance betweenadjacent conducting paths) of 290 µm. Also using particle columns, References 50and 51 attained a conducting path width of ~ 10 µm and a pitch of ~ 100 µm. Ingeneral, a large conducting path width is desirable for decreasing the resistance perpath, while a small pitch is desirable for high density interconnection.
©2001 CRC Press LLC

In contrast to the use of metal wires, metal columns, or metal particle columns,Reference 61 used one metal particle per conducting path. The concept of one particleper path had been demonstrated by Reference 49 by using metal-coated polymerparticles. However, due to the high resistivity of the metal coating compared to thebulk metal, the z-axis resistivity of the film was high (0.5 Ω.cm for a conductingpath). By using metal particle in place of metal coated polymer particles, Reference61 decreased the z-axis resistivity of a conducting path to 10–6 Ω.cm. Furthermore,Reference 61 did not rely on a polymer for providing resilience; resilience is providedby the metal particles, which protrude from both sides of the stand-alone film. Asa result, the problem of stress relaxation of the polymer is eliminated. In addition,the protrusion of the metal particles eliminates the problem of open-circuiting theconnection upon heating because of the higher thermal expansion of the polymercompared to the conductor.58
Most work on z-axis adhesive films56,57 used an adhesive with randomly dis-persed conductive particles (8–12 µm diameter) suspended in it. The particles werephenolic spheres that had been coated with nickel. After bonding under heat(180–190°C) and pressure (1.9 MPa), a particle became oval in shape (4 µm thick).There was one particle per conducting path. The main drawback of this technologyis the requirement of heat and pressure for curing the adhesive. Heat and pressureare not desirable in practical use of the z-axis adhesive. Reference 61 removed theneed for heat and pressure through the choice of the polymer.
A different kind of z-axis adhesive film60 used screening or stenciling to obtaina regular two-dimensional array of silver-filled epoxy conductive dots, but thistechnology suffers from the large pitch (1500 µm) of the dots and the consequentneed for alignment between z-axis film and contact pad array. In the work ofReference 61, the pitch of the conducting paths in the z-axis adhesive film is as lowas 64 µm.
Capacitors require materials with a high dielectric constant. Such materials inthe form of thick films allow capacitors to be integrated with the electronic pack-aging, allowing further miniaturization and performance and reliability improve-ments.62 These thick-film pastes involve ceramic particles with a high dielectricconstant, such as barium titanate (BaTiO3), and a polymer (e.g., epoxy).63,64
Inductors are needed for transformers, DC/DC converters, and other powersupply applications. They require magnetic materials. Such materials in the form ofthick films allow inductors and transformers to be integrated with the electronicpackaging, allowing further miniaturization. These thick-film pastes involve mag-netic particles (e.g., ferrite) and a polymer.65,66
The need for EMI shielding is increasing rapidly due to the interference of radiofrequency radiation (such as that from cellular phones) with digital electronics, andsociety’s increasing dependence on digital electronics. The associated electronicpollution is an interference problem.
EMI shielding is achieved by using electrical conductors, such as metals andconductive-filled polymers.67-75 EMI-shielding gaskets76-87 are resilient conductors.They are needed to electromagnetically seal an enclosure. The resilient conductorsare most commonly elastomers (rubber) that are filled with a conductive filler,88 orelastomers that are coated with a metalized layer. Metallized elastomers suffer from
©2001 CRC Press LLC

poor durability because of the tendency of the metal layer to debond from theelastomer. Conductive-filled elastomers do not have this problem, but they requirethe use of a highly conductive filler, such as silver particles, in order to attain a highshielding effectiveness while maintaining resilience. The highly conductive filler isexpensive, which makes the composite expensive. The use of a less conducting fillerresults in the need for a large volume fraction of the filler in order to attain a highshielding effectiveness; the consequence is diminished resilience or even loss ofresilience. Moreover, these composites suffer from degradation of shielding effec-tiveness in the presence of moisture or solvents. In addition, the polymer matrix inthe composites limits the temperature resistance, and the thermal expansion mis-match between filler and matrix limits the thermal cycling resistance.
Due to the skin effect (electromagnetic radiation at a high frequency interactingwith only the near surface region of an electrical conductor), a filler for a polymer-matrix composite for EMI shielding needs to be small in unit size. Although con-nectivity between the filler units is not required for shielding, it helps. Therefore, afiller in the form of a metal fiber of very small diameter is desirable. For this purpose,nickel filaments of diameter 0.4 µm and length > 100 µm, with a carbon core ofdiameter 0.1 µm, were developed.89 Their exceptionally small diameters comparedto those of existing metal fibers made them outstanding for use as fillers in polymersfor EMI shielding. A shielding effectiveness of 87 dB at 1 GHz was attained in apolyethersulfone-matrix composite with only 7 vol.% nickel filaments.89-91 The lowvolume fraction allows resilience in a silicone-matrix composite for EMI gaskets.92
3.4 SUMMARY
Polymer-matrix composite materials for microelectronics are designed for highthermal conductivity, low CTE, low dielectric constant, either high or low electricalconductivity, and processability (e.g., printability). Applications include heat sinks,housings, printed wiring boards, substrates, lids, die attach, encapsulation, intercon-nections, thermal interface materials, and EMI shielding. Combinations of propertiesare usually required. For example, for heat sinks and substrates, the combination ofhigh thermal conductivity and low CTE is required for heat dissipation and thermalstress reduction. In the case of aerospace electronics, low density is also desired.Polymer-matrix composites for microelectronics include those with continuous anddiscontinuous fillers. They can be in the form of an adhesive film, a stand-alonefilm, or a bulk material, and can be electrically isotropic or anisotropic.
REFERENCES
1. V. Sarihan and T. Fang, Structural Analysis in Microelectronic and Fiber OpticSystems, EEP, Vol. 12, pp. 1-4 (1995).
2. W.E. Marsh, K. Kanakarajan and G.D. Osborn, Polymer/Inorganic Interfaces, Mate-rials Research Soc. Symp. Proc., Materials Research Soc., Vol. 304, pp. 91-96 (1993).
3. L.T. Nguyen and I.C. Noyan, Polymer Eng. Sci., 28(16), 1013-1025 (1988).4. W.-J. Yang and K. Kudo, Proc. Int. Symp. Heat Transfer Science and Technology,
pp. 14-30 (1988).
©2001 CRC Press LLC

5. H. Korner, A. Shiota and C.K. Ober, ANTEC ’96: Plastics — Racing into the Future,Conf. Proc., Society of Plastics Engineers, Technical Papers Series, no. 42, vol. 2,pp. 1458-1461 (1996).
6. G.S. Swei and D.J. Arthur, 3rd Int. SAMPE Symp. Exhib., pp. 1111-1124 (1989).7. L. Li and D.D.L. Chung, Composites, 22(3),211-218 (1991).8. X. Lu and G. XU, J. Appl. Polymer Sci., 65(13), 2733-2738 (1997).9. D. Klosterman and L. LI, J. Electron. Manuf., 5(4), 277-287 (1995).
10. S.K. Kang, R. Rai and S. Purushothaman, 1996 Proc. 46th Electronic Components& Technology, IEEE, pp. 565-570 (1996).
11. G.F.C.M. Lijten, H.M. Van Noort and P.J.M. Beris, J. Electron. Manuf., 5(4), 253-261(1995).
12. M.P. Zussman, B. Kirayoglu, S. Sharkey and D.J. Powell, 6th Int. SAMPE ElectronicsConf., pp. 437-448 (1992).
13. J.D. Bolt and R.H. French, Adv. Mater. Process., 134(1), 32-35 (1988).14. J.D. Bolt, D.P. Button and B.A. Yost, Mater. Sci. Eng., A109, 207-211 (1989).15. S.P. Mukerherjee, D. Suryanarayana and D.H. Strope, J. Non-Crystalline Solids,
147-148, 783-791 (1992).16. M.P. Zussman, B. Kirayoglu, S. Sharkey and D.J. Powell, 6th Int. SAMPE Electronics
Conf., pp. 437-448 (1992).17. J.J. Glatz, R. Morgan and D. Neiswinger, 6th Int. SAMPE Electronics Conf., Vol. 6,
pp. 131-145 (1992).18. A. Bertram, K. Beasley and W. De La Torre, Nav. Eng. J., 104(3), 276-285 (1992).19. D. Brookstein and D. Maass, 7th Int. SAMPE Electronics Conf., pp. 310-327 (1994).20. T.F. Fleming and W.C. Riley, Proc. SPIE, 1997, 136-147 (1993).21. T.F. Fleming, C.D. Levan and W.C. Riley, Proc. Technical Conf., Int. Electronics
Packaging Conf., pp. 493-503 (1995).22. A.M. Ibrahim, 6th Int. SAMPE Electronics Conf., pp. 556-567 (1992).23. N. Kiuchi, K. Ozawa, T. Komami, O. Katoh, Y. Arai, T. Watanabe and S. Iwai, Int.
SAMPE Tech. Conf., Vol. 30, pp. 68-77 (1998).24. J.W.M. Spicer, D.W. Wilson, R. Osiander, J. Thomas and B.O. Oni, Proc. SPIE, 3700,
40-47 (1999).25. D.A. Foster, SAMPE Q., 21(1), 58-64 (1989).26. D.A. Foster, 34th Int. SAMPE Symp. Exhib., Book 2, pp. 1401-1410 (1989).27. W. De La Torre, 6th Int. SAMPE Electronics Conf., pp. 720-733 (1992).28. P.D. Wienhold, D.S. Mehoke, J.C. Roberts, G.R. Seylar and D.L. Kirkbride, Int.
SAMPE Tech. Conf., pp. 243-255 (1998).29. X. Luo and D.D.L. Chung, Composites: Part B, 30(3), 227-231 (1999).30. L.G. Morin Jr. and R.E. Duvall, Proc. Int. SAMPE Symp. Exhib., 43(1), 874-881 (1998).31. G. Lu, X. Li and H. Jiang, Composites Sci. Tech., 56, 193-200 (1996).32. P.L. Smaldone, 27th Int. SAMPE Technical Conf., pp. 819-829 (1995).33. J.J. Glatz, D.L. Vrable, T. Schmedake and C. Johnson, 6th Int. SAMPE Electronics
Conf., pp. 334-346 (1992).34. R. Crossman, Northcon/85 — Conf. Rec. (1985).35. D.S. McLachlan, M. Blaszkiewicz and R.E. Newnham, J. Am. Ceram. Soc., 73(8),
2187-2203 (1990).36. L. Li and D.D.L. Chung, Polym. Compos., 14(6), 467-472 (1993).37. L. Li, P. Yih and D.D.L. Chung, J. Electron. Mater., 21(11), 1065-1071 (1992).38. B. Guerrero, C. Alemán and R. Garza, J. Polym. Eng., 17(2), 95-110 (1997-1998).39. M. Omastová, J. Pavlinec, J. Pionteck and F. Simon, Polym. Int., 43(2), 109-116
(1997).
©2001 CRC Press LLC

40. X.B. Chen and J.-P. Issi, M. Cassart, J. Devaux and D. Billaud, Polymer, 35(24),5256-5258 (1994).
41. P. Chen and D.D.L. Chung, J. Electron. Mater., 24(1), 47-51 (1995).42. J. Fournier, G. Boiteux, G. Seytre and G. Marichy, J. Mater. Sci. Lett., 16(20), 1677-
1679 (1997).43. D. Klosterman and L. Li, J. Electron. Manuf., 5(4), 277-287 (1995).44. S.K. Kang, R. Rai and S. Purushothaman, Proc. 46th Electronic Components &
Technology, IEEE, pp. 565-570 (1996).45. W.R. Lambert and W.H. Knausenberger, Proceedings of the Technical Program —
National Electronic Packaging and Production Conference, 3, 1512-1526 (1991).46. J.A. Fulton, D.R. Horton, R.C. Moore, W.R. Lambert and J.J. Mottine, Proc. 39th
Electronic Components Conf., IEEE, pp. 71-77 (1989).47. W.R. Lambert, J.P. Mitchell, J.A. Suchin and J.A. Fulton, Proc. 39th Electronic
Components Conf., IEEE, pp. 99-106 (1989).48. P.B. Hogerton, J.B. Hall, J.M. Pujol and R.S. Reylek, Mat. Res. Soc. Symp. Proc.,
154, 415 (1989).49. L. Li and D.D.L. Chung, J. Electron. Packag., 119(4), 255 (1997).50. P.T. Robinson, V. Florescu, G. Rosen and M.T. Singer, Annual Connector & Inter-
connection Technology Symposium, pp. 507-515 (1990).51. G. Rosen, P.T. Robinson, V. Florescu and M.T. Singer, Proc. 6th IEEE Holm Conf.
Electrical Contacts and 15th Int. Conf. Electric Contacts, IEEE, pp. 151-165 (1990).52. D.D. Johnson, Proc. 3rd Int. Symp. Advanced Packaging Materials: Processes, Prop-
erties and Interfaces, IEEE, pp. 29-30 (1997).53. T. Kokogawa, H. Morishita, K. Adachi, H. Otsuki, H. Takasago and T. Yamazaki,
Conference Record of 1991 International Display Confrence, IEEE, and Society forInformation Display, pp. 45-48 (1991).
54. N.P. Kreutter, B.K. Grove, P.B. Hogerton and C.R. Jensen, 7th Electronic Materialsand Processing Congress (Aug. 1992).
55. H. Yoshigahara, Y. Sagami, T. Yamazaki, A. Burkhart and M. Edwards, Proc. TechnicalProgram: National Electronic Packaging and Production Conf., NEPCON West ’91,1, 213-219 (1991).
56. D.M. Bruner, Int. J. Microcircuite Electron. Packag., 18(3), 311 (1995).57. J.J. CREA and P.B. Hogerton, Proc. Technical Program: National Electronic Pack-
aging and Production Conf., NEPCON West ’91, 1, 251-259 (1991).58. K. Gilleo, Proc. Electricon ’94, Electronics Manufacturing Productivity Facility, pp.
11/1-11/12 (1994).59. K. Chung, G. Dreier, P. Fitzgerald, A. Boyle, M. Lin and J. Sager, Proc. 41st Electronic
Components Conf., p. 345 (May 1991).60. J.C. Bolger and J.M. Czarnowski, 1995 Japan IEMT Symp. Proc., 1995 Int. Electronic
Manufacturing Technology Symp., IEEE, pp. 476-481 (1996).61. Y. Xu and D.D.L. Chung, J. Electron. Mater., 28(11), 1307 (1999).62. G.Y. Chin, Adv. Mater. Proc., 137(1), 47, 50, 86 (1990).63. S. Liang, S.R. Chong and E.P. Giannelis, Proc. Electronic Components & Technology
Conf., IEEE, Vol. 48, pp. 171-175 (1998).64. V. Agarwal, P. Chahal, R. R. Tummala and M.G. Allen, Proc. Electronic Components
and Technology Conf., IEEE, Vol. 48, pp. 165-170 (1998).65. J.Y. Park and M.G. Allen, Conf. Proc. — IEEE Applied Power Electronics Conf. and
Exposition — APEC, Vol. 1, pp. 361-367 (1997).66. J.Y. Park, L.K. Lagorce and M.G. Allen, IEEE Trans. Magnetics, 33(5), 3322-3324
(1997).
©2001 CRC Press LLC

67. R. Charbonneau, Proc. Int. SAMPE Symp. Exhib., Vol. 43, No. 1, pp. 833-844 (1998).68. J. Wang, V.V. Varadan and V.K. Varadan, SAMPE J., 32(6), 18-22 (1996).69. S. Maugdal and S. Sankaran, Recent Trends in Carbon, Proc. National Conf., O.P.
Bahl, Ed., pp. 12-19 (1997).70. J.T. Hoback and J.T. Reilly, J. Elastomers Plast., 20(1), 54-69 (1998).71. G. Lu, X. Li and H. Jiang, Compos. Sci. Tech., 56, 193-200 (1996).72. D.W. Radford, J. Adv. Mater., pp. 45-53 (Oct. 1994).73. C. Huang and J. Pai, J. Appl. Polym. Sci., 63(1), 115-123 (1997).74. D.W. Radford and B.C. Cheng, J. Test. Evaluation, 21(5), 396-401 (1993).75. S.R. Gerteisen, Northcon/85 — Conf. Rec., Paper 6.1 (1985).76. P. O’Shea, Evaluation Eng., 34(8), 84-93 (1995).77. P. O’Shea, Evaluation Eng., 35(8), 56-61 (1996).78. R.A. Rothenberg and D.C. Inman, 1994 Int. Symp. Electromagnetic Compatibility,
p. 818 (1994).79. J.W.M. Child, Electron. Prod., pp. 41-47 (Oct. 1986).80. A.K. Subramanian, D.C. Pande and K. Boaz, Proc. 1995 Int. Conf. Electromagnetic
Interference and Compatibility, Soc. EMC Engineers, pp. 139-147 (1995).81. W. Hoge, Evaluation Eng., 34(1), 84-86 (1995).82. J.F. Walther, IEEE 1989 Int. Symp. Electromagnetic Compatibility: Symp. Record,
pp. 40-45 (1989).83. H.W. Denny and K.R. Shouse, IEEE 1990 Int. Symp. Electromagnetic Compatibility:
Symp. Record, pp. 20-24 (1990).84. R. Bates, S. Spence, J. Rowan and J. Hanrahan, 8th Int. Conf. Electromagnetic
Compatibility, Electronics Division, Insitution of Electrical Engineers, pp. 246-250(1992).
85. J.A. Catrysse, 8th Int. Conf. Electromagnetic Compatibility, Electronics Division,Institution of Electrical Engineers, pp. 251-255 (1992).
86. A.N. Faught, IEEE Int. Symp. Electromagnetic Compatibility, pp. 38-44 (1982).87. G. Kunkel, IEEE Int. Symp. Electromagnetic Compatibility, pp. 211-216 (1980).88. K.P. Sau, T.K. Chaki, A. Chakraborty and D. Khastgir, Plast., Rubber Compos.
Process Appl., 26(7), 291-297 (1997).89. X. Shui and D.D.L. Chung, J. Electron. Mater., 24(2), 107-113 (1995).90. X. Shui and D.D.L. Chung, J. Electron. Mater., 25(6), 930-934 (1996).91. X. Shui and D.D.L. Chung, J. Electron. Mater., 26(8), 928-934 (1997).92. X. Shui and D.D.L. Chung, J. Electron. Packag., 119(4), 236-238 (1997).
©2001 CRC Press LLC

Materials for Electromagnetic Interference Shielding
CONTENTS
4.1 Introduction4.2 Mechanisms of Shielding4.3 Composite Materials for Shielding4.4 Emerging Materials for Shielding 4.5 ConclusionAcknowledgmentReferences
SYNOPSIS Materials for the electromagnetic interference (EMI) shielding of elec-tronics and radiation sources are reviewed, with emphasis on composite materials andresilient EMI gasket materials which shield mainly by reflection of the radiation at ahigh frequency.
RELEVANT APPENDICES: E, D, C
4.1 INTRODUCTION
EMI shielding refers to the reflection and/or adsorption of electromagnetic radiationby a material that acts as a shield against its penetration. As electromagnetic radia-tion, particularly at high frequencies (radio waves, such as those emanating fromcellular phones) tend to interfere with electronics (computers), EMI shielding ofboth electronics and radiation sources is needed, and is increasingly required bygovernments around the world. The importance of EMI shielding relates to highdemand on the reliability of electronics, and the rapid growth of radio frequencyradiation sources.1-9
4
©2001 CRC Press LLC

EMI shielding is distinguished from magnetic shielding, which refers to theshielding of magnetic fields at low frequencies (60 Hz). Materials for EMI shieldingare different from those for magnetic shielding.
4.2 MECHANISMS OF SHIELDING
The primary mechanism of EMI shielding is reflection. For reflection of radiation,the shield must have mobile charge carriers (electrons or holes) that interact withthe electromagnetic fields in the radiation. As a result, the shield tends to be elec-trically conducting, although a high conductivity is not required. For example, avolume resistivity of the order of 1 Ω.cm is usually sufficient. However, electricalconductivity is not the scientific criterion for shielding, as conduction requiresconnectivity in the conduction path, whereas shielding does not. Although shieldingdoes not require connectivity, it is enhanced by it. Metals are by far the most commonmaterials for EMI shielding. They function by reflection due to the free electronsin them. Metal sheets are bulky, so metal coatings made by electroplating, electrolessplating, or vacuum deposition are used for shielding.10-25 The coating may be onbulk materials, fibers, or particles, but coatings tend to suffer from their poor wearor scratch resistance.
A secondary mechanism of EMI shielding is absorption. For significant absorp-tion of radiation, the shield should have electric and/or magnetic dipoles that interactwith the electromagnetic fields in radiation. The electric dipoles may be providedby BaTiO3 or other materials having a high value of the dielectric constant. Themagnetic dipoles may be provided by Fe3O4 or other materials with a high value ofmagnetic permeability,10 which may be enhanced by reducing the number of mag-netic domain walls through the use of a multilayer of magnetic films.26,27
The absorption loss is a function of the product σrµ r, whereas the reflection lossis a function of the ratio σr/µ r, where σr is the electrical conductivity relative tocopper and µr is the relative magnetic permeability. Table 4.1 provides these factorsfor various materials. Silver, copper, gold, and aluminum are excellent for reflectionbecause of their high conductivity. Superpermalloy and mumetal are excellent forabsorption because of their high magnetic permeability. The reflection loss decreaseswith increasing frequency, whereas the absorption loss increases with increasingfrequency.
Other than reflection and absorption, a mechanism of shielding is multiplereflections, the reflections at various surfaces or interfaces in the shield. This mech-anism requires the presence of a large surface area or interface area. An example ofa shield with a large surface area is a porous or foam material. An example of ashield with a large interface area is a composite material containing a filler that hasa large surface area. The loss due to multiple reflections can be neglected when thedistance between the reflecting surfaces or interfaces is large compared to the skindepth.
The losses, whether due to reflection, absorption, or multiple reflections, areexpressed in dB. The sum of all the losses is the shielding effectiveness (in dB).The absorption loss is proportional to the thickness of the shield.
©2001 CRC Press LLC

Electromagnetic radiation at high frequencies penetrates only the near surfaceregion of an electrical conductor. This is known as the “skin effect.” The electricfield of a plane wave penetrating a conductor drops exponentially with increasingdepth into the conductor. The depth at which the field drops to 1/e of the incidentvalue is the skin depth (δ), which is given by
(4.1)
wheref = frequency,µ = magnetic permeability = µ 0µ r,µ r = relative magnetic permeability,µ 0 = 4π × 10–7 H/m, andσ = electrical conductivity in Ω–1m–1.
Hence, the skin depth decreases with increasing frequency, and with increasingconductivity or permeability. For copper, µ r = 1, σ = 5.8 × 10⁷ Ω–1m–1, so δ is 2.09µm at a frequency of 1 GHz. For nickel of µ r = 100, σ = 1.15 × 10⁷ Ω–1m–1, so δis 0.47 µm at 1 GHz. The small value of δ for nickel compared to copper is due tothe ferromagnetic nature of nickel.
4.3 COMPOSITE MATERIALS FOR SHIELDINGDue to the skin effect, a composite material having a conductive filler with a smallunit size is more effective than one having a conductive filler with a large unit size.For effective use of the entire cross-section of a filler unit for shielding, the unit size
TABLE 4.1Electrical Conductivity Relative to Copper (σr) and Relative Magnetic Permeability (µr) of Selected Materials (from Ref. 119)
Material σr µ r σrµr σr/µ r
Silver 1.05 1 1.05 1.05Copper 1 1 1 1Gold 0.7 1 0.7 0.7Aluminum 0.61 1 0.61 0.61Brass 0.26 1 0.26 0.26Bronze 0.18 1 0.18 0.18Tin 0.15 1 0.15 0.15Lead 0.08 1 0.08 0.08Nickel 0.2 100 20 2 × 10⁻³
Stainless steel (430) 0.02 500 10 4 × 10⁻⁵
Mumetal (at 1 kHz) 0.03 20,000 600 1.5 × 10⁻⁶
Superpermalloy (at 1 kHz) 0.03 100,000 3,000 3 × 10⁻⁷
δ 1
πfµσ-----------------=
©2001 CRC Press LLC

of the filler should be comparable to or less than the skin depth. A filler of unit size1 µm or less is typically preferred, though such a small unit size is not commonlyavailable for most fillers, and the dispersion of the filler is more difficult when thefiller unit size decreases. Metal-coated polymer fibers or particles are used as fillersfor shielding, but they suffer from the fact that the polymer interior of each fiber orparticle does not contribute to shielding.
Polymer-matrix composites containing conductive fillers are attractive forshielding28-59 due to their processability (moldability), which helps to reduce oreliminate the seams in the housing that is the shield. The seams are commonlyencountered in the case of metal sheets as the shield, and they tend to cause leakageof radiation and diminish the effectiveness of the shield. In addition, polymer-matrixcomposites are attractive in their low density. The polymer matrix is electricallyinsulating and does not contribute to shielding, though the polymer matrix can affectthe connectivity of the conductive filler, and connectivity enhances shielding effec-tiveness. In addition, the polymer matrix affects processability.
Electrically conducting polymers60-79 are becoming increasingly available, butthey are not common and tend to be poor in processability and mechanical properties.Nevertheless, electrically conducting polymers do not require a conductive filler toprovide shielding, so that they may be used with or without one. In the presence ofa conductive filler, an electrically conducting polymer matrix has the added advan-tage of being able to electrically connect the filler units that do not touch one another,thereby enhancing connectivity.
Cement is slightly conducting, so the use of a cement matrix allows the con-ductive filler units in the composite to be electrically connected even when the fillerunits do not touch one another. Thus, cement-matrix composites have higher shield-ing effectiveness than corresponding polymer-matrix composites in which the poly-mer matrix is insulating.80 Moreover, cement is less expensive than polymers, andcement-matrix composites are useful for shielding rooms in a building.81-83 Similarly,carbon is a better matrix than polymers for shielding because of its conductivity,but carbon-matrix composites are expensive.84
A seam in a housing that serves as an EMI shield needs to be filled with an EMIgasket, which is commonly a material based on an elastomer, such as rubber.85-98
An elastomer is resilient, but is not able to shield unless it is coated with a conductor(a metal coating called metallization) or is filled with a conductive filler (typicallymetal particles). The coating suffers from its poor wear resistance. The use of aconductive filler is problematic because of the resulting decrease in resilience,especially at the high filler volume fraction that is required for shielding effective-ness. Because the decrease in resilience becomes more severe as the filler concen-tration increases, a filler that is effective even at a low volume fraction is desirable.Therefore, the development of EMI gaskets is more challenging than that of EMI-shielding materials in general.
For a general EMI-shielding material in the form of a composite material, afiller that is effective at a low concentration is desirable, although that is not ascritical as for EMI gaskets. This is because the strength and ductibility of a compositedecrease with increasing filler content when filler-matrix bonding is poor. Poorbonding is quite common for thermoplastic polymer matrices. Furthermore, a low
©2001 CRC Press LLC

filler content is desirable because of greater processability, which decreases withincreasing viscosity. In addition, low filler content is desirable due to cost and weightsaving.
In order for a conductive filler to be highly effective, it should have a small unitsize (due to the skin effect), a high conductivity (for shielding by reflection andabsorption), and a high aspect ratio (for connectivity). Metals are more attractivefor shielding than carbons because of their higher conductivity, though carbons areattractive in their oxidation resistance and thermal stability. Fibers are more attractivethan particles due to their high aspect ratio. Thus, metal fibers of a small diameterare desirable. Nickel filaments of diameter 0.4 µm have been shown to be particularlyeffective.98-100 Nickel is more attractive than copper because of its superior oxidationresistance. Oxide film is poor in conductivity and is thus detrimental to connectivityamong filler units.
Continuous fiber polymer-matrix structural composites that are capable of EMIshielding are needed for aircrafts and electronic enclosures.84,101-109 The fibers inthese composites are typically carbon fibers, which may be coated with a metal(nickel110) or be intercalated to increase conductivity.111,112 An alternate designinvolves the use of glass fibers (not conducting) and conducting interlayers in thecomposite.113,114
4.4 EMERGING MATERIALS FOR SHIELDING
A particularly attractive EMI gasket material is flexible graphite, a flexible sheetmade by compressing exfoliated graphite flakes (called worms) without a binder.During exfoliation, an intercalated graphite flake expands over 100 times along thec-axis. Compression of the resulting worms (like accordions) causes them to bemechanically interlocked so that a sheet is formed without a binder.
Due to exfoliation, flexible graphite has a large specific surface area (15 m2/g).Because of the absence of a binder, flexible graphite is essentially entirely graphite(other than the residual amount of intercalate in the exfoliated graphite). As a result,flexible graphite is chemically and thermally resistant, and low in coefficient ofthermal expansion (CTE). Since its microstructure involves graphite layers that areparallel to the surface of the sheet, flexible graphite is high in electrical and thermalconductivities in the plane of the sheet. Because the graphite layers are somewhatconnected perpendicular to the sheet (i.e., the honeycomb microstructure of exfoli-ated graphite), flexible graphite is electrically and thermally conductive in the direc-tion perpendicular to the sheet (although not as conductive as the plane of the sheet).These in-plane and out-of-plane microstructures result in resilience, which is impor-tant for EMI gaskets. Due to the skin effect, a high surface is desirable for shielding.As the electrical conductivity and specific surface area are both quite high in flexiblegraphite, the effectiveness of this material for shielding is exceptionally high (up to130 dB at 1 GHz).115
Other emerging materials for EMI shielding include woodceramics (porouscarbons made by impregnating woody materials with phenol resin)116,117 and alumi-num honeycomb.118
©2001 CRC Press LLC

4.5 CONCLUSION
Materials for EMI shielding are electrically conducting materials in the form ofmetals in bulk, porous and coating forms, composite materials with polymer, cementand carbon matrices, and carbons. In particular, EMI gasket materials, which requireresilience, include elastomers and flexible graphite.
ACKNOWLEDGMENT
This work was supported by the U.S. Defense Advanced Research Projects Agency.
REFERENCES
1. D. Bjorklof, Compliance Eng., 15(5), (1998).2. R. Brewer and G. Fenical, Evaluation Eng., 37(7), S-4−S-10 (1998).3. P. O’Shea, Evaluation Eng., 37(6), 40, 43, 45-46 (1998).4. R.S.R. Devender, Proc. Int. Conf. Electromagnetic Interference and Compatibility,
pp. 459-466 (1997).5. B. Geddes, Control, 9(10), (1996).6. S. Hempelmann, Galvanotechnik, 88(2), 418-424 (1997).7. W.D. Kimmel and D.D. Gerke, Medical Device & Diagnostic Industry, 17(7), 112-115
(1995).8. H.W. Markstein, Electron. Packag. Prod., 35(2), (1995).9. K.A. McRae, National Conf. Publication — Institution of Engineers, Australian, Vol.
2, No. 94/11, pp. 495-498 (1994).10. V.V. Sadchikov and Z.G. Prudnikova, Stal’, No. 4, pp. 66-69 (1997).11. S. Shinagawa, Y. Kumagai and K. Urabe, J. Porous Mater., 6(3), 185-190 (1999).12. B.C. Jackson and G. Shawhan, IEEE Int. Symp. Electromagnetic Compatibility, Vol.
1, pp. 567-572 (1998).13. R. Kumar, A. Kumar and D. Kumar, Proc. Int. Conf. Electromagnetic Interference
and Compatibility, pp. 447-450 (1997).14. L.G. Bhatgadde and S. Joseph, Proc. Int. Conf. Electromagnetic Interference and
Compatibility, pp. 443-445 (1997).15. A. Sidhu, J. Reike, U. Michelsen, R. Messinger, E. Habiger and J. Wolf, IEEE Int.
Symp. Electromagnetic Compatibility, pp. 102-105 (1997).16. J. Hajdu, Trans. Inst. Metal Finish., 75(Pt. 1), B7-B10 (1997).17. G. Klemmer, Special Areas Annual Technical Conf. — ANTEC, Conf. Proc., Vol. 3,
pp. 3430-3432 (1996).18. D. Gwinner, P. Scheyrer and W. Fernandez, Proc., Annual Technical Conf. — Soc.
Vacuum Coaters, p. 336 (1996).19. M.S. Bhatia, Proc. 4th Int. Conf. Electromagnetic Interference and Compatibility, pp.
321-324 (1995).20. L. Zhang, W. Li, J. Liu and B. Ren, Cailiao Gongcheng/J. Mater. Eng., No. 7, pp.
38-41 (1995).21. N.V. Mandich, Plat. Surf. Finish., 81(10), 60-63 (1994).22. B.C. Jackson and P. Kuzyk, IEE Conf. Publication, No. 396, pp. 119-124 (1994).23. C. Nagasawa, Y. Kumagai, K. Urabe and S. Shinagawa, J. Porous Mater., 6(3),
247-254 (1999).
©2001 CRC Press LLC

24. D.S. Dixon and J. Masi, IEEE Int. Symp. Electromagnetic Compatibility, Vol. 2, pp.1035-1040 (1998).
25. P.J.D. Mason, Proc. Annual Technical Conf. — Soc. Vacuum Coaters, pp. 192-197(1994).
26. C.A. Grimes, IEEE Aerospace Applications Conf. Proc., pp. 211-221 (1994).27. W.J. Biter, P.J. Jamnicky and W. Coburn, Int. SAMPE Electronics Conf., Vol. 7, pp.
234-242 (1994).28. L. Xing, J. Liu and S. Ren, Cailiao Gongcheng/J. Mater. Eng., No. 1, pp. 19-21
(1998).29. L. Rupprecht and C. Hawkinson, Medical Device & Diagnostic Industry 21(1),
(1999).30. S. Tan, M. Zhang and H. Zeng, Cailiao Gongcheng/J. Mater. Eng., No. 5, pp. 6-9
(1998).31. R. Charbonneau, Proc. Int. SAMPE Symp. Exhib., Vol. 43, No. 1, pp. 833-844 (1998).32. J.M. Kolyer, Proc. Int. SAMPE Symp. Exhib., Vol. 43, No. 1, pp. 810-822 (1998).33. S.L. Thompson, Evaluation Eng., 37(7), 62-63, 65 (1998).34. D.A. Olivero and D.W. Radford, J. Reinforced Plast. Composites, 17(8), 674-690
(1998).35. K.P. Sau, T.K. Chaki, A. Chakraborty and D. Khastgir, Plast. Rubber Composites
Process. Appl., 26(7), 291-297 (1997).36. W.B. Genetti, B.P. Grady and E.A. O’Rear, Electronic Packaging Materials Science
IX, Materials Research Society Symp. Proc., Vol. 445, pp. 153-158 (1997).37. J. Mao, J. Chen, M. Tu, W. Huang and Y. Liu, Gongcheng Cailiao/J. Functional
Mater., 28(2), 137-139 (1997).38. L. Rupprecht, Proc. Conf. Plastics for Portable and Wireless Electronics, pp. 12-20
(1996).39. B.K. Bachman, Proc. Conf. Plastics for Portable and Wireless Electronics, pp. 7-11
(1996).40. S. Schneider, Kunststoffe Plast. Europe, 87(4), 487-488 (1997).41. S. Schneider, Kunststoffe Plast. Europe, 87(4), 26 (1997).42. Ch-Y. Huang and J-F. Pai, J. Appl. Polym. Sci., 63(1), 115-123 (1997).43. M.W.K. Rosenow and J.A.E. Bell, Materials Annual Tech. Conf. − ANTEC, Conf.
Proc., Vol. 2, pp. 1492-1498 (1997).44. M.W.K. Rosenow and J.A.E. Bell, Proc. Int. SAMPE Symp. Exhib., Vol. 43, No. 1,
pp. 854-864 (1998).45. M.A. Saltzberg, A.L. Neller, C.S. Harvey, T.E. Borninski and R.J. Gordon, Circuit
World, 22(3), 67-68 (1996).46. J. Wang, V.V. Varadan and V.K. Varadan, SAMPE J., 32(6), 18-22 (1996).47. J.V. Masi and D.S. Dixon, Int. SAMPE Electronics Conf., Vol. 7, pp. 243-251 (1994).48. H. Rahman, J. Dowling and P.K. Saha, J. Mater. Proc. Tech., 54(1-4), 21-28 (1995).49. A.A. Dani and A.A. Ogale, 50 Years of Progress in Materials and Science Technology,
Int. SAMPE Technical Conf., Vol. 26, pp. 689-699 (1994).50. D.W. Radford, J. Adv. Mater., 26(1), 45-53 (1994).51. C.M. Ma, A.T. Hu and D.K. Chen, Polym. Polym. Composites, 1(2), 93-99 (1993).52. K. Miyashita and Y. Imai, Int. Prog. Urethanes, 6, 195-218 (1993).53. L. Li, P. Yih and D.D.L. Chung, J. Electron. Mater., 21(11), 1065-1071 (1992).54. L. Li and D.D.L. Chung, Composites, 25(3), 215-224 (1994).55. L. Li and D.D.L. Chung, Polym. Composites, 14(5), 361-366 (1993).56. L. Li and D.D.L. Chung, Polym. Composites, 14(6), 467-472 (1993).57. L. Li and D.D.L. Chung, Composites, 22(3), 211-218 (1991).
©2001 CRC Press LLC

58. M. Zhu and D.D.L. Chung, J. Electron. Packag., 113, 417-420 (1991).59. M. Zhu and D.D.L. Chung, Composites, 23(5), 355-364 (1992).60. J.A. Pomposo, J. Rodriguez and H. Grande, Synth. Met., 104(2), 107-111 (1999).61. J-S. Park, S-H. Ryn and O-H. Chung, Annual Technical Conf. — ANTEC, Conf.
Proc., Vol. 2, pp. 2410-2414 (1998).62. S. Courric and V.H. Tran, Polymer, 39(12), 2399-2408 (1998).63. M. Angelopoulos, Proc. Conf. Plastics for Portable and Wireless Electronics, p. 66
(1997).64. T. Makela, S. Pienimaa, T. Taka, S. Jussila and H. Isotalo, Synth. Met., 85(1-3),
1335-1336 (1997).65. R.S. Kohlman, Y.G. Min, A.G. MacDiarmid and A.J. Epstein, J. Eng. Appl. Sci., 2,
1412-1416 (1996).66. K. Naishadham, Int. SAMPE Electronics Conf., Vol. 7, pp. 252-265 (1994).67. A. Kaynak, A. Polat and U. Yilmazer, Mater. Res. Bull., 31(10), 1195-1206 (1996).68. A. Kaynak, Mater. Res. Bull., 31(7), 845-860 (1996).69. J. Joo, A.G. MacDiarmid and A.J. Epstein, Ann. Tech. Conf. — ANTEC, Conf. Proc.,
Vol. 2, pp. 1672-1677 (1995).70. C.P.J.H. Borgmans and R.H. Glaser, Evaluation Eng., 34(7), S-32–S-37 (1995).71. P. Yan, Scientific American, 273(1), 82-87 (1995).72. P.J. Mooney, JOM, 46(3), 44-45 (1994).73. H.H. Kuhn, A.D. Child and W.C. Kimbrell, Synth. Mater., 71(1-3), 2139-2142 (1995).74. M.T. Nguyen and A.F. Diaz, Adv. Mater., 6(11), 858-860 (1994).75. J. Unsworth, C. Conn, Z. Jin, A. Kaynak, R. Ediriweera, P. Innis and N. Booth, J.
Intelligent Mater. Syst. Struct., 5(5), 595-604 (1994).76. A. Kaynak, J. Unsworth, R. Clout, A.S. Mohan and G.E. Beard, J. Appl. Polym. Sci.,
54(3), 269-278 (1994).77. A. Kaynak, A.S. Mohan, J. Unsworth and R. Clout, J. Mater. Sci. Lett., 13(15),
1121-1123 (1994).78. W. Sauerer, Galvanotechnik, 85(5), 1467-1472 (1994).79. M.P. de Goefe and L.W. Steenbakkers, Kunststoffe Plast. Eur., 84, 16-18 (1994).80. X. Fu and D.D.L. Chung, Carbon, 36(4), 459-462 (1998).81. L. Gnecco, Evaluation Eng., 38(3), (1999).82. S-S. Lin, SAMPE J., 30(5), 39-45 (1994).83. Y. Kurosaki and R. Satake, IEEE Int. Symp. Electromagnetic Compatibility, pp.
739-740 (1994).84. X. Luo and D.D.L. Chung, Composites, Part B, 30(3), 227-231 (1999).85. M. Zhu, Y. Qiu and J. Tian, Cailiao Gongcheng/J. Functional Mater., 29(6), 645-647
(1998).86. D.A. Case and M.J. Oliver, Compliance Eng., 16(2), 40, 42, 44, 46, 48-49 (1999).87. S. Hudak, Evaluation Eng., 37(8), (1998).88. B.N. Prakash and L.D. Roy, Proc. Int. Conf. Electromagnetic Interference and Com-
patibility, pp. 1-2 (1997).89. S.H. Peng and K. Zhang, Annual Tech. Conf. — ANTEC, Conf. Proc., Vol. 2, pp.
1216-1218 (1998).90. S.K. Das, J. Nuebel and B. Zand, IEEE Int. Symp. Electromagnetic Compatibility,
pp. 66-71 (1997).91. S.H. Peng and W.S.V. Tzeng, IEEE Int. Symp. Electromagnetic Compatibility, pp.
94-97 (1997).92. P. O’Shea, Evaluation Eng., 36(8), (1997).93. P. O’Shea, Evaluation Eng., 35(8), (1996).
©2001 CRC Press LLC

94. Anonymous, Electron. Eng., 68(834), (1996).95. B. Lee, Engineering, 236(10), 32-33 (1995).96. R.A. Rothenberg, D.C. Inman and Y. Itani, IEEE Int. Symp. Electromagnetic Com-
patibility, p. 818 (1994).97. B.D. Mottahed and S. Manoochehri, Polym. Eng. Sci., 37(3), 653-666 (1997).98. X. Shui and D.D.L. Chung, J. Electron. Packag., 119(4), 236-238 (1997).99. X. Shui and D.D.L. Chung, J. Electron. Mater., 26(8), 928-934 (1997).
100. X. Shui and D.D.L. Chung, J. Electron. Mater., 24(2), 107-113 (1995).101. Y. Ramadin, S.A. Jawad, S.M. Musameh, M. Ahmad, A.M. Zihlif, A. Paesano, E.
Martuscelli and G. Ragosta, Polym. Int., 34(2), 145-150 (1994).102. M-S. Lin, IEEE Int. Symp. Electronmagnetic Compatibility, pp. 112-115 (1994).103. H-K. Chiu, M-S. Lin and C.H. Chen, IEEE Trans. Electromagnetic Compatibility,
39(4), 332-339 (1997).104. J.C. Roberts and P.D. Weinhold, J. Composite Mater., 29(14), 1834-1849 (1995).105. D.A. Olivero and D.W. Radford, SAMPE J., 33(1), 51-57 (1997).106. M. Choate and G. Broadbent, Thermosets: The True Engineering Polymers, Technical
Papers, Regional Tech. Conf. — Soc. Plast. Eng., pp. 69-82 (1996).107. P.D. Wienhold, D.S. Mehoke, J.C. Roberts, G.R. Seylar and D.L. Kirkbride, Int.
SAMPE Tech. Conf., Vol. 30, pp. 243-255 (1998).108. A. Fernyhough and Y. Yokota, Materials World, 5(4), 202-204 (1997).109. T. Hiramoto, T. Terauchi and J. Tomibe, Electrical Overstress/Electrostatic Discharge
Symp. Proc., ESD Assoc., pp. 18-21 (1998).110. L.G. Morin Jr. and R.E. Duvall, Proc. Int. SAMPE Symp. Exhib., Vol. 43, No. 1, pp.
874-881 (1998).111. J.R. Gaier and J. Terry, Int. SAMPE Electronics Conf., Vol. 7, pp. 221-233 (1994).112. J.R. Gaier, M.L. Davidson and R.K. Shively, Technology Transfer in a Global Com-
munity, Int. SAMPE Tech. Conf., Vol. 28, pp. 1136-1147 (1996).113. J.M. Liu, S.N. Vernon, A.D. Hellman and T.A. Campbell, Proc. SPIE — The Int.
Soc. Optical Eng., Vol. 2459, pp. 60-68 (1995).114. D.A. Olivero and D.W. Radford, Technology Transfer in a Global Community, Int.
SAMPE Tech. Conf., Vol. 28, pp. 1110-1121 (1996).115. X. Luo and D.D.L. Chung, Carbon, 34(10), 1293-1294 (1996).116. K. Shibata, T. Okabe, K. Saito, T. Okayama, M. Shimada, A. Yamamura and R.
Yamamoto, J. Porous Mater., 4(4), 269-275 (1997).117. T. Okabe, K. Saito, H. Togawa and Y. Kumagai, Zairyo/J. Soc. Mater. Sci., Japan,
44(498), 288-291 (1995).118. B.M. Rakshit, Proc. 1995 4th Int. Conf. Electromagnetic Interference Compatibility,
IEEE, pp. 413-415 (1995).119. C.R. Paul, Introduction to Electromagnetic Compatibility, K. Chang, Ed., John Wiley,
New York, p. 649 (1992).
©2001 CRC Press LLC

Cement-Based Electronics
CONTENTS
5.1 Introduction5.2 Background on Cement-Matrix Composites5.3 Cement-Based Electrical Circuit Elements
5.3.1 Conductor5.3.2 Diode
5.4 Cement-Based Sensors5.4.1 Strain Sensor 5.4.2 Damage Sensor 5.4.3 Thermistor
5.5 Cement-Based Thermoelectric Device5.6 ConclusionReferences
SYNOPSIS Cement-based electronics in the form of electrical circuit elements(conductor and diode in the form of a pn-junction), sensors of strain and damage,thermistor, and thermoelectric device are reviewed. They enable a concrete structureto provide electronic functions.
RELEVANT APPENDICES: A, B, C, E, F, I
5.1 INTRODUCTION
Cement, such as Portland cement, has long been used as a structural material. It canalso be used as an electronic material that provides electrical circuit elements,sensors, and thermoelectric devices. The use of a structural material for electronicsenables a structure to provide electronic functions, making it multifunctional andsmart.
Due to the large volume of usage of structural materials they must be inexpen-sive. In contrast, conventional electronic materials such as semiconductors are rel-
5
©2001 CRC Press LLC

atively expensive, particularly when vacuum processing, single crystals, and highpurity are required. Using a structural material for electronics results in low-costelectronics.
A structural material must have good mechanical properties. Semiconductorstend to have poor mechanical properties. The use of a structural material for elec-tronics results in electronics that are mechanically rugged.
This chapter is a review of cement-based electronics, an emerging field that isscientifically rich and technologically relevant.
5.2 BACKGROUND ON CEMENT-MATRIX COMPOSITES
Cement-matrix composites include concrete, mortar, and cement paste. They alsoinclude steel-reinforced concrete, i.e., concrete containing steel reinforcing bars.Other fillers, called admixtures, can be added to the mix to improve the propertiesof the composite. Admixtures are discontinuous, so they can be included in the mix.They can be particles, such as silica fume and latex; short fibers, such as polymer,steel, glass, or carbon fibers; or they can be liquids, such as methylcellulose aqueoussolution, water-reducing agent, defoamer, etc. The focus of this chapter is admixturesfor rendering composite electronic abilities while maintaining or even improvingstructural properties.
Cement-matrix composites for electronics include those containing short carbonfibers (for sensing strain, damage and temperature, for rendering p-type behavior,and for electromagnetic radiation reflection), short steel fibers (for thermoelectricityand for rendering n-type behavior), and silica fume (for helping fiber dispersion).This section provides background on cement-matrix composites, with emphasis oncarbon fiber cement-matrix composites.
Carbon fiber cement-matrix composites are structural materials that are rapidlygaining in importance due to the decrease in carbon fiber cost1 and the increasingdemand for superior structural and functional properties. These composites containshort carbon fibers, typically 5 mm in length, as they can be used as an admixturein concrete (whereas continuous fibers cannot simply be added to the concrete mix).Short fibers are also less expensive than continuous fibers. However, due to the weakbond between carbon fibers and the cement matrix, continuous fibers2-4 are muchmore effective in reinforcing concrete. Surface treatment of carbon fibers (by heating5
or by using ozone,6,7 silane,8 SiO2 particles,9 or hot NaOH solution10) is useful forimproving the bond between fiber and matrix, thereby improving the properties ofthe composite. In the case of surface treatment by ozone or silane, the improvedbond is due to the enhanced wettability by water. Admixtures such as latex,6,11
methyscellulose,6 and silica fume12 also help the bond.The effect of carbon fiber addition on the properties of concrete increases with
fiber volume fraction,13 unless the fiber volume fraction is so high that the air voidcontent becomes excessively high.14 (The air void content increases with fiber con-tent, and air voids tend to have a negative effect on many properties, such as thecompressive strength.) In addition, the workability of the mix decreases with fiber
©2001 CRC Press LLC

content.13 Moreover, the cost increases with fiber content. Therefore, a rather lowvolume fraction of fibers is desirable. A fiber content as low as 0.2 vol. % iseffective,15 although fiber contents exceeding 1 vol. % are more common.16-20 Therequired fiber content increases with the particle size of the aggregate, as the flexuralstrength decreases with increasing particle size.21
Effective use of carbon fibers in concrete requires dispersion of the fibers in themix. The dispersion is enhanced by using silica fume as an admixture.14,22-24 A typicalsilica fume content is 15% by weight of cement.14 The silica fume is typically usedalong with a small amount (0.4% by weight of cement) of methylcellulose for helpingthe dispersion of the fibers and the workability of the mix.14 Latex (typically 15–20%by weight of cement) is much less effective for helping the fiber dispersion, but itenhances workability, flexural strength, flexural toughness, impact resistance, frostresistance, and acid resistance.14,25,26 The ease of dispersion increases with decreasingfiber length.24
The improved structural properties rendered by carbon fiber addition pertain toincreased tensile and flexible strengths, increased tensile ductility and flexural tough-ness, enhanced impact resistance, reduced drying shrinkage, and improved freeze-thaw durability.13-15,17-25,27-38 Tensile and flexural strengths decrease with increasingspecimen size such that the size effect becomes larger as the fiber length increases.39
The low drying shrinkage is valuable for large structures and for use in repair,40,41
and in joining bricks in a structure.42,43
The functional properties rendered by carbon fiber addition pertain to strain-sensing ability,7,44-60 temperature-sensing ability,61-68 damage-sensing ability,44,48,69-71
thermoelectric behavior,63-68 thermal insulation ability,72-74 electrical conductionability75-85 (to facilitate cathodic protection of embedded steel and to provide elec-trical grounding or connection), and radio wave reflection/adsorption ability86-90 (forEMI shielding, for lateral guidance in automatic highways, and for television imagetransmission).
In relation to the structural properties, carbon fibers compete with glass, polymer,and steel fibers.18,27-29,32,36-38,91 Carbon fibers (isotropic pitch-based)1,91 are advanta-geous in their superior ability to increase the tensile strength of concrete, even thoughthe tensile strength, modulus, and ductility of isotropic pitch-based carbon fibers arelow compared to most other fibers. Carbon fibers are also advantageous for relativechemical inertness.92 PAN-based carbon fibers are also used,17,19,22,33 although theyare more commonly used as continuous fibers. Carbon-coated glass fibers93,94 andsubmicron-diameter carbon filaments86,87 are even less commonly used, although theformer are attractive for the low cost of glass fibers and the latter for high radiowave reflectivity. C-shaped carbon fibers are more effective for strengthening thanare round carbon fibers,95 but their relatively large diameter makes them less attrac-tive. Carbon fibers can be used in concrete together with steel fibers, as the additionof short carbon fibers to steel fiber-reinforced mortar increases the fracture toughnessof the interfacial zone between steel fibers and the cement matrix.96 Carbon fiberscan also be used in concrete with steel bars,97,98 or with carbon fiber-reinforcedpolymer rods.99
In relation to most functional properties, carbon fibers are exceptional comparedto other fiber types. Carbon fibers are electrically conducting, in contrast to glass
©2001 CRC Press LLC
and polymer fibers, which are not. Steel fibers are conducting, but their typicaldiameters (≥ 60 µm) are much larger than the diameter of a typical carbon fiber (15µm). The combination of electrical conductivity and small diameter makes carbonfibers superior to the other fiber types in the area of strain sensing and electricalconduction. However, carbon fibers are inferior to steel fibers for providing thermo-electric composites because of the high electron concentration in steel and the lowhole concentration in carbon.
Although carbon fibers are thermally conducting, addition of carbon fibers toconcrete lowers thermal conductivity,72 thus allowing applications related to thermalinsulation. This effect of carbon fiber addition is due to the increase in air voidcontent. The electrical conductivity of carbon fibers is higher than that of the cementmatrix by about eight orders of magnitude, whereas the thermal conductivity ofcarbon fibers is higher than that of the cement matrix by only one or two orders ofmagnitude. As a result, electrical conductivity is increased upon carbon fiber additiondespite the increase in air void content, but thermal conductivity is decreased.
The use of pressure after casting,100 and extrusion101,102 can result in compositeswith superior microstructure and properties. Moreover, extrusion improves the shap-ability.102
5.3 CEMENT-BASED ELECTRICAL CIRCUIT ELEMENTS
5.3.1 CONDUCTOR
Short carbon fibers are particularly effective for enhancing the electrical conductivityof cement.80 Figure 5.180 illustrates the volume electrical resistivity of compositesat seven days of curing. The resistivity decreases with increasing fiber volumefraction, whether or not a second filler (silica fume or sand) is present. When sandis absent, the addition of silica fume decreases the resistivity at all carbon fibervolume fractions except the highest of 4.24%; the decrease is most significant at thelowest fiber volume fraction of 0.53%. When sand is present, the addition of silicafume similarly decreases resistivity such that the decrease is most significant at fibervolume fractions below 1%. When silica fume is absent, the addition of sanddecreases resistivity only when the fiber volume fraction is below about 0.5%; athigh fiber volume fractions, the addition of sand increases resistivity due to theporosity induced by the sand. Thus, the addition of a second filler that is essentiallynonconducting decreases the resistivity of the composite only at low volume fractionsof the carbon fibers, and the maximum fiber volume fraction for the resistivity todecrease is larger when the particle size of the filler is smaller. The resistivitydecrease is attributed to improved fiber dispersion because of the presence of thesecond filler. Consistent with improved fiber dispersion is increased flexural tough-ness and strength.
5.3.2 DIODE
The pn-junction is the junction between a p-type conductor (a conductor with holesas the majority carrier) and an n-type conductor (a conductor with electrons as the
©2001 CRC Press LLC

majority carrier). The pn-junction is ideally rectifying, i.e., the current-voltage char-acteristic is such that the current is large when the applied voltage is positive on thep-side relative to the n-side, and is small when the applied voltage is positive on then-side relative to the p-side. The pn-junction is an electronic device that is centralto electrical circuitry because of its importance to diodes and transistors. Akin tothe pn-junction is the n-n+ junction, a junction between a weakly n-type conductorand a strongly n-type (i.e., n+) conductor.
In the field of electrical engineering, a pn-junction is obtained by allowing a p-type semiconductor to contact an n-type semiconductor. These semiconductors areobtained by doping with appropriate impurities that serve as electron donors (for n-type semiconductors) or electron acceptors (for p-type semiconductors).
Cement is inherently n-type, although it is only slightly n-type.65 Upon additionof a sufficient amount of short carbon fibers to cement, a composite that is p-typeis obtained.63-66 Upon addition of short steel fibers to cement, a composite that isstrongly n-type is obtained.103 In other words, the cement matrix contributes toconduction by electrons; carbon fibers contribute to conduction by holes; and steelfibers contribute to conduction by electrons.
Electric current rectification has been observed in a cement junction, as obtainedby the separate pouring of electrically dissimilar cement mixes side by side.104
FIGURE 5.1 Variation of the volume electrical resistivity with carbon fiber volume fraction:(a) without sand, with methylcellulose, without silica fume; (b) without sand, with methyl-cellulose, with silica fume; (c) with sand, with methyscellulose, without silica fume; (d) withsand, with methyscellulose, with silica fume.
1,000,000
100,000
10,000
1,000
100
10
10 1 2 3 4 5
Vol.% Fibers
Volu
me
Res
isti
vity
(Ω
.cm
), lo
g s
cale
(c)
(a)
(d)
(b)
©2001 CRC Press LLC

Figure 5.2 shows the I-V characteristic for the junction involving carbon-fiber(1.0% by weight of cement), silica-fume cement paste (p-type, with absolute ther-moelectric power –0.48 ± 0.11 µV/°C), and steel fiber (0.5% by weight of cement)cement paste (n-type, with absolute thermoelectric power 53.3 ± 4.8 µV/°C). Thispn-junction is rectifying. The I-V characteristic is nonlinear. The slope is steeper inthe positive voltage regime than the negative voltage regime.
The asymmetry in the I-V characteristic on the two sides of the origin for variousjunctions is in sharp contrast to the symmetry for a homogeneous piece of cementpaste without a junction.61 Hence, the asymmetry is attributed to the junction itself.
The junctions are rectifying; the magnitude of current is much larger when thevoltage is positive than when the voltage is negative. The rectification is attributedto the asymmetric electron flow resulting from the junction. Due to the high con-centration of electrons on the n-side, electrons flow by diffusion from the n-side tothe p-side across the junction. This flow is enhanced by a positive voltage that lowersthe contact potential at the junction. When the voltage is negative, the contactpotential is high, causing the diffusion current to be low. However, electrons areswept from the p-side to the n-side under the electric field associated with the highcontact potential at the junction, resulting in a drift current in the direction oppositeto the diffusion current. The drift current is enhanced by a more negative voltage,but is low due to the low electron concentration on the p-side.
5.4 CEMENT-BASED SENSORS
5.4.1 STRAIN SENSOR
The electrical resistance of strain-sensing concrete changes reversibly with strainsuch that the gage factor (fractional change in resistance per unit strain) is up to 700under compression or tension.7,44-60 The resistance (DC/AC) increases reversiblyupon tension and decreases reversibly upon compression because of fiber pull-outupon microcrack opening (< 1 µm), and the consequent increase in fiber-matrix
FIGURE 5.2 I-V characteristic of a cement-based pn junction.
0.6
0.5
0.4
0.3
0.2
0.1
-0.1
-0.2
-0.3
-30 -20 -10 10 20 300
0
Voltage (V)C
urr
ent
(mA
)
©2001 CRC Press LLC

contact resistivity. The concrete contains as low as 0.2 vol.% short carbon fibers,preferably those that have been surface treated. The fibers do not need to touch oneanother in the composite. The treatment improves the wettability with water. Thepresence of a large aggregate decreases the gage factor, but the strain-sensing abilityremains sufficient for practical use. Strain-sensing concrete works even when dataacquisition is wireless. Applications include structural vibration control and trafficmonitoring.
Figure 5.3(a) shows the fractional change in resistivity along the stress axis, andthe strain during repeated compressive loading at an increasing stress amplitude forcarbon-fiber latex cement paste at 28 days of curing. Figure 5.3(b) shows thecorresponding variation of stress and strain during the repeated loading. The strainvaries linearly with the stress up to the highest stress amplitude (Figure 5.3(b)). Thestrain returns to zero at the end of each cycle of loading. The resistivity decreasesupon loading in every cycle (due to fiber push-in) and increases upon unloading inevery cycle (due to fiber pull-out). The resistivity has a net increase after the firstcycle because of damage. Little further damage occurs in subsequent cycles, asshown by the resistivity after unloading not increasing much after the first cycle.The greater the strain amplitude, the more the resistivity decrease during loading,although resistivity and strain are not linearly related. The effects in the figures weresimilarly observed in carbon-fiber silica-fume cement paste at 28 days of curing.
Figures 5.4 and 5.5 illustrate the fractional changes in the longitudinal andtransverse resistivities, respectively, for carbon-fiber silica-fume cement paste at 28days of curing during repeated unaxial tensile loading at increasing strain amplitudes.The strain essentially returns to zero at the end of each cycle, indicating elasticdeformation. The longitudinal strain is positive (i.e., elongation); the transverse strainis negative (i.e., shrinkage due to the Poisson effect). Both longitudinal and transverseresistivities increase reversibly upon uniaxial tension. The reversibility of both strainand resistivity is more complete in the longitudinal direction than in the transversedirection. The gage factor is 89 and –59 for the longitudinal and transverse resis-tances, respectively.
Figures 5.6 and 5.7 show corresponding results for silica-fume cement paste.The strain is essentially totally reversible in both the longitudinal and transversedirections, but the resistivity is only partly reversible in both directions, in contrastto the reversibility of the resistivity when fibers are present (Figures 5.4 and 5.5).As in the case with fibers, both longitudinal and transverse resistivities increase uponuniaxial tension. However, the gage factor is only 7.2 and –7.1 for Figures 5.6 and5.7, respectively.
Comparison of Figures 5.4 and 5.5 (with fibers) with Figures 5.6 and 5.7 (withoutfibers) shows that fibers greatly enhance the magnitude and reversibility of theresistivity effect. The gage factors are much smaller in magnitude when fibers areabsent.
The increase in both longitudinal and transverse resistivities upon uniaxial ten-sion for cement pastes, whether with or without fibers, is attributed to defect (e.g.,microcrack) generation. In the presence of fibers, fiber bridging across microcracksoccurs, and slight fiber pull-out takes place upon tension, enhancing the possibilityof microcracks closing and causing more reversibility in the resistivity change. The
©2001 CRC Press LLC

fibers are much more electrically conductive than the cement matrix. The presenceof the fibers introduces interfaces between fibers and matrix. The degradation of thefiber-matrix interface, due to fiber pull-out or other mechanisms, is an additionaltype of defect generation that will increase the resistivity of the composite. Therefore,the presence of fibers greatly increases the gage factor.
a
b
FIGURE 5.3 Variation of the fractional change in volume electrical resistivity with time (a),of the stress with time (b), and of the strain (negative for compressive strain) with time (a,b)during dynamic compressive loading at increasing stress amplitudes within the elastic regimefor carbon-fiber latex cement paste at 28 days of curing.
2
1
0
-1
-2
0 50 100 150 200 250
-120
-100
-80
-60
-40
-20
0
Fra
ctio
nal
ch
ang
e in
resi
stiv
ity
(%)
Str
ain
(10
-6)
Time (s)
0 0
0 50 100 150 200 250
-0.2-50
-100
-150
-200
-250
-0.4
-0.6
-0.8
-1.2
-1.4
-1.6
-1.8
-1
Time (s)
Str
ess
(MP
a)
Str
ain
(10
-6)
©2001 CRC Press LLC

Transverse resistivity increases upon uniaxial tension, even though the Poissoneffect causes the transverse strain to be negative. This means that the effect of thetransverse resistivity increase overshadows the effect of transverse shrinkage. Theresistivity increase is a consequence of uniaxial tension. In contrast, under uniaxialcompression, resistance in the stress direction decreases at 28 days of curing. Hence,
FIGURE 5.4 Variation of the fractional change in longitudinal electrical resistivity with time(solid curve) and of the strain with time (dashed curve) during dynamic uniaxial tensileloading at increasing stress amplitudes within the elastic regime for carbon-fiber silica-fumecement paste.
FIGURE 5.5 Variation of the fractional change in transverse electrical resistivity with time(solid curve) and of the strain with time (dashed curve) during dynamic uniaxial tensileloading at increasing stress amplitudes within the elastic regime for carbon-fiber silica-fumecement paste.
0.2
0.15
0.05
00 10 20 30 40 50 60
0
0.4
0.2
0.60.8
1
1.2
1.4
1.61.8
0.1
Lo
ng
itu
din
al s
trai
n (
10-5
)
Time (s)
Fra
ctio
nal
ch
ang
e in
lon
git
ud
inal
res
isti
vity
0.012
0.01
0.008
0.006
0.004
0.002
0
0 10 20 30 40 50 60
-2.5
-2
-1.5
-0.5
-1
0
Fra
ctio
nal
ch
ang
e in
tran
sver
se r
esis
tivi
ty
Time (s)
Tran
sver
se s
trai
n (
10-6
)
©2001 CRC Press LLC

the effect of uniaxial tension on transverse resistivity, and that of uniaxial compres-sion on longitudinal resistivity are different; the gage factors are negative andpositive, respectively.
The similarity of the resistivity change in longitudinal and transverse directionsunder uniaxial tension suggests similarity for other directions as well. This meansthe resistance can be measured in any direction to sense the occurrence of tensile
FIGURE 5.6 Variation of the fractional change in longitudinal electrical resistivity with time(solid curve) and of the strain with time (dashed curve) during dynamic uniaxial tensileloading at increasing stress amplitudes within the elastic regime for silica-fume cement paste.
FIGURE 5.7 Variation of the fractional change in transverse electrical resistivity with time(solid curve) and of the strain with time (dashed curve) during dynamic uniaxial tensileloading at increasing stress amplitudes within the elastic regime for silica-fume cement paste.
0.016
0.012
0.008
0.004
0
0 10 20 30 40 50 60
2.5
1.5
0.5
2
1
0
Fra
ctio
nal
ch
ang
e in
lon
git
ud
inal
res
isti
vity
Time (s)
Lo
ng
itu
din
al s
trai
n (
10-5
)
0
0 10 20 30 40 50 60
-2.5
-1.5
-0.5
-2
-1
0
Fra
ctio
nal
ch
ang
e in
tran
sver
se r
esis
tivi
ty
Time (s)
Tran
sver
se s
trai
n (
10-6
)
0.0016
0.0014
0.0012
0.0008
0.0006
0.0004
0.0002
0.001
©2001 CRC Press LLC

loading. Although the gage factor is comparable in both longitudinal and transversedirections, the fractional change in resistance under uniaxial tension is much higherin the longitudinal direction than in the transverse direction. Thus, the use of lon-gitudinal resistance for practical self-sensing is preferred.
5.4.2 DAMAGE SENSOR
Concrete, with or without admixtures, is capable of sensing major and minordamage — even damage during elastic deformation — due to the electrical resistivityincrease that accompanies damage.44,48,69-71 That both strain and damage can besensed simultaneously through resistance measurement means that the strain/stresscondition (during dynamic loading) under which damage occurs can be obtained,thus facilitating damage origin identification. Damage is indicated by a resistanceincrease, which is larger and less reversible when the stress amplitude is higher. Theresistance increase can be a sudden increase during loading. It can also be a gradualshift of baseline resistance.
Figure 5.8(a)70 shows the fractional change in resistivity along the stress axis,as well as the strain during repeated compressive loading at an increasing stressamplitude, for plain cement paste at 28 days of curing. Figure 5.8(b) shows thecorresponding variation of stress and strain during the repeated loading. The strainvaries linearly with the stress up to the highest stress amplitude (Figure 5.8(b)). Thestrain returns to zero at the end of each cycle of loading. During the first loading,resistivity increases due to damage initiation. During the subsequent unloading,resistivity continues to increase, probably due to the opening of the microcracksgenerated during loading. During the second loading, resistivity decreases slightlyas the stress increases up to the maximum stress of the first cycle (probably due toclosing of the microcracks), and then increases as the stress increases beyond thisvalue (probably due to the generation of additional microcracks). During unloadingin the second cycle, resistivity increases significantly (probably due to opening ofthe microcracks). During the third loading, resistivity essentially does not change(or decreases very slightly) as the stress increases to the maximum stress of the thirdcycle (probably due to the balance between microcrack generation and microcrackclosing). Subsequent unloading causes resistivity to increase very significantly (prob-ably due to opening of the microcracks).
Figure 5.9 shows the fractional change in resistance, strain, and stress duringrepeated compressive loading at increasing and decreasing stress amplitudes forcarbon fiber (0.18 vol.%) concrete at 28 days of curing. The highest stress amplitudeis 60% of the compressive strength. A group of cycles in which the stress amplitudeincreases cycle by cycle, and then decreases cycle by cycle to the initial low stressamplitude, is hereby referred to as a group. Figure 5.9 shows the results for threegroups. The strain returns to zero at the end of each cycle for the stress amplitudes,indicating elastic behavior. The resistance decreases upon loading in each cycle, asin Figure 5.3. An extra peak at the maximum stress of a cycle grows as the stressamplitude increases, resulting in two peaks per cycle. The original peak (straininduced) occurs at zero stress, while the extra peak (damage induced) occurs at themaximum stress. Hence, during loading from zero stress within a cycle, the resistance
©2001 CRC Press LLC

drops and then increases sharply, reaching the maximum resistance of the extra peakat the maximum stress of the cycle. Upon subsequent unloading, resistance decreasesand then increases as unloading continues, reaching the maximum resistance of theoriginal peak at zero stress. In the part of this group where the stress amplitudedecreases cycle by cycle, the extra peak diminishes and disappears, leaving theoriginal peak as the sole peak. In the part of the second group where the stress
a
b
FIGURE 5.8 Variation of the fractional change in electrical resistivity with time (a), of thestress with time (b), and of the strain (negative for compressive strain) with time (a,b) duringdynamic compressive loading at increasing stress amplitudes within the elastic regime forsilica-fume cement paste at 28 days of curing.
00 50 100 150 200 250
-100
-90
-80
-70
-60
-50
-40
-30
-20
-10
0
Fra
ctio
nal
ch
ang
e in
resi
stiv
ity
(%)
Time (s)
Str
ain
(10
-6)
0.35
0.25
0.15
0.05
0.3
0.2
0.1
Time (s)
Str
ain
(10
-6)
0
-0.2
-0.4
-0.6
-0.8
-1.2
-1.4
-1.6
-1.8
-1
0 50 100 150 200 250
-250
-200
-150
-100
-50
0
Str
ess
(MP
a)
©2001 CRC Press LLC

amplitude increases cycle by cycle, the original peak is the sole peak, except thatthe extra peak returns in a minor way (more minor than in the first group) as thestress amplitude increases. The extra peak grows as the stress amplitude increases,but, in the part of the second group in which the stress amplitude decreases cycleby cycle, it quickly diminishes and vanishes, as in the first group. Within each group,the amplitude of resistance variation increases as the stress amplitude increases, anddecreases as the stress amplitude decreases.
a
b
FIGURE 5.9 Fractional change in resistance (a), strain (a), and stress (b) during repeatedcompressive loading at increasing and decreasing stress amplitudes, the highest of which was60% of the compressive strength, for carbon fiber concrete at 28 days of curing.
6.0%
4.0%
2.0%
0.0%
-2.0%
-4.0%
-6.0%
Time (s)
-0.0005
-0.0003
-0.0001
0.0001
0.0003
0.0005
Str
ain
Fra
ctio
nal
ch
ang
e in
res
ista
nce
0 500 1000 1500 2000
0 500 1000 1500 2000
0.0
-2.0
-4.0
-6.0
-8.0
-10.0
Time (s)
Str
ess
(MP
a)
©2001 CRC Press LLC

The greater the stress amplitude, the larger and less reversible the damage-induced resistance increase. If the stress amplitude has been experienced before, thedamage-induced resistance increase is small, as shown by comparing the result ofthe second group with that of the first (Figure 5.9), unless the extent of damage islarge (Figure 5.10 shows a highest stress amplitude of >90% the compressivestrength). When the damage is extensive (as shown by a modulus decrease), damage-induced resistance increase occurs in every cycle, even at a decreasing stress ampli-
a
b
FIGURE 5.10 Fractional change in resistance (a), strain (a), and stress (b) during repeatedcompressive loading at increasing and decreasing stress amplitudes, the highest of which was>90% of the compressive strength, for carbon fiber concrete at 28 days of curing.
80%
60%
40%
20%
0%
-20%
-40%
-60%
0.003
0.002
0.001
0.000
-0.001
-0.002
0 500 1000 1500 2000
Time (sec)
Str
ain
Fra
ctio
nal
ch
ang
e in
res
ista
nce
0.0
-2.0
-4.0
-6.0
-8.0
-10.0
Str
ess
(MP
a)
Time (s)
0 500 1000 1500 2000
©2001 CRC Press LLC

tude, and it can overshadow the strain-induced resistance decrease (Figure 5.10).Hence, damage-induced resistance increase occurs mainly during loading (evenwithin the elastic regime), particularly at a stress above that in prior cycles, unlessthe stress amplitude is high and/or damage is extensive.
At a high stress amplitude, damage-induced resistance increases cycle by cycleas the increases in stress amplitude cause the baseline resistance to increase irre-versibly (Figure 5.10). The baseline resistance in the regime of major damage (witha decrease in modulus) provides a measure of the extent of damage. This measureworks in the loaded or unloaded state. In contrast, the measure using the damage-induced resistance increase (Figure 5.9) works only during stress increase andindicates the occurrence of damage and its extent.
5.4.3 THERMISTOR
A thermistor is a thermometric device consisting of a material (typically a simicon-ductor, but in this case a cement paste) whose electrical resistivity decreases withrise in temperature. The carbon fiber concrete described above for strain sensing isa thermistor due to its resistivity decreasing reversibly with increasing temperature;61
its sensitivity is comparable to that of semiconductor thermistors. (The effect oftemperature will need to be compensated by using the concrete as a strain sensor.)Without fibers, sensitivity is much lower.61,62
Figure 5.1161 shows the current-voltage characteristic of carbon-fiber (0.5% byweight of cement) silica-fume (15% by weight of cement) cement paste at 38°Cduring stepped heating. The characteristic is linear below 5 V, and deviates positivelyfrom linearity beyond 5 V. The resistivity is obtained from the slope of the linearportion. The voltage at which the characteristic starts to deviate from linearity isreferred to as the “critical voltage.”
Figure 5.12 shows a plot of resistivity vs. temperature during heating and coolingfor carbon-fiber silica-fume cement paste. The resistivity decreases upon heating,and the effect is quite reversible upon cooling. That the resistivity is slightly increasedafter a heating-cooling cycle is probably due to thermal degradation of the material.Figure 5.13 shows the Arrhenius plot of log conductivity (conductivity = 1/resistiv-
FIGURE 5.11 Current-voltage characteristic of carbon-fiber silica-fume cement paste at38°C during stepped heating.
-30
-3000
-2000
-1000
0
2000
3000
1000
-20 -10 0 10 20 30
Voltage (V)
Cu
rren
t (µ
A)
©2001 CRC Press LLC

ity) vs. reciprocal absolute temperature. The slope of the plot gives the activationenergy, which is 0.390 ± 0.014 and 0.412 ± 0.017 eV during heating and cooling,respectively.
Results similar to those of carbon-fiber silica-fume cement paste were obtainedwith carbon-fiber (0.5% by weight of cement) latex (20% by weight of cement)cement paste, silica-fume cement paste, latex cement paste, and plain cement paste.However, for all these four types of cement paste, (1) the resistivity is higher byabout an order of magnitude, and (2) the activation energy is lower by about anorder of magnitude, as shown in Table 5.1. The critical voltage is higher when fibersare absent.
5.5 CEMENT-BASED THERMOELECTRIC DEVICE
The Seebeck63-68,103 effect is a thermoelectric effect that is the basis for thermocouplesfor temperature measurement. This effect involves charge carriers moving from ahot point to a cold point within a material, resulting in a voltage difference between
FIGURE 5.12 Plot of volume electrical resistivity vs. temperature during heating and coolingfor carbon-fiber silica-fume cement paste.
FIGURE 5.13 Arrhenius plot of log electrical conductivity vs. reciprocal absolute tempera-ture for carbon-fiber silica-fume cement paste.
Cooling
Heating
Temperature (0C)
Ele
ctri
cal r
esis
tivi
ty (
104 Ω
.cm
)
0 5 10 15 20 25 30 35 40 45 50
6
5
4
3
2
1
0
-3.6
-3.8
-4.2
-4.4
-4.6
-4.8
-4
Heating
Cooling
Lo
gσ
(lo
g((
Ω-1
.cm
-1))
0.0031 0.0033 0.0035 0.00371/T (K-1)
©2001 CRC Press LLC

the two points. The Seebeck coefficient is the negative of the voltage difference perunit temperature difference between the two points. Negative carriers (electrons)make it more negative, and positive carriers (holes) make it more positive.
The Seebeck effect in carbon fiber-reinforced cement paste involves electronsand/or ions from the cement matrix65 and holes from the fibers,63-66 such that thetwo contributions are equal at the percolation threshold, a fiber content between0.5% and 1.0% by weight of cement.65 The hole contribution increases monotonicallywith increasing fiber content below and above the percolation threshold.65
Due to the free electrons in a metal, cement containing metal fibers such as steelfibers is even more negative in the thermoelectric power than cement without fiber.103
The attainment of a very negative thermoelectric power is attractive since a materialwith a negative thermoelectric power and one with positive thermoelectric powerare two very dissimilar materials, the junction of which is a thermocouple junction.(The greater the dissimilarity, the more sensitive the thermocouple.)
Table 5.2 and Figure 5.14 show the thermopower results. The absolute thermo-electric power is much more negative for all the steel-fiber cement pastes comparedto all the carbon-fiber cement pastes. An increase of the steel fiber content from0.5% to 1.0% by weight of cement makes the absolute thermoelectric power morenegative, whether or not silica fume (or latex) is present. An increase of the steelfiber content also increases the reversibility and linearity of the change in Seebeckvoltage with the temperature difference between the hot and cold ends, as shownby comparing the values of the Seebeck coefficient obtained during heating andcooling in Table 5.2. The values obtained during heating and cooling are close forthe pastes with the higher steel fiber content, but are not so close for those with thelower steel fiber content. In contrast, for pastes with carbon fibers in place of steelfibers, the change in Seebeck voltage with the temperature difference is highlyreversible for both carbon fiber contents of 0.5% and 1.0% by weight of cement, asshown in Table 5.2 by comparing the values of the Seebeck coefficient obtainedduring heating and cooling.
TABLE 5.1Resistivity, Critical Voltage, and Activation Energy of Five Types of Cement Paste
Activation Energy (eV)
FormulationResistivity at 20oC
(Ω.cm)Critical Voltage
at 20oC (V) Heating Cooling
PlainSilica fumeCarbon fibers+ silica fume
LatexCarbon fibers+ latex
(4.87 ± 0.37) × 105
(6.12 ± 0.15) × 105
(1.73 ± 0.08) × 104
(6.99 ± 0.12) × 105
(9.64 ± 0.08) × 104
10.80 ± 0.4511.60 ± 0.378.15 ± 0.34
11.80 ± 0.318.76 ± 0.35
0.040 ± 0.0060.035 ± 0.0030.390 ± 0.014
0.017 ± 0.0010.018 ± 0.001
0.122 ± 0.0060.084 ± 0.0040.412 ± 0.017
0.025 ± 0.0020.027 ± 0.002
©2001 CRC Press LLC

TABLE 5.2Volume Electical Resistivity, Seebeck Coefficient (µV/°C) with Copper as the Reference, and the Absolute Thermoelectric Power (µV/°C) of Various Cement Pastes with Steel Fibers (Sf) or Carbon Fibers (Cf)
Heating Cooling
Cement Paste
Volume Fraction Fibers
Resistivity (Ω.cm)
Seebeck Coefficient
Absolute Thermoelectric
PowerSeebeck
Coefficient
Absolute Thermoelectric
Power
PlainSFLSf (0.5*)Sf (1.0*)Sf (0.5*) + SFSf (1.0*) + SFSf (0.5*) + LSf (1.0*) + LCf (0.5*) + SFCf (1.0*) + SFCf (0.5*) + LCf (1.0*) + L
000
0.10%0.20%0.10%0.20%0.085%0.17%0.48%0.95%0.41%0.82%
(4.7 ± 0.4) × 105
(5.8 ± 0.4) × 105
(6.8 ± 0.6) × 105
(7.8 ± 0.5) × 104
(4.8 ± 0.4) × 104
(5.6 ± 0.5) × 104
(3.2 ± 0.3) × 104
(1.4 ± 0.1) × 105
(1.1 ± 0.1) × 105
(1.5 ± 0.1) × 104
(8.3 ± 0.5) × 102
(9.7 ± 0.6) × 104
(1.8 ± 0.2) × 103
+0.35 ± 0.03+0.31 ± 0.02+0.28 ± 0.02–51.0 ± 4.8–56.8 ± 5.2–54.8 ± 3.9–66.2 ± 4.5–48.1 ± 3.2–55.4 ± 5.0+1.45 ± 0.09+2.82 ± 0.11+1.20 ± 0.05+2.10 ± 0.08
–1.99 ± 0.03–2.03 ± 0.02–2.06 ± 0.02–53.3 ± 4.8–59.1 ± 5.2–57.1 ± 3.9–68.5 ± 4.5–50.4 ± 3.2–57.7 ± 5.0–0.89 ± 0.09+0.48 ± 0.11–1.14 ± 0.05–0.24 ± 0.08
+0.38 ± 0.05+0.36 ± 0.03+0.30 ± 0.02–45.3 ± 4.4–53.7 ± 4.9–52.9 ± 4.1–65.6 ± 4.4–45.4 ± 2.9–54.2 ± 4.5+1.45 ± 0.09+2.82 ± 0.11+1.20 ± 0.05+2.10 ± 0.08
–1.96 ± 0.05–1.98 ± 0.03–2.04 ± 0.02–47.6 ± 4.4–56.0 ± 4.9–55.2 ± 4.1–67.9 ± 4.4–47.7 ± 2.9–56.5 ± 4.5–0.89 ± 0.09+0.48 ± 0.11–1.14 ± 0.05–0.24 ± 0.08
* % by weight of cementSF: silica fumeL: latex
©2001 CRC Press LLC

Table 5.2 shows that the volume electrical resistivity is much higher for thesteel-fiber cement pastes than the corresponding carbon-fiber cement pastes. This isattributed to the much lower volume fraction of fibers in the former. An increase inthe steel or carbon fiber content from 0.5% to 1.0% by weight of cement decreasesresistivity, though the decrease is more significant for the carbon fiber case than forthe steel fiber case. That the resistivity decrease is not large when the steel fibercontent is increased from 0.5% to 1.0% by weight of cement, and that the resistivityis still high at a steel fiber content of 1.0%, suggest that the steel fiber content of1.0% is below the percolation threshold.
Whether with or without silica fume or latex, the change of the Seebeck voltagewith temperature is more reversible and linear at a steel fiber content of 1.0% byweight of cement than at 0.5%. This is attributed to the larger role of the cementmatrix at the lower steel fiber content, and the contribution of the cement matrix toirreversibility and nonlinearity. Irreversibility and nonlinearity are particularly sig-nificant when the cement paste contains no fiber.
From a practical point of view, the steel-fiber silica-fume cement paste containingsteel fibers in the amount of 1.0% by weight of cement is particularly attractive foruse in temperature sensing, as the magnitude of the absolute thermoelectric poweris the highest (–68 µV/°C), and the variation of the Seebeck voltage with thetemperature difference between the hot and cold ends is reversible and linear. Themagnitude of the absolute thermoelectric power is as high as those of commercialthermocouple materials.
A cement-based thermocouple in the form of a junction between dissimilarcement pastes exhibits thermocouple sensitivity 70 ± 7 µV/°C.68 The dissimilar cementpastes are steel fiber cement paste (n-type) and carbon-fiber silica-fume cement paste(p-type). The junction is made by pouring the cement pastes side by side.
FIGURE 5.14 Variation of the Seebeck voltage (with copper as the reference) vs. the tem-perature difference during heating and cooling for steel-fiber silica-fume cement paste con-taining steel fibers in the amount of 1.0% by weight of cement.
Temperature difference (0C)
Cooling
Heating
00
0.51
2
3
4
5
1.5
2.5
3.5
4.5
10 20 30 40 50 60 70
Volt
age
(mV
)
©2001 CRC Press LLC

5.6 CONCLUSION
Cement-based electronics provide electrical circuit elements, including conductorand diode (pn-junction), in addition to strain and damage sensors, thermistors, andthermoelectric devices. This emerging technology provides the basis for the use ofconcrete structures for electronic functions.
REFERENCES
1. J. W. Newman, Int. SAMPE Symp. Exhib., Vol. 32, pp. 938-944 (1987).2. S. Furukawa, Y. Tsuji and S. Otani, Proc. 30th Japan Congress on Materials Research,
pp. 149-152 (1987).3. K. Saito, N. Kawamura and Y. Kogo, Advanced Materials: The Big Payoff, National
SAMPE Technical Conf., Vol. 21, pp. 796-802 (1989).4. S. Wen and D.D.L. Chung, Cem. Concr. Res., 29(3), 445-449 (1999).5. T. Sugama, L. E. Kukacka, N. Carciello and D. Stathopoulos, Cem. Concr. Res.,
19(3), 355-365 (1989).6. X. Fu, W. Lu and D.D.L. Chung, Cem. Concr. Res., 26(7), 1007-1012 (1996).7. X. Fu, W. Lu and D.D.L. Chung, Carbon, 36(9), 1337-1345 (1998).8. Y. Xu and D.D.L. Chung, Cem. Concr. Res., 29(5), 773-776 (1999).9. T. Yamada, K. Yamada, R. Hayashi and T. Herai, Int. SAMPE Symp. Exhib., Vol. 36,
Pt. 1, pp. 362-371 (1991).10. T. Sugama, L. E. Kukacka, N. Carciello and B. Galen, Cem. Concr. Res., 18(2),
290-300 (1988).11. B. K. Larson, L. T. Drzal and P. Sorousian, Composites, 21(3), 205-215 (1990).12. A. Katz, V.C. Li and A. Kazmer, J. Mater. Civil Eng., 7(2), 125-128 (1995).13. S. B. Park and B. I. Lee, Cem. Concr. Composites, 15(3), 153-163 (1993).14. P. Chen, X. Fu and D.D.L. Chung, ACI Mater. J., 94(2), 147-155 (1997).15. P. Chen and D.D.L. Chung, Composites, 24(1), 33-52 (1993).16. A. M. Brandt and L. Kucharska, Materials for the New Millennium, Proc. Mater.
Eng. Conf., Vol. 1, pp. 271-280 (1996).17. H. A. Toutanji, T. El-Korchi, R. N. Katz and G. L. Leatherman, Cem. Concr. Res.,
23(3), 618-626 (1993).18. N. Banthia and J. Sheng, Cem. Concr. Composites, 18(4), 251-269 (1996).19. H. A. Toutanji, T. El-Korchi and R. N. Katz, Com. Concr. Composites, 16(1), 15-21
(1994).20. S. Akihama, T. Suenaga and T. Banno, Int. J. Cem. Composites Lightweight Concr.,
6(3), 159-168 (1984).21. M. Kamakura, K. Shirakawa, K. Nakagawa, K. Ohta and S. Kashihara, Sumitomo
Metals (1983).22. A. Katz and A. Bentur, Cem. Concr. Res., 24(2), 214-220 (1994).23. Y. Ohama and M. Amano, Proc. 27th Japan Congress on Materials Research, pp.
187-191 (1983).24. Y. Ohama, M. Amano and M. Endo, Concr. Int.: Design Constr., 7(3), 58-62 (1985).25. K. Zayat and Z. Bayasi, ACI Mater. J., 93(2), 178-181 (1996).26. P. Soroushian, F. Aouadi and M. Nagi, ACI Mater. J., 88(1), 11-18 (1991).27. B. Mobasher and C. Y. Li, ACI Mater. J., 93(3), 284-292 (1996).28. N. Banthia, A. Moncef, K. Chokri and J. Sheng, Can. J. Civ. Eng., 21(6), 999-1011
(1994).
©2001 CRC Press LLC

29. B. Mobasher and C. Y. Li, Infrastructure: New Materials and Methods of Repair,Proc. Mater. Eng. Conf., No. 804, pp. 551-558 (1994).
30. P. Soroushian, M. Nagi and J. Hsu, ACI Mater. J., 89(3), 267-276 (1992).31. P. Soroushian, Constr. Specifier, 43(12), 102-108 (1990).32. A. K. Lal, Batiment Int./Building Research & Practice, 18(3), 153-161 (1990).33. S. B. Park, B. I. Lee and Y. S. Lim, Cem. Concr. Res., 21(4), 589-600 (1991).34. S. B. Park and B. I. Lee, High Temperatures — High Pressures, 22(6), 663-670 (1990).35. P. Soroushian, Mohamad Nagi and A. Okwuegbu, ACI Mater. J., 89(5), 491-494
(1992).36. M. Pigeon, M. Azzabi and R. Pleau, Cem. Concr. Res., 26(8), 1163-1170 (1996).37. N. Banthia, K. Chokri, Y. Ohama and S. Mindess, Adv. Cem. Based Mater., 1(3),
131-141 (1994).38. N. Banthia, C. Yan and K. Sakai, Com. Concr. Composites, 20(5), 393-404 (1998).39. T. Urano, K. Murakami, Y. Mitsui and H. Sakai, Composites — Part A: Applied
Science & Manufacturing, 27(3), 183-187 (1996).40. A. Ali and R. Ambalavanan, Indian Concr. J., 72(12), 669-675 (1998).41. P. Chen, X. Fu and D.D.L. Chung, Cem. Concr. Res., 25(3), 491-496 (1995).42. M. Zhu and D.D.L. Chung, Cem. Concr. Res., 27(12), 1829-1839 (1997).43. M. Zhu, R. C. Wetherhold and D.D.L. Chung, Cem. Concr. Res., 27(3), 437-451
(1997).44. P. Chen and D.D.L. Chung, Smart Mater. Struct., 2, 22-30 (1993)45. P. Chen and D.D.L. Chung, Composites, Part B, 27B, 11-23 (1996).46. P. Chen and D.D.L. Chung, J. Am. Ceram. Soc., 78(3), 816-818 (1995).47. D.D.L. Chung, Smart Mater. Struct., 4, 59-61 (1995).48. P. Chen and D.D.L. Chung, ACI Mater. J., 93(4), 341-350 (1996).49. X. Fu and D.D.L. Chung, Cem. Concr. Res., 26(1), 15-20 (1996).50. X. Fu, E. Ma, D.D.L. Chung and W. A. Anderson, Cem. Concr. Res., 27(6), 845-852
(1997).51. X. Fu and D.D.L. Chung, Cem. Concr. Res., 27(9), 1313-1318 (1997).52. X. Fu, W. Lu and D.D.L. Chung, Cem. Concr. Res., 28(2), 183-187 (1998).53. D.D.L. Chung, TANSO, (190), 300-312 (1999).54. Z. Shi and D.D.L. Chung, Cem. Concr. Res., 29(3), 435-439 (1999).55. Q. Mao, B. Zhao, D. Sheng and Z. Li, J. Wuhan U. Tech., Mater. Sci. Ed., 11(3),
41-45 (1996).56. Q. Mao, B. Zhao, D. Shen and Z. Li, Fuhe Cailiao Xuebao/Acta Materiae Compositae
Sinica, 13(4), 8-11 (1996).57. M. Sun, Q. Mao and Z. Li, J. Wuhan U. Tech., Mater. Sci. Ed., 13(4), 58-61 (1998).58. B. Zhao, Z. Li and D. Wu, J. Wuhan Univ. Tech., Mater. Sci. Ed., 10(4), 52-56 (1995).59. S. Wen and D.D.L. Chung, Cem. Concr. Res., 30(8), 1289-1294 (2000).60. S. Wen and D.D.L. Chung, Cem. Concr. Res., 31(2), 297-301 (2001).61. S. Wen and D.D.L. Chung, Cem. Concr. Res., 29(6), 961-965 (1999).62. W.J. McCarter, J. Am. Ceram. Soc., 78, 411-415 (1995).63. M. Sun, Z. Li, Q. Mao and D. Shen, Cem. Concr. Res. 28(4), 549-554 (1998).64. M. Sun, Z. Li, Q. Mao and D. Shen, Cem. Concr. Res. 28(12), 1707-1712 (1998).65. S. Wen and D.D.L. Chung, Cem. Concr. Res. 29(12), 1989-1993 (1999).66. S. Wen and D.D.L. Chung, Cem. Concr. Res. 30(8), 1295-1298 (2000).67. S. Wen and D.D.L. Chung, J. Mater. Res. 15(12), (2000).68. S. Wen and D.D.L. Chung, Cem. Concr. Res., 31(3), 507-510 (2001).69. D. Bontea, D.D.L. Chung and G.C. Lee, Cem. Concr. Res. 30(4), 651-659 (2000).70. S. Wen and D.D.L. Chung, Cem. Concr. Res., in press.
©2001 CRC Press LLC

71. J. Lee and G. Batson, Materials for the New Millennium, Proc. 4th Mater. Eng. Conf.,Vol. 2, pp. 887-896 (1996).
72. X. Fu and D.D.L. Chung, ACI Mater. J., 96(4), 455-461 (1999).73. Y. Xu and D.D.L. Chung, Cem. Concr. Res., 29(7), 1117-1121 (1999).74. Y. Shinozaki, Adv. Mater.: Looking Ahead to the 21st Century, Proc. 22nd National
SAMPE Tech. Conf., Vol. 22, pp. 986-997 (1990).75. X. Fu and D.D.L. Chung, Cem. Concr. Res., 25(4), 689-694 (1995).76. J. Hou and D.D.L. Chung, Cem. Concr. Res., 27(5), 649-656 (1997).77. G. G. Clemena, Materials Performance, 27(3), 19-25 (1988).78. R. J. Brousseau and G. B. Pye, ACI Mater. J., 94(4), 306-310 (1997).79. P. Chen and D.D.L. Chung, Smart Mater. Struct., 2, 181-188 (1993).80. P. Chen and D.D.L. Chung, J. Electron. Mater., 24(1), 47-51 (1995).81. X. Wang, Y. Wang and Z. Jin, Fuhe Cailiao Xuebao/Acta Materiae Compositae Sinica,
15(3), 75-80 (1998).82. N. Banthia, S. Djeridane and M. Pigeon, Cem. Concr. Res., 22(5), 804-814 (1992).83. P. Xie, P. Gu and J. J. Beaudoin, J. Mater. Sci., 31(15), 4093-4097 (1996).84. Z. Shui, J. Li, F. Huang and D. Yang, J. Wuhan Univ. Tech., Mater. Sci. Ed., 10(4),
37-41 (1995).85. S. Wen and D.D.L. Chung, Cem. Concr. Res., 31(2), 141-147 (2001).86. X. Fu and D.D.L. Chung, Cem. Concr. Res., 28(6), 795-801 (1998).87. X. Fu and D.D.L. Chung, Carbon, 36(4), 459-462 (1998).88. X. Fu and D.D.L. Chung, Cem. Concr. Res., 26(10), 1467-1472 (1996); 27(2), 314
(1997).89. T. Fujiwara and H. Ujie, Tohoku Kogyo Daigaku Kiyo, 1: Rikogakuhen, No. 7,
179-188 (1987).90. Y. Shimizu, A. Nishikata, N. Maruyama and A. Sugiyama, Terebijon Gakkaishi/J.
Inst. Television Engineers of Japan, 40(8), 780-785 (1986).91. P. Chen and D.D.L. Chung, ACI Mater. J., 93(2), 129-133 (1996).92. T. Uomoto and F. Katsuki, Doboku Gakkai Rombun-Hokokushu/Proc. Japan Soc.
Civil Engineers, No. 490, Pt. 5-23, 167-174 (1994-1995).93. C. M. Huang, D. Zhu, C. X. Dong, W. M. Kriven, R. Loh and J. Huang, Ceramic
Eng. Sci. Proc., 17(4), 258-265 (1996).94. C. M. Huang, D. Zhu, X. Cong, W. M. Kriven, R. R. Loh and J. Huang, J. Am.
Ceramic Soc., 80(9), 2326-2332 (1997).95. T-J. Kim and C-K. Park, Cem. Concr. Res., 28(7), 955-960 (1998).96. S. Igarashi and M. Kawamura, Doboku Gakkai Rombun-Hokokushu/Proc. Japan Soc.
Civil Eng., No. 502, Pt. 5-25, 83-92 (1994).97. M. Z. Bayasi and J. Zeng, ACI Structural J., 94(4), 442-446 (1997).98. G. Campione, S. Mindess and G. Zingone, ACI Mater. J., 96(1), 27-34 (1999).99. T. Yamada, K. Yamada and K. Kubomura, J. Composite Mater., 29(2), 179-194 (1995).
100. S. Delvasto, A. E. Naaman and J. L. Throne, Int. J. Cem. Composites LightweightConcr., 8(3), 181-190 (1986).
101. C. Park, Nippon Seramikkusu Kyokai, Gakujutsu Ronbunshi — J. Ceramic Soc.Japan, 106(1231), 268-271 (1998).
102. Y. Shao, S. Marikunte and S. P. Shah, Concr. Int., 17(4), 48-52 (1995).103. S. Wen and D.D.L. Chung, Cem. Concr. Res., 30(4), 661-664 (2000).104. S. Wen and D.D.L. Chung, Cem. Concr. Res., 31(2), 129-133 (2001).
©2001 CRC Press LLC

Self-Sensing of Carbon Fiber Polymer-Matrix Structural Composites
CONTENTS
6.1 Introduction6.2 Background6.3 Sensing Strain 6.4 Sensing Damage6.5 Sensing Temperature6.6 Sensing Bond Degradation6.7 Sensing Structural Transitions
6.7.1 DSC Analysis6.7.2 DC Electrical Resistance Analysis
6.8 Sensing Composite Fabrication Process6.9 ConclusionReferences
SYNOPSIS The self-sensing of continuous carbon fiber polymer-matrix structuralcomposites has been attained by electrical measurements. The sensing pertains tostrain, damage, temperature, bond degradation, structural transitions, and the fabrica-tion process. The experimental methods and data interpretation are covered in thischapter.
RELEVANT APPENDICES: A, B, C, F, G, J
6.1 INTRODUCTION
Polymer-matrix composites for structural applications typically contain continuousfibers such as carbon, polymer, and glass fibers; continuous fibers tend to be moreeffective than short fibers as a reinforcement. Polymer-matrix composites with con-tinuous carbon fibers are used for aerospace, automobile, and civil structures.
6
©2001 CRC Press LLC

Because carbon fibers are electrically conducting, whereas polymer and glass fibersare not, carbon fiber composites exhibit electrical properties that depend on param-eters such as strain, damage, and temperature, thereby attaining the ability to sensethemselves through electrical measurement. The self-sensing ability is valuable forsmart structures, smart manufacturing, structural vibration control, and structuralhealth monitoring. Self-sensing means the elimination of attached or embeddedsensors, as the structural material itself is the sensor. The consequence is reducedcost, enhanced durability, larger sensing volume, and the absence of mechanicalproperty degradation.
This chapter is focused on the use of DC electrical measurements for self-sensingin continuous carbon fiber polymer-matrix structural composites. The sensing is interms of the strain, damage, temperature, bond degradation, structural transitions,and the composite fabrication process.
6.2 BACKGROUND
Carbon fibers are electrically conducting, while the polymer matrix is electricallyinsulating (except for the rare situation in which the polymer is an electricallyconducting one1). The continuous fibers in a composite laminate are in the form oflayers called laminae. Each lamina comprises many bundles (called tows) of fibersin a polymer matrix. Each tow consists of thousands of fibers. There may or maynot be twists in a tow. Each fiber has a diameter ranging from 7 to 12 µm. The towswithin a lamina are typically oriented in the same direction, but tows in differentlaminae may or may not be in the same direction. A laminate with tows in all thelaminae oriented in the same direction is said to unidirectional. A laminate withtows in adjacent laminae oriented at an angle of 90° is said to be cross-ply. In general,an angle of 45° and other angles may be involved for various laminae. This is desiredfor attaining the mechanical properties required for the laminate in various directionsin the plane of the laminate.
Within a lamina with tows in the same direction, electrical conductivity is highestin the fiber direction. In the transverse direction in the plane of the lamina, theconductivity is not zero, even though the polymer matrix is insulating. This is becausethere are contacts between fibers of adjacent tows.2 In other words, a fraction of thefibers of one tow touches a fraction of the fibers of an adjacent tow here and therealong the length of the fibers. These contacts result from the fact that fibers are notperfectly straight or parallel (even though the lamina is said to be unidirectional),and that the flow of the polymer matrix (or resin) during composite fabrication cancause a fiber to be not completely covered by the polymer or resin (even though,prior to composite fabrication, each fiber may be completely covered by the polymeror resin, as in the case of a prepreg, i.e., a fiber sheet impregnated with the polymeror resin). Fiber waviness is known as marcelling. Transverse conductivity givesinformation on the number of fiber-fiber contacts in the plane of the lamina.
For similar reasons, the contacts between fibers of adjacent laminae cause theconductivity in the through-thickness direction (direction perpendicular to the planeof the laminate) to be nonzero. Thus, the through-thickness conductivity givesinformation on the number of fiber-fiber contacts between adjacent laminae.
©2001 CRC Press LLC

Matrix cracking between the tows of a lamina decreases the number of fiber-fiber contacts in the plane of the lamina, thus decreasing transverse conductivity.Similarly, matrix cracking between adjacent laminae (as in delamination3) decreasesthe number of fiber-fiber contacts between adjacent laminae, thus decreasingthrough-thickness conductivity. This means that the transverse and through-thicknessconductivities can indicate damage in the form of matrix cracking.
Fiber damage (as distinct from fiber fracture) decreases the conductivity of afiber, thereby decreasing longitudinal conductivity. However, due to the brittlenessof carbon fibers, the decrease in conductivity because of fiber damage prior to fiberfracture is rather small.4
Fiber fracture causes a much larger decrease in the longitudinal conductivity ofa lamina than does fiber damage. If there is only one fiber, a broken fiber results inan open circuit, i.e., zero conductivity. However, a lamina has a large number offibers, and adjacent fibers can make contact here and there. Therefore, the portionsof a broken fiber still contribute to the longitudinal conductivity of the lamina. Asa result, the decrease in conductivity due to fiber fracture is less than what it wouldbe if a broken fiber did not contribute to the conductivity. Nevertheless, the effectof fiber fracture on longitudinal conductivity is significant, so longitudinal conduc-tivity can indicate damage in the form of fiber fracture.5
The through-thickness volume resistance of a laminate is the sum of the volumeresistance of each of the laminae in the through-thickness direction, and the contactresistance of each of the interfaces between adjacent laminae (i.e., the interlaminarinterface). For example, a laminate with eight laminae has eight volume resistancesand seven contact resistances, all in the through-thickness direction. Thus, to studythe interlaminar interface, it is better to measure the contact resistance between twolaminae rather than the through-thickness volume resistance of the entire laminate.
Measurement of the contact resistance between laminae can be made by allowingtwo laminae (strips) to contact at a junction, and using the two ends of each stripfor making four electrical contacts.6 An end of the top strip and an end of the bottomstrip serve as contacts for passing current. The other end of the top strip and theother end of the bottom strip serve as contacts for voltage measurement. The fibersin the two strips can be in the same direction or in different directions. This methodis a form of the four-probe method of electrical resistance measurement. The con-figuration is illustrated in Figure 6.1 for cross-ply and unidirectional laminates. Tomake sure that the volume resistance within a lamina in the through-thicknessdirection does not contribute to the measured resistance, the fibers at each end of alamina strip should be electrically shorted together by using silver paint or otherconducting media. The measured resistance is the contact resistance of the junction.This resistance, multiplied by the area of the junction, gives the contact resistivity,which is independent of the area of the junction and just depends on the nature ofthe interlaminar interface. The unit of the contact resistivity is Ω.m2, whereas thatof the volume resistivity is Ω.m.
The structure of the interlaminar interface is more prone to change than thestructure within a lamina. For example, damage in the form of delamination is muchmore common than damage in the form of fiber fracture. Moreover, the structure ofthe interlaminar interface is affected by the interlaminar stress, which is particularly
©2001 CRC Press LLC
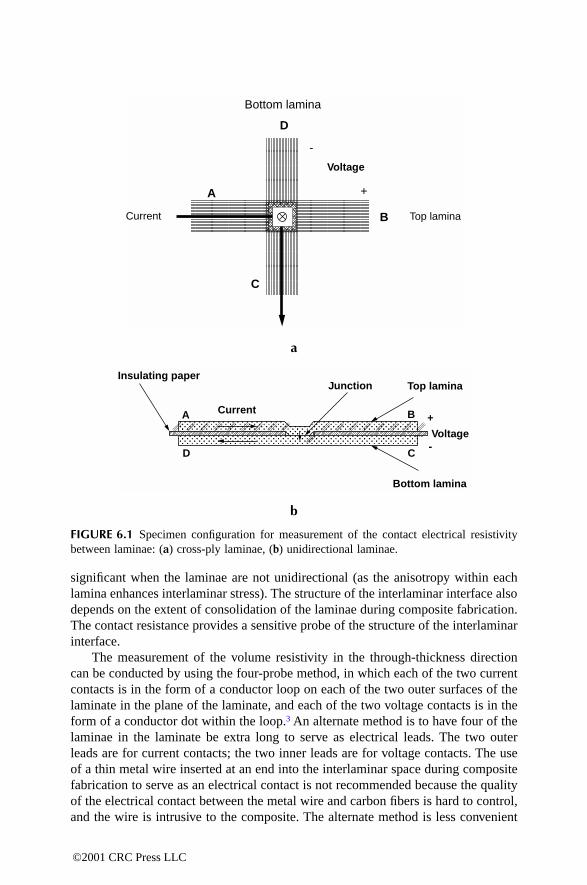
significant when the laminae are not unidirectional (as the anisotropy within eachlamina enhances interlaminar stress). The structure of the interlaminar interface alsodepends on the extent of consolidation of the laminae during composite fabrication.The contact resistance provides a sensitive probe of the structure of the interlaminarinterface.
The measurement of the volume resistivity in the through-thickness directioncan be conducted by using the four-probe method, in which each of the two currentcontacts is in the form of a conductor loop on each of the two outer surfaces of thelaminate in the plane of the laminate, and each of the two voltage contacts is in theform of a conductor dot within the loop.3 An alternate method is to have four of thelaminae in the laminate be extra long to serve as electrical leads. The two outerleads are for current contacts; the two inner leads are for voltage contacts. The useof a thin metal wire inserted at an end into the interlaminar space during compositefabrication to serve as an electrical contact is not recommended because the qualityof the electrical contact between the metal wire and carbon fibers is hard to control,and the wire is intrusive to the composite. The alternate method is less convenient
a
b
FIGURE 6.1 Specimen configuration for measurement of the contact electrical resistivitybetween laminae: (a) cross-ply laminae, (b) unidirectional laminae.
Bottom lamina
D
A
C
Voltage
B
+
-
Top laminaCurrent
Insulating paper
A
D
Current
Junction Top lamina
B +
-Voltage
C
Bottom lamina
©2001 CRC Press LLC

than the method involving loops and dots, but it approaches more closely the idealfour-probe method.
6.3 SENSING STRAIN
Smart structures that can monitor their own strain are valuable for structural vibrationcontrol. Self-monitoring of strain has been achieved in carbon fiber epoxy-matrixcomposites without the use of an embedded or attached sensor,7-11 as the electricalresistance of the composite in the through-thickness or longitudinal direction changesreversibly with longitudinal strain due to change in the degree of fiber alignment.Tension in the fiber direction increases the degree of fiber alignment, thereby decreas-ing the chance for fibers of adjacent laminae to touch one another. As a consequence,the through-thickness resistance increases while the longitudinal resistancedecreases.
Figure 6.29 shows the change in longitudinal resistance during cyclic longitudinaltension in the elastic regime for a unidirectional continuous carbon fiber epoxy-matrix composite with eight fiber layers. The stress amplitude is equal to 14% ofthe breaking stress. The strain returns to zero at the end of each cycle. Because ofthe small strains involved, the fractional resistance change ∆R/R0 is essentially equalto the fractional change in resistivity. The longitudinal ∆R/R0 decreases upon loadingand increases upon unloading in every cycle, such that R irreversibly decreasesslightly after the first cycle (i.e., ∆R/R0 does not return to zero at the end of the firstcycle). At higher stress amplitudes the effect is similar, except that both the reversibleand irreversible parts of ∆R/R0 are larger.
Figure 6.39 shows the change in the through-thickness resistance during cycliclongitudinal tension in the elastic regime for the same composite. The stress ampli-tude is equal to 14% of the breaking stress. The through-thickness ∆R/R0 increasesupon loading and decreases upon unloading in every cycle, such that R irreversiblydecreases slightly after the first cycle (i.e., ∆R/R0 does not return to zero at the endof the first cycle). Upon increasing the stress amplitude, the effect is similar, exceptthat the reversible part of ∆R/R0 is larger.
The strain sensitivity (gage factor) is defined as the reversible part of ∆R/R0
divided by the longitudinal strain amplitude. It is negative (from –18 to –12) for thelongitudinal ∆R/R0, and positive (17–24) for the through-thickness ∆R/R0. The mag-nitudes are comparable for the longitudinal and through-thickness strain sensitivities.As a result, whether the longitudinal R or the through-thickness R is preferred forstrain sensing depends on the convenience of electrical contact application for thegeometry of the particular smart structure.
Figure 6.49 shows the compressive stress, strain, and longitudinal ∆R/R0 obtainedsimultaneously during cyclic compression at stress amplitudes equal to 14% of thebreaking stress for a similar composite having 24 rather than 8 fiber layers. Thelongitudinal ∆R/R0 increases upon compressive loading and decreases upon unload-ing in every cycle, such that resistance R irreversibly increases very slightly afterthe first cycle. The magnitude of the gage factor is lower in compression (–1.2) thanin tension (from –18 to –12).
©2001 CRC Press LLC

A dimensional change without any resistivity change would have caused longi-tudinal R to increase during tensile loading and decrease during compressive loading.In contrast, the longitudinal R decreases upon tensile loading and increases uponcompressive loading. In particular, the magnitude of ∆R/R0 under tension is 7 to 11times that of ∆R/R0 calculated by assuming that ∆R/R0 is due only to dimensionalchange and not to any resistivity change. Hence the contribution of ∆R/R0 fromdimensional change is negligible compared to that from resistivity change.
The irreversible behavior, though small compared to the reversible behavior, issuch that R (longitudinal or through-thickness) under tension is irreversiblydecreased after the first cycle. This behavior is attributed to the irreversible distur-bance to the fiber arrangement at the end of the first cycle such that the fiberarrangement becomes less neat. A less neat fiber arrangement means a greater chancefor the adjacent fiber layers to touch one another.
6.4 SENSING DAMAGE
Self-monitoring of damage has been achieved in continuous carbon fiber polymer-matrix composites, as the electrical resistance of the composite changes with dam-age.3,8,12-25 Minor damage in the form of slight matrix damage and/or disturbance tothe fiber arrangement is indicated by the longitudinal and through-thickness resis-
FIGURE 6.2 Longitudinal stress and strain and fractional resistance increase (∆R/R0)obtained simultaneously during cyclic tension at a stress amplitude equal to 14% of thebreaking stress for continuous fiber epoxy-matrix composite.
180160140120100806040200
Tens
ile s
tres
s(M
Pa)
0.160.140.12
0.080.060.040.02
0.1
0
Str
ain
(%)
0-0.2-0.4-0.6-0.8
-1.2-1.4-1.6-1.8
-1
-20 20 40 60 80 100 120 140 160 180 200
Time (s)
∆R/R
0 (%
)
©2001 CRC Press LLC

tance decreasing irreversibly because of increase in the number of contacts betweenfibers, as shown after one loading cycle in Figures 6.2 to 6.4. More significantdamage in the form of delamination or interlaminar interface degradation is indicatedby the through-thickness resistance (or, more exactly, the contact resistivity of theinterlaminar interface) increasing due to decrease in the number of contacts betweenfibers of different laminae. Major damage in the form of fiber breakage is indicatedby the longitudinal resistance increasing irreversibly.
During mechanical fatigue, delamination was observed to begin at 30% of thefatigue life, whereas fiber breakage was observed to begin at 50% of the fatigue life.Figure 6.512 shows an irreversible resistance increase occurring at about 50% of thefatigue life during tension-tension fatigue testing of a unidirectional continuouscarbon fiber epoxy-matrix composite. The resistance and stress are in the fiberdirection. The reversible changes in resistance are due to strain, which causes theresistance to decrease reversibly in each cycle, as in Figure 6.2.
Figure 6.613 shows the variation of the contact resistivity with temperature duringthermal cycling. The temperature is repeatedly increased to various levels. A groupof cycles in which the temperature amplitude increases cycle by cycle and thendecreases cycle by cycle back to the initial low temperature amplitude is referredto as a group. Figure 6.6(a) shows the results of the first ten groups, while Figure6.6(b) shows the first group only. The contact resistivity decreases upon heating inevery cycle of every group. At the highest temperature (150°C) of a group, a spikeof resistivity increase occurs, as shown in Figure 6.6(b). It is attributed to damageat the interlaminar interface. In addition, the baseline resistivity (the top envelope)
FIGURE 6.3 Longitudinal stress and strain and the through-thickness ∆R/R0 obtained simul-taneously during cyclic tension at a stress amplitude equal to 14% of the breaking stress forcontinuous fiber epoxy-matrix composite.
18016014012010080604020
0Tens
ile s
tres
s(M
Pa)
0.160.140.12
0.080.060.040.02
0.1
0
Str
ain
(%)
0 20 40 60 80 100 120 140 160 180 200Time (sec)
∆R/R
0
0.040.030.020.01
-0.01-0.02
0
©2001 CRC Press LLC

gradually and irreversibly shifts downward as cycling progresses, as shown in Figure6.6(a). The baseline decrease is probably due to matrix damage within a lamina andthe resulting decreases in modulus and residual stress.
FIGURE 6.4 Longitudinal stress, strain, and ∆R/R0 obtained simultaneously during cycliccompression (longitudinal) at a stress amplitude equal to 14% of the breaking stress forcontinuous fiber epoxy-matrix composite.
FIGURE 6.5 Variation of longitudinal ∆R/R0 with cycle number during tension-tensionfatigue testing for a carbon fiber epoxy-matrix composite. Each cycle of reversible decreasein resistance is due to strain. The irreversible increase in resistance at around Cycle 218,281is due to damage in the form of fiber breakage.
160140120100
806040200
Com
pres
sive
str
ess
(MP
a)
0.140.12
0.080.060.040.02
0.1
0
Str
ain
(%)
00
∆R/R
0 (%
)
0.180.160.140.12
0.080.060.040.02
0.1
50 100 150 200 250 300 350
Time (s)
Cycle number218,270 218,278 218,288
-0.12
-0.08
-0.06
-0.04
-0.02
0.02
-0.1
0
∆R/R
o
©2001 CRC Press LLC

6.5 SENSING TEMPERATURE
Continuous carbon fiber epoxy-matrix composites provide temperature sensing byserving as thermistors26,27 and thermocouples.28
The thermistor function stems from the reversible decrease on temperature ofthe contact electrical resistivity at the interface between fiber layers. Figure 6.7shows the variation of the contact resistivity ρc with temperature during reheatingand subsequent cooling, both at 0.15°C/min, for carbon fiber epoxy-matrix compos-ites cured at 0 and 0.33 MPa. The corresponding Arrhenius plots of log contactconductivity (inverse of contact resistivity) versus inverse absolute temperature dur-ing heating are shown in Figure 6.8. From the slope of the Arrhenius plot, which is
a
b
FIGURE 6.6 Variation of contact electrical resistivity with time and of the temperature withtime during thermal cycling of a carbon fiber epoxy-matrix composite; (b) is the magnifiedview of the first 900 s of (a).
0.1400
350
300
250
200
150
100
50
0.098
0.096
0.094
0.092
0.088
0.086
0.084
0.09
0 1000 2000 3000 4000 5000 6000 7000 8000
Time (s)
Con
tact
res
istiv
ity (
Ω. c
m2 )
Tem
pera
ture
(0 C
)
0
0.1
0.098
0.096
0.094
0.092
0.09
0.088
0.086
0.084
0 200 400 600 8000
Time (s)
300
250
200
150
100
50
Tem
pera
ture
(0 C
)
Con
tact
res
istiv
ity (
Ω. c
m2 )
©2001 CRC Press LLC
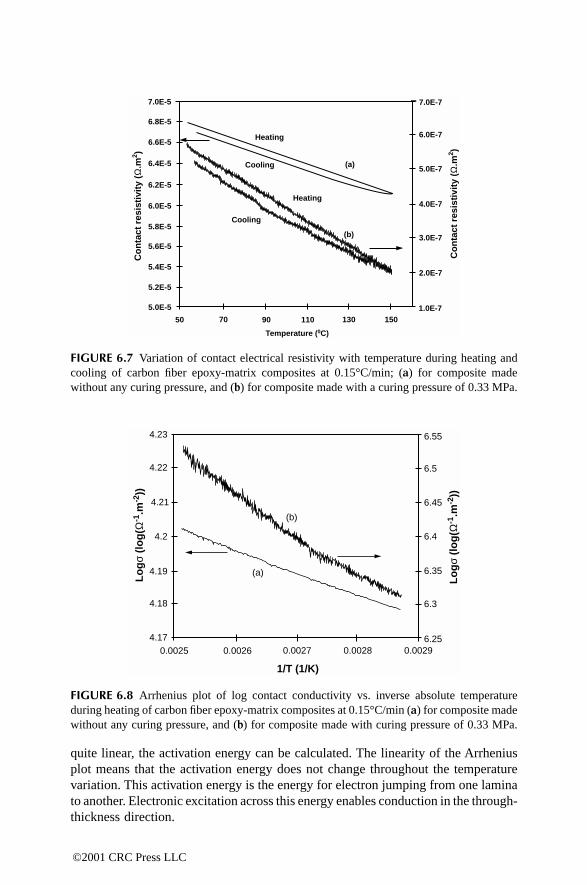
quite linear, the activation energy can be calculated. The linearity of the Arrheniusplot means that the activation energy does not change throughout the temperaturevariation. This activation energy is the energy for electron jumping from one laminato another. Electronic excitation across this energy enables conduction in the through-thickness direction.
FIGURE 6.7 Variation of contact electrical resistivity with temperature during heating andcooling of carbon fiber epoxy-matrix composites at 0.15°C/min; (a) for composite madewithout any curing pressure, and (b) for composite made with a curing pressure of 0.33 MPa.
FIGURE 6.8 Arrhenius plot of log contact conductivity vs. inverse absolute temperatureduring heating of carbon fiber epoxy-matrix composites at 0.15°C/min (a) for composite madewithout any curing pressure, and (b) for composite made with curing pressure of 0.33 MPa.
7.0E-5
6.8E-5
6.6E-5
6.4E-5
6.2E-5
6.0E-5
5.8E-5
5.6E-5
5.4E-5
5.2E-5
5.0E-5
50 70 90 110 130 1501.0E-7
7.0E-7
6.0E-7
5.0E-7
4.0E-7
3.0E-7
2.0E-7
Heating
Heating
Cooling
Cooling
(a)
(b)
Temperature (0C)
Co
nta
ct r
esis
tivi
ty (
Ω.m
2 )
Co
nta
ct r
esis
tivi
ty (
Ω.m
2 )
4.23
4.22
4.21
4.19
4.18
4.17
4.2
0.0025 0.0026 0.0027 0.0028 0.00296.25
6.3
6.35
6.4
6.45
6.5
6.55
1/T (1/K)
Lo
gσ
(lo
g(Ω
-1.m
-2))
Lo
gσ
(lo
g(Ω
-1.m
-2))
(a)
(b)
©2001 CRC Press LLC
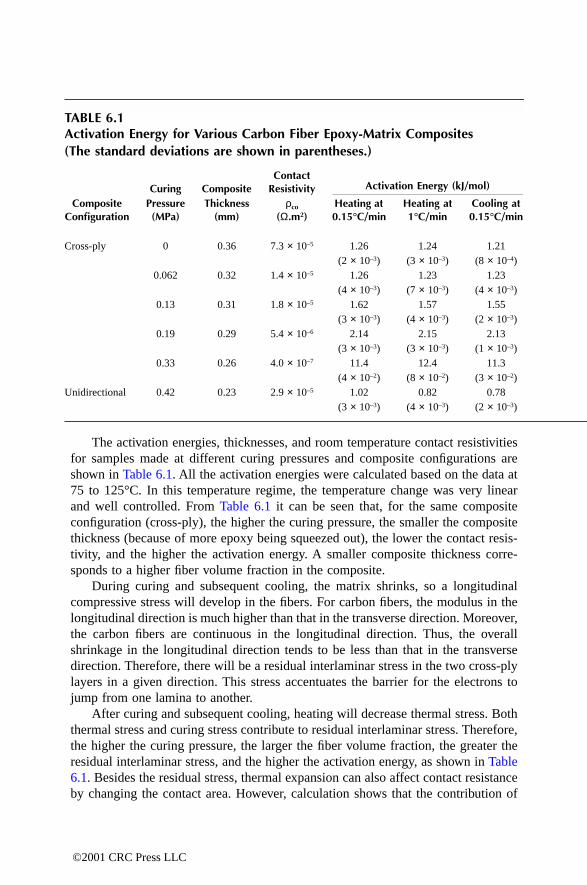
The activation energies, thicknesses, and room temperature contact resistivitiesfor samples made at different curing pressures and composite configurations areshown in Table 6.1. All the activation energies were calculated based on the data at75 to 125°C. In this temperature regime, the temperature change was very linearand well controlled. From Table 6.1 it can be seen that, for the same compositeconfiguration (cross-ply), the higher the curing pressure, the smaller the compositethickness (because of more epoxy being squeezed out), the lower the contact resis-tivity, and the higher the activation energy. A smaller composite thickness corre-sponds to a higher fiber volume fraction in the composite.
During curing and subsequent cooling, the matrix shrinks, so a longitudinalcompressive stress will develop in the fibers. For carbon fibers, the modulus in thelongitudinal direction is much higher than that in the transverse direction. Moreover,the carbon fibers are continuous in the longitudinal direction. Thus, the overallshrinkage in the longitudinal direction tends to be less than that in the transversedirection. Therefore, there will be a residual interlaminar stress in the two cross-plylayers in a given direction. This stress accentuates the barrier for the electrons tojump from one lamina to another.
After curing and subsequent cooling, heating will decrease thermal stress. Boththermal stress and curing stress contribute to residual interlaminar stress. Therefore,the higher the curing pressure, the larger the fiber volume fraction, the greater theresidual interlaminar stress, and the higher the activation energy, as shown in Table6.1. Besides the residual stress, thermal expansion can also affect contact resistanceby changing the contact area. However, calculation shows that the contribution of
TABLE 6.1Activation Energy for Various Carbon Fiber Epoxy-Matrix Composites(The standard deviations are shown in parentheses.)
Curing CompositeContact
Resistivity Activation Energy (kJ/mol)
CompositeConfiguration
Pressure(MPa)
Thickness(mm)
ρco
(Ω.m2)Heating at 0.15°C/min
Heating at1°C/min
Cooling at0.15°C/min
Cross-ply 0 0.36 7.3 × 10⁻⁵ 1.26(2 × 10⁻³)
1.24(3 × 10⁻³)
1.21(8 × 10⁻⁴)
0.062 0.32 1.4 × 10⁻⁵ 1.26(4 × 10⁻³)
1.23(7 × 10⁻³)
1.23(4 × 10⁻³)
0.13 0.31 1.8 × 10⁻⁵ 1.62(3 × 10⁻³)
1.57(4 × 10⁻³)
1.55(2 × 10⁻³)
0.19 0.29 5.4 × 10⁻⁶ 2.14(3 × 10⁻³)
2.15(3 × 10⁻³)
2.13(1 × 10⁻³)
0.33 0.26 4.0 × 10⁻⁷ 11.4(4 × 10⁻²)
12.4(8 × 10⁻²)
11.3(3 × 10⁻²)
Unidirectional 0.42 0.23 2.9 × 10⁻⁵ 1.02(3 × 10⁻³)
0.82(4 × 10⁻³)
0.78(2 × 10⁻³)
©2001 CRC Press LLC

thermal expansion is less than one-tenth of the observed change in contact resistancewith temperature.
The electron jump occurs primarily at points where direct contact takes placebetween fibers of adjacent laminae. The direct contact is possible due to the flowof the epoxy resin during composite fabrication, and also to the slight waviness ofthe fibers, as explained in Reference 3, in relation to the through-thickness volumeresistivity of a carbon fiber epoxy-matrix composite.
The curing pressure for the sample in the unidirectional composite configurationwas higher than that of any of the cross-ply samples (Table 6.1). Consequently, thethickness was the lowest. As a result, the fiber volume fraction was the highest.However, the contact resistivity of the unidirectional sample was the second highestrather than the lowest, and its activation energy was the lowest rather than the highest.The low activation energy is consistent with the fact that there was no CTE or curingshrinkage mismatch between the two unidirectional laminae and, as a result, nointerlaminar stress between them. This low value supports the notion that interlam-inar stress is important in affecting activation energy. The high contact resistivityfor the unidirectional case can be explained in the following way. In the cross-plysamples, the pressure during curing forced the fibers of the two laminae to pressonto one another and contact tightly. In the unidirectional sample, the fibers of oneof the laminae just sank into the other lamina at the junction, so pressure helpedrelatively little in the contact between fibers of adjacent laminae. Moreover, in thecross-ply situation, every fiber at the lamina-lamina interface contacted many fibersof the other lamina, while, in the unidirectional situation, every fiber had little chanceto contact the fibers of the other lamina. Therefore, the number of contact pointsbetween the two laminae was less for the unidirectional sample than for the cross-ply samples.
The thermocouple function stems from the use of n-type and p-type carbon fibers(obtained by intercalation) in different laminae. The thermocouple sensitivity andlinearity are as good as or better than those of commercial thermocouples. By usingtwo laminae that are cross-ply, a two-dimensional array of thermistors or thermo-couple junctions is obtained, thus allowing temperature distribution sensing.
Table 6.2 shows the Seebeck coefficient and the absolute thermoelectric powerof carbon fibers, and the thermocouple sensitivity of epoxy-matrix composite junc-tions. A positive value of the absolute thermoelectric power indicates p-type behav-ior; a negative value indicates n-type behavior. Pristine P-25 is slightly n-type;pristine T-300 is strongly n-type. A junction comprising pristine P-25 and pristineT-300 has a positive thermocouple sensitivity that is close to the difference of theSeebeck coefficients of T-300 and P-25, whether the junction is unidirectional orcross-ply. Pristine P-100 and pristine P-120 are both slightly n-type. Intercalationwith sodium causes them to become strongly n-type. Intercalation with brominecauses P-100 and P-120 to become strongly p-type. A junction comprising bromine-intercalated P-100 and sodium-intercalated P-100 has a positive thermocouple sen-sitivity that is close to the sum of the magnitudes of the absolute thermoelectricpowers of the bromine-intercalated P-100 and the sodium-intercalated P-100. Sim-ilarly, a junction comprising bromine-intercalated P-120 and sodium-intercalatedP-120 has a positive thermocouple sensitivity that is close to the sum of the
©2001 CRC Press LLC

TASe Fi (A is
)
P-T-P-P-P-P-P-P-P-P-P-P-
*
magnitudes of their absolute thermoelectric powers. Figure 6.9 shows the linearrelationship of the measured voltage with the temperature difference between hotand cold points for the junction comprising bromine-intercalated P-100 and sodium-intercalated P-100.
A junction comprising n-type and p-type partners has a thermocouple sensitivitythat is close to the sum of the magnitudes of the absolute thermoelectric powers ofthe two partners. This is because the electrons in the n-type partner, as well as theholes in the p-type partner, move away from the hot point toward the correspondingcold point. As a result, the overall effect on the voltage difference between the twocold ends is additive.
By using junctions comprising strongly n-type and strongly p-type partners, athermocouple sensitivity as high as +82 µV/°C has been attained. Semiconductorsare known to exhibit much higher values of the Seebeck coefficient than metals, butthe need to have thermocouples in the form of long wires makes metals the mainmaterials for thermocouples. Intercalated carbon fibers exhibit much higher valuesof the Seebeck coefficient than metals. Yet, unlike semiconductors, their fiber andfiber composite forms make them convenient for practical use as thermocouples.
The thermocouple sensitivity of the carbon fiber epoxy-matrix composite junc-tions is independent of the extent of curing, and is the same for unidirectional andcross-ply junctions. This is consistent with the fact that the thermocouple effecthinges on the difference in the bulk properties of the two partners and is not aninterfacial phenomenon. This means that the interlaminar interfaces in a fibrous
BLE 6.2ebeck Coefficient (µV/°C) and Absolute Thermoelectric Power (µV/°C) of Carbonbers and Thermocouple Sensitivity (µV/°C) of Epoxy-Matrix Composite Junctionsll junctions are unidirectional unless specified as cross-ply. The temperature range
20–110°C.)
Seebeck Coefficient with Copper as the Reference
(µV/°C)Absolute Thermoelectric
Power (µV/°C)Thermocouple
Sensitivity (µV/°C
25*300*25* + T-300*25* + T-300* (cross-ply)100*120*100 (Na)100 (Br2)100 (Br2) + P-100 (Na)120 (Na)120 (Br2)120 (Br2) + P-120 (Na)
+ 0.8– 5.0
– 1.7– 3.2– 48+ 43– 42+ 38
– 1.5– 7.3
– 4.0– 5.5– 50+ 41– 44+ 36
+ 5.5+ 5.4
+ 82
+ 74
Pristine (i.e., not intercalated)
©2001 CRC Press LLC

composite serve as thermocouple junctions in the same way, irrespective of the lay-up configuration of dissimilar fibers in the laminate. As a structural compositetypically has fibers in multiple directions, this behavior facilitates the use of astructural composite as a thermocouple array.
It is important to note that thermocouple junctions do not require any bondingagent other than epoxy, which serves as the matrix of the composite and not as anelectrical contact medium. In spite of the presence of the epoxy matrix in the junctionarea, direct contact occurs between a fraction of the fibers of a lamina and a fractionof the fibers of the other lamina, resulting in a conduction path in the directionperpendicular to the junction.
6.6 SENSING BOND DEGRADATION
Continuous fiber polymer-matrix composites are increasingly used to retrofit con-crete structures, particularly columns.28-30 The retrofit involves wrapping a fiber sheetaround a concrete column, or placing a sheet on the surface of a concrete structuresuch that the sheet is adhered to the underlying concrete using a polymer, mostcommonly epoxy. This method is effective for the repair of even quite badly damagedconcrete structures. Although the fibers and polymer are very expensive comparedto concrete, the alternative of tearing down and rebuilding the concrete structure isoften costlier. Both glass fibers and carbon fibers are used for composite retrofit.Glass fibers are advantageous for their relatively low cost, but carbon fibers areadvantageous for their high tensile modulus.
The effectiveness of a composite retrofit depends on the quality of the bondbetween the composite and the underlying concrete, as good bonding is necessary
FIGURE 6.9 Variation of the measured voltage with the temperature difference between hotand cold points for the epoxy-matrix composite junction comprising bromine-intercalatedP-100 and sodium-intercalated P-100 carbon fibers.
Temperature difference (0C)
Volt
age
(mV
)
0
0
1
2
3
4
5
6
7
8
10 20 30 40 50 60 70 80 90
©2001 CRC Press LLC

for load transfer. Peel testing for bond quality evaluation is destructive.31 Nonde-structive methods to evaluate the bond quality are valuable. They include acousticmethods, which are not sensitive to small amounts of debonding or bond degrada-tion,32 and dynamic mechanical testing.33,34 Electrical resistance measurement canbe used for nondestructive evaluation of the interface between concrete and its carbonfiber composite retrofit. The concept is that bond degradation causes the electricalcontact between the carbon fiber composite retrofit and the underlying concrete todegrade. Since concrete is electrically more conducting than air, the presence of anair pocket at the interface causes an increase in the measured apparent volumeresistance of the composite retrofit in a direction in the plane of the interface. Hence,bond degradation is accompanied by an increase in the apparent resistance of thecomposite retrofit. Although the polymer matrix is electrically insulating, the pres-ence of a thin layer of epoxy at the interface is unable to electrically isolate thecomposite retrofit from the underlying concrete.
Figure 6.10 shows the fractional change in resistance during cyclic compressiveloading at a stress amplitude of 1.3 MPa. The stress is along the fiber direction.Stress returns to zero at the end of each cycle. In each cycle, the electrical resistanceincreases reversibly during compressive loading. This is attributed to the reversibledegradation of the bond between carbon fiber sheet and concrete substrate duringcompressive loading. This bond degradation decreases the chance for fibers to touchthe concrete substrate, leading to a resistance increase.
As cycling progresses, both the maximum and minimum values of the fractionalchange in resistance in a cycle decrease. This is attributed to the irreversible distur-bance in the fiber arrangement during repeated loading and unloading. This distur-bance increases the chance for fibers to touch the concrete substrate, causing resis-tance to decrease irreversibly as cycling progresses.
FIGURE 6.10 The fractional change in resistance for the fiber composite retrofit on a con-crete substrate during cyclic compressive loading.
Time (s)
0-10
10
20 1.5
0
100 200 300
Str
ess
(MP
a)
Frac
tiona
l cha
nge
in r
esis
tanc
e (%
)
0.0
0.5
1.0
©2001 CRC Press LLC
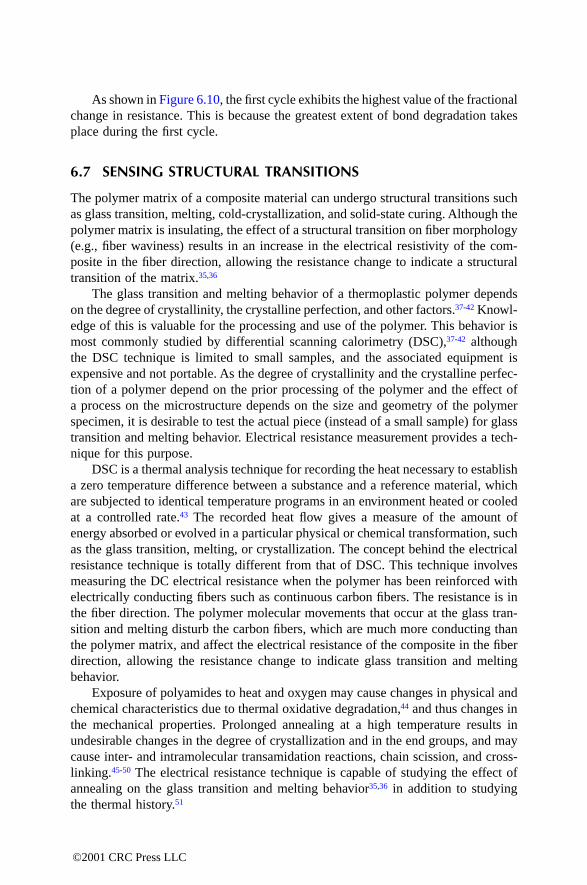
As shown in Figure 6.10, the first cycle exhibits the highest value of the fractionalchange in resistance. This is because the greatest extent of bond degradation takesplace during the first cycle.
6.7 SENSING STRUCTURAL TRANSITIONS
The polymer matrix of a composite material can undergo structural transitions suchas glass transition, melting, cold-crystallization, and solid-state curing. Although thepolymer matrix is insulating, the effect of a structural transition on fiber morphology(e.g., fiber waviness) results in an increase in the electrical resistivity of the com-posite in the fiber direction, allowing the resistance change to indicate a structuraltransition of the matrix.35,36
The glass transition and melting behavior of a thermoplastic polymer dependson the degree of crystallinity, the crystalline perfection, and other factors.37-42 Knowl-edge of this is valuable for the processing and use of the polymer. This behavior ismost commonly studied by differential scanning calorimetry (DSC),37-42 althoughthe DSC technique is limited to small samples, and the associated equipment isexpensive and not portable. As the degree of crystallinity and the crystalline perfec-tion of a polymer depend on the prior processing of the polymer and the effect ofa process on the microstructure depends on the size and geometry of the polymerspecimen, it is desirable to test the actual piece (instead of a small sample) for glasstransition and melting behavior. Electrical resistance measurement provides a tech-nique for this purpose.
DSC is a thermal analysis technique for recording the heat necessary to establisha zero temperature difference between a substance and a reference material, whichare subjected to identical temperature programs in an environment heated or cooledat a controlled rate.43 The recorded heat flow gives a measure of the amount ofenergy absorbed or evolved in a particular physical or chemical transformation, suchas the glass transition, melting, or crystallization. The concept behind the electricalresistance technique is totally different from that of DSC. This technique involvesmeasuring the DC electrical resistance when the polymer has been reinforced withelectrically conducting fibers such as continuous carbon fibers. The resistance is inthe fiber direction. The polymer molecular movements that occur at the glass tran-sition and melting disturb the carbon fibers, which are much more conducting thanthe polymer matrix, and affect the electrical resistance of the composite in the fiberdirection, allowing the resistance change to indicate glass transition and meltingbehavior.
Exposure of polyamides to heat and oxygen may cause changes in physical andchemical characteristics due to thermal oxidative degradation,44 and thus changes inthe mechanical properties. Prolonged annealing at a high temperature results inundesirable changes in the degree of crystallization and in the end groups, and maycause inter- and intramolecular transamidation reactions, chain scission, and cross-linking.45-50 The electrical resistance technique is capable of studying the effect ofannealing on the glass transition and melting behavior35,36 in addition to studyingthe thermal history.51
©2001 CRC Press LLC

6.7.1 DSC ANALYSIS
In Figure 6.11, (a) shows the DSC thermogram of the as-received carbon fiberNylon-6-matrix composite.35 The glass transition was not observed by DSC. Tm
(melting temperature, as indicated by the peak temperature) is 218.5°C; (b), (c), (d),(e), and (f) show the effect of annealing time and temperature on the melting peak.The DSC results are summarized in Table 6.3.34 Since Tm and ∆H of as-receivedand 100°C (5 h) annealed samples are almost the same (Figures 6.11(a) and (b)), itis attributed to the little change of the crystal perfection or the degree of crystallinityduring annealing at 100°C for 5 h. Figure 6.11(c) shows the DSC thermogram ofthe sample annealed at 180°C for 5 h. It reveals two endothermic melting peakswith peak temperatures of 216 and 195°C. The lower temperature peak may bebecause of the structural reorganization during annealing in which the amorphousportion partly developed crystallinity.35,52,53 As the annealing time increases to 15 h(Figure 6.11(d)), the high-temperature peak shifts to a lower temperature, but ∆Hincreases. As the annealing time increases to 30 h (Figure 6.11(e)), the height of thelow-temperature peak increases, while that of the high-temperature peak decreases.These effects are probably due to the reorganization and thermal oxidative degra-dation of the Nylon-6 matrix. When the annealing time increases from 5 h (Figure6.11(c)) to 15 h (Figure 6.11(d)), the degree of the crystallinity increases, so ∆Hincreases. However, at the same time, the extent of degradation increases due tothermal oxidation, which occurrs during annealing at a high temperature (180°C),resulting in lower crystal perfection. Therefore, the high-temperature peak shifts toa lower temperature. When the annealing time is long enough (30 h, Figure 6.11(e)),the crystalline portion from the reorganization process becomes dominant, as indi-
FIGURE 6.11 DSC thermograms showing the melting endothermic peaks before and afterannealing at the temperatures and for the times shown. (a) As-received; (b) 100°C, 5 h;(c) 180°C, 5 h; (d) 180°C, 15 h; (e) 180°C, 30 h; (f) 200°C, 5 h.
Temperature (0C)
Hea
t fl
ow
(W
/g)
50 100 150 200 250
9.0
10.0
11.0
a
b
c
d
e
f
©2001 CRC Press LLC
cated by the increase of the height of the low-temperature peak. When the samplehas been annealed at 200°C for 5 h (Figure 6.11(f)), both Tm and ∆H decrease relativeto the as-received sample. One possible explanation is that, when the annealingtemperature is very high, the extent of thermal degradation is extensive, resulting inless crystalline perfection and a lower degree of crystallinity.
6.7.2 DC ELECTRICAL RESISTANCE ANALYSIS
Figure 6.12(a)35 shows the fractional change in resistance for the as-received carbonfiber Nylon-6-matrix composite during heating, in which the temperature is raisedfrom 25 to 350°C at a rate of 0.5°C/min. Two peaks were observed. The onsettemperature of the first peak is 80°C, and that of the second peak is 220°C. The firstpeak is attributed to matrix molecular movement above Tg; the second peak isattributed to matrix molecular movement above Tm. Because the molecular move-ment above Tg is less drastic than that above Tm, the first peak is much lower thanthe second. As indicated before, the DSC thermogram of the as-received compositedoes not show a clear glass transition (Figure 6.11(a)). Therefore, the resistance ismore sensitive to the glass transition than DSC. The onset temperature (220°C) ofthe second peak (Figure 6.12(a)) is higher than the onset temperature (Tonset =200.9°C) of the DSC melting peak (Figure 6.11(a)), and is close to the meltingtemperature (Tm = 218.5°C) indicated by DSC (Figure 6.11(a)). The matrix molec-ular movement at Tonset is less intense than that at Tm, giving no effect on the resistancecurve at Tonset. Another reason may be a time lag between the matrix molecularmovement and the resistance change.
Figures 6.12(b), 6.12(c), and 6.12(d) show the effect of the annealing tempera-ture. Comparison of Figures 6.12(a) and 6.12(b) shows that annealing at 100°C for
TABLE 6.3Calorimetric Data for Carbon Fiber Nylon-6 Composite Before and After Annealing
Annealing Condition
Temperature(°C)
Time(h)
Tmla
(°C)Tonset
b
(°C)Tm
c
(°C)∆Hd
(J/g)
e e 200.9 218.5 26.7100 5 205.5 218.2 26.6180 5 194.8 201.3 215.5 34.8180 15 196.3 201.4 208.9 39.1180 30 196.3 200.0 209.0 38.6200 5 208.3 212.9 216.4 16.5
a Peak temperature of the low-temperature melting peakb Onset temperature of the high-temperature melting peakc Peak temperature of the high-temperature melting peakd Heat of fusione As-received
©2001 CRC Press LLC

©2001 CRC Press LLC
a
b
c
FIGURE 6.12 Effect of annealing condition on the variation of the electrical resistance withtemperature. (a) As-received; (b) 100°C, 5 h; (c) 180°C, 5 h; (d) 200°C, 5 h; (e) 180°C, 15 h;(f) 180°C, 30 h.
0 50 100 150 200 250 300 350 400
100
50
0
-50
Temperature (0C)
Fra
ctio
nal
ch
ang
e in
res
ista
nce
(%
)
0 50 100 150 200 250 300 350 400
100
50
0
-50
Temperature (0C)
Fra
ctio
nal
ch
ang
e in
res
ista
nce
(%
)
0 50 100 150 200 250 300 350 400
100
50
0
-50
Temperature (0C)
Fra
ctio
nal
ch
ang
e in
res
ista
nce
(%
)
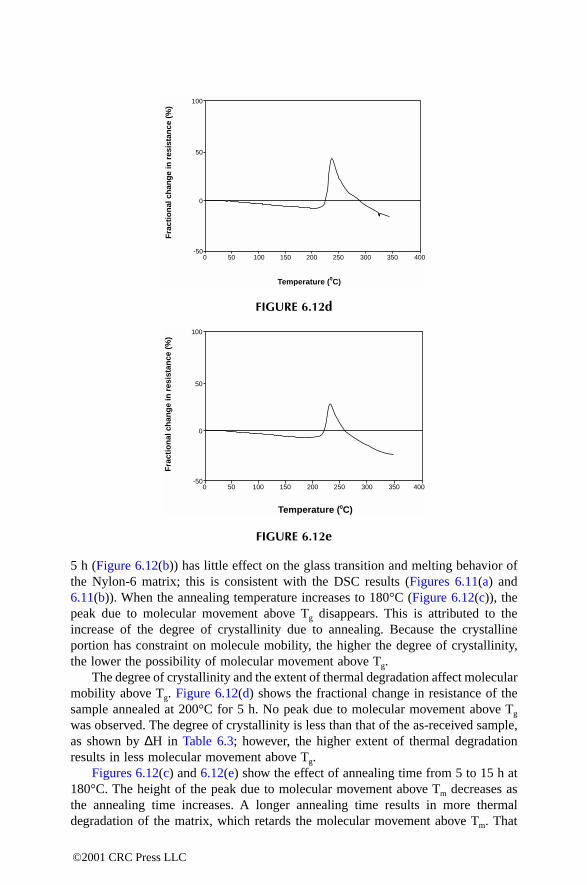
5 h (Figure 6.12(b)) has little effect on the glass transition and melting behavior ofthe Nylon-6 matrix; this is consistent with the DSC results (Figures 6.11(a) and6.11(b)). When the annealing temperature increases to 180°C (Figure 6.12(c)), thepeak due to molecular movement above Tg disappears. This is attributed to theincrease of the degree of crystallinity due to annealing. Because the crystallineportion has constraint on molecule mobility, the higher the degree of crystallinity,the lower the possibility of molecular movement above Tg.
The degree of crystallinity and the extent of thermal degradation affect molecularmobility above Tg. Figure 6.12(d) shows the fractional change in resistance of thesample annealed at 200°C for 5 h. No peak due to molecular movement above Tg
was observed. The degree of crystallinity is less than that of the as-received sample,as shown by ∆H in Table 6.3; however, the higher extent of thermal degradationresults in less molecular movement above Tg.
Figures 6.12(c) and 6.12(e) show the effect of annealing time from 5 to 15 h at180°C. The height of the peak due to molecular movement above Tm decreases asthe annealing time increases. A longer annealing time results in more thermaldegradation of the matrix, which retards the molecular movement above Tm. That
FIGURE 6.12d
FIGURE 6.12e
0 50 100 150 200 250 300 350 400
100
50
0
-50
Temperature (0C)
Fra
ctio
nal
ch
ang
e in
res
ista
nce
(%
)
0 50 100 150 200 250 300 350 400
100
50
0
-50
Temperature (0C)
Fra
ctio
nal
ch
ang
e in
res
ista
nce
(%
)
©2001 CRC Press LLC
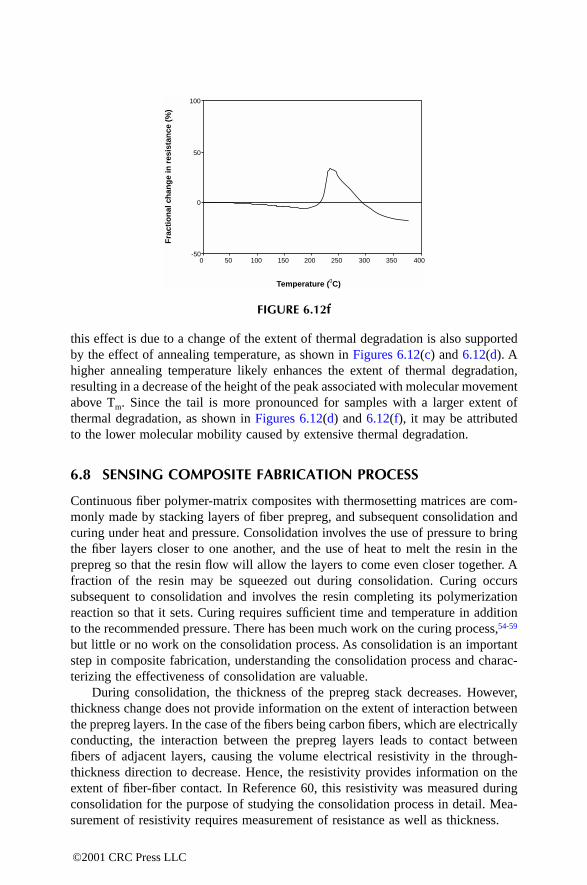
this effect is due to a change of the extent of thermal degradation is also supportedby the effect of annealing temperature, as shown in Figures 6.12(c) and 6.12(d). Ahigher annealing temperature likely enhances the extent of thermal degradation,resulting in a decrease of the height of the peak associated with molecular movementabove Tm. Since the tail is more pronounced for samples with a larger extent ofthermal degradation, as shown in Figures 6.12(d) and 6.12(f), it may be attributedto the lower molecular mobility caused by extensive thermal degradation.
6.8 SENSING COMPOSITE FABRICATION PROCESS
Continuous fiber polymer-matrix composites with thermosetting matrices are com-monly made by stacking layers of fiber prepreg, and subsequent consolidation andcuring under heat and pressure. Consolidation involves the use of pressure to bringthe fiber layers closer to one another, and the use of heat to melt the resin in theprepreg so that the resin flow will allow the layers to come even closer together. Afraction of the resin may be squeezed out during consolidation. Curing occurssubsequent to consolidation and involves the resin completing its polymerizationreaction so that it sets. Curing requires sufficient time and temperature in additionto the recommended pressure. There has been much work on the curing process,54-59
but little or no work on the consolidation process. As consolidation is an importantstep in composite fabrication, understanding the consolidation process and charac-terizing the effectiveness of consolidation are valuable.
During consolidation, the thickness of the prepreg stack decreases. However,thickness change does not provide information on the extent of interaction betweenthe prepreg layers. In the case of the fibers being carbon fibers, which are electricallyconducting, the interaction between the prepreg layers leads to contact betweenfibers of adjacent layers, causing the volume electrical resistivity in the through-thickness direction to decrease. Hence, the resistivity provides information on theextent of fiber-fiber contact. In Reference 60, this resistivity was measured duringconsolidation for the purpose of studying the consolidation process in detail. Mea-surement of resistivity requires measurement of resistance as well as thickness.
FIGURE 6.12f
0 50 100 150 200 250 300 350 400
100
50
0
-50
Temperature (0C)
Fra
ctio
nal
ch
ang
e in
res
ista
nce
(%
)
©2001 CRC Press LLC

Figure 6.1360 shows the variation of the through-thickness electrical resistivityand N/N0 during consolidation at a pressure of 0.56 MPa. During consolidation, thetemperature is raised linearly and reaches 120°C, the curing temperature. In Figure6.13, the resistivity decreases and N/N0 increases during consolidation such that theN/N0 curve reveals three stages of consolidation. The first stage is characterized bya very gradual increase in N/N0 (due to the solid form of the resin); the second stageis characterized by an abrupt increase in N/N0 (due to the molten form of the resin);the third stage is characterized by a moderately gradual increase in N/N0 (due to thethickening of the resin as the temperature increases). Similar changes in curvatureof the N/N0 plot were observed for consolidation conducted at ramped temperaturesthat reached 100, 110, 120, 130, or 140°C, although only the results for a maximumtemperature of 120°C are shown in Figure 6.13. Similar effects were observed at apressure of 1.10 MPa. The curve of N/N0 vs. temperature is quantitatively quiteindependent of the maximum temperature of consolidation, but is quantitativelydifferent for the two pressures. At the higher pressure, (1) N/N0 reaches much highervalues, (2) the second stage begins and ends at higher temperatures, and (3) theslope of the N/N0 vs. temperature curve in the second stage is higher (7.18/°C for1.10 MPa and 3.31/°C for 0.56 MPa). This means that pressure hastens consolidationand promotes the extent of consolidation, as expressed by the quantity N/N0. Incontrast, increasing the maximum temperature does not promote the extent of con-solidation.
6.9 CONCLUSION
The measurement of the DC electrical resistance or voltage allows carbon fiberpolymer-matrix structural composites to sense their own strain, damage, temperature,bond degradation, structural transitions, and fabrication process.
FIGURE 6.13 Variations of N/N0 (solid line) and through-thickness electrical resistivity(dashed line) with temperature during consolidation heating to 120°C at a pressure of 0.56 MPa.
Temperature (0C)
Res
isti
vity
(Ω
.cm
)
N/N
0
20 40 60 80 100 120
0
20
40
60
80
100
120
140
0
50
100
150
200
250
300
350
400
450
©2001 CRC Press LLC

REFERENCES
1. X.B. Chen and D. Billaud, Ext. Abstr. Program — 20th Bienn. Conf. Carbon, pp.274-275 (1991).
2. X. Wang and D.D.L. Chung, Composite Interfaces, 5(3), 191-199 (1998).3. X. Wang and D.D.L. Chung, Polym. Composites, 18(6), 692-700 (1997).4. X. Wang and D.D.L. Chung, Carbon, 35(5), 706-709 (1997).5. X. Wang and D.D.L. Chung, J. Mater. Res., 14(11), 4224-4229 (1999).6. S. Wang and D.D.L. Chung, Composite Interfaces, 6(6), 497-506 (1999).7. S. Wang and D.D.L. Chung Polym. Composites, 21(1), 13-19 (2000).8. N. Muto, H. Yanagida, T. Nakatsuji, M. Sugita, Y. Ohtsuka and Y. Arai, Smart Mater.
Struct., 1, 324-329 (1992).9. X. Wang, X. Fu and D.D.L. Chung, J. Mater. Res., 14(3), 790-802 (1999).
10. X. Wang and D.D.L. Chung, Composites: Part B, 29B(1), 63-73 (1998).11. P.E. Irving and C. Thiogarajan, Smart Mater. Struct., 7, 456-466 (1998).12. X. Wang, S. Wang and D.D.L. Chung, J. Mater. Sci., 34(11), 2703-2714 (1999).13. S. Wang and D.D.L. Chung, Polym. Composites, in press.14. S. Wang and D.D.L. Chung, Polym. Composites, in press.15. N. Muto, H. Yanagida, M. Miyayama, T. Nakatsuji, M. Sugita and Y. Ohtsuka, J.
Ceramic Soc. Japan, 100(4), 585-588 (1992).16. N. Muto, H. Yanagida, T. Nakatsuji, M. Sugita, Y. Ohtsuka, Y. Arai and C. Saito, Adv.
Composite Mater., 4(4), 297-308 (1995).17. R. Prabhakaran, Exp. Tech., 14(1), 16-20 (1990).18. M. Sugita, H. Yanagida and N. Muto, Smart Mater. Struct., 4(1A), A52-A57 (1995).19. A.S. Kaddour, F.A.R. Al-Salehi, S.T.S. Al-Hassani and M.J. Hinton, Composites Sci.
Tech., 51, 377-385 (1994).20. O. Ceysson, M. Salvia and L. Vincent, Scripta Materialia, 34(8), 1273-1280 (1996).21. K. Schulte and Ch. Baron, Composites Sci. Tech., 36, 63-76 (1989).22. K. Schulte, J. Physique IV, C7(3), 1629-1636 (1993).23. J.C. Abry, S. Bochard, A. Chateauminois, M. Salvia and G. Giraud, Composites Sci.
Tech., 59(6), 925-935 (1999).24. A. Tedoroki, H. Kobayashi and K. Matuura, JSME Int. J. Series A — Solid Mechanics
Strength of Materials, 38(4), 524-530 (1995).25. S. Hayes, D. Brooks, T. Liu, S. Vickers and G.F. Fernando, Proc. SPIE — Int. Soc.
Optical Eng., Vol. 2718, pp. 376-384 (1996).26. S. Wang and D.D.L. Chung, Composite Interfaces, 6(6), 497-506 (1999).27. S. Wang and D.D.L. Chung, Composites: Part B, 30(6), 591-601 (1999).28. S.Wang and D.D.L. Chung, Composite Interfaces, 6(6), 519-530 (1999).29. H.A. Toutanji, Composite Structures, 44(2), 155-161 (1999).30. H.A. Toutanji and T. El-Korchi, J. Composites Constr., 3(1), 38-45 (1999).31. Y. Lee and S. Matsui, Tech. Reports Osaka University, 48(2319-2337), 247-254
(1998).32. V. M. Karbhari, M. Engineer and D. A. Eckel II, J. Mater. Sci., 32(1), 147-156 (1997).33. D.P. Henkel and J. D. Wood, NDT & E International, 24(5), 259-264 (1991).34. A. K. Pandey and M. Biswas, J. Sound Vib., 169(1), 3-17 (1994).35. Z. Mei and D.D.L. Chung, Polym. Composites, 21(5), 711-715 (2000).36. Z. Mei and D.D.L. Chung, Polym. Composites, 19(6), 709-713 (1998).37. J.A. Kuphal, L.H. Sperling and L.M. Robeson, J. Appl. Polym. Sci., 42, 1525-1535
(1991).38. A.L. Simal and A.R. Martin, J. Appl. Polym. Sci., 68, 453-474 (1998).
©2001 CRC Press LLC

39. Ch.R. Davis, J. Appl. Polym. Sci., 62, 2237-2245 (1996).40. B.G. Risch and G.L. Wilkes, Polymer, 34, 2330-2343 (1993).41. H.J. Oswald, E.A. Turi, P.J. Harget and Y.P. Khanna, J. Macromol. Sci. Phys., B13(2),
231-254 (1977).42. J.U. Otaigbe and W.G. Harland, J. Appl. Polym. Sci., 36, 165-175 (1988).43. M.E. Brown, Introduction to Thermal Analysis: Techniques and Application, Chap-
man & Hall, New York, p. 25 (1988).44. C.H. Do, E.M. Pearce and B.J. Bulkin, J. Polym. Sci., Part A: Polym. Chem., 25,
2409-2424 (1987).45. M.C. Gupta and S.G. Viswanath, J. Therm. Anal., 47(4), 1081-1091 (1996).46. N. Avramova, Polym. & Polym. Comp., 1(4), 261-274 (1993).47. A.L. Simal and A.R. Martin, J. Appl. Polym. Sci., 68, 441-452 (1998).48. I.M. Fouda, M.M. El-Tonsy, F.M. Metawe, H.M. Hosny and K.H. Easawi, Polym.
Test., 17(7), 461-493 (1998).49. I.M. Fouda, E.A. Seisa and K.A. El-Farahaty, Polym. Test., 15(1), 3-12 (1996).50. L.M. Yarisheva, L. Yu Kabal’nova, A.A. Pedy and A.L. Volynskii, J. Therm. Anal.,
38(5), 1293-1297 (1992).51. Z. Mei and D.D.L. Chung, Thermochim. Acta, 369(1-2), 62-65 (2001).52. Y.P. Khanna, Macromolecules, 25, 3298-3300 (1992).53. Y.P. Khanna, J. Appl. Polym. Sci., 40, 569-579 (1990).54. C.W. Lee and B. Rice, Int. SAMPE Symp. Exhib., 41(2), 1511-1517 (1996).55. G.M. Maistros and I.K. Partridge, Composites, Part B, 29(3), 245-250 (1998).56. R.P. Cocker, D.L. Chadwick, D.J. Dare and R.E. Challis, Int. J. Adh. Adh., 18(5) 319-
331 (1998).57. G.R. Powell, P.A. Crosby, D.N. Waters, C.M. France, R.C. Spooncer and G.F.
Fernando, Smart Mater. Struct., 7(4), 557-568 (1998).58. Y. Li and S. Menon, Sensors, 15(2), 14, 16, 18, 19 (1998).59. R. Casalini, S. Corezzi, A. Livi, G. Levita and P.A. Rolla, J. Appl. Polym. Sci., 65(1),
17-25 (1997).60. S. Wang and D.D.L. Chung, Polymer Composites, 22(1), 42-46 (2001).
©2001 CRC Press LLC

Structural Health Monitoring by Electrical Resistance Measurement
CONTENTS
7.1 Introduction7.2 Carbon Fiber Polymer-Matrix Structural Composites7.3 Cement-Matrix Composites7.4 Joints
7.4.1 Joints Involving Composites and Concrete by Adhesion7.4.2 Joints Involving Composites by Adhesion7.4.3 Joints Involving Steels by Fastening7.4.4 Joints Involving Concrete by Pressure Application7.4.5 Joints Involving Composites by Fastening
7.5 ConclusionReferences
SYNOPSIS Structural health monitoring by DC electrical resistance measurementis reviewed. The technique is valuable for evaluating composites and joints, providedthe materials involved are not all electrically insulating. The measurement pertains toeither the volume electrical resistivity of a bulk material or the contact resistivity ofan interface, and it can be performed in real time during loading or heating.
RELEVANT APPENDICES: A, B, C, G
7.1 INTRODUCTION
Structural health monitoring refers to observing the integrity of a structure for thepurpose of hazard mitigation, whether the hazard is due to live load, earthquake,wind, ocean waves, fatigue, aging, heat, or other factors. It mainly entails nonde-structive sensing of the damage in the structure.
7
©2001 CRC Press LLC

Extensive damage, such as large cracks on the surface, can be sensed by visualand liquid penetrant inspection. Both surface and subsurface defects can be sensedby magnetic particle inspection, eddy current testing, ultrasonic testing, x-radiogra-phy, and other methods. However, these techniques are not very sensitive to defectsthat are subtle in nature or microscopic in size. The resolution is particularly poorfor magnetic particle inspection and x-radiography. The resolution is better forultrasonic methods, but it is still limited to about 0.1 mm (depending on the frequencyof the ultrasonic wave). For effective hazard mitigation, it is important to be able todetect defects when they are small.
Recent attention to structural health monitoring has been centered on the use ofembedded or attached sensors, such as piezoelectric, optical fiber, microelectrome-chanical, acoustic, dynamic response, phase transformation, and other sensors,1-38
and the use of tagging through the incorporation of piezoelectric, magnetic, orelectrically conducting particles in the composite material.39,40 The use of embeddedsensors or particles suffers from the mechanical property degradation of the com-posite. Furthermore, embedded sensors are hard to repair. Attached sensors are easierto repair than embedded sensors, but they suffer from poor durability. Both embeddedand attached sensors are much more expensive than the structural material, so theyadd a lot to the cost of the structure.
Electrical resistance measurement has received relatively little attention in termsof structural health monitoring. It does not involve any embedment or attachment,so it does not suffer from the problems described for embedded or attached sensors.Also, this method allows the entire structure to be monitored, whereas the use ofembedded or attached sensors allows the structure to be monitored only at variousplaces. The electrical resistance method is particularly effective for detecting smalland subtle defects in composite materials and in joints. Materials such as carbonfiber polymer-matrix composites are lightweight structural composites that areimportant for aircraft, for which structural health monitoring is critical. Joints,whether by fastening or adhesion, are encountered in almost any structure, and theirstructural health monitoring is particularly challenging due to the difficulty of prob-ing the joint interface.
7.2 CARBON FIBER POLYMER-MATRIX STRUCTURAL COMPOSITES
Polymer-matrix composites for structural applications typically contain continuousfibers such as carbon, polymer, and glass fibers because continuous fibers are moreeffective than short fibers as a reinforcement. Polymer-matrix composites with con-tinuous carbon fibers (Section 6.2) are used for aerospace, automobiles, and civilstructures.
The monitoring of damage has been achieved with continuous carbon fiberpolymer-matrix composites, as the electrical resistance of the composite changeswith damage (Section 6.4). In other words, the composites are sensors of their owndamage.
©2001 CRC Press LLC

7.3 CEMENT-MATRIX COMPOSITES
Concrete (a cement-matrix composite) is the dominant structural material for civilinfrastructure. Particularly in the presence of short carbon fibers as an admixture,its electrical resistivity changes upon strain or damage, making it a sensor of its ownstrain (Section 5.4.1) and damage (Section 5.4.2). That both strain and damage canbe sensed simultaneously through resistance measurement means that thestrain/stress condition under which damage occurs can be obtained, thus facilitatingdamage origin identification. Damage is indicated by a resistance increase, whichis larger and less reversible when the stress amplitude is higher. The resistanceincrease can be a sudden increase during loading or a gradual shift of baselineresistance.
7.4 JOINTS
Joining is one of the key processes in manufacturing and repair. It can be achievedby welding, diffusion bonding (autohesion in the case of polymers), soldering,brazing, adhesion, fastening, or other methods.
Joints can be evaluated destructively by mechanical testing, which involvesdebonding. However, it is preferred to use nondestructive methods, such as modulus(dynamic mechanical), acoustic, and electrical measurements. Electrical measure-ments are particularly attractive because of short response time and equipmentsimplicity. A requirement for the feasibility of electrical measurements for jointevaluation is that the components being joined are not electrical insulators. Thus,joints involving metals, cement (concrete), and conductor-filled polymers are suit-able.
The method of electrical resistance measurement for joint evaluation most com-monly involves measurement of the contact electrical resistivity of the joint interface.Contact resistivity is given by the product of the contact resistance and the jointarea; it is a quantity that is independent of the joint area. Degradation of the jointcauses contact resistivity to increase. A less common method involves measuringthe apparent volume resistance of a component while component A is joined tocomponent B. When B is less conducting than A, but is not insulating, degradationof the joint causes the apparent volume resistance of A to increase.
7.4.1 JOINTS INVOLVING COMPOSITE AND CONCRETE BY ADHESION
Continuous fiber polymer-matrix composites are used increasingly to retrofit con-crete structures, particularly columns.41-43 Retrofit involves wrapping a fiber sheetaround a concrete column or placing a sheet on the surface of a concrete structuresuch that the fiber sheet is adhered to the underlying concrete by using a polymer,usually epoxy. This method is effective for the repair of even quite badly damagedconcrete structures. Although the fibers and polymer are very expensive comparedto concrete, the alternative of tearing down and rebuilding the structure is often moreexpensive than the composite retrofit. Both glass fibers and carbon fibers are used
©2001 CRC Press LLC
for composite retrofit. Glass fibers are advantageous for their relatively low cost,but carbon fibers are advantageous for their high tensile modulus.
The effectiveness of a composite retrofit depends on the quality of the bondbetween the composite and the underlying concrete, as good bonding is necessaryfor load transfer. Peel testing for bond quality evaluation is destructive.44 Nonde-structive methods to evaluate the bond quality are valuable. They include acousticmethods, which are not sensitive to small amounts of debonding or bond degrada-tion,45 and dynamic mechanical testing.46 Electrical resistance measurement has beenused for nondestructive evaluation of the interface between concrete and its carbonfiber composite retrofit.41 This method is effective for studying the effects of tem-perature and debonding stress on the interface. The concept is that bond degradationcauses the electrical contact between the carbon fiber composite retrofit and theunderlying concrete to degrade. Since concrete is electrically more conducting thanair, the presence of an air pocket at the interface causes the measured apparentvolume resistance of the composite retrofit to increase in a direction in the plane ofthe interface. Hence, bond degradation is accompanied by an increase in the apparentresistance of the composite retrofit. Although the polymer matrix is electricallyinsulating, the presence of a thin layer of epoxy at the interface is unable to elec-trically isolate the composite retrofit from the underlying concrete.
The apparent resistance of the retrofit in the fiber direction is increased by bonddegradation, whether the degradation is due to heat or stress. The degradation isreversible. Irreversible disturbance in the fiber arrangement occurs slightly as thermalor load cycling occurs, as indicated by the resistance decreasing cycle by cycle.41
7.4.2 JOINTS INVOLVING COMPOSITES BY ADHESION
Joining methods for polymers and polymer-matrix composites include autohesion,which is relevant to the self-healing of polymers. Diffusion bonding (or autohesion)involves interdiffusion among the adjoining materials in the solid state. In contrast,fusion bonding involves melting. Due to the relatively low temperatures of diffusionbonding compared to fusion bonding, diffusion bonding does not suffer from theundesirable side-effects that occur in fusion bonding, such as degradation and cross-linking of the polymer matrix. Although the diffusion bonding of metals has beenwidely studied, relatively little study has been conducted on the autohesion ofpolymers. Because of the increased segment mobility above the glass transitiontemperature (Tg), thermoplastics are able to undergo interdiffusion above Tg.
Diffusion, as a thermally activated process, takes time. How long diffusion takesdepends on the temperature. In order for diffusion bonding or autohesion to beconducted properly, the kinetics of the process need to be known.
The study of the kinetics requires monitoring the process as it occurs. A real-time monitoring technique is obviously preferable to a traditional method thatrequires periodic interruption and cooling of the specimen. However, real-timemonitoring is experimentally difficult compared with interrupted monitoring. Themethod described here is ideal for thermoplastic prepregs containing continuouscarbon fibers, since the carbon fibers are conductive. Two carbon-fiber thermoplasticprepreg plies are placed together to form a joint. The electrical contact resistance
©2001 CRC Press LLC
of this joint is measured during autohesion. As autohesion occurs, the fibers in theplies being joined come closer together, resulting in a decrease in contact resistance.With the measurement of this resistance in real time, the autohesion process hasbeen monitored as a function of time at different selected bonding temperatures forNylon-6 and polyphenylenesulfide (PPS), both thermoplastics.47 Arrhenius plots ofa characteristic resistance decrease versus temperature allow determination of theactivation energy for the process. This method can be used for monitoring thebonding of unfilled thermoplastics if a few carbon fibers are strategically placed.
Engineering thermoplastics can be bonded by autohesion above the glass tran-sition temperature but below the melting temperature, or fusion welding (meltingand solidification). Both methods involve heating and subsequent cooling. Duringcooling, the thermoplastic goes from a soft solid state (in the case of autohesion) ora liquid state (in the case of fusion welding) to a stiff state. If the thermoplasticmembers to be joined are anisotropic (as in the case of each member being reinforcedwith fibers) and the fiber orientation in the two members is not the same, the thermalexpansion (actually contraction) mismatch at the bonding plane will cause thermalstress to build up during cooling. This thermal stress is detrimental to the quality ofthe adhesive bond.
Two scenarios can lead to the absence of bonding after cooling. One is theabsence of bond formation at the high temperature during welding because ofinsufficient time or temperature. The other scenario is the presence of bonding atthe high temperature, but the occurrence of debonding during cooling due to thermalstress. The cause of the absence of bonding is different in the two scenarios. In anygiven situation, the cause of the debonded joint must be understood if the absenceof bonding after cooling is to be avoided.
The propensity for mutual diffusion in thermoplastic polymers increases withtemperature. The contact at the interface across which interdiffusion takes place alsoplays a role. An intimate interface, as obtained by application of pressure to compressthe two members together, also facilitates diffusion. Thus, the quality of the jointimproves with increasing temperature and increasing pressure in the high-tempera-ture period of welding. The poorer the quality of the joint attained at a high tem-perature, the greater the likelihood that thermal stress built up during subsequentcooling will be sufficient to cause debonding. Hence, merely having bondingachieved at the high temperature in welding is not enough. The bond must be ofsufficient quality to withstand the abuse of thermal stress during cooling.
The quality of a joint is conventionally tested destructively by mechanicalmethods, or nondestructively by ultrasonic methods.48,49 This testing is performedat room temperature after the joint has been cooled from the high temperature usedin welding. As a result, the testing does not allow distinction between the twoscenarios described above. The use of a nondestructive method, namely contactelectrical resistance measurement, to monitor joint quality in real time during thehigh temperature period of welding, and also during subsequent cooling, has beenshown.50 The resistance increases by up to 600% upon debonding. The resistanceincrease is much greater than the resistance decrease during prior bonding. Debond-ing occurs during cooling when the pressure or temperature during prior bonding isnot sufficiently high.
©2001 CRC Press LLC

Adhesive joint formation between thermoplastic adherends typically involvesheating to temperatures above the melting temperature (Tm) of the thermoplastic.During heating to the desired elevated temperature, time is spent in the range betweenthe glass transition temperature (Tg) and the Tm. The dependence of the bond qualityon the heating rate, heating time, and pressure has been investigated through mea-surement of the contact resistance between adherends in the form of carbon fiber-reinforced PPS.51 A long heating time below the melting temperature (Tm) is detri-mental to subsequent PPS adhesive joint development above Tm. This is due to curingreactions below Tm and consequent reduced mass flow response above Tm. A highheating rate enhances the bonding more than a high pressure.
7.4.3 JOINTS INVOLVING STEELS BY FASTENING
Mechanical fastening involves the application of a force to the components to bejoined so as to prevent them from separating in service. During repair, maintenance,or other operations, unfastening may be needed. Hence, repeated fastening andunfastening may be necessary. By design, the stresses encountered by the compo-nents and fasteners are below the corresponding yield stresses so that no plasticdeformation occurs. However, the local stress at the asperities at the interface canexceed the yield stress, resulting in local plastic deformation as shown for carbonsteel fastened joints at a compressive stress of just 7% or less of the yield stress.52
Plastic deformation results in changes in the joint interfaces. This means that thejoint interface depends on the extent of prior fastening and unfastening. The jointinterface affects the mechanical and corrosion behavior of the joint; this problem isof practical importance.
Stainless steel differs from carbon steel in the presence of a passive film, whichis important to its corrosion resistance. The effect of repeated fastening and unfas-tening on the passive film is of concern.
Figures 7.1 (a) and (b)53 show the variation in resistance and displacement duringcyclic compressive loading of stainless steel on stainless steel at a stress amplitudeof 14 MPa. In every cycle, the resistance decreases as the compressive stressincreases such that the maximum stress corresponds to the minimum resistance andthe minimum stress corresponds to the maximum resistance (Figure 7.1(a)).
The maximum resistance (in the unloaded condition) of every cycle increasesupon stress cycling such that the increase is not significant until after 13 cycles (Figure7.1(a)). The increase is due to the damage of the passive film and the consequentsurface oxidation. The minimum resistance (at the maximum stress) of every cycleincreases slightly upon cycling (Figure 7.1(b)), probably due to strain hardening.
The higher the stress amplitude, the fewer the number of stress cycles for passivefilm damage to begin. At the lowest stress amplitude of 3.5 MPa, passive film damagewas not observed up to 30 cycles.
Comparison of the results on stainless steel and on carbon steel shows that thecarbon steel joint is dominated by effects associated with plastic deformation,whereas the stainless steel joint is dominated by effects associated with passive filmdamage. The effect of the passive film is absent in the carbon steel joint, as expectedfrom the absence of a passive film on carbon steel. The effects of plastic deformation
©2001 CRC Press LLC
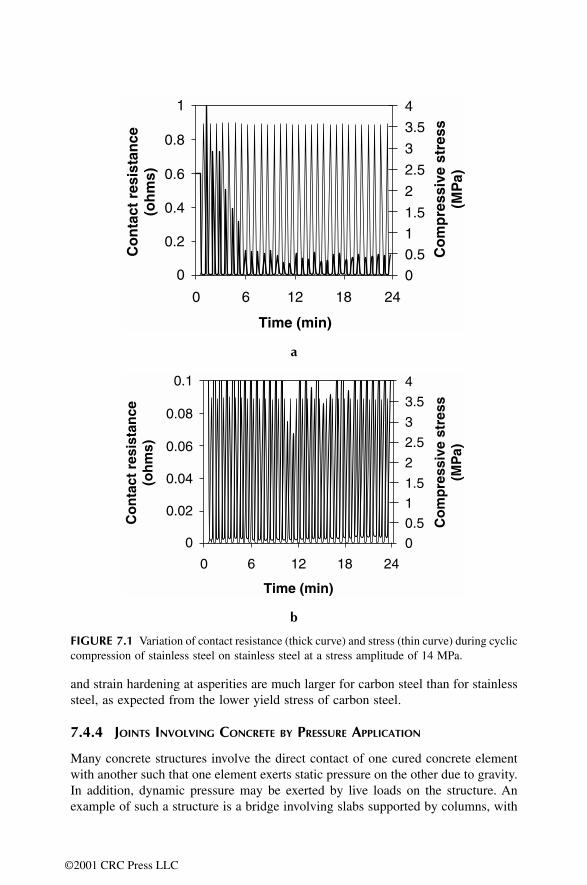
and strain hardening at asperities are much larger for carbon steel than for stainlesssteel, as expected from the lower yield stress of carbon steel.
7.4.4 JOINTS INVOLVING CONCRETE BY PRESSURE APPLICATION
Many concrete structures involve the direct contact of one cured concrete elementwith another such that one element exerts static pressure on the other due to gravity.In addition, dynamic pressure may be exerted by live loads on the structure. Anexample of such a structure is a bridge involving slabs supported by columns, with
a
b
FIGURE 7.1 Variation of contact resistance (thick curve) and stress (thin curve) during cycliccompression of stainless steel on stainless steel at a stress amplitude of 14 MPa.
1
0.8
0.6
0.4
0.2
0
0 6 12 18 24
0
0.5
1.5
2.5
3.5
1
2
3
4
Time (min)
Co
nta
ct r
esis
tan
ce(o
hm
s)
Co
mp
ress
ive
stre
ss(M
Pa)
0.1
0.08
0.06
0.04
0.02
0
0 6 12 18 24
0
0.5
1.5
2.5
3.5
1
2
3
4
Time (min)
Co
nta
ct r
esis
tan
ce(o
hm
s)
Co
mp
ress
ive
stre
ss(M
Pa)
©2001 CRC Press LLC

dynamic live loads exerted by vehicles traveling on the bridge. Another example isa concrete floor in the form of slabs supported by columns, with live loads exertedby people walking on the floor. The interface between concrete elements that are inpressure contact is of interest, as it affects the integrity and reliability of the assembly.For example, deformation at the interface affects the interfacial structure, which canaffect the effectiveness of load transfer between the contacting elements, and canaffect the durability of the interface to the environment. Moreover, deformation atthe interface can affect the dimensional stability of the assembly. Of particularconcern is how the interface is affected by dynamic loads.
A mortar-mortar contact was studied under dynamic loading at different com-pressive stress amplitudes by measuring the contact electrical resistance.54,55 Irre-versible decrease in contact resistance upon unloading was observed as load cyclingprogressed at a low stress amplitude (5 MPa, compared to a value of 64 MPa forthe compressive strength of the mortar), due to local plastic deformation at theasperities at the interface. Irreversible increase in contact resistance at the maximumstress was observed as load cycling progressed, probably due to debris generation;it was more significant at a higher stress amplitude (15 MPa).
7.4.5 JOINTS INVOLVING COMPOSITES BY FASTENING
Fasteners and components are usually made of metals, such as steel. However,polymers are increasingly used for both fasteners and components because of theirmoldability, low density, and corrosion resistance.
Due to the electrically insulating behavior of conventional polymers and theneed for an electrical conductor for measuring contact electrical resistance, a polymerwith continuous carbon fibers in a direction parallel to the plane of the joint wasused.56 The carbon fibers caused the composite to be electrical conducting in thefiber direction, as well as the through-thickness direction, because there is somedegree of contact between adjacent fibers in the composite despite the presence ofthe matrix.57 Due to the direction of the fibers, the mechanical properties of thecomposite in the through-thickness direction was dominated by the polymer matrix.
Contact resistance measurement was used to investigate the effect of repeatedfastening and unfastening on a composite-composite joint interface.56 A composite-composite joint obtained by mechanical fastening at a compressive stress of 5% (orless) of the 1% offset yield strength of the polymer (Nylon-6) was found to exhibitirreversible decrease in contact electrical resistance upon repeated fastening andunfastening. The decrease occurred after up to 10 cycles of fastening and unfastening,although the decrease diminished with cycling. It was primarily due to local plasticdeformation of the matrix at the asperities at the interface. Moreover, the stressrequired for the resistance to reach its minimum in a cycle decreased with cyclingbecause of softening of the matrix.
7.5 CONCLUSION
DC electrical resistance measurement is useful for structural health monitoring,particularly in relation to composites and joints, provided the materials involved arenot all electrically insulating. Monitoring involves measuring the volume resistivity
©2001 CRC Press LLC

of a bulk material or the contact resistivity of an interface. Measurement can beconducted in real time during loading or heating.
REFERENCES
1. V.K. Varadan and V.V. Varadan, Proc. SPIE, 3673, 359-368 (1999).2. J.S. Vipperman, AIAA/ASME/ASCE/AHS Structures, Structural Dynamics and Mate-
rials Conference — Collection of Technical Papers, 4, 3107-3114 (1999).3. R.C. Foedinger, D.L. Rea, J.S. Sirkis, C.S. Baldwin, J.R. Troll, R. Grande, C.S. Davis
and T.L. VanDiver, Proc. SPIE, 3670, 289-301 (1999).4. X. Deng, Q. Wang and V. Giurgiutiu, Proc. SPIE, 3668(I), 363-370 (1999).5. Z. Jiang, K. Kabeya and S. Chonan, Proc. SPIE, 3668(I), 343-350 (1999).6. C. Boller, C. Biemans, W.J. Staszewski, K. Worden and G.R. Tomlinson, Proc. SPIE,
3668(I), 285-294 (1999).7. D.M. Castillo, C. Pardo de Vera and J.A. Guemes, Key Eng. Mater., 167, 91-101
(1999).8. Q. Wang and X. Deng, Int. J. Solids Struct., 36(23), 3443-3468 (1999).9. R. Pascual, J.C. Golinval and M. Razeto, Proceedings of the 17th International Modal
Analysis Conference — IMAC, Vol. 1, pp. 238-243 (1999).10. B.J. Maclean, M.G. Mladejovsky, M.R. Whitaker, M. Olivier and S.C. Jacobsen,
Nondestructive Characterization of Materials in Aging Systems, Materials ResearchSociety Symposium Proceedings, Vol. 503, pp. 309-320 (1998).
11. R. Foedinger, D. Rea, J. Sirkis, R. Wagreich, J. Troll, R. Grande, C. Davis and T.L.Vandiver, Proc. 43rd International SAMPE Symposium and Exhibition, Vol. 43, No.1, pp. 444-457 (1998).
12. C.J. Groves-Kirkby, GEC J. Tech., 15(1), 16-26 (1998).13. S. Beard and F.-K. Chang, J. Intelligent Mater. Syst. Struct., 8(10), 891-897 (1997).14. G.W. Reich and K.C. Park, Collection of Technical Papers — AIAA/ASME/ASCE/
AHS/ASC Structures, Structural Dynamics and Materials Conference, Vol. 2, pp.1653-1660 (1998).
15. D. Polla, L. Francis, W. Robbins and R. Harjani, Emerging Technologies for Machin-ery Health Monitoring and Prognosis, American Society of Mechanical Engineers,Tribology Division, TRIB., Vol. 7, pp. 19-24 (1997).
16. M.J. Schulz, A.S. Naser, S.K. Thyagarajan, T. Mickens and P.F. Pai, Proc. 16thInternational Modal Analysis Conference — IMAC, Vol. 1, pp. 760-766 (1998).
17. G.H. James, III, D.C. Zimmerman and R.L. Mayes, Proceedings of the 16th Inter-national Modal Analysis Conference — IMAC, Vol. 1, pp. 151-157 (1998).
18. D. Inaudi, N. Casanova, P. Kronenberg, S. Marazzi and S. Vurpillot, Proc. SPIE,3044, 236-243 (1997).
19. P.J. Ellerbrock, Proc. SPIE, 3044, 207-218 (1997).20. A.E. Aktan, A.J. Helmicki, V.J. Hunt, N. Catbas, M. Lenett and A. Levi, Proceedings
of the American Control Conference, Vol. 2, pp. 873-877 (1997).21. J.A.J. Fells, M.J. Goodwin, C.J. Groves-Kirkby, D.C.J. Reid, J.E. Rule, and M.B.
Shell, IEEE Colloquium (Digest), (033), 10/1-10/11 (1997).22. R.S. Ballinger and D.W. Herrin, 11th Biennial Conference on Reliability, Stress
Analysis, and Failure Prevention, American Society of Mechanical Engineers, DesignEngineering Division DE, Vol. 83, No. 2 (Pt. 1), pp. 181-187 (1995).
23. D.C. Zimmerman, S.W. Smith, H.M. Kim and T.J. Bartkowicz, J. Vibr. Acoust. Trans.ASME, 118(4), 543-550 (1996).
©2001 CRC Press LLC

24. J.N. Schoess, G. Seifert, C.A. Paul, Proc. SPIE, 2718, 175-184 (1996).25. J.N. Schoess, Proc. SPIE, 2717, 212-218 (1996).26. J. Schoess, F. Malver, B. Iyer and J. Kooyman, 52nd Annual Forum Proceedings —
American Helicopter Society, Vol. 2, pp. 1788-1793 (1996).27. K.E. Castanien and C. Liang, Proc. SPIE, 2721, 38-49 (1996).28. G. James, D. Roach, B. Hansche, R. Meza and N. Robinson, Proc. Int. Conf. Eng.,
Constr., Oper. Space, Vol. 2, pp. 1127-1133 (1996).29. B.D. Westermo and L.D. Thompson, Proc. SPIE, 2443, 841-851 (1995).30. D.C. Zimmerman, M. Kaouk and T. Simmermacher, J. Mech. Design, 117B, 214-221
(1995).31. N. Narendran and J. Weiss, Proc. Instrum. Soc. Am., Vol. 38, pp. 273-282 (1995).32. D.A. Sofge, 2nd Australian and New Zealand Conference on Intelligent Information
Systems — Proceedings, pp. 91-94 (1994).33. C.A. Paul, G.P. Sendeckyj and G.P. Carman, Proc. SPIE, 1918, 154-164 (1993).34. G. Park, H.H. Cudney and D.J. Inman, Proc. SPIE, 3670, 461-469 (1999).35. G. Park, K. Kabeya, H.H. Cudney and D.J. Inman, JSME Int. J. Series A — Solid
Mech. Mater. Eng., 42(2), 249-258 (1999).36. F. Lalande, C.A. Rogers, B.W. Childs, Z.A. Chaudhry, Proc. SPIE, 2717, 237-243
(1996).37. B.D. Westermo and L.D. Thompson, Proc. SPIE, 2446, 37-46 (1995).38. L. Thompson, B. Westermo and R. Waldbusser, Proceedings of the 42nd International
Instrumentation Symposium, Instrument Society of America, pp. 567-576 (1996).39. S.R. White, Proc. SPIE, 2442, 337-348 (1995).40. R.F. Quattrone and J.B. Berman, Materials for the New Millennium, Proceedings of
the Materials Engineering Conference, Vol. 2, pp. 1045-1054 (1996).41. Z. Mei and D.D.L. Chung, Cem. Concr. Res., 30(5), 799-802 (2000).42. H.A. Toutanji, Composite Struct., 44(2), 155-161 (1999).43. H.A. Toutanji and T. El-Korchi, J. Composites Constr., 3(1), 38-45 (1999).44. V.M. Karbhari, M. Engineer and D.A. Eckel, II, J. Mater. Sci., 32(1), 147-156 (1997).45. D.P. Henkel, J.D. Wood, NDT & E International, 24(5), 259-264 (1991).46. A.K. Pandey and M. Diswas, J. Sound Vibr., 169(1), 3-17 (1994).47. Z. Mei and D.D.L. Chung, Int. J. Adh. Adh., 20, 173-175 (2000).48. S. Dixon, C. Edwards and S.B. Palmer, Ultrasonics, 32(6), 425-430 (1994).49. V.K. Winston, Proc. 43rd International SAMPE Symposium and Exhibition, Vol. 43,
No. 2, pp. 1428-1437 (1998).50. Z. Mei and D.D.L. Chung, Int. J. Adh. Adh., 20, 135-139 (2000).51. Z. Mei and D.D.L. Chung, Int. J. Adh. Adh., 20, 273-277 (2000).52. X. Luo and D.D.L. Chung, J. Mater. Eng. Perf., 9, 95-97 (2000).53. X. Luo and D.D.L. Chung, Adv. Eng. Mater., 3(1-2), 62-65 (2001).54. X. Luo and D.D.L. Chung, Cem. Concr. Res., 30(2), 323-326 (2000).55. X. Luo and D.D.L. Chung, J. Mater. Sci., 35(19), 4795-4802 (2000).56. X. Luo and D.D.L. Chung, Polym. Eng. Sci., 40(7), 1505-1509 (2000).57. X. Wang and D.D.L. Chung, Polym. Composites, 18(6), 692-700 (1997).
©2001 CRC Press LLC

Modification of the Surface of Carbon Fibers for Use as a Reinforcement in Composite Materials
CONTENTS
8.1 Introduction to Surface Modification8.2 Introduction to Carbon Fiber Composites8.3 Surface Modification of Carbon Fibers for Polymer-Matrix
Composites8.4 Surface Modification of Carbon Fibers for Metal-Matrix Composites References
SYNOPSIS Surface modification can greatly enhance the effectiveness of carbonfibers as a reinforcement in composite materials. The methods of surface modifica-tion, as used for polymer-matrix and metal-matrix composites, are covered.
RELEVANT APPENDIX: J
8.1 INTRODUCTION TO SURFACE MODIFICATION
The surface of a material greatly affects many of its properties. Modification of thesurface is an effective way to improve material properties. Surface modificationrefers to modification of surface composition or surface structure. The surface regioncan have a thickness ranging from Å to µm. As modification of the surface is oftensimpler and less expensive than modification of the bulk, it is used technologicallyto improve materials for many applications.
8
©2001 CRC Press LLC

Methods of surface modification include heating in a reactive environment (tochange the surface composition or to form surface functional groups, a surface alloy,a surface compound, surface porosity, surface roughness, or a coating); heating thesurface in an inert environment, such as by using a laser (to change the surfacemicrostructure or crystallinity); bombardment by charged particles such as ions(plasma) or electrons (to introduce surface defects or roughness); immersion in aliquid, possibly followed by heating (to form a coating, or a reaction product in casethe liquid is reactive); immersion in a solvent (to remove contaminants such asgrease); subjecting the material to electrochemical oxidation (to form surface func-tional groups, surface roughness, etc.); and sandblasting (to roughen the surface).
Carbon (as in carbon fibers) can be modified by heating in air, as the oxygen inthe air reacts with the surface carbon atoms, thereby forming surface functionalgroups in the form of C–O and/or C=O. Similar effects can be attained by subjectingcarbon to electrochemical oxidation or to an oxygen plasma. Carbon can also bemodified by heating in CO2 gas, as the reaction
C + CO2 → 2CO
causes the conversion of solid carbon on the surface to CO gas, resulting in surfaceporosity — a form of carbon called activated carbon. Carbon can also be modifiedby immersion in silicon liquid to form SiC on the surface through the reaction
C + Si → SiC
It can also be modified by heating in silane (SiH4) gas to form SiC on the surfacethrough the reaction
C + SiH4 → SiC + H2
As carbon is typically either amorphous or partly crystalline, it can be modified byheating the surface in an inert atmosphere so that the surface crystallinity is increased —a process known as surface annealing. As sandblasting involves bombardment withabrasive particles, it cannot be used on surfaces of microscopic size (such as the surfaceof carbon fibers).
This chapter focuses on the surface modification of carbon fibers for use as areinforcement in composite materials. The fibers are also used in the activated formfor fluid purification by adsorption. In addition, carbon fibers are used as batteryelectrode materials and as materials for EMI shielding. Surface modification signif-icantly improves carbon fibers for all these applications, although the dominantapplication is reinforcement.
8.2 INTRODUCTION TO CARBON FIBER COMPOSITES
Composite materials are materials containing more than one phase such that thedifferent phases are artificially blended together. They are not multiphase materials
©2001 CRC Press LLC

in which the different phases are formed naturally by reactions, phase transforma-tions, or other phenomena.
A composite material typically consists of one or more fillers in a certain matrix.A carbon fiber composite is one in which at least one of the fillers is carbon fibers,either short or continuous, unidirectional or multidirectional, woven or nonwoven.The matrix is usually a polymer, a metal, a carbon, a ceramic, or a combination ofdifferent materials. Except for sandwich composites, the matrix is three-dimension-ally continuous, whereas the filler can be three-dimensionally discontinuous orcontinuous. Carbon fiber fillers are usually three-dimensionally discontinuous unlessthe fibers are three-dimensionally interconnected by weaving or by the use of abinder such as carbon.
The high strength and modulus of carbon fibers makes them useful as a rein-forcement for polymers, metals, carbons, and ceramics, even though they are brittle.Effective reinforcement requires good bonding between the fibers and the matrix,especially for short fibers. For a unidirectional composite, the longitudinal tensilestrength is quite independent of the fiber-matrix bonding, but the transverse tensilestrength and the flexural strength increase with increasing fiber-matrix bonding. Onthe other hand, excessive fiber-matrix bonding can cause a composite with a brittlematrix (e.g., carbon and ceramics) to become more brittle. The strong fiber-matrixbonding causes cracks to propagate straightly in the direction perpendicular to thefiber-matrix interface without being deflected to propagate along this interface. Inthe case of a composite with a ductile matrix (metals and polymers), a crack initiatingin the brittle fiber tends to be blunted when it reaches the ductile matrix, even whenthe fiber-matrix bonding is strong. Therefore, an optimum degree of fiber-matrixbonding is needed for brittle-matrix composites, whereas a high degree of fiber-matrix bonding is preferred for ductile-matrix composites.
The mechanisms of fiber-matrix bonding include chemical bonding, van derWaals bonding, and mechanical interlocking. Chemical bonding gives the largestbonding force, provided the density of chemical bonds across the fiber-matrix inter-face is sufficiently high. This density can be increased by chemical treatments ofthe fibers or by sizings on the fibers. Mechanical interlocking between the fibersand the matrix is an important contribution to the bonding if the fibers form a three-dimensional network. Otherwise, the fibers should have a rough surface in order fora small degree of mechanical interlocking to take place.
Both chemical and van der Waals bonding require the fibers to be in intimatecontact with the matrix. For intimate contact to take place, the matrix or matrixprecursor must be able to wet the surfaces of the carbon fibers during its infiltrationinto the carbon fiber preform. Chemical treatments and coatings can be applied tothe fibers to enhance wetting. The choice of treatment or coating depends on thematrix. Another way to enhance wetting is to use high pressure during infiltration.A third method is to add a wetting agent to the matrix or matrix precursor beforeinfiltration. As the wettability may vary with temperature, the infiltration temperaturecan be chosen to enhance wetting.
The occurrence of a reaction between the fibers and the matrix helps the wettingand bonding between the fibers and the matrix. An excessive reaction degrades thefibers, and the reaction product(s) may be undesirable for the mechanical, thermal,
©2001 CRC Press LLC

or moisture resistance properties of the composite. An optimum amount of reactionis preferred.
Carbon fibers are electrically and thermally conductive, in contrast to the non-conducting nature of polymer and ceramic matrices. Therefore, carbon fibers canserve not only as a reinforcement, but also as an additive for enhancing electricalor thermal conductivity. Furthermore, carbon fibers have nearly zero coefficient ofthermal expansion, so they can also serve as an additive for lowering thermalexpansion. The combination of high thermal conductivity and low thermal expansionmakes carbon fiber composites useful for heat sinks in electronics, and for spacestructures that require dimensional stability. As the thermal conductivity of carbonfibers increases with the degree of graphitization, applications requiring a highthermal conductivity should use the graphitic fibers, such as high-modulus pitch-based fibers and vapor-grown carbon fibers.
Carbon fibers are more cathodic than practically any metal, so in a metal matrix,a galvanic couple is formed with the metal as the anode. This causes corrosion ofthe metal. The corrosion product tends to be unstable in moisture and causes pitting,which aggravates corrosion. To alleviate this problem, carbon fiber metal-matrixcomposites are often coated.
Carbon is the matrix that is most compatible with carbon fibers. The carbonfibers in a carbon-matrix composite (called carbon-carbon composite) serve tostrengthen the composite, as the carbon fibers are much stronger than the carbonmatrix because of the crystallographic texture in each fiber. Moreover, the carbonfibers serve to toughen the composite, as debonding between the fibers and thematrix provides a mechanism for energy absorption during mechanical deformation.In addition to having attractive mechanical properties, carbon-carbon compositesare more thermally conductive than carbon fiber polymer-matrix composites. How-ever, at elevated temperatures (above 320°C), carbon-carbon composites degradedue to the oxidation of carbon (especially the carbon matrix), which forms CO2 gas.To alleviate this problem, carbon-carbon composites are coated.
Carbon fiber ceramic-matrix composites are more oxidation resistant than car-bon-carbon composites. The most common form of such composites is carbon fiber-reinforced concrete. Although the oxidation of carbon is catalyzed by an alkalineenvironment and concrete is alkaline, the chemical stability of carbon fibers inconcrete is superior to that of competitive fibers, such as polypropylene, glass, andsteel. Composites containing carbon fibers in more advanced ceramic matrices (suchas SiC) are rapidly being developed.
Carbon fiber composites are most commonly fabricated by the impregnation ofthe matrix or matrix precursor in the liquid state into the fiber preform, which isusually in the form of a woven fabric. In the case of composites in the shape oftubes, the fibers may be impregnated in the form of a continuous bundle from aspool and, subsequently, the bundles may by wound on a mandrel. Instead ofimpregnation, the fibers and matrix material may be intermixed in the solid state bycommingling carbon fibers and matrix fibers, by coating the carbon fibers with thematrix material, by sandwiching carbon fibers with foils of the matrix material, orin other ways. After impregnation or intermixing, consolidation is carried out, oftenunder heat and pressure.
©2001 CRC Press LLC

Because of the decreasing price of carbon fibers, the applications of carbon fibercomposites are rapidly widening to include the aerospace, automobile, marine,construction, biomedical, and other industries. This situation poses an unusualdemand on research and development in the field of carbon fiber composites.
8.3 SURFACE MODIFICATION OF CARBON FIBERS FOR POLYMER-MATRIX COMPOSITES
Polymer-matrix composites are much easier to fabricate than metal-matrix, carbon-matrix, and ceramic-matrix composites, whether the polymer is a thermoset or athermoplastic. This is because of the relatively low processing temperatures requiredfor fabricating polymer-matrix composites. For thermosets, such as epoxy, phenolic,and furfuryl resin, the processing temperature ranges from room temperature toabout 200°C; for thermoplastics, such as polyimide (PI), polyethersulfone (PES),polyetheretherketone (PEEK), polyetherimide (PEI), and polyphenyl sulfide (PPS),the processing temperature ranges from 300 to 400°C.
Thermosets (especially epoxy) have long been used as polymer matrices forcarbon fiber composites. During curing, usually performed in the presence of heatand pressure, a thermoset resin hardens gradually due to the completion of poly-merization and the cross-linking of the polymer molecules. Thermoplastics haverecently become important because of their greater ductility and processing speedcompared to thermosets, and the recent availability of thermoplastics that can with-stand high temperatures. The higher processing speed of thermoplastics is due tothe fact that thermoplastics soften immediately upon heating above the glass tran-sition temperature (Tg), and the softened material can be shaped easily. Subsequentcooling completes the processing. In contrast, the curing of a thermoset resin is areaction that occurs gradually.
Epoxy is by far the most widely used polymer matrix for carbon fibers. Tradenames of epoxy include Epon®, Epirez®, and Araldite®. Epoxy has an excellentcombination of mechanical properties and corrosion resistance, is dimensionallystable, exhibits good adhesion, and is relatively inexpensive. Moreover, the lowmolecular weight of uncured epoxide resins in the liquid state results in exceptionallyhigh molecular mobility during processing. This mobility enables the resin to quicklywet the surface of carbon fiber, for example.
Epoxy resins are characterized by having two or more epoxide groups permolecule. The chemical structure of an epoxide group is:
The mers (repeating units) of typical thermoplasts used for carbon fibers areshown below, where Be = benzene ring.
O
CH2 C
H
©2001 CRC Press LLC

The properties of the above thermoplastics are listed in Table 8.1.1-3 In contrast,epoxies have tensile strengths of 30–100 MPa, moduli of elasticity of 2.8–3.4 GPa,ductilities of 0–6%, and a density of 1.25 g/cm3. Thus, epoxies are much more brittlethan PES, PEEK, and PEI. In general, the ductility of a semicrystalline thermoplasticdecreases with increasing crystallinity. For example, the ductility of PPS can rangefrom 2 to 20%, depending on the crystallinity.4 Another major difference betweenthermoplastics and epoxies lies in the higher processing temperatures of thermo-plastics (300–400°C).
Surface treatments of carbon fibers are essential for improving the bondingbetween the fibers and the polymer matrix. They involve oxidation treatments andthe use of coupling agents, wetting agents, and/or sizings (coatings). Carbon fibersneed treatment for both thermosets and thermoplastics. As the processing tempera-ture is usually higher for thermoplastics than thermosets, the treatment must bestable to a higher temperature (300–400°C) when a thermoplastic is used.
Oxidation treatments can be applied by gaseous, solution, electrochemical, andplasma methods. Oxidizing plasmas include those involving oxygen,5-8 CO2,9 andair.5,10 The resulting oxygen-containing functional groups (hydroxyl, ketone, andcarboxyl groups) on the fiber surface cause improvement in the wettability of thefiber, and in fiber-matrix adhesion. The consequence is enhancement of the inter-laminar shear strength (ILSS) and flexural strength. Other plasmas (not necessarilyoxidizing) that are effective involve nitrogen,5 acrylonitrile,5 and trimethyl silane.11
O H O H
O
C
C C
C
NNPI
PEEK
PPS
PES
PEI
H H
H O
O
O Be Be BeO
O
O
O
O
OO
O
O
C
CH3
CH3
C
CH
H
N
C
C
N
O SBe
Be S
Be
C
H
©2001 CRC Press LLC

Akin to plasma treatment is ion beam treatment, which involves oxygen or nitrogenions.12 Plasma treatments are useful for epoxy as well as thermoplastic matrices.6,13-16
Oxidation by gaseous methods includes the use of oxygen gas containing ozone.17
Oxidation by solution methods involves wet oxidation,18,19 such as acid treat-ments.6,20,21 Oxidation by electrochemical methods includes the use of ammoniumsulfate solutions,22 a diammonium hydrogen phosphate solution containing ammo-nium rhodanide,23 ammonium bicarbonate solutions,24,25 a phosphoric acid solution,26
and other aqueous electrolytes.27-30 In general, the various treatments provide chem-ical modification of the fiber surface in addition to removal of a loosely adherentsurface layer.31-36 More severe oxidation treatments serve to roughen the fiber surface,enhancing the mechanical interlocking between the fibers and the matrix.37,38
Table 8.239 shows the effect of gaseous and solution oxidation treatments on themechanical properties of high-modulus carbon fibers and their epoxy-matrix com-posites. The treatments degrade the fiber properties but improve the compositeproperties. The most effective treatment in Table 8.2 is refluxing in a 10%NaClO3/25% H2SO4 mixture for 15 min, as this treatment results in a fiber weightloss of 0.2%, a fiber tensile strength loss of 2%, a composite flexural strength gainof 5%, and a composite interlaminar shear strength (ILSS) gain of 91%. Epoxy-embedded single fiber tensile testing showed that anodic oxidation of pitch-basedcarbon fibers in ammonium sulfate solutions increased the interfacial shear strengthby 300%.40 As the modulus of the fiber increases, progressively longer treatmenttimes are required to attain the same improvement in ILSS. Although the treatmentincreases ILSS, it decreases the impact strength, so treatment time must be carefullycontrolled in order to achieve a balance in properties. The choice of treatment timealso depends on the particular fiber-resin combination used. For a particular treat-ment, as the modulus of the fiber increases, the treatment’s positive effect on theILSS and its negative effect on the impact strength become more severe.39
TABLE 8.1Properties of Thermoplastics for Carbon Fiber Polymer-Matrix Composites
PES PEEK PEI PPS PI
Tg (°C) 230a 170a 225a 86a 256b
Decomposition temperature (°C) 550a 590a 555a 527a 550b
Processing temperature (°C) 350a 380a 350a 316a 304b
Tensile strength (MPa) 84c 70c 105c 66c 138b
Modulus of elasticity (GPa) 2.4c 3.8c 3.0c 3.3c 3.4b
Ductility (% elongation) 30–80c 50–150c 50–65c 2c 5b
Izod impact (ft lb/in.) 1.6c 1.6c 1c <0.5c 1.5c
Density (g/cm3) 1.37c 1.31c 1.27c 1.3c 1.37b
a From Ref. 1b From Ref. 2c From Ref. 3
©2001 CRC Press LLC

Less common methods of modification of the carbon fiber surface involve usinggamma-ray radiation for surface oxidation,41 and applying coatings by electrochem-ical polymerization (polyphenylene oxide, PPO, as a coating),42-45 plasma polymer-ization,43,44,46-49 vapor deposition polymerization,50 and other polymerization tech-niques.51-54 A relatively simple coating technique is solution dipping,43 as in the caseof coating with polyurethane.55 Tough, compliant thermoplastic coatings,56 such aspolyurethane,55 silicone,57,58 and polyvinyl alcohol59 are attractive for enhancing thetoughness of composites. Other thermoplastic coatings, such as polyetherimide(PEI), improve epoxy matrix properties through diffusion into the epoxy matrix.60
Still other coatings serve as coupling agents between the fiber and the matrix becauseof the presence of reactive functional groups, such as epoxy groups61 and aminegroups.62 Metal (e.g., nickel and copper) coatings are used not only for enhancingthe electrical properties,63,64 but also for improving the adhesion between fiber andthe epoxy matrix.65
Commercial carbon fibers are surface treated to enhance the bonding with epoxy,though the surface treatment is proprietary. Table 8.366 shows the effect of a surfacetreatment on the interfacial shear strength for PAN-based carbon fibers manufacturedby Hercules. Fibers designated AS-1 and AS-4 are typical Type II intermediate strain
TABLE 8.2Effects of Various Surface Treatments on Properties of High-Modulus Carbon Fibers and Their Epoxy-Matrix Composites (From Ref. 39)
Fiber Properties Composite Properties
Fiber TreatmentWt. Loss
(%)
Tensile Strength Loss (%)
Flexural Strength Loss (%)
ILSS Gain (%)
400°C in air (30 min) 0 0 0 18500°C in air (30 min) 0.4 6 12 50600°C in air (30 min) 4.5 50 Too weak
to test—
60% HNO3 (15 min) 0.2 0 8 115.25% NaOCl (30 min) 0.4 1.5 5 3010–15% NaOCl (15 min) 0.2 0 8 615% HClO4 (15 min) 0.2 0 12 05% KMnO4/10% NaOH (15 min) 0.4 0 15 195% KMnO4/10% H2SO4 (15 min) 6.0(+) 17 13 9510% H2O2/20% H2SO4 (15 min) 0.1 5 14 042% HNO3/30% H2SO4 (15 min) 0.1 0 4(+) 010% NaClO3/15% NaOH (15 min) 0.2 0 12 1210% NaClO3/25% H2SO4 (15 min) 0.2 2 5(+) 9115% NaClO3/40% H2SO4 (15 min) 0.7 4 15 10810% Na2Cr2O7/25% H2SO4 (15 min) 0.3 8 15(+) 1815% Na2Cr2O7/40% H2SO4 (15 min) 1.7 27 31 18
Note: All liquid treatments at reflux temperature.
©2001 CRC Press LLC

fibers, whereas AU-1 and AU-4 are the untreated analogs of AS-1 and AS-4, respec-tively. The interfacial shear strength was determined from the critical shear transferlength, i.e., the length of the fiber fragments after fracture of a single fiber pulledin tension while being encapsulated in epoxy. Surface treatment increased the inter-facial shear strength by 54 and 65% for AS-1 and AS-4, respectively.66
Table 8.466 shows the atomic surface concentrations of AS-1 and AS-4 fibers,as determined by x-ray photoelectron spectroscopy. The atomic surface concentra-tions are similar for AS-1 and AS-4, indicating that the superior interfacial shearstrength of AS-1 compared to AS-4 is not due to a difference in surface composition.On the other hand, scanning electron microscopy shows that the surface of AS-1 iscorrugated, whereas that of AS-4 is smooth. The superior interfacial shear strengthof AS-1 is attributed to its surface morphology, which increases its surface area andenhances the mechanical interlocking between the fiber and the matrix.66
Although surface treatments of carbon fibers result in some degree of oxidation,which places oxygen on the surface in an acidic form, the treatments themselvesproduce little acidity. Surface acidification is not desirable because it is accompaniedby surface degradation.67
The oxidation treatments approximately double the surface concentration ofoxygen. Functional groups on the fiber surface and at 500 Å below the surface arelisted below in relative order of abundance.
TABLE 8.3Interfacial Shear Strength of Carbon Fibers in an Epoxy Matrix (From Ref 66)
Fiber Interfacial Shear Strength (MPa)
AU-1 48AS-1 74AU-4 37AS-4 61
TABLE 8.4Atomic Surface Concentrations of the Carbon Fibers of Table 8.3 (From Ref. 66)
Atomic Percent
Fiber C1s O1s N1s S2p NaKLL
AS-1 84 11 4.3 0.2 1.0AS-4 83 12 4.0 0.2 0.7
©2001 CRC Press LLC

At the surface
At 500 Å depth
The main functional groups produced are carbonyl, carboxyl, and hydroxyl.39
The oxygen concentration does not simply determine the increase in ILSS ortransverse tensile strength of the composites.14,23,24,26,27,31,37,39,44 Indeed, the additionof the surface chemical oxygen groups is believed to be responsible for only 10%of the increase in adhesion resulting from the treatment; only about 4% of the surfacesites of the carbon fibers are involved in chemical bonding with the epoxy and aminegroups of the polymer. Although the magnitude of the bond strength for chemicalbonds is very high, the quantity of bonds is low.68 On the other hand, eliminationof the functional groups on the treated fibers by diazomethane causes the ILSS todecrease toward the level of the untreated fibers,69 so the contribution of the func-tional groups to fiber-matrix adhesion cannot be neglected.
In addition to oxidation treatments, carbon fibers require the use of couplingagents, wetting agents, and/or sizings in order to improve the wetting of the fibersby the polymer, the adhesion between the fibers and the matrix, and the handleabilityof the fibers. As one agent often serves more than one function, the distinction amongcoupling agents, wetting agents, and sizings is often vague.
Coupling agents39,61,62,70 are mostly short-chain hydrocarbon molecules. One endof a molecule is compatible with or interacts with the polymer, while the other endinteracts with the fiber. A coupling agent molecule has the form X–R, where Xinteracts with the fiber and R is compatible with or interacts with the polymer.
Organosilanes are of the form R–Si–(OX) 3 , where X is methyl, ethyl, methox-yethyl, etc., and R is a suitable hydrocarbon chain. They are widely used as couplingagents between glass fibers and thermosets, as the –OX groups react with the –OHgroups on the glass surface.
However, organosilanes do not function for carbon, organic, or metallic fibers.
C O C OH = =C
O O
C C C1OHC S
COCS =COC
OO
O O
O O
Si - OH + XO - R Si - O - R + HOX
©2001 CRC Press LLC
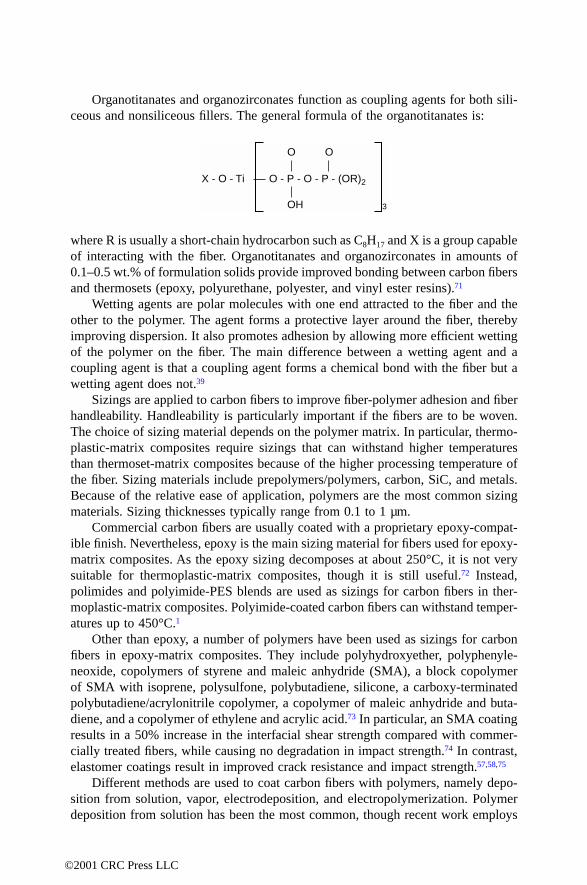
Organotitanates and organozirconates function as coupling agents for both sili-ceous and nonsiliceous fillers. The general formula of the organotitanates is:
where R is usually a short-chain hydrocarbon such as C8H17 and X is a group capableof interacting with the fiber. Organotitanates and organozirconates in amounts of0.1–0.5 wt.% of formulation solids provide improved bonding between carbon fibersand thermosets (epoxy, polyurethane, polyester, and vinyl ester resins).71
Wetting agents are polar molecules with one end attracted to the fiber and theother to the polymer. The agent forms a protective layer around the fiber, therebyimproving dispersion. It also promotes adhesion by allowing more efficient wettingof the polymer on the fiber. The main difference between a wetting agent and acoupling agent is that a coupling agent forms a chemical bond with the fiber but awetting agent does not.39
Sizings are applied to carbon fibers to improve fiber-polymer adhesion and fiberhandleability. Handleability is particularly important if the fibers are to be woven.The choice of sizing material depends on the polymer matrix. In particular, thermo-plastic-matrix composites require sizings that can withstand higher temperaturesthan thermoset-matrix composites because of the higher processing temperature ofthe fiber. Sizing materials include prepolymers/polymers, carbon, SiC, and metals.Because of the relative ease of application, polymers are the most common sizingmaterials. Sizing thicknesses typically range from 0.1 to 1 µm.
Commercial carbon fibers are usually coated with a proprietary epoxy-compat-ible finish. Nevertheless, epoxy is the main sizing material for fibers used for epoxy-matrix composites. As the epoxy sizing decomposes at about 250°C, it is not verysuitable for thermoplastic-matrix composites, though it is still useful.72 Instead,polimides and polyimide-PES blends are used as sizings for carbon fibers in ther-moplastic-matrix composites. Polyimide-coated carbon fibers can withstand temper-atures up to 450°C.1
Other than epoxy, a number of polymers have been used as sizings for carbonfibers in epoxy-matrix composites. They include polyhydroxyether, polyphenyle-neoxide, copolymers of styrene and maleic anhydride (SMA), a block copolymerof SMA with isoprene, polysulfone, polybutadiene, silicone, a carboxy-terminatedpolybutadiene/acrylonitrile copolymer, a copolymer of maleic anhydride and buta-diene, and a copolymer of ethylene and acrylic acid.73 In particular, an SMA coatingresults in a 50% increase in the interfacial shear strength compared with commer-cially treated fibers, while causing no degradation in impact strength.74 In contrast,elastomer coatings result in improved crack resistance and impact strength.57,58,75
Different methods are used to coat carbon fibers with polymers, namely depo-sition from solution, vapor, electrodeposition, and electropolymerization. Polymerdeposition from solution has been the most common, though recent work employs
X - O - Ti O - P - O - P - (OR)2
O
OH
O
3
©2001 CRC Press LLC
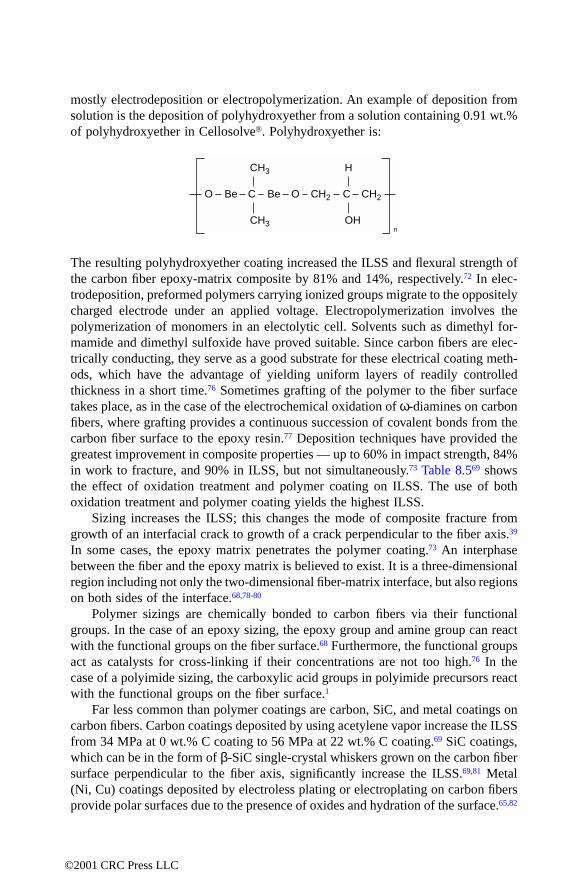
mostly electrodeposition or electropolymerization. An example of deposition fromsolution is the deposition of polyhydroxyether from a solution containing 0.91 wt.%of polyhydroxyether in Cellosolve®. Polyhydroxyether is:
The resulting polyhydroxyether coating increased the ILSS and flexural strength ofthe carbon fiber epoxy-matrix composite by 81% and 14%, respectively.72 In elec-trodeposition, preformed polymers carrying ionized groups migrate to the oppositelycharged electrode under an applied voltage. Electropolymerization involves thepolymerization of monomers in an electolytic cell. Solvents such as dimethyl for-mamide and dimethyl sulfoxide have proved suitable. Since carbon fibers are elec-trically conducting, they serve as a good substrate for these electrical coating meth-ods, which have the advantage of yielding uniform layers of readily controlledthickness in a short time.76 Sometimes grafting of the polymer to the fiber surfacetakes place, as in the case of the electrochemical oxidation of ω-diamines on carbonfibers, where grafting provides a continuous succession of covalent bonds from thecarbon fiber surface to the epoxy resin.77 Deposition techniques have provided thegreatest improvement in composite properties — up to 60% in impact strength, 84%in work to fracture, and 90% in ILSS, but not simultaneously.73 Table 8.569 showsthe effect of oxidation treatment and polymer coating on ILSS. The use of bothoxidation treatment and polymer coating yields the highest ILSS.
Sizing increases the ILSS; this changes the mode of composite fracture fromgrowth of an interfacial crack to growth of a crack perpendicular to the fiber axis.39
In some cases, the epoxy matrix penetrates the polymer coating.73 An interphasebetween the fiber and the epoxy matrix is believed to exist. It is a three-dimensionalregion including not only the two-dimensional fiber-matrix interface, but also regionson both sides of the interface.68,78-80
Polymer sizings are chemically bonded to carbon fibers via their functionalgroups. In the case of an epoxy sizing, the epoxy group and amine group can reactwith the functional groups on the fiber surface.68 Furthermore, the functional groupsact as catalysts for cross-linking if their concentrations are not too high.76 In thecase of a polyimide sizing, the carboxylic acid groups in polyimide precursors reactwith the functional groups on the fiber surface.1
Far less common than polymer coatings are carbon, SiC, and metal coatings oncarbon fibers. Carbon coatings deposited by using acetylene vapor increase the ILSSfrom 34 MPa at 0 wt.% C coating to 56 MPa at 22 wt.% C coating.69 SiC coatings,which can be in the form of β-SiC single-crystal whiskers grown on the carbon fibersurface perpendicular to the fiber axis, significantly increase the ILSS.69,81 Metal(Ni, Cu) coatings deposited by electroless plating or electroplating on carbon fibersprovide polar surfaces due to the presence of oxides and hydration of the surface.65,82
O Be BeC O CH2
CH3
CH3
CH2C
H
OHn
©2001 CRC Press LLC

8.4 SURFACE MODIFICATION OF CARBON FIBERS FOR METAL-MATRIX COMPOSITES
The difficulty molten metals have in wetting the surface of carbon fibers complicatesthe fabrication of metal-matrix composites. This difficulty is particularly severe forhigh-modulus carbon fibers (e.g., BP Amoco’s Thornel® P-100) that have graphiteplanes mostly aligned parallel to the fiber surface. The edges of the graphite planesare more reactive with the molten metals than the graphite planes themselves. As aresult, low-modulus carbon fibers are more reactive and are wetted more easily bythe molten metals. Although this reaction between the fibers and the metal helps thewetting, it produces a brittle carbide and degrades the strength of the fibers.
To enhance wetting or other characteristics, carbon fibers are coated by a metal,a ceramic, or carbon. The metals include nickel83,84 and silver.85,86 Nickel coatingcan be attained by either electroplating or carbonyl decomposition. The ceramicsinclude TiB2,87,88 SiC,89-94 Al2O3,95,96 TiC,94 B4C3,94 and ZrO2.97 The SiC coating canbe produced by using a polycarbosilane solution.90,91,93 which is subsequently pyro-lyzed. However, it can also be produced by reactive chemical vapor deposition(RCVD) using SiCl4 gas.94 Zirconia (ZrO2) coating can be produced from a zirco-nium oxychloride solution by dip-coating and heating.97 The carbon coating ispyrolytic carbon84,87-89 obtained by chemical vapor deposition.
A double layer coating comprising a carbon inner layer and an outer layer whichis either TiB2
87,88 or SiC89 is particularly attractive because the carbon layer deviatescracks, while the ceramic layer enhances wettability with liquid metals. Moreover,TiB2 protects the fiber from the reaction with liquid aluminum that forms brittleAl4C3. A three-layer coating98 comprising an inner carbon layer, an outer siliconlayer, and an intermediate gradient layer (gradient in SixCy composition rangingfrom pure C at the interface with the carbon inner layer to pure Si at the interfacewith the silicon outer layer) is also attractive. The gradient layer serves as a wettingagent, a diffusion/reaction barrier, and a releaser of residual thermal stress, andallows tailoring of the interfacial shear strength.
TABLE 8.5Effect of Oxidation Treatment and Polymer Coating on ILSS of Composite (From Ref. 69)
OxidationPolymerCoating
Polymer(%)
Density(g/cm3)
ILSS(MPa)
None None — 1.28 16.260% HNO3, 24 h. None — 1.29 24.3
PVA 7 1.31 42.8PVC 7 1.31 42.1Rigid polyurethane 3 1.27 40.7PAN 7 1.27 16.6
©2001 CRC Press LLC

Another method involves treating the carbon fiber with a K2ZrF6 solution, whichenhances the wettability with liquid aluminum because of the reaction betweenK2ZrF6 and Al.99,100
In the case of Mg as the metal matrix, SiO2 is the most common coating, as itis air-stable and improves the wetting and bonding between fiber and liquid mag-nesium.101 A three-layer coating involving carbon as the inner layer, SiO2 as theouter layer, and SixCy as the gradient intermediate layer is particularly attractive.102,103
The SiO2 coating can be obtained by passing the fibers through a toluene solutioncontaining a silicon-based organometallic compound and chloride, followed byhydrolysis and pyrolysis of the organometallic compound.101 Another ceramic coat-ing used for Mg-matrix composites is TiN, formed by chemical vapor depositionfrom TiCl4 and N2 gases.104
Metals used as coatings include Ni, Cu, and Ag; they generally result in com-posites of strengths much lower than those predicted by the rule of mixtures (ROM).In the case of nickel-coated and copper-coated carbon fibers in an aluminum matrix,metal aluminides (Al3M) form and embrittle the composites. In the case of nickel-coated carbon fibers in a magnesium matrix, nickel reacts with magnesium to formNi/Mg compounds and a low-melting (508°C) eutectic.105 On the other hand, copper-coated fibers are suitable with copper,106-110 tin, or other metals as the matrix. Ametal coating that is particularly successful involves sodium, which wets carbonfibers and coats them with a protective intermetallic compound by reaction with oneor more other molten metals (e.g., tin). This is called the sodium process.111,112 Arelated process immerses the fibers in liquid NaK.113 However, these processesinvolving sodium suffer from sodium contamination of the fibers, probably due tothe intercalation of sodium into graphite.114 Nevertheless, aluminum-matrix com-posites containing unidirectional carbon fibers treated by the sodium process exhibittensile strengths close to those calculated by using the rule of mixtures, indicatingthat the fibers are not degraded by the sodium process.114
Ceramics used as coatings on carbon fibers include TiC, SiC, B4C, TiB2, TiN,K2ZrF6, and ZrO2. Methods used to deposit the ceramics include (1) reaction of thecarbon fibers with a molten metal alloy, called the liquid metal transfer agent (LMTA)technique; (2) chemical vapor deposition (CVD); and (3) solution coating.
The LMTA technique involves immersing the fibers in a melt of copper or tin(called a liquid metal transfer agent, which must not react with carbon) in which arefractory element (e.g., W, Cr, Ti) is dissolved, and subsequent removal of thetransfer agent from the fiber surface by immersion in liquid aluminum. For example,to form a TiC coating, the alloy can be Cu–10% Ti at 1050°C or Sn–1% Ti at900–1055°C. In particular, by immersing the fibers in Sn–1% Ti at 900–1055°C for0.25–10 min, a 0.1 µm layer of TiC is formed on the fibers, although they are alsosurrounded by the tin alloy. Subsequent immersion for 1 min in liquid aluminumcauses the tin alloy to dissolve in the liquid aluminum.115 The consequence is a wirepreform suitable for fabricating aluminum-matrix composites. Other than titaniumcarbide, tungsten carbide and chromium carbide have been formed on carbon fibersby the LMTA technique.
The CVD technique has been used for forming coatings of TiB2, TiC, SiC, B4C,and TiN. The B4C coating is formed by reactive CVD on carbon fibers, using a
©2001 CRC Press LLC

BCl3/H2 mixture as the reactant.116 The TiB2 deposition uses TiCl4 and BCl3 gases,which are reduced by Zn vapor. The TiB2 coating is particularly attractive becauseof exceptionally good wetting between TiB2 and molten aluminum. During compos-ite fabrication, the TiB2 coating is displaced and dissolved in the matrix, while anoxide (γ-Al2O3 for a pure aluminum matrix, MgAl2O4 spinel for a 6061 aluminummatrix) is formed between the fiber and the matrix. The oxygen for the oxideformation comes from the sizing on the fibers; the sizing is not completely removedbefore processing.117 The oxide layer serves as a diffusion barrier to aluminum, butallows diffusion of carbon, thereby limiting Al4C3 growth to the oxide-matrix inter-face.118 Moreover, the oxide provides bonding between the fiber and the matrix.Because of the reaction at the interface between the coating and the fiber, the fiberstrength is degraded after coating. To alleviate this problem, a layer of pyrolyticcarbon is deposited between the fiber and the ceramic layer.119 The CVD processinvolves high temperatures, e.g., 1200°C for SiC deposition using CH3SiCl4;120 thishigh temperature degrades the carbon fibers. Another problem of the CVD processis the difficulty of obtaining a uniform coating around the circumference of eachfiber. Moreover, it is expensive and causes the need to scrub and dispose most ofthe corrosive starting material, as most of the starting material does not react at all.The most serious problem with the TiB2 coating is that it is not air stable. It cannotbe exposed to air before immersion in the molten metal or wetting will not takeplace. This limits the shape of materials that can be fabricated, especially since thewire preforms are not very flexible.117
A high compliance (or a low modulus) is preferred for the coating in order toincrease the interface strength. An increase in the interface (or interphase) strengthresults in an increase in the transverse strength. The modulus of SiC coatings canbe varied by controlling the plasma voltage in plasma-assisted chemical vapordeposition (PACVD). Modulus values in a range from 19 to 285 GPa have beenobtained in PACVD SiC, compared to a value of 448 GPa for CVD SiC. Unidirec-tional carbon fiber (Thornel® P-55) aluminum-matrix composites in which the fibersare coated with SiC exhibit an interfacial strength and a transverse strength thatincrease with decreasing modulus of the SiC coating.121-123
The most attractive coating technique developed to date is the solution coatingmethod. In the case of using an organometallic solution, fibers are passed through atoluene solution containing an organometallic compound, followed by hydrolysis orpyrolysis of the organometallic compounds to form the coating. Thus, the fibers arepassed sequentially through a furnace in which the sizing on the fibers is vaporized,followed by an ultrasonic bath containing an organometallic solution. The coatedfibers are then passed through a chamber containing flowing steam in which theorganometallic compound on the fiber surface is hydrolyzed to oxide, and finallythrough an argon atmosphere drying furnace in which any excess solvent or water isvaporized and any unhydrolyzed organometallic is pyrolyzed.117 In contrast to theTiB2 coatings, the SiO2 coatings formed by organometallic solution coating are airstable.
The organometallic compounds used are alkoxides, in which metal atoms arebound to hydrocarbon groups by oxygen atoms. The general formula is M(OR)x,where R is any hydrocarbon group and x is the oxidation state of the metal atomM. When exposed to water vapor, these alkoxides hydrolyze.117
©2001 CRC Press LLC

For example, the alkoxide tetraethoxysilane (also called tetraethylorthosilicate) ishydrolyzed by water as follows:117
Si(OC2H5)4 + 2H2O → SiO2 + 4C2H5OH
Alkoxides can also be pyrolyzed to yield oxides, e.g., Reference 117:
Si(OC2H5)4 → SiO2 + 2C2H5OH + 2C2H4
Most alkoxides can be dissolved in toluene. By controlling the solution concen-tration and the time and temperature of immersion, it is possible to control theuniformity and thickness of the resulting oxide coating. The thickness of the oxidecoatings on the fibers varies from 700 to 1500 Å. The oxide is amorphous andcontains carbon, which originates in the carbon fiber.
Liquid magnesium wets SiO2-coated low-modulus carbon fibers (e.g., T-300)and infiltrates the fiber bundles due to reactions between the molten magnesium andthe SiO2 coating. The reactions include the following.117
2Mg + SiO2 → 2MgO + Si ∆G°670°C = –76 kcal
MgO + SiO2 → MgSiO3 ∆G°670°C = –23 kcal
2Mg + 3SiO2 → 2MgSiO3 + Si ∆G°670°C = –122 kcal
2MgO + SiO2 → Mg2SiO4 ∆G°670°C = –28 kcal
2Mg + 2SiO2 → Mg2SiO4 + Si ∆G°670°C = –104 kcal
The interfacial layer between the fiber and the Mg matrix contains MgO andmagnesium silicates. However, immersion of SiO2-coated high-modulus fibers (e.g.,P-100) in liquid magnesium causes the oxide coating to separate from the fibersbecause of the poor adherence of the oxide coating to the high-modulus fibers. Thisproblem can be solved by first depositing a thin amorphous carbon coating on thefibers by passing the fiber bundles through a toluene solution of petroleum pitch,followed by evaporation of the solvent and pyrolysis of the pitch.
The most effective air-stable coating for carbon fibers used in aluminum-matrixcomposites is a mixed boron-silicon oxide applied from organometallic solutions.117
Instead of SiO2, TiO2 can be deposited on carbon fibers by the organometallicsolution method. For TiO2, the alkoxide can be titanium isopropoxide.124
SiC coatings can be formed by using polycarbosilane (dissolved in toluene) asthe precursor, which is pyrolyzed to SiC. These coatings are wet by molten coppercontaining a small amount of titanium because of a reaction between SiC and Ti toform TiC.117
M OR( )xx2---H2O+ MOx 2⁄ xROH+→
©2001 CRC Press LLC

Instead of using an organometallic solution, another method uses an aqueoussolution of a salt. For example, the salt, potassium zirconium hexafluoride (K2ZrF6)or potassium titanium hexafluoride (K2TiF6), is used to deposit microcrystals ofK2ZrF6 or K2TiF6 on the fiber surface.117,125,126 These fluoride coatings are stable inair. The following reactions supposedly take place125 between K2ZrF6 and the alu-minum matrix:
3K2ZrF6 + 4Al → 6KF + 4AlF3 + 3Zr (1)
3Zr + 9Al → 3Al3Zr (2)
Zr + O2 → ZrO2 (3)
In the case of an Al–12 wt.% Si alloy (rather than pure Al) as the matrix, the followingreaction may also occur:126
Zr + 2Si → ZrSi2 (4)
The fluorides KF and AlF3 are thought to dissolve the thin layer of Al2O3 on theliquid aluminum surface, thus helping the liquid aluminum to wet the carbon fibers.Furthermore, reactions (1) and (2) are strongly exothermic and may cause a localtemperature increase near the fiber-matrix interface. The increased temperature prob-ably gives rise to a liquid phase at the fiber-matrix interface.125
Although the K2ZrF6 treatment causes the contact angle between carbon andliquid aluminum at 700–800°C to decrease from 160° to 60–75°C,78 it causesdegradation of the fiber tensile strength during aluminum infiltration.127
Another example of a salt solution coating method involves the use of zirconiumoxychloride (ZrOCl2).128 Dip-coating the carbon fibers in the salt solution and sub-sequently heating at 330°C cause the formation of a ZrO2 coating of less than 1 µmin thickness. The ZrO2 coating improves fiber-matrix wetting and reduces the fiber-matrix reaction in aluminum-matrix composites.
Instead of treating the carbon fibers, the wetting of the carbon fibers by moltenmetals can be improved by the addition of alloying elements into the molten metals.For aluminum as the matrix, effective alloying elements include Mg, Cu, and Fe.114
REFERENCES
1. W.-T. Whang and W.-L. Liu, SAMPE Q., 22(1), 3-9 (1990).2. D.C. Sherman, C.-Y. Chen, and J.L. Cercena, Proc. Int. SAMPE Symp. and Exhib.,
33, G. Carrillo, E.D. Newell, W.D. Brown, and P. Phelan, Eds., pp. 538-539 (1988).3. D.R. Askeland, The Science and Engineering of Materials, 2nd ed., PWS-Kent,
Boston, pp. 538-539 (1989).4. S.D. Mills, D.M. Lee, A.Y. Lou, D.F. Register, and M.L. Stone, Proc. 20th Int. SAMPE
Tech. Conf., pp. 263-270 (1988).5. G. Bogoeva-Gaceva, E. Maeder, L. Hauessler and A. Dekanski, Composites — Part
A: Applied Science and Manufacturing, 28(5), 445-452 (1997).
©2001 CRC Press LLC

6. J. Jang and H. Yang, J. Mater. Sci., 35(9), 2297-2303 (2000).7. G. Wu, C.-H. Hung and J.-C. Lu, International SAMPE Symposium & Exhibition,
44(I), 1090-1097 (1999).8. H. Zhuang and J.P. Wightman, J. Adhesion, 62(1-4), 213-245 (1997).9. R.E. Allred and W.C. Schimpf, J. Adhesion Sci. Tech., 8(4), 383-394 (1994).
10. G.J. Farrow, K.E. Atkinson, N. Fluck and C. Jones, Surf. Interface Anal., 23(5),313-318 (1995).
11. E.A. Friis, B. Kumar, F.W. Cooke and H.K. Yasuda, Proc. 1996 5th World Biomate-rials Congress, Vol. 1, p. 913 (1996).
12. S.-S. Lin and P.W. Yip, Proc. of the 1993 Fall Meeting, Interface Control of Electrical,Chemical, and Mechanical Properties Materials Research Society Symposium Pro-ceedings, Vol. 318, pp. 381-386 (1994).
13. N. Dilsiz, J. Adhesion Sci. Tech., 14(7), 975-987 (2000).14. M.C. Paiva, C.A. Bernardo and M. Nardin, Carbon, 38(9), 1323-1337 (2000).15. G. Akovali and N. Dilsiz, Polym. Eng. Sci., 36(8), 1081-1086 (1996).16. N. Chand, E. Schulz and G. Hinrichsen, J. Mater. Sci. Lett., 15(15), 1374-1375 (1996).17. T. Yoshikawa and A. Kojima, Quarterly Report of RTRI (Railway Technical Research
Institute) (Japan), 32(3), 190-199 (1991).18. P.W.M. Peters and H. Albertsen, J. Mater. Sci., 28(4), 1059-1066 (1993).19. H. Albertsen, J. Ivens, P. Peters, M. Wevers and I. Verpoest, Compos. Sci. Tech., 54(2),
133-145 (1995).20. L. Ibarra, A. Macias and E. Palma, J. Applied Polym. Sci., 61(13), 2447-2454 (1996).21. D. Cho, J. Mater. Sci. Lett., 15(20), 1786-1788 (1996).22. T.R. King, D.F. Adams and D.A. Buttry, Composites, 22(5), 380-387 (1991).23. E. Fitzer, N. Popovska and H.-P. Rensch, J. Adhesion, 36(2-3), 139-149 (1991).24. M.R. Alexander and F.R. Jones, Surf. Interface Anal., 22(1), 230-235 (1994).25. Fukunaga and S. Ueda, Compos. Sci. Tech., 60(2), 249-254 (2000).26. S.-J. Park and M.-H. Kim, J. Mater. Sci., 35(8), 1901-1905 (2000).27. Jones, Surf. Interface Anal., 20(5), 357-367 (1993).28. C.A. Baillie and M.G. Bader, J. Mater. Sci., 29(14), 3822-3836 (1994).29. J.A. Hrivnak and R.L. McCullough, J. Thermoplastic Compos. Mater., 9(4), 304-315
(1996).30. I.A. Rashkovan and Y.G. Korabel’nikov, Compos. Sci. Tech., 57(8), 1017-1022 (1997).31. G. Bogoeva-Gaceva, D. Burevski, A. Dekanski and A. Janevski, J. Mater. Sci., 30(13),
3543-3546 (1995).32. D.W. Dwight, Proc. 53rd Annual Technical Conf. — ANTEC, Vol. 2, pp. 2744-2747
(1995).33. N. Tsujioka, Z. Maekawa, H. Hamada and M. Hojo, Zairyo/J. Soc. Mater. Sci. (Japan),
46(2), 163-169 (1997).34. L. Ibarra and D. Panos, Polym. Int., 43(3), 251-259 (1997).35. L. Ibarra and D. Panos, J. Applied Polym. Sci., 67(10), 1819-1826 (1998).36. J.M.M. de Kok and T. Peijs, Composites — Part A: Applied Science and Manufac-
turing, 30(7), 917-932 (1999).37. P.W. Yip and S.S. Lin, Mater. Res. Soc. Symp. Proc., Vol. 170, C.G. Pantano and
E.J.H. Chen, Eds., pp. 339-344 (1990).38. T.C. Chang and B.Z. Jang, Mater. Res. Soc. Symp. Proc., Vol. 170, C.G. Pantano and
E.J.H. Chen, Eds., pp. 321-326 (1990).39. W.W. Wright, Compos. Polym., 3(4), 231-257 (1990).40. T.R. King, D.F. Adams, and D.A. Buttry, Composites, 22(5), 380-387 (1991).
©2001 CRC Press LLC

41. J. Tian, Q. Wang, S. Yang and Q. Xue, Appl. Math. Mech. (English Edition), 19(10),1-5 (1998).
42. J.A. King, D.A. Buttry and D.F. Adams, Polym. Compos., 14(4), 301-307 (1993).43. B. Harris, O.G. Braddell, D.P. Almond, C. Lefebvre and J. Verbist, J. Mater. Sci.,
28(12), 3353-3366 (1993).44. B. Harris, O.G. Braddell, C. Lefebvre and J. Verbist, Plast. Rubber Compos., 18(4),
221-240 (1992).45. F. Zhang and L. Hu, Fuhe Cailiao Xuebao/Acta Materiae Compositae Sinica, 14(2),
12-16 (1997).46. A.P. Kettle, F.R. Jones, M.R. Alexander, R.D. Short, M. Stollenwerk, J. Zabold, W.
Michaeli, W. Wu, E. Jacobs and I. Verpoest, Composites — Part A: Applied Scienceand Manufacturing, 29(3), 241-250 (1998).
47. N. Dilsiz and G. Akovali, Composite Interfaces, 3(5-6), 401-410 (1996).48. N. Dilsiz, E. Ebert, W. Weisweiler and G. Akovali, J. Colloid Interface Sci., 170(1),
241-248 (1995).49. R. Li, L. Ye and Y.-W. Mai, Composites — Part A: Applied Science and Manufac-
turing, 28(1), 73-86 (1997).50. J.P. Armistead and A.W. Snow, ASTM Special Technical Publication, (1290), 168-
181 (1996).51. T. Duvis, C.D. Papaspyrides and T. Skourlis, Compos. Sci. Tech., 48(1-4), 127-133
(1993).52. T. Skourlis, T. Duvis and C.D. Papaspyrides, Compos. Sci. Tech., 48(1-4), 119-125
(1993).53. Zheng, X. Wu and S. Li, Huadong Huagong Xueyuan Xuebao/J. East China Inst. of
Chem. Tech., 20(4), 485-491 (1994).54. P.C. Varelidis, R.L. McCullough and C.D. Papaspyrides, Compos. Sci. Tech., 59(12),
1813-1823 (1999).55. M. Tanoglu, G.R. Palmese, S.H. McKnight and J.W. Gillespie, Jr., Proc. 1998 56th
Annual Tech. Conf. — ANTEC, Vol. 2, pp. 2346-2350 (1998).56. V. Giurgiutiu, K.L. Reifsnider, R.D. Kriz, B.K. Ahn J.J. Lesko, Proc. 36th
AIAA/ASME/ASCE/AHS/ASC Structures, Structural Dynamics and Mater. Conf.and AIAA/ASME Adaptive Structures Forum, Vol. 1, pp. 453-469 (1995).
57. M. Labronici and H. Ishida, Compos. Interfaces, 5(3), 257-275 (1998).58. M. Labronici and H. Ishida, Compos. Interfaces, 5(2), 87-116 (1998).59. J.-K. Kim and Y.-W. Mai, Proc. Int. Conf. on Adv. Composite Mater., Minerals, Metals
& Materials Soc. (TMS), pp. 69-77 (1993).60. S. Shin and J. Jang, J. Mater. Sci., 35(8), 2047-2054 (2000).61. J. Gulyas, S. Rosenberger, E. Foldes and B. Pukanszky, Polym. Compos., 21(3),
387-395 (2000).62. J.A. King, D.A. Buttry and D.F. Adams, Polym. Compos., 14(4), 292-300 (1993).63. G. Lu, X. Li and H. Jiang, Compos. Sci. Tech., 56(2), 193-2000 (1996).64. F.A. Hussain and A.M. Zihlif, J. Thermoplastic Compos. Mater., 6(2), 120-129 (1993).65. Hage Jr., S.F. Costa and L.A. Pessan, J. Adhesion Sci. Tech., 11(12), 1491-1499
(1997).66. M.J. Rich and L.T. Drzal, J. Reinf. Plast. Compos., 7(2), 145-154 (1988).67. B.-W. Chun, C.R. Davis, Q. He and R.R. Gustafson, Carbon, 30(2), 177-187 (1992).68. L.T. Drzal, Vacuum, 41(7-9), 1615-1618 (1990).69. R. Yosomiya, K. Morimoto, A. Nakajima, Y. Ikada, and T. Suzuki, Eds., Adhesion
and Bonding in Composites, Marcel Dekker, New York, pp. 257-281 (1990).
©2001 CRC Press LLC
70. R. Yosomiya, K. Morimoto, A. Nakajima, Y. Ikada, and T. Suzuki, Eds., Adhesionand Bonding in Composites, Marcel Dekker, New York, pp. 109-154 (1990).
71. G. Sugerman, S.M. Gabayson, W.E. Chitwood, and S.J. Monte, Proc. 3rd Dev. Sci.Technol. Compos. Mater., Eur. Conf. Compos. Mater., A.R. Bunsell, P. Lamicq, andA. Massiah, Eds., Elsevier, London, pp. 51-56 (1989).
72. K.T. Kern, E.R. Long, Jr., S.A.T. Long, and W.L. Harries, Polym. Prepr., 31(1),611-612 (1990).
73. W.W. Wright, Compos. Polym., 3(5), 360-401 (1990).74. R.V. Subramanian, A.R. Sanadi, and A. Crasto, J. Adhes. Sci. Technol., 4(10), 329-346
(1990).75. S.H. Jao and F.J. McGarry, Proc. Int. SAMPE Tech. Conf. 22, L.D. Michelove, R.P.
Caruso, P. Adams, and W.H. Fossey, Jr., Eds., pp. 455-469 (1990).76. Sellitti, J.L. Koenig, and H. Ishida, Mater. Sci. Eng., A126, 235-244 (1990).77. Barbier, J. Pinson, G. Desarmot, and M. Sanchez, J. Electrochem. Soc., 137(6), 1757-
1764 (1990).78. L.T. Drzal, Mater. Sci. Eng., A126, 289-293 (1990).79. L.T. Drzal, Mater. Res. Soc. Symp. Proc., Vol. 170, C.G. Pantano and E.J.H. Chen,
Eds., pp. 275-283 (1990).80. L.T. Drzal, Treatise on Adhesion and Adhesives, Vol. 6, R.L. Patrick, Ed., Marcel
Dekker, New York, pp. 187-211 (1989).81. M.G. Harwell, D.E. Hirt, D.D. Edie, N. Popovska and G. Emig, Carbon, 38(8),
1111-1121 (2000).82. N.C.W. Judd, Br. Polym. J., 9(4), 272-277 (1977).83. T.F. Stephenson, J.A.E. Bell and J.R. Gordon, 3rd Int. SAMPE Metals and Metals
Processing Conf. and 24th Int. SAMPE Tech. Conf., Vol. 3, pp. 560-568 (1992).84. B. Wielage and A. Dorner, Compos. Sci. Tech., 59(8), 1239-1245 (1999).85. S.G. Warrier and R.Y. Lin, J. Mater. Sci., 28(18), 4868-4877 (1993).86. S.G. Warrier, C.A. Blue and R.Y. Lin, J. Mater. Sci., 28(3), 760-768 (1993).87. P. Bertrand, M.H. Vidal-Setif, R. Valle and R. Mevrel, J. Mater. Sci., 33(20), 5029-
5036 (1998).88. P. Bertrand, M.H. Vidal-Setif and R. Mevrel, Surf. Coat. Tech., 96(2-3), 283-292
(1997).89. O. Perez, G. Patriarche, M. Lancin and M.H. Vidal-Setif, J. de Physique I., 3(7), Pt.
3, 1693-1698 (1993).90. Y.-Q. Wang and B.-L. Zhou, Composites — Part A: Applied Science and Manufac-
turing, 27(12), 1139-1145 (1996).91. Y.-Q. Wang and B.-L. Zhou, J. Mater. Process. Tech., 73(1-3), 78-81 (1998).92. J. Wang, T. Hong, G. Li and P. Li, Composites — Part A: Applied Science and
Manufacturing, 28(11), 943-948 (1997).93. Y.-Q. Wang, Z.-M. Wang, J.-Y. Yang, F.-Q. Zhang, B.-L. Zhou, Compos. Manufac-
turing, 6(2), 103-106 (1995).94. H. Vincent, C. Vincent, M.P. Berthet, H. Mourichoux and J. Bouix, J. Less-Common
Met., 175(1), 37-58 (1991).95. Q. Zeng, J. Applied Polym. Sci., 70(1), 177-183 (1998).96. Y. Wang, J. Zheng, Z. Wang, B. Zhou and L. Zhou, Fuhe Cailiao Xuebao/Acta
Materiae Compositae Sinica, 12(3), 31-35 (1995).97. R.V. Subramanian and E.A. Nyberg, J. Mater. Res., 7(3), 677-688 (1992).98. J.K. Yu, H.L. Li and B.L. Shang, J. Mater. Sci., 29(10), 2641-2647 (1994).99. G. Zheng, X. Chen, Z. Shen and H. Du, Fuhe Cailiao Xuebao/Acta Materiae Com-
positae Sinica, 10(1), 57-63 (1993).
©2001 CRC Press LLC

100. X. Chen, G. Zhen and Z. Shen, J. Mater. Sci., 31(16), 4297-4302 (1996).101. R. Chen and X. Li, Compos. Sci. Tech., 49(4), 357-362 (1993).102. K. Zhang, Y. Wang and B. Zhou, Transactions of Nonferrous Metals Soc. of China,
7(3), 86-89 (1997).103. K. Zhang, Y.Q. Wang, B.L. Zhou, Y.H. Zhou and H.L. Li, Acta Metallurgica Sinica
(English Letters), 10(5), 398-402 (1997).104. N. Popovska, H. Gerhard, D. Wurm, S. Poscher, G. Emig and R.F. Singer, Mater.
Design, 18(4-6), 239-242 (1997).105. I.W. Hall, Metallography, 20(2), 237-246 (1987).106. D.A. Foster, Proc. Int. SAMPE Symp. and Exhib., 34, G.A. Zakrzewski, D. Mazenko,
S.T. Peters, and C.D. Dean, Eds., pp. 1401-1410 (1989).107. P. Sebo, Key Eng. Mater., 108-110, 315-322 (1995).108. Y.Z. Wan, Y.L. Wang, G.J. Li, H.L. Luo and G.X. Cheng, J. Mater. Sci. Lett., 16(19),
1561-1563 (1997).109. M. Jahazi and F. Jalilian, Compos. Sci. Tech., 59(13), 1969-1975 (1999).110. S. Sun and M. Zhang, Acta Metallurgica Sinica, 26(6), B433-B437 (1990).111. M.F. Amateau, J. Compos. Mater., 10, 279 (1976).112. D.M. Goddard, J. Mater. Sci., 13(9), 1841-1848 (1978).113. A.P. Levitt and H.E. Band, U.S. Patent 4,157,409 (1979).114. R. Yosomiya, K. Morimoto, A. Nakajima, Y. Ikada, and T. Suzuki, Eds., Adhesion
and Bonding in Composites, Marcel Dekker, New York, pp. 235-256 (1990).115. D.D. Himbeault, R.A. Varin, and K. Piekarski, Proc. Int. Symp. Process. Ceram. Met.
Matrix Compos., H. Monstaghaci, Ed., Pergamon, New York, pp. 312-323 (1989).116. H. Vincent, C. Vincent, J.P. Scharff, H. Mourichoux, and J. Bouix, Carbon, 30(3),
495-505 (1992).117. H. Katzman, Proc. Metal and Ceramic Matrix Composite Processing Conf., Vol. I,
U.S. Dept. of Defense Information Analysis Centers, pp. 115-140 (1984); J. Mater.Sci. 22, 144-148 (1987); Mater. Manufact. Process., 5(1), 1-15 (1990).
118. L.D. Brown and H.L. Marcus, Proc. Metal and Ceramic Matrix Composite ProcessingConf., Vol. II, U.S. Dept. of Defense Information Analysis Centers, pp. 91-113 (1984).
119. G. Leonhardt, E. Kieselstein, H. Podlesak, E. Than, and A. Hofmann, Mater. Sci.Eng., A135, 157-160 (1991).
120. K. Honjo and A. Shindo, Proc. 1st Compos. Interfaces Int. Conf., H. Ishida and J.L.Koenig, Eds., pp. 101-107 (1986).
121. J.A. Cornie, A.S. Argon, and V. Gupta, MRS Bull., 16(4), 32-38 (1991).122. H. Landis, Ph.D. dissertation, MIT, 1988.123. A.S. Argon, V. Gupta, K.S. Landis, and J.A. Cornie, J. Mater. Sci., 24, 1207-1218
(1989).124. J.P. Clement and H.J. Rack, Proc. Am. Soc. Compos. Symp. High Temp. Compos.,
pp. 11-20 (1989).125. S. Schamm, J.P. Rocher, and R. Naslain, Proc. 3rd Eur. Conf. Compos. Mater., Dev.
Sci. Technol. Compos. Mater., A.R. Bunsell, P. Lamicq, and A. Massiah, Eds., Elsevier,London, pp. 157-163 (1989).
126. S.N. Patankar, V. Gopinathan, and P. Ramakrishnan, Scripta Metall., 24, 2197-2202(1990).
127. S.N. Patankar, V. Gopinathan, and P. Ramakrishnan, J. Mater. Sci. Lett., 9, 912-913(1990).
128. R.V. Subramanian and E.A. Nyberg, J. Mater. Res., 7(3), 677-688 (1992).
©2001 CRC Press LLC

Corrosion Control of Steel-Reinforced Concrete
CONTENTS
9.1 Introduction9.2 Steel Surface Treatment9.3 Admixtures in Concrete9.4 Surface Coating on Concrete9.5 Cathodic Protection9.6 Steel Replacement9.7 ConclusionAcknowledgmentReferences
SYNOPSIS The methods and materials for corrosion control of steel-reinforcedconcrete are reviewed. The methods are steel surface treatment, the use of admixturesin concrete, surface coating on concrete, and cathodic protection.
RELEVANT APPENDIX: H
9.1 INTRODUCTION
Steel-reinforced concrete is widely used in construction. The corrosion of the steelreinforcing bars (rebars) in concrete limits the life of concrete structures. It is oneof the main causes for the deterioration of the civil infrastructure. Corrosion occursin the steel regardless of the inherent capacity of concrete to protect the steel fromcorrosion; accelerated corrosion results from the loss of alkalinity in the concreteor the penetration of aggressive ions (such as chloride ions).
Methods of corrosion control of steel-reinforced concrete include cathodic pro-tection,1-12 surface treatments of the rebars (epoxy coating,13-44 galvanizing,21,32,45-51
copper cladding,52 protective rust growth,53 surface oxidation,54 and sandblasting54),
9
©2001 CRC Press LLC

the use of admixtures (organic and inorganic corrosion inhibitors,51,55-69 silicafume,71-89 fly ash,90-92 slag,93 and latex70,94-96) and the use of surface coating.97-99 Thischapter is a review of the methods and materials for corrosion control of steel-reinforced concrete.
9.2 STEEL SURFACE TREATMENT
Steel rebars are made of mild steel because of low cost. (Stainless steel is excellentin corrosion resistance,100 but its high cost makes it impractical for use in concrete.)The coating of a steel rebar with epoxy is commonly used to improve corrosionresistance, but it degrades the bond between rebar and concrete, and the tendencyof the epoxy coating to debond is a problem.13-44 Furthermore, the cut ends of therebar and areas of the rebar where the epoxy coating is damaged are not protectedfrom corrosion. On the other hand, galvanized steel attains corrosion protection byits zinc coating, which acts as a sacrificial anode. Galvanized steel bonds to concretebetter than epoxy-coated steel,48 and the tendency of the coating to debond is alsoless. Areas of the rebar where the zinc coating is damaged are still protected; theexposed areas, such as the cut ends, are protected provided they are less than 8 mmfrom the zinc coating.49 Steel surface treatments that improve both corrosion resis-tance and bond strength are attractive. They include sandblasting and surface oxi-dation.54
Sandblasting involves discharging ceramic particles (typically alumina particlesaround 250 µm) under pressure (about 80 psi or 0.6 MPa). It results in rougheningas well as cleaning the surface of the steel rebar. Cleaning relates to the removal ofrust and other contaminants on the surface, as a steel rebar is usually covered byrust and other contaminants. Cleaning causes the surface of the rebar to be moreuniform in composition, which improves corrosion resistance. Roughening enhancesthe mechanical interlocking between rebar and concrete, thus increasing bondstrength.54
Water immersion means total immersion of the rebar in water at room temper-ature for two days. It causes the formation of a black oxide layer on the surface ofthe rebar, thus enhancing the composition uniformity of the surface and improvingcorrosion resistance. In addition, the oxide layer enhances the adhesion betweenrebar and concrete, thereby increasing bond strength. Water immersion times thatare less than or greater than two days yield less desirable effects on both bondstrength and corrosion resistance.54
Steel rebars can also be coated with a corrosion-inhibiting cement slurry51,55,101
or a cement-polymer composite101 for corrosion protection.Of all the methods described for treating the surface of steel rebar, the most
widely used are epoxy coating and galvanizing because of their long history of usage.
9.3 ADMIXTURES IN CONCRETE
Admixtures are solids or liquids that are added to a concrete mix to improve theproperties of the resulting concrete. Admixtures that enhance the corrosion resistanceof steel reinforced concrete include those that are primarily for corrosion inhibition
©2001 CRC Press LLC

and those that are primarily for improving the structural properties. The latter areattractive because of multifunctionality. The former are mostly inorganic chemicals(such as calcium nitrite,56,67-70 copper oxide,59 zinc oxide,59 sodium thiocyanate,60,61
and alkaline earth silicate64) that increase the alkalinity of the concrete, althoughthey can be organic chemicals such as banana juice.62 Admixtures primarily forstructural property improvement can be solid particles such as silica fume,71-89 flyash90-92 and slag,93 and solid particle dispersions such as latex.70,94-96
Silica fume as an admixture is particularly effective for improving the corrosionresistance of steel-reinforced concrete due to the decrease in the water absorptivity,and not so much because of the increase in electrical resistivity.71-89 Latex improvescorrosion resistance because it decreases water absorptivity and increases electricalresistivity.70,94-96 Methylcellulose improves corrosion resistance only slightly.72 Car-bon fibers decrease corrosion resistance due to a decrease in electrical resistivity.72
However, the negative effect of the carbon fibers can be compensated by addingeither silica fume or latex, which reduce water absorptivity.72 The corrosion resis-tance of carbon fiber-reinforced concrete, which typically contains silica fume forimproving fiber dispersion, is superior to that of plain concrete.72
Table 9.172 shows the effects of silica fume, latex, methylcellulose, and shortcarbon fibers as admixtures on the corrosion potential (Ecorr, measured according toASTM C876 using a high-impedance voltmeter and a saturated calomel electrodeplaced on the concrete surface; Ecorr that is more negative than –270 mV suggests90% probability of active corrosion) and the corrosion current density (Icorr, deter-mined by measuring the polarization resistance at a low scan rate of 0.167 mV/s)of steel-reinforced concrete in both saturated Ca(OH)2 and 0.5 N NaCl solutions.The saturated Ca(OH)2 solution simulates the ordinary concrete environment; theNaCl solution represents a high-chloride environment. Silica fume improves the
TABLE 9.1Effect of Carbon Fibers (f), Methylcellulose (M), Silica Fume (SF), and Latex (L) on the Corrosion Resistance of Steel Rebar in Concrete
In saturated Ca(OH)2 solution In 0.5 N NaCl solution
Ecorr*(–mV, ±5) Icorr
*(µA/cm2, ±0.03) Ecorr*(–mV, ±5) Icorr
*(µA/cm2, ±0.03)
P 210 0.74 510 1.50+ M 220 0.73 / /+ M + f 220 0.68 560 2.50+ M + SF 137 0.17 / /+ M + f + SF 170 0.22 350 1.15+ SF 140 0.19 270 0.88+ L 180 0.36 360 1.05+ L + f 190 0.44 405 1.28
Note: P = plain, M = methylcellulose, f = carbon fibers, SF = silica fume, L = latex
* Value at 25 weeks of corrosion testing
©2001 CRC Press LLC

corrosion resistance of rebars in concrete in both saturated Ca(OH)2 and NaClsolutions more effectively than any of the other admixtures, although latex is effec-tive. Methylcellulose slightly improves the corrosion resistance of rebar in concretein Ca(OH)2 solution. Carbon fibers decrease the corrosion resistance of rebars inconcrete, mainly because they decrease the electrical resistivity of concrete. Thenegative effect of fibers can be compensated by either silica fume or latex.
Instead of using a corrosion-inhibiting admixture in the entire volume of con-crete, one may use the admixture to modify the cement slurry that is used as acoating on the steel rebar.51,55 Compared to the use of rebars that have been eitherepoxy coated or galvanized, this method suffers from its labor-intensive site-orientedprocess.101 On the other hand, the use of a shop-coating based on a cement-polymercomposite is an emerging alternative.101
Of all the admixtures described for improving the corrosion resistance of steel-reinforced concrete, the most widely used are calcium nitrite, silica fume, and latex.
9.4 SURFACE COATING ON CONCRETE
Coatings (such as acrylic rubber) can be applied to the concrete surface for thepurpose of corrosion control through improving impermeability.97-99 However, thismethod suffers from the poor durability of the coating, and the loss of corrosionprotection in areas where the coating is damaged.
9.5 CATHODIC PROTECTION
Cathodic protection is an effective method for corrosion control of steel-reinforcedconcrete.1-11 It involves the application of a voltage to force electrons to go to thesteel rebar, thereby making the steel a cathode. As the voltage needs to be constantlyapplied, the electrical energy consumption is substantial. This can be alleviated bythe use of carbon fiber-reinforced concrete.
As the steel rebar is embedded in concrete, the electrons need to go through theconcrete in order to reach the rebar. However, concrete is not very conductingelectrically. The use of carbon fiber-reinforced concrete for embedding the rebarfacilitates cathodic protection, as the short carbon fibers enhance the conductivityof the concrete.5
For directing electrons to the steel-reinforced concrete, an electrical contact thatis connected to the voltage supply is needed on the concrete. One choice of anelectrical contact material is zinc, a coating deposited on the concrete by thermalspraying. It has a very low volume resistivity (thus requiring no metal mesh embed-ment), but it suffers from poor wear and corrosion resistance, the tendency to oxidize,high thermal expansion coefficient, and high material and processing costs. Anotherchoice is a conductor-filled polymer,12 that can be applied as a coating withoutheating, but it suffers from poor wear resistance, higher thermal expansion coeffi-cient, and high material cost. Yet another choice is a metal (e.g., titanium) strip orwire embedded at one end in cement mortar that is in the form of a coating on thesteel-reinforced concrete. The use of carbon fiber-reinforced mortar for this coatingfacilitates cathodic protection, as it is advantageous to enhance its conductivity.5
©2001 CRC Press LLC

Due to the decrease in volume electrical resistivity associated with carbon fiberaddition (0.35 vol. %) to concrete, concrete containing carbon fibers and silica fumereduces the driving voltage required for cathodic protection by 18% compared toplain concrete, and by 28% compared to concrete with silica fume. Because of thedecrease in resistivity associated with carbon fiber addition (1.1 vol. %) to mortar,overlay (embedding titanium wires for electrical contacts to steel-reinforced con-crete) in the form of mortar containing carbon fibers and latex reduces the drivingvoltage required for cathodic protection by 10% compared to plain mortar overlay.In spite of the low resistivity of mortar overlay with carbon fibers, cathodic protectionrequires multiple metal electrical contacts embedded in the mortar at a spacing of11 cm or less.5
9.6 STEEL REPLACEMENT
The replacement of steel rebars by fiber-reinforced polymer rebars is an emergingtechnology that is attractive because of the corrosion resistance of fiber-reinforcedpolymer.102-107 However, this technology suffers from high cost, the poor bondingbetween concrete and the fiber-reinforced polymer rebar, and the low ductility ofthe fiber-reinforced polymer.
9.7 CONCLUSION
Methods of corrosion control of steel-reinforced concrete include steel surface treat-ment, the use of admixtures in concrete, surface coating on concrete, and cathodicprotection.
ACKNOWLEDGMENT
This work was supported in part by the U.S. National Science Foundation.
REFERENCES
1. B.S. Wyatt, Corros. Sci. 35(5-8), Pt. 2, 1601-1615 (1993).2. S.C. Das, Struct. Eng. 71(22), 400-403 (1993).3. J.S. Tinnea and R.P. Brown, Proc. 1996 4th Materials Engineering Conf., Vol. 2, pp.
1531-1539 (1996).4. I. Solomon, M.F. Bird, and B. Phang, Corros. Sci. 35(5-8), Pt. 2, 1649-1660 (1993).5. J. Hou and D.D.L. Chung, Cem. Concr. Res. 27(5), 649-656 (1997).6. R.J. Kessler, R.G. Powers, and I.R. Lasa, Mater. Perform. 37(1), 12-15 (1998).7. R.J. Brousseau and G.B. Pye, ACI Mater. J. 94(4), 306-310 (1997).8. F. Papworth and R. Ratcliffe, Concr. Int. 16(10) 39-44 (1994).9. K.E.W. Coulson, T.J. Barlo, and D.P. Werner, Oil & Gas J. 89(41), 80-84 (1991).
10. V. Dunlap, Proc. Conf. Cathodic Protection of Reinforced Concrete Bridge Decks,NACE, pp. 131-136 (1986).
11. B. Heuze, Mater. Perform. 19(5), 24-33 (1980).
©2001 CRC Press LLC

12. R. Pangrazzi, W.H. Hartt, and R. Kessler, Corrosion 50(3) 186-196 (1994).13. R.E. Weyers, W. Pyc, and M.M. Sprinkel, ACI Mater. J. 95(5), 546-557 (1998).14. S.W. Poon and I.F. Tasker, Asia Engineer 26(8), 17 (1998).15. R.D. Lampton Jr. and D. Schemberger, Materials for the New Millenium, Proc. 1996
4th Materials Engineering Conf., Vol. 2, pp. 1209-1218 (1996).16. J.L. Smith and Y.P. Virmani, Public Roads 60(2), 6-12 (1996).17. B. Neffgen, Eur. Coat. J. (10), 700-703 (1996).18. J. Shubrook, Plant Eng. 50(10), 99-100 (1996).19. J.S. McHattie, I.L. Perez, and J.A. Kehr, Cem. Concr. Compos. 18(2), 93-103 (1996).20. J. Hartley, Steel Times 224(1), 23-24 (1996).21. K. Thangavel, N.S. Rengaswamy, and K. Balakrishnan, Indian Concr. J. 69(5),
289-293 (1995).22. L.K. Aggarwal, K.K. Asthana, and R. Lakhani, Indian Concr. J. 69(5), 269-273
(1995).23. H.O. Hasan, J.A. Ramirez, and D.B. Cleary, Better Roads 65(5), (1995).24. K. Kahhaleh, J. Jirsa, R. Carrasquillo, and H. Wheat, Proc. 3rd Materials Engineering
Conf., 804, pp. 8-15 (1994).25. R.G. Mathey and J.R. Clifton, Proc. Struct. Congr. 94, pp. 109-115 (1994).26. P. Schiessl and C. Reuter, Beton — und Stahlbetonbau 87(7), 171-176 (1992).27. R. Korman, ENR 228(19), 9 (1992).28. K.C. Clear, Concr. Int. 14(5), 58, 60-62 (1992).29. T.E. Cousins, D.W. Johnston, and P. Zia, ACI Mater. J. 87(4), 309-318 (1990).30. K.W.J. Treadaway and H. Davies, Struct. Eng. 67(6), 99-108 (1989).31. R.A. Treece and J.O. Jirsa, ACI Mater. J. 86(2), 167-174 (1989).32. S. Muthukrishnan and S. Guruviah, Trans. SAEST 23(2-3), 183-188 (1988).33. T.D. Lin, R.I. Zwiers, S.T. Shirley, and R.G. Burg, ACI Mater. J. 85(6), 544-550
(1988).34. H.A. El-Sayed, F.H. Mosalamy, A.F. Galal, and B.A. Sabrah, Corros. Prev. Control
35(4), 87-92 (1988).35. D.P. Gustafson, Civ. Eng. 58(10), 38-41 (1988).36. L. Salparanta, Valt Tek Tutkimuskeskus Tutkimuksia 521, 48 p (1988).37. R.J. Higgins, Concr. Plant Prod. 5(6), 197-198 (1987).38. R.J. Higgins, Concr. Plant Prod. 5(4), 131-132 (1987).39. H.A. El-Sayed, M.M. Kamal, S.N. El-Ebiary, and H. Shahin, Corros. Prev. Control
34(1), 18-23 (1987).40. B.W. McLean and A.J.R. Bridges, U.K. Corrosion ’85, Vol. 2, pp. 11-17 (1985).41. S.L. Lopata, ASTM Special Technical Publication 841, pp. 5-9 (1983).42. T. Arai, K. Shirakawa, N. Mikami, S. Koyama, and A. Yamazaki, Sumitomo Metals
36(3), 53-71 (1984).43. J. Clifton, CIB 83, 9th CIB Congress, pp. 68-69 (1983).44. K. Kobayashi and K. Takewaka, Int. J. Cem. Compos. Lightweight Concr. 6(2), 99-116
(1984).45. V.R. Subramanian, Indian Concr. J. 70(7), 383-385 (1996).46. S.R. Yeomans, Hong Kong Inst. Eng. Trans. 2(2), 17-28 (1995).47. N. Gowripalan and H.M. Mohamed, Cem. Concr. Res. 28(8), 1119-1131 (1998).48. O.A. Kayyali and S.R. Yeomans, Constr. Build. Mater. 9(4), 219-226 (1995).49. S.R. Yeomans, Corrosion 50(1), 72-81 (1994).50. F.H. Rasheeduzzafar, F.H. Dakhil, M.A. Bader, and M.M. Khan, ACI Mater. J. 89(5),
439-448 (1992).
©2001 CRC Press LLC

51. N.S. Rengaswamy, S. Srinivasan, and T.M. Balasubramanian, Trans. SAEST 23(2-3),163-173 (1988).
52. D.B. McDonald, Y.P. Virmani, and D.F. Pfeifer, Concr. Int. 18(11), 39-43 (1996).53. H. Kishikawa, H. Miyuki, S. Hara, M. Kamiya, and M. Yamashita, Sumitomo Search
(60), 20-26 (1998).54. J. Hou, X. Fu, and D.D.L. Chung, Cem. Concr. Res. 27(5), 679-684 (1997).55. N.S. Rengaswamy, R. Vedalakshmi, and K. Balakrishnan, Corros. Prev. Control 42(6),
145-150 (1995).56. J.M. Gaidis and A.M. Rosenberg, Cem. Concr. Aggregates 9(1), 30-33 (1987).57. N.S. Berke, Concr. Int. 13(7), 24-27 (1991).58. C.K. Nmai, S.A. Farrington, and G.S. Bobrowski, Concr. Int. 14(4), 45-51 (1992).59. N.S. Rengaswamy, V. Saraswathy, and K. Balakrishnan, J. Ferrocement 22(4),
359-371 (1992).60. C.K. Nmai, M.A. Bury, and H. Farzam, Concr. Int. 16(4), 22-25 (1994).61. C.K. Nmai, M.A. Bury, and H. Farzam, Concr. Int. 16(4), 22-25 (1994).62. S.H. Tantawi, J. Mater. Sci. Technol. 12(2), 95-99 (1996).63. R.J. Scancella, Proc. 4th Materials Engineering Conf., Vol. 2, pp. 1276-1280 (1996).64. J.R. Miller and D.J. Fielding, Concr. Int. 19(4), 29-34 (1997).65. I.Z. Selim, J. Mater. Sci. Technol. 14(4), 339-343 (1998).66. D. Bjegovic and B. Miksic, Mater. Perform. 38(11), 52-56 (1999).67. M. Tullmin, L. Mammoliti, R. Sohdi, C.M. Hansson, and B.B. Hope, Cem. Concr.
Aggregates 17(2), 134-144 (1995).68. C.M. Hansson, L. Mammoliti, and B.B. Hope, Cem. Concr. Res. 28(12), 1775-1781
(1998).69. N.S. Berke, M.P. Dallaire, R.E. Weyers, M. Henry, J.E. Peterson, and B. Prowell,
ASTM Special Technical Publication, No. 1137, pp. 300-327 (1991).70. N.S. Berke and A. Rosenberg, Transp. Res. Rec. (1211), 18-27 (1989).71. N.S. Berke, Transp. Res. Rec. (1204), 21-26 (1988).72. J. Hou and D.D.L. Chung, Corros. Sci. 42(9), 1489-1507 (2000).73. J.G. Cabrera and P.A. Claisse, Constr. Build. Mater. 13(7), 405-414 (1999).74. O.E. Gjorv, ACI Mater. J. 92(6), 591-598 (1995).75. J.G. Cabrera, P.A. Claisse, and D.N. Hunt, Constr. Build. Mater. 9(2), 105-113 (1995).76. N.R. Jarrah, O.S.B. Al-Amoudi, M. Maslehuddin, O.A. Ashiru, and A.I. Al-Mana,
Constr. Build. Mater. 9(2), 97-103 (1995).77. T. Lorentz and C. French, ACI Mater. J. 92(2), 181-190 (1995).78. S.A. Khedr and A.F. Idriss, J. Mater. Civ. Eng. 7(2), 102-107 (1995).79. C. Ozyildirim, ACI Mater. J. 91(2), 197-202 (1994).80. J.T. Wolsiefer, Sr., Proc. ASCE National Convention and Exposition, pp. 15-29
(1993).81. K. Torii, M. Kawamura, T. Asano, and M. Mihara, Zairyo/J. Soc. Mater. Sci., Japan
40(456), 1164-1170 (1991).82. H.T. Cao and V. Sirivivantnanon, Cem. Concr. Res. 21(2-3), 316-324 (1991).83. Anon., Concr. Constr. 33(2), 6 (1988).84. K.P. Fischer, O. Bryhn, and P. Aagaard, Publikasjon — Norges Geotekniske Institutt
(161), (1986).85. O. Gautefall and O. Vennesland, Nord. Concr. Res. (2), 17-28 (1983).86. P.J.M. Monteiro, O.E. Gjorv, and P.K. Mehta, Cem. Concr. Res. 15(5), 781-784
(1985).87. O. Vennesland and O.E. Gjorv, Publication SP — American Concrete Institute 79,
Vol. 2, pp. 719-729 (1983).
©2001 CRC Press LLC
88. A.H. Ali, Corros. Prev. Control 46(3), 76-81 (1999).89. A.H. Ali, B. El-Sabbagh, and H.M. Hassan, Corros. Prev. Control 45(6), 173-180
(1998).90. M. Maslehuddin, H. Saricimen, and A.I. Al-Mana, ACI Mater. J. 84(1), 42-50 (1987).91. M. Maslehuddin, A.I. Al-Mana, M. Shamim, and H. Saricimen, ACI Mater. J. 86(1),
58-62 (1989).92. O.S.B. Al-Amoudi, M. Maslehuddin, and I.M. Asi, Cem. Concr. Aggregates 18(2),
71-77 (1996).93. M. Maslehuddin, A.I. Al-Mana, H. Saricimen, and M. Shamim, Cem. Concr. Aggre-
gates 12(1), 24-31 (1990).94. K. Babaei and N.M. Hawkins, ASTM Special Technical Publication, No. 1137, pp.
140-154 (1991).95. S.H. Okba, A.S. El-Dieb, and M.M. Reda, Cem. Concr. Res. 27(6), 861-868 (1997).96. S.X. Wang, W.W. Lin, S.A. Ceng, and J.Q. Zhang, Cem. Concr. Res. 28(5), 649-653
(1998).97. F. Andrews-Phaedonos, Transport Proc. 19th ARRB Conference of the Australian
Road Research Board, pp. 245-262 (1998).98. J.-Z. Zhang, I.M. McLoughlin, and N.R. Buenfeld, Cem. Concr. Compos. 20(4),
253-261 (1998).99. R.N. Swamy and S. Tanikawa, Mater. Struct. 26(162), 465-478 (1993).
100. B.G. Callaghan, Corros. Sci. 35(5-8), Pt. 2, 1535-1541 (1993).101. K. Kumar, R. Vedalakshmi, S. Pitchumani, A. Madhavamayandi, and N.S. Ren-
gaswamy, Indian Concr. J. 70(7), 359-364 (1996).102. K. Murphy, S. Zhang, and V.M. Karbhari, International SAMPE Symposium &
Exhibition, 44(II), 2222-2230 (1999).103. H. Saadatmanesh and F. Tannous, Proc. International Seminar on Repair and Reha-
bilitation of Reinforced Concrete Structures: The State of the Art, pp. 120-133 (1998).104. S.S. Faza, Materials for the New Millennium, Proc. 4th Materials Engineering Conf.,
Vol. 2, pp. 905-913 (1996).105. S. Loud, SAMPE J. 32(1), (1996).106. T.R. Gentry and M. Husain, J. Compos. Constr. 3(2), 82-86 (1999).107. H.C. Boyle and V.M. Karbhari, Polym.-Plast. Technol. Eng. 34(5), 697-720 (1995).
©2001 CRC Press LLC

Applications of Submicron-Diameter Carbon Filaments
CONTENTS
10.1 Introduction10.2 Structural Applications10.3 Electromagnetic Interface Shielding, Electromagnetic Reflection,
and Surface Electrical Conduction10.4 DC Electrical Conduction10.5 Field Emission10.6 Electrochemical Application10.7 Thermal Conduction10.8 Strain Sensors10.9 Porous Carbons10.10 Catalyst Support10.11 ConclusionAcknowledgmentReferences
SYNOPSIS The applications of submicron-diameter carbon filaments grown cata-lytically from carbonaceous gases are reviewed. The applications relate to structuralapplications, EMI shielding, electromagnetic reflection, surface electrical conduc-tion, DC electrical conduction, field emission, electrochemical applications, thermalconduction, strain sensors, porous carbons, and catalyst support.
RELEVANT APPENDIX: J
10
©2001 CRC Press LLC

10.1 INTRODUCTION
Submicron-diameter carbon filaments are grown catalytically from carbonaceousgases at 500–700°C,1,2 although they include the carbon nanotubes,3 which havediameters in the nanometer range. Due to the higher yield in production, the formerare more abundant, and applications are more well developed, than the latter. Sub-micron carbon filaments are to be distinguished from conventional carbon fibers,which are made by pyrolysis of pitch or polymer.4-6 They are also to be distinguishedfrom vapor-grown carbon fibers (VGCF), which are prepared by pyrolysis of car-bonaceous gases to noncatalytically deposit carbon on catalytically grown submi-cron-diameter carbon filaments at 950–1100°C.7-14 Carbon filaments differ from bothconventional and vapor-grown carbon fibers in their small diameters. Conventionalcarbon fibers typically have diameters around 10 µm, and VGCF have diameters upto 10 µm. Both carbon filaments and VGCF are not continuous, though the lattercan be longer than the former. In contrast, conventional carbon fibers can be con-tinuous. In spite of the discontinuous nature of carbon filaments, the aspect ratiocan be quite high because of the small diameter. Carbon filaments tend not to bestraight. Thus, they are intertwined and have a morphology that resembles cottonwool (Figure 10.1). Moreover, they are typically disordered crystallographically,unless they have been graphitized by heat treatment. However, even a disorderedfilament exhibits a fishbone morphology for the carbon layers (Figure 10.2). Eachfilament has an axial hollow channel in the middle due to the catalyst particle usedin filament growth. In this chapter, the term “filaments” refers to filaments ofsubmicron diameter, whereas “fibers” refers to fibers of diameter greater than 1 µm.
Carbon filaments are commercially available, though not in large volumes. Asthe amount of usage increases, their price will fall. According to Applied Sciences,Inc., which manufactures catalytically grown carbon filaments, the price will fall toU.S. $2-3 per pound. This is even lower than that of short isotropic pitch-basedcarbon fibers. In order for usage to increase, applications must be developed.
FIGURE 10.1 Scanning electron micrograph of carbon filaments.
©2001 CRC Press LLC
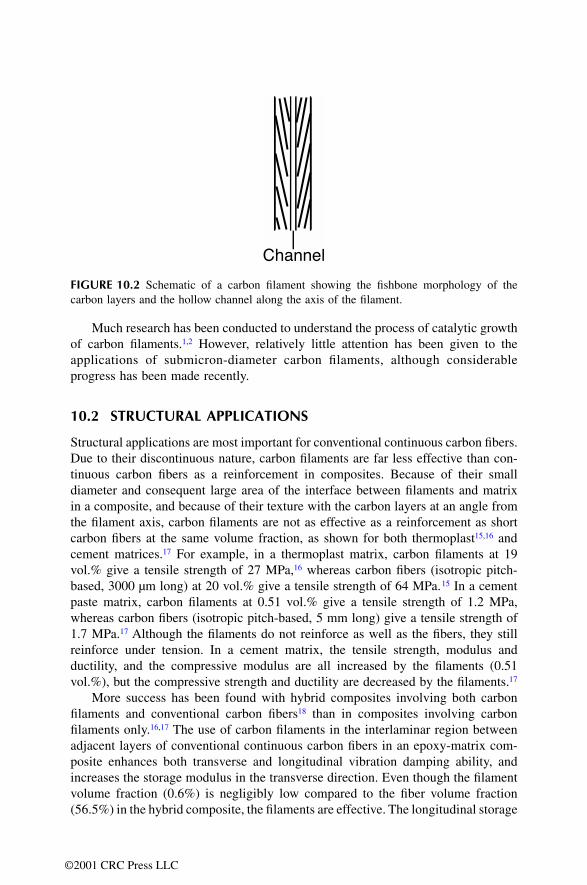
Much research has been conducted to understand the process of catalytic growthof carbon filaments.1,2 However, relatively little attention has been given to theapplications of submicron-diameter carbon filaments, although considerableprogress has been made recently.
10.2 STRUCTURAL APPLICATIONS
Structural applications are most important for conventional continuous carbon fibers.Due to their discontinuous nature, carbon filaments are far less effective than con-tinuous carbon fibers as a reinforcement in composites. Because of their smalldiameter and consequent large area of the interface between filaments and matrixin a composite, and because of their texture with the carbon layers at an angle fromthe filament axis, carbon filaments are not as effective as a reinforcement as shortcarbon fibers at the same volume fraction, as shown for both thermoplast15,16 andcement matrices.17 For example, in a thermoplast matrix, carbon filaments at 19vol.% give a tensile strength of 27 MPa,16 whereas carbon fibers (isotropic pitch-based, 3000 µm long) at 20 vol.% give a tensile strength of 64 MPa.15 In a cementpaste matrix, carbon filaments at 0.51 vol.% give a tensile strength of 1.2 MPa,whereas carbon fibers (isotropic pitch-based, 5 mm long) give a tensile strength of1.7 MPa.17 Although the filaments do not reinforce as well as the fibers, they stillreinforce under tension. In a cement matrix, the tensile strength, modulus andductility, and the compressive modulus are all increased by the filaments (0.51vol.%), but the compressive strength and ductility are decreased by the filaments.17
More success has been found with hybrid composites involving both carbonfilaments and conventional carbon fibers18 than in composites involving carbonfilaments only.16,17 The use of carbon filaments in the interlaminar region betweenadjacent layers of conventional continuous carbon fibers in an epoxy-matrix com-posite enhances both transverse and longitudinal vibration damping ability, andincreases the storage modulus in the transverse direction. Even though the filamentvolume fraction (0.6%) is negligibly low compared to the fiber volume fraction(56.5%) in the hybrid composite, the filaments are effective. The longitudinal storage
FIGURE 10.2 Schematic of a carbon filament showing the fishbone morphology of thecarbon layers and the hollow channel along the axis of the filament.
Channel
©2001 CRC Press LLC
modulus is only slightly decreased by the filament addition.18 Another form ofhybrid composite involves the catalytic growth of carbon filaments on conventionalcarbon fibers to provide mechanical interlocking between adjacent fibers in a com-posite.19,20 The interfacial shear strength between fiber and a polymer matrix isincreased by over 4.75 times after the growth of filaments on the fiber.20 Furthermore,the specific surface area is increased from about 1.0 m2/g to 250–300 m2/g.20
However, the practicality of composite fabrication using such hybrid fibers remainsan issue.
Due to the clingy morphology and small diameter of carbon filaments, dispersionof the filaments in a composite requires more care than that of conventional shortcarbon fibers. A method of dispersing the carbon filaments in a thermoplast matrixinvolves (1) dispersing the filaments in an isopropyl alcohol aqueous solution withthe help of a trace amount of a dispersant, such as Triton X102® from Rohm andHaas Co.; (2) mixing the slurry with thermoplast powder at room temperature byusing a kitchen blender such that the concentration of isopropyl alcohol in theaqueous solution is adjusted so that the thermoplast particles are suspended; (3)draining the solution; (4) drying at 120°C; and (5) hot-pressing uniaxially abovethe glass transition temperature of the thermoplast and at 1000 psi (6.9 MPa) for0.5 h. The mixing in Step 2 causes very little filament breakage, so the aspect ratioof the filaments after mixing remains high (typically > 1000).15,20 In this method,the thermoplast must be in the form of fine particles because of the small diameterof the carbon filaments. As thermoplasts are in the form of pellets rather thanparticles, the choice is limited. In the case of a thermosetting resin such as epoxy,dispersion of the carbon filaments requires dilution of the resin with a solvent tolower the viscosity, and subsequent mixing of the filament-resin slurry by using avigorous means, such as a blender. Due to the strong effect of the form of the matrixraw material on the dispersion of the carbon filaments, the properties (both mechan-ical and electromagnetic) of the composites depend significantly on the matrixmaterial.
Catalytically grown carbon filaments have a layer of polyaromatic hydrocarbonson their surfaces, because of the process in which they are grown.22 The hydrocarbonlayer can be removed by cleansing with a solvent, such as acetone or methylenechloride.22 The removal or partial removal of the hydrocarbon layer improves thebonding between carbon filaments and a thermoplast matrix, as suggested by thefact that the volume electrical resistivity of the composite is much lower when thehydrocarbon layer has been removed before incorporating the filaments in the com-posite,21,23 and as supported by the mechanical properties of the composites.24
Surface treatment of the filaments by oxidation helps the mechanical propertiesof cement-matrix and polymer-matrix composites.25,26 The bond between carbon anda cement matrix is weak compared to that between carbon and a polymer matrix.Therefore, surface treatment of carbon for improving the bond with cement isparticularly important. The treatment of catalytically grown carbon filaments (0.1µm diameter) with ozone gas (0.3 vol.% in air, 160°C, 10 min) increases the tensilestrength, modulus and ductility, and the compressive strength and modulus andductility of cement pastes relative to the values for pastes with the same volumefraction of untreated filaments.25 Similar effects apply to the ozone treatment of
©2001 CRC Press LLC

carbon fibers,26,27 for which it has been shown that ozone treatment improves wettingby water, degree of fiber dispersion in cement, and bond strength with cement, inaddition to increasing surface oxygen concentration.27
Ceramic-matrix (Al2O3 or MgAl2O4 as matrix) composite powders that containin situ formed carbon nanotubes may be useful for structural applications.28
10.3 ELECTROMAGNETIC INTERFERENCE SHIELDING, ELECTROMAGNETIC REFLECTION, AND SURFACE ELECTRICAL CONDUCTION
EMI shielding29-32 is in critical demand due to the interference of wireless deviceswith digital devices, and the increasing sensitivity and importance of electronicdevices. EMI shielding is one of the main applications of conventional short carbonfibers.33 Because of the small diameter, carbon filaments are more effective for EMIshielding at the same volume fraction in a composite than conventional short carbonfibers, as shown for both thermoplast15,16 and cement17,34 matrices. For example, ina thermoplast matrix, carbon filaments at 19 vol.% give an EMI shielding effective-ness of 74 dB at 1 GHz,16 whereas carbon fibers at 20 vol.% give a shieldingeffectiveness of 46 dB at 1 GHz.15 In a cement-matrix composite, fiber volumefractions are typically less than 1%. Carbon filaments at 0.54 vol.% in a cementpaste give an effectiveness of 26 dB at 1.5 GHz,17 whereas carbon fibers at 0.84vol.% in a mortar yield an effectiveness of 15 dB at 1.5 GHz.34 These effectivenessmeasurements were made with the same fixture and about the same sample thick-nesses. A low-volume fraction of the filler is attractive for maintaining ductility orresilience in the polymer-matrix composite, as both ductility and resilience decreasewith increasing filler volume fraction. Resilience is particularly important for EMI-shielding gaskets and electric cable jackets. In addition, a low-volume fraction ofthe filler reduces the material cost and improves the processability of the composites,whether polymer-matrix or cement-matrix.
The greater shielding effectiveness of filaments compared to fibers is becauseof the skin effect, i.e., high-frequency electromagnetic radiation interacts only withthe near surface region of an electrical conductor. However, carbon filaments arestill not as effective as nickel fibers of 2 µm diameter at the same volume fraction,as shown for a thermoplast matrix.23 On the other hand, by coating a carbon filamentwith nickel by electroplating, a nickel filament (0.4 µm diameter) with a carbon core(0.1 µm diameter) is obtained.23,35 Nickel filaments are more effective than nickelfibers for shielding, because of their small diameters. At 1 GHz, a shielding effec-tiveness of 87 dB was attained by using only 7 vol.% nickel filaments in a thermoplastmatrix.23 The shielding is almost all by reflection rather than absorption.
The high radio wave reflectivity of carbon filament-reinforced cement pastemakes carbon filament concrete attractive for use for lateral guidance in automatichighways.36 Automatic highways are those that provide fully automated control ofvehicles so that safety and mobility are enhanced. In other words, a driver does notneed to drive on an automatic highway; the vehicle goes automatically, with bothlateral control (steering to control position relative to the center of the traffic lane)
©2001 CRC Press LLC
and longitudinal control (speed and headway). Current technology uses magneticsensors with magnetic highway markings to provide lateral guidance, and uses radarto monitor vehicle position relative to other vehicles in its lane for the purpose oflongitudinal guidance. Cement paste containing 0.5 vol.% carbon filaments exhibitsreflectivity at 1 GHz that is 29 dB higher than the transmissivity. Without thefilaments, the reflectivity is 3–11 dB lower than the transmissivity.
Compared to magnetic technology, the attractions of electromagnetic technologyare low material cost, low labor cost, low peripheral electronic cost, good mechanicalproperties, good reliability, and high durability. Moreover, the magnetic field froma magnetic marking can be shielded by electrical conductors between the markingand the vehicle, whereas the electromagnetic field cannot be shielded easily.
The surface impedance of carbon filament composites, nickel filament compos-ites, and nickel fiber composites is low. In particular, at 1 GHz, the surface impedanceis comparable to that of copper for a thermoplast-matrix composite with 7 vol.%nickel filaments and a thermoplast-matrix composite with 13 vol.% nickel fibers.16
The surface impedance is higher for carbon filament composites than nickel filamentcomposites or nickel fiber composites at similar filler volume fractions.16 Althoughcarbon filaments have a lower density than nickel filaments, a thermoplast-matrixcomposite with 7 vol.% nickel filaments has the same specific surface conductanceas one with 19 vol.% carbon filaments.16 The low surface impedance is valuable forapplications related to electrostatic discharge protection and microwave waveguides.
10.4 DC ELECTRICAL CONDUCTION
Submicron-diameter carbon filaments are useful as an electrically conducting addi-tive for enhancing the DC electrical conductivity of a polymer-matrix composite,37-41
provided they are properly dispersed.16,21,39 An application that benefits from theenhanced conductivity relates to solid rocket propellants, for which enhanced con-ductivity decreases the incidence of dangerous electric discharge events.38 Anotherapplication pertains to molecular optoelectronics and involves the use of carbonnanotubes.40,41
10.5 FIELD EMISSION
The high aspect ratio, small radius of curvature at the tips, high chemical stability,and high mechanical strength of carbon nanotubes are advantageous for field emis-sion, i.e., the emission of electrons under an applied electric field. Field emission isrelevant to various electronic devices, including high-current electron sources, flat-panel displays, and light source bulbs.42-53 Nanotubes as emitters provide signifi-cantly brighter displays than either cathode ray tubes or Spindt tip-based displays.3
In addition, field emission electron sources are energy saving compared with ther-mionic ones, because no heating is necessary to emit electrons from the cathodesurface.45 Moreover, carbon nanotubes are free of any precious or hazardous ele-ment.45 Alignment of the nanotubes is desired for this application, and they shouldhave closed, well-ordered tips.
©2001 CRC Press LLC
10.6 ELECTROCHEMICAL APPLICATION
Due to its electrical conductivity and chemical resistance, carbon is an importantmaterial for electrochemical applications, particularly electrodes for electrochemicalcells,54-62 double-layer capacitors,61,63-67 and energy storage.68,69 The small diameterof carbon nanotubes is advantageous for microelectrode arrays.70-73 Capacitors exhib-iting fast response (100 Hz) and high specific capacitance (100 F/g) have beenattained by using carbon filaments.68 Porous tablets of carbon nanotubes have beenfabricated by using polymeric binders as polarizable electrodes in capacitors.67
Electrolyte absorptivity, specific surface area, surface chemistry, and crystallo-graphic structure are important for electrodes. Carbon black59 is the most commontype of carbon for these applications, though the use of conventional carbonfibers,54-60,63-66 VGCF,61,62 and carbon filaments68,74-77 has been investigated. Theremoval of the hydrocarbon layer on carbon filaments improves electrochemicalbehavior, as indicated by the electron transfer rate across the electrode-electrolyteinterface.22
Catalytically grown carbon filaments of diameter 0.1 µm have been shownsuperior to carbon black in lithium primary cells that use carbon as a porous electrode(current collector),75 and as an electrically conductive additive in a nonconductingelectrode.76 The current collector of the lithium/thionyl chloride (Li/SOCl2) cellconventionally uses carbon black, which needs a teflon binder. Because of thecleansing ability of thionyl chloride, carbon filaments used in place of carbon blackdo not require solvent cleansing before use. As the filaments tend to cling together,a binder is not necessary, in contrast to carbon black. Using the same paper-makingprocess, carbon filaments can be made into a thinner sheet than carbon black. Thethinness is valuable for enhancing the energy density of the cell, as the area overwhich the lithium anode faces the carbon current collector is increased. In addition,the packing density is lower for the filament sheet than the carbon black sheet, sothe catholyte absorptivity is higher for the filament sheet than the carbon black and,consequently, energy density is further increased.75
The MnO2 cathode of a Li/MnO2 primary cell is electrically nonconducting, soa conductive additive, typically carbon black, is mixed with the MnO2 particles. Theuse of catalytically grown carbon filaments of diameter 0.1 µm in place of carbonblack causes the running voltage near cell end-of-life to decline gradually, in contrastto the abrupt end-of-life when carbon black is used. The gradualness toward end-of-life is due to a high electron transfer rate and a high rate of electrolyte absorption.For the filaments to be effective, they need to undergo solvent cleansing prior to use.76
By using catalytically grown carbon filaments with diameters around 80 Å, adouble-layer capacitor of specific capacitance 102 F/g at 1 Hz has been achieved.77
The catalytic growth of carbon filaments on carbons provides a way of modifyingthe surface of carbons to improve electrochemical behavior.78 The resulting carbonsare called “hairy carbons.” Particularly abundant hair growth occurs when the carbonis carbon black because of the confinement of the catalyst size by the pores in thecarbon black. Hair growth, followed by an oxidation heat treatment, results in furtherimprovement in electrochemical behavior. The particulate nature of hairy carbonblack is in contrast to the fibrous nature of carbon filaments or carbon fibers. The
©2001 CRC Press LLC

particulate nature facilitates dispersion, while the hairiness makes a binder unnec-essary for electrode forming.
10.7 THERMAL CONDUCTION
Due to the low temperature (500–700°C) during the catalytic growth of carbonfilaments, they may be only slightly crystalline (i.e., almost totally amorphous) afterfabrication. However, subsequent heat treatment at 2500–3000°C causes graphitiza-tion,22 which is expected to result in a large increase in thermal conductivity. A highthermal conductivity is valuable for use of the filaments in composites for thermalmanagement, which is critically needed for heat dissipation from electronic pack-ages, space radiators, and plasma facing. Because of the small diameters of thecarbon filaments, single-filament thermal conductivity measurement is difficult. Thethermal conductivity of conventional pitch-based carbon fiber is 603 W/m.K forP-120,79 750 W/m.K for P-100-4,80 1000 W/m.K for P-X-5,80 and 1055 W/m.K forK1100;79 that of VGCF is 2540–2680 W/m.K.80
The thermal conductivity of carbon filament composites has not been reported,but polymer-matrix,81 aluminum-matrix,82,83 and carbon-matrix82,84-86 compositescontaining VGCF exhibit thermal conductivities up to 466, 642, and 910 W/m.K,respectively. A polymer-matrix composite containing conventional pitch-based con-tinuous carbon fibers (P-120) exhibits thermal conductivity 245 W/m.K.80
Although the thermal conductivity has not been reported for carbon filamentcomposites, the volume electrical resistivity has, and a low electrical resistivity isexpected to correlate with a high thermal conductivity. The electrical resistivity ofa carbon filament polymer-matrix composite is higher than that of a nickel filamentcomposite or a nickel fiber composite at the same filler volume fraction and withthe same matrix polymer.23 At 13 vol.% carbon filaments, the DC resistivity of thecomposite is 0.37 Ω.cm; at 13 vol.% nickel filaments, the resistivity is 0.0035 Ω.cm.23
The high resistivity of the carbon filament composite is attributed to the highresistivity of the carbon filaments, which have not been graphitized, and to the largefilament-matrix interface area per unit volume due to the small diameters of thecarbon filaments (0.1 µm) compared to the nickel filaments (0.4 µm diameter).
10.8 STRAIN SENSORS
Because of the advent of smart structures, strain sensors are increasingly needed forstructural vibration control and in situ structural health monitoring. Compositescontaining conventional short carbon fibers have their volume electrical resistivitychange reversibly upon reversible strain, allowing them to serve as strain sensors.In the case of a composite with a ductile matrix (such as a polymer matrix), thisphenomenon is due to the change in the distance between adjacent fibers in thecomposite and is referred to as piezoresistivity.87 Tension causes this distance toincrease, thereby increasing resistivity; compression causes this distance to decrease,decreasing resistivity. In the case of a composite with an elastomer matrix, thephenomenon is different in both direction and origin; the resistivity decreases upon
©2001 CRC Press LLC
tension, as observed for a silicone-matrix composite with 0.4 µm diameter nickelfilaments (with a 0.1 µm diameter carbon filament core in each nickel filament23).88
This reverse piezoresistivity effect is probably due to the increase in filament align-ment upon tension. In the case of a composite with a brittle matrix, the phenomenonis not reverse but is different in origin; it is due to the slight (< 1 µm) pullout of thefiber bridging a crack as the crack opens, and the consequent increase in the contactelectrical resistivity of the fiber-matrix interface.89-91 Tension causes a crack to open,increasing the resistivity; compression causes a crack to close, decreasing the resis-tivity.
The use of carbon filaments in place of conventional short carbon fibers in apolymer-matrix composite improves the reproducibility and linearity of the piezore-sistivity effect.92 This is because of the small diameter of the filaments, which resultsin (1) a large number of filaments per unit volume of the composite, (2) reducedtendency of the filaments to buckle upon compression of the composite, and (3)reduced tendency for the matrix at the junction of adjacent filaments to be damaged.Furthermore, the use of the filaments enhances the tendency toward the reversepiezoresistivity effect.93
The use of carbon filaments in place of conventional short carbon fibers in acement-matrix composite results in increased noise in the electromechanical effect.17
This is because of the bent morphology and large aspect ratio of the filaments, whichhinder the pullout of filaments. Thus, carbon filaments are not attractive for cement-matrix composite strain sensors.
10.9 POROUS CARBONS
Porous carbons with high porosity (above 50 vol.%) and/or high specific surfacearea are useful for numerous nonstructural applications such as electrodes, catalysts,catalyst support, filters, chemical absorbers, molecular sieves, membranes, dentaland surgical prosthetic devices, and thermal insulators.94-102 They can be made fromcarbon fibers, which may be bound by a binder such as a polymer, pitch, or carbon.Alternatively, they can be made by carbonizing organic fibers that are bound by abinder. In either case, a pore-forming agent may be used, although it is not essential.Porous carbons can also be made from a polymer (such as a phenolic) that is notin the form of fibers, through foaming and carbonization. Due to the large diameters(typically 10 µm or more) of the carbon or organic fibers for fiber-based porouscarbons, and the foaming process for polymer-based porous carbons, the pores inthe resulting porous carbons are large (> 40 µm in mean size). As a result, porouscarbons are low in strength (< 7 MPa under compression) and in specific geometricsurface area (SGSA, < 1100 cm2/cm3). This is more serious for polymer-based porouscarbons than for fiber-based porous carbons. By using carbon filaments in place ofcarbon fibers, a porous carbon of mean pore size 4 µm, SGSA 35,000 cm2/cm3, andcompressive strength 30–35 MPa has been obtained.103
Carbons with high specific surface area include the conventional activated carbonbulk,104-106 activated carbon fibers,107 fine carbon particles,108 carbon aerogels,109 andcarbon nanotubes.110 Other than adsorbents for purification and chemical process-
©2001 CRC Press LLC

ing,104-106 these carbons are used as catalytic materials, battery electrode materials,capacitor materials, gas (e.g., hydrogen) storage materials, and biomedical engineer-ing materials. A hydrogen storage capacity of approximately 1.5 wt. % has beenreached at ambient temperature and a hydrogen pressure of 125 bar.110
A problem concerning porous carbon materials relates to the need for high-surface-area porous carbon materials with mesopores and/or macropores for someapplications; many macromolecules and ions encountered in purification, catalysis,and batteries cannot penetrate the surface of the carbon without such pores.
According to IUPAC, pores are classified into four types, namely macropores(diameter > 500 Å), mesopores (20 Å < diameter < 500 Å), micropores (8 Å <diameter < 20 Å), and micro-micropores (diameter < 8 Å). Most pores are microporesin conventional activated carbons. The pore volume in activated carbon fibers(including pitch-based, PAN-based, and rayon-based) is occupied by micropores(mainly) and micro-micropores. The pore volume in carbon aerogels is occupied bymesopores (mainly) and micropores. On the other hand, the specific surface areasof carbon aerogels are low (e.g., 650 m2/g106) compared to activated carbons (as highas 3000 m2/g).
A mesoporous carbon (83% of total pore volume being > 30 Å pore size, 17%of total pore volume being < 30 Å pore size) that has a total pore volume of 1.55cm3/g and high specific surface area (1310 m2/g) is in the form of carbon filamentsthat have been surface-oxidized in ozone at 150°C and then activated in CO2 + N2
(1:1) at 970°C.111 Without activation, the filaments have only 44–57% of the totalpore volume being > 30 Å pore size, and the specific surface area is low (41–54m2/g). Activation by CO2 greatly increases the specific surface area. This is in contrastto conventional carbon fibers, which have essentially no pores. The porous natureof the filaments is attributed to the fact that the filaments are made from carbonaceousgases. The separation between adjacent filaments in a filament compact is of theorder of 0.1 µm, thus providing macropores within the compact. These elongatedmacropores serve as channels that facilitate fluid flow. The combination of mesoporeswithin each filament and macropores between the filaments is in contrast to carbonaerogels, which have micropores within each particle and between particles, andmesopores between chains of interconnected particles. The mesoporous activatedcarbon filaments have mean mesopore size (BJH) of 54 Å.
10.10 CATALYST SUPPORT
Catalytically grown carbon filaments, even without activation, have been shown tobe effective catalyst (e.g., Ni- and Fe-based particles) support material.112-117 Thecatalytic activity for the conversion of hydrocarbons is higher than that when thecatalyst particles are supported on either active carbon or γ-alumina.113,115 The dis-persion of a catalyst on carbon filaments is improved by prior surface treatment ofthe filaments by oxidation (using nitric acid).118 A platinum catalyst supported bycarbon filaments is more active and filters more easily than that supported byactivated carbon, as shown for the hydrogenation of nitrobenzene.118
©2001 CRC Press LLC

10.11 CONCLUSION
Applications of submicron-diameter carbon filaments include structural applications,EMI shielding, electromagnetic reflection, surface electrical conduction, DC elec-trical conduction, electrochemical applications, thermal conduction, strain sensors,and catalyst support. Most applications involve the incorporation of the carbonfilaments in composites, most commonly polymer-matrix composites. Particularlypromising applications include (1) the use of carbon filaments between layers ofconventional continuous carbon fibers for improving the vibration damping abilityand the storage modulus in the transverse direction; (2) coating the carbon filamentswith nickel to form nickel filaments for use as a filler in polymer-matrix compositesfor EMI shielding, electrostatic discharge protection, and microwave waveguides;(3) the use of carbon filaments as a filler in concrete for lateral guidance in automatichighways; (4) the use of carbon filaments as a porous electrode and as an electricallyconducting additive in a nonconducting electrode for lithium primary cells; (5) theuse of carbon filaments for double-layer capacitors; (6) the use of carbon filamentsas a filler in a polymer-matrix composite strain sensor; (7) the use of carbon nano-tubes and activated carbon filaments for adsorption, hydrogen storage, and catalystsupport; and (8) the use of carbon nanotubes for field emission.
ACKNOWLEDGMENT
This work was supported by the Defense Advanced Research Projects Agency ofthe U.S. Department of Defense.
REFERENCES
1. N.M. Redriguez, J. Mater. Res. 8(12), 3233-3250 (1993).2. P. Chitrapu, C.R.F. Lund and J.A. Tsamopoulos, Carbon 30(2), 285-293 (1992).3. S. Subramoney, The Electrochemical Society Interface 18(4), 34-37 (1999).4. D.D.L. Chung, Carbon Fiber Composites, Butterworth-Heinemann, Boston (1994).5. L.H. Peebles, Carbon Fibers, CRC Press, Boca Raton (1994).6. M.S. Dresselhaus, G. Dresselhaus, K. Sugihara, I.L. Spain and H.A. Goldberg, Graph-
ite Fibers and Filaments, Vol. 1, Springer-Verlag, Berlin (1988).7. M. Endo, CHEMTECH 18(9), 568-576 (1988).8. G.G. Tibbetts, Carbon 27(5) 745-747 (1989).9. G.G. Tibbetts, D.W. Gorkiewicz and R.L. Alig, Carbon 31(5), 809-814 (1993).
10. T. Kato, T. Matsumoto, T. Saito, J.-H. Hayashi, K. Kusakabe and S. Morooka, Carbon31(6), 937-940 (1993).
11. S.R. Mukai, T. Masuda, T. Harada and K. Hashimoto, Carbon 34(5), 645-648 (1996).12. T. Masuda, S.R. Mukai, H. Fujikawa, Y. Fujikata and K. Hashimoto, Mater. Manuf.
Proc. 9(2), 237-247 (1994).13. M. Ishioka, T. Okada and K. Matsubara, J. Mater. Res. 7(11), 3019-3022 (1992).14. G.G. Tibbetts, SAE Transactions 99, Sect. 1, pp. 246-249 (1990).15. L. Li and D.D.L. Chung, Composites 25(3), 215-224 (1994).
©2001 CRC Press LLC

16. X. Shui and D.D.L. Chung, J. Electron. Mater. 26(8), 928-934 (1997).17. X. Fu and D.D.L. Chung, Cem. Concr. Res. 26(10), 1467-1472 (1996); 27(2), 314
(1997)18. S.W. Hudnut and D.D.L. Chung, Carbon 33(11), 1627-1631 (1995).19. W.B. Downs and R.T.K. Baker, Carbon 29(8), 1173-1179 (1991).20. W.B. Downs and R.T.K. Baker, J. Mater. Res. 10(3), 625-633 (1995).21. X. Shui and D.D.L. Chung, 38th Int. SAMPE Symp. Exhib., Book 2, Vince Bailey,
Gerald C. Janicki and Thomas Haulik, Eds., pp. 1869-1875 (1993).22. X. Shui, C.A. Frysz and D.D.L. Chung, Carbon 33(12), 1681-1698 (1995).23. X. Shui and D.D.L. Chung, J. Electron. Mater. 24(2), 107-113 (1995).24. G.G. Tibbetts and J.J. McHugh, J. Mater. Res. 14(7), 2871-2880 (1999).25. X. Fu and D.D.L. Chung, Carbon 36(4), 459-462 (1998).26. G. Caldeira, J.M. Maia, O.S. Carneiro, J.A. Covas and C.A. Bernardo, ANTEC ’97,
2, 2352-2356 (1997).27. X. Fu, W. Lu and D.D.L. Chung, Carbon 36(9), 1337-1345 (1998).28. Ch. Laurent, A. Peigney, O. Quenard and A. Rousset, Key Eng. Mater. 132-136 (Pt. 1),
157-160 (1997).29. B.D. Mottahed and S. Manoocheheri, Polym.-Plast. Technol. Eng. 34(2), 271-346
(1995).30. P.S. Neelakanta and K. Subramaniam, Adv. Mater. Proc. 141(3), 20-25 (1992).31. G. Lu, X. Li and H. Jiang, Compos. Sci. Tech. 56, 193-200 (1996).32. Kaynak, A. Polat and U. Yilmazer, Mater. Res. Bull. 31(10), 1195-1206 (1996).33. P.B. Jana and A.K. Mallick, J. Elastomers Plast. 26(1), 58-73 (1994).34. J.-M. Chiou, Q. Zheng and D.D.L. Chung, Composites 20(4), 379-381 (1989).35. X. Shui and D.D.L. Chung, J. Mater. Sci. 35, 1773-1785 (2000).36. X. Fu and D.D.L. Chung, Cem. Concr. Res. 28(6), 795-801 (1998).37. V. Chellappa and B.Z. Jang, J. Mater. Sci. 30(19), 4879-4883 (1995).38. C.W. Farriss II, F.N. Kelley and E. Von Meerwall, J. Appl. Polym. Sci. 55(6), 935-943
(1995).39. J. Sandler, M.S.P. Shaffer, T. Prasse, W. Bauhofer, K. Schulte and A.H. Windle,
Polymer 40, 5967-5971 (1999).40. S.A. Curran, P.M. Ajayan, W.J. Blau, D.L. Carroll, J.N. Coleman, A.B. Dalton, et.
al., Adv. Mater. 10(14), 1091-1093 (1998).41. L. Dai, Polymers Adv. Tech. 10(7), 357-420 (1999).42. R.Z. Ma, C.L. Xu, B.Q. Wei, J. Liang, D.H. Wu and D.J. Li, Mater. Res. Bull. 34(5),
741-747 (1999).43. J.-M. Bonard, J.-P. Salvetat, T. Stockli, L. Forro and A. Chatelain, Appl. Phys. 69(3),
245-254 (1999).44. S. Huang, L. Dai and A.W.H. Mau, J. Phys. Chem. B. 103(21), 4223-4227 (1999).45. Y. Saito and S. Uemura, Carbon 38(2), 169-182 (2000).46. Y. Saito, K. Hamaguchi, R. Mizushima, S. Uemura, T. Nagasako, J. Yotani, et al.,
Appl. Surface Sci. 146(1), 305-311 (1999).47. Y. Saito, Nihon Enerugi Gakkaishi/Journal of the Japan Institute of Energy 77(9),
867-875 (1998) (Japanese).48. T. Habermann, A. Goehl, K. Janischowsky, D. Nau, M. Stammler, L. Ley, et al., Proc.
of the IEEE International Vacuum Microelectronics Conference, pp. 200-201 (1998).49. K.A. Dean, P. VonAllmen and B.R. Chalamala, Proc. of the IEEE International
Vacuum Microelectronics Conference, pp. 196-197 (1998).50. Y. Saito, K. Hamaguchi, S. Uemura, K. Uchida, Y. Tasaka, F. Ikazaki, et al., Appl.
Phys. 67(1), 95-100 (1998).
©2001 CRC Press LLC

51. N.I. Sinitsyn, Y.V. Gulyaev, G.V. Torgashov, L.A. Chernozatonskii, Z.Y. Kosak-ovskaya, Y.F. Zakharchenko, et al., Appl. Surface Sci. 111, 145-150 (1997).
52. Y.V. Gulyaev, L.A. Chernozatonskii, Z.Y. Kosakovskaya, A.L. Musatov, N.I. Sinitsinand G.V. Torgashov, Proc. of the IEEE International Vacuum Microelectronics Con-ference, pp. 5-9 (1996)
53. N.I. Sinitsyn, Y.V. Gulyaev, N.D. Devjatkov, M.B. Golant, A.M. Alekseyenko, Y.F.Zakharchenko, et al., Radiotekhnika (4), 8-17 (1999) (Russian).
54. M.W. Verbrugge and D.J. Koch, J. Electrochem. Soc. 143(1), 24-31 (1996).55. M. Endo, J.-I. Nakamura, A. Emori, Y. Sasabe, K. Takeuchi and M. Inagaki, Molecular
Crystals and Liquid Crystals, Proc. 7th Int. Symp. on Intercalation Compounds, 244,171-176 (1994).
56. T. Takamura, M. Kikuchi, H. Awano, U. Tatsuya, and Y. Ikezawa, Materials ResearchSociety Symp. Proc., 393, 345-355 (1995).
57. T. Tamaki, Ibid, pp. 357-365.58. R. Yazami, K. Zaghib, and M. Deschamps, J. Power Sources 52, 55-59 (1994).59. O. Chusid, Y. Ein Ely, D. Aurbach, M. Babai and Y. Carmeli, J. Power Sources 43-44,
47-64 (1993).60. M. Endo, Y. Nishimura, T. Takahashi, K. J. Phys. Chem. Solids 57(6-8), 725-728
(1996).61. M. Endo, Y. Okada and H. Nakamura, Synth. Met. 34(1-3), 739-744 (1989).62. K. Zaghib, K. Tatsumi, H. Abe, T. Ohsaki, Y. Sawad and S. Higuchi, J. Electrochem.
Soc. 145(1), 210-215 (1998).63. S. Biniak, B. Dzielendziak and J. Siedlewski, Carbon 33(9), 1255-1263 (1995).64. Tanahashi, A. Yoshida and A. Nishino, Carbon 28(4), 477-482 (1990).65. M. Ishikawa, M. Morita, M. Ihara and Y. Matsuda, J. Electrochem. Soc. 141(7), 1730-
1734 (1994).66. Y. Matsuda, M. Morita, M. Ishikawa and M. Ihara, J. Electrochem. Soc. 140(7), L109-
L110 (1993).67. R.Z. Ma, J. Liang, B.Q. Wei, B. Zhang, C.L. Xu and D.H. Wu, J. Power Sources
84(1), 126-129 (1999).68. S.M. Lipka, Proc. 13th Annual Battery Conference on Applications and Advances,
IEEE, pp. 373-374 (1998).69. G. Che, B.B. Lakshmi, C.R. Martin and E.R. Fisher, Langmuir 15(3), 750-758 (1999).70. M. Burghard, G. Duesberg, G. Philipp, J. Muster and S. Roth, Adv. Mater. 10(8),
584-588 (1998).71. J.J. Davis, R.J. Coles and H.A.O. Hill, J. Electroanal. Chem. 440(1-2), 279-282
(1997).72. N. Grobert, M. Terrones, A.J. Osborne, H. Terrones, W.K. Hsu, S. Trasobares, et al.,
Appl. Phys. 67(5), 595-598 (1998).73. P.J. Britto, K.S.V. Santhanam, A. Rubio, J.A. Alonso and P.M. Ajayan, Adv. Mater.
11(2), 154-157 (1999).74. X. Shui, D.D.L. Chung and C.A. Frysz, J. Power Sources 47(3), 313-320 (1994).75. C.A. Frysz, X. Shui and D.D.L. Chung, J. Power Sources 58(1), 55-66 (1996).76. C.A. Frysz, X. Shui and D.D.L. Chung, J. Power Sources 58(1), 41-54 (1996).77. C. Niu, E.K. Sichel, R. Hoch, D. Moy and H. Tennent, Appl. Phys. Lett. 70(11),
1480-1482 (1997).78. X. Shui, C.A. Frysz and D.D.L. Chung, Carbon 35(10-11), 1439-1455 (1997).79. W.E. Lundblad, H.S. Starrett and C.W. Wanstrall, Proc. 26th Int. SAMPE Technical
Conference, pp. 759-764 (1994).80. B. Nysten and J.-P. Issi, Composites 21(4), 339-343 (1990).
©2001 CRC Press LLC

81. J.-M. Ting, J.R. Guth and M.L. Lake, Proc. 19th Annual Conf. Composites, AmericanCeramic Soc., 16(4), 279-288 (1995).
82. J.-M. Ting, M.L. Lake and D.R. Duffy, J. Mater. Res. 10(6), 1478-1484 (1995).83. J.-M. Ting and M.L. Lake, J. Mater. Res. 10(2), 247-250 (1995).84. J.-M. Ting and M.L. Lake, J. Nuclear Mater. 212(1), Pt. B, 1141-1145 (1994).85. J.-M. Ting and M.L. Lake, Carbon 33(5), 663-667 (1995).86. J.-M. Ting and M.L. Lake, Diamond and Related Materials 3(10), 1243-1248 (1994).87. X. Wang and D.D.L. Chung, Smart Mater. Struct. 4, 363-367 (1995).88. X. Shui and D.D.L. Chung, Smart Mater. Struct. 6, 102-105 (1997).89. P.-W. Chen and D.D.L. Chung, ACI Mater. J. 93(4), 341-350 (1996).90. P.-W. Chen and D.D.L. Chung, Composites 27B, 11-23 (1996).91. P.-W. Chen and D.D.L. Chung, Smart Mater. Struct. 2, 22-30 (1993).92. X. Shui and D.D.L. Chung, Smart Mater. Struct. 5, 243-246 (1996).93. V. Chellappa, Z.W. Chiou and B.Z. Jang, J. Mater. Sci. 30(17), 4263-4272 (1995).94. E.E. Hucke, U.S. Patent 3,859,421 (1975)95. J. Wang, Electrochim. Acta 26, 1721-1726 (1981).96. A.N. Strohl and D.J. Curran, Anal. Chem. 51, 1050-1053 (1979).97. W.J. Blaedel and J. Wang, Anal. Chem. 52(11), 1697-1700 (1980).98. I.C. Agarwal, A.M. Rochon, H.D. Gesser and A.B. Sparling, Water Res. 18, 227-232
(1984).99. A.P. Sylwester, J.H. Aubert, P.B. Rand, C. Arnold, Jr. and L.R. Clough, Polymer.
Mater. Sci. Eng. 57, 113-117 (1987).100. A.P. Sylwester and R.L. Clough, Synth Met. 29(2-3), 253-258 (1989).101. Y. Oren and A. Soffer, Electrochim. Acta 28, 1649-1654 (1983).102. C. Lestrade, P.Y. Guyomar and M. Astruc, Environ. Technol. Lett. 2, 409 (1981).103. X. Shui and D.D.L. Chung, Carbon 34(6), 811-814 (1996); 34(9), 1162 (1996).104. M.M. Dubinin, N.S. Polyakov and G.A. Petukhova, Adsorption Science Tech. 10(1-4),
17-26 (1993).105. H.-L. Chiang, P.C. Chiang and J.H. You, Toxicol. Environ. Chem. 47(1-2), 97-108
(1995).106. Y. Takeuchi and T. Itoh, Sep. Technol. 3(3), 168-175 (1993).107. J. Alcaniz-Monge, D. Cazorla-Amoros, A. Linares-Solano, S. Yoshida and A. Oya,
Carbon 32(7), 1277-1283 (1994).108. R. Ghosal, D.J. Kaul, U. Boes, D. Sanders, D.M. Smith and A. Maskara, Materials
Research Society Symp. Proc., 371, 413-423 (1995).109. A.W.P. Fung, Z.H. Wang, K. Lu, M.S. Dresslehaus and R.W. Pekala, J. Mater. Res.
8(8), 1875-1885 (1993).110. R. Ströbel, L. Jörissen, T. Schliermann, V. Trapp, W. Schütz, K. Bohmhammel,
G. Wolf and J. Garche, J. Power Sources 84(2), 221-224 (1999).111. W. Lu and D.D.L. Chung, Carbon 35(3), 427-430 (1997).112. M. Kim, N.M. Rodriguez and R.T.K. Baker, Mater. Res. Soc. Symp. Proc., 368,
99-104 (1995).113. N.M. Rodriguez, M.-S. Kim and R.T.K. Baker, J. Phys. Chem. 98(50), 13108-13111
(1994).114. C. Park and R.T.K. Baker, Mater. Res. Soc. Symp. Proc., 497, 145-150 (1998).115. Chambers, T. Nemes, N.M. Rodriguez and R.T.K. Baker, J. Phys. Chem. 102,
2251-2258 (1998).116. C. Park, N.M. Rodriguez and R.T.K. Baker, Mater. Res. Soc. Symp. Proc., 454, 21-26
(1997).
©2001 CRC Press LLC

117. C. Park, R.T.K. Baker and N.M. Rodriguez, Coke Formation and MitigationPreprints — American Chemical Society, Div. Petroleum Chem., 40(4), 646-648(1995).
118. J.W. Geus, A.J. Van Dillen and M.S. Hoogenraad, Mater. Res. Soc. Symp. Proc., 368,87-98 (1995).
©2001 CRC Press LLC

Improving Cement-Based Materials by Using Silica Fume
CONTENTS
11.1 Introduction11.2 Workability11.3 Mechanical Properties 11.4 Vibration Damping Capacity11.5 Sound Absorption11.6 Freeze-Thaw Durability11.7 Abrasion Resistance11.8 Shrinkage11.9 Air Void Constant and Density11.10 Permeability11.11 Steel Rebar Corrosion Resistance11.12 Alkali-Silica Reactivity Reduction11.13 Chemical Attack Resistance11.14 Bond Strength to Steel Rebar11.15 Creep Rate11.16 Coefficient of Thermal Expansion11.17 Specific Heat11.18 Thermal Conductivity11.19 Fiber Dispersion11.20 ConclusionReferences
SYNOPSIS The effects of silica fume as an admixture in cement-based materialsare reviewed in terms of the mechanical properties, vibration damping capacity,freeze-thaw durability, abrasion resistance, shrinkage, air void content, density, per-meability, steel rebar corrosion resistance, alkali-silica reactivity reduction, chemicalattack resistance, bond strength to steel rebar, creep rate, coefficient of thermalexpansion, specific heat, thermal conductivity, fiber dispersion, and workability. Theeffects of silane treatment of the silica fume and of the use of silane as an additionaladmixture are also addressed.
11
©2001 CRC Press LLC

11.1 INTRODUCTION
Cement-based materials such as concrete have long been used for civil infrastructuresuch as highways, bridges, and buildings. However, the deterioration of the civilinfrastructure across the U.S. has led to the realization that cement-based materialsmust be improved in terms of their properties and durability. The fabrication of thesematerials involves mixing cement, water, aggregates, and other additives (calledadmixtures). The use of admixtures is a convenient way of improving cement-basedmaterials. Techniques involving special mixing, casting, or curing procedures tendto be less attractive because of the need for special equipment in the field. Anadmixture that is particularly effective is silica fume,1-4 although there are otherssuch as latex and short fibers that are more expensive. This chapter focuses on theuse of silica fume to improve cement-based materials.
Silica fume is very fine noncrystalline silica generated by electric arc furnacesas a by-product of the fabrication of metallic silicon or ferrosilicon alloys. It is apowder with particles having diameters 100 times smaller than Portland cement, i.e.,mean particle size between 0.1 and 0.2 µm. The SiO2 content ranges from 85 to98%. Silica fume is pozzolanic, meaning it is reactive, like volcanic ash.
The property improvements needed for cement-based materials include increasesin strength, modulus, and ductility; decrease in the drying shrinkage; decrease inthe permeability to liquids and chloride ions; and increase in the durability to freeze-thaw temperature cycling.
Silica fume used as an admixture in a concrete mix has significant effects onthe properties of the resulting material. These effects pertain to the strength, modulus,ductility, vibration damping capacity, sound absorption, abrasion resistance, air voidcontent, shrinkage, bonding strength with reinforcing steel, permeability, chemicalattack resistance, alkali-silica reactivity reduction, corrosion resistance of embeddedsteel reinforcement, freeze-thaw durability, creep rate, coefficient of thermal expan-sion (CTE), specific heat, thermal conductivity, and degree of fiber dispersion inmixes containing short microfibers. In addition, silica fume addition degrades theworkability of the mix.
The data given in this chapter to illustrate the effects of silica fume are all forsilica fume from Elkem Materials Inc. (EMS 965) used in the amount of 15% byweight of cement. The cement is Portland cement (Type I) from Lafarge Corp. Curingis in air at room temperature with a relative humidity of 100% for 28 days. Thewater-reducing agent, if used, is a sodium salt of a condensed naphthalenesulphonicacid from Rohm and Haas Co. (TAMOL SN®).
11.2 WORKABILITY
Silica fume causes workability and consistency losses,5-18 which are barriers againstproper utilization of silica fume concrete. However, the consistency of silica fumemortar is greatly enhanced by using either silane-treated silica fume or silane as anadditional admixture.19,20 The effectiveness of silane for cement is due to the reac-tivity of its molecular ends with –OH groups, which are present on the surface ofboth silica and cement.
©2001 CRC Press LLC

Table 11.119,20 shows that silane introduction using either the coating or admix-ture method causes the silica fume mortar mix to increase in workability (slump).With silane (by either method) and no water-reducing agent, the workability of silicafume mortar mix is better than that of the mix with as-received silica fume andwater-reducing agent in the amount of 1% by weight of cement. With silane (byeither method) and water-reducing agent in the amount of 0.2% by weight of cement,the workability is almost as good as the mix with as-received silica fume and water-reducing agent in the amount of 2% by weight of cement.
The increase in workability due to silane introduction is because of the improvedwettability of silica fume by water. The improved wettability is expected from thehydrophylic nature of the silane molecule. Silane treatment involves formation of asilane coating on the surface of the silica fume; it does not cause surface roughening.21
11.3 MECHANICAL PROPERTIES
The most well-known effect of silica fume is the increase in strength,17,18,20,22-52
including compressive strength,17,20,53-81 tensile strength,20,60,63,71,72,82 and flexuralstrength.59,66,72,83,84 The strengthening is due to the pozzolanic activity of silica fumecausing improved strength of the cement paste;36,79 the increased density of mortaror concrete resulting from the fineness of silica fume and the consequent efficientreaction to form hydration products, which fill the capillaries between cement andaggregate;50 the refined pore structure;55,76 and the microfiller effect of silica fume.76,77
In addition, the modulus is increased.20,44,48,53,73,85 These effects are also partly dueto the densification of the interfacial zone between paste and aggregate.85
As shown in Table 11.220 for cement pastes at 28 days of curing, the tensilestrength, tensile ductility, compressive strength, and compressive modulus areincreased, and the compressive ductility is decreased by the addition of silica fumethat has not been surface treated. The tensile strength and compressive strength arefurther increased, and the compressive ductility further decreased, when silane-
TABLE 11.1Workability of Mortar Mix (The water/cement ratio was 0.35.)
Silica FumeWater-Reducing Agent/Cement
Slump (mm)
Plain 0% *With untreated silica fume 0% 150With untreated silica fume 1% 186With untreated silica fume 2% 220With treated silica fume 0% 194With treated silica fume 0.2% 215With silane and untreated silica fume 0% 197With silane and untreated silica fume 0.2% 218
* Too large to be measured.
©2001 CRC Press LLC
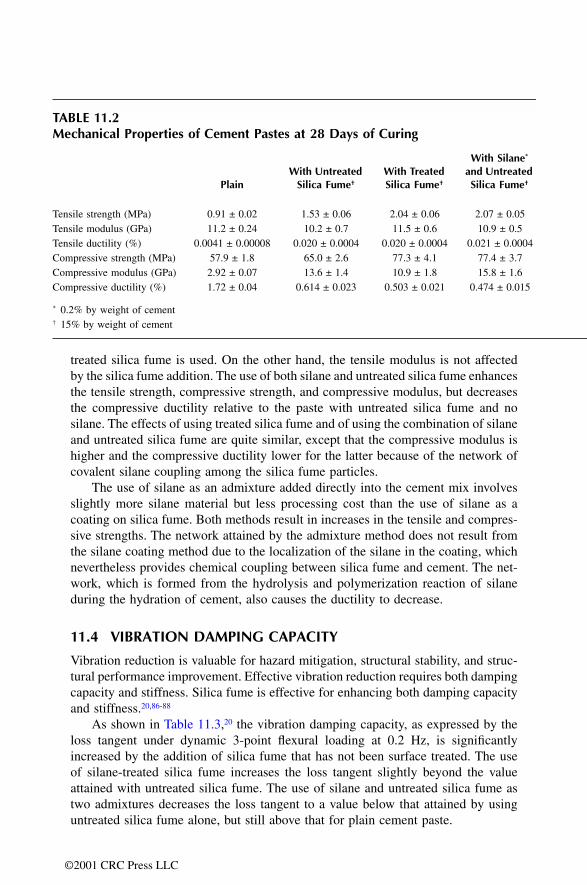
TM
TeTeTeCCC
*
†
treated silica fume is used. On the other hand, the tensile modulus is not affectedby the silica fume addition. The use of both silane and untreated silica fume enhancesthe tensile strength, compressive strength, and compressive modulus, but decreasesthe compressive ductility relative to the paste with untreated silica fume and nosilane. The effects of using treated silica fume and of using the combination of silaneand untreated silica fume are quite similar, except that the compressive modulus ishigher and the compressive ductility lower for the latter because of the network ofcovalent silane coupling among the silica fume particles.
The use of silane as an admixture added directly into the cement mix involvesslightly more silane material but less processing cost than the use of silane as acoating on silica fume. Both methods result in increases in the tensile and compres-sive strengths. The network attained by the admixture method does not result fromthe silane coating method due to the localization of the silane in the coating, whichnevertheless provides chemical coupling between silica fume and cement. The net-work, which is formed from the hydrolysis and polymerization reaction of silaneduring the hydration of cement, also causes the ductility to decrease.
11.4 VIBRATION DAMPING CAPACITY
Vibration reduction is valuable for hazard mitigation, structural stability, and struc-tural performance improvement. Effective vibration reduction requires both dampingcapacity and stiffness. Silica fume is effective for enhancing both damping capacityand stiffness.20,86-88
As shown in Table 11.3,20 the vibration damping capacity, as expressed by theloss tangent under dynamic 3-point flexural loading at 0.2 Hz, is significantlyincreased by the addition of silica fume that has not been surface treated. The useof silane-treated silica fume increases the loss tangent slightly beyond the valueattained with untreated silica fume. The use of silane and untreated silica fume astwo admixtures decreases the loss tangent to a value below that attained by usinguntreated silica fume alone, but still above that for plain cement paste.
ABLE 11.2echanical Properties of Cement Pastes at 28 Days of Curing
PlainWith Untreated
Silica Fume†
With Treated Silica Fume†
With Silane* and UntreatedSilica Fume†
nsile strength (MPa) 0.91 ± 0.02 1.53 ± 0.06 2.04 ± 0.06 2.07 ± 0.05nsile modulus (GPa) 11.2 ± 0.24 10.2 ± 0.7 11.5 ± 0.6 10.9 ± 0.5nsile ductility (%) 0.0041 ± 0.00008 0.020 ± 0.0004 0.020 ± 0.0004 0.021 ± 0.0004
ompressive strength (MPa) 57.9 ± 1.8 65.0 ± 2.6 77.3 ± 4.1 77.4 ± 3.7ompressive modulus (GPa) 2.92 ± 0.07 13.6 ± 1.4 10.9 ± 1.8 15.8 ± 1.6ompressive ductility (%) 1.72 ± 0.04 0.614 ± 0.023 0.503 ± 0.021 0.474 ± 0.015
0.2% by weight of cement15% by weight of cement
©2001 CRC Press LLC

The ability of silica fume to enhance damping capacity is due to the large areaof the interface between silica fume particles and the cement matrix, and the con-tribution of interface slippage to energy dissipation. Although the pozzolanic natureof silica fume makes the interface rather diffuse, the interface still contributes todamping. The silane covalent coupling introduced by the silane surface treatmentof silica fume can move during vibration, thus providing another mechanism fordamping and enhancing the loss tangent. The network introduced by the use of silaneand untreated silica fume as two admixtures restricts movement, therefore reducingthe damping capacity relative to the case with untreated silica fume alone. Never-theless, the use of the two admixtures enhances the damping capacity relative toplain cement paste, as even less movement is possible in plain cement paste.
The storage modulus (Table 11.3) is much increased by the addition of untreatedsilica fume, is further increased by the use of silane-treated silica fume, and is stillfurther increased by the use of silane and untreated silica fume as two admixtures.The increase in storage modulus upon addition of untreated silica fume is attributedto the high modulus of silica compared to the cement matrix. The enhancement ofthe storage modulus by the use of silane-treated silica fume is due to the chemicalcoupling provided by the silane between silica fume and cement. The furtherenhancement of the storage modulus by the use of silane and untreated silica fumeas two admixtures is due to the network of covalent coupling among the silica fumeparticles.
The loss modulus (Table 11.3) is the product of the loss tangent and the storagemodulus. As vibration reduction requires both damping and stiffness, both losstangent and storage modulus should be high for effective vibration reduction. Hence,the loss modulus serves as an overall figure of merit for vibration reduction ability.The loss modulus is much increased by the addition of untreated silica fume, andis further increased by the use of silane-treated silica fume. However, the use ofsilane and untreated silica fume as two admixtures decreases the loss modulus to avalue below the paste with untreated silica fume alone because of the decrease inthe loss tangent. As a result, the use of silane-treated silica fume yields the highestvalue of the loss modulus.
TABLE 11.3Dynamic Flexural Properties of Cement Pastes at a Flexural (3-Point Bending) Loading Frequency of 0.2 Hz
Loss Tangent(tan δ, ±0.002)
Storage Modulus(GPa, ±0.03)
Loss Modulus(GPa, ±0.02)
Plain 0.035 1.91 0.067With untreated silica fume† 0.082 12.71 1.04With treated silica fume† 0.087 16.75 1.46With silane* and untreated silica fume† 0.055 17.92 0.99
* 0.2% by weight of cement† 15% by weight of cement
©2001 CRC Press LLC

11.5 SOUND ABSORPTION
Sound or noise absorption is useful for numerous structures, such as pavementoverlays and noise barriers. The addition of silica fume to concrete improves soundabsorption ability.88 The effect is related to the increase in vibration damping capacity.
11.6 FREEZE-THAW DURABILITY
Freeze-thaw durability refers to the ability to withstand changes between tempera-tures above 0°C and those below 0°C. Due to the presence of water, which undergoesfreezing and thawing, concrete tends to degrade upon such temperature cycling. Airvoids (called air entrainment) are used as cushions to accommodate the changes involume, thereby enhancing freeze-thaw durability.
The addition of silica fume to mortar improves freeze-thaw durability,89-92 inspite of the poor air-void system.92 However, the use of air entrainment is stillrecommended.93-97 The addition of silica fume also reduces scaling.98
11.7 ABRASION RESISTANCE
The addition of untreated silica fume to mortar increases abrasion resistance,48,98,99
as shown by the depth of wear decreasing from 1.07 to 0.145 mm (as tested usingASTM C944-90a, Rotating-Cutter Method).99 Abrasion resistance is furtherimproved by using acid-treated silica fume.100
11.8 SHRINKAGE
The hydration reaction that occurs during the curing of cement causes shrinkage,called “autogenous shrinkage,” which is accompanied by a decrease in the relativehumidity within the pores. If curing is conducted in an open atmosphere, as is oftenthe case, additional shrinkage occurs due to the movement of water through thepores to the surface, and the loss of water on the surface by evaporation. The overallshrinkage that occurs is known as the “drying shrinkage,” which is the shrinkagethat is practically important.
Drying shrinkage can cause cracking and prestressing loss.101 The addition ofuntreated silica fume to cement paste decreases drying shrinkage20,34,101-105 (Table11.4). This desirable effect is partly due to the reduction of the pore size andconnectivity of the voids, and partly due to the prestressing effect of silica fume,which restrains shrinkage. The use of silane-treated silica fume in place of untreatedsilica fume further decreases drying shrinkage because of the hydrophylic characterof the silane-treated silica fume, and the formation of chemical bonds between silicafume particles and cement.20 The use of silane and untreated silica fume as twoadmixtures also decreases the drying shrinkage, but not as significantly as the useof silane-treated silica fume.20 However, silica fume has also been reported toincrease drying shrinkage,34,106,107 and the restrained shrinkage crack width isincreased by silica fume addition.108
©2001 CRC Press LLC

Due to the pozzolanic nature of silica fume, silica fume addition increases theautogenous shrinkage, as well as the autogenous relative humidity change.109,110
These effects are undesirable, as they may cause cracking if the deformation isrestrained.
Carbonization refers to the chemical reaction between CO2 and cement, as madepossible by the in-diffusion of CO2 gas. This reaction causes shrinkage, called“carbonization shrinkage.” Due to the effect of silica fume addition on the porestructure, which affects the in-diffusion, carbonization shrinkage may be avoided bythe addition of silica fume.111
Concrete exposed to hot climatic conditions soon after casting is particularlyprone to plastic shrinkage cracking,112 which is primarily due to the development oftensile capillary pressure during drying. Silica fume addition increases the plasticshrinkage113 because of the high tensile capillary pressure resulting from the highsurface area of the silica fume particles.
11.9 AIR VOID CONTENT AND DENSITY
The air void content of cement paste (Table 11.5) is increased by the addition ofuntreated silica fume.20,114 Along with this effect is a decrease in density (Table 11.6).Both effects are related to the reduction in drying shrinkage. The introduction ofsilane by either coating or admixture decreases the air void content, but the valueis still higher than that of plain cement paste. The use of the admixture method ofsilane introduction increases the density to a value almost as high as that of plaincement paste because of the network of covalent coupling among the silica fumeparticles.20 On the other hand, the air void content of concrete is decreased by silicafume addition,8,17 probably because of the densification of the paste-aggregate inter-face.85
11.10 PERMEABILITY
The permeability of chloride ions in concrete is decreased by the addition ofuntreated silica fume.5,8,17,22,25,30-32,46,47,50,57,59,78,103,115-138 Related to this effect is thedecrease in water absorptivity. Both effects are due to the microscopic pore structureresulting from the calcium silicate hydrate (CSH) formed upon the pozzolanicreaction of silica fume with free lime during the hydration of concrete.139-163
TABLE 11.4Drying Shrinkage Strain (10–4, ±0.015) of Cement Pastes at 28 Days
Plain 4.98With untreated silica fume 4.41With treated silica fume 4.18With silane and untreated silica fume 4.32
©2001 CRC Press LLC

11.11 STEEL REBAR CORROSION RESISTANCE
The addition of untreated silica fume to steel-reinforced concrete enhances thecorrosion resistance of the reinforcing steel.163-177 This is related to the decrease inpermeability.
11.12 ALKALI-SILICA REACTIVITY REDUCTION
Alkali-silica reactivity refers to the reactivity of silica (present in most aggregates)and alkaline ions (present in cement). It is detrimental due to the expansion causedby the reaction product. This reactivity is reduced by the addition of silica fume178-195
because of the effectiveness of silica fume in removing alkali from the pore solu-tion,184,185,190 reducing the alkali ion (Na+, K+, OH–) concentrations in the poresolution,193,195 and retarding the transportation of alkalis to reaction sites.192 However,silica fume with coarse particles or undispersed agglomerates can induce distressrelated to alkali-silica reactivity.196
11.13 CHEMICAL ATTACK RESISTANCE
The addition of untreated silica fume to concrete enhances chemical attackresistance197-213 whether the chemical is acid, sulfate, chloride, etc. This effect isrelated to the decrease in permeability.
11.14 BOND STRENGTH TO STEEL REBAR
The addition of untreated silica fume to concrete increases the shear bond strengthbetween concrete and steel rebar.214-220 This effect is mainly due to the reducedporosity and thickness of the transition zone adjacent to the steel, thereby improving
TABLE 11.5Air Void Content (%, ±0.02) of Cement Pastes
Plain 2.32With untreated silica fume 3.73With treated silica fume 3.26With silane and untreated silica fume 3.19
TABLE 11.6Density (g/cm3, ±0.02) of Cement Pastes
Plain 2.01With untreated silica fume 1.72With treated silica fume 1.73With silane and untreated silica fume 1.97
©2001 CRC Press LLC
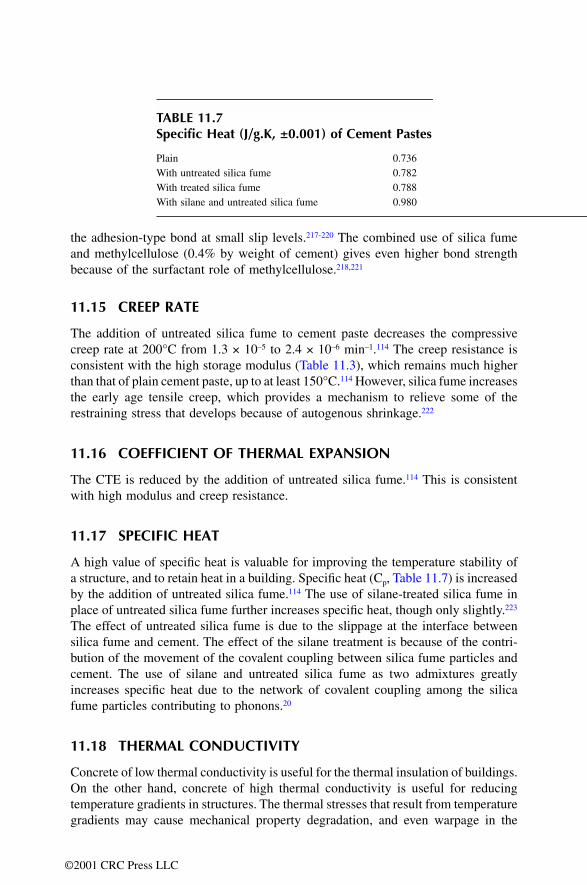
the adhesion-type bond at small slip levels.217-220 The combined use of silica fumeand methylcellulose (0.4% by weight of cement) gives even higher bond strengthbecause of the surfactant role of methylcellulose.218,221
11.15 CREEP RATE
The addition of untreated silica fume to cement paste decreases the compressivecreep rate at 200°C from 1.3 × 10⁻⁵ to 2.4 × 10⁻⁶ min–1.114 The creep resistance isconsistent with the high storage modulus (Table 11.3), which remains much higherthan that of plain cement paste, up to at least 150°C.114 However, silica fume increasesthe early age tensile creep, which provides a mechanism to relieve some of therestraining stress that develops because of autogenous shrinkage.222
11.16 COEFFICIENT OF THERMAL EXPANSION
The CTE is reduced by the addition of untreated silica fume.114 This is consistentwith high modulus and creep resistance.
11.17 SPECIFIC HEAT
A high value of specific heat is valuable for improving the temperature stability ofa structure, and to retain heat in a building. Specific heat (Cp, Table 11.7) is increasedby the addition of untreated silica fume.114 The use of silane-treated silica fume inplace of untreated silica fume further increases specific heat, though only slightly.223
The effect of untreated silica fume is due to the slippage at the interface betweensilica fume and cement. The effect of the silane treatment is because of the contri-bution of the movement of the covalent coupling between silica fume particles andcement. The use of silane and untreated silica fume as two admixtures greatlyincreases specific heat due to the network of covalent coupling among the silicafume particles contributing to phonons.20
11.18 THERMAL CONDUCTIVITY
Concrete of low thermal conductivity is useful for the thermal insulation of buildings.On the other hand, concrete of high thermal conductivity is useful for reducingtemperature gradients in structures. The thermal stresses that result from temperaturegradients may cause mechanical property degradation, and even warpage in the
TABLE 11.7Specific Heat (J/g.K, ±0.001) of Cement Pastes
Plain 0.736With untreated silica fume 0.782With treated silica fume 0.788With silane and untreated silica fume 0.980
©2001 CRC Press LLC
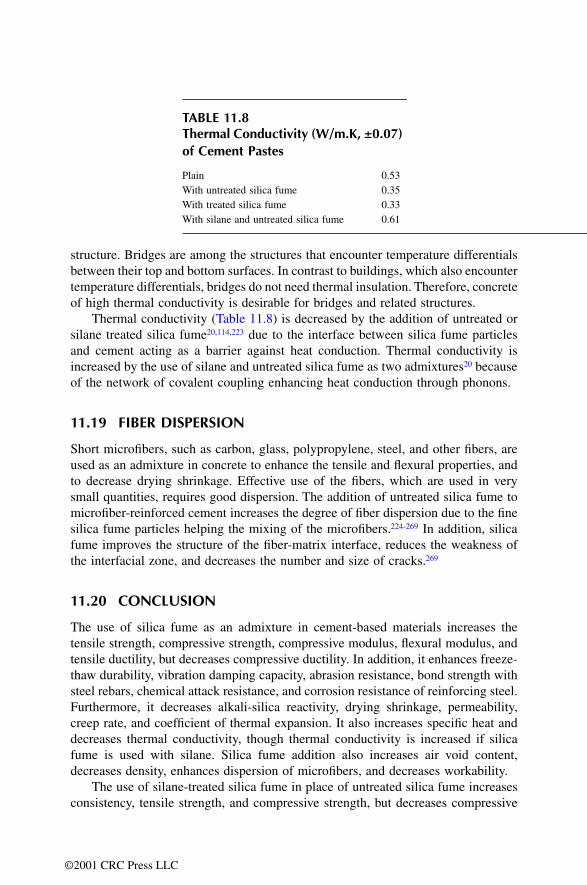
structure. Bridges are among the structures that encounter temperature differentialsbetween their top and bottom surfaces. In contrast to buildings, which also encountertemperature differentials, bridges do not need thermal insulation. Therefore, concreteof high thermal conductivity is desirable for bridges and related structures.
Thermal conductivity (Table 11.8) is decreased by the addition of untreated orsilane treated silica fume20,114,223 due to the interface between silica fume particlesand cement acting as a barrier against heat conduction. Thermal conductivity isincreased by the use of silane and untreated silica fume as two admixtures20 becauseof the network of covalent coupling enhancing heat conduction through phonons.
11.19 FIBER DISPERSION
Short microfibers, such as carbon, glass, polypropylene, steel, and other fibers, areused as an admixture in concrete to enhance the tensile and flexural properties, andto decrease drying shrinkage. Effective use of the fibers, which are used in verysmall quantities, requires good dispersion. The addition of untreated silica fume tomicrofiber-reinforced cement increases the degree of fiber dispersion due to the finesilica fume particles helping the mixing of the microfibers.224-269 In addition, silicafume improves the structure of the fiber-matrix interface, reduces the weakness ofthe interfacial zone, and decreases the number and size of cracks.269
11.20 CONCLUSION
The use of silica fume as an admixture in cement-based materials increases thetensile strength, compressive strength, compressive modulus, flexural modulus, andtensile ductility, but decreases compressive ductility. In addition, it enhances freeze-thaw durability, vibration damping capacity, abrasion resistance, bond strength withsteel rebars, chemical attack resistance, and corrosion resistance of reinforcing steel.Furthermore, it decreases alkali-silica reactivity, drying shrinkage, permeability,creep rate, and coefficient of thermal expansion. It also increases specific heat anddecreases thermal conductivity, though thermal conductivity is increased if silicafume is used with silane. Silica fume addition also increases air void content,decreases density, enhances dispersion of microfibers, and decreases workability.
The use of silane-treated silica fume in place of untreated silica fume increasesconsistency, tensile strength, and compressive strength, but decreases compressive
TABLE 11.8Thermal Conductivity (W/m.K, ±0.07) of Cement Pastes
Plain 0.53With untreated silica fume 0.35With treated silica fume 0.33With silane and untreated silica fume 0.61
©2001 CRC Press LLC

ductility. Furthermore, the silane treatment increases damping capacity and specificheat, and decreases drying shrinkage and air void content.
The use of silane and untreated silica fume as two admixtures, relative to theuse of silane-treated silica fume, increases compressive modulus, but decreasescompressive ductility and damping capacity. It also decreases air void content andincreases density, specific heat, and thermal conductivity.
REFERENCES
1. M.D. Luther and P.A. Smith, Proc. Eng. Foundation Conf. 75-106 (1991).2. V.M. Malhotra, Concr. Int. 15(4), 23-28 (1993).3. M.D. Luther, Concr. Int. 15(4), 29-33 (1993).4. J. Wolsiefer and D.R. Morgan, Concr. Int. 15(4), 34-39 (1993).5. M.D.A. Thomas, M.H. Shehata, S.G. Shashiprakash, D.S. Hopkins and K. Cail, Cem.
Concr. Res. 29(8), 1207-1214 (1999).6. J. Punkki, J. Golaszewski and O.E. Gjorv, ACI Mater. J. 93(5), 427-431 (1996).7. R.P. Khatri, V. Sirivivatnanon and W. Gross, Cem. Concr. Res. 25(1), 209-220 (1995).8. Z. Bayasi and R. Abitaher, Concr. Int. 14(4), 35-37 (1992).9. O.E. Gjorv, Concr. Int. 20(9), 57-60 (1998).
10. H. El-Didamony, A. Amer, M. Heikal and M. Shoaib, Ceramics-Silikaty 43(1), 29-33(1999).
11. H. El-Didamony, A. Amer and M. Heikal, Ceramics-Silikaty 42(4), 171-176 (1998).12. M. Nehdi, S. Mindess and P.-C. Aitcin, Cem. Concr. Res. 28(5), 687-697 (1998).13. F.E. Amparano and Y. Xi, ACI Mater. J. 95(6), 695-703 (1998).14. M. Nehdi and S. Mindess, Transp. Res. Rec. (1574), 41-48 (1996).15. L. Kucharska and M. Moczko, Adv. Cem. Res. 6(24), 139-145 (1994).16. P. Rougeron and P.-C. Aitcin, Cem. Concr. Aggregates 16(2), 115-124 (1994).17. Z. Bayasi and J. Zhou, ACI Mater. J. 90(4), 349-356 (1993).18. F. Collins and J.G. Sanjayan, Cem. Concr. Res. 29(3), 459-462 (1999).19. Y. Xu and D.D.L. Chung, Cem. Concr. Res. 29(3), 451-453 (1999).20. Y. Xu and D.D.L. Chung, Cem. Concr. Res. 30(8), 1305-1311 (2000).21. Y. Xu and D.D.L. Chung, Composite Interfaces 7(4), 243-256 (2000).22. S.Y.N. Chan and X. Ji, Cem. Concr. Compos. 21(4), 293-300 (1999).23. V.G. Papadakis, Cem. Concr. Res. 29(1), 79-86 (1999).24. M.D.A. Thomas, K. Cail and R.D. Hooton, Can. J. Civ. Eng. 25(3), 391-400 (1998).25. H.A. Toutanji, Adv. Cem. Res. 10(3), 135-139 (1998).26. R. Lewis, Concrete 32(5), 19-20,22 (1998).27. R. Breitenbuecher, Mater. Struct. 31(207), 209-215 (1998).28. B. Persson, Adv. Cem. Based Mater. 7(3-4), 139-155 (1998).29. W.H. Dilger and S.V.K.M. Rao, Pci J. 42(4), 82-96 (1997).30. K.H. Khayat, M. Vachon and M.C. Lanctot, ACI Mater. J. 94(3), 183-192 (1997).31. S.A. El-Desoky and I.A. Ibrahim, Eur. J. Control 43(5), 919-932 (1996).32. M.L. Allan and L.E. Kukacka, ACI Mater. J. 93(6), 559-568 (1996).33. Y. Li, B.W. Langan and M.A. Ward, Cem., Concr. Aggregates 18(2), 112-117 (1996).34. M.N. Haque, Cem. Concr. Compos. 18(5), 333-342 (1996).35. K. Wiegrink, S. Marikunte and S.P. Shah, ACI Mater. J. 93(5), 409-415 (1996).36. M. Kessal, P.-C. Nkinamubanzi, A. Tagnit-Hamou and P.-C. Aitcin, Cem. Concr.
Aggregates 18(1), 49-54 (1996).
©2001 CRC Press LLC

37. V. Lilkov and V. Stoitchkov, Cem. Concr. Res. 26(7), 1073-1081 (1996).38. M. Kessal, M. Edwards-Lajnef, A. Tagnit-Hamou and P.-C. Aitcin, Can. J. Civil Eng.
23(3), 614-620 (1996).39. W.H. Dilger, A. Ghali, S.V.K.M. Rao, Pci J. 41(2), 68-89 (1996).40. S.A.A. El-Enein, M.F. Kotkata, G.B. Hanna, M. Saad, and M.M.A. El Razek, Cem.
Concr. Res. 25(8), 1615-1620 (1995).41. S. Wild, B.B. Sabir and J.M. Khatib, Cem. Concr. Res. 25(7), 1567-1580 (1995).42. K.G. Babu and P.V.S. Prakash, Cem. Concr. Res. 25(6), 1273-1283 (1995).43. M. Collepardi, S. Monosi and P. Piccioli, Cem. Concr. Res. 25(5), 961-968 (1995).44. J.C. Walraven, Betonwerk und Fertigteil-Technik 60(11), 7 pp (1994).45. F. Papworth and R. Ratcliffe, Concr. Int. 16(10), 39-44 (1994).46. K. Torii and M. Kawamura, Cem. Concr. Compos. 16(4), 279-286 (1994).47. C. Ozyildirim and W.J. Halstead, ACI Mater. J. 91(6), 587-594 (1994).48. S.A. Khedr and M.N. Abou-Zeid, J. Mater. Civil Eng. 6(3), 357-375 (1994).49. P. Fidiestol, Concr. Int. 15(11), 33-36 (1993).50. L. Rocole, Aberdeen’s Concr. Constr. 38(6), 441-442 (1993).51. G. Ozyildirim, Concr. Int. 15(1), 33-38 (1993).52. M. Moukwa, B.G. Lewis, S.P. Shah and C. Ouyang, Cem. Concr. Res. 23(3), 711-723
(1993).53. B. Ma, J. Li and J. Peng, J. Wuhan Univ. Technol. 14(2), 1-7 (1999).54. K. Tan and X. Pu, Cem. Concr. Res. 28(12), 1819-1825 (1998).55. L. Bagel, Cem. Concr. Res. 28(7), 1011-1020 (1998).56. C.E.S. Tango, Cem. Concr. Res. 28(7), 969-983 (1998).57. M. Lachemi, G. Li, A. Tagnit-Hamou and P.-C. Aitcin, Concr. Int. 20(1), 59-65 (1998).58. S.H. Alsayed, ACI Mater. J. 94(6), 472-477 (1997).59. Salas, R. Gutierrez and S. Delvasto, J. Resour. Manage. Technol. 24(2), 74-78 (1997).60. J. Li and T. Pei, Cem. Concr. Res. 27(6), 833-837 (1997).61. B.B. Sabir, Mag. Concr. Res. 49(179), 139-146 (1997).62. V. Waller, P. Naproux and F. Larrard, Bull. Liaison Lab. Ponts Chaussees (208), 53-65
(1997).63. H.A. Toutanji and T. El-Korchi, Cem. Concr. Aggregates 18(2), 78-84 (1996).64. S. Iravani, ACI Mater. J. 93(5), 416-426 (1996).65. M.H. Zhang, R. Lastra and V.M. Malhotra, Cem. Concr. Res. 26(6), 963-977 (1996).66. R. Gagne, A. Boisvert and M. Pigeon, ACI Mater. J. 93(2), 111-120 (1996).67. S.L. Mak and K. Torii, Cem. Concr. Res. 25(8), 1791-1802 (1995).68. B.B. Sabir, Mag. Concr. Res. 47(172), 219-226 (1995).69. H.A. Toutanji and T. El-Korchi, Cem. Concr. Res. 25(7), 1591-1602 (1995).70. S. Ghosh and K.W. Nasser, Can. J. Civil Eng. 22(3), 621-636 (1995).71. H. Marzouk and A. Hussein, J. Mater. Civil Eng. 7(3), 161-167 (1995).72. E.H. Fahmy, Y.B.I. Shaheen and W.M. El-Dessouki, J. Ferrocement 25(2), 115-121
(1995).73. F.P. Zhou, B.I.G. Barr and F.D. Lydon, Cem. Concr. Res. 25(3), 543-552 (1995).74. J. Xie, A.E. Elwi and J.G. MacGregor, ACI Mater. J. 92(2), 135-145 (1995).75. S.U. Al-Dulaijan, A.H.J. Al-Tayyib, M.M. Al-Zahrani, G. Parry-Jones and A.I.
Al-Mana, J. Am. Ceram. Soc. 78(2), 342-346 (1995).76. A. Goldman and A. Bentur, Adv. Cem. Based Mater. 1(5), 209-215 (1994).77. A. Goldman and A. Bentur, Cem. Concr. Res. 23(4), 962-972 (1993).78. K.J. Folliard, M. Ohta, E. Rathje and P. Collins, Cem. Concr. Res. 24(3), 424-432
(1994).
©2001 CRC Press LLC
79. C. Xiaofeng, G. Shanglong, D. Darwin and S.L. McCabe, ACI Mater. J. 89(4),375-387 (1992).
80. R.S. Ravindrarajah, Proc. Nondestr. Test. Concr. Elem. Struct., ASCE, pp. 115-126(1992).
81. B.B. Sabir and K. Kouyiali, Cem. Concr. Res. 13(3), 203-208 (1991).82. H.A. Toutanji, L. Liu and T. El-Korchi, Mater. Struct. 32(217), 203-209 (1999).83. S. Sarkar, O. Adwan and J.G.L. Munday, Struct. Eng. 75(7), 115-121 (1997).84. C. Tasdemir, M.A. Tasdemir, N. Mills, B.I.G. Barr and F.D. Lydon, ACI Mater. J.
96(1), 74-83 (1999).85. M.G. Alexander and T.I. Milne, ACI Mater. J. 92(3), 227-235 (1995).86. X. Fu, X. Li and D.D.L. Chung, J. Mater. Sci. 33, 3601-3605 (1998).87. Y. Wang and D.D.L. Chung, Cem. Concr. Res. 28(10), 1353-1356 (1998).88. M. Tamai and M. Tanaka, Trans. Jpn. Concr. Inst. 16, 81-88 (1994).89. R. Quaresima, G. Scoccia, R. Volpe, F. Medici and C. Merli, Proc. 1993 Symp.
Stabilization and Solidification of Hazardous, Radioactive, and Mixed Wastes: 3rd
Volume, Vol. 1240, ASTM Special Technical Publication, pp. 135-146 (1996).90. M. Sonebi and K.H. Khayat, Can. J. Civil Eng. 20(4), 650-659 (1993).91. R.D. Hooton, ACI Mater. J., 90(2), 143-151 (1993).92. M. Lachemi, G. Li, A. Tagnit-Hamou and P.-C. Aitcin, Concr. Int. 20(1), 59-65 (1998).93. V. Yogendran, B.W. Langan, M.N. Haque and M.A. Ward, ACI Mater. J. 84(2),
124-129 (1987).94. P.-W. Chen and D.D.L. Chung, Composites 24(1), 33-52 (1993).95. M.G. Kashi and R.E. Weyers, Proc. Sessions Related to Structural Materials at
Structures Congress, Vol. 89, ASCE, pp. 138-148 (1989).96. V.M. Malhotra, Proc. 2nd Int. Conf., Publication SP — American Concrete Institute
91, Vol. 2, pp. 1069-1094 (1986).97. A. Durekovic, V. Calogovic and K. Popovic, Cem. Concr. Res. 19(2), 267-277 (1989).98. B.B. Sabir, Cem. Concr. Compos. 19(4), 285-294 (1997).99. Z.-Q. Shi and D.D.L. Chung, Cem. Concr. Res. 27(8), 1149-1153 (1997).
100. X. Li and D.D.L. Chung, Cem. Concr. Res. 28(4), 493-498 (1998).101. V. Baroghel-Bouny and J. Godin, Bull. Liaison Lab. Ponts Chaussees (218), 39-48
(1998).102. S.H. Alsayed, Cem. Concr. Res. 28(10), 1405-1415 (1998).103. A. Lamontagne, M. Pigeon, R. Pleau and D. Beaupre, ACI Mater. J. 93(1), 69-74
(1996).104. M.G. Alexander, Adv. Cem. Res. 6(22), 73-81 (1994).105. F.H. Al-Sugair, Mag. Concr. Res. 47(170), 77-81 (1995).106. B. Bissonnette and M. Pigeon, Cem. Concr. Res. 25(5), 1075-1085 (1995).107. G.A. Rao, Cem. Concr. Res. 28(10), 1505-1509 (1998).108. Z. Li, M. Qi, Z. Li, and B. Ma, J. Mater. Civil Eng. 11(3), 214-223 (1999).109. O.M. Jensen and P.F. Hansen, ACI Mater. J. 93(6), 539-543 (1996).110. O.M. Jensen and P.F. Hansen, Adv. Cem. Res. 7(25), 33-38 (1995).111. B. Persson, Cem. Concr. Res. 28(7), 1023-1036 (1998).112. T.A. Samman, W.H. Mirza and F.F. Wafa, ACI Mater. J. 93(1), 36-40 (1996).113. R. Bloom and A. Bentur, ACI Mater. J. 92(2), 211-217 (1995).114. X. Fu and D.D.L. Chung, ACI Mater. J. 96(4), 455-461 (1999).115. Z. Liu and J.J. Beaudoin, Cem. Concr. Res. 29(7), 1085-1090 (1999).116. T.-J. Zhao, J.-Q. Zhu and P.-Y. Chi, ACI Mater. J. 96(1), 84-89 (1999).117. T.H. Wee, A.K. Suryavanshi and S.S. Tin, Cem. Concr. Compos. 21(1), 59-72 (1999).118. R.K. Dhir and M.R. Jones, Fuel 78(2), 137-142 (1999).
©2001 CRC Press LLC

119. P. Sandberg, L. Tang and A. Anderson, Cem. Concr. Res. 28(10), 1489-1503 (1998).120. N. Gowripalan and H.M. Mohamed, Cem. Concr. Res. 28(8), 1119-1131 (1998).121. C. Shi, J.A. Stegemann and R.J. Caldwell, ACI Mater. J. 95(4), 389-394 (1998).122. S.L. Amey, D.A. Johnson, M.A. Miltenberger and H. Farzam, ACI Struct. J. 95(2),
205-214 (1998).123. R.J. Detwiler, T. Kojundic and P. Fidjestol, Concr. Int. 19(8), 43-45 (1997).124. S.L. Amey, D.A. Johnson, M.A. Miltenberger and H. Farzam, ACI Struct. J. 95(1),
27-36 (1998).125. R.P. Khatri, V. Sirivivatnanon and L.K. Yu, Mag. Concr. Res. 49(180), 167-172 (1997).126. R.P. Khatri, V. Sirivivatnanon and J.L. Yang, Cem. Concr. Res. 27(8), 1179-1189
(1997).127. K. Tan and O.E. Gjorv, Cem. Concr. Res. 26(3), 355-361 (1996).128. G.J.Z. Xu, D.F. Watt and P.P. Hudec, Cem. Concr. Res. 25(6), 1225-1236 (1995).129. A.A. Ramezanianpour and V.M. Malhotra, Cem. Concr. Compos. 17(2), 125-133
(1995).130. O.S.B. Al-Amoudi, M. Maslehuddin and Y.A.B. Abdul-Al, Constr. Build. Mater. 9(1),
25-33 (1995).131. A. Delagrave, M. Pigeon and E. Revertegat, Cem. Concr. Res. 24(8), 1433-1443
(1994).132. C. Ozyildirim, Cem. Concr. Aggregates 16(1), 53-56 (1994).133. C. Ozyildirim, ACI Mater. J. 91(2), 197-202 (1994).134. R.J. Detwiler, C.A. Fapohunda and J. Natale, ACI Mater. J. 91(1), 63-66 (1994).135. C. Lobo and M.D. Cohen, ACI Mater. J. 89(5), 481-491 (1992).136. N. Banthia, M. Pigeon, J. Marchand and J. Boisvert, J. Mater. Civil Eng. 4(1), 27-40
(1992).137. B. Ma, Z. Li and J. Peng, J. Wuhan Univ. Technol. 13(4), 16-24 (1998).138. P.S. Mangat and B.T. Molloy, Mag. Concr. Res. 47(171), 129-141 (1995).139. C.S. Poon, L. Lam and Y.L. Wong, J. Mater. Civil. Eng. 11(3), 197-205 (1999).140. H. Yan, W. Sun and H. Chen, Cem. Concr. Res. 29(3), 423-426 (1999).141. D.R.G. Mitchell, I. Hinczak and R.A. Day, Cem. Concr. Res. 28(11), 1571-1584
(1998).142. K.O. Kjellsen, O.H. Wallevik and L. Fjallberg, Adv. Cem. Res. 10(1), 33-40 (1998).143. K. Vivekanandam and I. Patnaikuni, Cem. Concr. Res. 27(6), 817-823 (1997).144. M. Saad, S.A. Abo-El-Enein, G.B. Hanna and M.F. Kotkata, Cem. Concr. Res. 26(10),
1479-1484 (1996).145. K.A. Khalil, Mater. Lett. 26(4-5), 259-264 (1996).146. J. Marchand, H. Hornain, S. Diamond, M. Pigeon and H. Guiraud, Cem. Concr. Res.
26(3), 427-438 (1996).147. C. Tasdemir, M.A. Tasdemir, F.D. Lydon, and B.I.G. Barr, Cem. Concr. Res. 26(1),
63-68 (1996).148. M.J. Aquino, Z. Li and S.P. Shah, Adv. Cem. Based Mater. 2(6), 211-223 (1995).149. M. Cheyrezy, V. Maret and L. Frouin, Cem. Concr. Res. 25(7), 1491-1500 (1995).150. D.P. Bentz and P.E. Stutzman, Cem. Concr. Res. 24(6), 1044-1050 (1994).151. Y. Cao and R.J. Detwiler, Cem. Concr. Res. 25(3), 627-638 (1995).152. P.-C. Aitcin, Constr. Build. Mater. 9(1), 13-17 (1995).153. A. Durekovic, Cem. Concr. Res. 25(2), 365-375 (1995).154. S. Mindess, L. Qu and M.G. Alexander, Adv. Cem. Res. 6(23), 103-107 (1994).155. Q. Yu, M. Hu, J. Qian, X. Wang and C. Tao, J. Wuhan Univ. Technol. 9(2), 22-28
(1994).156. K. Mitsui, Z. Li, D.A. Lange and S.P. Shah, ACI Mater. J. 91(1), 30-39 (1994).
©2001 CRC Press LLC

157. M.D. Cohen, A. Goldman and W.-F. Chen, Cem. Concr. Res. 24(1), 95-98 (1994).158. D.N. Winslow, M.D. Cohen, D.P. Bentz, K.A. Snyder and E.J. Garboczi, Cem. Concr.
Res. 24(1), 25-37 (1994).159. Z. Xu, P. Gu, P. Xie and J.J. Beaudoin, Cem. Concr. Res. 23(5), 1007-1015 (1993).160. S.L. Sarkar, S. Chandra and L. Berntsson, Cem. Concr. Compos. 14(4), 239-248
(1992).161. D.P. Bentz, P.E. Stutzman and E.J. Garboczi, Cem. Concr. Res. 22(5), 891-902 (1992).162. X. Ping and J.J. Beaudoin, Cem. Concr. Res. 22(4), 597-604 (1992).163. S.P. Shah, Z. Li and D.A. Lange, Proc. 9th Conf. Eng. Mechanics, pp. 852-855 (1992).164. J. Zemajtis, R.E. Weyers and M.M. Sprinkel, Transp. Res. Rec. 57-59 (1999).165. O.E. Gjorv, ACI Mater. J. 92(6), 591-598 (1995).166. J.G. Cabrera, P.A. Claisse and D.N. Hunt, Constr. Build. Mater. 9(2), 105-113 (1995).167. N.R. Jarrah, O.S.B. Al-Amoudi, M. Maslehuddin, O.A. Ashiru and A.I. Al-Mana,
Constr. Build. Mater. 9(2), 97-103 (1995).168. T. Lorentz and C. French, ACI Mater. J. 92(2), 181-190 (1995).169. S.A. Khedr and A.F. Idriss, J. Mater. Civil Eng. 7(2), 102-107 (1995).170. P.S. Mangat, J.M. Khatib and B.T. Molloy, Cem. Concr. Compos. 16(2), 73-81 (1994).171. O.S.B. Al-Amoudi, A.R. Rasheeduzzafar, M. Maslehuddin and S.N. Abduljauwad,
Cem. Concr. Aggregates 16(1), 3-11 (1994).172. D. Whiting, Transp. Res. Rec. (1392), 142-148 (1993).173. J.T. Wolsiefer, Sr., Proc. ASCE Natl. Conv. Expo., pp. 15-29 (1993).174. A.R. Rasheeduzzafar, S.S. Al-Saadoun and A.S. Al-Gahtani, ACI Mater. J. 89(4),
337-366 (1992).175. A.R. Rasheeduzzafar, ACI Mater. J. 89(6), 574-586 (1992).176. C.K. Nmai, S.A. Farrington and G.S. Bobrowski, Concr. Int. 14(4), 45-51 (1992).177. J. Hou and D.D.L. Chung, Corros. Sci. 42(9), 1489-1507 (2000).178. V.S. Ramachandran, Cem. Concr. Compos. 20(2/3), 149-161 (1998).179. S. Diamond, Cem. Concr. Compos. 19(5-6), 391-401 (1997).180. H. Wang and J.E. Gillott, Mag. Concr. Res. 47(170), 69-75 (1995).181. W. Wieker, R. Herr and C. Huebert, Betonwerk und Fertigteil-Technik 60(11), 86-91
(1994).182. M. Berra, T. Mangialardi and A.E. Paolini, Cem. Concr. Compos. 16(3), 207-218
(1994).183. M. Geiker and N. Thaulow, Proc. Eng. Foundation Conf. 123-136 (1991).184. A. Shayan, G.W. Quick and C.J. Lancucki, Adv. Cem. Res. 5(20), 151-162 (1993).185. J. Duchesne and M.A. Berube, Cem. Concr. Res. 24(2), 221-230 (1994).186. P.P. Hudec and N.K. Banahene, Cem. Concr. Compos. 15(1-2), 21-26 (1993).187. J.E. Gillot and H. Wang, Cem. Concr. Res. 23(4), 973-980 (1993).188. N.R. Swamy and R.M. Wan, Cem. Concr. Aggregates 15(1), 32-49 (1993).189. D.S. Lane, Mater. Eng. Congr., ASCE, pp. 231-244 (1992).190. A.R. Rasheeduzzafar and S.E. Hussain, Cem. Concr. Compos. 13(3), 219-225 (1991).191. C. Perry and J.E. Gillott, Durability Build. Mater. 3(2), 1985 (1985).192. A.R. Rasheeduzzafar and H.S. Ehtesham, Cem. Concr. Compos. 13(3), 219-225
(1991).193. B. Durand, J. Berard and R. Roux, Cem. Concr. Res. 20(3), 419-428 (1990).194. G.J.Z. Xu, D.F. Watt and P.P. Hudec, Cem. Concr. Res. 25(6), 1225-1236 (1995).195. M.-A. Berube, J. Duchesne and D. Chouinard, Cem. Concr. Aggregates 17(1), 26-33
(1995).196. S. Diamond, Cem. Concr. Compos. 19(5-6), 391-401 (1997).197. A.H. Ali, Corros. Prev. Control 46(3), 76-81 (1999).
©2001 CRC Press LLC

198. M.S. Morsy, Cem. Concr. Res. 29(4), 603-606 (1999).199. R.J. van Eijk and H.J.H. Brouwers, Heron 42(4), 215-229 (1997).200. A.K. Tamimi, Mater. Struct. 30(197), 188-191 (1997).201. F. Turker, F. Akoz, S. Koral and N. Yuzer, Cem. Concr. Res. 27(2), 205-214 (1997).202. F.M. Kilinckale, Cem. Concr. Res. 27(12), 1911-1918 (1997).203. N.D. Belie, V.D. Coster and D.V. Nieuwenburg, Mag. Concr. Res. 49(181), 337-344
(1997).204. P. Jones, Concrete (London) 31(4), 12-13 (1997).205. J.A. Daczko, D.A. Johnson and S.L. Amey, Mater. Performance 36(1), 51-56 (1997).206. A. Delagrave, M. Pigeon, J. Marchand and E. Revertagat, Cem. Concr. Res. 26(5),
749-760 (1996).207. A.A. Bubshait, B.M. Tahir and M.O. Jannadi, Build. Res. Inf. 24(1), 41-49 (1996).208. F. Akoz, F. Turker, S. Koral and N. Yuzer, Cem. Concr. Res. 25(6), 1360-1368 (1995).209. K. Torii and M. Kawamura, Cem. Concr. Res. 24(2), 361-370 (1994).210. H.S. Shin and K.-S. Jun, C J. Environ. Sci. Health 30(3), :651-668 (1995).211. V. Matte and M. Moranville, Cem. Concr. Compos. 21(1), 1-9 (1999).212. M.J. Rudin, Waste Management 16(4), 305-311 (1996).213. P.-W. Chen and D.D.L. Chung, Composites 27B, 269-274 (1996).214. A. Yahia, K.H. Khayat and B. Benmokrane, Mater. Struct. 31(208), 267-274 (1998).215. B.S. Hamad and S.M. Sabbah, Mater. Struct. 31(214), 707-713 (1998).216. Z. Li, M. Xu and N.C. Chui, Mag. Concr. Res. 50(1), 49-57 (1998).217. A. Mor, ACI Mater. J. 89(1), 76-82 (1992).218. X. Fu and D.D.L. Chung, ACI Mater. J. 95(6), 725-734 (1998).219. P.J.M. Monteiro, O.E. Gjorv and P.K. Mehta, Cem. Concr. Res. 19(1), 114-123 (1989).220. O.E. Gjorv, P.J.M. Monteiro and P.K. Mehta, ACI Mater. J. 87(6), 573-580 (1990).221. X. Fu and D.D.L. Chung, ACI Mater. J. 95(5), 601-608 (1998).222. K. Kovler, S. Igarashi and A. Bentur, Mater. Struct. 32(219), 383-387 (1999).223. Y. Xu and D.D.L. Chung, Cem. Concr. Res. 29(7), 1117-1121 (1999).224. S.B. Park, E.S. Yoon and B.I. Lee, Cem. Concr. Res. 29(2), 193-200 (1999).225. M. Pigeon and R. Cantin, Cem. Concr. Compos. 20(5), 365-375 (1998).226. H. Toutanji, S. McNeil and Z. Bayasi, Cem. Concr. Res. 28(7), 961-968 (1998).227. T.-J. Kim and C.-K. Park, Cem. Concr. Res. 28(7), 955-960 (1998).228. H.A.D. Kirsten, J. S. Afr. Inst. Min. Metall. 98(2), 93-104 (1998).229. C. Aldea, S. Marikunte and S.P. Shah, Adv. Cem. Based Mater. 8(2), 47-55 (1998).230. A. Dubey and N. Banthia, ACI Mater. J. 95(3), 284-292 (1998).231. L. Biolzi, G.L. Guerrini and G. Rosati, Constr. Build. Mater. 11(1), 57-63 (1997).232. O. Eren and T. Celik, Constr. Build. Mater. 11(7-8), 373-382 (1997).233. S.A. Austin, C.H. Peaston and P.J. Robins, Constr. Build. Mater. 11(5-6), 291-298
(1997).234. E. Dallaire, P.-C. Aitcin and M. Lachemi, Civ. Eng. 68(1), 48-51 (1998).235. R.J. Brousseau and G.B. Pye, ACI Mater. J. 94(4), 306-310 (1997).236. S. Marikunte, C. Aldea and S.P. Shah, Adv. Cem. Based Mater. 5(3-4), 100-108 (1997).237. Y.-W. Chan and V.C. Li, Adv. Cem. Based Mater. 5(1), 8-17 (1997).238. R. Cantin and M. Pigeon, Cem. Concr. Res. 26(11), 1639-1648 (1996).239. M.R. Taylor, F.D. Lydon and B.I.G. Barr, Constr. Build. Mater. 10(6), 445-450 (1996).240. H.-C. Wu, V.C. Li, Y.M. Lim, K.F. Hayes and C.C. Chen, J. Mater. Sci. Lett. 15(19),
1736-1739 (1996).241. A. Kumar and A.P. Gupta, Exp. Mech. 36(3), 258-261 (1996).242. S. Wei, G. Jianming and Y. Yun, ACI Mater. J. 93(3), 206-212 (1996).243. N. Banthia and C. Yan, Cem. Concr. Res. 26(5), 657-662 (1996).
©2001 CRC Press LLC

244. A. Katz and A. Bentur, Adv. Cem. Based Mater. 3(1), 1-13 (1996).245. P. Balaguru and A. Foden, ACI Struct. J. 93(1), 62-78 (1996).246. P. Soroushian, F. Mirza and A. Alhozaimy, ACI Mater. J. 92(3), 291-295 (1995).247. A. Katz and A. Bentur, Cem. Concr. Compos. 17(2), 87-97 (1995).248. N. Banthia, N. Yan, C. Chan, C. Yan and A. Bentur, Materials Research Society
Symposium Proceedings, Vol. 370, pp. 539-548 (1995).249. A. Katz and V.C. Li, Materials Research Society Symposium Proceedings, Vol. 370,
pp. 529-537 (1995).250. A. Katz, V.C. Li and A. Kazmer, J. Mater. Civil Eng. 7(2), 125-128 (1995).251. W.M. Boone, D.B. Clark and E.L. Theisz, Proc. Ports ’95 Conference on Port
Engineering and Development for the 21st Century, Vol. 2, pp. 1138-1147 (1995).252. S.-I. Igarashi and M. Kawamura, Proc. Jpn. Soc. Civ. Eng. (502), Pt. 5-25, 83-92
(1994).253. S. Marikunte and P. Soroushian, ACI Mater. J. 91(6), 607-616 (1994).254. X. Lin, M.R. Silsbee, D.M. Roy, K. Kessler, and P.R. Blankenhorn, Cem. Concr. Res.
24(8), 1558-1566 (1994).255. Anonymous, Eng. News-Rec. 233(2), 13 (1994).256. N.M.P. Low and J.J. Beaudoin, Cem. Concr. Res. 24(5), 874-884 (1994).257. N.M.P. Low and J.J. Beaudoin, Cem. Concr. Res. 24(2), 250-258 (1994).258. A. Katz and A. Bentur, Cem. Concr. Res. 24(2), 214-220 (1994).259. P. Balaguru and M.G. Dipsia, ACI Mater. J. 90(5), 399-405 (1993).260. M.N.P. Low and J.J. Beaudoin, Cem. Concr. Res. 23(6), 1467-1479 (1993).261. P.S. Mangat and G.S. Manarakis, Mater. Struct. 26(161), 433-440 (1993).262. N.M.P. Low and J.J. Beaudoin, Cem. Concr. Res. 23(5), 1016-1028 (1993).263. N.M.P. Low and J.J. Beaudoin, Cem. Concr. Res. 23(4), 905-916 (1993).264. S.B. Park and B.I. Lee, High Temp. High Pressures 22(6), 663-670 (1990).265. P. Balaguru, R. Narahari and M. Patel, ACI Mater. J. 89(6), 541-546 (1992).266. A.S. Ezeldin and P.N. Balaguru, J. Mater. Civil Eng. 4(4), 415-429 (1992).267. N.M.P. Low and J.J. Beaudoin, Cem. Concr. Res. 22(5), 981-989 (1992).268. P.-W. Chen, X. Fu and D.D.L. Chung, ACI Mater. J. 94(2), 147-155 (1997).269. H. Yan, W. Sun and H. Chen, Cem. Concr. Res. 29(3), 423-426 (1999).
©2001 CRC Press LLC

Appendix A:Electrical Behavior of Various Types of Materials
A.1 METALS
Metals can be defined as solids in which the valence electronic energy bands arenot completely filled. The Fermi energy of a metal lies within the valence electronicenergy band. Since the valence electrons can be excited without crossing an energyband gap, metals are characterized by high electrical conductivities. Because ofoverlap between adjacent valence bands, all of the valence electrons serve as chargecarriers; the larger the number of valence electrons per atom, the higher the carrierconcentration in the solid. For example, Al has three valence electrons per atomwith the three s and three p bands overlapping, so it has a higher carrier concentrationthan Na, which has one valence electron per atom. Note that this definition of ametal agrees with the fact that atoms in a metal are held together by metallic bonding,which is provided by delocalized valence electrons. The delocalization of the valenceelectrons is necessary for them to move large distances from the parent nuclei.
A.2 INSULATORS
Whereas metals have incompletely filled valence bands, those of insulators arecompletely filled. Furthermore, the energy band gap between the top of the filledvalence band and the bottom of the empty higher energy band is large, typicallygreater than 4 eV. These energy bands are illustrated in Figure A.1. In order for thevalence electrons to be excited, their energy must increase enough to cross the energyband gap and move to the bottom of the empty energy band that is higher in energy.After making this transition, the electron can increase its kinetic energy and be ableto move in response to an electric field. Therefore, the energy band above the valenceband is known as the “conduction band” and the electrons in the conduction bandare known as “conduction electrons,” which serve as charge carriers in electricalconduction. In some insulators (e.g., diamond), the energy band gap is so large thatit is unlikely for thermal energy to be sufficient to cause any of the valence electronsto move to the conduction band. The concentration of conduction electrons isnegligible in such an insulator. In some insulators, the low concentration of conduc-tion electrons is due to the presence of carrier traps, such as defects. Because the
©2001 CRC Press LLC

carrier concentration is low, such a solid exhibits a low electrical conductivity; thatis, it is an insulator.
A.3 COMPOSITES
A composite is a material formed by the artificial blending of two or more compo-nents. For example, one component is metal particles while the other is a polymersuch that the metal particles are dispersed in the polymer matrix. As polymers areusually insulators, a polymer-matrix composite that is electrically conducting usuallycontains an electrically conducting filler (particles, flakes, short fibers, or continuousfibers).
The conductivity of a composite with an insulating matrix depends on theconductivity, volume fraction, unit size, and aspect ratio of the filler. It also dependson the distribution of the filler in the composite. The distribution, in turn, dependson the composite fabrication method. In general, the conductivity of the compositedoes not increase linearly with the filler volume fraction. It increases abruptly at acertain filler volume fraction called the “percolation threshold.” This threshold isthe filler volume fraction at which the filler units begin to touch one another suffi-ciently so that somewhat continuous electrical conduction paths form in the com-posite. Below and above the threshold the conductivity still increases with the fillervolume fraction, but more gradually. A large aspect ratio of the filler enhances thetouching of adjacent filler units, thus decreasing the percolation threshold. In thecase of a composite formed from a mixture of insulator matrix powder and fillerunits, the percolation threshold is lower when the ratio of the filler unit size to thematrix particle size is smaller, as the small filler units line up along the boundariesof the large matrix particles.
The conductivity of a composite with an insulating matrix depends not only onthe filler, but also on the filler-matrix interface. A stronger interface is associatedwith a lower contact resistivity, resulting in a lower volume resistivity for thecomposite. Below the percolation threshold, the filler-matrix interface plays a par-ticularly important role. The contact resistivity (ρc) of an interface is a quantity thatdoes not depend on the area of the interface or contact, but only on the nature ofthe interface. The contact resistance (Rc) decreases with increasing contact area (A),i.e.,
FIGURE A.1 Energy bands of an insulator. Shaded energy ranges are occupied by electrons.
Eg
> 4 eV
Ene
rgy
Conductionband
Valenceband
Rc1A---∝
©2001 CRC Press LLC

The proportionality constant is ρc, so that
(A.1)
Since the unit of Rc is Ω and that of A is m2, the unit of ρc is Ω.m2.
A.4 SEMICONDUCTORS
Semiconductors, like classical insulators, have completely filled valence bands.However, the energy band gap between the top of the filled valence band and thebottom of the conduction band is small, typically less than 4 eV. As a result, thermalenergy causes a small fraction of the valence electrons to move across the energyband gap into the bottom of the conduction band, giving rise to a small number ofconduction electrons that serve as charge carriers for electrical conductions. This isillustrated in Figure A.2
The transition of a small fraction of the valence electrons from the top of thevalence band to the bottom of the conduction band also gives rise to unoccupiedelectron states at the top of the valence band. This is analogous to the vacancies ina crystal. The movement of atoms can be described by the movement of vacanciesin the opposite direction. Since the number of vacancies is a small fraction of thenumber of atom sites in the crystal, it is simpler to describe atomic relocation bythe movement of the vacancies than by the movement of the atoms themselves. Asimilar situation applies to the electronic vacancies, called “holes,” in the top of thevalence band of a semiconductor. Since the number of holes is much smaller thanthe number of electrons in the valence band, the transitions in energy of the valenceelectrons within the valence band (which is not completely filled, as shown in FigureA.2(b)) can be described more simply by the transitions in energy of the holes withinthe valence band. The holes provide an additional source of charge carriers. Sinceholes are due to the absence of electrons, they are positively charged. Hence, thecharge of a hole is equal in magnitude and opposite in sign to that of an electron.
FIGURE A.2 Energy bands of a semiconductor. (a) At very low temperatures — negligiblenumber of conduction electrons. (b) At higher temperatures — some conduction electrons.Shaded energy ranges are occupied by electrons.
Eg < 4 eV
Valenceband
Conductionband Conduction
electrons
Holes
(a) (b)
Rcρc
A-----=
©2001 CRC Press LLC

A semiconductor has two types of charge carriers, conduction electrons andholes; and, the electrical conductivity of a semiconductor has two contributions, asgiven by
σ = qnµn + qpµp (A.2)
whereq = magnitude of the charge of an electronn = number of conduction electrons per unit volumep = number of holes per unit volumeµn = mobility of conduction electronsµp = mobility of conduction holes
The subscript “n” is used for electrons, which are negatively charged; the subscript“p” is used for holes, which are positively charged. Since the transition of eachelectron from the valence band to the conduction band simultaneously gives rise toa conduction electron in the conduction band and a hole in the valence band, thenumber of conduction electrons must equal the number of holes, i.e., n = p. There-fore, for a semiconductor (pure), Eq. (A.2) can be simplified as
σ = qn(µn + µp) (A.3)
In the presence of both a voltage gradient and a charge carrier concentrationgradient, the current density in a semiconductor has a contribution from the con-duction electrons and another contribution from the holes. The contribution by theconduction electrons is given by
(A.4)
The contribution by the holes is given by
(A.5)
The total current density is given by
(A.6)
The energy band gap is related to the ionization energy of the atoms in the solid.This is because the transition of an electron from the valence band to the conductionband means delocalizing and freeing the electron from its parent atom, therebyionizing the parent atom. The higher the ionization energy, the larger the energyband gap. For example, consider the elements in group IV A of the periodic table.
Jn qnµnΣ qDndndx------+=
Jp qnµpΣ qDpdnpdx
---------–=
J
J Jn Jp+=
©2001 CRC Press LLC

The ionization energies of these elements increase up the group, so the energy bandgaps of these elements also increase up the group, as shown in Table A.1. C(diamond), Si, Ge, and Sn (gray) all exhibit the diamond structure. They all havecompletely filled valence bands that contain sp3 hybridized electrons. The differencein electrical conductivity among these elements is due to the difference in energyband gap. The gap is particularly large in diamond, so diamond is an insulator. Theother three substances are all semiconductors. The smaller the energy band gap, thegreater the number of valence electrons that have sufficient thermal energy to crossthe energy band gap, and the higher the electrical conductivity.
Semiconductors have electrical conductivities that are between those of metalsand insulators. Other than elemental semiconductors (e.g., Si, Ge, etc.), there arecompound semiconductors (ZnS, GaP, GaAs, InP, etc.). In contrast to many elementalsemiconductors, which exhibit the diamond structure, most compound semiconduc-tors exhibit the zinc blende structure.
TABLE A.1Energy Band Gaps and Electrical Conductivities of the Elements in Group IVA of the Periodic Table
Element Energy Band Gap (eV)
Electrical Conductivityat 20°C
(Ω–1.cm–1)
C (diamond)SiGeSn (gray)
~61.10.720.08
10–18
5 × 10⁻⁶
0.02104
©2001 CRC Press LLC
Appendix B:Temperature Dependence of Electrical Resistivity
B.1 METALS
A metal has only one type of charge carrier — electrons. The electrical conductivityof a metal is given by Eq. (B.1):
σ = qnµ (B.1)
whereq = magnitude of the charge of an electronn = number of free electrons (valence electrons) per unit volumeµ = mobility of electrons
The number of valence electrons does not change with temperature, so n isindependent of temperature. On the other hand, as the temperature increases, themobility of the electrons decreases. This is because thermal vibrations of the atomsin the solid increase in amplitude as the temperature increases, and such vibrationsinterfere with the motion of the electrons, thus decreasing their mobility. Since n isfixed and µ decreases slightly with increasing temperature, the electrical conductivityof a metal decreases slightly with increasing temperature. In other words, the elec-trical resistivity of a metal increases with increasing temperature. The variation ofthe electrical resistivity with temperature is roughly linear, as shown schematicallyin Figure B.1. The rate of increase of electrical resistivity with temperature iscommonly described by the temperature coefficient of electrical resistivity (α), whichis defined by the equation
(B.2)
where ∆ρ/ρ is the fractional change in electrical resistivity, and ∆T is the increasein temperature. The value of α is ~0.004°C–1 for most pure metals. Note that Eq. (B.2)requires that the unit of α be °C–1, which is the same as K–1, where K means “Kelvin”or absolute temperature.
∆ρρ
------- α∆T=
©2001 CRC Press LLC

B.2 SEMICONDUCTORS
A semiconductor has two types of carriers — conduction electrons and holes. Theelectrons (negative) move up a voltage gradient, whereas the holes (positive) movedown a voltage gradient, as illustrated in Figure B.1. Conventionally, the directionof the current is taken as the direction of the flow of the positive charge carriers,i.e., from a higher voltage to a lower voltage.
The electrical conductivity of an intrinsic semiconductor is given by Eq. (A.3),which is
σ = qn(µn + µp) (A.3)
Due to thermal vibrations of the atoms, both µn and µp decrease slightly as thetemperature increases. Since thermal energy causes the valence electrons to beexcited to the conduction band, the value of n increases with increasing temperature.As for any thermally-activated process, the temperature dependence is exponential.It can be shown that n varies with temperature in the form
whereEg = energy band gap between conduction and valence bandsk = Boltzmann’s constantT = temperature in K
The factor of 2 in the exponent is because the excitation of an electron across Eg
produces an intrinsic conduction electron and an intrinsic hole.Since µn and µp only decrease slightly with increasing temperature, whereas n
significantly increases with increasing temperature, the variation of σ with temper-ature is roughly of the form,
FIGURE B.1 The temperature dependence of the electrical resistivity of a metal.
T
ρ
n eEg– 2kTÚ
∝
©2001 CRC Press LLC

Eg is itself temperature-dependent, although its slight temperature dependence isnegligible in most circumstances. Let the constant of proportionality be σo. Takingnatural logarithms,
(B.3)
Changing the natural logarithms to logarithms of base 10,
(B.4)
Thus, the variation of σ with T can be shown in an Arrhenius plot of log σ against1/T, as shown in Figure B.2. The plot is a straight line of slope –[Eg/(2.3)2k]; theintercept of the line on the log σ axis is log σo. Therefore, by measuring σ as afunction of T, one can determine Eg and σo. This is one of the most common waysto determine the energy band gap of a semiconductor.
The significant variation of σ with T for a semiconductor allows a semiconductorto serve a temperature measuring device called a “thermistor.” The temperature isindicated by the conductivity, which relates to the measured resistance of the ther-mistor. The resistance decreases with increasing temperature.
The most clearcut difference in behavior between a metal and a semiconductoris that the electrical conductivity of a metal decreases with increasing temperature,whereas that of a semiconductor increases with increasing temperature. Therefore,the simplest way to determine whether a solid is a metal or a semiconductor is tosee whether the electrical conductivity of the solid increases or decreases withtemperature.
FIGURE B.2 An Arrhenius (semi-logarithmic) plot of the variation of the electrical conduc-tivity with temperature for an intrinsic semiconductor.
1 / T
Slope
log σ
log σ o= - ( 2.3 ) 2k
Eg
σ eEg– 2kTÚ
∝
σ σoeEg– 2kTÚ
=
σln σolnEg
2kT----------–=
σlog σologEg
2.3( )2kT-----------------------–=
©2001 CRC Press LLC
Appendix C:Electrical Measurement
The most basic form of electrical measurement involves measurement of the resis-tance (DC) or impedance (AC). The impedance Z is a complex quantity having theresistance R as the real part and the reactance X as the imaginary part, i.e.,
Z = R + jX (C.1)
where j represents . The reactance X is due to capacitance and/or inductance.The quantities Z, R, and X depend on frequency υ (angular frequency ω = 2πυ)
For a capacitance C,
(C.2)
Note that X, in this case, decreases with increasing ω. The current through a capacitorleads the voltage by a phase of 90°, because the current is
(C.3)
where q is the charge and
q = Cv (C.4)
where v is the voltage (AC), i.e., v = V sin ωt.For an inductance L,
X = ωL (C.5)
Note that X in this case increases with increasing ω. The current i through an inductorlags the voltage v by a phase of 90° because
(C.6)
1–
X 1ωC--------–=
i dqdt------=
v Ldidt-----=
©2001 CRC Press LLC

An electric field at a high frequency penetrates only the near surface region ofa conductor. The amplitude of the wave decreases exponentially as the wave pene-trates the conductor. The depth at which the amplitude is decreased to 1/e of thevalue at the surface is called the “skin depth,” and the phenomenon is known as the“skin effect.” The higher the frequency υ, the smaller the skin depth δ, which isgiven by
δ = (σπµυ)–1/2 (C.7)
where σ is the DC electrical conductivity, µ is the permeability (µ = µ oµr), and υ isthe frequency. The greater is σ, the smaller is δ. Because of the skin effect, only thesurface region contributes significantly to conduction. Hence, R increases at highfrequencies, as illustrated in Figure C.1.
Measurement of resistance (DC) or impedance (Z) typically involves a samplethat has its long dimension along the direction of resistance/impedance measurement,since the resistance/impedance increases with length. This measurement is bestconducted by using the four-probe method, which involves four electrical contactssuch that the outer two are for passing current and the inner two for measuringvoltage, as illustrated in Figure C.2. Voltage divided by current is resistance (DC)or impedance (AC). In contrast, the two-probe method uses two electrical contacts,such that each contact is for both passing current and measuring voltage, as illustratedin Figure C.3. The main advantage of the four-probe over the two-probe method isthat the contact resistance/impedance is not included in the measured resis-tance/impedance in the former, but is included in the latter. Since the contact resis-
FIGURE C.1 Variation of resistance R with frequency due to the skin effect.
FIGURE C.2 The four-probe method of resistance/impedance measurement.
Frequency
Res
ista
nce
Voltage probe Voltage probe
Current probeCurrent probe
©2001 CRC Press LLC

tance/impedance may be even larger than the sample resistance/impedance, exclud-ing it is important. The contact resistance/impedance is not included in the four-probe method because no current passes through the voltage probes and, conse-quently, there is no contact potential drop (i.e., V = IR = 0 when I = 0 and R ≠ 0).Another advantage of the four-probe method is that the current path is parallel tothe direction of resistance/impedance measurement in the part of the sample betweenthe voltage probes. In contrast, the current path near the two probes is not parallelin the two-probe method. Having parallel current paths means that a cross-sectionalplane perpendicular to the current paths is equipotential.
The electrical contacts may be made by using solder, electrically conductingadhesive, electrically conducting paint, or pressure. Solder suffers from the require-ment of heating during application, and the heating may not be acceptable to thematerial. An adhesive or paint does not require heating, although some adhesivesperform better if heated. A pressure contact is the least expensive and disconnectionis easy, but it suffers from high contact resistivity.
Resistance/impedance measurements may be performed at different positive andnegative voltage levels. If the resulting plot of current vs. voltage (called the “I-Vcharacteristic”) is a straight line through the origin (Figure C.4), the resis-tance/impedance is independent of the voltage and the behavior is said to be ohmic.If the current is zero when the voltage is negative, and non-zero when the voltageis positive (Figure C.5), the behavior is said to be rectifying. The I-V characteristicprovides information on the electrical behavior. When the voltage is very high,breakdown (as in dielectric breakdown, Appendix D) can occur, causing the I-Vcharacteristic to deviate from linearity (Figure C.6).
FIGURE C.3 The two-probe method of resistance/impedance measurement.
FIGURE C.4 I-V characteristic for ohmic behavior.
Current probeVoltage probe
Current probeVoltage probe
V
I
©2001 CRC Press LLC

Measurement of the resistance/impedance does not give information on the typeof carrier, as holes and electrons both respond to the applied voltage and yieldcurrents in the same direction. To obtain information on the type of carrier, eitherHall measurement or thermopower measurement can be conducted.
Hall measurement involves measuring the voltage (called “Hall voltage”) in thevertical direction in the plane of Figure C.7 while the carriers move in the horizontaldirection in response to the applied voltage V, and the applied magnetic field is inthe direction going into the page. The carriers (each of charge q) experience a force
(called the “Lorentz force”) in the vertical direction, such that
(C.8)
where is the velocity of the carriers and B is the magnetic induction. If q is positive(i.e., the carriers are holes, which move toward the right in response to the applied
voltage V), is in the upward direction. This force causes the holes to move upward.Thus, the Hall voltage VH is positive. If q is negative (i.e., the carriers are electrons,
FIGURE C.5 I-V characteristic for rectifying behavior.
FIGURE C.6 I-V characteristic for ohmic behavior with dielectric breakdown.
V
I
I
V
F
F qvXB=
v
F
©2001 CRC Press LLC

which move toward the left in response to the applied voltage V), is also in theupward direction. This force causes the electrons to move upward. Thus, the Hallvoltage VH is negative. From the sign of VH, the type of carrier can be identified.
Thermopower measurement involves applying a temperature gradient across asample. The carriers have a net flow from the hot end to the cold end because thegreater thermal energy at the hot end causes more carrier motion in the vicinity ofthe hot end. If the carriers are holes, their movement will cause the cold end to beat a positive voltage relative to the hot end (Figure C.8). On the other hand, if thecarriers are electrons, their movement will cause the hot end to be at a positivevoltage relative to the cold end. Thus, from the sign of the voltage, the type of thecarrier can be identified. The “thermopower” is defined as the voltage per unittemperature difference.
FIGURE C.7 Hall measurement.
FIGURE C.8 Thermopower measurement.
+
+ -
-B
I
+ -
Hot
Cold
F
©2001 CRC Press LLC

Appendix D:Dielectric Behavior
Electrical insulators are also known as dielectrics. Most ionic solids and molecularsolids are insulators because of the negligible concentration of conduction electronsor holes.
Consider two metal (conductor) plates connected to the two ends of a batteryof voltage V (Figure D.1). Assuming the electrical resistance of the connecting wiresis negligible, the potential between the two metal plates is V. Assume that the mediumbetween the plates is a vacuum.
There are a lot of conduction electrons in the metal plates and metal wires. Thepositive end of the battery attracts conduction electrons, making the left plate pos-itively charged (charge = +Q). The negative end of the battery repels conductionelectrons, making the right plate negatively charged (charge = –Q). Let the area ofeach plate be A. the magnitude of charge per unit area of each plate is known asthe “charge density” (Do).
(D.1)
The electric field E between the plates is given by
(D.2)
FIGURE D.1 A pair of positively charged and negatively charged conductor plates in vacuum.
++++
+
+++
++++
+
------
-
----
---
d
V+ -
DoQA----=
E Vd----=
©2001 CRC Press LLC

where d is the separation of the plates. When E = 0, Do = 0. In fact, D is proportionalto E. Let the proportionality constant be εo. Then
Do = εoE (D.3)
εo is called the “permittivity of free space.” It is a universal constant.
εo = 8.85 × 10⁻¹² C/(V.m)
Eq. (D.3) is known as Gauss’s law.Just as Do is proportional to E, Q is proportional to V. The plot of Q versus V
is a straight line through the origin (Figure D.2), with
(D.4)
Co is known as the “capacitance.” Its unit is Coulomb/Volt, or Farad (F). In fact,this is the principle behind a parallel-plate capacitor.
Next, consider that the medium between the two plates is not a vacuum, but aninsulator whose center of positive charge and center of negative charge coincidewhen V = 0. When V > 0, the center of positive charge is shifted toward the negativeplate, while the center of negative charge is shifted toward the positive plate. Suchdisplacement of the centers of positive and negative charges is known as “polariza-tion.” In the case of a molecular solid with polarized molecules (e.g., HF), thepolarization in the molecular solid is due to the preferred orientation of each moleculesuch that the positive end of the molecule is closer to the negative plate. In the caseof an ionic solid, the polarization is due to the slight movement of the cations towardthe negative plate, and that of the anions toward the positive plate. In the case of anatomic solid, the polarization is due to the skewing of the electron clouds towardthe positive plate.
When polarization occurs, the center of positive charge sucks more electrons tothe negative plate, causing the charge on the negative plate to be –κQ, where κ > 1(Figure D.3). Similarly, the center of negative charge repels more electrons away
FIGURE D.2 Plot of charge Q vs. potential V. The slope = .
Q
V
CoεoA
d---------=
Slope CoQV----
εoEAEd
-------------εoA
d---------= = = =
©2001 CRC Press LLC

from the positive plate, causing the charge on the positive plate to be κQ. κ is aunitless number called the “relative dielectric constant.” Its value at 1 MHz (106 Hz)is 2.3 for polyethylene, 3.2 for polyvinyl chloride, 6.5 for Al2O3, 3000 for BaTiO3,and 78.3 for water.
The charges in the plates when a vacuum is between the plates are called “freecharges” (magnitude = Q on each plate). The extra charges in the plates when aninsulator is between the plates are called the “bound charges” (magnitude = κQ – Q =(κ – 1)Q on each plate).
When an insulator is between the plates, the charge density is given by
(D.5)
Using Eq. (D.3), Eq. (D.5) becomes
Dm = κ εo E = ε E (D.6)
where ε ≡ κεo; ε is known as the dielectric constant, whereas κ is known as therelative dielectric constant. Hence, ε and εo have the same unit.
When an insulator is between the plates, the capacitance is given by
(D.7)
From Eq. (D.7), the capacitance is inversely proportional to d, so capacitance mea-surement provides a way to detect changes in d (i.e., to sense strain).
Mathematically, the polarization is defined as the bound charge density, so thatit is given by
P = Dm − Do
= κ εoE − εoE (D.8)= (κ − 1) εoE
FIGURE D.3 A pair of positively charged and negatively charged conductor plates in amedium with relative dielectric constant κ.
+ +
+++ ++++
---- -
---
Center ofnegative charge
Center ofpositive charge
Free charges
Bound charges
+κQ -κQ
Dm κDoκQA
-------= =
CmκQV
-------κεoEA
Ed-----------------
κεoAd
------------- κCo= = = =
©2001 CRC Press LLC
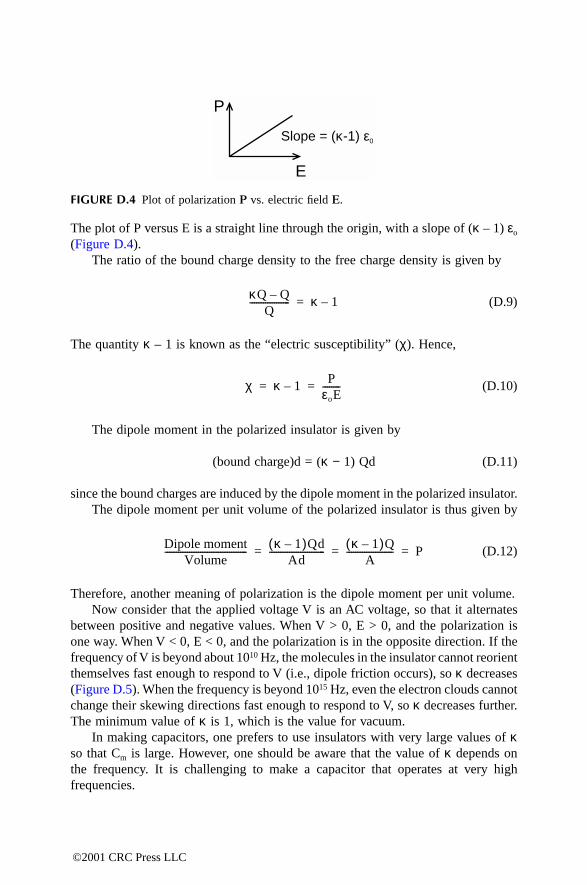
The plot of P versus E is a straight line through the origin, with a slope of (κ – 1) εo
(Figure D.4).The ratio of the bound charge density to the free charge density is given by
(D.9)
The quantity κ – 1 is known as the “electric susceptibility” (χ). Hence,
(D.10)
The dipole moment in the polarized insulator is given by
(bound charge)d = (κ − 1) Qd (D.11)
since the bound charges are induced by the dipole moment in the polarized insulator.The dipole moment per unit volume of the polarized insulator is thus given by
(D.12)
Therefore, another meaning of polarization is the dipole moment per unit volume.Now consider that the applied voltage V is an AC voltage, so that it alternates
between positive and negative values. When V > 0, E > 0, and the polarization isone way. When V < 0, E < 0, and the polarization is in the opposite direction. If thefrequency of V is beyond about 1010 Hz, the molecules in the insulator cannot reorientthemselves fast enough to respond to V (i.e., dipole friction occurs), so κ decreases(Figure D.5). When the frequency is beyond 1015 Hz, even the electron clouds cannotchange their skewing directions fast enough to respond to V, so κ decreases further.The minimum value of κ is 1, which is the value for vacuum.
In making capacitors, one prefers to use insulators with very large values of κso that Cm is large. However, one should be aware that the value of κ depends onthe frequency. It is challenging to make a capacitor that operates at very highfrequencies.
FIGURE D.4 Plot of polarization P vs. electric field E.
P
E
Slope = (κ-1) ε0
κQ Q–Q
------------------ κ 1–=
χ κ 1– PεoE--------= =
Dipole momentVolume
------------------------------------- κ 1–( )QdAd
------------------------- κ 1–( )QA
--------------------- P= = =
©2001 CRC Press LLC

In AC condition, it is mathematically more convenient to express E and Dm incomplex notation, i.e.,
E = Êeiωt = Ê(cos ωt + i sin ωt) (D.13)
and
(D.14)
where ω is the angular frequency (which is related to the frequency f by the equationω = 2πf; angular frequency has the unit radians/s, whereas frequency has the unitcycle/s, or Hertz (Hz)), δ is the dielectric loss angle (which describes the lag of Dm
with respect to E), Ê is the amplitude of the E wave, and Dm is the amplitude of theDm wave. If δ = 0, E and Dm are in phase and there is no lag. Not only are E andDm complex, ε is complex too. Eq. (D.6) then becomes
Hence,
(D.15)
The quantity is known as the “static dielectric constant.” From Eq. (D.15),the loss factor (or loss tangent or dielectric loss or dissipation factor) tan δ is given by
(D.16)
FIGURE D.5 Dependence of the relative dielectric constant κ on the frequency.
Orientation
κ
1
Electrons
Vacuum
Frequency (Hz)
1010 1015
Dm Dmei ωt δ–( ) Dm ωt δ–( ) i ωt δ–( )sin+cos[ ]= =
Dmei ωt δ–( ) εEeiωt=
ε Dm
E-------e iδ– Dm
E------- δ i δsin–cos( )= =
Dm E⁄
δtan Imaginary part of εReal part of ε
----------------------------------------------–=
©2001 CRC Press LLC

In another convention, the dissipation factor is defined as tan δ, while the dielectricloss factor is defined as κ tan δ.
By definition, ε = κεo, so Eq. (D.16) can be written as
(D.17)
The loss factor tan δ is more commonly used than δ itself to describe the extent oflag between Dm and E. This is because tan δ relates to the energy loss. The valueof tan δ at 1 MHz (106 Hz) is 0.0001 for polyethylene, 0.05 for polyvinyl chloride,and 0.001 for Al2O3.
Lag occurs when the insulator is not a perfect insulator. A nonideal capacitorcan be modeled as a capacitor C in parallel with a resistor (DC) R, as shown inFigure D.6. If the insulator is perfect, R will be infinite and thus disappear fromFigure D.6. The current ic through the capacitor is given by
(D.18)
where v is the AC voltage across both capacitor and resistor. Let
v = V sin ωt (D.19)
where V is the amplitude of the voltage wave of angular frequency ω, which isrelated to the frequency f and period T by
(D.20)
Substituting Eq. (D.19) into Eq. (D.18),
FIGURE D.6 A nonideal capacitor modeled as a capacitor C and a resistor R in parallel.
v = V sin ωt
C R
δtan Imaginary part of κReal part of κ
-----------------------------------------------–=
icdQdt------- C
dvdt------= =
ω 2πf 2πt
------= =
©2001 CRC Press LLC

(D.21)
Since
Eq. (D.21) becomes
(D.22)
Comparison of Eq. (D.22) with Eq. (D.19) shows that ic leads v by a phase angleof π/2, or 90°. This pertains to the current through the capacitor only.
The current through the resistor R is
(D.23)
iR and v are in phase.The phase relationship is conventionally described by a phasor diagram (Figure
D.7), which shows that iR is in phase with v, iC is 90° ahead of v, and the resultantcurrent i is ahead of v by φ = 90° – δ. From Figure D.7,
(D.24)
FIGURE D.7 Phasor diagram for the nonideal capacitor of Figure D.6.
v = V sin ωt
iR
i c=
=VR
sin ωtco
s ω
t
Res
ulta
nt c
urre
nt i
δ
V1/
ωC
ic Cdvdt------ ωCV ωtcos
V1 ωC( )⁄-------------------- ωtcos
= =
=
ωtπ2---+
sin ωtπ2---cossin ωt
π2---sincos+
ωtcos
=
=
icV
1 ωC( )⁄-------------------- ωt π
2---+
sin=
iRvR----
VR---- ωtsin= =
δtan V R⁄VωC------------- 1
ωCR------------= =
©2001 CRC Press LLC

The electrical energy stored in the perfect capacitor is
(D.25)
The maximum value of this energy is , and this occurs when cos 2ωt = –1.
The higher is C, the greater the energy loss.The loss of energy per cycle due to conduction through the resistor R is
(D.26)
The smaller is R, the greater is the energy loss. When R = ∞, R becomes an opencircuit and disappears from the circuit of Figure D.6.
(D.27)
Hence, tan δ is related to the energy loss. Energy loss is undesirable for mostpiezoelectric applications.
Dipole friction causes energy loss such that the greatest loss occurs at frequenciesat which dipole orientation can almost, but not quite, occur. This is shown in FigureD.8, which corresponds to Figure D.5. A peak in tan δ occurs at each step decreasein κ as the frequency increases.
Energy stored viC td0
τ
∫V2ωC ωt ωtcossin td
0
τ
∫V2ωC
2--------------- 2ωtsin td
0
τ
∫V2ωC4ω 2( )--------------- 2ωcos[ ] 0
τ–
14---CV2 2ωt 1–cos( )–
=
=
=
=
=
12---CV2
Energy lossV2
R------ ωt ωtsinsin td
0
2π ω⁄
∫V2
ωR-------- 1
2--- 1 2ωtcos–( ) ωt( )d
0
2π
∫V2
ωR-------- 1
2--- ωt
12--- 2ωtsin–
0
2π
V2
ωR-------- 1
2--- 2π 0– 0– 0+( )
V2πωR----------
=
=
=
=
=
Energy lost per cycle2π maximum energy stored×----------------------------------------------------------------------- V2π ωR⁄
2πCV2 2⁄------------------------
1ωCR------------ δtan
=
= =
©2001 CRC Press LLC

Dielectric measurement refers to measurement of the relative dielectric constantκ of a dielectric material. Parallel plate geometry is used because the capacitanceincreases with plate area. This geometry involves sandwiching the sample betweenelectrical conductor plates, applying a voltage across the parallel plates, and mea-suring the impedance across the plates. The measurement is best conducted usingthe three-electrode method, which involves one of the plates being one electrode,and the other plate consisting of an outer electrode and an inner electrode that areelectrically unconnected (Figure D.9). The outer electrode, called the “guard elec-trode,” ensures that the electric flux lines across the inner electrode and the otherplate are all perpendicular to the plates so that a cross-section of the sample parallelto the plates is equipotential. On the other hand, the electric flux lines across the
FIGURE D.8 Dependence of tan δ on the frequency.
FIGURE D.9 Three-electrode method of dielectric measurement: (a) Side view, (b) top view,(c) bottom view.
Frequency (Hz)
1010 1015ta
n δ
(a)
(b)
(c)
Guard electrode
Guard electrode
©2001 CRC Press LLC

outer electrode and the other plate partly curve outward. In contrast to the three-electrode method is the inferior two-electrode method (Figure D.10), which suffersfrom the outward curving of the electric flux lines near the edge of the sample.
Dielectric measurements can be performed as functions of frequency as well asvoltage across the plates. The variations of the impedance with frequency and voltageprovide information on the origin of dielectric behavior. The temperature may alsobe varied to yield even more information.
FIGURE D.10 Two-electrode method of dielectric measurement, side view.
©2001 CRC Press LLC
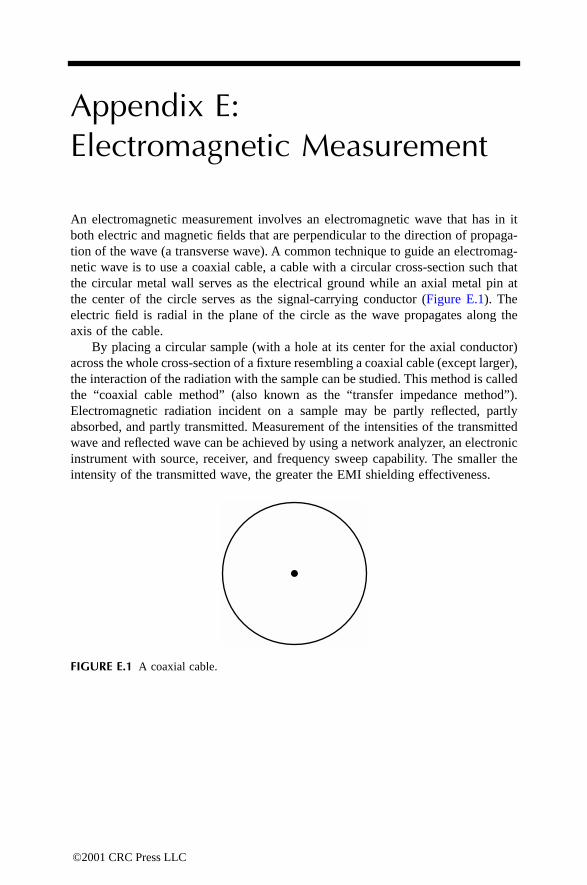
Appendix E:Electromagnetic Measurement
An electromagnetic measurement involves an electromagnetic wave that has in itboth electric and magnetic fields that are perpendicular to the direction of propaga-tion of the wave (a transverse wave). A common technique to guide an electromag-netic wave is to use a coaxial cable, a cable with a circular cross-section such thatthe circular metal wall serves as the electrical ground while an axial metal pin atthe center of the circle serves as the signal-carrying conductor (Figure E.1). Theelectric field is radial in the plane of the circle as the wave propagates along theaxis of the cable.
By placing a circular sample (with a hole at its center for the axial conductor)across the whole cross-section of a fixture resembling a coaxial cable (except larger),the interaction of the radiation with the sample can be studied. This method is calledthe “coaxial cable method” (also known as the “transfer impedance method”).Electromagnetic radiation incident on a sample may be partly reflected, partlyabsorbed, and partly transmitted. Measurement of the intensities of the transmittedwave and reflected wave can be achieved by using a network analyzer, an electronicinstrument with source, receiver, and frequency sweep capability. The smaller theintensity of the transmitted wave, the greater the EMI shielding effectiveness.
FIGURE E.1 A coaxial cable.
©2001 CRC Press LLC
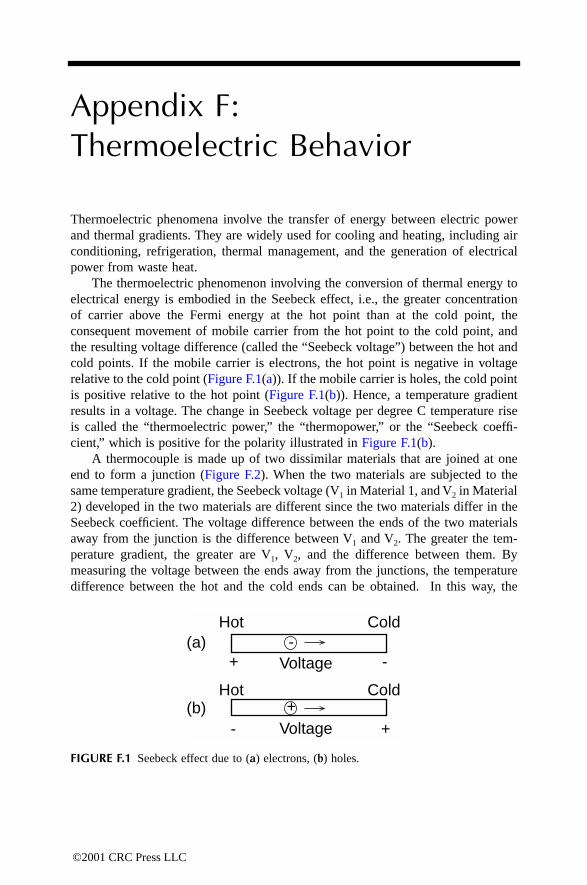
Appendix F:Thermoelectric Behavior
Thermoelectric phenomena involve the transfer of energy between electric powerand thermal gradients. They are widely used for cooling and heating, including airconditioning, refrigeration, thermal management, and the generation of electricalpower from waste heat.
The thermoelectric phenomenon involving the conversion of thermal energy toelectrical energy is embodied in the Seebeck effect, i.e., the greater concentrationof carrier above the Fermi energy at the hot point than at the cold point, theconsequent movement of mobile carrier from the hot point to the cold point, andthe resulting voltage difference (called the “Seebeck voltage”) between the hot andcold points. If the mobile carrier is electrons, the hot point is negative in voltagerelative to the cold point (Figure F.1(a)). If the mobile carrier is holes, the cold pointis positive relative to the hot point (Figure F.1(b)). Hence, a temperature gradientresults in a voltage. The change in Seebeck voltage per degree C temperature riseis called the “thermoelectric power,” the “thermopower,” or the “Seebeck coeffi-cient,” which is positive for the polarity illustrated in Figure F.1(b).
A thermocouple is made up of two dissimilar materials that are joined at oneend to form a junction (Figure F.2). When the two materials are subjected to thesame temperature gradient, the Seebeck voltage (V1 in Material 1, and V2 in Material2) developed in the two materials are different since the two materials differ in theSeebeck coefficient. The voltage difference between the ends of the two materialsaway from the junction is the difference between V1 and V2. The greater the tem-perature gradient, the greater are V1, V2, and the difference between them. Bymeasuring the voltage between the ends away from the junctions, the temperaturedifference between the hot and the cold ends can be obtained. In this way, the
FIGURE F.1 Seebeck effect due to (a) electrons, (b) holes.
++
+ -
-
-(a)
(b)Voltage
Voltage
Hot Cold
Hot Cold
©2001 CRC Press LLC

thermocouple is a temperature measurement device. In using a thermocouple, thejunction is placed at the location where temperature measurement is desired. Theends of the materials away from the junction are kept at a known temperature, suchas room temperature. The change in voltage difference between the ends away fromthe junction per degree C change in temperature difference between hot and coldends is called the “thermocouple sensitivity.” Note that the thermocouple is not basedon an interfacial phenomenon, but on the difference in bulk properties of the dis-similar materials.
FIGURE F.2 A thermocouple comprising two dissimilar materials, which give Seebeck volt-ages V1 and V2.
+
- -
+Junction
Temperature A
Temperature B
V1 V2
©2001 CRC Press LLC
Appendix G:Nondestructive Evaluation
G.1 INTRODUCTION
Nondestructive evaluation (NDE) or nondestructive testing (NDT) refers to thetesting of a component without harming it to assess its quality (during or aftermanufacture) or condition (during or after use). Assessment during manufactureenables adjustment of the manufacturing conditions of either the particular compo-nent being manufactured or similar components to be manufactured in order toimprove the quality. This assessment relates to smart manufacturing and qualitycontrol. Assessment during use enables the monitoring of damage induced by useso as to mitigate hazards. This relates to smart structures and structural healthmonitoring. The use of embedded sensors and structural materials with the inherentabilities to sense was described in Chapters 2–6. This appendix describes sensingmethods that involve materials or instrumentation that are external to the structure.These are commonly used for inspection because they are nonintrusive and widelyapplicable, though they are limited to sensing damage such as cracks. Strain, residualstress, and subtle damage cannot be sensed. Moreover, these types of damage maynot be amenable to sensing in real time.
G.2 LIQUID PENETRANT INSPECTION
Liquid penetrant inspection detects surface defects. It involves applying a penetrantto the surface to be inspected by dipping, spraying, or brushing. The penetrant isthen pulled into the surface crack by capillary action (Figure G.1(b)). After allowingsufficient time for the penetrant to be drawn into surface cracks, the excess penetrantis removed (Figure G.1(c)). After this, a developer (an absorbent material capableof drawing the penetrant from the cracks) is applied so that some penetrant isextracted to the surface (Figure G.1(d)) and visual inspection is possible. In orderto make the penetrant more visible, brightly colored dyes or fluorescent materialsare often added. Moreover, the developer is usually chosen to provide a contrastingbackground. After inspection, the developer and remaining penetrant are removedby cleaning.
©2001 CRC Press LLC

G.3 ULTRASONIC INSPECTION
An ultrasonic wave has a higher frequency than audible sound. The frequencytypically ranges from 25 to 100,000 MHz. A higher frequency means a shorterwavelength, which allows smaller defects to be detected.
Ultrasonic inspection involves sending an ultrasonic wave emitted by a pulsedoscillator and transducer through the material to be inspected and measuring theintensity of the reflected wave or the transmitted wave, as well as the time it takesfor the wave to be detected. A defect such as a crack acts as a barrier for thetransmission of the wave, so the intensity of the transmitted wave is decreased. This
FIGURE G.1 Liquid penetrant inspection.
FIGURE G.2 Ultrasonic inspection involving two transducers in the through-transmissionconfiguration.
Defect
Penetrant
Developer
(a)
(b)
(c)
(d)
Defect
Sending transducer
Receiving transducer
©2001 CRC Press LLC

is illustrated in Figure G.2, where two transducers are used in the through-transmis-sion configuration.
The through-thickness (in-line) configuration also allows measurement of thetime it takes for the wave to go from the sending transducer to the receivingtransducer. This time, together with the distance between the two transducers, givesthe ultrasonic sound speed of the material under inspection. During the curing of athermosetting resin, the ultrasonic sound speed of the resin changes. This makessense because the viscosity increases greatly as curing takes place. Hence, measure-ment of the ultrasonic sound speed allows cure monitoring. Another method of curemonitoring is the dielectric method in which the AC electrical conductivity is mea-sured. This conductivity is the ionic conductivity, which changes during curing. Yetanother method of cure monitoring uses an optical fiber.
A defect provides an interface that reflects the wave, so a reflected wave isdetected at an earlier time compared to the time when the reflected wave from thebottom surface is detected. This is shown in Figure G.3, where two transducers areused in the pulse-echo mode. An oscilloscope may be used to obtain the plot inFigure G.3(b). The time of the echo from the defect gives information on its depth.The intensity of the echo gives information on its size. It is possible for the receivingand sending transducer to be the same, as shown in Figure G.4, but this is limitedto the pulse-echo mode.
Since air is a poor transmitter of ultrasonic waves, an acoustic coupling medium(a liquid such as water, oil, or grease) is needed to connect a transducer to thematerial to be inspected. Figure G.5 illustrates the use of water as a coupling mediumin a pulse-echo configuration similar to Figure G.4. Note that Figures G.5(b) and
FIGURE G.3 (a) Ultrasonic inspection involving two transducers in the pulse-echo mode.(b) Plot of intensity (transducer voltage) vs. time showing the initial pulse and echoes fromthe bottom surface and the intervening defect.
Sendingtransducer
Receivingtransducer
Defect
Initialpulse
Echo fromdefect
Echo frombottom surface
Time
Inte
nsity
(b)
(a)
©2001 CRC Press LLC

G.3(b) differ in that the echo from the front surface is present in the former butabsent in the latter. The use of a coupling medium also means that the transducersdo not have to make contact with the material under inspection. The noncontactconfiguration is particularly attractive when the material under inspection is hot.
An ultrasonic technique more sensitive than the technique described in FiguresG.2–G.5 involves measuring the attenuation of the intensity of the ultrasonic waveupon bouncing back and forth by the front and bottom surfaces of the material underinspection. The greater the amount of defects in the material, the greater the atten-uation from cycle to cycle. For example, the echo from the back surface (FigureG.4) is recorded as a function of the cycle number, as shown in Figure G.6.
FIGURE G.4 Ultrasonic inspection involving a single transducer.
FIGURE G.5 (a) Ultrasonic inspection involving a single transducer connected to the mate-rial by water, which serves as an acoustic coupling medium. (b) Plot of intensity (transducervoltage) vs. time showing the initial pulse and echoes from the front and bottom surfaces andthe intervening defect.
Defect
Transducer
Transducer
Water
Initialpulse
Echo fromfront surface
Echo frombottom surface
Echo fromdefect
Time
Inte
nsity
(a)
(b)
©2001 CRC Press LLC

G.4 ACOUSTIC EMISSION TESTING
In response to an applied stress, a material may develop defects such as cracks. Theprocess is accompanied by the emission of ultrasonic waves. This is known as“acoustic emission” (AE). The detection of these waves provides a means of damagemonitoring in real time. Detection is achieved using receiving transducers. By theuse of two or more transducers in different locations of a test piece, the location ofthe damage can be determined. The energy of an acoustic emission event relates tothe damage mechanism, e.g., fiber breakage vs. delamination in a fiber composite.Acoustic emission occurs during loading, as defects are generated during loading.However, some damage mechanisms, such as delamination, cause acoustic emissionduring unloading, in addition to more extensive acoustic emission during loading.In the case of delamination, this is due to frictional noise associated with the adjacentdelaminated surfaces coming in contact as unloading occurs (Figure G.7).
FIGURE G.6 Attenuation of ultrasonic wave upon traveling through the material. One cyclemeans traveling from the front surface to the back surface and then to the front surface.
FIGURE G.7 Plot of the cumulative number of acoustic emission events vs. time (solid curve)and plot of load vs. time (dashed curve) during loading and unloading of a fiber compositeexperiencing delamination during loading and friction between delaminated surfaces duringunloading.
1 2 3 4 5Cycle No.
More defects
Fewer defects
Inte
nsity
of e
cho
from
bac
k su
rfac
e
Cum
ulat
ive
num
ber
ofac
oust
ic e
mis
sion
eve
nts
Load
Frictionbegins Friction
subsides
Time
©2001 CRC Press LLC

G.5 MAGNETIC PARTICLE INSPECTION
The magnetic flux lines in a ferromagnetic or ferrimagnetic material are distortedaround a defect, since the defect (such as a crack) has a low magnetic permeability(µr = 1 for air). This distortion for a surface crack is illustrated in Figure G.8. As aresult of the distortion, magnetic flux lines protrude from the surface at the locationof the surface crack. This is known as “field leakage,” which attracts magnetic particlesthat are applied to the surface of the material to be inspected. Hence, the location ofthe magnetic particles indicates the location of the defect. A subsurface defect thatis sufficiently close to the surface can also be detected, as shown in Figure G.9.
This method requires applying a magnetic field in a suitable direction, which ispreferably perpendicular to the length of the defect, in order to maximize thedistortion of the magnetic flux lines. As shown in Figure G.10, a defect that has itslength parallel to the applied magnetic field does not cause much distortion of themagnetic flux lines. A magnetic field along the axis of a cylindrical sample may beapplied by passing an electric current circumferentially, as shown in Figure G.11(a).A circumferential magnetic field may be applied by passing a current in the axialdirection, as shown in Figure G.11(b). Depending on the direction of the magneticfield, defects of various orientations are detected. This method is restricted to fer-romagnetic and ferrimagnetic materials.
FIGURE G.8 Distortion of the magnetic flux lines due to a surface crack in a ferromagneticor ferrimagnetic material.
FIGURE G.9 Distortion of the magnetic flux lines due to a subsurface defect.
FIGURE G.10 Little distortion of the magnetic flux lines when the length of the defect isparallel to the applied magnetic field.
Magnetic field
Magnetic field
Magnetic field
©2001 CRC Press LLC

G.6 EDDY CURRENT TESTING
An eddy current is an electric current induced in an electrically conducting materialdue to an applied time-varying magnetic field. The phenomenon is due to Faraday’slaw, which says that a voltage is generated in a conductor loop when the magneticflux through the loop is changed. The eddy current is in a direction such that themagnetic field it generates opposes the applied magnetic field. If a circumferentialcurrent is used to generate the applied electric field, the resulting eddy current is inthe opposite direction from the magnetizing current, as shown in Figure G.12 for acylindrical sample and a flat sample.
FIGURE G.11 (a) An axial magnetic field generated by a circumferential electric current.(b) A circumferential magnetic field generated by an axial electric current.
FIGURE G.12 The generation of an eddy current by an applied magnetic field: (a) a cylin-drical sample, (b) a flat sample.
Magnetizingcurrent
Magnetizingcurrent
Magnetic field
Magneticfield
(a)
(b)
Magnetizingcurrent
Magnetizingcurrent
(a)
(b)
Eddy current
Eddy current
©2001 CRC Press LLC

The eddy current paths are distorted around a defect, which is a region of higherelectrical resistivity, as shown in Figure G.13. Hence, the magnitude of the eddycurrent is diminished. As a result, the magnetic field induced by the eddy current isdecreased. Thus, this magnetic field, as sensed by a sensor coil, indicated the severityof the defect. By moving the sensor coil to different locations on the sample surface,the location of the defect is detected. This method is limited to electrically conductingmaterials.
G.7 X-RADIOGRAPHY
Internal defects are usually best detected by x-radiography, which involves sendingx-rays through the material to be inspected and detecting the transmitted x-ray imageusing a photographic film as shown in Figure G.14. A pore in the material to beinspected is low in density, so it gives more transmitted intensity and greater filmdarkening. An inclusion of high density in the material gives less transmitted inten-sity and less film darkening.
FIGURE G.13 Distortion of eddy current paths around a defect.
FIGURE G.14 X-radiography setup involving an x-ray source and a photographic film, withthe material to be inspected between them.
Magnetic field inducedby eddy current
Eddy current paths
Test piece
Photographic film
X-ray
©2001 CRC Press LLC

Appendix H:Electrochemical Behavior
Electrochemical behavior occurs when there are ions that can move in a mediumdue to an electric field. The positive ions (cations) move toward the negative end ofthe voltage gradient, while the negative ions (anions) move toward the positive end(Figure H.1). The medium containing the movable ions is called the “electrolyte.”The electrical conductors in contact with the electrolyte for the purpose of applyingthe electric field are electrodes. The electrode at the positive end of the voltagegradient is the positive electrode or anode. The electrode at the negative end is thenegative electrode or cathode. The electrodes must be sufficiently inert so that theydo not react with the electrolyte. In order to apply the electric field, the electrodesare connected to a DC power supply such that the cathode is connected to thenegative end and the anode to the positive end. In this way, electrons flow in theelectrical leads (the outer circuit) from the anode to the cathode, while ions flow inthe electrolyte. The electron flow in the outer circuit and the ion flow in the electrolyteconstitute a loop of charge flow. Note that the anions flow from cathode to anodein the electrolyte while the electrons flow from anode to cathode in the outer circuit,and both anions and electrons are negatively charged.
FIGURE H.1 Flow of electrons in the outer circuit from anode to cathode, flow of cationstoward cathode, and of anions toward anode in the electrolyte in response to applied voltage,which is positive at the anode.
e- e-
Electrolyte
Ions
Ano
de
Cat
hode
+_
©2001 CRC Press LLC
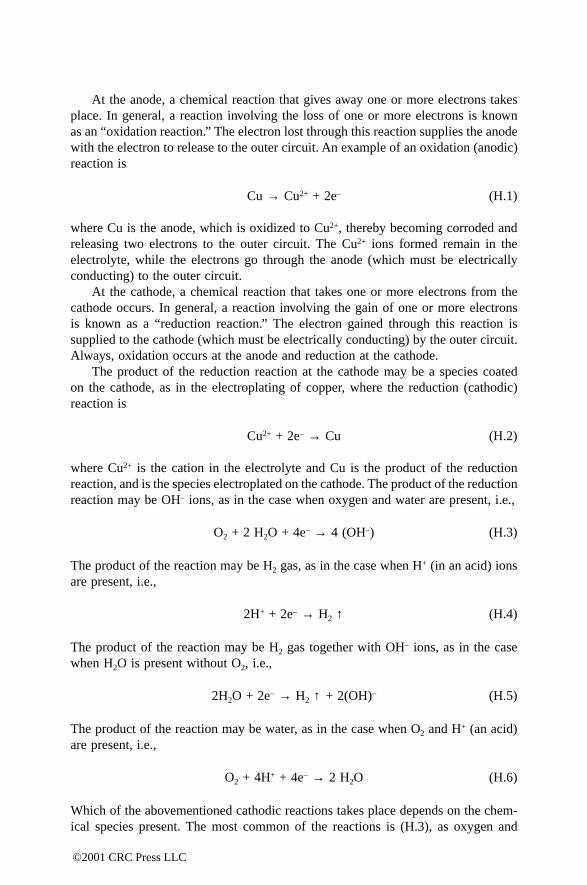
At the anode, a chemical reaction that gives away one or more electrons takesplace. In general, a reaction involving the loss of one or more electrons is knownas an “oxidation reaction.” The electron lost through this reaction supplies the anodewith the electron to release to the outer circuit. An example of an oxidation (anodic)reaction is
Cu → Cu2+ + 2e– (H.1)
where Cu is the anode, which is oxidized to Cu2+, thereby becoming corroded andreleasing two electrons to the outer circuit. The Cu2+ ions formed remain in theelectrolyte, while the electrons go through the anode (which must be electricallyconducting) to the outer circuit.
At the cathode, a chemical reaction that takes one or more electrons from thecathode occurs. In general, a reaction involving the gain of one or more electronsis known as a “reduction reaction.” The electron gained through this reaction issupplied to the cathode (which must be electrically conducting) by the outer circuit.Always, oxidation occurs at the anode and reduction at the cathode.
The product of the reduction reaction at the cathode may be a species coatedon the cathode, as in the electroplating of copper, where the reduction (cathodic)reaction is
Cu2+ + 2e– → Cu (H.2)
where Cu2+ is the cation in the electrolyte and Cu is the product of the reductionreaction, and is the species electroplated on the cathode. The product of the reductionreaction may be OH– ions, as in the case when oxygen and water are present, i.e.,
O2 + 2 H2O + 4e– → 4 (OH–) (H.3)
The product of the reaction may be H2 gas, as in the case when H+ (in an acid) ionsare present, i.e.,
2H+ + 2e– → H2 ↑ (H.4)
The product of the reaction may be H2 gas together with OH– ions, as in the casewhen H2O is present without O2, i.e.,
2H2O + 2e– → H2 ↑ + 2(OH)– (H.5)
The product of the reaction may be water, as in the case when O2 and H+ (an acid)are present, i.e.,
O2 + 4H+ + 4e– → 2 H2O (H.6)
Which of the abovementioned cathodic reactions takes place depends on the chem-ical species present. The most common of the reactions is (H.3), as oxygen and
©2001 CRC Press LLC

water are present in most environments. The variety of cathodic reactions is muchgreater than that of anodic reactions.
The anodic and cathodic reactions together make up the overall reaction. Forexample, the anodic reaction (H.1) and cathodic reaction (H.3) together become
A Cu2+ ion and two OH– ions formed by the overall reaction react to form Cu(OH)2,which resides in the electrolyte.
Both anode and cathode must be electrically conducting, but they do not haveto participate in the anodic or cathodic reactions. The anodic reaction (H.1) involvesthe anode (Cu) as the reactant, but the cathodic reactions (H.2), (H.3), (H.4), (H.5),and (H.6) do not involve the cathode. Thus, the cathode is usually a platinum wireor other electrical conductor that does not react with the electrolyte.
The electrolyte must allow ionic movement in it. It is usually a liquid, althoughit can be a solid. For the cathodic reaction (H.2) to occur, the electrolyte must containCu2+ ions (e.g., a copper sulfate or CuSO4 solution). For the cathodic reaction (H.4)to occur, the electrolyte must contain H+ ions (e.g., a sulfuric acid or H2SO4 solution).The anodic reaction occurs at the interface between the anode and the electrolyte;the cathodic reaction occurs at the interface between the cathode and the electrolyte.The ions that are either reactants (e.g., H+ in Reaction (H.4)) or reaction products(e.g., OH– in Reaction (H.3)) must move to or from the electrode/electrolyte inter-face.
Whether an electrode ends up being the anode or the cathode depends on therelative propensity for oxidation and reduction at each electrode. The electrode atwhich oxidation has higher propensity becomes the anode and the other becomesthe cathode. The propensity depends on the types and concentrations of the chemicalspecies present.
Different species have different propensities to be oxidized. For example, iron(Fe → Fe2+ + 2e–) has more propensity for oxidation than copper (Cu → Cu2+ + 2e–),when the Fe2+ and Cu2+ ions in the electrolyte are at the same concentration. WhenFe and Cu are the electrodes and the Fe2+ and Cu2+ ion concentrations are the samein the electrolyte, Fe will become the anode and Cu will become the cathode (FigureH.2). Fe and Cu constitute a galvanic couple, and this setup constitutes a galvaniccell or composition cell. The anodic reaction will be Fe → Fe2+ + 2e–, while thecathodic reaction will be (H.2), (H.3), (H.4), (H.5), or (H.6), depending on therelative propensity for these competing reduction reactions.
The concentrations of the species also affect the propensity. In general, highconcentrations of the reactants increase the propensity for a reaction, and highconcentrations of the reaction products decrease the propensity. This is known as“Le Chatelier’s principle.” Thus, a high concentration of Cu2+ in the electrolyteincreases the propensity for Reaction (H.2). When copper is both electrodes, but theCu2+ concentrations are different in the vicinities of the two electrodes, the electrode
2 Cu → 2 Cu2+ + 4e–
O2 + 2 H2O + 4e– → 4 (OH–)
2 Cu + O2 + 2 H2O → 2 Cu2+ + 4(OH–)
©2001 CRC Press LLC

with the higher Cu2+ ion concentration will become the cathode and the electrodewith the lower Cu2+ ion concentration will become the anode (Figure H.3). Thissetup involving a difference in concentration constitutes a concentration cell. Sim-ilarly, when copper is both electrodes, but the O2 concentrations are different in thevicinities of the two electrodes (Figure H.4), the electrode with the higher O2
concentration will become the cathode and the electrode with the lower O2 concen-tration will become the anode. A difference in oxygen concentration is commonlyencountered, since oxygen comes from air and access to air can be varied. Therefore,a concentration cell involving a difference in O2 concentration is particularly com-mon and is called an “oxygen concentration cell.” For example, a piece of copperwith dirt covering a part of it (Figure H.5) is an oxygen concentration cell, becausethe part of the copper covered by the dirt has less access to air and becomes theanode, forcing the uncovered part of the copper to be the cathode. Hence, the coveredpart gets corroded. Similarly, a piece of metal (an electrical conductor) having acrack in it (Figure H.6) is an oxygen concentration cell because the part of the metalat the crack has less access to air and becomes the anode, forcing the part of themetal exposed to open air to be the cathode.
When the two electrodes are open-circuited at the outer circuit, a voltage (calledthe “open-circuit voltage”) exists between them. This voltage describes the differencein the propensity for oxidation between the two electrodes, so it is considered thedriving force for the cathodic and anodic reactions that occur when the electrodesare short-circuited at the outer circuit. The greater the difference in oxidation pro-pensity, the higher the open-circuit voltage. This is the same principle behind bat-teries, which provide a voltage as the output. Because the voltage pertains to the
FIGURE H.2 Composition cell with Fe as the anode and Cu as the cathode. Note thatelectrons and ions flow without the need for an applied voltage between anode and cathode.
Fe Cu
e-
Fe2+
Fe CuFe2++ 2e- Cu2++ 2e-
Cu2+
e-
Anode Cathode
(Oxidation) (Reduction)
©2001 CRC Press LLC

FIGURE H.3 Concentration cell with Cu electrodes, a low Cu2+ concentration at the anodeside, and a high Cu2+ concentration at the cathode side.
FIGURE H.4 Oxygen concentration cell with Cu electrodes, a low O2 concentration at theanode side, and a high O2 concentration at the cathode side.
CuCu
e-
CuCu Cu2++ 2e-Cu2++ 2e-
Cu2+ Cu2+
e-
Anode Cathode
(Oxidation) (Reduction)
(low concentration) (high concentration)
CuCu
Cu Cu2+ + 2e-
e- e-
Anode Cathode
(Oxidation) (Reduction)
O2 (low concentration)
O2 (high concentration)
O2 + 2H2O + 4e-
4(OH-)
©2001 CRC Press LLC

difference between a pair of electrodes, it is customary to describe the voltage ofany electrode relative to the same electrode. In this way, each electrode is associatedwith a voltage, and a scale is established for ranking various electrodes in terms ofoxidation propensity. The electrode that serves as the reference involves the oxidationreaction
H2 → 2H+ + 2e–
such that the H2 gas is at a pressure of 1 atm, the H+ ion concentration in theelectrolyte is 1.0 M (1 M = 1 molar = 1 mole/liter), and the temperature is 25°C.In this reference, the electrode does not participate in the reaction, so it only needsto be an electrical conductor. Therefore, platinum is used. The platinum electrodeis immersed in the electrolyte and H2 gas is bubbled through the electrolyte, asillustrated in Figure H.7. The electrode in the figure is called the “standard hydrogenreference half-cell” (half of a cell). Relative to this reference half-cell, copper hasa lower oxidation propensity (when the Cu2+ ion concentration is 1 M and thetemperature is 25°C) such that the open circuit voltage is 0.340 V and the positiveend of the voltage is at the cathode, which is copper (Figure H.8). That the positiveend of the open circuit voltage is at the cathode is because the anode has a higheroxidation propensity than the cathode and it wants to release electrons to the outercircuit, which cannot accept them because of the open circuit situation. The standardelectrode potential for copper is thus +0.340 V. A ranking of the electrodes in terms
FIGURE H.5 A piece of copper partially covered by dirt is an oxygen concentration cell.
FIGURE H.6 A piece of metal with a crack is an oxygen concentration cell.
Cathode
Cu
Anode
Dirt
Anode
Crack
Metal
Cathode
©2001 CRC Press LLC

of the standard electrode potential is shown in Table H.1, which is known as the“standard electromotive force (emf) series.” Note that this ranking is for the case inwhich the ion concentration is 1 M and the temperature is 25°C. If the ion concen-tration or the temperature is changed, the ranking can be different. The higher theelectrode is in Table H.1, the more cathodic it is. The lower the electrode is in TableH.1, the more anodic it is. For example, from Table H.1, Fe is cathodic relative toZn, and the open-circuit voltage between the Fe and Zn electrodes (called the “overallcell potential”) is
FIGURE H.7 The standard hydrogen reference half-cell.
FIGURE H.8 A cell with copper as the cathode and the hydrogen half-cell as the anode underopen-circuit condition. The open-circuit voltage is 0.340 V — positive at the cathode.
H2 (1 atm)
H+ (1.0 M)
Pt
- 0.340 V +
Anode Cathode
H2
H2 2H+ + 2e- Cu2+ + 2e- Cu
H+ Cu2+
(Reduction)(Oxidation)
Pt Cu
©2001 CRC Press LLC

[(–0.440) – (–0.763)] V
= 0.323 V
such that the positive end of the voltage is at the Fe electrode (Figure H.9). Notefrom the figure that the electrolyte in the vicinity of the Fe electrode (i.e., the rightcompartment of the electrolyte) has Fe2+ ions at 1.0 M, while the electrolyte in thevicinity of the Zn electrode (i.e., the left compartment of the electrolyte) has Zn2+
ions at 1.0 M. The two compartments are separated by a membrane, which allowsions to flow through (otherwise it would be open circuited within the electrolyte)but provides enough hindrance to the mixing of the electrolytes in the two compart-ments. The anode reaction in Figure H.9 is
Zn → Zn2+ + 2e–
The cathode reaction is
Fe2+ + 2e– → Fe
TABLE H.1The Standard emf Series
Electrode ReactionStandard Electrode
Potential (V)
Increasingly inert Au3+ + 3e– → Au +1.420(Cathodic) O2 + 4H+ + 4e– → 2H2O +1.229
Pt2+ + 2e– → Pt ~+1.2Ag+ + e– → Ag +0.800
Fe3+ + e– → Fe2+ +0.771O2 + 2H2O + 4e– → 4(OH–) +0.401
Cu2+ + 2e– → Cu +0.3402H+ + 2e– → H2 0.000Pb2+ + 2e– → Pb –0.126Sn2+ + 2e– → Sn –0.136Ni2+ + 2e– → Ni –0.250Co2+ + 2e– → Co –0.277Cd2+ + 2e– → Cd –0.403Fe2+ + 2e– → Fe –0.440Cr3+ + 3e– → Cr –0.744Zn2+ + 2e– → Zn –0.763Al3+ + 3e– → Al –1.662
Mg2+ + 2e– → Mg –2.363Increasingly active Na+ + e– → Na –2.714(Anodic) K+ + e– → K –2.924
©2001 CRC Press LLC

The overall reaction is
Zn + Fe2+ → Zn2+ + Fe
The cell of Figure H.9 is commonly written as
Zn Zn2+ Fe2+ Fe (H.7)
where Zn and Fe2+ are the reactants, Zn2+ and Fe are the reaction products, and thevertical lines denote phase boundaries.
FIGURE H.9 A cell with zinc as the anode and iron as the cathode under open-circuitcondition. The open-circuit voltage is 0.323 V — positive at the cathode.
- 0.323 V +
Zn Fe
Anode Cathode
Zn Zn2+ + 2e- Fe2+ + 2e- Fe
Zn2+ Fe2+
(Reduction)(Oxidation)
©2001 CRC Press LLC

Appendix I:The pn Junction
A pn junction functions as a diode, with the current-voltage characteristic shown inFigure I.1. The pn junction allows current to go from the p-side to the n-side (I > 0,V > 0, forward bias), and almost no current from the n-side to the p-side (I < 0 butalmost zero when V < 0, reverse bias). When the applied voltage V is very negative,a large negative current flows. This is known as “breakdown.”
Consider a pn junction at V = 0 (open circuited). Because the hole concentrationis much higher in the p-side than the n-side, holes diffuse from the p-side to then-side, causing the exposure of some acceptor anions near the junction in the p-side(Figure I.2). Similarly, because the conduction electron concentration is much higherin the n-side than the p-side, the conduction electrons diffuse from the n-side to thep-side, thus causing the exposure of some donor cations near the junction in the n-side. In this way, diffusion results in a region with very few carriers near the junction.This region is the depletion region (or the space-charge layer, or the dipole layer,or the transition region). The exposed ions in the depletion region cause an electricfield such that the electric potential is higher in the n-side than the p-side. Thedifference in electric potential between the two sides is called the “contact potential”(Vo). Note that the contact potential is present even when the applied voltage V iszero. The contact potential is a barrier for the diffusion of holes from the p-side tothe n-side because holes want to go down in potential. Similarly, the contact potentialis a barrier for the diffusion of conduction electrons from the n-side to the p-sidebecause electrons want to go up in potential. Both the diffusion of holes from thep-side to the n-side and the diffusion of electrons from the n-side to the p-sidecontribute to the diffusion current Id, which flows from the p-side to the n-side.
FIGURE I.1 The pn junction (a) configuration, (b) current (I)-voltage (V) relationship.
Breakdown Reversebias
Forward
bias
P
n
V
-
+
( a ) ( b )
II
VI o
-
©2001 CRC Press LLC

There is a small concentration of holes in the n-side. When these holes approachthe depletion region, they spontaneously go down the potential gradient and get tothe p-side. Similarly, there is a small concentration of conduction electrons in thep-side. When these conduction electrons approach the depletion region, they spon-taneously go up the potential gradient and get to the n-side. Such movements of theminority carriers constitute a drift current (Io) that flows from the n-side to the p-side, i.e., in a direction opposite to that of the diffusion current Id.
When the applied voltage V is zero, the current I is also zero, since there is anopen circuit. Under this situation, Id = Io.
When the applied voltage V is negative (reverse bias), the applied potential ismore positive in the n-side than the p-side. This causes the contact potential toincrease to Vo – V (since V < 0). As a result, the barrier to the diffusion current isincreased, thus greatly lowering Id, to the extent that Id << Io. Hence,
I = Id – Io ≅ – Io
Because Io is due to the minority carriers, it is bound to be small. Therefore, underreverse bias, a very small current flows from the n-side to the p-side.
FIGURE I.2 A pn junction at bias voltage V = 0.
+ + + - + - - - -
+ Hole
Donor cation
Acceptor anion
Conduction electron
+
-
+ + + - + - - -+ + + - + - - -
+ + + - + - - -
p - side n - side
p n
Carrier
concentration
Electric
potential
W
p = hole concentration
n = conduction electron concentration
W = width of depletion region
Vo
Vo = contact potential
Id = diffusion current
Io = drift currentId
Io
©2001 CRC Press LLC

When the applied voltage V is very negative, the contact potential becomes verylarge, resulting in an intense electric field in the depletion region. This strong electricfield may tear electrons out of the covalent bonds, creating many more holes andconduction electrons. The holes and electrons get swept across the depletion regionwith high kinetic energies, knocking more valence electrons out of covalent bonds.The consequence is a large reverse current (I < 0, V < 0). This phenomenon is knownas “breakdown.”
When the applied voltage V is positive (forward bias), the applied potential ismore positive in the p-side than the n-side, so the contact potential decreases toVo – V. Hence, the barrier to the diffusion current is lowered and Id >> Io. Therefore,
I = Id – Io ≈ Id
In fact, Id increases exponentially with increasing V.
©2001 CRC Press LLC

Appendix J:Carbon Fibers
Carbon fibers are fibers that are at least 92 wt.% carbon in composition.1 They canbe short or continuous; their structure can be crystalline, amorphous, or partlycrystalline. The crystalline form has the crystal structure of graphite (Figure J.1),which consists of sp2 hybridized carbon atoms arranged two-dimensionally in ahoneycomb structure in the x-y plane. Carbon atoms within a layer are bonded by(1) covalent bonds provided by the overlap of the sp2 hybridized orbitals, and(2) metallic bonding provided by the delocalization of the pz orbitals, i.e., the πelectrons. This delocalization makes graphite a good electrical conductor and a goodthermal conductor in the x-y plane. The bonding between the layers is van der Waalsbonding, so the carbon layers can easily slide with respect to one another; graphiteis an electrical insulator and a thermal insulator perpendicular to the layers. Due tothe difference between the in-plane and out-of-plane bonding, graphite has a highmodulus of elasticity parallel to the plane and a low modulus perpendicular to theplane. Thus, graphite is highly anisotropic.
The high modulus of a carbon fiber stems from the fact that the carbon layers,though not necessarily flat, tend to be parallel to the fiber axis. This crystallographicpreferred orientation is known as a “fiber texture.” A carbon fiber has a highermodulus parallel to the fiber axis than perpendicular to the fiber axis, and thecoefficient of thermal expansion is lower along the fiber axis.
The greater the degree of alignment of the carbon layers parallel to the fiberaxis (i.e., the stronger the fiber texture, the greater the c-axis crystallite size (Lc),the density, the carbon content, and the fiber’s tensile modulus, electrical conduc-tivity, and thermal conductivity parallel to the fiber axis), the smaller the fiber’scoefficient of thermal expansion and internal shear strength.
The carbon layers in graphite are stacked in an AB sequence such that half ofthe carbon atoms have atoms directly above and below them in adjacent layers(Figure J.1). Note that this AB sequence differs from that in a hexagonal close-packed (HCP) crystal structure. In a carbon fiber, there can be graphite regions ofsize Lc perpendicular to the layers and size La parallel to the layers. There can alsobe crystalline regions in which the carbon layers, though well developed and parallelto one another, are not stacked in any particular sequence; the carbon in these regionsis said to be turbostratic carbon. Yet another type of carbon that can exist in carbonfibers in amorphous carbon, in which the carbon layers, though well developed, arenot even parallel to one another.
The proportion of graphite in a carbon fiber can range from 0 to 100%. Whenthe proportion is high, the fiber is said to be graphitic, and it is called a graphite
©2001 CRC Press LLC

fiber. However, a graphite fiber is polycrystalline, whereas a graphite whisker is asingle crystal with the carbon layer rolled up like a scroll. Because of their singlecrystal nature, graphite whiskers are virtually flaw-free and have exceptionally highstrength. However, the production yield of graphite whiskers is too low for them tobe commercially significant.
Table J.12 compares the mechanical properties, melting temperature, and densityof carbon fibers with other types of fibers. There are numerous grades of carbonfibers; Table J.1 only shows the two high-performance grades, which are labeled“high strength” and “high modulus.” Among the fibers (not counting the whiskers),high-strength carbon fibers exhibit the highest strength, while high-modulus carbonfibers exhibit the highest elasticity. Moreover, the density of carbon fibers is quitelow, making the specific modulus (modulus/density ratio) of high-modulus carbonfibers exceptionally high. The polymer fibers, such as polyethylene and Kevlar®
fibers, have densities even lower than carbon fibers, but their melting temperaturesare low. The ceramic fibers, such as glass, SiO2, Al2O3, and SiC fiber, have densitieshigher than carbon fibers; most of them (except glass fibers) suffer from high pricesor are not readily available in a continuous fiber form. The tensile stress-strain curvesof the fibers are straight lines all the way to fracture, so the strength divided by themodulus gives the ductility (strain at break) of each fiber, as shown in Table J.1.The main drawback of the mechanical properties of carbon fibers is in the lowductility, which is lower than those of glass, SiO2, and Kevlar fibers. The ductilityof high-modulus carbon fibers is even lower than that of high-strength carbon fibers.
FIGURE J.1 The crystal structure of graphite.
Z
Y
A BX
B' A'
1.42 A0
3.35
A0
©2001 CRC Press LLC

TABLE J.1 Properties of Var
Material
elting Temp.
a
(
°
C)Specific Modulus
a
(10
6
m)Specific Strength
a
(10
4
m)
E-glass < 1725 2.90 14S-glass < 1725 3.56 18SiO
2
1728 3.38 27.4Al
2
O
3
2015 9.86 5.3ZrO
2
2677 7.26 4.3Carbon(high-strength)
3700 18.8 19
Carbon(high-modulus)
3700 36.3 13
BN 2730 4.78 7.4Boron 2030 16.4 12B
4
C 2450 20.9 9.9SiC 2700 12.0 5.1TiB
2
2980 11.6 0.3Be 1277 19.7 7.1
©2001 CRC Pres
ious Fibers and Whiskers
Densitya
(g/cm3)Tensile Strengtha
(GPa)Modulus of Elasticitya
(GPa)Ductility
(%)M
2.55 3.4 72.4 4.72.50 4.5 86.9 5.22.19 5.9 72.4 8.13.95 2.1 380 0.554.84 2.1 340 0.621.50 5.7 280 2.0
1.50 1.9 530 0.36
1.90 1.4 90 1.62.36 3.4 380 0.892.36 2.3 480 0.484.09 2.1 480 0.444.48 0.10 510 0.021.83 1.28 300 0.4
s LLC

W 3410 2.2 2Polyethylene 147 12.4 27.4Kevlar
®
500 8.81 25.7Al
2
O
3
whiskers 1982 11.0 53.3BeO whiskers 2550 12.3 47.0B
4
C whiskers 2450 19.5 56.1SiC whiskers 2700 15.4 66.5Si
3
N
4
whiskers — 12.1 44.4Graphite whiskers 3700 43 128Cr whiskers 1890 3.40 12
a
From Ref. 2.
TABLE J.1 (continProperties of Var
MaterialD
ty Melting Temp.
a
(
°
C)Specific Modulus
a
(10
6
m)Specific Strength
a
(10
4
m)
©2001 CRC Press L
19.4 4.0 410 0.980.97 2.59 120 2.21.44 4.5 120 3.83.96 21 430 4.92.85 13 340 3.82.52 14 480 2.93.18 21 480 4.43.18 14 380 3.71.66 21 703 3.07.2 8.90 240 3.7
ued)ious Fibers and Whiskers
ensitya
(g/cm3)Tensile Strengtha
(GPa)Modulus of Elasticitya
(GPa)Ductili
(%)
LC

Carbon fibers that are commercially available are divided into three categories,namely general-purpose (GP), high-performance (HP), and activated carbon fibers(ACF). The general-purpose type is characterized by an amorphous and isotropicstructure, low tensile strength, low tensile modulus, and low cost. The high-perfor-mance type is characterized by relatively high strength and modulus. Among thehigh-performance carbon fibers, a higher modulus is associated with a higher pro-portion of graphite and more anisotropy. Activated carbon fibers are characterizedby the presence of a large number of open micropores, which act as adsorption sites.The adsorption capacity of activated carbon fibers is comparable to that of activatedcarbons, but the fiber shape of activated carbon fibers allows the adsorbate to get tothe adsorption site faster, thus accelerating the adsorption and desorption processes.3
The amount adsorbed increases with the severity of activation. Severe activationmay be achieved by treating commercial ACF with sulfuric acid, followed by heatingat up to 500°C.4
Commercial carbon fibers are fabricated by using pitch or polyacrylonitrile(PAN) as the precursor. The process for both precursors is shown in Scheme J.1.5
Precursor fibers are fabricated by conventional spinning techniques, such as wetspinning for PAN and melt spinning for pitch. They must be converted to a formthat is flameproof and stable at the high temperatures (> 700°C) involved in carbon-ization. Therefore, before carbonization (pyrolysis), they are stabilized in the caseof the PAN precursor, or infusiblized in the case of the pitch precursor. Bothstabilization and infusiblization are carried out in an oxidizing atmosphere. Afterthat, general-purpose and high-performance fibers are obtained by carbonization inan inert atmosphere, followed by graphitization at > 2500°C in an inert atmosphere
SCHEME J.1 The process for making carbon fibers from PAN and pitch precursors.
CARBON FIBERCARBON FIBER
ACTIVATEDFIBER
Activation(reactive atm.)
PANPolymerization
Wet spinning
Stabilization(oxidizing atm.)
Carbonization(inert atm.)
Graphitization(inert atm.)
PITCHPitch preparation
(isotropic/anisotropic)
Melt spinning
Infusibilization(oxidizing atm.)
Carbonization(inert atm.)
Graphitization(inert atm.)
©2001 CRC Press LLC
if a high modulus is desired. Activated carbon fibers are obtained by activation in areactive atmosphere, such as steam at elevated temperatures. To enhance the pre-ferred orientation in the high-performance carbon fibers, graphitization can be per-formed while the fibers are under tension. The higher the graphitization temperature,the greater the preferred orientation.
For the case of pitch as the precursor, isotropic pitch gives an isotropic carbonfiber, which belongs to the category of general-purpose carbon fibers. Anisotropicpitch (such as mesophase pitch) yields high-performance carbon fibers that have thecarbon layers preferentially parallel to the fiber axis.
Table J.2 shows the tensile properties of various carbon fibers on the market.Among the high-performance (HP) carbon fibers, those based on pitch can attain ahigher modulus than those based on PAN, because pitch is more graphitizable thanPAN. In particular, the HP fiber designated E-130 by du Pont exhibits a modulus of894 GPa, which is over 80% of the theoretical value of graphite single crystal (1000GPa). A higher modulus is associated with a lower elongation at break, as shownby comparing the group of BP Amoco HP fibers in the order P-25, P-75S, andP-120S, and the group of du Pont HP fibers in the order E-35, E-75, and E-130.The du Pont HP fibers exhibit higher tensile strengths and greater elongations thanthe BP Amoco HP fibers of similar moduli. Among the high-performance (HP)fibers, those based on PAN can attain a higher tensile strength and greater elongationthan those based on pitch because (1) shear is easier between the carbon layers ina graphitized fiber, (2) pitch is more graphitizable than PAN, and (3) the orientedgraphitic structure causes the fibers to be more sensitive to surface defects andstructural flaws. In particular, the HP PAN-based fiber designated T-1000 by Torayexhibits a tensile strength of 7060 MPa and an elongation of 2.4%. The general-purpose (GP) fibers tend to be low in strength and modulus, but high in elongationat break.
Table J.2 also shows the diameters of various commercial carbon fibers. Amongthe HP fibers, those based on PAN have smaller diameters than those based on pitch.
Pitch-based carbon fibers (GP and HP) represent only about 10% of the totalcarbon fibers produced worldwide around 1990,6 but this percentage is increasingdue to the lower cost and higher carbon content of pitch compared to PAN. Thecosts of precursors and carbon fibers are shown in Table J.3. Mesophase pitch-basedcarbon fibers are currently the most expensive because of the processing cost.Isotropic pitch-based carbon fibers are the least expensive. PAN-based carbon fibersare intermediate in cost.
Although carbon fibers are mostly more expensive than aramid fibers or glassfibers, they provide higher tensile strengths. Among the different grades of carbonfibers, the prices differ greatly. In general, the greater the tensile strength, the higherthe price.7
The price of carbon fibers has been decreasing while consumption has beenincreasing.7 The decreasing price is broadening the applications of carbon fibersfrom military to civil application, from aerospace to automobile applications, andfrom biomedical devices to concrete structures.
©2001 CRC Press LLC

iameter (µm) Manufacturer
14.5 Kureha Chem.14.5 Kureha Chem.13 Donac10 Ashland Petroleum
7-11 Nippon Carbon7.0 Toray7.0 Toray5.2 Toray5.3 Toray5 Mitsubishi Rayon6 Mitsubishi Rayon
6.2 Toho Rayon4.7 Toho Rayon4.0 Toho Rayon8 Hercules8 Hercules8 Hercules5 Hercules5 Hercules
TABLE J.2 Tensile Properties and Diameters of Commercial Carbon Fibers
TypeFiber
DesignationTensile Strength
(MPa)
Tensile Modulus of Elasticity
(GPa)
Elongation at Break
(%)D
GP T-101S 720 32 2.2T-201S 690 30 2.1S-210 784 39 2.0P-400 690 48 1.4GF-20 980 98 1.0
HP (PAN) T-300 3530 230 1.5T-400H 4410 250 1.8T-800H 5590 294 1.9T-1000 7060 294 2.4MR 50 5490 294 1.9MRE 50 5490 323 1.7HMS-40 3430 392 0.87HMS-40X 4700 392 1.20HMS-60X 3820 588 0.65AS-1 3105 228 1.32AS-2 2760 228 1.2AS-4 3795 235 1.53AS-6 4140 242 1.65IM-6 4382 276 1.50
©2001 CRC Press LLC

8 Hercules8 Hercules
H 11 BP Amoco10 BP Amoco10 BP Amoco9.6 du Pont9.4 du Pont9.2 du Pont10 Donac9 Donac
A
15 Toho Rayon
7 Toho Rayon
14 Donac
11 Donac
a
b
c
TT
meter µm) Manufacturer
HMS4 2484 338 0.7HMU 2760 380 0.70
P (pitch) P-25 1400 160 0.9P-75S 2100 520 0.4P-120S 2200 827 0.27E-35 2800 241 1.03E-75 3100 516 0.56E-130 3900 894 0.55F-140 1800 140 1.3F-600 3000 600 0.52
CF FX-100 — 500a 18b
FX-600 — 1500a 50b
A-10 245 1000a 20c
A-20 98 2000a 45c
Specific surface area (m2/g)Adsorption amount of benzene (%)Adsorption amount of acetone (%)
ABLE J.2 (CONTINUED)ensile Properties and Diameters of Commercial Carbon Fibers
TypeFiber
DesignationTensile Strength
(MPa)
Tensile Modulus of Elasticity
(GPa)
Elongation at Break
(%)Dia
(
©2001 CRC Press LLC

Under rapid development are short carbon fibers grown from the vapor of low-molecular-weight hydrocarbon compounds, such as acetylene. This process involvescatalytic growth using solid catalyst particles (e.g., Fe) to form carbon filaments,which can be as small as 0.1 µm in diameter. Subsequent chemical vapor depositionfrom the carbonaceous gas in the same chamber causes the filaments to grow indiameter, resulting in vapor-grown carbon fibers (VGCF) or gas-phase-grown carbonfibers.
Carbon fibers can alternatively be classified on the bases of their tensile strengthand modulus. The nomenclature given below was formulated by IUPAC.
• UHM (ultra high modulus) type: carbon fibers with modulus greater than500 GPa
• HM (high modulus) type: carbon fibers with modulus greater than 300GPa and strength-to-modulus ratio less than 1%
• IM (intermediate modulus) type: carbon fibers with modulus up to 300GPa and strength-to-modulus ratio above 1 × 10⁻²
• Low-modulus type: carbon fibers with modulus as low as 100 GPa andlow strength; they have an isotropic structure
• HT (high strength) type: carbon fibers with strength greater than 3 GPaand strength-to-modulus ratio between 1.5 and 2 × 10⁻²
There is overlap between the IM and HT categories, as shown by the abovedefinitions.
Commercial continuous carbon fibers are in the form of tows (untwisted bundles)containing typically 1,000–12,000 fibers (filaments) per tow, or yarns (twisted bun-dles). They may be sized or unsized. The sizing improves the handleability and mayenhance the bonding between the fibers and certain matrices when the fibers areused in composites.
High-performance carbon fibers are widely used in polymer-matrix compositesfor aircraft that are lightweight for the purpose of saving fuel. The aircraft Voyager,which has 90% of its structure made of such composites, achieved a nonstop,unfueled, around-the-world flight in 1986. The use of such composites in passengeraircraft is rapidly increasing. High-performance carbon fibers are also used in car-bon-matrix composites for high-temperature aerospace applications, such as theSpace Shuttle, as the carbon matrix is more temperature resistant than a polymer
TABLE J.3Cost of PAN-Based, Mesophase Pitch-Based, and Isotropic Pitch-Based Carbon Fibers (From Ref. 6.)
Cost of Precursor ($/kg) Cost of Carbon Fibers ($/kg)
PAN-based 0.40 60Mesophase pitch-based 0.25 90Isotropic pitch-based 0.25 22
©2001 CRC Press LLC
matrix. These fibers have begun to be used in metal matrices, such as aluminum,for aerospace applications, as aluminum is more temperature resistant than polymers.
Short general-purpose pitch-based carbon fibers are used for the reinforcementof concrete, because low cost is crucial for the concrete industry. Because this is alarge-volume application of carbon fibers, the tonnage of carbon fibers used isexpected to increase markedly as this application becomes more widely accepted.General-purpose carbon fibers are also used for thermal insulation, sealing materials,electrically conducting materials, antistatic materials, heating elements, electrodes,filters, friction materials, sorbents, and catalysts.8
REFERENCES
1. E. Fitzer, in Carbon Fibers, Filaments, and Composites, J.L. Figueiredo, C.A. Ber-nardo, R.T.K. Baker, and K.J. Huttinger, Eds., Kluwer Academic, Dordrecht, pp. 3-41(1990).
2. D.R. Askeland, The Science and Engineering of Materials, 2nd Ed., PWS-Kent,Boston, p. 591 (1989).
3. L.I. Fridman and S.F. Grebennikov, Khimicheskie Volokna 6, 10-13 (1990).4. Isao Mochida and Shizuo Kawano, Ind. Eng. Chem. Res. 30(10), 2322-2327 (1991).5. K. Okuda, Trans. Mater. Res. Soc. Jpn. 1, 119-139 (1990).6. D.D. Edie, in Carbon Fibers, Filaments, and Composites, J.L. Figueiredo, C.A.
Bernardo, R.T.K. Baker, and K.J. Huttinger, Eds., Kluwer Academic, Dordrecht, pp.43-72 (1990).
7. E. Fitzer and F. Kunkele, High Temp. High Pressures 22(3), 239-266 (1990).8. R.M. Levit, Khimicheskie Volokna 6, 16-18 (1990).
©2001 CRC Press LLC