application of random vibration theory methodology for ... · application of random vibration...
TRANSCRIPT
Application of Random Vibration Theory Methodology for Seismic
Soil-Structure Interaction Analysis
Farhang Ostadan Nan Deng Lisa Anderson Bechtel National, Inc. USDOE NPH Workshop October 2014
Application of Random Vibration Theory Methodology for Seismic Soil-Structure Interaction Analysis, Page-2
Background
• Current practice for SSI analysis utilizes time histories matched to design response spectra
• Structural responses may vary significantly depending on the time history seed selection
• Recently, the number of time histories required to obtain a stable mean response has been challenged
• Forthcoming version of ASCE 4 recommends a minimum of 5 sets of time histories to capture variability of ground motion on structural response
• SRP 3.7.1 requests closer inspection of Power Spectral Density before a time history is selected
Application of Random Vibration Theory Methodology for Seismic Soil-Structure Interaction Analysis, Page-3
Background
• In RVT analysis, the structural response is directly calculated from a design response spectrum, eliminating the need to work with time histories • RVT has been used in recent years for seismic site response and development of ground motions • Using the same methodology RVT has been applied to SSI analysis
• Reviewed in technical publications and regulatory reviews
• Is permitted in the forthcoming version of ASCE 4
Application of Random Vibration Theory Methodology for Seismic Soil-Structure Interaction Analysis, Page-4
RVT Formulation in SASSI2010
• RVT Formulation for SASSI2010 • Published by Farhang Ostadan and Nan Deng • Proceedings of the 15th World Conference on
Earthquake Engineering • “Random Vibration Theory-Based-Soil-Structure
Interaction Analysis”
Application of Random Vibration Theory Methodology for Seismic Soil-Structure Interaction Analysis, Page-5
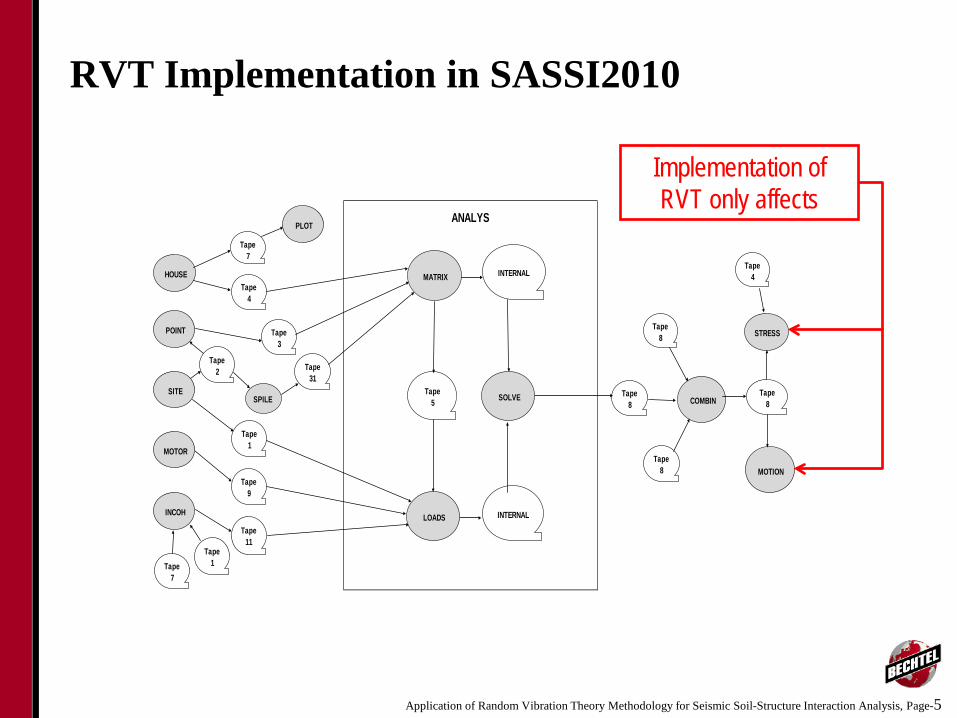
RVT Implementation in SASSI2010
ANALYS
Tape8
HOUSE
Tape2
Tape7
Tape1
Tape7
Tape4
Tape3
SPILE
Tape1
Tape9
Tape11
Tape5
INTERNAL
INTERNAL
Tape8
Tape8
COMBINTape
8
STRESS
MOTION
Tape31
PLOT
POINT
SITE
MOTOR
INCOH LOADS
SOLVE
MATRIXTape
4
Implementation of RVT only affects
Application of Random Vibration Theory Methodology for Seismic Soil-Structure Interaction Analysis, Page-6
Objective
• Demonstrate use of RVT analysis to produce a stable mean response in one step through comparison with multiple time history analyses • Four Demonstration Cases:
• Diesel Generator Type Structure on Hard Rock • Lumped Mass Stick Model of Reactor Type Structure on
Hard Rock • Deeply Embedded Structure on Rock Site • Deeply Embedded Structure on Soil Site
Application of Random Vibration Theory Methodology for Seismic Soil-Structure Interaction Analysis, Page-7
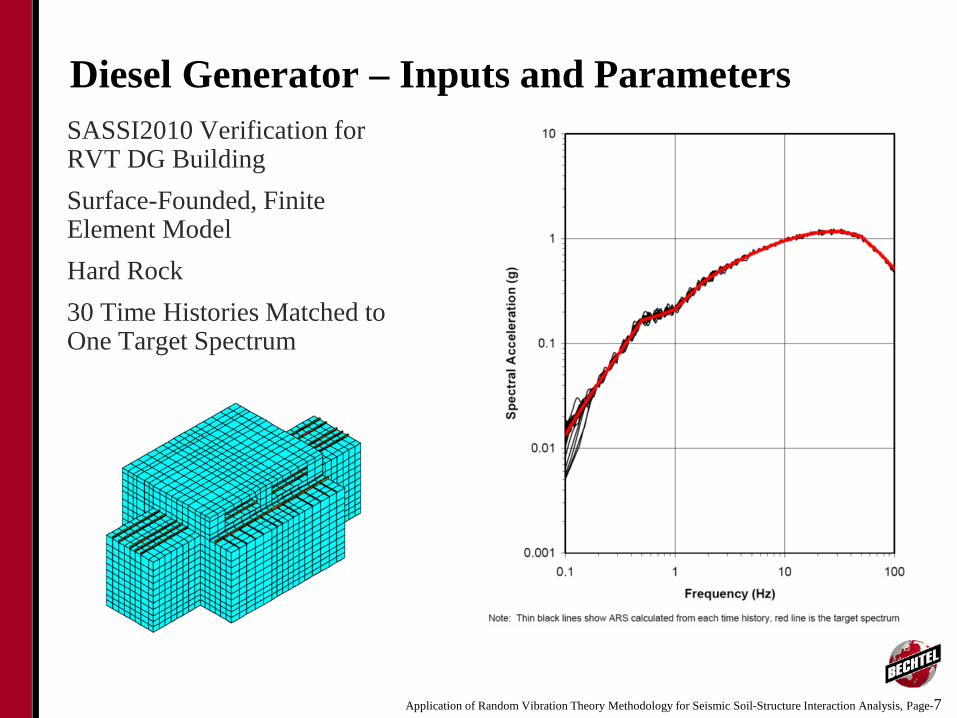
Diesel Generator – Inputs and Parameters SASSI2010 Verification for RVT DG Building Surface-Founded, Finite Element Model Hard Rock 30 Time Histories Matched to One Target Spectrum
Application of Random Vibration Theory Methodology for Seismic Soil-Structure Interaction Analysis, Page-8
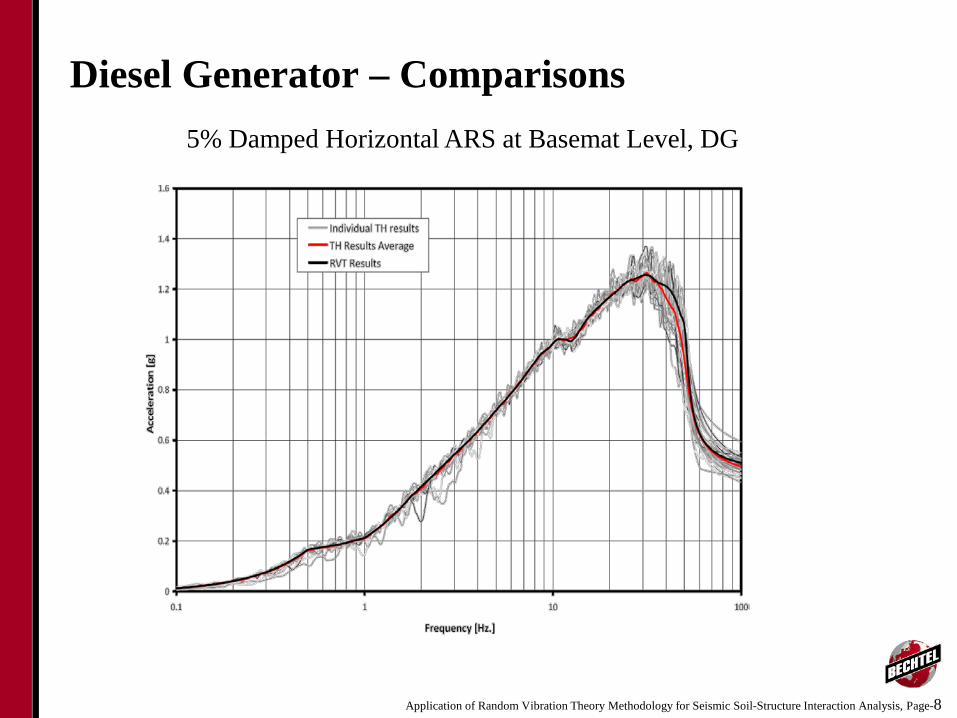
Diesel Generator – Comparisons 5% Damped Horizontal ARS at Basemat Level, DG
Application of Random Vibration Theory Methodology for Seismic Soil-Structure Interaction Analysis, Page-9
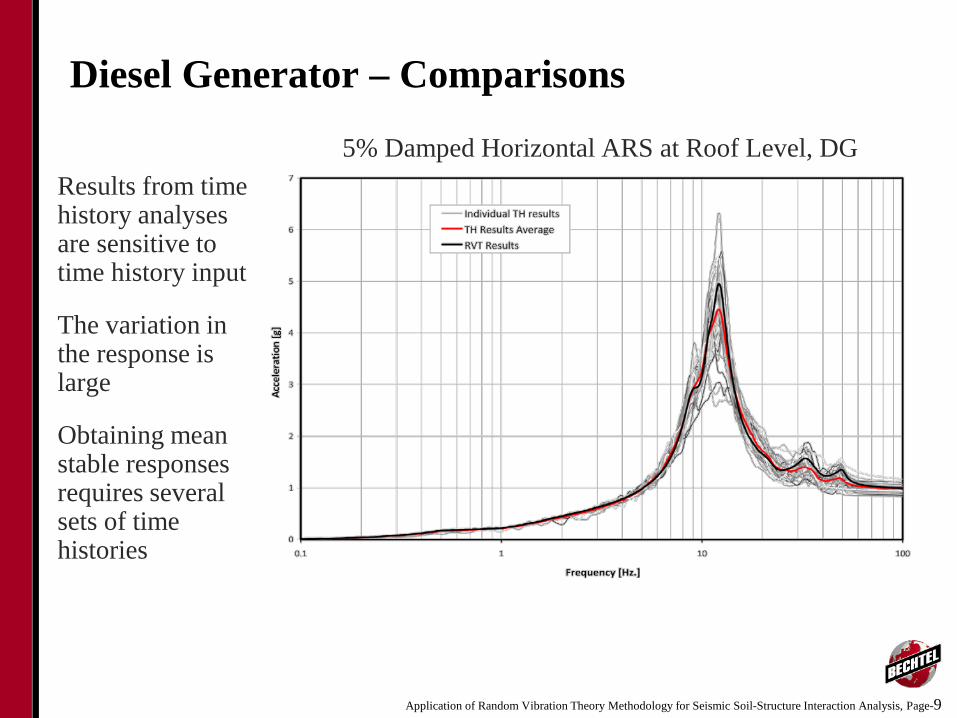
Diesel Generator – Comparisons
Results from time history analyses are sensitive to time history input
The variation in the response is large
Obtaining mean stable responses requires several sets of time histories
5% Damped Horizontal ARS at Roof Level, DG
Application of Random Vibration Theory Methodology for Seismic Soil-Structure Interaction Analysis, Page-10
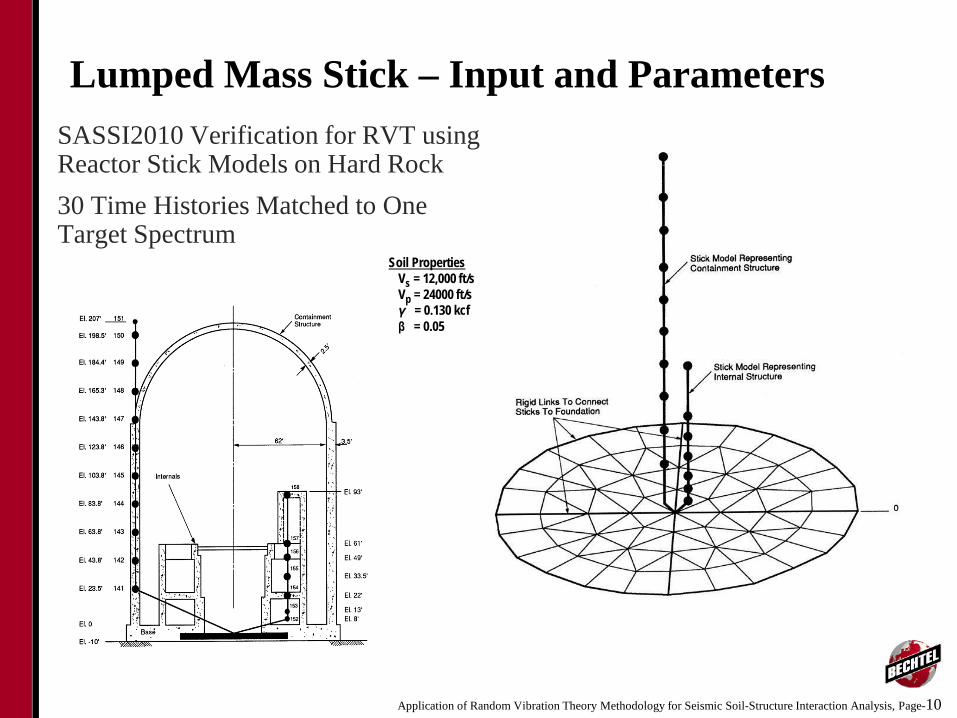
Lumped Mass Stick – Input and Parameters
Soil Properties Vs = 12,000 ft/s Vp = 24000 ft/s γ = 0.130 kcf β = 0.05
SASSI2010 Verification for RVT using Reactor Stick Models on Hard Rock 30 Time Histories Matched to One Target Spectrum
Application of Random Vibration Theory Methodology for Seismic Soil-Structure Interaction Analysis, Page-11
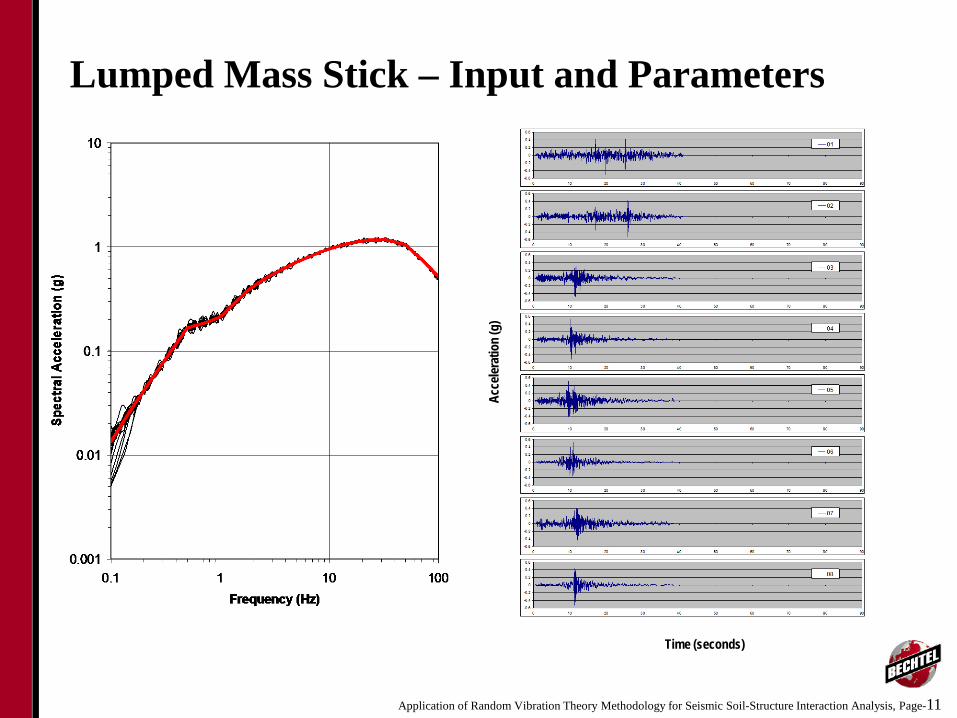
Lumped Mass Stick – Input and Parameters
Acc
elera
tion
(g)
Time (seconds)
Application of Random Vibration Theory Methodology for Seismic Soil-Structure Interaction Analysis, Page-12
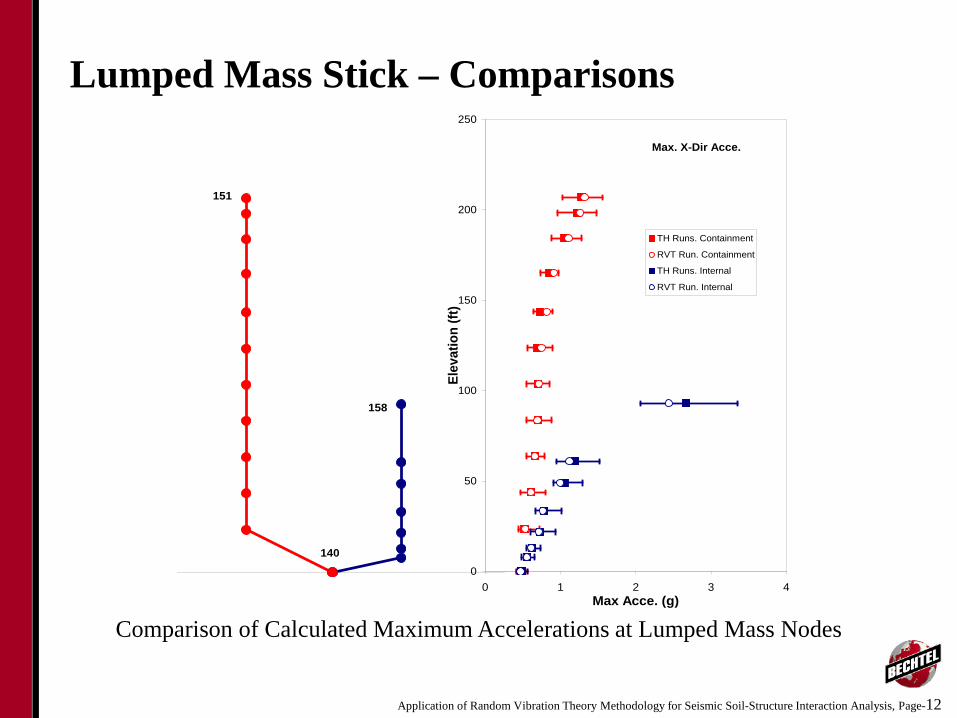
Lumped Mass Stick – Comparisons
151
158
1400
50
100
150
200
250
0 1 2 3 4Max Acce. (g)
Elev
atio
n (ft
)
TH Runs. Containment
RVT Run. Containment
TH Runs. Internal
RVT Run. Internal
Max. X-Dir Acce.
Comparison of Calculated Maximum Accelerations at Lumped Mass Nodes
Application of Random Vibration Theory Methodology for Seismic Soil-Structure Interaction Analysis, Page-13
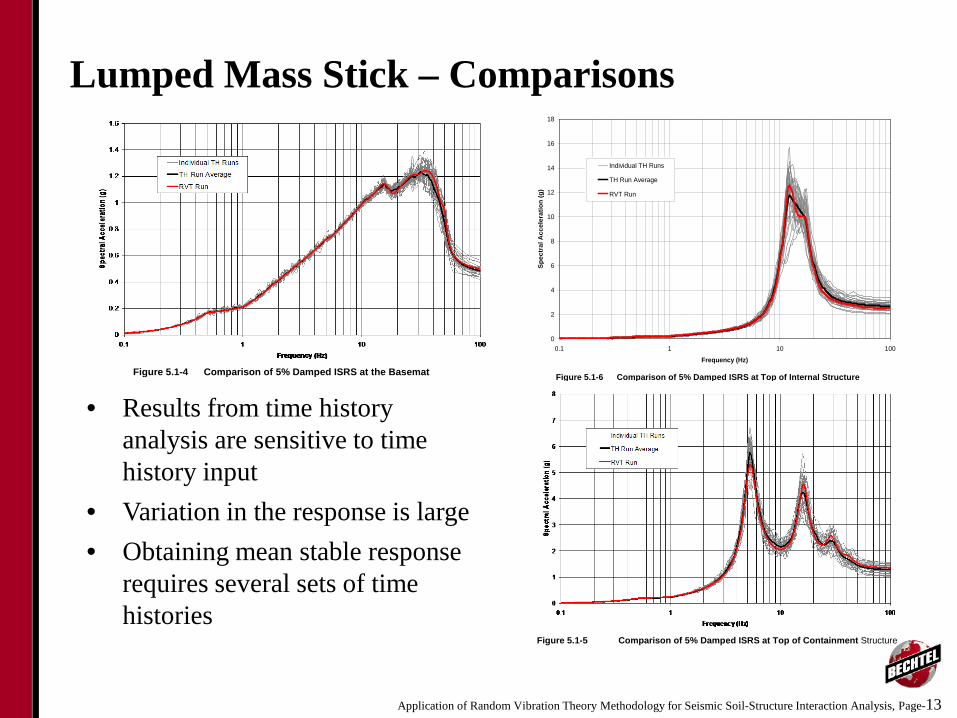
Lumped Mass Stick – Comparisons
Figure 5.1-4 Comparison of 5% Damped ISRS at the Basemat
0
2
4
6
8
10
12
14
16
18
0.1 1 10 100
Frequency (Hz)
Spec
tral
Acc
eler
atio
n (g
)
Individual TH Runs
TH Run Average
RVT Run
Figure 5.1-6 Comparison of 5% Damped ISRS at Top of Internal Structure
Figure 5.1-5 Comparison of 5% Damped ISRS at Top of Containment Structure
• Results from time history analysis are sensitive to time history input
• Variation in the response is large • Obtaining mean stable response
requires several sets of time histories
Application of Random Vibration Theory Methodology for Seismic Soil-Structure Interaction Analysis, Page-14
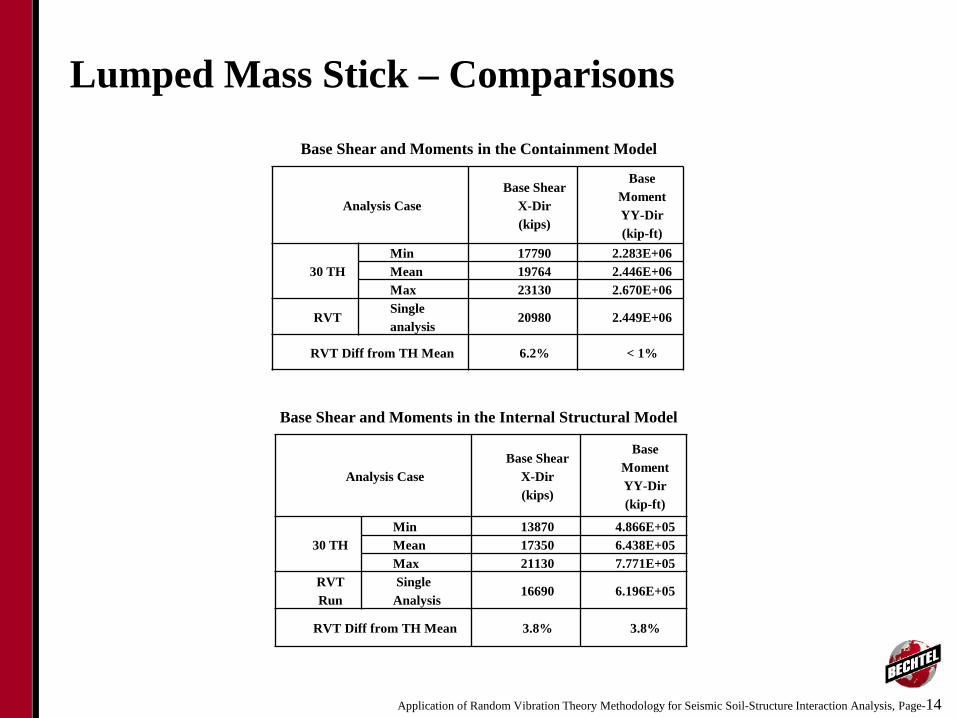
Lumped Mass Stick – Comparisons
Base Shear and Moments in the Internal Structural Model
Base Shear and Moments in the Containment Model
Analysis Case Base Shear
X-Dir (kips)
Base Moment YY-Dir (kip-ft)
30 TH Min 17790 2.283E+06 Mean 19764 2.446E+06 Max 23130 2.670E+06
RVT Single analysis
20980 2.449E+06
RVT Diff from TH Mean 6.2% < 1%
Analysis Case Base Shear
X-Dir (kips)
Base Moment YY-Dir (kip-ft)
30 TH Min 13870 4.866E+05 Mean 17350 6.438E+05 Max 21130 7.771E+05
RVT Run
Single Analysis
16690 6.196E+05
RVT Diff from TH Mean 3.8% 3.8%
Application of Random Vibration Theory Methodology for Seismic Soil-Structure Interaction Analysis, Page-15
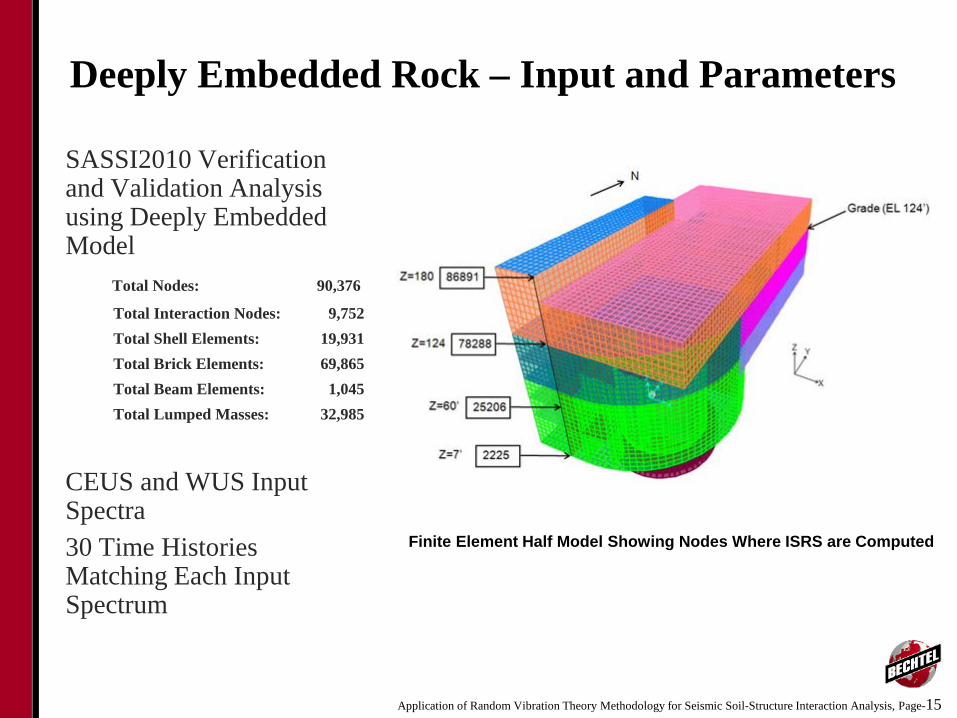
Deeply Embedded Rock – Input and Parameters
SASSI2010 Verification and Validation Analysis using Deeply Embedded Model Total Nodes: 90,376
Total Interaction Nodes: 9,752 Total Shell Elements: 19,931 Total Brick Elements: 69,865 Total Beam Elements: 1,045 Total Lumped Masses: 32,985
CEUS and WUS Input Spectra 30 Time Histories Matching Each Input Spectrum
Finite Element Half Model Showing Nodes Where ISRS are Computed
Application of Random Vibration Theory Methodology for Seismic Soil-Structure Interaction Analysis, Page-16
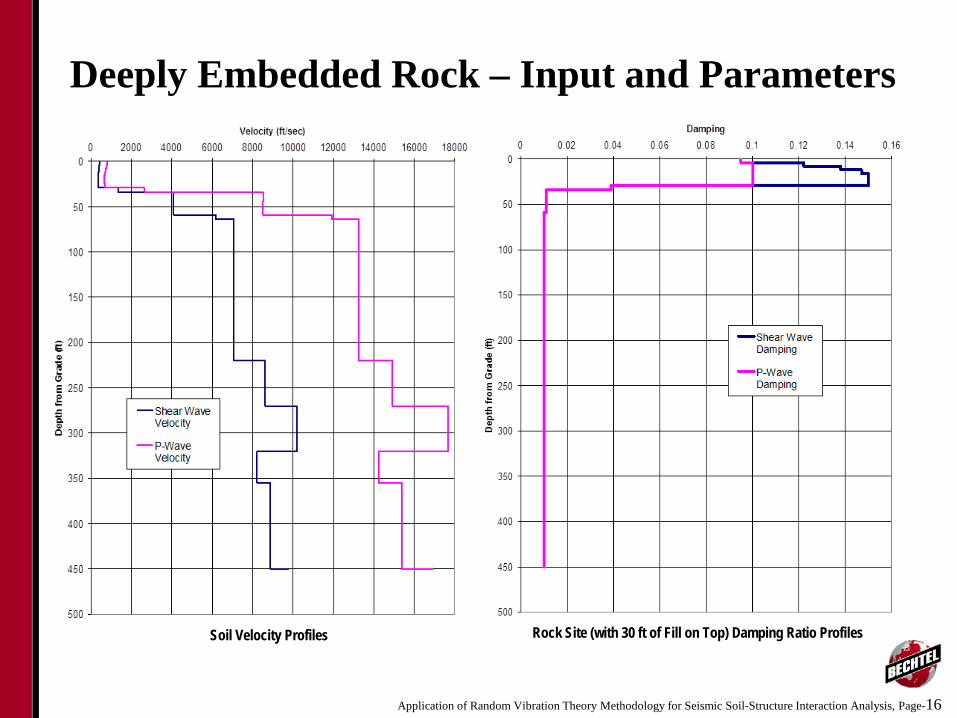
Deeply Embedded Rock – Input and Parameters
Rock Site (with 30 ft of Fill on Top) Damping Ratio Profiles Soil Velocity Profiles
Application of Random Vibration Theory Methodology for Seismic Soil-Structure Interaction Analysis, Page-17
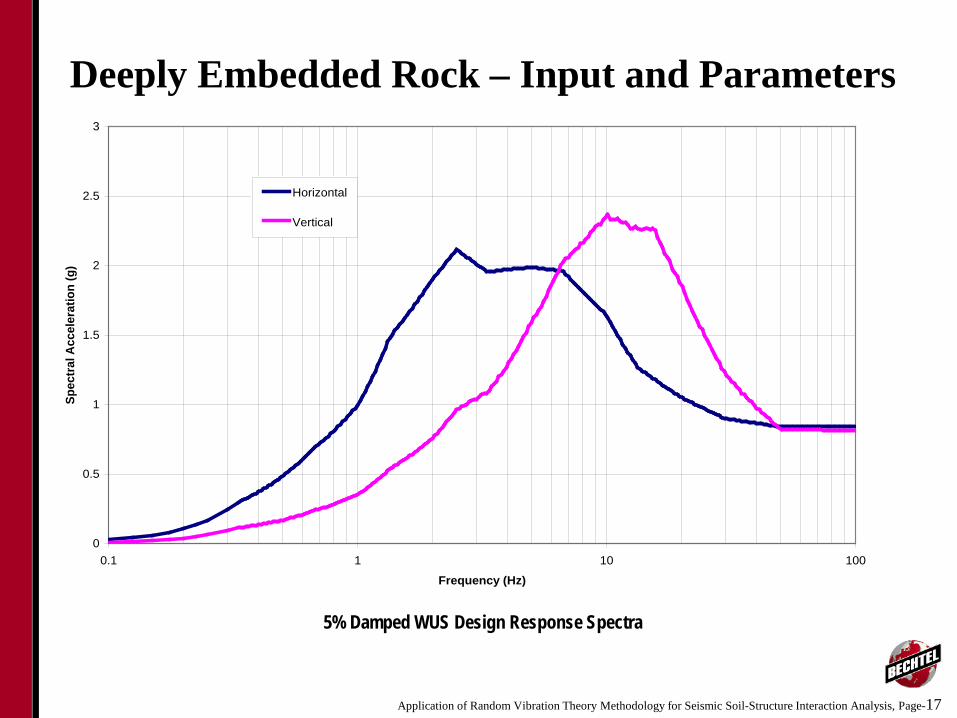
Deeply Embedded Rock – Input and Parameters
0
0.5
1
1.5
2
2.5
3
0.1 1 10 100
Frequency (Hz)
Spec
tral
Acc
eler
atio
n (g
)
Horizontal
Vertical
5% Damped WUS Design Response Spectra
Application of Random Vibration Theory Methodology for Seismic Soil-Structure Interaction Analysis, Page-18
Deeply Embedded Rock – Comparisons
Application of Random Vibration Theory Methodology for Seismic Soil-Structure Interaction Analysis, Page-19
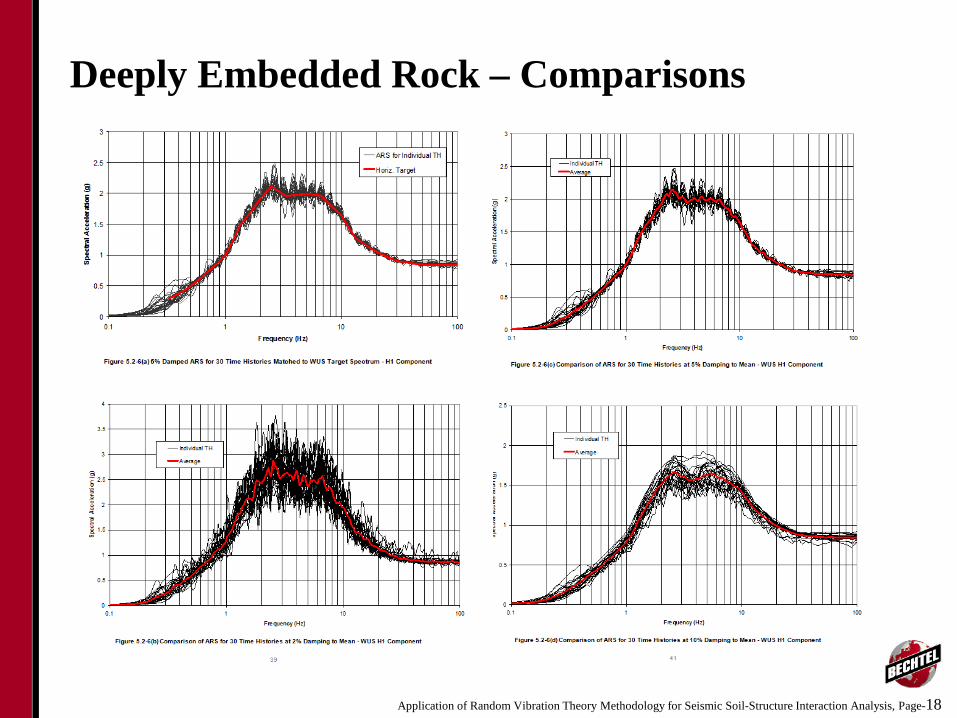
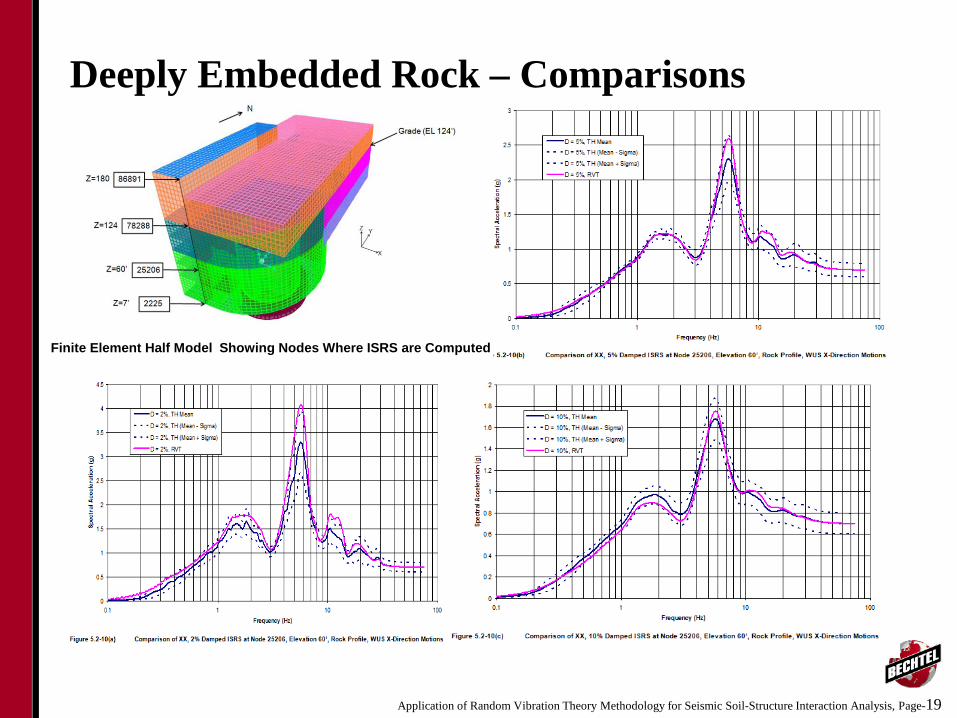
Deeply Embedded Rock – Comparisons
Finite Element Half Model Showing Nodes Where ISRS are Computed
Application of Random Vibration Theory Methodology for Seismic Soil-Structure Interaction Analysis, Page-20
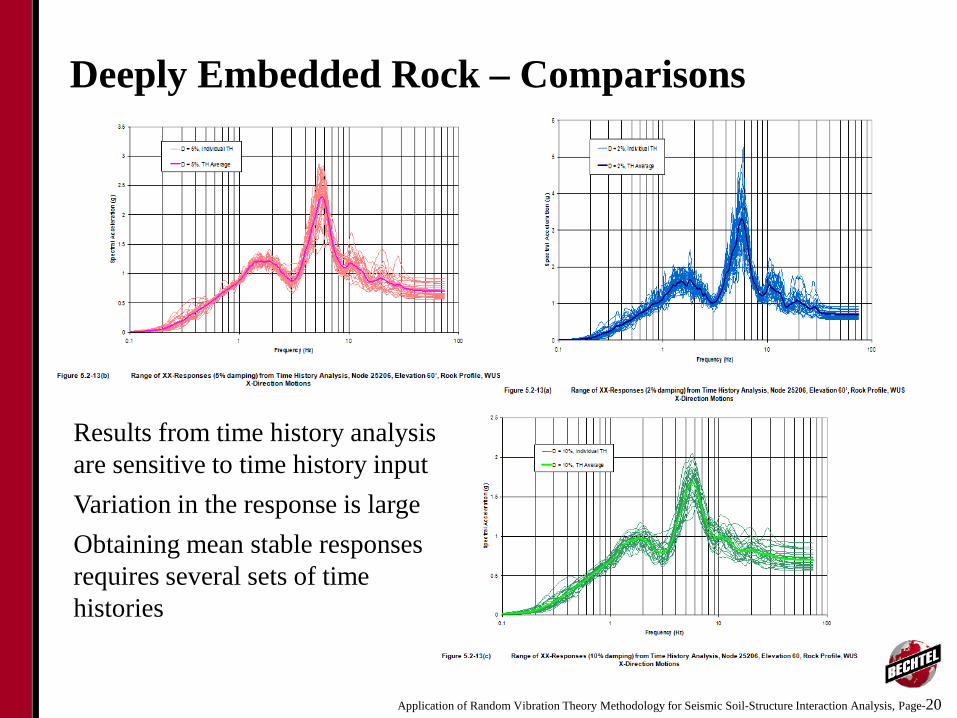
Deeply Embedded Rock – Comparisons
Results from time history analysis are sensitive to time history input Variation in the response is large Obtaining mean stable responses requires several sets of time histories
Application of Random Vibration Theory Methodology for Seismic Soil-Structure Interaction Analysis, Page-21
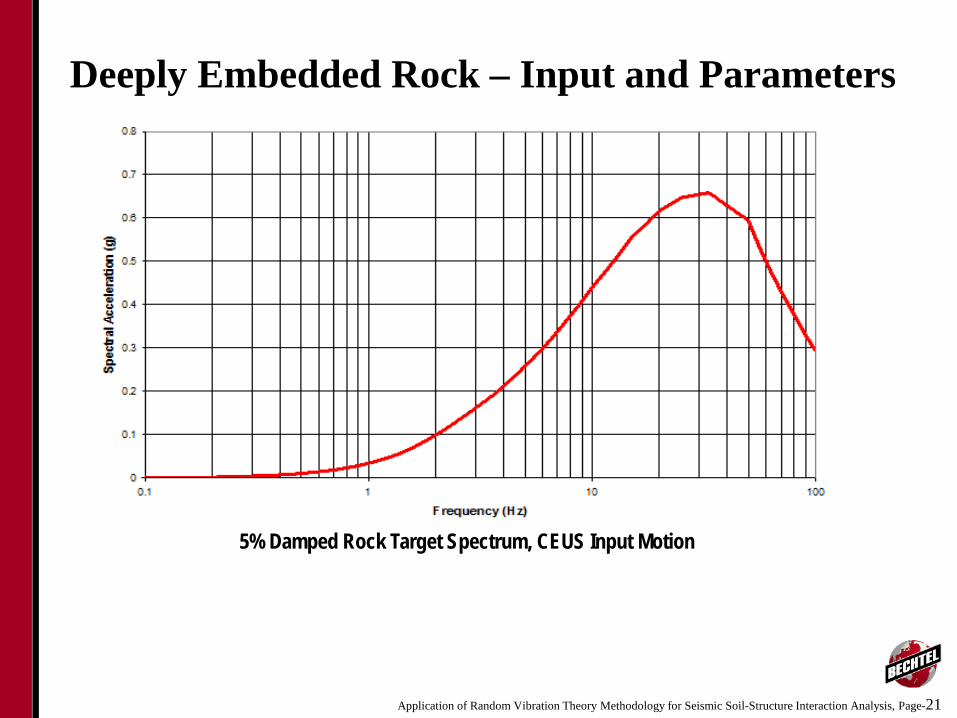
Deeply Embedded Rock – Input and Parameters
5% Damped Rock Target Spectrum, CEUS Input Motion
Application of Random Vibration Theory Methodology for Seismic Soil-Structure Interaction Analysis, Page-22
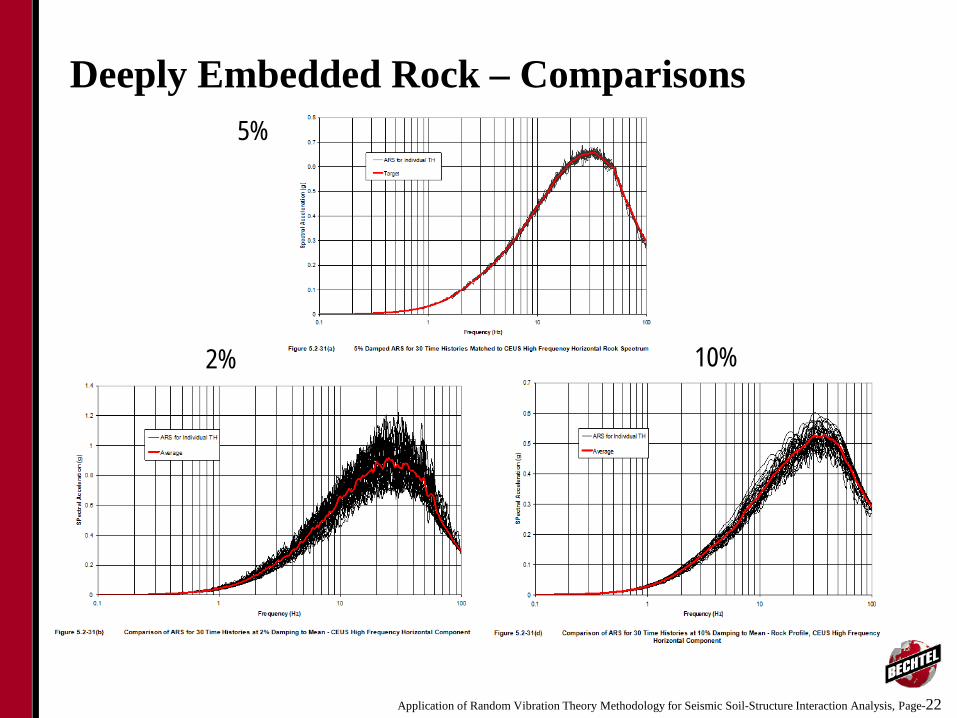
Deeply Embedded Rock – Comparisons 5%
2% 10%
Application of Random Vibration Theory Methodology for Seismic Soil-Structure Interaction Analysis, Page-23
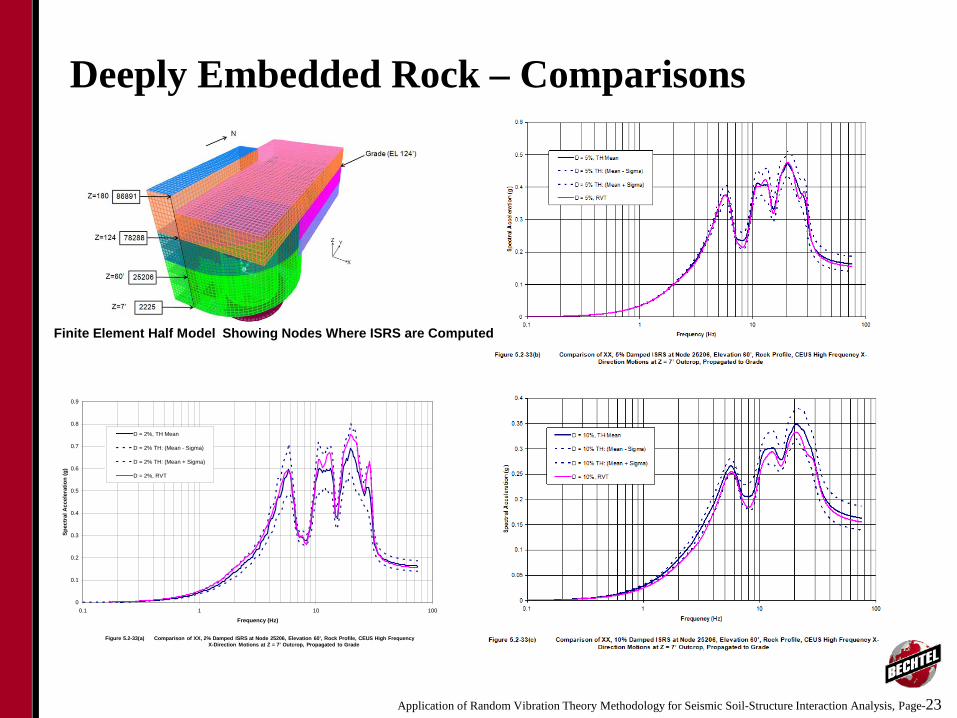
Deeply Embedded Rock – Comparisons
Finite Element Half Model Showing Nodes Where ISRS are Computed
0
0.1
0.2
0.3
0.4
0.5
0.6
0.7
0.8
0.9
0.1 1 10 100
Frequency (Hz)
Spec
tral
Acc
eler
atio
n (g
)
D = 2%, TH Mean
D = 2% TH: (Mean - Sigma)
D = 2% TH: (Mean + Sigma)
D = 2%, RVT
Figure 5.2-33(a) Comparison of XX, 2% Damped ISRS at Node 25206, Elevation 60’, Rock Profile, CEUS High Frequency X-Direction Motions at Z = 7’ Outcrop, Propagated to Grade
Application of Random Vibration Theory Methodology for Seismic Soil-Structure Interaction Analysis, Page-24
Deeply Embedded Rock – Comparisons
0
0.1
0.2
0.3
0.4
0.5
0.6
0.7
0.8
0.9
1
0.1 1 10 100
Frequency (Hz)
Spec
tral
Acc
eler
atio
n (g
)
D = 2%, Individual TH
D = 5%, Individual TH
D = 10%, Individual TH
D = 2%, TH Average
D = 5%, TH Average
D = 10%, TH Average
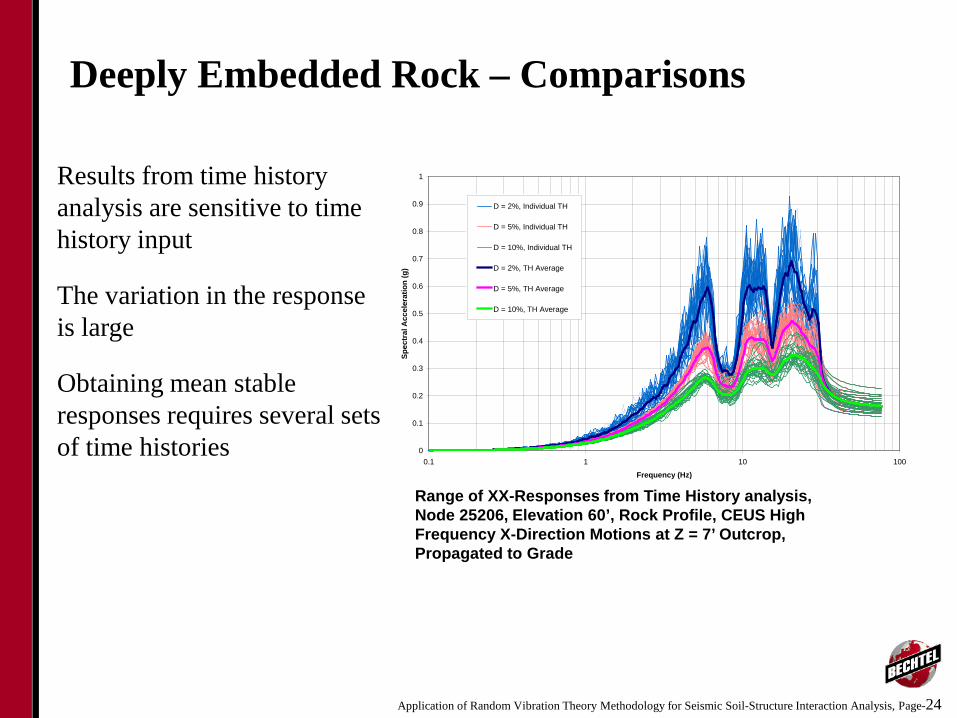
Range of XX-Responses from Time History analysis, Node 25206, Elevation 60’, Rock Profile, CEUS High Frequency X-Direction Motions at Z = 7’ Outcrop, Propagated to Grade
Results from time history analysis are sensitive to time history input
The variation in the response is large
Obtaining mean stable responses requires several sets of time histories
Application of Random Vibration Theory Methodology for Seismic Soil-Structure Interaction Analysis, Page-25
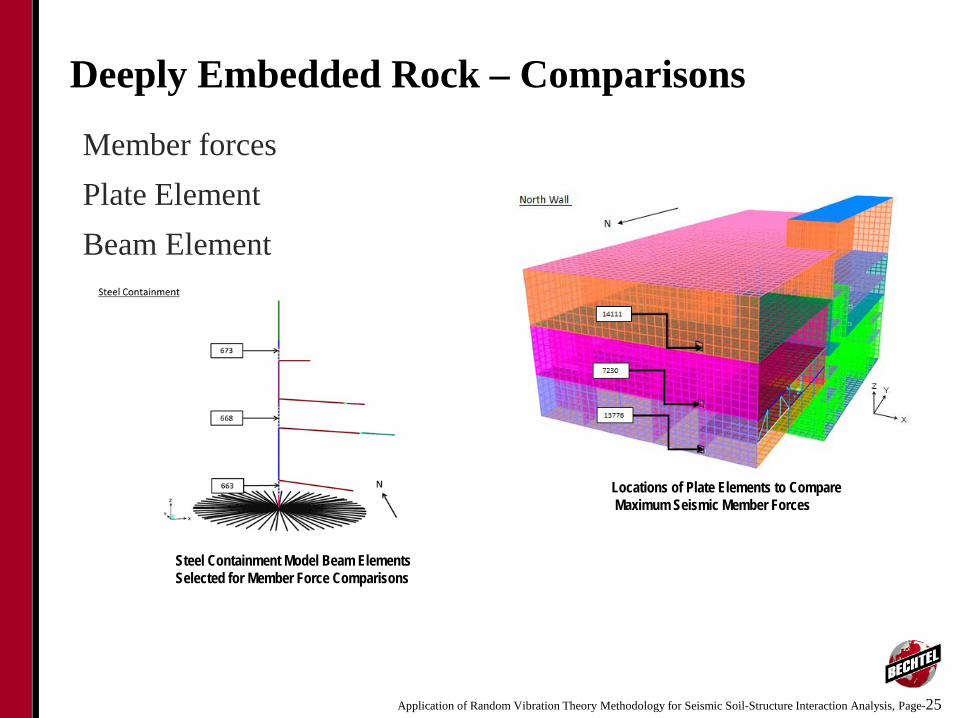
Deeply Embedded Rock – Comparisons
Member forces Plate Element Beam Element
Locations of Plate Elements to Compare Maximum Seismic Member Forces
Steel Containment Model Beam Elements Selected for Member Force Comparisons
Application of Random Vibration Theory Methodology for Seismic Soil-Structure Interaction Analysis, Page-26
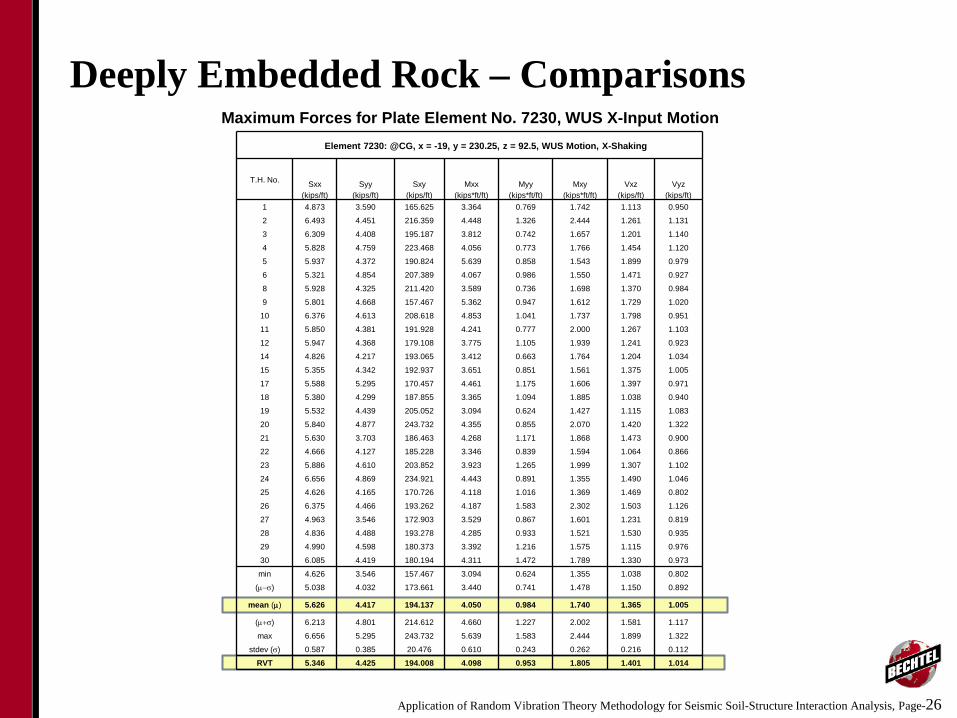
Deeply Embedded Rock – Comparisons Maximum Forces for Plate Element No. 7230, WUS X-Input Motion
Element 7230: @CG, x = -19, y = 230.25, z = 92.5, WUS Motion, X-Shaking
T.H. No. Sxx (kips/ft)
Syy (kips/ft)
Sxy (kips/ft)
Mxx (kips*ft/ft)
Myy (kips*ft/ft)
Mxy (kips*ft/ft)
Vxz (kips/ft)
Vyz (kips/ft)
1 4.873 3.590 165.625 3.364 0.769 1.742 1.113 0.950
2 6.493 4.451 216.359 4.448 1.326 2.444 1.261 1.131
3 6.309 4.408 195.187 3.812 0.742 1.657 1.201 1.140
4 5.828 4.759 223.468 4.056 0.773 1.766 1.454 1.120
5 5.937 4.372 190.824 5.639 0.858 1.543 1.899 0.979
6 5.321 4.854 207.389 4.067 0.986 1.550 1.471 0.927
8 5.928 4.325 211.420 3.589 0.736 1.698 1.370 0.984
9 5.801 4.668 157.467 5.362 0.947 1.612 1.729 1.020
10 6.376 4.613 208.618 4.853 1.041 1.737 1.798 0.951
11 5.850 4.381 191.928 4.241 0.777 2.000 1.267 1.103
12 5.947 4.368 179.108 3.775 1.105 1.939 1.241 0.923
14 4.826 4.217 193.065 3.412 0.663 1.764 1.204 1.034
15 5.355 4.342 192.937 3.651 0.851 1.561 1.375 1.005
17 5.588 5.295 170.457 4.461 1.175 1.606 1.397 0.971
18 5.380 4.299 187.855 3.365 1.094 1.885 1.038 0.940
19 5.532 4.439 205.052 3.094 0.624 1.427 1.115 1.083
20 5.840 4.877 243.732 4.355 0.855 2.070 1.420 1.322
21 5.630 3.703 186.463 4.268 1.171 1.868 1.473 0.900
22 4.666 4.127 185.228 3.346 0.839 1.594 1.064 0.866
23 5.886 4.610 203.852 3.923 1.265 1.999 1.307 1.102
24 6.656 4.869 234.921 4.443 0.891 1.355 1.490 1.046
25 4.626 4.165 170.726 4.118 1.016 1.369 1.469 0.802
26 6.375 4.466 193.262 4.187 1.583 2.302 1.503 1.126
27 4.963 3.546 172.903 3.529 0.867 1.601 1.231 0.819
28 4.836 4.488 193.278 4.285 0.933 1.521 1.530 0.935
29 4.990 4.598 180.373 3.392 1.216 1.575 1.115 0.976
30 6.085 4.419 180.194 4.311 1.472 1.789 1.330 0.973
min 4.626 3.546 157.467 3.094 0.624 1.355 1.038 0.802
(µ−σ) 5.038 4.032 173.661 3.440 0.741 1.478 1.150 0.892
mean (µ) 5.626 4.417 194.137 4.050 0.984 1.740 1.365 1.005
(µ+σ) 6.213 4.801 214.612 4.660 1.227 2.002 1.581 1.117
max 6.656 5.295 243.732 5.639 1.583 2.444 1.899 1.322
stdev (σ) 0.587 0.385 20.476 0.610 0.243 0.262 0.216 0.112
RVT 5.346 4.425 194.008 4.098 0.953 1.805 1.401 1.014
Application of Random Vibration Theory Methodology for Seismic Soil-Structure Interaction Analysis, Page-27
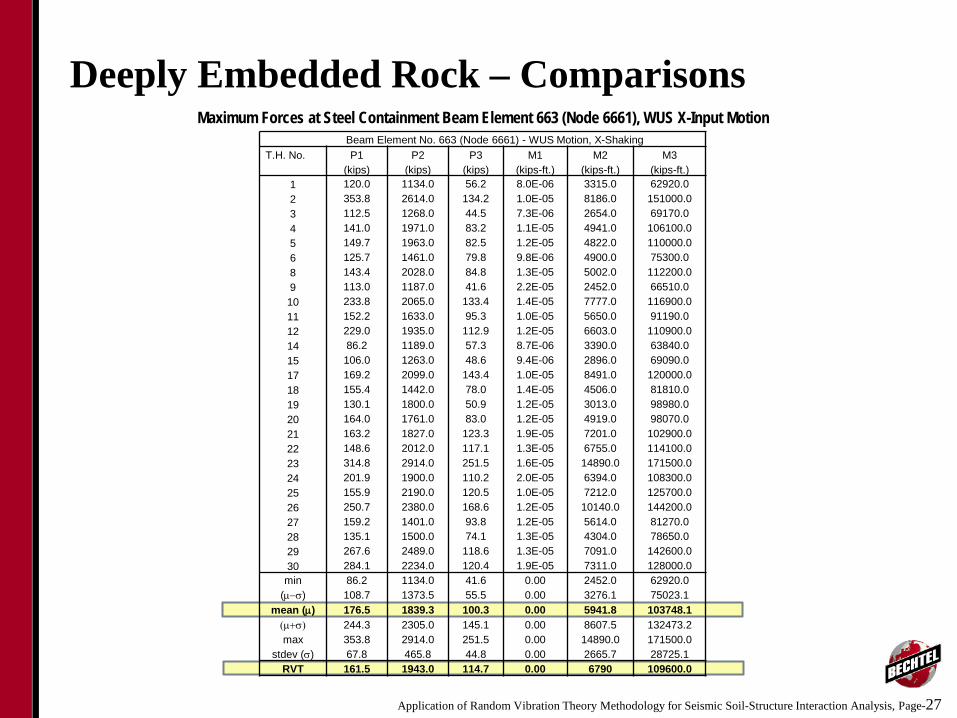
Deeply Embedded Rock – Comparisons Maximum Forces at Steel Containment Beam Element 663 (Node 6661), WUS X-Input Motion
Beam Element No. 663 (Node 6661) - WUS Motion, X-Shaking T.H. No. P1 P2 P3 M1 M2 M3 (kips) (kips) (kips) (kips-ft.) (kips-ft.) (kips-ft.)
1 120.0 1134.0 56.2 8.0E-06 3315.0 62920.0 2 353.8 2614.0 134.2 1.0E-05 8186.0 151000.0 3 112.5 1268.0 44.5 7.3E-06 2654.0 69170.0 4 141.0 1971.0 83.2 1.1E-05 4941.0 106100.0 5 149.7 1963.0 82.5 1.2E-05 4822.0 110000.0 6 125.7 1461.0 79.8 9.8E-06 4900.0 75300.0 8 143.4 2028.0 84.8 1.3E-05 5002.0 112200.0 9 113.0 1187.0 41.6 2.2E-05 2452.0 66510.0 10 233.8 2065.0 133.4 1.4E-05 7777.0 116900.0 11 152.2 1633.0 95.3 1.0E-05 5650.0 91190.0 12 229.0 1935.0 112.9 1.2E-05 6603.0 110900.0 14 86.2 1189.0 57.3 8.7E-06 3390.0 63840.0 15 106.0 1263.0 48.6 9.4E-06 2896.0 69090.0 17 169.2 2099.0 143.4 1.0E-05 8491.0 120000.0 18 155.4 1442.0 78.0 1.4E-05 4506.0 81810.0 19 130.1 1800.0 50.9 1.2E-05 3013.0 98980.0 20 164.0 1761.0 83.0 1.2E-05 4919.0 98070.0 21 163.2 1827.0 123.3 1.9E-05 7201.0 102900.0 22 148.6 2012.0 117.1 1.3E-05 6755.0 114100.0 23 314.8 2914.0 251.5 1.6E-05 14890.0 171500.0 24 201.9 1900.0 110.2 2.0E-05 6394.0 108300.0 25 155.9 2190.0 120.5 1.0E-05 7212.0 125700.0 26 250.7 2380.0 168.6 1.2E-05 10140.0 144200.0 27 159.2 1401.0 93.8 1.2E-05 5614.0 81270.0 28 135.1 1500.0 74.1 1.3E-05 4304.0 78650.0 29 267.6 2489.0 118.6 1.3E-05 7091.0 142600.0 30 284.1 2234.0 120.4 1.9E-05 7311.0 128000.0 min 86.2 1134.0 41.6 0.00 2452.0 62920.0
(µ−σ) 108.7 1373.5 55.5 0.00 3276.1 75023.1 mean (µ) 176.5 1839.3 100.3 0.00 5941.8 103748.1 (µ+σ) 244.3 2305.0 145.1 0.00 8607.5 132473.2 max 353.8 2914.0 251.5 0.00 14890.0 171500.0
stdev (σ) 67.8 465.8 44.8 0.00 2665.7 28725.1 RVT 161.5 1943.0 114.7 0.00 6790 109600.0
Application of Random Vibration Theory Methodology for Seismic Soil-Structure Interaction Analysis, Page-28
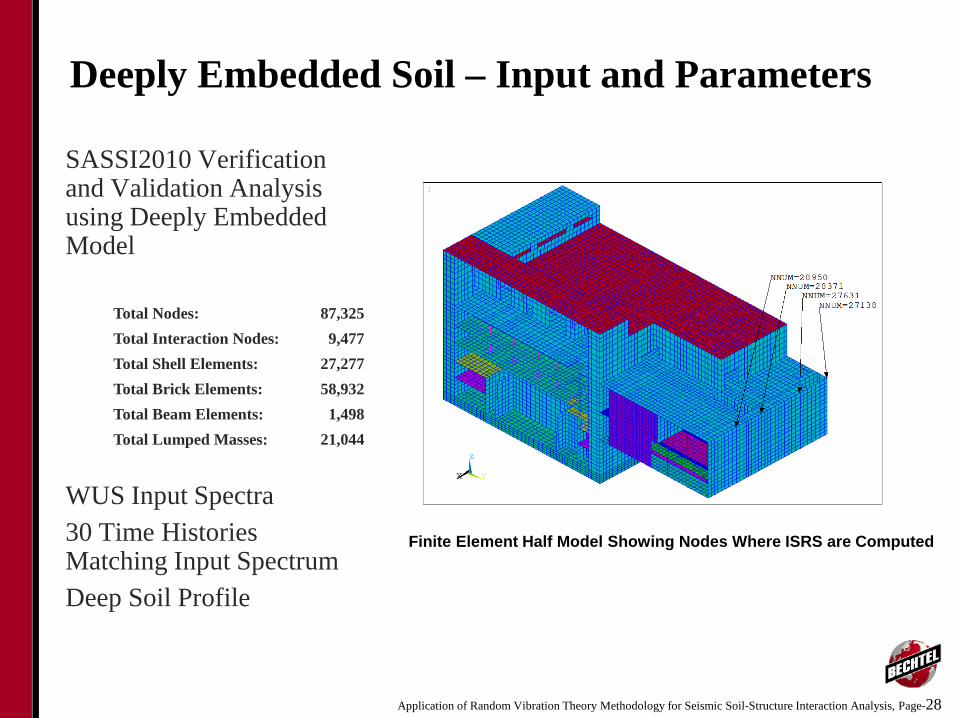
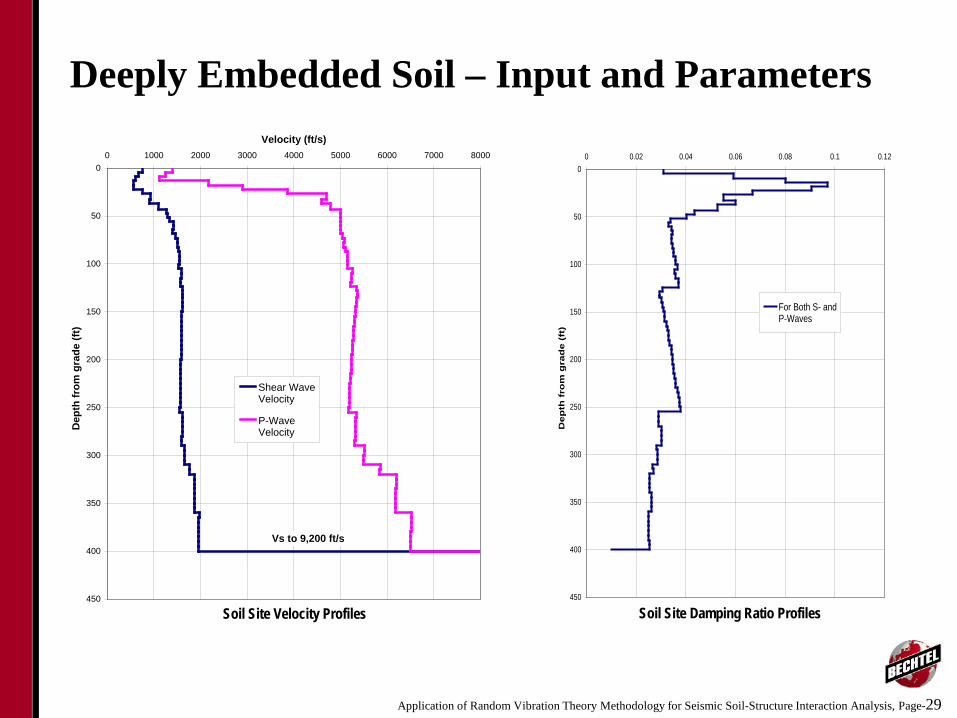
Deeply Embedded Soil – Input and Parameters
SASSI2010 Verification and Validation Analysis using Deeply Embedded Model
Total Nodes: 87,325 Total Interaction Nodes: 9,477 Total Shell Elements: 27,277 Total Brick Elements: 58,932 Total Beam Elements: 1,498 Total Lumped Masses: 21,044
WUS Input Spectra 30 Time Histories Matching Input Spectrum Deep Soil Profile
Finite Element Half Model Showing Nodes Where ISRS are Computed
Application of Random Vibration Theory Methodology for Seismic Soil-Structure Interaction Analysis, Page-29
Deeply Embedded Soil – Input and Parameters
0
50
100
150
200
250
300
350
400
450
0 1000 2000 3000 4000 5000 6000 7000 8000
Velocity (ft/s)
Dep
th fr
om g
rade
(ft)
Shear WaveVelocity
P-WaveVelocity
Vs to 9,200 ft/s
0
50
100
150
200
250
300
350
400
450
0 0.02 0.04 0.06 0.08 0.1 0.12
Dep
th f
rom
gra
de
(ft)
For Both S- andP-Waves
Soil Site Velocity Profiles Soil Site Damping Ratio Profiles
Application of Random Vibration Theory Methodology for Seismic Soil-Structure Interaction Analysis, Page-30
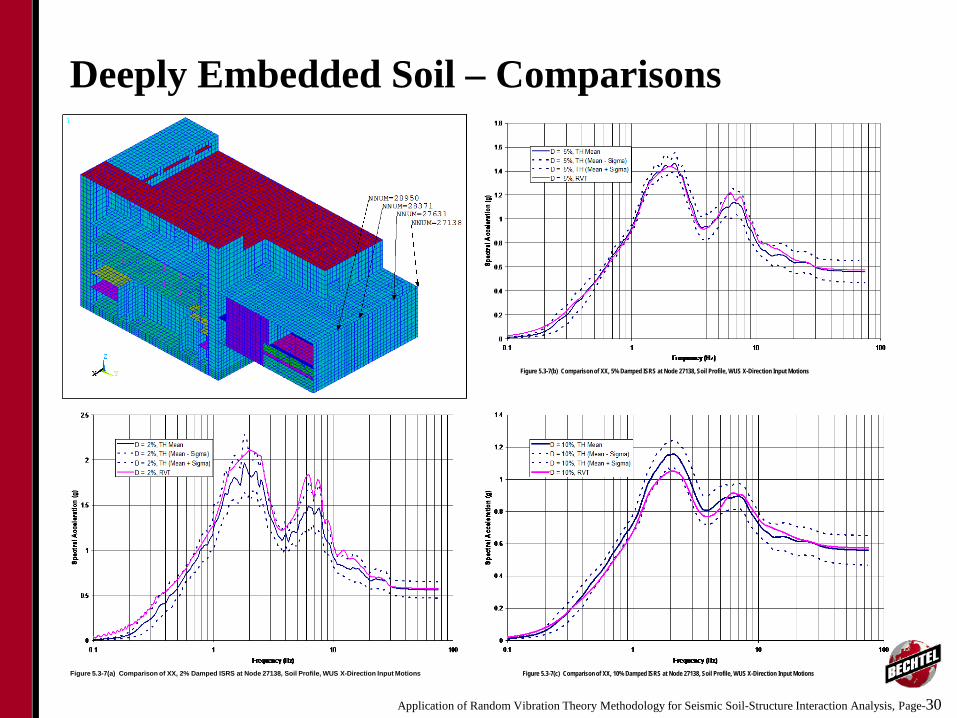
Deeply Embedded Soil – Comparisons
Figure 5.3-7(a) Comparison of XX, 2% Damped ISRS at Node 27138, Soil Profile, WUS X-Direction Input Motions
Figure 5.3-7(b) Comparison of XX, 5% Damped ISRS at Node 27138, Soil Profile, WUS X-Direction Input Motions
Figure 5.3-7(c) Comparison of XX, 10% Damped ISRS at Node 27138, Soil Profile, WUS X-Direction Input Motions
Application of Random Vibration Theory Methodology for Seismic Soil-Structure Interaction Analysis, Page-31
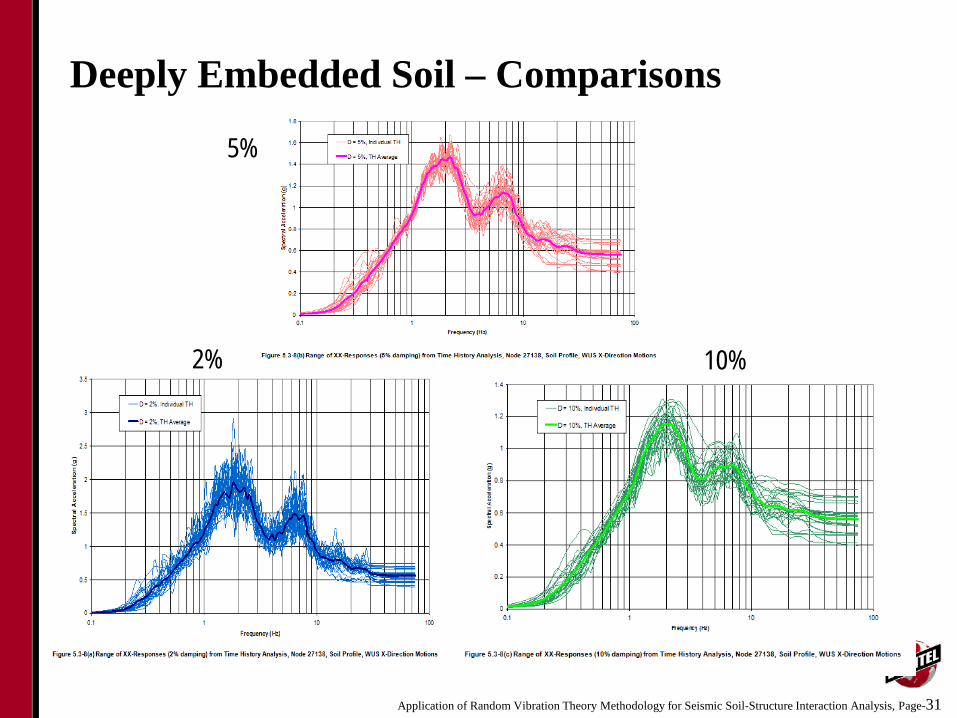
Deeply Embedded Soil – Comparisons
5%
2% 10%
Application of Random Vibration Theory Methodology for Seismic Soil-Structure Interaction Analysis, Page-32
Conclusions
• Developing a stable mean solution using time history methods may require up to 30 seed time histories
• Developing a stable standard deviation of the response may require even more time histories
• Using RVT methodology, as implemented in SASSI2010, produces a stable mean response more efficiently
• Responses at other confidence levels can be determined as needed