application of integrated bayesian modeling and markov...
TRANSCRIPT
267Animal Biodiversity and Conservation 271 (2004)
copy 2004 Museu de Ciegravencies NaturalsISSN 1578ndash665X
Fonnesbeck C J amp Conroy M J 2004 Application of integrated Bayesian modeling and Markov chainMonte Carlo methods to the conservation of a harvested species Animal Biodiversity and Conservation271 267ndash281
AbstractApplication of integrated Bayesian modeling and Markov chain Monte Carlo methods to the conservation ofa harvested speciesmdash When endeavoring to make informed decisions conservation biologists mustfrequently contend with disparate sources of data and competing hypotheses about the likely impacts ofproposed decisions on the resource status Frequently statistical analyses modeling (eg for populationprojection) and optimization or simulation are conducted as separate exercises For example a populationmodel might be constructed whose parameters are then estimated from data (eg ringing studiespopulation surveys) This model might then be used to predict future population states from currentpopulation estimates under a particular management regime Finally the parameterized model might alsobe used to evaluate alternative candidate management decisions via simulation optimization or both Thisapproach while effective does not take full advantage of the integration of data and model components forprediction and updating we propose a hierarchical Bayesian context for this integration In the case ofAmerican black ducks (Anas rubripes) managers are simultaneously faced with trying to extract asustainable harvest from the species while maintaining individual stocks above acceptable thresholds Theproblem is complicated by spatial heterogeneity in the growth rates and carrying capacity of black ducksstocks movement between stocks regional differences in the intensity of harvest pressure and heteroge-neity in the degree of competition from a close congener mallards (Anas platyrynchos) among stocks Wehave constructed a population life cycle model that takes these components into account and simultane-ously performs parameter estimation and population prediction in a Bayesian framework Ringing data areused to develop posterior predictive distributions for harvest mortality rates given as input decisions aboutharvest regulations Population surveys of black ducks and mallards are used to obtain stockndashspecificestimates of population size for both species for inputs into the population lifendashcycle model Theseestimates are combined with the posterior distributions for harvest mortality to obtain posterior predictivedistributions of future population status for candidate sets of regional harvest regulations under alternativebiological hypotheses for black duck population dynamics These distributions might then be used for boththe exploration of optimal harvest policies and for sequential updating of model posteriors via comparisonof predictive distributions to future survey estimates of stockndashspecific abundance Our approach illustratesadvantages of MCMC for integrating disparate data sources into a common predictive framework for usein conservation decision making
Key words Bayesian analysis Integrated model Hierarchical model Harvest MCMC Waterfowl
ResumenAplicacioacuten de la modelacioacuten integrada bayesiana y de los meacutetodos Monte Carlo basados en cadenas deMarkov para la conservacioacuten de una especie recolectadamdash En el momento de tomar decisiones bienfundamentadas es habitual que los bioacutelogos conservacionistas deban enfrentarse a fuentes de datosdispares e hipoacutetesis alternativas acerca de los impactos probables que tendraacuten las decisiones propuestasen el estado del recurso A menudo tanto los anaacutelisis estadiacutesticos como la modelacioacuten (para la proyeccioacutenpoblacional por ejemplo) y la optimizacioacuten o simulacioacuten se llevan a cabo como ejercicios independientes
Application of integrated Bayesianmodeling and Markov chain MonteCarlo methods to the conservation ofa harvested species
C J Fonnesbeck amp M J Conroy
268 Fonnesbeck amp Conroy
Asiacute es posible que se construya un modelo poblacional cuyos paraacutemetros se estimen a partir de datos(como estudios de anillamiento y estudios poblacionales) Posteriormente cabe la posibilidad de que estemismo modelo se emplee para predecir situaciones demograacuteficas futuras a partir de las estimaciones depoblacioacuten actuales utilizando para ello un sistema de gestioacuten determinado Por uacuteltimo el modeloparametrizado tambieacuten puede emplearse para evaluar posibles decisiones de gestioacuten alternativas a traveacutesde la simulacioacuten la optimizacioacuten o ambos procedimientos Si bien este enfoque resulta eficaz noaprovecha al maacuteximo la integracioacuten de datos y los componentes de los modelos para la prediccioacuten yactualizacioacuten En este estudio proponemos un contexto bayesiano jeraacuterquico que permite efectuar dichaintegracioacuten En el caso del aacutenade sombriacuteo americano (Anas rubripes) los gestores deben enfrentarse a lalabor de intentar extraer una recoleccioacuten sostenible de la especie al tiempo que mantienen los stocks deindividuos por encima de umbrales aceptables El problema se ve agravado por la heterogeneidad espacialque presentan las tasas de crecimiento y la carga cinegeacutetica de los stocks de aacutenades sombriacuteos elmovimiento entre los stocks las diferencias regionales en la intensidad de la presioacuten recolectora y laheterogeneidad en el grado de competencia por parte de un congeacutenere cercano mdashel aacutenade real (Anasplatyrynchos)mdash entre los stocks Hemos formulado un modelo del ciclo vital de la poblacioacuten que toma enconsideracioacuten estos componentes al tiempo que permite llevar a cabo una estimacioacuten de los paraacutemetrosy una prediccioacuten de la poblacioacuten en un marco bayesiano Los datos de anillamiento se emplean paradesarrollar distribuciones predictivas posteriores para las tasas de mortalidad durante la recoleccioacutenexpresadas como decisiones de entrada acerca de la normativa sobre recolecciones Los estudiospoblacionales del aacutenade sombriacuteo y del aacutenade real se emplean para obtener estimaciones sobre el tamantildeopoblacional especiacuteficas de los stocks de ambas especies que se emplearaacuten como entradas para el modelodel ciclo vital de la poblacioacuten Dichas estimaciones se combinan con las distribuciones posteriores para lamortalidad durante la recoleccioacuten con el propoacutesito de obtener distribuciones predictivas posteriores de lasituacioacuten demograacutefica futura para posibles conjuntos de normativas regionales acerca de la recoleccioacuten deacuerdo con hipoacutetesis bioloacutegicas alternativas relativas a la dinaacutemica poblacional del aacutenade sombriacuteo En unafase posterior tales distribuciones pueden utilizarse tanto para la investigacioacuten de poliacuteticas oacuteptimas enmateria de recoleccioacuten como para la actualizacioacuten secuencial de distribuciones posteriores del modelomediante la comparacioacuten de distribuciones predictivas para estimaciones en estudios futuros acerca de laabundancia poblacional presente de forma especiacutefica en los stocks Nuestro enfoque ilustra las ventajasque presentan las teacutecnicas de Montecarlo basadas en cadenas de Markov (MCMC) para integrar fuentes dedatos dispares en un marco predictivo comuacuten con vistas a su utilizacioacuten en la toma de decisiones sobreconservacioacuten
Palabras clave Anaacutelisis bayesiano Modelo integrado Modelo jeraacuterquico Recoleccioacuten MCMC Avesacuaacuteticas
Christopher J Fonnesbeck amp Michael J Conroy Cooperative Fish and Wildlife Research Unit DB WarnellSchool of Forest Resources Univ of Georgia Athens GA 30602 USA
Animal Biodiversity and Conservation 271 (2004) 269
ages among these elements pragmatically thereare also strong arguments for integration For in-stance dynamic optimization models include bothstate dynamics and an objective function In turndata are required to estimate system states andstate dynamics and to assess model comportmentto reality which in turn should influence decisionmaking Because these elements typically dependupon a common data structure and involvemodeling there is practical motivation for an inte-grated approach that leverages shared informationIn this paper we first construct a conceptual frame-work for integrating process modeling parameterestimation and model prediction based on princi-ples of conditional hierarchical modeling We thendemonstrate the approach using a real decisionproblem involving optimal harvest management ofmultiple stocks of American black ducks
Methods
A generic decision model
We clarify these concepts by means of a genericdecision model To begin with consider a dynamicsystem in which the state Xt (possibly vectorndashvalued) evolves through time according to a speci-fied process model f (XtZt) which includes boththe endogenous effect of the state as exogenousfactors Zt such as weather the latter are fre-quently modeled as random variables (fig 1) Addto this model inputs from the vector of decisionsdt which potentially affect both transitions to fu-ture states and the utility gained from present andfuture states (possibly altered under management)Before proceeding further we wish to use thisgeneric model to reinforce our earlier points Firstfigure 2 makes clear that the modeling of decisioninfluences (both on the system itself and our ob-jective gain from the system) are inextricably linkedto the process model In addition any algorithmthat seeks to find decisions which optimize theobjective functional is constrained by system dy-namics That is it is impossible to obtain themaximum of a dynamic decision problem withouttaking into account system dynamics Finally dy-namic decisions are often subject to a finite timehorizon In natural resource management it isusually appropriate that this horizon is relativelydistant Decisions are made usually with feed-back from the current system state in order toseek an optimal result over an appropriately longtime horizon Although simple conceptually thisintegration of dynamic modeling with decisionmaking is complex in practice Further decisionsordinarily cannot be based directly on the systemstates and a model but rather on statistical esti-mates of the states and of the parameters of themodel Thus the actual system state beingmodeled evolves through time according to some(assumed) model The observed system state isrelated to the actual system according to a statis-
Introduction
Dynamic models frequently are used in conserva-tion biology to aid in the evaluation of alternativeconservation decisions with respect to obtainingsome desired outcome Such approaches ordinarilyemploy whether explicitly or not several elementsFirst a process model is used to describe howobserved system states such as population sizeand composition change through time Secondsystem states and relevant parameters such assurvival and recruitment rates must be estimatedusing data via one or more statistical modelsThird one or more control variables must be de-fined these are thought to influence the system insuch a way as to lead to gains in the managementobjective Examples of decisions that are frequentlymade and to which decision modeling may beapplied include determination of optimal harvestregulations setting of forest cutting policies thetiming and intensity of restocking efforts as compo-nents of endangered species conservation anddecisions about land acquisition for conservationFourth we need an explicit way of describing therelative value or utility of potential managementoutcomes That is either explicitly or implicitlythere is some overarching resource goal and quan-tifiable resource objective in any decisionndashmakingprocess For harvest decisions the objective typi-cally is the maximization of longndashterm harvest yieldfor forest cutting the objective may be the gain ofrevenue perhaps subject to constraints on the avoid-ance of loss of biodiversity for restocking effortsperhaps the maximization of the expected time toextinction for some species for land acquisitionperhaps the maximization of biodiversity conserva-tion under budgetary constraints Finally we need aprocedure that seeks some optimum combinationof decisions and system conditions Formal proce-dures exist for all these elements in ecology thereis a particularly rich literature focused on dynamicmodeling and statistical estimation methods muchof which is summarized in Williams et al (2002)Likewise there exists an extensive literature ondecision theory and dynamic optimization methodsand optimal control theory much of it also summa-rized by Williams et al (2002) However in ourexperience process modeling statistical estima-tion and decision analysis are often considered asdistinct enterprises Thus statistical models arefrequently used to estimate population states andother parameters these results may subsequentlybe incorporated into an existing or newly con-structed population model The parameterized modelthen may be applied to a decision problem forinstance by exploratory simulation or formal opti-mization procedures Although the sequence ofevents differs from cases to case (eg modelconstructed first followed by parameter estimationand optimization) the idea is the same componentelements are treated separately and integration (tothe extent it occurs at all) is usually postndashhoc andoften adndashhoc Philosophically there are close link-
270 Fonnesbeck amp Conroy
tical sampling model Parameters of the processand decision models are now themselves basedon estimates from one or more statistical samplingmodels providing a prediction given the current(observed) state (fig 3)
(1)
Predictions about the future state of the systemnow inherit statistical uncertainties due these statis-tical models as do predictions about utility undereach candidate management decision
The development so far has assumed that themathematical form and parametric structure of theprocess model are known Usually this will not be
the case therefore it will be important to consideralternative process models In the context of deci-sion making these alternative models becomeimportant to the extent that the utility of decisionsis dependent on belief in the alternate modelsSuppose we entertain a single alternate modeldenoted as Model 2 (fig 4) Identical observedsystem states and candidate decisions induce twosets of values for the predicted utility and pre-dicted system state one set under each modelGiven these alternate predictions the decisionmaker must first reconcile the fact that differentmodels may lead to different utility for each deci-sion thus the optimal decision may be differentfor each model One approach is to form an
Fig 2 Incorporation of decision variables and objective function into the stochastic process showingfeedback of future state upon the objective
Fig 2 Incorporacioacuten al proceso estocaacutestico de variables de decisiones y de la funcioacuten objetivaindicando el feedback del estado futuro con respecto al objetivo
Randomeffects
Z(t)
RandomeffectsZ(t+1)
StateX(t)
StateX(t+1)
Actiond(t)
Actiond(t+1)
Rewardu[d(t)X(t)]
Rewardu[d(t+1)X(t+1)]
Fig 1 Generical model of a dynamic process with random effects
Fig 1 Modelo geneacuterico de un proceso dinaacutemico con efectos aleatorios
Randomeffects
Z(t)
RandomeffectsZ(t+1)
StateX(t)
StateX(t+1)
Animal Biodiversity and Conservation 271 (2004) 271
expectation of utility across the models which inturn depends on model probabilities quantifyingrelative belief in each model Initially model prob-abilities may be impartial attributing equal weightto each candidate model
Finally following decision making monitoringdata are used to compare the predictions undereach model for observed future states (fig 3)These predictions and observations have at leasttwo potential uses (1) they provide an obviousmeans of evaluating the degree to which any ofthe predictive models performs (ie validation)as well as a means of discriminating among com-peting models As we will describe this leads to anatural way to update relative belief in the alter-nate models using Bayes factors (2) as notedabove optimal decisions and their utility will gen-erally differ among alternate process models Thusto the degree that uncertainty exists with respectto which model best describes and predicts theprocess prescribed decisions will be suboptimalconversely reduction of process uncertaintythrough time will result in improved decision mak-ing at future decisionndashmaking epochs
Sequential conditioning as a tool for integration
Our approach to this problem exploits wellndashknownand related principles of probability Bayesian infer-ence and conditional modeling In Bayesian infer-ence parameter values and observations Y areboth modeled with probability density functions soit makes sense to consider their joint probability Pr( Y)
(2)
Because for any sample outcome the probabilityof the data is a constant Bayesrsquo theorem statesthat the posterior (that is following sampling) prob-ability of is proportional to the product of thesampling distribution of the data assuming andthe prior (unconditional) probability of
(3)
This formulation is readily generalized to alter-native model forms Conditional modeling has in-creasingly been recognized as a powerful tool for
Observedstate
Y(t+1)
Actual stateX(t)
Actual stateX(t+1)
Actiond(t)
Actiond(t+1)
Rewardu[d(t)X(t)]
Rewardu[d(t+1)X(t+1)]
ObservedstateY(t)
Estimated stateY(t+1)
Estimatedreward
u[d(t)X(t)]
Actual
Predicted
Fig 3 Relationship between actual and observedestimated processes in a dyanmic system
Fig 3 Relacioacuten entre los procesos reales y los observadosestimados en un sistema dinaacutemico
272 Fonnesbeck amp Conroy
Predicted stateX1(t+1)
Actiond(t)
ObservedstateY(t)
ObservedstateY(t+1)
Observedreward
u[d(t+1)X(t+1)]
Predictedreward
u1[d(t+1)X(t+1)]
Predicted stateX2(t+1)
Predictedreward
u2[d(t+1)X(t+1)]
Model 1
Model 2
Fig 4 Alternative process models and predictions Following decision making monitoring data areobtained for comparison of the predictions under each model to observed future states Thesepredictions may then be used to compute Bayes factors for updating the relative belief in the alternatemodels for use in the next decisionndashmaking epoch
Fig 4 Modelos de procesos alternativos y predicciones Tras la toma de decisiones se obtienen datosde control para comparar las predicciones facilitadas por cada modelo con los estados futurosobservados Estas predicciones pueden utilizarse para calcular factores de Bayes y actualizar lacreencia relativa en los modelos alternativos con vistas a su utilizacioacuten en el siguiente periacuteodo de tomade decisiones
modeling complex ecological relationships by de-composition as simpler element that are related in aconditional often hierarchical manner (eg Wikle2003) In addition hierarchical processes naturallylend themselves to conditional sequencing
These ideas can be effectively combined to solveour generic decision problem in an adaptive se-quential updating model by expressing the prob-lem as
(4)
where M represents model structure are param-eter values is the predicted and Y the observedsystem state By sequential conditioning we cansee that
(5)
This decomposition provides a natural sequen-tial way of dealing with the complexity of simulta-neously modeling uncertainty in data models andprocesses Beginning with the rightndashmost term in(5) conditioned on a distribution of parametervalues Pr( ) we have predicted values Next in
this sequence is the probability of model M andfinally the likelihood of the data given the modelparameter values and predictions We use Markovchain Monte Carlo (MCMC) methods to samplefrom the conditional posterior distributions of thequantities we seek (eg models predictions) Al-though not explicitly explored in this paper condi-tional decomposition is readily extended to deci-sion making problems by incorporating a utilityfunction
Integrated modeling with Markov chain MonteCarlo methods
Markov chain Monte Carlo is a class of generalsimulation techniques used primarily to solve prob-lems of Bayesian inference (Gamerman 1997)Specifically these methods are used to generatesamples that are distributed according to sometarget posterior form ( ) without having to directlysample from the posterior itself This is most usefulwhen ( ) is extremely complex or otherwise diffi-cult to analyze For example the joint posteriorcharacterizing our problem in (5) can be analyticalintractable for many biological problems
Animal Biodiversity and Conservation 271 (2004) 273
All MCMC algorithms produce samples from aset of densities (hence Monte Carlo simulation)these distributions are derived from ( ) accordingto the conditional probability of each i The currentset of parameter values is dependent on theprevious values thereby generating aMarkov chain The Markov chain is constructed insuch a way that its limiting distribution ( ) is thedistribution of interest
The MetropolisndashHastings algorithm (Metropoliset al 1953 Hastings 1970) is the most generalMCMC procedure and therefore the most widelyapplicable The MetropolisndashHastings algorithm esti-mates the posterior density using a form of rejec-tion sampling (see Robert amp Casella 1999) Theproposal function q( ) generates candidate val-ues for ( ) which are accepted or rejected accord-ing to each valuersquos probability under the target Provided that the full support of ( ) may besampled the choice of q can otherwise be arbi-trary In any case the MetropolisndashHastings algo-rithm estimates the posterior form directly from asubset of filtered samples rather than relying onBayesrsquo rule and conjugate distributions
Case study integrated estimation and predictionfor American black ducks
To illustrate our approach we use an example of anadaptive decisionndashmaking model for American blackducks The black duck problem involves a process ofobservation predictive modeling and optimizationwith the following major elements (1) historical datahave been used to fit empirical relationships betweenpopulation parameters and key hypothesized factorsunder alternative models (2) a population projectionmodel incorporates key relationships into a discretendashtime projection model (3) population surveys areused each year to infer the state of the system (4)based on the surveys parameter estimates and theprojection model a forecast of system state and ofexpected utility is obtained (5) the forecast of systemstate is compared to observed system state at thenext time epoch in order to evaluate the relativepredictive ability of the alternative models and com-pute relative weights for each model and (6) theparameter estimates models and model weights areused in dynamic optimization procedures (eg Lubow1995) to obtain optimal statendashspecific decisions formaximizing expected utility
The models and data structures used are anextension of those described in Conroy et al (2002)to multiple stocks and is illustrated in schematicform in figure 5 The elements of this model aresummarized as follows (1) the observed systemstate is the number of black ducks (Ni) and mal-lards (Mi) in each of three geographic strata (west-ern central and eastern portions of the range inCanada) as estimated from surveys conducted bythe Canadian Wildlife Service (2) historical datainvolving band recoveries hunter surveys of wingscollected from shot ducks and population sur-veys are used to estimate the relationship be-
tween stratumndashspecific fall age ratios (Ai) andblack duck and mallard abundance under alterna-tive models of densityndashdependence and densityndashdependence with competition (Zimpfer 2004Conroy et al 2002) (3) historical data involvingband recoveries and population surveys are usedto estimate the relationship between nonndashharvestsurvival (Sb
j) and black duck abundance underalternative models of densityndashdependent (com-pensatory) and densityndashindependent (additive) mor-tality (Conroy et al 2002) (4) the fall age ratioscalculated above together with springndashtondashsum-mer survival(Sb assumed constant) are used toproject fall abundance in each breeding area priorto migration (Fn
j) (5) historical data involving bandreleases stratified by breeding and harvest areasand recoveries and recaptures stratified by har-vest and breeding areas are used to estimaterates of movement from breeding to harvest areas( ij) and of return (fidelity) to breeding areas ( jiZimpfer 2004) (6) historical data involving bandrecoveries harvest regulations and hunter num-bers stratified by harvest regions are used todevelop predictions of harvest rates conditional onharvest regulations and hunter numbers
For the purposes of this study we assumedfixed values for the parameter estimates of nonndashharvest survival (SaSb) and movement ( ij ji)rates and perfect ability to control harvest rates atspecified values via harvest regulations We fur-ther conditioned on the observed system stateXt = [N1 N2 N3 M1 M2 M3]t Thus focus is onuncertainty in stratumndashspecific estimates of ageratio which in turn induce uncertainty in theprojection model from two sources statistical un-certainty in the parameter values conditioned onan assumed model structure Pr( M) and uncer-tainty in model structure Pr(M) Predictions underthese alternative estimated models are then com-pared to observations of the consequent states ofsystem Xt Stratumndashspecific age ratios are esti-mated under a joint likelihood of wing survey andband recovery data (fig 6) This consists of thefollowing components
(6)
where Wy is the number of juvenile wings in theharvest survey for a specific reproduction area Wis total (adult + juvenile) wings mi Ri i = y aare number of recoveries and bands respectivelyfor juveniles and adults hi i = y a are bandrecovery rates is relative vulnerability of adult tojuvenile harvest and is proportion of young in theharvest (adjusted from population age ratio A by These likelihoods are in turn embedded in a modeldescribing the relationship between age ratio andblack duck and mallard abundance
274 Fonnesbeck amp Conroy
(7)
where i are coefficients to be estimated Har-vest rates could not be directly estimated duringthe period of our study because of problemsinduced by the conversion to tollndashfree solicitationof bands (see Conroy et al 2002) We insteadused estimates from hunter surveys in the USand Canada to obtain an estimate of total annualharvest per harvest region Ht which was as-signed to age and sex categories in our model
according to differential vulnerability estimates These estimates were used together with theprojected prendashharvest population in each region(according to our process model) to estimateharvest rates and harvest mortality with the con-straint that the latter could not exceed unityConditioned on observed Yt = (Nt Mt mgt mstWgt) we used our process model to generateposterior predictions of stratumndashspecific abun-dance for black ducks at the next survey periodby the relationship
Fig 5 Flow diagram of black duck state dynamics model Stratumndashspecific numbers of black ducks(Ni i = 123) survive from spring to fall at the constant rate Sa Stratumndashspecific black duck andmallard (Mi) abundance influence fall age ratios Ai according to a production model (see (6) for detailsage ratios are applied to the surviving adult population to determine fall abundance prior to migrationand harvest (F(s)
i) Surviving birds migrate to southern harvestwintering areas j = 123 according tofixed rates ij with postndashharvest (Hi) abundance leaving Nj j = 123 in each wintering area Survivalover winter (Sb
j) is determined by a densityndashdependent model as a function of areandashspecific abundanceN(w)
j with fidelity to breeding areas at a fixed rate ij In present study movement and survivalparameters are fixed with only the parameters of the reproduction estimation and prediction model (6)estimated from data
Fig 5 Diagrama de flujo del modelo de la dinaacutemica del estado del aacutenade sombriacuteo Los nuacutemeros deaacutenades sombriacuteos especiacuteficos al estrato (Ni i =123) sobreviven de primavera a otontildeo a una razoacutenconstante de Sa La abundancia de aacutenades sombriacuteos y aacutenades azulones especiacutefica al estrato (Mi)influye en las tasas de edad durante el otontildeo Ai seguacuten un modelo de produccioacuten (para detalles ver (6)las tasas de edad se aplican a la poblacioacuten adulta superviviente para determinar la abundancia otontildealantes de la migracioacuten y la recoleccioacuten (F(s)
i) Las aves supervivientes migran hacia aacutereas derecoleccioacutenhibernacioacuten meridionales j = 123 seguacuten tasas fijas ij de manera que la abundanciaposterior a la recoleccioacuten (Hj) deja Nj j = 123 en cada aacuterea de hibernacioacuten La supervivencia duranteel invierno (Sb
j) viene determinada por un modelo dependiente de la densidad como una funcioacuten de laabundancia especiacutefica a un aacuterea N(w)
j con fidelidad a las aacutereas de reproduccioacuten a una tasa fija ij Enel presente estudio los paraacutemetros de movimiento y de supervivencia son fijos de manera que losparaacutemetros del modelo de prediccioacuten y de estimacioacuten de reproduccioacuten (6) son los uacutenicos que seestiman a partir de los datos
Ni Mi
Fi(n) = NiS
(1)(1 + Ai) Ai = exp ( 0 + 1Ni + 2Mi)
S(a)
Fj(s) Hi
Nj(w)
S(b)ji ij
Animal Biodiversity and Conservation 271 (2004) 275
Wy ----- Bin( W)
AA +
=
Xy ----- Bin(hyRy)
Xa ----- Bin(haRa)
hy = ha
S
A = exp ( 0 + 1B + 2M)
Differentialvulnerabil-
ity
Age ratios(production)
Survival (fixed)
Predic-tion
Wy ----- Bin( W)
hy = ha
SA = exp ( 0 + 1B + 2M)
Xy ----- Bin(hyRy)
Xa ----- Bin(haRa)
N ----- MN(NT)ln(P) = ln(A(1+A))+ P
P 1 ndash P
ln(S) = ln(S)+ S
AA +
=
Differentialvulnerability
Survival (fixed)
Survival biasPredictionProduction bias
Age ratios(production)
A =
Fig 6 Model for black duck reproduction estimation and prediction using nonndashintegrated (top) andintegrated (bottom) frameworks Binomial likelihoods (ellipses) are calculated for proportion of juvenilesin the harvest ( ) from wing recovery data (W) and for stagendashspecific harvest rates (h) based onbandings (R) and dead recoveries (X) These are in turn used to calculate age ratios (A) that form thebasis for the reproduction model which includes densityndashdependent terms for black ducks (B) andmallards (M) This along with a fixed survival function is then used to predict the next yearrsquos populationsize The integrated form is identical to the nonndashintegrated except that the predicted population is nowpart of a multivariate logndashnormal likelihood as the expected value of the observed population size Eachintegrated model incorporates zero or more bias parameters ( )
Fig 6 Modelo para la prediccioacuten y estimacioacuten de reproduccioacuten del aacutenade sombriacuteo utilizando marcosno integrados (parte superior) y marcos integrados (parte inferior) Las probabilidades binomiales(elipses) se calculan para la proporcioacuten de individuos joacutevenes en la recoleccioacuten ( ) a partir de los datosde recuperacioacuten de alas (W) y para las tasas de recoleccioacuten especiacuteficas a una etapa (h) basaacutendoseen anillamientos (R) y en la recuperacioacuten de aves muertas (X) Tales probabilidades se utilizan a suvez para calcular las tasas de edad (A) que forman la base para el modelo de reproduccioacutenincluyendo teacuterminos dependientes de la densidad para el aacutenade sombriacuteo (B) y el aacutenade real (M) Estojunto con una funcioacuten de supervivencia fija se utiliza despues para predecir el tamantildeo que tendraacute lapoblacioacuten el proacuteximo antildeo La forma integrada es ideacutentica a la no integrada salvo que ahora lapoblacioacuten prevista forma parte de una probabilidad logariacutetmica normal multivariante expresada comoel valor previsto del tamantildeo de la poblacioacuten observada Cada modelo integrado incorpora cero o maacutesparaacutemetros de sesgo ( )
276 Fonnesbeck amp Conroy
increment ct is generated using a N(0 ) density Theadvantage of the random walk approach is that noproblemndashspecific restrictions regarding the form ofthe proposal distribution need to be consideredProposal distributions for MetropolisndashHastings sam-pling must be enveloping such that q(x) m (x) Therefore most proposal distributions must be cho-sen manually for each variable in each problem Incontrast the random walk algorithm functions inde-pendently of the form of the target ( ) The disad-vantage of the random walk is that when steps arerelatively large (ie large ) proposed values mayfrequently fall in the tails of the target distributionresulting in unacceptably low acceptance ratessimilarly if increments are relatively small accept-ance rates may be very high but the rate of mixing(exploration of the support of ) will be correspond-ingly low Either extreme is inefficient and thereforeundesirable The adaptive random walk implementedin PyMC addresses this inefficiency by adapting thescale parameter of the proposal distribution ac-cording to the recent acceptance probability foreach parameter during the simulation Every k it-erations (k = 100 is default) the variance is de-creased for acceptance rates below 20 and in-creased for those above 50 (arbitrarily chosen)thereby balancing proposal acceptance and mixingAdaptation occurs in the burnndashin phase of thealgorithm and continues until all parameter accept-ance rates fall within the aforementioned interval
The joint likelihood for the integrated model in-cluded three components related to estimation andprediction Binomial likelihoods were calculated forthe adult and juvenile harvest rates based onbanding and recovery data for these groups Addi-tionally the probability of the proposed proportionof young in the harvest was calculated using wingdata in a binomial likelihood As illustrated in (6) is also related to differential vulnerability and ageratio The final component is the likelihood of theobserved population given the predicted value ofthe model In each year the likelihood of the ob-served population in each area was calculatedbased on a multivariate logndashnormal density centeredat the array of predicted values The sum of loga-rithms for these likelihoods were passed to theMetropolisndashHastings sampler in PyMC after everyproposal of a new parameter this joint logndashlikeli-hood was used to either accept or reject the pro-posed value Because all parameters are assumedto have equal priors these cancel out from the ratioof posterior densities used to calculate Theproposal distributions q( (t)
i ) and q( (t)i)
]similarly drop out since the probability of jumpingfrom (t)
i to is equal to the reverse jump under therandom walk strategy
Model scenarios
A suite of 10 distinct model scenarios was specifiedThe first was a null model which separately esti-mated parameters of the agendashratio reproduction func-tion then used this function to predict areandashspecific
where (8)
Here are parameters fixed as constants for thisanalysis (eg movement and survival rates) andf() is the functional form specified under our processmodel Finally we modeled observed abundanceNt+1 via a multivariate logndashnormal distributioncentered at the predicted abundance Ntildet+1
(9)
where subscripts are suppressed for notationalsimplicity Previous approaches have involved in-dependent estimation of then using these esti-mates to predict future states Nt+1 Experiencewith the black duck and other duck harvest modelshas uncovered apparent systematic overndashpredic-tion from this approach An integrated hierarchi-cal approach outlined above endeavors toremediate this problem by establishing feedbackbetween prediction and estimation (fig 6) In ourcase this would be achieved via adjustments ofthe coefficients of the age ratio process models At= (Nt Mt) However it is not known whether overndashprediction is due to the reproduction model or thesurvival process model (which for the purposes ofthis study we have assumed has fixed coeffi-cients) (Conroy et al 2002) Indeed it is possiblethat neither component induces the bias but rathersome aspect of the sampling process itself isflawed Therefore in addition to the (implicit) ad-justment contained in the integrated age ratioprocess model we explicitly modeled systematicbiases in predicted survival and age ratio
(10)
where St At are the values of survival and age ratiorespectively predicted from the model conditionedon current states and data and s a are logndashscalebiasing factors which are estimated the values StAt are then used in prediction
MCMC implementation
We implemented the black duck parameter estima-tion and prediction models using Python (httppythonorg) an open source objectndashoriented pro-gramming language Python is a modular develop-ment environment with a wide selection of thirdndashparty scientific and numerical tools suitable forbiometric applications We developed a Pythonmodule PyMC (httppymcsourceforgenet) thatimplements an adaptive random walk Metropolis-Hastings algorithm for MCMC sampling At eachiteration of the algorithm new parameter valuesare proposed according to a random walk The
Animal Biodiversity and Conservation 271 (2004) 277
black duck populations for 11 years (1991ndash2001)Four additional scenarios each used the integratedapproach described above to simultaneously esti-mate reproduction model parameters and predictsubsequent population size Each of the integratedmodels estimated some combination of vital ratebias parameters described in (10) Model 10 as-sumed reproduction bias but no survival bias Model01 assumed survival bias but no reproduction biasModel 11 estimated both bias terms while Model 00estimated neither These five models were replicatedunder two alternative biological models for blackduck reproduction one incorporating a Mallard com-petitive effect the other excluding this effect for atotal of 10 scenarios
The MetropolisndashHastings sampler in PyMC pro-duced predictions and estimates for the model setA total of 100000 sampling iterations for eachmodel were executed with the first 50000 con-servatively discarded as burnndashin samples as-suming that convergence had been achieved bythat stage Manual inspection of sample tracessuggested convergence and adequate mixing ofeach chain We compared reproduction model pa-rameter estimates among model scenarios aswell as bias factor estimates where relevant using95 Bayesian credible intervals derived from theposterior distribution of the final 50000 samplesWe also calculated the logndashbias of each populationi = 123 in each of t = 110 years
(11)
Model selection was performed using AkaikersquosInformation Criterion (Burnham amp Anderson 2002Akaike 1973 AIC) calculated for each model ateach iteration Burnham amp Anderson (2002) illus-trate the equivalence of AIC model weights andBayesian posterior model weights provided thatmodel priors are equivalent (as we have specified)Use of AIC greatly simplifies model selection in aBayesian framework relative to other approachessuch as reversible jump MCMC (King amp Brooks2002) The lack of random effects and the relativelysmall set of models in this study eliminated theneed for procedures that are far more complex toimplement The calculation of AIC at each MCMCiteration yielded a distribution of values rather thanthe typical scalar value which explicitly character-izes parametric uncertainty and its interaction withmodel selection uncertainty
Results
Figure 7 illustrates the systematic overndashpredictionresulting from separately estimating vital ratesthen using those rates in a predictive model Thiseffect is most severe in the Western and Centralpopulations moreover overndashprediction is higherin earlier years relative to later Predictions de-rived from an integrated framework (fig 8) areonly subtly less positively biased overall The ad-
dition of a reproduction bias term (fig 9) or bothbias terms (fig 11) produces a more dramaticreduction in prediction bias particularly earlier inthe time series Here the relative overndashpredictionof the West and Central populations is balancedby underndashprediction in the East to achieve relativeunbiasedness overall The addition of the survivalbias parameter did not appreciably improve pre-diction (fig 10) Calculated AICndashbased modelweights reinforce the influence of reproductionbias on prediction as these models account forover 90 of total weight (table 1) Much biologicaluncertainty also remains in the form of the repro-duction function with neither model dominatingthe other consistently with respect to AIC weight
Estimates of reproduction and survival rate biasfactors are summarized in table 2 A positive re-production bias was estimated when survival biaswas assumed absent under Model 10 while anegative survival bias is discovered in the ab-sence of reproduction bias using Model 01 (though95 credible intervals include zero) Specifyingdual bias results in a positive reproduction biasunder the nondashcompetition reproduction model(Model 11) virtually no bias when competition isassumed (Model 11c) and a positive survival biasestimate in either case Complementary to theseestimates are those of the reproduction modelparameters (table 3) The age ratio reproductionmodel parameter estimates are strikingly similaramong statistical bias models and between inte-grated and nonndashintegrated models All have ap-proximately equivalent intercepts and a pattern ofincreasing negative density dependence west toeast Stronger differences are evident betweenbiological models where mallard competition ef-fects are balanced by generally larger interceptvalues relative to those of the nonndashcompetitivemodels
Discussion
The pattern of overndashprediction that pervades blackduck population models may well be independentof the quality of the model parameter estimators orthe data used by them A potential explanation forthese systematic and unidentified biases in ob-served population size is a flawed breeding survey(or wintering survey depending on which model isemployed (Conroy et al 2002)) Some have sug-gested that the current survey design is inadequatefor reliably estimating the breeding population(Bordage 2000) a nonndashstandard survey over thepast decade may in fact be responsible for theparticularly acute overndashprediction in the early partof the time series (D Bordage pers comm) Thistype of bias cannot be accounted for by our inte-grated models
Assuming however that an important compo-nent of the existing bias is due to the models or datafor estimating vital rates an integrated frameworksuch as that presented here may prove beneficial
278 Fonnesbeck amp Conroy
Model parameter estimates that were informed bythe consequent population prediction resulted inless biased population estimates relative to theirnonndashintegrated counterparts particularly when re-production bias parameters were specified Re-maining bias showed spatial and temporal patternsof heterogeneity In particular estimates were morepositively biased in the first half of the time serieswhere negative biases occurred they tended to bein the second half Again this trend may be due toinconsistencies in survey methodologies over thistime period Spatially more overndashprediction oc-curred in the Western and Central populationsbalanced by relative unbiasedness or even underndashprediction in the East This may also be generallyrelated to survey problems in these areas becausethe West and Central regions are characterized bylarge unsurveyed areas in Ontario and Quebec in
contrast to the relatively smaller wellndashsurveyedAtlantic provinces in the East The quality of predic-tions among integrated models were not obviouslydifferent according to which vital rate bias param-eters were estimated
Each of the integrated models not only representsa different explanation for the source of overndashpredic-tion but also for the factors influencing production ingeneral Having quantified structural and biologicaluncertainty future development could link weightedpredictions across models to a dynamic decisionoptimization procedure thereby providing a com-plete decision analysis system to inform manage-ment Though not currently incorporated into themodeling framework presented here methods ofdynamic optimization exist which complement theintegrated stochastic simulation approach outlinedthus far (eg reinforcement learning)
Figs 7 8 Bias in population predictions from nonndashintegrated model (7) and from integrated modelwith no bias factors (Model 00) (8) relative to actual population estimates for production withmallard competition (A) and without (B) over 11 years (1991ndash2001) Plots indicate differenceslog(predicted) ndash log(observed) for Western (dashed line) Central (dotndashdashed) and Eastern (solid)populations of black ducks
Figs 7 8 Sesgos en las predicciones de poblacioacuten a partir del modelo no integrado (7) y a partir delmodelo integrado sin factores de sesgo (modelo 00) con relacioacuten a las estimaciones de poblacioacutenactuales para la produccioacuten con competencia de aacutenades reales (A) y sin competencia (B) a lo largo de11 antildeos (1991ndash2001) Las representaciones graacuteficas indican diferencias logariacutetmicas (previstas) ndashlogariacutetmicas (observadas) para las poblaciones de aacutenades sombriacuteos del estrato geograacutefico occidental(liacutenea discontinua) central (liacutenea discontinua punteada) y oriental (liacutenea continua)
A B
10
05
00
ndash05
2 4 6 8 10 2 4 6 8 10Time Time
2 4 6 8 10 2 4 6 8 10Time Time
10
05
00
ndash05
10
05
00
ndash05
10
05
00
ndash05log
(p
red
) ndash
log
(o
bs)
log
(p
red
) ndash
log
(o
bs)
Animal Biodiversity and Conservation 271 (2004) 279
Figs 9ndash11 Bias in population predictions from integrated model with reproduction bias (Model 10) (9)from integrated model with survival bias (Model 01) (10) and from integrated model with bothreproduction and survival bias (Model 11) (11) relative to actual population estimates for productionwith mallard competition (A) and without (B) over 11 years (1991ndash2001) Plots indicate differences log(predicted) ndash log (observed) for Western (dashed line) Central (dotndashdashed) and Eastern (solid)populations of black ducks
Figs 9ndash11 Sesgos en las predicciones de poblacioacuten a partir del modelo integrado con sesgos dereproduccioacuten (Modelo 10) (9) a partir del modelo integrado con sesgos de supervivencia (Modelo 01)(10) y a partir del modelo integrado con sesgos de reproduccioacuten y sesgos de supervivencia (Modelo11) (11) con relacioacuten a las estimaciones de poblacioacuten actuales para la produccioacuten con competencia deaacutenades reales (A) y sin competencia (B) a lo largo de 11 antildeos (1991ndash2001) Las representacionesgraacuteficas indican diferencias logariacutetmicas (previstas) ndash logariacutetmicas (observadas) para las poblacionesde aacutenades sombriacuteos del estrato geograacutefico occidental (liacutenea discontinua) central (liacutenea discontiacutenuapunteada) y oriental (liacutenea continua)
A B
10
05
00
ndash05log
(p
red
) ndash
log
(o
bs)
10
05
00
ndash05log
(p
red
) ndash
log
(o
bs)
10
05
00
ndash05log
(p
red
) ndash
log
(o
bs) 10
05
00
ndash05
10
05
00
ndash05
10
05
00
ndash05
2 4 6 8 10 2 4 6 8 10Time Time
2 4 6 8 10 2 4 6 8 10Time Time
2 4 6 8 10 2 4 6 8 10Time Time
280 Fonnesbeck amp Conroy
Table 3 Production model parameter estimates for each model scenario (95 Bayesian credibleintervals in parentheses) Spatiallyndashexplicit parameters listed on multiple lines for each model whereappropriate West (top) Central (middle) East (bottom)
Tabla 3 Estimaciones de paraacutemetros del modelo de produccioacuten para cada modelo (entre pareacutentesislos intervalos bayesianos creiacutebles al 95) Los paraacutemetros espacialmente expliacutecitos se detallan enliacuteneas muacuteltiples para cada modelo estrato geograacutefico occidental (liacutenea superior) estrato geograacuteficocentral (linea media) estrato geograacutefico oriental (liacutenea inferior)
Model Intercept Black Duck effect Mallard effect
00 1872 (14022316) ndash0501 (ndash0724ndash0256) 0
1473 (10601870) ndash0617 (ndash0957ndash0275)
1627 (13761871) ndash0877 (ndash0993ndash0759)
01 1843 (13792299) ndash0478 (ndash0713ndash0238) 0
1478 (10501888) ndash0608 (ndash0952ndash0248)
1640 (13951886) ndash0879 (ndash0987ndash0766)
10 1914 (13672462) ndash0494 (ndash0794ndash0185) 0
1284 (08191828) ndash0700 (ndash1074ndash0360)
1893 (16792095) ndash0928 (ndash1022ndash0837)
11 1843 (12722379) ndash0457 (ndash0752ndash0142) 0
1269 (07611775) ndash0671 (ndash1032ndash0294)
1805 (15452056) ndash0883 (ndash0985ndash0763)
Null 1495 (09552019) ndash0255 (ndash0531 0038) 0
1655 (12202058) ndash0738 (ndash1070ndash0386)
1679 (14211938) ndash0902 (ndash1013ndash0792)
Table 1 Mean AIC values along with AICvalues and associated model weights of 10competing models for black duck populationdynamics based on the final 50000 of100000 total MCMC iterations
Tabla 1 Valores medios de AIC junto convalores de AIC y pesos de modelos asociadosde 10 modelos alternativos para la dinaacutemicapoblacional del aacutenade sombriacuteo a partir de las50000 de un total de 100000 iteracionesMCMC finales
Model AIC AIC Weight
10c 2582794 000 0519
10 2582859 065 0375
11 2583161 367 0082
00 2583588 794 0010
00c 2583661 867 0007
01c 2583870 1076 0002
01 2583877 1083 0002
11c 2583986 1192 0001
Null 2587729 4935 0000
Nullc 2588437 5643 0000
Table 2 Production and survival bias parameterestimates (log scale) for each of eight integratedmodel scenario combinations (95 Bayesiancredible intervals in parentheses) Zero valuesindicate no estimate for given model scenario
Tabla 2 Estimaciones de paraacutemetros deproduccioacuten y sesgos de supervivencia (escalalogariacutetmica) para cada una de las ochocombinaciones de modelos integrados (entepareacutentesis los intervalos bayesianos creiacutebles al95) Los valores cero no indican ningunaestimacioacuten para el modelo dado
Model Production Bias Survival Bias
0000c 0 0
10 0701(0641 0762) 0
10c 0696(0638 0750) 0
01 0 ndash0085(ndash0478 0250)
01c 0 ndash0121(ndash0473 0186)
11 0679(0573 0754) 0051(ndash0128 0251)
11c ndash0100(ndash0211 0027) 0241(ndash0298 0760)
Animal Biodiversity and Conservation 271 (2004) 281
Though incomplete we have presented anintegrated framework for modeling populationdynamics The feedback between predictions andparameter estimates achieved by sampling froma full joint posterior via Markov chain MonteCarlo results in vital rate estimates that arebetter predictors of population change This ho-listic approach is a more efficient use of allavai lable information relat ive to standardmodeling procedures that estimate parametersand project population states in serial The avail-ability of complementary procedures for dynamicdecision analysis hold promise for the develop-ment of a truly integrated natural resource deci-sionndashmaking tool
References
Akaike H 1973 Information theory as an exten-sion of the maximum likelihood principle InSecond International Symposium on InformationTheory 267ndash281 (B N Petrov amp F Csaki Eds)Akademiai Kiado Budapest
Bordage D 2000 Black duck joint venture heli-copter survey ndash Queacutebec Technical report Cana-dian Wildlife Service Queacutebec Region Environ-ment Canada SaintendashFoy QC
Burnham K P amp Anderson D R 2002 ModelSelection and MultindashModel Inference A Practi-cal Informationndashtheoretic Approach SpringerNew York
Conroy M J Miller M W amp Hines J E 2002Identification and synthetic modeling of factorsaffecting American black duck populations Jour-nal of Wildlife Management 6 (Wildlife Mono-graph No150)
Gamerman D 1997 Markov Chain Monte Carlostatistical simulation for Bayesian inferenceChapman and Hall London first edition
Hastings W K 1970 Monte carlo sampling meth-ods using markov chains and their applicationsBiometrika 57 97ndash109
King R amp Brooks S P 2002 Model Selection forIntegrated RecoveryRecapture Data Biometrics58 841ndash851
Lubow B C 1995 SDP Generalized software forsolving stochastic dynamic optimization prob-lems Wildlife Society Bulletin 23 738ndash742
Metropolis N Rosenbluth A W Rosenbluth MN Teller A H amp Teller E 1953 Equations ofstate calculations by fast computing machine JChem Phys 21 1087ndash1091
Robert C P amp Casella G 1999 Monte Carlostatistical methods SpringerndashVerlag New York
Wikle C K 2003 Hierarchical Bayesian modelsfor predicting the spread of ecological proc-esses Ecology 84 1382ndash1394
Williams B K Nichols J D amp Conroy M J2002 The Analysis and Management of AnimalPopulations Academic Press San Diego CA
Zimpfer N L 2004 Estimating movement andproduction rates in American black ducks Masterrsquosthesis Univ of Georgia Athens
Model Intercept Black Duck effect Mallard effect
00c 2727 (23913063) ndash0794 (ndash0887ndash0692) ndash0265 (ndash0482 ndash0048)
1705 (14711934)
1493 (12601719)
01c 2710 (23513072) ndash0787 (ndash0884ndash0693) ndash0253 (ndash0478 ndash0033)
1704 (14701921)
1482 (12601704)
10c 2820 (24523176) ndash0837 (ndash0935ndash0721) ndash0283 (ndash0503 ndash0036)
1541 (13381748)
1693 (14661911)
11c 2757 (23583141) ndash0800 (ndash0898ndash0701) ndash0275 (ndash0519 ndash0025)
1716 (14771947)
1523 (12921759)
Nullc 2729 (23253116) ndash0805 (ndash0904ndash0707) ndash0220 (ndash05030065)
1736 (15111969)
1507 (12771731)
Table 3 (Cont)
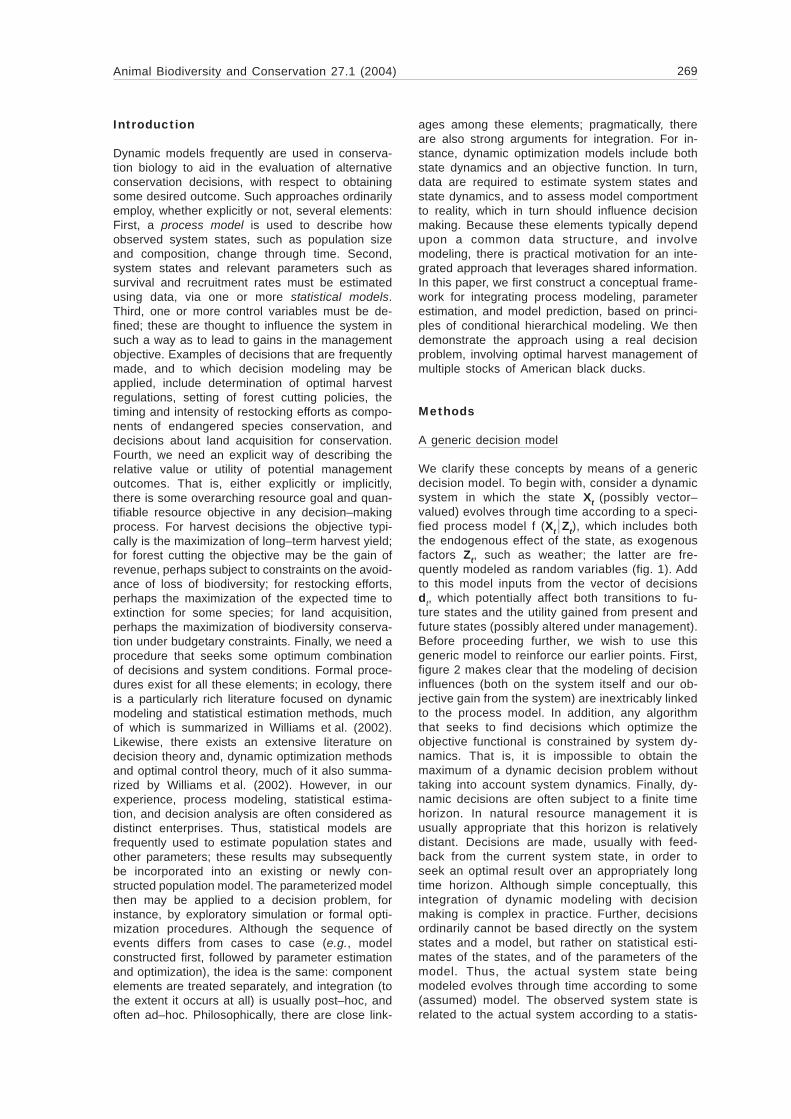
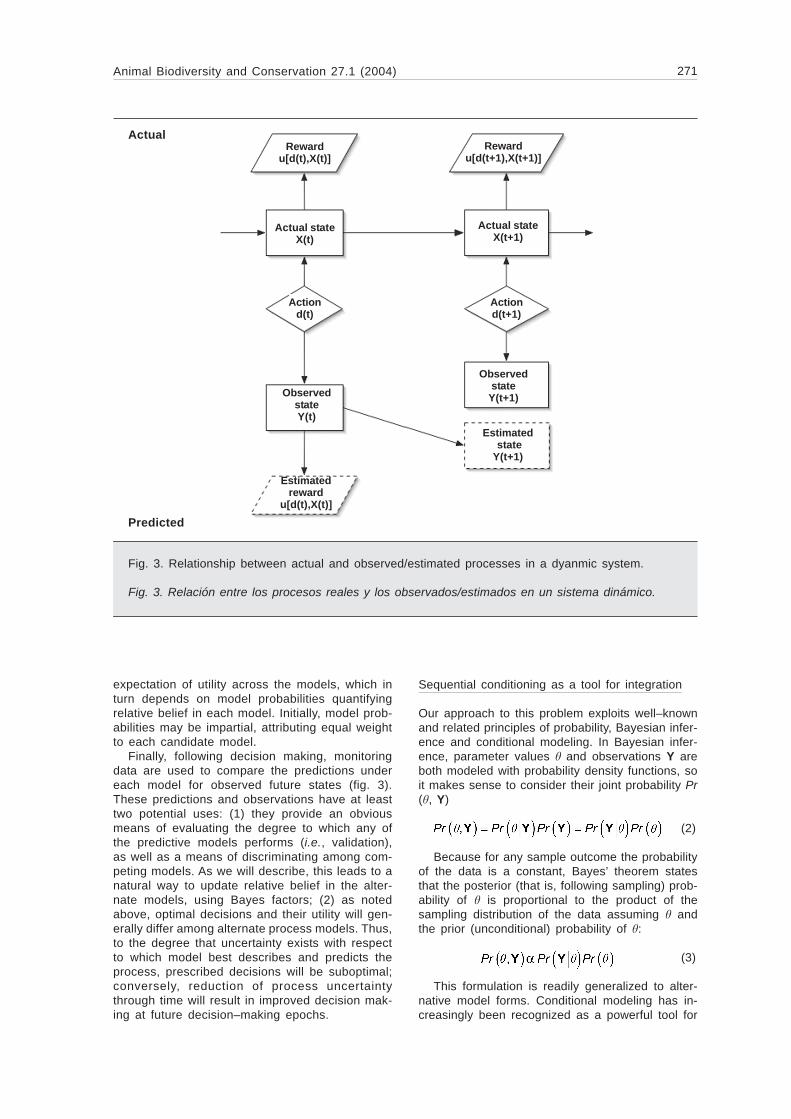
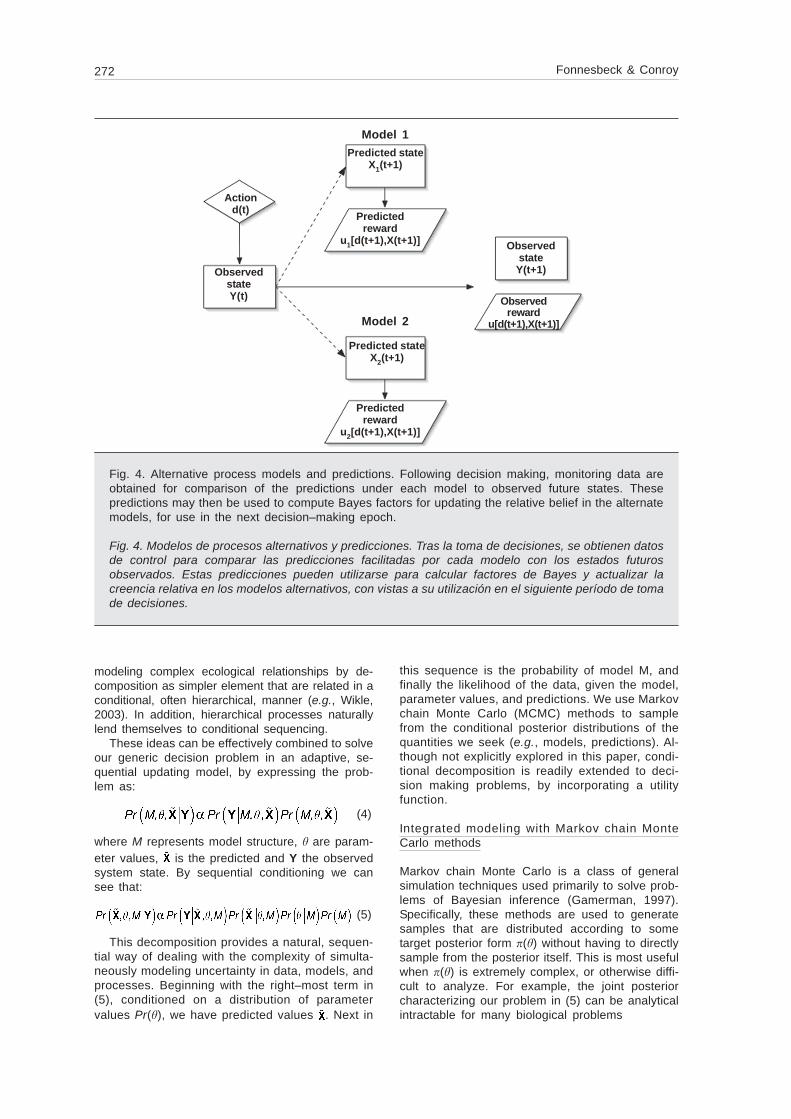
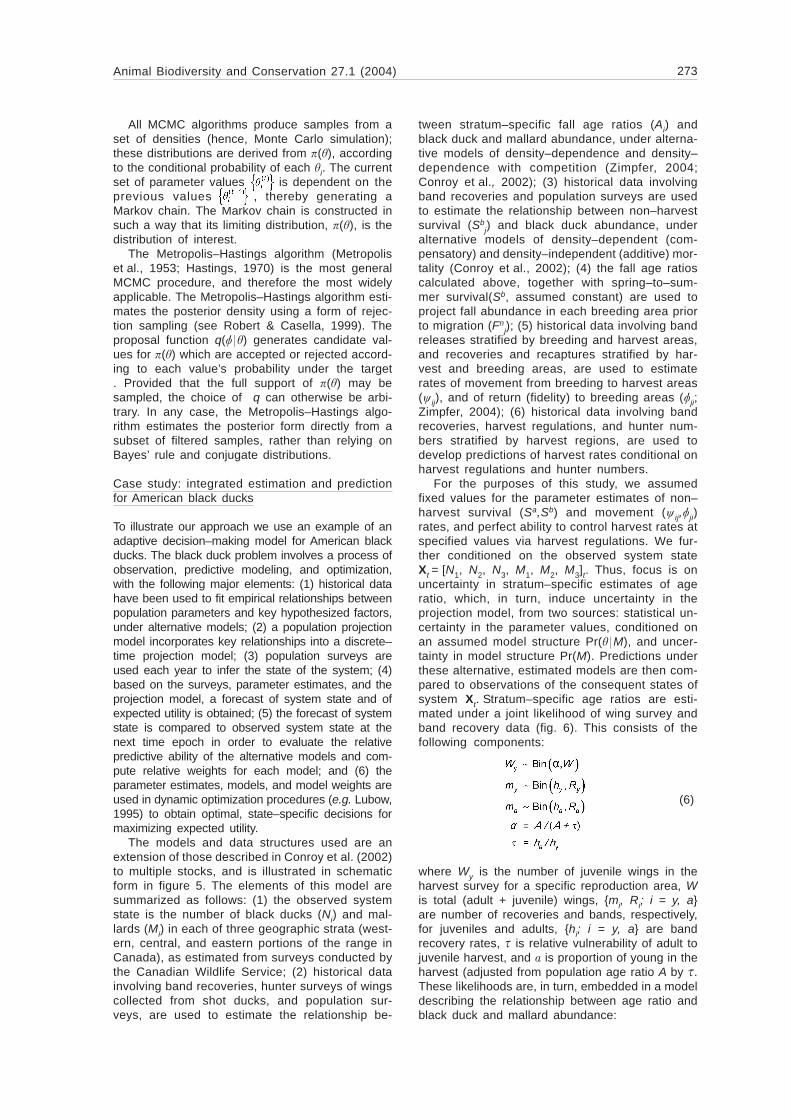