applanation resonance tonometry for intraocular pressure ...144522/fulltext01.pdf · changes the...
TRANSCRIPT
1
Applanation resonance tonometry for intraocular pressure measurement
Per Hallberg
Department of Applied Physics and Electronics, Department of Radiation Sciences,
Department of Clinical Science, Ophthalmology, and Centre for Biomedical Engineering and Physics, Umeå University, Sweden,
Department of Biomedical Engineering and Informatics, Umeå University Hospital, Sweden.
Umeå 2006
2
Department of Applied Physics and Electronics Umeå University
SE-901 87 Umeå, Sweden
Resonance Sensor Lab Dissertations No. 1
ISSN 1653-6789, ISBN 91-7264-061-8
© 2006 by Per Hallberg
Printed by Print & Media, Umeå University, Umeå, 2006: 2001884
••

3
Doubt is the beginning of wisdom. (René Descartes)

4
••
5
1 Abstract
Elevated intraocular pressure (IOP) is one of the major risk factors for glaucoma. Since glaucoma is a leading cause of blindness, reliable methods for measuring the IOP are important. This doctoral dissertation presents a new method, applanation resonance tonometry (ART), for measurement of IOP. The method is based on resonance sensor technology combined with the novel multipoint analysis of continuously sampled data of both contact force and contact area. The ART was evaluated in in vitro porcine-eye studies as well as in clinic on both healthy volunteers and patients. The method was shown to give reliable IOP measurements with sufficient precision.
In the 1980s a new tactile sensor, based on resonance technology, was introduced for measuring physical properties such as stiffness or hardness. The sensor was based on a piezoelectric element that is set to vibrate at its resonance frequency. In 2000, it was shown that when the sensor touches an object, the frequency shift was proportional to the contact area. A method for IOP estimation using area measurement while applanating the cornea with constant force was suggested and evaluated. The results were promising but there was between-eye variability, and a further development was needed.
We combined the area measurement device with a force transducer and thereby developed the concept for the ART. The former single point reading of contact force (FC) and contact area (A) was thus further developed into a multipoint method that used an area interval recorded from the initial applanation of the cornea. In that area interval, the slope between FC and A was interpreted as proportional to the IOP. In an in vitro model the method showed a high degree of explanation (R2=0.99) and an improved accuracy of the IOP measurement.
Evaluation in a clinical setting, both in vitro (porcine eye-model) and in vivo(humans) showed promising result. However, when the centralisation of the probe was dependent on the operator, the unavoidable off-centre placement of the sensor resulted in a reduced precision.
A new symmetric probe with a larger sensor tip and improved aligning light was developed and evaluated in vitro. It showed that the error from off-centring was highly reduced. The new ART probe, used as a biomicroscope device (ARTBiom)and as a handheld device (ARTHand), was further evaluated in a clinical study designed in accordance with the International Standard Organisation’s (ISO) requirement. Both the ARTBiom and the ARTHand met the precision set by the requirements.
6
Laser surgery is a common way to correct vision. The surgery changes the curvature and thickness of the cornea and thereby affects how indirect tonometry measures the IOP. The biomechanical effect of photorefractive keratectomy (PRK) on IOP measurements was evaluated using Goldmann applanation tonometry (GAT) and ART in an in vitro study. Both methods were affected, but to a different extent. The flat contact probe of GAT, as compared with the convex tip of ART, and single point vs. multipoint approach, provide explanation to the ART advantage regarding measurement error of IOP after PRK.
In conclusion, resonance sensor technology has made it possible to introduce a new multipoint method for measuring IOP, and the method is relevant for measuring IOP in humans. It may be possible to reduce errors in the clinical measurement of IOP with this new method, especially after corneal surgery. The ART has the potential to become a useful clinical instrument for IOP measurement.
••

7
Contents1 ABSTRACT 5
2 ABBREVIATIONS 9
3 ORIGINAL PAPERS 11
4 INTRODUCTION 134.1 GENERAL BACKGROUND 134.2 ANATOMY OF THE EYE 144.3 REFRACTION 184.3.1 REFRACTIVE KERATECTOMY 194.4 INTRAOCULAR PRESSURE 204.4.1 GLAUCOMA 214.4.2 PREVALENCE OF GLAUCOMA 214.5 MEASUREMENT OF INTRAOCULAR PRESSURE 224.5.1 CONTACT TONOMETRY 224.5.2 NON-CONTACT TONOMETRY 254.5.3 SELF TONOMETRY 264.5.4 STANDARDS FOR ESTABLISHING NEW TONOMETRY METHODS 274.6 RESONANCE SENSOR 294.7 AIMS OF THE STUDY 31
5 METHODS 335.1 APPLANATION RESONANCE TONOMETRY 335.2 RESONANCE PROBES 345.2.1 PROBE 1 345.2.2 PROBE 2 345.3 EXPERIMENTAL SET-UPS 365.3.1 BENCH-BASED SET-UP 365.3.2 BIOMICROSCOPE-BASED SET-UP 375.3.3 HAND-HELD SET-UP 395.4 PHOTOREFRACTIVE KERATECTOMY 395.4.1 BIOMECHANICAL MODEL OF APPLANATION 405.5 STATISTIC METHODS 41
6 MATERIALS 436.1 IN VITRO MATERIALS 436.2 CLINICAL MATERIALS 44
7 RESULTS AND DISCUSSIONS 457.1 FURTHER DEVELOPMENT 54
8 GENERAL SUMMARY AND CONCLUSIONS 55
9 ACKNOWLEDGEMENTS 57
10 REFERENCES 59

8
••
9
2 Abbreviations
A Contact area
ART Applanation resonance tonometry
ARTBiom IOP measured with ART in the biomicroscope based set-up
ARTHand IOP measured with ART in the hand-held set-up
ARTIndent IOP measured with ART from the initial applanation phase
ARTRemoval IOP measured with ART from the removal phase
CCT Central corneal thickness
D Diopter
FC Contact force
FRigidity Force related to the corneal rigidity
FSurface tension Force related to the capillary forces from tear fluid
GAT Goldmann applanation tonometry
IOP Intraocular pressure
IOPVC Reference IOP measured in the eye
ISO International Standard Organisation
L Applanation depth
LASEK Laser subepithelial keratectomy
LASIK Laser in situ keratomileusis
p Pearson’s correlation coefficient
PRK Photorefractive keratectomy
PTK Phototherapeutic keratectomy
PZT Lead Zirconate Titanate
Q Optical power
R Corneal radius of curvature
r Correlation
R2 Degree of explanation of a model
RK Radial keratotomy
Curvature of the sensor tip

10
••
11
3 Original papers
This dissertation is based on the following papers, which are referred to by their Roman numerals in the text. Papers I, II and III are reprinted with permission from the publishers.
I. Eklund, A., Hallberg, P., Lindén, C., Lindahl, O.A., Applanation resonance sensor for measuring intraocular pressure - a continuos force and area measurement method. Investigativ Ophthalmology & Visual Science, 2003. 44(7): p. 3017-3024.
II. Hallberg, P., Linden, C., Lindahl, O.A., Bäcklund, T., Eklund, A. Applanation resonance tonometry for intraocular pressure in humans.Physiological Measurement, 2004. 25: p. 1053-1065.
III. Hallberg, P., Lindén, C., Bäcklund, T., Eklund, A., Symmetric sensor for applanation resonance tonometry of the eye. Medical and Biological Engineering and Computing, 2006. 44(1 - 2): p. 54-60.†
IV. Hallberg, P., Eklund, A., Bäcklund, T., Lindén, C., Clinical evaluation of Applanation Resonance Tonometry in comparison with Goldmann applanation tonometry. Submitted 2006.
V. Hallberg, P., Eklund, A., Santala, K., Lindahl, O.A., Lindén, C. Underestimation of intraocular pressure after photorefractive keratectomy – biomechanical analysis. Submitted 2006
www.iop.org/journals/pmea
† With kind permission of Springer Science and Business Media.

12
••
Introduction
13
4 Introduction
4.1 General background Glaucoma is an eye disease that may be defined as a progressive optic neuropathy with characteristic changes of the optic nerve head and the visual field. The aetiology is not completely understood, but one of the major risk factors is elevated intraocular pressure (IOP) [1]. All treatment, so far, is aimed at reducing IOP. Therefore, it is important for diagnostic purposes and for follow-up after treatment to have simple and reliable methods for measuring the IOP. Tonometry is a standard procedure in all examinations of the eye.
The applanation principle states that when a flat surface is pressed against a fluid-filled sphere with a flexible membrane, the internal pressure may be measured by the force exerted on the plane and the area of contact [2]. For IOP measurement the applanation principle is generally described through the Imbert-Fick law [2] by contact force (FC) and area of contact (A) (Eq. 1).
CFIOPA
(1)
One of the most commonly used methods to measure IOP is Goldmann applanation tonometry (GAT). It is based on constant area applanation and operator adjustment of the force to reach that area [2]. Thus, IOP is calculated from a one-point reading of area and force.
Imbert Fick’s law is valid under ideal conditions which include an infinitely thin cornea with a dry surface and perfect elasticity. The human cornea does not meet those conditions. The cornea is a complex biomechanical system that introduces several errors into the measurement process. Goldmann recognised the rigidity of the cornea and the influence of the tear fluid [2]. Since those two parameters counteract each other, Goldmann used a predefined contact area of 7.35 mm2 where the rigidity (FRigidity) and tear surface tension force (FSurface tension)were balanced (Eq. 2).
RigiditysionSurfacetenC FAIOPFF (2)
Two prerequisites for correct GAT in an eye are normal central corneal thickness (CCT) and normal corneal curvature. If these factors are changed, several studies have shown that significant measurement errors will occur during the estimation of IOP with GAT [3].
Excimer laser surgery has become a common technique to correct refractive errors. Photorefractive keratectomy (PRK), laser subepithelial keratectomy
Introduction
14
(LASEK) and laser in situ keratomileusis (LASIK) are three methods that are frequently used. The laser induces a reduction of the corneal thickness and changes the corneal curvature. Both factors can cause measurement errors when determining IOP [3-6], but their individual influences have not been clarified. Many studies have focused on the relationship between CCT and IOP [4, 7, 8]. In general, a thick cornea implies an increased contact force from the corneal rigidity and results in an overestimation of the IOP (Eq. 2). A well known consequence of laser refractive surgery for myopia is an underestimation of the IOP measured with GAT [9-11]. However, the causes are not fully understood.
Professor Omata presented a new type of resonance sensor [12, 13] in the mid 1980s. Through a collaboration with Professor Lindahl, the resonance technique was brought to Sweden in the mid 1990s [14, 15]. Eklund et al. developed a model that measured the contact area between sensor probe and tissue with the resonance technology. The novel technique was used to determine the intraocular pressure using a constant contact force method [16].
The sensor is based on a piezoelectric element that is set to vibrate at its resonance frequency. It has been shown [16] that when the sensor is applied against the cornea, the frequency shift is proportional to the contact area. By using a constant force and measuring the frequency shift, the contact area and the IOP can be calculated according to Eq. 1. The study [16] demonstrated that the resonator sensor principle can be used to measure IOP in a physical model. As with GAT, the calculation of IOP is based on a one-point reading of area and force. That study [16], as well as a later study [17], showed an IOP-measurement variation related to differences between eyes. In the latter study, normalization of frequency shift was shown to reduce the between-eye variability, and a further development toward a method that incorporates a self-calibration, similar to the normalization, was suggested.
This dissertation describes the development and evaluation of the Applanation resonance tonometer. It shows how the resonance sensor technique for area measurement was used to create a new method with multiple readings of area and force during a quick applanation. The work included a number of development steps, in vitro experimental studies, clinical studies, and biomechanical analyses of the applanation.
4.2 Anatomy of the eye The accessory structures of the eye are: the eyelids, eyelashes, eyebrows, lacrimal apparatus, and the extrinsic eye muscles. Six muscles in the eye socket control eye movement. Four rectus muscles are attached to the eye ball and they move the eye straight up, down and to the sides. The other two muscles that are attached to the eye ball are called oblique and control the eye’s rotational movements.
The eyelids protect the eyes from the environment, injury and light. They also maintain a smooth corneal surface by spreading tears evenly over the eye. The
••
Introduction
15
lids are composed of an outer layer of skin, a middle layer of muscle and tissue that gives them form, and an inner layer of moist conjunctival tissue (conjunctiva).
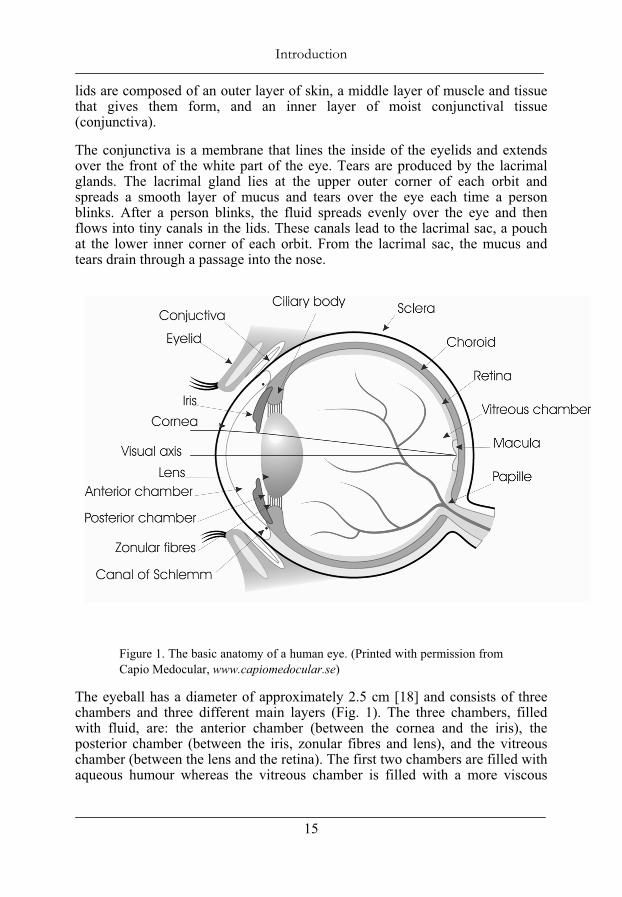
The conjunctiva is a membrane that lines the inside of the eyelids and extends over the front of the white part of the eye. Tears are produced by the lacrimal glands. The lacrimal gland lies at the upper outer corner of each orbit and spreads a smooth layer of mucus and tears over the eye each time a person blinks. After a person blinks, the fluid spreads evenly over the eye and then flows into tiny canals in the lids. These canals lead to the lacrimal sac, a pouch at the lower inner corner of each orbit. From the lacrimal sac, the mucus and tears drain through a passage into the nose.
Figure 1. The basic anatomy of a human eye. (Printed with permission from Capio Medocular, www.capiomedocular.se)
The eyeball has a diameter of approximately 2.5 cm [18] and consists of three chambers and three different main layers (Fig. 1). The three chambers, filled with fluid, are: the anterior chamber (between the cornea and the iris), the posterior chamber (between the iris, zonular fibres and lens), and the vitreous chamber (between the lens and the retina). The first two chambers are filled with aqueous humour whereas the vitreous chamber is filled with a more viscous
Introduction
16
fluid, the vitreous humour. The three different layers are: the fibrous tunic, the vascular tunic, and the retina.
The fibrous tunic is the outer coat of the eyeball and consists of the anterior cornea and the posterior sclera. The cornea has a thickness of 0.53 (± 0.03 SD) mm [8] and is composed of five main layers of tissue: epithelium, Bowman’s membrane, stroma, Descemet’s membrane, and the endothelium. The epithelium provides a smooth, hydrophobic, reflective surface which protects the eye from external damage. The epithelium is also rich in nerves. If a small injury were to occur or if a foreign body were to touch the cornea a reflex would shut the eyelid to protect the eye. Bowman’s membrane is composed of strong layered protein fibres called collagen. Once injured, Bowman’s layer can form a scar as it heals. Beneath Bowman’s layer is the stroma, which occupies about 90 percent of the corneal thickness. It consists primarily of water and collagen, and it does not contain any blood vessels. Collagen gives the cornea its strength, elasticity, and form. The collagen fibres’ unique shape, arrangement, and spacing are essential to allow the cornea to conduct light and to be transparent. Descemet’s membrane is a thin but strong sheet, composed of collagen fibres. Descemet’s membrane is regenerated readily after injury. Endothelial cells form the deepest layer of the cornea, and they are essential in keeping the cornea clear. Normally, fluid leaks slowly from inside the eye into the middle corneal layer (stroma). The endothelium's primary task is to pump this excess fluid out of the stroma. Without this pumping action, the stroma would swell with water. In a healthy eye, a perfect balance is maintained between the fluid moving into the cornea and fluid being pumped out of the cornea. Once endothelium cells are destroyed by disease or trauma, they are lost forever. If many endothelial cells are destroyed, corneal oedema and impaired vision might occur.
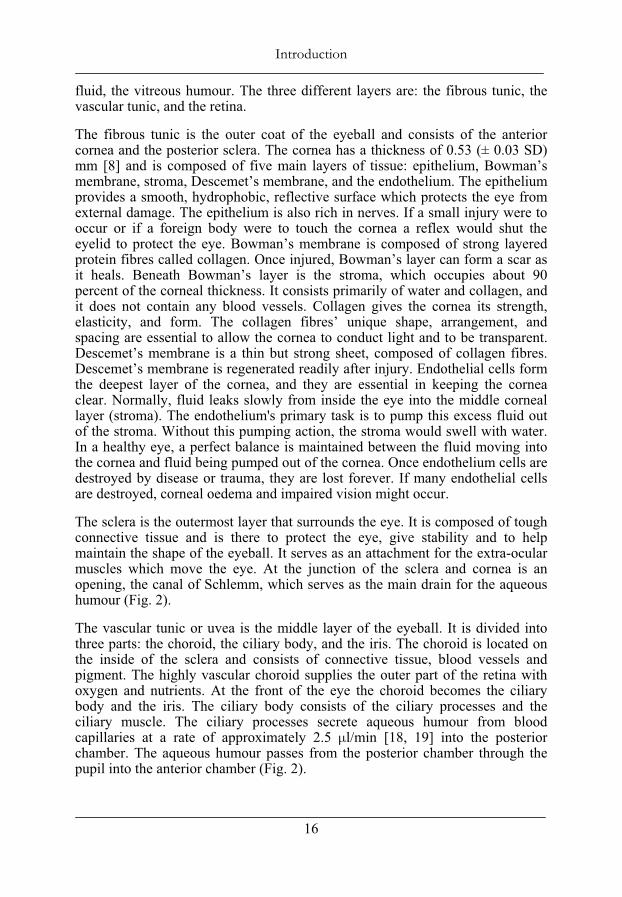
The sclera is the outermost layer that surrounds the eye. It is composed of tough connective tissue and is there to protect the eye, give stability and to help maintain the shape of the eyeball. It serves as an attachment for the extra-ocular muscles which move the eye. At the junction of the sclera and cornea is an opening, the canal of Schlemm, which serves as the main drain for the aqueous humour (Fig. 2).
The vascular tunic or uvea is the middle layer of the eyeball. It is divided into three parts: the choroid, the ciliary body, and the iris. The choroid is located on the inside of the sclera and consists of connective tissue, blood vessels and pigment. The highly vascular choroid supplies the outer part of the retina with oxygen and nutrients. At the front of the eye the choroid becomes the ciliary body and the iris. The ciliary body consists of the ciliary processes and the ciliary muscle. The ciliary processes secrete aqueous humour from blood capillaries at a rate of approximately 2.5 μl/min [18, 19] into the posterior chamber. The aqueous humour passes from the posterior chamber through the pupil into the anterior chamber (Fig. 2).
••
Introduction
17
Figure 2. The pathway of aqueous humour flow from the ciliary body to the drainage angle
The normal outflow pathway for the aqueous humour includes the trabecular meshwork, Schlemm's canal and the episcleral venous system. Zonular fibres (Fig. 1), the fibres that hold the lens in place, are attached to the ciliary body. The lens is covered by a lens capsule and has a shape that is more rounded at the back than at the front. The main purpose of the lens is to adjust the focus at the retina throughout accommodation. The ciliary muscle in the ciliary body allows us to accommodate. When the muscle contracts the fibres relax and the lens gains a rounder shape which enables us to see clearly at a close distance. When the muscle relaxes the fibres are tightened and the lens becomes more flat. Then we can see clearly at a long distance. The amplitude of accommodation of an eye is the maximum amount that the lens can accommodate and is measured in dioptres (D), equivalent to the reciprocal focal length expressed in meters. This amount is high when young and decreases with age. After age 40 in most people, comfortable focus at a near distance becomes more difficult. This normal condition is known as presbyopia and is due both to a decreased flexibility of the crystalline lens and to a weakening of the ciliary muscle. At about 65 years of age the lens is incapable of changing shape. The iris is the coloured part of the choroid. The amount of pigment in the iris determines if we have blue or brown eyes. The iris is placed in front of the lens and contains of two muscles, one which narrows and one which widens the pupil, which is the opening in the centre of the iris. It works much like the shutter of a camera and responds to the intensity of the light.
The retina is the third and innermost coat of the eyeball and lines the back of the eye. It contains the photoreceptor cells, the rods and cones, which receive light and result in neural signals that undergo complex processing by other neurons of the retina. The signals are transformed into action potentials in retinal ganglion cells which are then transmitted via the optic nerve to the visual centre of the brain. Cones, named for their conical shape, require a high intensity of light and
Introduction
18
allow the perception of colour. They are concentrated at the centre of the macula (fovea), and the high concentration of cones in the macula gives a high spatial resolution from light incoming with the visual axis. Rod cells are named for their cylindrical shape. They support vision at low light levels but do not allow the perception of colour. Rods, are concentrated at the outer edges of the retina and are used in peripheral vision. Since they are more light-sensitive, rods are responsible for night vision. A loss of rods causes’ night blindness, while a loss of cones causes legal blindness.
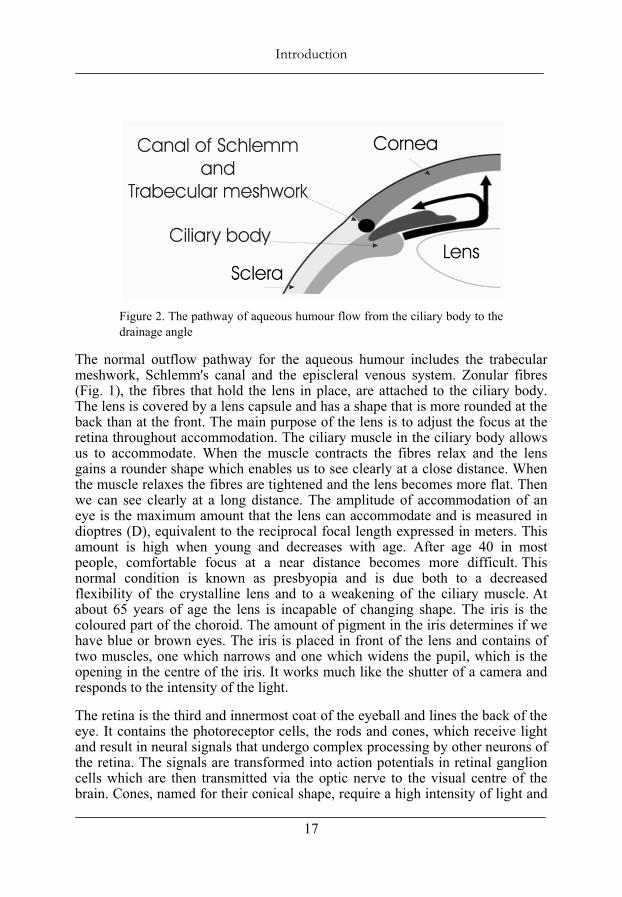
Using an ophthalmoscope, an operator can observe the retina’s anterior surface including the macula and the papilla (optic disc)(Fig. 1). The macula, the small depression in the retina, is observed at the centre of the posterior portion of the retina as a dark red area. The papilla is the place where the optic nerve leaves the retina and is seen at the nasal side of the retina. There are no photoreceptor cells there and this creates a spot in the visual field where we can’t see, the blind spot. The blind spot is easily demonstrated. Cover your left eye and gaze at the cross below. By altering the distance between the paper and your eye, you will find a point at which the square disappears.
The vitreous body occupies the space in the eye between the retina and the lens. It is a jelly-like substance and consists of a transparent, viscous fluid and very fine fibres. It holds the retina flush against the choroid, so that the retina provides an even surface for the reception of clear images. Unlike the aqueous humour (replaced every 90 min [18]), the vitreous body does not undergo constant replacement.
4.3 Refraction Light is a form of electromagnetic radiation and is visible for humans in a narrow band from 400 – 700 nm. The speed of light travelling in a vacuum (c) is approx. 3x10⁸ m/s. Its speed in a transparent medium (v) is always less then the speed in a vacuum, and the ratio between the speed in a vacuum and the speed in a medium is defined as the index of refraction (nrefraction).
refractioncnv
(3)
When light travels from one medium into another medium the velocity will change. The wavelength changes to accommodate the change in velocity. At a fixed frequency, wavelength is proportional to speed and therefore the ratio of the wavelength in a vacuum to the wavelength in a medium is also equal to the index of refraction. If the light meets a boundary at an oblique angle then its direction must change if the wavelength is to change by the appropriate factor. The angel through which the light is refracted can be calculated from simple
X
••
Introduction
19
geometry, and the relationship between the angle of the incidence and the angle of refraction is determined by Snell’s law:
1 1 2 2sin sinn n . (4)
However, light incident upon a surface, in general, will be partially reflected and partially transmitted as a refracted ray. The angle relationships for both reflection and refraction can be derived from Fermat’s principle. The fact that the angle of incidence ( incident) is equal to the angle of reflection ( reflekted) is called the law of reflection: ( incident = reflekted).
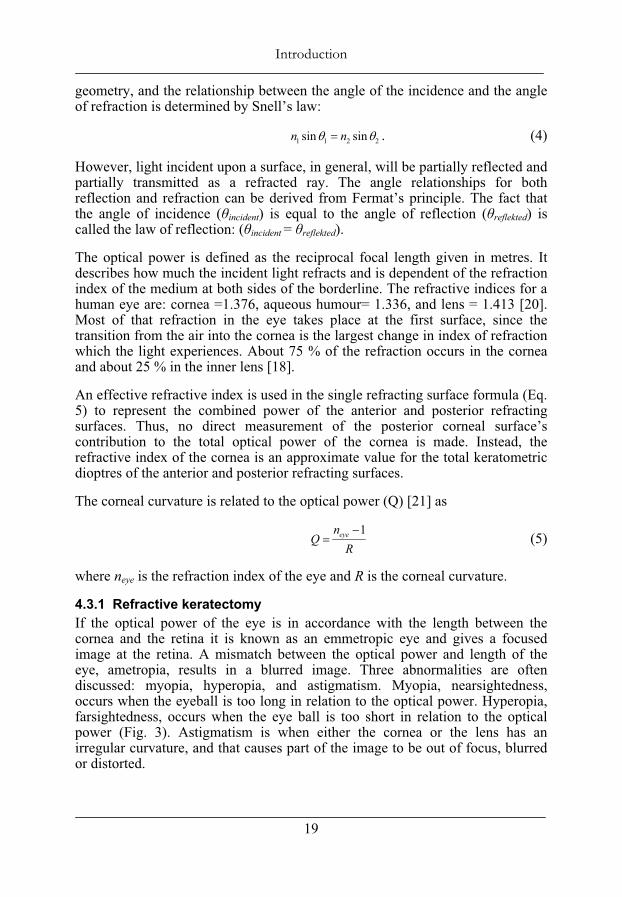
The optical power is defined as the reciprocal focal length given in metres. It describes how much the incident light refracts and is dependent of the refraction index of the medium at both sides of the borderline. The refractive indices for a human eye are: cornea =1.376, aqueous humour= 1.336, and lens = 1.413 [20]. Most of that refraction in the eye takes place at the first surface, since the transition from the air into the cornea is the largest change in index of refraction which the light experiences. About 75 % of the refraction occurs in the cornea and about 25 % in the inner lens [18].
An effective refractive index is used in the single refracting surface formula (Eq. 5) to represent the combined power of the anterior and posterior refracting surfaces. Thus, no direct measurement of the posterior corneal surface’s contribution to the total optical power of the cornea is made. Instead, the refractive index of the cornea is an approximate value for the total keratometric dioptres of the anterior and posterior refracting surfaces.
The corneal curvature is related to the optical power (Q) [21] as
1eyenQ
R (5)
where neye is the refraction index of the eye and R is the corneal curvature.
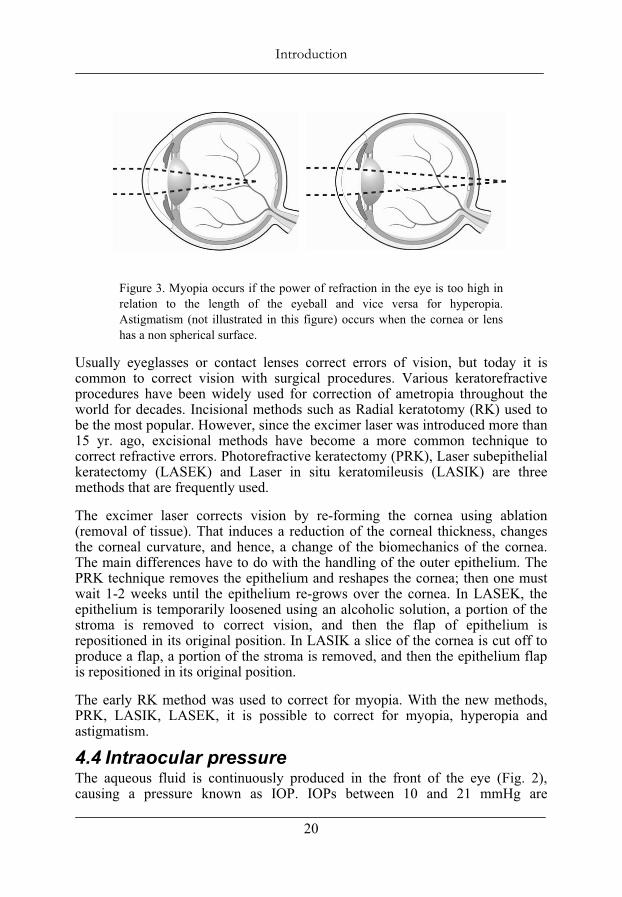
4.3.1 Refractive keratectomy If the optical power of the eye is in accordance with the length between the cornea and the retina it is known as an emmetropic eye and gives a focused image at the retina. A mismatch between the optical power and length of the eye, ametropia, results in a blurred image. Three abnormalities are often discussed: myopia, hyperopia, and astigmatism. Myopia, nearsightedness, occurs when the eyeball is too long in relation to the optical power. Hyperopia, farsightedness, occurs when the eye ball is too short in relation to the optical power (Fig. 3). Astigmatism is when either the cornea or the lens has an irregular curvature, and that causes part of the image to be out of focus, blurred or distorted.
Introduction
20
Figure 3. Myopia occurs if the power of refraction in the eye is too high in relation to the length of the eyeball and vice versa for hyperopia. Astigmatism (not illustrated in this figure) occurs when the cornea or lens has a non spherical surface.
Usually eyeglasses or contact lenses correct errors of vision, but today it is common to correct vision with surgical procedures. Various keratorefractive procedures have been widely used for correction of ametropia throughout the world for decades. Incisional methods such as Radial keratotomy (RK) used to be the most popular. However, since the excimer laser was introduced more than 15 yr. ago, excisional methods have become a more common technique to correct refractive errors. Photorefractive keratectomy (PRK), Laser subepithelial keratectomy (LASEK) and Laser in situ keratomileusis (LASIK) are three methods that are frequently used.
The excimer laser corrects vision by re-forming the cornea using ablation (removal of tissue). That induces a reduction of the corneal thickness, changes the corneal curvature, and hence, a change of the biomechanics of the cornea. The main differences have to do with the handling of the outer epithelium. The PRK technique removes the epithelium and reshapes the cornea; then one must wait 1-2 weeks until the epithelium re-grows over the cornea. In LASEK, the epithelium is temporarily loosened using an alcoholic solution, a portion of the stroma is removed to correct vision, and then the flap of epithelium is repositioned in its original position. In LASIK a slice of the cornea is cut off to produce a flap, a portion of the stroma is removed, and then the epithelium flap is repositioned in its original position.
The early RK method was used to correct for myopia. With the new methods, PRK, LASIK, LASEK, it is possible to correct for myopia, hyperopia and astigmatism.
4.4 Intraocular pressure The aqueous fluid is continuously produced in the front of the eye (Fig. 2), causing a pressure known as IOP. IOPs between 10 and 21 mmHg are
••
Introduction
21
considered as normal with a mean of 16 mmHg [22]. To offset the in-flowing fluid and to maintain normal IOP, the fluid drains out between the iris and cornea (an area known as the drainage angle, Fig. 2). It does so mainly through two channels within this angle: the trabecular meshwork, and the uveoscleral pathway. The trabecular meshwork, a sponge-like, porous network, and its connecting passageways, are referred to as the "conventional" outflow pathway. Most of the eye fluid outflow occurs in this region and flows from the trabecular meshwork to a group of vessels encircling the anterior chamber, called Schlemm’s canal. From here, the fluid enters collection chambers and then flows out into the general blood circulatory system of the body. The uveoscleral pathway is located behind the trabecular meshwork and is called the “unconventional” pathway. About 10 % [23] of the fluid flows out through this channel. Elevated IOP might develop as a result of abnormally high resistance to drainage of aqueous humour through the above mentioned pathways (Fig. 2).
4.4.1 Glaucoma Glaucoma, a group of optic neuropathies, is characterized by the death of retinal ganglion cells, leading to a deformation of the optic nerve, and progressive loss of the visual field [24]. The disease is often associated with elevated IOP. Current therapies include medications or surgeries are aimed at lowering the pressure, although mechanisms by which elevated IOP leads to neuronal damage in glaucoma are unknown. However, the risk to develop glaucoma have shown to increase tenfold if IOP > 23 mmHg as compared with people with IOP < 16 mmHg [1]. Furthermore, glaucoma is often asymptomatic for an extended time period and since the resulting loss of vision starts on peripherally, less than 50 % of its victims are aware of their disease. At diagnosis, often 30-40% of the ganglion cells are already dead [25].
The main classification includes primary, secondary and congential glaucoma. Primary glaucoma can be further classified as either open angle glaucoma, which comprises a number of chronic diseases, or closed angle glaucoma, which may have a more acute onset of symptoms.
4.4.2 Prevalence of Glaucoma Glaucoma is a leading cause of blindness in the world. In 1996 it was estimated that by the year 2000, there would be 66.8 million with glaucoma worldwide, with 6.7 million bilaterally blind from glaucoma [26]. The World Health Organisation [27] estimates that East Asia may contribute up to 50% of the glaucoma-blind in the world [28]. However, most of the people with glaucoma are unaware they have it. Fifty [28] to 90 % [29] remain undiagnosed. Nearly 3 million people have glaucoma in the United States (NHIS95), and 10 million people have high IOP that may lead to glaucoma in the US (Research to Prevent Blindness, NISE, NSF). It is estimated that approx.1 % of the people over 40 yr. of age have primary open angle glaucoma in the UK [30]. About 100,000 people are diagnosed for glaucoma in Sweden but approximately same amount might still be unknown of there disease [31].
Introduction
22
4.5 Measurement of intraocular pressure Even if elevated IOP is no longer considered a criterion for the glaucoma diagnosis, it is still closely related to the disease and important for classification, management and follow-up. Direct measurement of the IOP requires an invasive operation, and therefore indirect methods are usually used in the clinic.
The indirect methods can be divided into contact tonometry and non-contact tonometry, with subgroups of stationary methods based on a biomicroscope or hand-held methods. In addition, an interest for self-tonometry has recently been raised.
The current standard method to measure IOP is to use some kind of applanation tonometry method. Applanation refers to flattening a portion of a sphere. The applanation principle states that when a flat surface is pressed against a fluid-filled sphere with a flexible membrane, the internal pressure may be measured by the force exerted on the contact of area. For IOP measurement the applanation principle is generally described through the Imbert-Fick law [2, 32, 33] by FC and A (Eq. 1).
4.5.1 Contact tonometry Goldmann applanation tonometry (GAT) was introduced in 1954 [2], and is often regarded as the most accurate method [34]. It is still used as the golden standard and reference method in the International Standard Organisation (ISO) standard [35]. The method is based on the Imbert-Fick law (Eq. 1) using the applanation principle. Imbert Fick’s law is valid under ideal conditions which include an infinitely thin cornea and a dry surface with perfect elasticity. The human cornea does not meet those conditions. The cornea is a complex biomechanical system that introduces several errors into the measurement process. Goldmann recognized the rigidity of the cornea (FRigidity) and the influence of the tear fluid (FSurface tension). These variables were added into Imbert-Fick’s law (Eq. 2) [2].
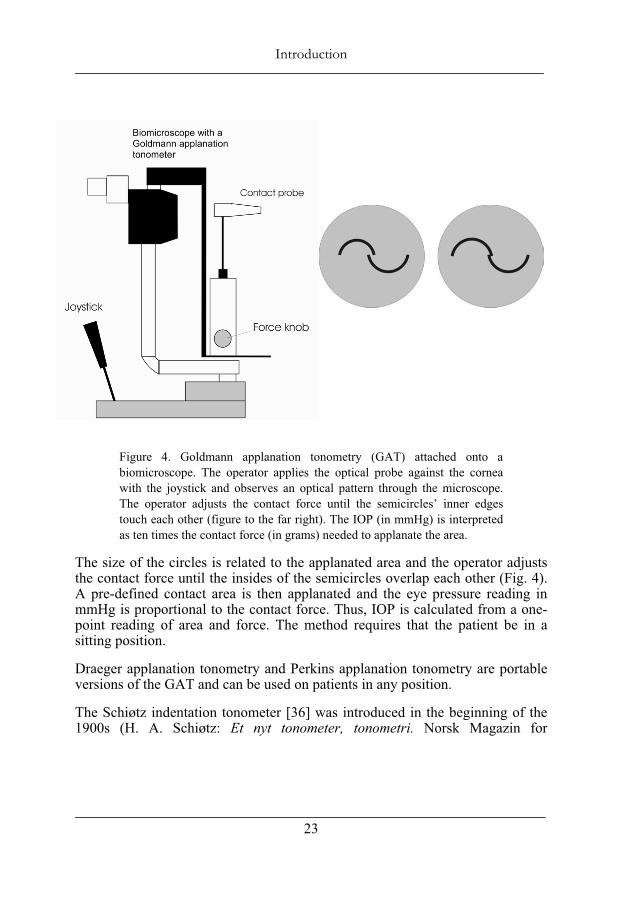
The effects of the FRigidity and the FSurface tension counteract each other, and Goldmann found that they were balanced (on normal eyes) within an interval of contact diameter between 2.5 and 4.0 mm [2]. Goldmann chose to use a predefined contact diameter of 3.06 mm which corresponds to an area of 7.35 mm2, where ten times the contact force in grams was interpreted as the IOP in mmHg. The device is mounted on a biomicroscope equipped with a slit lamp. An anaesthetic drop combined with a fluorescein dye is placed in the eye and an optical prism is gently brought in contact with the cornea (Fig. 4). The operator observes two green semicircles through the optical prism using a biomicroscope (Fig. 4).
••
Introduction
23
Figure 4. Goldmann applanation tonometry (GAT) attached onto a biomicroscope. The operator applies the optical probe against the cornea with the joystick and observes an optical pattern through the microscope. The operator adjusts the contact force until the semicircles’ inner edges touch each other (figure to the far right). The IOP (in mmHg) is interpreted as ten times the contact force (in grams) needed to applanate the area.
The size of the circles is related to the applanated area and the operator adjusts the contact force until the insides of the semicircles overlap each other (Fig. 4). A pre-defined contact area is then applanated and the eye pressure reading in mmHg is proportional to the contact force. Thus, IOP is calculated from a one-point reading of area and force. The method requires that the patient be in a sitting position.
Draeger applanation tonometry and Perkins applanation tonometry are portable versions of the GAT and can be used on patients in any position.
The Schiøtz indentation tonometer [36] was introduced in the beginning of the 1900s (H. A. Schiøtz: Et nyt tonometer, tonometri. Norsk Magazin for
Introduction
24
Lægevidenskaben, Kristiania, 1905)1. The tonometer uses a plunger with a constant contact force and measures the indentation depth. The indentation will be dependent upon the IOP and the distensibility of the ocular walls. The plunger is connected to a lever arm with a scale. A footplate is rested on the cornea and the plunger is free to indent the cornea. A variety of weights may be used to minimize errors due to corneal rigidity. Normal weights used in Schiøtz tonometry are 5.5, 7.5 or 10 g.
Mackay-Marg tonometry was introduced in 1959 [37], and consists of a plunger ( = 1.5 mm) [38], with a coplanar guard ring. Movement of the plunger is monitored by a differential transducer and recorded. The guard ring applanates the cornea with a diameter of approximately 3 mm, which imply a displacement of the plunger. The plunger is driven back to its initial coplanar position and the restoring force is assumed to be related to the IOP [39]. The tonometry may be performed with the patient in any position.
The Tono-pen is a microprocessor-controlled, hand-held tonometer and was introduced in 1987 [40]. Tono-pen uses similar principles as the Mackay-Marg tonometer with a plunger ( = 1.02 mm) and an outer guard ring ( = 3.22 mm). Tono-pen calculates an average IOP after four to ten acceptable measurements. The final IOP and a standard deviation of the measured values are displayed in a quartz crystal display. The Tono-Pen XL, using a slightly larger plunger ( = 1.5 mm), gives two measures within each contact. When completing 4 measurements it gives out a different audible signal, and the display shows the mean pressure and the SD in percentage. If the SD is lower than 10 % of the mean, the measurements are considered reliable.
The Pneumatonometer was introduced in 1979 [41]. It is similar to the Mackay-Marg tonometer in some aspects, but its sensor is air pressured. The sensor probe consists of a thin rubber membrane which is pressurised by gas. When the membrane is applied to the cornea it is applanated automatically [39]. A constant gas flow is supplied from a jet tube located at the centre of the probe, and the gas leaks through the gap between the tip of the jet tube and the thin membrane. The membrane remains at a position where pneumatic force exerted on the membrane is balanced by the IOP. The method allows continuous IOP monitoring.
The Dynamic Contour Tonometer (DCT) was introduced in 2002 [42] and uses a direct trans-corneal method to measure the IOP. It is a slitlamp mounted device, similar to the GAT, with a concave sensor tip with a radius of 10.5 mm. When the tip is placed on the eye, the cornea takes the contour of the tip. Thereis a miniaturized, 1.7-mm diameter piezoresistive pressure sensor in the centre
1 www.tidsskriftet.no/pls/lts/PA_LT.VisSeksjon?vp_SEKS_ID=263673
••
Introduction
25
of the probe [43]. Pressure readings are sampled and digitized at 100 Hz. Data is transferred to a microprocessor-based control unit, which computes and displays the measured pressure.
The ICare tonometer was introduced in 1997 and consists of a pair of coils coaxial with the probe shaft, a solenoid coil, and a sensing coil [44]. A lightweight probe is propelled towards the cornea by the solenoid, and the movement is monitored by the sensing coil. The probe consist of a steel wire shaft with a round plastic tip, Ø = 1.7 mm. The speed immediately before impact, the deceleration during impact, and the ratio of these parameters, are correlated to the IOP. The method does not need any anaesthetics.
The Smartlens was introduced in 1999 [45]. The device has a concave surface with a radius of 11 mm covered with a Mylar membrane. In the centre of the probe is a flat applanation surface with a diameter of 2.5 mm. The membrane is filled with silicon oil, and through a canal, the oil is in contact with a piezo-electric pressure-sensing element.
Halberg tonometry was introduced in 1968 [46]. It is a gravity activated optical direct reading of Maklakoff type [47].The tonometer uses a principle which is similar to Goldmann applanation [39], but instead of adjusting the contact force until the pre-defined contact area is reached, the method uses a constant force. The contact area will be dependent upon the IOP and is read optically.
4.5.2 Non-contact tonometry Non-contact applanation tonometers were introduced in 1974 by Forbes [48]. The non-contact tonometry method also uses the applanation principle to estimate the IOP. The applanation is achived by an air jet or an air puff.
Introduction
26
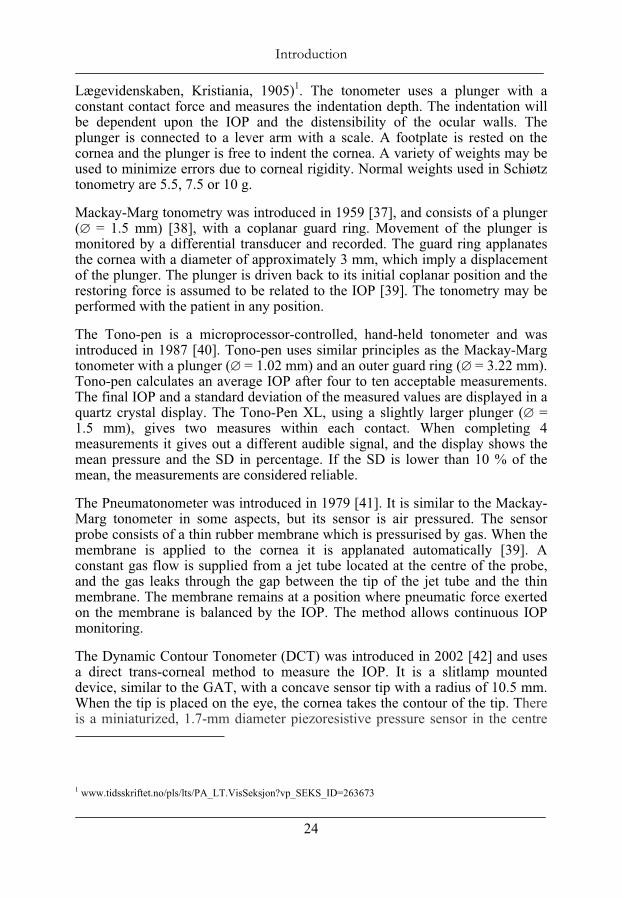
Figure 5. The cornea is applanated with a puff of air. A light system with a light source and a photocell uses the cornea as a mirror and detect a maximum of reflected light when the appropriate area is applanated.
A light system with a light source and a photoelectric cell (Fig. 5) indicate when the appropriate applanated area is reached. The non-contact tonometer measures the time it takes from the initial generation of the puff of air to when the cornea is exactly flattened (in milliseconds) to the point where the timing device stops. It takes less time for the puff of air to flatten a soft eye than it does a hard eye. The method does not transmit infectious diseases, and it is not necessary to use anaesthetic or staining eye drops.
4.5.3 Self tonometry The interest for self tonometry has increased lately. Ocuton S, Proview, and Digital eyelid tonometer are three methods recently presented.
The function of Ocuton S is based on Goldmann’s principle of applanation. The instrument was introduced in 1999 [49] and is equipped with a multifunctional microprocessor capable of calculating IOP instantaneously. After instillation of a drop of local anaesthetic the Ocuton S tonometer is positioned at a fixed distance of 10 mm from the corneal apex of the eye to be measured. Once aligned with the centre of the cornea with the aid of an internal luminous viewfinder, the measurement prism emerges automatically from the instrument until contact with the corneal surface for 2 seconds. The IOP is automatically estimated after the 2-sec. contact.
Proview measures the IOP through the eyelid by pressing a spring-based plunger against the eye. The sensor-pressure against the eyelid is slowly increased until a
••
Introduction
27
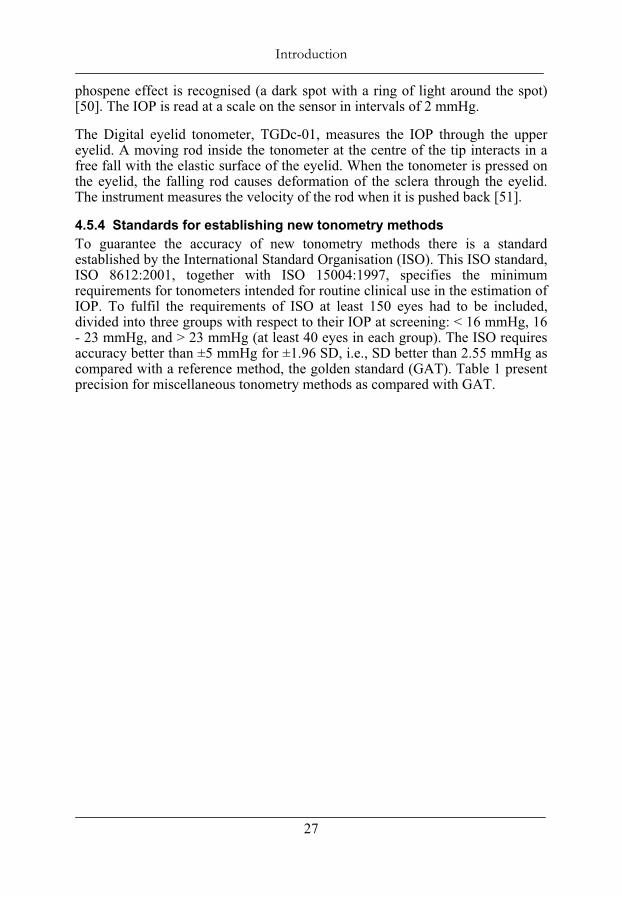
phospene effect is recognised (a dark spot with a ring of light around the spot) [50]. The IOP is read at a scale on the sensor in intervals of 2 mmHg.
The Digital eyelid tonometer, TGDc-01, measures the IOP through the upper eyelid. A moving rod inside the tonometer at the centre of the tip interacts in a free fall with the elastic surface of the eyelid. When the tonometer is pressed on the eyelid, the falling rod causes deformation of the sclera through the eyelid. The instrument measures the velocity of the rod when it is pushed back [51].
4.5.4 Standards for establishing new tonometry methods To guarantee the accuracy of new tonometry methods there is a standard established by the International Standard Organisation (ISO). This ISO standard, ISO 8612:2001, together with ISO 15004:1997, specifies the minimum requirements for tonometers intended for routine clinical use in the estimation of IOP. To fulfil the requirements of ISO at least 150 eyes had to be included, divided into three groups with respect to their IOP at screening: < 16 mmHg, 16 - 23 mmHg, and > 23 mmHg (at least 40 eyes in each group). The ISO requires accuracy better than ±5 mmHg for ±1.96 SD, i.e., SD better than 2.55 mmHg as compared with a reference method, the golden standard (GAT). Table 1 present precision for miscellaneous tonometry methods as compared with GAT.
Introduction
28
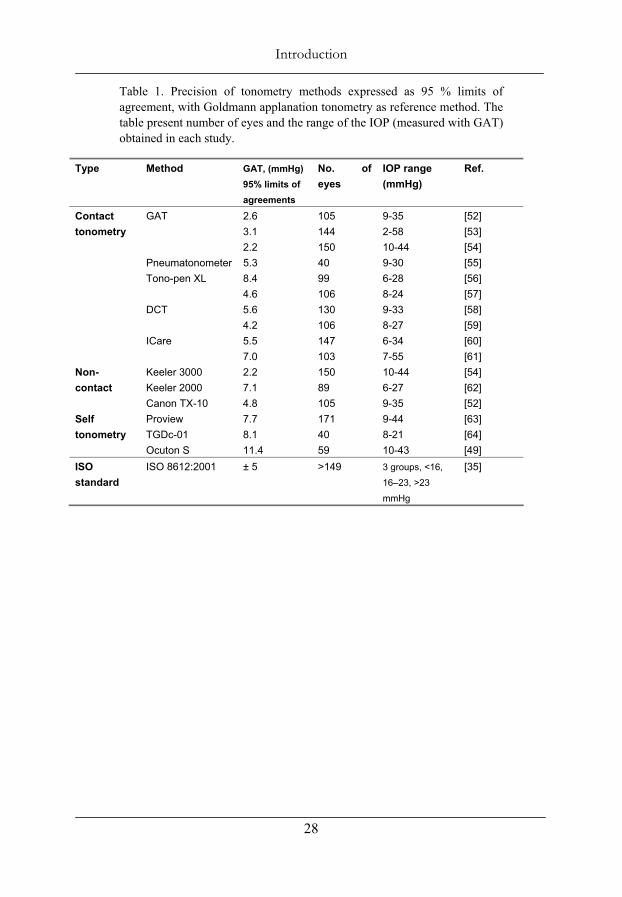
Table 1. Precision of tonometry methods expressed as 95 % limits of agreement, with Goldmann applanation tonometry as reference method. The table present number of eyes and the range of the IOP (measured with GAT) obtained in each study.
Type Method GAT, (mmHg) 95% limits of agreements
No. of eyes
IOP range(mmHg)
Ref.
GAT 2.6 3.12.2
105144150
9-352-5810-44
[52][53][54]
Pneumatonometer 5.3 40 9-30 [55] Tono-pen XL 8.4
4.699106
6-288-24
[56][57]
DCT 5.6 4.2
130106
9-338-27
[58][59]
Contact tonometry
ICare 5.5 7.0
147103
6-347-55
[60][61]
Keeler 3000 Keeler 2000
2.27.1
15089
10-44 6-27
[54][62]
Non-contact
Canon TX-10 4.8 105 9-35 [52]Proview 7.7 171 9-44 [63] TGDc-01 8.1 40 8-21 [64]
Selftonometry
Ocuton S 11.4 59 10-43 [49] ISOstandard
ISO 8612:2001 ± 5 >149 3 groups, <16,
16–23, >23
mmHg
[35]
••
Introduction
29
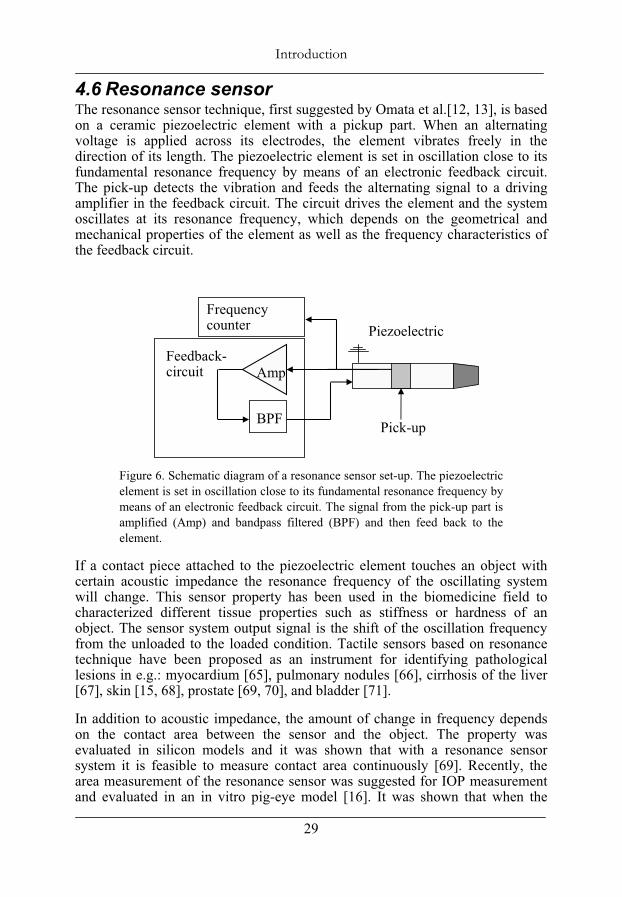
4.6 Resonance sensor The resonance sensor technique, first suggested by Omata et al.[12, 13], is based on a ceramic piezoelectric element with a pickup part. When an alternating voltage is applied across its electrodes, the element vibrates freely in the direction of its length. The piezoelectric element is set in oscillation close to its fundamental resonance frequency by means of an electronic feedback circuit. The pick-up detects the vibration and feeds the alternating signal to a driving amplifier in the feedback circuit. The circuit drives the element and the system oscillates at its resonance frequency, which depends on the geometrical and mechanical properties of the element as well as the frequency characteristics of the feedback circuit.
Figure 6. Schematic diagram of a resonance sensor set-up. The piezoelectric element is set in oscillation close to its fundamental resonance frequency by means of an electronic feedback circuit. The signal from the pick-up part is amplified (Amp) and bandpass filtered (BPF) and then feed back to the element.
If a contact piece attached to the piezoelectric element touches an object with certain acoustic impedance the resonance frequency of the oscillating system will change. This sensor property has been used in the biomedicine field to characterized different tissue properties such as stiffness or hardness of an object. The sensor system output signal is the shift of the oscillation frequency from the unloaded to the loaded condition. Tactile sensors based on resonance technique have been proposed as an instrument for identifying pathological lesions in e.g.: myocardium [65], pulmonary nodules [66], cirrhosis of the liver [67], skin [15, 68], prostate [69, 70], and bladder [71].
In addition to acoustic impedance, the amount of change in frequency depends on the contact area between the sensor and the object. The property was evaluated in silicon models and it was shown that with a resonance sensor system it is feasible to measure contact area continuously [69]. Recently, the area measurement of the resonance sensor was suggested for IOP measurement and evaluated in an in vitro pig-eye model [16]. It was shown that when the
Feedback-circuit Amp
BPF
Frequencycounter Piezoelectric
Pick-up
Introduction
30
sensor was applied against the cornea, the frequency shift was proportional to the contact area. By using a constant force and measure frequency shift, i.e. contact area, the IOP can be calculated according to Eq. 1. The study [16] demonstrated that the resonator sensor principle can be used to measure IOP in a physical model. As with GAT, the calculation of IOP was based on a one-point reading of area and force. That study [16], as well as a later study [17] showed an IOP-measurement variation related to differences between eyes. In the latter study, normalization of frequency shift was shown to reduce the between-eye variability, and a further development toward a method that incorporates some type of self-calibration, similar to the normalization, was suggested.
••
Introduction
31
4.7 Aims of the study The general aim of this dissertation was to further develop and evaluate applanation resonance tonometry (ART), into a clinically useful method for measurement of intraocular pressure (IOP).
This dissertation had the following specific aims:
To develop a new applanation method for intraocular pressure measurement that used combined continuous force and area measurement.
To evaluate ART based on the multipoint method in an in vitro porcine-eye model.
To investigate the ability of the ART-system, based on the novel multipoint method, to measure IOP in humans.
To evaluate if a new, more symmetric sensor with a larger sensor tip and an improved alignment light, could reduce the position dependency of ART in an in vitro model simulating a clinical setting.
To evaluate the precision of the new ART in a clinical study designed in accordance with the International Standard Organisation (ISO) requirements.
To evaluate biomechanical effects of photorefractive keratectomy (PRK) treatment and the resulting estimation errors on IOP measurements in an in vitro porcine-eye set-up.

Introduction
32
••
Methods
33
5 Methods
5.1 Applanation resonance tonometry The development of the new ART probe was based on continuous and simultaneous sampling of both contact area and contact force.
The area-measuring device consisted of a piezoelectric element made of Lead Zirconate Titanate (PZT) with a pick-up part. A feedback circuit processed the signal from the pick-up and powered the PZT element in order to sustain the oscillations at resonance frequency. A convex contact piece was glued onto one end of the PZT element. The resonance frequency depends on the geometry, the material properties of the PZT element and contact piece, the suspension of the element, and the frequency characteristics of the feedback circuit [69]. Imbert-Fick’s law (Eq. 1) requires information of both the contact area and the contact force to determine the IOP. Thus, a force transducer was attached to the PZT element and they were mounted into a sensor module.
When the sensor is brought in contact with the cornea, the acoustic impedance of the cornea will mechanically load the sensor and a new oscillating system is formed with a new resonance frequency. Since the degree of load on the resonance system depends on the contact area, the resonance frequency of the system is related to the contact area between the sensor and the cornea [16]. Earlier reports on similar resonator probes have shown that the frequency shift has a linear relationship with the area of contact [16, 69].
In designing a model for the current ART probe we therefore assumed that frequency, f, changes proportionally to contact area, A:
01 ( )ART
A f fC
(6)
with f0 as the resonance frequency of the unloaded sensor and CART being a sensor-specific proportionality constant. Eq. 1 and 6 give:
01
CART
F f f IOPC
(7)
Differentiation leads to:
CART
dFIOP Cdf
(8)
Methods
34
This was the basis for our model. To handle offset forces not related to IOP, a constant term was added to the model. The final model is described with general coefficients i:
1 0CdFIOP
df (9)
5.2 Resonance probes Two different ART devices, Probe 1, and then, Probe 2, were developed and evaluated in the work of this dissertation. Probe 1 was evaluated in Papers I-II and used in Paper V, Probe 2 was evaluated in Papers III and IV.
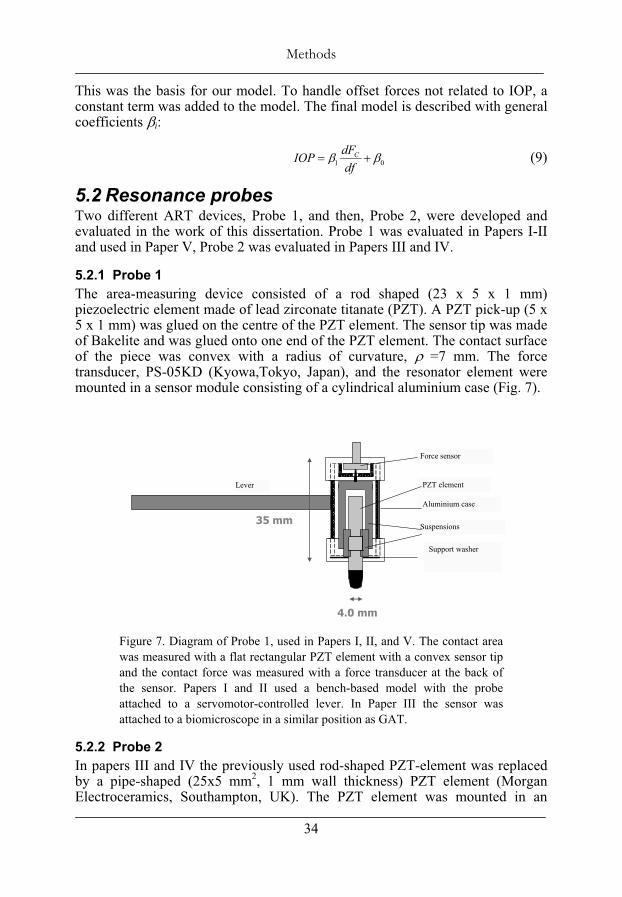
5.2.1 Probe 1 The area-measuring device consisted of a rod shaped (23 x 5 x 1 mm) piezoelectric element made of lead zirconate titanate (PZT). A PZT pick-up (5 x 5 x 1 mm) was glued on the centre of the PZT element. The sensor tip was made of Bakelite and was glued onto one end of the PZT element. The contact surface of the piece was convex with a radius of curvature, =7 mm. The force transducer, PS-05KD (Kyowa,Tokyo, Japan), and the resonator element were mounted in a sensor module consisting of a cylindrical aluminium case (Fig. 7).
Figure 7. Diagram of Probe 1, used in Papers I, II, and V. The contact area was measured with a flat rectangular PZT element with a convex sensor tip and the contact force was measured with a force transducer at the back of the sensor. Papers I and II used a bench-based model with the probe attached to a servomotor-controlled lever. In Paper III the sensor was attached to a biomicroscope in a similar position as GAT.
5.2.2 Probe 2 In papers III and IV the previously used rod-shaped PZT-element was replaced by a pipe-shaped (25x5 mm2, 1 mm wall thickness) PZT element (Morgan Electroceramics, Southampton, UK). The PZT element was mounted in an
Support washer
35 mm
4.0 mm
PZT element
Force sensor
Suspensions
Aluminium case
Lever
••
Methods
35
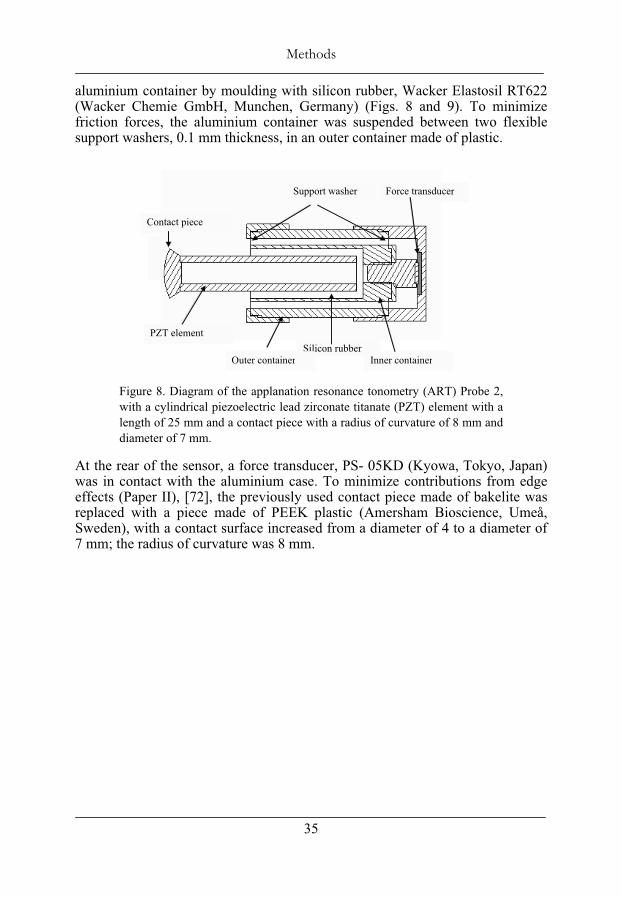
aluminium container by moulding with silicon rubber, Wacker Elastosil RT622 (Wacker Chemie GmbH, Munchen, Germany) (Figs. 8 and 9). To minimize friction forces, the aluminium container was suspended between two flexible support washers, 0.1 mm thickness, in an outer container made of plastic.
Figure 8. Diagram of the applanation resonance tonometry (ART) Probe 2, with a cylindrical piezoelectric lead zirconate titanate (PZT) element with a length of 25 mm and a contact piece with a radius of curvature of 8 mm and diameter of 7 mm.
At the rear of the sensor, a force transducer, PS- 05KD (Kyowa, Tokyo, Japan) was in contact with the aluminium case. To minimize contributions from edge effects (Paper II), [72], the previously used contact piece made of bakelite was replaced with a piece made of PEEK plastic (Amersham Bioscience, Umeå, Sweden), with a contact surface increased from a diameter of 4 to a diameter of 7 mm; the radius of curvature was 8 mm.
Silicon rubberOuter container Inner container
PZT element
Support washer Force transducer
Contact piece
Methods
36
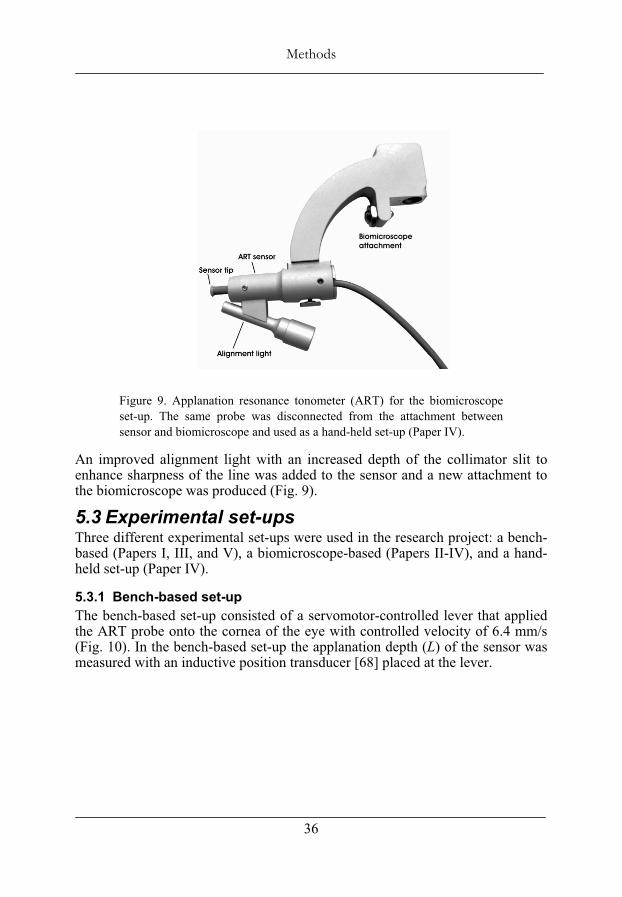
Figure 9. Applanation resonance tonometer (ART) for the biomicroscope set-up. The same probe was disconnected from the attachment between sensor and biomicroscope and used as a hand-held set-up (Paper IV).
An improved alignment light with an increased depth of the collimator slit to enhance sharpness of the line was added to the sensor and a new attachment to the biomicroscope was produced (Fig. 9).
5.3 Experimental set-ups Three different experimental set-ups were used in the research project: a bench-based (Papers I, III, and V), a biomicroscope-based (Papers II-IV), and a hand-held set-up (Paper IV).
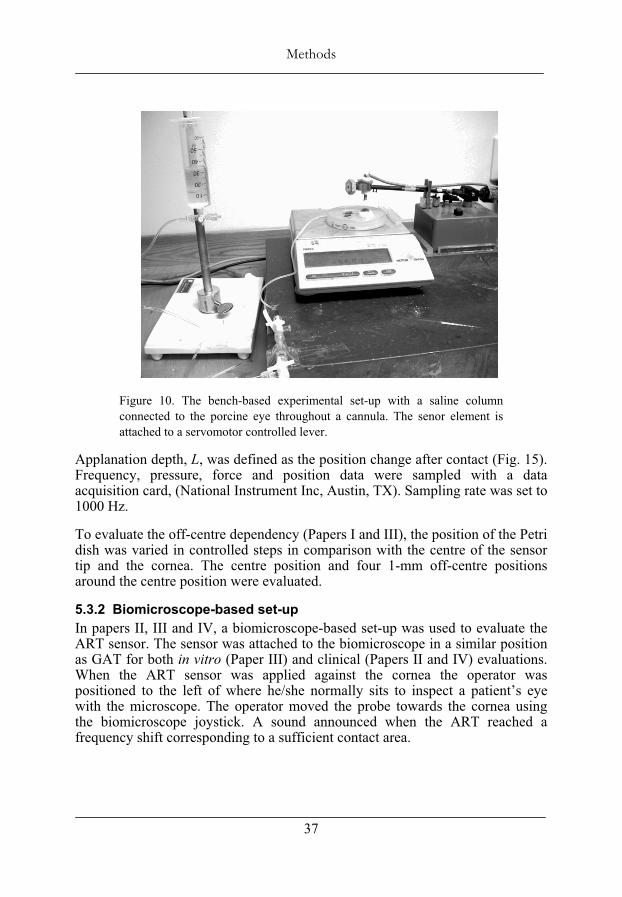
5.3.1 Bench-based set-up The bench-based set-up consisted of a servomotor-controlled lever that applied the ART probe onto the cornea of the eye with controlled velocity of 6.4 mm/s (Fig. 10). In the bench-based set-up the applanation depth (L) of the sensor was measured with an inductive position transducer [68] placed at the lever.
••
Methods
37
Figure 10. The bench-based experimental set-up with a saline column connected to the porcine eye throughout a cannula. The senor element is attached to a servomotor controlled lever.
Applanation depth, L, was defined as the position change after contact (Fig. 15). Frequency, pressure, force and position data were sampled with a data acquisition card, (National Instrument Inc, Austin, TX). Sampling rate was set to 1000 Hz.
To evaluate the off-centre dependency (Papers I and III), the position of the Petri dish was varied in controlled steps in comparison with the centre of the sensor tip and the cornea. The centre position and four 1-mm off-centre positions around the centre position were evaluated.
5.3.2 Biomicroscope-based set-up In papers II, III and IV, a biomicroscope-based set-up was used to evaluate the ART sensor. The sensor was attached to the biomicroscope in a similar position as GAT for both in vitro (Paper III) and clinical (Papers II and IV) evaluations. When the ART sensor was applied against the cornea the operator was positioned to the left of where he/she normally sits to inspect a patient’s eye with the microscope. The operator moved the probe towards the cornea using the biomicroscope joystick. A sound announced when the ART reached a frequency shift corresponding to a sufficient contact area.
Methods
38
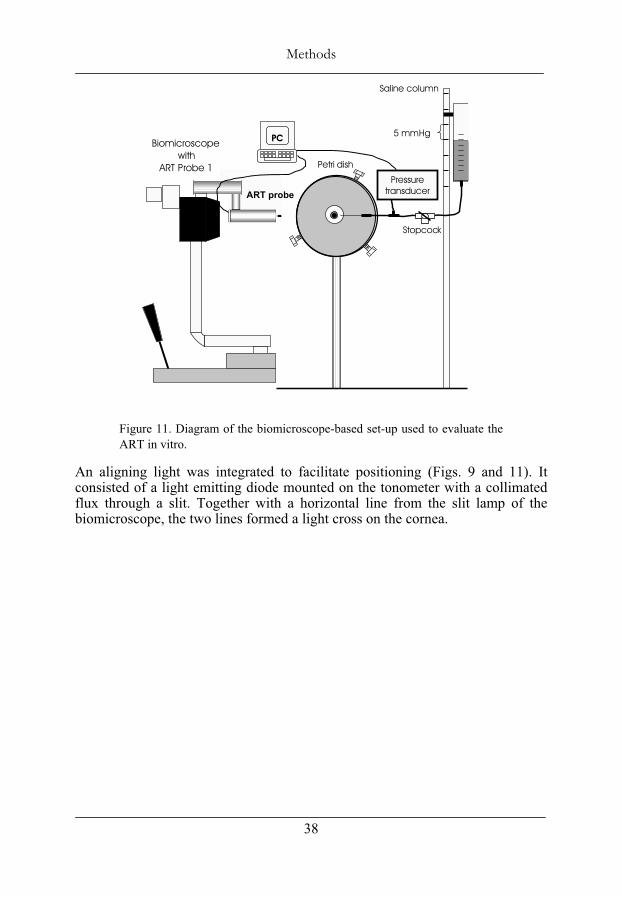
Figure 11. Diagram of the biomicroscope-based set-up used to evaluate the ART in vitro.
An aligning light was integrated to facilitate positioning (Figs. 9 and 11). It consisted of a light emitting diode mounted on the tonometer with a collimated flux through a slit. Together with a horizontal line from the slit lamp of the biomicroscope, the two lines formed a light cross on the cornea.
Saline column
Petri dish
Stopcock
PC 5 mmHgBiomicroscope
withART Probe 1
Pressure transducer ART probe
••
Methods
39
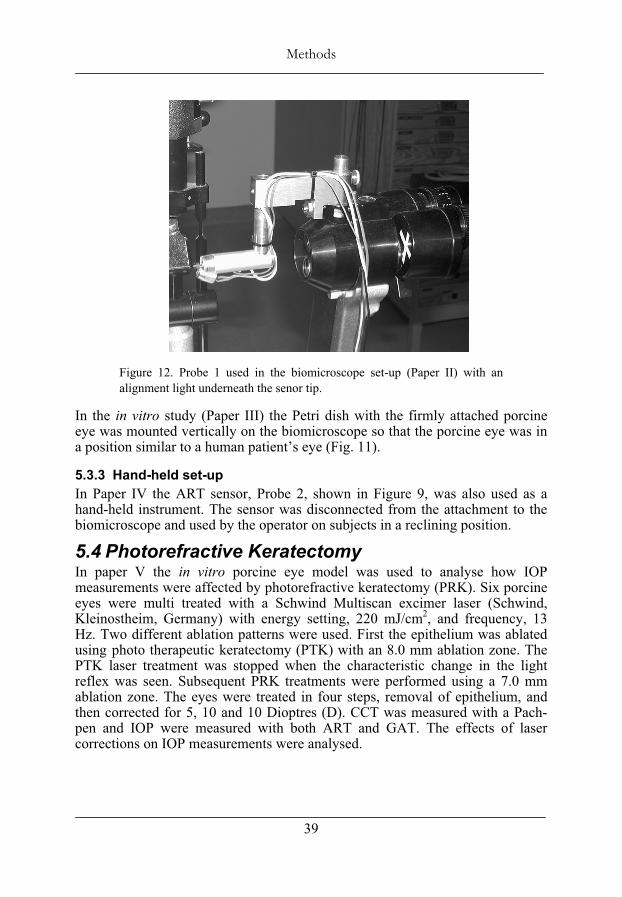
Figure 12. Probe 1 used in the biomicroscope set-up (Paper II) with an alignment light underneath the senor tip.
In the in vitro study (Paper III) the Petri dish with the firmly attached porcine eye was mounted vertically on the biomicroscope so that the porcine eye was in a position similar to a human patient’s eye (Fig. 11).
5.3.3 Hand-held set-up In Paper IV the ART sensor, Probe 2, shown in Figure 9, was also used as a hand-held instrument. The sensor was disconnected from the attachment to the biomicroscope and used by the operator on subjects in a reclining position.
5.4 Photorefractive Keratectomy In paper V the in vitro porcine eye model was used to analyse how IOP measurements were affected by photorefractive keratectomy (PRK). Six porcine eyes were multi treated with a Schwind Multiscan excimer laser (Schwind, Kleinostheim, Germany) with energy setting, 220 mJ/cm2, and frequency, 13 Hz. Two different ablation patterns were used. First the epithelium was ablated using photo therapeutic keratectomy (PTK) with an 8.0 mm ablation zone. The PTK laser treatment was stopped when the characteristic change in the light reflex was seen. Subsequent PRK treatments were performed using a 7.0 mm ablation zone. The eyes were treated in four steps, removal of epithelium, and then corrected for 5, 10 and 10 Dioptres (D). CCT was measured with a Pach-pen and IOP were measured with both ART and GAT. The effects of laser corrections on IOP measurements were analysed.
Methods
40
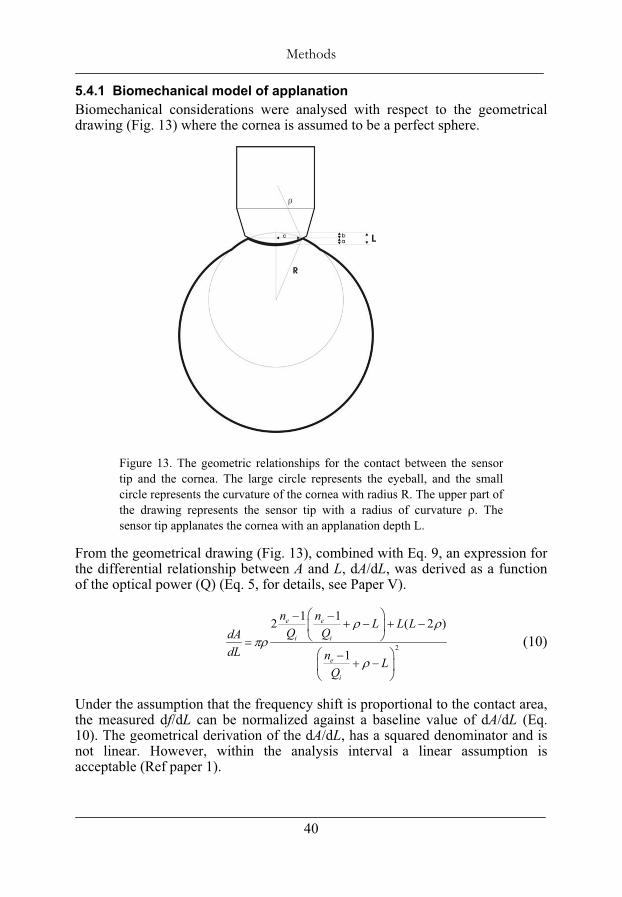
5.4.1 Biomechanical model of applanation Biomechanical considerations were analysed with respect to the geometrical drawing (Fig. 13) where the cornea is assumed to be a perfect sphere.
Figure 13. The geometric relationships for the contact between the sensor tip and the cornea. The large circle represents the eyeball, and the small circle represents the curvature of the cornea with radius R. The upper part of the drawing represents the sensor tip with a radius of curvature . The sensor tip applanates the cornea with an applanation depth L.
From the geometrical drawing (Fig. 13), combined with Eq. 9, an expression for the differential relationship between A and L, dA/dL, was derived as a function of the optical power (Q) (Eq. 5, for details, see Paper V).
2
1 12 ( 2 )
1
e e
i i
e
i
n n L L LQ QdA
dL n LQ
(10)
Under the assumption that the frequency shift is proportional to the contact area, the measured df/dL can be normalized against a baseline value of dA/dL (Eq. 10). The geometrical derivation of the dA/dL, has a squared denominator and is not linear. However, within the analysis interval a linear assumption is acceptable (Ref paper 1).
••
Methods
41
5.5 Statistic methods Values are expressed as mean ± standard deviation (SD). The Kolmogorov-Smirnov statistical test was used to test the hypothesis that the data were normally distributed. One way ANOVA procedure with Bonferroni Post Hoc test was used to test for differences between groups. A General linear model (GLM) was used to analyse differences and variance dependency between GATand ART. Pearson’s correlation coefficient was used for correlation analysis. P < 0.05 was considered statistically significant.

Methods
42
••
Materials
43
6 Materials
This dissertation includes three in vitro studies, Papers I, III and V, and two clinical studies, Papers II and IV.
6.1 In vitro materials The three in vitro studies, Papers I, III and V, were performed on cadaver eyes from approximately 6-month-old Landrace pigs, enucleated immediately after the pigs had been put to death at the abattoir (Swedish Meat, Skellefteå or Ullånger, Sweden). The eyes were kept in saline and measurements were performed within 12 hours (16 h in Paper V) after enucleation [3]. Seven eyes were used in Paper I and III. Six out of them, were used for evaluation of the sensor’s capability to measure IOP. One eye was used for evaluation of off-centre positioning dependence of the sensor. In Paper V six eyes were used to evaluate the effects of PRK treatments.
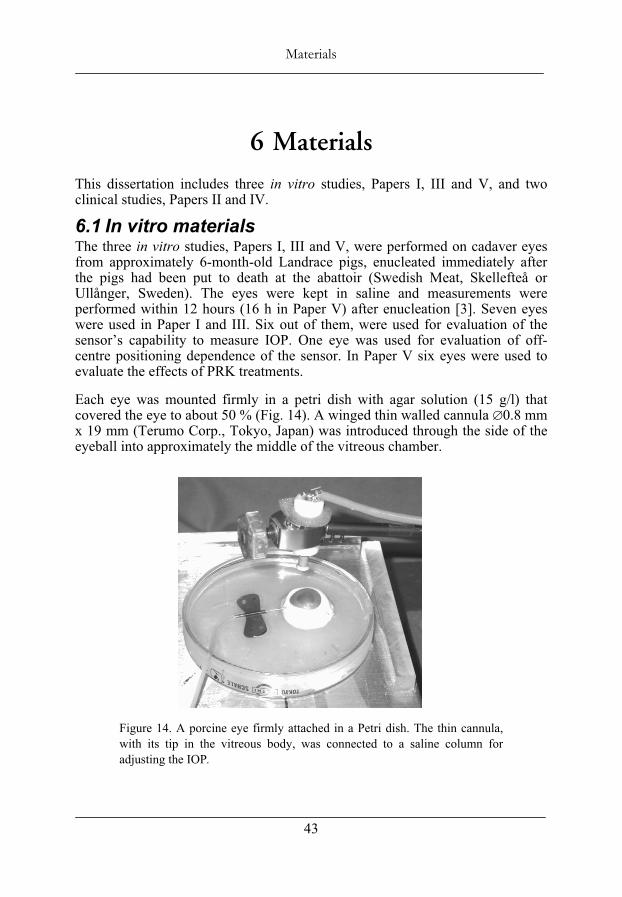
Each eye was mounted firmly in a petri dish with agar solution (15 g/l) that covered the eye to about 50 % (Fig. 14). A winged thin walled cannula 0.8 mm x 19 mm (Terumo Corp., Tokyo, Japan) was introduced through the side of the eyeball into approximately the middle of the vitreous chamber.
Figure 14. A porcine eye firmly attached in a Petri dish. The thin cannula, with its tip in the vitreous body, was connected to a saline column for adjusting the IOP.
Materials
44
The interface between the cannula and the tissue was sealed with cyanoacrylate adhesive True Bond (Pro-Gruppen AB, Stockholm, Sweden) to avoid leakage [73]. The cannula was connected to a saline column consisting of PVC tubing, a three-way stopcock, and at the distal end a partially saline-filled syringe opens to air. The syringe was movable and mounted on a stable stand. The eye was pressurised for 10 seconds by opening it to the saline column. The pressure level was calculated from the measured height of the saline column. Just before measurement the stopcock was closed to create a closed system that approximated the normal state of the eye [73]. In Papers I and III there was a standard pressure transducer (ICP pressure monitor kit, Becton Dickenson, NJ, USA) connected to the stopcock allowing monitoring of the pressure in the vitreous chamber (IOPVC) during applanation. To avoid drying of the cornea, the eye was moistened before every pressurization with room-temperature saline. To simulate blinking the saline was applied onto the eye with one sweep of a very soft goat-hair brush, Kreatima 922 (Schormdanner Pinsel, Nürnberg, Germany).
6.2 Clinical materials Two groups of subjects were included in both studies of paper II and IV: healthy volunteers with normal IOP and patients with elevated IOP. All subjects were asked for medical history and underwent a pre-study ocular examination including refraction and determination of visual acuity, IOP, slit-lamp examination and ophthalmoscopy. The study protocol followed the tenets of the Declaration of Helsinki and was approved by the Ethics committee of the Medical Faculty of Umeå University. Informed consent was obtained from each individual.
In Paper II, 24 healthy volunteers (mean age = 43 yr.) and 24 subjects with ocular hypertension or open-angle glaucoma (mean age = 70 yr.) participated. A total of 104 IOP measurements were performed.
In Paper IV data were recorded from 154 eyes (90 female and 64 male with a mean age of 59 yr.) of 30 healthy volunteers and 46 patients. One eye was identified as an outlier and was excluded. Therefore, the analysis was based on 153 IOP measurements.
••
Results and Discussions
45
7 Results and Discussions
Previous studies, presented by Eklund et al., showed that the resonance technique can be used to determine the IOP in a constant force model [16, 17]. Using a constant force, the IOP was interpreted as proportional to the reciprocal frequency shift, a single point reading.
The present research project and dissertation started with a suggestion of the multipoint method. To evaluate the method we developed a model, two probe designs and we used three different experimental set-ups.
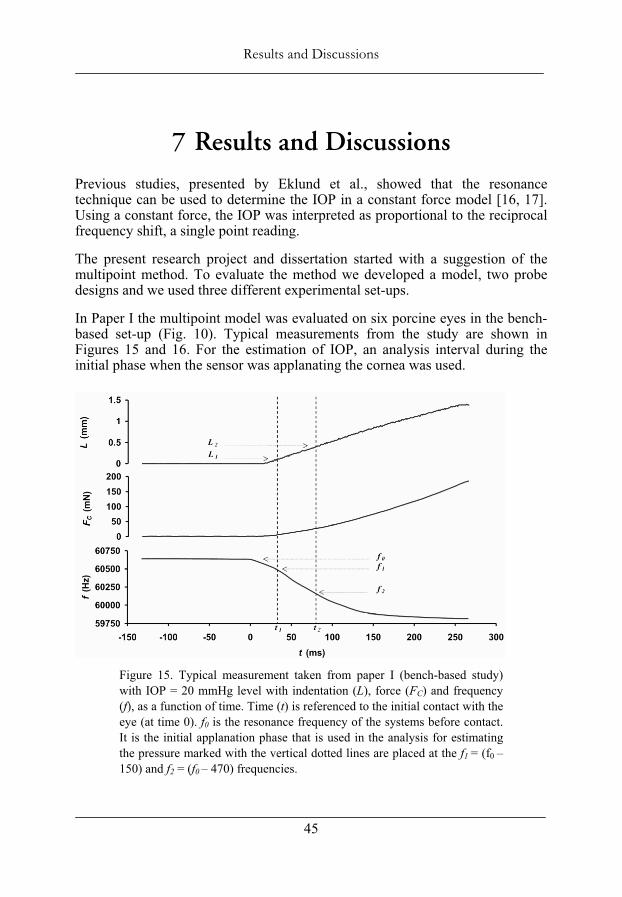
In Paper I the multipoint model was evaluated on six porcine eyes in the bench-based set-up (Fig. 10). Typical measurements from the study are shown in Figures 15 and 16. For the estimation of IOP, an analysis interval during the initial phase when the sensor was applanating the cornea was used.
Figure 15. Typical measurement taken from paper I (bench-based study) with IOP = 20 mmHg level with indentation (L), force (FC) and frequency (f), as a function of time. Time (t) is referenced to the initial contact with the eye (at time 0). f0 is the resonance frequency of the systems before contact. It is the initial applanation phase that is used in the analysis for estimating the pressure marked with the vertical dotted lines are placed at the f1 = (f0 –150) and f2 = (f0 – 470) frequencies.
Results and Discussions
46
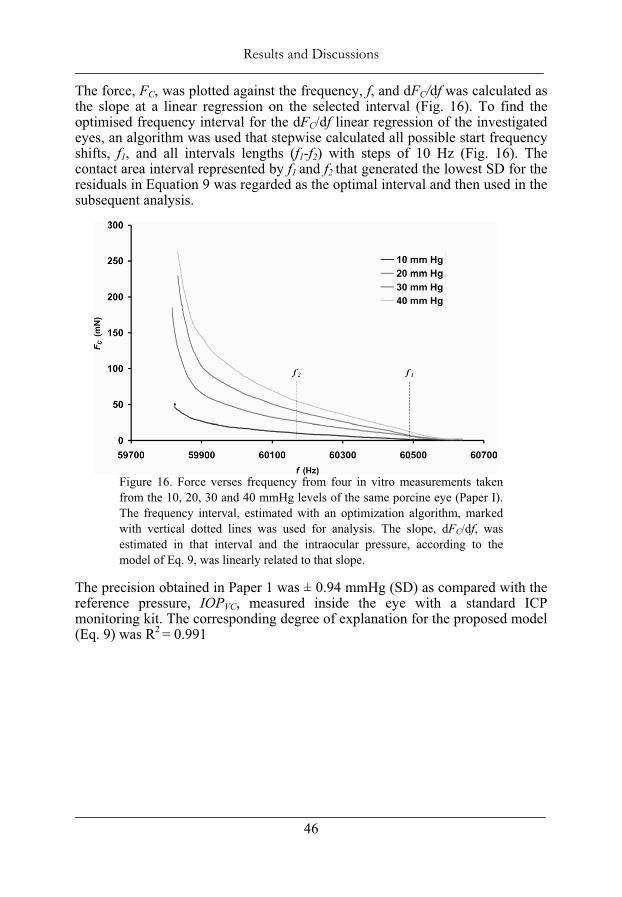
The force, FC, was plotted against the frequency, f, and dFC/df was calculated as the slope at a linear regression on the selected interval (Fig. 16). To find the optimised frequency interval for the dFC/df linear regression of the investigated eyes, an algorithm was used that stepwise calculated all possible start frequency shifts, f1, and all intervals lengths (f1-f2) with steps of 10 Hz (Fig. 16). The contact area interval represented by f1 and f2 that generated the lowest SD for the residuals in Equation 9 was regarded as the optimal interval and then used in the subsequent analysis.
Figure 16. Force verses frequency from four in vitro measurements taken from the 10, 20, 30 and 40 mmHg levels of the same porcine eye (Paper I). The frequency interval, estimated with an optimization algorithm, marked with vertical dotted lines was used for analysis. The slope, dFC/df, was estimated in that interval and the intraocular pressure, according to the model of Eq. 9, was linearly related to that slope.
The precision obtained in Paper 1 was ± 0.94 mmHg (SD) as compared with the reference pressure, IOPVC, measured inside the eye with a standard ICP monitoring kit. The corresponding degree of explanation for the proposed model (Eq. 9) was R2 = 0.991
••
Results and Discussions
47
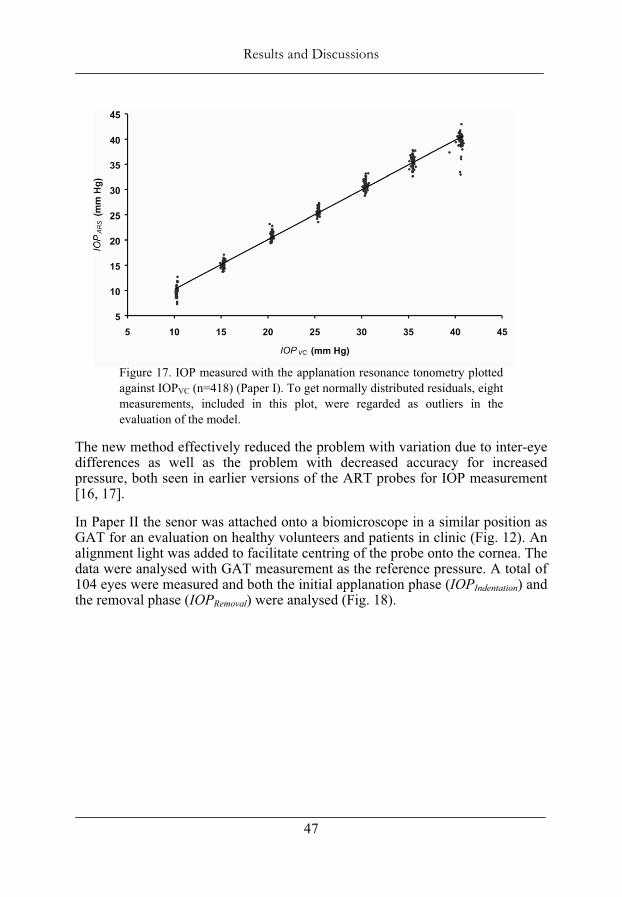
Figure 17. IOP measured with the applanation resonance tonometry plotted against IOPVC (n=418) (Paper I). To get normally distributed residuals, eight measurements, included in this plot, were regarded as outliers in the evaluation of the model.
The new method effectively reduced the problem with variation due to inter-eye differences as well as the problem with decreased accuracy for increased pressure, both seen in earlier versions of the ART probes for IOP measurement [16, 17].
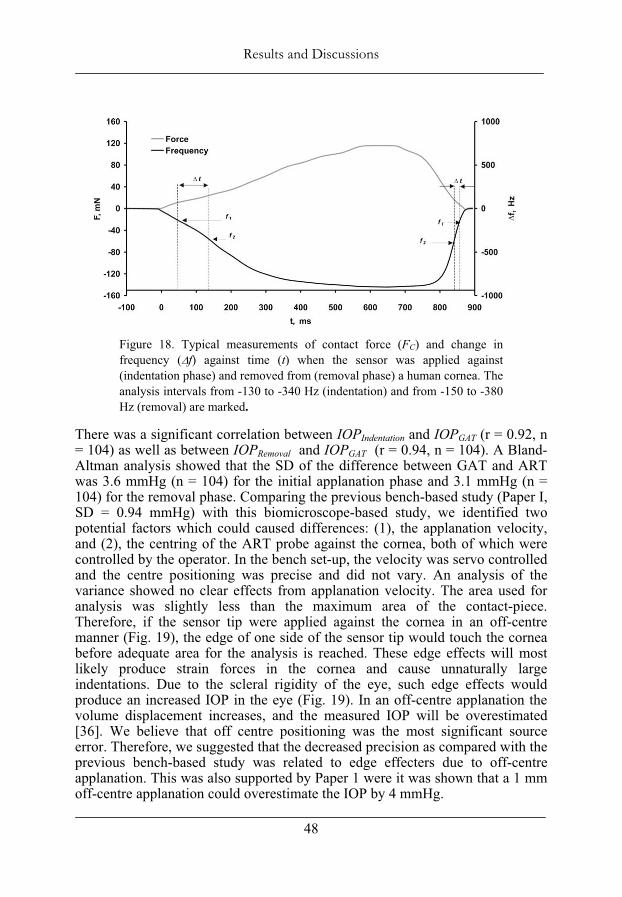
In Paper II the senor was attached onto a biomicroscope in a similar position as GAT for an evaluation on healthy volunteers and patients in clinic (Fig. 12). An alignment light was added to facilitate centring of the probe onto the cornea. The data were analysed with GAT measurement as the reference pressure. A total of 104 eyes were measured and both the initial applanation phase (IOPIndentation) and the removal phase (IOPRemoval) were analysed (Fig. 18).
Results and Discussions
48
Figure 18. Typical measurements of contact force (FC) and change in frequency ( f) against time (t) when the sensor was applied against (indentation phase) and removed from (removal phase) a human cornea. The analysis intervals from -130 to -340 Hz (indentation) and from -150 to -380 Hz (removal) are marked.
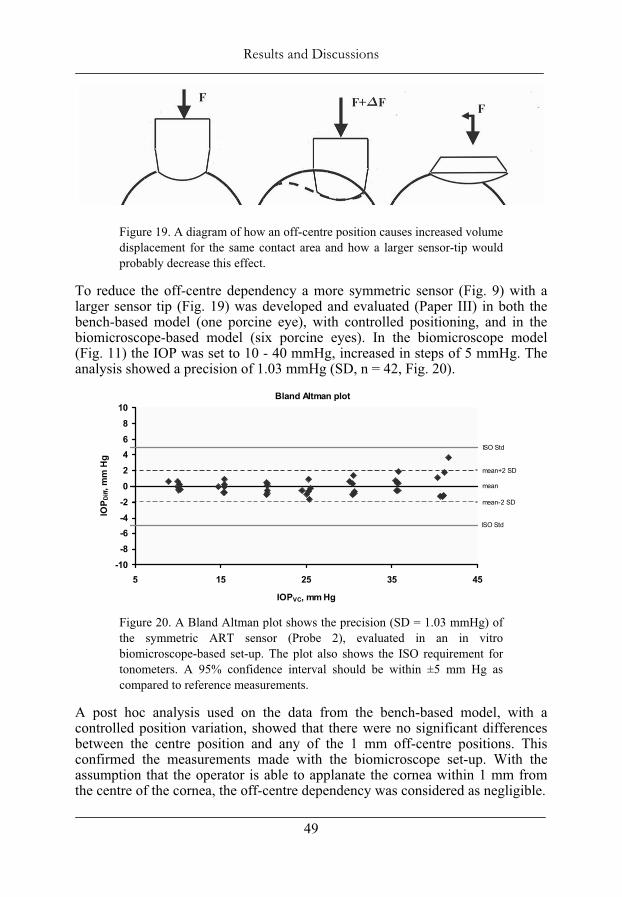
There was a significant correlation between IOPIndentation and IOPGAT (r = 0.92, n = 104) as well as between IOPRemoval and IOPGAT (r = 0.94, n = 104). A Bland-Altman analysis showed that the SD of the difference between GAT and ART was 3.6 mmHg (n = 104) for the initial applanation phase and 3.1 mmHg (n = 104) for the removal phase. Comparing the previous bench-based study (Paper I, SD = 0.94 mmHg) with this biomicroscope-based study, we identified two potential factors which could caused differences: (1), the applanation velocity, and (2), the centring of the ART probe against the cornea, both of which were controlled by the operator. In the bench set-up, the velocity was servo controlled and the centre positioning was precise and did not vary. An analysis of the variance showed no clear effects from applanation velocity. The area used for analysis was slightly less than the maximum area of the contact-piece. Therefore, if the sensor tip were applied against the cornea in an off-centre manner (Fig. 19), the edge of one side of the sensor tip would touch the cornea before adequate area for the analysis is reached. These edge effects will most likely produce strain forces in the cornea and cause unnaturally large indentations. Due to the scleral rigidity of the eye, such edge effects would produce an increased IOP in the eye (Fig. 19). In an off-centre applanation the volume displacement increases, and the measured IOP will be overestimated [36]. We believe that off centre positioning was the most significant source error. Therefore, we suggested that the decreased precision as compared with the previous bench-based study was related to edge effecters due to off-centre applanation. This was also supported by Paper 1 were it was shown that a 1 mm off-centre applanation could overestimate the IOP by 4 mmHg.
••
Results and Discussions
49
Figure 19. A diagram of how an off-centre position causes increased volume displacement for the same contact area and how a larger sensor-tip would probably decrease this effect.
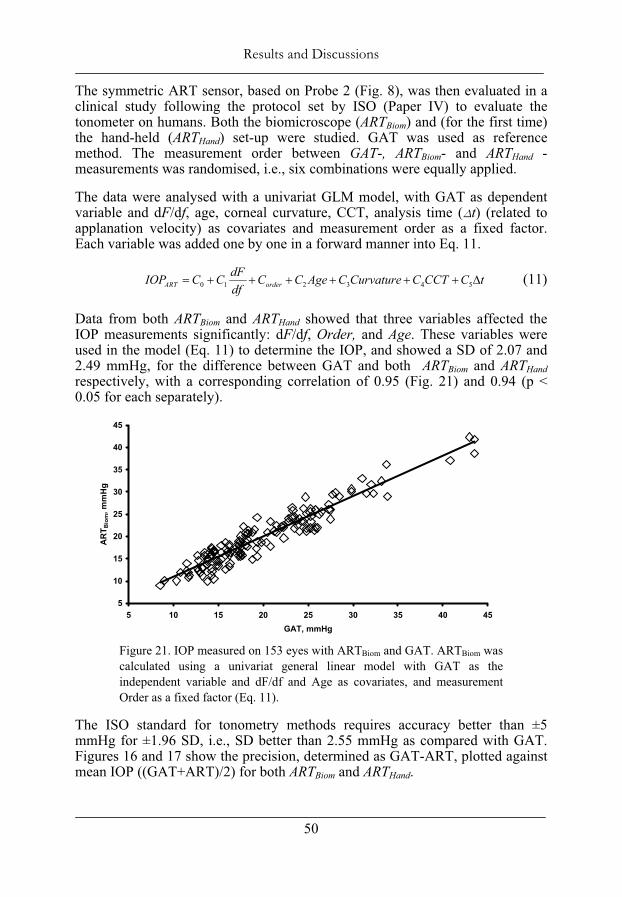
To reduce the off-centre dependency a more symmetric sensor (Fig. 9) with a larger sensor tip (Fig. 19) was developed and evaluated (Paper III) in both the bench-based model (one porcine eye), with controlled positioning, and in the biomicroscope-based model (six porcine eyes). In the biomicroscope model (Fig. 11) the IOP was set to 10 - 40 mmHg, increased in steps of 5 mmHg. The analysis showed a precision of 1.03 mmHg (SD, n = 42, Fig. 20).
Figure 20. A Bland Altman plot shows the precision (SD = 1.03 mmHg) of the symmetric ART sensor (Probe 2), evaluated in an in vitro biomicroscope-based set-up. The plot also shows the ISO requirement for tonometers. A 95% confidence interval should be within ±5 mm Hg as compared to reference measurements.
A post hoc analysis used on the data from the bench-based model, with a controlled position variation, showed that there were no significant differences between the centre position and any of the 1 mm off-centre positions. This confirmed the measurements made with the biomicroscope set-up. With the assumption that the operator is able to applanate the cornea within 1 mm from the centre of the cornea, the off-centre dependency was considered as negligible.
Bland Altman plot
-10-8-6-4-202468
10
5 15 25 35 45
IOPVC, mm Hg
IOP D
iff, m
m H
g
ISO Std
mean+2 SD
mean-2 SD
ISO Std
mean
Results and Discussions
50
The symmetric ART sensor, based on Probe 2 (Fig. 8), was then evaluated in a clinical study following the protocol set by ISO (Paper IV) to evaluate the tonometer on humans. Both the biomicroscope (ARTBiom) and (for the first time) the hand-held (ARTHand) set-up were studied. GAT was used as reference method. The measurement order between GAT-, ARTBiom- and ARTHand -measurements was randomised, i.e., six combinations were equally applied.
The data were analysed with a univariat GLM model, with GAT as dependent variable and dF/df, age, corneal curvature, CCT, analysis time ( t) (related to applanation velocity) as covariates and measurement order as a fixed factor. Each variable was added one by one in a forward manner into Eq. 11.
0 1 2 3 4 5ART orderdFIOP C C C C Age C Curvature C CCT C tdf
(11)
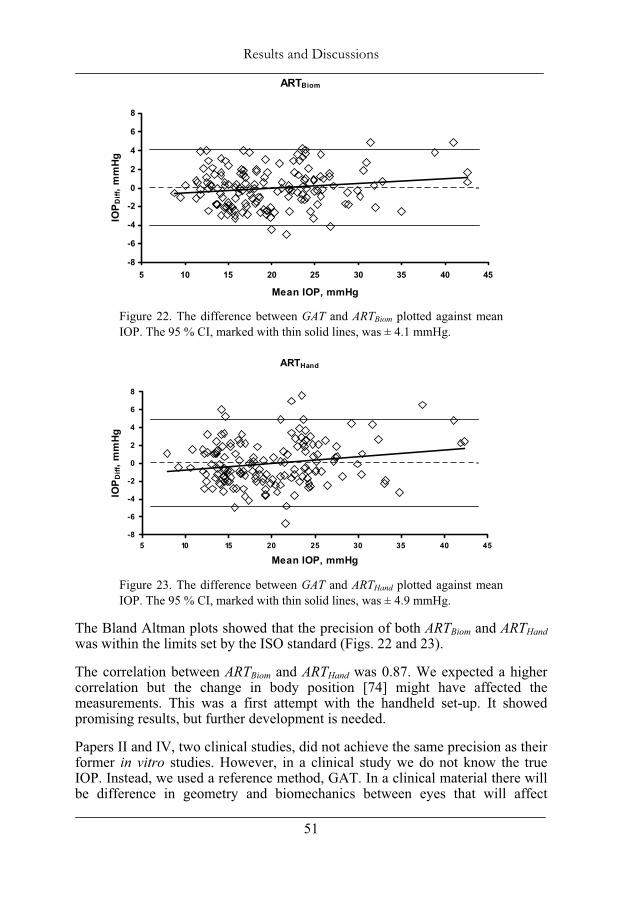
Data from both ARTBiom and ARTHand showed that three variables affected the IOP measurements significantly: dF/df, Order, and Age. These variables were used in the model (Eq. 11) to determine the IOP, and showed a SD of 2.07 and 2.49 mmHg, for the difference between GAT and both ARTBiom and ARTHandrespectively, with a corresponding correlation of 0.95 (Fig. 21) and 0.94 (p < 0.05 for each separately).
Figure 21. IOP measured on 153 eyes with ARTBiom and GAT. ARTBiom was calculated using a univariat general linear model with GAT as the independent variable and dF/df and Age as covariates, and measurement Order as a fixed factor (Eq. 11).
The ISO standard for tonometry methods requires accuracy better than ±5 mmHg for ±1.96 SD, i.e., SD better than 2.55 mmHg as compared with GAT. Figures 16 and 17 show the precision, determined as GAT-ART, plotted against mean IOP ((GAT+ART)/2) for both ARTBiom and ARTHand.
5
10
15
20
25
30
35
40
45
5 10 15 20 25 30 35 40 45GAT, mmHg
AR
T Bio
m, m
mH
g
••
Results and Discussions
51
Figure 22. The difference between GAT and ARTBiom plotted against mean IOP. The 95 % CI, marked with thin solid lines, was ± 4.1 mmHg.
Figure 23. The difference between GAT and ARTHand plotted against mean IOP. The 95 % CI, marked with thin solid lines, was ± 4.9 mmHg.
The Bland Altman plots showed that the precision of both ARTBiom and ARTHandwas within the limits set by the ISO standard (Figs. 22 and 23).
The correlation between ARTBiom and ARTHand was 0.87. We expected a higher correlation but the change in body position [74] might have affected the measurements. This was a first attempt with the handheld set-up. It showed promising results, but further development is needed.
Papers II and IV, two clinical studies, did not achieve the same precision as their former in vitro studies. However, in a clinical study we do not know the true IOP. Instead, we used a reference method, GAT. In a clinical material there will be difference in geometry and biomechanics between eyes that will affect
ARTHand
-8
-6
-4
-2
0
2
4
6
8
5 10 15 20 25 30 35 40 45
Mean IOP, mmHg
IOP D
iff, m
mHg
ARTBiom
-8
-6
-4
-2
0
2
4
6
8
5 10 15 20 25 30 35 40 45
Mean IOP, mmHg
IOP
Diff
, mm
Hg
Results and Discussions
52
tonometry methods in different ways. GAT has known sources of errors [3] related to the biomechanics of the cornea. The age dependency shown in Paper IV indicates that the ART and GAT estimate the IOP differently due to the biomechanics. In Paper IV we also showed a significant decrease of the IOP during the measurement sequence included three methods. This will always be a significant factor to consider when comparing different methods for measuring physiological parameters with indirect methods. However, the precision of ART (Probe 2) obtained in this clinical study matches the most accurate methods presented in Table 1.
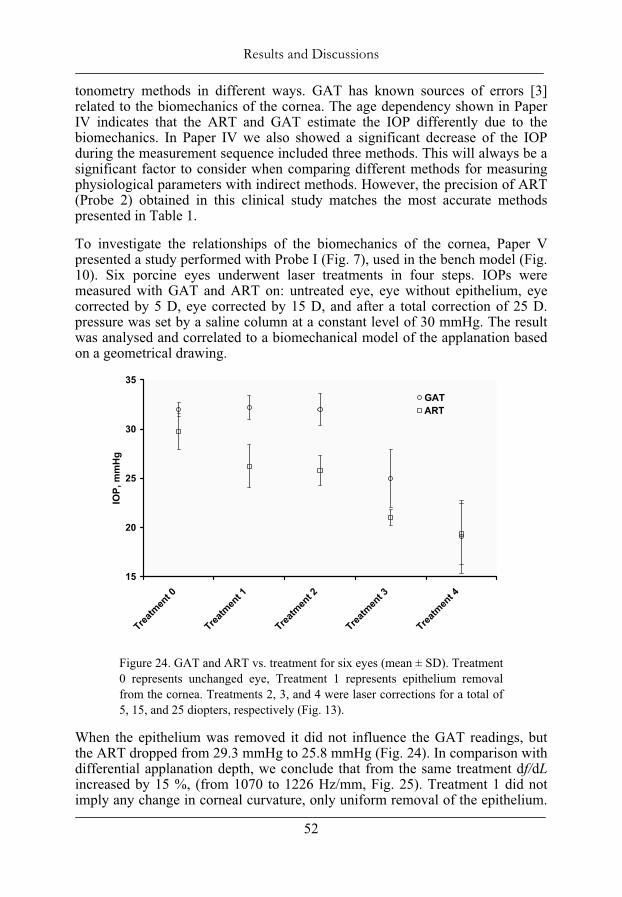
To investigate the relationships of the biomechanics of the cornea, Paper V presented a study performed with Probe I (Fig. 7), used in the bench model (Fig. 10). Six porcine eyes underwent laser treatments in four steps. IOPs were measured with GAT and ART on: untreated eye, eye without epithelium, eye corrected by 5 D, eye corrected by 15 D, and after a total correction of 25 D. pressure was set by a saline column at a constant level of 30 mmHg. The result was analysed and correlated to a biomechanical model of the applanation based on a geometrical drawing.
Figure 24. GAT and ART vs. treatment for six eyes (mean ± SD). Treatment 0 represents unchanged eye, Treatment 1 represents epithelium removal from the cornea. Treatments 2, 3, and 4 were laser corrections for a total of 5, 15, and 25 diopters, respectively (Fig. 13).
When the epithelium was removed it did not influence the GAT readings, but the ART dropped from 29.3 mmHg to 25.8 mmHg (Fig. 24). In comparison with differential applanation depth, we conclude that from the same treatment df/dLincreased by 15 %, (from 1070 to 1226 Hz/mm, Fig. 25). Treatment 1 did not imply any change in corneal curvature, only uniform removal of the epithelium.
15
20
25
30
35
Treatm
ent 0
Treatm
ent 1
Treatm
ent 2
Treatm
ent 3
Treatm
ent 4
IOP,
mm
Hg
GATART
••
Results and Discussions
53
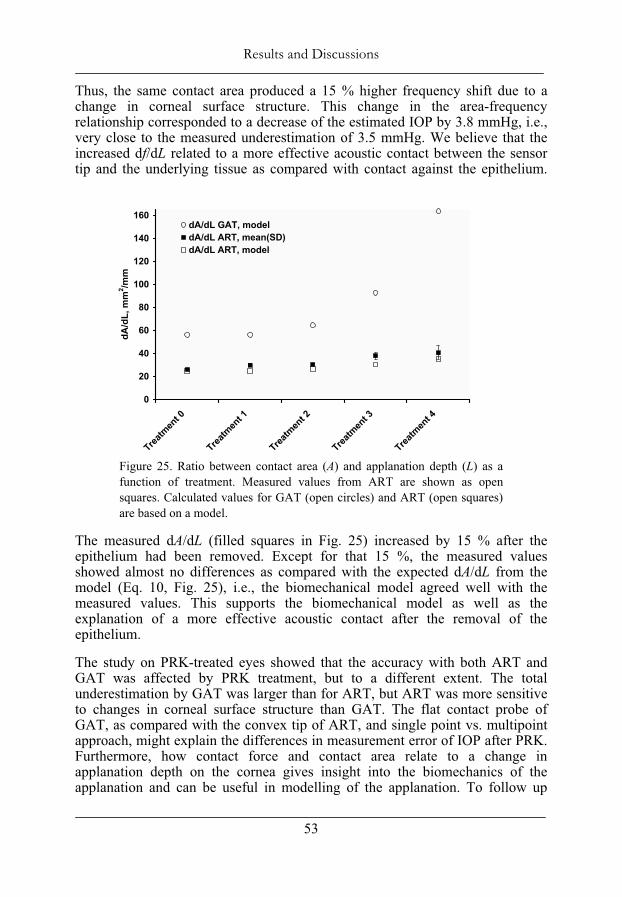
Thus, the same contact area produced a 15 % higher frequency shift due to a change in corneal surface structure. This change in the area-frequency relationship corresponded to a decrease of the estimated IOP by 3.8 mmHg, i.e., very close to the measured underestimation of 3.5 mmHg. We believe that the increased df/dL related to a more effective acoustic contact between the sensor tip and the underlying tissue as compared with contact against the epithelium.
Figure 25. Ratio between contact area (A) and applanation depth (L) as a function of treatment. Measured values from ART are shown as open squares. Calculated values for GAT (open circles) and ART (open squares) are based on a model.
The measured dA/dL (filled squares in Fig. 25) increased by 15 % after the epithelium had been removed. Except for that 15 %, the measured values showed almost no differences as compared with the expected dA/dL from the model (Eq. 10, Fig. 25), i.e., the biomechanical model agreed well with the measured values. This supports the biomechanical model as well as the explanation of a more effective acoustic contact after the removal of the epithelium.
The study on PRK-treated eyes showed that the accuracy with both ART and GAT was affected by PRK treatment, but to a different extent. The total underestimation by GAT was larger than for ART, but ART was more sensitive to changes in corneal surface structure than GAT. The flat contact probe of GAT, as compared with the convex tip of ART, and single point vs. multipoint approach, might explain the differences in measurement error of IOP after PRK. Furthermore, how contact force and contact area relate to a change in applanation depth on the cornea gives insight into the biomechanics of the applanation and can be useful in modelling of the applanation. To follow up
0
20
40
60
80
100
120
140
160
Treatm
ent 0
Treatm
ent 1
Treatm
ent 2
Treatm
ent 3
Treatm
ent 4
dA/d
L, m
m2 /m
m
dA/dL GAT, modeldA/dL ART, mean(SD)dA/dL ART, model

Results and Discussions
54
Paper V, we have planed a clinical study regarding IOP measurements on laser corrected eyes. Ethical permission has been received.
7.1 Further development The ART sensor might be useful in at least three different clinical versions in the future: ART biomicroscope, ART hand-held, and ART self-tonometry. Both biomicroscope and hand-held set-ups have already come far but self-tonometry is still a field of use to be developed.
••
Conclusions
55
8 General summary and conclusions
This dissertation describes the research and development of a new tonometer based on a novel method. The method is based on a multipoint model with simultaneous and continuous sampling of both contact force and contact area during applanation. The model was evaluated in an in vitro bench-based study and showed a high precision (SD = 0.94 mmHg) and a high degree of explanation (R2 = 0.991).
With further evaluation in a clinical setting we identified a position dependency. A new, more symmetric, sensor with a larger sensor tip was developed. An invitro study using the bench-based as well as the biomicroscope-based set-up confirmed the improvements and the position dependency were regarded as negligible.
A clinical study designed in accordance with the International Standard Organisation’s (ISO) requirements, showed that the precision obtained in ARTBiom was within the limits set by the ISO standards for tonometers. Also a first evaluation of the hand-held version of the ART showed a precision within the ISO standard.
A study on PRK-treated eyes showed that the accuracy with both ART and GAT was affected by PRK treatment, but to a different extent. The total underestimation by GAT was larger than for ART, but ART was more sensitive to changes in corneal surface structure than GAT. The flat contact probe of GAT, as compared with the convex tip of ART, and single point vs. multipoint approach, might explain the differences in measurement error of IOP after PRK. Furthermore, how contact force and contact area relate to a change in applanation depth on the cornea gives insight into the biomechanics of the applanation and can be useful in modelling of the applanation.
In conclusion, resonance sensor technology has made it possible to introduce a new multipoint method for measuring IOP, and the method is relevant for measuring IOP in humans. It may be possible to reduce errors in the clinical measurement of IOP with this new method, especially after corneal surgery. The ART has the potential to become a useful clinical instrument for IOP measurement.

Conclusions
56
••
Acknowledgements
57
9 Acknowledgements
I would like to express my sincere thanks to all my friends but especially to:
Professor Olof Lindahl, my head supervisor, for your ever-lasting optimism, and scientific wisdom. I am grateful that you talked me into the field of research and that you are such an inspiring supervisor,
I thank Anders Eklund, my supervisor and friend, for your patience, knowledge, and pedagogic lectures (reprimands). I am grateful for all of those evening, morning, and weekend discussions. To Maria, I’m sorry that I encroached on your spare time. I guess it is pay-back time now (with taxes of course :-),
Christina Lindén, my supervisor, for always having time for me and for guiding me through my Ph.D studies with continuous encouragement,
Tomas Bäcklund, co-author and friend, thanks for your cooperation, nothing is impossible for you,
Professor Stefan Karlsson, Department of Biomedical Engineering and Informatics, for understanding, support, and for establishing the exciting and creative environment for research at our department,
Professor Ronnie Lundström, head of the Department of Biomedical Engineering and Informatics, for providing excellent research conditions,
all colleagues at the Department on Biomedical Engineering and Informatics, you all have contributed to the fact that I walk with a smile on my lips to my job every morning, Annelise Müller and Johan Skönevik, who kept their focus on the remote consulting project when I didn’t have the time to do so, and Annelise for the illustrations, Christer Grönlund for creative discussions and pleasant chats,
co-author Timo Koskela, for your participation in the project and for the pleasant time we spent in your clinic. I am also grateful that you let us use your clinic for our research,
co-author Kenneth Santala, for fruitful discussions,
Michael Hansson for all the nice time we spent in your office and for very skilful measurements,

Acknowledgements
58
Leif Nyström and Peter Bäcklund for skilful software and hardware engineering,
Waldemar Nyström, Bioresonator, for your warm support and contribution to this thesis,
Professor Sado Omata and Yoshinobu Murayama, my Japanese colleagues, for friendship and meaningful discussions,
my relatives and friends that all contributed to the spare time in my life, and
last but absolutely not least, to my wife, Elisabet, and my children; Ida-Maria, Peter, Anna and Kalle, for your understanding and love. Being together as a family has given me inspiration, joy, laughter and diversion from scientific work.
Learn from yesterday, live for today, hope for tomorrow.
(Albert Einstein)
••
References
59
10 References 1. Sommer, A., Intraocular pressure and glaucoma. American Journal of
Ophthalmology, 1989. 107(2): p. 186-188. 2. Goldmann, H. Applanation tonometry. in Glaucoma, Transactions of the
second conference. 1957. New York: Josiah Macy, Jr. Foundation. 3. Whitacre, M.M. and R. Stein, Sources of error with use of Goldmann-type
tonometers. Survey of Ophthalmology, 1993. 38(1): p. 1-30. 4. Whitacre, M.M., R.A. Stein, and K. Hassanein, The effect of corneal
thickness on applanation tonometry. American Journal of Ophthalmology, 1993. 115(5): p. 592-596.
5. Mark, H., Corneal curvature in applanation tonometry. Am J Ophthalmol, 1973. 76(2): p. 223-224.
6. Munger, R., et al., Changes in measured intraocular pressure after hyperopic photorefractive keratectomy. Journal of Cataract & Refractive Surgery, 2001. 27(8): p. 1254-1262.
7. Ehlers, N., T. Brahmsen, and S. Sperling, Applanation tonometry and central corneal thickness. Acta Ophthalmologica, 1975. 53: p. 34-43.
8. Doughty, M.J. and M.L. Zaman, Human corneal thickness and its impact on intraocular pressure measures: a review and meta-analysis approach.Survey of Ophthalmology, 2000. 44(5): p. 367-408.
9. Kaufmann, C., L.M. Bachmann, and M.A. Thiel, Intraocular Pressure Measurements Using Dynamic Contour Tonometry after Laser In Situ Keratomileusis. Invest. Ophthalmol. Vis. Sci., 2003. 44(9): p. 3790-3794.
10. Rosa, N., et al., Goldmann applanation tonometry after myopic photorefractive keratectomy. Acta Ophthalmologica Scandinavica, 1998. 76(5): p. 550-554.
11. Siganos, D.S., G.I. Papastergiou, and C. Moedas, Assessment of the Pascal dynamic contour tonometer in monitoring intraocular pressure in unoperated eyes and eyes after LASIK,. Journal of Cataract & Refractive Surgery, 2004. 30(4): p. 746-751.
12. Omata, S., Development of a piezoelectric transducer for measuring contact compliance of soft tissue. Iyo Denshi to Seitai Kogaku, 1986. 24(5): p. 330-4.
13. Omata, S., Characteristics of the vibration modes and the contact compliances of a soft material measured with a newly developed piezoelectric vibrometer. Iyo Denshi to Seitai Kogaku, 1988. 26(1): p. 32-40.
14. Lindahl, O.A. and S. Omata, Impression technique for the assessment of oedema: comparison with a new tactile sensor that measures physical properties of tissue. Medical and Biological Engineering and Computing, 1995. 33(1): p. 27-32.
References
60
15. Lindahl, O.A., S. Omata, and K.A. Angquist, A tactile sensor for detection of physical properties of human skin in vivo. Journal of Medical Engineering and Technology, 1998. 22(4): p. 147-53.
16. Eklund, A., T. Backlund, and O.A. Lindahl, A resonator sensor for measurement of intraocular pressure--evaluation in an in vitro pig-eye model. Physiological Measurement, 2000. 21(3): p. 355-367.
17. Eklund, A., et al., Evaluation of applanation resonator sensors for intraocular pressure measurement, results from clinical and in vitro studies. Medical and Biological Engineering and Computing, 2003. 41: p. 190-197.
18. Tortora, G.J. and S.R. Grabowski, Principles of Anatomy and Physiology.1996, New York, NY: Harper Collins Collage Publishers.
19. Vanlandingham, B.D. and R.F. Brubaker, Combined effect of dorzolamide and latanoprost on the rate of aqueous humor flow. American Journal of Ophthalmology, 1998. 126(2): p. 191-196.
20. Haigis, W., Corneal power after refractive surgery for myopia: contact lens method. Journal of Cataract & Refractive Surgery, 2003. 29(7): p. 1397-1411.
21. Olsen, T., On the calculation of power from curvature of the cornea. Br J Ophthalmol, 1986. 70(2): p. 152-154.
22. Leydhecker, W., K. Akiyama, and H.G. Neumann, Der intraokulare Druck gesunder menschlicher Augen. Klin Monatsbl Augenheilkd, 1958. 133: p. 662-670.
23. Johnson, D.H. and M. Johnson, How Does Nonpenetrating Glaucoma Surgery Work? Aqueous Outflow Resistance and Glaucoma Surgery.Journal of Glaucoma, 2001. 10(1): p. 55-67.
24. Lindén, C., Aspects on Prostanoid and Cholinergic Effects on Aqueous Humour Dynamics in Human Eyes, in Department of Ophthalmology.1997, Umeå University: Umeå.
25. Quigley, H.A., Histopathology underlying glaucomatous damage II, in Glaucoma diagnosis. Structorue and function, R.N. Weinreb, Greve, E.L., Editor. 2004, Kugler publications, Netherlands: Hague. p. 21-30.
26. Quigley, H.A., Number of people with glaucoma worldwide. Brit. Jour. of Ophtal., 1996. 80: p. 389-393.
27. Tylefors, B., Negrel, A.D., Parajasegaram, R., Dadzie K.Y., Global data on blindness. Bulletin of World Health Organisation, 1995. 73(Pt1): p. 115-121.
28. Sommer, A., Tielsch, J.M., Katz, J., Quigley, H.A., Gottsch, J.D., Javitt, J., Singh, K., Relationship between intraocular pressure and primary open angle glaucoma among white and black Americans: the Baltimore Eye Survey. Archives of Ophthalmology, 1991. 120: p. 1090-1095.
29. Klein, B.E.K., et al., Prevalence of glaucoma: the Beaver Dam Eye Study.Ophthalmology, 1992. 99(Pt10): p. 1499-1504.
30. Kroese, M., et al., Prevalence of primary open angle glaucoma in general ophthalmic practice in the United Kingdom. Br J Ophthalmol, 2002. 86(9): p. 978-980.
••

References
61
31. Heijl, A., et al., Reduction of intraocular pressure and glaucoma progression: results from the Early Manifest Glaucoma Trial. Archives of Ophthalmology, 2002. 120(10): p. 1268-1279.
32. Imbert, A., Théorie des ophthalmotonométres. Archives of Ophthalmology, 1885. 5: p. 358-363.
33. Fick, R., Ein neues ophthalmotonometer. Pflygers Arch Ges Physiol, 1888. 42: p. 159-190.
34. Cantor, L., Glaucoma. Basic and Clinical Science Course, ed. T.A. Weingeist, T.J. Liesegang, and M.G. Grand. Vol. 10. 2000, San Fransisco, US: The Foundation of the American Academy of Ophthalmology. 20.
35. ISO, Ophtahlmic instruments - Tonometers, in ISO 8612:2001. 2001, International Standard Organization.
36. Friedenwald, J.S., Contribution to the theory and practice of tonometry.American Journal of Ophthalmology, 1937. 20: p. 985-1024.
37. Mackay, R.S. and E. Marg, Fast, automatic, electronic tonometers based on an exact theory. Acta Ophthalmol (Copenh), 1959. 37: p. 495-507.
38. Marg, E., A report on Mackay-Marg tonometry in optometry. Journal of the American Optometric Association, 1963. 34(12): p. 961-965.
39. Togawa, T., T. Tamura, and P.A. Oberg, Biomedical Transducers and Instruments. 1997, Boca Raton, Florida: CRC Press.
40. Minckler, D.S., et al., Clinical evaluation of the Oculab Tono-Pen.American Journal of Ophthalmology, 1987. 104(2): p. 168-73.
41. Moses, R.A. and W.J.J. Grodzki, The pneumatonograph. A laboratory study. Archives of Ophthalmology, 1979. 97(3): p. 547-552.
42. Kanngiesser, H.E., Robert, Y. Dynamic contour tonometry. in ARVOabstract. 2002: Invest Ophthalmol Vis Sci.
43. Kanngiesser, H., E., Kniestedt, C., Robert, Y.C., Dynamic Contour Tonometry: Presentation of a New Tonometer. Journal of Glaucoma, 2005. 14(5): p. 344-350.
44. Kontiola, A.I., A new electromechanical method for measuring intraocular pressure. Documenta Ophthalmologica. Advances in Ophthalmology, 1996-97. 93(3): p. 265-276.
45. Dekker, P.W., et al., Principles of contact lens tonometry. International Ophthalmology, 1999. 22(2): p. 105-111.
46. Halberg, G.P., Hand applanation tonometer. Transactions - American Academy of Ophthalmology and Otolaryngology, 1968. 72(1): p. 112-114.
47. Previte, L.R., Burris, J.E. Jr., Carter, V. Jr., Carol, B., Halberg hand applanation tonometer: statistical analysis of tonometry with Goldmann, Halberg and Schiotz tonometers on 2000 eyes. Annals of Ophthalmology, 1974. 6(6): p. 567-570.
48. Forbes, M., G. Pico, and B. Grolman, A noncontact applanation tonometer. Description and clinical evaluation. Archives of Ophthalmology, 1974. 91(2): p. 134-140.
References
62
49. Theofylaktopoulos, I., M. Diestelhorst, and G.n.K. Krieglstein, Self-tonometry with the Ocuton S versus Goldmann tonometry. Graefe's Archive for Clinical and Experimental Ophthalmology, 1999. 237(9): p. 720-724.
50. Fresco, B.B., A new tonometer--the pressure phosphene tonometer:Clinical comparison with Goldmann tonometry. Ophthalmology, 1998. 105(11): p. 2123-2126.
51. Lösch, A., et al., Transpalpebral measurement of intraocular pressure using the TGDc-01 tonometer versus standard Goldmann applanation tonometry. Graefe's Archive for Clinical and Experimental Ophthalmology, 2005. 243(4): p. 313-316.
52. Tonnu, P.-A., et al., A comparison of four methods of tonometry: method agreement and interobserver variability. Br J Ophthalmol, 2005. 89(7): p. 847-850.
53. Thorburn, W., The accuracy of clinical applanation tonometry. Acta Ophthalmol (Copenh), 1978. 56(1): p. 1-5.
54. Parker, V.A., J. Herrtage, and N.J.C. Sarkies, Clinical comparison of the Keeler Pulsair 3000 with the Goldmann applanation tonometer. British Journal of Ophthalmology, 2001. 85: p. 1303-1304.
55. Morgan, A.J., Hosking, S. L., Salmon, J. F.,, Clinical Evaluation of the Dynamic Observing Tonometer. Journal of Glaucoma, 2002. 11(4): p. 334-339.
56. Bafa, M., et al., Clinical comparison of the measurement of the IOP with the ocular blood flow tonometer, the Tonopen XL and the Goldmann applanation tonometer. Acta Ophthalmol Scand, 2001. 79(1): p. 15-18.
57. Midelfart, A. and A. Wigers, Clinical comparison of the ProTon and Tono-Pen tonometers with the Goldmann applanation tonometer. British Journal of Ophthalmology, 1994. 78(12): p. 895-898.
58. Kotecha, A., et al., The relative effects of corneal thickness and age on Goldmann applanation tonometry and dynamic contour tonometry, 10.1136/bjo.2005.075580. Br J Ophthalmol, 2005. 89(12): p. 1572-1575.
59. Ku, J.Y.F., et al., Comparison of intraocular pressure measured by Pascal dynamic contour tonometry and Goldmann applanation tonometry. 2005. 20(2): p. 191-198.
60. Martinez-de-la-Casa, J.M., et al., Reproducibility and Clinical Evaluation of Rebound Tonometry,10.1167/iovs.05-0586. Invest. Ophthalmol. Vis. Sci., 2005. 46(12): p. 4578-4580.
61. van der Jagt, L.H. and N.M. Jansonius, Three portable tonometers, the TGDc-01, the ICARE and the Tonopen XL, compared with each other and with Goldmann applanation tonometry. Ophthalmic and Physiological Optics, 2005. 25(5): p. 429-435.
62. Mackie, S.W., et al., Clinical comparison of the Keeler Pulsair 2000, American Optical MkII and Goldmann applanation tonometers.Ophthalmic and Physiological Optics, 1996. 16(2): p. 171-177.
63. Li, J., et al., Clinical Comparison of the Proview Eye Pressure Monitor With the Goldmann Applanation Tonometer and the TonoPen. Arch Ophthalmol, 2004. 122(8): p. 1117-1121.
••
References
63
64. Lam, A.K.C., C.H. Lam, and R. Chan, The validity of a digital eyelid tonometer (TGDc-01) and its comparison with Goldmann applanation tonometry - a pilot study. Ophthalmic and Physiological Optics, 2005. 25(3): p. 205-210.
65. Miyaji MD, K., et al., Myocardial Tactile Stiffness: A Variable of Regional Myocardial Function. Journal of the American College of Cardiology, 1998. 31(5): p. 1165-1173.
66. Ohtsuka, T., Furuse, A., Kohno, T., Nakajima, J., Yagyu, K., Omata, S., New tactile sensor techniques for localization of pulmonary nodules.International surgery, 1997. 82(1): p. 12-14.
67. Hatakeyama, Y., Ono, T., Sato, N., Sakuma, H., Koyama, Y., Inoue, N., Takenoshita, S., Omata, S., Usefulness of the tactile sensor for estimating the degree of liver fibrosis and the DNA synthesis activity of remnant liver cells after partial hepatectomy. Fukushima journal of medical science, 2002. 48(2): p. 93-101.
68. Omata, S. and Y. Terunuma, New tactile sensor like the human hand and its applications. Sens. & Actuators, 1992. 35: p. 9-15.
69. Eklund, A., A. Bergh, and O.A. Lindahl, A catheter tactile sensor for measuring hardness of soft tissue: measurement in a silicone model and in an in vitro human prostate model. Medical and Biological Engineering and Computing, 1999. 37(5): p. 618-624.
70. Christos E. Constantinou, S.O., Analysis of the relative biomechanical effects of ?1 and ?2 antagonists in modifying the compliance of the prostate and micturition parameters of the hormonally manipulated male rat. Neurourology and Urodynamics, 1996. 15(1): p. 85-101.
71. Takeshi Watanabe, S.O., Jeong Z. Lee, Christos E. Constantinou,, Comparative analysis of bladder wall compliance based on cystometry and biosensor measurements during the micturition cycle of the rat.Neurourology and Urodynamics, 1997. 16(6): p. 567-581.
72. Hallberg, P., Lindén, C., Lindahl, O.A., Bäcklund, T., Eklund, A., Comparison of Goldmann applanation- and Applanation resonance tonometry in a vertical in vitro porcine-eye model. Journal of Medical Engineering and Technology, In press.
73. Eisenberg, D.L., et al., Tonometry in adults and children. A manometric evaluation of pneumatonometry, applanation, and TonoPen in vitro and in vivo. Ophthalmology, 1998. 105(7): p. 1173-1181.
74. Weinreb, R.N., J. Cook, and T.R. Friberg, Effect of inverted body position on intraocular pressure. Amer. J. Ophthalmol., 1984. 98(6): p. 784-787.