appendix d performance indicators (metrics) utilized in ... · performance indicators (metrics)...
TRANSCRIPT
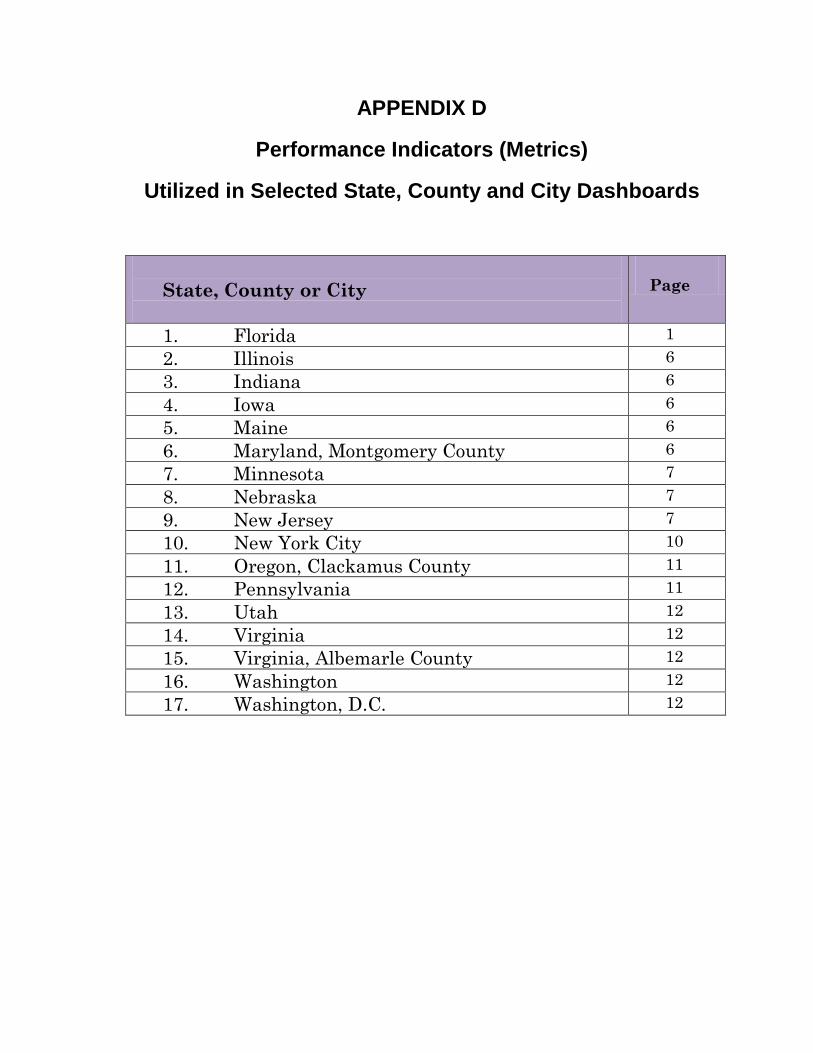
APPENDIX D
Performance Indicators (Metrics)
Utilized in Selected State, County and City Dashboards
State, County or City
Page
1. Florida 1 2. Illinois 6 3. Indiana 6 4. Iowa 6 5. Maine 6 6. Maryland, Montgomery County 6 7. Minnesota 7 8. Nebraska 7 9. New Jersey 7 10. New York City 10 11. Oregon, Clackamus County 11 12. Pennsylvania 11 13. Utah 12 14. Virginia 12 15. Virginia, Albemarle County 12 16. Washington 12 17. Washington, D.C. 12
1
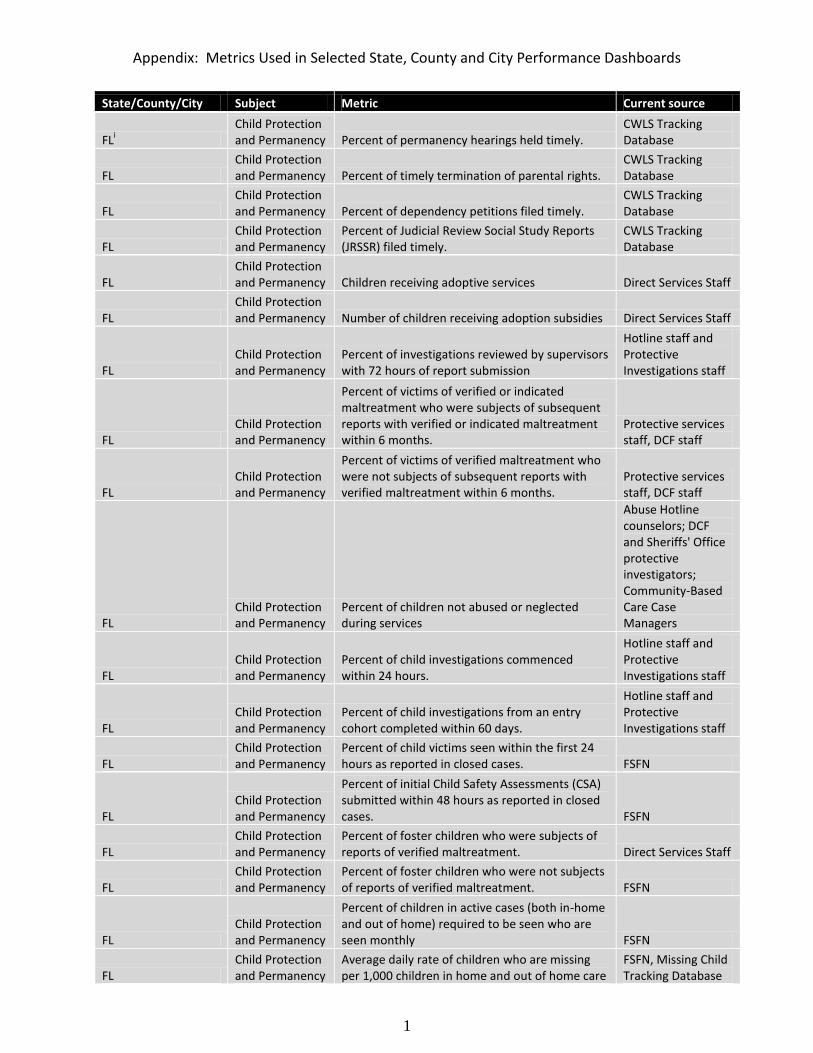
Appendix: Metrics Used in Selected State, County and City Performance Dashboards
State/County/City Subject Metric Current source
FLi
Child Protection and Permanency Percent of permanency hearings held timely.
CWLS Tracking Database
FL Child Protection and Permanency Percent of timely termination of parental rights.
CWLS Tracking Database
FL Child Protection and Permanency Percent of dependency petitions filed timely.
CWLS Tracking Database
FL Child Protection and Permanency
Percent of Judicial Review Social Study Reports (JRSSR) filed timely.
CWLS Tracking Database
FL Child Protection and Permanency Children receiving adoptive services Direct Services Staff
FL Child Protection and Permanency Number of children receiving adoption subsidies Direct Services Staff
FL Child Protection and Permanency
Percent of investigations reviewed by supervisors with 72 hours of report submission
Hotline staff and Protective Investigations staff
FL Child Protection and Permanency
Percent of victims of verified or indicated maltreatment who were subjects of subsequent reports with verified or indicated maltreatment within 6 months.
Protective services staff, DCF staff
FL Child Protection and Permanency
Percent of victims of verified maltreatment who were not subjects of subsequent reports with verified maltreatment within 6 months.
Protective services staff, DCF staff
FL Child Protection and Permanency
Percent of children not abused or neglected during services
Abuse Hotline counselors; DCF and Sheriffs' Office protective investigators; Community-Based Care Case Managers
FL Child Protection and Permanency
Percent of child investigations commenced within 24 hours.
Hotline staff and Protective Investigations staff
FL Child Protection and Permanency
Percent of child investigations from an entry cohort completed within 60 days.
Hotline staff and Protective Investigations staff
FL Child Protection and Permanency
Percent of child victims seen within the first 24 hours as reported in closed cases. FSFN
FL Child Protection and Permanency
Percent of initial Child Safety Assessments (CSA) submitted within 48 hours as reported in closed cases. FSFN
FL Child Protection and Permanency
Percent of foster children who were subjects of reports of verified maltreatment. Direct Services Staff
FL Child Protection and Permanency
Percent of foster children who were not subjects of reports of verified maltreatment. FSFN
FL Child Protection and Permanency
Percent of children in active cases (both in-home and out of home) required to be seen who are seen monthly FSFN
FL Child Protection and Permanency
Average daily rate of children who are missing per 1,000 children in home and out of home care
FSFN, Missing Child Tracking Database
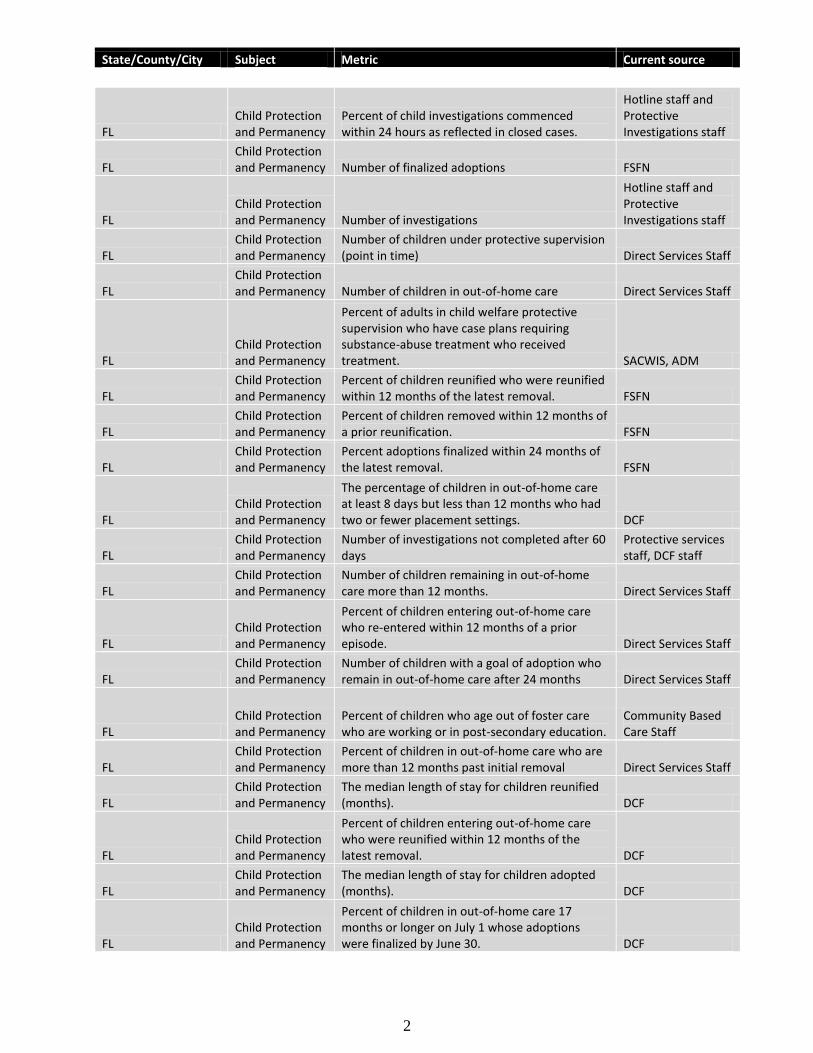
State/County/City Subject Metric Current source
2
FL Child Protection and Permanency
Percent of child investigations commenced within 24 hours as reflected in closed cases.
Hotline staff and Protective Investigations staff
FL Child Protection and Permanency Number of finalized adoptions FSFN
FL Child Protection and Permanency Number of investigations
Hotline staff and Protective Investigations staff
FL Child Protection and Permanency
Number of children under protective supervision (point in time) Direct Services Staff
FL Child Protection and Permanency Number of children in out-of-home care Direct Services Staff
FL Child Protection and Permanency
Percent of adults in child welfare protective supervision who have case plans requiring substance-abuse treatment who received treatment. SACWIS, ADM
FL Child Protection and Permanency
Percent of children reunified who were reunified within 12 months of the latest removal. FSFN
FL Child Protection and Permanency
Percent of children removed within 12 months of a prior reunification. FSFN
FL Child Protection and Permanency
Percent adoptions finalized within 24 months of the latest removal. FSFN
FL Child Protection and Permanency
The percentage of children in out-of-home care at least 8 days but less than 12 months who had two or fewer placement settings. DCF
FL Child Protection and Permanency
Number of investigations not completed after 60 days
Protective services staff, DCF staff
FL Child Protection and Permanency
Number of children remaining in out-of-home care more than 12 months. Direct Services Staff
FL Child Protection and Permanency
Percent of children entering out-of-home care who re-entered within 12 months of a prior episode. Direct Services Staff
FL Child Protection and Permanency
Number of children with a goal of adoption who remain in out-of-home care after 24 months Direct Services Staff
FL Child Protection and Permanency
Percent of children who age out of foster care who are working or in post-secondary education.
Community Based Care Staff
FL Child Protection and Permanency
Percent of children in out-of-home care who are more than 12 months past initial removal Direct Services Staff
FL Child Protection and Permanency
The median length of stay for children reunified (months). DCF
FL Child Protection and Permanency
Percent of children entering out-of-home care who were reunified within 12 months of the latest removal. DCF
FL Child Protection and Permanency
The median length of stay for children adopted (months). DCF
FL Child Protection and Permanency
Percent of children in out-of-home care 17 months or longer on July 1 whose adoptions were finalized by June 30. DCF
State/County/City Subject Metric Current source
3
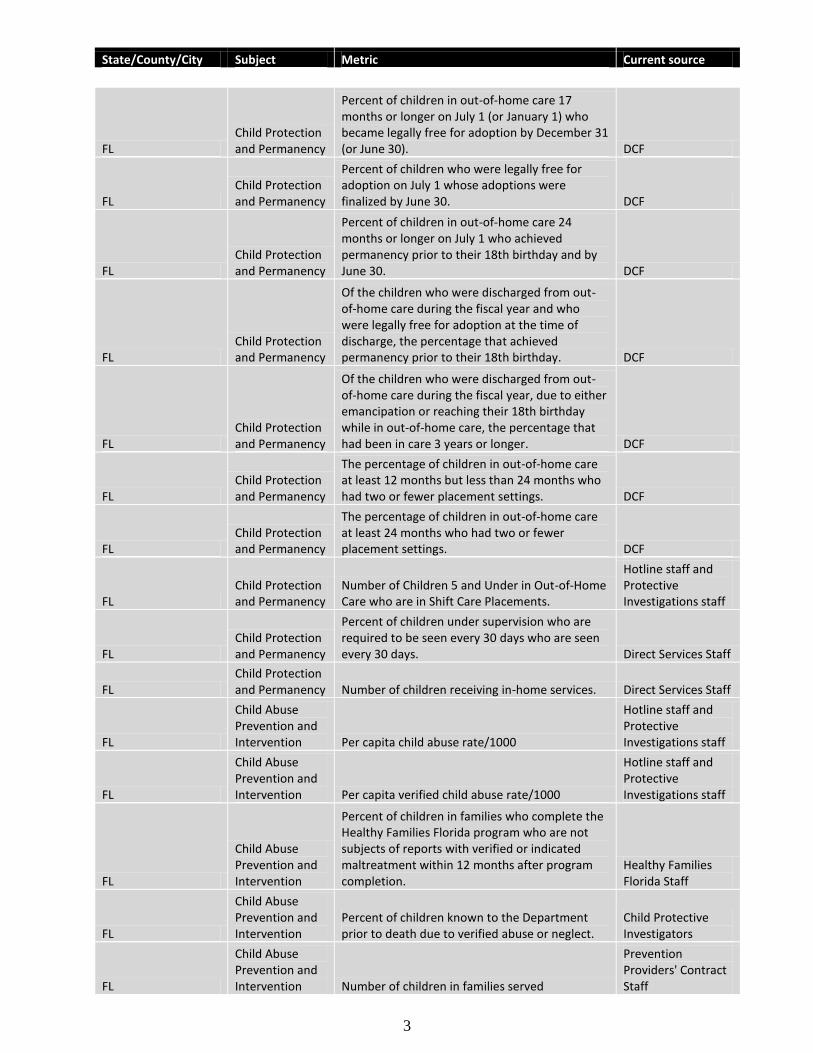
FL Child Protection and Permanency
Percent of children in out-of-home care 17 months or longer on July 1 (or January 1) who became legally free for adoption by December 31 (or June 30). DCF
FL Child Protection and Permanency
Percent of children who were legally free for adoption on July 1 whose adoptions were finalized by June 30. DCF
FL Child Protection and Permanency
Percent of children in out-of-home care 24 months or longer on July 1 who achieved permanency prior to their 18th birthday and by June 30. DCF
FL Child Protection and Permanency
Of the children who were discharged from out-of-home care during the fiscal year and who were legally free for adoption at the time of discharge, the percentage that achieved permanency prior to their 18th birthday. DCF
FL Child Protection and Permanency
Of the children who were discharged from out-of-home care during the fiscal year, due to either emancipation or reaching their 18th birthday while in out-of-home care, the percentage that had been in care 3 years or longer. DCF
FL Child Protection and Permanency
The percentage of children in out-of-home care at least 12 months but less than 24 months who had two or fewer placement settings. DCF
FL Child Protection and Permanency
The percentage of children in out-of-home care at least 24 months who had two or fewer placement settings. DCF
FL Child Protection and Permanency
Number of Children 5 and Under in Out-of-Home Care who are in Shift Care Placements.
Hotline staff and Protective Investigations staff
FL Child Protection and Permanency
Percent of children under supervision who are required to be seen every 30 days who are seen every 30 days. Direct Services Staff
FL Child Protection and Permanency Number of children receiving in-home services. Direct Services Staff
FL
Child Abuse Prevention and Intervention Per capita child abuse rate/1000
Hotline staff and Protective Investigations staff
FL
Child Abuse Prevention and Intervention Per capita verified child abuse rate/1000
Hotline staff and Protective Investigations staff
FL
Child Abuse Prevention and Intervention
Percent of children in families who complete the Healthy Families Florida program who are not subjects of reports with verified or indicated maltreatment within 12 months after program completion.
Healthy Families Florida Staff
FL
Child Abuse Prevention and Intervention
Percent of children known to the Department prior to death due to verified abuse or neglect.
Child Protective Investigators
FL
Child Abuse Prevention and Intervention Number of children in families served
Prevention Providers' Contract Staff
State/County/City Subject Metric Current source
4
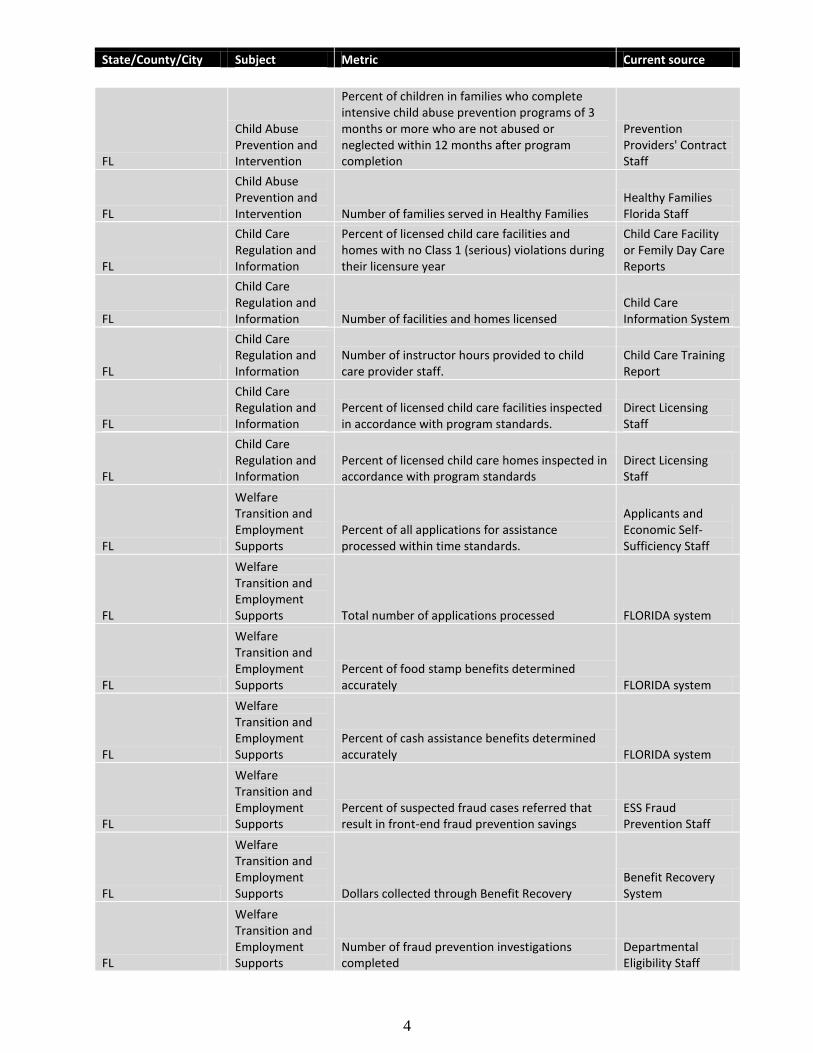
FL
Child Abuse Prevention and Intervention
Percent of children in families who complete intensive child abuse prevention programs of 3 months or more who are not abused or neglected within 12 months after program completion
Prevention Providers' Contract Staff
FL
Child Abuse Prevention and Intervention Number of families served in Healthy Families
Healthy Families Florida Staff
FL
Child Care Regulation and Information
Percent of licensed child care facilities and homes with no Class 1 (serious) violations during their licensure year
Child Care Facility or Femily Day Care Reports
FL
Child Care Regulation and Information Number of facilities and homes licensed
Child Care Information System
FL
Child Care Regulation and Information
Number of instructor hours provided to child care provider staff.
Child Care Training Report
FL
Child Care Regulation and Information
Percent of licensed child care facilities inspected in accordance with program standards.
Direct Licensing Staff
FL
Child Care Regulation and Information
Percent of licensed child care homes inspected in accordance with program standards
Direct Licensing Staff
FL
Welfare Transition and Employment Supports
Percent of all applications for assistance processed within time standards.
Applicants and Economic Self-Sufficiency Staff
FL
Welfare Transition and Employment Supports Total number of applications processed FLORIDA system
FL
Welfare Transition and Employment Supports
Percent of food stamp benefits determined accurately FLORIDA system
FL
Welfare Transition and Employment Supports
Percent of cash assistance benefits determined accurately FLORIDA system
FL
Welfare Transition and Employment Supports
Percent of suspected fraud cases referred that result in front-end fraud prevention savings
ESS Fraud Prevention Staff
FL
Welfare Transition and Employment Supports Dollars collected through Benefit Recovery
Benefit Recovery System
FL
Welfare Transition and Employment Supports
Number of fraud prevention investigations completed
Departmental Eligibility Staff
State/County/City Subject Metric Current source
5
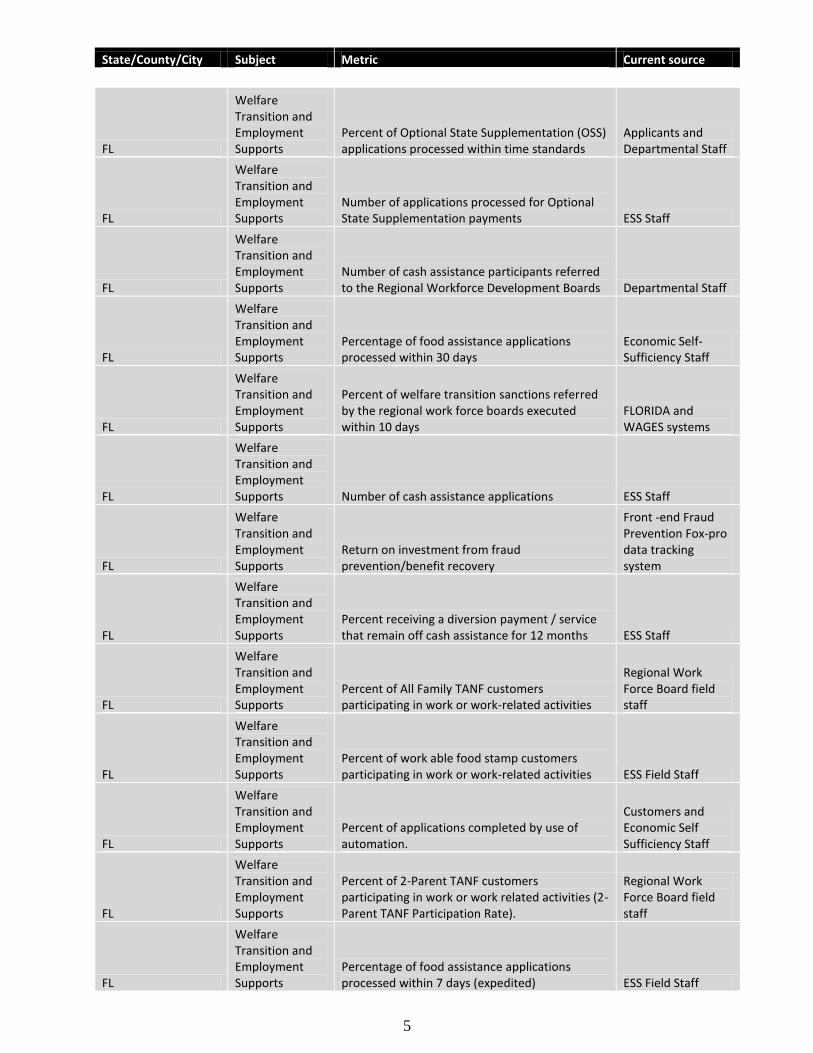
FL
Welfare Transition and Employment Supports
Percent of Optional State Supplementation (OSS) applications processed within time standards
Applicants and Departmental Staff
FL
Welfare Transition and Employment Supports
Number of applications processed for Optional State Supplementation payments ESS Staff
FL
Welfare Transition and Employment Supports
Number of cash assistance participants referred to the Regional Workforce Development Boards Departmental Staff
FL
Welfare Transition and Employment Supports
Percentage of food assistance applications processed within 30 days
Economic Self-Sufficiency Staff
FL
Welfare Transition and Employment Supports
Percent of welfare transition sanctions referred by the regional work force boards executed within 10 days
FLORIDA and WAGES systems
FL
Welfare Transition and Employment Supports Number of cash assistance applications ESS Staff
FL
Welfare Transition and Employment Supports
Return on investment from fraud prevention/benefit recovery
Front -end Fraud Prevention Fox-pro data tracking system
FL
Welfare Transition and Employment Supports
Percent receiving a diversion payment / service that remain off cash assistance for 12 months ESS Staff
FL
Welfare Transition and Employment Supports
Percent of All Family TANF customers participating in work or work-related activities
Regional Work Force Board field staff
FL
Welfare Transition and Employment Supports
Percent of work able food stamp customers participating in work or work-related activities ESS Field Staff
FL
Welfare Transition and Employment Supports
Percent of applications completed by use of automation.
Customers and Economic Self Sufficiency Staff
FL
Welfare Transition and Employment Supports
Percent of 2-Parent TANF customers participating in work or work related activities (2-Parent TANF Participation Rate).
Regional Work Force Board field staff
FL
Welfare Transition and Employment Supports
Percentage of food assistance applications processed within 7 days (expedited) ESS Field Staff
State/County/City Subject Metric Current source
6
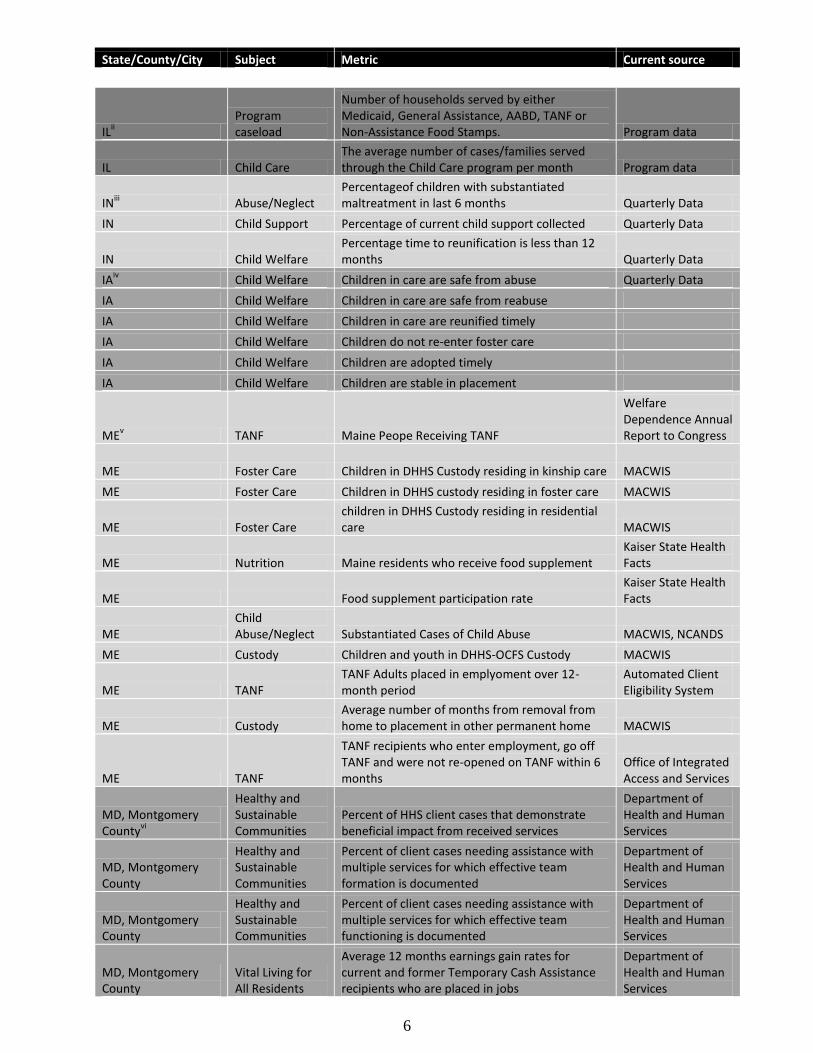
ILii
Program caseload
Number of households served by either Medicaid, General Assistance, AABD, TANF or Non-Assistance Food Stamps. Program data
IL Child Care The average number of cases/families served through the Child Care program per month Program data
INiii Abuse/Neglect
Percentageof children with substantiated maltreatment in last 6 months Quarterly Data
IN Child Support Percentage of current child support collected Quarterly Data
IN Child Welfare Percentage time to reunification is less than 12 months Quarterly Data
IAiv Child Welfare Children in care are safe from abuse Quarterly Data
IA Child Welfare Children in care are safe from reabuse
IA Child Welfare Children in care are reunified timely
IA Child Welfare Children do not re-enter foster care
IA Child Welfare Children are adopted timely
IA Child Welfare Children are stable in placement
MEv TANF Maine Peope Receiving TANF
Welfare Dependence Annual Report to Congress
ME Foster Care Children in DHHS Custody residing in kinship care MACWIS
ME Foster Care Children in DHHS custody residing in foster care MACWIS
ME Foster Care children in DHHS Custody residing in residential care MACWIS
ME Nutrition Maine residents who receive food supplement Kaiser State Health Facts
ME Food supplement participation rate Kaiser State Health Facts
ME Child Abuse/Neglect Substantiated Cases of Child Abuse MACWIS, NCANDS
ME Custody Children and youth in DHHS-OCFS Custody MACWIS
ME TANF TANF Adults placed in emplyoment over 12-month period
Automated Client Eligibility System
ME Custody Average number of months from removal from home to placement in other permanent home MACWIS
ME TANF
TANF recipients who enter employment, go off TANF and were not re-opened on TANF within 6 months
Office of Integrated Access and Services
MD, Montgomery County
vi
Healthy and Sustainable Communities
Percent of HHS client cases that demonstrate beneficial impact from received services
Department of Health and Human Services
MD, Montgomery County
Healthy and Sustainable Communities
Percent of client cases needing assistance with multiple services for which effective team formation is documented
Department of Health and Human Services
MD, Montgomery County
Healthy and Sustainable Communities
Percent of client cases needing assistance with multiple services for which effective team functioning is documented
Department of Health and Human Services
MD, Montgomery County
Vital Living for All Residents
Average 12 months earnings gain rates for current and former Temporary Cash Assistance recipients who are placed in jobs
Department of Health and Human Services
State/County/City Subject Metric Current source
7
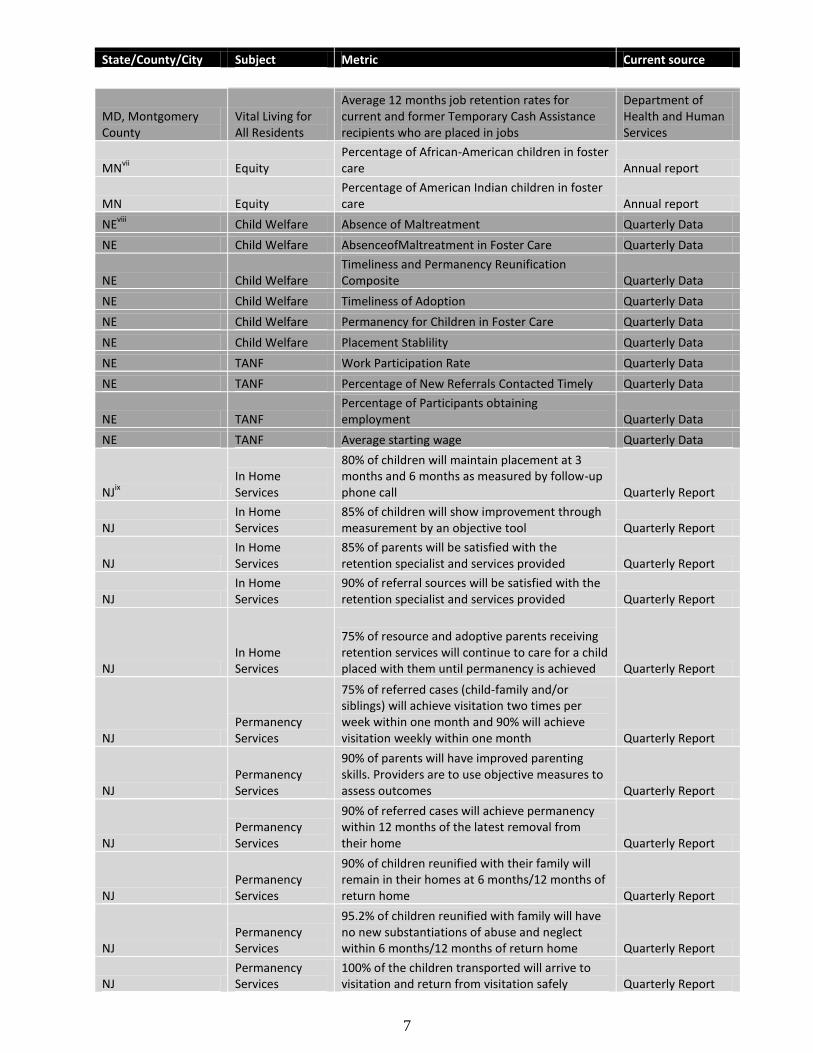
MD, Montgomery County
Vital Living for All Residents
Average 12 months job retention rates for current and former Temporary Cash Assistance recipients who are placed in jobs
Department of Health and Human Services
MNvii
Equity Percentage of African-American children in foster care Annual report
MN Equity Percentage of American Indian children in foster care Annual report
NEviii
Child Welfare Absence of Maltreatment Quarterly Data
NE Child Welfare AbsenceofMaltreatment in Foster Care Quarterly Data
NE Child Welfare Timeliness and Permanency Reunification Composite Quarterly Data
NE Child Welfare Timeliness of Adoption Quarterly Data
NE Child Welfare Permanency for Children in Foster Care Quarterly Data
NE Child Welfare Placement Stablility Quarterly Data
NE TANF Work Participation Rate Quarterly Data
NE TANF Percentage of New Referrals Contacted Timely Quarterly Data
NE TANF Percentage of Participants obtaining employment Quarterly Data
NE TANF Average starting wage Quarterly Data
NJix
In Home Services
80% of children will maintain placement at 3 months and 6 months as measured by follow-up phone call Quarterly Report
NJ In Home Services
85% of children will show improvement through measurement by an objective tool Quarterly Report
NJ In Home Services
85% of parents will be satisfied with the retention specialist and services provided Quarterly Report
NJ In Home Services
90% of referral sources will be satisfied with the retention specialist and services provided Quarterly Report
NJ In Home Services
75% of resource and adoptive parents receiving retention services will continue to care for a child placed with them until permanency is achieved Quarterly Report
NJ Permanency Services
75% of referred cases (child-family and/or siblings) will achieve visitation two times per week within one month and 90% will achieve visitation weekly within one month Quarterly Report
NJ Permanency Services
90% of parents will have improved parenting skills. Providers are to use objective measures to assess outcomes Quarterly Report
NJ Permanency Services
90% of referred cases will achieve permanency within 12 months of the latest removal from their home Quarterly Report
NJ Permanency Services
90% of children reunified with their family will remain in their homes at 6 months/12 months of return home Quarterly Report
NJ Permanency Services
95.2% of children reunified with family will have no new substantiations of abuse and neglect within 6 months/12 months of return home Quarterly Report
NJ Permanency Services
100% of the children transported will arrive to visitation and return from visitation safely Quarterly Report

State/County/City Subject Metric Current source
8
NJ Permanency Services
90% of children in out of home care will visit regularly with siblings in other placements in accordance with their case plans and if in the best interest of all involved siblings Quarterly Report
NJ Permanency Services
95% of reports documenting the interactions and reactions of all involved parties to the visitation will be submitted timely to the Division Quarterly Report
NJ Permanency Services
90% of children in out of home care will visit regularly with their parent(s) or other legally responsible family member at least weekly and in accordance with their case plan Quarterly Report
NJ Permanency Services
90% of all children and families will be either reunified or have an approved permanent plan within 12 months of the child’s entry into out of home placement Quarterly Report
NJ Permanency Services
86% of children reunified with their families will not re-enter placement for at least 12 months following reunification Quarterly Report
NJ Out of Home Care
70% of children will be discharged to a less restrictive setting/level of care within 9 to 12 months of admission Quarterly Report
NJ Out of Home Care
70% of children will have lower aggregate scores on the Strengths and Needs Assessment from admission to discharge Quarterly Report
NJ Out of Home Care
TBD% of children will not have new out of home admissions at 6 months post-discharge Quarterly Report
NJ Out of Home Care
Average length of stay will be reduced by 10% from the previous year until an agreed upon benchmark is reached Quarterly Report
NJ Out of Home Care
99.47% of youth will not have any substantiated abuse or neglect while in shelter care Quarterly Report
NJ Out of Home Care
95% of youth entering out of home care shall receive a full medical examination within 30 days of placement Quarterly Report
NJ Out of Home Care
95% of youth will have a discharge plan developed within 48 hours of admission Quarterly Report
NJ Out of Home Care
90% of children remain in their 1st placement since entry into care Quarterly Report
NJ Out of Home Care
65% of children are placed within the community from which they were removed Quarterly Report
NJ Out of Home Care
65% of children are placed with a group of 2 or 3 of their siblings in care at the same time or within 30 days of each other, if the level of care is compatible and it is in accordance with all their case plans Quarterly Report
NJ Out of Home Care
70% of children will be discharged to a less restrictive setting/level of care (treatment homes) within 9 to 12 months Quarterly Report
NJ Out of Home Care
70% of children will have lower scores across domains of the Strengths and Needs Assessment Quarterly Report
NJ Out of Home Care
Average length of stay will be reduced by 10% from the previous year Quarterly Report
State/County/City Subject Metric Current source
9
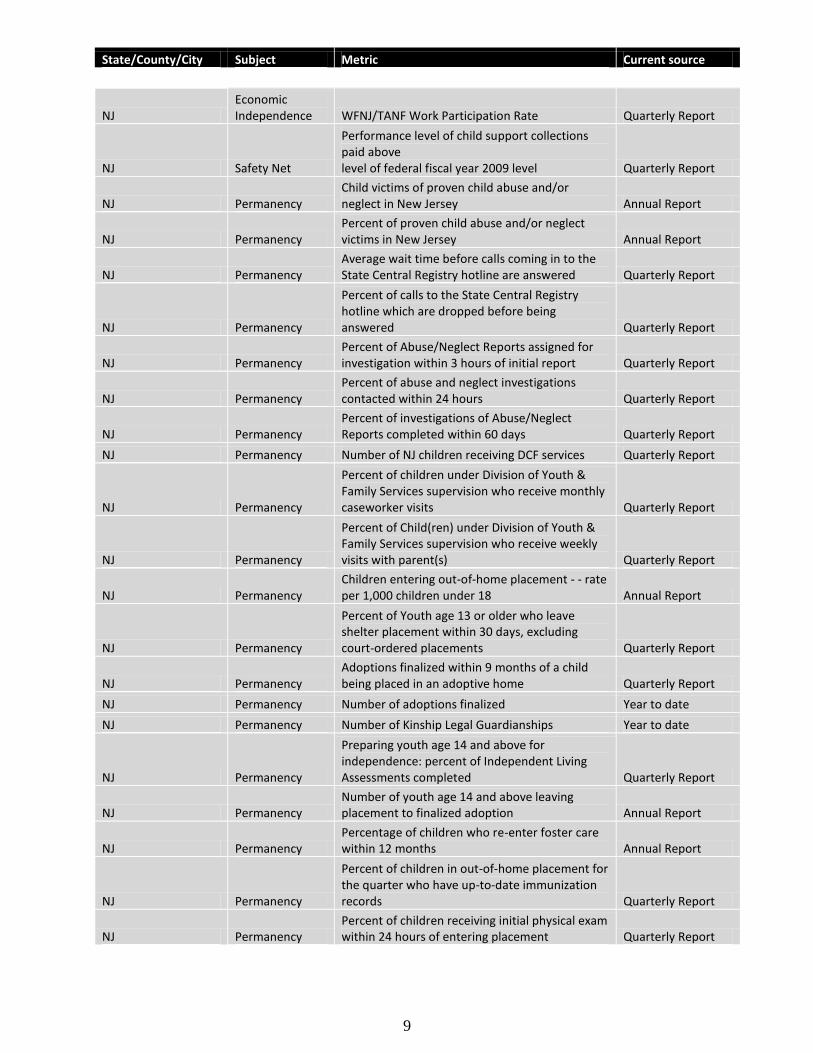
NJ Economic Independence WFNJ/TANF Work Participation Rate Quarterly Report
NJ Safety Net
Performance level of child support collections paid above level of federal fiscal year 2009 level Quarterly Report
NJ Permanency Child victims of proven child abuse and/or neglect in New Jersey Annual Report
NJ Permanency Percent of proven child abuse and/or neglect victims in New Jersey Annual Report
NJ Permanency Average wait time before calls coming in to the State Central Registry hotline are answered Quarterly Report
NJ Permanency
Percent of calls to the State Central Registry hotline which are dropped before being answered Quarterly Report
NJ Permanency Percent of Abuse/Neglect Reports assigned for investigation within 3 hours of initial report Quarterly Report
NJ Permanency Percent of abuse and neglect investigations contacted within 24 hours Quarterly Report
NJ Permanency Percent of investigations of Abuse/Neglect Reports completed within 60 days Quarterly Report
NJ Permanency Number of NJ children receiving DCF services Quarterly Report
NJ Permanency
Percent of children under Division of Youth & Family Services supervision who receive monthly caseworker visits Quarterly Report
NJ Permanency
Percent of Child(ren) under Division of Youth & Family Services supervision who receive weekly visits with parent(s) Quarterly Report
NJ Permanency Children entering out-of-home placement - - rate per 1,000 children under 18 Annual Report
NJ Permanency
Percent of Youth age 13 or older who leave shelter placement within 30 days, excluding court-ordered placements Quarterly Report
NJ Permanency Adoptions finalized within 9 months of a child being placed in an adoptive home Quarterly Report
NJ Permanency Number of adoptions finalized Year to date
NJ Permanency Number of Kinship Legal Guardianships Year to date
NJ Permanency
Preparing youth age 14 and above for independence: percent of Independent Living Assessments completed Quarterly Report
NJ Permanency Number of youth age 14 and above leaving placement to finalized adoption Annual Report
NJ Permanency Percentage of children who re-enter foster care within 12 months Annual Report
NJ Permanency
Percent of children in out-of-home placement for the quarter who have up-to-date immunization records Quarterly Report
NJ Permanency Percent of children receiving initial physical exam within 24 hours of entering placement Quarterly Report
State/County/City Subject Metric Current source
10
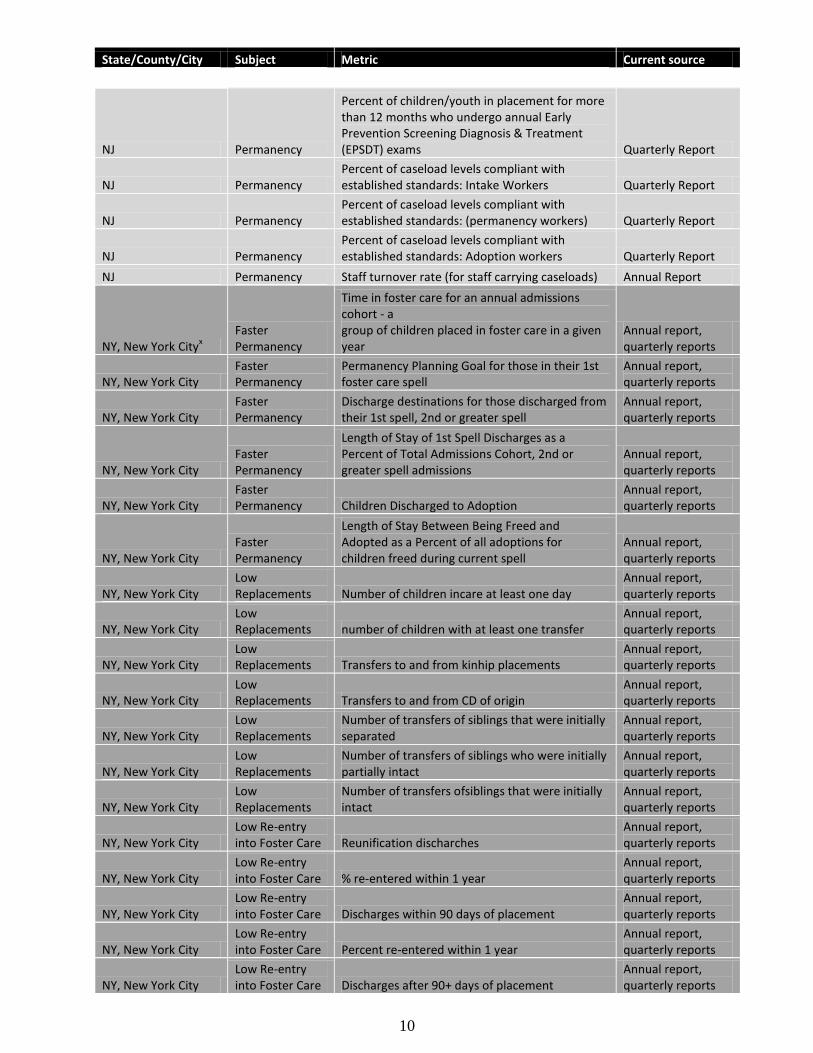
NJ Permanency
Percent of children/youth in placement for more than 12 months who undergo annual Early Prevention Screening Diagnosis & Treatment (EPSDT) exams Quarterly Report
NJ Permanency Percent of caseload levels compliant with established standards: Intake Workers Quarterly Report
NJ Permanency Percent of caseload levels compliant with established standards: (permanency workers) Quarterly Report
NJ Permanency Percent of caseload levels compliant with established standards: Adoption workers Quarterly Report
NJ Permanency Staff turnover rate (for staff carrying caseloads) Annual Report
NY, New York Cityx
Faster Permanency
Time in foster care for an annual admissions cohort - a group of children placed in foster care in a given year
Annual report, quarterly reports
NY, New York City Faster Permanency
Permanency Planning Goal for those in their 1st foster care spell
Annual report, quarterly reports
NY, New York City Faster Permanency
Discharge destinations for those discharged from their 1st spell, 2nd or greater spell
Annual report, quarterly reports
NY, New York City Faster Permanency
Length of Stay of 1st Spell Discharges as a Percent of Total Admissions Cohort, 2nd or greater spell admissions
Annual report, quarterly reports
NY, New York City Faster Permanency Children Discharged to Adoption
Annual report, quarterly reports
NY, New York City Faster Permanency
Length of Stay Between Being Freed and Adopted as a Percent of all adoptions for children freed during current spell
Annual report, quarterly reports
NY, New York City Low Replacements Number of children incare at least one day
Annual report, quarterly reports
NY, New York City Low Replacements number of children with at least one transfer
Annual report, quarterly reports
NY, New York City Low Replacements Transfers to and from kinhip placements
Annual report, quarterly reports
NY, New York City Low Replacements Transfers to and from CD of origin
Annual report, quarterly reports
NY, New York City Low Replacements
Number of transfers of siblings that were initially separated
Annual report, quarterly reports
NY, New York City Low Replacements
Number of transfers of siblings who were initially partially intact
Annual report, quarterly reports
NY, New York City Low Replacements
Number of transfers ofsiblings that were initially intact
Annual report, quarterly reports
NY, New York City Low Re-entry into Foster Care Reunification discharches
Annual report, quarterly reports
NY, New York City Low Re-entry into Foster Care % re-entered within 1 year
Annual report, quarterly reports
NY, New York City Low Re-entry into Foster Care Discharges within 90 days of placement
Annual report, quarterly reports
NY, New York City Low Re-entry into Foster Care Percent re-entered within 1 year
Annual report, quarterly reports
NY, New York City Low Re-entry into Foster Care Discharges after 90+ days of placement
Annual report, quarterly reports
State/County/City Subject Metric Current source
11
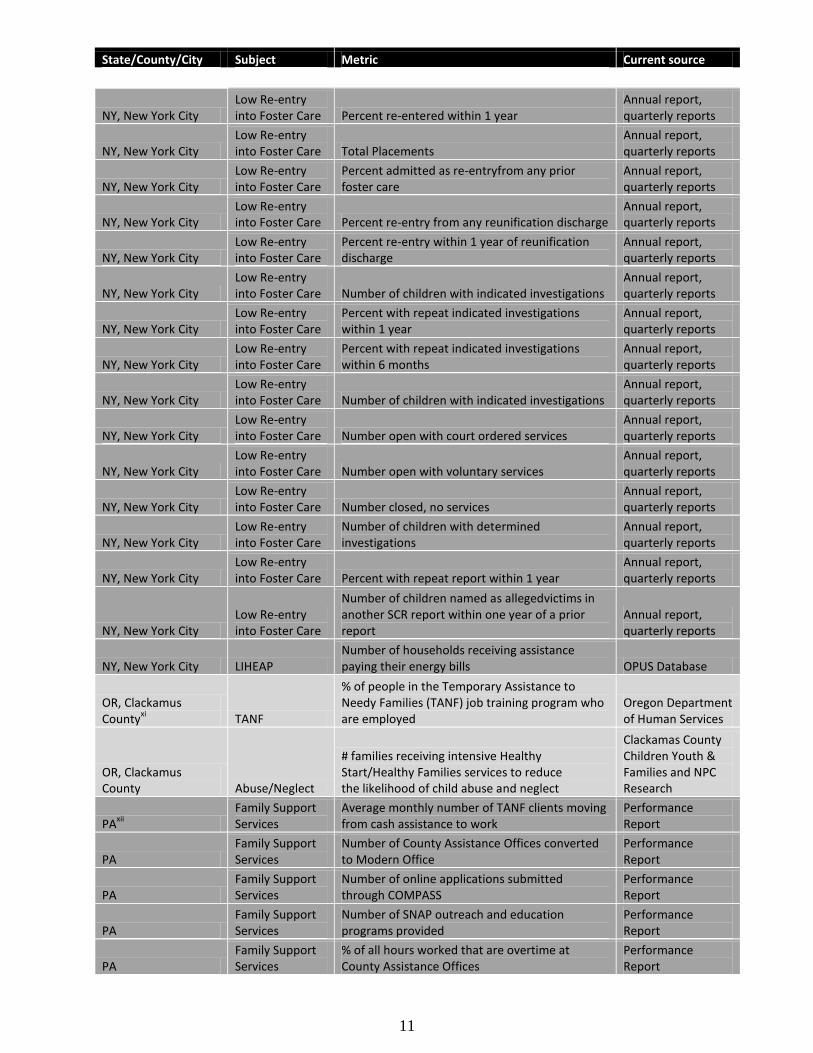
NY, New York City Low Re-entry into Foster Care Percent re-entered within 1 year
Annual report, quarterly reports
NY, New York City Low Re-entry into Foster Care Total Placements
Annual report, quarterly reports
NY, New York City Low Re-entry into Foster Care
Percent admitted as re-entryfrom any prior foster care
Annual report, quarterly reports
NY, New York City Low Re-entry into Foster Care Percent re-entry from any reunification discharge
Annual report, quarterly reports
NY, New York City Low Re-entry into Foster Care
Percent re-entry within 1 year of reunification discharge
Annual report, quarterly reports
NY, New York City Low Re-entry into Foster Care Number of children with indicated investigations
Annual report, quarterly reports
NY, New York City Low Re-entry into Foster Care
Percent with repeat indicated investigations within 1 year
Annual report, quarterly reports
NY, New York City Low Re-entry into Foster Care
Percent with repeat indicated investigations within 6 months
Annual report, quarterly reports
NY, New York City Low Re-entry into Foster Care Number of children with indicated investigations
Annual report, quarterly reports
NY, New York City Low Re-entry into Foster Care Number open with court ordered services
Annual report, quarterly reports
NY, New York City Low Re-entry into Foster Care Number open with voluntary services
Annual report, quarterly reports
NY, New York City Low Re-entry into Foster Care Number closed, no services
Annual report, quarterly reports
NY, New York City Low Re-entry into Foster Care
Number of children with determined investigations
Annual report, quarterly reports
NY, New York City Low Re-entry into Foster Care Percent with repeat report within 1 year
Annual report, quarterly reports
NY, New York City Low Re-entry into Foster Care
Number of children named as allegedvictims in another SCR report within one year of a prior report
Annual report, quarterly reports
NY, New York City LIHEAP Number of households receiving assistance paying their energy bills OPUS Database
OR, Clackamus County
xi TANF
% of people in the Temporary Assistance to Needy Families (TANF) job training program who are employed
Oregon Department of Human Services
OR, Clackamus County Abuse/Neglect
# families receiving intensive Healthy Start/Healthy Families services to reduce the likelihood of child abuse and neglect
Clackamas County Children Youth & Families and NPC Research
PAxii
Family Support Services
Average monthly number of TANF clients moving from cash assistance to work
Performance Report
PA Family Support Services
Number of County Assistance Offices converted to Modern Office
Performance Report
PA Family Support Services
Number of online applications submitted through COMPASS
Performance Report
PA Family Support Services
Number of SNAP outreach and education programs provided
Performance Report
PA Family Support Services
% of all hours worked that are overtime at County Assistance Offices
Performance Report
State/County/City Subject Metric Current source
12
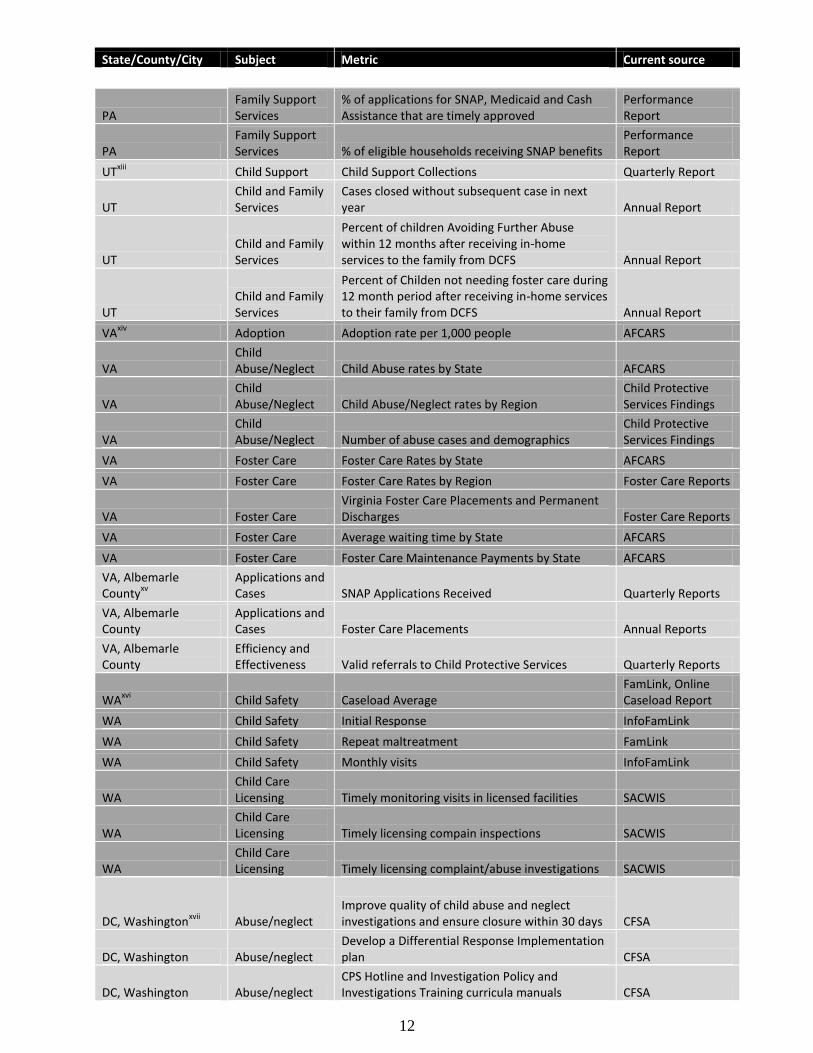
PA Family Support Services
% of applications for SNAP, Medicaid and Cash Assistance that are timely approved
Performance Report
PA Family Support Services % of eligible households receiving SNAP benefits
Performance Report
UTxiii
Child Support Child Support Collections Quarterly Report
UT Child and Family Services
Cases closed without subsequent case in next year Annual Report
UT Child and Family Services
Percent of children Avoiding Further Abuse within 12 months after receiving in-home services to the family from DCFS Annual Report
UT Child and Family Services
Percent of Childen not needing foster care during 12 month period after receiving in-home services to their family from DCFS Annual Report
VAxiv
Adoption Adoption rate per 1,000 people AFCARS
VA Child Abuse/Neglect Child Abuse rates by State AFCARS
VA Child Abuse/Neglect Child Abuse/Neglect rates by Region
Child Protective Services Findings
VA Child Abuse/Neglect Number of abuse cases and demographics
Child Protective Services Findings
VA Foster Care Foster Care Rates by State AFCARS
VA Foster Care Foster Care Rates by Region Foster Care Reports
VA Foster Care Virginia Foster Care Placements and Permanent Discharges Foster Care Reports
VA Foster Care Average waiting time by State AFCARS
VA Foster Care Foster Care Maintenance Payments by State AFCARS
VA, Albemarle County
xv
Applications and Cases SNAP Applications Received Quarterly Reports
VA, Albemarle County
Applications and Cases Foster Care Placements Annual Reports
VA, Albemarle County
Efficiency and Effectiveness Valid referrals to Child Protective Services Quarterly Reports
WAxvi
Child Safety Caseload Average FamLink, Online Caseload Report
WA Child Safety Initial Response InfoFamLink
WA Child Safety Repeat maltreatment FamLink
WA Child Safety Monthly visits InfoFamLink
WA Child Care Licensing Timely monitoring visits in licensed facilities SACWIS
WA Child Care Licensing Timely licensing compain inspections SACWIS
WA Child Care Licensing Timely licensing complaint/abuse investigations SACWIS
DC, Washingtonxvii
Abuse/neglect Improve quality of child abuse and neglect investigations and ensure closure within 30 days CFSA
DC, Washington Abuse/neglect Develop a Differential Response Implementation plan CFSA
DC, Washington Abuse/neglect CPS Hotline and Investigation Policy and Investigations Training curricula manuals CFSA
State/County/City Subject Metric Current source
13
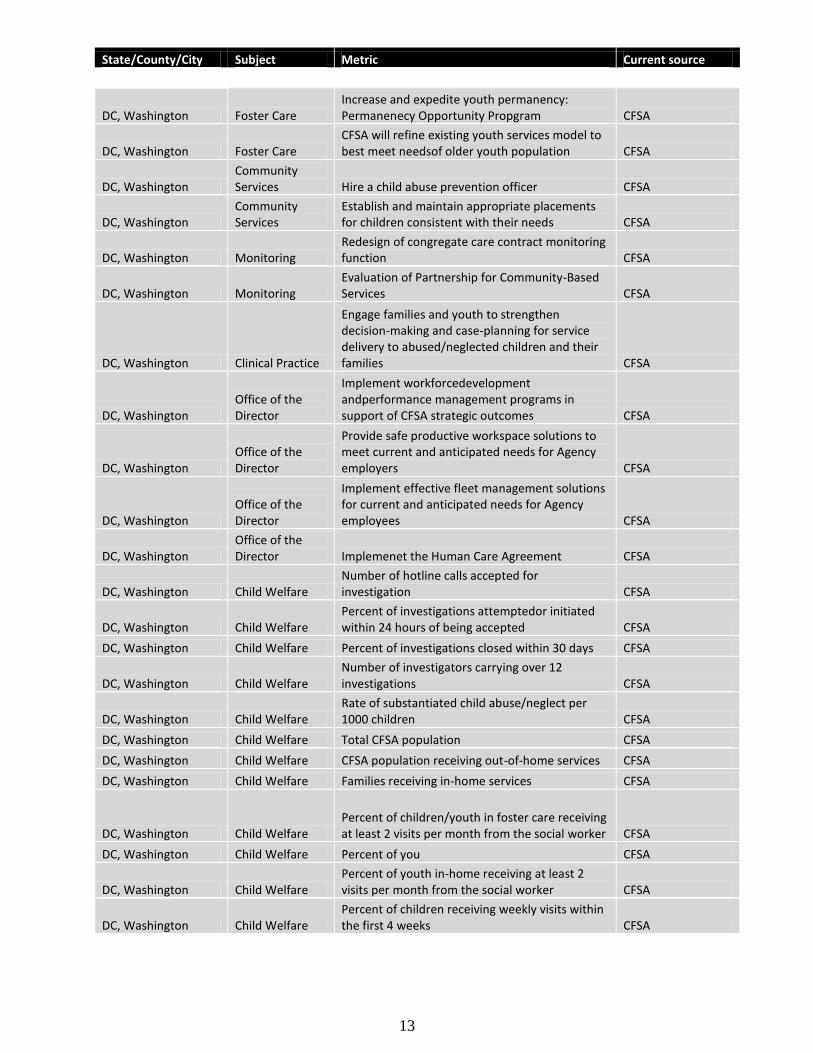
DC, Washington Foster Care Increase and expedite youth permanency: Permanenecy Opportunity Propgram CFSA
DC, Washington Foster Care CFSA will refine existing youth services model to best meet needsof older youth population CFSA
DC, Washington Community Services Hire a child abuse prevention officer CFSA
DC, Washington Community Services
Establish and maintain appropriate placements for children consistent with their needs CFSA
DC, Washington Monitoring Redesign of congregate care contract monitoring function CFSA
DC, Washington Monitoring Evaluation of Partnership for Community-Based Services CFSA
DC, Washington Clinical Practice
Engage families and youth to strengthen decision-making and case-planning for service delivery to abused/neglected children and their families CFSA
DC, Washington Office of the Director
Implement workforcedevelopment andperformance management programs in support of CFSA strategic outcomes CFSA
DC, Washington Office of the Director
Provide safe productive workspace solutions to meet current and anticipated needs for Agency employers CFSA
DC, Washington Office of the Director
Implement effective fleet management solutions for current and anticipated needs for Agency employees CFSA
DC, Washington Office of the Director Implemenet the Human Care Agreement CFSA
DC, Washington Child Welfare Number of hotline calls accepted for investigation CFSA
DC, Washington Child Welfare Percent of investigations attemptedor initiated within 24 hours of being accepted CFSA
DC, Washington Child Welfare Percent of investigations closed within 30 days CFSA
DC, Washington Child Welfare Number of investigators carrying over 12 investigations CFSA
DC, Washington Child Welfare Rate of substantiated child abuse/neglect per 1000 children CFSA
DC, Washington Child Welfare Total CFSA population CFSA
DC, Washington Child Welfare CFSA population receiving out-of-home services CFSA
DC, Washington Child Welfare Families receiving in-home services CFSA
DC, Washington Child Welfare Percent of children/youth in foster care receiving at least 2 visits per month from the social worker CFSA
DC, Washington Child Welfare Percent of you CFSA
DC, Washington Child Welfare Percent of youth in-home receiving at least 2 visits per month from the social worker CFSA
DC, Washington Child Welfare Percent of children receiving weekly visits within the first 4 weeks CFSA
State/County/City Subject Metric Current source
14
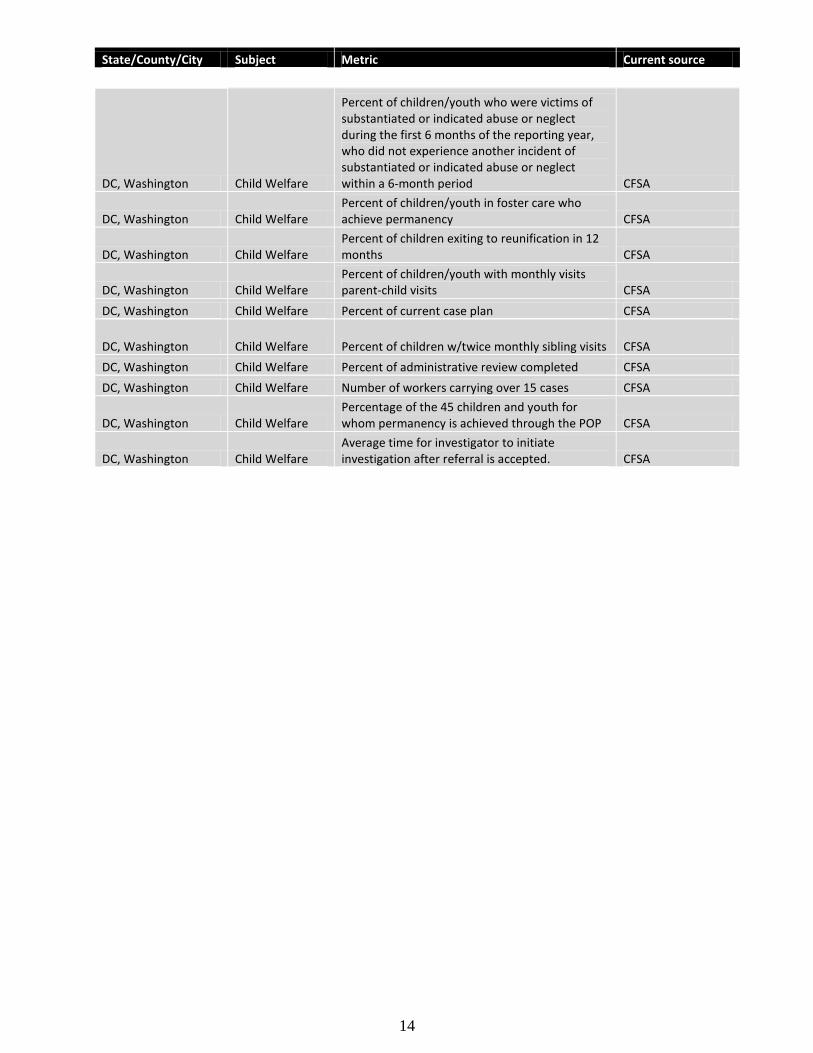
DC, Washington Child Welfare
Percent of children/youth who were victims of substantiated or indicated abuse or neglect during the first 6 months of the reporting year, who did not experience another incident of substantiated or indicated abuse or neglect within a 6‐month period CFSA
DC, Washington Child Welfare Percent of children/youth in foster care who achieve permanency CFSA
DC, Washington Child Welfare Percent of children exiting to reunification in 12 months CFSA
DC, Washington Child Welfare Percent of children/youth with monthly visits parent‐child visits CFSA
DC, Washington Child Welfare Percent of current case plan CFSA
DC, Washington Child Welfare Percent of children w/twice monthly sibling visits CFSA
DC, Washington Child Welfare Percent of administrative review completed CFSA
DC, Washington Child Welfare Number of workers carrying over 15 cases CFSA
DC, Washington Child Welfare Percentage of the 45 children and youth for whom permanency is achieved through the POP CFSA
DC, Washington Child Welfare Average time for investigator to initiate investigation after referral is accepted. CFSA
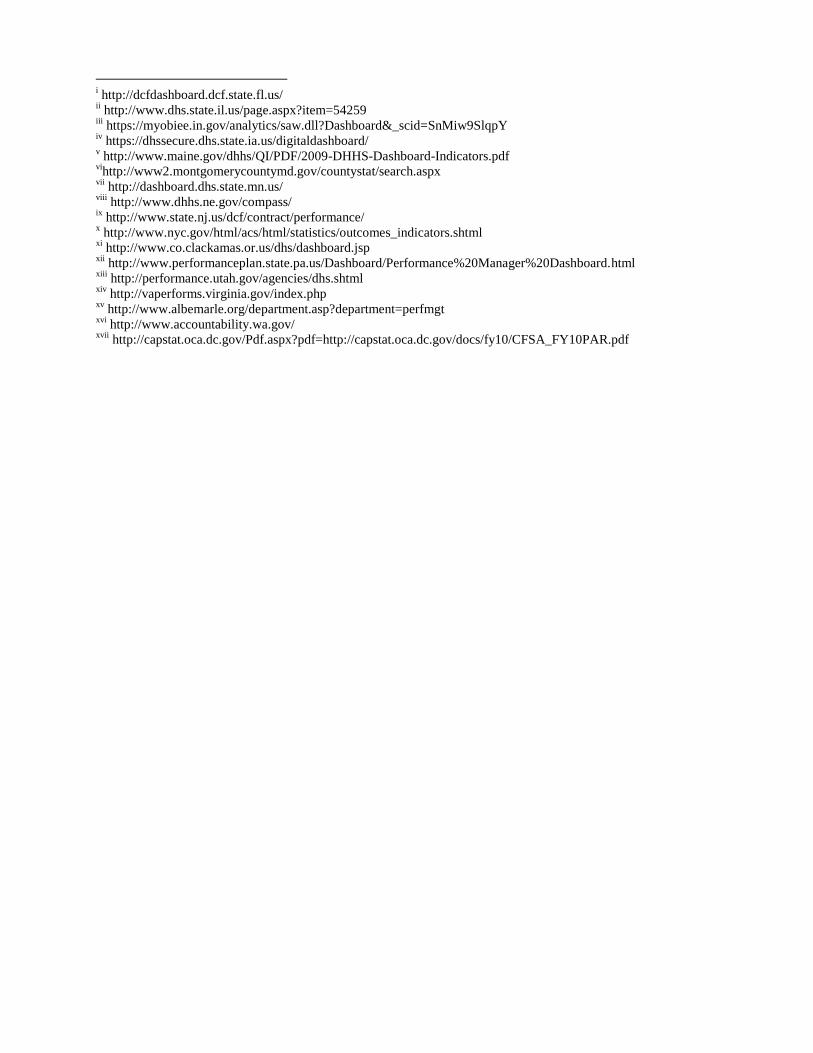
i http://dcfdashboard.dcf.state.fl.us/
ii http://www.dhs.state.il.us/page.aspx?item=54259
iii https://myobiee.in.gov/analytics/saw.dll?Dashboard&_scid=SnMiw9SlqpY
iv https://dhssecure.dhs.state.ia.us/digitaldashboard/
v http://www.maine.gov/dhhs/QI/PDF/2009-DHHS-Dashboard-Indicators.pdf
vihttp://www2.montgomerycountymd.gov/countystat/search.aspx
vii http://dashboard.dhs.state.mn.us/
viii http://www.dhhs.ne.gov/compass/
ix http://www.state.nj.us/dcf/contract/performance/
x http://www.nyc.gov/html/acs/html/statistics/outcomes_indicators.shtml
xi http://www.co.clackamas.or.us/dhs/dashboard.jsp
xii http://www.performanceplan.state.pa.us/Dashboard/Performance%20Manager%20Dashboard.html
xiii http://performance.utah.gov/agencies/dhs.shtml
xiv http://vaperforms.virginia.gov/index.php
xv http://www.albemarle.org/department.asp?department=perfmgt
xvi http://www.accountability.wa.gov/
xvii http://capstat.oca.dc.gov/Pdf.aspx?pdf=http://capstat.oca.dc.gov/docs/fy10/CFSA_FY10PAR.pdf