appendix b bore hole logs - juneau · split spoon blow counts shown are uncorrected raw data....
TRANSCRIPT
Juneau International Runway 8/26 Rehabilitation November 2013 Geotechnical Report – APPENDIX B Juneau, Alaska
APPENDIX B
Bore Hole Logs
BOREHOLE LOGS FIGURE
Designed:
Drawn:
Checked:
Project No.:
Date:
PND
PND
PND
B-1
STANDARD BOREHOLELOG DETAILS
132070
Oct 2013
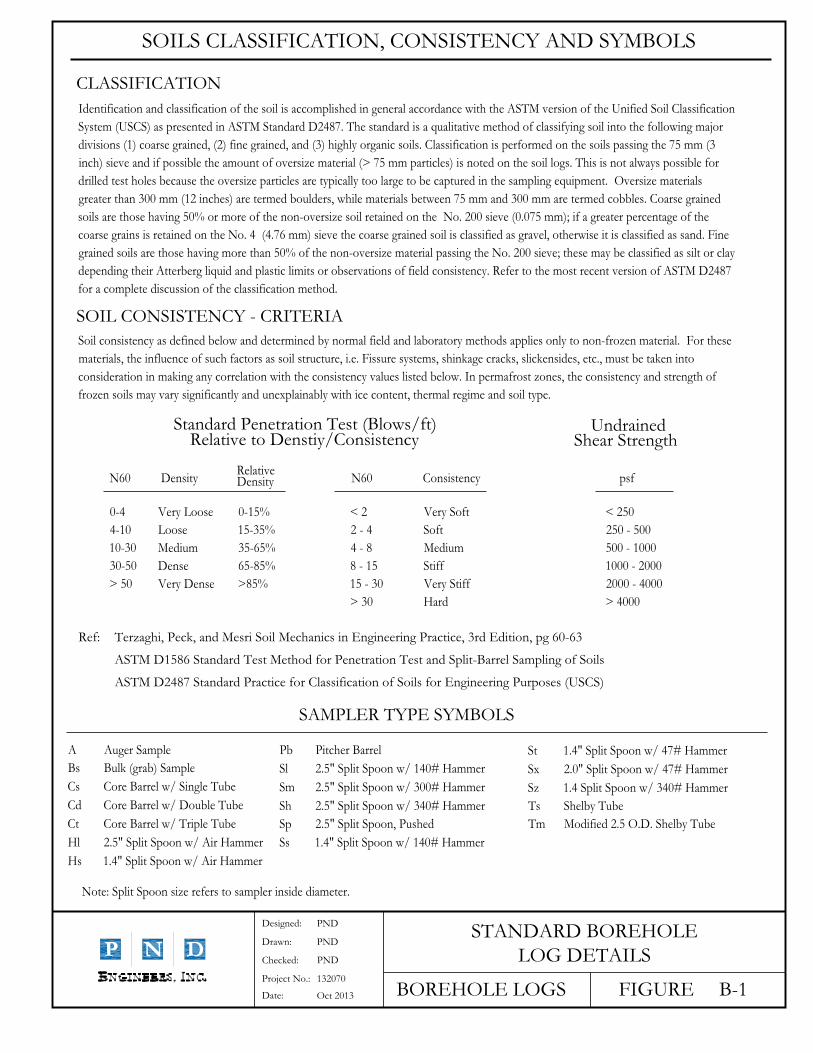
SOILS CLASSIFICATION, CONSISTENCY AND SYMBOLS
CLASSIFICATION
Identification and classification of the soil is accomplished in general accordance with the ASTM version of the Unified Soil Classification
System (USCS) as presented in ASTM Standard D2487. The standard is a qualitative method of classifying soil into the following major
divisions (1) coarse grained, (2) fine grained, and (3) highly organic soils. Classification is performed on the soils passing the 75 mm (3
inch) sieve and if possible the amount of oversize material (> 75 mm particles) is noted on the soil logs. This is not always possible for
drilled test holes because the oversize particles are typically too large to be captured in the sampling equipment. Oversize materials
greater than 300 mm (12 inches) are termed boulders, while materials between 75 mm and 300 mm are termed cobbles. Coarse grained
soils are those having 50% or more of the non-oversize soil retained on the No. 200 sieve (0.075 mm); if a greater percentage of the
coarse grains is retained on the No. 4 (4.76 mm) sieve the coarse grained soil is classified as gravel, otherwise it is classified as sand. Fine
grained soils are those having more than 50% of the non-oversize material passing the No. 200 sieve; these may be classified as silt or clay
depending their Atterberg liquid and plastic limits or observations of field consistency. Refer to the most recent version of ASTM D2487
for a complete discussion of the classification method.
SOIL CONSISTENCY - CRITERIA
Soil consistency as defined below and determined by normal field and laboratory methods applies only to non-frozen material. For these
materials, the influence of such factors as soil structure, i.e. Fissure systems, shinkage cracks, slickensides, etc., must be taken into
consideration in making any correlation with the consistency values listed below. In permafrost zones, the consistency and strength of
frozen soils may vary significantly and unexplainably with ice content, thermal regime and soil type.
Standard Penetration Test (Blows/ft)Relative to Denstiy/Consistency
N60 Density
0-4
4-10
10-30
30-50
> 50
Very Loose
Loose
Medium
Dense
Very Dense
< 250
250 - 500
500 - 1000
1000 - 2000
2000 - 4000
> 4000
0-15%
15-35%
35-65%
65-85%
>85%
< 2
2 - 4
4 - 8
8 - 15
15 - 30
> 30
Very Soft
Soft
Medium
Stiff
Very Stiff
Hard
Ref: Terzaghi, Peck, and Mesri Soil Mechanics in Engineering Practice, 3rd Edition, pg 60-63
ASTM D1586 Standard Test Method for Penetration Test and Split-Barrel Sampling of Soils
ASTM D2487 Standard Practice for Classification of Soils for Engineering Purposes (USCS)
Note: Split Spoon size refers to sampler inside diameter.
A Auger Sample
Bs Bulk (grab) Sample
Cs Core Barrel w/ Single Tube
Cd Core Barrel w/ Double Tube
Ct Core Barrel w/ Triple Tube
Hl 2.5" Split Spoon w/ Air Hammer
Hs 1.4" Split Spoon w/ Air Hammer
SAMPLER TYPE SYMBOLS
Pb Pitcher Barrel
Sl 2.5" Split Spoon w/ 140# Hammer
Sm 2.5" Split Spoon w/ 300# Hammer
Sh 2.5" Split Spoon w/ 340# Hammer
Sp 2.5" Split Spoon, Pushed
Ss 1.4" Split Spoon w/ 140# Hammer
St 1.4" Split Spoon w/ 47# Hammer
Sx 2.0" Split Spoon w/ 47# Hammer
Sz 1.4 Split Spoon w/ 340# Hammer
Ts Shelby Tube
Tm Modified 2.5 O.D. Shelby Tube
N60 Consistency psf
UndrainedShear Strength
RelativeDensity
BOREHOLE LOGS FIGURE B-2
0
SAMPLES COMMENTS
Casing Depth, Drilling Rate,Fluid Loss, Drill Pressure,
Tests, InstrumentationAdditional Information
GRAPH
2
Other InformationSoil Structure, Mineralogy,
Condition, Relative Density,Soil Name, Color, Moisture
SOIL DESCRIPTION
20 40 60 80
1 2 3 4
2 4 6 8Dep
th (F
eet)
Wat
er T
able
GR
APH
ICSY
MB
OL
Num
ber
Typ
e
Loca
tion
Rec
over
y(%
)
PenetrationBlows per
6/Inch(per Foot)* E
leva
tion
(Fee
t)
22.43
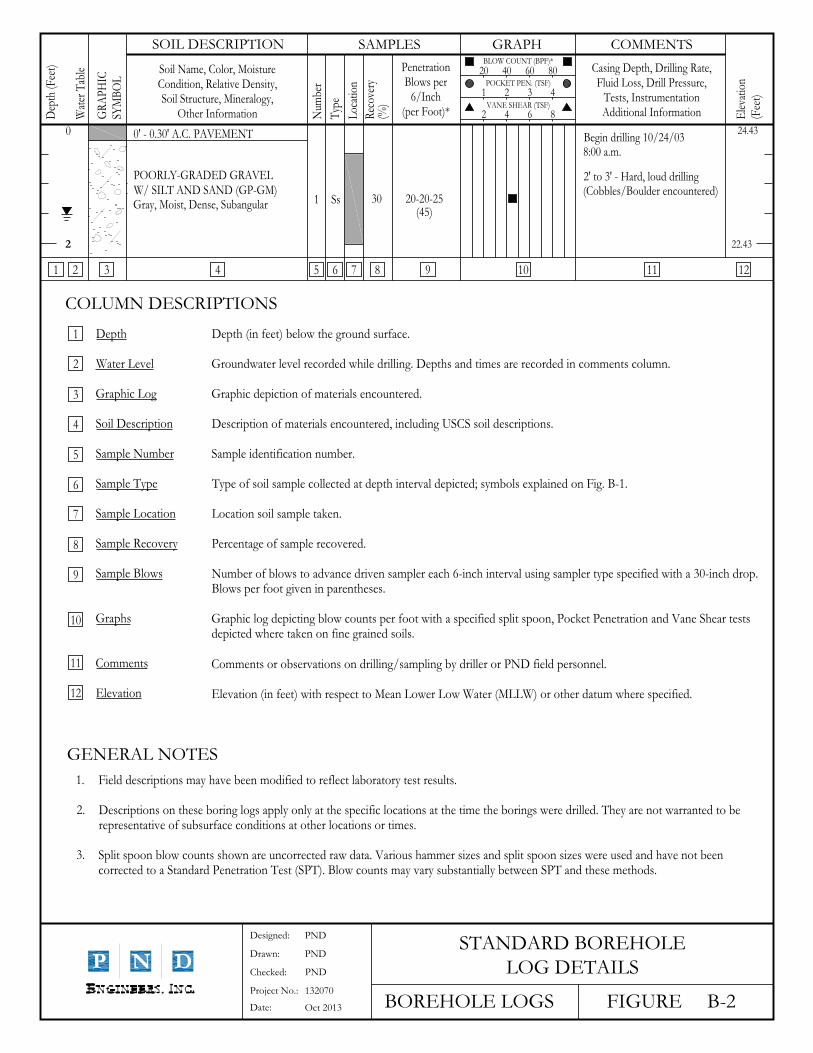
24.430' - 0.30' A.C. PAVEMENT Begin drilling 10/24/038:00 a.m.
2' to 3' - Hard, loud drilling(Cobbles/Boulder encountered)
POORLY-GRADED GRAVELW/ SILT AND SAND (GP-GM)Gray, Moist, Dense, Subangular
STANDARD BOREHOLELOG DETAILS
Designed:
Drawn:
Checked:
Project No.:
Date:
PND
PND
PND
132070
Oct 2013
BLOW COUNT (BPF)*
POCKET PEN. (TSF)
VANE SHEAR (TSF)
Depth (in feet) below the ground surface.
Groundwater level recorded while drilling. Depths and times are recorded in comments column.
Graphic depiction of materials encountered.
Description of materials encountered, including USCS soil descriptions.
Sample identification number.
Type of soil sample collected at depth interval depicted; symbols explained on Fig. B-1.
Location soil sample taken.
Percentage of sample recovered.
Number of blows to advance driven sampler each 6-inch interval using sampler type specified with a 30-inch drop.Blows per foot given in parentheses.
Graphic log depicting blow counts per foot with a specified split spoon, Pocket Penetration and Vane Shear testsdepicted where taken on fine grained soils.
Comments or observations on drilling/sampling by driller or PND field personnel.
Elevation (in feet) with respect to Mean Lower Low Water (MLLW) or other datum where specified.
Depth
Water Level
Graphic Log
Soil Description
Sample Number
Sample Type
Sample Location
Sample Recovery
Sample Blows
Graphs
Comments
Elevation
12111098765431 2
1
2
3
4
5
6
7
8
9
10
11
12
GENERAL NOTES
Field descriptions may have been modified to reflect laboratory test results.
Descriptions on these boring logs apply only at the specific locations at the time the borings were drilled. They are not warranted to berepresentative of subsurface conditions at other locations or times.
Split spoon blow counts shown are uncorrected raw data. Various hammer sizes and split spoon sizes were used and have not beencorrected to a Standard Penetration Test (SPT). Blow counts may vary substantially between SPT and these methods.
30 20-20-25Ss1(45)
1.
2.
3.
COLUMN DESCRIPTIONS
BOREHOLE LOGS FIGURE B-3
STANDARD BOREHOLELOG DETAILS
Designed:
Drawn:
Checked:
Project No.:
Date:
PND
PND
PND
132070
Oct 2013
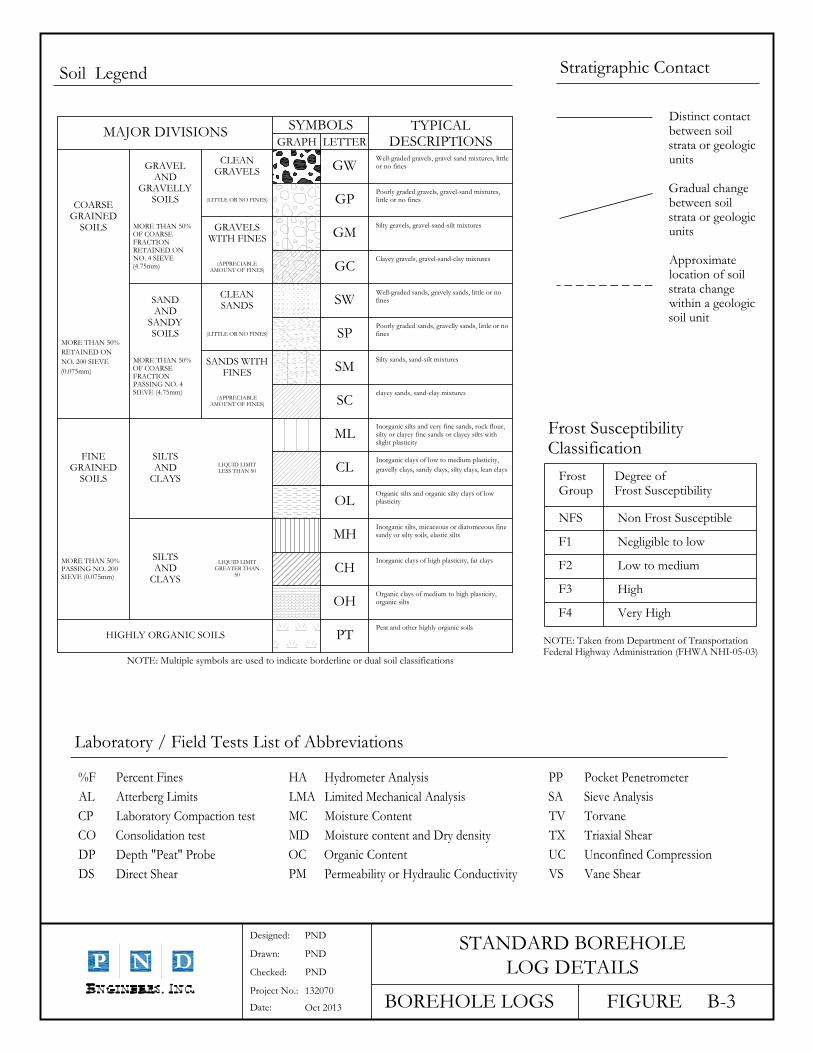
Laboratory / Field Tests List of Abbreviations
Soil Legend
%F
AL
CP
CO
DP
DS
Hydrometer Analysis
Limited Mechanical Analysis
Moisture Content
Moisture content and Dry density
Organic Content
Permeability or Hydraulic Conductivity
Percent Fines
Atterberg Limits
Laboratory Compaction test
Consolidation test
Depth "Peat" Probe
Direct Shear
HA
LMA
MC
MD
OC
PM
Stratigraphic Contact
Pocket Penetrometer
Sieve Analysis
Torvane
Triaxial Shear
Unconfined Compression
Vane Shear
PP
SA
TV
TX
UC
VS
Well-graded gravels, gravel sand mixtures, littleor no fines
Organic silts and organic silty clays of lowplasticity
Poorly graded gravels, gravel-sand mixtures,little or no fines
Silty gravels, gravel-sand-silt mixtures
Clayey gravels, gravel-sand-clay mixtures
Well-graded sands, gravely sands, little or nofines
Poorly graded sands, gravelly sands, little or nofines
Silty sands, sand-silt mixtures
clayey sands, sand-clay mixtures
Inorganic silts and very fine sands, rock flour,silty or clayey fine sands or clayey silts withslight plasticity
Inorganic clays of low to medium plasticity,
gravelly clays, sandy clays, silty clays, lean clays
Inorganic silts, micaceous or diatomceous finesandy or silty soils, elastic silts
Inorganic clays of high plasticity, fat clays
Organic clays of medium to high plasticity,organic silts
Peat and other highly organic soils
GW
GP
GM
GC
SW
SP
SM
SC
ML
CL
OL
MH
CH
OH
PT
MAJOR DIVISIONS TYPICALDESCRIPTIONS
SYMBOLSLETTERGRAPH
CLEANGRAVELS
(LITTLE OR NO FINES)
GRAVELSWITH FINES
(APPRECIABLEAMOUNT OF FINES)
CLEANSANDS
(LITTLE OR NO FINES)
SANDS WITHFINES
(APPRECIABLEAMOUNT OF FINES)
LIQUID LIMITLESS THAN 50
SILTSAND
CLAYS
LIQUID LIMITGREATER THAN
50
SILTSAND
CLAYS
HIGHLY ORGANIC SOILS
GRAVELAND
GRAVELLYSOILS
MORE THAN 50%OF COARSEFRACTIONRETAINED ONNO. 4 SIEVE(4.75mm)
SANDAND
SANDYSOILS
MORE THAN 50%OF COARSEFRACTIONPASSING NO. 4SIEVE (4.75mm)
COARSEGRAINED
SOILS
MORE THAN 50%
RETAINED ON
NO. 200 SIEVE
(0.075mm)
FINEGRAINED
SOILS
MORE THAN 50%PASSING NO. 200SIEVE (0.075mm)
NOTE: Multiple symbols are used to indicate borderline or dual soil classifications
Frost SusceptibilityClassification
Distinct contactbetween soilstrata or geologicunits
Gradual changebetween soilstrata or geologicunits
Approximatelocation of soilstrata changewithin a geologicsoil unit
FrostGroup
Degree ofFrost Susceptibility
NFS
F1
F2
F3
F4
Non Frost Susceptible
Negligible to low
Low to medium
High
Very High
NOTE: Taken from Department of TransportationFederal Highway Administration (FHWA NHI-05-03)

1
2
3
4
5
Cs
Sh
Sh
Sh
Sh
Start Drilling: 9/16/13;Time 11:30 PM
6 inch dia. surface ACP core
borehole wall holding firm -no sloughing
End Drilling: 9/16/13;Time 11:10 PM
8-13-14-15(27)
1-11-10-12(21)
5-7-7-6(14)
5-4-6-6(10)
ASPHALT
Asphalt Core Thickness = 10.5inches
POORLY-GRADED SAND WITHSILT AND GRAVEL (SP-SM)brown, dry, medium dense; 32%gravel; 56.5% sand; 11.5% fines;subrounded gravel to 2 in dia.; FrostGroup=F2
WELL-GRADED SAND (SW)brown, dry, medium dense; 5%gravel; 90% sand; 5% fines;subrounded gravel to 1 in dia.; FrostGroup=F2
POORLY-GRADED SAND (SP)brown, dry, medium dense; 5%gravel; 90% sand; 5% fines; tracesubangular gravel to 1/2 in dia; veryfine to fine grained angular sand -non native; Frost Group=F2
WELL-GRADED SAND (SW)brown, dry, medium dense; 8%gravel; 87.3% sand; 4.7% fines;trace subangular gravel to 1/2 in dia;Frost Group=F2
Groundwater table not encountered
100
50
75
75
FIGURE B-41 of 1
Num
ber
Dep
th (
feet
)
Wat
er T
able
Checked: MH
Logged By: CDL/PJD
Data Entry: PJD
Project No.: 132070
SOIL DESCRIPTION SAMPLES GRAPH COMMENTS
Typ
e
Casing Depth, Drilling Rate,Fluid Loss, Drill Pressure,
Tests, Instrumentation,Additional Information
PND-1 (Sta. 64+90)
VANE SHEAR (tsf)
BLOW COUNT
Date: Sep. 2013
PenetrationBlows per
6/Inch(per foot)
or{Rock Quality}
JUNEAU INTERNATIONAL AIRPORTRUNWAY 08/26 REHAB
Juneau, AlaskaENGINEERS, INC.
Ele
vati
on(f
eet)
20 40 60 80
1 2 3 4
0.2 0.4 0.6 0.8Loc
atio
n
Gra
phic
Sym
bol
Soil Name, Color, MoistureContent, Relative Density,Soil Structure, Mineralogy,
Other Information
POCKET PEN (tsf)
Rec
over
y %
(RQ
D %
)
BO
RE
HO
LE L
OG
132
070
JIA
RU
NW
AY
826
RE
HA
B L
OG
S.G
PJ
PN
D E
NG
INE
ER
S.G
DT
11
/21
/13
©20
13
0.0
2.5
5.0
7.5
10.0
27.0
24.5
22.0
19.5
17.0
1 Cs
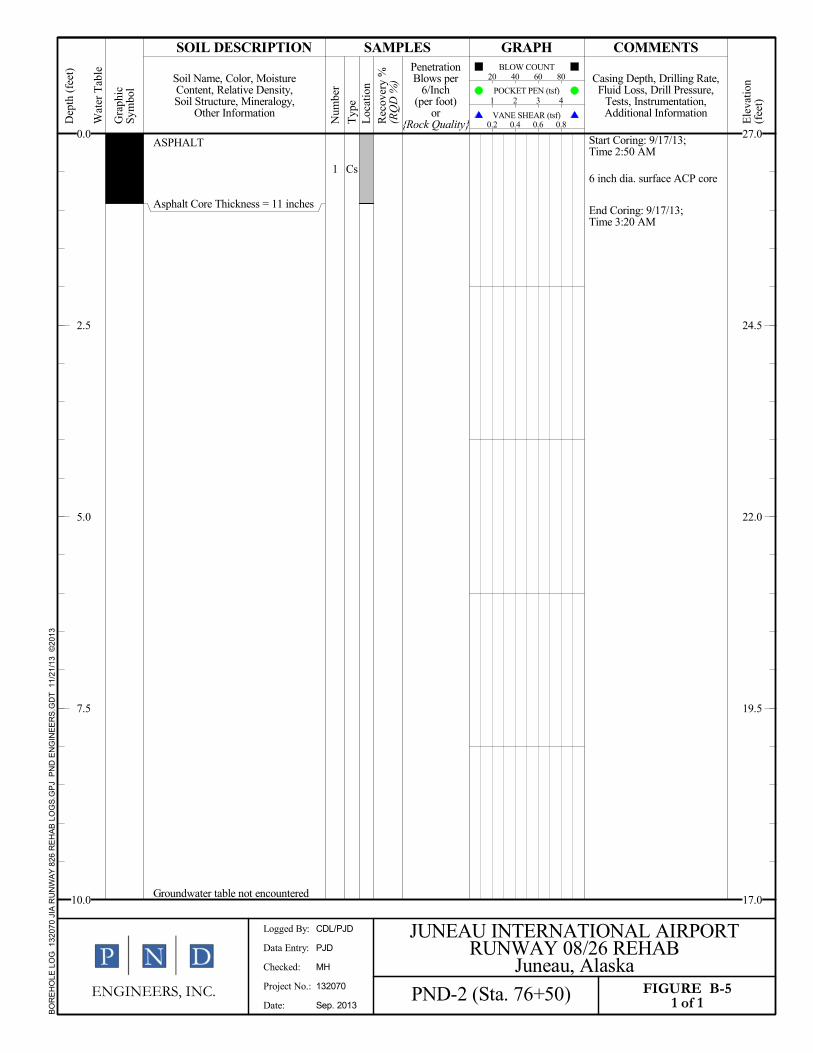
Start Coring: 9/17/13;Time 2:50 AM
6 inch dia. surface ACP core
End Coring: 9/17/13;Time 3:20 AM
ASPHALT
Asphalt Core Thickness = 11 inches
Groundwater table not encountered
FIGURE B-51 of 1
Num
ber
Dep
th (
feet
)
Wat
er T
able
Checked: MH
Logged By: CDL/PJD
Data Entry: PJD
Project No.: 132070
SOIL DESCRIPTION SAMPLES GRAPH COMMENTS
Typ
e
Casing Depth, Drilling Rate,Fluid Loss, Drill Pressure,
Tests, Instrumentation,Additional Information
PND-2 (Sta. 76+50)
VANE SHEAR (tsf)
BLOW COUNT
Date: Sep. 2013
PenetrationBlows per
6/Inch(per foot)
or{Rock Quality}
JUNEAU INTERNATIONAL AIRPORTRUNWAY 08/26 REHAB
Juneau, AlaskaENGINEERS, INC.
Ele
vati
on(f
eet)
20 40 60 80
1 2 3 4
0.2 0.4 0.6 0.8Loc
atio
n
Gra
phic
Sym
bol
Soil Name, Color, MoistureContent, Relative Density,Soil Structure, Mineralogy,
Other Information
POCKET PEN (tsf)
Rec
over
y %
(RQ
D %
)
BO
RE
HO
LE L
OG
132
070
JIA
RU
NW
AY
826
RE
HA
B L
OG
S.G
PJ
PN
D E
NG
INE
ER
S.G
DT
11
/21
/13
©20
13
0.0
2.5
5.0
7.5
10.0
27.0
24.5
22.0
19.5
17.0

1 Cs
Start Coring: 9/17/13;Time 3:45 AM
6 inch dia. surface ACP core
End Coring: 9/17/13;Time 4:20 AM
ASPHALT
Asphalt Core Thickness = 11 inches
Groundwater table not encountered
FIGURE B-61 of 1
Num
ber
Dep
th (
feet
)
Wat
er T
able
Checked: MH
Logged By: CDL/PJD
Data Entry: PJD
Project No.: 132070
SOIL DESCRIPTION SAMPLES GRAPH COMMENTS
Typ
e
Casing Depth, Drilling Rate,Fluid Loss, Drill Pressure,
Tests, Instrumentation,Additional Information
PND-3 (Sta. 82+50)
VANE SHEAR (tsf)
BLOW COUNT
Date: Sep. 2013
PenetrationBlows per
6/Inch(per foot)
or{Rock Quality}
JUNEAU INTERNATIONAL AIRPORTRUNWAY 08/26 REHAB
Juneau, AlaskaENGINEERS, INC.
Ele
vati
on(f
eet)
20 40 60 80
1 2 3 4
0.2 0.4 0.6 0.8Loc
atio
n
Gra
phic
Sym
bol
Soil Name, Color, MoistureContent, Relative Density,Soil Structure, Mineralogy,
Other Information
POCKET PEN (tsf)
Rec
over
y %
(RQ
D %
)
BO
RE
HO
LE L
OG
132
070
JIA
RU
NW
AY
826
RE
HA
B L
OG
S.G
PJ
PN
D E
NG
INE
ER
S.G
DT
11
/21
/13
©20
13
0.0
2.5
5.0
7.5
10.0
27.0
24.5
22.0
19.5
17.0

1 Cs
Start Coring: 9/17/13;Time 11:00 PM
6 inch dia. surface ACP core
End Coring: 9/17/13;Time 11:45 PM
ASPHALT
Asphalt Core Thickness = 11 inches
Groundwater table not encountered
FIGURE B-71 of 1
Num
ber
Dep
th (
feet
)
Wat
er T
able
Checked: MH
Logged By: CDL/PJD
Data Entry: PJD
Project No.: 132070
SOIL DESCRIPTION SAMPLES GRAPH COMMENTS
Typ
e
Casing Depth, Drilling Rate,Fluid Loss, Drill Pressure,
Tests, Instrumentation,Additional Information
PND-4 (Sta. 20+90)
VANE SHEAR (tsf)
BLOW COUNT
Date: Sep. 2013
PenetrationBlows per
6/Inch(per foot)
or{Rock Quality}
JUNEAU INTERNATIONAL AIRPORTRUNWAY 08/26 REHAB
Juneau, AlaskaENGINEERS, INC.
Ele
vati
on(f
eet)
20 40 60 80
1 2 3 4
0.2 0.4 0.6 0.8Loc
atio
n
Gra
phic
Sym
bol
Soil Name, Color, MoistureContent, Relative Density,Soil Structure, Mineralogy,
Other Information
POCKET PEN (tsf)
Rec
over
y %
(RQ
D %
)
BO
RE
HO
LE L
OG
132
070
JIA
RU
NW
AY
826
RE
HA
B L
OG
S.G
PJ
PN
D E
NG
INE
ER
S.G
DT
11
/21
/13
©20
13
0.0
2.5
5.0
7.5
10.0
28.0
25.5
23.0
20.5
18.0

1
2A
2B
3
4
5
Cs
Sh
Sh
Sh
Sh
Sh
Start Coring: 9/18/13;Time 12:10 AM
6 inch dia. surface ACP core
*SPT value representscombined sample 2A and 2B
End Coring: 9/18/13;Time 11:19 AM
23-18-20-24(38)*
17-20-16-14(36)
11-10-12-12(22)
11-12-12(24)
ASPHALT
Asphalt Core Thickness = 9 inches
POORLY-GRADED SAND WITHGRAVEL (SP)black, dense; 25% gravel; 75%sand; subrounded gravel to 1 in dia;oil stained sand and gravel; materialresembles unconsolidated asphalt
POORLY-GRADED GRAVELWITH SILT AND SAND (GP-GM)gray, dry, dense; 48% gravel; 45%sand; 7% fines; subrounded gravelto 2 in dia; distinctly non-nativematerial; density loosens downdepth as noted; Frost Group=F1
At bottom of hole, increase in finescontent (to approximately 10%)
Groundwater table not encountered
100
100
90
75
75
100
FIGURE B-81 of 1
Num
ber
Dep
th (
feet
)
Wat
er T
able
Checked: MH
Logged By: CDL/PJD
Data Entry: PJD
Project No.: 132070
SOIL DESCRIPTION SAMPLES GRAPH COMMENTS
Typ
e
Casing Depth, Drilling Rate,Fluid Loss, Drill Pressure,
Tests, Instrumentation,Additional Information
PND-5 (Sta. 27+00)
VANE SHEAR (tsf)
BLOW COUNT
Date: Sep. 2013
PenetrationBlows per
6/Inch(per foot)*
or{Rock Quality}
JUNEAU INTERNATIONAL AIRPORTRUNWAY 08/26 REHAB
Juneau, AlaskaENGINEERS, INC.
Ele
vati
on(f
eet)
20 40 60 80
1 2 3 4
0.2 0.4 0.6 0.8Loc
atio
n
Gra
phic
Sym
bol
Soil Name, Color, MoistureContent, Relative Density,Soil Structure, Mineralogy,
Other Information
POCKET PEN (tsf)
Rec
over
y %
(RQ
D %
)
BO
RE
HO
LE L
OG
132
070
JIA
RU
NW
AY
826
RE
HA
B L
OG
S.G
PJ
PN
D E
NG
INE
ER
S.G
DT
11
/21
/13
©20
13
0.0
2.5
5.0
7.5
10.0
28.0
25.5
23.0
20.5
18.0
1A
1B
2
3
4A
4B
5A
5B
Cs
Sh
Sh
Sh
Sh
Sh
Sh
Sh
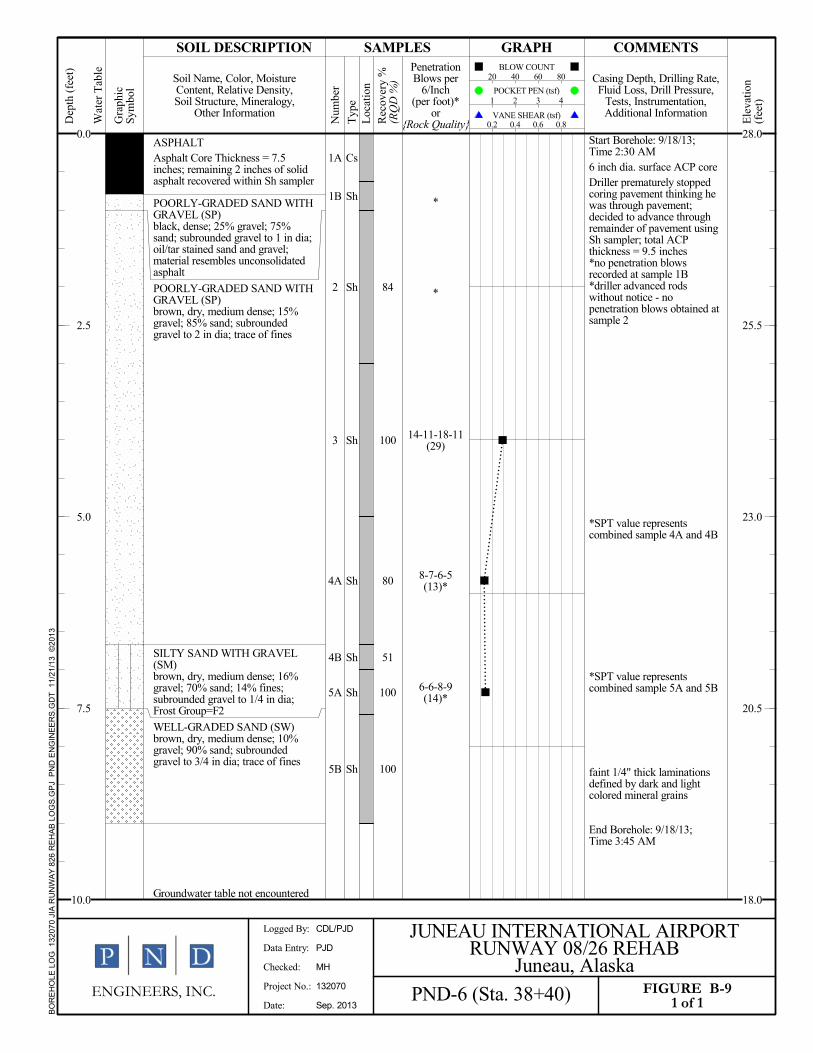
Start Borehole: 9/18/13;Time 2:30 AM 6 inch dia. surface ACP core Driller prematurely stoppedcoring pavement thinking hewas through pavement;decided to advance throughremainder of pavement usingSh sampler; total ACPthickness = 9.5 inches *no penetration blowsrecorded at sample 1B *driller advanced rodswithout notice - nopenetration blows obtained atsample 2
*SPT value representscombined sample 4A and 4B
*SPT value representscombined sample 5A and 5B
faint 1/4" thick laminationsdefined by dark and lightcolored mineral grains
End Borehole: 9/18/13;Time 3:45 AM
*
*
14-11-18-11(29)
8-7-6-5(13)*
6-6-8-9(14)*
ASPHALTAsphalt Core Thickness = 7.5inches; remaining 2 inches of solidasphalt recovered within Sh sampler
POORLY-GRADED SAND WITHGRAVEL (SP)black, dense; 25% gravel; 75%sand; subrounded gravel to 1 in dia;oil/tar stained sand and gravel;material resembles unconsolidatedasphalt
POORLY-GRADED SAND WITHGRAVEL (SP)brown, dry, medium dense; 15%gravel; 85% sand; subroundedgravel to 2 in dia; trace of fines
SILTY SAND WITH GRAVEL(SM)brown, dry, medium dense; 16%gravel; 70% sand; 14% fines;subrounded gravel to 1/4 in dia;Frost Group=F2
WELL-GRADED SAND (SW)brown, dry, medium dense; 10%gravel; 90% sand; subroundedgravel to 3/4 in dia; trace of fines
Groundwater table not encountered
84
100
80
51
100
100
FIGURE B-91 of 1
Num
ber
Dep
th (
feet
)
Wat
er T
able
Checked: MH
Logged By: CDL/PJD
Data Entry: PJD
Project No.: 132070
SOIL DESCRIPTION SAMPLES GRAPH COMMENTS
Typ
e
Casing Depth, Drilling Rate,Fluid Loss, Drill Pressure,
Tests, Instrumentation,Additional Information
PND-6 (Sta. 38+40)
VANE SHEAR (tsf)
BLOW COUNT
Date: Sep. 2013
PenetrationBlows per
6/Inch(per foot)*
or{Rock Quality}
JUNEAU INTERNATIONAL AIRPORTRUNWAY 08/26 REHAB
Juneau, AlaskaENGINEERS, INC.
Ele
vati
on(f
eet)
20 40 60 80
1 2 3 4
0.2 0.4 0.6 0.8Loc
atio
n
Gra
phic
Sym
bol
Soil Name, Color, MoistureContent, Relative Density,Soil Structure, Mineralogy,
Other Information
POCKET PEN (tsf)
Rec
over
y %
(RQ
D %
)
BO
RE
HO
LE L
OG
132
070
JIA
RU
NW
AY
826
RE
HA
B L
OG
S.G
PJ
PN
D E
NG
INE
ER
S.G
DT
11
/21
/13
©20
13
0.0
2.5
5.0
7.5
10.0
28.0
25.5
23.0
20.5
18.0

1
2
Cs
G
Start Coring: 9/19/13;Time 11:10 PM
6 inch dia. surface ACP core
End Coring: 9/19/13;Time 11:40 PM
ASPHALT
Asphalt Core Thickness = 17 inches
WELL-GRADED SAND WITHGRAVEL (SW)brown, loose to medium dense; 30%gravel; 70% sand; subroundedgravel to 2 in dia.; trace of fines
Groundwater table not encountered
FIGURE B-101 of 1
Num
ber
Dep
th (
feet
)
Wat
er T
able
Checked: MH
Logged By: CDL/PJD
Data Entry: PJD
Project No.: 132070
SOIL DESCRIPTION SAMPLES GRAPH COMMENTS
Typ
e
Casing Depth, Drilling Rate,Fluid Loss, Drill Pressure,
Tests, Instrumentation,Additional Information
PND-7 (Sta. 16+00)
VANE SHEAR (tsf)
BLOW COUNT
Date: Sep. 2013
PenetrationBlows per
6/Inch(per foot)
or{Rock Quality}
JUNEAU INTERNATIONAL AIRPORTRUNWAY 08/26 REHAB
Juneau, AlaskaENGINEERS, INC.
Ele
vati
on(f
eet)
20 40 60 80
1 2 3 4
0.2 0.4 0.6 0.8Loc
atio
n
Gra
phic
Sym
bol
Soil Name, Color, MoistureContent, Relative Density,Soil Structure, Mineralogy,
Other Information
POCKET PEN (tsf)
Rec
over
y %
(RQ
D %
)
BO
RE
HO
LE L
OG
132
070
JIA
RU
NW
AY
826
RE
HA
B L
OG
S.G
PJ
PN
D E
NG
INE
ER
S.G
DT
11
/21
/13
©20
13
0.0
2.5
5.0
7.5
10.0
29.0
26.5
24.0
21.5
19.0
1
2A
2B
3
4
5
Cs
Sh
Sh
Sh
Sh
Sh
Sh
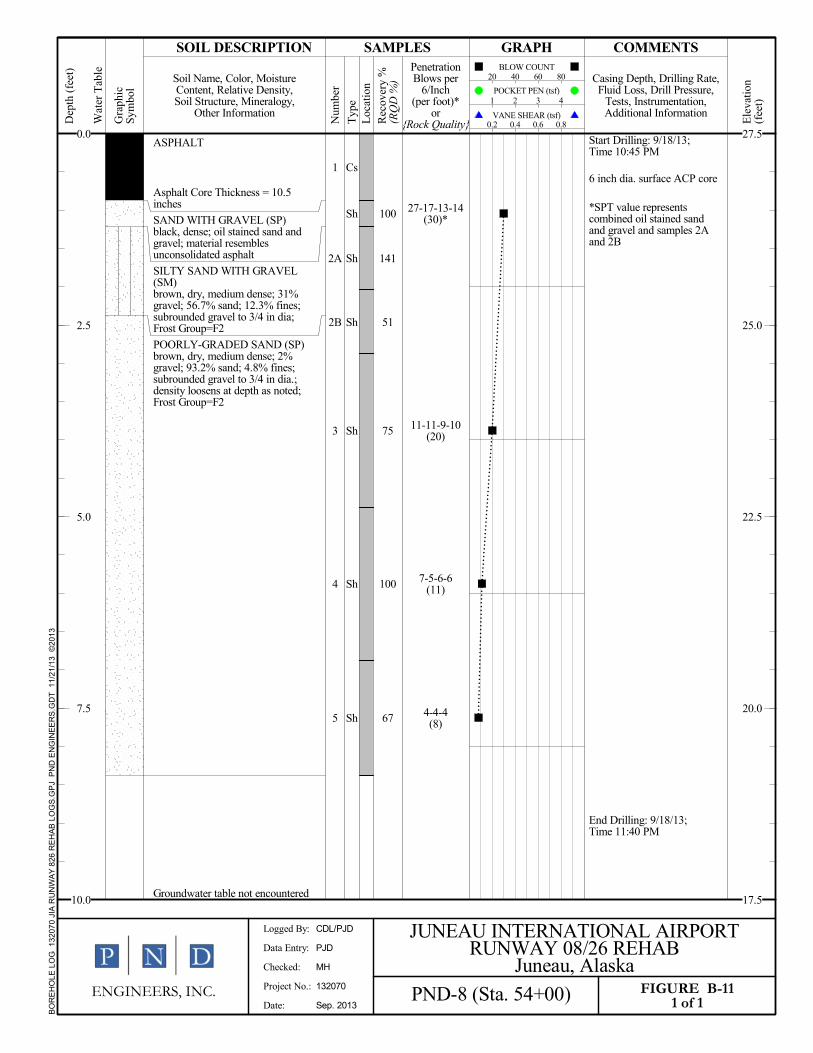
Start Drilling: 9/18/13;Time 10:45 PM
6 inch dia. surface ACP core
*SPT value representscombined oil stained sandand gravel and samples 2Aand 2B
End Drilling: 9/18/13;Time 11:40 PM
27-17-13-14(30)*
11-11-9-10(20)
7-5-6-6(11)
4-4-4(8)
ASPHALT
Asphalt Core Thickness = 10.5inches
SAND WITH GRAVEL (SP)black, dense; oil stained sand andgravel; material resemblesunconsolidated asphalt
SILTY SAND WITH GRAVEL(SM)brown, dry, medium dense; 31%gravel; 56.7% sand; 12.3% fines;subrounded gravel to 3/4 in dia;Frost Group=F2
POORLY-GRADED SAND (SP)brown, dry, medium dense; 2%gravel; 93.2% sand; 4.8% fines;subrounded gravel to 3/4 in dia.;density loosens at depth as noted;Frost Group=F2
Groundwater table not encountered
100
141
51
75
100
67
FIGURE B-111 of 1
Num
ber
Dep
th (
feet
)
Wat
er T
able
Checked: MH
Logged By: CDL/PJD
Data Entry: PJD
Project No.: 132070
SOIL DESCRIPTION SAMPLES GRAPH COMMENTS
Typ
e
Casing Depth, Drilling Rate,Fluid Loss, Drill Pressure,
Tests, Instrumentation,Additional Information
PND-8 (Sta. 54+00)
VANE SHEAR (tsf)
BLOW COUNT
Date: Sep. 2013
PenetrationBlows per
6/Inch(per foot)*
or{Rock Quality}
JUNEAU INTERNATIONAL AIRPORTRUNWAY 08/26 REHAB
Juneau, AlaskaENGINEERS, INC.
Ele
vati
on(f
eet)
20 40 60 80
1 2 3 4
0.2 0.4 0.6 0.8Loc
atio
n
Gra
phic
Sym
bol
Soil Name, Color, MoistureContent, Relative Density,Soil Structure, Mineralogy,
Other Information
POCKET PEN (tsf)
Rec
over
y %
(RQ
D %
)
BO
RE
HO
LE L
OG
132
070
JIA
RU
NW
AY
826
RE
HA
B L
OG
S.G
PJ
PN
D E
NG
INE
ER
S.G
DT
11
/21
/13
©20
13
0.0
2.5
5.0
7.5
10.0
27.5
25.0
22.5
20.0
17.5
1
2
Cs
G
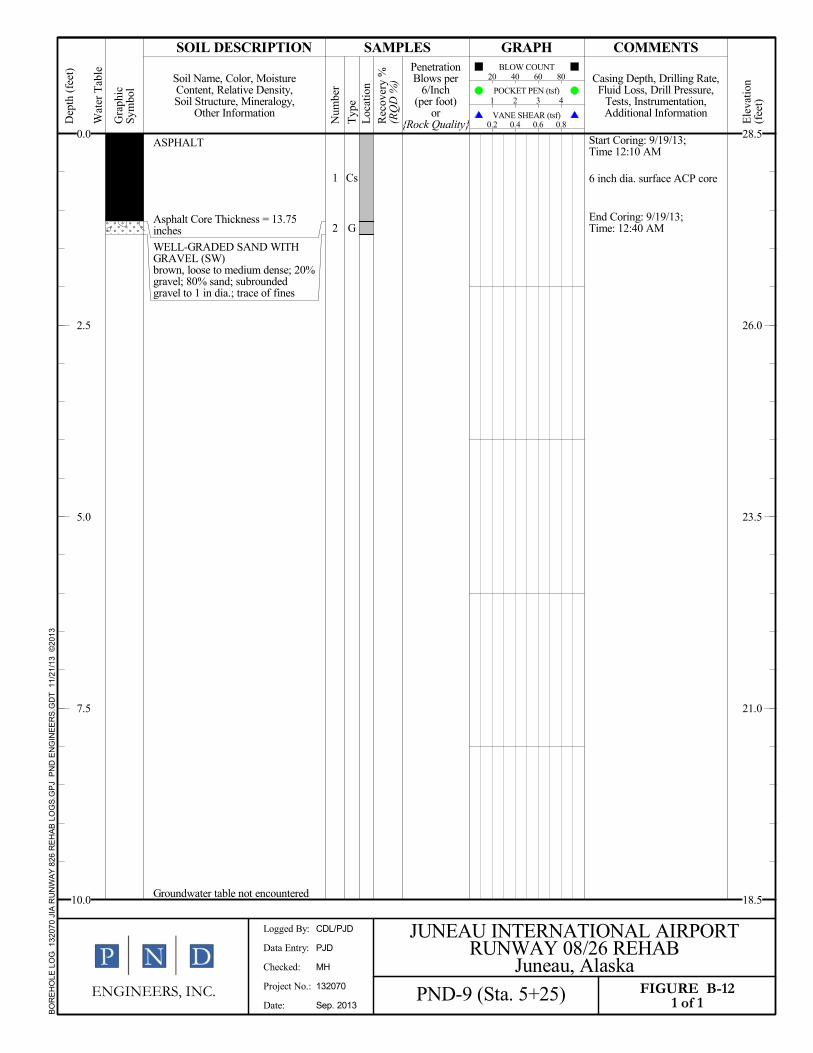
Start Coring: 9/19/13;Time 12:10 AM
6 inch dia. surface ACP core
End Coring: 9/19/13;Time: 12:40 AM
ASPHALT
Asphalt Core Thickness = 13.75inches
WELL-GRADED SAND WITHGRAVEL (SW)brown, loose to medium dense; 20%gravel; 80% sand; subroundedgravel to 1 in dia.; trace of fines
Groundwater table not encountered
FIGURE B-121 of 1
Num
ber
Dep
th (
feet
)
Wat
er T
able
Checked: MH
Logged By: CDL/PJD
Data Entry: PJD
Project No.: 132070
SOIL DESCRIPTION SAMPLES GRAPH COMMENTS
Typ
e
Casing Depth, Drilling Rate,Fluid Loss, Drill Pressure,
Tests, Instrumentation,Additional Information
PND-9 (Sta. 5+25)
VANE SHEAR (tsf)
BLOW COUNT
Date: Sep. 2013
PenetrationBlows per
6/Inch(per foot)
or{Rock Quality}
JUNEAU INTERNATIONAL AIRPORTRUNWAY 08/26 REHAB
Juneau, AlaskaENGINEERS, INC.
Ele
vati
on(f
eet)
20 40 60 80
1 2 3 4
0.2 0.4 0.6 0.8Loc
atio
n
Gra
phic
Sym
bol
Soil Name, Color, MoistureContent, Relative Density,Soil Structure, Mineralogy,
Other Information
POCKET PEN (tsf)
Rec
over
y %
(RQ
D %
)
BO
RE
HO
LE L
OG
132
070
JIA
RU
NW
AY
826
RE
HA
B L
OG
S.G
PJ
PN
D E
NG
INE
ER
S.G
DT
11
/21
/13
©20
13
0.0
2.5
5.0
7.5
10.0
28.5
26.0
23.5
21.0
18.5
1
2
Cs
G
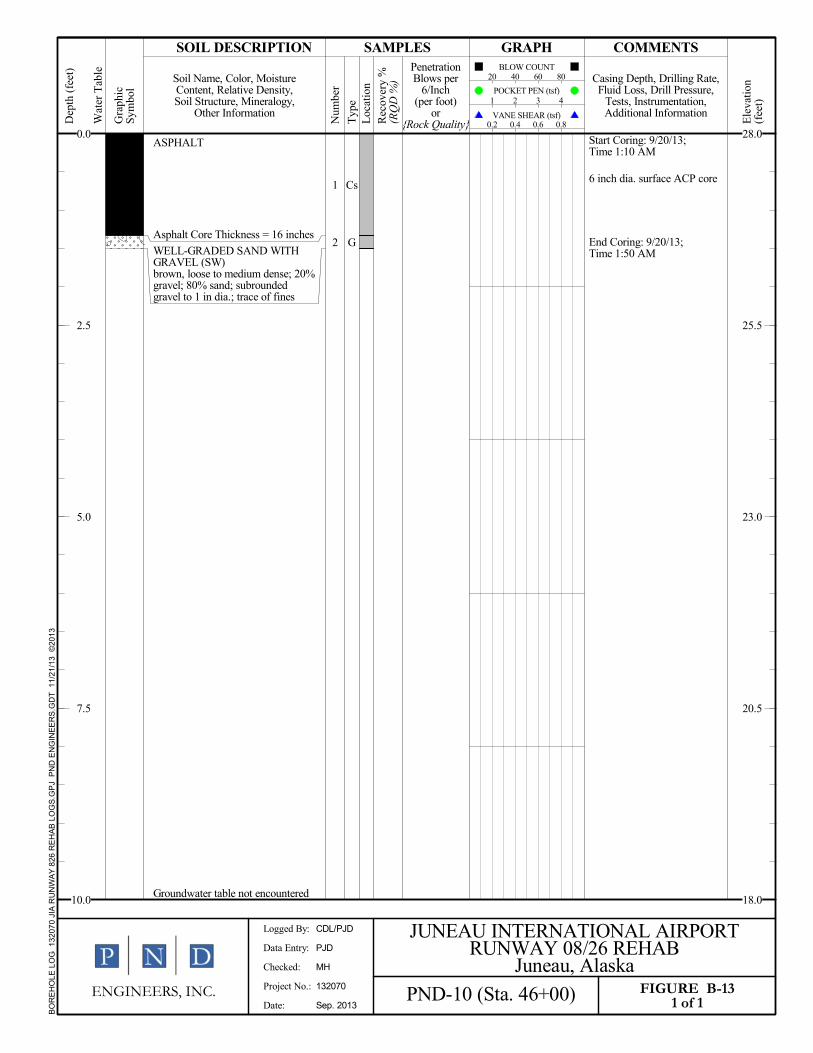
Start Coring: 9/20/13;Time 1:10 AM
6 inch dia. surface ACP core
End Coring: 9/20/13;Time 1:50 AM
ASPHALT
Asphalt Core Thickness = 16 inches
WELL-GRADED SAND WITHGRAVEL (SW)brown, loose to medium dense; 20%gravel; 80% sand; subroundedgravel to 1 in dia.; trace of fines
Groundwater table not encountered
FIGURE B-131 of 1
Num
ber
Dep
th (
feet
)
Wat
er T
able
Checked: MH
Logged By: CDL/PJD
Data Entry: PJD
Project No.: 132070
SOIL DESCRIPTION SAMPLES GRAPH COMMENTS
Typ
e
Casing Depth, Drilling Rate,Fluid Loss, Drill Pressure,
Tests, Instrumentation,Additional Information
PND-10 (Sta. 46+00)
VANE SHEAR (tsf)
BLOW COUNT
Date: Sep. 2013
PenetrationBlows per
6/Inch(per foot)
or{Rock Quality}
JUNEAU INTERNATIONAL AIRPORTRUNWAY 08/26 REHAB
Juneau, AlaskaENGINEERS, INC.
Ele
vati
on(f
eet)
20 40 60 80
1 2 3 4
0.2 0.4 0.6 0.8Loc
atio
n
Gra
phic
Sym
bol
Soil Name, Color, MoistureContent, Relative Density,Soil Structure, Mineralogy,
Other Information
POCKET PEN (tsf)
Rec
over
y %
(RQ
D %
)
BO
RE
HO
LE L
OG
132
070
JIA
RU
NW
AY
826
RE
HA
B L
OG
S.G
PJ
PN
D E
NG
INE
ER
S.G
DT
11
/21
/13
©20
13
0.0
2.5
5.0
7.5
10.0
28.0
25.5
23.0
20.5
18.0

1
2
3
4
Cs
Sh
Sh
Sh
Start Borehole: 9/20/13;Time 2:15 AM
6 inch dia. surface ACP core
driller had considerabledifficulty pulling rods,decided to terminate drilling
End Borehole: 9/19/13;Time 3:23 AM
12-17-19-25(36)
21-17-17-18(34)
16-13-13-12(26)
ASPHALT
Asphalt Core Thickness = 17.5inches
POORLY-GRADED SAND WITHSILT AND GRAVEL (SP-SM)brown, dry, medium dense; 24%gravel; 69% sand; 7% fines;subrounded gravel to 2.5 in dia;Frost Group=F2
Groundwater table not encountered
84
84
84
FIGURE B-141 of 1
Num
ber
Dep
th (
feet
)
Wat
er T
able
Checked: MH
Logged By: CDL/PJD
Data Entry: PJD
Project No.: 132070
SOIL DESCRIPTION SAMPLES GRAPH COMMENTS
Typ
e
Casing Depth, Drilling Rate,Fluid Loss, Drill Pressure,
Tests, Instrumentation,Additional Information
PND-11 (Sta. 39+40)
VANE SHEAR (tsf)
BLOW COUNT
Date: Sep. 2013
PenetrationBlows per
6/Inch(per foot)
or{Rock Quality}
JUNEAU INTERNATIONAL AIRPORTRUNWAY 08/26 REHAB
Juneau, AlaskaENGINEERS, INC.
Ele
vati
on(f
eet)
20 40 60 80
1 2 3 4
0.2 0.4 0.6 0.8Loc
atio
n
Gra
phic
Sym
bol
Soil Name, Color, MoistureContent, Relative Density,Soil Structure, Mineralogy,
Other Information
POCKET PEN (tsf)
Rec
over
y %
(RQ
D %
)
BO
RE
HO
LE L
OG
132
070
JIA
RU
NW
AY
826
RE
HA
B L
OG
S.G
PJ
PN
D E
NG
INE
ER
S.G
DT
11
/21
/13
©20
13
0.0
2.5
5.0
7.5
10.0
28.0
25.5
23.0
20.5
18.0

Juneau International Runway 8/26 Rehabilitation November 2013 Geotechnical Report – APPENDIX C Juneau, Alaska
APPENDIX C
Lab Test Results
Client
Project
Location Sta/Offset
Material/Source
Sampled by/date
MoistureSIEVE SIZE Percent passing Percent passing Percent passing Percent passing
"
"
"
1 1/2 "
"
3/4 "
1/2 "
3/8 "
No
No
No
No
No
No
No
No
No
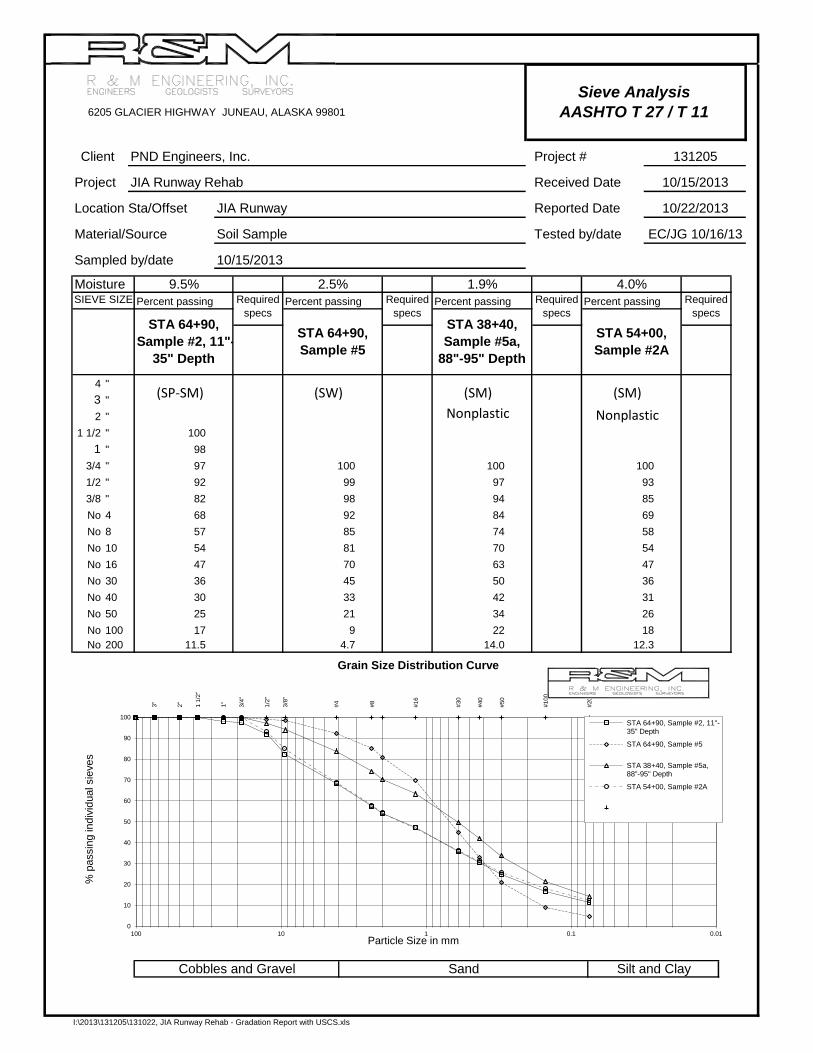
Soil Sample Tested by/date EC/JG 10/16/13
9.5% 2.5%Required
specs
4.0%Required
specsSTA 64+90,
Sample #2, 11"-
35" Depth
STA 38+40,
Sample #5a,
88"-95" Depth
STA 54+00,
Sample #2A
6205 GLACIER HIGHWAY JUNEAU, ALASKA 99801
PND Engineers, Inc. Project #
JIA Runway Reported Date
100
1004
131205
Sieve Analysis
AASHTO T 27 / T 11
Cobbles and Gravel Sand Silt and Clay
10/15/2013
JIA Runway Rehab Received Date 10/15/2013
10/22/2013
54
69
58
14.0
22
42
34
70
85
81
45
70
85
93
1.9%
100 100
21
33
9799
98
100
36
30
25
30
40
50
200
917
11.5 4.7
8
10
16
97
92
82
68
57
54
47
4
3
2
1
100
100
Required
specs
STA 64+90,
Sample #5
100
98
100
100
100
100
100
100
100
63
50
92
100
100
100
94
84
74
12.3
47
36
31
18
26
100
100
Required
specs
100
100
100
3"
2"
1 1
/2"
1"
3/4
"
1/2
"
3/8
"
#4
#8
#16
#30
#40
#50
#100
#200
0
10
20
30
40
50
60
70
80
90
100
0.010.1110100
% p
assin
g in
div
idual sie
ves
Particle Size in mm
STA 64+90, Sample #2, 11"-35" Depth
STA 64+90, Sample #5
STA 38+40, Sample #5a,88"-95" Depth
STA 54+00, Sample #2A
Grain Size Distribution Curve
Nonplastic Nonplastic
(SP-SM) (SW) (SM) (SM)
I:\2013\131205\131022, JIA Runway Rehab - Gradation Report with USCS.xls
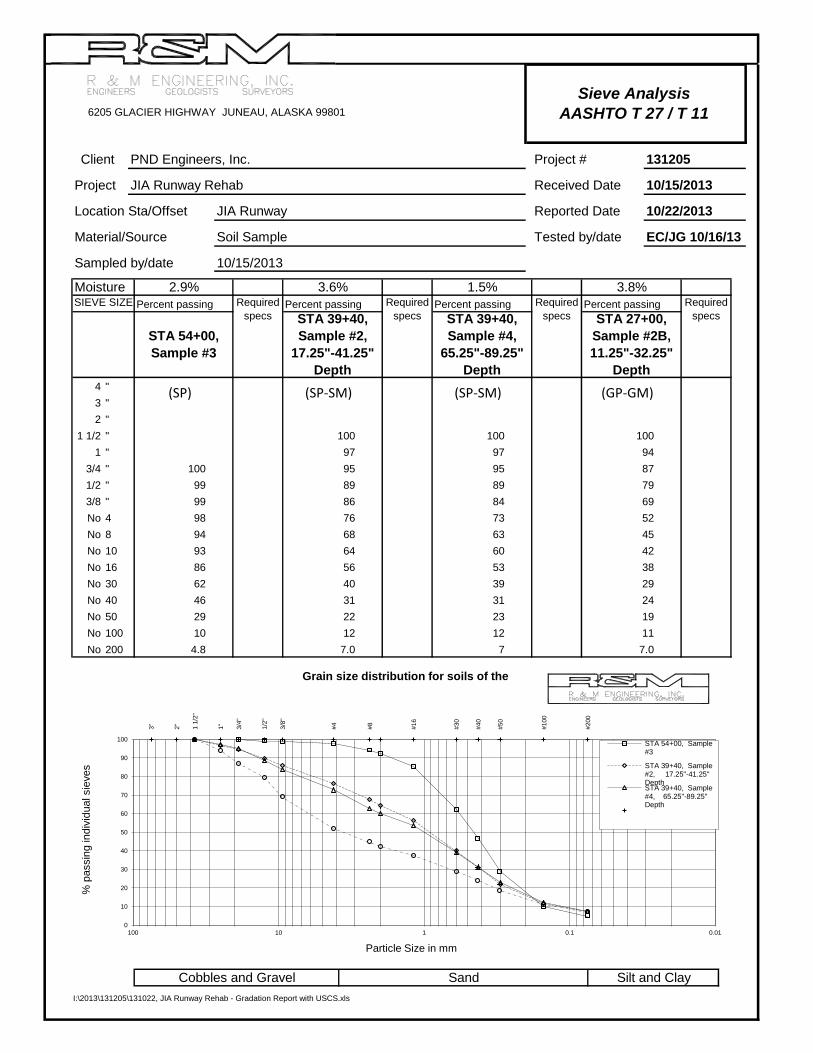
Client
Project
Location Sta/Offset
Material/Source
Sampled by/date
MoistureSIEVE SIZE Percent passing Percent passing Percent passing Percent passing
"
"
"
1 1/2 "
"
3/4 "
1/2 "
3/8 "
No
No
No
No
No
No
No
No
No
31
22
64
56
40
86
62
200
12
30
40
50
100
46
29
4.8 7.0
76
86
10
16
93
12
53
39
31
10
4
4
3
2
1
68
100
99
99
8
98
94
Required
specs
97
95
89
100
7
94
87
97
95
63
84
73
23
60
29
24
Required
specsSTA 27+00,
Sample #2B,
11.25"-32.25"
Depth
11
100
7.0
69
52
45
19
42
38
STA 54+00,
Sample #3
Required
specsSTA 39+40,
Sample #2,
17.25"-41.25"
Depth
3.8%Required
specsSTA 39+40,
Sample #4,
65.25"-89.25"
Depth
Sieve Analysis
AASHTO T 27 / T 116205 GLACIER HIGHWAY JUNEAU, ALASKA 99801
PND Engineers, Inc. Project # 131205
JIA Runway Rehab Received Date 10/15/2013
JIA Runway Reported Date 10/22/2013
Soil Sample Tested by/date EC/JG 10/16/13
Cobbles and Gravel Sand Silt and Clay
10/15/2013
7989
100
2.9% 3.6% 1.5%
3"
2"
1 1
/2"
1"
3/4
"
1/2
"
3/8
"
#4
#8
#16
#30
#40
#50
#100
#200
0
10
20
30
40
50
60
70
80
90
100
0.010.1110100
% p
assin
g in
div
idual sie
ves
Particle Size in mm
STA 54+00, Sample#3
STA 39+40, Sample#2, 17.25"-41.25"DepthSTA 39+40, Sample#4, 65.25"-89.25"Depth
Grain size distribution for soils of the
(SP) (SP-SM) (SP-SM) (GP-GM)
I:\2013\131205\131022, JIA Runway Rehab - Gradation Report with USCS.xls

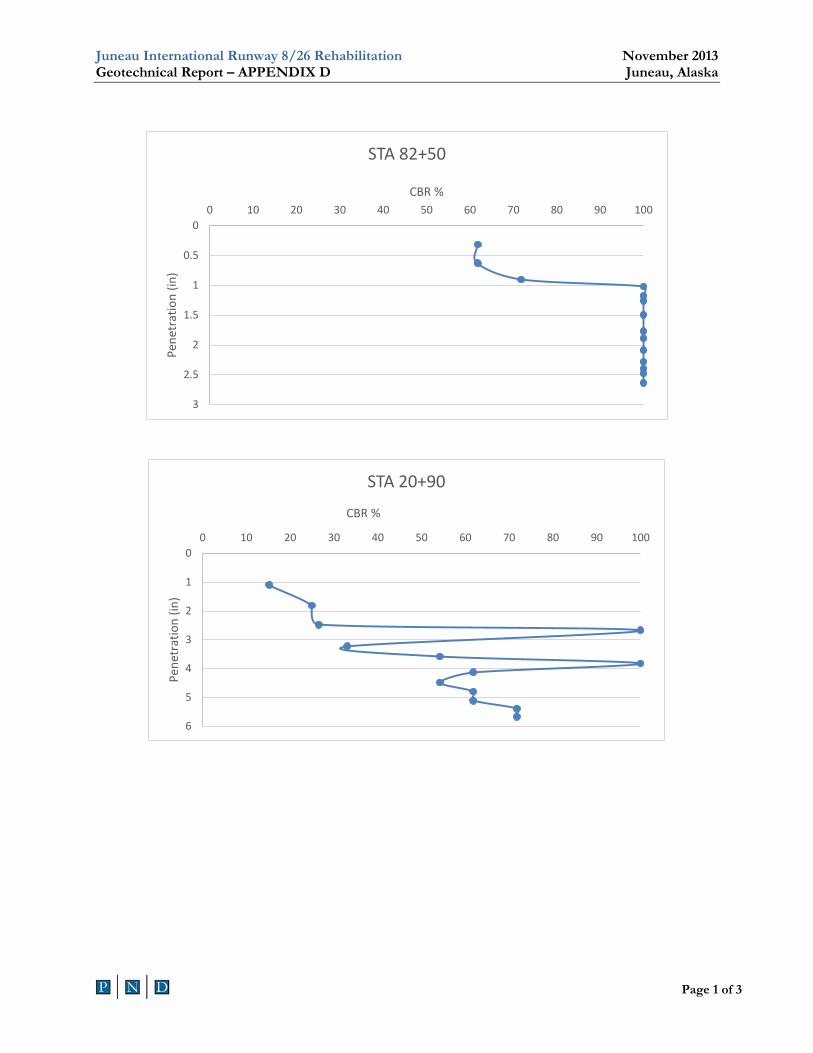
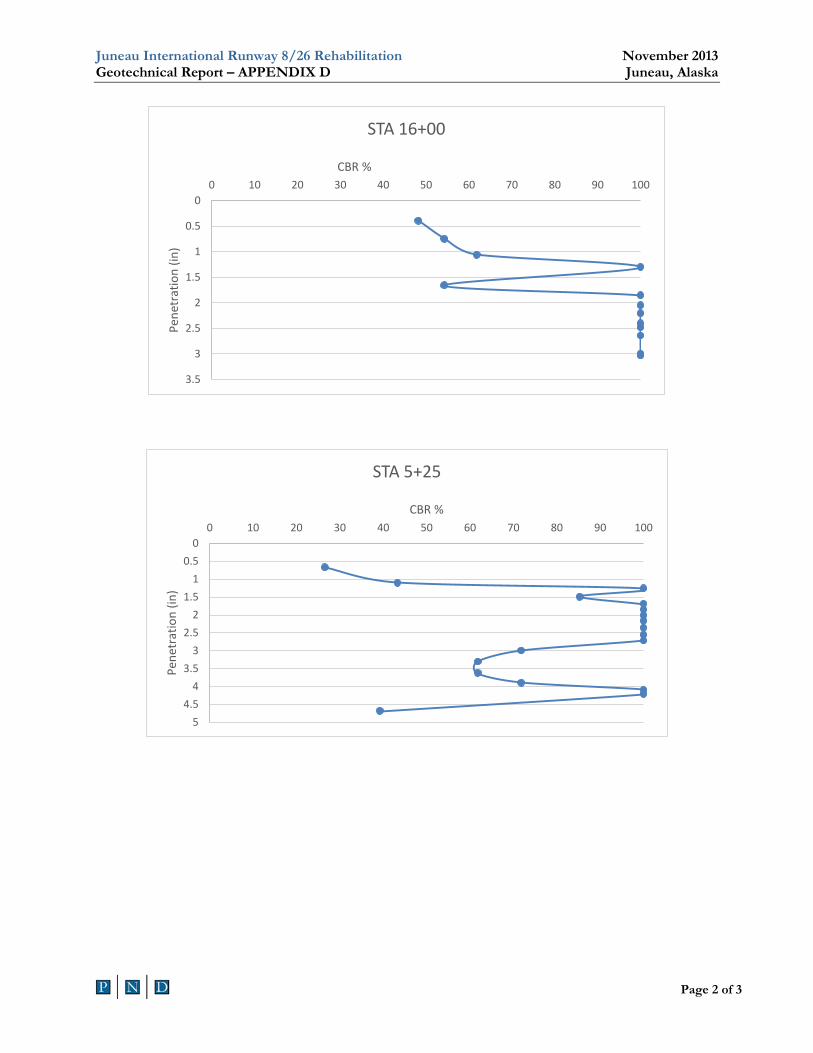
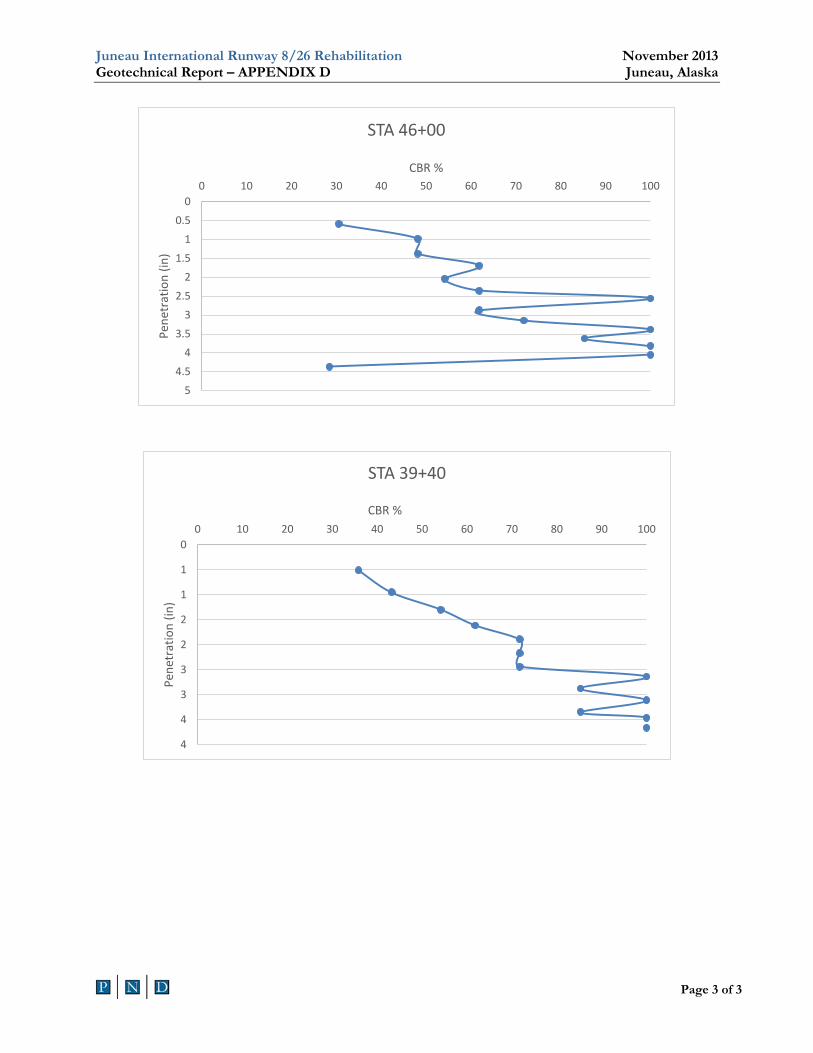
Juneau International Runway 8/26 Rehabilitation November 2013 Geotechnical Report – APPENDIX D Juneau, Alaska
APPENDIX D
DCP Test Data
Juneau International Runway 8/26 Rehabilitation November 2013 Geotechnical Report – APPENDIX D Juneau, Alaska
0
1
2
3
4
5
6
0 10 20 30 40 50 60 70 80 90 100
Pene
trat
ion
(in)
CBR %
STA 20+90
Page 1 of 3
0
0.5
1
1.5
2
2.5
3
0 10 20 30 40 50 60 70 80 90 100
Pene
trat
ion
(in)
CBR %
STA 82+50
Juneau International Runway 8/26 Rehabilitation November 2013 Geotechnical Report – APPENDIX D Juneau, Alaska
00.5
11.5
22.5
33.5
44.5
5
0 10 20 30 40 50 60 70 80 90 100
Pene
trat
ion
(in)
CBR %
STA 5+25
0
0.5
1
1.5
2
2.5
3
3.5
0 10 20 30 40 50 60 70 80 90 100Pe
netr
atio
n (in
) CBR %
STA 16+00
Page 2 of 3
Juneau International Runway 8/26 Rehabilitation November 2013 Geotechnical Report – APPENDIX D Juneau, Alaska
00.5
11.5
22.5
33.5
44.5
5
0 10 20 30 40 50 60 70 80 90 100
Pene
trat
ion
(in)
CBR %
STA 46+00
0
1
1
2
2
3
3
4
4
0 10 20 30 40 50 60 70 80 90 100
Pene
trat
ion
(in)
CBR %
STA 39+40
Page 3 of 3
Juneau International Runway 8/26 Rehabilitation November 2013 Geotechnical Report – APPENDIX E Juneau, Alaska
APPENDIX E
FAARFIELD Analysis

Juneau International Runway 8/26 Rehabilitation November 2013 Geotechnical Report – APPENDIX E Juneau, Alaska
FAARFIELD - Airport Pavement Design (V 1.305, 9/28/10 64-bit) Section AConFlex01 in Job 132070. Working directory is C:\Users\clongton\Desktop\FAARFIELD\ The structure is AC Overlay on Flexible. Asphalt CDF was not computed. Design Life = 20 years. A design for this section was completed on 10/29/13 at 09:48:11. Pavement Structure Information by Layer, Top First
No. Type Thickness in
Modulus psi
Poisson's Ratio
Strength R,psi
1 P-401/ P-403 HMA Overlay 2.85 200,000 0.35 0 2 P-401/ P-403 HMA Surface 9.00 200,000 0.35 0 3 Subgrade 0.00 45,000 0.35 0
Total thickness to the top of the subgrade = 11.85 in Airplane Information
No. Name Gross Wt. lbs
Annual Departures
% Annual Growth
1 Sngl Whl-10 10,325 26 0.20 2 Dual Whl-45 47,400 494 0.20 3 Sngl Whl-10 9,900 283 0.20 4 Dual Whl-20 17,120 416 0.20 5 Dual Whl-10 6,600 43 0.20 6 B737-400 150,000 4,838 0.20 7 B737-700 154,500 300 0.20 8 B737-800 174,200 356 0.20 9 B737-900 ER 187,700 365 0.20 10 C-17A 351,000 12 0.20 11 Dual Whl-45 40,125 26 0.20 12 Dual Whl-100 95,000 52 0.20 13 Sngl Whl-3 2,000 3,278 0.20 14 Sngl Whl-10 8,750 2,655 0.20 15 Sngl Whl-3 2,900 52 0.20 16 Sngl Whl-5 5,090 1,496 0.20 17 Citation-V 16,630 26 0.20 18 Dual Whl-20 15,000 78 0.20 19 Dual Whl-20 12,500 260 0.20 20 Learjet-35A/65A 18,300 832 0.20 21 C-130 155,000 52 0.20 22 Navajo-C 7,200 170 0.20 23 Sarat.PA-32R-301 3,600 1,409 0.20 24 Shorts-330-200 22,900 26 0.20
Additional Airplane Information Subgrade CDF
No. Name CDF Contribution
CDF Max for Airplane
P/C Ratio
1 Sngl Whl-10 0.00 0.00 4.09 2 Dual Whl-45 0.00 0.00 2.37 3 Sngl Whl-10 0.00 0.00 4.09 4 Dual Whl-20 0.00 0.00 2.76 5 Dual Whl-10 0.00 0.00 2.90 6 B737-400 0.39 0.40 1.82 7 B737-700 0.04 0.04 1.89 8 B737-800 0.16 0.16 1.85
Page 1 of 2
Juneau International Runway 8/26 Rehabilitation November 2013 Geotechnical Report – APPENDIX E Juneau, Alaska
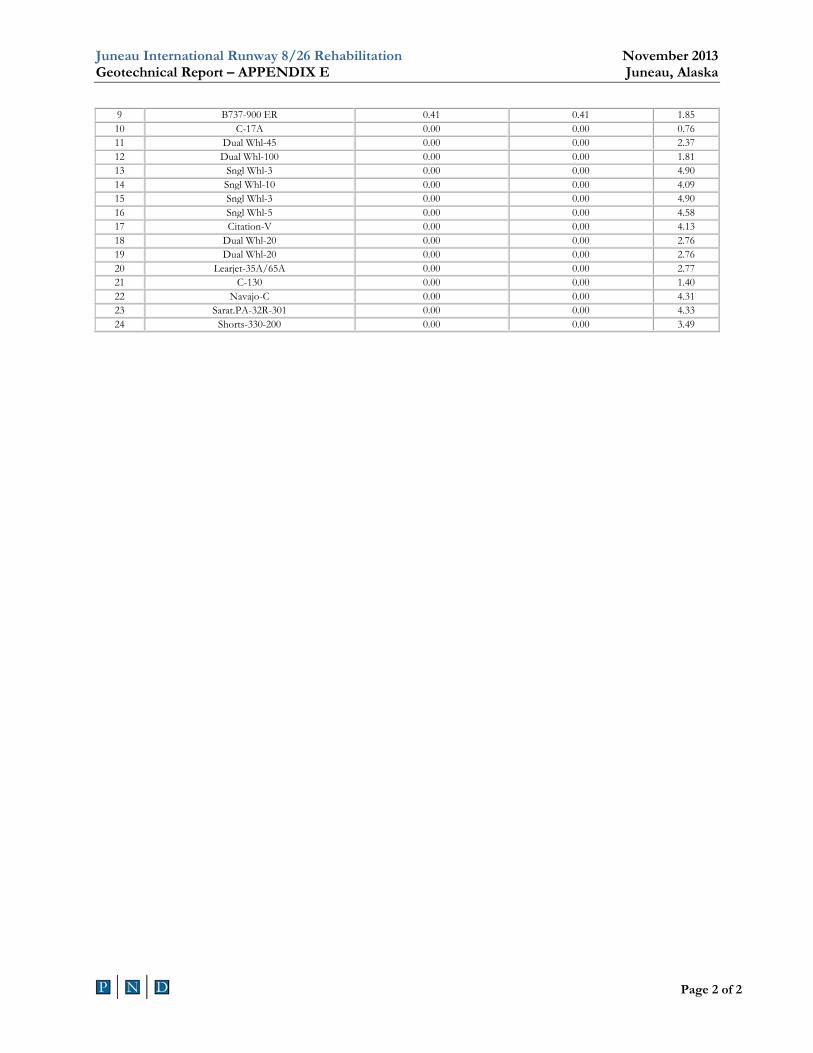
9 B737-900 ER 0.41 0.41 1.85 10 C-17A 0.00 0.00 0.76 11 Dual Whl-45 0.00 0.00 2.37 12 Dual Whl-100 0.00 0.00 1.81 13 Sngl Whl-3 0.00 0.00 4.90 14 Sngl Whl-10 0.00 0.00 4.09 15 Sngl Whl-3 0.00 0.00 4.90 16 Sngl Whl-5 0.00 0.00 4.58 17 Citation-V 0.00 0.00 4.13 18 Dual Whl-20 0.00 0.00 2.76 19 Dual Whl-20 0.00 0.00 2.76 20 Learjet-35A/65A 0.00 0.00 2.77 21 C-130 0.00 0.00 1.40 22 Navajo-C 0.00 0.00 4.31 23 Sarat.PA-32R-301 0.00 0.00 4.33 24 Shorts-330-200 0.00 0.00 3.49
Page 2 of 2
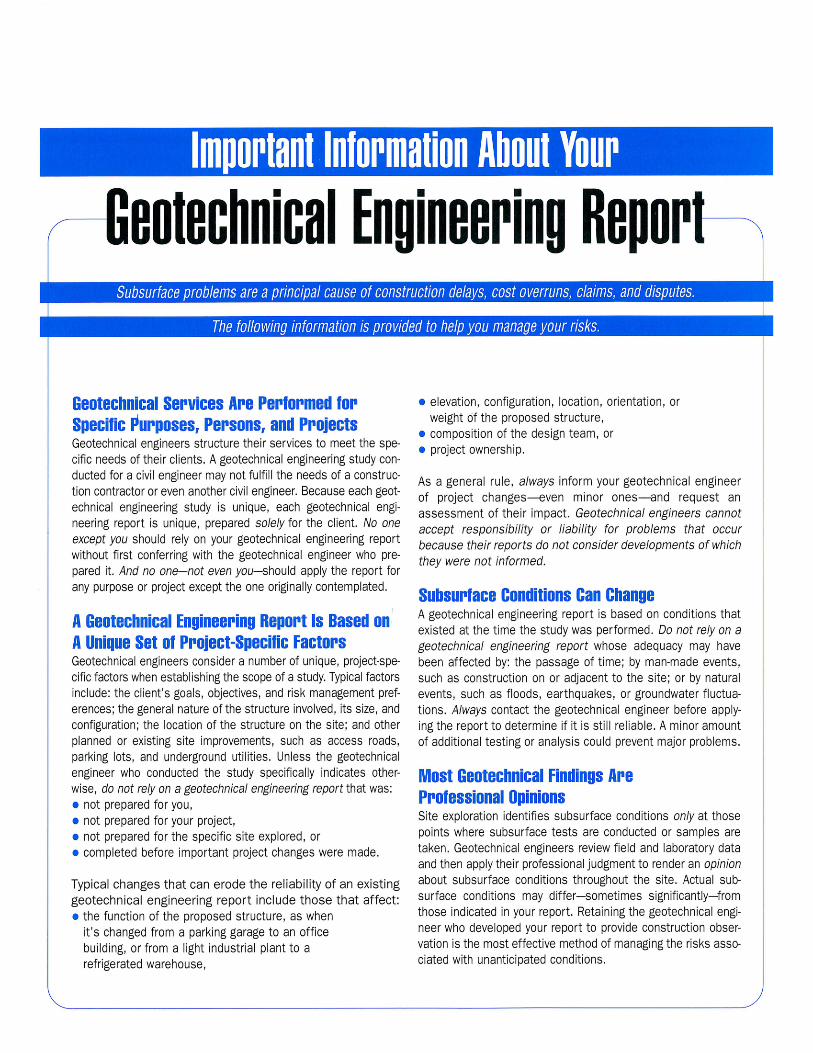
Juneau International Runway 8/26 Rehabilitation November 2013 Geotechnical Report – APPENDIX F Juneau, Alaska
APPENDIX F
“Important Information Regarding Your Geotechnical Report” By ASFE