appendix a evaluation and screening approach documents/es appendix a... · appendix a . evaluation...
TRANSCRIPT

Nuclear Fuel Cycle Evaluation and Screening – Final Report – Appendix A October 8, 2014
APPENDIX A EVALUATION AND SCREENING APPROACH

Nuclear Fuel Cycle Evaluation and Screening – Final Report – Appendix A ii October 8, 2014
Nuclear Fuel Cycle Evaluation and Screening – Final Report – Appendix A October 8, 2014 iii
CONTENTS
A. Evaluation and Screening Approach ....................................................................................................... 1 A-1. Study Objective and Scope ...................................................................................................... 2
A-1.1 Scope of Considerations for the Evaluation Criteria ................................................... 4 A-1.2 Study Background ....................................................................................................... 5 A-1.3 The Nuclear Fuel Cycle .............................................................................................. 6 A-1.4 Fuel Cycle Option Terminology ................................................................................. 8 A-1.5 Steady-State Analysis and Transition Issues ............................................................. 10 A-1.6 Analysis Examples and Metric Data ......................................................................... 16 A-1.7 Treatment of Uncertainties ........................................................................................ 17
A-2. Approach for the Evaluation and Screening .......................................................................... 17 A-2.1 Background Preparations .......................................................................................... 19 A-2.2 Evaluation ................................................................................................................. 22 A-2.3 Fuel Cycle Screening ................................................................................................ 25
A-3. Analytical Basis for the Evaluation and Screening Utility Calculations................................ 28 A-3.1 Overview of Multi-attribute Utility Analysis ............................................................ 28 A-3.2 Application of MUA for Fuel Cycle Evaluation and Screening ............................... 29
References ................................................................................................................................................... 35
ATTACHMENT 1. CHARTER FOR THE EVALUATION AND SCREENING OF FUEL CYCLE OPTIONS ........................................................................................................................... 37
FIGURES
Figure A-1.1. The Nuclear Energy System, also Known as the Nuclear Fuel Cycle. ................................. 7
Figure A-1.2. Nuclear Fuel Cycle Options, Fuel Cycle Option Groups, and Evaluation Groups. ........... 10
Figure A-1.3. Temporal Phases of Fuel Cycle Option Identification, Development, and Deployment and the Applicable Challenge Metrics. .......................................................... 11
Figure A-1.4. Illustrative Example of Fuel Cycle Performance over the Transition Time. ...................... 12
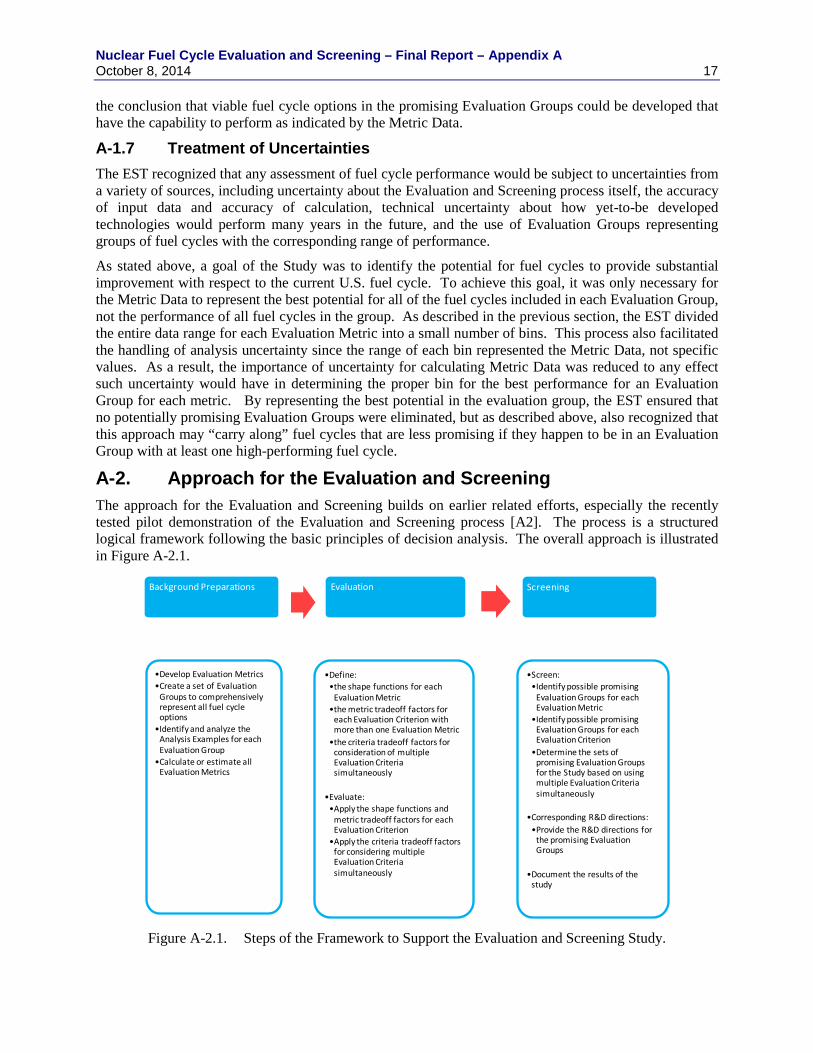
Figure A-2.1. Steps of the Framework to Support the Evaluation and Screening Study. ......................... 17
Figure A-2.2. Background Preparations. ................................................................................................... 20
Figure A-2.3. Structure of the Evaluation Metrics and Evaluation Criteria for Criteria and Scenario Analyses. ............................................................................................................. 23
Figure A-2.4. Nuclear Fuel Cycle Evaluation. .......................................................................................... 24
Figure A-2.5. Example Graph Showing Both Benefit and Challenge for Each Evaluation Group for One Scenario and One Set of Shape Functions and Metric Tradeoff Factors. ............. 27
Figure A-3.1. Example Shape Functions for a Generic Metric. ................................................................ 32
Nuclear Fuel Cycle Evaluation and Screening – Final Report – Appendix A iv October 8, 2014
TABLES Table A-1.1. Examples of Past Nuclear Fuel Cycle Studies. ..................................................................... 5
Table A-1.2. Physics Consideration Relevant to Transition. ................................................................... 13
Table A-1.3. Transition Effects on the Evaluation Metrics. .................................................................... 14
Table A-3.1. Analysis Terminology. ....................................................................................................... 30
Table A-3.2. Illustration of the Assessment and Interpretation of Tradeoff Factors. .............................. 33
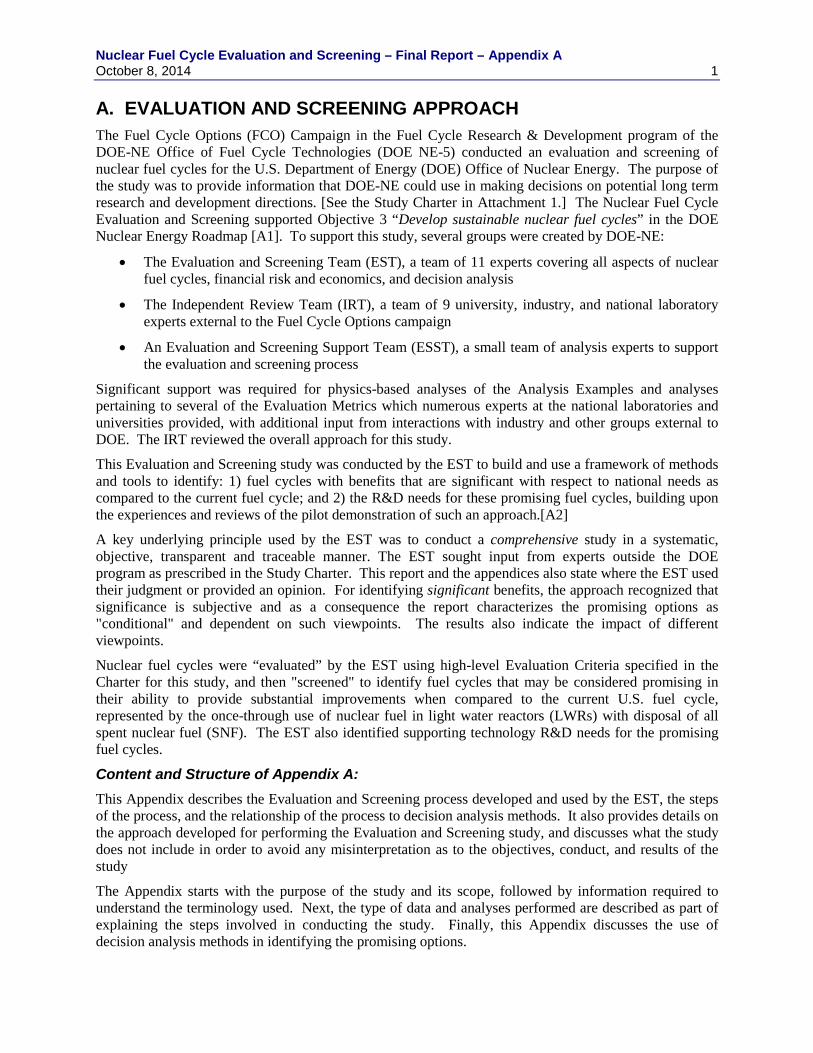
Nuclear Fuel Cycle Evaluation and Screening – Final Report – Appendix A October 8, 2014 1 A. EVALUATION AND SCREENING APPROACH The Fuel Cycle Options (FCO) Campaign in the Fuel Cycle Research & Development program of the DOE-NE Office of Fuel Cycle Technologies (DOE NE-5) conducted an evaluation and screening of nuclear fuel cycles for the U.S. Department of Energy (DOE) Office of Nuclear Energy. The purpose of the study was to provide information that DOE-NE could use in making decisions on potential long term research and development directions. [See the Study Charter in Attachment 1.] The Nuclear Fuel Cycle Evaluation and Screening supported Objective 3 “Develop sustainable nuclear fuel cycles” in the DOE Nuclear Energy Roadmap [A1]. To support this study, several groups were created by DOE-NE:
• The Evaluation and Screening Team (EST), a team of 11 experts covering all aspects of nuclear fuel cycles, financial risk and economics, and decision analysis
• The Independent Review Team (IRT), a team of 9 university, industry, and national laboratory experts external to the Fuel Cycle Options campaign
• An Evaluation and Screening Support Team (ESST), a small team of analysis experts to support the evaluation and screening process
Significant support was required for physics-based analyses of the Analysis Examples and analyses pertaining to several of the Evaluation Metrics which numerous experts at the national laboratories and universities provided, with additional input from interactions with industry and other groups external to DOE. The IRT reviewed the overall approach for this study.
This Evaluation and Screening study was conducted by the EST to build and use a framework of methods and tools to identify: 1) fuel cycles with benefits that are significant with respect to national needs as compared to the current fuel cycle; and 2) the R&D needs for these promising fuel cycles, building upon the experiences and reviews of the pilot demonstration of such an approach.[A2]
A key underlying principle used by the EST was to conduct a comprehensive study in a systematic, objective, transparent and traceable manner. The EST sought input from experts outside the DOE program as prescribed in the Study Charter. This report and the appendices also state where the EST used their judgment or provided an opinion. For identifying significant benefits, the approach recognized that significance is subjective and as a consequence the report characterizes the promising options as "conditional" and dependent on such viewpoints. The results also indicate the impact of different viewpoints.
Nuclear fuel cycles were “evaluated” by the EST using high-level Evaluation Criteria specified in the Charter for this study, and then "screened" to identify fuel cycles that may be considered promising in their ability to provide substantial improvements when compared to the current U.S. fuel cycle, represented by the once-through use of nuclear fuel in light water reactors (LWRs) with disposal of all spent nuclear fuel (SNF). The EST also identified supporting technology R&D needs for the promising fuel cycles.
Content and Structure of Appendix A: This Appendix describes the Evaluation and Screening process developed and used by the EST, the steps of the process, and the relationship of the process to decision analysis methods. It also provides details on the approach developed for performing the Evaluation and Screening study, and discusses what the study does not include in order to avoid any misinterpretation as to the objectives, conduct, and results of the study
The Appendix starts with the purpose of the study and its scope, followed by information required to understand the terminology used. Next, the type of data and analyses performed are described as part of explaining the steps involved in conducting the study. Finally, this Appendix discusses the use of decision analysis methods in identifying the promising options.
Nuclear Fuel Cycle Evaluation and Screening – Final Report – Appendix A 2 October 8, 2014 A-1. Study Objective and Scope The Study Charter stated the objective of the Nuclear Fuel Cycle Evaluation and Screening study:
The objective of the proposed evaluation and screening process is to provide information about the potential benefits and challenges of nuclear fuel cycle options (i.e., the complete nuclear energy system from mining to disposal) that can be used to strengthen the basis and provide guidance for the activities undertaken by the DOE-NE Fuel Cycle Research and Development (FCR&D) program.
The Charter specified the scope of the study as follows:
To achieve the objective, a comprehensive set of fuel cycle options will first be defined and then evaluated, followed by screening to identify a relatively small number of promising fuel cycle options with the potential for achieving substantial improvements compared to the current nuclear fuel cycle in the United States. Improvements will be measured in terms of broadly defined economic, environmental, safety, non-proliferation, security, and sustainability goals. The required characteristics of the promising fuel cycle options can be used to establish specific technical objectives for the essential supporting technologies. This information can strengthen the basis for R&D decisions, particularly with respect to narrowing the focus of program activities. These R&D decisions could include eliminating support for technologies no longer considered relevant to program objectives, continuing or increased support for technologies already under development, as well as support for technologies that are currently not being investigated.
The Study Charter listed nine high-level Evaluation Criteria to represent the broadly defined goals:
• Nuclear Waste Management • Proliferation Risk • Nuclear Material Security Risk • Safety • Environmental Impact • Resource Utilization • Development and Deployment Risk • Institutional Issues • Financial Risk and Economics
Results from the evaluation and screening provided information to answer the following three questions from the Study Charter:
1. Which nuclear fuel cycle system options have the potential for substantial beneficial improvements in nuclear fuel cycle performance, and what aspects of the options make these improvements possible?
2. Which nuclear material management approaches can favorably impact the performance of fuel cycle options, e.g. extended decay storage (spent or used fuel, products, or wastes), specific disposal environments, processing of used fuel, minor actinide separation and transmutation, etc.?
3. Where is DOE R&D investment needed to support the set of promising fuel cycle system options and nuclear material management approaches identified above, and what are the technical objectives of associated technologies?
Nuclear Fuel Cycle Evaluation and Screening – Final Report – Appendix A October 8, 2014 3 The EST focused the study on technical or other measurable indicators of fuel cycle capabilities since the basis for identifying a relatively small number of promising fuel cycles would be the ability of such fuel cycles to provide substantial improvements compared to the current U.S. fuel cycle with respect to the specified nine Criteria. The EST evaluated and screened nuclear fuel cycles only at what is termed the “functional” level in this report (i.e., the physics principles defining what happens at each fuel cycle step, not the technologies for how it is accomplished). As a consequence, the study did not evaluate or screen either specific technology options or deployment options.
The study did not consider general questions about the use of nuclear power, or questions that represented non-technical or non-measurable concerns. For example, the EST did not consider questions or challenges about implementing deep geologic disposal of spent nuclear fuel (SNF) or other highly radioactive long-lived wastes, but since all fuel cycles requires such disposal, the EST used the premise that appropriate disposal would be available for any nuclear fuel cycle, and the study focused on the effects that options may have on the potential disposal paths. Similarly, the EST did not consider general concerns about the economics of nuclear power, the future viability of using nuclear power, or the public acceptance of nuclear power facilities, since such questions and concerns are outside the scope of this study. However, while economic viability of the continued use of nuclear power was not a question addressed in the study, the EST did explore the relative economics among different nuclear fuel cycles. Specific fuel cycle implementation choices were also not included, such as the use of small modular reactors, since in principle such reactors are usable with any fuel cycle.
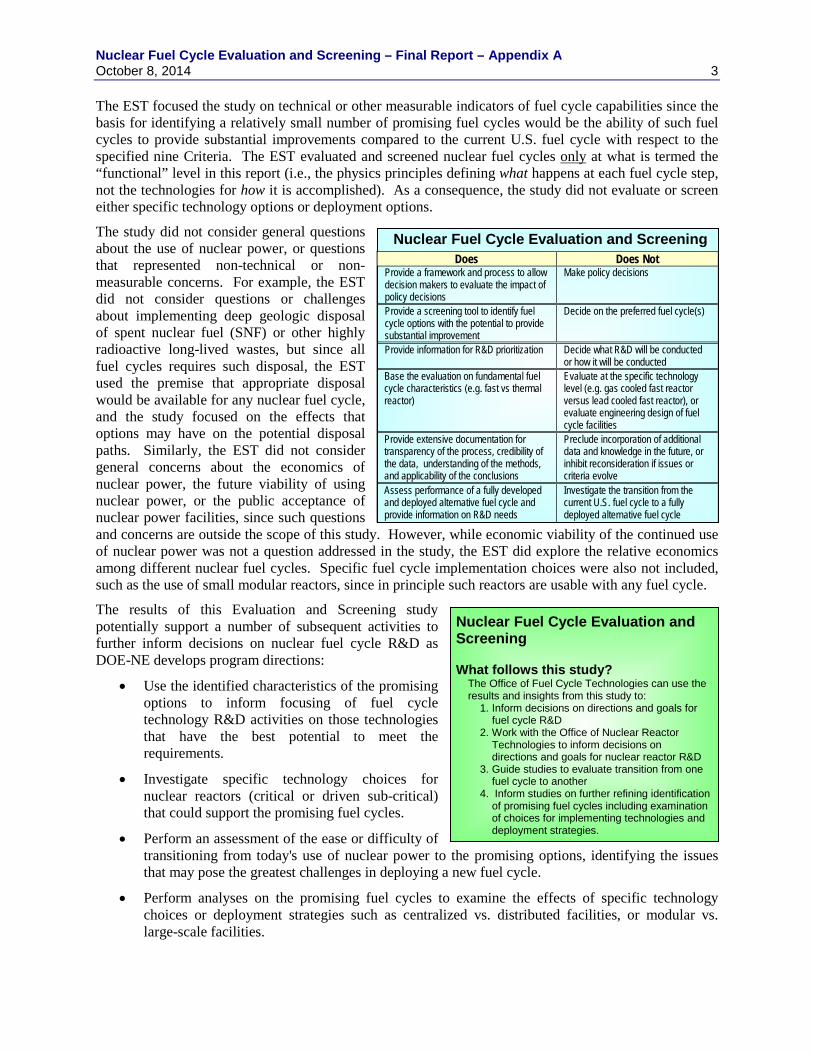
The results of this Evaluation and Screening study potentially support a number of subsequent activities to further inform decisions on nuclear fuel cycle R&D as DOE-NE develops program directions:
• Use the identified characteristics of the promising options to inform focusing of fuel cycle technology R&D activities on those technologies that have the best potential to meet the requirements.
• Investigate specific technology choices for nuclear reactors (critical or driven sub-critical) that could support the promising fuel cycles.
• Perform an assessment of the ease or difficulty of transitioning from today's use of nuclear power to the promising options, identifying the issues that may pose the greatest challenges in deploying a new fuel cycle.
• Perform analyses on the promising fuel cycles to examine the effects of specific technology choices or deployment strategies such as centralized vs. distributed facilities, or modular vs. large-scale facilities.
Nuclear Fuel Cycle Evaluation and Screening What follows this study?
The Office of Fuel Cycle Technologies can use the results and insights from this study to:
1. Inform decisions on directions and goals for fuel cycle R&D
2. Work with the Office of Nuclear Reactor Technologies to inform decisions on directions and goals for nuclear reactor R&D
3. Guide studies to evaluate transition from one fuel cycle to another
4. Inform studies on further refining identification of promising fuel cycles including examination of choices for implementing technologies and deployment strategies.
Nuclear Fuel Cycle Evaluation and Screening Does Does Not
Provide a framework and process to allow decision makers to evaluate the impact of policy decisions
Make policy decisions
Provide a screening tool to identify fuel cycle options with the potential to provide substantial improvement
Decide on the preferred fuel cycle(s)
Provide information for R&D prioritization Decide what R&D will be conducted or how it will be conducted
Base the evaluation on fundamental fuel cycle characteristics (e.g. fast vs thermal reactor)
Evaluate at the specific technology level (e.g. gas cooled fast reactor versus lead cooled fast reactor), or evaluate engineering design of fuel cycle facilities
Provide extensive documentation for transparency of the process, credibility of the data, understanding of the methods, and applicability of the conclusions
Preclude incorporation of additional data and knowledge in the future, or inhibit reconsideration if issues or criteria evolve
Assess performance of a fully developed and deployed alternative fuel cycle and provide information on R&D needs
Investigate the transition from the current U.S. fuel cycle to a fully deployed alternative fuel cycle
Nuclear Fuel Cycle Evaluation and Screening – Final Report – Appendix A 4 October 8, 2014 A-1.1 Scope of Considerations for the Evaluation Criteria The following summarizes the scope considered by the EST for each of the Evaluation Criteria that guided defining the Evaluation Criteria and developing the corresponding Evaluation Metrics.
Nuclear Waste Management Criterion – The premise for this study used by the EST was that all disposal paths required by the use of nuclear power would be available for the disposal of any and all wastes generated by a nuclear fuel cycle. As such, questions of whether such suitable disposal paths exist today for all radioactive wastes were not relevant to this study, nor were questions of any challenges or impediments to such implementation. All nuclear fuel cycles generate wastes that require isolation from the inhabited environment, such as using deep geologic isolation for the management of spent nuclear fuel (SNF) and/or high-level wastes (HLW). Some nuclear fuel cycles may generate less waste than others, but all fuel cycles create these wastes. Consequently, there is nothing that a nuclear fuel cycle can do that would either enable or eliminate the need for this waste disposal capability, and the Study focused on the quantity and characteristics of the radioactive wastes generated by the different fuel cycles, including the current U.S. fuel cycle, not on the details of waste disposal such as geologic disposal environments. Similarly, the EST considered the low-level wastes (LLW) generated by a fuel cycle, which are currently disposed with near-surface burial.
Proliferation Risk Criterion – In general, assessing proliferation risk is a complex and challenging endeavor, primarily because it involves both technical and socio-political considerations, with the dominant factor being facility location. Since most of these factors are beyond the scope of the E&S Study, there was no attempt at an assessment of proliferation risk in the E&S Study, and efforts focused only on the evaluation of technical differences between fuel cycle options at the physics-based functional level (this study did not consider any specific implementing technologies as described in the Main Report, in this Appendix, and in Appendix B).
Nuclear Material Security Risk Criterion – The comparison of nuclear material security risk between nuclear energy system options includes an evaluation of the potential target materials as they exist for normal operations. Further, the other aspects of physical protection relevant to nuclear material security risk are a function of specific facility designs and operations, including physical barriers and assumptions made about the protective force and adversary force capabilities. These were not considerations in this E&S Study of fuel cycles, and as a consequence, it was not possible to evaluate nuclear material security risk; the E&S Study could only inform on the materials available from the fuel cycle.
Safety Criterion – the EST considered whether a fuel cycle could be safely deployed and the relative challenges in addressing safety hazards for an alternative fuel cycle in comparison to the current U.S. fuel cycle for all of the facilities required for each fuel cycle. The EST did not consider general questions on the acceptability of the current safety of nuclear power as deployed in the U.S.
Environmental Impact Criterion – the EST considered the environmental impacts from the routine operations of a nuclear fuel cycle focusing on impacts from fuel acquisition and nuclear power generation. Environmental impacts from accidents at fuel cycle facilities are not included in this criterion since these are part of the Safety criterion. Similarly, the EST did not consider the environmental impacts of waste disposal under this criterion since they are represented, directly or indirectly, by the metrics in the Nuclear Waste Management criterion. The information in this Study is only about the relative changes in such impacts between fuel cycle options, and not about whether such impacts are ultimately acceptable.
Resource Utilization Criterion – the EST only considered the natural resources required for nuclear fuel (i.e. uranium and thorium), not resources in general.
Development and Deployment Risk Criterion – the EST considered technology development needs for fuel cycle options including what would be necessary for maturing the technologies and factors that would affect deployment of a first-of-a-kind facility and integration of all parts of the entire fuel cycle.
Nuclear Fuel Cycle Evaluation and Screening – Final Report – Appendix A October 8, 2014 5 Institutional Issues Criterion – the EST considered issues such as the existing infrastructure, current regulations, and market conditions and any different supporting needs that alternative fuel cycles would have as potential challenges to the deployment of a fuel cycle.
Financial Risk and Economics Criterion – the EST considered the relative differences in financial risk and economics among nuclear fuel cycle options. However, the EST did not consider the overall economic viability of nuclear power in the U.S.
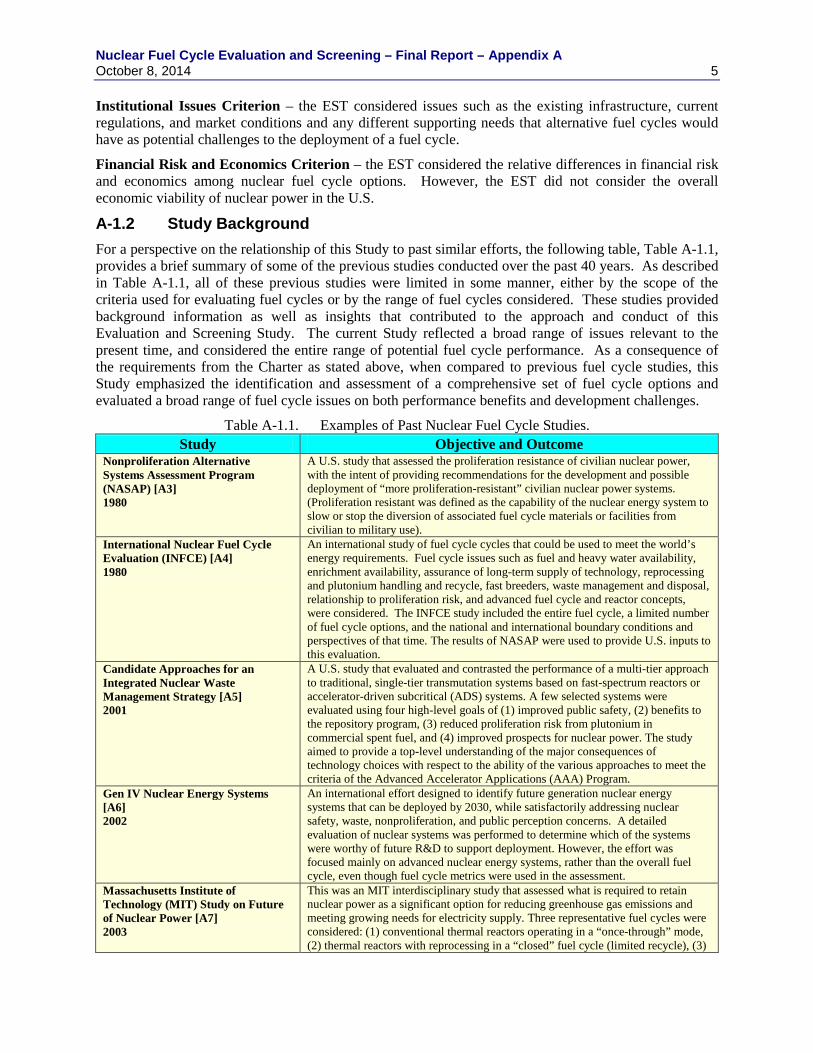
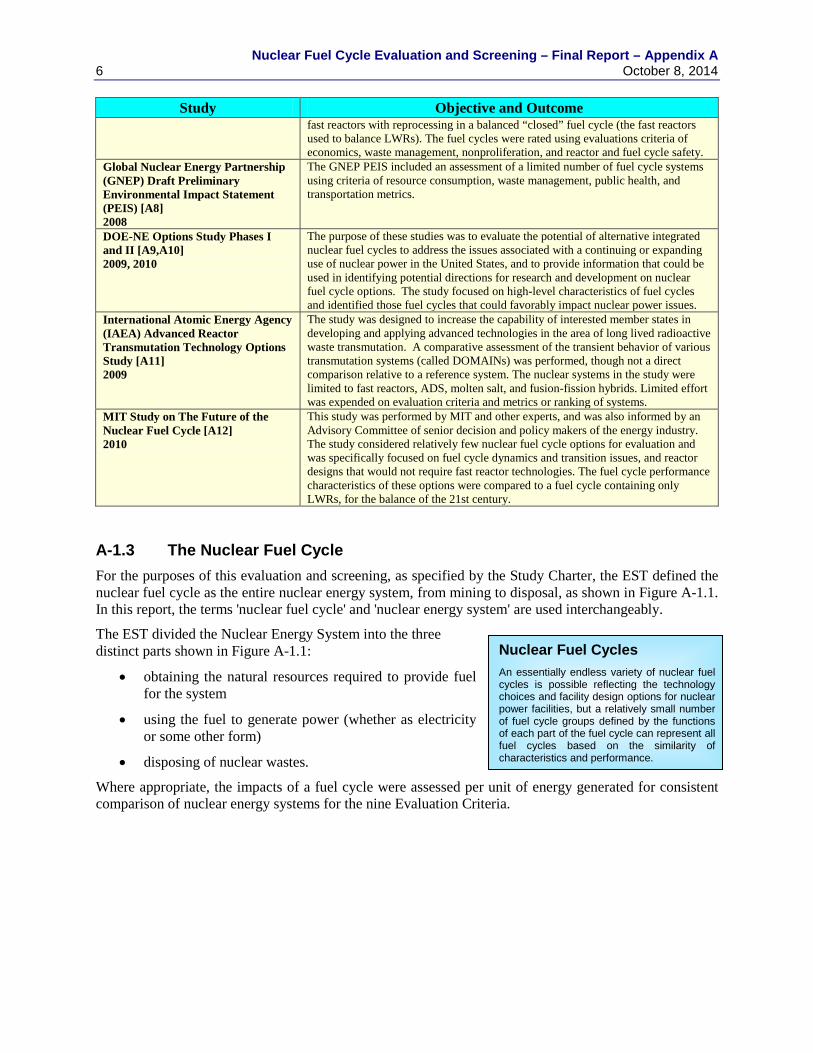
A-1.2 Study Background For a perspective on the relationship of this Study to past similar efforts, the following table, Table A-1.1, provides a brief summary of some of the previous studies conducted over the past 40 years. As described in Table A-1.1, all of these previous studies were limited in some manner, either by the scope of the criteria used for evaluating fuel cycles or by the range of fuel cycles considered. These studies provided background information as well as insights that contributed to the approach and conduct of this Evaluation and Screening Study. The current Study reflected a broad range of issues relevant to the present time, and considered the entire range of potential fuel cycle performance. As a consequence of the requirements from the Charter as stated above, when compared to previous fuel cycle studies, this Study emphasized the identification and assessment of a comprehensive set of fuel cycle options and evaluated a broad range of fuel cycle issues on both performance benefits and development challenges.
Table A-1.1. Examples of Past Nuclear Fuel Cycle Studies. Study Objective and Outcome
Nonproliferation Alternative Systems Assessment Program (NASAP) [A3] 1980
A U.S. study that assessed the proliferation resistance of civilian nuclear power, with the intent of providing recommendations for the development and possible deployment of “more proliferation-resistant” civilian nuclear power systems. (Proliferation resistant was defined as the capability of the nuclear energy system to slow or stop the diversion of associated fuel cycle materials or facilities from civilian to military use).
International Nuclear Fuel Cycle Evaluation (INFCE) [A4] 1980
An international study of fuel cycle cycles that could be used to meet the world’s energy requirements. Fuel cycle issues such as fuel and heavy water availability, enrichment availability, assurance of long-term supply of technology, reprocessing and plutonium handling and recycle, fast breeders, waste management and disposal, relationship to proliferation risk, and advanced fuel cycle and reactor concepts, were considered. The INFCE study included the entire fuel cycle, a limited number of fuel cycle options, and the national and international boundary conditions and perspectives of that time. The results of NASAP were used to provide U.S. inputs to this evaluation.
Candidate Approaches for an Integrated Nuclear Waste Management Strategy [A5] 2001
A U.S. study that evaluated and contrasted the performance of a multi-tier approach to traditional, single-tier transmutation systems based on fast-spectrum reactors or accelerator-driven subcritical (ADS) systems. A few selected systems were evaluated using four high-level goals of (1) improved public safety, (2) benefits to the repository program, (3) reduced proliferation risk from plutonium in commercial spent fuel, and (4) improved prospects for nuclear power. The study aimed to provide a top-level understanding of the major consequences of technology choices with respect to the ability of the various approaches to meet the criteria of the Advanced Accelerator Applications (AAA) Program.
Gen IV Nuclear Energy Systems [A6] 2002
An international effort designed to identify future generation nuclear energy systems that can be deployed by 2030, while satisfactorily addressing nuclear safety, waste, nonproliferation, and public perception concerns. A detailed evaluation of nuclear systems was performed to determine which of the systems were worthy of future R&D to support deployment. However, the effort was focused mainly on advanced nuclear energy systems, rather than the overall fuel cycle, even though fuel cycle metrics were used in the assessment.
Massachusetts Institute of Technology (MIT) Study on Future of Nuclear Power [A7] 2003
This was an MIT interdisciplinary study that assessed what is required to retain nuclear power as a significant option for reducing greenhouse gas emissions and meeting growing needs for electricity supply. Three representative fuel cycles were considered: (1) conventional thermal reactors operating in a “once-through” mode, (2) thermal reactors with reprocessing in a “closed” fuel cycle (limited recycle), (3)
Nuclear Fuel Cycle Evaluation and Screening – Final Report – Appendix A 6 October 8, 2014
Study Objective and Outcome fast reactors with reprocessing in a balanced “closed” fuel cycle (the fast reactors used to balance LWRs). The fuel cycles were rated using evaluations criteria of economics, waste management, nonproliferation, and reactor and fuel cycle safety.
Global Nuclear Energy Partnership (GNEP) Draft Preliminary Environmental Impact Statement (PEIS) [A8] 2008
The GNEP PEIS included an assessment of a limited number of fuel cycle systems using criteria of resource consumption, waste management, public health, and transportation metrics.
DOE-NE Options Study Phases I and II [A9,A10] 2009, 2010
The purpose of these studies was to evaluate the potential of alternative integrated nuclear fuel cycles to address the issues associated with a continuing or expanding use of nuclear power in the United States, and to provide information that could be used in identifying potential directions for research and development on nuclear fuel cycle options. The study focused on high-level characteristics of fuel cycles and identified those fuel cycles that could favorably impact nuclear power issues.
International Atomic Energy Agency (IAEA) Advanced Reactor Transmutation Technology Options Study [A11] 2009
The study was designed to increase the capability of interested member states in developing and applying advanced technologies in the area of long lived radioactive waste transmutation. A comparative assessment of the transient behavior of various transmutation systems (called DOMAINs) was performed, though not a direct comparison relative to a reference system. The nuclear systems in the study were limited to fast reactors, ADS, molten salt, and fusion-fission hybrids. Limited effort was expended on evaluation criteria and metrics or ranking of systems.
MIT Study on The Future of the Nuclear Fuel Cycle [A12] 2010
This study was performed by MIT and other experts, and was also informed by an Advisory Committee of senior decision and policy makers of the energy industry. The study considered relatively few nuclear fuel cycle options for evaluation and was specifically focused on fuel cycle dynamics and transition issues, and reactor designs that would not require fast reactor technologies. The fuel cycle performance characteristics of these options were compared to a fuel cycle containing only LWRs, for the balance of the 21st century.
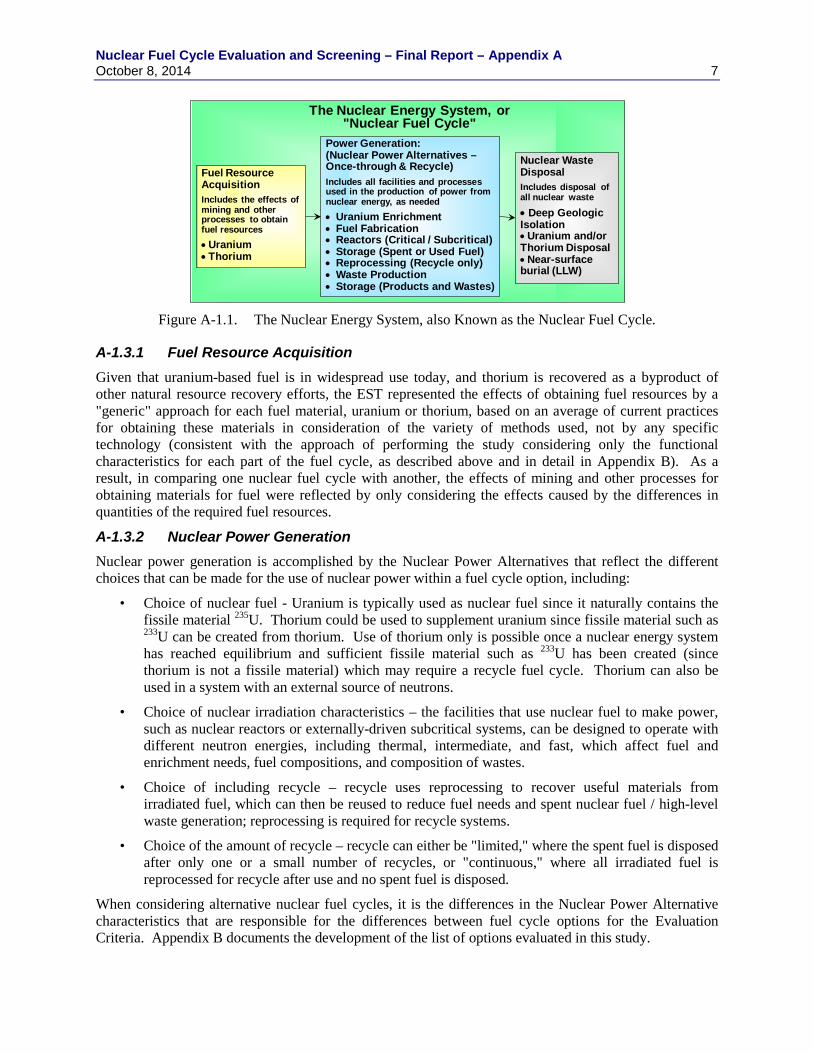
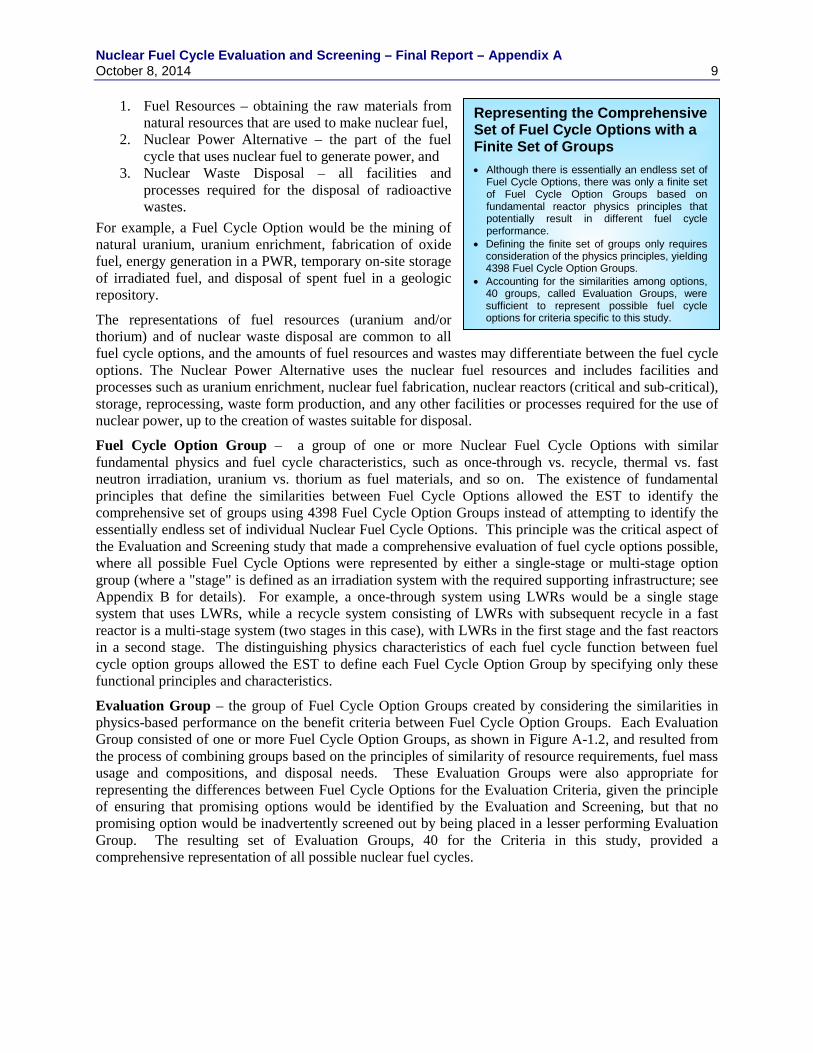
A-1.3 The Nuclear Fuel Cycle For the purposes of this evaluation and screening, as specified by the Study Charter, the EST defined the nuclear fuel cycle as the entire nuclear energy system, from mining to disposal, as shown in Figure A-1.1. In this report, the terms 'nuclear fuel cycle' and 'nuclear energy system' are used interchangeably.
The EST divided the Nuclear Energy System into the three distinct parts shown in Figure A-1.1:
• obtaining the natural resources required to provide fuel for the system
• using the fuel to generate power (whether as electricity or some other form)
• disposing of nuclear wastes.
Where appropriate, the impacts of a fuel cycle were assessed per unit of energy generated for consistent comparison of nuclear energy systems for the nine Evaluation Criteria.
Nuclear Fuel Cycles An essentially endless variety of nuclear fuel cycles is possible reflecting the technology choices and facility design options for nuclear power facilities, but a relatively small number of fuel cycle groups defined by the functions of each part of the fuel cycle can represent all fuel cycles based on the similarity of characteristics and performance.
Nuclear Fuel Cycle Evaluation and Screening – Final Report – Appendix A October 8, 2014 7
Figure A-1.1. The Nuclear Energy System, also Known as the Nuclear Fuel Cycle.
A-1.3.1 Fuel Resource Acquisition Given that uranium-based fuel is in widespread use today, and thorium is recovered as a byproduct of other natural resource recovery efforts, the EST represented the effects of obtaining fuel resources by a "generic" approach for each fuel material, uranium or thorium, based on an average of current practices for obtaining these materials in consideration of the variety of methods used, not by any specific technology (consistent with the approach of performing the study considering only the functional characteristics for each part of the fuel cycle, as described above and in detail in Appendix B). As a result, in comparing one nuclear fuel cycle with another, the effects of mining and other processes for obtaining materials for fuel were reflected by only considering the effects caused by the differences in quantities of the required fuel resources.
A-1.3.2 Nuclear Power Generation Nuclear power generation is accomplished by the Nuclear Power Alternatives that reflect the different choices that can be made for the use of nuclear power within a fuel cycle option, including:
• Choice of nuclear fuel - Uranium is typically used as nuclear fuel since it naturally contains the fissile material 235U. Thorium could be used to supplement uranium since fissile material such as 233U can be created from thorium. Use of thorium only is possible once a nuclear energy system has reached equilibrium and sufficient fissile material such as 233U has been created (since thorium is not a fissile material) which may require a recycle fuel cycle. Thorium can also be used in a system with an external source of neutrons.
• Choice of nuclear irradiation characteristics – the facilities that use nuclear fuel to make power, such as nuclear reactors or externally-driven subcritical systems, can be designed to operate with different neutron energies, including thermal, intermediate, and fast, which affect fuel and enrichment needs, fuel compositions, and composition of wastes.
• Choice of including recycle – recycle uses reprocessing to recover useful materials from irradiated fuel, which can then be reused to reduce fuel needs and spent nuclear fuel / high-level waste generation; reprocessing is required for recycle systems.
• Choice of the amount of recycle – recycle can either be "limited," where the spent fuel is disposed after only one or a small number of recycles, or "continuous," where all irradiated fuel is reprocessed for recycle after use and no spent fuel is disposed.
When considering alternative nuclear fuel cycles, it is the differences in the Nuclear Power Alternative characteristics that are responsible for the differences between fuel cycle options for the Evaluation Criteria. Appendix B documents the development of the list of options evaluated in this study.
The Nuclear Energy System, or "Nuclear Fuel Cycle"
Fuel Resource AcquisitionIncludes the effects of mining and other processes to obtain fuel resources•Uranium• Thorium
Power Generation:(Nuclear Power Alternatives –Once-through & Recycle)Includes all facilities and processes used in the production of power from nuclear energy, as needed• Uranium Enrichment• Fuel Fabrication• Reactors (Critical / Subcritical)• Storage (Spent or Used Fuel)• Reprocessing (Recycle only)• Waste Production• Storage (Products and Wastes)
Nuclear Waste Disposal Includes disposal of all nuclear waste
• Deep Geologic Isolation•Uranium and/or Thorium Disposal•Near-surface burial (LLW)
Nuclear Fuel Cycle Evaluation and Screening – Final Report – Appendix A 8 October 8, 2014 A-1.3.3 Nuclear Waste Disposal For the disposal of nuclear wastes, the situation is more complex. First, it is essential to recognize that all nuclear energy systems generate radioactive wastes requiring isolation from the inhabited environment, such as highly-radioactive wastes that require deep geologic isolation (for SNF and/or HLW) and wastes that are acceptable for near-surface burial (LLW), but the amounts and compositions of such wastes can vary from one nuclear fuel cycle to another.
For near-surface burial, all of the approaches currently used for disposal are similar to one another, involving shallow burial of the materials in appropriate containers at suitable sites. The EST evaluated the difference between nuclear fuel cycles by the different amount of LLW produced per unit of energy generated.
However, for nuclear wastes requiring isolation from the inhabited environment such as SNF or HLW, there are no operating geologic repositories at this time. Global studies continue to investigate the potential to design, construct, and operate a nuclear waste repository in many geologic environments, often with very different natural isolation capabilities with respect to the elemental content of spent fuel or HLW. These studies all appear to indicate that it may be possible in principle to develop an acceptable nuclear waste repository in these environments, i.e., one that meets regulations for such a repository. As mentioned above, questions related to achieving the goal of actually constructing and opening a repository (which may be easier in some environments and more challenging in others) are outside the scope of this study. As a result, while the original plan was to explore the effects of different disposal environments during the course of this study as stated in the Charter, recognition that it is possible to design an acceptable repository for many disposal environments prompted a change in focus for this study to using only generic considerations of waste disposal applicable to any repository. Informing on the effects of different nuclear fuel cycles on the radioactive wastes requiring geologic isolation only required consideration of the differences in the amount of wastes produced (and to a lesser extent the characteristics), again per unit of energy generated. This approach also made the treatment of waste disposal consistent with the overall approach of using the functional characteristics of each part of the fuel cycle for the study, as described above and in Appendix B.
Many fuel cycles also produce excess amounts of nuclear materials that would be considered wastes since there is no use for them in the fuel cycle. These materials include excess depleted uranium (from uranium enrichment), excess recovered uranium (from reprocessing when not all uranium is recycled), or excess recovered thorium (from reprocessing when not all thorium is recycled). No disposal path has been identified for these excess materials in the U.S., but all are wastes that will require a suitable disposal approach.
A-1.4 Fuel Cycle Option Terminology Given the potentially endless variety of possible nuclear fuel cycle options, the EST used the following concepts to structure the consideration of nuclear fuel cycle options for the Evaluation and Screening study. This allowed the EST to develop and evaluate the comprehensive set of fuel cycles by using a relatively small set of groups of options, as explained below and in detail in Appendix B.
A Nuclear Fuel Cycle Option, or Fuel Cycle Option, is a specific implementation of the complete nuclear energy system as shown in Figure A-1.1, including all technologies required for the use of nuclear energy, from obtaining natural resources for nuclear fuel to the disposal of radioactive wastes. As shown in Figure A-1.1, for this study, each fuel cycle option (or nuclear energy system) consisted of three parts:
Deep Geologic Waste Disposal The EST evaluated the impact on disposal of SNF / HLW from different fuel cycles by only considering the amount and hazard of the wastes because all fuel cycles require such disposal capabilities and the EST assumed that a suitable repository would be developed for one or more of several geologic environments.
Nuclear Fuel Cycle Evaluation and Screening – Final Report – Appendix A October 8, 2014 9
1. Fuel Resources – obtaining the raw materials from natural resources that are used to make nuclear fuel,
2. Nuclear Power Alternative – the part of the fuel cycle that uses nuclear fuel to generate power, and
3. Nuclear Waste Disposal – all facilities and processes required for the disposal of radioactive wastes.
For example, a Fuel Cycle Option would be the mining of natural uranium, uranium enrichment, fabrication of oxide fuel, energy generation in a PWR, temporary on-site storage of irradiated fuel, and disposal of spent fuel in a geologic repository.
The representations of fuel resources (uranium and/or thorium) and of nuclear waste disposal are common to all fuel cycle options, and the amounts of fuel resources and wastes may differentiate between the fuel cycle options. The Nuclear Power Alternative uses the nuclear fuel resources and includes facilities and processes such as uranium enrichment, nuclear fuel fabrication, nuclear reactors (critical and sub-critical), storage, reprocessing, waste form production, and any other facilities or processes required for the use of nuclear power, up to the creation of wastes suitable for disposal.
Fuel Cycle Option Group – a group of one or more Nuclear Fuel Cycle Options with similar fundamental physics and fuel cycle characteristics, such as once-through vs. recycle, thermal vs. fast neutron irradiation, uranium vs. thorium as fuel materials, and so on. The existence of fundamental principles that define the similarities between Fuel Cycle Options allowed the EST to identify the comprehensive set of groups using 4398 Fuel Cycle Option Groups instead of attempting to identify the essentially endless set of individual Nuclear Fuel Cycle Options. This principle was the critical aspect of the Evaluation and Screening study that made a comprehensive evaluation of fuel cycle options possible, where all possible Fuel Cycle Options were represented by either a single-stage or multi-stage option group (where a "stage" is defined as an irradiation system with the required supporting infrastructure; see Appendix B for details). For example, a once-through system using LWRs would be a single stage system that uses LWRs, while a recycle system consisting of LWRs with subsequent recycle in a fast reactor is a multi-stage system (two stages in this case), with LWRs in the first stage and the fast reactors in a second stage. The distinguishing physics characteristics of each fuel cycle function between fuel cycle option groups allowed the EST to define each Fuel Cycle Option Group by specifying only these functional principles and characteristics.
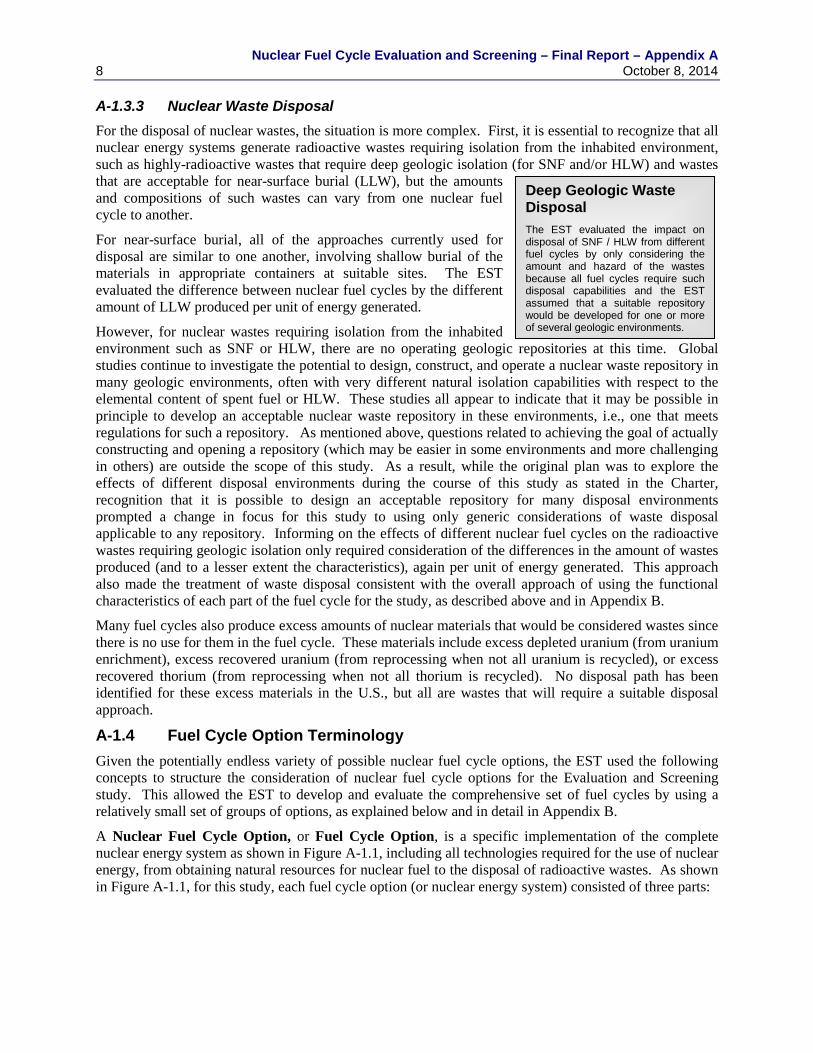
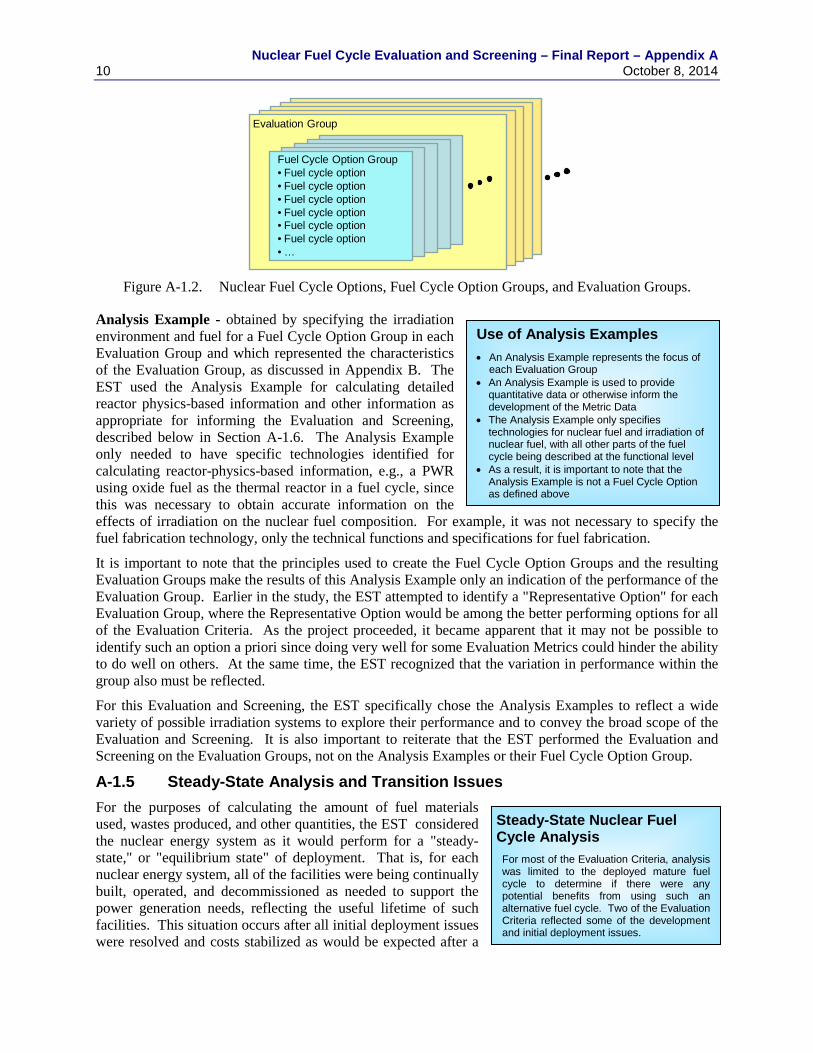
Evaluation Group – the group of Fuel Cycle Option Groups created by considering the similarities in physics-based performance on the benefit criteria between Fuel Cycle Option Groups. Each Evaluation Group consisted of one or more Fuel Cycle Option Groups, as shown in Figure A-1.2, and resulted from the process of combining groups based on the principles of similarity of resource requirements, fuel mass usage and compositions, and disposal needs. These Evaluation Groups were also appropriate for representing the differences between Fuel Cycle Options for the Evaluation Criteria, given the principle of ensuring that promising options would be identified by the Evaluation and Screening, but that no promising option would be inadvertently screened out by being placed in a lesser performing Evaluation Group. The resulting set of Evaluation Groups, 40 for the Criteria in this study, provided a comprehensive representation of all possible nuclear fuel cycles.
Representing the Comprehensive Set of Fuel Cycle Options with a Finite Set of Groups • Although there is essentially an endless set of
Fuel Cycle Options, there was only a finite set of Fuel Cycle Option Groups based on fundamental reactor physics principles that potentially result in different fuel cycle performance.
• Defining the finite set of groups only requires consideration of the physics principles, yielding 4398 Fuel Cycle Option Groups.
• Accounting for the similarities among options, 40 groups, called Evaluation Groups, were sufficient to represent possible fuel cycle options for criteria specific to this study.
Nuclear Fuel Cycle Evaluation and Screening – Final Report – Appendix A 10 October 8, 2014
Figure A-1.2. Nuclear Fuel Cycle Options, Fuel Cycle Option Groups, and Evaluation Groups.
Analysis Example - obtained by specifying the irradiation environment and fuel for a Fuel Cycle Option Group in each Evaluation Group and which represented the characteristics of the Evaluation Group, as discussed in Appendix B. The EST used the Analysis Example for calculating detailed reactor physics-based information and other information as appropriate for informing the Evaluation and Screening, described below in Section A-1.6. The Analysis Example only needed to have specific technologies identified for calculating reactor-physics-based information, e.g., a PWR using oxide fuel as the thermal reactor in a fuel cycle, since this was necessary to obtain accurate information on the effects of irradiation on the nuclear fuel composition. For example, it was not necessary to specify the fuel fabrication technology, only the technical functions and specifications for fuel fabrication.
It is important to note that the principles used to create the Fuel Cycle Option Groups and the resulting Evaluation Groups make the results of this Analysis Example only an indication of the performance of the Evaluation Group. Earlier in the study, the EST attempted to identify a "Representative Option" for each Evaluation Group, where the Representative Option would be among the better performing options for all of the Evaluation Criteria. As the project proceeded, it became apparent that it may not be possible to identify such an option a priori since doing very well for some Evaluation Metrics could hinder the ability to do well on others. At the same time, the EST recognized that the variation in performance within the group also must be reflected.
For this Evaluation and Screening, the EST specifically chose the Analysis Examples to reflect a wide variety of possible irradiation systems to explore their performance and to convey the broad scope of the Evaluation and Screening. It is also important to reiterate that the EST performed the Evaluation and Screening on the Evaluation Groups, not on the Analysis Examples or their Fuel Cycle Option Group.
A-1.5 Steady-State Analysis and Transition Issues For the purposes of calculating the amount of fuel materials used, wastes produced, and other quantities, the EST considered the nuclear energy system as it would perform for a "steady-state," or "equilibrium state" of deployment. That is, for each nuclear energy system, all of the facilities were being continually built, operated, and decommissioned as needed to support the power generation needs, reflecting the useful lifetime of such facilities. This situation occurs after all initial deployment issues were resolved and costs stabilized as would be expected after a
Evaluation Group
Fuel Cycle Option Group• Fuel cycle option• Fuel cycle option• Fuel cycle option• Fuel cycle option• Fuel cycle option• Fuel cycle option• …
Steady-State Nuclear Fuel Cycle Analysis For most of the Evaluation Criteria, analysis was limited to the deployed mature fuel cycle to determine if there were any potential benefits from using such an alternative fuel cycle. Two of the Evaluation Criteria reflected some of the development and initial deployment issues.
Use of Analysis Examples • An Analysis Example represents the focus of
each Evaluation Group • An Analysis Example is used to provide
quantitative data or otherwise inform the development of the Metric Data
• The Analysis Example only specifies technologies for nuclear fuel and irradiation of nuclear fuel, with all other parts of the fuel cycle being described at the functional level
• As a result, it is important to note that the Analysis Example is not a Fuel Cycle Option as defined above
Nuclear Fuel Cycle Evaluation and Screening – Final Report – Appendix A October 8, 2014 11 sufficient number of each facility was built. The EST used this assumption of nuclear energy systems at equilibrium to assess whether an alternative to today's use of nuclear power would offer any significant benefits with respect to the Evaluation Criteria, and to explain and quantify the benefits. As discussed below, the EST noted that some benefits identified in this Study would be obtained once transition to a new fuel cycle begins, e.g., if the new fuel cycle involves recycle, the spent fuel would no longer be destined for disposal, but reprocessed and there would only be disposal of the smaller amount of HLW. Other benefits would accrue during transition, such as any reduction in fuel resources required by the new fuel cycle.
Some of the issues that may arise in replacing today's infrastructure with such an alternative, including deployment issues and introduction costs, are reflected in the Evaluation and Screening by two of the Evaluation Criteria, informing on the anticipated effort and difficulties in developing and implementing a nuclear energy system different from the current U.S. nuclear power infrastructure. However, the detailed deployment of the new fuel cycle to replace the existing U.S. infrastructure, designated as "transition," including choices on timing of facility construction and options for accelerating or delaying such a transition, was not part of this Study.
Physics-Based Assessment of Transition Impacts on Identified Promising Options
The EST conducted the Evaluation and Screening study using performance information for the equilibrium state of fuel cycle options, as discussed above. To ensure that the study’s results would not be adversely affected by this assumption, the Evaluation and Screening Team (EST) conducted an assessment of the issues (non-equilibrium and transient effects) that arise when replacing the current U.S. fuel cycle with an alternative fuel cycle that might affect identification of promising options. This section summarizes the results of that assessment.
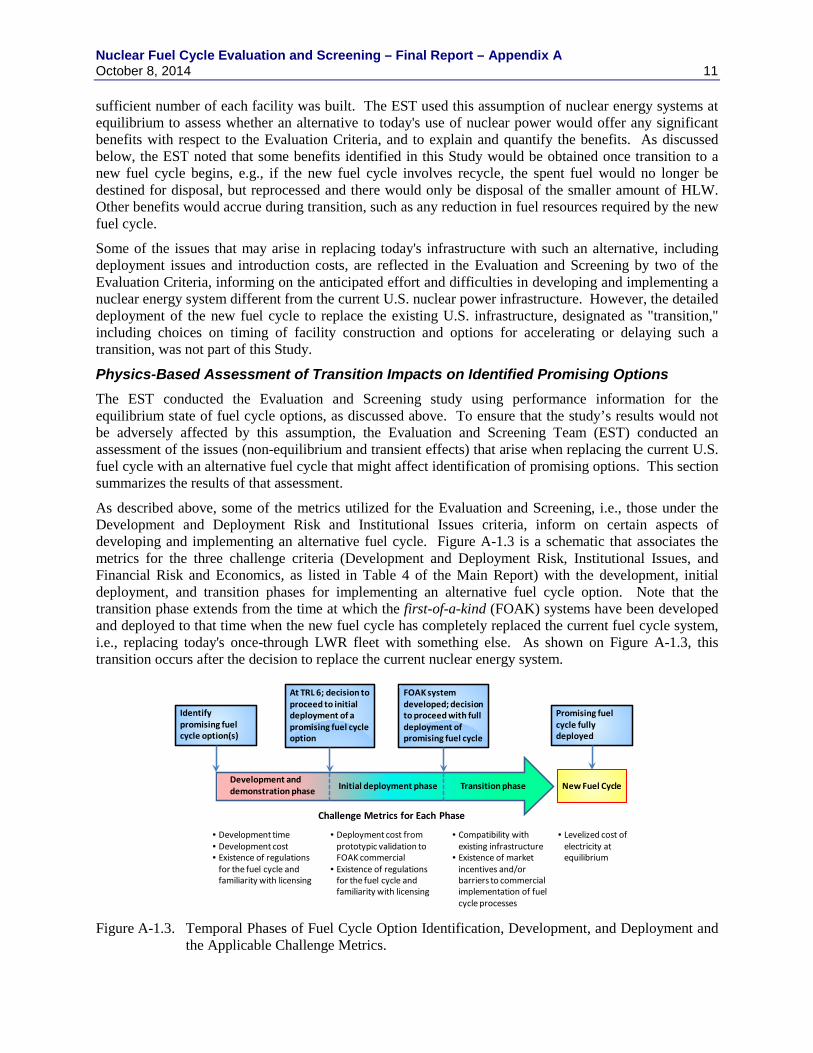
As described above, some of the metrics utilized for the Evaluation and Screening, i.e., those under the Development and Deployment Risk and Institutional Issues criteria, inform on certain aspects of developing and implementing an alternative fuel cycle. Figure A-1.3 is a schematic that associates the metrics for the three challenge criteria (Development and Deployment Risk, Institutional Issues, and Financial Risk and Economics, as listed in Table 4 of the Main Report) with the development, initial deployment, and transition phases for implementing an alternative fuel cycle option. Note that the transition phase extends from the time at which the first-of-a-kind (FOAK) systems have been developed and deployed to that time when the new fuel cycle has completely replaced the current fuel cycle system, i.e., replacing today's once-through LWR fleet with something else. As shown on Figure A-1.3, this transition occurs after the decision to replace the current nuclear energy system.
Figure A-1.3. Temporal Phases of Fuel Cycle Option Identification, Development, and Deployment and
the Applicable Challenge Metrics.
Challenge Metrics for Each Phase
• Development time• Development cost• Existence of regulations
for the fuel cycle and familiarity with licensing
• Deployment cost from prototypic validation to FOAK commercial
• Existence of regulations for the fuel cycle and familiarity with licensing
At TRL 6; decision to proceed to initial deployment of a promising fuel cycle option
• Compatibility with existing infrastructure
• Existence of market incentives and/or barriers to commercial implementation of fuel cycle processes
New Fuel Cycle
• Levelized cost of electricity at equilibrium
Identify promising fuel cycle option(s)
FOAK system developed; decision to proceed with full deployment of promising fuel cycle
Development and demonstration phase Initial deployment phase Transition phase
Promising fuel cycle fully deployed
Nuclear Fuel Cycle Evaluation and Screening – Final Report – Appendix A 12 October 8, 2014 In the EST considerations, the metrics of infrastructure compatibility and market incentives apply to the transition phase. However, note that in this study, there is no consideration in the challenge metrics of either the additional time and cost to go from FOAK to nth-of-a-kind (NOAK), or the time and cost to completely transition to the new nuclear energy system, since these are determined by choices about making such additions to, or replacements of, the current U.S. fleet and are not determined by the characteristics of the fuel cycle itself. After the transition period, an equilibrium state of deployment occurs as described above. The EST evaluated the fuel cycles with respect to the benefit criteria for this equilibrium period after transition was completed and the new fuel cycle fully deployed. As shown on the figure, the Financial Risk and Economics criterion using the LCAE metric as a measure of electricity production cost was also evaluated for the fully deployed new fuel cycle at the equilibrium condition, and as a consequence, all development, initial deployment, and transition costs have already occurred and they are not included in the LCAE.
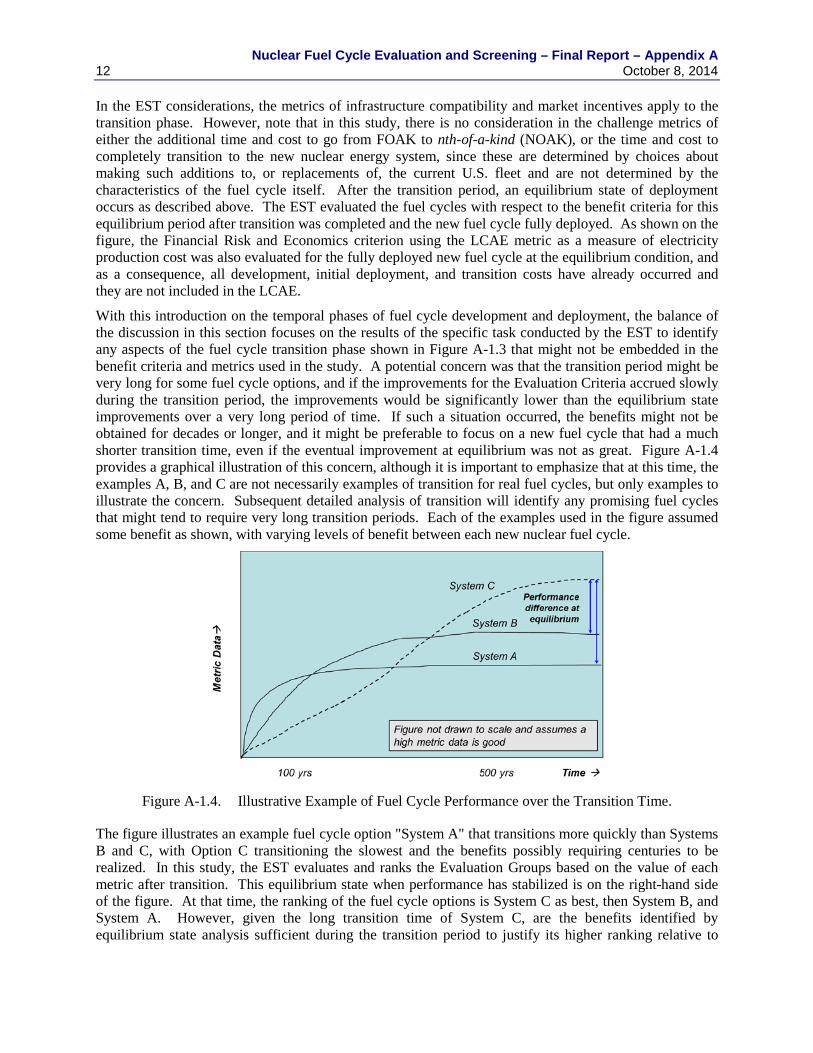
With this introduction on the temporal phases of fuel cycle development and deployment, the balance of the discussion in this section focuses on the results of the specific task conducted by the EST to identify any aspects of the fuel cycle transition phase shown in Figure A-1.3 that might not be embedded in the benefit criteria and metrics used in the study. A potential concern was that the transition period might be very long for some fuel cycle options, and if the improvements for the Evaluation Criteria accrued slowly during the transition period, the improvements would be significantly lower than the equilibrium state improvements over a very long period of time. If such a situation occurred, the benefits might not be obtained for decades or longer, and it might be preferable to focus on a new fuel cycle that had a much shorter transition time, even if the eventual improvement at equilibrium was not as great. Figure A-1.4 provides a graphical illustration of this concern, although it is important to emphasize that at this time, the examples A, B, and C are not necessarily examples of transition for real fuel cycles, but only examples to illustrate the concern. Subsequent detailed analysis of transition will identify any promising fuel cycles that might tend to require very long transition periods. Each of the examples used in the figure assumed some benefit as shown, with varying levels of benefit between each new nuclear fuel cycle.
Figure A-1.4. Illustrative Example of Fuel Cycle Performance over the Transition Time.
The figure illustrates an example fuel cycle option "System A" that transitions more quickly than Systems B and C, with Option C transitioning the slowest and the benefits possibly requiring centuries to be realized. In this study, the EST evaluates and ranks the Evaluation Groups based on the value of each metric after transition. This equilibrium state when performance has stabilized is on the right-hand side of the figure. At that time, the ranking of the fuel cycle options is System C as best, then System B, and System A. However, given the long transition time of System C, are the benefits identified by equilibrium state analysis sufficient during the transition period to justify its higher ranking relative to
Nuclear Fuel Cycle Evaluation and Screening – Final Report – Appendix A October 8, 2014 13 Systems A and B, particularly when the benefits of those two Systems may be achieved over a shorter time period, prior to all Systems reaching steady-state?
To address this concern, it is first noted that in this study, if System A, System B, and System C are all identified as potentially promising, then they would not be screened out and all would be eligible for consideration as a promising option for R&D. However, if the benefit at equilibrium for System A is not sufficient for it to be identified as a potentially promising option, then System A would not be carried forward no matter how fast the transition. Furthermore, many aspects that determine the transition time are affected by choices made concerning deployment of an alternative fuel cycle, not by the characteristics of the fuel cycle itself. As a result, the question of preferring a faster-transitioning promising fuel cycle depends on whether any of the metrics are adversely affected during transition.
Assessment of Transition
To assess the potential effects of transition, the EST considered the changes required starting from the Basis of Comparison, i.e. an option consistent with the current U.S. fuel cycle utilizing light-water reactor technology. The EST also identified factors that affect the transition to an alternative fuel cycle and found that the issue is multi-dimensional, encompassing both technical and societal factors. Combinations of these factors provided many paths to consider for fuel cycle implementation, and would either shorten or prolong the transition. For example, the pace of transition might evolve as dictated by economic considerations, or be accelerated by societal decisions to deploy more quickly. The factors included the time for initial maturation from FOAK to NOAK, the development of the national or international infrastructure and supply chain, fuel cycle facility capacity, materials availability, labor, market forces (including capital at risk), whether to use existing (legacy) spent nuclear fuel, and global consideration of the environment, etc. The EST did not perform such multi-dimensional analysis of transition in this Study since these aspects are not determined by choice of fuel cycle but by other choices made subsequent to the decision to deploy an alternative fuel cycle. It must, however, be noted that such transition studies have been performed on selected fuel cycles in previous activities supported by DOE, facilitating understanding of the many issues involved in deploying an alternative fuel cycle [A13]. The EST did investigate, however, whether there are fundamental physics considerations (i.e., conditions in the fuel cycle) that might force prolonged transition and used that knowledge to inform on potential impacts for the promising Evaluation Groups.
Physics-based Constraints in Fuel Cycle
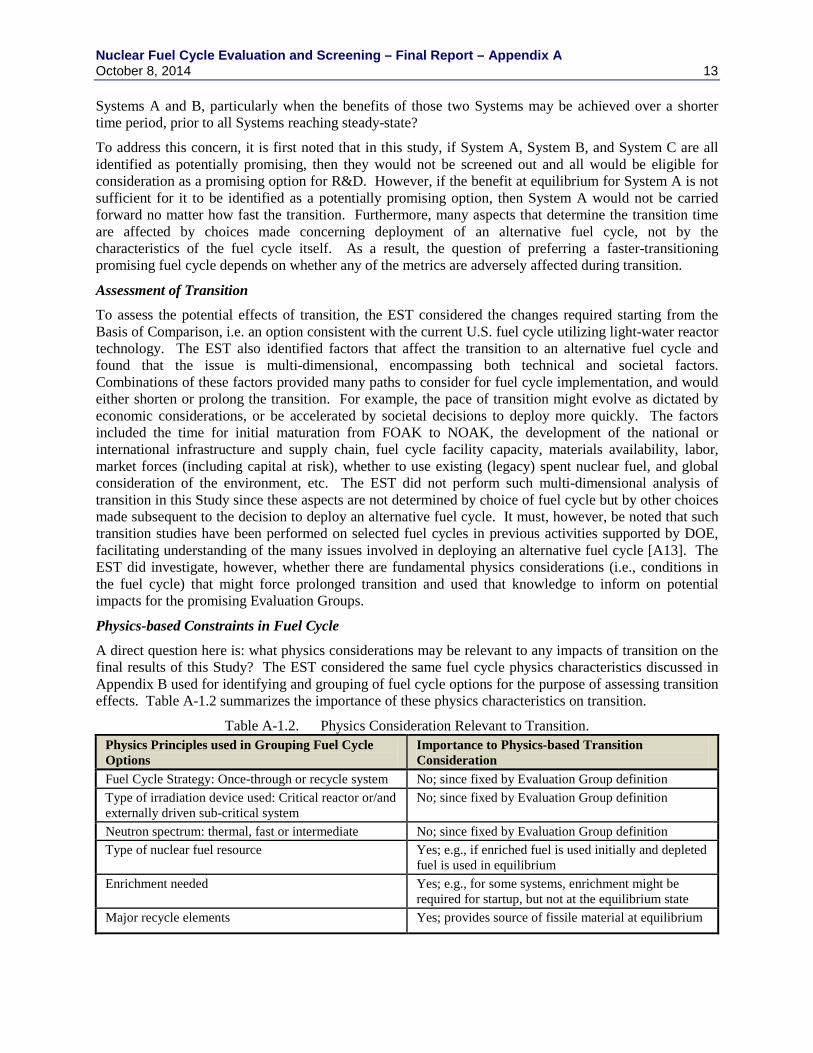
A direct question here is: what physics considerations may be relevant to any impacts of transition on the final results of this Study? The EST considered the same fuel cycle physics characteristics discussed in Appendix B used for identifying and grouping of fuel cycle options for the purpose of assessing transition effects. Table A-1.2 summarizes the importance of these physics characteristics on transition.
Table A-1.2. Physics Consideration Relevant to Transition. Physics Principles used in Grouping Fuel Cycle Options
Importance to Physics-based Transition Consideration
Fuel Cycle Strategy: Once-through or recycle system No; since fixed by Evaluation Group definition Type of irradiation device used: Critical reactor or/and externally driven sub-critical system
No; since fixed by Evaluation Group definition
Neutron spectrum: thermal, fast or intermediate No; since fixed by Evaluation Group definition Type of nuclear fuel resource Yes; e.g., if enriched fuel is used initially and depleted
fuel is used in equilibrium Enrichment needed Yes; e.g., for some systems, enrichment might be
required for startup, but not at the equilibrium state Major recycle elements Yes; provides source of fissile material at equilibrium
Nuclear Fuel Cycle Evaluation and Screening – Final Report – Appendix A 14 October 8, 2014 Based on the considerations and the findings summarized in Table A-1.2, the EST concluded that the assessment of physics-based issues that might affect the transition impacts should focus on:
1. The effects of having the fuel cycle composed partly of the current U.S. fuel cycle and partly of the new nuclear fuel cycle, which is the situation prior to completion of the transition.
2. The additional effects from options requiring enrichment or creation of fissile materials only during initial startup of the reactors during the transition period.
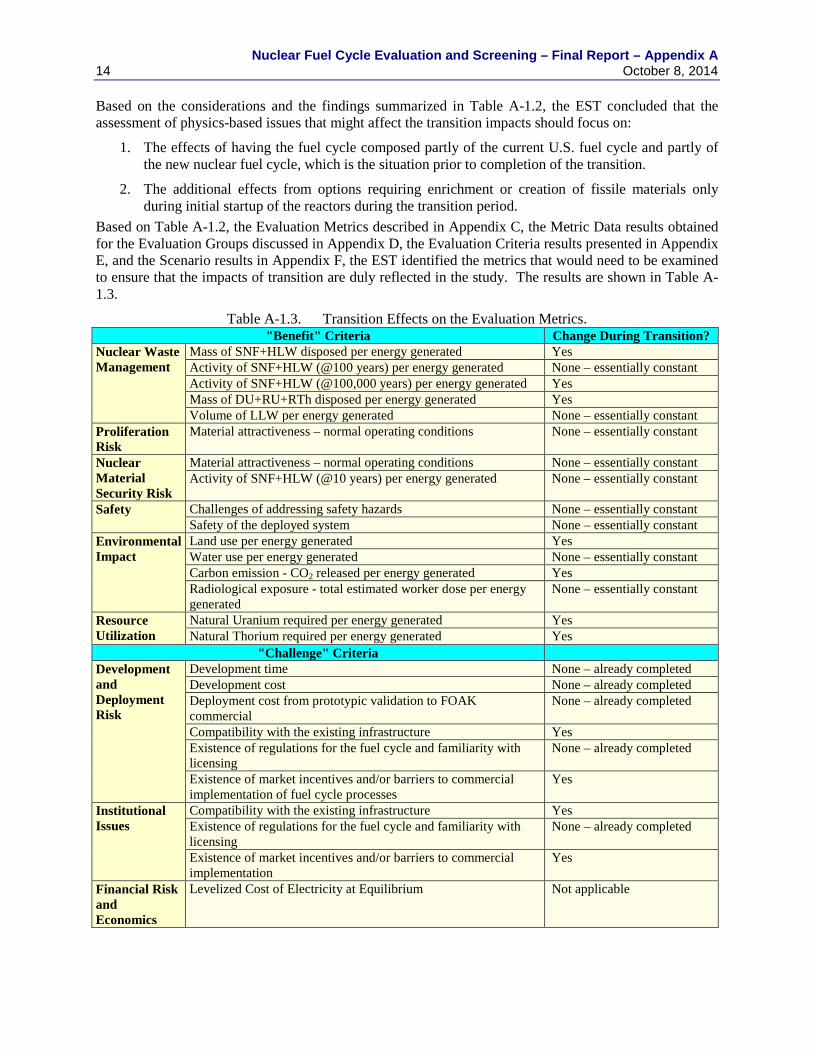
Based on Table A-1.2, the Evaluation Metrics described in Appendix C, the Metric Data results obtained for the Evaluation Groups discussed in Appendix D, the Evaluation Criteria results presented in Appendix E, and the Scenario results in Appendix F, the EST identified the metrics that would need to be examined to ensure that the impacts of transition are duly reflected in the study. The results are shown in Table A-1.3.
Table A-1.3. Transition Effects on the Evaluation Metrics. "Benefit" Criteria Change During Transition?
Nuclear Waste Management
Mass of SNF+HLW disposed per energy generated Yes Activity of SNF+HLW (@100 years) per energy generated None – essentially constant Activity of SNF+HLW (@100,000 years) per energy generated Yes Mass of DU+RU+RTh disposed per energy generated Yes Volume of LLW per energy generated None – essentially constant
Proliferation Risk
Material attractiveness – normal operating conditions None – essentially constant
Nuclear Material Security Risk
Material attractiveness – normal operating conditions None – essentially constant Activity of SNF+HLW (@10 years) per energy generated None – essentially constant
Safety
Challenges of addressing safety hazards None – essentially constant Safety of the deployed system None – essentially constant
Environmental Impact
Land use per energy generated Yes Water use per energy generated None – essentially constant Carbon emission - CO2 released per energy generated Yes Radiological exposure - total estimated worker dose per energy generated
None – essentially constant
Resource Utilization
Natural Uranium required per energy generated Yes Natural Thorium required per energy generated Yes
"Challenge" Criteria Development and Deployment Risk
Development time None – already completed Development cost None – already completed Deployment cost from prototypic validation to FOAK commercial
None – already completed
Compatibility with the existing infrastructure Yes Existence of regulations for the fuel cycle and familiarity with licensing
None – already completed
Existence of market incentives and/or barriers to commercial implementation of fuel cycle processes
Yes
Institutional Issues
Compatibility with the existing infrastructure Yes Existence of regulations for the fuel cycle and familiarity with licensing
None – already completed
Existence of market incentives and/or barriers to commercial implementation
Yes
Financial Risk and Economics
Levelized Cost of Electricity at Equilibrium Not applicable
Nuclear Fuel Cycle Evaluation and Screening – Final Report – Appendix A October 8, 2014 15 Table A-1.3 lists all the metrics used in the study. Those metrics for which the Metric Data would not change as the new fuel cycle is deployed and the nuclear power infrastructure consists partly of the current U.S. infrastructure and partly of the new fuel cycle are designated as "None – essentially constant." The metrics for which Metric Data could change during transition are listed as "Yes." The metrics for which the Metric Data reflects activities already finished prior to completion of fuel cycle transition are listed as "No – already completed." Metrics for which transition is not applicable are listed as "Not Applicable". With this information, the EST then assessed all the 40 Evaluation Groups to determine if the metric data are expected to be significantly affected during transition, and if so to identify the impacted groups.
Item 1 listed above would affect all fuel cycles during transition from the current U.S. fuel cycle that obtain benefit from one or more of the metrics listed as "Yes" in Table A-1.3, but not all. The benefits associated with these metrics, e.g. natural uranium required, accrue during the transition period depending on the percentage of the current U.S. fleet that has been replaced with the new fuel cycle. The rate at which the benefits accrue would depend on the timing for transition, which unless limited by fundamental physics constraints, is mainly at the discretion of the decision-makers and the capabilities of the nuclear infrastructure in designing and constructing the facilities. In this regard, this aspect of transition has no effect on the identification of promising options since all of the promising options identified in this Study obtain at least some benefit from these metrics. For other metrics listed as "Yes', the benefit may be obtained much more quickly, and independent of transition time such as for Mass of SNF+HLW disposed per energy generated in the case of continuous recycle. In this case, once transition to the new fuel cycle begins, SNF is no longer destined for disposal, but will all be reprocessed for recycling and only the resulting HLW will be disposed, even if the reprocessing is decades away.
Item 2 listed above recognizes that some Evaluation Groups may have additional issues for transition associated with the need for fissile materials. These Evaluation Groups might not require enriched uranium fuel in the new fuel cycle equilibrium state, or the initial creation of sufficient fissile to sustain operations such as 233U or 235U, but could require it as these systems are deployed.
• The Study results for the Safety Criteria show that use of enriched uranium or the initial creation of fissile materials does not affect this criterion, so the initial need during transition has no effect.
• Of potential significance are the impacts on the benefits associated with Nuclear Waste Management, Environmental Impact, and Resource Utilization that may be affected by this additional interim need for fissile materials through any of the following metrics for which the new fuel cycle shows the potential for substantial improvement: Activity of SNF+HLW (@100,000 years) per energy generated, Mass of DU+RU+RTh disposed per energy generated, Land use per energy generated, Carbon emission - CO2 released per energy generated, Natural Uranium required per energy generated, and/or Natural Thorium required per energy generated. In these cases, the initial use of enriched uranium, or operations to produce fissile materials that reduce energy output (such as in externally-driven systems starting up with insufficient fissile materials) may result in an extended transition time depending on the rate at which the systems create the materials to sustaining operations. In some cases, this can occur within a few years as is typically the case with initial needs for enriched uranium, while in others such as starting from thorium to create fissile 233U in externally-driven systems, the buildup of sufficient fissile materials can occur very gradually, perhaps requiring a decade or more. As a result, the benefits associated with eliminating these needs once the new fuel cycle has started up and completely replaced the current U.S. fuel cycle accrue more gradually during the transition period.
• Examples of such fuel cycles are found in EG04, EG06, EG07, EG08, EG10, etc., any fuel cycle where the system either requires substantial enriched uranium to start up, or where the system requiring such an extended startup represents a substantial part of the power production. Some of
Nuclear Fuel Cycle Evaluation and Screening – Final Report – Appendix A 16 October 8, 2014
the delays can be mitigated by strategies such as using fissile materials recovered from existing spent fuel, but these are deployment details beyond the scope of the current Study.
Overall, transitioning from the current U.S. fuel cycle has an extended transition time only for certain fuel cycles lacking in initial fissile materials, a situation that can be mitigated by other actions outside of the new fuel cycle such as using existing fissile materials to facilitate startup. In all cases, some metrics accrue benefits as transition occurs based on the amount of the existing fuel cycle that has been replaced. For the other metrics where benefits are obtained, any benefits are realized once the decision is made to deploy the new fuel cycle since the metrics are essentially constant during transition.
A-1.6 Analysis Examples and Metric Data Determination of the Metric Data required detailed information about fuel cycle performance. As described above, to support the development of the Metric Data, an Analysis Example was identified for each Evaluation Group by specifying the irradiation environment and fuel type for one of the Fuel Cycle Option Groups in the Evaluation Group, e.g., a PWR using uranium oxide fuel as the thermal reactor in a fuel cycle, since this level of detail was necessary to obtain accurate information on the effects of irradiation on fuel resource needs, nuclear fuel composition, and spent fuel characteristics. Note that an Analysis Example is not a specific nuclear fuel cycle option as the term is used in the Study Charter (defined above) since only the irradiation and fuel technologies were specified, and all other fuel cycle activities are only specified at the functional level. The Analysis Example was used only for calculating detailed reactor physics-based material mass balance information and other necessary information that provided an initial estimate of the performance of the Evaluation Group. For this Evaluation and Screening, the EST specifically chose the Analysis Examples to reflect a wide variety of possible irradiation systems to convey the broad scope of the Evaluation and Screening, not knowing a priori if the selected irradiation system represented the best performing system for each Evaluation Group. The EST performed the Evaluation and Screening on the Evaluation Groups, not on the Analysis Examples or their Fuel Cycle Option Group.
As described in Appendices C and D for each metric, the EST divided the potential range of the data into a small number of "bins", typically 5 to 7, with each bin covering a part of the entire data range. Using the results provided by an Analysis Example, the EST identified the bin containing that information as the initial determination of the Metric Data for that Evaluation Group. The EST then considered all of the Fuel Cycle Option Groups within the Evaluation Group to determine if the bin identified for each metric represented the potential performance of the best options within that Evaluation Group. In almost all cases, there was no need to make any changes from this initial determination. However, in some cases, once all of the results were available for the Analysis Examples, the choice of irradiation system did not represent the best potential of the Evaluation Group. In those few cases, the EST used information for a better choice of irradiation system (available from the Analysis Examples of other, similar, Evaluation Groups) to guide and justify identification of the appropriate bin for the best potential of that Evaluation Group. The details of this process are discussed in Appendix D for all cases where this was required.
The EST recognized that this process of identifying the bin representing the best performance potential for each metric could result in a set of Metric Data for an Evaluation Group that might not be achievable by any specific fuel cycle option in the group, i.e., performing well on some metrics may be to some degree incompatible with simultaneously performing well on others. This is part of the issue that prevented justifiable identification of an Analysis Example a priori that excelled with respect to all Evaluation Metrics. However, since the purpose of the evaluation and screening was to inform on the potential of fuel cycles with respect to all metrics and criteria without regard to their relative importance, the EST considered each metric and criterion independently, and treated the relative importance of the Evaluation Metrics and Criteria parametrically within the Study. Subsequent examination of the promising Evaluation Groups has not identified any such incompatibilities in performance, resulting in
Nuclear Fuel Cycle Evaluation and Screening – Final Report – Appendix A October 8, 2014 17 the conclusion that viable fuel cycle options in the promising Evaluation Groups could be developed that have the capability to perform as indicated by the Metric Data.
A-1.7 Treatment of Uncertainties The EST recognized that any assessment of fuel cycle performance would be subject to uncertainties from a variety of sources, including uncertainty about the Evaluation and Screening process itself, the accuracy of input data and accuracy of calculation, technical uncertainty about how yet-to-be developed technologies would perform many years in the future, and the use of Evaluation Groups representing groups of fuel cycles with the corresponding range of performance.
As stated above, a goal of the Study was to identify the potential for fuel cycles to provide substantial improvement with respect to the current U.S. fuel cycle. To achieve this goal, it was only necessary for the Metric Data to represent the best potential for all of the fuel cycles included in each Evaluation Group, not the performance of all fuel cycles in the group. As described in the previous section, the EST divided the entire data range for each Evaluation Metric into a small number of bins. This process also facilitated the handling of analysis uncertainty since the range of each bin represented the Metric Data, not specific values. As a result, the importance of uncertainty for calculating Metric Data was reduced to any effect such uncertainty would have in determining the proper bin for the best performance for an Evaluation Group for each metric. By representing the best potential in the evaluation group, the EST ensured that no potentially promising Evaluation Groups were eliminated, but as described above, also recognized that this approach may “carry along” fuel cycles that are less promising if they happen to be in an Evaluation Group with at least one high-performing fuel cycle.
A-2. Approach for the Evaluation and Screening The approach for the Evaluation and Screening builds on earlier related efforts, especially the recently tested pilot demonstration of the Evaluation and Screening process [A2]. The process is a structured logical framework following the basic principles of decision analysis. The overall approach is illustrated in Figure A-2.1.
Figure A-2.1. Steps of the Framework to Support the Evaluation and Screening Study.
Background Preparations
•Develop Evaluation Metrics•Create a set of Evaluation
Groups to comprehensively represent all fuel cycle options
•Identify and analyze the Analysis Examples for each Evaluation Group
•Calculate or estimate all Evaluation Metrics
Evaluation
•Define:•the shape functions for each
Evaluation Metric•the metric tradeoff factors for
each Evaluation Criterion with more than one Evaluation Metric
•the criteria tradeoff factors for consideration of multiple Evaluation Criteria simultaneously
•Evaluate:•Apply the shape functions and
metric tradeoff factors for each Evaluation Criterion
•Apply the criteria tradeoff factors for considering multiple Evaluation Criteria simultaneously
Screening
•Screen:•Identify possible promising
Evaluation Groups for each Evaluation Metric
•Identify possible promising Evaluation Groups for each Evaluation Criterion
•Determine the sets of promising Evaluation Groups for the Study based on using multiple Evaluation Criteria simultaneously
•Corresponding R&D directions:•Provide the R&D directions for
the promising Evaluation Groups
•Document the results of the study
Nuclear Fuel Cycle Evaluation and Screening – Final Report – Appendix A 18 October 8, 2014 Background Preparations
1. Develop the Evaluation Metrics – the EST provided descriptions for the specified high-level Evaluation Criteria based on the prior studies as mentioned in the Study Charter, and developed appropriate and adequate Evaluation Metrics for each of the Criteria given the scope specified for the Evaluation and Screening, including describing the approach for developing the Metrics, identifying the method of calculating or estimating each Metric, and discussing the treatment of uncertainties. Development of the Evaluation Metrics included input from external groups, including industry and universities, for fuel cycle evaluation and screening suitability [A14]. The set of Evaluation Metrics was reviewed by the IRT and approved by DOE/NE-5. All Evaluation Metrics are discussed in detail in Appendix C.
2. Create a set of Evaluation Groups to comprehensively represent all fuel cycle options – the EST developed the set of Evaluation Groups as described in Appendix B. One Evaluation Group represented the current U.S. fuel cycle and was the "Basis of Comparison" for this study. The IRT reviewed the set of Evaluation Groups and determined the set to be appropriate to inform on the high-level criteria by considering the adequacy of the groups with respect to the Evaluation Metrics. For the comprehensive set of fuel cycle options, input was solicited from external groups to both provide opportunities for participation and for completeness of the option list [A15].
3. Identify and analyze the Analysis Examples for each Evaluation Group – the EST identified Analysis Examples for each Evaluation Group, and either performed or directed detailed analyses of the set of Analysis Examples to provide data and other information necessary to inform development of the Metric Data for each Evaluation Group. The results of the physics-based analyses for identification of Evaluation Groups are presented in Appendix B and the Metric Data are presented in Appendix D.
4. Generate the Metric Data – the EST determined the Metric Data for all Evaluation Metrics using data from the detailed fuel cycle analyses of the Analysis Examples as described above and other information, with the documentation presented in Appendix D.
Evaluation
5. Define the shape functions and metric tradeoff factors for each Evaluation Criterion, and the criteria tradeoff factors for considering multiple Evaluation Criteria simultaneously – the EST developed multiple sets of value judgments (called "shape functions," "metric tradeoff factors," and "criteria tradeoff factors") that can be applied to the Evaluation Metrics so that they can be combined into one or more measures of "utility" representing the relative importance of changes in fuel cycle performance as represented by the Evaluation Metrics. These developments are discussed in Section A-3 of this Appendix, and the sets of shape functions and tradeoff factors are discussed in Appendices E and F.
6. Evaluate: Apply the shape functions, metric tradeoff factors, and criteria tradeoff factors – the EST applied the shape functions and the metric tradeoff factors to the Metric Data to obtain Evaluation Group utility for each Evaluation Criterion and for combinations of the Evaluation Criteria. Note that application of the shape functions was not essential at the Metric level to compare Evaluation Groups. Appendices E and F provide the results of this process.
Screening
7. Screen: Identify the promising Evaluation Groups for each Evaluation Metric, Evaluation Criterion, and for Evaluation Criteria Scenarios – the EST used the results of the evaluation step for each metric and criterion to identify possible promising Evaluation Groups. The EST determined the sets of promising Evaluation Groups for this study by using the multiple criteria
Nuclear Fuel Cycle Evaluation and Screening – Final Report – Appendix A October 8, 2014 19
scenarios along with parametric variations of the tradeoff factors and shape functions. These promising Evaluation Groups showed improvements as measured by the substantially higher benefit utility compared to the current U.S. fuel cycle. The results of this process are described in Appendices D and E for the metrics and criteria and Appendix F for the scenarios. Appendix F also provides the sets of promising options from the study.
8. Corresponding R&D directions – the EST provided the corresponding R&D directions for all promising Evaluation Groups in the study.
9. Document the results of the Evaluation and Screening – the EST created this final report describing all aspects of the Evaluation and Screening study. The draft of the final report was reviewed by the IRT and their comments were addressed as described in Appendix H. The final report was reviewed by DOE prior to publication.
It is important to recognize that a significant amount of effort was required to develop the Evaluation Metrics, to identify the minimum set of Evaluation Groups for the study, and to perform the detailed analyses to support the calculation or estimation of the Evaluation Metrics before the evaluation and screening could begin. The following sections discuss each part of the overall approach in greater detail.
A-2.1 Background Preparations In order to conduct the Evaluation and Screening process as shown in Figure A-2.1, there were a number of activities that had to occur to support the evolving evaluation and screening framework based on the testing in the pilot demonstration. Figure A-2.2 shows these activities for the background preparations, which also highlights external input from outside of DOE and other aspects of preparing for the fuel cycle Evaluation and Screening.
Figure A-2.2 shows the background activities performed to prepare for the Evaluation and Screening. The blue boxes indicate activities undertaken by the EST to support the Evaluation and Screening framework, and each of these steps is described in detail below. The EST considered several constraints or potential constraints (the red box), and throughout the process efforts were made to bring in perspectives from outside the EST (the green boxes), including reviews by the IRT (created by DOE-NE). “Internal” input was principally from other FCR&D campaigns and other parts of DOE that were supporting this effort and that may benefit from the results. “External” input was from outside the DOE, including industry and academia, reflecting additional perspectives or insights. As shown, two of the main tasks, 1) defining the Evaluation Criteria and developing the Evaluation Metrics and 2) defining the Evaluation Groups, were conducted in parallel. After initial development of the Evaluation Groups and the Evaluation Metrics was completed, they were reviewed together to ensure that the metrics were appropriate and adequate for the Evaluation and Screening, that the Metric Data necessary to complete the study could be obtained, and to confirm that the Evaluation Groups would appropriately represent the range of possible fuel cycle options relative to the criteria.
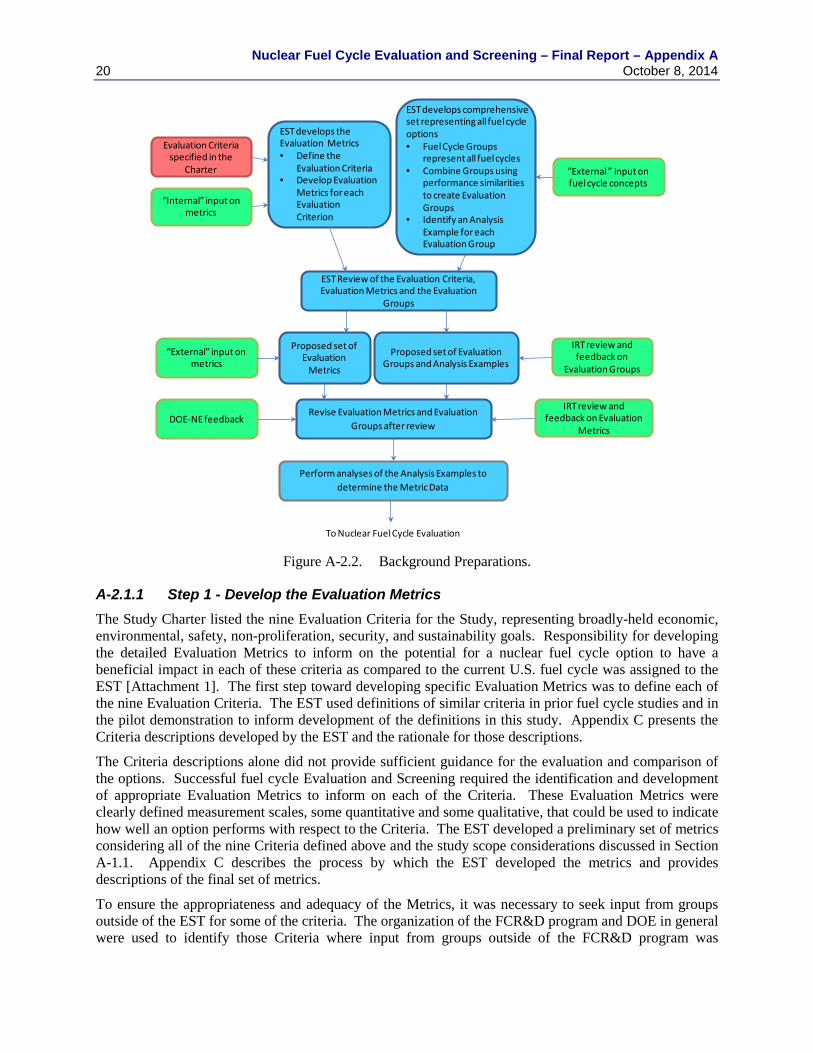
Nuclear Fuel Cycle Evaluation and Screening – Final Report – Appendix A 20 October 8, 2014
Figure A-2.2. Background Preparations.
A-2.1.1 Step 1 - Develop the Evaluation Metrics The Study Charter listed the nine Evaluation Criteria for the Study, representing broadly-held economic, environmental, safety, non-proliferation, security, and sustainability goals. Responsibility for developing the detailed Evaluation Metrics to inform on the potential for a nuclear fuel cycle option to have a beneficial impact in each of these criteria as compared to the current U.S. fuel cycle was assigned to the EST [Attachment 1]. The first step toward developing specific Evaluation Metrics was to define each of the nine Evaluation Criteria. The EST used definitions of similar criteria in prior fuel cycle studies and in the pilot demonstration to inform development of the definitions in this study. Appendix C presents the Criteria descriptions developed by the EST and the rationale for those descriptions.
The Criteria descriptions alone did not provide sufficient guidance for the evaluation and comparison of the options. Successful fuel cycle Evaluation and Screening required the identification and development of appropriate Evaluation Metrics to inform on each of the Criteria. These Evaluation Metrics were clearly defined measurement scales, some quantitative and some qualitative, that could be used to indicate how well an option performs with respect to the Criteria. The EST developed a preliminary set of metrics considering all of the nine Criteria defined above and the study scope considerations discussed in Section A-1.1. Appendix C describes the process by which the EST developed the metrics and provides descriptions of the final set of metrics.
To ensure the appropriateness and adequacy of the Metrics, it was necessary to seek input from groups outside of the EST for some of the criteria. The organization of the FCR&D program and DOE in general were used to identify those Criteria where input from groups outside of the FCR&D program was
EST develops the Evaluation Metrics• Define the
Evaluation Criteria• Develop Evaluation
Metrics for each Evaluation Criterion
EST Review of the Evaluation Criteria, Evaluation Metrics and the Evaluation
Groups
Proposed set of Evaluation
Metrics
Proposed set of Evaluation Groups and Analysis Examples
“External” input on metrics
“External ” input on fuel cycle concepts
IRT review and feedback on
Evaluation Groups
Perform analyses of the Analysis Examples to determine the Metric Data
Evaluation Criteria specified in the
Charter
“Internal” input on metrics
EST develops comprehensive set representing all fuel cycle options• Fuel Cycle Groups
represent all fuel cycles• Combine Groups using
performance similarities to create Evaluation Groups
• Identify an Analysis Example for each Evaluation Group
Revise Evaluation Metrics and Evaluation Groups after review
IRT review and feedback on Evaluation
MetricsDOE-NE feedback
To Nuclear Fuel Cycle Evaluation
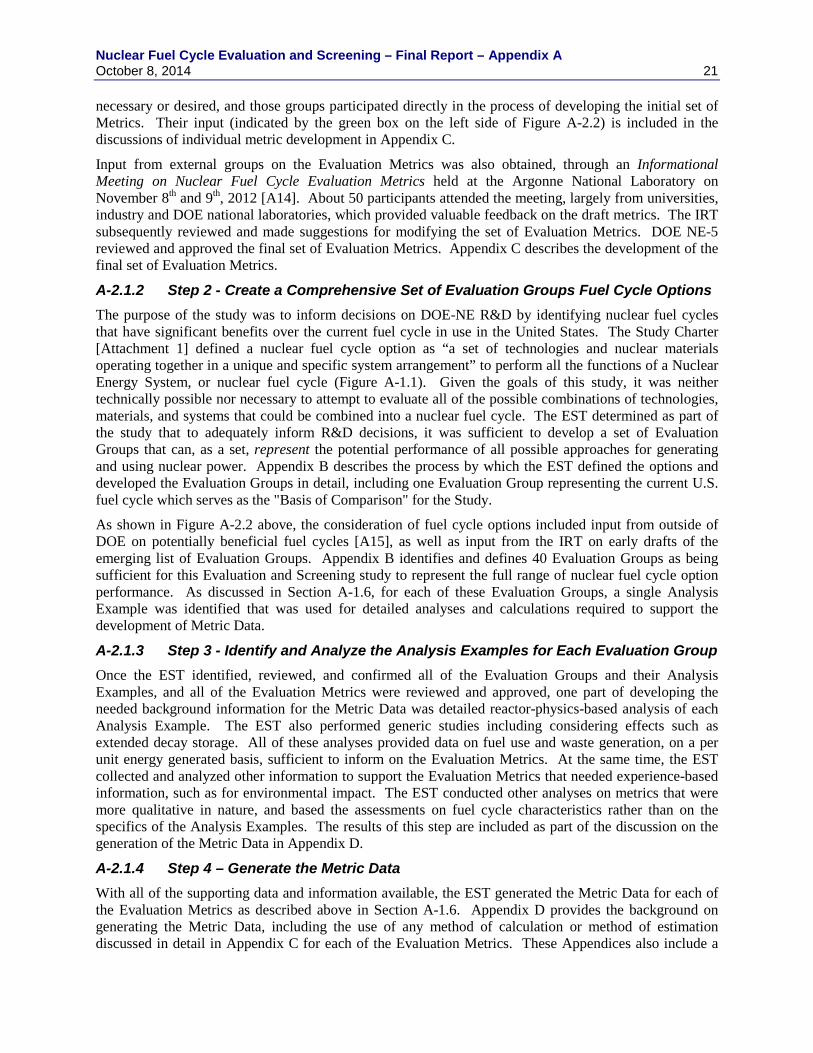
Nuclear Fuel Cycle Evaluation and Screening – Final Report – Appendix A October 8, 2014 21 necessary or desired, and those groups participated directly in the process of developing the initial set of Metrics. Their input (indicated by the green box on the left side of Figure A-2.2) is included in the discussions of individual metric development in Appendix C.
Input from external groups on the Evaluation Metrics was also obtained, through an Informational Meeting on Nuclear Fuel Cycle Evaluation Metrics held at the Argonne National Laboratory on November 8th and 9th, 2012 [A14]. About 50 participants attended the meeting, largely from universities, industry and DOE national laboratories, which provided valuable feedback on the draft metrics. The IRT subsequently reviewed and made suggestions for modifying the set of Evaluation Metrics. DOE NE-5 reviewed and approved the final set of Evaluation Metrics. Appendix C describes the development of the final set of Evaluation Metrics.
A-2.1.2 Step 2 - Create a Comprehensive Set of Evaluation Groups Fuel Cycle Options The purpose of the study was to inform decisions on DOE-NE R&D by identifying nuclear fuel cycles that have significant benefits over the current fuel cycle in use in the United States. The Study Charter [Attachment 1] defined a nuclear fuel cycle option as “a set of technologies and nuclear materials operating together in a unique and specific system arrangement” to perform all the functions of a Nuclear Energy System, or nuclear fuel cycle (Figure A-1.1). Given the goals of this study, it was neither technically possible nor necessary to attempt to evaluate all of the possible combinations of technologies, materials, and systems that could be combined into a nuclear fuel cycle. The EST determined as part of the study that to adequately inform R&D decisions, it was sufficient to develop a set of Evaluation Groups that can, as a set, represent the potential performance of all possible approaches for generating and using nuclear power. Appendix B describes the process by which the EST defined the options and developed the Evaluation Groups in detail, including one Evaluation Group representing the current U.S. fuel cycle which serves as the "Basis of Comparison" for the Study.
As shown in Figure A-2.2 above, the consideration of fuel cycle options included input from outside of DOE on potentially beneficial fuel cycles [A15], as well as input from the IRT on early drafts of the emerging list of Evaluation Groups. Appendix B identifies and defines 40 Evaluation Groups as being sufficient for this Evaluation and Screening study to represent the full range of nuclear fuel cycle option performance. As discussed in Section A-1.6, for each of these Evaluation Groups, a single Analysis Example was identified that was used for detailed analyses and calculations required to support the development of Metric Data.
A-2.1.3 Step 3 - Identify and Analyze the Analysis Examples for Each Evaluation Group Once the EST identified, reviewed, and confirmed all of the Evaluation Groups and their Analysis Examples, and all of the Evaluation Metrics were reviewed and approved, one part of developing the needed background information for the Metric Data was detailed reactor-physics-based analysis of each Analysis Example. The EST also performed generic studies including considering effects such as extended decay storage. All of these analyses provided data on fuel use and waste generation, on a per unit energy generated basis, sufficient to inform on the Evaluation Metrics. At the same time, the EST collected and analyzed other information to support the Evaluation Metrics that needed experience-based information, such as for environmental impact. The EST conducted other analyses on metrics that were more qualitative in nature, and based the assessments on fuel cycle characteristics rather than on the specifics of the Analysis Examples. The results of this step are included as part of the discussion on the generation of the Metric Data in Appendix D.
A-2.1.4 Step 4 – Generate the Metric Data With all of the supporting data and information available, the EST generated the Metric Data for each of the Evaluation Metrics as described above in Section A-1.6. Appendix D provides the background on generating the Metric Data, including the use of any method of calculation or method of estimation discussed in detail in Appendix C for each of the Evaluation Metrics. These Appendices also include a
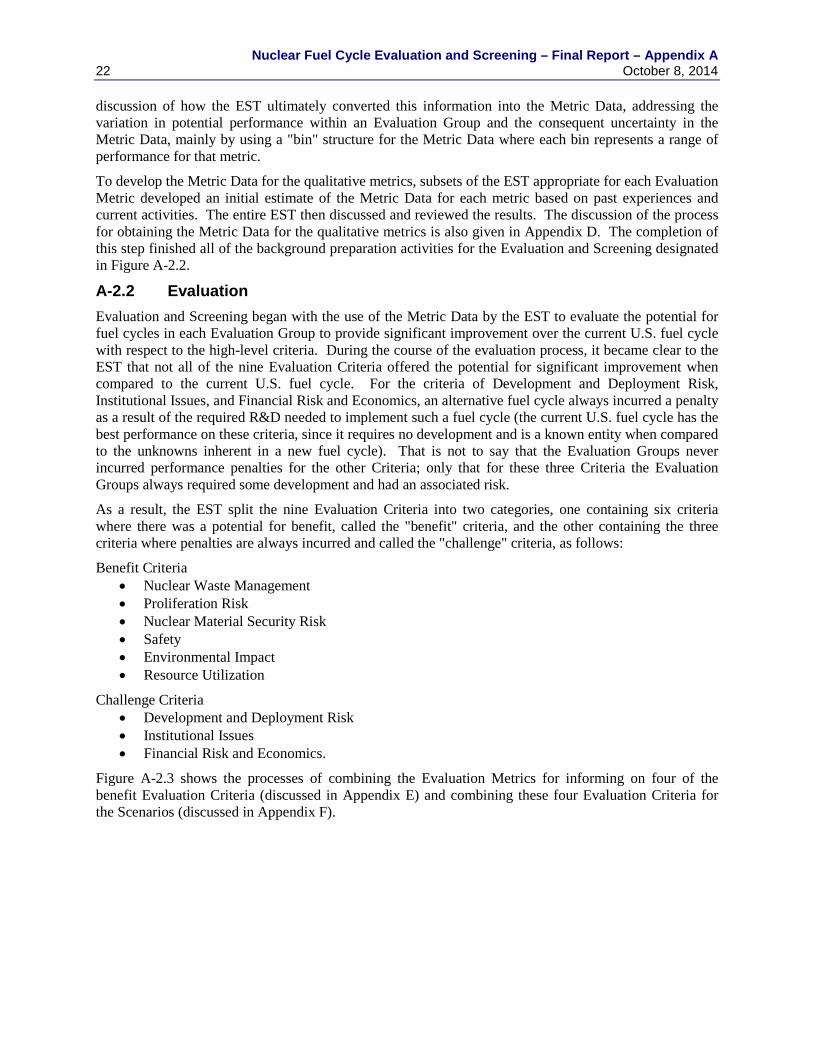
Nuclear Fuel Cycle Evaluation and Screening – Final Report – Appendix A 22 October 8, 2014 discussion of how the EST ultimately converted this information into the Metric Data, addressing the variation in potential performance within an Evaluation Group and the consequent uncertainty in the Metric Data, mainly by using a "bin" structure for the Metric Data where each bin represents a range of performance for that metric.
To develop the Metric Data for the qualitative metrics, subsets of the EST appropriate for each Evaluation Metric developed an initial estimate of the Metric Data for each metric based on past experiences and current activities. The entire EST then discussed and reviewed the results. The discussion of the process for obtaining the Metric Data for the qualitative metrics is also given in Appendix D. The completion of this step finished all of the background preparation activities for the Evaluation and Screening designated in Figure A-2.2.
A-2.2 Evaluation Evaluation and Screening began with the use of the Metric Data by the EST to evaluate the potential for fuel cycles in each Evaluation Group to provide significant improvement over the current U.S. fuel cycle with respect to the high-level criteria. During the course of the evaluation process, it became clear to the EST that not all of the nine Evaluation Criteria offered the potential for significant improvement when compared to the current U.S. fuel cycle. For the criteria of Development and Deployment Risk, Institutional Issues, and Financial Risk and Economics, an alternative fuel cycle always incurred a penalty as a result of the required R&D needed to implement such a fuel cycle (the current U.S. fuel cycle has the best performance on these criteria, since it requires no development and is a known entity when compared to the unknowns inherent in a new fuel cycle). That is not to say that the Evaluation Groups never incurred performance penalties for the other Criteria; only that for these three Criteria the Evaluation Groups always required some development and had an associated risk.
As a result, the EST split the nine Evaluation Criteria into two categories, one containing six criteria where there was a potential for benefit, called the "benefit" criteria, and the other containing the three criteria where penalties are always incurred and called the "challenge" criteria, as follows:
Benefit Criteria • Nuclear Waste Management • Proliferation Risk • Nuclear Material Security Risk • Safety • Environmental Impact • Resource Utilization
Challenge Criteria • Development and Deployment Risk • Institutional Issues • Financial Risk and Economics.
Figure A-2.3 shows the processes of combining the Evaluation Metrics for informing on four of the benefit Evaluation Criteria (discussed in Appendix E) and combining these four Evaluation Criteria for the Scenarios (discussed in Appendix F).
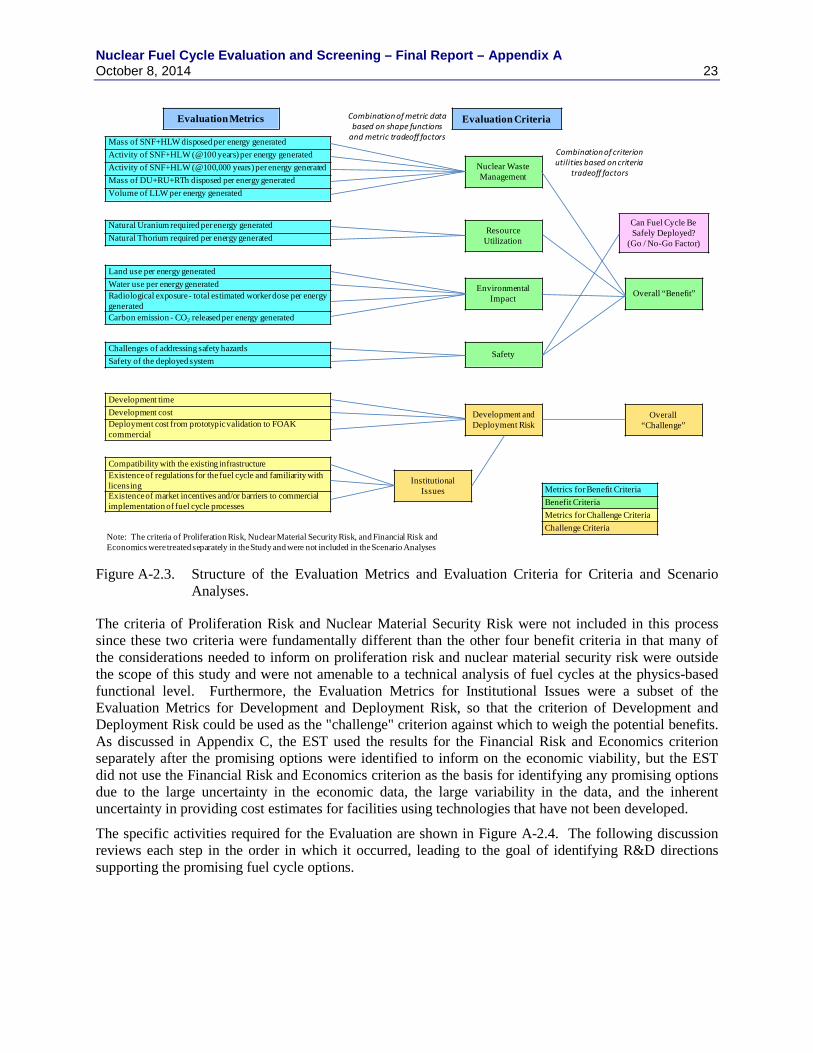
Nuclear Fuel Cycle Evaluation and Screening – Final Report – Appendix A October 8, 2014 23
Figure A-2.3. Structure of the Evaluation Metrics and Evaluation Criteria for Criteria and Scenario
Analyses.
The criteria of Proliferation Risk and Nuclear Material Security Risk were not included in this process since these two criteria were fundamentally different than the other four benefit criteria in that many of the considerations needed to inform on proliferation risk and nuclear material security risk were outside the scope of this study and were not amenable to a technical analysis of fuel cycles at the physics-based functional level. Furthermore, the Evaluation Metrics for Institutional Issues were a subset of the Evaluation Metrics for Development and Deployment Risk, so that the criterion of Development and Deployment Risk could be used as the "challenge" criterion against which to weigh the potential benefits. As discussed in Appendix C, the EST used the results for the Financial Risk and Economics criterion separately after the promising options were identified to inform on the economic viability, but the EST did not use the Financial Risk and Economics criterion as the basis for identifying any promising options due to the large uncertainty in the economic data, the large variability in the data, and the inherent uncertainty in providing cost estimates for facilities using technologies that have not been developed.
The specific activities required for the Evaluation are shown in Figure A-2.4. The following discussion reviews each step in the order in which it occurred, leading to the goal of identifying R&D directions supporting the promising fuel cycle options.
Mass of SNF+HLW disposed per energy generated Activity of SNF+HLW (@100 years) per energy generated Activity of SNF+HLW (@100,000 years) per energy generated Mass of DU+RU+RTh disposed per energy generated Volume of LLW per energy generated
Natural Uranium required per energy generated Natural Thorium required per energy generated
Land use per energy generatedWater use per energy generated Radiological exposure - total estimated worker dose per energy generatedCarbon emission - CO2 released per energy generated
Challenges of addressing safety hazardsSafety of the deployed system
Development time Development cost Deployment cost from prototypic validation to FOAKcommercial
Compatibility with the existing infrastructure Existence of regulations for the fuel cycle and familiarity with licensing Existence of market incentives and/or barriers to commercial implementation of fuel cycle processes
Nuclear Waste Management
ResourceUtilization
EnvironmentalImpact
Safety
Development and Deployment Risk
InstitutionalIssues
Evaluation Metrics Evaluation Criteria
Overall “Benefit”
Overall “Challenge”
Can Fuel Cycle Be Safely Deployed?
(Go / No-Go Factor)
Combination of metric data based on shape functions
and metric tradeoff factors
Combination of criterion utilities based on criteria
tradeoff factors
Metrics for Benefit CriteriaBenefit CriteriaMetrics for Challenge CriteriaChallenge Criteria
Note: The criteria of Proliferation Risk, Nuclear Material Security Risk, and Financial Risk and Economics were treated separately in the Study and were not included in the Scenario Analyses
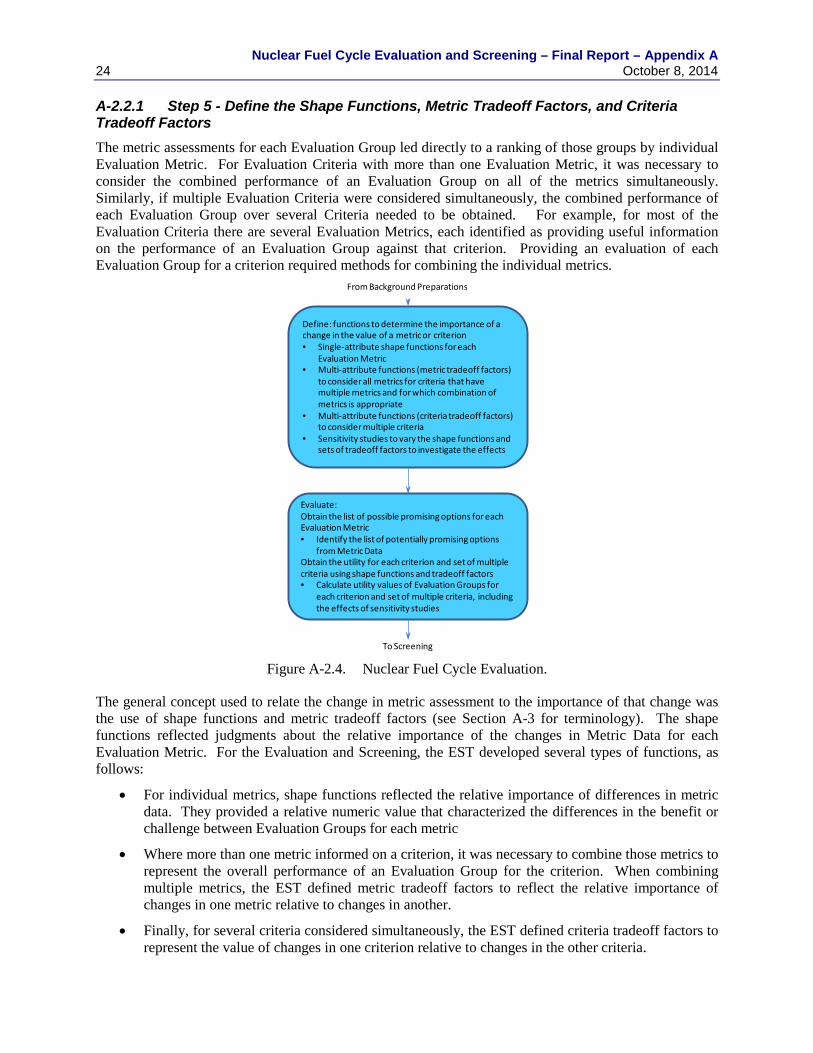
Nuclear Fuel Cycle Evaluation and Screening – Final Report – Appendix A 24 October 8, 2014 A-2.2.1 Step 5 - Define the Shape Functions, Metric Tradeoff Factors, and Criteria Tradeoff Factors The metric assessments for each Evaluation Group led directly to a ranking of those groups by individual Evaluation Metric. For Evaluation Criteria with more than one Evaluation Metric, it was necessary to consider the combined performance of an Evaluation Group on all of the metrics simultaneously. Similarly, if multiple Evaluation Criteria were considered simultaneously, the combined performance of each Evaluation Group over several Criteria needed to be obtained. For example, for most of the Evaluation Criteria there are several Evaluation Metrics, each identified as providing useful information on the performance of an Evaluation Group against that criterion. Providing an evaluation of each Evaluation Group for a criterion required methods for combining the individual metrics.
Figure A-2.4. Nuclear Fuel Cycle Evaluation.
The general concept used to relate the change in metric assessment to the importance of that change was the use of shape functions and metric tradeoff factors (see Section A-3 for terminology). The shape functions reflected judgments about the relative importance of the changes in Metric Data for each Evaluation Metric. For the Evaluation and Screening, the EST developed several types of functions, as follows:
• For individual metrics, shape functions reflected the relative importance of differences in metric data. They provided a relative numeric value that characterized the differences in the benefit or challenge between Evaluation Groups for each metric
• Where more than one metric informed on a criterion, it was necessary to combine those metrics to represent the overall performance of an Evaluation Group for the criterion. When combining multiple metrics, the EST defined metric tradeoff factors to reflect the relative importance of changes in one metric relative to changes in another.
• Finally, for several criteria considered simultaneously, the EST defined criteria tradeoff factors to represent the value of changes in one criterion relative to changes in the other criteria.
Define: functions to determine the importance of a change in the value of a metric or criterion • Single-attribute shape functions for each
Evaluation Metric• Multi-attribute functions (metric tradeoff factors)
to consider all metrics for criteria that have multiple metrics and for which combination of metrics is appropriate
• Multi-attribute functions (criteria tradeoff factors) to consider multiple criteria
• Sensitivity studies to vary the shape functions and sets of tradeoff factors to investigate the effects
To Screening
Evaluate:Obtain the list of possible promising options for each Evaluation Metric• Identify the list of potentially promising options
from Metric DataObtain the utility for each criterion and set of multiple criteria using shape functions and tradeoff factors• Calculate utility values of Evaluation Groups for
each criterion and set of multiple criteria, including the effects of sensitivity studies
From Background Preparations
Nuclear Fuel Cycle Evaluation and Screening – Final Report – Appendix A October 8, 2014 25 All of these represented judgments about how differences in performance on a metric or criterion translated to differences in the overall benefit of an Evaluation Group. Such judgments are not unique, and different perspectives can often lead to different ideas about when and how to combine these various factors. The EST explored the sensitivity of the results to a range of shape functions and metric tradeoff factors by using several multiple criteria scenarios and parametric variations of shape functions and tradeoff factors.
A-2.2.2 Step 6 - Apply the Shape Functions, Metric Tradeoff Factors, and Criteria Tradeoff Factors The EST applied shape functions and metric tradeoff factors to the Metric Data to yield calculated utility values at the criteria level. To explore the impact of different perspectives on the relative importance of changes for a metric, and the relative importance of changes across metrics for a single criterion, the EST performed analyses using different shape functions for the metrics and different sets of metric tradeoff factors. Application of different shape functions and metric tradeoff factors to the metric data for a single Evaluation Group led to different Criterion-level utility values (reflecting different potential decision-maker “perspectives” on the importance of any improvements on those metrics). The EST explored the implications of those differences in the Screening phase of the study described in the next section.
Definition and use of multiple-criteria scenarios To meet the charge in the Evaluation and Screening Charter that the evaluation and screening “will explore the impacts of different criteria weighting factors that reflect the range of possible policy guidance and illustrate the effects of specific policy choices,” the EST defined a set of “Scenarios,” each defined by a different set of Criteria tradeoff factors. Each scenario reflected different possible judgments about which criteria “matter” (and how much each matters) in determining the benefit of an alternative fuel cycle.
For each Evaluation Group, the EST combined the criterion-level utility values using the criteria tradeoff factors for a scenario, yielding a calculated utility value for a combination of criteria results. These analyses allowed the exploration of the impacts of varying the relative importance of differences in the Evaluation Criteria with respect to one another as specified in the Study Charter. The EST defined a set of 11 different scenarios with different criteria tradeoff factors to represent a range of perspectives and to explore the implications of different perspectives on the analysis results (See Appendix F).
The result of the evaluation phase was the calculated utility values for each Evaluation Groups: utility value representing benefit and utility value representing challenge for each criterion and for each scenario. These results provided the input to the screening phase of the study as described in the next section.
A-2.3 Fuel Cycle Screening The fuel cycle screening identified the promising Evaluation Groups, defined as those that offer promise for beneficial improvement with respect to the Evaluation Criteria as compared to the current U.S. fuel cycle.
A-2.3.1 Step 7 - Identify the Promising Evaluation Groups For each Evaluation Metric, the EST obtained a single list of Evaluation Groups reflecting the Metric Data itself. More lists of Evaluation Groups resulted from using the shape functions and metric tradeoff factors for each Evaluation Criterion. These EST reviewed these lists to identify possible promising Evaluation Groups. The EST used the scenarios considering multiple criteria simultaneously and parametric variation of the tradeoff factors and shape functions to determine the sets of promising Evaluation Groups for the study.
Nuclear Fuel Cycle Evaluation and Screening – Final Report – Appendix A 26 October 8, 2014 The identification of promising Evaluation Groups is a conditional, in that it depends on the amount of improvement obtainable, and what level of improvement constitutes a significant or substantial change. The question of what level of improvement is significant or substantial depends on the viewpoint of decision-maker. As a consequence, for some Evaluation Metrics, Evaluation Criteria, and Scenarios, more than one level of improvement was identified as potentially promising (based on levels of improvement that might be considered significant for different decision-maker preferences), and the Evaluation Groups meeting that definition of promise were identified. This process also allowed for a result that there may be no promising Evaluation Groups for an Evaluation Metric, Evaluation Criterion, or Scenario, again depending on decision-makers’ preferences. In such cases, the fact that no Evaluation Group showed the potential for a substantial improvement with respect to the current U.S. fuel cycle may also be valuable information for decision-makers.
The EST examined the utility values for each Metric, each Criterion, and each of the Scenarios to determine if promising Evaluation Groups could be identified. At the Criterion and Scenario level, this process produced several utility values of Evaluation Groups corresponding to different shape functions and tradeoff factors used to represent different perspectives. The EST examined these results to:
• Identify any Evaluation Groups that were promising under all shape functions and metric tradeoff factors, and under all scenarios. If such fuel cycle options existed, then they would be essentially insensitive to changes in viewpoint or perspective about the relative importance of the Evaluation Metrics and Evaluation Criteria, as are the fuel cycle options for which R&D could be supported regardless of a particular viewpoint.
• Identify any Evaluation Groups that were promising under a subset of shape functions and tradeoff factors, and determine any commonalities among those perspectives. These analyses identified fuel cycle options for which R&D could be supported only under certain circumstances.
• Identify any Evaluation Groups that were promising under only one or very few sets of shape functions and tradeoff factors. If such fuel cycle options existed, they highlighted the conditions needed to support R&D investment in those fuel cycles.
• Identify any Evaluation Groups that were not promising under any combination of shape functions and tradeoff factors. Those Evaluation Groups do not offer any potential for significant benefits with respect to any of the evaluation criteria and can be “screened out” as not attractive for future development.
Consideration of Benefit and Challenge As described above, the EST characterized six of the nine Evaluation Criteria as benefit criteria, where the intent was that R&D investment might enable fuel cycles that perform better than the current nuclear U.S. fuel cycle (the “Basis of Comparison”) on those criteria. The other three criteria were characterized as challenge criteria in that they identified specific barriers or challenges to fuel cycle implementation that exceeded those faced by the current nuclear fuel cycle.
Choices about where to invest R&D funding may consider both the benefits of alternative fuel cycles and the challenges that developing those fuel cycles pose. Thus in each evaluation at the Criterion and the Scenario level, the EST considered both the benefit and challenge of each Evaluation Group. Several types of results were calculated and presented in Appendices E and F to further define promising Evaluation Groups.
Figure A-2.5 shows an example of a type of analysis result that informs on both benefit and challenge. In this plot, benefit is represented by the y-axis, showing the calculated utility for each Evaluation Group for a particular set of shape functions and tradeoff factors for the benefit criteria. The x-axis shows the challenge for each Evaluation Group, as represented by the calculated utility for the Development and Deployment Risk criterion in this Study. Each “diamond” on this graph represents the (Challenge,
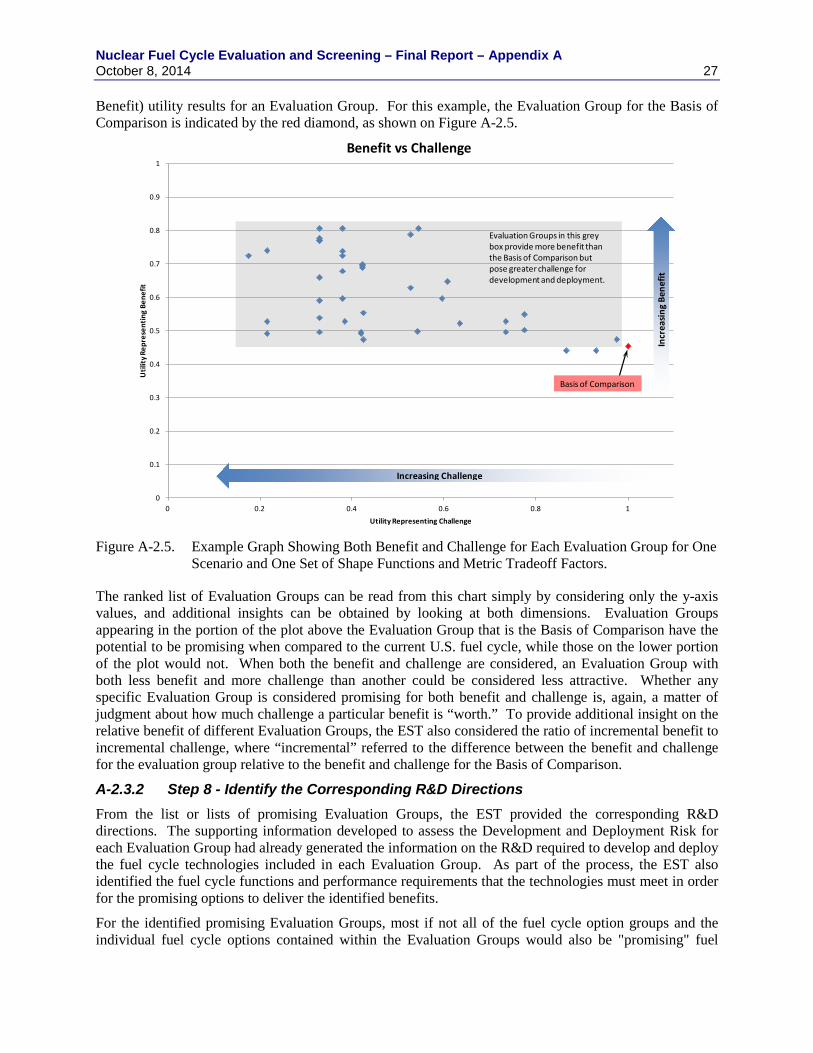
Nuclear Fuel Cycle Evaluation and Screening – Final Report – Appendix A October 8, 2014 27 Benefit) utility results for an Evaluation Group. For this example, the Evaluation Group for the Basis of Comparison is indicated by the red diamond, as shown on Figure A-2.5.
Figure A-2.5. Example Graph Showing Both Benefit and Challenge for Each Evaluation Group for One
Scenario and One Set of Shape Functions and Metric Tradeoff Factors.
The ranked list of Evaluation Groups can be read from this chart simply by considering only the y-axis values, and additional insights can be obtained by looking at both dimensions. Evaluation Groups appearing in the portion of the plot above the Evaluation Group that is the Basis of Comparison have the potential to be promising when compared to the current U.S. fuel cycle, while those on the lower portion of the plot would not. When both the benefit and challenge are considered, an Evaluation Group with both less benefit and more challenge than another could be considered less attractive. Whether any specific Evaluation Group is considered promising for both benefit and challenge is, again, a matter of judgment about how much challenge a particular benefit is “worth.” To provide additional insight on the relative benefit of different Evaluation Groups, the EST also considered the ratio of incremental benefit to incremental challenge, where “incremental” referred to the difference between the benefit and challenge for the evaluation group relative to the benefit and challenge for the Basis of Comparison.
A-2.3.2 Step 8 - Identify the Corresponding R&D Directions From the list or lists of promising Evaluation Groups, the EST provided the corresponding R&D directions. The supporting information developed to assess the Development and Deployment Risk for each Evaluation Group had already generated the information on the R&D required to develop and deploy the fuel cycle technologies included in each Evaluation Group. As part of the process, the EST also identified the fuel cycle functions and performance requirements that the technologies must meet in order for the promising options to deliver the identified benefits.
For the identified promising Evaluation Groups, most if not all of the fuel cycle option groups and the individual fuel cycle options contained within the Evaluation Groups would also be "promising" fuel
0
0.1
0.2
0.3
0.4
0.5
0.6
0.7
0.8
0.9
1
0 0.2 0.4 0.6 0.8 1
Util
ity R
epre
sent
ing
Bene
fit
Utility Representing Challenge
Benefit vs Challenge
Increasing Challenge
Incr
easin
g Be
nefit
Evaluation Groups in this grey box provide more benefit than the Basis of Comparison but pose greater challenge for development and deployment.
Basis of Comparison
Nuclear Fuel Cycle Evaluation and Screening – Final Report – Appendix A 28 October 8, 2014 cycle options. However, there is the potential that an Evaluation Group identified as promising will include one or more specific Fuel Cycle Option Groups which, by themselves, would necessarily not be "promising." This refinement of identifying the promising fuel cycle options within a promising Evaluation Group is planned as a subsequent effort following the completion of the Evaluation and Screening and is not part of this report. From the beginning, the process was designed to ensure that no "promising" fuel cycle options would be missed, not necessarily to ensure that all options that are not "promising" are screened out, i.e., to be inclusive rather than exclusive.
A-2.3.3 Step 9 - Document the Results of the Evaluation and Screening At the completion of the project, the EST wrote this report describing the Evaluation and Screening approach, the background preparations, the fuel cycle evaluation and screening, the promising options, and the corresponding supporting R&D. The information in this report also contains the information to answer the questions posed in the Charter that are listed in Section A-1.
A-3. Analytical Basis for the Evaluation and Screening Utility Calculations “Multi-attribute utility analysis” (MUA) is the basic analytical approach used in this Evaluation and Screening (E&S) to evaluate and compare alternative fuel cycles for multiple criteria simultaneously. MUA is a well-established, logically sound approach for consistent and reproducible evaluation of options using a set of well-defined criteria [A16, A17]. This section of Appendix A briefly describes the steps in an MUA, how the EST implemented or modified those steps for the E&S, and provides a “cross-walk” of commonly used terminology with the terms used in this E&S report.
A-3.1 Overview of Multi-attribute Utility Analysis The general steps in defining and analyzing a multi-attribute decision problem are very similar to the steps described above as the steps for the evaluation and screening. Namely:
• Clearly define the decision context: what is being decided and by whom?
• Identify and define the options to be evaluated and compared. Ideally, this step should be taken, or at least revisited, after the first part of the next step (defining the value model) is completed. Often clear definition of what a decision-maker is trying to achieve will help bring to light new, different, or modified options that should also be included in the analysis.
• Define the value model. The value model specifies all the components necessary for estimating the relative value of different options based on decision-maker preferences. Several steps are involved:
- Identify the fundamental objectives of the decision maker(s) for the given decision context: When making the decisions being considered, what factors define what the decision-makers are trying to accomplish? What will a good outcome achieve?
- Develop measurable attributes for each objective. Attributes specify in more detail what is meant by each fundamental objective, and provide a means for estimating or measuring how well an option performs in a way that the performance of an option can be evaluated. For example, total discounted cash flow might be identified as a measureable attribute for a fundamental objective of maximizing revenue.
- Develop single- and multi-attribute value functions, to encode decision-maker preferences for different levels of performance within and between metrics.
• Evaluate the performance of each option against each objective, using the measureable attributes. Apply the value functions to calculate an overall value of comparison for each option. This value of
Nuclear Fuel Cycle Evaluation and Screening – Final Report – Appendix A October 8, 2014 29
comparison combines the estimated performance on each attribute with decision-maker preferences for different levels of performance on different attributes and objectives.
• Define and conduct appropriate sensitivity analyses. The sensitivity of results to alternative value functions can be particularly important when the decision makers are not well-defined, may change over time, and/or explicitly wish to consider alternative perspectives.
A-3.2 Application of MUA for Fuel Cycle Evaluation and Screening A-3.2.1 Terminology To communicate this Evaluation and Screening study to the intended audience, the EST chose a set of terms that are more familiar to DOE and to lay audiences than the terms typically used in a multi-attribute analysis. Table A-3.1 lists a “cross-walk” between the terms used in MUA studies and the terms chosen for this Evaluation and Screening. The first column lists primary terms (and alternative terms in parentheses) that may be seen in other studies, and a short definition of what each term means; the second column lists the term used for that concept in this study.
A-3.2.2 Decision context and options to be evaluated The decision context for fuel cycle evaluation and screening has been described previously in the main text of the report and in Section A-1 above. Appendix B describes the 40 Evaluation Groups developed by the EST for the evaluation and screening.
A-3.2.3 Value model structure A hierarchical value model was defined for this study: with metric utility results first combined to the criterion level using (in most cases) an additive multi-attribute value function, and those criteria utility results combined in several different scenarios (see Section A-2.2.2) using another additive multi-attribute value function. Figure A-2.3 illustrates the structure of this hierarchical model, and the development of each of the elements of that model is described below. In Figure A-2.3, the green boxes represent the benefit Evaluation Criteria and the orange boxes represent the challenge Evaluation Criteria. The blue boxes to the left list the Evaluation Metrics for the four benefit criteria used in the criteria and scenario analyses and the yellow boxes provide the Evaluation Metrics for the challenge criteria. The boxes on the right side of the diagram represent the final combinations of these criteria into overall benefit and overall challenge.
Several issues required special treatment:
• Safety of the deployed system, identified as one of the metrics for informing on the Safety criterion, was treated as a go/no-go criterion. Any Evaluation Group that could not be deployed safely would be eliminated from consideration.
• All of the metrics for the Institutional Issues criterion were also specified as metrics for Development and Deployment Risk. Because the EST Charter specifically listed Institutional Issues as something DOE wanted to consider, this analysis retains it for consideration at the criterion level, but in the representation of “overall challenge” it is considered a subset of the Development and Deployment Risk, which ensures those metrics are not double-counted.
It should be noted that technically, “utility” functions are required when there is significant uncertainty in the factors being considered and risk preferences are relevant; “measurable value functions” are sufficient when uncertainties are small or not treated explicitly and where risk preferences are not relevant [A18]. In this analysis we use the term “utility" generically to refer to both utility and measurable value functions.
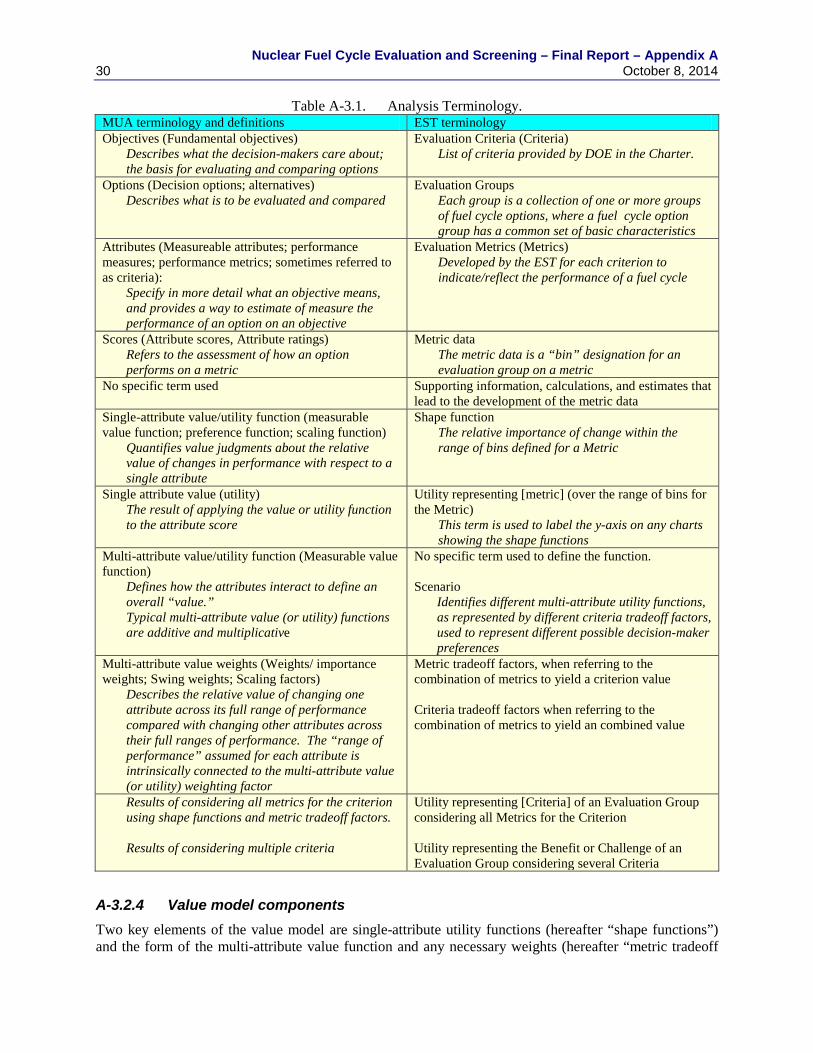
Nuclear Fuel Cycle Evaluation and Screening – Final Report – Appendix A 30 October 8, 2014
Table A-3.1. Analysis Terminology. MUA terminology and definitions EST terminology Objectives (Fundamental objectives)
Describes what the decision-makers care about; the basis for evaluating and comparing options
Evaluation Criteria (Criteria) List of criteria provided by DOE in the Charter.
Options (Decision options; alternatives)
Describes what is to be evaluated and compared
Evaluation Groups Each group is a collection of one or more groups of fuel cycle options, where a fuel cycle option group has a common set of basic characteristics
Attributes (Measureable attributes; performance measures; performance metrics; sometimes referred to as criteria):
Specify in more detail what an objective means, and provides a way to estimate of measure the performance of an option on an objective
Evaluation Metrics (Metrics) Developed by the EST for each criterion to indicate/reflect the performance of a fuel cycle
Scores (Attribute scores, Attribute ratings) Refers to the assessment of how an option performs on a metric
Metric data The metric data is a “bin” designation for an evaluation group on a metric
No specific term used
Supporting information, calculations, and estimates that lead to the development of the metric data
Single-attribute value/utility function (measurable value function; preference function; scaling function)
Quantifies value judgments about the relative value of changes in performance with respect to a single attribute
Shape function The relative importance of change within the range of bins defined for a Metric
Single attribute value (utility) The result of applying the value or utility function to the attribute score
Utility representing [metric] (over the range of bins for the Metric)
This term is used to label the y-axis on any charts showing the shape functions
Multi-attribute value/utility function (Measurable value function)
Defines how the attributes interact to define an overall “value.” Typical multi-attribute value (or utility) functions are additive and multiplicative
No specific term used to define the function. Scenario
Identifies different multi-attribute utility functions, as represented by different criteria tradeoff factors, used to represent different possible decision-maker preferences
Multi-attribute value weights (Weights/ importance weights; Swing weights; Scaling factors)
Describes the relative value of changing one attribute across its full range of performance compared with changing other attributes across their full ranges of performance. The “range of performance” assumed for each attribute is intrinsically connected to the multi-attribute value (or utility) weighting factor
Metric tradeoff factors, when referring to the combination of metrics to yield a criterion value Criteria tradeoff factors when referring to the combination of metrics to yield an combined value
Results of considering all metrics for the criterion using shape functions and metric tradeoff factors. Results of considering multiple criteria
Utility representing [Criteria] of an Evaluation Group considering all Metrics for the Criterion Utility representing the Benefit or Challenge of an Evaluation Group considering several Criteria
A-3.2.4 Value model components Two key elements of the value model are single-attribute utility functions (hereafter “shape functions”) and the form of the multi-attribute value function and any necessary weights (hereafter “metric tradeoff
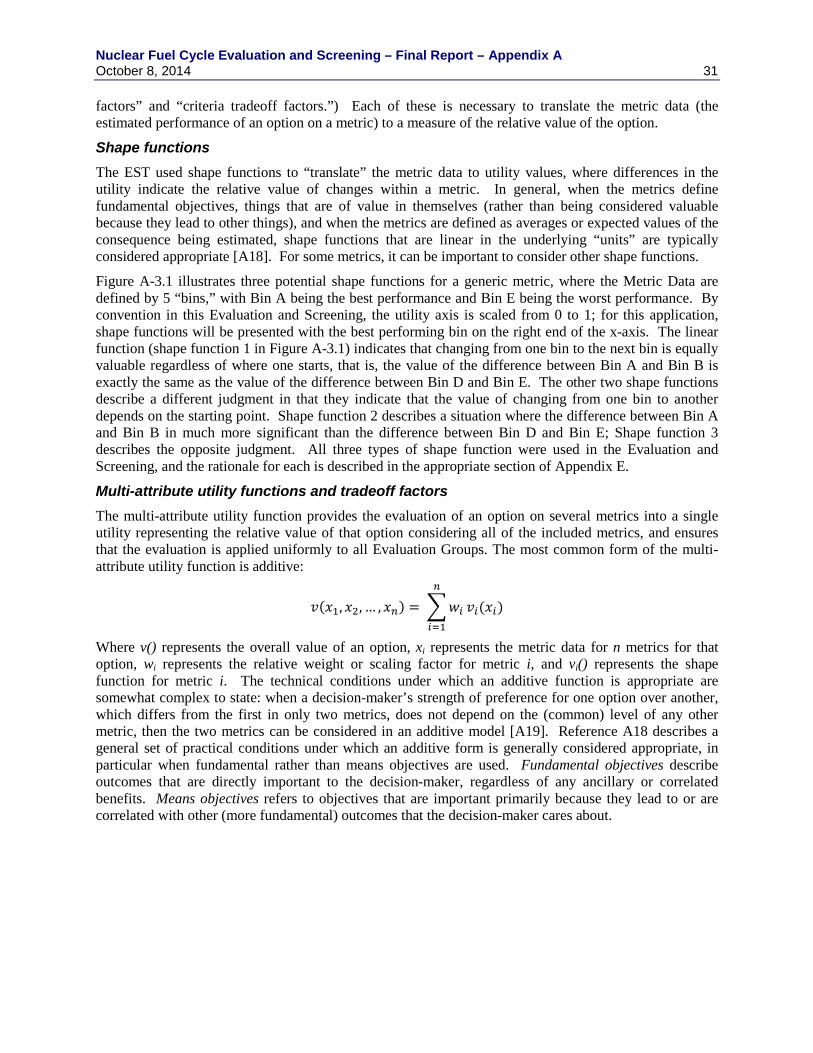
Nuclear Fuel Cycle Evaluation and Screening – Final Report – Appendix A October 8, 2014 31 factors” and “criteria tradeoff factors.”) Each of these is necessary to translate the metric data (the estimated performance of an option on a metric) to a measure of the relative value of the option.
Shape functions The EST used shape functions to “translate” the metric data to utility values, where differences in the utility indicate the relative value of changes within a metric. In general, when the metrics define fundamental objectives, things that are of value in themselves (rather than being considered valuable because they lead to other things), and when the metrics are defined as averages or expected values of the consequence being estimated, shape functions that are linear in the underlying “units” are typically considered appropriate [A18]. For some metrics, it can be important to consider other shape functions.
Figure A-3.1 illustrates three potential shape functions for a generic metric, where the Metric Data are defined by 5 “bins,” with Bin A being the best performance and Bin E being the worst performance. By convention in this Evaluation and Screening, the utility axis is scaled from 0 to 1; for this application, shape functions will be presented with the best performing bin on the right end of the x-axis. The linear function (shape function 1 in Figure A-3.1) indicates that changing from one bin to the next bin is equally valuable regardless of where one starts, that is, the value of the difference between Bin A and Bin B is exactly the same as the value of the difference between Bin D and Bin E. The other two shape functions describe a different judgment in that they indicate that the value of changing from one bin to another depends on the starting point. Shape function 2 describes a situation where the difference between Bin A and Bin B in much more significant than the difference between Bin D and Bin E; Shape function 3 describes the opposite judgment. All three types of shape function were used in the Evaluation and Screening, and the rationale for each is described in the appropriate section of Appendix E.
Multi-attribute utility functions and tradeoff factors The multi-attribute utility function provides the evaluation of an option on several metrics into a single utility representing the relative value of that option considering all of the included metrics, and ensures that the evaluation is applied uniformly to all Evaluation Groups. The most common form of the multi-attribute utility function is additive:
𝑣(𝑥1,𝑥2, … , 𝑥𝑛) = �𝑤𝑖
𝑛
𝑖=1
𝑣𝑖(𝑥𝑖)
Where v() represents the overall value of an option, xi represents the metric data for n metrics for that option, wi represents the relative weight or scaling factor for metric i, and vi() represents the shape function for metric i. The technical conditions under which an additive function is appropriate are somewhat complex to state: when a decision-maker’s strength of preference for one option over another, which differs from the first in only two metrics, does not depend on the (common) level of any other metric, then the two metrics can be considered in an additive model [A19]. Reference A18 describes a general set of practical conditions under which an additive form is generally considered appropriate, in particular when fundamental rather than means objectives are used. Fundamental objectives describe outcomes that are directly important to the decision-maker, regardless of any ancillary or correlated benefits. Means objectives refers to objectives that are important primarily because they lead to or are correlated with other (more fundamental) outcomes that the decision-maker cares about.
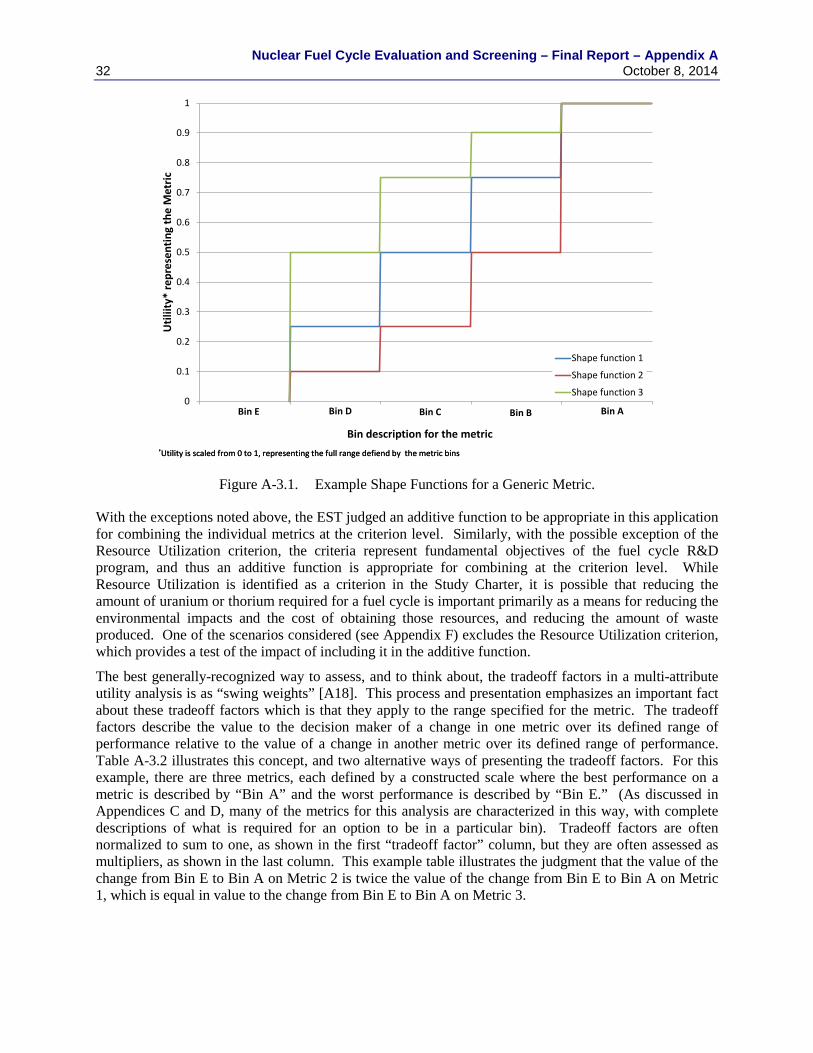
Nuclear Fuel Cycle Evaluation and Screening – Final Report – Appendix A 32 October 8, 2014
Figure A-3.1. Example Shape Functions for a Generic Metric.
With the exceptions noted above, the EST judged an additive function to be appropriate in this application for combining the individual metrics at the criterion level. Similarly, with the possible exception of the Resource Utilization criterion, the criteria represent fundamental objectives of the fuel cycle R&D program, and thus an additive function is appropriate for combining at the criterion level. While Resource Utilization is identified as a criterion in the Study Charter, it is possible that reducing the amount of uranium or thorium required for a fuel cycle is important primarily as a means for reducing the environmental impacts and the cost of obtaining those resources, and reducing the amount of waste produced. One of the scenarios considered (see Appendix F) excludes the Resource Utilization criterion, which provides a test of the impact of including it in the additive function.
The best generally-recognized way to assess, and to think about, the tradeoff factors in a multi-attribute utility analysis is as “swing weights” [A18]. This process and presentation emphasizes an important fact about these tradeoff factors which is that they apply to the range specified for the metric. The tradeoff factors describe the value to the decision maker of a change in one metric over its defined range of performance relative to the value of a change in another metric over its defined range of performance. Table A-3.2 illustrates this concept, and two alternative ways of presenting the tradeoff factors. For this example, there are three metrics, each defined by a constructed scale where the best performance on a metric is described by “Bin A” and the worst performance is described by “Bin E.” (As discussed in Appendices C and D, many of the metrics for this analysis are characterized in this way, with complete descriptions of what is required for an option to be in a particular bin). Tradeoff factors are often normalized to sum to one, as shown in the first “tradeoff factor” column, but they are often assessed as multipliers, as shown in the last column. This example table illustrates the judgment that the value of the change from Bin E to Bin A on Metric 2 is twice the value of the change from Bin E to Bin A on Metric 1, which is equal in value to the change from Bin E to Bin A on Metric 3.
0
0.1
0.2
0.3
0.4
0.5
0.6
0.7
0.8
0.9
1
Util
iity*
repr
esen
ting
the
Met
ric
Bin description for the metric
Shape function 1
Shape function 2
Shape function 3
*Utility is scaled from 0 to 1, representing the full range defiend by the metric bins*Utility is scaled from 0 to 1, representing the full range defiend by the metric bins
Bin E Bin D Bin C Bin B Bin A
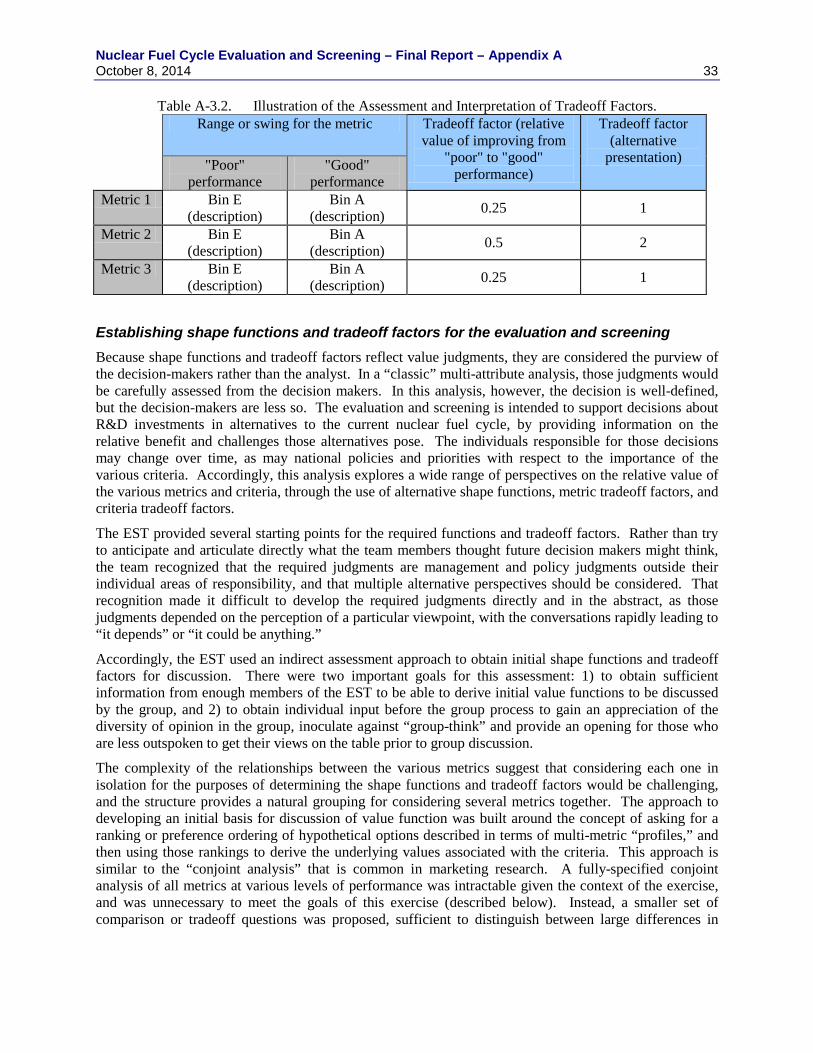
Nuclear Fuel Cycle Evaluation and Screening – Final Report – Appendix A October 8, 2014 33
Table A-3.2. Illustration of the Assessment and Interpretation of Tradeoff Factors. Range or swing for the metric Tradeoff factor (relative
value of improving from "poor" to "good"
performance)
Tradeoff factor (alternative
presentation) "Poor" performance
"Good" performance
Metric 1 Bin E (description)
Bin A (description) 0.25 1
Metric 2 Bin E (description)
Bin A (description) 0.5 2
Metric 3 Bin E (description)
Bin A (description) 0.25 1
Establishing shape functions and tradeoff factors for the evaluation and screening Because shape functions and tradeoff factors reflect value judgments, they are considered the purview of the decision-makers rather than the analyst. In a “classic” multi-attribute analysis, those judgments would be carefully assessed from the decision makers. In this analysis, however, the decision is well-defined, but the decision-makers are less so. The evaluation and screening is intended to support decisions about R&D investments in alternatives to the current nuclear fuel cycle, by providing information on the relative benefit and challenges those alternatives pose. The individuals responsible for those decisions may change over time, as may national policies and priorities with respect to the importance of the various criteria. Accordingly, this analysis explores a wide range of perspectives on the relative value of the various metrics and criteria, through the use of alternative shape functions, metric tradeoff factors, and criteria tradeoff factors.
The EST provided several starting points for the required functions and tradeoff factors. Rather than try to anticipate and articulate directly what the team members thought future decision makers might think, the team recognized that the required judgments are management and policy judgments outside their individual areas of responsibility, and that multiple alternative perspectives should be considered. That recognition made it difficult to develop the required judgments directly and in the abstract, as those judgments depended on the perception of a particular viewpoint, with the conversations rapidly leading to “it depends” or “it could be anything.”
Accordingly, the EST used an indirect assessment approach to obtain initial shape functions and tradeoff factors for discussion. There were two important goals for this assessment: 1) to obtain sufficient information from enough members of the EST to be able to derive initial value functions to be discussed by the group, and 2) to obtain individual input before the group process to gain an appreciation of the diversity of opinion in the group, inoculate against “group-think” and provide an opening for those who are less outspoken to get their views on the table prior to group discussion.
The complexity of the relationships between the various metrics suggest that considering each one in isolation for the purposes of determining the shape functions and tradeoff factors would be challenging, and the structure provides a natural grouping for considering several metrics together. The approach to developing an initial basis for discussion of value function was built around the concept of asking for a ranking or preference ordering of hypothetical options described in terms of multi-metric “profiles,” and then using those rankings to derive the underlying values associated with the criteria. This approach is similar to the “conjoint analysis” that is common in marketing research. A fully-specified conjoint analysis of all metrics at various levels of performance was intractable given the context of the exercise, and was unnecessary to meet the goals of this exercise (described below). Instead, a smaller set of comparison or tradeoff questions was proposed, sufficient to distinguish between large differences in
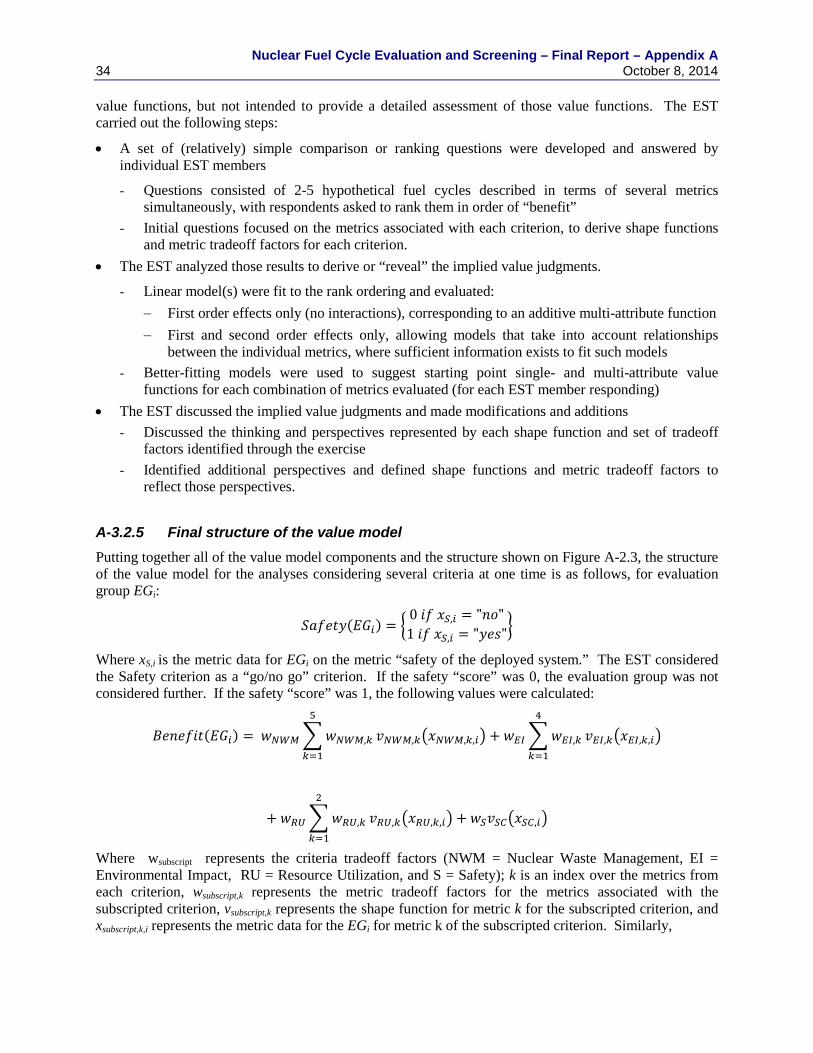
Nuclear Fuel Cycle Evaluation and Screening – Final Report – Appendix A 34 October 8, 2014 value functions, but not intended to provide a detailed assessment of those value functions. The EST carried out the following steps:
• A set of (relatively) simple comparison or ranking questions were developed and answered by individual EST members
- Questions consisted of 2-5 hypothetical fuel cycles described in terms of several metrics simultaneously, with respondents asked to rank them in order of “benefit”
- Initial questions focused on the metrics associated with each criterion, to derive shape functions and metric tradeoff factors for each criterion.
• The EST analyzed those results to derive or “reveal” the implied value judgments.
- Linear model(s) were fit to the rank ordering and evaluated: − First order effects only (no interactions), corresponding to an additive multi-attribute function − First and second order effects only, allowing models that take into account relationships
between the individual metrics, where sufficient information exists to fit such models - Better-fitting models were used to suggest starting point single- and multi-attribute value
functions for each combination of metrics evaluated (for each EST member responding) • The EST discussed the implied value judgments and made modifications and additions
- Discussed the thinking and perspectives represented by each shape function and set of tradeoff factors identified through the exercise
- Identified additional perspectives and defined shape functions and metric tradeoff factors to reflect those perspectives.
A-3.2.5 Final structure of the value model Putting together all of the value model components and the structure shown on Figure A-2.3, the structure of the value model for the analyses considering several criteria at one time is as follows, for evaluation group EGi:
𝑆𝑎𝑓𝑒𝑡𝑦(𝐸𝐺𝑖) = �0 𝑖𝑓 𝑥𝑆,𝑖 = "𝑛𝑜"1 𝑖𝑓 𝑥𝑆,𝑖 = "𝑦𝑒𝑠"�
Where xS,i is the metric data for EGi on the metric “safety of the deployed system.” The EST considered the Safety criterion as a “go/no go” criterion. If the safety “score” was 0, the evaluation group was not considered further. If the safety “score” was 1, the following values were calculated:
𝐵𝑒𝑛𝑒𝑓𝑖𝑡(𝐸𝐺𝑖) = 𝑤𝑁𝑊𝑀�𝑤𝑁𝑊𝑀,𝑘
5
𝑘=1
𝑣𝑁𝑊𝑀,𝑘�𝑥𝑁𝑊𝑀,𝑘,𝑖� + 𝑤𝐸𝐼�𝑤𝐸𝐼,𝑘
4
𝑘=1
𝑣𝐸𝐼,𝑘�𝑥𝐸𝐼,𝑘,𝑖�
+ 𝑤𝑅𝑈�𝑤𝑅𝑈,𝑘
2
𝑘=1
𝑣𝑅𝑈,𝑘�𝑥𝑅𝑈,𝑘,𝑖� + 𝑤𝑆𝑣𝑆𝐶�𝑥𝑆𝐶,𝑖�
Where wsubscript represents the criteria tradeoff factors (NWM = Nuclear Waste Management, EI = Environmental Impact, RU = Resource Utilization, and S = Safety); k is an index over the metrics from each criterion, wsubscript,k represents the metric tradeoff factors for the metrics associated with the subscripted criterion, vsubscript,k represents the shape function for metric k for the subscripted criterion, and xsubscript,k,i represents the metric data for the EGi for metric k of the subscripted criterion. Similarly,
Nuclear Fuel Cycle Evaluation and Screening – Final Report – Appendix A October 8, 2014 35
𝐶ℎ𝑎𝑙𝑙𝑒𝑛𝑔𝑒(𝐸𝐺𝑖) = �𝑤𝐷𝐷,𝑘
6
𝑘=1
𝑣𝐷𝐷,𝑘�𝑥𝐷𝐷,𝑘,𝑖�
where the same coding as above applies (DD = Development and Deployment Risk). Note that the Challenge calculation includes the metrics for Institutional Issues as a subset of those for Development and Deployment Risk.
Appendix E describes the shape functions and metric tradeoff factors explored for each criterion. The EST explored the effects of alternative criterion tradeoff factors through extensive sensitivity analyses via the use of Scenarios described briefly in Section A-2.2.2 and more completely in Appendix F.
Developing metric data and conducting analyses Appendix D describes how the EST developed the metric data for each of the Evaluation Groups, and the details and results of the analyses themselves are described in Appendices E and F.
REFERENCES A1. "Nuclear Energy Research and Development Roadmap – Report to Congress," U.S. Department
of Energy, Office of Nuclear Energy, April 2010.
A2. U.S. Department of Energy, Office of Nuclear Energy, “A Screening Method for Guiding R&D Decisions: Pilot Application to Nuclear Fuel Cycle Options,” August, 2011.
A3. "Nuclear Proliferation and Civilian Nuclear Power: Report of the Nonproliferation Alternative Systems Assessment Program. Executive Summary," DOE/NE-0001, June 1980.
A4. "INFCE Summary Volume, International Atomic Energy Agency," Vienna 1980.
A5. "Candidate Approaches for an Integrated Nuclear Waste Management Strategy –Scoping Evaluations, AAA Program Report," LA-UR-01-5572, November 2001.
A6. "A Technology Roadmap for Generation IV Nuclear Energy Systems," GIF-002-00, Issued by the U.S. DOE Nuclear Energy Research Advisory Committee and the Generation IV International Forum, December 2002.
A7. "The Future of Nuclear Power – An Interdisciplinary MIT Study," 2003.
A8. "Draft Global Nuclear Energy Partnership - Programmatic Environmental Impact Statement," U.S. Department of Energy, Office of Nuclear Energy, DOE/EIS-0396, October 2008.
A9. Wigeland, R., T. Taiwo, M. Todosow, W. Halsey, and J. Gehin, "AFCI Options Study, Advanced Fuel Cycle Initiative," AFCI-TIO-PMO-MI-DV-2009-000086, September 30, 2009.
A10. Wigeland, R., T. Taiwo, M. Todosow, W. Halsey, and J. Gehin," Options Study - Phase II," FCRD-TIO-2010-000167, September 30, 2010.
A11. "Advanced Reactor Technology Options for Utilization and Transmutation of Actinides in Spent Nuclear Fuel," IAEA-TECDOC-1626, (2009).
A12. "The Future of Nuclear Fuel Cycle – An Interdisciplinary MIT Study," 2010.
A13. Dixon, B, et al, "Dynamic Systems Analysis Report for Nuclear Fuel Recycle," Revision 1, AFCI-SYSA-AI-SS-RT-2009-0000053, December 2008.
A14. Summary of the U.S. DOE Informational Meeting on Nuclear Fuel Cycle Evaluation Metrics, Argonne National Laboratory, November 8-9, 2012
Nuclear Fuel Cycle Evaluation and Screening – Final Report – Appendix A 36 October 8, 2014
(http://www.inl.gov/conferences/nfcemm/d/summary-of-doe-im-on-nfc-evaluation-metrics-final.pdf).
A15. Summary of the U.S. DOE Informational Meeting on Nuclear Fuel Cycle Options held at Argonne National Laboratory on April 25, 2012 (http://www.inl.gov/conferences/nfco/d/summary-of-doe-informational-meeting-on-nfc-options.pdf ).
A16. Clemen, R.T., Making Hard Decisions: An Introduction to Decision Analysis, Duxbury Press, 1990.
A17. Keeney, R.L., Raiffa, H., Decisions with Multiple Objectives: Preferences and Value Tradeoffs, Wiley, 1976.
A18. Keeney R.L., von Winterfeldt, D., “Practical value models,” in Edwards, W., Miles, R.F. Jr., von Winterfeldt, D. (Eds.), Advances in Decision Analysis: From Foundations to Applications, Cambridge University Press, Cambridge, pp. 232-252, 2007.
A19. Dyer J.S., Sarin R., “Measureable multiattribute value functions,” Operations Research (22), pp. 810-822, 1979.
Nuclear Fuel Cycle Evaluation and Screening – Final Report – Appendix A October 8, 2014 37
ATTACHMENT 1. CHARTER FOR THE EVALUATION AND SCREENING OF FUEL CYCLE OPTIONS
Nuclear Fuel Cycle Evaluation and Screening – Final Report – Appendix A 38 October 8, 2014
Nuclear Fuel Cycle Evaluation and Screening – Final Report – Appendix A October 8, 2014 39
Nuclear Fuel Cycle Evaluation and Screening – Final Report – Appendix A 40 October 8, 2014
Nuclear Fuel Cycle Evaluation and Screening – Final Report – Appendix A October 8, 2014 41
Nuclear Fuel Cycle Evaluation and Screening – Final Report – Appendix A 42 October 8, 2014