api infrastructure investment study
DESCRIPTION
API-Infrastructure-Investment-Study.pdfTRANSCRIPT

Oil & Natural Gas Transportation & Storage Infrastructure: Status, Trends, & Economic Benefits
Report for:
American Petroleum Institute
Submitted by:
IHS Global Inc. 1150 Connecticut Ave, NW, Suite 401
Washington, D.C. 20036
December 2013

Oil & Natural Gas Transportation & Storage Infrastructure: Status, Trends, & Economic Benefits
IHS Global Inc. i
CONTACT INFORMATION
RICHARD FULLENBAUM Vice President, IHS Economic Consulting 1150 Connecticut Ave., NW, Suite 401 Washington, DC 20036 Tel: 202-481-9212 Email: [email protected]
JAMES FALLON Director, IHS Downstream Energy Consulting 600 Travis Street, Suite 2150 Houston, TX 77002 Tel: 832-209-4452 Email: [email protected] BOB FLANAGAN Director, IHS Economic Consulting 24 Hartwell Avenue Lexington, MA 02421 Tel: 781-301-9158 Email: [email protected]

Oil & Natural Gas Transportation & Storage Infrastructure: Status, Trends, & Economic Benefits
IHS Global Inc. ii
TABLE OF CONTENTS EXECUTIVE SUMMARY .................................................................................................................... 3
1. INTRODUCTION .......................................................................................................................... 9
2. CURRENT STATE OF THE US OIL & GAS INFRASTRUCTURE ...................................................... 11
3. FORECASTED TRENDS IN U.S. OIL & GAS INFRASTRUCTURE DEVELOPMENT (2014-2025)..... 20
Direct Capital Investment Assessment Methodology .............................................................. 21
Direct Capital Investment Forecast Base Case Results ............................................................. 24
Direct Capital Investment Forecast High Case Results ............................................................. 31
4. ECONOMIC IMPACT ASSESSMENT OF INFRASTRUCTURE INVESTMENT ................................. 34
Underlying Assumptions ........................................................................................................... 36
Overall National Level Results .................................................................................................. 40
Employment Contribution by US Census Region ...................................................................... 41
5. CONCLUSION ............................................................................................................................ 44
APPENDIX A ................................................................................................................................... 47
APPENDIX B ................................................................................................................................... 52

Oil & Natural Gas Transportation & Storage Infrastructure: Status, Trends, & Economic Benefits
IHS Global Inc. 3
EXECUTIVE SUMMARY
Over the past five years, unconventional oil and gas activity has thrust the nation into an unexpected position. The U.S. is now the global growth leader in crude oil production capacity growth, adding nearly 1.2 million barrels per day (mbd) of capacity over the 2008 – 2012 time period1. In addition, the U.S. is now the largest natural gas producer, at 65 billion cubic feet (Bcf) per day2. At the same time, unconventional activity is spurring the growth of natural gas liquids (NGLs) production, adding over 500,000 barrels of oil equivalent (boe) per day since 20083. This has brought the total increase in liquids production capacity to some 1.7 mbd since 2008. Driven by growth in U.S. natural gas, natural gas liquids, and crude oil, the past 2 years have witnessed rapid growth in direct capital investment toward oil and gas infrastructure assets. IHS estimates that capital spending in oil and gas midstream and downstream infrastructure has increased by 60 percent, from $56.3 billion in 2010 to $89.6 billion in 2013. This increase in capital spending has provided both an economic stimulus and an incisive data point into how shale driven oil and gas production is reshaping the U.S. oil and gas infrastructure landscape. As this period of high infrastructure investment, which began after the 2008-2009 financial recession, continues to progress it will largely reverse a macro energy infrastructure trend that began taking shape in the early 1970’s. Many of the major oil and gas infrastructure investments made for the past 30 years have been premised under the assumption of decreasing domestic production, increasing energy imports, and the need to move imported energy from coastal receiving ports to inland demand centers. A large portion of the projects being developed during this sustained infrastructure investment period will shift the U.S. towards being energy trade balanced and add key infrastructure segments that enable growing energy production in the Midcontinent region to reach demand centers on the US Gulf Coast and Eastern seaboard. The purpose of this study is two-fold: (1) to provide a comprehensive assessment of required investment in oil and gas transportation and storage infrastructure through 2025; and (2) to assess the economic impacts associated with this investment, in terms of employment, contribution to GDP (Value Added), labor income, and tax revenues. The analysis of infrastructure investments examines significant trends both during an historical period – 2010 through 2013 – and on a forecast basis, 2014 – 2025. It focuses on energy types supported by investment, including Natural Gas, NGLs and LPG, Oil and Condensate, Refineries and Refined Products, and Common Infrastructure. The economic impact assessment is developed on the basis of average annual investments from 2014 through 2025. Both the analysis of infrastructure spending and the resultant economic impact assessment are developed under
1 EIA – Monthly Energy Review https://www.eia.gov/totalenergy/data/monthly/pdf/sec3_3.pdf
2 BP Statistical Review of World Energy 2012
3 EIA – Monthly Energy Review https://www.eia.gov/totalenergy/data/monthly/pdf/sec3_3.pdf

Oil & Natural Gas Transportation & Storage Infrastructure: Status, Trends, & Economic Benefits
IHS Global Inc. 4
two scenarios – a base case, reflecting the IHS view of the most likely path of oil and gas production over the 2014-2025 time frame, and a high production case, reflecting a 20 percent increase in natural gas, natural gas liquids, and crude oil production above the base case that could be associated with expanded access to current off limit areas in Atlantic, Eastern GOM, Pacific and Alaska4. Capital Investment in Oil and Gas Transportation & Storage Infrastructure
There are several themes and forward looking changes that are major factors affecting both the level and composition of oil and gas infrastructure spending. These can be summarized as follows:
An incisive example of the structural shift from import to export oriented infrastructure assets is provided with liquefied natural gas (LNG) facilities. By the late 1990s, it appeared that the U.S. would need to supplement domestic natural gas production with imported LNG, and starting in 2000, LNG regasification (import) facilities were re-commissioned, expanded, or constructed. As the last of these import facilities were placed into service, the full potential of the shale gas resource was just being understood by the marketplace, largely making billions of dollars in import investment unnecessary. Fortunately, these import facilities can be repurposed with additional investment as dual purpose import and export LNG facilities.
The results of the IHS analysis determine that this recent surge in oil and gas transportation and storage infrastructure investment is not a short lived phenomenon. Rather, we find that a sustained period of high levels of oil and gas infrastructure investment will continue through the end of the decade. The IHS analysis estimates that between $85 – $90 billion of direct capital will be allocated toward oil and gas infrastructure in 2014. Between 2014 and 2020, IHS projects that an average of greater than $80 billion will be invested annually in U.S. midstream and downstream petroleum infrastructure. After 2020, IHS expects that pace of investment to curtail moderately from this sustained period of high investment, declining gradually to an infrastructure direct capital investment of just under $60 billion by 2025.
4 Source: IHS Downstream Energy Expanded Production Case, April 2013. The IHS Downstream Energy Practice
utilizes a 20 percent increase for all high production scenarios.

Oil & Natural Gas Transportation & Storage Infrastructure: Status, Trends, & Economic Benefits
IHS Global Inc. 5
The IHS forecast of oil and gas infrastructure investment over the next 12 years (2014 – 2025) estimates a cumulative spending of $890 billion (in 2012 Dollars), with crude oil and natural gas gathering systems and direct production support facilities receiving the largest share of the investment at 60% of total. The IHS analysis forecasts a heavy weighting of investments towards liquids (crude oil and NGL’s) over the next 5 years driven by wide oil-to-gas price spreads, but expects the investment trend to shift back towards a higher percentage of natural gas investment in the second half of the forecast horizon as natural gas prices recover. Pipelines and related investments will remain the primary mover of oil and gas production despite a near term shift towards the use of rail and marine as major modes of oil and gas production transportation. As major pipeline corridors and projects are completed, the efficiency and economics of long distance pipeline movements will shift the logistics weighting back towards its historical distribution pattern.
In addition to the IHS base case forecast, a high production case capital investment outlook has also been developed which assumes a 20 percent increase in oil and gas production relative to the base case over the forecast period. In the high production case, total oil and gas transportation and storage infrastructure investment increases to $1.15 trillion over the 2014-2025 period, a 29% increase over the base production case. In the high production case, IHS forecasts that significant additional growth will occur in asset classes such as LNG liquefaction facilities, gas processing capacity, natural gas underground storage formations, and crude oil pipelines. The high production case is highlighted by a doubling of U.S. LNG exports and the construction of a second major North-South crude oil pipeline transportation corridor.
0
200
400
600
800
1,000
1,200
1,400
2010 2011 2012 2013 2014 2015 2016 2017 2018 2019 2020 2021 2022 2023 2024 2025
Base Case Direct Capital Investments Cumulative(in 2012 Dollars)
Natural Gas NGL & LPG Crude Oil Refined Products Common Infrastructure
$ Billions

Oil & Natural Gas Transportation & Storage Infrastructure: Status, Trends, & Economic Benefits
IHS Global Inc. 6
0
20
40
60
80
100
120
2010 2011 2012 2013 2014 2015 2016 2017 2018 2019 2020 2021 2022 2023 2024 2025
Direct Capital Investments Year by Year - High Production Case(in 2012 Dollars)
Natural Gas NGL & LPG Crude Oil Refined Products Common Infrastructure
$ Billions

Oil & Natural Gas Transportation & Storage Infrastructure: Status, Trends, & Economic Benefits
IHS Global Inc. 7
Economic Impact Results IHS assessed the economic contributions attributable to increased investments in oil and natural gas transportation and storage infrastructure under both the base case and high production scenarios. The objective was to fully capture the influence of each scenario’s infrastructure investment on the US economy and the four US Census Regions through direct spending, supply-chain activity and the effects of workers’ spending portions of their incomes in the general economy. The economic impact analysis was generated based on average annual investment levels over the 2014-2025 forecast horizon. IHS anticipates that, under the base case scenario, the infrastructure investment will lead to average annual economic contributions over the 2014 to 2025 period of:
Support for almost 900,000 jobs;
Contribution to US GDP of $94 billion;
Labor Income of $59 billion;
Government Revenues in excess of $21 billion.
Under the high production scenario these contributions will increase to:
Support for almost 1,147,000 jobs;
Contribution to US GDP of $120 billion;
Labor Income of $75 billion;
Government Revenues in excess of $27 billion. IHS also examined the effects of regional infrastructure and storage investment on the US economy. In the base case scenario, the $73.8 billion of overall average annual investment was distributed across the four US Census Regions. Approximately $41.5 billion of the investment went to the South, $14.1 billion to the West, $11.8 billion to the Midwest and $6.4 billion to the Northeast. Based on these direct investments, IHS determined the jobs contribution to the US economy and each of the four US Census Regions. This analysis reflects the indirect and induced jobs that are contributed in regions other than a region in which the direct investment occurs. For example, as highlighted in the figure below, the Northeast gains 38,730 net new jobs as a result of investments made in the other 3 US Census Regions.

Oil & Natural Gas Transportation & Storage Infrastructure: Status, Trends, & Economic Benefits
IHS Global Inc. 8
Conclusion A significant finding of this study is the staying power of capital expenditure levels throughout the 2014-2025 forecast period. While investment declines after the build out in the first half of the forecast period, even by 2025 investment amounts remain at a robust $60 billion in the base case and over $80 billion in the high production case. This is an indication of continuing investment at fairly steady levels beyond 2025. While the economic contribution of oil and gas transportation and storage infrastructure investment is significant, we are mindful that these investment levels are clearly not as large as the capital expenditure elements related to the upstream unconventional oil and gas sector. It should be remembered that these infrastructure investments facilitate the ultimate economic benefits flowing from unconventional oil and natural gas development. While we have assessed the stand-alone economic contribution of these investments5, it is necessary to take into account the infrastructure necessary to bring the upstream products to market and thus allow the significant economic benefits from those products to come to fruition. Economic impacts resulting from capital expenditure elements related to the upstream unconventional oil and gas sector are detailed in volume 3 of the IHS study “America’s New Energy Future: A Manufacturing Renaissance”.
5 See America’s New Energy Future: A Manufacturing Renaissance (Volume 3) – September 2013
Investment and Job Distribution by US Census Region, Base Case
Source: IHS 2013
30.387
6,446
1,897
40,796
9,500
8,741
Notes: 1. The phrase “Jobs originating in this region” is shorthand for “US jobs supported as a result of direct capital investment made in this US Census Region”
2. Each arrow shows the net redistribution of jobs between two regions
Investment
$14.1B
Investment
$41.5B
Investment
$6.4B
Investment
$11.8B
Jobs "originating" in region 76,355
Net jobs due to investment
in other regions38,730
Net jobs in region 115,084
Net Jobs in the Northeast
Jobs "originating" in region 501,477
Net jobs due to investment
in other regions(79,923)
Net jobs in region 421,553
Net Jobs in the South
Jobs "originating" in region 150,482
Net jobs due to investment
in other regions48,400
Net jobs in region 198,882
Net Jobs in the Midwest
Jobs "originating" in region 164,672
Net jobs due to investment
in other regions(7,206)
Net jobs in region 157,466
Net Jobs in the West

Oil & Natural Gas Transportation & Storage Infrastructure: Status, Trends, & Economic Benefits
IHS Global Inc. 9
1. INTRODUCTION
Over the past five years, unconventional oil and gas activity has thrust the nation into an unexpected position. The U.S. is now the global growth leader in crude oil production capacity growth, adding nearly 1.2 million barrels per day (mbd) of capacity over the 2008 – 2012 time period6. In addition, the U.S. is now the largest natural gas producer, at 65 billion cubic feet (Bcf) per day7. At the same time, unconventional activity is spurring the growth of natural gas liquids (NGLs) production, adding over 500,000 barrels of oil equivalent (boe) per day since 20088. This has brought the total increase in liquids production capacity to 1.7 mbd since 2008. In the face of these historic changes in U.S. oil and natural gas production patterns the need for and benefits from additional oil and gas infrastructure in the U.S. and Canada is becoming increasingly apparent. The purpose of this report is to provide critical information in the following areas:
Characterization of the current state of the oil and gas related transportation infrastructure.
Provision of a comprehensive overview and estimates of the (emerging) infrastructure investments needed for the transportation and storage of crude oil, NGL’s, refined product, and natural gas reported as cumulative investment from the present to 2025.
Assessment of the associated employment, GDP and tax revenue impacts associated with such infrastructure investments reported as average annual impacts over the study horizon.
Incorporation of a potential high production growth scenario to estimate infrastructure and economic impacts associated with expanded access to current off limit areas in Atlantic, Eastern GOM, Pacific and Alaska. The time frame for this additional scenario would also be through 2025.
Twenty asset classes are examined in the assessment of oil and gas transportation and storage infrastructure investment. These include the following:
(1) Natural Gas Gathering (2) Gas Processing (3) Natural Gas Pipelines (4) Natural Gas Storage (5) LNG Processing
6 EIA – Monthly Energy Review https://www.eia.gov/totalenergy/data/monthly/pdf/sec3_3.pdf
7 BP Statistical Review of World Energy 2012
8 EIA – Monthly Energy Review https://www.eia.gov/totalenergy/data/monthly/pdf/sec3_3.pdf

Oil & Natural Gas Transportation & Storage Infrastructure: Status, Trends, & Economic Benefits
IHS Global Inc. 10
(6) LNG Marine (7) NGL & LPG Processing (8) NGL & LPG Pipelines (9) NGL & LPG Storage and Rail (10) NGL & LPG Marine (11) Crude Oil Gathering (12) Crude Oil Pipelines (13) Crude Oil Storage (14) Crude Oil Marine (15) Crude Oil Rail (16) Refineries (17) Refined Product Pipelines (18) Refined Product Storage (19) Refined Product Marine (20) Common Infrastructure
Section Two describes the current state of the oil and gas transportation and storage infrastructure and provides capital addition estimates over the past four years, 2010-2013. This is a retrospective look at investments that have already been made and specific key capital projects that are operating. Section Three provides a forecast of direct capital investments and capacity additions over the 2014-2025 time frame required to support our base case of expected natural gas, natural gas liquids, crude oil, and refined product production. Infrastructure forecasts are also presented in Section Three for the potential high production case, which assumes a 20 percent increase in natural gas, natural gas liquids, and crude oil production above the base case9. Section Four presents the economic impact assessment related to infrastructure investment for both the base case and high production cases. The direct capital investment forecasts taken from section three are used as the primary modeling inputs into the IMPLAN modeling structure (modified to incorporate the IHS Macro-Economic Model configuration in estimating induced effects). The investments over the 2014-2025 timeframe are incorporated into the IMPLAN structure as annual averages. The analysis is conducted at both a national level and on a nine Census Division basis, aggregated up to the four U.S. Census Regions. Relevant metrics include direct, indirect, induced and total effects on an employment, value added (contribution to GDP), labor income, and government revenue basis. Section Five provides the final conclusions of this study. Finally Appendix A provides additional details underlying the oil and natural gas transportation and storage infrastructure investment estimates, and Appendix B presents additional details underlying the economic impact results and modelling approach.
9 Source: IHS Downstream Energy Expanded Production Case, April 2013. The IHS Downstream Energy Practice
utilizes a 20 percent increase for all high production scenarios.

Oil & Natural Gas Transportation & Storage Infrastructure: Status, Trends, & Economic Benefits
IHS Global Inc. 11
2. CURRENT STATE OF THE US OIL & GAS INFRASTRUCTURE
The emergence of the U.S. from the 2008-2009 recession has been underpinned by rapid growth in domestic infrastructure investment that supports the production and processing of natural gas, natural gas liquids, and crude oil. Our analysis indicates that the direct capital investment in U.S. oil and gas infrastructure has increased over the past 4 years by 60 percent, from $56.3 billion in 2010 to $89.6 billion in 201310. This increase in capital spending has both provided an economic stimulus and provides an incisive data point into how shale driven oil and gas production is reshaping U.S. oil and gas infrastructure. For the purposes of this report, infrastructure refers to the physical assets starting at the production wellhead necessary to transport and convert produced hydrocarbons into both semi-finished and finished products and deliver those products to market. In conventional oil and gas vernacular this covers the assets typically classified as “Midstream” and “Downstream” assets, and includes gathering, stabilization, and supporting assets typically installed in the direct vicinity of the production well. The analysis contained in this report covers the following three distinct hydrocarbon value segments; natural gas, natural gas liquids (NGL)11, and crude oil12. Across each hydrocarbon value chain the assets can further be categorized by functionality and logistics transportation mode. Common asset sectors across the three hydrocarbon segments include the following:
Pipelines includes both long distance inter and intrastate transmissions systems and the local or regional gathering systems which aggregate production for delivery into the common carrier transmission systems. The assessment of the gathering system direct capital investment contains the group of assets typically found in the direct vicinity of the production well. This includes both the collection pipelines and associated pumping and compression facilities, and also supporting assets necessary to stabilize, condition, and perform bulk separation from the as-produced hydrocarbons.
Rail infrastructure includes direct capital investment in loading and unloading facilities, additional railroad tank cars used in the transportation of increased liquids production, and direct investment in railroad tracks to establish new routes or enhance existing lines associated with delivering increased volumes of hydrocarbon liquids.
Marine infrastructure includes direct capital investment in both new build vessels13 required to transport incremental production and specially designed marine loading and unloading facilities. The classes of marine vessels covered include tankers, ocean-going barges, and inland transport barges. The growth in capital investment in fit-for-purpose is particularly strong for dedicated NGL export facilities and liquefied natural gas (LNG) bunkering facilities to support marine vessel refuelling along U.S. waterways.
10
2013 value reflects a current year estimate and may vary slightly as end of the year data is compiled. 11
Includes natural gasoline or pentane plus typically contained in the raw NGL mixture. 12
Includes stabilized condensate or very light crude oil, API greater than 50. 13
All new build marine vessels assumed to conform to requirements of the Jones Act.

Oil & Natural Gas Transportation & Storage Infrastructure: Status, Trends, & Economic Benefits
IHS Global Inc. 12
Processing & Storage infrastructure is typically referred to as the “Downstream” sector of the petroleum industry, and includes those facilities involved in the physical storage of hydrocarbons. Also any asset group whose function is to process, separate, or liquefy raw hydrocarbons into higher value intermediates and finished products. These facilities include raw or rich natural gas processing plants, natural gas liquefaction facilities (or LNG export facilities), NGL fractionators, and crude oil refinery investments. Not included in the processing and storage sector are secondary processing facilities such as petrochemical, fertilizer plants, and gas-to-liquids (GTL) investments.
Common Infrastructure covers key enabling pieces of infrastructure that are typically common to all three hydrocarbon value chains and are not classified as one of the primary transportation modes. This includes investment in roads to handle increased heavy duty vehicle traffic for both production operations and logistics functions, port facilities specific to increased oil and gas production, new U.S. mines for hydraulic fracturing sand, and large scale investment in cross-continental infrastructure to support the use of liquefied and compressed natural gas (LNG-CNG) as a petroleum diesel alternative in long distance heavy duty trucking.
The investment pattern in U.S. oil and gas infrastructure over the past four years is largely a continuation of a macro trend that began in the mid-to-late 2000s, that was unfortunately disrupted by the financial recession, and recently took a sharp pivot away from gas oriented investment towards investment in liquids related infrastructure. The short term pivot away from natural gas related infrastructure, particularly pipelines and gathering systems, is a function of an extended period of historically low U.S. natural gas prices (less than $4.00 per MMBTU) due to general market oversupply facilitated by the natural gas shale production revolution. The macro trend that began just before the recession reversed a multi-decade long infrastructure trend in the U.S., one based upon the presumption that the U.S. would be importing an ever increasing percentage of its energy demand in the form of crude oil, refined products, natural gas liquids, and liquefied natural gas. The investments over this period (nominally the period between 1975 and 2005) in the major pieces of oil and gas infrastructure largely support this now increasingly incorrect outlook of an ever increasing energy trade imbalance.

Oil & Natural Gas Transportation & Storage Infrastructure: Status, Trends, & Economic Benefits
IHS Global Inc. 13
US Oil & Natural Gas Consumption Supplied by Imports14
As an example of the infrastructure investment spending trend of the preceding three decades consider the types of investments made in several key asset classes. For crude oil pipeline, the major investments made during the late 1970s and early 1980s were largely made to move crude oil from the coastal regions of the country to the midcontinent where crude oil production was in decline. This included major investments such as the Louisiana Offshore Oil Platform (LOOP), which finished construction in 1981 and its conjoining pipeline Capline15, constructed a decade earlier. At the time this was the largest crude oil pipeline in the world. With these systems combined, the capability existed to receive a very large crude carrier (VLCC) vessel16 at a US Gulf Coast marine berth, and transport up to 1.2 million B/D of crude oil from the Gulf Coast to the Midwest. In similar fashion, the Seaway pipeline finished in 1976 was envisioned as a major corridor for moving crude oil from the deep-water port of Freeport, Texas to Midwest refineries through Cushing, Oklahoma. These investments in conjunction with a series of expansions of the Canadian Interprovincial Pipeline System (now Enbridge Mainline) through the 1980s and 1990s are all indicative of a U.S. petroleum industry anticipating an ever increasing percentage of
14
While these estimates include coal, the major component is oil and natural gas. There have been virtually no coal imports (just exports) in the recent past due to significantly lower natural gas prices. 15
Capline finished construction in 1969 and was originally envisioned as a means of moving Louisiana offshore Gulf Coast production to the U.S. Midwest. By the 1980s and 1990s it was largely being used to move imported crude oil barrels to those same refineries. 16
A VLCC marine vessel holds approximately 2 million barrels of crude oil.
0%
5%
10%
15%
20%
25%
30%
35%
1982 1987 1992 1997 2002 2007 2012
Percent
Inflection Point
25 Year Trend Shaping U.S. Oil & Gas Infrastructure Investment

Oil & Natural Gas Transportation & Storage Infrastructure: Status, Trends, & Economic Benefits
IHS Global Inc. 14
imported crude oil. This conventional wisdom largely drove the trend in U.S. crude oil pipeline developments for the past 20 years and is illustrated in the static landscape of the major U.S. crude oil pipelines, which had remained largely unchanged from 1995 to 2005.
In the natural gas segment of the industry, a similar trend emerged in the early 2000s. The simultaneous combination of increasing electricity production from natural gas and what was forecasted at the time to be ever declining U.S. natural gas production, resulted in a wave of investments in mega-scale liquefied natural gas regasification facilities located across the Gulf and Atlantic seaboards. Starting in 2000, 10 LNG facilities were re-commissioned17, expanded, or constructed with a total incremental natural gas import capacity of approximately 18 BCF/D. This regasification capacity, if it were ever fully utilized, represented the capability to supply 25% of U.S. natural gas demands. The natural gas for these LNG import terminals was originally anticipated to be sourced from world scale LNG liquefaction facilities in the Caribbean18, West Africa, North Africa, Middle East, Southeast Asia, and as far away as Western Australia and Eastern Russia.
17
Two facilities, Dominion Cove Point in Maryland and Southern-El Paso in Georgia, had been mothballed since the late 1970s. 18
Trinidad and Tobago
© 2012, IHS Inc. No portion of this presentation may be reproduced, reused, or otherwise distributed in any form without prior written consent.
North American Major Crude Oil Pipelines (2005)
Edmonton
Chicago
Houston
Area
Denver
Montreal
Hardisty
Vancouver
Anacortes
Guernsey
Patoka
KM Trans
Mountain
Enbridge
Mainline
(5 Lines)
Bridger
& Butte
Enbridge
LakeheadEnbridge
No. 9 Line
Shell
Ho-Ho
BP
Cush-Chi
(2 Lines)
Enbridge
Southern
Access
Sarnia
Corpus Christi
Marathon
Saint James
Longview &
Corsicana
Seaway
WTG
Capline
Mid-Valley
Pegasus
Shell
OzarkCushing
Jayhawk
Midland
Centurion
& Basin
Lima
- Oil Sands
- Bakken
- Niobrara
- Greater Mississippian
- Permian Basin
- Eagle Ford
- Utica
- Monteny / Cardium
Clearbrook
Superior
Wood River
KM
Express
KM
Platte

Oil & Natural Gas Transportation & Storage Infrastructure: Status, Trends, & Economic Benefits
IHS Global Inc. 15
Unfortunately, from an investment perspective, seven of these facilities were not finished with commissioning until 2008 or later, with two of them not commissioned until as late as 2011. Just as many of these facilities were ready to accept their first cargos of LNG, the full potential of the U.S. shale gas resource was being realized. This ultimately reduced the operating utilization to lower than expected levels for billions of dollars in natural gas infrastructure investment. As an example of how energy fortunes can change over the multi-decade investment horizon of major oil and gas projects, Indonesia, the largest producer and exporter of LNG for several decades, signed in December of 2013 its first contract for the importation of LNG (starting in 2018). A portion of the volumes that Indonesia will be importing are anticipated to be supplied by LNG liquefaction terminals located on the U.S. Gulf Coast supplied with domestic natural gas. As is now well acknowledged, the story of what changed is the story of the U.S. shale oil and gas revolution. The combination of horizontal drilling and hydraulic fracturing technologies enable oil and gas companies to tap a large new source of oil and gas production held in shale and other low porosity or tight geologic formations using these techniques. In the beginning the impact of the shale shift on U.S. oil and gas infrastructure was primarily a natural gas story or, more specifically, a dry natural gas story19. The initial impact of shale gas on infrastructure development was largely focused on natural gas gathering systems, natural gas interstate pipelines, and natural gas storage. “More recently, the development of the shale basins in the southeast U.S. has spawned a boom in transmission pipeline construction in that part of the country. Shale gas supplies were connected, via new pipelines, to the traditional long-line pipelines that transported natural gas from the Gulf of Mexico to the mid-Atlantic and northeast U.S. Over 3,000 miles of interstate pipeline has been approved and has gone into service to haul southeast U.S. shale gas.”20 This statement from the National Petroleum Council reflects the state of infrastructure development to support shale gas that was occurring in the 2008 – 2010 timeframe. The second half of the natural gas infrastructure development story centers on the prolific production from the Marcellus shale development. Large scale development in the Marcellus aided in sustaining natural gas investment through the 2010 – 2013 period, despite historically low natural gas prices, and reduced natural gas drilling activity across the U.S. As of September 2011 and based on data from the FERC, “over 70 miles of interstate pipeline to transport Marcellus Shale basin gas have gone into service, 319 miles of interstate pipeline are approved and under construction, 116 miles are pending, and almost 5,000 miles of potential projects have been announced. An interesting characteristic of the Marcellus Basin area pipelines is that while total capacity proposed will be large, the mileage will be seemingly small when compared to long haul pipelines in the west. This is primarily due to the proximity of this supply to highly populated east coast markets.”21 Both of these major infrastructure
19
Natural gas that does not contain a high percentage of natural gas liquids that can be further extracted in a natural gas processing plant. 20
National Petroleum Council, North American Resource Development Study, made available September 15, 2011. 21
National Petroleum Council, North American Resource Development Study, made available September 15, 2011.

Oil & Natural Gas Transportation & Storage Infrastructure: Status, Trends, & Economic Benefits
IHS Global Inc. 16
developments in the U.S. natural gas markets have had a profound impact over the past 5 years in shifting the traditional flow patterns of natural gas in the U.S.
As natural gas production from shale has developed, particularly in areas of non-traditional production, the demand for underground22 natural gas storage has grown as well, both to manage seasonal demand swings and to buffer the market from rapid changes in production. Since 2009, U.S. domestic total natural gas storage23 has increased by 500 billion cubic feet to a total storage capacity of 9,100 billion cubic feet. This 6% increase seems small unless placed into the context that in the preceding 20 years, underground natural gas storage in the U.S. had only grown by the same 500 billion cubic feet. Another key theme in the recent development of U.S. oil and gas infrastructure has been the migration of techniques originally developed for shale gas to liquids rich production plays. Particularly in light of depressed natural gas prices the ability to adopt these techniques in oil and wet gas24 rich basins has been critical to keeping the U.S. drilling rig fleet fully utilized. This near term shift in production focus away from natural gas towards liquids is evident in both the number of crude oil versus natural gas wells completed and in the investment in crude oil
22
Underground storage constitutes storage in depleted oil / gas reservoirs, salt caverns, and aquifers. 23
Total natural gas storage to be differentiated from working gas capacity. 24
Raw natural gas with a high concentration of natural gas liquids.
© IHS 2013
FIGURE 13
Source: IHS CERA and U.S. Census Bureau, Census 2000.
00112-13
PRE v POST
Shale Flows
<1
Bcf/d>1
Bcf/d

Oil & Natural Gas Transportation & Storage Infrastructure: Status, Trends, & Economic Benefits
IHS Global Inc. 17
gathering systems. Based on IHS analysis the direct capital investment in crude oil gathering and support facilities has doubled since 2010, increasing from $15 billion to just under $30 billion by 2013. However, in a classic case of outrunning the supply lines, the pace of drilling and production in crude oil and other liquids rich plays has far outpaced the ability of the downstream supporting infrastructure to be added. In 2010 and 2011 calculated direct capital investment in crude oil and NGL’s logistics and processing25 averaged just under $8 billion annually. As the need for supporting infrastructure became self-evident, the direct capital investment in liquids logistics and processing increased by over 260 percent, jumping to $22 billion in 2012, and then increasing by another 32 percent to just under $29 billion in 201326. This almost quadrupling of direct investment has stimulated almost every aspect of U.S. domestic oil and gas infrastructure, creating a construction and development surge not experienced in the U.S. petroleum industry in 25 years. Detailed below are examples of the scale and development acceleration experienced for specific asset classes of oil and gas infrastructure.
Driven by the economics of extracting NGL’s over the present day value of natural gas, the investment in gas processing has increased from $2 billion in 2010 to $7.5 billion in 2013. In 2012 and 2013 alone an estimated 12 BCF/D of natural gas processing was added or restarted in the U.S. This capacity surge represents almost 20% of total U.S. natural gas demand.
Heavily concentrated in Mont Belvieu, Texas, the main NGL fractionation hub in the U.S., the investment in NGL fractionation has increased from just under $1 billion per year to over $4.5 billion per year. In 2012 and 2013, IHS estimates that just over 1 million B/D of NGL fractionation capacity had been added. This represents fractionation capacity for nearly one-third of total U.S. NGL production.
NGL pipelines, which serve as the key connector between the gas processing plants and the large NGL fractionating hubs, have increased investment from under $1 billion per year to over $3 billion per year in 2013.
Starting with the original Keystone pipeline commissioned in 2010 and the reversal of several other exiting pipelines between the Upper Midwest and Midcontinent, a large scale reshaping of domestic crude oil flow patterns is under way. Investments in U.S. crude oil pipelines have increased from $1.6 billion in 2010 to $6.6 billion in 2013. With many pipelines under development, the investment in crude oil pipelines is projected to be sustaining for the next half decade. By 2015, just 2 years from now, the landscape of major U.S. crude oil pipelines will have almost no resemblance to the picture that existed in 2005.
25
Including natural gas processing for NGL production but excluding crude oil refining. 26
Estimated current year projection.

Oil & Natural Gas Transportation & Storage Infrastructure: Status, Trends, & Economic Benefits
IHS Global Inc. 18
Even with the large increase and investment in pipelines the completion of infrastructure projects has not been able to keep pace with the rapid increase in production. This has created the opportunity for marine, both river and ocean going, and particularly rail to inhabit a much larger role in the movement of production than they have played in many years. Crude oil movements by rail have increased from less than 50,000 B/D in 2010 to 800,000 B/D in 2013, driving capital investment in rail tracks, rail loading and unloading facilities, and tank cars used in the transportation of crude oil. At present the backlog for tank cars in the U.S. stands at just under 60,000, representing over 20% of the entire tank car fleet27. Driven by rail, both figuratively and literally, the investment in rail and marine logistics for transporting crude oil and NGL’s has increased from less than $0.5 billion in 2010 to over $5 billion by 2013.
In support of oil and gas production across all three value chains, investment in common infrastructure has also increased significantly, from $1.3 billion in 2010 to $7.7 billion in 2013. This investment is heavily concentrated in additional highway and local road construction to support higher traffic flows, but also includes port investment for new high traffic crude oil marine centers such as Corpus Christi, TX.
During this period of rapid growth in U.S. oil and gas infrastructure one segment of the industry has experienced the reverse trend from the other asset classes detailed above, and that is
27
Railway Supply Institute, September 2013 Data.
© 2012, IHS Inc. No portion of this presentation may be reproduced, reused, or otherwise distributed in any form without prior written consent.
Expected North American Major Crude Oil Pipelines (2015)
Edmonton
Chicago
Saint JamesHouston
Area
Denver
Cushing
Montreal
Hardisty
Vancouver
Anacortes
Guernsey
KM Trans
Mountain
Bridger
& Butte
Enbridge
Lakehead
(Expansion)Enbridge
No. 9 Line
Jayhawk
Centurion
& Basin
Shell
Ho-Ho
& West-Ho
Enbridge
Southern
Access
(Expansion)
Sarnia
Koch, PAA,
Double Eagle, & KM
Keystone
Enbridge
Alberta
Clipper
(Expansion)
KM
2 Lines
Enbridge
Sandpiper
Flanagan
South
Corpus Christi
Longhorn,
BridgeTex,
& Permian
Express
Enbridge
Mainline
Pony
Express
Lima
BP &
Spearhead
Mid-Valley
Pegasus
Enbridge
Ozark
Patoka Marathon
MidlandSeaway
& Twin
WTG
Longview &
CorsicanaCapline
Gulf Coast
- Oil Sands
- Bakken
- Niobrara
- Greater Mississippian
- Permian Basin
- Eagle Ford
- Utica
- Monteny / Cardium
Clearbrook
Superior
Southern
Lights
(Diluent)
Wood River
Enbridge
Spectra
Express
KM
Platte
Cochin
(Diluent)

Oil & Natural Gas Transportation & Storage Infrastructure: Status, Trends, & Economic Benefits
IHS Global Inc. 19
refining. The period of 2005 – 2010 represented a relatively large and sustained investment period for the U.S. refining industry. This was driven by investment to produce cleaner fuels, reduce criteria emissions, improve process safety standards, and by several large investment decisions made during the relatively high refining margin period that existed from 2005 – 2007. During this period of high margins and growing U.S. refined product demand, investment decisions were made to expand two already very large refineries, Marathon Petroleum Garyville, LA and Motiva Port Arthur, TX. Although these investments will be technically classified as expansion projects, in reality these represent the construction of two world scale grass root refineries inside the fence line of existing refineries, totalling over 600,000 B/D of new high complexity refining capacity. These investments were being constructed and completed during 2010 and drove a high direct capital investment for that year. Since those investment decisions were made, the demand in the U.S. for refined petroleum products has not increased as predicted, but actually decreased, curtailing the need for additional large scale investment in U.S. refining capacity. Since 2010, calculated, non-sustaining capital investment in refining has decreased from $7.5 billion in 2010 to just under $3 billion in 2013.
SECTION II TABLE 1
U.S OIL & GAS DIRECT CAPITAL INVESTMENTS IN RECENT HISTORY (2010-2013)
(Million 2012 Dollars)
2010 2011 2012 2013
Natural Gas Gathering, Pipelines & Storage 25,014 20,841 15,585 17,760
Crude Oil & NGL Gathering, Pipelines & Storage 18,283 26,347 36,326 40,464
Natural Gas & NGL Processing 3,707 4,436 11,260 15,578
Natural Gas / NGL / Crude Oil Rail & Marine Logistics 496 1,477 3,518 5,284
Refineries & Refined Product Infrastructure 7,496 4,489 3,085 2,887
Common Infrastructure 1,340 2,681 7,050 7,651
Oil & Natural Gas Transportation & Storage Infrastructure: Status, Trends, & Economic Benefits
IHS Global Inc. 20
3. FORECASTED TRENDS IN U.S. OIL & GAS INFRASTRUCTURE DEVELOPMENT (2014-2025)
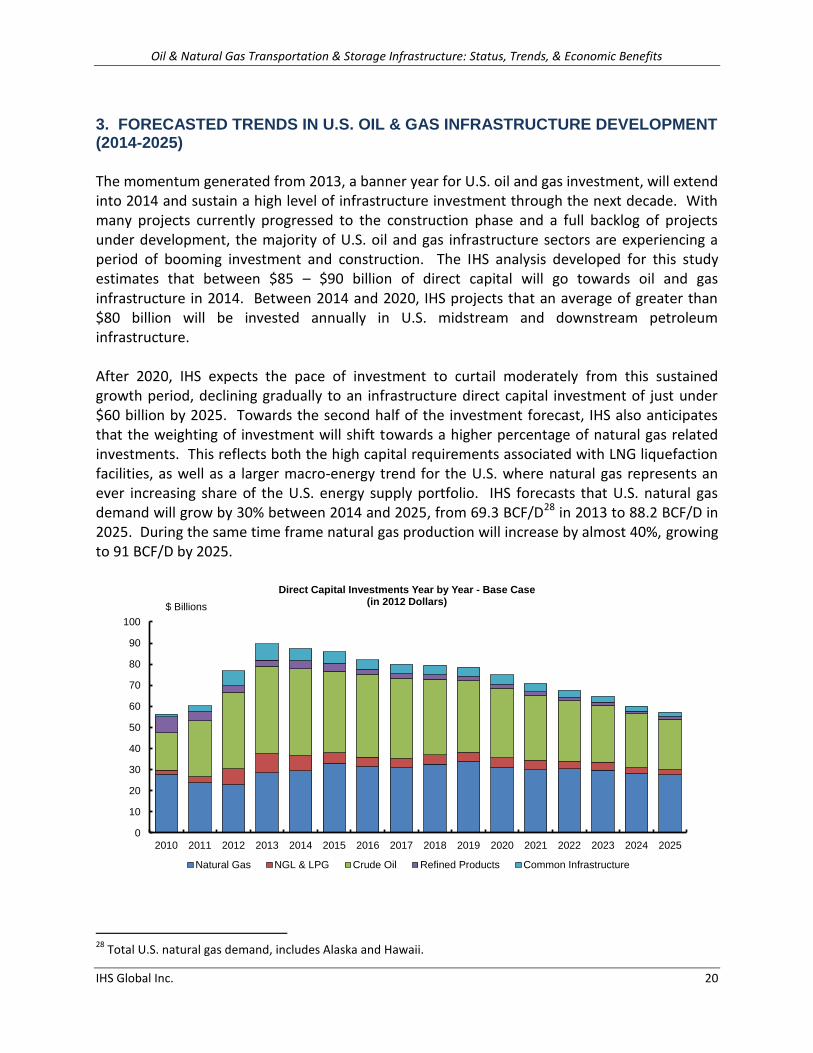
The momentum generated from 2013, a banner year for U.S. oil and gas investment, will extend into 2014 and sustain a high level of infrastructure investment through the next decade. With many projects currently progressed to the construction phase and a full backlog of projects under development, the majority of U.S. oil and gas infrastructure sectors are experiencing a period of booming investment and construction. The IHS analysis developed for this study estimates that between $85 – $90 billion of direct capital will go towards oil and gas infrastructure in 2014. Between 2014 and 2020, IHS projects that an average of greater than $80 billion will be invested annually in U.S. midstream and downstream petroleum infrastructure. After 2020, IHS expects the pace of investment to curtail moderately from this sustained growth period, declining gradually to an infrastructure direct capital investment of just under $60 billion by 2025. Towards the second half of the investment forecast, IHS also anticipates that the weighting of investment will shift towards a higher percentage of natural gas related investments. This reflects both the high capital requirements associated with LNG liquefaction facilities, as well as a larger macro-energy trend for the U.S. where natural gas represents an ever increasing share of the U.S. energy supply portfolio. IHS forecasts that U.S. natural gas demand will grow by 30% between 2014 and 2025, from 69.3 BCF/D28 in 2013 to 88.2 BCF/D in 2025. During the same time frame natural gas production will increase by almost 40%, growing to 91 BCF/D by 2025.
28
Total U.S. natural gas demand, includes Alaska and Hawaii.
0
10
20
30
40
50
60
70
80
90
100
2010 2011 2012 2013 2014 2015 2016 2017 2018 2019 2020 2021 2022 2023 2024 2025
Direct Capital Investments Year by Year - Base Case(in 2012 Dollars)
Natural Gas NGL & LPG Crude Oil Refined Products Common Infrastructure
$ Billions

Oil & Natural Gas Transportation & Storage Infrastructure: Status, Trends, & Economic Benefits
IHS Global Inc. 21
Direct Capital Investment Assessment Methodology For the assessment on U.S. direct capital investment in oil and gas transportation and storage infrastructure over the next 12 years, IHS has applied a methodology based on a zero based build-up of announced, planned, and probable projects calibrated against the need for infrastructure in a given industry sector using IHS base case production forecasts. These methods are identical to those used to develop the assessment of recent investment in U.S. oil and gas infrastructure (Section 2). IHS constructed a project-by-project database for each hydrocarbon value chain and asset segment. Data for individual projects were sourced from the public domain based on details provided in individual company 10-K statements, investor presentations, press releases, regulatory filings, permit applications, and other publicly available sources. An assessment was then made on whether the project is probable or speculative with all probable projects assumed to proceed through construction and placed into service. The IHS methodology used for this assessment acknowledges that not all projects classified as “probable” will ultimately be funded and constructed. However, based on the given need for specific asset classes of infrastructure, IHS concludes that there is sufficient probability to reasonably assume that a given project will be constructed or potentially be replaced with a similar project attempting to satisfy the identified market need. Entities that are developing oil and gas infrastructure projects which are private, who do not provide public data, are not included in this assessment. However, this investment total is expected to be relatively small, as few private entities possess the capital resources to develop large scale oil and gas infrastructure projects. In cases where budgets are provided for a given project, IHS typically incorporated the company provided figure but includes a planning level contingency to cover cost escalation, inflation, and uncertainty. For announced and probable infrastructure projects where capital budgets are not provided, IHS applies an in-house proprietary screening level capital estimation method, based on comparable projects of a given asset class and location, to provide a screening level estimate of investment. The capital investment for each project is distributed over a typical project development and construction cycle, with adjustments made based on project size and complexity. Projects with a high degree of complexity, highly engineered components such as high horsepower turbo machinery, or large regulatory or permitting burdens were assumed to have a 4-6 year development schedule. LNG liquefaction or long distance oil and gas transmission pipelines are typical projects with these extended development cycles. Smaller projects, where the engineering is largely off-the shelf and many of the components can be pre-fabricated or modularized, were assumed to have a shorter development cycle, typically on the order of 2-3 years. Oil and gas gathering systems and gas processing facilities are examples of projects that normally fall under this shortened development cycle. The individual projects are then aggregated to provide a total investment and capacity being added per asset class with a distribution of the investment over the set forecast horizon. The next step in the assessment process is a comparison of the announced capacity being added in a given asset class against the expected need for a certain type of asset based on projected peak production and the location of that production. IHS annually develops a detailed outlook for production and demand across all of the hydrocarbon value chains. Details

Oil & Natural Gas Transportation & Storage Infrastructure: Status, Trends, & Economic Benefits
IHS Global Inc. 22
are provided at a granular level including the hydrocarbon mix of that production (crude oil versus NGL’s versus gas) and the development of which locations or basins will result in that production. This level of specificity is necessary for IHS to evaluate the incremental infrastructure need, above what already exists, for a given formation or field. For example, if IHS forecasts that natural gas production is expected to increase by 24.4 million BCF/D29 by 2025, then IHS can reasonably assert that a minimum of 31 BCF/D30 of gas processing capacity needs to be installed to adequately manage and condition this anticipated increase in natural gas production. Based on announced projects under development with details in the public domain, IHS has determined that there is currently 10 BCF/D of gas processing capacity scheduled for construction between 2014 and 2016. Using the IHS production forecast, it is then calculated that a minimum of 20 BCF/D of unannounced projects remain to be developed between 2017 and 2025. It is assumed that these projects are in the nascent stage of development and insufficient clarity about the specific nature of the projects exists for the development company to begin providing public details. For this assessment, IHS will then add sufficient undefined placeholder projects to ensure that sufficient gas processing capacity is added between 2017 and 2025, to match the expected increase in production. However, in reality additional gas processing capacity is required to be added above the bare minimum, as additional capacity should be added both to cover the expected growth in production-demand and to offset natural production declines for existing mature fields, potentially located in geographically unrelated regions of the country. Using this method, IHS conservatively assumes that 25 BCF/D of unannounced but probable projects are likely to be developed for the gas processing asset class between 2017 and 2025. These methods are then applied across the 20 asset classes of oil and gas infrastructure which IHS has identified, making asset class specific adjustments based on the projected production growth and the incremental need for additional oil and gas infrastructure. The production and demand forecasts for natural gas, natural gas liquids, and crude oil become a key input in assessing the cumulative investment in U.S. oil and gas infrastructure using the IHS methodology. Given the inherent uncertainty of any forecast and that the annual update of IHS forecasts typically occurs during the May/April timeframe31 an alternate scenario (to the base case) was also developed. This alternate case is labeled as the “high production” case and evaluates the direct capital investment forecast for an alternate scenario with a notional 20 percent increase in production. This could be associated with expanded access to current off limit areas in Atlantic, Eastern GOM, Pacific and Alaska.32 For both natural gas and natural gas liquids, this 20% increase is a top line increase by the end of the forecast period, i.e. production
29
Increase in production from 66.6 BCF/D in 2013 to 91.0 BCF/D in 2025. 30
The gas processing capacity added is quoted in terms of rich gas or inlet gas capacity; with the extraction of NGL’s the remaining dry gas is a smaller volume than the inlet rich gas. This is known as shrinkage. To produce a given volume of dry gas typically the inlet gas is 25% higher than the expected product dry gas, although this varies greatly depending on gas composition. 31
The IHS production forecast used for this analysis is dated by 7 months. 32
Source: IHS Downstream Energy Expanded Production Case, April 2013. The IHS Downstream Energy Practice utilizes a 20 percent increase for all high production scenarios.

Oil & Natural Gas Transportation & Storage Infrastructure: Status, Trends, & Economic Benefits
IHS Global Inc. 23
in 2025 is 20% higher than in the base case. For crude oil, a slightly different high production case was evaluated, one in which total production (total barrels produced) is 20% higher than in the base production case. This is due to an expected peak production of crude oil being reached around 2020 followed by a production plateau, and gradual decline in both the base and high production case. No anticipation of peak production is expected for either natural gas or natural gas liquids over the forecast. For this analysis, IHS has not performed an in depth analysis of the specific sequence of events that would transition the base production case into the high production case. However, like similar alternate scenarios, this high production case would evolve over time and be caused by a multitude of factors such as increased production recovery rates, increased drilling efficiency, an overall lowering of drilling costs, or an opening of access to geographic regions that have previously been unavailable for exploration and production33. Additionally, as has historically been the case, a key driver in determining the development level of oil and gas resources is the absolute or benchmark global pricing for either natural gas or crude oil. A period of elevated prices, above those experienced during the past two years, caused by either a supply demand imbalance or a set of geopolitical externalities, would provide additional financial incentive for resource development or push currently non-economic plays to become economically feasible. The development and results from a high production case are particularly relevant in that the growth in U.S. oil and gas production since the recession has been so rapid, that in many cases the high case forecasts, developed by both the IEA, EIA, and industry consultants are regularly being adopted as the base case only several months after forecasts are released. The IHS U.S. crude oil production forecast for 2013 of 7.2 million B/D, developed in February and March 2013, already appears dated in lieu of recently released EIA production data showing September production of 7.8 million B/D and expected October production of 8.0 million B/D. Full year 2013 U.S. crude oil production is now projected at 7.5 million B/D, a full 300,000 B/D higher than projections from one year ago. The rapid growth in U.S. oil and gas production turns the high production case into not just an academic exercise but a credible alternative providing a snapshot of growth and investment upside potential.
33
This could occur on either public or private land.

Oil & Natural Gas Transportation & Storage Infrastructure: Status, Trends, & Economic Benefits
IHS Global Inc. 24
Direct Capital Investment Forecast Base Case Results The evaluation of the base case direct capital investment result is the cumulative investment forecast from 2014–2025 of $890 billion in oil and gas transportation and storage infrastructure. Performing a deeper analysis of the results yields several important conclusions that can be drawn on infrastructure investment trends and specific target asset segments. Crude oil and natural gas gathering and support facilities represent the largest investment asset segment through the forecast period with just under 60% or $526 billion in direct capital investment projected. The investment trend in gathering systems and support facilities has a strong correlation to overall drilling activity and is expected to ebb and flow with the pace of well completions. Slight adjustments have been applied to account for more mature production areas such as the Permian Basin of West Texas, which requires less new investment in gathering facilities due to the longevity of the region and the number of assets that can be repurposed for increasing production. New development areas such the Bakken and Eagle Ford production regions will require extensive investments in gathering and support facilities as both regions have not been historic production regions and are starting from a point of low existing infrastructure. Even some new and emerging shale producing regions such as the Mississippi Lime or SCOOP34 region, although undeveloped, will require less investment in gathering and support facilities than for example the Bakken formation because it has been an historic producing region and already has a relatively large base of major infrastructure assets. This is due to its proximity half way between the Permian Basin and the oil storage hub of Cushing, Oklahoma. The period of 2012 -2015 has and will witness a period of reduced capital investment in natural gas gathering systems, as rigs and completions have focused on liquid rich and crude oil plays. Average investment over this period of reduced activity is expected to average less than $10 billion annually. As natural gas demand recovers and grows in response to reduced prices, IHS forecasts that natural gas prices will recover, which will in turn prompt a shift back towards gas
34
South Central Oklahoma Oil Province.
0
2,000
4,000
6,000
8,000
10,000
12,000
2010 2015 2020 2025
Comparison of IHS Base & High Production Case(Crude Oil and NGL's)
U.S. Crude Oil Production (Base Case) U.S. Crude Oil Production (High Case)
U.S. NGL Production (Base Case) U.S. NGL Production (High Case)
Thousands of Barrels Per day

Oil & Natural Gas Transportation & Storage Infrastructure: Status, Trends, & Economic Benefits
IHS Global Inc. 25
based drilling. This natural gas demand recovery will be further supported by the step change increase in demand from new sources such as natural gas liquefaction and the use of natural gas as a transportation fuel in long distance trucking. From 2019 – 2025 natural gas oriented gathering and support facilities are projected to average over $16 billion annually of direct capital investments. Driven by the value added economics of NGL extraction, the period of extensive growth that began in 2012 will extend through 2019, with an average of $4 billion in annual gas processing investment from the period of 2014 – 2019.
The past 2 years have seen a proliferation of new gas processing additions. Once these under construction facilities are commissioned, there could be a period of relatively low utilization for these new plants. Many gas processing plants are being designed and constructed with excess capacity, resulting in ample processing capacity on the ground when supply responds to the recovery in natural gas demand anticipated in the 2015 – 2016 time frame. During the forecast period IHS estimates that approximately 30 BCF/D of gas processing capacity will be added, above the 8.5 billion BCF/D slated for completion in 2013 and 2014. Similar to natural gas gathering investments, the period 2013 – 2015 is projected as a period of muted investment in natural gas pipelines and natural gas underground storage. With the recovery in natural gas pricing, both of these asset classes are projected to a see a recovery in their investment profiles with natural gas pipelines and storage facilities averaging just under $10 billion annually after 2018. The asset class at the forefront of natural gas growth recovery and development will be natural gas liquefaction facilities, which other than a small facility located in Kenai, Alaska have no history of development in the U.S. The unconventional oil and gas revolution has led many
Natural Gas$3.86 Natural Gas
$3.16
Rich Gas Increment
$1.74
Ethane$0.80
Propane$0.94
Iso-Butane$0.68
Normal Butane$0.62
Natural Gasoline$0.70
$0.00
$1.00
$2.00
$3.00
$4.00
$5.00
$6.00
$7.00
Natural Gas Only(2015 Price Forecast)
NGLs and Residue Gas(2015 Price Forecast)
Natural Gas Liquid Value Addition: 2015 Price Basis
$5.60 / MCF
$6.90 / MCF
$ per thousand cubic feet (MCF)
Assumes 30% Shrinkage for NGLs
Extracted
Source: IHS

Oil & Natural Gas Transportation & Storage Infrastructure: Status, Trends, & Economic Benefits
IHS Global Inc. 26
investors to actively pursue LNG export projects. IHS assumes that several of the LNG export projects now under development are likely to be completed. The expected total investment for these natural gas liquefaction projects over the 12-year forecast period will be $45.1 billion, based on the assumption of $550 - 850 per metric ton of annual capacity, depending on brownfield versus greenfield development. As of November 2013, there were 25 LNG export projects – representing a total of 56 individual LNG production trains – under development in the US, 23 of which are located in the US lower 48 and 2 in Alaska. If all of these proposed projects were to progress through permitting, funding, construction, and start-up, they would increase US natural gas liquefaction capacity to over 32 billion cubic feet per day, which represents 35% of the projected US natural gas demand in 2025. The IHS forecast for US LNG development takes a conservative approach, assuming that a total of 6 projects will become operational. These 6 projects represent 12 individual liquefaction trains with a total capacity of 7.3 BCF per day. Based on natural gas producing regions and existing infrastructure, these LNG facilities are likely to be located in the US Gulf Coast and involve the retrofitting of existing LNG import terminals into dual purpose import-export facilities. The approach of adding liquefaction trains to existing import terminals is a preferred strategy by developers as it reduces total project investment cost by reusing existing LNG storage tanks and marine facilities. The conservatism in the IHS forecast is based on significant development challenges still facing many LNG projects, including export license approval, environmental impact reviews, local and state regulatory approval, capital availability, cost escalation, competition from other global LNG developments (in areas such as Australia, East Africa, and British Columbia), costs, and standard construction and engineering challenges associated with projects of this scale. Successful execution of the LNG projects at the head of the export license approval queue could allow the industry to exceed the 6 projects that IHS forecasts to be completed. However, many key development checkpoints have yet to be crossed. An alternate use of LNG that could potentially emerge over the coming decade is the use of LNG as an alternative to marine fuel oil for bunkering purposes. This investment in marine tankers and cargo ships with capability to consume LNG as fuel will be driven both by the economics of bountiful natural gas and by benefits associated with reduced sulfur oxide and other criteria pollutants. For ships that operate between the U.S. mainland, Alaska, Hawaii, and Puerto Rico these are likely to be constructed in U.S. Jones Act shipyards. Allowance in this IHS analysis has been made for this type of investment, although this type of investment is relatively small compared to typical oil and gas infrastructure investments. The fractionation of NGL’s into individual components such as ethane, propane, butane, and iso-butane is another asset segment that has experienced large growth investment in 2012 and 2013, and is projected to continue over the next couple of years. Two NGL fractionator hubs in particular are experiencing tremendous growth in NGL fractionation capacity. The long

Oil & Natural Gas Transportation & Storage Infrastructure: Status, Trends, & Economic Benefits
IHS Global Inc. 27
established fractionation hub of Mont Belvieu, Texas currently has 8 major expansion projects under development with completion slated for the 2013 – 2015 time frame and an expected capacity addition of almost 700,000 B/D of fractionation capacity. The second major area is an emerging hub located at the intersection of the Pennsylvania, Ohio, and West Virginia borders located in the heart of the Marcellus and Utica shale development. Notionally identified as the Houston, Pennsylvania hub this is actually a complex of some 16 de-ethanizer and de-propanizer plants which will likely grow to an interconnecting network of 25 individual facilities involved in the fractionation of NGL’s. Smaller debottlenecks are under way at the traditional fractionation hubs of Conway, Kansas and Geismar, Louisiana. The second major piece of NGL infrastructure development is the long distance, typically interstate, transmission lines connecting the gas processing facilities to the NGL fractionation hubs. These long distance pipelines are usually common carrier systems which aggregate the NGL extraction from dozens of individual gas processing plants. Several large projects are currently under construction linking the gas processing facilities of Western Pennsylvania and Ohio to both the Gulf Coast and marine terminals along the Delaware River. Additional corridors are being expanded or established between West Texas and East Texas picking up NGL production from Eagle Ford along the way and between gas processing in the Rocky Mountains and the U.S. Gulf Coast. As additional natural gas is recovered from the Bakken, production investment in NGL development will be made there as well. Total investment in NGL pipelines over the forecast period is projected at $23.9 billion.
North America NGL Pipeline Infrastructure – 2013

Oil & Natural Gas Transportation & Storage Infrastructure: Status, Trends, & Economic Benefits
IHS Global Inc. 28
An area of infrastructure investment that is NGL specific is the construction of multiple dedicated NGL export terminals located in either the Gulf Coast or along the Delaware River in Pennsylvania. The growth in NGL fractionation capacity is projected to far outpace the growth in NGL demand. The majority of U.S. NGL demand is as petrochemical feedstock. Several large petrochemical steam crackers have been proposed and are currently under development but are likely to not be completed until the end of the decade. In the interim, the U.S. will emerge as a large exporter of NGL’s, primarily ethane and propane, through purpose built NGL marine terminals. The IHS analysis assumes that as many as 10 of these facilities could ultimately be constructed at a project investment of $4 billion over the forecast period. Starting in 2012 and continuing through 2018, crude oil pipelines are receiving a large infusion and major build-out of both larger interstate systems and smaller intrastate systems. The IHS analysis projects that over 18,000 miles of major crude oil pipelines will be constructed, expanded, reversed, or converted from natural gas or other pipeline service. The trend in crude oil pipeline development will be the continued development of a large central transportation corridor running from North to South through the Midcontinent region. Smaller systems will connect geographically peripheral regions such as the Bakken development to this large central transportation corridor. A second major corridor will be operated as a continuous line of several different systems running horizontally from West Texas to refineries in the Texas and Louisiana Gulf Coast, with production from Eagle Ford on ramping to this Texas longitudinal corridor.
© 2012, IHS Inc. No portion of this presentation may be reproduced, reused, or otherwise distributed in any form without prior written consent.
Expected North American Major Crude Oil Pipelines (2020)
Edmonton
Chicago
Houston
Area
Denver
Cushing
Montreal
Hardisty
Vancouver
Anacortes
GuernseyWood River
KM Trans
Mountain
(Expansion)
Spectra
ExpressBridger
& Butte
Enbridge
LakeheadEnbridge
No. 9 Line
KM
Platte
Jayhawk
Centurion
& Basin
Shell
Ho-Ho
& West-Ho
Enbridge
Southern
Access
Sarnia
Keystone
Enbridge
Enbridge
Alberta
Clipper
KM
2 Lines
Enbridge
Sandpiper
Flanagan
South
Corpus Christi
Longhorn,
BridgeTex,
& Permian
Express
Enbridge
Mainline
Pony
Express
Eastern
Energy
XL
Kitamat
Trunkline
Conversion
(High Production)
KM Freedom
(High Production)
& XOM
Lima
Saint James
MidlandLongview &
CorsicanaSeaway
& Twin
Capline
Gulf Coast
Patoka
BP &
Spearhead
Mid-Valley
Enbridge
Ozark
Marathon
Pegasus
Koch, PAA,
Double Eagle, & KM
Northern
Gateway
- Oil Sands
- Bakken
- Niobrara
- Greater Mississippian
- Permian Basin
- Eagle Ford
- Utica
- Monteny / Cardium
Clearbrook
Superior
Southern
Lights
(Diluent)
Cochin
(Diluent)
Saint
Johns

Oil & Natural Gas Transportation & Storage Infrastructure: Status, Trends, & Economic Benefits
IHS Global Inc. 29
IHS forecasts cumulative investment in U.S. crude oil pipelines of $37.8 billion between 2014 and 2025, with the majority being invested during the first 6 years of the forecast period. Over the first half of the investment period annual average investment is expected to exceed $5 billion. A significant theme that has emerged during the shale crude oil growth era has been the reemergence of using rail as a logistical alternative to long distance pipeline movements. The rapid growth in crude-by-rail movements is reflective of both the rapid growth in production but also the longer development schedule associated with long distance pipeline systems. Rail has stepped in to provide a key interim logistics solution as pipeline construction progresses. 2013 represents a milestone year for investment in crude dedicated rail cars and both crude loading and unloading facilities, with total investment of $3.6 billion. This will likely represent the peak investment year for dedicated crude-by-rail infrastructure. Although 2014 is still forecasted at over $2.4 billion of direct capital investment, remaining investment over the forecast period will average approximately $600 million annually. This curtailed investment in dedicated crude by rail facilities is a function of the over-build from 2012 – 2014 and the lower need for rail once pipeline infrastructure is sufficiently developed. By the end of 2014 crude oil loading and unloading capacity in the US will exceed 3 million B/D despite a forecast of peak crude oil rail movements of between 1.2 and 1.5 million B/D. Additionally, the construction backlog for new dedicated crude oil tank cars has reached a sufficient enough level that the placement of new orders has curtailed substantially in the past 6 months.
The segment of the industry that will receive the lower proportional direct capital investment associated with the growth of unconventional oil and gas will be the U.S. refining system. Total investment in all refined product asset groups (refineries, pipelines, logistics, and storage) is

Oil & Natural Gas Transportation & Storage Infrastructure: Status, Trends, & Economic Benefits
IHS Global Inc. 30
forecasted at just over $25 billion between 2014 and 2015, with 75% of this investment directed toward refineries. The major cause-and-effect investment from the growth in shale crude oil production will be US refineries in the Midwest and Gulf Coast debottlenecking their facilities, to enable the flexibility to process increasing volumes of light sweet crude oil, the quality of crude produced from shale formations. Major fuels refineries in the U.S. Gulf Coast and Midwest have invested heavily over the past 20 years to process increasing volumes of heavy sour crude oil from regions such as Canada, Venezuela, and Mexico. The conventional wisdom of the time was that these investments would be necessary to stay long-term competitive and that global crude oil production growth would largely be of the heavy sour variant. In another ironic twist produced from the unconventional era, those same facilities have shifted their investment strategy 180 degrees and are now investing capital to increase capacity to process the top or light portion of the barrel. The scale of investment required to process the top of the crude oil barrel is an order of magnitude smaller than the investment necessary to process the bottom of the barrel. Numerous investments are under development to add simple atmospheric fractionation, light ends (essentially NGL) handling, and hydro-treating capacity for light liquids fractions. In addition to the investment refineries are making to process increasing volumes of unconventional crude oil, many billions of capital investment will be allocated to projects that allow refiners to produce Tier III compliant gasoline, lower sulfur distillate and heavier fuel oils, reduce criteria emissions, and even potentially reduce carbon dioxide greenhouse gas emissions from stationary point sources. As these investments are driven by regulatory initiatives independent of the increased production of U.S. crude oil, they have not been included in the refinery capital investment forecast developed for this analysis. Outside of the additional investment in road, class 1 rail lines, and marine port dredging, two main asset types are expected to receive investment in the common infrastructure category. The first is investment in new greenfield mines for the extraction and production of silica and sand with properties determined to be beneficial for use in hydraulic fracturing. The second and more important development is the establishment of at least one, but likely several, LNG and CNG trucking corridors. IHS anticipates that these shipping corridors will receive primarily private capital investment, with public support coming in the form of fiscal and tax incentives associated with dual fuel heavy duty vehicles that can consume both diesel fuel and either CNG or LNG. In that 65% of U.S. diesel fuel consumption is for long distance heavy duty trucking35, the establishment of continental shipping corridors would have a material impact on both petroleum diesel and natural gas demand, but could also provide a significant logistics and economic advantage for the U.S., not experienced by non-North American countries. Investment in common infrastructure to support oil and gas development is forecast at just under $50 billion over the forecast period.
35
DOT Class I Vehicles.

Oil & Natural Gas Transportation & Storage Infrastructure: Status, Trends, & Economic Benefits
IHS Global Inc. 31
Direct Capital Investment Forecast High Case Results As detailed earlier in Section 3, the high production case provides an assessment of the additional direct capital investment associated with a notional 20 percent increase in natural gas, NGL, and crude oil production. The results from the high production assessment lead to an increase of direct capital investment from $890 billion for the base case forecast to an investment of $1.15 trillion or an increase of 29% over the period of 2014 – 2025. For the high investment case oil and gas transportation and storage infrastructure peaks at $105 billion in 2019, before declining moderately to just over $80 billion in 2025.
The shift in investment should be characterized by one of three trends: asset classes where the increase in investment grows proportionally to production, asset classes where the increase in production results in a disproportionate increase in investment, and asset classes where the growth in production has no impact on investment. The results of the high case analysis can be summarized as follows:
0
200
400
600
800
1,000
1,200
1,400
2010 2011 2012 2013 2014 2015 2016 2017 2018 2019 2020 2021 2022 2023 2024 2025
Base Case Direct Capital Investments Cumulative(in 2012 Dollars)
Natural Gas NGL & LPG Crude Oil Refined Products Common Infrastructure
$ Billions
0
20
40
60
80
100
120
2010 2011 2012 2013 2014 2015 2016 2017 2018 2019 2020 2021 2022 2023 2024 2025
Direct Capital Investments Year by Year - High Production Case(in 2012 Dollars)
Natural Gas NGL & LPG Crude Oil Refined Products Common Infrastructure
$ Billions

Oil & Natural Gas Transportation & Storage Infrastructure: Status, Trends, & Economic Benefits
IHS Global Inc. 32
Asset classes that result in no or de minimus investment in the high production case are all of the refining asset classes and the investments directly associated with rail logistics movements. This is largely due to additional production in crude oil backing-out additional imports but not requiring an increase in U.S. refining capacity. Furthermore, the overbuild in crude oil rail logistics is sufficient enough that even a 20% increase in production would increase utilization of existing facilities but not require any new facilities.
Asset classes that result in proportional investment based on the high production case include the gathering and support facilities for both natural gas and crude oil wells, pipelines, the assets directly associated with NGL production, and common infrastructure. The base case analysis projects that a moderate overbuild of NGL processing and transportation capacity is occurring. As a result, only an average of a 15% increase in direct capital investment is required for a 20% increase in production.
Crude oil pipelines will require a slightly higher than proportional investment in infrastructure in the event of a 20% increase in production. This assessment is based on the assumption that in the high production case a second major North-South corridor would need to be developed, notionally running from the Midwest to the Louisiana Gulf Coast. In addition, in the high production case a major horizontally oriented pipeline project would be justifiable to move increased production to either Coast. In this analysis, this is assumed to be an investment similar to the proposed Kinder Morgan Freedom pipeline, running from production in West Texas to refineries in Southern California.
Asset classes that would result in a disproportionate increase in investment associated with a production increase of 20% include natural gas processing, natural gas storage, LNG processing, and dedicated crude oil marine vessels.
In the base case a large increase in both natural gas storage and natural gas processing has occurred over the past 5 years, and as such the investment needed over the next decade is reduced as surplus capacity exists to absorb anticipated increases. The projected increase associated with the high production case would overtake the surplus production of the base case and trigger another period of high investment and rapid expansion, hence the 20 percent increase in production resulting in a 60 plus percent increase in direct capital investment.
Similarly for LNG processing, with such a large increase in production it is unlikely that supply side capacity could react swiftly enough to absorb the swell in production. LNG liquefaction facilities would prove critical in alleviating demand constraints and providing a shock absorber to moderate short term differences between supply and demand growth. In the high production case the expected volume of LNG exports from the U.S. increases by 100 percent, notionally from 5 BCF/D to 10 BCF/D.
Although smaller in absolute terms, the high production case would result in a disproportionate increase in investment in marine inland barges, ocean going barges, and marine tankers as a third logistics option in the movement of crude oil. Again, in absolute terms this is a relatively small asset class.

Oil & Natural Gas Transportation & Storage Infrastructure: Status, Trends, & Economic Benefits
IHS Global Inc. 33
BASE CASE HIGH CASE
Tab Number
Petroleum Infrastructure
Investment
Direct Capital
Investment ($MM)
Direct Capital
Investment ($MM)
Percent
Change
1 Natural Gas Gathering 177,705 215,490 21%
2 Gas Processing 32,327 60,992 89%
3 Natural Gas Pipelines 84,060 101,610 21%
4 Natural Gas Storage 23,784 37,869 59%
5 LNG Processing 41,913 68,909 64%
6 LNG Marine 9,092 12,342 36%
7 NGL & LPG Processing 14,781 17,024 15%
8 NGL & LPG Piplines 21,058 23,866 13%
9 NGL & LPG Storage & Rail 12,412 13,909 12%
10 NGL & LPG Marine 3,002 3,973 32%
11 Crude Oil Gathering 348,447 448,393 29%
12 Crude Oil Pipelines 27,393 37,848 38%
13 Crude Oil Storage 4,071 6,062 49%
14 Crude Oil Marine 6,657 11,519 73%
15 Crude Oil Rail 9,267 9,267 0%
16 Refineries 19,113 19,113 0%
17 Refined Product Pipelines 2,000 2,000 0%
18 Refined Product Storage 2,063 2,063 0%
19 Refined Product Marine 1,935 1,935 0%
20 Roads & Common Infrastructure 48,030 51,496 7%
Total DCI ($MM) 889,110 1,145,681 29%
Summary of Direct Capital Investment (2014 - 2025)

Oil & Natural Gas Transportation & Storage Infrastructure: Status, Trends, & Economic Benefits
IHS Global Inc. 34
4. ECONOMIC IMPACT ASSESSMENT OF INFRASTRUCTURE INVESTMENT
IHS assessed the economic contributions attributable to increased investments in oil and natural gas transportation and storage infrastructure under both the base case and high production scenarios. The objective was to fully capture the influence of each scenario’s infrastructure investment on the US economy and the four US Census Regions through direct spending, supply-chain activity and the effects of workers’ spending portions of their incomes in the general economy. To capture these effects, the capital expenditure analyses forecasts presented in Section 3 were integrated into our modeling system. IHS anticipates that, under the base case scenario, the infrastructure investment will lead to an average annual economic contribution over the 2014 to 2025 period of:
Support for almost 900,000 jobs;
Contribution to US GDP of $94 billion;
Labor Income of $59 billion;
Government Revenues in excess of $21 billion. Under the high production scenario these contributions will increase to:
Support for almost 1,147,000 jobs;
Contribution to US GDP of $120 billion;
Labor Income of $75 billion;
Government Revenues in excess of $27 billion. The economic impact results, focusing on employment, are also presented in this section. The complete set of average annual economic impact results by US Census Region, as measured by jobs, value added contribution to GDP, labor income and government revenues are presented in Appendix B1 for both the base case and high production case. Jobs, value added (contribution to GDP) and labor income are broken out by two direct investment strategy categorizations (target energy type and transport mode), by industry super-sector and by direct, indirect and induced economic contribution (as defined below). Federal and State & Local taxes, broken out by personal and corporate taxes, are reported by US Census Region and by the target energy type and transport mode investment strategies. Appendix B2 expands the reported results to the nine US Census Divisions, by each of the investment strategies by industry super-sector and direct/indirect/induced economic contribution. Results are presented for both the base case and high production case.

Oil & Natural Gas Transportation & Storage Infrastructure: Status, Trends, & Economic Benefits
IHS Global Inc. 35
Defining the Economic Contribution
Referring to the graphic above, the steps used to derive the economic contribution of any industry can be summarized as follows:
Any dollar of industrial expenditure, in this case capital investment, results in direct benefits to the economy (dark blue box).
The capital investment triggers activity within the supply chain (medium blue box). An increase in direct capital investment, with all else constant, will lead to more revenue and output among supplier industries, such as steel, machinery and engineering services. This will lead to higher US demand for manufactured products such as pumps and compressors, which in turn require more fabricated metal and steel, and so on, thereby magnifying the indirect contribution. Thus, the initial direct capital investment triggers numerous indirect reverberations within the extended supply chain.
To meet the increased demand, suppliers will also need to hire and compensate workers (green box). These workers then spend a portion of their income on consumer goods and services (light blue box), inducing another round of economic contribution.
Finally, the changes in direct, indirect and induced activity can lead to other economic ramifications (gray box), including, but not limited to, policy issues, regulatory concerns and trade imbalances.
For this study, IHS traced the subsequent changes in demand caused by the direct capital investment on the US national and US census division level. The direct, indirect and induced impacts were assessed along the following four dimensions.
Employment includes wage, salary and self-employment jobs within the economy.
Value Added (contribution to GDP) is an industry’s or an establishment’s total output less the cost of intermediate inputs.

Oil & Natural Gas Transportation & Storage Infrastructure: Status, Trends, & Economic Benefits
IHS Global Inc. 36
Labor Income captures all forms of employment income, including Employee Compensation (wages and benefits, employer-paid payroll taxes, unemployment taxes, etc.) and Proprietor Income (payments received by self-employed individuals and unincorporated business owners).
Government Revenue includes taxes and other related revenues on Federal, and state and local levels.
Underlying Assumptions IHS Energy researched the capital requirements necessary to support the overall transportation and storage infrastructure investment needed to support the growth in natural gas and oil production. The midstream elements consist of natural gas, natural gas liquids (NGL), and oil gathering systems, pipelines and storage, while the downstream elements include natural gas processing plants, liquefied petroleum gas (LPG) and NGL processing, and refineries. In addition, capital requirements for common infrastructure elements, such as roads and rail, were determined. Detailed capital requirements were forecast for the following 20 asset classes:
IHS assessed the economic contribution of each asset class. The results were then consolidated using two different aggregation schemes. The first scheme consolidated the results based on the target energy type supported by the investment (Natural Gas, NGLs and LPG, Oil and Condensate, Refineries and Refined Products and Common Infrastructure). The second aggregation grouped the results based on transport mode (Pipelines, Processing and Storage, Rail, Marine, and Common Infrastructure, Excluding Rail). The following graphic shows how the asset classes were mapped to the two aggregations.
1. Natural Gas Gathering 2. Gas Processing 3. Natural Gas Pipelines 4. Natural Gas Storage 5. LNG Processing 6. LNG Marine 7. NGL & LPG Processing 8. NGL & LPG Pipelines 9. NGL & LPG Storage & Rail 10. NGL & LPG Marine
11. Crude Oil Gathering 12. Crude Oil Pipelines 13. Crude Oil Storage 14. Crude Oil Marine 15. Crude Oil Rail 16. Refineries 17. Refined Product Pipelines 18. Refined Product Storage 19. Refined Product Marine 20. Common Infrastructure

Oil & Natural Gas Transportation & Storage Infrastructure: Status, Trends, & Economic Benefits
IHS Global Inc. 37
Mapping of Asset Classes to Aggregation Schemes36
The following pages show the forecast annual transportation and storage infrastructure investment for the two aggregations under both the base case and high production scenarios. Under the Energy Type aggregation, investment in infrastructure dedicated to Natural Gas, Oil and Condensate dominate the spending over the entire forecast period. Likewise, under the Transport Mode aggregation, investment in pipelines receives the bulk of the investment, followed closely by processing and storage.
36
IHS determined that approximately 18% of Asset Class #2 direct investment and 45% of Asset Class #20 direct investment are dedicated to Rail projects. Therefore, these Asset Classes were proportioned accordingly when creating the Transport Mode aggregation.
Asset Class Target Energy Type
1_Natural Gas Gathering
2_Gas Processing
3_Natural Gas Pipelines
4_Natural Gas Storage
5_LNG Processing
6_LNG Marine
7_NGL & LPG Processing
8_NGL & LPG Pipelines
9_NGL & LPG Storage & Rail
10_NGL & LPG Marine
11_Crude Oil Gathering
12_Crude Oil Pipelines
13_Crude Oil Storage
14_Crude Oil Marine
15_Crude Oil Rail
16_Refineries
17_Refined Product Pipelines
18_Refined Product Storage
19_Refined Product Marine
20_Common Infrastructure Common Infrastructure
Natural Gas
Refineries & RP
Oil and Condensate
NGL & LPG
Asset Class Transport Mode
1_Natural Gas Gathering
3_Natural Gas Pipelines
8_NGL & LPG Pipelines
11_Crude Oil Gathering
12_Crude Oil Pipelines
17_Refined Product Pipelines
9_NGL & LPG Storage & Rail (18%)
15_Crude Oil Rail
20_Common Infrastructure (45%)
6_LNG Marine
10_NGL & LPG Marine
14_Crude Oil Marine
19_Refined Product Marine
2_Gas Processing
4_Natural Gas Storage
5_LNG Processing
7_NGL & LPG Processing
9_NGL & LPG Storage & Rail (82%)
13_Crude Oil Storage
16_Refineries
18_Refined Product Storage
20_Common Infrastructure (55%) Common Infra., Exc. Rail
Pipelines
Rail
Marine
Processing and
Storage

Oil & Natural Gas Transportation & Storage Infrastructure: Status, Trends, & Economic Benefits
IHS Global Inc. 38
Capital Investment by Target Energy Class – Base Case
(average annual investment = $73.8 billion)
Source: IHS 2013
Capital Investment by Transport Mode – Base Case (average annual investment = $73.8 billion)
Source: IHS 2013
0
10
20
30
40
50
60
70
80
90
100
2014 '16 '18 '20 '22 '24 2025
Cap
ita
l In
ve
stm
en
t (b
illi
on
s o
f 2
01
2$
)
Common Infrastructure Refineries and Refined ProductsNGL and LPG Oil and CondensateNatural Gas Average 2014 - 2025
0
10
20
30
40
50
60
70
80
90
100
2014 '16 '18 '20 '22 '24 2025
Cap
ital
Investm
en
t (b
illi
on
s o
f 2
01
2$
)
Common Infrastructure, Exc. Rail MarineRail Processing and StoragePipelines Average 2014 - 2025

Oil & Natural Gas Transportation & Storage Infrastructure: Status, Trends, & Economic Benefits
IHS Global Inc. 39
Capital Investment by Target Energy Class – High Production Case
(average annual investment = $94.8 billion)
Source: IHS 2013
Capital Investment by Transport Mode – High Production Case (average annual investment = $94.8 billion)
Source: IHS 2013
0
10
20
30
40
50
60
70
80
90
100
110
2014 '16 '18 '20 '22 '24 2025
Cap
ita
l In
ve
stm
en
t (b
illi
on
s o
f 2
01
2$
)
Common Infrastructure Refineries and Refined ProductsNGL and LPG Oil and CondensateNatural Gas Average 2014 - 2025
0
10
20
30
40
50
60
70
80
90
100
110
2014 '16 '18 '20 '22 '24 2025
Cap
ita
l In
ve
stm
en
t (b
illi
on
s o
f 2
01
2$
)
Common Infrastructure, Exc. Rail MarineRail Processing and StoragePipelines Average 2014 - 2025

Oil & Natural Gas Transportation & Storage Infrastructure: Status, Trends, & Economic Benefits
IHS Global Inc. 40
Overall National Level Results The table below presents the national economic contribution for both the base case and the high production case scenario. The direct, indirect, and induced impacts are presented for employment, value added (contribution to GDP), and labor income. Government revenues generated are also presented for both cases.

Oil & Natural Gas Transportation & Storage Infrastructure: Status, Trends, & Economic Benefits
IHS Global Inc. 41
Employment Contribution by US Census Region IHS examined the effects of regional infrastructure and storage investment on the US economy. In the base case scenario, the $73.8 billion of overall average annual investment was distributed across the four US Census Regions. Approximately $41.5 billion of the investment went to the South, $14.1 billion to the West, $11.8 billion to the Midwest and $6.4 billion to the Northeast. Based on these direct investments, IHS determined the jobs contribution to the US economy and each of the four US Census Regions. This analysis reflects the indirect and induced jobs that are contributed in regions other than a region in which the direct investment occurs. For example, the Northeast gains 38,730 net new jobs as a result of investment made in the other 3 US Census Regions.
Distribution of Investment and Economic Contribution by US Census Region, Base Case (Dollars are in billions)
Source: IHS 2013
30.387
6,446
1,897
40,796
9,500
8,741
Notes: 1. The phrase “Jobs originating in this region” is shorthand for “US jobs supported as a result of direct capital investment made in this US Census Region”
2. Each arrow shows the net redistribution of jobs between two regions
Investment
$14.1B
Investment
$41.5B
Investment
$6.4B
Investment
$11.8B
Jobs "originating" in region 76,355
Net jobs due to investment
in other regions38,730
Net jobs in region 115,084
Net Jobs in the Northeast
Jobs "originating" in region 501,477
Net jobs due to investment
in other regions(79,923)
Net jobs in region 421,553
Net Jobs in the South
Jobs "originating" in region 150,482
Net jobs due to investment
in other regions48,400
Net jobs in region 198,882
Net Jobs in the Midwest
Jobs "originating" in region 164,672
Net jobs due to investment
in other regions(7,206)
Net jobs in region 157,466
Net Jobs in the West

Oil & Natural Gas Transportation & Storage Infrastructure: Status, Trends, & Economic Benefits
IHS Global Inc. 42
The following table provides the distributions of net new jobs by US Census Regions under the base case.
The following figure extends the analysis to the high production case.
Distribution of Investment and Economic Contribution by US Census Region, High Production Case (Dollars are in billions)
Source: IHS 2013
Northeast South Midwest West
Jobs due to investment in the Census Region 76,355 501,477 150,482 164,672
Jobs supported in other Census Regions1 (18,421) (118,272) (31,424) (41,169)
Northeast (38,301) (9,730) (9,120)
South (7,915) (14,790) (15,644)
Midwest (7,833) (55,586) (16,405)
West (2,673) (24,385) (6,905)
Jobs supported from other Census Regions2 57,151 38,348 79,823 33,963
Northeast 7,915 7,833 2,673
South 38,301 55,586 24,385
Midwest 9,730 14,790 6,905
West 9,120 15,644 16,405
Net additional jobs supported in the Census Region 38,730 (79,923) 48,400 (7,206)
Northeast (30,387) (1,897) (6,446)
South 30,387 40,796 8,741
Midwest 1,897 (40,796) (9,500)
West 6,446 (8,741) 9,500
Total jobs created in the Census Region 115,084 421,553 198,882 157,466
Notes: 1. Jobs supported in other US Census Regions due to investment in a given US Census Region
2. Jobs supported in a given US Census Region due to investment in other US Census Regions
Inter-Census Region Job CreationDistribution of Jobs Across US Census Regions
41,351
8,883
2,079
55,902
13,611
11,605
Notes: 1. The phrase “Jobs originating in this region” is shorthand for “US jobs supported as a result of direct capital investment made in this US Census Region”
2. Each arrow shows the net redistribution of jobs between two regions
Investment
$18.7B
Investment
$55.3B
Investment
$7.5B
Investment
$13.3B
Jobs "originating" in region 88,342
Net jobs due to investment
in other regions52,313
Net jobs in region 140,654
Net Jobs in the Northeast
Jobs "originating" in region 668,859
Net jobs due to investment
in other regions(108,857)
Net jobs in region 560,001
Net Jobs in the South
Jobs "originating" in region 218,048
Net jobs due to investment
in other regions(10,890)
Net jobs in region 207,158
Net Jobs in the West
Jobs "originating" in region 171,657
Net jobs due to investment
in other regions67,434
Net jobs in region 239,092
Net Jobs in the Midwest

Oil & Natural Gas Transportation & Storage Infrastructure: Status, Trends, & Economic Benefits
IHS Global Inc. 43
The following table provides the distributions of net new jobs by US Census Regions under the high production case.
Northeast South Midwest West
Jobs due to investment in the Census Region 88,342 668,859 171,657 218,048
Jobs supported in other Census Regions1 (21,503) (155,701) (36,211) (54,104)
Northeast (50,560) (11,269) (11,987)
South (9,209) (17,036) (20,599)
Midwest (9,190) (72,937) (21,518)
West (3,103) (32,204) (7,907)
Jobs supported from other Census Regions2 73,815 46,844 103,646 43,214
Northeast 9,209 9,190 3,103
South 50,560 72,937 32,204
Midwest 11,269 17,036 7,907
West 11,987 20,599 21,518
Net additional jobs supported in the Census Region 52,313 (108,857) 67,434 (10,890)
Northeast (41,351) (2,079) (8,883)
South 41,351 55,902 11,605
Midwest 2,079 (55,902) (13,611)
West 8,883 (11,605) 13,611
Total jobs created in the Census Region 140,654 560,001 239,092 207,158
Notes: 1. Jobs supported in other US Census Regions due to investment in a given US Census Region
2. Jobs supported in a given US Census Region due to investment in other US Census Regions
Inter-Census Region Job CreationDistribution of Jobs Across US Census Regions

Oil & Natural Gas Transportation & Storage Infrastructure: Status, Trends, & Economic Benefits
IHS Global Inc. 44
5. CONCLUSION
The results of this study indicate that overall transportation and storage infrastructure investment needed to support the growth in natural gas and oil production is expected to reach $89.3 billion in 2013 after experiencing $56.3 billion in 2010, $60.3 billion in 2011 and $76.6 billion in 2012. The average annual investment, $81.7 billion per year from 2014 through 2019, will moderate to $66.0 billion per year over the 2020-2025 timeframe. Over the entire forecast period (2014 – 2025) the average investment is expected to be $73.8 billion. Should the high production scenario take effect, those estimates would be revised upward to $98.3 billion per year from 2014 through 2019 and $91.3 billion per year from 2020 through 2025. Over the entire forecast period, annual investment levels would average $94.8 billion. Below, these investments are broken down by both the Target Energy Type and by Transport Mode. In the former, the lion’s share of investment goes to Oil and Condensate, closely followed by Natural Gas. When viewed by Transport Mode nearly three-quarters of investment will be dedicated to pipelines, especially gathering infrastructure.
Average Annual Investment by Target Energy Type ($ billions)
Average Annual Investment Investment by Transport Mode ($ billions)
Source: IHS 2013
What is significant about the infrastructure investment trends is the staying power of capital expenditure levels throughout the 2014-2025 forecast period. While investment declines after
$54.8
$2.8
$1.7
$12.4
$2.2
$68.4
$2.9
$2.5
$18.6
$2.4
Pipelines
Rail
Marine
Processing andStorage
CommonInfrastructure,
Exc. Rail
Base Case($73.8 billion)
High Production Case($94.8 billion)
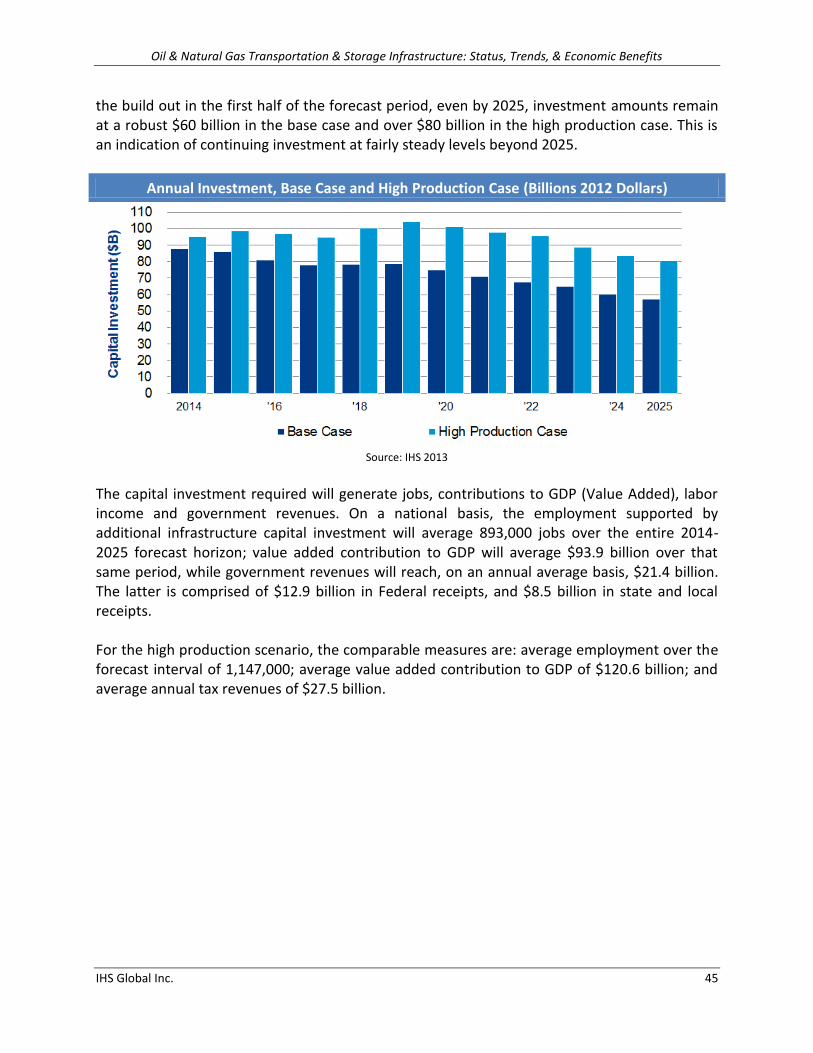
Oil & Natural Gas Transportation & Storage Infrastructure: Status, Trends, & Economic Benefits
IHS Global Inc. 45
the build out in the first half of the forecast period, even by 2025, investment amounts remain at a robust $60 billion in the base case and over $80 billion in the high production case. This is an indication of continuing investment at fairly steady levels beyond 2025.
Annual Investment, Base Case and High Production Case (Billions 2012 Dollars)
Source: IHS 2013
The capital investment required will generate jobs, contributions to GDP (Value Added), labor income and government revenues. On a national basis, the employment supported by additional infrastructure capital investment will average 893,000 jobs over the entire 2014-2025 forecast horizon; value added contribution to GDP will average $93.9 billion over that same period, while government revenues will reach, on an annual average basis, $21.4 billion. The latter is comprised of $12.9 billion in Federal receipts, and $8.5 billion in state and local receipts. For the high production scenario, the comparable measures are: average employment over the forecast interval of 1,147,000; average value added contribution to GDP of $120.6 billion; and average annual tax revenues of $27.5 billion.

Oil & Natural Gas Transportation & Storage Infrastructure: Status, Trends, & Economic Benefits
IHS Global Inc. 46
Source: IHS 2013
While the economic contribution of oil and gas transportation and storage infrastructure investment is significant, we are mindful that these investment levels are clearly not as large as other capital expenditure elements related to the unconventional oil and gas development sector. It should be remembered that these infrastructure investments facilitate the ultimate economic benefits flowing from unconventional oil and natural gas development. While we have assessed the stand-alone economic contribution of these investments37, it is necessary to take into account the infrastructure necessary to bring the upstream products to market and thus allow the significant economic benefits from those products to come to fruition. Economic impacts resulting from capital expenditure elements related to the upstream unconventional oil and gas sector are detailed in volume 3 of the IHS study “America’s New Energy Future: A Manufacturing Renaissance”.
37
See America’s New Energy Future: A Manufacturing Renaissance (Volume 3) – September 2013

Oil & Natural Gas Transportation & Storage Infrastructure: Status, Trends, & Economic Benefits
IHS Global Inc. 47
APPENDIX A
Assumptions and Underlying Details Related to Oil & Natural Gas Transportation &
Storage Infrastructure Investments

Oil & Natural Gas Transportation & Storage Infrastructure: Status, Trends, & Economic Benefits
IHS Global Inc. 48
Source: IHS 2013
TABLE A1 BASE CASE
API Infrastructure Assessment Production Basis
2010 2011 2012 2013 2014 2015 2016 2017 2018 2019 2020 2021 2022 2023 2024 2025
Natural Gas Production - Total US 58.4 62.8 65.8 66.6 67.1 69.2 72.9 77.2 81.4 83.0 83.6 85.9 89.4 91.0 90.8 91.0
Natural Gas Demand -Total US 64.9 66.0 68.8 69.3 69.4 71.7 73.5 77.5 79.9 80.7 80.8 82.9 85.6 87.3 88.0 88.2
Natural Gas Liquids Production - Total US 2,777 2,853 3,002 3,078 3,242 3,417 3,490 3,651 3,802 3,954 4,132 4,262 4,309 4,362 4,387 4,388
Natural Gas Liquids Production - Gas Processing 2,074 2,183 2,309 2,380 2,540 2,715 2,790 2,955 3,113 3,269 3,451 3,585 3,637 3,694 3,723 3,728
Natural Gas Liquids Demand - Total US 2,296 2,320 2,338 2,369 2,422 2,463 2,572 2,813 2,960 3,038 3,145 3,219 3,313 3,352 3,365 3,385
Crude Oil Production - Total US 5,450 5,738 6,456 7,150 7,276 7,472 7,706 7,919 8,028 8,171 8,163 8,081 7,947 7,801 7,651 7,484
Crude Oil Production - Unconventional Oil 755 1,138 2,081 3,076 3,353 3,537 3,805 4,069 4,246 4,363 4,433 4,467 4,502 4,535 4,550 4,528
US Refinery Crude Runs 14,724 14,806 15,020 15,264 15,548 15,715 15,848 15,896 15,929 15,935 15,860 15,756 15,652 15,547 15,443 15,338
US Refined Product Demand 15,793 15,438 15,073 15,131 15,236 15,358 15,483 15,520 15,535 15,537 15,506 15,489 15,448 15,412 15,360 15,305
(All Units in Thousands of Barrels Per Day Except Natural Gas Which is in Billions of Cubic Feet Per Day)

Oil & Natural Gas Transportation & Storage Infrastructure: Status, Trends, & Economic Benefits
IHS Global Inc. 49
Source: IHS 2013
TABLE A2 HIGH CASE
API Infrastructure Assessment Production Basis
2010 2011 2012 2013 2014 2015 2016 2017 2018 2019 2020 2021 2022 2023 2024 2025
Natural Gas Production - Total US 58.4 62.8 65.8 66.6 70.7 74.2 77.8 81.3 84.8 88.4 91.9 95.5 99.0 102.6 106.1 109.7
Natural Gas Demand -Total US 64.9 66.0 68.8 69.3 72.7 75.6 77.9 79.7 81.8 83.4 84.7 86.5 88.2 90.3 92.0 93.3
Natural Gas Liquids Production - Total US 2,777 2,853 3,002 3,078 3,411 3,579 3,748 3,917 4,085 4,254 4,423 4,591 4,760 4,929 5,097 5,266
Natural Gas Liquids Production - Gas Processing 2,074 2,183 2,309 2,380 2,709 2,877 3,048 3,221 3,396 3,569 3,742 3,915 4,088 4,261 4,433 4,606
Natural Gas Liquids Demand - Total US 2,296 2,320 2,338 2,369 2,517 2,594 2,736 3,024 3,207 3,332 3,470 3,600 3,745 3,827 3,876 3,933
Crude Oil Production - Total US 5,450 5,738 6,456 7,300 7,700 8,100 8,500 9,000 9,500 10,000 10,250 10,400 10,600 10,700 10,650 10,600
Crude Oil Production - Unconventional Oil 755 1,138 2,081 3,076 3,429 3,785 4,126 4,552 4,977 5,401 5,633 5,765 6,045 6,199 6,202 5,980
US Refinery Crude Runs 14,724 14,806 15,020 15,264 15,548 15,715 15,848 15,896 15,929 15,935 15,860 15,756 15,652 15,547 15,443 15,338
US Refined Product Demand 15,793 15,438 15,073 15,131 15,236 15,358 15,483 15,520 15,535 15,537 15,506 15,489 15,448 15,412 15,360 15,305
(All Units in Thousands of Barrels Per Day Except Natural Gas Which is in Billions of Cubic Feet Per Day)

Oil & Natural Gas Transportation & Storage Infrastructure: Status, Trends, & Economic Benefits
IHS Global Inc. 50
Source: IHS 2013
TABLE A3. BASE CASE.
(Millions of 2012 Dollars)
2014 2015 2016 2017 2018 2019 2020 2021 2022 2023 2024 2025
Natural Gas Gathering, Pipelines & Storage 17,149 18,726 20,493 22,202 23,658 25,221 25,704 26,114 27,386 27,111 25,970 25,815
Crude Oil & NGL Gathering, Pipelines & Storage 39,773 38,064 38,976 38,060 36,129 34,614 33,891 31,841 29,990 28,621 26,277 24,732
Natural Gas & NGL Processing 16,019 15,625 11,802 9,028 9,163 8,570 5,119 3,387 2,907 2,686 2,467 2,250
Natural Gas / NGL / Crude Oil Rail & Marine Logistics 4,849 4,347 3,987 4,063 4,031 3,850 3,859 3,865 2,494 2,177 1,719 1,189
Refineries & Refined Product Infrastructure 3,920 3,676 2,343 2,179 2,032 1,949 1,856 1,706 1,496 1,407 1,318 1,230
Common Infrastructure 5,705 5,437 4,421 4,392 4,546 4,337 4,605 3,976 3,345 2,825 2,397 2,043
Total 87,416 85,875 82,022 79,923 79,559 78,540 75,032 70,889 67,618 64,829 60,149 57,259
Cummulative Total 87,416 173,290 255,312 335,235 414,795 493,335 568,367 639,256 706,874 771,703 831,851 889,110
U.S OIL & GAS DIRECT CAPITAL INVESTMENTS FORECAST (2014-2025)

Oil & Natural Gas Transportation & Storage Infrastructure: Status, Trends, & Economic Benefits
IHS Global Inc. 51
Source: IHS 2013
TABLE A4. HIGH CASE.
U.S OIL & GAS DIRECT CAPITAL INVESTMENTS FORECASTS (2014-2025)
(Millions of 2012 Dollars)
2014 2015 2016 2017 2018 2019 2020 2021 2022 2023 2024 2025
Natural Gas Gathering, Pipelines & Storage 18,911 22,781 25,039 27,053 28,406 30,486 32,071 33,157 34,518 34,293 34,038 34,218
Crude Oil & NGL Gathering, Pipelines & Storage 43,879 44,510 45,761 46,409 46,263 45,833 45,165 42,711 41,474 40,411 37,679 36,074
Natural Gas & NGL Processing 16,409 17,447 16,418 12,523 15,850 16,726 12,106 10,998 11,127 6,608 5,615 5,098
Natural Gas / NGL / Crude Oil Rail & Marine Logistics 4,895 4,743 4,697 5,295 5,260 5,284 5,104 5,172 3,481 3,082 2,396 1,603
Refineries & Refined Product Infrastructure 3,920 3,676 2,343 2,179 2,032 1,949 1,856 1,706 1,496 1,407 1,318 1,230
Common Infrastructure 5,814 5,654 4,530 4,988 5,142 4,933 5,309 4,084 3,453 2,934 2,506 2,152
Total 93,828 98,810 98,786 98,446 102,952 105,211 101,611 97,828 95,549 88,735 83,551 80,374
Cummulative Total 93,828 192,638 291,424 389,870 492,822 598,032 699,644 797,472 893,020 981,756 1,065,307 1,145,681

Oil & Natural Gas Transportation & Storage Infrastructure: Status, Trends, & Economic Benefits
IHS Global Inc. 52
APPENDIX B
Detailed Economic Impact Results & Underlying Modeling Approach

Oil & Natural Gas Transportation & Storage Infrastructure: Status, Trends, & Economic Benefits
IHS Global Inc. 53
Appendix B1: Detailed Economic Impact Assessment Results by Census Region The following tables represent the economic contribution to the US economy originating from investments made in each of the four US Census Regions as determined by IHS. While much of the contribution will stay within the region of origin, some of the contribution will flow amongst the other regions. In contrast to the employment statistics provided in the Executive Summary and Section 4 of the report, these data represent the national impacts due to investment in each of the regions, and do not reflect the specific economic impacts to each region. The totals from each approach, however, are consistent.
Employment Economic Impact, Base Case
Source: IHS 2013
Employment - Base Case Northeast South Midwest West Total US
Aggregation A: Energy Type
Natural Gas 55,522 226,233 53,266 38,609 373,630
NGL & LPG 9,211 30,329 9,676 2,014 51,230
Crude Oil and Condensate 4,454 218,309 53,650 119,802 396,215
Refineries and Refined Products 1,177 16,249 5,503 2,458 25,387
Common Infrastucture 5,991 10,356 28,388 1,789 46,524
Total 76,355 501,476 150,483 164,672 892,986
Aggregation B: Transport Mode
Pipelines 51,905 362,043 105,548 145,938 665,434
Rail 5,179 9,307 13,940 3,543 31,969
Marine 5,300 7,274 1,353 5,297 19,224
Processing & Storage 10,675 117,159 14,029 8,909 150,772
Common Infrastucture, Exc. Rail 3,296 5,693 15,613 985 25,587
Total 76,355 501,476 150,483 164,672 892,986
Employment by Industry - Base Case Northeast South Midwest West Total US
Construction 8,086 42,778 20,805 8,073 79,742
Financial Services 2,948 21,316 6,319 7,563 38,146
Information & Professional Services 20,824 123,096 40,078 42,835 226,833
Leisure & Other Services 8,109 57,513 16,794 19,796 102,212
Manufacturing 24,018 174,159 42,622 59,542 300,341
Natural Resources 962 8,659 2,072 1,855 13,548
Transportation & Utilities 2,831 18,674 5,900 5,929 33,334
Wholesale & Retail Trade 7,083 48,955 13,856 16,570 86,464
Misc. 1,494 6,326 2,037 2,509 12,366
Total 76,355 501,476 150,483 164,672 892,986
Employment by Type - Base Case Northeast South Midwest West Total US
Direct 21,873 145,317 44,147 47,382 258,719
Indirect 24,539 169,247 48,039 58,555 300,380
Induced 29,943 186,912 58,297 58,735 333,887
Total 76,355 501,476 150,483 164,672 892,986

Oil & Natural Gas Transportation & Storage Infrastructure: Status, Trends, & Economic Benefits
IHS Global Inc. 54
Value Added Contribution to GDP, Base Case
Source: IHS 2013
Value Added ($M) - Base Case Northeast South Midwest West Total US
Aggregation A: Energy Type
Natural Gas 6,593 23,459 5,434 3,864 39,350
NGL & LPG 1,075 3,206 1,030 215 5,526
Crude Oil and Condensate 528 23,287 5,443 11,767 41,025
Refineries and Refined Products 140 1,795 559 276 2,770
Common Infrastucture 794 1,195 2,978 214 5,182
Total 9,130 52,943 15,443 16,337 93,853
Aggregation B: Transport Mode
Pipelines 6,145 37,870 10,750 14,247 69,013
Rail 652 1,027 1,458 406 3,543
Marine 629 777 145 609 2,159
Processing & Storage 1,267 12,611 1,453 958 16,288
Common Infrastucture, Exc. Rail 437 657 1,638 118 2,850
Total 9,130 52,943 15,443 16,337 93,853
Value Added by Industry ($M) - Base Case Northeast South Midwest West Total US
Construction 723 3,222 1,639 733 6,318
Financial Services 1,581 8,327 2,329 2,721 14,959
Information & Professional Services 2,367 11,693 3,792 4,126 21,978
Leisure & Other Services 435 2,519 715 991 4,661
Manufacturing 2,262 15,692 3,812 4,393 26,159
Natural Resources 148 1,422 286 287 2,142
Transportation & Utilities 643 4,065 1,231 1,006 6,944
Wholesale & Retail Trade 916 5,765 1,553 1,960 10,194
Misc. 54 237 86 122 499
Total 9,130 52,943 15,443 16,337 93,853
Value Added by Type ($M) - Base Case Northeast South Midwest West Total US
Direct 2,090 13,189 3,966 3,497 22,742
Indirect 3,385 20,107 5,567 6,694 35,754
Induced 3,654 19,647 5,910 6,146 35,358
Total 9,130 52,943 15,443 16,337 93,853

Oil & Natural Gas Transportation & Storage Infrastructure: Status, Trends, & Economic Benefits
IHS Global Inc. 55
Labor Income Impact, Base Case
Source: IHS 2013
Labor Income ($M) - Base Case Northeast South Midwest West Total US
Aggregation A: Energy Type
Natural Gas 4,185 14,598 3,437 2,431 24,651
NGL & LPG 693 2,041 666 141 3,541
Crude Oil and Condensate 334 14,295 3,459 7,305 25,393
Refineries and Refined Products 89 1,124 359 175 1,747
Common Infrastucture 511 743 1,920 137 3,312
Total 5,811 32,802 9,842 10,188 58,643
Aggregation B: Transport Mode
Pipelines 3,898 23,308 6,826 8,839 42,870
Rail 421 644 940 263 2,268
Marine 396 493 93 387 1,369
Processing & Storage 815 7,949 927 624 10,314
Common Infrastucture, Exc. Rail 281 409 1,056 75 1,822
Total 5,811 32,802 9,842 10,188 58,643
Labor Income by Industry ($M) - Base Case Northeast South Midwest West Total US
Construction 604 2,685 1,365 616 5,270
Financial Services 630 2,768 819 938 5,154
Information & Professional Services 1,837 9,085 3,006 3,103 17,030
Leisure & Other Services 301 1,726 494 668 3,190
Manufacturing 1,471 10,387 2,495 2,958 17,311
Natural Resources 67 576 110 118 870
Transportation & Utilities 303 1,933 562 538 3,336
Wholesale & Retail Trade 537 3,418 917 1,150 6,022
Misc. 62 224 74 100 460
Total 5,811 32,802 9,842 10,188 58,643
Labor Income by Type ($M) - Base Case Northeast South Midwest West Total US
Direct 1,518 9,360 2,913 2,461 16,252
Indirect 2,166 12,469 3,551 4,238 22,424
Induced 2,127 10,973 3,378 3,489 19,967
Total 5,811 32,802 9,842 10,188 58,643

Oil & Natural Gas Transportation & Storage Infrastructure: Status, Trends, & Economic Benefits
IHS Global Inc. 56
Government Revenues, Base Case
Source: IHS 2013
Government Revenues
by Census Region ($M)Northeast South Midwest West Total US
Federal Taxes 1,426.5 7,138.9 2,135.6 2,213.4 12,914.4
Personal 1,225.7 5,874.9 1,791.7 1,845.1 10,737.3
Corporate 200.8 1,264.0 343.9 368.3 2,177.0
State & Local Taxes 1,042.6 4,358.4 1,509.0 1,548.5 8,458.5
Personal 339.2 689.5 402.9 364.9 1,796.5
Corporate 703.4 3,668.8 1,106.1 1,183.5 6,661.9
Total Government Revenues 2,469.1 11,497.2 3,644.6 3,761.9 21,372.8
Government Revenues
by Energy Type ($M)Natural Gas NGL & LPG
Oil and
CondensateRefined
Common
Infrastucture
Total
US
Federal 5,414.8 765.0 5,638.0 380.5 716.0 12,914.4
Personal 4,507.2 641.8 4,672.3 317.2 598.9 10,737.3
Corporate 907.7 123.2 965.7 63.3 117.2 2,177.0
State & Local 3,523.1 489.4 3,726.2 247.3 472.6 8,458.5
Personal 755.1 108.4 778.3 53.5 101.3 1,796.5
Corporate 2,768.0 381.0 2,947.9 193.8 371.2 6,661.9
Total Government Revenues 8,937.9 1,254.4 9,364.1 627.8 1,188.6 21,372.8
Government Revenues
by Transport ModePipelines
Processing
& StorageMarine Rail
Common Infra.,
Exc. Rail
Total
US
Federal 9,491.5 2,241.3 297.6 490.1 393.8 12,914.4
Personal 7,877.2 1,872.2 248.2 410.4 329.4 10,737.3
Corporate 1,614.3 369.0 49.4 79.8 64.4 2,177.0
State & Local 6,236.8 1,442.5 198.0 321.3 259.9 8,458.5
Personal 1,313.8 315.7 41.9 69.4 55.7 1,796.5
Corporate 4,923.0 1,126.8 156.1 251.9 204.2 6,661.9
Total Government Revenues 15,728.4 3,683.7 495.6 811.4 653.7 21,372.8

Oil & Natural Gas Transportation & Storage Infrastructure: Status, Trends, & Economic Benefits
IHS Global Inc. 57
Employment Economic Impact, High Production Case
Source: IHS 2013
Employment - High Prod Case Northeast South Midwest West Total US
Aggregation A: Energy Type
Natural Gas 64,048 325,386 61,069 53,431 503,934
NGL & LPG 10,111 35,265 11,074 2,282 58,732
Crude Oil and Condensate 6,933 281,091 64,128 156,818 508,970
Refineries and Refined Products 1,177 16,249 5,503 2,458 25,387
Common Infrastucture 6,074 10,865 29,883 3,059 49,881
Total 88,343 668,856 171,657 218,048 1,146,904
Aggregation B: Transport Mode
Pipelines 58,263 465,838 120,873 185,795 830,769
Rail 5,350 9,629 14,652 4,112 33,743
Marine 7,777 10,065 2,029 7,692 27,563
Processing & Storage 13,615 177,349 17,667 18,769 227,400
Common Infrastucture, Exc. Rail 3,338 5,975 16,436 1,680 27,429
Total 88,343 668,856 171,657 218,048 1,146,904
Employment - High Prod Case Northeast South Midwest West Total US
Construction 8,870 60,666 22,051 11,809 103,396
Financial Services 3,407 28,420 7,170 9,962 48,959
Information & Professional Services 24,010 165,604 45,371 56,942 291,927
Leisure & Other Services 9,363 76,681 19,025 26,152 131,221
Manufacturing 28,308 227,665 50,835 77,698 384,506
Natural Resources 1,111 11,448 2,352 2,493 17,404
Transportation & Utilities 3,304 25,009 6,705 7,871 42,889
Wholesale & Retail Trade 8,228 64,919 15,819 21,773 110,739
Misc. 1,742 8,444 2,329 3,348 15,863
Total 88,343 668,856 171,657 218,048 1,146,904
Employment - High Prod Case Northeast South Midwest West Total US
Direct 25,125 196,087 49,632 63,038 333,882
Indirect 28,666 222,803 55,780 76,817 384,066
Induced 34,552 249,966 66,245 78,193 428,956
Total 88,343 668,856 171,657 218,048 1,146,904

Oil & Natural Gas Transportation & Storage Infrastructure: Status, Trends, & Economic Benefits
IHS Global Inc. 58
Value Added Contribution to GDP, High Production Case
Source: IHS 2013
Value Added ($M) - High Prod Case Northeast South Midwest West Total US
Aggregation A: Energy Type
Natural Gas 7,598 33,917 6,242 5,452 53,208
NGL & LPG 1,183 3,731 1,178 244 6,337
Crude Oil and Condensate 817 29,977 6,488 15,430 52,712
Refineries and Refined Products 140 1,795 559 276 2,770
Common Infrastucture 805 1,249 3,130 372 5,556
Total 10,543 70,669 17,596 21,774 120,583
Aggregation B: Transport Mode
Pipelines 6,886 48,797 12,295 18,155 86,133
Rail 673 1,060 1,529 477 3,740
Marine 918 1,081 218 883 3,100
Processing & Storage 1,623 19,044 1,833 2,054 24,554
Common Infrastucture, Exc. Rail 443 687 1,722 205 3,056
Total 10,543 70,669 17,596 21,774 120,583
Value Added ($M) - High Prod Case Northeast South Midwest West Total US
Construction 791 4,578 1,741 1,079 8,189
Financial Services 1,827 11,112 2,650 3,612 19,201
Information & Professional Services 2,724 15,756 4,296 5,513 28,289
Leisure & Other Services 501 3,361 807 1,313 5,982
Manufacturing 2,659 20,539 4,523 5,767 33,489
Natural Resources 173 1,874 327 381 2,755
Transportation & Utilities 743 5,502 1,381 1,364 8,991
Wholesale & Retail Trade 1,063 7,631 1,774 2,580 13,048
Misc. 63 316 98 163 640
Total 10,543 70,669 17,596 21,774 120,583
Value Added ($M) - High Prod Case Northeast South Midwest West Total US
Direct 2,385 17,882 4,420 4,748 29,435
Indirect 3,949 26,508 6,458 8,808 45,723
Induced 4,209 26,279 6,719 8,218 45,425
Total 10,543 70,669 17,596 21,774 120,583

Oil & Natural Gas Transportation & Storage Infrastructure: Status, Trends, & Economic Benefits
IHS Global Inc. 59
Labor Income Impact, High Production Case
Source: IHS 2013
Labor Income ($M) - High Prod Case Northeast South Midwest West Total US
Aggregation A: Energy Type
Natural Gas 4,821 21,156 3,947 3,444 33,367
NGL & LPG 763 2,376 762 159 4,060
Crude Oil and Condensate 515 18,405 4,113 9,586 32,618
Refineries and Refined Products 89 1,124 359 175 1,747
Common Infrastucture 518 777 2,018 238 3,551
Total 6,704 43,837 11,200 13,601 75,343
Aggregation B: Transport Mode
Pipelines 4,365 30,054 7,795 11,270 53,483
Rail 434 665 986 308 2,394
Marine 578 685 140 561 1,964
Processing & Storage 1,043 12,006 1,168 1,331 15,549
Common Infrastucture, Exc. Rail 285 427 1,110 131 1,953
Total 6,704 43,837 11,200 13,601 75,343
Labor Income ($M) - High Prod Case Northeast South Midwest West Total US
Construction 661 3,813 1,450 906 6,830
Financial Services 731 3,697 939 1,246 6,613
Information & Professional Services 2,111 12,277 3,398 4,158 21,944
Leisure & Other Services 347 2,304 558 885 4,094
Manufacturing 1,730 13,572 2,962 3,880 22,145
Natural Resources 78 760 124 157 1,119
Transportation & Utilities 351 2,592 636 720 4,299
Wholesale & Retail Trade 623 4,525 1,047 1,514 7,709
Misc. 72 298 85 135 590
Total 6,704 43,837 11,200 13,601 75,343
Labor Income ($M) - High Prod Case Northeast South Midwest West Total US
Direct 1,725 12,709 3,232 3,351 21,016
Indirect 2,527 16,442 4,124 5,580 28,674
Induced 2,452 14,686 3,844 4,670 25,652
Total 6,704 43,837 11,200 13,601 75,343

Oil & Natural Gas Transportation & Storage Infrastructure: Status, Trends, & Economic Benefits
IHS Global Inc. 60
Government Revenues, High Production Case
Source: IHS 2013
Government Revenues
by Census Region ($M)Northeast South Midwest West Total US
Federal Taxes 1,759.0 9,481.8 2,394.8 2,954.6 16,590.1
Personal 1,509.5 7,810.6 2,007.4 2,465.9 13,793.4
Corporate 249.4 1,671.3 387.4 488.7 2,796.7
State & Local Taxes 1,285.0 5,806.7 1,699.1 2,071.9 10,862.6
Personal 415.4 940.7 453.0 498.9 2,308.1
Corporate 869.6 4,865.9 1,246.1 1,572.9 8,554.5
Total Government Revenues 3,043.9 15,288.5 4,093.9 5,026.4 27,452.8
Government Revenues
by Energy Type ($M)Natural Gas NGL & LPG Oil Refined
Common
Infrastucture
Total
US
Federal 7,321.4 877.2 7,243.3 380.5 767.7 16,590.1
Personal 6,096.2 735.9 6,002.0 317.2 642.1 13,793.4
Corporate 1,225.2 141.3 1,241.3 63.3 125.6 2,796.7
State & Local 4,758.4 561.2 4,789.0 247.3 506.7 10,862.6
Personal 1,022.0 124.2 999.8 53.5 108.6 2,308.1
Corporate 3,736.5 436.9 3,789.3 193.8 398.0 8,554.5
Total Government Revenues 12,079.9 1,438.4 12,032.3 627.8 1,274.4 27,452.8
Government Revenues
by Transport ModePipelines
Processing
& StorageMarine Rail
Common Infra,
Exc. Rail
Total
US
Federal 11,844.9 3,378.5 427.1 517.3 422.3 16,590.1
Personal 9,828.8 2,822.3 356.0 433.1 353.2 13,793.4
Corporate 2,016.1 556.3 71.1 84.2 69.1 2,796.7
State & Local 7,786.5 2,173.7 284.5 339.2 278.7 10,862.6
Personal 1,639.1 475.9 60.1 73.2 59.8 2,308.1
Corporate 6,147.4 1,697.8 224.4 265.9 218.9 8,554.5
Total Government Revenues 19,631.4 5,552.3 711.7 856.5 700.9 27,452.8
Oil & Natural Gas Transportation & Storage Infrastructure: Status, Trends, & Economic Benefits
IHS Global Inc. 61
Appendix B2: Detailed Economic Impact Assessment Results by Census Division The following tables represent the economic contribution to the US economy originating from investments made in each of the nine US Census Divisions as determined by IHS. While much of the contribution will stay within the division of origin, some of the contribution will flow amongst the other divisions. In contrast to the employment statistics provided in the Executive Summary and Section 4 of the report, these data represent the national impacts due to investment in each of the divisions, and do not reflect the specific economic impacts to each division. The totals from each approach, however, are consistent.

Oil & Natural Gas Transportation & Storage Infrastructure: Status, Trends, & Economic Benefits
IHS Global Inc. 62
Base Case by Energy Class:
Employment Impact by Industry and US Census Division
Source: IHS 2013
Employment New England Mid-Atlantic South Atlantic East South Central West South Central East North Central West North Central Mountain Pacific Total US
Natural Gas 4,722 50,796 45,252 17,164 163,829 38,057 15,207 31,634 6,979 373,640
Construction 982 2,830 6,197 4,548 14,883 4,377 1,573 2,937 1,314 39,641
Financial Services 183 1,916 1,975 639 7,078 1,603 668 1,508 289 15,859
Information & Professional Services 1,393 13,276 12,498 4,300 40,870 9,916 3,858 8,372 1,918 96,401
Leisure & Other Services 499 5,253 5,413 1,848 18,914 4,307 1,661 3,893 804 42,592
Manufacturing 983 19,373 11,912 3,154 55,343 11,913 4,969 9,851 1,571 119,069
Natural Resources 42 587 804 350 2,717 556 183 329 126 5,694
Transportation & Utilities 141 1,800 1,761 621 6,192 1,487 558 1,155 248 13,963
Wholesale & Retail Trade 416 4,725 4,108 1,451 15,889 3,477 1,494 3,153 591 35,304
Misc. 83 1,036 584 253 1,943 421 243 436 118 5,117
NGL and LPG 14 9,197 2,669 6,256 21,404 7,255 2,421 2,014 - 51,230
Construction 3 1,852 482 2,052 4,654 1,407 643 573 - 11,666
Financial Services - 375 114 235 928 307 108 95 - 2,162
Information & Professional Services 6 2,665 798 1,632 5,855 2,101 672 600 - 14,329
Leisure & Other Services 1 1,035 317 686 2,499 837 279 259 - 5,913
Manufacturing 3 1,778 535 687 4,060 1,480 329 176 - 9,048
Natural Resources - 131 49 112 389 102 33 22 - 838
Transportation & Utilities - 366 113 219 819 304 95 76 - 1,992
Wholesale & Retail Trade 1 837 223 538 1,948 629 225 186 - 4,587
Misc. - 158 38 95 252 88 37 27 - 695
Crude Oil and Condensate - 4,454 226 3,272 214,811 29,576 24,074 105,457 14,345 396,215
Construction - 896 53 51 4,617 1,645 3,359 1,411 1,108 13,140
Financial Services - 188 10 116 9,078 1,139 1,009 4,909 576 17,025
Information & Professional Services - 1,258 66 682 48,766 7,044 6,160 27,178 3,515 94,669
Leisure & Other Services - 508 27 327 24,323 3,113 2,582 12,731 1,582 45,193
Manufacturing - 777 32 1,517 91,790 12,198 7,103 41,835 5,260 160,512
Natural Resources - 74 5 92 3,618 436 285 1,036 256 5,802
Transportation & Utilities - 213 9 104 7,760 1,019 843 3,785 486 14,219
Wholesale & Retail Trade - 460 21 310 22,081 2,630 2,317 10,985 1,288 40,092
Misc. - 80 3 73 2,778 352 416 1,587 274 5,563
Refineries and Refined Products - 1,177 324 126 15,799 1,317 4,186 729 1,729 25,387
Construction - 228 95 44 2,645 364 689 113 252 4,430
Financial Services - 49 14 5 672 56 175 33 74 1,078
Information & Professional Services - 332 90 31 4,514 363 1,272 230 478 7,310
Leisure & Other Services - 134 38 13 1,840 152 456 92 208 2,933
Manufacturing - 216 37 13 3,641 180 917 142 429 5,575
Natural Resources - 20 6 3 273 19 49 12 35 417
Transportation & Utilities - 56 11 4 635 47 209 37 70 1,069
Wholesale & Retail Trade - 120 29 11 1,389 119 350 60 153 2,231
Misc. - 22 4 2 190 17 69 10 30 344
Common Infrastructure - 5,991 195 365 9,796 8,407 19,981 557 1,232 46,524
Construction - 1,295 42 97 2,318 1,701 5,050 132 233 10,868
Financial Services - 235 9 14 433 364 889 26 51 2,021
Information & Professional Services - 1,894 58 103 2,832 2,529 6,163 179 364 14,122
Leisure & Other Services - 679 25 41 1,201 1,031 2,376 76 154 5,583
Manufacturing - 887 28 43 1,370 1,400 2,132 49 228 6,137
Natural Resources - 107 5 12 227 147 264 10 30 802
Transportation & Utilities - 254 8 17 402 383 953 27 47 2,091
Wholesale & Retail Trade - 524 17 31 911 759 1,853 51 104 4,250
Misc. - 116 3 7 102 93 301 7 21 650
Total 4,736 71,615 48,666 27,183 425,639 84,612 65,869 140,391 24,285 892,996
Construction 985 7,101 6,869 6,792 29,117 9,494 11,314 5,166 2,907 79,745
Financial Services 183 2,763 2,122 1,009 18,189 3,469 2,849 6,571 990 38,145
Information & Professional Services 1,399 19,425 13,510 6,748 102,837 21,953 18,125 36,559 6,275 226,831
Leisure & Other Services 500 7,609 5,820 2,915 48,777 9,440 7,354 17,051 2,748 102,214
Manufacturing 986 23,031 12,544 5,414 156,204 27,171 15,450 52,053 7,488 300,341
Natural Resources 42 919 869 569 7,224 1,260 814 1,409 447 13,553
Transportation & Utilities 141 2,689 1,902 965 15,808 3,240 2,658 5,080 851 33,334
Wholesale & Retail Trade 417 6,666 4,398 2,341 42,218 7,614 6,239 14,435 2,136 86,464
Misc. 83 1,412 632 430 5,265 971 1,066 2,067 443 12,369
Northeast South Midwest West

Oil & Natural Gas Transportation & Storage Infrastructure: Status, Trends, & Economic Benefits
IHS Global Inc. 63
Base Case by Energy Class:
GDP Contribution by Industry and US Census Division
Source: IHS 2013
Value Added ($M) New England Mid-Atlantic South Atlantic East South Central West South Central East North Central West North Central Mountain Pacific Total US
Natural Gas 564.9 6,028.0 4,549.1 1,570.7 17,339.2 4,019.1 1,415.0 3,032.3 832.0 39,350.3
Construction 83.9 272.1 451.3 292.0 1,166.8 363.2 118.7 245.1 132.0 3,125.0
Financial Services 93.5 1,066.4 741.3 220.5 2,672.0 604.9 207.9 494.0 124.3 6,224.8
Information & Professional Services 148.7 1,549.5 1,191.7 372.4 3,841.5 939.8 342.9 754.9 207.3 9,348.6
Leisure & Other Services 25.2 287.3 252.7 74.5 817.6 183.6 66.4 189.4 42.9 1,939.6
Manufacturing 107.7 1,735.4 987.4 281.9 4,968.9 1,117.3 372.4 702.1 158.4 10,431.4
Natural Resources 7.9 84.5 76.1 37.6 501.3 97.5 23.3 62.3 20.2 910.6
Transportation & Utilities 40.8 374.3 362.6 126.6 1,440.8 306.4 106.9 201.4 65.1 3,025.0
Wholesale & Retail Trade 54.3 620.9 459.5 152.6 1,860.0 390.3 164.5 361.1 75.7 4,139.0
Misc. 3.0 37.5 26.6 12.6 70.5 16.1 11.9 22.0 6.1 206.2
NGL and LPG 2.0 1,072.6 275.7 590.3 2,340.4 798.6 231.1 215.5 - 5,526.0
Construction 0.3 158.5 35.8 138.2 357.3 121.4 47.2 48.9 - 907.5
Financial Services 0.3 175.2 44.2 86.9 355.1 123.8 33.0 35.2 - 853.8
Information & Professional Services 0.6 280.9 77.7 146.5 566.5 207.3 58.3 57.3 - 1,395.0
Leisure & Other Services 0.1 52.4 15.4 29.5 110.8 37.4 11.2 13.4 - 270.2
Manufacturing 0.4 190.4 45.1 70.9 400.5 151.3 31.2 17.5 - 907.3
Natural Resources 0.0 19.8 4.6 10.9 87.3 15.0 4.3 3.9 - 145.8
Transportation & Utilities 0.1 87.4 26.2 45.2 228.1 67.9 20.0 16.4 - 491.3
Wholesale & Retail Trade 0.2 102.0 24.8 57.9 225.7 71.0 23.9 21.6 - 527.1
Misc. 0.0 5.9 2.0 4.4 9.0 3.5 1.9 1.1 - 27.9
Crude Oil and Condensate - 527.8 22.5 287.1 22,977.0 3,112.3 2,330.7 10,163.7 1,603.8 41,024.9
Construction - 70.7 3.5 3.7 378.9 140.9 255.4 137.6 102.5 1,093.2
Financial Services - 86.3 3.6 41.6 3,704.0 477.1 354.4 1,745.3 247.9 6,660.3
Information & Professional Services - 128.4 6.0 59.3 4,680.2 704.6 578.0 2,590.1 387.1 9,133.7
Leisure & Other Services - 24.5 1.2 13.4 1,061.4 136.5 108.8 632.7 84.6 2,063.1
Manufacturing - 94.3 3.4 108.5 8,311.6 1,103.6 565.6 2,954.1 475.0 13,616.0
Natural Resources - 14.5 0.4 5.8 578.4 52.2 30.9 158.2 29.6 870.1
Transportation & Utilities - 51.0 1.9 14.7 1,495.5 179.4 157.9 581.3 96.1 2,577.9
Wholesale & Retail Trade - 55.5 2.3 33.8 2,672.2 304.1 261.0 1,292.0 164.7 4,785.6
Misc. - 2.7 0.1 6.2 94.9 13.9 18.8 72.3 16.3 225.0
Refineries and Refined Products - 140.2 33.1 11.3 1,751.0 141.6 417.0 75.9 199.8 2,769.9
Construction - 18.2 6.8 2.8 203.6 29.6 52.5 9.3 23.3 346.1
Financial Services - 22.8 5.4 1.6 269.8 22.1 60.2 11.9 29.7 423.4
Information & Professional Services - 34.3 8.8 2.7 444.5 35.2 116.8 21.5 50.0 713.8
Leisure & Other Services - 6.5 1.9 0.6 82.6 6.9 19.0 4.7 10.8 133.0
Manufacturing - 25.8 3.7 1.2 348.2 19.2 77.2 11.4 43.4 530.2
Natural Resources - 3.9 0.6 0.3 51.6 3.3 5.6 2.1 4.7 72.0
Transportation & Utilities - 13.3 2.6 0.9 184.2 11.1 45.2 7.8 17.4 282.5
Wholesale & Retail Trade - 14.5 3.2 1.1 159.8 13.7 37.3 6.8 18.7 255.1
Misc. - 0.8 0.2 0.1 6.7 0.6 3.1 0.5 1.8 13.8
Common Infrastructure - 794.1 20.5 35.3 1,139.5 944.3 2,033.8 60.1 154.2 5,181.9
Construction - 119.9 3.0 6.1 172.8 139.0 371.2 10.4 23.6 845.8
Financial Services - 136.6 3.3 4.9 172.8 146.9 298.7 9.6 23.4 796.2
Information & Professional Services - 224.3 5.7 9.1 280.6 247.6 562.1 16.6 40.7 1,386.6
Leisure & Other Services - 39.2 1.2 1.7 54.2 46.1 99.6 3.9 8.7 254.5
Manufacturing - 108.0 2.8 4.5 153.9 155.5 219.0 5.2 25.6 674.4
Natural Resources - 17.6 0.5 1.2 65.1 24.2 29.7 1.8 3.7 143.7
Transportation & Utilities - 76.2 2.1 3.9 129.5 96.3 239.4 6.5 13.7 567.6
Wholesale & Retail Trade - 68.3 1.9 3.2 107.2 85.4 201.6 5.8 13.5 486.9
Misc. - 4.1 0.1 0.6 3.4 3.5 12.7 0.3 1.3 26.0
Total 566.9 8,562.7 4,900.9 2,494.7 45,547.1 9,015.9 6,427.6 13,547.5 2,789.8 93,853.0
Construction 84.1 639.3 500.4 442.8 2,279.3 794.1 845.1 451.4 281.3 6,317.7
Financial Services 93.8 1,487.4 797.9 355.4 7,173.7 1,374.9 954.1 2,295.9 425.4 14,958.5
Information & Professional Services 149.3 2,217.4 1,289.9 590.0 9,813.3 2,134.3 1,658.0 3,440.4 685.1 21,977.8
Leisure & Other Services 25.3 410.0 272.4 119.7 2,126.5 410.5 305.0 844.2 147.1 4,660.5
Manufacturing 108.0 2,154.0 1,042.3 467.0 14,183.1 2,546.8 1,265.4 3,690.2 702.5 26,159.2
Natural Resources 7.9 140.3 82.2 55.7 1,283.8 192.1 93.7 228.4 58.2 2,142.3
Transportation & Utilities 41.0 602.3 395.3 191.4 3,478.0 661.1 569.5 813.5 192.3 6,944.3
Wholesale & Retail Trade 54.5 861.2 491.6 248.7 5,024.8 864.5 688.4 1,687.4 272.5 10,193.7
Misc. 3.0 51.0 28.9 23.9 184.5 37.6 48.4 96.2 25.5 498.9
Northeast South Midwest West

Oil & Natural Gas Transportation & Storage Infrastructure: Status, Trends, & Economic Benefits
IHS Global Inc. 64
Base Case by Energy Class: Labor Income Impact by Industry and US Census Division
Source: IHS 2013
Labor Income ($M) New England Mid-Atlantic South Atlantic East South Central West South Central East North Central West North Central Mountain Pacific Total US
Natural Gas 367.1 3,818.0 2,852.1 1,023.7 10,722.3 2,541.9 894.7 1,894.1 537.0 24,650.9
Construction 70.0 228.2 375.3 242.9 971.3 302.6 99.0 204.3 109.8 2,603.4
Financial Services 35.4 438.3 241.2 67.5 869.2 207.3 72.7 159.7 42.1 2,133.6
Information & Professional Services 118.8 1,182.2 938.7 309.5 3,010.6 746.3 264.4 576.8 163.4 7,310.7
Leisure & Other Services 17.8 199.0 172.1 51.6 559.2 126.1 46.1 127.6 28.5 1,328.0
Manufacturing 69.2 1,134.9 633.9 180.1 3,283.8 734.2 245.9 470.6 104.5 6,857.0
Natural Resources 3.3 38.6 36.2 16.1 198.0 37.4 7.6 23.7 8.8 369.8
Transportation & Utilities 17.2 188.8 161.9 56.1 660.6 143.6 52.1 102.9 29.0 1,412.3
Wholesale & Retail Trade 32.0 363.6 271.8 90.8 1,103.5 230.8 97.1 212.0 44.7 2,446.3
Misc. 3.4 44.3 20.8 9.0 66.2 13.6 9.8 16.5 6.0 189.6
NGL and LPG 1.3 691.3 174.3 392.2 1,475.0 515.2 151.2 140.5 - 3,541.1
Construction 0.2 131.7 29.7 114.9 296.5 100.9 39.2 40.5 - 753.7
Financial Services 0.1 63.3 14.6 27.2 113.6 43.6 11.1 11.3 - 284.8
Information & Professional Services 0.4 224.9 62.5 121.3 459.7 167.9 46.9 45.5 - 1,129.2
Leisure & Other Services 0.1 36.2 10.5 20.4 75.4 25.7 7.7 9.0 - 185.0
Manufacturing 0.2 121.8 28.1 45.7 257.0 97.1 20.5 11.7 - 582.1
Natural Resources 0.0 8.9 2.3 4.9 34.1 6.0 1.4 1.6 - 59.3
Transportation & Utilities 0.1 38.5 10.5 20.0 95.8 29.0 8.8 7.3 - 209.8
Wholesale & Retail Trade 0.1 60.0 14.6 34.4 134.1 41.9 14.1 12.7 - 312.0
Misc. 0.0 6.0 1.5 3.3 8.8 3.1 1.6 0.9 - 25.3
Crude Oil and Condensate - 333.6 14.4 178.2 14,102.2 1,969.2 1,490.3 6,283.3 1,021.4 25,392.6
Construction - 58.8 2.9 3.2 320.5 118.2 212.7 120.1 85.9 922.3
Financial Services - 31.7 1.2 14.4 1,273.5 178.5 130.0 609.0 91.1 2,329.4
Information & Professional Services - 101.7 4.8 45.5 3,515.7 543.5 446.7 1,925.0 289.7 6,872.8
Leisure & Other Services - 17.0 0.9 9.4 729.5 94.3 75.9 428.2 56.4 1,411.5
Manufacturing - 60.6 2.1 69.9 5,557.3 727.2 364.7 1,993.0 321.5 9,096.4
Natural Resources - 6.2 0.2 2.8 234.3 21.1 11.0 64.3 13.7 353.6
Transportation & Utilities - 22.3 0.8 8.9 788.4 94.7 78.3 329.5 50.3 1,373.2
Wholesale & Retail Trade - 32.6 1.3 20.0 1,583.4 179.3 153.8 757.0 97.0 2,824.5
Misc. - 2.6 0.1 4.1 99.7 12.3 17.1 57.2 15.8 208.8
Refineries and Refined Products - 88.6 21.4 7.5 1,095.5 92.6 266.8 47.8 126.8 1,746.9
Construction - 15.2 5.6 2.3 169.1 24.6 43.7 7.8 19.4 287.7
Financial Services - 8.5 1.7 0.5 88.2 7.5 21.5 3.9 10.1 141.9
Information & Professional Services - 27.1 7.0 2.3 363.7 28.4 95.5 17.4 39.2 580.6
Leisure & Other Services - 4.5 1.3 0.4 56.6 4.7 13.3 3.2 7.2 91.2
Manufacturing - 16.5 2.3 0.8 221.7 12.5 48.4 7.3 28.7 338.2
Natural Resources - 1.7 0.3 0.1 20.9 1.3 2.0 0.9 2.0 29.2
Transportation & Utilities - 5.8 1.1 0.4 74.0 5.0 17.7 3.1 7.6 114.6
Wholesale & Retail Trade - 8.5 1.9 0.7 94.9 8.1 22.0 4.0 11.0 151.1
Misc. - 0.8 0.2 0.1 6.3 0.6 2.7 0.4 1.6 12.6
Common Infrastructure - 511.0 13.0 22.8 707.5 603.0 1,317.4 38.2 99.0 3,311.8
Construction - 99.6 2.5 5.1 143.3 115.5 308.3 8.7 19.6 702.6
Financial Services - 52.2 1.0 1.5 52.6 48.3 98.4 2.9 7.7 264.5
Information & Professional Services - 181.3 4.6 7.7 231.3 203.6 462.6 13.6 32.3 1,137.0
Leisure & Other Services - 26.9 0.8 1.2 36.7 31.5 68.9 2.6 5.7 174.2
Manufacturing - 67.5 1.8 3.0 99.1 101.0 144.0 3.5 17.1 436.9
Natural Resources - 8.1 0.2 0.5 25.3 10.2 11.7 0.7 1.8 58.5
Transportation & Utilities - 30.6 0.8 1.5 52.1 39.4 93.5 2.6 5.7 226.2
Wholesale & Retail Trade - 40.1 1.1 1.9 63.9 50.6 119.3 3.4 8.0 288.3
Misc. - 4.8 0.1 0.4 3.2 3.0 10.8 0.2 1.2 23.6
Total 368.4 5,442.5 3,075.2 1,624.4 28,102.5 5,721.9 4,120.3 8,403.9 1,784.2 58,643.3
Construction 70.2 533.5 416.0 368.5 1,900.7 661.9 702.9 381.3 234.7 5,269.7
Financial Services 35.5 594.0 259.7 111.0 2,397.1 485.2 333.7 786.8 151.1 5,154.2
Information & Professional Services 119.3 1,717.3 1,017.7 486.3 7,581.0 1,689.7 1,316.1 2,578.3 524.6 17,030.2
Leisure & Other Services 17.8 283.6 185.6 83.0 1,457.3 282.3 211.8 570.6 97.8 3,189.9
Manufacturing 69.4 1,401.3 668.3 299.4 9,418.8 1,672.0 823.5 2,486.1 471.8 17,310.6
Natural Resources 3.4 63.5 39.2 24.5 512.6 76.0 33.7 91.2 26.3 870.4
Transportation & Utilities 17.2 285.9 175.2 87.0 1,670.8 311.6 250.4 445.4 92.7 3,336.2
Wholesale & Retail Trade 32.1 504.9 290.8 147.8 2,979.8 510.7 406.3 989.1 160.6 6,022.2
Misc. 3.4 58.5 22.7 16.9 184.2 32.5 41.9 75.2 24.6 459.9
Northeast South Midwest West

Oil & Natural Gas Transportation & Storage Infrastructure: Status, Trends, & Economic Benefits
IHS Global Inc. 65
Base Case by Energy Class:
Direct, Indirect, and Induced Employment by US Census Division
Source: IHS 2013
Base Case by Energy Class:
Direct, Indirect, and Induced GDP Contribution by US Census Division
Source: IHS 2013
Employment New England Mid-Atlantic South Atlantic East South Central West South Central East North Central West North Central Mountain Pacific Total US
Natural Gas 4,722 50,796 45,252 17,164 163,829 38,057 15,207 31,634 6,979 373,640
Direct 1,635 13,879 13,881 7,005 49,457 10,229 5,038 10,068 2,098 113,290
Indirect 1,206 17,471 13,616 4,306 53,573 12,634 4,790 10,425 2,001 120,022
Induced 1,881 19,446 17,755 5,853 60,799 15,194 5,379 11,141 2,880 140,328
NGL and LPG 14 9,197 2,669 6,256 21,404 7,255 2,421 2,014 - 51,230
Direct 5 2,921 914 2,484 7,385 2,212 875 704 - 17,500
Indirect 3 2,529 685 1,543 5,772 1,944 606 493 - 13,575
Induced 6 3,747 1,070 2,229 8,247 3,099 940 817 - 20,155
Crude Oil and Condensate - 4,454 226 3,272 214,811 29,576 24,074 105,457 14,345 396,215
Direct - 1,265 70 994 54,167 6,394 7,742 29,871 3,370 103,873
Indirect - 1,373 63 1,232 81,219 11,811 7,602 38,970 5,453 147,723
Induced - 1,816 93 1,046 79,425 11,371 8,730 36,616 5,522 144,619
Refineries and Refined Products - 1,177 324 126 15,799 1,317 4,186 729 1,729 25,387
Direct - 333 115 54 5,419 441 1,596 268 479 8,705
Indirect - 362 82 31 4,230 343 981 182 529 6,740
Induced - 482 127 41 6,150 533 1,609 279 721 9,942
Common Infrastructure - 5,991 195 365 9,796 8,407 19,981 557 1,232 46,524
Direct - 1,834 57 137 3,178 2,405 7,212 190 334 15,347
Indirect - 1,593 55 97 2,751 2,388 4,944 146 358 12,332
Induced - 2,564 83 131 3,867 3,614 7,825 221 540 18,845
Total 4,736 71,615 48,666 27,183 425,639 84,612 65,869 140,391 24,285 892,996
Direct 1,640 20,232 15,037 10,674 119,606 21,681 22,463 41,101 6,281 258,715
Indirect 1,209 23,328 14,501 7,209 147,545 29,120 18,923 50,216 8,341 300,392
Induced 1,887 28,055 19,128 9,300 158,488 33,811 24,483 49,074 9,663 333,889
Northeast South Midwest West
Value Added
Contribution to GDP ($M) New England Mid-Atlantic South Atlantic East South Central West South Central East North Central West North Central Mountain Pacific Total US
Natural Gas 565 6,028 4,549 1,571 17,339 4,019 1,415 3,032 832 39,350
Direct 171 1,223 1,188 563 4,639 969 387 762 241 10,145
Indirect 169 2,395 1,547 470 6,347 1,490 521 1,149 257 14,346
Induced 224 2,410 1,814 538 6,352 1,560 506 1,120 334 14,859
NGL and LPG 2 1,073 276 590 2,340 799 231 215 - 5,526
Direct 1 304 83 205 728 230 77 69 - 1,698
Indirect 1 339 80 172 738 239 66 60 - 1,696
Induced 1 430 112 213 874 329 87 87 - 2,133
Crude Oil and Condensate - 528 23 287 22,977 3,112 2,331 10,164 1,604 41,025
Direct - 132 6 60 4,781 524 602 1,976 304 8,384
Indirect - 192 7 128 9,679 1,381 857 4,407 671 17,322
Induced - 204 9 100 8,517 1,208 872 3,780 629 15,319
Refineries and Refined Products - 140 33 11 1,751 142 417 76 200 2,770
Direct - 35 10 4 563 43 149 26 54 883
Indirect - 51 10 3 531 43 111 21 66 835
Induced - 55 13 4 658 56 158 29 80 1,052
Common Infrastructure - 794 21 35 1,140 944 2,034 60 154 5,182
Direct - 225 6 12 340 266 719 20 44 1,632
Indirect - 239 6 11 377 298 561 17 46 1,555
Induced - 331 8 12 422 380 754 23 64 1,994
Total 567 8,563 4,901 2,495 45,547 9,016 6,428 13,547 2,790 93,853
Direct 172 1,918 1,294 844 11,051 2,032 1,935 2,853 644 22,742
Indirect 170 3,216 1,651 784 17,672 3,452 2,116 5,655 1,039 35,754
Induced 225 3,429 1,957 867 16,824 3,532 2,377 5,039 1,107 35,358
Northeast South Midwest West

Oil & Natural Gas Transportation & Storage Infrastructure: Status, Trends, & Economic Benefits
IHS Global Inc. 66
Base Case by Energy Class:
Direct, Indirect, and Induced Labor Income by US Census Division
Source: IHS 2013
Base Case by Energy Class:
Government Revenues
Source: IHS 2013
Labor Income ($M) New England Mid-Atlantic South Atlantic East South Central West South Central East North Central West North Central Mountain Pacific Total US
Natural Gas 367 3,818 2,852 1,024 10,722 2,542 895 1,894 537 24,651
Direct 128 865 863 425 3,274 705 279 549 183 7,271
Indirect 107 1,544 969 297 3,915 946 330 718 162 8,988
Induced 131 1,409 1,020 302 3,533 891 286 627 192 8,391
NGL and LPG 1 691 174 392 1,475 515 151 141 - 3,541
Direct 0 231 60 161 542 173 60 54 - 1,281
Indirect 0 214 51 110 448 153 42 37 - 1,055
Induced 1 247 63 121 485 190 49 49 - 1,204
Crude Oil and Condensate - 334 14 178 14,102 1,969 1,490 6,283 1,021 25,393
Direct - 99 5 41 3,309 376 447 1,348 221 5,846
Indirect - 118 5 82 6,024 891 549 2,792 434 10,895
Induced - 117 5 56 4,768 702 494 2,143 366 8,651
Refineries and Refined Products - 89 21 8 1,095 93 267 48 127 1,747
Direct - 26 8 3 401 34 105 18 39 634
Indirect - 31 6 2 326 27 71 13 41 519
Induced - 31 7 2 368 32 90 16 46 594
Common Infrastructure - 511 13 23 707 603 1,317 38 99 3,312
Direct - 169 4 9 254 199 536 15 33 1,219
Indirect - 150 4 7 223 187 355 11 29 966
Induced - 192 5 7 230 217 426 13 37 1,126
Total 368 5,442 3,075 1,624 28,102 5,722 4,120 8,404 1,784 58,643
Direct 129 1,389 941 639 7,781 1,486 1,427 1,985 476 16,252
Indirect 108 2,058 1,034 498 10,937 2,204 1,347 3,571 667 22,424
Induced 132 1,995 1,100 488 9,385 2,031 1,346 2,848 641 19,967
Northeast South Midwest West
Government Revenues
by Energy Type ($M)Natural Gas NGL & LPG
Oil and
CondensateRefined
Common
Infrastucture
Total
US
Federal 5,414.8 765.0 5,638.0 380.5 716.0 12,914.4
Personal 4,507.2 641.8 4,672.3 317.2 598.9 10,737.3
Corporate 907.7 123.2 965.7 63.3 117.2 2,177.0
0.0
State & Local 3,523.1 489.4 3,726.2 247.3 472.6 8,458.5
Personal 755.1 108.4 778.3 53.5 101.3 1,796.5
Corporate 2,768.0 381.0 2,947.9 193.8 371.2 6,661.9
Total Government Revenues 8,937.9 1,254.4 9,364.1 627.8 1,188.6 21,372.8

Oil & Natural Gas Transportation & Storage Infrastructure: Status, Trends, & Economic Benefits
IHS Global Inc. 67
Base Case by Transport Mode: Employment Impact by Industry and US Census Division
Source: IHS 2013
Employment New England Mid-Atlantic South Atlantic East South Central West South Central East North Central West North Central Mountain Pacific Total US
Pipelines 4,722 47,181 32,936 22,597 306,508 65,919 39,631 133,187 12,757 665,438
Construction 982 2,269 4,022 5,295 6,214 6,181 5,122 3,289 737 34,111
Financial Services 183 1,781 1,456 846 13,108 2,669 1,694 6,246 491 28,474
Information & Professional Services 1,393 12,141 8,771 5,591 69,215 16,355 10,105 34,426 3,019 161,016
Leisure & Other Services 499 4,875 3,961 2,440 34,978 7,218 4,283 16,163 1,344 75,761
Manufacturing 983 18,547 9,427 4,794 131,268 23,440 12,040 51,168 5,208 256,875
Natural Resources 42 540 577 483 5,172 961 471 1,325 232 9,803
Transportation & Utilities 141 1,637 1,216 812 11,050 2,371 1,404 4,791 394 23,816
Wholesale & Retail Trade 416 4,431 3,096 1,976 31,673 5,972 3,848 13,808 1,088 66,308
Misc. 83 960 410 360 3,830 752 664 1,971 244 9,274
Rail - 5,179 311 260 8,736 4,552 9,388 1,010 2,533 31,969
Construction - 1,117 71 71 2,118 929 2,371 253 514 7,444
Financial Services - 206 13 9 386 197 418 49 108 1,386
Information & Professional Services - 1,582 92 72 2,440 1,357 2,884 311 728 9,466
Leisure & Other Services - 582 39 29 1,058 555 1,116 131 307 3,817
Manufacturing - 832 44 31 1,262 764 1,016 95 462 4,506
Natural Resources - 83 7 8 187 78 125 14 47 549
Transportation & Utilities - 214 13 12 355 206 445 45 94 1,384
Wholesale & Retail Trade - 466 28 23 836 415 872 98 228 2,966
Misc. - 97 4 5 94 51 141 14 45 451
Marine 14 5,286 2,180 - 5,094 1,353 - - 5,297 19,224
Construction 3 1,049 522 - 1,185 296 - - 997 4,052
Financial Services - 225 97 - 223 59 - - 242 846
Information & Professional Services 6 1,500 679 - 1,442 410 - - 1,479 5,516
Leisure & Other Services 1 604 269 - 605 161 - - 667 2,307
Manufacturing 3 920 245 - 793 198 - - 975 3,134
Natural Resources - 89 40 - 92 21 - - 101 343
Transportation & Utilities - 260 102 - 210 68 - - 232 872
Wholesale & Retail Trade 1 545 198 - 481 124 - - 519 1,868
Misc. - 94 28 - 63 16 - - 85 286
Processing and Storage - 10,675 13,124 4,126 99,909 8,166 5,863 5,890 3,019 150,772
Construction - 1,954 2,230 1,373 18,325 1,152 1,042 1,552 529 28,157
Financial Services - 424 549 144 4,231 343 250 263 121 6,325
Information & Professional Services - 3,161 3,935 1,029 28,183 2,438 1,746 1,726 849 43,067
Leisure & Other Services - 1,174 1,538 424 11,477 941 648 714 344 17,260
Manufacturing - 2,244 2,812 564 22,126 1,999 1,223 763 719 32,450
Natural Resources - 148 242 73 1,649 117 73 63 51 2,416
Transportation & Utilities - 438 567 134 3,969 387 285 227 106 6,113
Wholesale & Retail Trade - 936 1,064 324 8,727 688 501 502 244 12,986
Misc. - 196 187 61 1,222 101 95 80 56 1,998
Common Infrastructure, Exc. Rail - 3,296 105 201 5,387 4,623 10,990 305 680 25,587
Construction - 712 22 54 1,275 935 2,778 72 128 5,976
Financial Services - 130 4 8 237 201 489 15 29 1,113
Information & Professional Services - 1,042 32 57 1,557 1,391 3,390 98 201 7,768
Leisure & Other Services - 374 13 23 661 567 1,306 42 84 3,070
Manufacturing - 487 15 24 753 770 1,173 26 126 3,374
Natural Resources - 59 3 6 125 81 145 6 17 442
Transportation & Utilities - 140 5 9 221 210 524 14 26 1,149
Wholesale & Retail Trade - 288 10 16 501 417 1,019 28 57 2,336
Misc. - 64 1 4 57 51 166 4 12 359
Total 4,736 71,615 48,666 27,183 425,639 84,612 65,869 140,391 24,285 892,996
Construction 985 7,101 6,867 6,793 29,117 9,493 11,313 5,166 2,905 79,740
Financial Services 183 2,766 2,119 1,007 18,185 3,469 2,851 6,573 991 38,144
Information & Professional Services 1,399 19,426 13,509 6,749 102,837 21,951 18,125 36,561 6,276 226,833
Leisure & Other Services 500 7,609 5,820 2,916 48,779 9,442 7,353 17,050 2,746 102,215
Manufacturing 986 23,030 12,543 5,413 156,202 27,171 15,452 52,052 7,490 300,339
Natural Resources 42 919 869 570 7,225 1,258 814 1,408 448 13,553
Transportation & Utilities 141 2,689 1,903 967 15,805 3,242 2,658 5,077 852 33,334
Wholesale & Retail Trade 417 6,666 4,396 2,339 42,218 7,616 6,240 14,436 2,136 86,464
Misc. 83 1,411 630 430 5,266 971 1,066 2,069 442 12,368
Northeast South Midwest West

Oil & Natural Gas Transportation & Storage Infrastructure: Status, Trends, & Economic Benefits
IHS Global Inc. 68
Base Case by Transport Mode:
GDP Contribution by Industry and US Census Division
Source: IHS 2013
Value Added ($M) New England Mid-Atlantic South Atlantic East South Central West South Central East North Central West North Central Mountain Pacific Total US
Pipelines 564.9 5,580.4 3,289.0 2,079.4 32,502.1 6,965.2 3,784.8 12,809.1 1,438.2 69,012.9
Construction 83.9 220.8 293.3 344.5 530.9 523.7 390.0 296.9 77.1 2,761.1
Financial Services 93.5 991.5 542.5 296.2 5,194.7 1,061.5 568.8 2,178.4 222.1 11,149.2
Information & Professional Services 148.7 1,420.2 832.6 487.7 6,542.5 1,593.7 930.0 3,242.5 348.2 15,546.2
Leisure & Other Services 25.2 266.6 183.9 100.0 1,516.7 313.2 177.1 800.1 74.7 3,457.5
Manufacturing 107.7 1,654.6 775.5 411.3 11,794.2 2,159.4 937.5 3,615.0 450.8 21,906.1
Natural Resources 7.9 77.8 54.0 48.2 856.9 146.3 54.6 214.1 28.2 1,488.0
Transportation & Utilities 40.8 330.4 239.9 160.7 2,117.3 456.0 265.9 753.6 79.2 4,443.8
Wholesale & Retail Trade 54.3 583.8 349.3 210.8 3,815.6 682.4 430.0 1,616.6 143.4 7,886.2
Misc. 3.0 34.7 18.0 20.2 133.1 29.1 30.7 91.8 14.4 374.9
Rail - 652.2 31.8 24.5 970.9 505.9 951.8 103.4 302.3 3,542.7
Construction - 99.6 4.9 4.3 153.1 75.1 173.7 19.3 49.5 579.5
Financial Services - 110.5 5.1 3.4 147.1 78.5 139.5 16.4 46.3 546.8
Information & Professional Services - 178.6 8.6 6.2 234.0 131.7 262.1 27.6 77.2 926.0
Leisure & Other Services - 31.7 1.8 1.2 46.1 24.5 46.6 6.3 16.4 174.7
Manufacturing - 97.9 4.6 3.3 139.8 85.0 103.9 10.2 53.0 498.0
Natural Resources - 13.3 0.7 0.8 48.7 12.8 14.1 2.6 5.7 98.8
Transportation & Utilities - 57.9 2.9 2.5 102.5 50.1 111.1 9.6 23.1 359.7
Wholesale & Retail Trade - 59.0 3.1 2.3 96.4 46.3 94.6 10.8 28.6 341.1
Misc. - 3.5 0.2 0.4 3.1 1.9 6.0 0.6 2.6 18.2
Marine 2.0 626.6 223.0 - 554.1 144.8 - - 608.9 2,159.3
Construction 0.3 82.3 35.3 - 87.3 22.9 - - 88.0 316.2
Financial Services 0.3 101.7 35.6 - 83.6 21.9 - - 90.0 333.2
Information & Professional Services 0.6 152.8 63.2 - 137.4 38.4 - - 143.7 536.0
Leisure & Other Services 0.1 29.0 12.1 - 26.3 6.6 - - 32.3 106.3
Manufacturing 0.4 110.8 25.3 - 83.9 21.7 - - 114.5 356.6
Natural Resources 0.0 17.8 4.2 - 21.2 3.5 - - 16.5 63.2
Transportation & Utilities 0.1 63.5 24.9 - 57.4 15.8 - - 57.1 218.8
Wholesale & Retail Trade 0.2 65.6 21.3 - 54.9 13.4 - - 62.2 217.6
Misc. 0.0 3.1 1.1 - 2.2 0.5 - - 4.6 11.6
Processing and Storage - 1,266.8 1,345.8 371.4 10,893.3 880.7 572.4 602.0 355.6 16,288.1
Construction - 170.7 165.2 90.6 1,412.9 96.0 77.1 129.4 53.7 2,195.7
Financial Services - 208.4 212.7 53.2 1,653.2 132.3 81.5 95.8 54.2 2,491.4
Information & Professional Services - 342.4 382.4 91.1 2,745.1 234.5 156.7 161.1 93.7 4,207.0
Leisure & Other Services - 61.2 74.0 17.5 507.6 40.7 26.5 35.6 18.9 782.0
Manufacturing - 231.2 235.3 49.9 2,080.5 195.2 103.5 62.1 70.1 3,027.8
Natural Resources - 21.7 23.2 6.1 321.1 16.2 8.7 10.7 5.6 413.3
Transportation & Utilities - 108.5 126.5 26.0 1,129.7 86.3 60.8 46.8 25.3 1,609.8
Wholesale & Retail Trade - 115.3 116.9 33.9 998.9 75.5 52.9 56.8 30.9 1,481.0
Misc. - 7.5 9.7 3.0 44.2 4.1 4.7 3.7 3.2 80.0
Common Infrastructure, Exc. Rail - 436.8 11.3 19.4 626.8 519.4 1,118.6 33.1 84.8 2,850.0
Construction - 65.9 1.6 3.3 95.0 76.4 204.2 5.7 13.0 465.2
Financial Services - 75.2 1.8 2.7 95.0 80.8 164.3 5.3 12.9 437.9
Information & Professional Services - 123.3 3.1 5.0 154.4 136.2 309.1 9.1 22.4 762.6
Leisure & Other Services - 21.6 0.7 1.0 29.8 25.3 54.8 2.1 4.8 140.0
Manufacturing - 59.4 1.5 2.5 84.7 85.5 120.4 2.9 14.1 370.9
Natural Resources - 9.7 0.3 0.6 35.8 13.3 16.3 1.0 2.0 79.0
Transportation & Utilities - 41.9 1.2 2.2 71.2 52.9 131.7 3.6 7.6 312.2
Wholesale & Retail Trade - 37.6 1.0 1.8 59.0 47.0 110.9 3.2 7.4 267.8
Misc. - 2.2 0.1 0.3 1.9 1.9 7.0 0.2 0.7 14.3
Total 566.9 8,562.7 4,900.9 2,494.7 45,547.1 9,015.9 6,427.6 13,547.5 2,789.8 93,853.0
Construction 84.1 639.3 500.4 442.8 2,279.3 794.1 845.1 451.4 281.3 6,317.7
Financial Services 93.8 1,487.4 797.9 355.4 7,173.7 1,374.9 954.1 2,295.9 425.4 14,958.5
Information & Professional Services 149.3 2,217.4 1,289.9 590.0 9,813.3 2,134.3 1,658.0 3,440.4 685.1 21,977.8
Leisure & Other Services 25.3 410.0 272.4 119.7 2,126.5 410.5 305.0 844.2 147.1 4,660.5
Manufacturing 108.0 2,154.0 1,042.3 467.0 14,183.1 2,546.8 1,265.4 3,690.2 702.5 26,159.2
Natural Resources 7.9 140.3 82.2 55.7 1,283.8 192.1 93.7 228.4 58.2 2,142.3
Transportation & Utilities 41.0 602.3 395.3 191.4 3,478.0 661.1 569.5 813.5 192.3 6,944.3
Wholesale & Retail Trade 54.5 861.2 491.6 248.7 5,024.8 864.5 688.4 1,687.4 272.5 10,193.7
Misc. 3.0 51.0 28.9 23.9 184.5 37.6 48.4 96.2 25.5 498.9
Northeast South Midwest West

Oil & Natural Gas Transportation & Storage Infrastructure: Status, Trends, & Economic Benefits
IHS Global Inc. 69
Base Case by Transport Mode:
Labor Income Impact by Industry and US Census Division
Source: IHS 2013
Labor Income ($M) New England Mid-Atlantic South Atlantic East South Central West South Central East North Central West North Central Mountain Pacific Total US
Pipelines 367.1 3,530.6 2,055.1 1,348.0 19,905.1 4,413.1 2,412.5 7,923.8 915.1 42,870.3
Construction 70.0 185.5 244.0 286.7 449.0 436.8 324.9 253.2 64.7 2,314.7
Financial Services 35.4 408.2 175.0 92.3 1,755.1 379.3 205.1 748.9 82.7 3,882.1
Information & Professional Services 118.8 1,077.5 648.1 401.0 4,905.6 1,246.0 718.2 2,419.1 258.5 11,792.9
Leisure & Other Services 17.8 184.6 125.1 69.3 1,040.0 215.5 123.3 540.8 49.7 2,365.9
Manufacturing 69.2 1,084.8 503.1 264.5 7,894.3 1,421.9 610.5 2,437.3 304.3 14,589.9
Natural Resources 3.3 35.4 25.6 21.2 344.1 57.4 18.8 85.4 13.4 604.6
Transportation & Utilities 17.2 171.5 113.2 73.6 1,120.2 227.8 131.3 419.8 42.7 2,317.3
Wholesale & Retail Trade 32.0 341.9 206.7 125.3 2,261.5 403.0 253.5 947.5 84.4 4,655.8
Misc. 3.4 41.1 14.2 14.2 135.4 25.4 27.0 71.8 14.7 347.2
Rail - 420.7 20.3 15.9 607.8 323.6 616.6 66.6 196.3 2,267.8
Construction - 82.8 4.0 3.6 127.0 62.4 144.3 16.0 41.2 481.4
Financial Services - 41.7 1.6 1.0 45.3 25.9 45.9 5.1 15.6 182.2
Information & Professional Services - 143.9 6.9 5.2 191.6 108.1 215.6 22.4 61.0 754.7
Leisure & Other Services - 21.9 1.2 0.8 31.4 16.8 32.2 4.3 10.9 119.5
Manufacturing - 61.7 3.0 2.2 90.6 55.3 68.4 6.9 35.4 323.3
Natural Resources - 6.1 0.3 0.4 18.9 5.3 5.5 1.1 2.6 40.2
Transportation & Utilities - 24.2 1.2 1.0 42.8 20.8 43.6 4.1 10.4 148.1
Wholesale & Retail Trade - 34.7 1.8 1.4 57.4 27.4 56.0 6.3 16.9 201.9
Misc. - 3.8 0.1 0.3 2.8 1.6 5.1 0.4 2.3 16.4
Marine 1.3 395.0 142.1 - 350.5 93.1 - - 387.2 1,369.2
Construction 0.2 68.4 29.3 - 72.5 19.0 - - 73.3 262.8
Financial Services 0.1 37.3 11.3 - 26.8 7.4 - - 29.1 112.0
Information & Professional Services 0.4 121.3 51.8 - 112.2 31.8 - - 113.8 431.3
Leisure & Other Services 0.1 20.2 8.3 - 18.0 4.6 - - 21.5 72.6
Manufacturing 0.2 71.3 16.1 - 54.3 14.1 - - 77.1 233.3
Natural Resources 0.0 7.6 2.0 - 8.2 1.4 - - 6.6 25.7
Transportation & Utilities 0.1 27.2 9.7 - 23.9 6.4 - - 25.1 92.4
Wholesale & Retail Trade 0.1 38.6 12.6 - 32.6 7.9 - - 36.8 128.7
Misc. 0.0 3.1 0.9 - 2.0 0.5 - - 3.9 10.4
Processing and Storage - 815.1 850.6 248.0 6,849.9 560.4 366.7 392.5 231.2 10,314.5
Construction - 142.0 137.4 75.4 1,173.4 80.0 64.1 107.3 44.7 1,824.4
Financial Services - 78.1 71.2 16.9 541.0 46.0 28.5 31.2 19.5 832.4
Information & Professional Services - 274.8 308.3 75.9 2,244.3 191.8 127.9 129.3 73.6 3,425.9
Leisure & Other Services - 42.2 50.5 12.3 347.8 28.1 18.4 24.1 12.6 536.1
Manufacturing - 146.4 145.1 31.1 1,325.1 125.1 65.5 40.0 45.6 1,923.8
Natural Resources - 9.9 11.2 2.7 127.5 6.4 3.0 4.3 2.7 167.7
Transportation & Utilities - 46.1 50.6 11.5 455.2 35.0 24.1 20.1 11.3 654.0
Wholesale & Retail Trade - 67.7 69.0 20.1 593.2 44.5 31.2 33.3 18.2 877.2
Misc. - 7.9 7.4 2.2 42.2 3.5 3.9 2.9 3.0 73.0
Common Infrastructure, Exc. Rail - 281.0 7.1 12.5 389.1 331.6 724.6 21.0 54.5 1,821.5
Construction - 54.8 1.4 2.8 78.8 63.5 169.6 4.8 10.8 386.4
Financial Services - 28.7 0.6 0.8 28.9 26.6 54.1 1.6 4.2 145.5
Information & Professional Services - 99.7 2.5 4.2 127.2 112.0 254.4 7.5 17.8 625.3
Leisure & Other Services - 14.8 0.4 0.7 20.2 17.3 37.9 1.4 3.1 95.8
Manufacturing - 37.1 1.0 1.6 54.5 55.5 79.2 1.9 9.4 240.3
Natural Resources - 4.5 0.1 0.3 13.9 5.6 6.4 0.4 1.0 32.2
Transportation & Utilities - 16.8 0.5 0.8 28.6 21.6 51.4 1.4 3.2 124.4
Wholesale & Retail Trade - 22.1 0.6 1.1 35.1 27.8 65.6 1.9 4.4 158.6
Misc. - 2.6 0.0 0.2 1.8 1.6 6.0 0.1 0.6 13.0
Total 368.4 5,442.5 3,075.2 1,624.4 28,102.5 5,721.9 4,120.3 8,403.9 1,784.2 58,643.3
Construction 70.2 533.5 416.0 368.5 1,900.7 661.9 702.9 381.3 234.7 5,269.7
Financial Services 35.5 594.0 259.7 111.0 2,397.1 485.2 333.7 786.8 151.1 5,154.2
Information & Professional Services 119.3 1,717.3 1,017.7 486.3 7,581.0 1,689.7 1,316.1 2,578.3 524.6 17,030.2
Leisure & Other Services 17.8 283.6 185.6 83.0 1,457.3 282.3 211.8 570.6 97.8 3,189.9
Manufacturing 69.4 1,401.3 668.3 299.4 9,418.8 1,672.0 823.5 2,486.1 471.8 17,310.6
Natural Resources 3.4 63.5 39.2 24.5 512.6 76.0 33.7 91.2 26.3 870.4
Transportation & Utilities 17.2 285.9 175.2 87.0 1,670.8 311.6 250.4 445.4 92.7 3,336.2
Wholesale & Retail Trade 32.1 504.9 290.8 147.8 2,979.8 510.7 406.3 989.1 160.6 6,022.2
Misc. 3.4 58.5 22.7 16.9 184.2 32.5 41.9 75.2 24.6 459.9
Northeast South Midwest West

Oil & Natural Gas Transportation & Storage Infrastructure: Status, Trends, & Economic Benefits
IHS Global Inc. 70
Base Case by Transport Mode:
Direct, Indirect and Induced Employment by US Census Division
Source: IHS 2013
Base Case by Transport Mode:
Direct, Indirect and Induced GDP Contribution by US Census Division
Source: IHS 2013
Employment New England Mid-Atlantic South Atlantic East South Central West South Central East North Central West North Central Mountain Pacific Total US
Pipelines 4,722 47,179 32,946 22,596 306,513 65,918 39,628 133,186 12,756 665,444
Direct 1,635 12,624 9,680 8,742 77,845 16,046 12,886 38,413 3,062 180,933
Indirect 1,206 16,575 10,466 6,152 116,088 23,985 12,476 48,517 4,908 240,373
Induced 1,881 17,980 12,800 7,702 112,580 25,887 14,266 46,256 4,786 244,138
Rail - 5,179 311 260 8,736 4,552 9,388 1,010 2,533 31,969
Direct - 1,600 96 98 2,858 1,300 3,388 348 703 10,391
Indirect - 1,403 86 69 2,477 1,300 2,327 268 743 8,673
Induced - 2,176 129 93 3,401 1,952 3,673 394 1,087 12,905
Marine 14 5,286 2,180 - 5,094 1,353 - - 5,297 19,224
Direct 5 1,512 733 - 1,719 422 - - 1,438 5,829
Indirect 3 1,623 569 - 1,396 362 - - 1,642 5,595
Induced 6 2,151 878 - 1,979 569 - - 2,217 7,800
Processing and Storage - 10,675 13,124 4,126 99,909 8,166 5,863 5,890 3,019 150,772
Direct - 3,487 4,497 1,759 35,436 2,590 2,222 2,237 894 53,122
Indirect - 2,850 3,351 934 26,070 2,161 1,401 1,350 850 38,967
Induced - 4,338 5,276 1,433 38,403 3,415 2,240 2,303 1,275 58,683
Common Infrastructure, Exc. Rail - 3,296 105 201 5,387 4,623 10,990 305 680 25,587
Direct - 1,009 31 75 1,748 1,323 3,967 103 184 8,440
Indirect - 877 29 54 1,514 1,312 2,719 81 198 6,784
Induced - 1,410 45 72 2,125 1,988 4,304 121 298 10,363
Total 4,736 71,615 48,666 27,183 425,639 84,612 65,869 140,391 24,285 892,996
Direct 1,640 20,232 15,037 10,674 119,606 21,681 22,463 41,101 6,281 258,715
Indirect 1,209 23,328 14,501 7,209 147,545 29,120 18,923 50,216 8,341 300,392
Induced 1,887 28,055 19,128 9,300 158,488 33,811 24,483 49,074 9,663 333,889
Northeast South Midwest West
Value Added New England Mid-Atlantic South Atlantic East South Central West South Central East North Central West North Central Mountain Pacific Total US
Pipelines 565 5,580 3,289 2,079 32,502 6,965 3,785 12,809 1,438 69,013
Direct 171 1,085 806 693 6,825 1,427 1,000 2,604 262 14,873
Indirect 169 2,267 1,182 669 13,711 2,826 1,390 5,457 611 28,282
Induced 224 2,228 1,301 717 11,965 2,712 1,396 4,749 565 25,858
Rail - 652 32 24 971 506 952 103 302 3,543
Direct - 182 9 8 285 141 336 33 85 1,079
Indirect - 202 10 8 328 162 263 31 94 1,098
Induced - 268 13 8 358 203 353 39 123 1,366
Marine 2 627 223 - 554 145 - - 609 2,159
Direct 1 159 70 - 170 44 - - 173 617
Indirect 1 227 66 - 179 44 - - 201 717
Induced 1 241 87 - 205 57 - - 235 825
Processing and Storage - 1,267 1,346 371 10,893 881 572 602 356 16,288
Direct - 368 406 135 3,584 274 203 206 99 5,275
Indirect - 388 390 101 3,247 256 155 158 108 4,802
Induced - 510 550 135 4,063 351 214 239 149 6,211
Common Infrastructure, Exc. Rail - 437 11 19 627 519 1,119 33 85 2,850
Direct - 124 3 7 187 146 396 11 24 898
Indirect - 131 3 6 207 164 308 10 26 855
Induced - 182 5 7 232 209 415 13 35 1,097
Total 567 8,563 4,901 2,495 45,547 9,016 6,428 13,547 2,790 93,853
Direct 172 1,918 1,294 844 11,051 2,032 1,935 2,853 644 22,742
Indirect 170 3,216 1,651 784 17,672 3,452 2,116 5,655 1,039 35,754
Induced 225 3,429 1,957 867 16,824 3,532 2,377 5,039 1,107 35,358
Northeast South Midwest West

Oil & Natural Gas Transportation & Storage Infrastructure: Status, Trends, & Economic Benefits
IHS Global Inc. 71
Base Case by Transport Mode:
Direct, Indirect and Induced Labor Income by US Census Division
Source: IHS 2013
Base Case by Transport Mode:
Government Revenues
Source: IHS 2013
Labor Income New England Mid-Atlantic South Atlantic East South Central West South Central East North Central West North Central Mountain Pacific Total US
Pipelines 367 3,531 2,055 1,348 19,905 4,413 2,412 7,924 915 42,870
Direct 128 767 588 522 4,720 1,044 736 1,794 188 10,489
Indirect 107 1,462 737 424 8,511 1,808 886 3,446 397 17,779
Induced 131 1,302 729 402 6,674 1,561 790 2,684 330 14,603
Rail - 421 20 16 608 324 617 67 196 2,268
Direct - 139 7 6 216 106 251 25 66 815
Indirect - 127 6 5 196 102 167 19 60 681
Induced - 155 7 5 196 116 199 22 71 771
Marine 1 395 142 - 351 93 - - 387 1,369
Direct 0 118 52 - 128 33 - - 129 460
Indirect 0 139 41 - 109 28 - - 125 443
Induced 1 137 49 - 114 32 - - 133 466
Processing and Storage - 815 851 248 6,850 560 367 393 231 10,314
Direct - 273 291 105 2,576 194 145 157 75 3,817
Indirect - 246 247 66 1,998 164 99 100 69 2,990
Induced - 296 312 77 2,275 203 122 135 87 3,508
Common Infrastructure, Exc. Rail - 281 7 13 389 332 725 21 54 1,822
Direct - 93 2 5 140 109 295 8 18 671
Indirect - 83 2 4 123 103 195 6 16 531
Induced - 106 3 4 127 119 235 7 20 619
Total 368 5,442 3,075 1,624 28,102 5,722 4,120 8,404 1,784 58,643
Direct 129 1,389 941 639 7,781 1,486 1,427 1,985 476 16,252
Indirect 108 2,058 1,034 498 10,937 2,204 1,347 3,571 667 22,424
Induced 132 1,995 1,100 488 9,385 2,031 1,346 2,848 641 19,967
Northeast South Midwest West
Government Revenues
by Transport ModePipelines
Processing
& StorageMarine Rail
Common Infra.,
Exc. Rail
Total
US
Federal 9,491.5 2,241.3 297.6 490.1 393.8 12,914.4
Personal 7,877.2 1,872.2 248.2 410.4 329.4 10,737.3
Corporate 1,614.3 369.0 49.4 79.8 64.4 2,177.0
0.0
State & Local 6,236.8 1,442.5 198.0 321.3 259.9 8,458.5
Personal 1,313.8 315.7 41.9 69.4 55.7 1,796.5
Corporate 4,923.0 1,126.8 156.1 251.9 204.2 6,661.9
Total Government Revenues 15,728.4 3,683.7 495.6 811.4 653.7 21,372.8
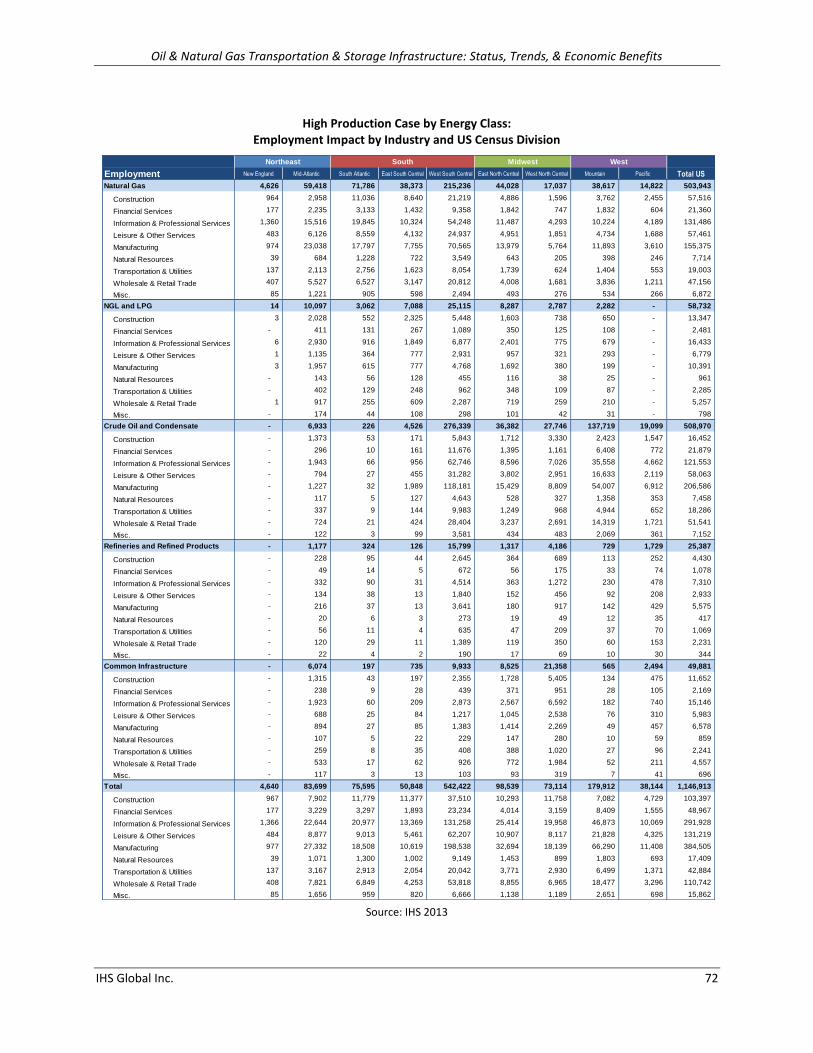
Oil & Natural Gas Transportation & Storage Infrastructure: Status, Trends, & Economic Benefits
IHS Global Inc. 72
High Production Case by Energy Class:
Employment Impact by Industry and US Census Division
Source: IHS 2013
Employment New England Mid-Atlantic South Atlantic East South Central West South Central East North Central West North Central Mountain Pacific Total US
Natural Gas 4,626 59,418 71,786 38,373 215,236 44,028 17,037 38,617 14,822 503,943
Construction 964 2,958 11,036 8,640 21,219 4,886 1,596 3,762 2,455 57,516
Financial Services 177 2,235 3,133 1,432 9,358 1,842 747 1,832 604 21,360
Information & Professional Services 1,360 15,516 19,845 10,324 54,248 11,487 4,293 10,224 4,189 131,486
Leisure & Other Services 483 6,126 8,559 4,132 24,937 4,951 1,851 4,734 1,688 57,461
Manufacturing 974 23,038 17,797 7,755 70,565 13,979 5,764 11,893 3,610 155,375
Natural Resources 39 684 1,228 722 3,549 643 205 398 246 7,714
Transportation & Utilities 137 2,113 2,756 1,623 8,054 1,739 624 1,404 553 19,003
Wholesale & Retail Trade 407 5,527 6,527 3,147 20,812 4,008 1,681 3,836 1,211 47,156
Misc. 85 1,221 905 598 2,494 493 276 534 266 6,872
NGL and LPG 14 10,097 3,062 7,088 25,115 8,287 2,787 2,282 - 58,732
Construction 3 2,028 552 2,325 5,448 1,603 738 650 - 13,347
Financial Services - 411 131 267 1,089 350 125 108 - 2,481
Information & Professional Services 6 2,930 916 1,849 6,877 2,401 775 679 - 16,433
Leisure & Other Services 1 1,135 364 777 2,931 957 321 293 - 6,779
Manufacturing 3 1,957 615 777 4,768 1,692 380 199 - 10,391
Natural Resources - 143 56 128 455 116 38 25 - 961
Transportation & Utilities - 402 129 248 962 348 109 87 - 2,285
Wholesale & Retail Trade 1 917 255 609 2,287 719 259 210 - 5,257
Misc. - 174 44 108 298 101 42 31 - 798
Crude Oil and Condensate - 6,933 226 4,526 276,339 36,382 27,746 137,719 19,099 508,970
Construction - 1,373 53 171 5,843 1,712 3,330 2,423 1,547 16,452
Financial Services - 296 10 161 11,676 1,395 1,161 6,408 772 21,879
Information & Professional Services - 1,943 66 956 62,746 8,596 7,026 35,558 4,662 121,553
Leisure & Other Services - 794 27 455 31,282 3,802 2,951 16,633 2,119 58,063
Manufacturing - 1,227 32 1,989 118,181 15,429 8,809 54,007 6,912 206,586
Natural Resources - 117 5 127 4,643 528 327 1,358 353 7,458
Transportation & Utilities - 337 9 144 9,983 1,249 968 4,944 652 18,286
Wholesale & Retail Trade - 724 21 424 28,404 3,237 2,691 14,319 1,721 51,541
Misc. - 122 3 99 3,581 434 483 2,069 361 7,152
Refineries and Refined Products - 1,177 324 126 15,799 1,317 4,186 729 1,729 25,387
Construction - 228 95 44 2,645 364 689 113 252 4,430
Financial Services - 49 14 5 672 56 175 33 74 1,078
Information & Professional Services - 332 90 31 4,514 363 1,272 230 478 7,310
Leisure & Other Services - 134 38 13 1,840 152 456 92 208 2,933
Manufacturing - 216 37 13 3,641 180 917 142 429 5,575
Natural Resources - 20 6 3 273 19 49 12 35 417
Transportation & Utilities - 56 11 4 635 47 209 37 70 1,069
Wholesale & Retail Trade - 120 29 11 1,389 119 350 60 153 2,231
Misc. - 22 4 2 190 17 69 10 30 344
Common Infrastructure - 6,074 197 735 9,933 8,525 21,358 565 2,494 49,881
Construction - 1,315 43 197 2,355 1,728 5,405 134 475 11,652
Financial Services - 238 9 28 439 371 951 28 105 2,169
Information & Professional Services - 1,923 60 209 2,873 2,567 6,592 182 740 15,146
Leisure & Other Services - 688 25 84 1,217 1,045 2,538 76 310 5,983
Manufacturing - 894 27 85 1,383 1,414 2,269 49 457 6,578
Natural Resources - 107 5 22 229 147 280 10 59 859
Transportation & Utilities - 259 8 35 408 388 1,020 27 96 2,241
Wholesale & Retail Trade - 533 17 62 926 772 1,984 52 211 4,557
Misc. - 117 3 13 103 93 319 7 41 696
Total 4,640 83,699 75,595 50,848 542,422 98,539 73,114 179,912 38,144 1,146,913
Construction 967 7,902 11,779 11,377 37,510 10,293 11,758 7,082 4,729 103,397
Financial Services 177 3,229 3,297 1,893 23,234 4,014 3,159 8,409 1,555 48,967
Information & Professional Services 1,366 22,644 20,977 13,369 131,258 25,414 19,958 46,873 10,069 291,928
Leisure & Other Services 484 8,877 9,013 5,461 62,207 10,907 8,117 21,828 4,325 131,219
Manufacturing 977 27,332 18,508 10,619 198,538 32,694 18,139 66,290 11,408 384,505
Natural Resources 39 1,071 1,300 1,002 9,149 1,453 899 1,803 693 17,409
Transportation & Utilities 137 3,167 2,913 2,054 20,042 3,771 2,930 6,499 1,371 42,884
Wholesale & Retail Trade 408 7,821 6,849 4,253 53,818 8,855 6,965 18,477 3,296 110,742
Misc. 85 1,656 959 820 6,666 1,138 1,189 2,651 698 15,862
Northeast South Midwest West

Oil & Natural Gas Transportation & Storage Infrastructure: Status, Trends, & Economic Benefits
IHS Global Inc. 73
High Production Case by Energy Class:
GDP Contribution by Industry and US Census Division
Source: IHS 2013
Value Added ($M) New England Mid-Atlantic South Atlantic East South Central West South Central East North Central West North Central Mountain Pacific Total US
Natural Gas 560.0 7,037.6 7,286.8 3,616.4 23,014.0 4,657.2 1,584.7 3,708.6 1,743.2 53,208.4
Construction 83.7 286.7 810.8 576.6 1,674.1 407.9 122.4 316.5 247.5 4,526.2
Financial Services 92.2 1,246.2 1,187.3 509.1 3,558.4 697.5 232.7 603.6 260.0 8,386.9
Information & Professional Services 145.9 1,809.8 1,899.1 915.1 5,145.3 1,088.6 382.0 924.1 452.7 12,762.5
Leisure & Other Services 24.4 334.6 398.3 171.5 1,081.2 210.1 73.8 230.5 90.6 2,615.1
Manufacturing 108.6 2,057.3 1,508.3 669.9 6,389.2 1,312.2 430.4 847.7 340.9 13,664.4
Natural Resources 8.5 97.3 122.7 77.0 684.0 115.1 26.6 75.5 35.7 1,242.6
Transportation & Utilities 40.2 435.3 588.3 335.9 1,954.3 357.4 117.8 244.5 146.9 4,220.8
Wholesale & Retail Trade 53.4 726.2 733.4 331.7 2,439.8 449.7 185.6 439.6 154.0 5,513.3
Misc. 3.0 44.1 38.6 29.7 87.8 18.7 13.4 26.5 14.9 276.8
NGL and LPG 1.9 1,181.0 316.2 669.0 2,746.0 911.8 266.3 244.2 - 6,336.5
Construction 0.3 174.2 41.0 156.6 418.4 138.3 54.3 55.4 - 1,038.5
Financial Services 0.3 193.3 50.7 98.4 417.0 141.4 38.0 39.9 - 979.0
Information & Professional Services 0.6 309.8 89.1 166.1 665.3 236.7 67.2 64.9 - 1,599.8
Leisure & Other Services 0.1 57.7 17.7 33.4 130.1 42.7 12.9 15.2 - 309.9
Manufacturing 0.4 209.7 51.7 80.3 471.0 172.9 36.1 19.9 - 1,042.1
Natural Resources 0.0 21.6 5.3 12.3 101.5 17.1 4.9 4.5 - 167.2
Transportation & Utilities 0.1 96.1 30.0 51.2 267.0 77.7 23.1 18.6 - 563.8
Wholesale & Retail Trade 0.2 112.1 28.4 65.6 265.0 81.1 27.5 24.5 - 604.4
Misc. 0.0 6.6 2.2 5.0 10.7 4.0 2.2 1.3 - 32.0
Crude Oil and Condensate - 817.3 22.5 399.1 29,555.0 3,816.9 2,670.8 13,290.3 2,139.9 52,711.8
Construction - 106.8 3.5 11.5 482.1 146.8 251.9 225.9 143.0 1,371.5
Financial Services - 132.9 3.6 57.8 4,764.2 583.4 405.7 2,280.8 329.3 8,557.8
Information & Professional Services - 196.2 6.0 83.5 6,021.8 859.4 658.9 3,388.6 512.3 11,726.6
Leisure & Other Services - 37.9 1.2 18.7 1,364.7 165.7 122.7 826.7 113.1 2,650.8
Manufacturing - 148.4 3.4 143.5 10,700.9 1,390.5 694.3 3,818.8 629.0 17,528.9
Natural Resources - 23.4 0.4 8.2 739.3 62.6 35.5 207.5 41.8 1,118.7
Transportation & Utilities - 80.7 1.9 21.2 1,922.4 217.3 177.3 764.2 130.1 3,315.1
Wholesale & Retail Trade - 87.0 2.3 46.3 3,437.2 374.1 302.8 1,683.8 219.7 6,153.1
Misc. - 4.1 0.1 8.4 122.4 17.1 21.7 94.0 21.6 289.3
Refineries and Refined Products - 140.2 33.1 11.3 1,751.0 141.6 417.0 75.9 199.8 2,769.9
Construction - 18.2 6.8 2.8 203.6 29.6 52.5 9.3 23.3 346.1
Financial Services - 22.8 5.4 1.6 269.8 22.1 60.2 11.9 29.7 423.4
Information & Professional Services - 34.3 8.8 2.7 444.5 35.2 116.8 21.5 50.0 713.8
Leisure & Other Services - 6.5 1.9 0.6 82.6 6.9 19.0 4.7 10.8 133.0
Manufacturing - 25.8 3.7 1.2 348.2 19.2 77.2 11.4 43.4 530.2
Natural Resources - 3.9 0.6 0.3 51.6 3.3 5.6 2.1 4.7 72.0
Transportation & Utilities - 13.3 2.6 0.9 184.2 11.1 45.2 7.8 17.4 282.5
Wholesale & Retail Trade - 14.5 3.2 1.1 159.8 13.7 37.3 6.8 18.7 255.1
Misc. - 0.8 0.2 0.1 6.7 0.6 3.1 0.5 1.8 13.8
Common Infrastructure - 804.8 20.8 71.2 1,156.9 957.5 2,172.6 60.9 311.3 5,555.9
Construction - 121.4 3.0 12.3 175.0 140.7 396.2 10.6 47.7 906.9
Financial Services - 138.8 3.4 10.0 175.4 149.1 319.7 9.7 47.5 853.7
Information & Professional Services - 227.1 5.8 18.4 284.6 250.9 600.7 16.8 82.3 1,486.7
Leisure & Other Services - 39.5 1.2 3.5 54.7 46.5 106.0 3.9 17.5 272.9
Manufacturing - 109.0 2.8 9.1 155.7 157.2 232.9 5.2 51.2 723.1
Natural Resources - 18.0 0.5 2.4 67.5 24.8 31.8 1.8 7.4 154.1
Transportation & Utilities - 77.5 2.2 8.0 131.8 98.0 256.6 6.6 27.9 608.6
Wholesale & Retail Trade - 69.3 1.9 6.6 108.8 86.7 215.6 5.9 27.3 522.1
Misc. - 4.1 0.1 0.9 3.4 3.5 13.2 0.3 2.4 27.9
Total 561.9 9,980.9 7,679.4 4,766.9 58,223.0 10,485.2 7,111.3 17,379.9 4,394.1 120,582.6
Construction 84.0 707.3 865.0 759.8 2,953.1 863.3 877.3 617.8 461.5 8,189.1
Financial Services 92.5 1,734.0 1,250.4 676.9 9,184.8 1,593.6 1,056.3 2,945.9 666.5 19,200.8
Information & Professional Services 146.4 2,577.2 2,008.7 1,185.8 12,561.5 2,470.8 1,825.6 4,416.0 1,097.3 28,289.4
Leisure & Other Services 24.5 476.2 420.3 227.6 2,713.3 471.9 334.6 1,081.1 232.1 5,981.6
Manufacturing 108.9 2,550.3 1,569.9 904.1 18,065.1 3,052.1 1,470.8 4,702.9 1,064.5 33,488.7
Natural Resources 8.5 164.2 129.5 100.1 1,644.0 222.9 104.3 291.4 89.6 2,754.6
Transportation & Utilities 40.3 703.0 625.0 417.2 4,459.7 761.4 620.0 1,041.7 322.3 8,990.7
Wholesale & Retail Trade 53.6 1,009.1 769.2 451.3 6,410.6 1,005.2 768.8 2,160.6 419.7 13,048.0
Misc. 3.0 59.6 41.3 44.2 230.9 43.9 53.6 122.6 40.7 639.8
Northeast South Midwest West

Oil & Natural Gas Transportation & Storage Infrastructure: Status, Trends, & Economic Benefits
IHS Global Inc. 74
High Production Case by Energy Class:
Labor Income Impact by Industry and US Census Division
Source: IHS 2013
Labor Income ($M) New England Mid-Atlantic South Atlantic East South Central West South Central East North Central West North Central Mountain Pacific Total US
Natural Gas 364.8 4,456.0 4,585.2 2,341.2 14,229.5 2,946.1 1,000.8 2,321.6 1,122.0 33,367.2
Construction 69.9 240.9 673.8 480.1 1,392.4 339.9 102.1 263.8 206.1 3,769.0
Financial Services 35.6 515.1 386.2 161.8 1,159.6 241.1 82.0 195.9 89.8 2,867.1
Information & Professional Services 116.8 1,379.9 1,501.6 763.8 4,041.7 865.5 293.7 706.7 358.7 10,028.4
Leisure & Other Services 17.3 231.9 271.6 119.3 739.1 144.5 51.3 155.4 60.4 1,790.8
Manufacturing 69.7 1,346.1 968.2 425.7 4,210.3 862.8 284.4 568.1 223.4 8,958.8
Natural Resources 3.5 44.5 57.5 33.2 269.0 43.7 8.6 28.7 15.8 504.5
Transportation & Utilities 16.9 220.0 261.4 138.8 885.0 166.8 58.1 125.0 62.8 1,934.9
Wholesale & Retail Trade 31.5 425.1 434.0 196.8 1,447.8 265.8 109.4 258.0 90.8 3,259.2
Misc. 3.6 52.4 31.0 21.6 84.5 15.9 11.1 20.0 14.2 254.4
NGL and LPG 1.3 761.3 199.9 444.5 1,731.2 588.3 174.2 159.3 - 4,060.0
Construction 0.2 144.8 34.0 130.2 347.2 115.0 45.1 45.9 - 862.4
Financial Services 0.1 70.0 16.7 30.9 133.6 49.8 12.7 12.8 - 326.6
Information & Professional Services 0.4 248.0 71.7 137.5 539.9 191.7 54.1 51.6 - 1,294.9
Leisure & Other Services 0.1 39.8 12.0 23.2 88.6 29.4 8.9 10.2 - 212.1
Manufacturing 0.2 134.1 32.3 51.8 302.3 111.0 23.7 13.3 - 668.6
Natural Resources 0.0 9.7 2.6 5.6 39.7 6.9 1.6 1.8 - 67.9
Transportation & Utilities 0.1 42.3 12.1 22.7 112.2 33.2 10.1 8.2 - 240.7
Wholesale & Retail Trade 0.1 66.0 16.8 39.0 157.5 47.8 16.3 14.4 - 357.8
Misc. 0.0 6.7 1.7 3.8 10.4 3.5 1.8 1.1 - 29.0
Crude Oil and Condensate - 514.7 14.4 248.9 18,141.4 2,412.2 1,700.3 8,223.8 1,361.7 32,617.6
Construction - 88.8 2.9 9.8 407.9 123.4 210.0 195.1 119.7 1,157.7
Financial Services - 48.4 1.2 19.8 1,639.1 219.5 150.6 794.7 120.3 2,993.6
Information & Professional Services - 155.2 4.8 64.5 4,523.3 661.4 506.6 2,521.8 383.1 8,820.9
Leisure & Other Services - 26.4 0.9 13.1 938.0 114.6 85.8 559.5 75.3 1,813.6
Manufacturing - 95.6 2.1 92.5 7,154.6 916.8 447.4 2,576.2 425.8 11,711.0
Natural Resources - 10.0 0.2 3.9 299.5 25.1 12.3 84.4 19.2 454.7
Transportation & Utilities - 35.2 0.8 12.4 1,013.7 115.7 89.4 431.2 67.8 1,766.1
Wholesale & Retail Trade - 51.2 1.3 27.4 2,036.7 220.6 178.4 986.5 129.4 3,631.6
Misc. - 3.9 0.1 5.6 128.6 15.1 19.8 74.4 20.9 268.4
Refineries and Refined Products - 88.6 21.4 7.5 1,095.5 92.6 266.8 47.8 126.8 1,746.9
Construction - 15.2 5.6 2.3 169.1 24.6 43.7 7.8 19.4 287.7
Financial Services - 8.5 1.7 0.5 88.2 7.5 21.5 3.9 10.1 141.9
Information & Professional Services - 27.1 7.0 2.3 363.7 28.4 95.5 17.4 39.2 580.6
Leisure & Other Services - 4.5 1.3 0.4 56.6 4.7 13.3 3.2 7.2 91.2
Manufacturing - 16.5 2.3 0.8 221.7 12.5 48.4 7.3 28.7 338.2
Natural Resources - 1.7 0.3 0.1 20.9 1.3 2.0 0.9 2.0 29.2
Transportation & Utilities - 5.8 1.1 0.4 74.0 5.0 17.7 3.1 7.6 114.6
Wholesale & Retail Trade - 8.5 1.9 0.7 94.9 8.1 22.0 4.0 11.0 151.1
Misc. - 0.8 0.2 0.1 6.3 0.6 2.7 0.4 1.6 12.6
Common Infrastructure - 517.7 13.1 46.0 717.5 611.3 1,406.9 38.7 199.8 3,550.9
Construction - 100.9 2.5 10.3 145.2 117.0 329.0 8.8 39.7 753.3
Financial Services - 53.1 1.1 3.0 53.4 49.1 105.4 2.9 15.6 283.6
Information & Professional Services - 183.8 4.7 15.6 234.7 206.5 494.6 13.7 65.4 1,219.0
Leisure & Other Services - 27.1 0.8 2.4 37.1 31.8 73.4 2.6 11.5 186.8
Manufacturing - 68.0 1.8 5.9 100.0 102.1 153.0 3.5 34.1 468.4
Natural Resources - 8.3 0.2 1.1 26.1 10.4 12.5 0.7 3.5 62.8
Transportation & Utilities - 31.1 0.9 3.1 53.0 40.0 100.2 2.6 11.7 242.5
Wholesale & Retail Trade - 40.7 1.1 3.9 64.8 51.4 127.6 3.5 16.1 309.1
Misc. - 4.7 0.1 0.6 3.2 3.0 11.3 0.2 2.2 25.4
Total 366.1 6,338.3 4,834.1 3,088.1 35,915.1 6,650.5 4,549.1 10,791.1 2,810.3 75,342.7
Construction 70.1 590.6 718.8 632.7 2,461.8 720.0 729.9 521.2 385.0 6,830.2
Financial Services 35.8 695.0 406.8 216.0 3,073.9 566.9 372.3 1,010.3 235.8 6,612.8
Information & Professional Services 117.2 1,994.0 1,589.8 983.7 9,703.3 1,953.6 1,444.5 3,311.3 846.4 21,943.8
Leisure & Other Services 17.3 329.8 286.5 158.3 1,859.4 325.1 232.7 730.8 154.4 4,094.4
Manufacturing 70.0 1,660.3 1,006.7 576.6 11,988.9 2,005.1 956.8 3,168.3 712.1 22,145.0
Natural Resources 3.6 74.1 60.9 44.0 655.2 87.4 37.0 116.5 40.5 1,119.1
Transportation & Utilities 17.0 334.3 276.3 177.4 2,137.9 360.6 275.4 570.1 149.9 4,298.9
Wholesale & Retail Trade 31.6 591.5 455.2 267.8 3,801.7 593.7 453.6 1,266.4 247.3 7,708.8
Misc. 3.6 68.5 33.0 31.6 233.1 38.1 46.7 96.1 38.9 589.7
Northeast South Midwest West

Oil & Natural Gas Transportation & Storage Infrastructure: Status, Trends, & Economic Benefits
IHS Global Inc. 75
High Production Case by Energy Class:
Direct, Indirect and Induced Employment by US Census Division
Source: IHS 2013
High Production Case by Energy Class:
Direct, Indirect and Induced GDP Contribution by US Census Division
Source: IHS 2013
Employment New England Mid-Atlantic South Atlantic East South Central West South Central East North Central West North Central Mountain Pacific Total US
Natural Gas 4,626 59,418 71,786 38,373 215,236 44,028 17,037 38,617 14,822 503,943
Direct 1,607 16,161 22,538 15,539 65,214 11,832 5,588 12,347 4,634 155,460
Indirect 1,179 20,567 21,059 9,417 69,422 14,656 5,454 12,638 4,157 158,549
Induced 1,840 22,690 28,189 13,417 80,600 17,540 5,995 13,632 6,031 189,934
NGL and LPG 14 10,097 3,062 7,088 25,115 8,287 2,787 2,282 - 58,732
Direct 5 3,206 1,047 2,813 8,652 2,528 1,007 799 - 20,057
Indirect 3 2,774 788 1,749 6,780 2,220 698 557 - 15,569
Induced 6 4,117 1,227 2,526 9,683 3,539 1,082 926 - 23,106
Crude Oil and Condensate - 6,933 226 4,526 276,339 36,382 27,746 137,719 19,099 508,970
Direct - 1,952 70 1,405 69,659 7,732 8,748 39,175 4,464 133,205
Indirect - 2,164 63 1,664 104,485 14,729 9,003 50,636 7,250 189,994
Induced - 2,817 93 1,457 102,195 13,921 9,995 47,908 7,385 185,771
Refineries and Refined Products - 1,177 324 126 15,799 1,317 4,186 729 1,729 25,387
Direct - 333 115 54 5,419 441 1,596 268 479 8,705
Indirect - 362 82 31 4,230 343 981 182 529 6,740
Induced - 482 127 41 6,150 533 1,609 279 721 9,942
Common Infrastructure - 6,074 197 735 9,933 8,525 21,358 565 2,494 49,881
Direct - 1,862 59 278 3,227 2,441 7,716 193 680 16,456
Indirect - 1,614 55 193 2,787 2,420 5,279 147 725 13,220
Induced - 2,598 83 264 3,919 3,664 8,363 225 1,089 20,205
Total 4,640 83,699 75,595 50,848 542,422 98,539 73,114 179,912 38,144 1,146,913
Direct 1,612 23,514 23,829 20,089 152,171 24,974 24,655 52,782 10,257 333,883
Indirect 1,182 27,481 22,047 13,054 187,704 34,368 21,415 64,160 12,661 384,072
Induced 1,846 32,704 29,719 17,705 202,547 39,197 27,044 62,970 15,226 428,958
Northeast South Midwest West
Value Added
Contribution to GDP ($M) New England Mid-Atlantic South Atlantic East South Central West South Central East North Central West North Central Mountain Pacific Total US
Natural Gas 560 7,038 7,287 3,616 23,014 4,657 1,585 3,709 1,743 53,208
Direct 171 1,415 1,966 1,322 6,218 1,126 426 939 519 14,103
Indirect 168 2,813 2,426 1,033 8,311 1,730 593 1,396 526 18,995
Induced 222 2,810 2,894 1,262 8,485 1,802 565 1,374 698 20,111
NGL and LPG 2 1,181 316 669 2,746 912 266 244 - 6,337
Direct 1 334 96 232 853 263 89 78 - 1,946
Indirect 1 373 92 195 866 273 76 67 - 1,945
Induced 1 474 128 241 1,027 375 101 98 - 2,445
Crude Oil and Condensate - 817 23 399 29,555 3,817 2,671 13,290 2,140 52,712
Direct - 203 6 87 6,150 623 663 2,612 409 10,753
Indirect - 301 7 173 12,448 1,718 1,012 5,730 891 22,280
Induced - 313 9 139 10,957 1,476 996 4,948 840 19,678
Refineries and Refined Products - 140 33 11 1,751 142 417 76 200 2,770
Direct - 35 10 4 563 43 149 26 54 883
Indirect - 51 10 3 531 43 111 21 66 835
Induced - 55 13 4 658 56 158 29 80 1,052
Common Infrastructure - 805 21 71 1,157 958 2,173 61 311 5,556
Direct - 228 6 25 345 269 768 20 89 1,750
Indirect - 242 6 22 384 303 599 18 94 1,668
Induced - 335 9 24 428 385 805 23 128 2,138
Total 562 9,981 7,679 4,767 58,223 10,485 7,111 17,380 4,394 120,583
Direct 171 2,214 2,084 1,670 14,129 2,324 2,095 3,676 1,072 29,435
Indirect 168 3,781 2,542 1,426 22,540 4,067 2,391 7,232 1,576 45,723
Induced 222 3,986 3,054 1,671 21,555 4,094 2,625 6,472 1,746 45,425
Northeast South Midwest West

Oil & Natural Gas Transportation & Storage Infrastructure: Status, Trends, & Economic Benefits
IHS Global Inc. 76
High Production Case by Energy Class:
Direct, Indirect and Induced Labor Income by US Census Division
Source: IHS 2013
High Production Case by Energy Class: Government Revenues
Source: IHS 2013
Labor Income ($M) New England Mid-Atlantic South Atlantic East South Central West South Central East North Central West North Central Mountain Pacific Total US
Natural Gas 365 4,456 4,585 2,341 14,229 2,946 1,001 2,322 1,122 33,367
Direct 128 995 1,441 965 4,401 815 305 679 384 10,114
Indirect 107 1,817 1,517 659 5,113 1,100 376 873 335 11,896
Induced 130 1,644 1,627 717 4,715 1,031 320 770 403 11,357
NGL and LPG 1 761 200 444 1,731 588 174 159 - 4,060
Direct 0 254 69 183 635 197 69 62 - 1,469
Indirect 0 235 58 125 526 174 48 42 - 1,210
Induced 0 273 72 137 570 217 57 55 - 1,381
Crude Oil and Condensate - 515 14 249 18,141 2,412 1,700 8,224 1,362 32,618
Direct - 151 5 60 4,256 445 488 1,789 297 7,492
Indirect - 185 5 111 7,749 1,109 648 3,630 576 14,013
Induced - 179 5 78 6,136 858 564 2,805 488 11,113
Refineries and Refined Products - 89 21 8 1,095 93 267 48 127 1,747
Direct - 26 8 3 401 34 105 18 39 634
Indirect - 31 6 2 326 27 71 13 41 519
Induced - 31 7 2 368 32 90 16 46 594
Common Infrastructure - 518 13 46 717 611 1,407 39 200 3,551
Direct - 171 4 19 257 202 572 15 67 1,307
Indirect - 152 4 14 227 190 379 11 59 1,036
Induced - 194 5 14 233 220 455 13 73 1,207
Total 366 6,338 4,834 3,088 35,915 6,650 4,549 10,791 2,810 75,343
Direct 129 1,597 1,527 1,230 9,951 1,692 1,540 2,563 788 21,016
Indirect 107 2,420 1,590 910 13,942 2,600 1,523 4,569 1,012 28,674
Induced 131 2,321 1,717 947 12,022 2,358 1,486 3,659 1,011 25,652
Northeast South Midwest West
Government Revenues
by Energy Type ($M)Natural Gas NGL & LPG Oil Refined
Common
Infrastucture
Total
US
Federal 7,321.4 877.2 7,243.3 380.5 767.7 16,590.1
Personal 6,096.2 735.9 6,002.0 317.2 642.1 13,793.4
Corporate 1,225.2 141.3 1,241.3 63.3 125.6 2,796.7
0.0
State & Local 4,758.4 561.2 4,789.0 247.3 506.7 10,862.6
Personal 1,022.0 124.2 999.8 53.5 108.6 2,308.1
Corporate 3,736.5 436.9 3,789.3 193.8 398.0 8,554.5
Total Government Revenues12,079.9 1,438.4 12,032.3 627.8 1,274.4 27,452.8

Oil & Natural Gas Transportation & Storage Infrastructure: Status, Trends, & Economic Benefits
IHS Global Inc. 77
High Production Case by Transport Mode:
Employment Impact by Industry and US Census Division
Source: IHS 2013
Midwest West
Employment New England Mid-Atlantic South Atlantic East South Central West South Central East North Central West North Central Mountain Pacific Total US
Pipelines 4,626 53,633 56,054 24,408 385,385 75,771 45,098 169,843 15,960 830,778
Construction 964 2,058 8,136 5,627 7,327 6,326 5,126 4,383 924 40,871
Financial Services 177 2,017 2,464 908 16,473 3,040 1,922 7,955 610 35,566
Information & Professional Services 1,360 13,702 15,089 5,998 86,954 18,588 11,395 43,910 3,760 200,756
Leisure & Other Services 483 5,523 6,688 2,615 43,947 8,210 4,839 20,596 1,673 94,574
Manufacturing 974 21,715 14,732 5,327 165,628 28,085 14,523 65,078 6,546 322,608
Natural Resources 39 609 952 525 6,491 1,096 534 1,692 291 12,229
Transportation & Utilities 137 1,851 2,080 872 13,895 2,700 1,591 6,110 486 29,722
Wholesale & Retail Trade 407 5,055 5,212 2,136 39,841 6,854 4,405 17,602 1,359 82,871
Misc. 85 1,103 701 400 4,829 872 763 2,517 311 11,581
Rail - 5,350 312 427 8,890 4,605 10,047 1,013 3,099 33,743
Construction - 1,153 71 116 2,155 941 2,540 254 623 7,853
Financial Services - 213 13 16 393 200 448 49 132 1,464
Information & Professional Services - 1,633 92 120 2,482 1,374 3,087 312 897 9,997
Leisure & Other Services - 601 39 49 1,077 561 1,193 132 378 4,030
Manufacturing - 861 44 50 1,285 771 1,083 95 564 4,753
Natural Resources - 85 7 12 190 79 133 14 59 579
Transportation & Utilities - 222 13 19 362 208 478 45 117 1,464
Wholesale & Retail Trade - 482 29 37 851 420 935 98 275 3,127
Misc. - 100 4 8 95 51 150 14 54 476
Marine 14 7,763 2,836 - 7,229 2,029 - - 7,692 27,563
Construction 3 1,524 678 - 1,687 442 - - 1,432 5,766
Financial Services - 332 126 - 316 88 - - 353 1,215
Information & Professional Services 6 2,185 886 - 2,054 618 - - 2,137 7,886
Leisure & Other Services 1 891 349 - 858 241 - - 970 3,310
Manufacturing 3 1,370 318 - 1,114 297 - - 1,433 4,535
Natural Resources - 132 51 - 130 31 - - 148 492
Transportation & Utilities - 384 133 - 298 101 - - 337 1,253
Wholesale & Retail Trade 1 808 258 - 682 187 - - 758 2,694
Misc. - 137 37 - 90 24 - - 124 412
Processing and Storage - 13,615 16,286 25,610 135,453 11,443 6,224 8,747 10,022 227,400
Construction - 2,444 2,871 5,525 25,045 1,634 1,119 2,372 1,489 42,499
Financial Services - 536 690 954 5,811 483 266 390 402 9,532
Information & Professional Services - 4,067 4,878 7,136 38,187 3,422 1,851 2,551 2,868 64,960
Leisure & Other Services - 1,484 1,923 2,751 15,655 1,320 689 1,058 1,134 26,014
Manufacturing - 2,895 3,399 5,195 29,750 2,763 1,286 1,091 2,613 48,992
Natural Resources - 186 287 453 2,213 165 78 91 163 3,636
Transportation & Utilities - 568 682 1,145 5,262 547 301 330 378 9,213
Wholesale & Retail Trade - 1,183 1,340 2,046 11,935 970 534 748 789 19,545
Misc. - 252 216 405 1,595 139 100 116 186 3,009
Common Infrastructure, Exc. Rail - 3,338 107 403 5,465 4,691 11,745 309 1,371 27,429
Construction - 723 23 109 1,296 950 2,973 73 261 6,408
Financial Services - 131 4 15 241 203 523 15 58 1,190
Information & Professional Services - 1,057 32 115 1,581 1,412 3,625 100 407 8,329
Leisure & Other Services - 378 14 46 670 575 1,396 42 170 3,291
Manufacturing - 491 15 47 761 778 1,247 26 252 3,617
Natural Resources - 59 3 12 125 82 154 6 32 473
Transportation & Utilities - 142 5 18 225 215 560 14 53 1,232
Wholesale & Retail Trade - 293 10 34 509 424 1,091 29 115 2,505
Misc. - 64 1 7 57 52 176 4 23 384
Total 4,640 83,699 75,595 50,848 542,422 98,539 73,114 179,912 38,144 1,146,913
Construction 967 7,902 11,779 11,377 37,510 10,293 11,758 7,082 4,729 103,397
Financial Services 177 3,229 3,297 1,893 23,234 4,014 3,159 8,409 1,555 48,967
Information & Professional Services 1,366 22,644 20,977 13,369 131,258 25,414 19,958 46,873 10,069 291,928
Leisure & Other Services 484 8,877 9,013 5,461 62,207 10,907 8,117 21,828 4,325 131,219
Manufacturing 977 27,332 18,508 10,619 198,538 32,694 18,139 66,290 11,408 384,505
Natural Resources 39 1,071 1,300 1,002 9,149 1,453 899 1,803 693 17,409
Transportation & Utilities 137 3,167 2,913 2,054 20,042 3,771 2,930 6,499 1,371 42,884
Wholesale & Retail Trade 408 7,821 6,849 4,253 53,818 8,855 6,965 18,477 3,296 110,742
Misc. 85 1,656 959 820 6,666 1,138 1,189 2,651 698 15,862
Northeast South

Oil & Natural Gas Transportation & Storage Infrastructure: Status, Trends, & Economic Benefits
IHS Global Inc. 78
High Production Case by Transport Mode:
GDP Contribution by Industry and US Census Division
Source: IHS 2013
Value Added ($M) New England Mid-Atlantic South Atlantic East South Central West South Central East North Central West North Central Mountain Pacific Total US
Pipelines 560.0 6,325.9 5,670.3 2,258.7 40,867.9 8,001.8 4,293.2 16,349.8 1,805.7 86,133.3
Construction 83.7 205.6 600.2 370.4 629.2 541.8 391.4 394.9 97.6 3,314.8
Financial Services 92.2 1,126.4 928.4 320.5 6,534.3 1,214.4 644.8 2,781.6 278.6 13,921.1
Information & Professional Services 145.9 1,605.4 1,439.6 526.4 8,221.8 1,815.8 1,049.5 4,140.9 436.8 19,382.1
Leisure & Other Services 24.4 302.1 310.2 107.5 1,905.0 355.2 198.6 1,019.9 93.3 4,316.2
Manufacturing 108.6 1,927.3 1,245.0 456.9 14,881.7 2,576.4 1,123.0 4,600.5 568.5 27,487.9
Natural Resources 8.5 86.4 95.9 53.1 1,070.7 167.9 62.4 272.4 35.3 1,852.8
Transportation & Utilities 40.2 365.7 431.3 171.7 2,656.9 511.4 295.5 960.5 97.7 5,530.9
Wholesale & Retail Trade 53.4 667.1 589.9 229.0 4,800.6 785.1 492.8 2,062.0 179.5 9,859.3
Misc. 3.0 39.9 29.9 23.3 167.6 33.8 35.3 117.0 18.4 468.2
Rail - 672.9 31.9 40.6 987.9 511.8 1,017.7 103.7 373.0 3,739.5
Construction - 102.7 4.9 7.2 155.4 75.9 185.6 19.3 60.4 611.3
Financial Services - 114.1 5.2 5.7 149.6 79.5 149.4 16.5 57.1 577.1
Information & Professional Services - 184.1 8.6 10.4 237.8 133.2 280.4 27.7 95.9 978.1
Leisure & Other Services - 32.6 1.8 2.0 46.8 24.7 49.7 6.4 20.3 184.3
Manufacturing - 101.2 4.6 5.4 142.4 85.8 110.8 10.3 64.6 525.0
Natural Resources - 13.8 0.7 1.3 50.2 13.0 15.1 2.6 7.4 104.2
Transportation & Utilities - 59.8 2.9 4.3 104.4 50.9 119.2 9.6 29.5 380.6
Wholesale & Retail Trade - 61.0 3.1 3.8 98.1 46.9 101.3 10.8 34.8 359.8
Misc. - 3.6 0.2 0.5 3.1 1.9 6.3 0.6 3.0 19.2
Marine 1.9 916.3 291.7 - 789.0 217.8 - - 883.1 3,099.8
Construction 0.3 118.4 46.1 - 124.8 34.5 - - 126.1 450.1
Financial Services 0.3 148.4 46.7 - 119.4 33.1 - - 130.4 478.3
Information & Professional Services 0.6 220.8 82.8 - 196.6 58.0 - - 206.8 765.5
Leisure & Other Services 0.1 42.4 15.8 - 37.4 10.0 - - 47.0 152.7
Manufacturing 0.4 165.1 33.2 - 118.1 32.5 - - 168.7 517.9
Natural Resources 0.0 26.6 5.4 - 29.6 5.1 - - 24.3 91.2
Transportation & Utilities 0.1 93.1 32.4 - 82.1 23.6 - - 82.4 313.7
Wholesale & Retail Trade 0.2 97.1 27.8 - 78.0 20.1 - - 90.7 313.8
Misc. 0.0 4.5 1.4 - 3.2 0.8 - - 6.7 16.7
Processing and Storage - 1,623.1 1,674.0 2,428.5 14,941.8 1,227.1 605.5 892.9 1,161.2 24,554.2
Construction - 214.0 212.2 375.5 1,947.4 133.7 82.4 197.8 151.2 3,314.2
Financial Services - 268.7 268.3 345.3 2,285.0 184.6 86.2 142.5 174.2 3,754.8
Information & Professional Services - 442.0 474.6 638.9 3,748.8 325.8 165.4 238.0 312.5 6,346.0
Leisure & Other Services - 77.3 91.9 116.3 694.1 56.4 28.0 52.6 61.8 1,178.3
Manufacturing - 296.8 285.5 436.8 2,837.3 270.9 109.0 89.3 234.6 4,560.1
Natural Resources - 27.4 27.3 44.4 456.3 23.1 9.3 15.3 18.5 621.7
Transportation & Utilities - 141.7 157.2 236.8 1,543.8 121.6 64.2 67.9 97.4 2,430.7
Wholesale & Retail Trade - 145.8 147.3 214.9 1,374.1 105.5 56.2 84.5 99.6 2,227.9
Misc. - 9.4 9.7 19.8 55.1 5.4 4.8 4.9 11.3 120.4
Common Infrastructure, Exc. Rail - 442.6 11.4 39.2 636.3 526.6 1,194.9 33.5 171.2 3,055.8
Construction - 66.8 1.7 6.8 96.2 77.4 217.9 5.8 26.2 498.8
Financial Services - 76.3 1.9 5.5 96.5 82.0 175.8 5.4 26.1 469.5
Information & Professional Services - 124.9 3.2 10.1 156.5 138.0 330.4 9.3 45.3 817.7
Leisure & Other Services - 21.7 0.7 1.9 30.1 25.6 58.3 2.2 9.6 150.1
Manufacturing - 59.9 1.5 5.0 85.6 86.5 128.1 2.9 28.2 397.7
Natural Resources - 9.9 0.3 1.3 37.1 13.6 17.5 1.0 4.1 84.8
Transportation & Utilities - 42.6 1.2 4.4 72.5 53.9 141.1 3.6 15.4 334.7
Wholesale & Retail Trade - 38.1 1.0 3.6 59.9 47.7 118.6 3.2 15.0 287.1
Misc. - 2.2 0.1 0.5 1.9 1.9 7.3 0.2 1.3 15.3
Total 561.9 9,980.9 7,679.4 4,766.9 58,223.0 10,485.2 7,111.3 17,379.9 4,394.1 120,582.6
Construction 84.0 707.3 865.0 759.8 2,953.1 863.3 877.3 617.8 461.5 8,189.1
Financial Services 92.5 1,734.0 1,250.4 676.9 9,184.8 1,593.6 1,056.3 2,945.9 666.5 19,200.8
Information & Professional Services 146.4 2,577.2 2,008.7 1,185.8 12,561.5 2,470.8 1,825.6 4,416.0 1,097.3 28,289.4
Leisure & Other Services 24.5 476.2 420.3 227.6 2,713.3 471.9 334.6 1,081.1 232.1 5,981.6
Manufacturing 108.9 2,550.3 1,569.9 904.1 18,065.1 3,052.1 1,470.8 4,702.9 1,064.5 33,488.7
Natural Resources 8.5 164.2 129.5 100.1 1,644.0 222.9 104.3 291.4 89.6 2,754.6
Transportation & Utilities 40.3 703.0 625.0 417.2 4,459.7 761.4 620.0 1,041.7 322.3 8,990.7
Wholesale & Retail Trade 53.6 1,009.1 769.2 451.3 6,410.6 1,005.2 768.8 2,160.6 419.7 13,048.0
Misc. 3.0 59.6 41.3 44.2 230.9 43.9 53.6 122.6 40.7 639.8
WestNortheast South Midwest

Oil & Natural Gas Transportation & Storage Infrastructure: Status, Trends, & Economic Benefits
IHS Global Inc. 79
High Production Case by Transport Mode:
Labor Income Impact by Industry and US Census Division
Source: IHS 2013
Labor Income ($M) New England Mid-Atlantic South Atlantic East South Central West South Central East North Central West North Central Mountain Pacific Total US
Pipelines 364.8 3,999.9 3,562.0 1,464.6 25,027.0 5,066.7 2,728.2 10,119.5 1,150.6 53,483.3
Construction 69.9 173.4 498.8 308.3 532.8 452.5 326.3 336.4 81.9 2,780.3
Financial Services 35.6 466.9 300.2 100.8 2,210.8 438.4 235.0 957.2 104.6 4,849.5
Information & Professional Services 116.8 1,214.0 1,130.2 432.2 6,162.2 1,415.5 806.7 3,090.2 323.9 14,691.7
Leisure & Other Services 17.3 209.3 211.3 74.5 1,306.4 244.7 138.5 689.5 62.2 2,953.5
Manufacturing 69.7 1,266.0 804.7 294.0 9,961.4 1,698.5 730.9 3,102.1 383.9 18,311.2
Natural Resources 3.5 39.4 44.7 23.1 430.1 65.3 21.0 108.8 16.7 752.8
Transportation & Utilities 16.9 192.6 198.9 79.3 1,407.4 258.8 148.1 535.2 52.9 2,890.1
Wholesale & Retail Trade 31.5 390.6 349.2 136.0 2,845.2 463.5 290.4 1,208.5 105.6 5,820.5
Misc. 3.6 47.7 24.0 16.3 170.8 29.6 31.2 91.6 19.0 433.7
Rail - 434.0 20.3 26.3 618.1 327.4 659.1 66.8 241.7 2,393.6
Construction - 85.3 4.1 6.0 128.9 63.1 154.1 16.0 50.3 507.8
Financial Services - 43.1 1.6 1.7 46.1 26.3 49.3 5.1 19.2 192.3
Information & Professional Services - 148.4 7.0 8.8 194.8 109.4 230.7 22.5 75.9 797.4
Leisure & Other Services - 22.5 1.2 1.4 31.9 17.0 34.4 4.3 13.5 126.1
Manufacturing - 63.7 3.0 3.5 92.1 55.8 72.8 6.9 43.0 340.8
Natural Resources - 6.3 0.3 0.6 19.4 5.4 5.9 1.1 3.4 42.4
Transportation & Utilities - 25.0 1.2 1.7 43.6 21.1 46.7 4.1 13.1 156.6
Wholesale & Retail Trade - 35.8 1.8 2.3 58.4 27.8 59.9 6.4 20.6 212.9
Misc. - 3.9 0.1 0.3 2.9 1.6 5.4 0.4 2.7 17.3
Marine 1.3 576.2 185.9 - 499.5 140.1 - - 561.0 1,964.1
Construction 0.2 98.4 38.3 - 103.6 28.7 - - 105.0 374.2
Financial Services 0.1 54.0 14.9 - 38.4 11.2 - - 42.2 160.9
Information & Professional Services 0.4 174.9 67.9 - 160.7 48.0 - - 163.4 615.2
Leisure & Other Services 0.1 29.6 10.9 - 25.6 6.9 - - 31.2 104.2
Manufacturing 0.2 106.3 21.1 - 76.5 21.2 - - 113.8 339.1
Natural Resources 0.0 11.4 2.6 - 11.5 2.0 - - 9.7 37.1
Transportation & Utilities 0.1 40.1 12.6 - 34.1 9.5 - - 36.4 132.8
Wholesale & Retail Trade 0.1 57.1 16.5 - 46.3 11.9 - - 53.7 185.6
Misc. 0.0 4.4 1.1 - 2.9 0.7 - - 5.7 14.9
Processing and Storage - 1,043.5 1,058.7 1,571.9 9,375.9 780.1 388.0 583.6 747.1 15,548.7
Construction - 178.0 176.3 312.8 1,616.6 111.4 68.5 163.9 126.1 2,753.6
Financial Services - 101.9 89.4 111.9 749.3 64.0 30.1 46.4 61.3 1,254.2
Information & Professional Services - 355.6 382.3 534.1 3,056.6 267.2 135.0 191.0 247.3 5,169.0
Leisure & Other Services - 53.5 62.7 81.1 475.1 39.0 19.5 35.6 41.2 807.8
Manufacturing - 186.9 177.0 275.8 1,803.9 173.5 69.0 57.4 152.6 2,896.2
Natural Resources - 12.5 13.1 19.6 179.8 9.1 3.2 6.2 8.7 252.3
Transportation & Utilities - 59.5 63.0 94.7 623.7 49.2 25.5 29.4 41.0 986.0
Wholesale & Retail Trade - 85.6 87.0 127.3 816.1 62.2 33.1 49.6 58.6 1,319.7
Misc. - 9.9 7.7 14.6 54.7 4.6 4.0 4.0 10.3 109.8
Common Infrastructure, Exc. Rail - 284.7 7.2 25.3 394.6 336.2 773.8 21.3 109.9 1,953.0
Construction - 55.5 1.4 5.6 79.8 64.4 181.0 4.8 21.8 414.3
Financial Services - 29.2 0.6 1.6 29.4 27.0 58.0 1.6 8.6 156.0
Information & Professional Services - 101.1 2.6 8.6 129.1 113.6 272.0 7.6 36.0 670.5
Leisure & Other Services - 14.9 0.4 1.3 20.4 17.5 40.4 1.4 6.3 102.7
Manufacturing - 37.4 1.0 3.3 55.0 56.1 84.1 1.9 18.8 257.6
Natural Resources - 4.5 0.1 0.6 14.4 5.7 6.9 0.4 1.9 34.5
Transportation & Utilities - 17.1 0.5 1.7 29.1 22.0 55.1 1.4 6.4 133.4
Wholesale & Retail Trade - 22.4 0.6 2.2 35.6 28.3 70.2 1.9 8.9 170.0
Misc. - 2.6 0.0 0.3 1.8 1.6 6.2 0.1 1.2 13.9
Total 366.1 6,338.3 4,834.1 3,088.1 35,915.1 6,650.5 4,549.1 10,791.1 2,810.3 75,342.7
Construction 70.1 590.6 718.8 632.7 2,461.8 720.0 729.9 521.2 385.0 6,830.2
Financial Services 35.8 695.0 406.8 216.0 3,073.9 566.9 372.3 1,010.3 235.8 6,612.8
Information & Professional Services 117.2 1,994.0 1,589.8 983.7 9,703.3 1,953.6 1,444.5 3,311.3 846.4 21,943.8
Leisure & Other Services 17.3 329.8 286.5 158.3 1,859.4 325.1 232.7 730.8 154.4 4,094.4
Manufacturing 70.0 1,660.3 1,006.7 576.6 11,988.9 2,005.1 956.8 3,168.3 712.1 22,145.0
Natural Resources 3.6 74.1 60.9 44.0 655.2 87.4 37.0 116.5 40.5 1,119.1
Transportation & Utilities 17.0 334.3 276.3 177.4 2,137.9 360.6 275.4 570.1 149.9 4,298.9
Wholesale & Retail Trade 31.6 591.5 455.2 267.8 3,801.7 593.7 453.6 1,266.4 247.3 7,708.8
Misc. 3.6 68.5 33.0 31.6 233.1 38.1 46.7 96.1 38.9 589.7
Northeast South Midwest West
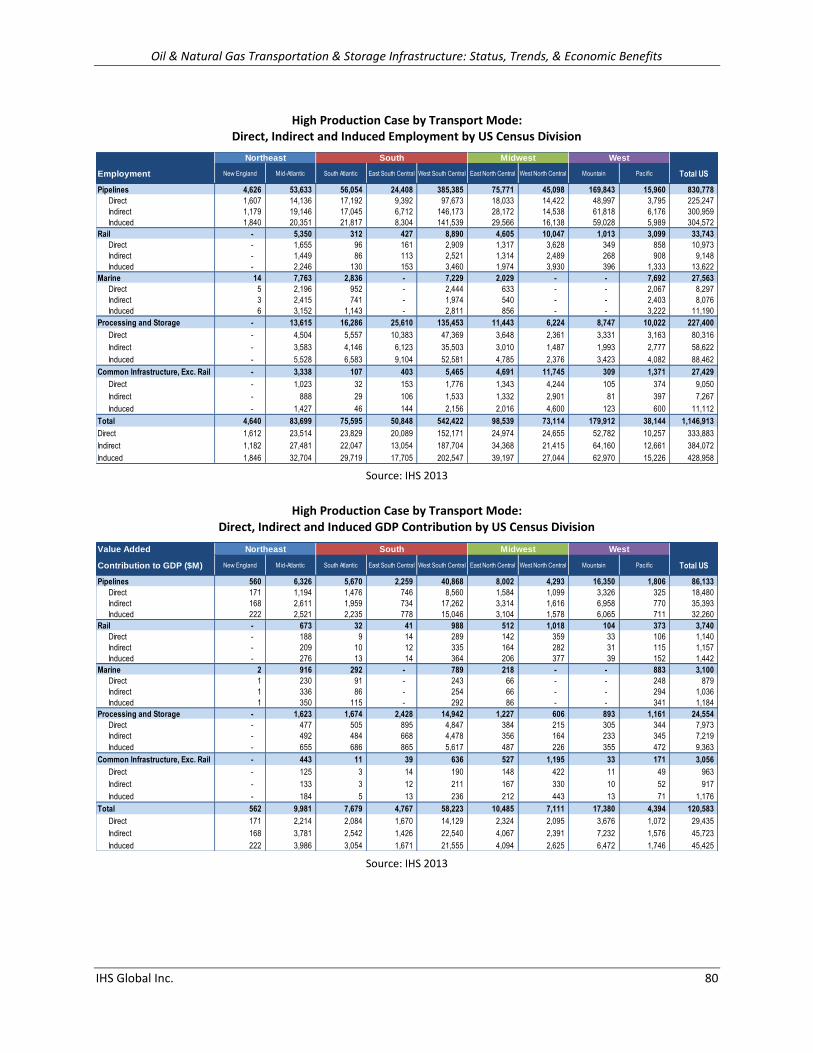
Oil & Natural Gas Transportation & Storage Infrastructure: Status, Trends, & Economic Benefits
IHS Global Inc. 80
High Production Case by Transport Mode:
Direct, Indirect and Induced Employment by US Census Division
Source: IHS 2013
High Production Case by Transport Mode:
Direct, Indirect and Induced GDP Contribution by US Census Division
Source: IHS 2013
Employment New England Mid-Atlantic South Atlantic East South Central West South Central East North Central West North Central Mountain Pacific Total US
Pipelines 4,626 53,633 56,054 24,408 385,385 75,771 45,098 169,843 15,960 830,778
Direct 1,607 14,136 17,192 9,392 97,673 18,033 14,422 48,997 3,795 225,247
Indirect 1,179 19,146 17,045 6,712 146,173 28,172 14,538 61,818 6,176 300,959
Induced 1,840 20,351 21,817 8,304 141,539 29,566 16,138 59,028 5,989 304,572
Rail - 5,350 312 427 8,890 4,605 10,047 1,013 3,099 33,743
Direct - 1,655 96 161 2,909 1,317 3,628 349 858 10,973
Indirect - 1,449 86 113 2,521 1,314 2,489 268 908 9,148
Induced - 2,246 130 153 3,460 1,974 3,930 396 1,333 13,622
Marine 14 7,763 2,836 - 7,229 2,029 - - 7,692 27,563
Direct 5 2,196 952 - 2,444 633 - - 2,067 8,297
Indirect 3 2,415 741 - 1,974 540 - - 2,403 8,076
Induced 6 3,152 1,143 - 2,811 856 - - 3,222 11,190
Processing and Storage - 13,615 16,286 25,610 135,453 11,443 6,224 8,747 10,022 227,400
Direct - 4,504 5,557 10,383 47,369 3,648 2,361 3,331 3,163 80,316
Indirect - 3,583 4,146 6,123 35,503 3,010 1,487 1,993 2,777 58,622
Induced - 5,528 6,583 9,104 52,581 4,785 2,376 3,423 4,082 88,462
Common Infrastructure, Exc. Rail - 3,338 107 403 5,465 4,691 11,745 309 1,371 27,429
Direct - 1,023 32 153 1,776 1,343 4,244 105 374 9,050
Indirect - 888 29 106 1,533 1,332 2,901 81 397 7,267
Induced - 1,427 46 144 2,156 2,016 4,600 123 600 11,112
Total 4,640 83,699 75,595 50,848 542,422 98,539 73,114 179,912 38,144 1,146,913
Direct 1,612 23,514 23,829 20,089 152,171 24,974 24,655 52,782 10,257 333,883
Indirect 1,182 27,481 22,047 13,054 187,704 34,368 21,415 64,160 12,661 384,072
Induced 1,846 32,704 29,719 17,705 202,547 39,197 27,044 62,970 15,226 428,958
Northeast South Midwest West
Value Added
Contribution to GDP ($M) New England Mid-Atlantic South Atlantic East South Central West South Central East North Central West North Central Mountain Pacific Total US
Pipelines 560 6,326 5,670 2,259 40,868 8,002 4,293 16,350 1,806 86,133
Direct 171 1,194 1,476 746 8,560 1,584 1,099 3,326 325 18,480
Indirect 168 2,611 1,959 734 17,262 3,314 1,616 6,958 770 35,393
Induced 222 2,521 2,235 778 15,046 3,104 1,578 6,065 711 32,260
Rail - 673 32 41 988 512 1,018 104 373 3,740
Direct - 188 9 14 289 142 359 33 106 1,140
Indirect - 209 10 12 335 164 282 31 115 1,157
Induced - 276 13 14 364 206 377 39 152 1,442
Marine 2 916 292 - 789 218 - - 883 3,100
Direct 1 230 91 - 243 66 - - 248 879
Indirect 1 336 86 - 254 66 - - 294 1,036
Induced 1 350 115 - 292 86 - - 341 1,184
Processing and Storage - 1,623 1,674 2,428 14,942 1,227 606 893 1,161 24,554
Direct - 477 505 895 4,847 384 215 305 344 7,973
Indirect - 492 484 668 4,478 356 164 233 345 7,219
Induced - 655 686 865 5,617 487 226 355 472 9,363
Common Infrastructure, Exc. Rail - 443 11 39 636 527 1,195 33 171 3,056
Direct - 125 3 14 190 148 422 11 49 963
Indirect - 133 3 12 211 167 330 10 52 917
Induced - 184 5 13 236 212 443 13 71 1,176
Total 562 9,981 7,679 4,767 58,223 10,485 7,111 17,380 4,394 120,583
Direct 171 2,214 2,084 1,670 14,129 2,324 2,095 3,676 1,072 29,435
Indirect 168 3,781 2,542 1,426 22,540 4,067 2,391 7,232 1,576 45,723
Induced 222 3,986 3,054 1,671 21,555 4,094 2,625 6,472 1,746 45,425
Northeast South Midwest West

Oil & Natural Gas Transportation & Storage Infrastructure: Status, Trends, & Economic Benefits
IHS Global Inc. 81
High Production Case by Transport Mode:
Direct, Indirect and Induced Labor Income by US Census Division
Source: IHS 2013
High Production Case by Transport Mode:
Government Revenues
Source: IHS 2013
Labor Income New England Mid-Atlantic South Atlantic East South Central West South Central East North Central West North Central Mountain Pacific Total US
Pipelines 365 4,000 3,562 1,465 25,027 5,067 2,728 10,120 1,151 53,483
Direct 128 838 1,087 562 5,915 1,153 803 2,294 234 13,014
Indirect 107 1,687 1,221 465 10,718 2,124 1,032 4,396 501 22,251
Induced 130 1,475 1,254 437 8,394 1,790 893 3,429 416 18,218
Rail - 434 20 26 618 327 659 67 242 2,394
Direct - 143 7 11 220 107 268 26 81 861
Indirect - 131 6 8 199 103 178 19 73 718
Induced - 160 7 8 199 117 213 22 87 814
Marine 1 576 186 - 500 140 - - 561 1,964
Direct 0 171 68 - 183 49 - - 185 656
Indirect 0 206 54 - 154 42 - - 183 639
Induced 0 200 64 - 162 49 - - 193 669
Processing and Storage - 1,043 1,059 1,572 9,376 780 388 584 747 15,549
Direct - 352 364 647 3,493 271 154 235 251 5,766
Indirect - 312 306 430 2,746 227 105 148 222 4,496
Induced - 380 389 495 3,138 281 129 201 275 5,287
Common Infrastructure, Exc. Rail - 285 7 25 395 336 774 21 110 1,953
Direct - 94 2 10 141 111 315 8 37 719
Indirect - 84 2 7 125 105 209 6 32 570
Induced - 107 3 8 128 121 250 7 40 664
Total 366 6,338 4,834 3,088 35,915 6,650 4,549 10,791 2,810 75,343
Direct 129 1,597 1,527 1,230 9,951 1,692 1,540 2,563 788 21,016
Indirect 107 2,420 1,590 910 13,942 2,600 1,523 4,569 1,012 28,674
Induced 131 2,321 1,717 947 12,022 2,358 1,486 3,659 1,011 25,652
Northeast South Midwest West
Government Revenues
by Transport ModePipelines
Processing
& StorageMarine Rail
Common Infra,
Exc. Rail
Total
US
Federal 11,844.9 3,378.5 427.1 517.3 422.3 16,590.1
Personal 9,828.8 2,822.3 356.0 433.1 353.2 13,793.4
Corporate 2,016.1 556.3 71.1 84.2 69.1 2,796.7
0.0
State & Local 7,786.5 2,173.7 284.5 339.2 278.7 10,862.6
Personal 1,639.1 475.9 60.1 73.2 59.8 2,308.1
Corporate 6,147.4 1,697.8 224.4 265.9 218.9 8,554.5
Total Government Revenues 19,631.4 5,552.3 711.7 856.5 700.9 27,452.8

Oil & Natural Gas Transportation & Storage Infrastructure: Status, Trends, & Economic Benefits
IHS Global Inc. 82
Appendix B3 – Modeling Approach To assess the direct, indirect, and induced economic impacts of the investment in transport and storage infrastructure, IHS used a customized version of the IMPLAN modeling environment. The base IMPLAN model closely follows the accounting conventions used in the US Bureau of Economic Analysis study, Input-Output Study of the US Economy, and is flexible enough to evaluate changes via the value of output or employment from the source industry. IHS customized the environment by updating worker productivity rates based on its proprietary Business Market Insights database, which IHS economists believe produces more conservative estimates of employment impacts. As discussed in the main body of this report, IHS Energy experts developed expenditure forecasts for each of twenty asset classes, both nationally and by each of the nine US Census Divisions. These expenditures were used as the inputs to ten IMPLAN models: one for the entire US and one each for the nine US Census Divisions. The expenditures for each asset class-census region configuration were modeled independently. The results were then combined to produce the “Target Energy Type” and “Transport Mode” aggregations. Input-Output Modeling Frameworks IMPLAN, short for "Impact Analysis for Planning," is a widely used, commercially available model for conducting input-output analysis. Based on a social account matrix framework, IMPLAN provides a balanced set of 440-industry sector matrices that map the buy-sell dyads of inter-industry transactions and consumer-to-industry transactions. When additional transactions occur, IMPLAN rebalances the matrices, therein estimating how transactional activity ripples through the economy. The additional activity, in turn, drives changes in employment, wages, GDP contribution and government revenues. The economic ripples fall into three main categories, as defined below:
Direct Effects: are the direct responses of an economy to changes in the final demand of a given industry or set of industries. In the model developed for this project, direct effects capture the impacts of direct employment and production associated with the refineries.
Indirect Effects (also known as Supplier Effects): refer to the “ripple responses” of an economy to subsequent final demand shifts within industries that serve the direct industries. In essence, the indirect effects capture the response of extended supply chains.
Induced Effects (also known as Income Effects): refer to the response of an economy to changes in household spending attributable to income generated by the direct and indirect effects. Employees within the direct and indirect industries also act as consumers in the general US economy. Induced effects capture the impacts of this consumer activity

Oil & Natural Gas Transportation & Storage Infrastructure: Status, Trends, & Economic Benefits
IHS Global Inc. 83
Three Levels of Economic Impact
The figure below shows the structure and fiscal flows of a typical Social Account Matrix (SAM), which presents the transactions that occur within an economy as a matrix. The columns of a SAM represent expenditures (or spending), while the rows represent income. The key components (or accounts) appear in both the Columns and the Rows of the SAM, representing the dual role each account plays in the economy. As such, a SAM not only captures the transactional activity within an economy, but all of the linkages between industrial sectors, households and institutions as well.
Social Accounting Matrix Captures Expenditure-to-Income Flows
Capex and Opex that
directly enters the
economy as spending on local goods and
services
Indirect spending with
local supply chain and
service providers
Induced national economic activity
(consumer spending, wage impacts, etc.)
Activities Commodities Factors Households Government InvestmentRest of
WorldTotal
Activities
Commodities
Factors
Households
Government
Investment
Rest of World
Total
Expenditures
Inco
me

Oil & Natural Gas Transportation & Storage Infrastructure: Status, Trends, & Economic Benefits
IHS Global Inc. 84
A Social Accounting Matrix (SAM) provides a complete, consistent and balanced representation of all activity within an economy. An Expenditure (or spending) within an economy flows down a column and then leftward along the corresponding Income row. For example, consider Consumer Spending. Expenditures flow down the “Household” column and then left across the appropriate “Commodity” row. The following graphic populates the SAM framework with the classes of transactions that link expenditures (columns) to income (rows). A SAM is similar to double entry bookkeeping where each entry is a transaction that has both a price and a quantity dimension, and that identifies both its source and destination. Therefore, the total expenditures by each account must be exactly equal to the total receipts for the account, i.e. the respective row and column totals must equate. This means, for example, that total domestic demand (the commodity row) equals total domestic supply (the commodities column). It is this characteristic that makes a SAM a tool that can be used for modeling purposes.
Social Accounting Matrix Structure Transaction Classes
Economic impact analyses focus on inter-industry interactions (Activity-Commodity-Factors) and consumer transactions (Activity-Commodity-Factors-Households). The inter-industry interactions, which encompass direct and indirect effects, are highlighted in the purple region of the following figure. Similarly, the consumer transactions are enclosed by the red box. Ultimately, these two regions of the SAM are transformed into the core of an economic impact model such as IMPLAN.
Activities Commodities Factors Households Gov’t InvestmentRest of
WorldTotal
ActivitiesDomestic
SupplyActivity Income
CommoditiesIntermediate
DemandConsumption
(C)
Gov’tSpending
(G)
Investment(I)
Exports(E)
Total Demand
FactorsValue-Added
(GDP)
Total Factor Income
HouseholdsFactor
Payments to Households
SocialTransfers
Foreign Remittances
Total Household
Income
GovernmentSales Tax andImport tariffs
DirectTaxes
Foreign Grants and
Loans
Government Income
InvestmentPrivate Savings
Fiscal Surplus
Current Account Balance
Total Savings
Rest of WorldImports
(M)
Foreign Exchange
Outflow
TotalGrossOutput
Total SupplyTotal Factor
Spending
Total HouseholdSpending
Gov’tExpenditure
Total Investment Spending
Foreign Exchange
Inflow
Expenditures
Inco
me

Oil & Natural Gas Transportation & Storage Infrastructure: Status, Trends, & Economic Benefits
IHS Global Inc. 85
Portions of a SAM Needed for the Economic Impact Assessment
IMPLAN multipliers The notion of a multiplier rests upon the difference between the initial effect of a change in final demand and the total effects of that change. Total effects can be calculated either as direct and indirect effects or as direct, indirect, and induced effects. Direct effects are production changes associated with the immediate effects or final-demand changes. Indirect effects are production changes in backward-linked industries caused by the changing input needs of directly affected industries (for example, additional purchases to produce additional output). Induced effects are the changes in regional household spending patterns caused by changes in household income generated from the direct and indirect effects. Type I multipliers A Type I multiplier is the direct effect produced by a change in final demand plus the indirect effect, divided by the direct effect. Increased demands are assumed to lead to increased employment and population, with the average income level remaining constant. The Leontief inverse (Type I multipliers matrix) is derived by inverting the direct coefficients matrix. The result is a matrix of total requirement coefficients, the amount each industry must produce for the purchasing industry to deliver one dollar's worth of output to final demand. Type SAM multipliers Type SAM multipliers incorporate “induced” effects resulting from the household expenditures from new labor income. The linear relationship between labor income and household expenditure can be customized in the IMPLAN software. The default relationship is Personal Consumption Expenditure (PCE) and total household expenditure. Each dollar of workplace-based income is spent based on the SAM relationship generated by IMPLAN.
Activities Commodities Factors Households Gov’t InvestmentRest of
WorldTotal
ActivitiesDomestic
SupplyActivityIncome
CommoditiesIntermediate
DemandConsumption
(C)
Gov’tSpending
(G)
Investment(I)
Exports(E)
Total Demand
FactorsValue-Added
(GDP)
Total Factor Income
HouseholdsFactor
Payments to Households
SocialTransfers
Foreign Remittances
Total Household
Income
GovernmentSales Tax andImport tariffs
DirectTaxes
Foreign Grants and
Loans
Government Income
InvestmentPrivate Savings
Fiscal Surplus
Current Account Balance
Total Savings
Rest of WorldImports
(M)
Foreign Exchange
Outflow
TotalGrossOutput
Total SupplyTotal Factor
Spending
Total HouseholdSpending
Gov’tExpenditure
Total Investment Spending
Foreign Exchange
Inflow
ExpendituresIn
com
e