ap statistics: syllabus · ap ® statistics: syllabus ... analyzing data (graphical and numerical...
TRANSCRIPT

AP Statistics Audit Syllabus Page 1
AP®
Statistics: Syllabus Daniel Coapstick
Stuttgart High School Course Description Statistics are used everywhere from fast food businesses ordering hamburger patties to insurance companies setting rates to colleges predicting a student’s future success by the results of a test. This course allows students to become familiar with the vocabulary, method, and meaning in the statistics like these that exist in the world around them. AP Statistics is the high school equivalent of a one semester, introductory college statistics course. In this course, students develop strategies for collecting, organizing, analyzing and drawing conclusions from data. Students will design, administer and tabulate results from surveys and experiments. Probability and simulations aid students in constructing models for chance behavior. Sampling distributions provide the logical structure for confidence intervals and hypothesis tests. This course is designed to prepare students to take the College Board Advanced Placement Examination in May. Students will explore statistics in an interactive and technology-based setting with an emphasis on applying statistical knowledge to real-world scenarios. This course requires students to be critical thinkers, excellent writers/communicators and outstanding problem solvers. This is an applied course in which students actively construct their own understanding of the methods, interpretation, communication and application of statistics. Each unit is framed by enduring understandings and essential questions designed to allow students a deep understanding of the concepts at hand rather than memorization and emulation. Purpose The purpose of AP Statistics is to introduce students to the major concepts and tools for collecting, analyzing and drawing conclusions from data. Students will be exposed to four broad conceptual themes:
Exploring Data: Describing patterns and departures from patterns (20%–30% of AP Exam). Exploratory analysis of data makes use of graphical and numerical techniques to study patterns and departures from patterns. Emphasis will be placed on interpreting information from graphical and numerical displays and summaries.
Sampling and Experimentation: Planning and conducting a study (10%–15%). Data must be collected according to a well-developed plan if valid information on a conjecture is to be obtained. This plan includes clarifying the question and deciding upon a method of data collection and analysis.
Anticipating Patterns: Exploring random phenomena using probability and simulation (20%–30%). Probability is the tool used for anticipating what the distribution of data should look like under a given model.
Statistical Inference: Estimating population parameters and testing hypotheses (30%–40%). Statistical inference guides the selection of appropriate models
AP Statistics Audit Syllabus Page 2
Format and Teaching Strategies Class will be structured in such a way as to facilitate a true understanding of the nature and meaning of statistics. Time will be spent in lecture and discussion but much of the class time will be devoted to hands-on activities and investigations. Students will be encouraged to communicate their thought processes both orally and in writing. Students will regularly be exposed to released AP Statistics multiple-choice and free response questions throughout the year. They will spend significant time in class discussing and evaluating their responses based on the released rubrics. Emphasis will be placed on statistical accuracy and effective communication of statistical concepts. Students will also complete several performance/transfer tasks throughout the year consisting of relevant, open-ended questions requiring students to connect multiple statistical topics together. Course Investigations and Projects Individual and group investigations and projects are given throughout the year to help students develop statistical strategies and methods in understanding appropriate statistical techniques and the best ways to communicate them within the context of the assignment. The students will write formal assignments to practice free response questions. It is important students also are asked to complete formalize presentations requiring them to use the language and vocabulary of statistics to describe statistical methods, results and interpretations of their findings. The students will complete a project in the second semester where they will engage in all stages of the research process. Students will plan the sampling procedure, define measurement strategies, conduct analysis, interpret their results in context, and present their results to peers. A written report and presentation is required. Course Goals In AP Statistics, students are expected to develop skills, knowledge and habits of mind: Skills: Produce convincing oral and written statistical arguments, using appropriate terminology, in a variety of applied settings. Know when and how to use technology to aid them in solving statistical problems.
Knowledge: Essential techniques for producing data (surveys, experiments, observational studies), analyzing data (graphical and numerical summaries), modeling data (probability, random variables, sampling distributions), and drawing conclusions from data (inference procedures--confidence intervals and significance tests.)
Habits of Mind: Become critical consumers of published statistical results by heightening their awareness of ways in which statistics can be improperly used to mislead, confuse or distort the truth. Technology Throughout the course, students will use a variety of technology tools to investigate concepts from the course syllabus. All students will either have their own TI-Nspire CX CAS or a TI-84+ graphing calculators and the course will rely heavily on applications specifically developed by Texas Instruments and other providers for the course (http://education.ti.com/calculators/timathnspired/).
AP Statistics Audit Syllabus Page 3
The course will also make extensive use of statistical software including, but not limited to:
Fathom (http://www.keypress.com/x5656.xml)
StatCrunch (http://www.statcrunch.com/)
SOFA (http://www.sofastatistics.com/home.php)
DIGMATH (http://snyfarvc.cc.farmingdale.edu/~gordonsp/StatisticalSimulations.htm)
Rice Virtual Lab in Statistics (http://onlinestatbook.com/rvls/index.html)
Rossmanchance.com applets and labs
SOCR Applets (http://socr.ucla.edu/htmls/SOCR_Analyses.html)
Wolfram Demonstrations Project (http://demonstrations.wolfram.com/education.html?edutag=High+School+Statistics&limit=20)
Additional Reference and Resource Material Textbooks The primary textbook (and accompanying online and print resources) for the course is: Stats Modeling the World, (4th Edition), Bock, Velleman, and De Veaux, Addison-Wesley, 2011. Additional textbooks include:
Stats Modeling the World, (4th Edition), Bock, Velleman, and De Veaux, Addison-Wesley, 2011.
Introduction to Statistics and Data Analysis, (4th Edition), Peck, Olsen, and Devore, Brooks/Cole--CENGAGE Learning, 2008.
Activity-Based Statistics ( 2nd Edition), Scheaffer, Watkins, Witmer, and Gnanadesikan, Key College, 2004.
Workshop Statistics (3rd Edition), Rossman, Chance and Von Oehsen, John Wiley & Sons, Inc., 2008.
5 Steps to a 5: AP Statistics 2015-2016, Hinders and Craine, McGraw-Hill, 2011.
Head First Statistics, Griffiths, O'Reilly Media, Inc., 2009. Videos
Against All Odds: Inside Statistics video series (http://www.learner.org/resources/series65.html), Annenberg Learner, 1988.
StatProf.com (http://statprof.com/)
The Joy of Stats (http://www.gapminder.org/videos/the-joy-of-stats/)
AP Statistics--Mr. Jaffe, (http://itunes.apple.com/us/podcast/ap-statistics-mr-jaffe/id442146928 ), iTunes podcasts.
Learning Videos (http://videoshots.wordpress.com/2010/08/31/statistics/)
AP Statistics Audit Syllabus Page 4
Online Courses
StatTrek (http://www.stattrek.com/)
AP Statistics (http://www.mathorama.com/stat/framestats.html)
CMU Open Learning Initiative (http://oli.web.cmu.edu/openlearning/forstudents/freecourses), Carnegie Mellon University.
Data Analysis, Statistics & Probability (http://www.learner.org/courses/learningmath/data/index.html), Annenberg Learning Math.
HyperStat Online Statistics Textbook (http://davidmlane.com/hyperstat/index.html) Course Content The following outline describes this course’s content by unit. Each unit includes the following information:
Enduring Understandings and Essential Questions (UbD)
Course Content correlated to the AP Statistics topic outline and the Common Core Standards
Unit Learning Targets
Case Studies, Cases Closed, Activities, Data Explorations and Homework from TPS 4E Each unit will be supplemented by hands-on activities, projects and performance/transfer tasks from relevant sources including released AP Statistics examinations. The schedule is, of course, subject to change based on student needs, class interruptions, teacher absences, etc.
AP Statistics Audit Syllabus Page 5
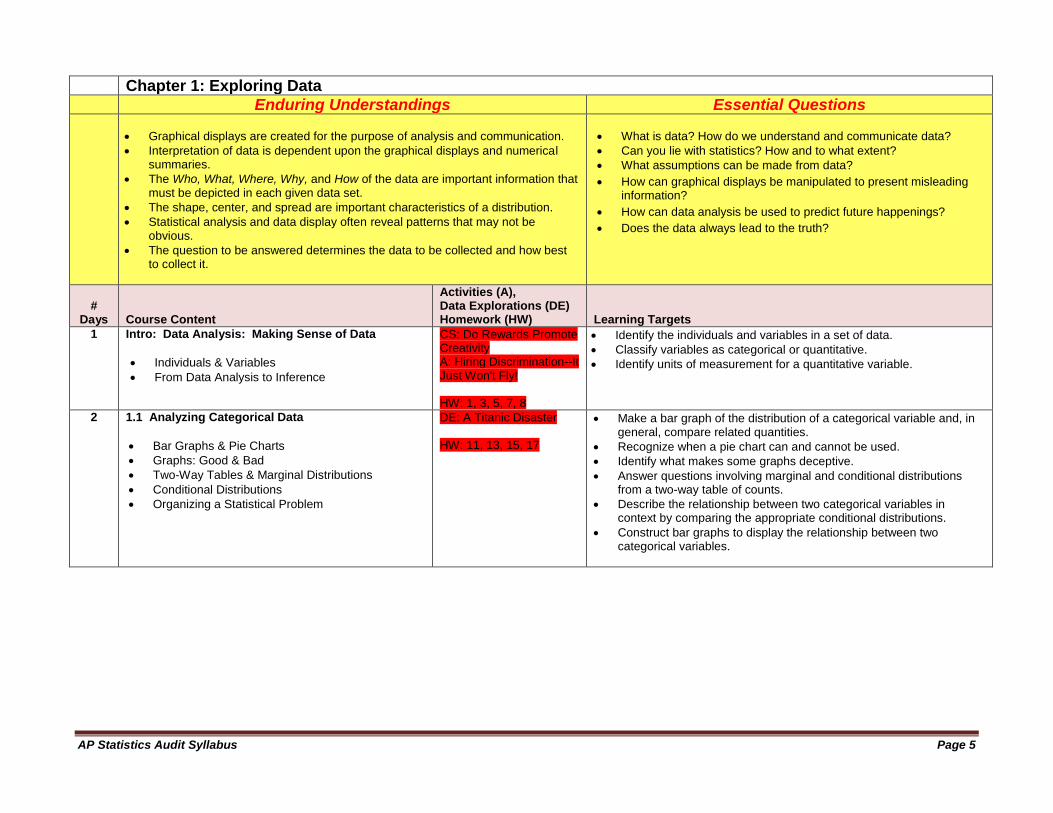
Chapter 1: Exploring Data
Enduring Understandings Essential Questions
Graphical displays are created for the purpose of analysis and communication.
Interpretation of data is dependent upon the graphical displays and numerical summaries.
The Who, What, Where, Why, and How of the data are important information that must be depicted in each given data set.
The shape, center, and spread are important characteristics of a distribution.
Statistical analysis and data display often reveal patterns that may not be obvious.
The question to be answered determines the data to be collected and how best to collect it.
What is data? How do we understand and communicate data?
Can you lie with statistics? How and to what extent?
What assumptions can be made from data?
How can graphical displays be manipulated to present misleading information?
How can data analysis be used to predict future happenings?
Does the data always lead to the truth?
# Days Course Content
Activities (A), Data Explorations (DE) Homework (HW) Learning Targets
1 Intro: Data Analysis: Making Sense of Data
Individuals & Variables
From Data Analysis to Inference
CS: Do Rewards Promote Creativity A: Hiring Discrimination--It Just Won't Fly! HW: 1, 3, 5, 7, 8
Identify the individuals and variables in a set of data.
Classify variables as categorical or quantitative.
Identify units of measurement for a quantitative variable.
2 1.1 Analyzing Categorical Data
Bar Graphs & Pie Charts
Graphs: Good & Bad
Two-Way Tables & Marginal Distributions
Conditional Distributions
Organizing a Statistical Problem
DE: A Titanic Disaster HW: 11, 13, 15, 17
Make a bar graph of the distribution of a categorical variable and, in general, compare related quantities.
Recognize when a pie chart can and cannot be used.
Identify what makes some graphs deceptive.
Answer questions involving marginal and conditional distributions from a two-way table of counts.
Describe the relationship between two categorical variables in context by comparing the appropriate conditional distributions.
Construct bar graphs to display the relationship between two categorical variables.

AP Statistics Audit Syllabus Page 6
Chapter 1: Exploring Data #
Days Course Content A/DE/HW Learning Targets
2 1.2 Displaying Quantitative Data with Graphs
Dotplots
Describing Shape
Comparing Distributions
Stemplots
Histograms
Using Histograms Wisely
HW: 19, 21, 23, 25, 27-32, 37, 39, 41, 43, 45, 47, 53, 55, 57, 59, 60, 69-74
Make a dotplot or stemplot to display small sets of data.
Describe the overall pattern (shape, center, and spread) of a distribution and identify any major departures from the pattern (like outliers).
Identify the shape of a distribution from a dotplot, stemplot or histogram as roughly symmetric or skewed. Identify the number of modes.
Make a histogram with a reasonable choice of classes.
Interpret histograms.
2
1.3 Displaying Quantitative Data with Numbers
Measuring Center: The Mean
Measuring Center: The Median
Comparing the Mean & the Median
Measuring Spread: The Interquartile Range (IQR)
Identifying Outliers
The Five-Number Summary & Boxplots
Measuring Spread: The Standard Deviation
Choosing Measures of Center & Spread
Use Calculators to Compare Distributions, Measure Spread, Calculate and Compare Mean and Median
A: Mean as a "Balance Point" DE: Did Mr. Starnes Stack his Class? CC: Do Rewards Promote Creativity HW: 79, 81, 83, 87, 89, 91, 93, 95, 97, 103, 105, 107-110
Calculate and interpret measures of center (mean & median) in context.
Calculate and interpret measures of spread (IQR) in context.
Identify outliers using the 1.5 IQR rule.
Make a boxplot.
Calculate and interpret measures of spread (standard deviation).
Select appropriate measures of center and spread.
Use appropriate graphs and numerical summaries to compare distributions of quantitative variables.
1 Chapter 1 Review
1 Chapter 1 AP Statistics Practice Test
9 Days/9 Days
AP Statistics Audit Syllabus Page 7
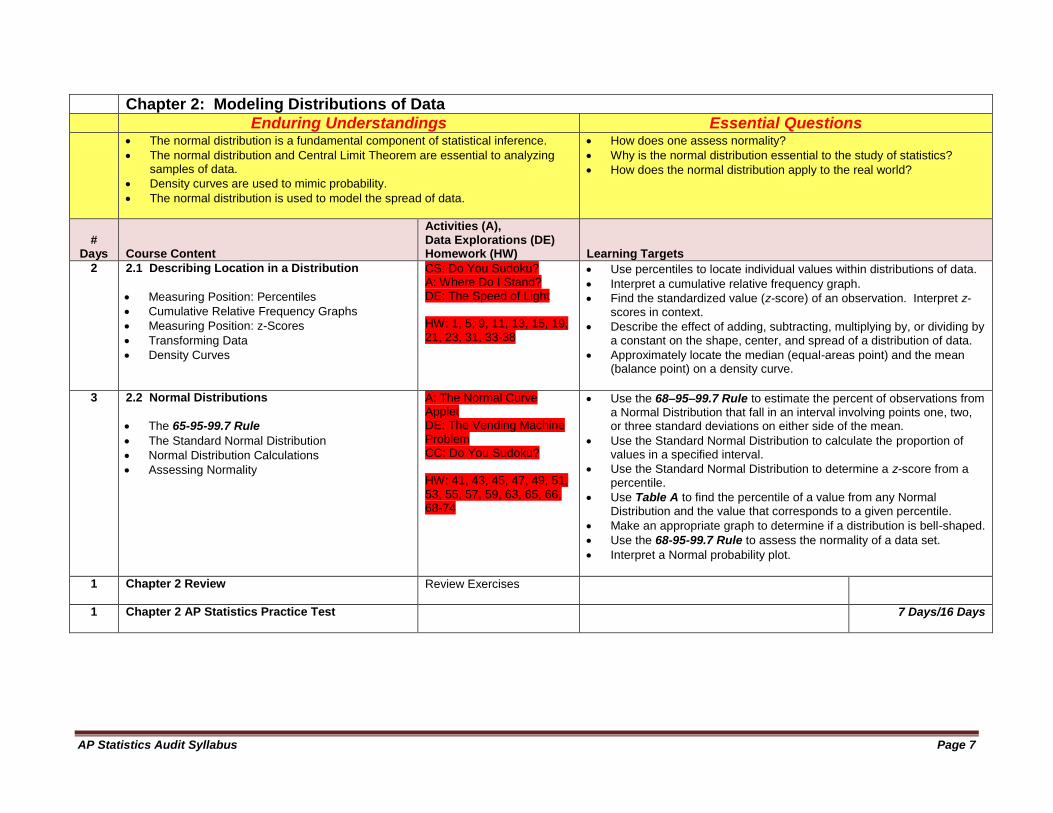
Chapter 2: Modeling Distributions of Data
Enduring Understandings Essential Questions The normal distribution is a fundamental component of statistical inference.
The normal distribution and Central Limit Theorem are essential to analyzing samples of data.
Density curves are used to mimic probability.
The normal distribution is used to model the spread of data.
How does one assess normality?
Why is the normal distribution essential to the study of statistics?
How does the normal distribution apply to the real world?
# Days Course Content
Activities (A), Data Explorations (DE) Homework (HW) Learning Targets
2 2.1 Describing Location in a Distribution
Measuring Position: Percentiles
Cumulative Relative Frequency Graphs
Measuring Position: z-Scores
Transforming Data
Density Curves
CS: Do You Sudoku? A: Where Do I Stand? DE: The Speed of Light HW: 1, 5, 9, 11, 13, 15, 19, 21, 23, 31, 33-38
Use percentiles to locate individual values within distributions of data.
Interpret a cumulative relative frequency graph.
Find the standardized value (z-score) of an observation. Interpret z-scores in context.
Describe the effect of adding, subtracting, multiplying by, or dividing by a constant on the shape, center, and spread of a distribution of data.
Approximately locate the median (equal-areas point) and the mean (balance point) on a density curve.
3 2.2 Normal Distributions
The 65-95-99.7 Rule
The Standard Normal Distribution
Normal Distribution Calculations
Assessing Normality
A: The Normal Curve Applet DE: The Vending Machine Problem CC: Do You Sudoku? HW: 41, 43, 45, 47, 49, 51, 53, 55, 57, 59, 63, 65, 66, 68-74
Use the 68–95–99.7 Rule to estimate the percent of observations from a Normal Distribution that fall in an interval involving points one, two, or three standard deviations on either side of the mean.
Use the Standard Normal Distribution to calculate the proportion of values in a specified interval.
Use the Standard Normal Distribution to determine a z-score from a percentile.
Use Table A to find the percentile of a value from any Normal Distribution and the value that corresponds to a given percentile.
Make an appropriate graph to determine if a distribution is bell-shaped.
Use the 68-95-99.7 Rule to assess the normality of a data set.
Interpret a Normal probability plot.
1 Chapter 2 Review
Review Exercises
1 Chapter 2 AP Statistics Practice Test
7 Days/16 Days
AP Statistics Audit Syllabus Page 8
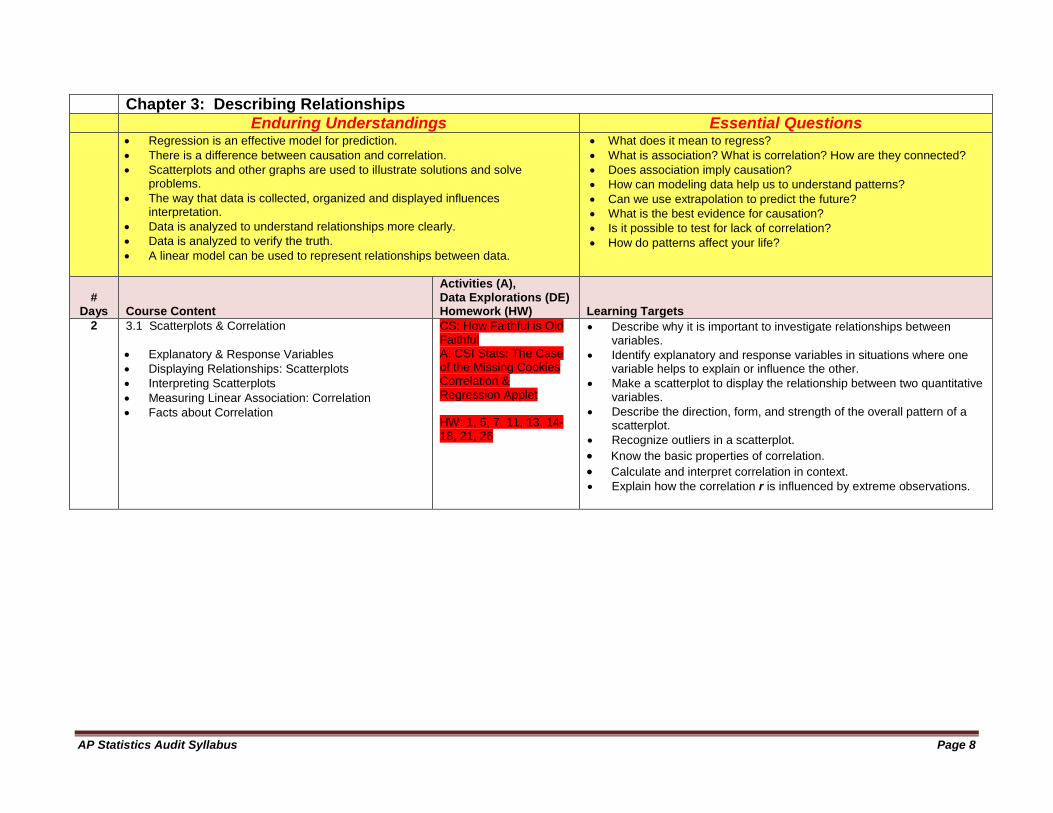
Chapter 3: Describing Relationships
Enduring Understandings Essential Questions Regression is an effective model for prediction.
There is a difference between causation and correlation.
Scatterplots and other graphs are used to illustrate solutions and solve problems.
The way that data is collected, organized and displayed influences interpretation.
Data is analyzed to understand relationships more clearly.
Data is analyzed to verify the truth.
A linear model can be used to represent relationships between data.
What does it mean to regress?
What is association? What is correlation? How are they connected?
Does association imply causation?
How can modeling data help us to understand patterns?
Can we use extrapolation to predict the future?
What is the best evidence for causation?
Is it possible to test for lack of correlation?
How do patterns affect your life?
# Days Course Content
Activities (A), Data Explorations (DE) Homework (HW) Learning Targets
2 3.1 Scatterplots & Correlation
Explanatory & Response Variables
Displaying Relationships: Scatterplots
Interpreting Scatterplots
Measuring Linear Association: Correlation
Facts about Correlation
CS: How Faithful is Old Faithful A: CSI Stats: The Case of the Missing Cookies Correlation & Regression Applet HW: 1, 5, 7, 11, 13, 14-18, 21, 26
Describe why it is important to investigate relationships between variables.
Identify explanatory and response variables in situations where one variable helps to explain or influence the other.
Make a scatterplot to display the relationship between two quantitative variables.
Describe the direction, form, and strength of the overall pattern of a scatterplot.
Recognize outliers in a scatterplot.
Know the basic properties of correlation.
Calculate and interpret correlation in context.
Explain how the correlation r is influenced by extreme observations.
AP Statistics Audit Syllabus Page 9
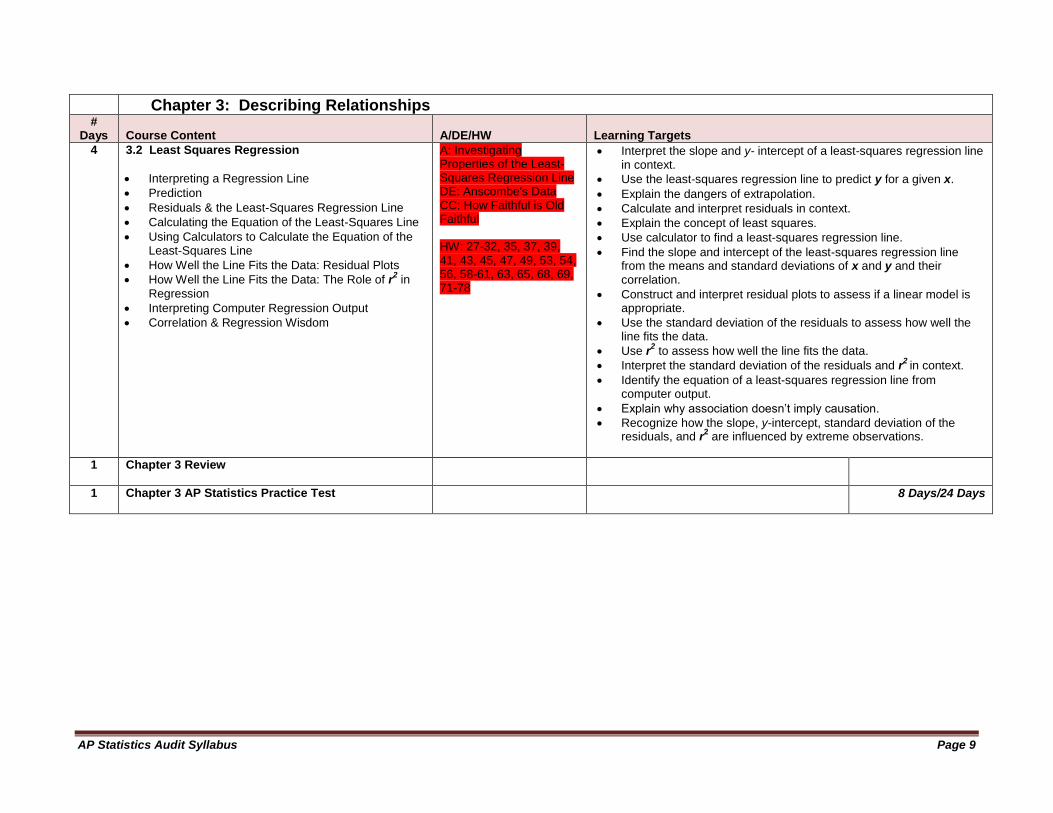
Chapter 3: Describing Relationships #
Days Course Content A/DE/HW Learning Targets
4 3.2 Least Squares Regression
Interpreting a Regression Line
Prediction
Residuals & the Least-Squares Regression Line
Calculating the Equation of the Least-Squares Line
Using Calculators to Calculate the Equation of the Least-Squares Line
How Well the Line Fits the Data: Residual Plots
How Well the Line Fits the Data: The Role of r2 in
Regression
Interpreting Computer Regression Output
Correlation & Regression Wisdom
A: Investigating Properties of the Least-Squares Regression Line DE: Anscombe's Data CC: How Faithful is Old Faithful HW: 27-32, 35, 37, 39, 41, 43, 45, 47, 49, 53, 54, 56, 58-61, 63, 65, 68, 69, 71-78
Interpret the slope and y- intercept of a least-squares regression line in context.
Use the least-squares regression line to predict y for a given x.
Explain the dangers of extrapolation.
Calculate and interpret residuals in context.
Explain the concept of least squares.
Use calculator to find a least-squares regression line.
Find the slope and intercept of the least-squares regression line from the means and standard deviations of x and y and their correlation.
Construct and interpret residual plots to assess if a linear model is appropriate.
Use the standard deviation of the residuals to assess how well the line fits the data.
Use r2 to assess how well the line fits the data.
Interpret the standard deviation of the residuals and r2
in context.
Identify the equation of a least-squares regression line from computer output.
Explain why association doesn’t imply causation.
Recognize how the slope, y-intercept, standard deviation of the residuals, and r
2 are influenced by extreme observations.
1 Chapter 3 Review
1 Chapter 3 AP Statistics Practice Test
8 Days/24 Days
AP Statistics Audit Syllabus Page 10
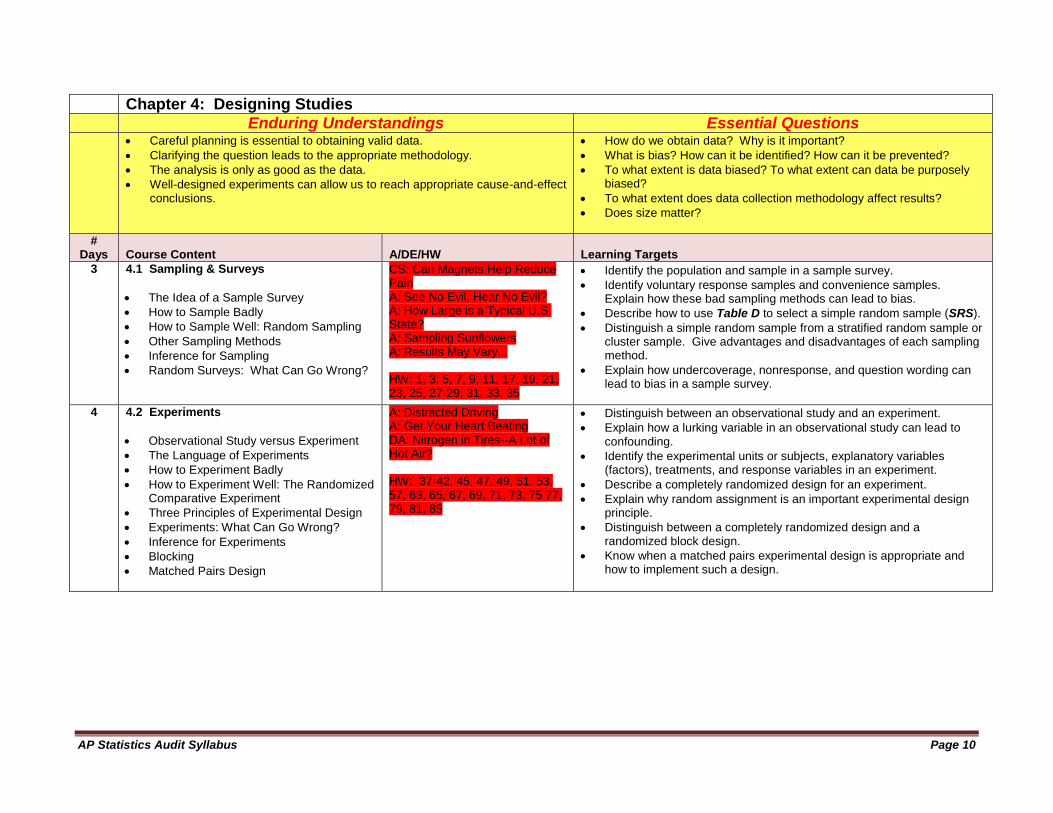
Chapter 4: Designing Studies
Enduring Understandings Essential Questions Careful planning is essential to obtaining valid data.
Clarifying the question leads to the appropriate methodology.
The analysis is only as good as the data.
Well-designed experiments can allow us to reach appropriate cause-and-effect conclusions.
How do we obtain data? Why is it important?
What is bias? How can it be identified? How can it be prevented?
To what extent is data biased? To what extent can data be purposely biased?
To what extent does data collection methodology affect results?
Does size matter?
# Days Course Content A/DE/HW Learning Targets
3 4.1 Sampling & Surveys
The Idea of a Sample Survey
How to Sample Badly
How to Sample Well: Random Sampling
Other Sampling Methods
Inference for Sampling
Random Surveys: What Can Go Wrong?
CS: Can Magnets Help Reduce Pain A: See No Evil, Hear No Evil? A: How Large is a Typical U.S. State? A: Sampling Sunflowers A: Results May Vary... HW: 1, 3, 5, 7, 9, 11, 17, 19, 21, 23, 25, 27-29, 31, 33, 35
Identify the population and sample in a sample survey.
Identify voluntary response samples and convenience samples. Explain how these bad sampling methods can lead to bias.
Describe how to use Table D to select a simple random sample (SRS).
Distinguish a simple random sample from a stratified random sample or cluster sample. Give advantages and disadvantages of each sampling method.
Explain how undercoverage, nonresponse, and question wording can lead to bias in a sample survey.
4 4.2 Experiments
Observational Study versus Experiment
The Language of Experiments
How to Experiment Badly
How to Experiment Well: The Randomized Comparative Experiment
Three Principles of Experimental Design
Experiments: What Can Go Wrong?
Inference for Experiments
Blocking
Matched Pairs Design
A: Distracted Driving A: Get Your Heart Beating DA: Nitrogen in Tires--A Lot of Hot Air? HW: 37-42, 45, 47, 49, 51, 53, 57, 63, 65, 67, 69, 71, 73, 75 77, 79, 81, 85
Distinguish between an observational study and an experiment.
Explain how a lurking variable in an observational study can lead to confounding.
Identify the experimental units or subjects, explanatory variables (factors), treatments, and response variables in an experiment.
Describe a completely randomized design for an experiment.
Explain why random assignment is an important experimental design principle.
Distinguish between a completely randomized design and a randomized block design.
Know when a matched pairs experimental design is appropriate and how to implement such a design.
AP Statistics Audit Syllabus Page 11
Chapter 4: Designing Studies
# Days Course Content A/DE/HW Learning Targets
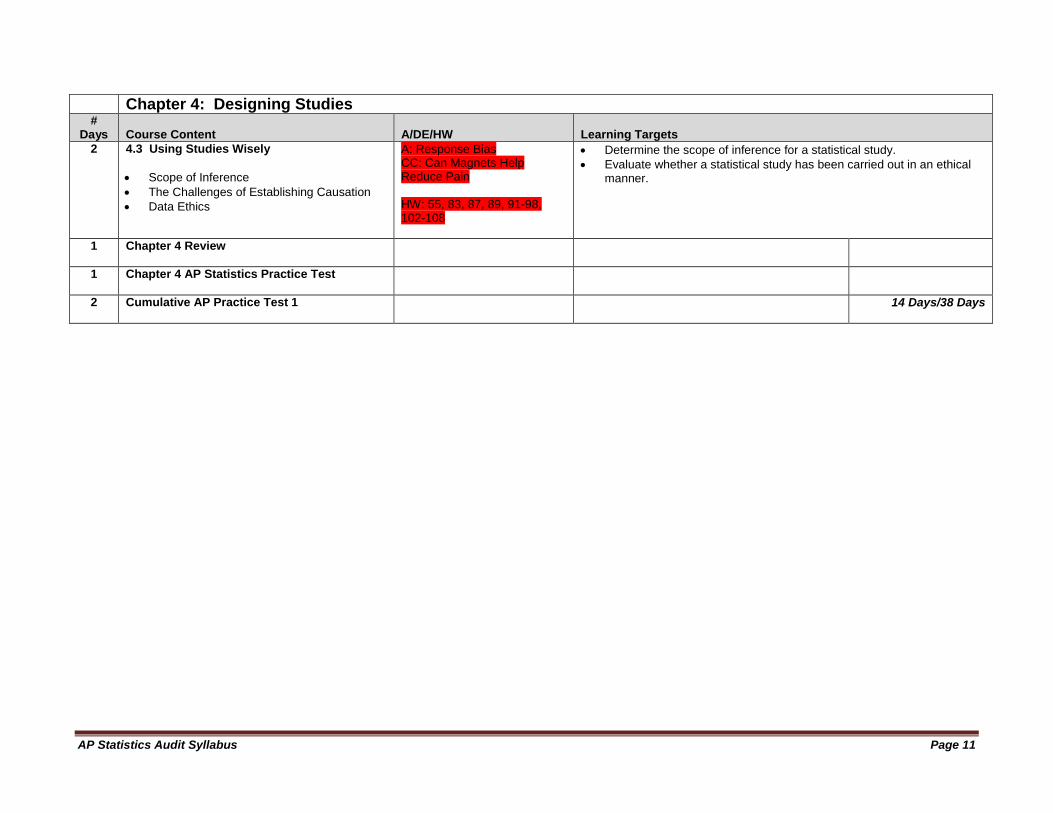
2 4.3 Using Studies Wisely
Scope of Inference
The Challenges of Establishing Causation
Data Ethics
A: Response Bias CC: Can Magnets Help Reduce Pain HW: 55, 83, 87, 89, 91-98, 102-108
Determine the scope of inference for a statistical study.
Evaluate whether a statistical study has been carried out in an ethical manner.
1 Chapter 4 Review
1 Chapter 4 AP Statistics Practice Test
2 Cumulative AP Practice Test 1
14 Days/38 Days
AP Statistics Audit Syllabus Page 12
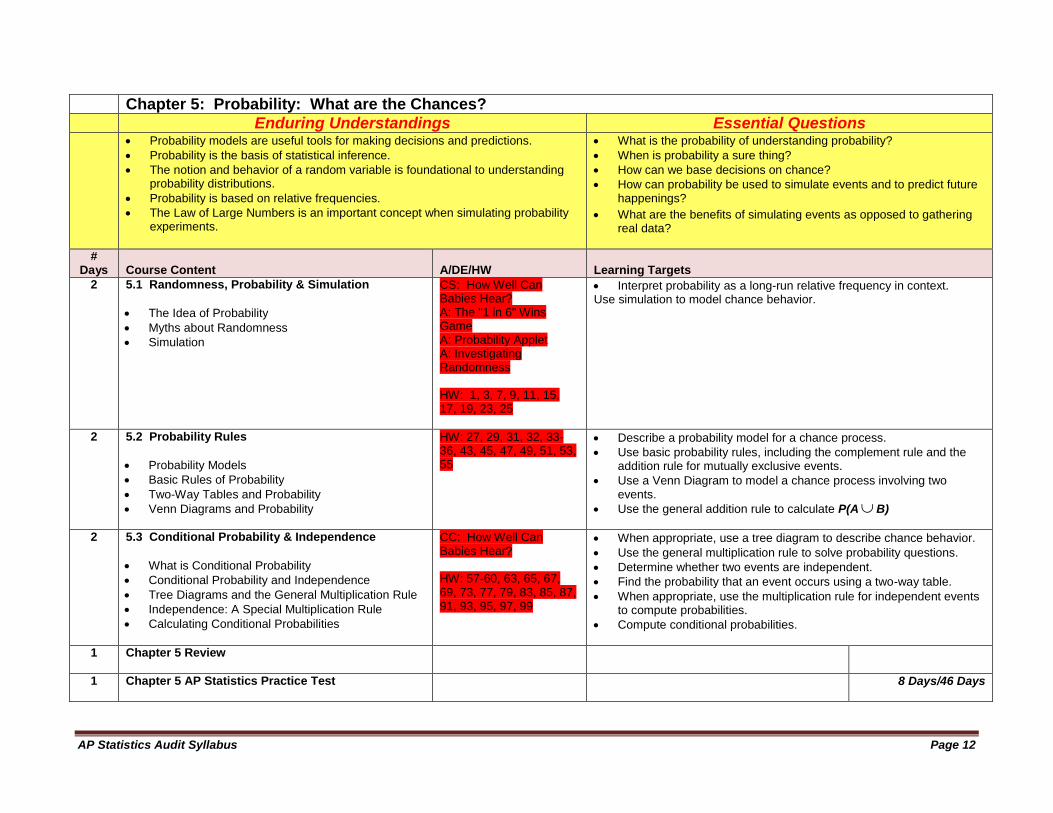
Chapter 5: Probability: What are the Chances?
Enduring Understandings Essential Questions Probability models are useful tools for making decisions and predictions.
Probability is the basis of statistical inference.
The notion and behavior of a random variable is foundational to understanding probability distributions.
Probability is based on relative frequencies.
The Law of Large Numbers is an important concept when simulating probability experiments.
What is the probability of understanding probability?
When is probability a sure thing?
How can we base decisions on chance?
How can probability be used to simulate events and to predict future happenings?
What are the benefits of simulating events as opposed to gathering real data?
# Days
Course Content A/DE/HW Learning Targets
2 5.1 Randomness, Probability & Simulation
The Idea of Probability
Myths about Randomness
Simulation
CS: How Well Can Babies Hear? A: The "1 in 6" Wins Game A: Probability Applet A: Investigating Randomness HW: 1, 3, 7, 9, 11, 15, 17, 19, 23, 25
Interpret probability as a long-run relative frequency in context. Use simulation to model chance behavior.
2 5.2 Probability Rules
Probability Models
Basic Rules of Probability
Two-Way Tables and Probability
Venn Diagrams and Probability
HW: 27, 29, 31, 32, 33-36, 43, 45, 47, 49, 51, 53, 55
Describe a probability model for a chance process.
Use basic probability rules, including the complement rule and the addition rule for mutually exclusive events.
Use a Venn Diagram to model a chance process involving two events.
Use the general addition rule to calculate P(A B)
2 5.3 Conditional Probability & Independence
What is Conditional Probability
Conditional Probability and Independence
Tree Diagrams and the General Multiplication Rule
Independence: A Special Multiplication Rule
Calculating Conditional Probabilities
CC: How Well Can Babies Hear? HW: 57-60, 63, 65, 67, 69, 73, 77, 79, 83, 85, 87, 91, 93, 95, 97, 99
When appropriate, use a tree diagram to describe chance behavior.
Use the general multiplication rule to solve probability questions.
Determine whether two events are independent.
Find the probability that an event occurs using a two-way table.
When appropriate, use the multiplication rule for independent events to compute probabilities.
Compute conditional probabilities.
1 Chapter 5 Review
1 Chapter 5 AP Statistics Practice Test
8 Days/46 Days
AP Statistics Audit Syllabus Page 13
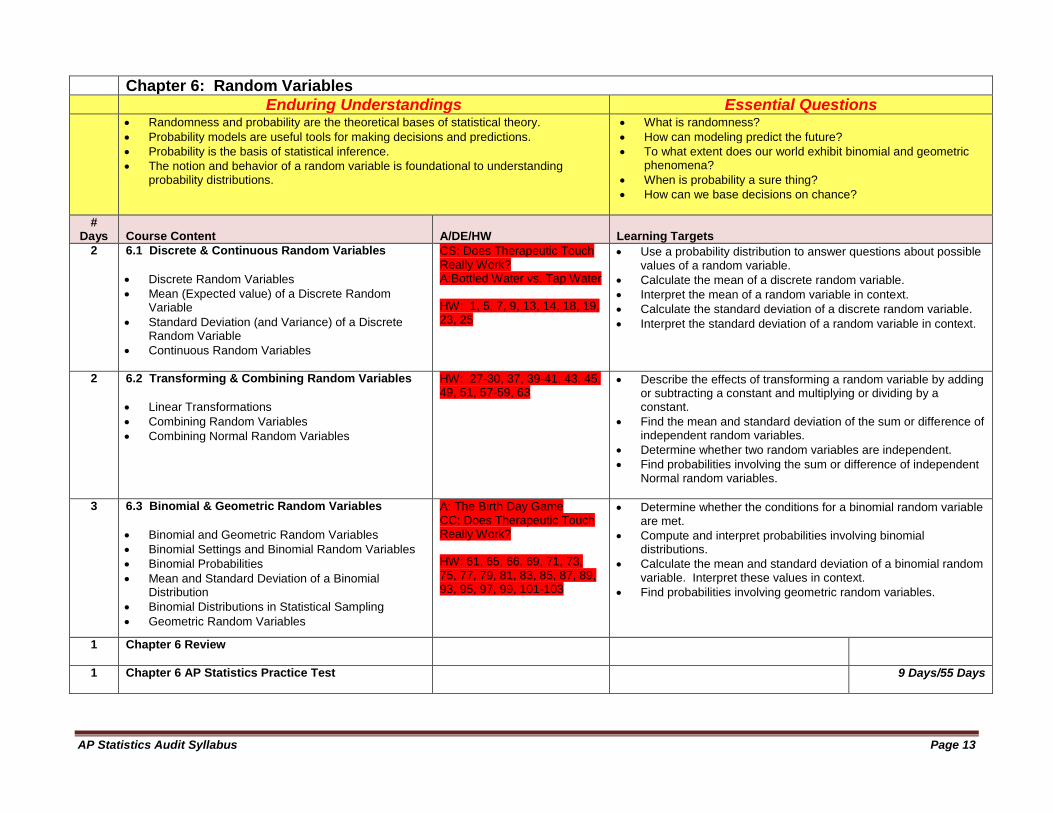
Chapter 6: Random Variables
Enduring Understandings Essential Questions Randomness and probability are the theoretical bases of statistical theory.
Probability models are useful tools for making decisions and predictions.
Probability is the basis of statistical inference.
The notion and behavior of a random variable is foundational to understanding probability distributions.
What is randomness?
How can modeling predict the future?
To what extent does our world exhibit binomial and geometric phenomena?
When is probability a sure thing?
How can we base decisions on chance?
# Days
Course Content A/DE/HW Learning Targets
2 6.1 Discrete & Continuous Random Variables
Discrete Random Variables
Mean (Expected value) of a Discrete Random Variable
Standard Deviation (and Variance) of a Discrete Random Variable
Continuous Random Variables
CS: Does Therapeutic Touch Really Work? A:Bottled Water vs. Tap Water HW: 1, 5, 7, 9, 13, 14, 18, 19, 23, 25
Use a probability distribution to answer questions about possible values of a random variable.
Calculate the mean of a discrete random variable.
Interpret the mean of a random variable in context.
Calculate the standard deviation of a discrete random variable.
Interpret the standard deviation of a random variable in context.
2 6.2 Transforming & Combining Random Variables
Linear Transformations
Combining Random Variables
Combining Normal Random Variables
HW: 27-30, 37, 39-41, 43, 45, 49, 51, 57-59, 63
Describe the effects of transforming a random variable by adding or subtracting a constant and multiplying or dividing by a constant.
Find the mean and standard deviation of the sum or difference of independent random variables.
Determine whether two random variables are independent.
Find probabilities involving the sum or difference of independent Normal random variables.
3 6.3 Binomial & Geometric Random Variables
Binomial and Geometric Random Variables
Binomial Settings and Binomial Random Variables
Binomial Probabilities
Mean and Standard Deviation of a Binomial Distribution
Binomial Distributions in Statistical Sampling
Geometric Random Variables
A: The Birth Day Game CC: Does Therapeutic Touch Really Work? HW: 61, 65, 66, 69, 71, 73, 75, 77, 79, 81, 83, 85, 87, 89, 93, 95, 97, 99, 101-103
Determine whether the conditions for a binomial random variable are met.
Compute and interpret probabilities involving binomial distributions.
Calculate the mean and standard deviation of a binomial random variable. Interpret these values in context.
Find probabilities involving geometric random variables.
1 Chapter 6 Review
1 Chapter 6 AP Statistics Practice Test
9 Days/55 Days
AP Statistics Audit Syllabus Page 14
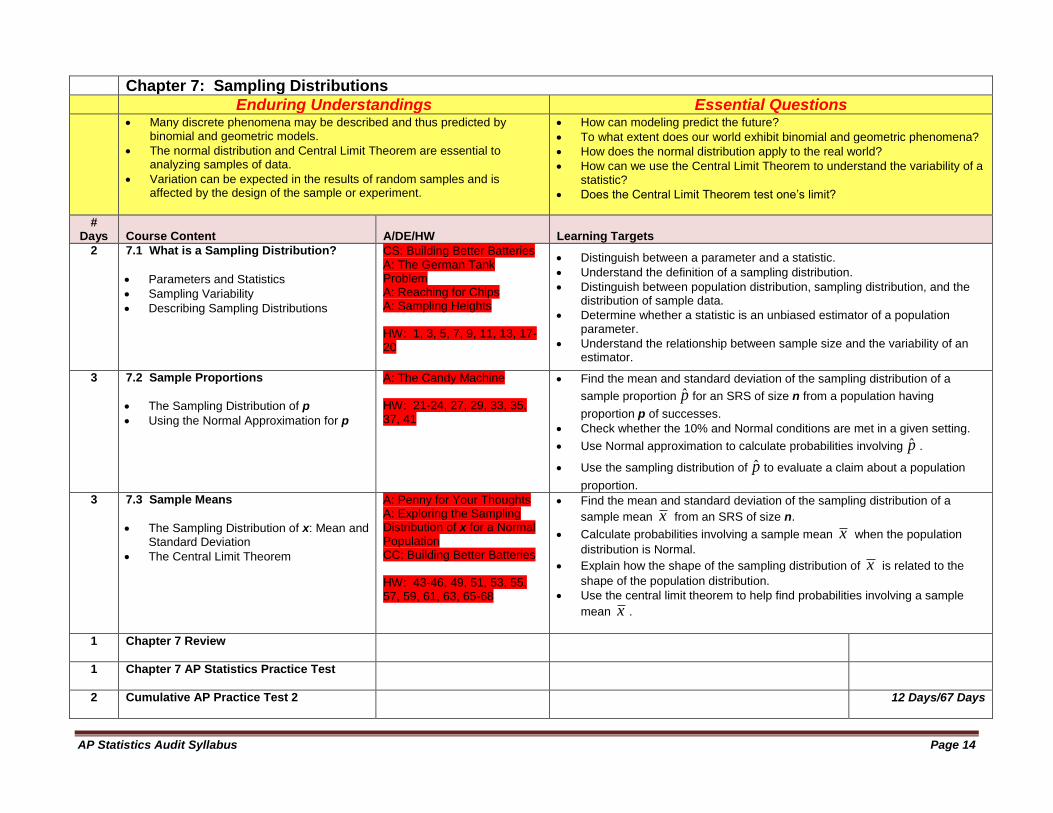
Chapter 7: Sampling Distributions
Enduring Understandings Essential Questions Many discrete phenomena may be described and thus predicted by
binomial and geometric models.
The normal distribution and Central Limit Theorem are essential to analyzing samples of data.
Variation can be expected in the results of random samples and is affected by the design of the sample or experiment.
How can modeling predict the future?
To what extent does our world exhibit binomial and geometric phenomena?
How does the normal distribution apply to the real world?
How can we use the Central Limit Theorem to understand the variability of a statistic?
Does the Central Limit Theorem test one’s limit?
# Days
Course Content A/DE/HW Learning Targets
2 7.1 What is a Sampling Distribution?
Parameters and Statistics
Sampling Variability
Describing Sampling Distributions
CS: Building Better Batteries A: The German Tank Problem A: Reaching for Chips A: Sampling Heights HW: 1, 3, 5, 7, 9, 11, 13, 17-20
Distinguish between a parameter and a statistic.
Understand the definition of a sampling distribution.
Distinguish between population distribution, sampling distribution, and the distribution of sample data.
Determine whether a statistic is an unbiased estimator of a population parameter.
Understand the relationship between sample size and the variability of an estimator.
3 7.2 Sample Proportions
The Sampling Distribution of p
Using the Normal Approximation for p
A: The Candy Machine HW: 21-24, 27, 29, 33, 35, 37, 41
Find the mean and standard deviation of the sampling distribution of a
sample proportion p̂ for an SRS of size n from a population having
proportion p of successes.
Check whether the 10% and Normal conditions are met in a given setting.
Use Normal approximation to calculate probabilities involving p̂ .
Use the sampling distribution of p̂ to evaluate a claim about a population
proportion.
3 7.3 Sample Means
The Sampling Distribution of x: Mean and Standard Deviation
The Central Limit Theorem
A: Penny for Your Thoughts A: Exploring the Sampling Distribution of x for a Normal Population CC: Building Better Batteries HW: 43-46, 49, 51, 53, 55, 57, 59, 61, 63, 65-68
Find the mean and standard deviation of the sampling distribution of a
sample mean x from an SRS of size n.
Calculate probabilities involving a sample mean x when the population
distribution is Normal.
Explain how the shape of the sampling distribution of x is related to the
shape of the population distribution.
Use the central limit theorem to help find probabilities involving a sample
mean x .
1 Chapter 7 Review
1 Chapter 7 AP Statistics Practice Test
2 Cumulative AP Practice Test 2
12 Days/67 Days
AP Statistics Audit Syllabus Page 15
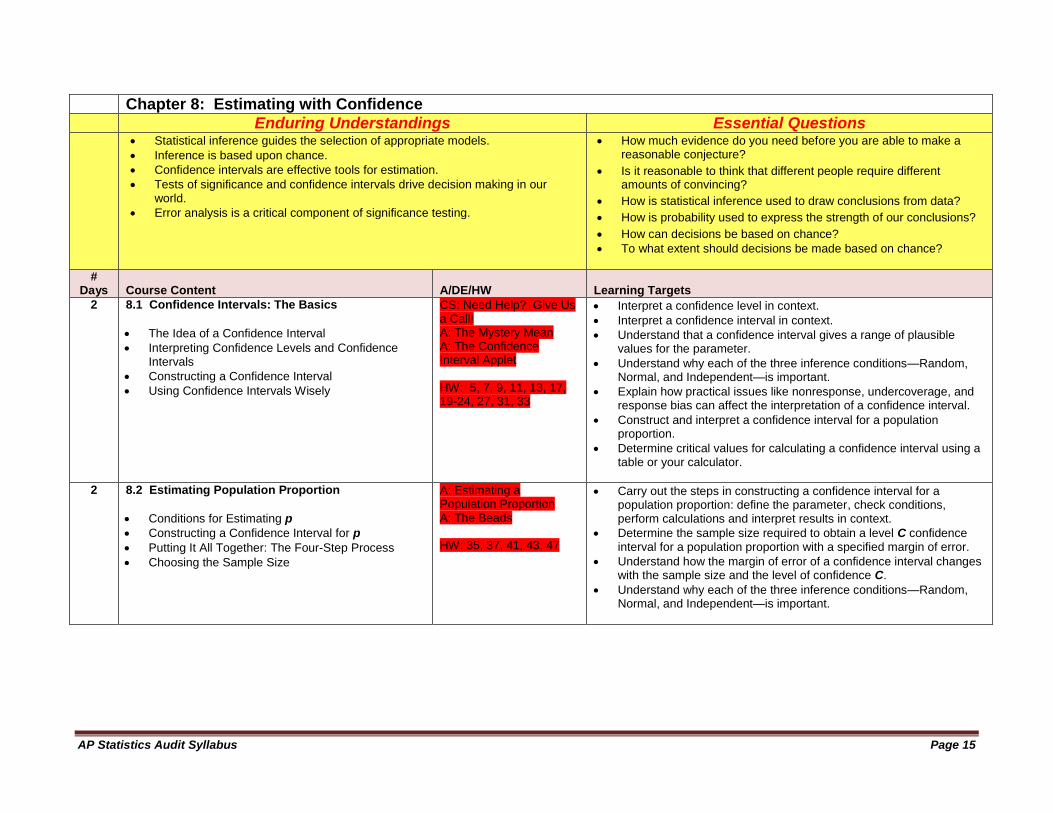
Chapter 8: Estimating with Confidence
Enduring Understandings Essential Questions Statistical inference guides the selection of appropriate models.
Inference is based upon chance.
Confidence intervals are effective tools for estimation.
Tests of significance and confidence intervals drive decision making in our world.
Error analysis is a critical component of significance testing.
How much evidence do you need before you are able to make a reasonable conjecture?
Is it reasonable to think that different people require different amounts of convincing?
How is statistical inference used to draw conclusions from data?
How is probability used to express the strength of our conclusions?
How can decisions be based on chance?
To what extent should decisions be made based on chance?
# Days
Course Content A/DE/HW Learning Targets
2 8.1 Confidence Intervals: The Basics
The Idea of a Confidence Interval
Interpreting Confidence Levels and Confidence Intervals
Constructing a Confidence Interval
Using Confidence Intervals Wisely
CS: Need Help? Give Us a Call! A: The Mystery Mean A: The Confidence Interval Applet HW: 5, 7, 9, 11, 13, 17, 19-24, 27, 31, 33
Interpret a confidence level in context.
Interpret a confidence interval in context.
Understand that a confidence interval gives a range of plausible values for the parameter.
Understand why each of the three inference conditions—Random, Normal, and Independent—is important.
Explain how practical issues like nonresponse, undercoverage, and response bias can affect the interpretation of a confidence interval.
Construct and interpret a confidence interval for a population proportion.
Determine critical values for calculating a confidence interval using a table or your calculator.
2 8.2 Estimating Population Proportion
Conditions for Estimating p
Constructing a Confidence Interval for p
Putting It All Together: The Four-Step Process
Choosing the Sample Size
A: Estimating a Population Proportion A: The Beads HW: 35, 37, 41, 43, 47
Carry out the steps in constructing a confidence interval for a population proportion: define the parameter, check conditions, perform calculations and interpret results in context.
Determine the sample size required to obtain a level C confidence interval for a population proportion with a specified margin of error.
Understand how the margin of error of a confidence interval changes with the sample size and the level of confidence C.
Understand why each of the three inference conditions—Random, Normal, and Independent—is important.
AP Statistics Audit Syllabus Page 16
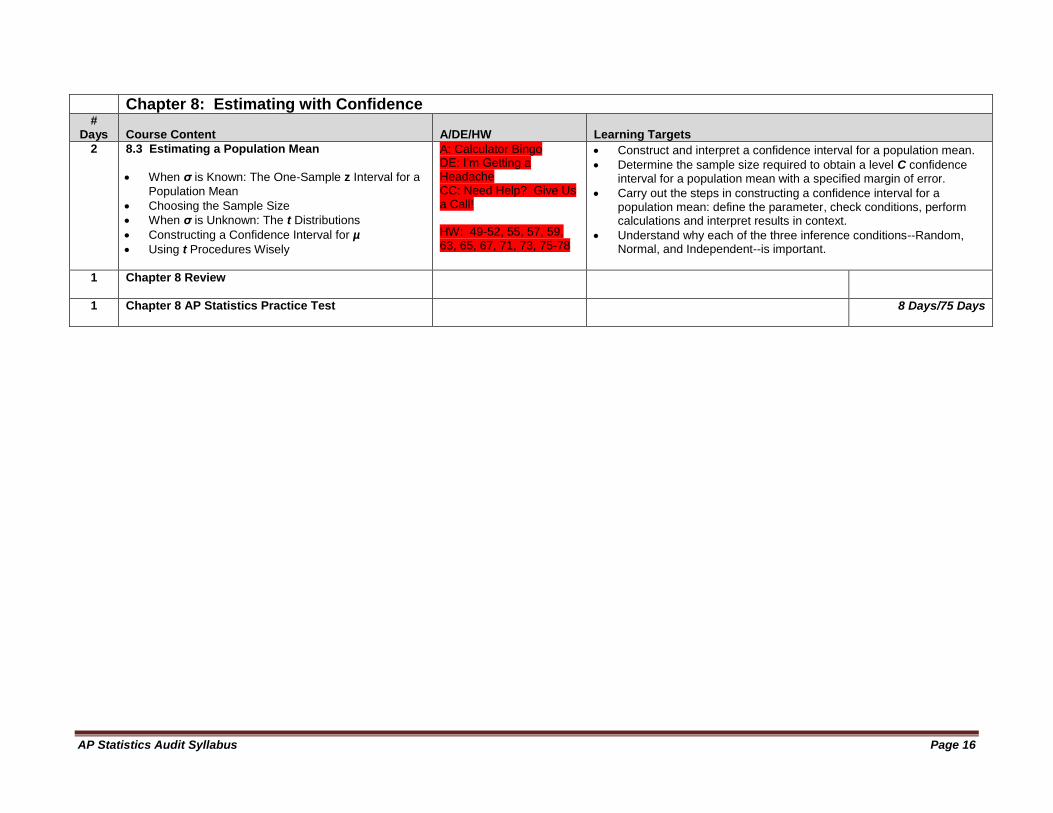
Chapter 8: Estimating with Confidence
# Days
Course Content A/DE/HW Learning Targets
2 8.3 Estimating a Population Mean
When σ is Known: The One-Sample z Interval for a
Population Mean
Choosing the Sample Size
When σ is Unknown: The t Distributions
Constructing a Confidence Interval for µ
Using t Procedures Wisely
A: Calculator Bingo DE: I’m Getting a Headache CC: Need Help? Give Us a Call! HW: 49-52, 55, 57, 59, 63, 65, 67, 71, 73, 75-78
Construct and interpret a confidence interval for a population mean.
Determine the sample size required to obtain a level C confidence interval for a population mean with a specified margin of error.
Carry out the steps in constructing a confidence interval for a population mean: define the parameter, check conditions, perform calculations and interpret results in context.
Understand why each of the three inference conditions--Random, Normal, and Independent--is important.
1 Chapter 8 Review
1 Chapter 8 AP Statistics Practice Test
8 Days/75 Days
AP Statistics Audit Syllabus Page 17
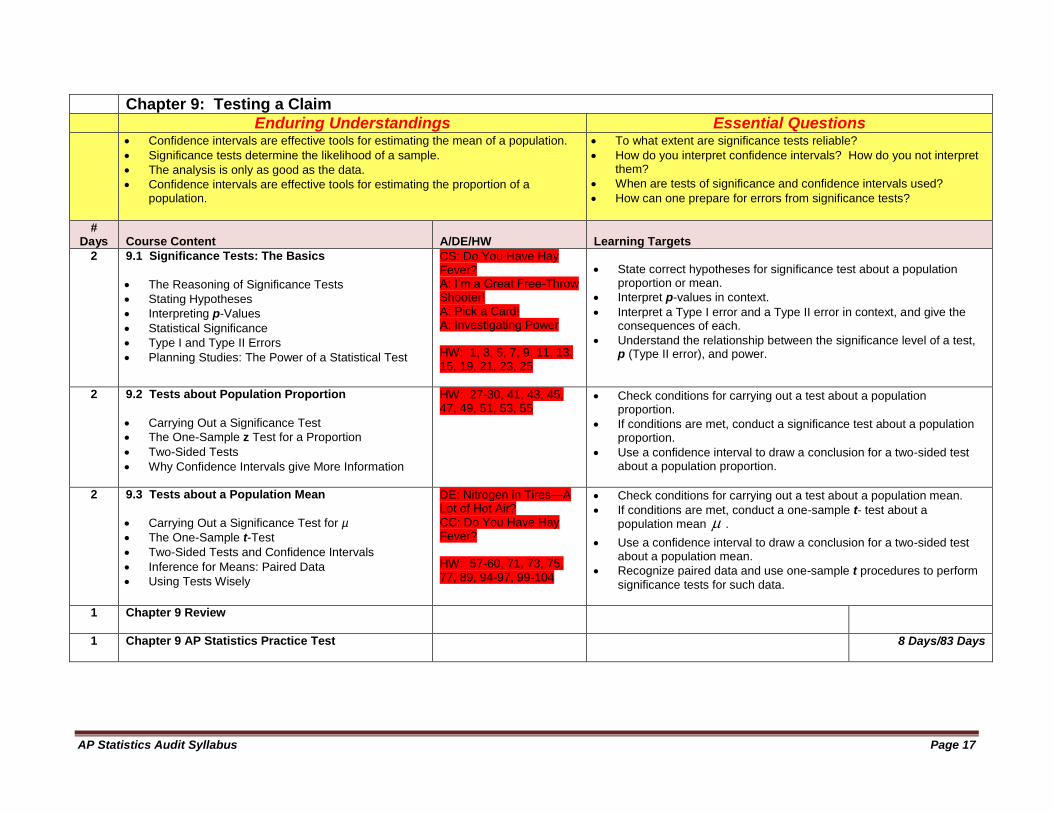
Chapter 9: Testing a Claim
Enduring Understandings Essential Questions Confidence intervals are effective tools for estimating the mean of a population.
Significance tests determine the likelihood of a sample.
The analysis is only as good as the data.
Confidence intervals are effective tools for estimating the proportion of a population.
To what extent are significance tests reliable?
How do you interpret confidence intervals? How do you not interpret them?
When are tests of significance and confidence intervals used?
How can one prepare for errors from significance tests?
#
Days Course Content A/DE/HW Learning Targets
2 9.1 Significance Tests: The Basics
The Reasoning of Significance Tests
Stating Hypotheses
Interpreting p-Values
Statistical Significance
Type I and Type II Errors
Planning Studies: The Power of a Statistical Test
CS: Do You Have Hay Fever? A: I’m a Great Free-Throw Shooter! A: Pick a Card! A: Investigating Power HW: 1, 3, 5, 7, 9, 11, 13, 15, 19, 21, 23, 25
State correct hypotheses for significance test about a population proportion or mean.
Interpret p-values in context.
Interpret a Type I error and a Type II error in context, and give the consequences of each.
Understand the relationship between the significance level of a test, p (Type II error), and power.
2 9.2 Tests about Population Proportion
Carrying Out a Significance Test
The One-Sample z Test for a Proportion
Two-Sided Tests
Why Confidence Intervals give More Information
HW: 27-30, 41, 43, 45, 47, 49, 51, 53, 55
Check conditions for carrying out a test about a population proportion.
If conditions are met, conduct a significance test about a population proportion.
Use a confidence interval to draw a conclusion for a two-sided test about a population proportion.
2 9.3 Tests about a Population Mean
Carrying Out a Significance Test for µ
The One-Sample t-Test
Two-Sided Tests and Confidence Intervals
Inference for Means: Paired Data
Using Tests Wisely
DE: Nitrogen in Tires—A Lot of Hot Air? CC: Do You Have Hay Fever? HW: 57-60, 71, 73, 75, 77, 89, 94-97, 99-104
Check conditions for carrying out a test about a population mean.
If conditions are met, conduct a one-sample t- test about a population mean .
Use a confidence interval to draw a conclusion for a two-sided test about a population mean.
Recognize paired data and use one-sample t procedures to perform
significance tests for such data.
1 Chapter 9 Review
1 Chapter 9 AP Statistics Practice Test
8 Days/83 Days
AP Statistics Audit Syllabus Page 18
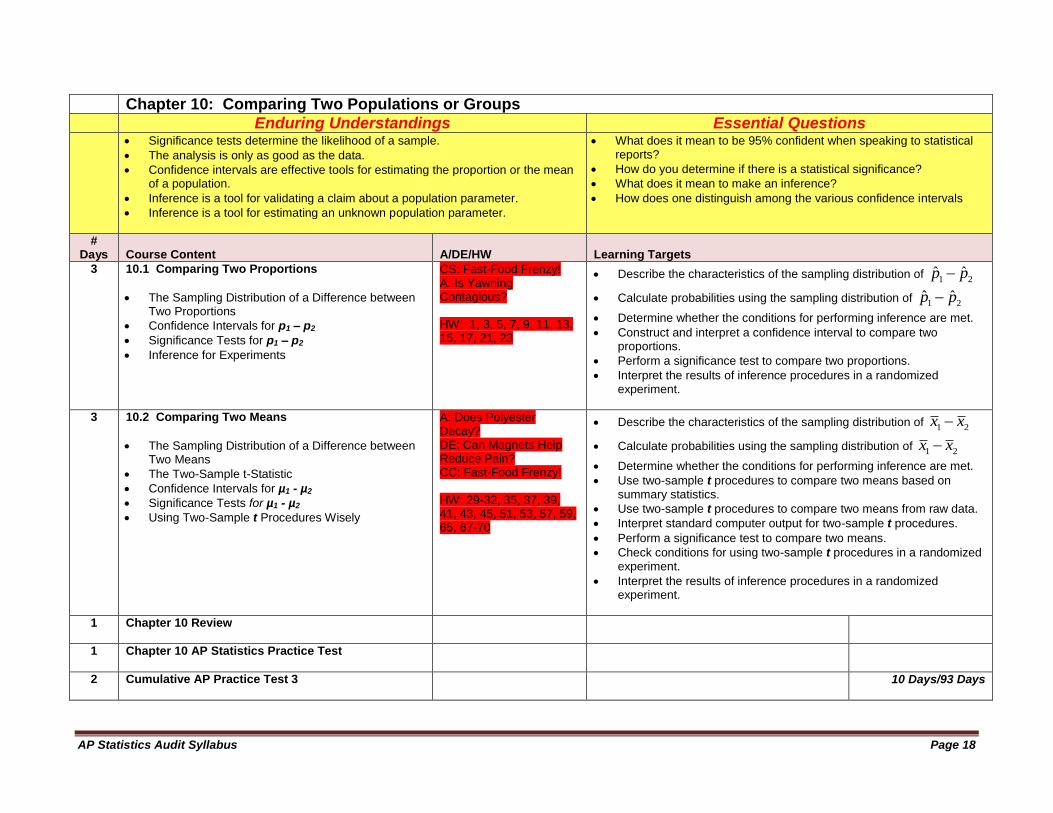
Chapter 10: Comparing Two Populations or Groups
Enduring Understandings Essential Questions Significance tests determine the likelihood of a sample.
The analysis is only as good as the data.
Confidence intervals are effective tools for estimating the proportion or the mean of a population.
Inference is a tool for validating a claim about a population parameter.
Inference is a tool for estimating an unknown population parameter.
What does it mean to be 95% confident when speaking to statistical reports?
How do you determine if there is a statistical significance?
What does it mean to make an inference?
How does one distinguish among the various confidence intervals
# Days
Course Content A/DE/HW Learning Targets
3 10.1 Comparing Two Proportions
The Sampling Distribution of a Difference between Two Proportions
Confidence Intervals for p1 – p2
Significance Tests for p1 – p2
Inference for Experiments
CS: Fast-Food Frenzy! A: Is Yawning Contagious? HW: 1, 3, 5, 7, 9, 11, 13, 15, 17, 21, 23
Describe the characteristics of the sampling distribution of 1 2ˆ ˆp p
Calculate probabilities using the sampling distribution of 1 2ˆ ˆp p
Determine whether the conditions for performing inference are met.
Construct and interpret a confidence interval to compare two proportions.
Perform a significance test to compare two proportions.
Interpret the results of inference procedures in a randomized experiment.
3 10.2 Comparing Two Means
The Sampling Distribution of a Difference between Two Means
The Two-Sample t-Statistic
Confidence Intervals for µ1 - µ2
Significance Tests for µ1 - µ2
Using Two-Sample t Procedures Wisely
A: Does Polyester Decay? DE: Can Magnets Help Reduce Pain? CC: Fast-Food Frenzy! HW: 29-32, 35, 37, 39, 41, 43, 45, 51, 53, 57, 59, 65, 67-70
Describe the characteristics of the sampling distribution of 1 2x x
Calculate probabilities using the sampling distribution of 1 2x x
Determine whether the conditions for performing inference are met.
Use two-sample t procedures to compare two means based on summary statistics.
Use two-sample t procedures to compare two means from raw data.
Interpret standard computer output for two-sample t procedures.
Perform a significance test to compare two means.
Check conditions for using two-sample t procedures in a randomized experiment.
Interpret the results of inference procedures in a randomized experiment.
1 Chapter 10 Review
1 Chapter 10 AP Statistics Practice Test
2 Cumulative AP Practice Test 3
10 Days/93 Days
AP Statistics Audit Syllabus Page 19
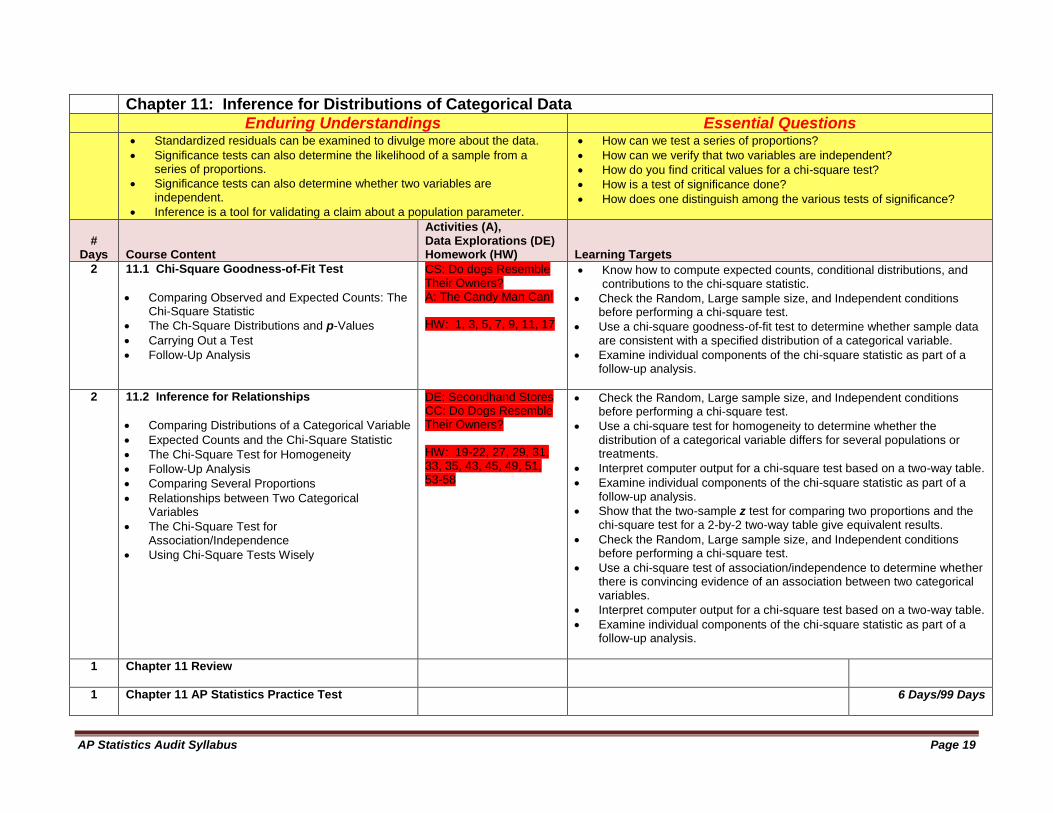
Chapter 11: Inference for Distributions of Categorical Data
Enduring Understandings Essential Questions Standardized residuals can be examined to divulge more about the data.
Significance tests can also determine the likelihood of a sample from a series of proportions.
Significance tests can also determine whether two variables are independent.
Inference is a tool for validating a claim about a population parameter.
How can we test a series of proportions?
How can we verify that two variables are independent?
How do you find critical values for a chi-square test?
How is a test of significance done?
How does one distinguish among the various tests of significance?
# Days
Course Content
Activities (A), Data Explorations (DE) Homework (HW) Learning Targets
2 11.1 Chi-Square Goodness-of-Fit Test
Comparing Observed and Expected Counts: The Chi-Square Statistic
The Ch-Square Distributions and p-Values
Carrying Out a Test
Follow-Up Analysis
CS: Do dogs Resemble Their Owners? A: The Candy Man Can! HW: 1, 3, 5, 7, 9, 11, 17
Know how to compute expected counts, conditional distributions, and contributions to the chi-square statistic.
Check the Random, Large sample size, and Independent conditions before performing a chi-square test.
Use a chi-square goodness-of-fit test to determine whether sample data are consistent with a specified distribution of a categorical variable.
Examine individual components of the chi-square statistic as part of a follow-up analysis.
2 11.2 Inference for Relationships
Comparing Distributions of a Categorical Variable
Expected Counts and the Chi-Square Statistic
The Chi-Square Test for Homogeneity
Follow-Up Analysis
Comparing Several Proportions
Relationships between Two Categorical Variables
The Chi-Square Test for Association/Independence
Using Chi-Square Tests Wisely
DE: Secondhand Stores CC: Do Dogs Resemble Their Owners? HW: 19-22, 27, 29, 31, 33, 35, 43, 45, 49, 51, 53-58
Check the Random, Large sample size, and Independent conditions before performing a chi-square test.
Use a chi-square test for homogeneity to determine whether the distribution of a categorical variable differs for several populations or treatments.
Interpret computer output for a chi-square test based on a two-way table.
Examine individual components of the chi-square statistic as part of a follow-up analysis.
Show that the two-sample z test for comparing two proportions and the chi-square test for a 2-by-2 two-way table give equivalent results.
Check the Random, Large sample size, and Independent conditions before performing a chi-square test.
Use a chi-square test of association/independence to determine whether there is convincing evidence of an association between two categorical variables.
Interpret computer output for a chi-square test based on a two-way table.
Examine individual components of the chi-square statistic as part of a follow-up analysis.
1 Chapter 11 Review
1 Chapter 11 AP Statistics Practice Test
6 Days/99 Days
AP Statistics Audit Syllabus Page 20
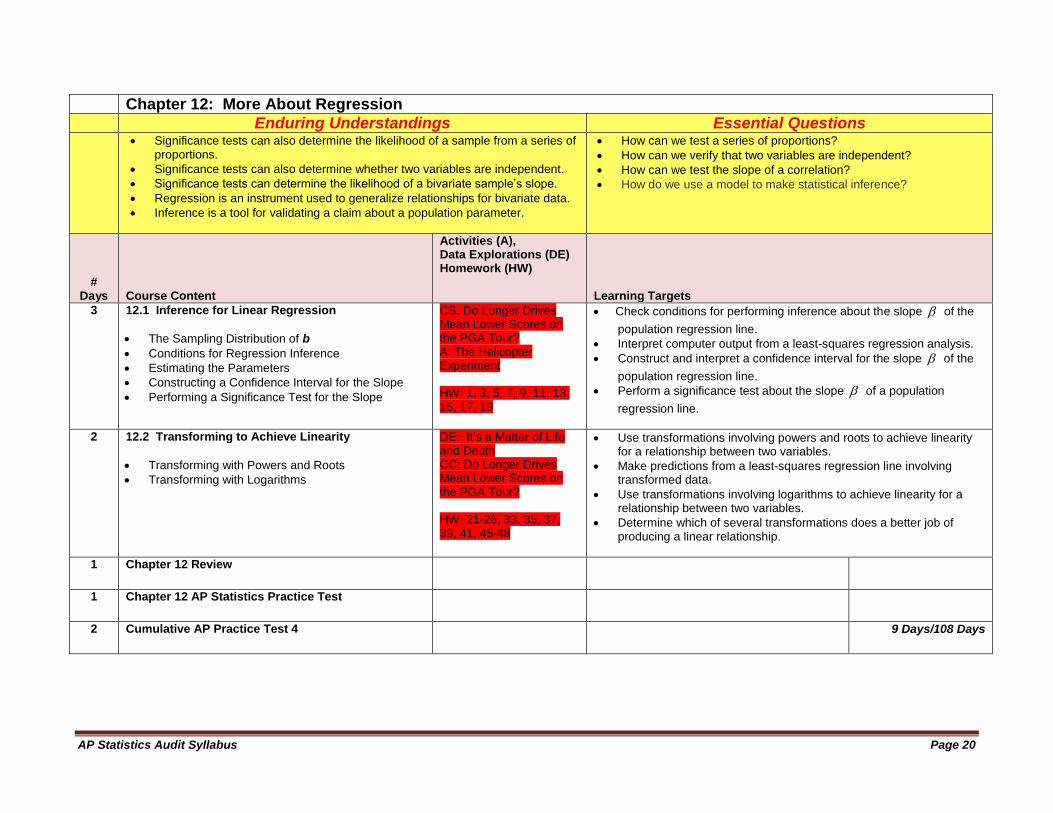
Chapter 12: More About Regression
Enduring Understandings Essential Questions Significance tests can also determine the likelihood of a sample from a series of
proportions.
Significance tests can also determine whether two variables are independent.
Significance tests can determine the likelihood of a bivariate sample’s slope.
Regression is an instrument used to generalize relationships for bivariate data.
Inference is a tool for validating a claim about a population parameter.
How can we test a series of proportions?
How can we verify that two variables are independent?
How can we test the slope of a correlation?
How do we use a model to make statistical inference?
# Days
Course Content
Activities (A), Data Explorations (DE) Homework (HW)
Learning Targets
3 12.1 Inference for Linear Regression
The Sampling Distribution of b
Conditions for Regression Inference
Estimating the Parameters
Constructing a Confidence Interval for the Slope
Performing a Significance Test for the Slope
CS: Do Longer Drives Mean Lower Scores on the PGA Tour? A: The Helicopter Experiment HW: 1, 3, 5, 7, 9, 11, 13, 15, 17, 19
Check conditions for performing inference about the slope of the
population regression line.
Interpret computer output from a least-squares regression analysis.
Construct and interpret a confidence interval for the slope of the
population regression line.
Perform a significance test about the slope of a population
regression line.
2 12.2 Transforming to Achieve Linearity
Transforming with Powers and Roots
Transforming with Logarithms
DE: It’s a Matter of Life and Death CC: Do Longer Drives Mean Lower Scores on the PGA Tour? HW: 21-26, 33, 35, 37, 39, 41, 45-48
Use transformations involving powers and roots to achieve linearity for a relationship between two variables.
Make predictions from a least-squares regression line involving transformed data.
Use transformations involving logarithms to achieve linearity for a relationship between two variables.
Determine which of several transformations does a better job of producing a linear relationship.
1 Chapter 12 Review
1 Chapter 12 AP Statistics Practice Test
2 Cumulative AP Practice Test 4
9 Days/108 Days
AP Statistics Audit Syllabus Page 21
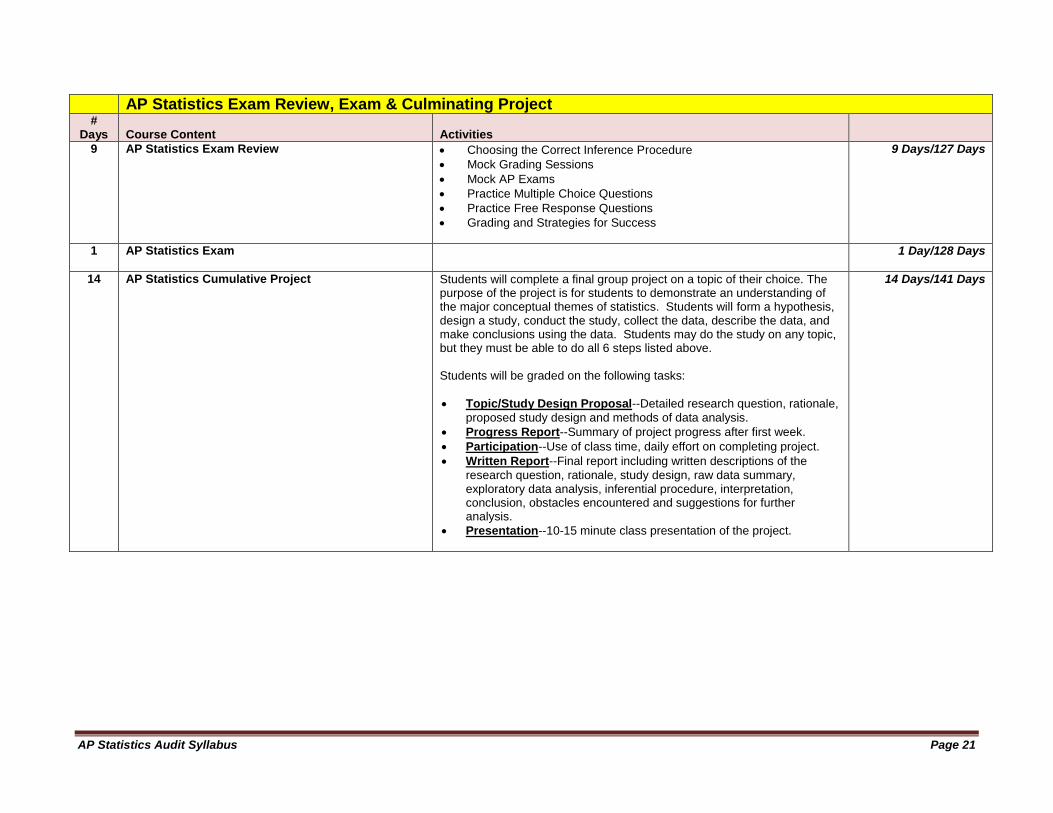
AP Statistics Exam Review, Exam & Culminating Project
# Days Course Content
Activities
9 AP Statistics Exam Review Choosing the Correct Inference Procedure
Mock Grading Sessions
Mock AP Exams
Practice Multiple Choice Questions
Practice Free Response Questions
Grading and Strategies for Success
9 Days/127 Days
1 AP Statistics Exam
1 Day/128 Days
14 AP Statistics Cumulative Project Students will complete a final group project on a topic of their choice. The purpose of the project is for students to demonstrate an understanding of the major conceptual themes of statistics. Students will form a hypothesis, design a study, conduct the study, collect the data, describe the data, and make conclusions using the data. Students may do the study on any topic, but they must be able to do all 6 steps listed above. Students will be graded on the following tasks:
Topic/Study Design Proposal--Detailed research question, rationale,
proposed study design and methods of data analysis.
Progress Report--Summary of project progress after first week.
Participation--Use of class time, daily effort on completing project.
Written Report--Final report including written descriptions of the
research question, rationale, study design, raw data summary, exploratory data analysis, inferential procedure, interpretation, conclusion, obstacles encountered and suggestions for further analysis.
Presentation--10-15 minute class presentation of the project.
14 Days/141 Days