antithyroperoxidase antibodies (atpo) in hashimoto ... · antithyroperoxidase antibodies (atpo) in...
TRANSCRIPT
ANTITHYROPEROXIDASE ANTIBODIES (ATPO) INHASHIMOTO THYROIDITIS: VARIATION OF LEVELS AND
CORRELATION WITH ECHOGRAPHIC PATTERNS
D. PeretianuSCM Povernei, Bucharest
Antithyroidperoxidase antibodies (ATPO), antithyroid antibodies directed to thyroidfollicular microsomes, are recognized as the test for diagnosis of Hashimoto’s thyroiditis.The study tries to establish relationships between the ATPO and echographic picture inthyroiditis.
In 383 patients (15-85 years, 354 women and 29 men) the antithyroperoxidase assaywas performed using ELISA technique, (N= 0 - 34 µU/ml). Therefore, 185 patients hadHashimoto thyroiditis and 198 patients were excluded. The images obtained from all thepatients and controls, classified in 7 patterns, showed that pattern #1 (“hypoechogenic andpseudonodular”) could be considered as pathognomonic for the diagnosis of Hashimotothyroiditis: the predictive positive value was 95.61%. Five hundred and six evaluationmoments echo-ATPO were correlated in both Hashimoto thyroiditis and control group. Inpatients with Hashimoto thyroiditis, 301 evaluations were performed, both immune (ATPO)and echographic. For all cases and patterns (36 degrees of freedom), χχ2 test was 77.35. Pvalue was < 0.0001. When ATPO are high, pattern #1 was the most frequent, while forpattern #7 (normal), ATPO should be the lowest. The ATPO evolution can be consideredmostly as unchanged during over one year observation. There is no correlation between theATPO level, echographic pattern and thyroid function: the patients were in the same percenteuthyroid and hypothyroid associated with similar echographic patterns.
In conclusion, this study shows a highly correlative relationship between theechographic pattern and ATPO levels in Hashimoto patients.
Key words: Autoimmune disorder, ATPO, Hashimoto’s thyroiditis, thyroidultrasound /echography, thyroid function.
INTRODUCTION
Antithyroperoxidase antibodies (ATPO) are considered as antithyroidantibodies directed to the thyroid follicular microsomes, i.e., antiperoxidase. It was
61
Endocrine Care
Correspondence to: Dan Peretianu, str Povernei no. 32, tel +40.722504098, email:
Acta Endocrinologica (Buc), vol. I, no. 1, p. 58-75, 2005
argued that they represent both the pathogenesis of Hashimoto thyroiditis (as ADCCimmune pathogenetic mechanism) and the way of identifying the disease (1-5).
The immune lesion of the thyroid could have several or only one imagisticshape. It was suggested that the echographic shape or echographic images inHashimoto thyroiditis were somehow very typical for the disease (6-8). However, astandard echographic description of the immune thyroid disease is missing. Arelationship between the pathogenical factor which generates thyroiditis (i.e.,ATPO) and ultrasound shapes was made in only one published study (9) and inseveral previous communications (10,11).
This study tries to cover these aspects, bringing in front the problem ofspecificity, sensitivity and positive predictive value of some clearly describedpattern of images recorded in Hashimoto thyroiditis and some comments related toimmune associations. The analysis of ATPO evolution (i.e. fluctuation along thedisease) will be presented, too.
MATERIALS AND METHODS
Hashimoto thyroiditis diagnosisThe diagnosis of Hashimoto thyroiditis was performed according to ATPO
level: ATPO > 34 µU/ml mean thyroiditis. The thyroid function and thyroidechography were related to immune pathogenesis.
PatientsFrom over 10 000 consecutive patients with thyroid disorders viewed in the
last 5 years, in 383 patients (15 to 85 years, 354 women and 29 men) theantithyroperoxidase assay was performed using ELISA technique, normal range 0 -34 µU/ml (see later).
Two hundred fifty eight patients were euthyroid, 95 were hypothyroid and 45were hyperthyroid. At the begining of the study, no one was under thyroidsubstitution or antithyroid treatments. After diagnosis, hypothyroid patientsreceived T4 therapy and hyperthyroid patients received either methimazole orcarbimazole. Some of them received also a polarized, polychromatic, low energyradiation light BioptronR type (λλ 480-3400 nm; the degree of polarization is 95%for the spectrum between λλ 590 to 1550 nm and energy density 40 mW/cm2),according to Peretianu et al (12,13) known to activate the inflammatory immuneresponses.
Echographic description of the thyroid patternsThe echography was performed with an ALOKA 500 machine using a 7.5 MHzlinear probe. The images obtained from all the patients and controls were classifiedinto 7 patterns, according to Peretianu (9), as follows:
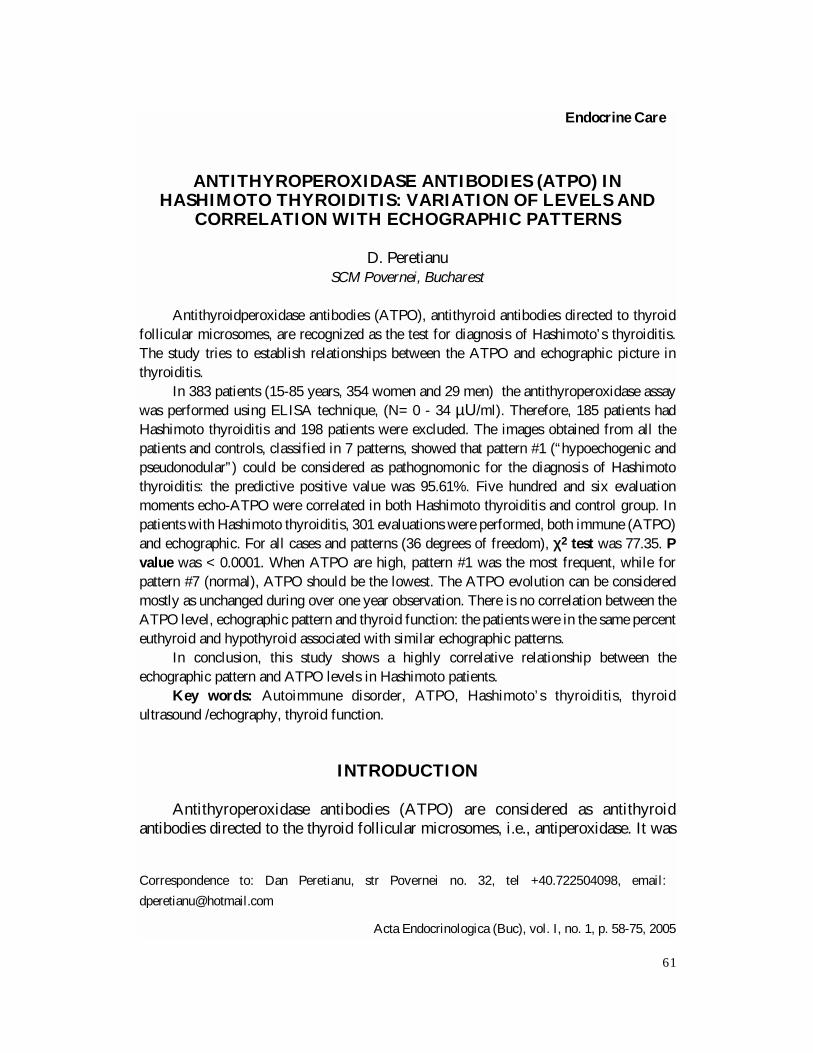
� Type 1: hypoechogenic and pseudonodular (Fig. 1 a) - “Symmetricallyenlarged thyroid lobes with an inhomogenous hypoechogenity echotexture. Thehypoechogenity could be described as important or marked. Areas of
D. Peretianu
62
hypoechogenity are bordered usually by hyperechogenic structures, described asfibrosis. In some cases the pseudonodule is surrounded by more hypoechogenicor/and anechogenic rims, which generate a nodular shape. These anechogenicborders are probably of vascular origin and do not represent capsules for nodules(Fig. 1 b). Therefore, the areas rounded by hypoechogenity or anechogenity couldbe described or viewed as pseudonodular. Frequently there could appear smallcalcifications”.
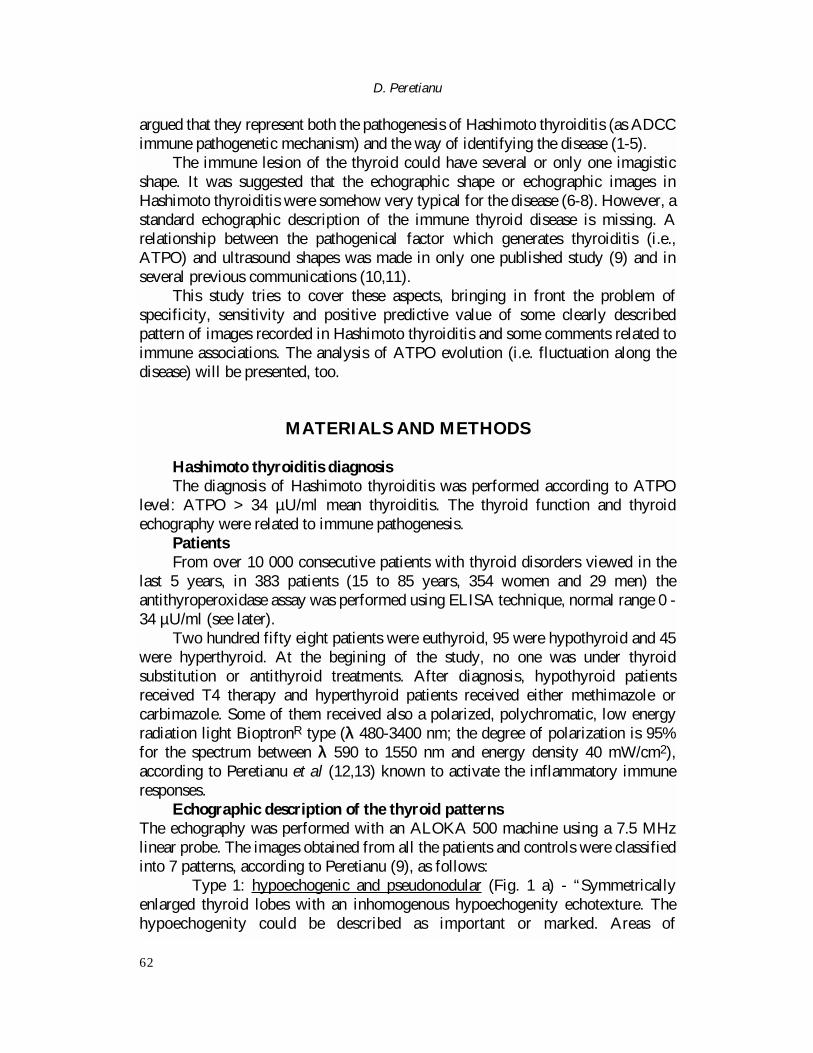
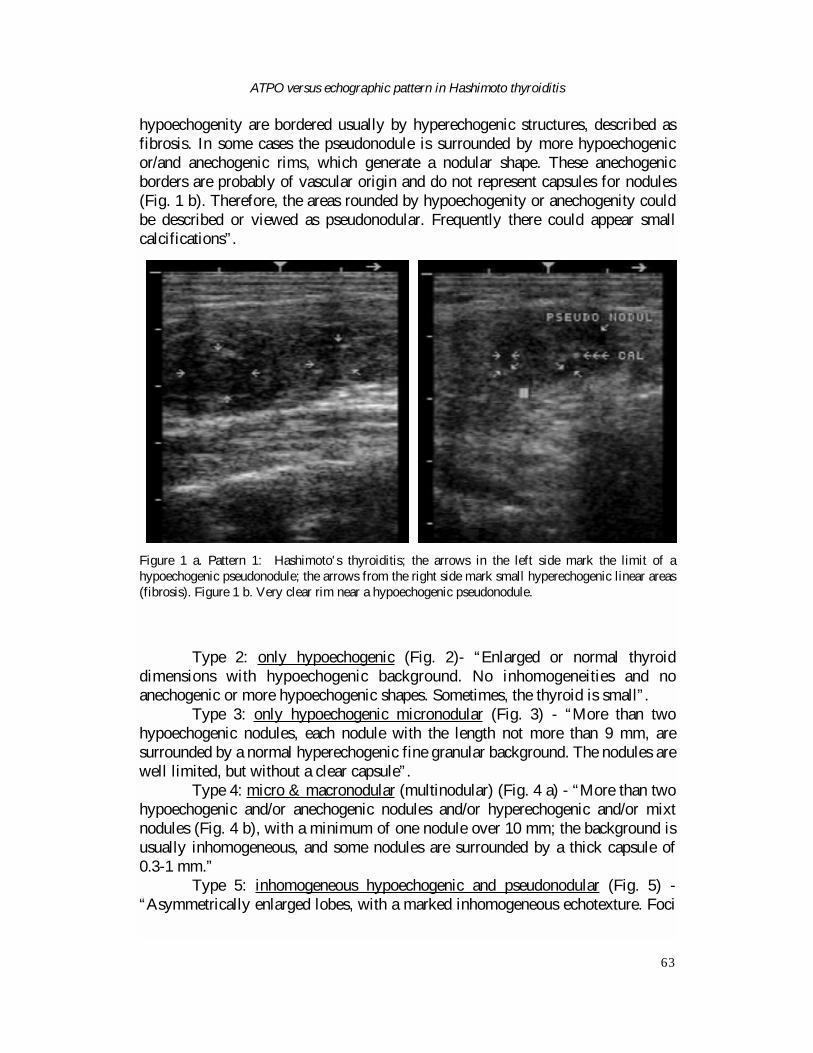
� Type 2: only hypoechogenic (Fig. 2)- “Enlarged or normal thyroiddimensions with hypoechogenic background. No inhomogeneities and noanechogenic or more hypoechogenic shapes. Sometimes, the thyroid is small”.
� Type 3: only hypoechogenic micronodular (Fig. 3) - “More than twohypoechogenic nodules, each nodule with the length not more than 9 mm, aresurrounded by a normal hyperechogenic fine granular background. The nodules arewell limited, but without a clear capsule”.
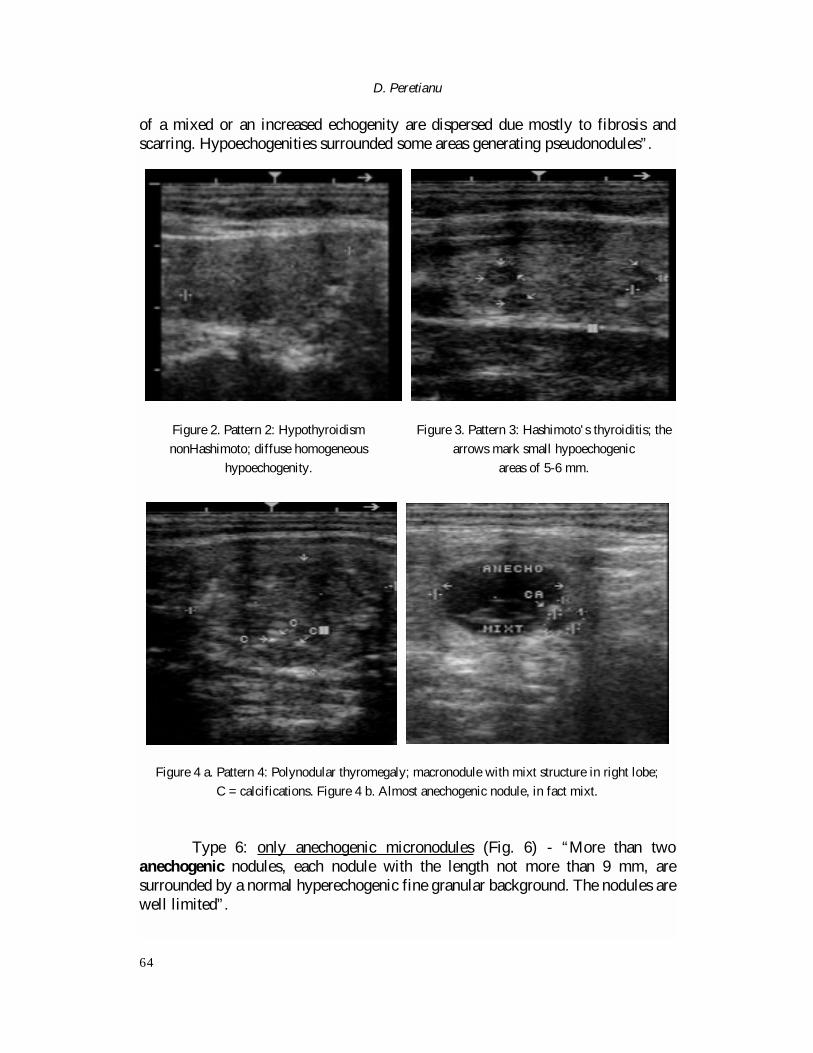
� Type 4: micro & macronodular (multinodular) (Fig. 4 a) - “More than twohypoechogenic and/or anechogenic nodules and/or hyperechogenic and/or mixtnodules (Fig. 4 b), with a minimum of one nodule over 10 mm; the background isusually inhomogeneous, and some nodules are surrounded by a thick capsule of 0.3-1 mm.”
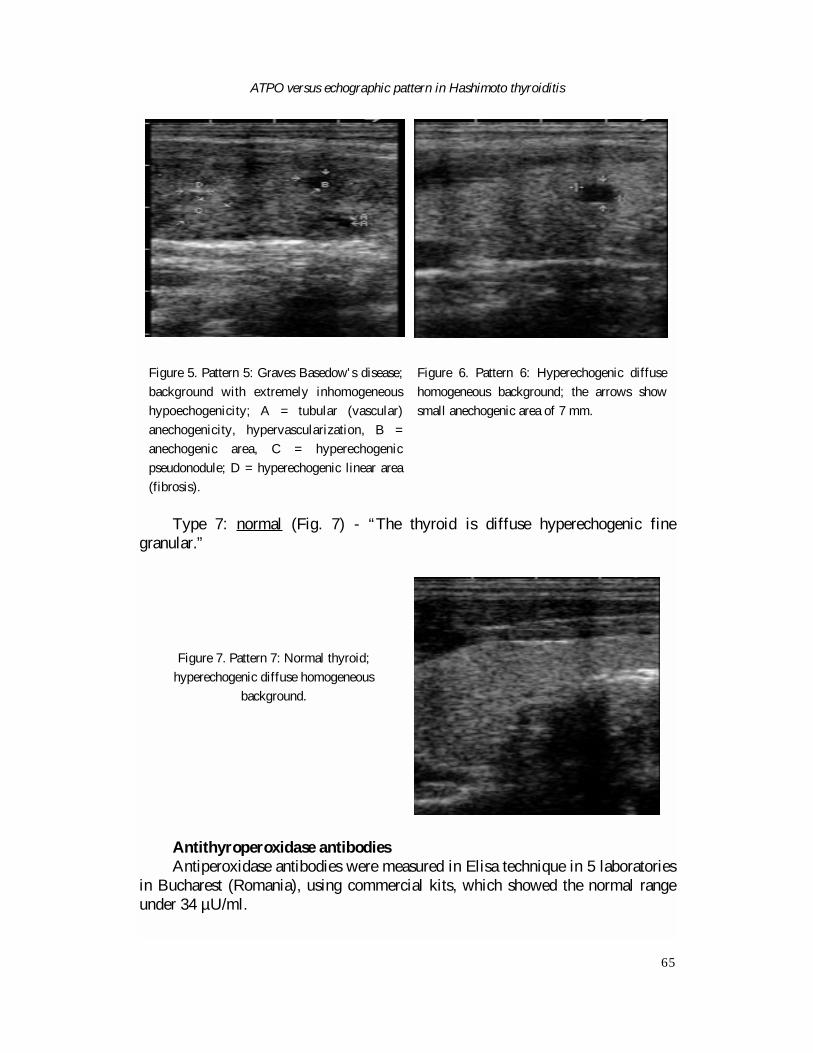
� Type 5: inhomogeneous hypoechogenic and pseudonodular (Fig. 5) -“Asymmetrically enlarged lobes, with a marked inhomogeneous echotexture. Foci
ATPO versus echographic pattern in Hashimoto thyroiditis
63
Figure 1 a. Pattern 1: Hashimoto's thyroiditis; the arrows in the left side mark the limit of ahypoechogenic pseudonodule; the arrows from the right side mark small hyperechogenic linear areas(fibrosis). Figure 1 b. Very clear rim near a hypoechogenic pseudonodule.
of a mixed or an increased echogenity are dispersed due mostly to fibrosis andscarring. Hypoechogenities surrounded some areas generating pseudonodules”.
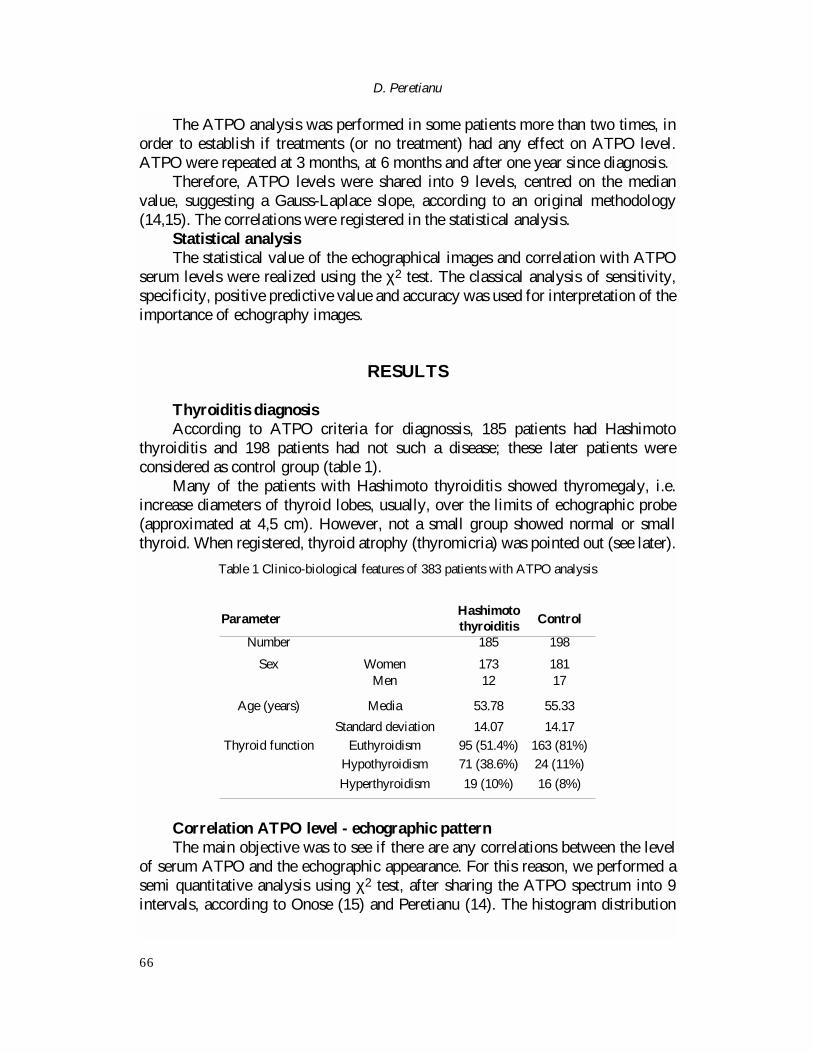
� Type 6: only anechogenic micronodules (Fig. 6) - “More than twoanechogenic nodules, each nodule with the length not more than 9 mm, aresurrounded by a normal hyperechogenic fine granular background. The nodules arewell limited”.
D. Peretianu
64
Figure 4 a. Pattern 4: Polynodular thyromegaly; macronodule with mixt structure in right lobe;
C = calcifications. Figure 4 b. Almost anechogenic nodule, in fact mixt.
Figure 2. Pattern 2: Hypothyroidism
nonHashimoto; diffuse homogeneous
hypoechogenity.
Figure 3. Pattern 3: Hashimoto's thyroiditis; the
arrows mark small hypoechogenic
areas of 5-6 mm.
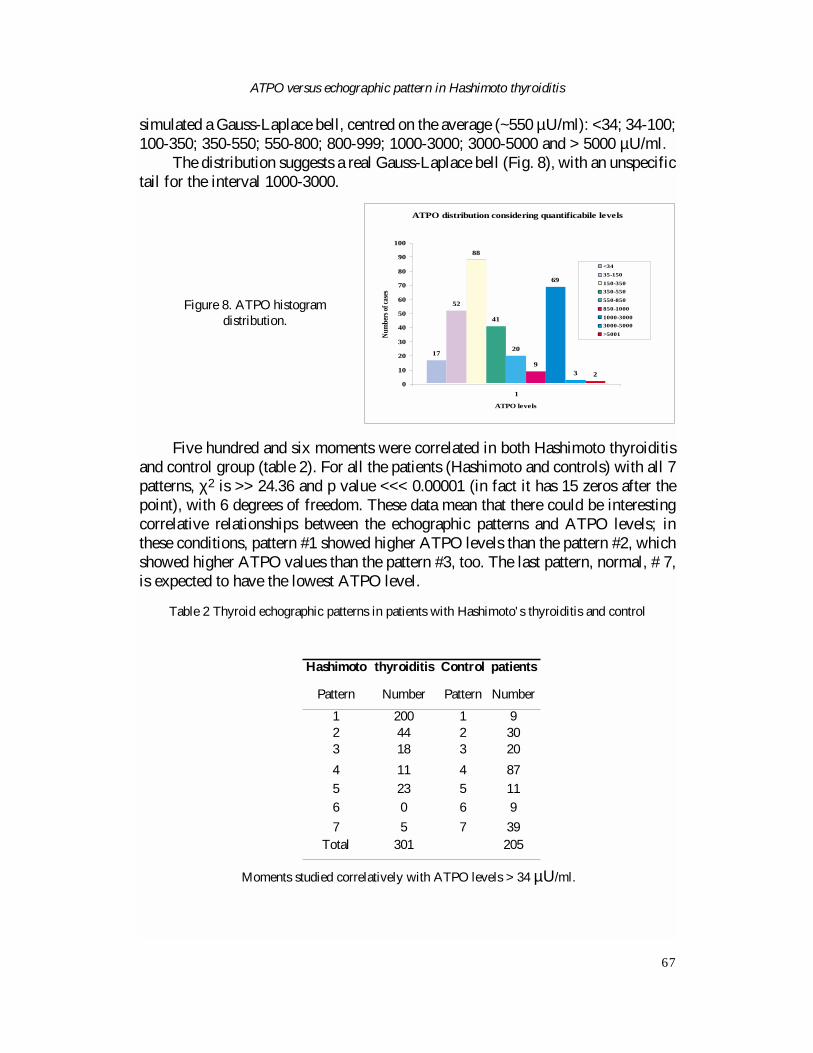
Type 7: normal (Fig. 7) - “The thyroid is diffuse hyperechogenic finegranular.”
Antithyroperoxidase antibodiesAntiperoxidase antibodies were measured in Elisa technique in 5 laboratories
in Bucharest (Romania), using commercial kits, which showed the normal rangeunder 34 µU/ml.
ATPO versus echographic pattern in Hashimoto thyroiditis
65
Figure 5. Pattern 5: Graves Basedow's disease;
background with extremely inhomogeneous
hypoechogenicity; A = tubular (vascular)
anechogenicity, hypervascularization, B =
anechogenic area, C = hyperechogenic
pseudonodule; D = hyperechogenic linear area
(fibrosis).
Figure 6. Pattern 6: Hyperechogenic diffuse
homogeneous background; the arrows show
small anechogenic area of 7 mm.
Figure 7. Pattern 7: Normal thyroid;
hyperechogenic diffuse homogeneous
background.
The ATPO analysis was performed in some patients more than two times, inorder to establish if treatments (or no treatment) had any effect on ATPO level.ATPO were repeated at 3 months, at 6 months and after one year since diagnosis.
Therefore, ATPO levels were shared into 9 levels, centred on the medianvalue, suggesting a Gauss-Laplace slope, according to an original methodology(14,15). The correlations were registered in the statistical analysis.
Statistical analysisThe statistical value of the echographical images and correlation with ATPO
serum levels were realized using the χ2 test. The classical analysis of sensitivity,specificity, positive predictive value and accuracy was used for interpretation of theimportance of echography images.
RESULTS
Thyroiditis diagnosisAccording to ATPO criteria for diagnossis, 185 patients had Hashimoto
thyroiditis and 198 patients had not such a disease; these later patients wereconsidered as control group (table 1).
Many of the patients with Hashimoto thyroiditis showed thyromegaly, i.e.increase diameters of thyroid lobes, usually, over the limits of echographic probe(approximated at 4,5 cm). However, not a small group showed normal or smallthyroid. When registered, thyroid atrophy (thyromicria) was pointed out (see later).
Correlation ATPO level - echographic patternThe main objective was to see if there are any correlations between the level
of serum ATPO and the echographic appearance. For this reason, we performed asemi quantitative analysis using χ2 test, after sharing the ATPO spectrum into 9intervals, according to Onose (15) and Peretianu (14). The histogram distribution
D. Peretianu
66
ParameterHashimotothyroiditis Control
Number 185 198
Sex Women 173 181Men 12 17
Age (years) Media 53.78 55.33
Standard deviation 14.07 14.17
Thyroid function Euthyroidism 95 (51.4%) 163 (81%)
Hypothyroidism 71 (38.6%) 24 (11%)
Hyperthyroidism 19 (10%) 16 (8%)
Table 1 Clinico-biological features of 383 patients with ATPO analysis
simulated a Gauss-Laplace bell, centred on the average (~550 µU/ml): <34; 34-100;100-350; 350-550; 550-800; 800-999; 1000-3000; 3000-5000 and > 5000 µU/ml.
The distribution suggests a real Gauss-Laplace bell (Fig. 8), with an unspecifictail for the interval 1000-3000.
Five hundred and six moments were correlated in both Hashimoto thyroiditisand control group (table 2). For all the patients (Hashimoto and controls) with all 7patterns, χ2 is >> 24.36 and p value <<< 0.00001 (in fact it has 15 zeros after thepoint), with 6 degrees of freedom. These data mean that there could be interestingcorrelative relationships between the echographic patterns and ATPO levels; inthese conditions, pattern #1 showed higher ATPO levels than the pattern #2, whichshowed higher ATPO values than the pattern #3, too. The last pattern, normal, # 7,is expected to have the lowest ATPO level.
ATPO versus echographic pattern in Hashimoto thyroiditis
67
ATPO distribution considering quantificabile levels
17
88
41
20
9
69
3 2
52
0
10
20
30
40
50
60
70
80
90
100
1
ATPO levels
Numb
ers o
f cas
es
<3435-150150-350350-550550-850850-10001000-30003000-5000>5001
Figure 8. ATPO histogramdistribution.
Hashimoto thyroiditis Control patients
Pattern Number Pattern Number
1 200 1 92 44 2 303 18 3 20
4 11 4 87
5 23 5 11
6 0 6 9
7 5 7 39Total 301 205
Table 2 Thyroid echographic patterns in patients with Hashimoto's thyroiditis and control
Moments studied correlatively with ATPO levels > 34 µU/ml.
In patients with Hashimoto thyroiditis, during time, 301 evaluations wereperformed at the same time both immune (ATPO) and echographic. For all casesand patterns (36 degrees of freedom), χ2 test is 77.35, P value is < 0.0001.
This also means that, when ATPO are high, pattern 1 is the most frequent. Theanalysis suggested that in pattern 7 (normal), ATPO should be the lowest.
From 57 patients with more than one ATPO analysis (see later), only in 8women (14%), the echographic pattern changes in time:
In AlLi, the echographic pattern modified from #1 to #2 during decreasingfluctuant ATPO level from 201 µU/ml (passing from 29 and 435) to 6 µU/ml.
In ConTu, the echographic pattern modified from #3 to #4 during decreasingfluctuant ATPO level from 108 µU/ml (passing from 73 and 103) to 8.75 µU/ml.
In VoiNi, the pattern #1 changed to #5 after withdrawing Bioptron lighttherapy (BLT), when ATPO decreased from 880 to 563 µU/ml and ATPO increasedback to 610.5 µU/ml.
In AlAl, pattern #1 changed to #5 after BLT and after decreasing ATPO from1000 to 407.5 (but passing through 309, 400, 1000 µU/ml, respectively);
In BuEc, pattern #1 changed to #2, when ATPO decreased from 1000 to 288µU/ml, under levothyroxine treatment (even the patient was euthyroid !);
In ConDo, pattern #1 changed to #5, and ATPO increased slowly from 157(through 184.5) to 197.5 µU/ml, under LT4;
In VinEl, pattern #1 changed, when ATPO were 273.5 µU/ml, 381.5 µU/ml, topattern #2 under BLT, when ATPO levels were 300 µU/ml;
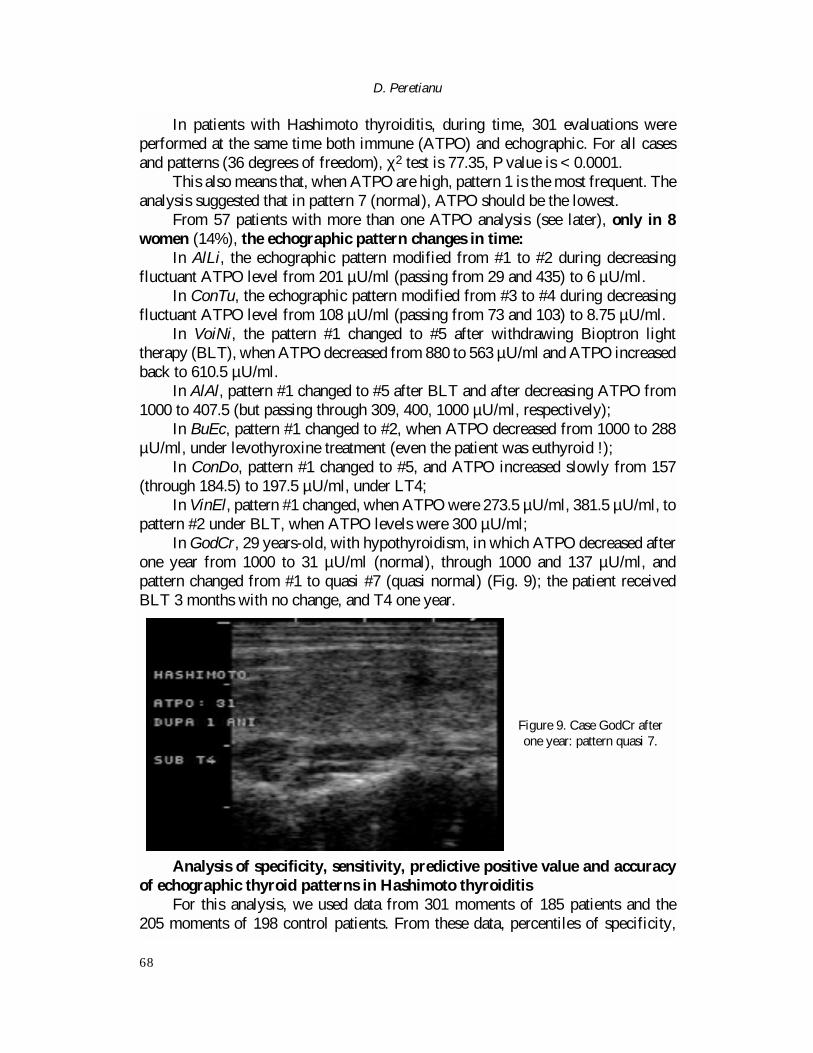
In GodCr, 29 years-old, with hypothyroidism, in which ATPO decreased afterone year from 1000 to 31 µU/ml (normal), through 1000 and 137 µU/ml, andpattern changed from #1 to quasi #7 (quasi normal) (Fig. 9); the patient receivedBLT 3 months with no change, and T4 one year.
Analysis of specificity, sensitivity, predictive positive value and accuracyof echographic thyroid patterns in Hashimoto thyroiditis
For this analysis, we used data from 301 moments of 185 patients and the 205 moments of 198 control patients. From these data, percentiles of specificity,
D. Peretianu
68
Figure 9. Case GodCr afterone year: pattern quasi 7.
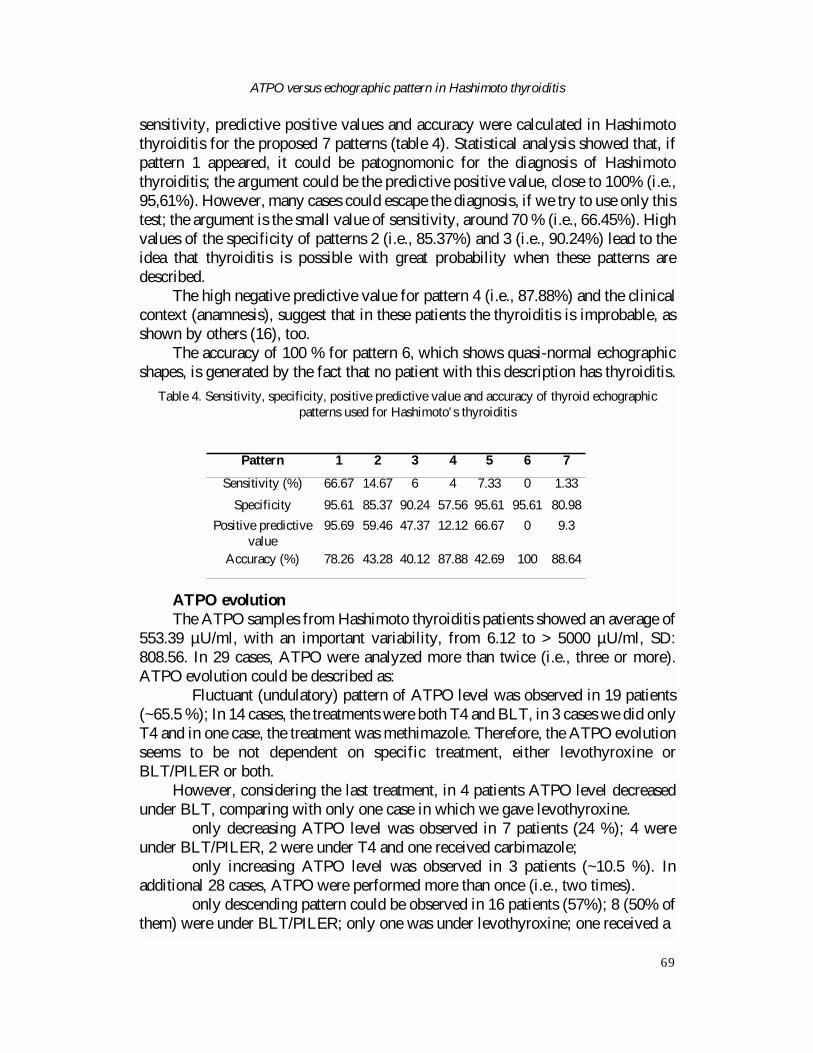
sensitivity, predictive positive values and accuracy were calculated in Hashimotothyroiditis for the proposed 7 patterns (table 4). Statistical analysis showed that, ifpattern 1 appeared, it could be patognomonic for the diagnosis of Hashimotothyroiditis; the argument could be the predictive positive value, close to 100% (i.e.,95,61%). However, many cases could escape the diagnosis, if we try to use only thistest; the argument is the small value of sensitivity, around 70 % (i.e., 66.45%). Highvalues of the specificity of patterns 2 (i.e., 85.37%) and 3 (i.e., 90.24%) lead to theidea that thyroiditis is possible with great probability when these patterns aredescribed.
The high negative predictive value for pattern 4 (i.e., 87.88%) and the clinicalcontext (anamnesis), suggest that in these patients the thyroiditis is improbable, asshown by others (16), too.
The accuracy of 100 % for pattern 6, which shows quasi-normal echographicshapes, is generated by the fact that no patient with this description has thyroiditis.
ATPO evolutionThe ATPO samples from Hashimoto thyroiditis patients showed an average of
553.39 µU/ml, with an important variability, from 6.12 to > 5000 µU/ml, SD:808.56. In 29 cases, ATPO were analyzed more than twice (i.e., three or more).ATPO evolution could be described as:
� Fluctuant (undulatory) pattern of ATPO level was observed in 19 patients(~65.5 %); In 14 cases, the treatments were both T4 and BLT, in 3 cases we did onlyT4 and in one case, the treatment was methimazole. Therefore, the ATPO evolutionseems to be not dependent on specific treatment, either levothyroxine orBLT/PILER or both.
However, considering the last treatment, in 4 patients ATPO level decreasedunder BLT, comparing with only one case in which we gave levothyroxine.
� only decreasing ATPO level was observed in 7 patients (24 %); 4 wereunder BLT/PILER, 2 were under T4 and one received carbimazole;
� only increasing ATPO level was observed in 3 patients (~10.5 %). Inadditional 28 cases, ATPO were performed more than once (i.e., two times).
� only descending pattern could be observed in 16 patients (57%); 8 (50% ofthem) were under BLT/PILER; only one was under levothyroxine; one received a
ATPO versus echographic pattern in Hashimoto thyroiditis
69
Pattern 1 2 3 4 5 6 7
Sensitivity (%) 66.67 14.67 6 4 7.33 0 1.33
Specificity 95.61 85.37 90.24 57.56 95.61 95.61 80.98
Positive predictivevalue
95.69 59.46 47.37 12.12 66.67 0 9.3
Accuracy (%) 78.26 43.28 40.12 87.88 42.69 100 88.64
Table 4. Sensitivity, specificity, positive predictive value and accuracy of thyroid echographicpatterns used for Hashimoto's thyroiditis
homeopathic treatment, one was under carbimazole and 5 received no treatment.� only ascending pattern could be registered in 6 patients (21.4%); 2 were
under T4; 1 received methimazole and one was under BLT; the other two receivedno treatment;
� no modified ATPO levels values appeared in 6 patients (21.4%); 2 wereunder BLT/PILER, one under T4, and 2 under no treatment. Considering thefluctuant pattern as non modified, and the sum of two subgroups (57 patients),ATPO level evolution could be considered as:
� Unchanged / fluctuant in 25 patients (44%);� Decreasing in 23 patients (40%);� Increasing in 9 patients (16%).
Echographic patterns in relations with thyroid immune disorders;hyperthyroidism, thyroid atrophy and amiodarone associated with Hashimotothyroiditis
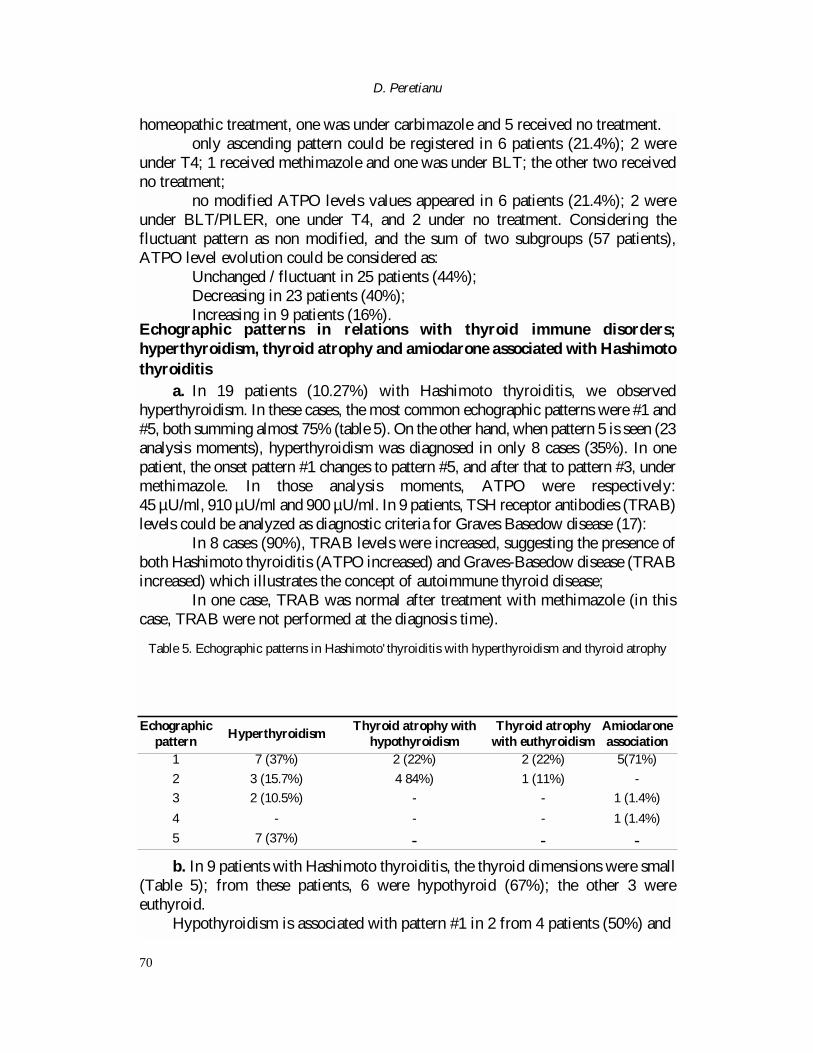
a. In 19 patients (10.27%) with Hashimoto thyroiditis, we observedhyperthyroidism. In these cases, the most common echographic patterns were #1 and#5, both summing almost 75% (table 5). On the other hand, when pattern 5 is seen (23analysis moments), hyperthyroidism was diagnosed in only 8 cases (35%). In onepatient, the onset pattern #1 changes to pattern #5, and after that to pattern #3, undermethimazole. In those analysis moments, ATPO were respectively: 45 µU/ml, 910 µU/ml and 900 µU/ml. In 9 patients, TSH receptor antibodies (TRAB)levels could be analyzed as diagnostic criteria for Graves Basedow disease (17):
� In 8 cases (90%), TRAB levels were increased, suggesting the presence ofboth Hashimoto thyroiditis (ATPO increased) and Graves-Basedow disease (TRABincreased) which illustrates the concept of autoimmune thyroid disease;
� In one case, TRAB was normal after treatment with methimazole (in thiscase, TRAB were not performed at the diagnosis time).
b. In 9 patients with Hashimoto thyroiditis, the thyroid dimensions were small(Table 5); from these patients, 6 were hypothyroid (67%); the other 3 wereeuthyroid.
Hypothyroidism is associated with pattern #1 in 2 from 4 patients (50%) and
D. Peretianu
70
Echographic pattern
HyperthyroidismThyroid atrophy with
hypothyroidismThyroid atrophy
with euthyroidismAmiodaroneassociation
1 7 (37%) 2 (22%) 2 (22%) 5(71%)
2 3 (15.7%) 4 84%) 1 (11%) -
3 2 (10.5%) - - 1 (1.4%)
4 - - - 1 (1.4%)
5 7 (37%) - - -
Table 5. Echographic patterns in Hashimoto'thyroiditis with hyperthyroidism and thyroid atrophy
with pattern #2 in 4 from 5 patients (80%); that means that, when pattern #2 isassociated with thyroid atrophy, hypothyroidism is very probable.
c. In 7 cases (3.8%), there was a history of amiodarone administration. Fourpatients were euthyroid and 3 were hypothyroid (2 patients with subclinicalhypothyroidism). Over 70% patients showed pattern #1 (Table 5).
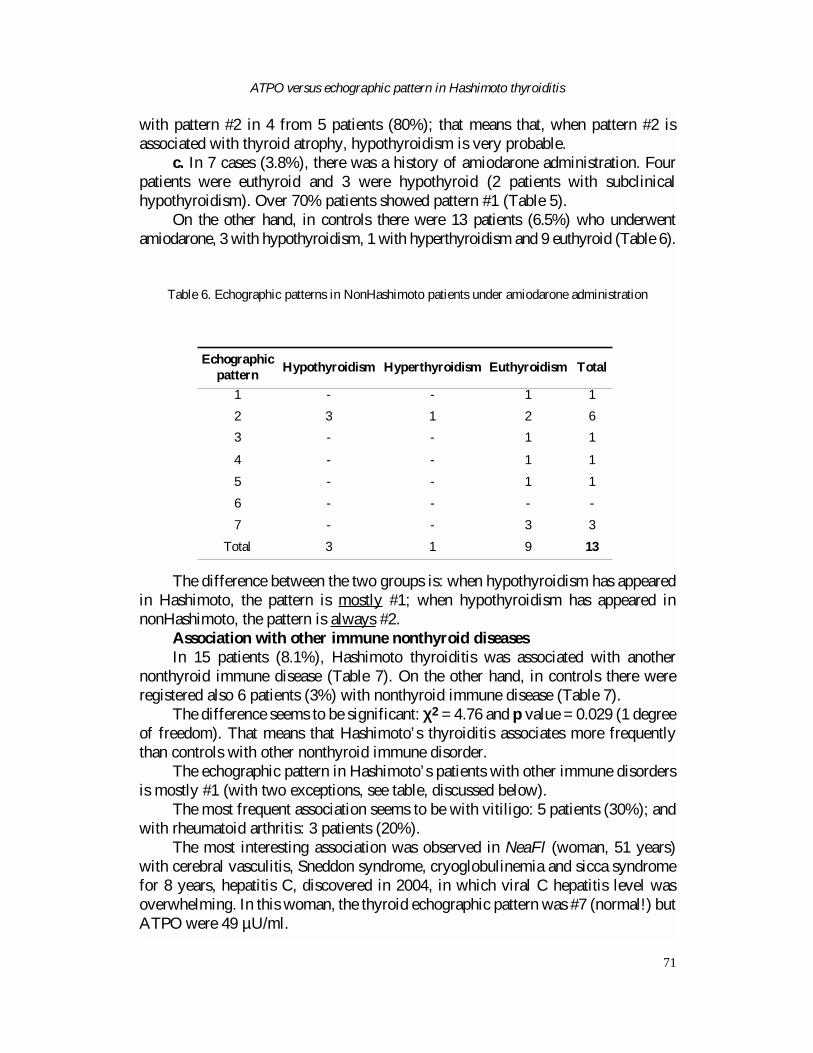
On the other hand, in controls there were 13 patients (6.5%) who underwentamiodarone, 3 with hypothyroidism, 1 with hyperthyroidism and 9 euthyroid (Table 6).
The difference between the two groups is: when hypothyroidism has appearedin Hashimoto, the pattern is mostly #1; when hypothyroidism has appeared innonHashimoto, the pattern is always #2.
Association with other immune nonthyroid diseasesIn 15 patients (8.1%), Hashimoto thyroiditis was associated with another
nonthyroid immune disease (Table 7). On the other hand, in controls there wereregistered also 6 patients (3%) with nonthyroid immune disease (Table 7).
The difference seems to be significant: χχ2 = 4.76 and p value = 0.029 (1 degreeof freedom). That means that Hashimoto’s thyroiditis associates more frequentlythan controls with other nonthyroid immune disorder.
The echographic pattern in Hashimoto’s patients with other immune disordersis mostly #1 (with two exceptions, see table, discussed below).
The most frequent association seems to be with vitiligo: 5 patients (30%); andwith rheumatoid arthritis: 3 patients (20%).
The most interesting association was observed in NeaFl (woman, 51 years)with cerebral vasculitis, Sneddon syndrome, cryoglobulinemia and sicca syndromefor 8 years, hepatitis C, discovered in 2004, in which viral C hepatitis level wasoverwhelming. In this woman, the thyroid echographic pattern was #7 (normal!) butATPO were 49 µU/ml.
ATPO versus echographic pattern in Hashimoto thyroiditis
71
Echographic pattern
Hypothyroidism Hyperthyroidism Euthyroidism Total
1 - - 1 1
2 3 1 2 6
3 - - 1 1
4 - - 1 1
5 - - 1 1
6 - - - -
7 - - 3 3
Total 3 1 9 13
Table 6. Echographic patterns in NonHashimoto patients under amiodarone administration
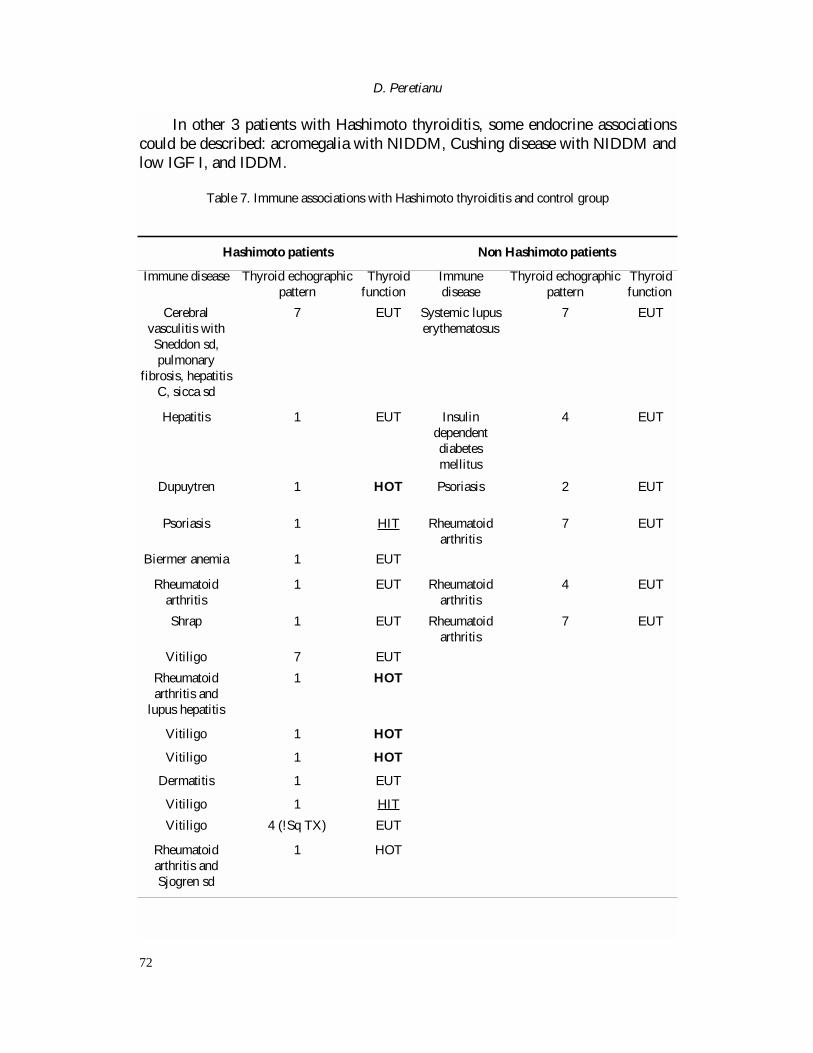
In other 3 patients with Hashimoto thyroiditis, some endocrine associationscould be described: acromegalia with NIDDM, Cushing disease with NIDDM andlow IGF I, and IDDM.
D. Peretianu
72
Table 7. Immune associations with Hashimoto thyroiditis and control group
Hashimoto patients Non Hashimoto patients
Immune disease Thyroid echographicpattern
Thyroid function
Immunedisease
Thyroid echographicpattern
Thyroid function
Cerebralvasculitis withSneddon sd,pulmonary
fibrosis, hepatitisC, sicca sd
7 EUT Systemic lupuserythematosus
7 EUT
Hepatitis 1 EUT Insulindependentdiabetesmellitus
4 EUT
Dupuytren 1 HOT Psoriasis 2 EUT
Psoriasis 1 HIT Rheumatoidarthritis
7 EUT
Biermer anemia 1 EUT
Rheumatoidarthritis
1 EUT Rheumatoidarthritis
4 EUT
Shrap 1 EUT Rheumatoidarthritis
7 EUT
Vitiligo 7 EUT
Rheumatoidarthritis and
lupus hepatitis
1 HOT
Vitiligo 1 HOT
Vitiligo 1 HOT
Dermatitis 1 EUT
Vitiligo 1 HIT
Vitiligo 4 (!Sq TX) EUT
Rheumatoidarthritis andSjogren sd
1 HOT
DISCUSSION
Relationships between ATPO level echographic patterns and thyroidfunction
Our way of describing the echographic images from Hashimoto differs fromothers. Most of the authors described only hypoechogenic patterns. Some suggestedmore hypoechogenic degrees for Hashimoto thyroiditis: e. g from mild to marked(6-8) or from first degree to third degree (18). Others (19,20) suggested only one“diffuse hypoechogenic pattern”, some timer with “heterogenic” shapes. Somerecent studies investigated the hypoechogeneity only with “quantitatively grayscale” (21-26).
We observed more than one pattern; in Hashimoto’s thyroiditis, we described5 patterns (out of 7), without focusing on the value of echogenity, which, usually,is a subjective description. The main problem is to show if the patterns described byus could represent stages of immune lesions.
Some authors (27) affirmed that there is an overlap between echographiclesions and thyroid dysfunction, since there are patients with Hashimoto thyroiditisand normal echography. The last case was observed only in two patients in ourseries (see below). Thus, based on our results, we conclude that (with the underlinedexceptions) there is no patient with Hashimoto thyroiditis without a modifiedechography.
On the other hand, only in pattern #1 description - diffuse pseudonodularshape - could the quantitative gray scale be analyzed. However, when there was aclear hypoechogenity (probable pattern #1), others (21-24) suggested that morehypoechogenity was correlated with more hypothyroidism.
Therefore, the most important result of this study is to affirm that there is adirect relationship and a significant correlation (!) between the level of serumATPO and the specific echographic images described as specific patterns, mostlyhypoechogenic and pseudonodular. The precise nature of this relationship could berelated to the local echographic aspect of the immune reaction, since ATPOantibodies are considered as the main pathogenic factor in the ADCC processagainst thyroid cells (2,3). Another type of antibodies related to thyroiditis, such asTSH receptor-blocking antibodie seems to be correlated to both the echogenicvolume of the thyroid and the thyroid function (27).
However, this statement is not in contradiction with that which says that thereis no direct correlation between the ATPO level and the specific pattern observed inHashimoto’s thyroiditis. That means that the nature of the immune process does notvary in time and can be viewed in the same manner during echographic observation.
At the same time it was suggested the negative correlation between the “levelof hypothyroidism” and the ATPO level (25, 28): “When the maximum bioactiveTPO antibody activity recorded was compared with echogenicity and thyroid status,there was a correlation between hypoechogenicity, elevated antibody activity andabnormal thyroid status (r = 0.72, p < 0.001)” (29).
ATPO versus echographic pattern in Hashimoto thyroiditis
73
In another clinical context (30), the importance of ATPO at the thyroid levelwas pointed out: it was shown that malignant nodules because of peripheral cellularimpregnation could differentiate almost all of thyroid adenoma (benign nodules)with monoclonal antibodies developed against thyroperoxidase.
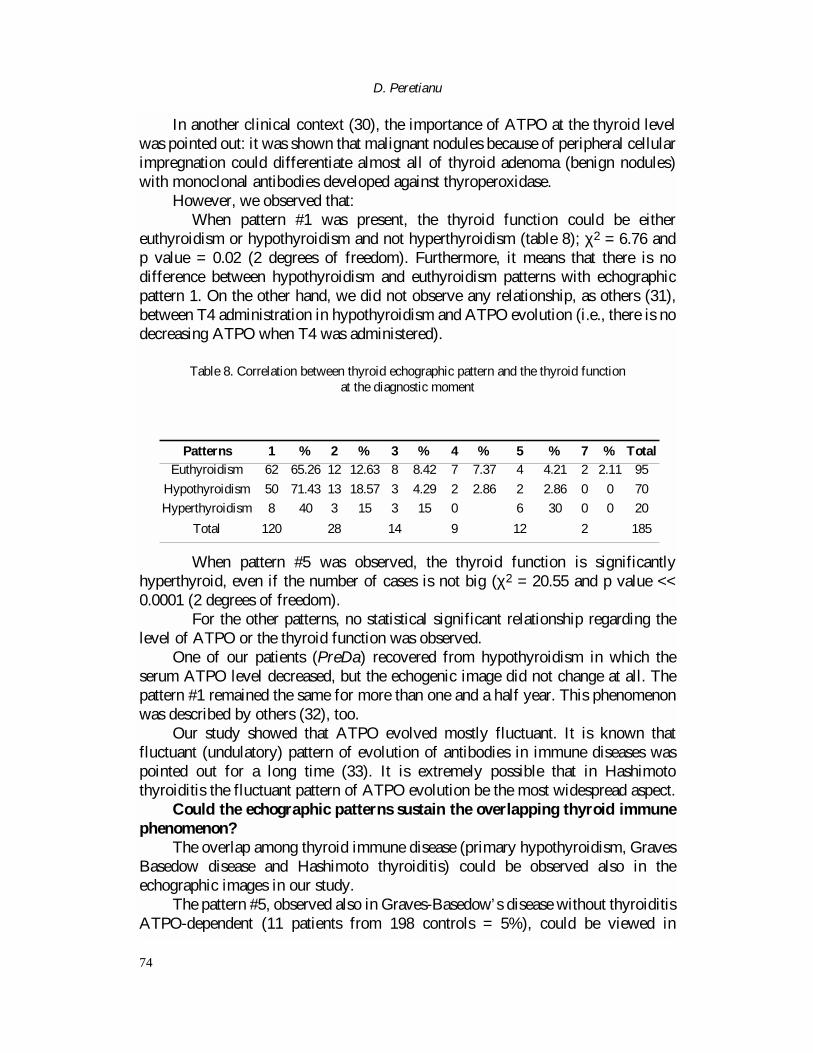
However, we observed that:� When pattern #1 was present, the thyroid function could be either
euthyroidism or hypothyroidism and not hyperthyroidism (table 8); χ2 = 6.76 and p value = 0.02 (2 degrees of freedom). Furthermore, it means that there is nodifference between hypothyroidism and euthyroidism patterns with echographicpattern 1. On the other hand, we did not observe any relationship, as others (31),between T4 administration in hypothyroidism and ATPO evolution (i.e., there is nodecreasing ATPO when T4 was administered).
� When pattern #5 was observed, the thyroid function is significantlyhyperthyroid, even if the number of cases is not big (χ2 = 20.55 and p value <<0.0001 (2 degrees of freedom).
� For the other patterns, no statistical significant relationship regarding thelevel of ATPO or the thyroid function was observed.
One of our patients (PreDa) recovered from hypothyroidism in which theserum ATPO level decreased, but the echogenic image did not change at all. Thepattern #1 remained the same for more than one and a half year. This phenomenonwas described by others (32), too.
Our study showed that ATPO evolved mostly fluctuant. It is known thatfluctuant (undulatory) pattern of evolution of antibodies in immune diseases waspointed out for a long time (33). It is extremely possible that in Hashimotothyroiditis the fluctuant pattern of ATPO evolution be the most widespread aspect.
Could the echographic patterns sustain the overlapping thyroid immunephenomenon?
The overlap among thyroid immune disease (primary hypothyroidism, GravesBasedow disease and Hashimoto thyroiditis) could be observed also in theechographic images in our study.
The pattern #5, observed also in Graves-Basedow’s disease without thyroiditisATPO-dependent (11 patients from 198 controls = 5%), could be viewed in
D. Peretianu
74
Patterns 1 % 2 % 3 % 4 % 5 % 7 % TotalEuthyroidism 62 65.26 12 12.63 8 8.42 7 7.37 4 4.21 2 2.11 95
Hypothyroidism 50 71.43 13 18.57 3 4.29 2 2.86 2 2.86 0 0 70
Hyperthyroidism 8 40 3 15 3 15 0 6 30 0 0 20
Total 120 28 14 9 12 2 185
Table 8. Correlation between thyroid echographic pattern and the thyroid function at the diagnostic moment
8 patients from 24 (33%) with Hashimoto thyroiditis. For these two diseases, themedical science succeeded to evidentiate the pathogenetic factors and to perform those analyses which diagnosed the diseases: ATPO for Hashimoto and TRAB forGraves-Basedow’s disease.
Increased ATPO levels were described also in Graves Basedow disease (34),and TRAB could be observed in Hashimoto’ thyroiditis (see above). On the otherhand, many immune diseases are associated and are overlapping (35). For thisreason, we considered that, in fact, in those patients there exist two immune thyroiddisorders at the same time: both Hashimoto’s thyroiditis and Graves-Basedowdisease.
The similarity of echographic pattern #2 in some Hashimnoto moments (44 from 301 = 14.5%) and primary hypothyroidism without Hashimoto’sthyroiditis in control patients (3 from 24 patients = 12.5 %) (see no echographicpattern difference between fig. 3 and 10) could be possible to be viewed also as anoverlapping phenomenon.
All these statements could lead to another idea: all these three entitiesrepresent aspects of the same disease, because there is a real overlap of growthstimulating and growth blocking antibodies between Hashimoto and primaryhypothyrodism (36), on the one hand, and there is a same ATPO activity in patientswith both Graves’ and Hashimoto’s sera (37), on the other hand.
Related only to ATPO (not to echography), there were shown in this study alsoby others (7) that ATPO levels did not differ among patients with hypothyroidismand euthyroidism. However, not all agree with this statement (4).
In conclusion, our study shows that five echographic patterns can be describedin Hashimoto thyroiditis. One of them, named “hypoechogenic and pseudonodular”(pattern #1) could be considered as highly specific and most related to higher ATPOlevels. This suggests that the other echographic patterns could representevolutionary stages for the disease, including also the normal shape/pattern.
There seems to be no relationship between ATPO level and thyroid functionin patients with altered pattern #1 compared with other patterns.
Considering the fluctuant pattern as non-modified, ATPO level evolutioncould be considered mostly as unchanged during over one year observation.
References
1. Kasagi K, Kousaka T, Higuchi K, Iida Y, Misaki T, Alam MS, Miyamoto S, Yamabe H, Konishi J.
Clinical significance of measurements of antithyroid antibodies in the diagnosis of Hashimoto’s
thyroiditis: comparison with histological findings. Thyroid 1996; 6(5): 445-50.
2. Rodien P, Madec AM, Ruf J, Rajas F, Bornet H, Carayon P, Orgiazzi J. Antibody-dependent cell-
mediated cytotoxicity in autoimmune thyroid disease: relationship to anti-thyroperoxidase antibodies.
J.Clin.Endocrinol.Metab. 1966; 81(7): 2595-600.
ATPO versus echographic pattern in Hashimoto thyroiditis
75
3. Metcalfe RA, Oh YS, Stroud C, Arnold K, Weetman AP. Analysis of antibody-dependent cell-
media
ted cytotoxicity in autoimmune thyroid disease. Autoimmunity 1997; 25(2): 65-72.
4. Romaldini JH, Biancalana MM, Figueiredo DI, Farah CS, Mathias PC. Effect of L-thyroxine
administration on antithyroid antibody levels, lipid profile, and thyroid volume in patients with
Hashimoto’s thyroiditis. Thyroid 1996; 6(3): 183-8.
5. McCanlies E, O’Leary L, Foley TP, Kramer MK, Burke JB,Libman A, Swan JS, Steenkiste AR,
McCarthy BJ, Trucco M, Dorman JS. Hashimoto’s thyroiditis and insulin-dependent diabetes mellitus:
differences among individuals with and without abnormal thyroid function. J.Clin.Endocrinol.Metab.
2001; 83: 1548-1551.
6. Vulpoi C, Zbranca E, Mogos V, Preda C, Galesanu C, Toma C, Ungureanu C, Susai G. Utilitatea
ecografiei in diagnosticul tireopatiilor autoimune. Rev.Med.Chir.Soc.Med.Natur. Iasi 1997; 101(1-2):
113-9.
7. Rubello D, Gasparoni P, Rota G, Borsato N, Zanco P, Chierichetti F, Ferlin G. Functional meaning
of scintigraphic and echographic patterns, and of circulating anti-peroxydase antibodies in
asymptomatic chronic thyroiditis. Quarterly J. Nuclear Medicine 1966; 40(4): 359-64.
8. Loviselli A, Bocchetta A, Mossa P, Velluzzi F, Bernardi F, del Zompo M, Mariotti S. Value of
thyroid echography in the long-term follow-up of lithium-treated patients. Neuropsychobiology 1997;
36(1): 37-41.
9. Peretianu D. Aspecte ecografice in tiroidita Hashimoto. Rev. Rom.Ultrasonografie 2004; 6(2-3),
97-104.
10. Peretianu D. Correlations between antithyroperoxidase antibodies (ATPO) levels from Hashimoto
thyroiditis, as ondulatory „visceral feature” of immune system, and echographic patterns. Study on 97
patients. 11th Congress of Rom.Soc.Endocrinol., Craiova, 5-7.06.2003. Rom.J.Endocrinol. Metab.
2003; 2(3): 40.
11. Peretianu D. Conceptul de pattern ecografic tiroidian. Evaluare ecografica in tiroidita Hashimoto.
Al 12-lea Congress Soc. Rom.Endocrinol., Timisoara, 13-16.10.2004, Rom.J.Endocrinol. Metab.
2004; S:65.
12. Peretianu D, Muraru M, Staicu D. Analiza a aplicarii luminii PILER prin aparatul BioptronR la
cazuri de boli tiroidiene, dupa folosirea timp de un an. Rev.Med.Rom., (Buc.) 2001; 47(3-4): 222-226.
13. Peretianu D, Muraru M, Staicu D. BIOPTRONR light therapy use in thyroid diseases. 10th
Congress Rom.Soc.Endocrinol. & Amer.Ass.Clin.Endocrinol. Joint Meeting, Bucureºti,
26-28.09.2002, Rom.J.Endocrinol.Metab. 2002; 1(4):16.
14. Peretianu D, Grigorie D, Onose G. (eds.), Imunoendocrinologie in boli de colagen si osteoporoza.
Editura Academiei Romane, Bucuresti, 2002.
15. Onose G, Peretianu D. Metoda de cuantificare a gradului de activitate/evolutivitate (severitate)
imuno-inflamatorie in spondilartropatii. Brevet OSIM, 1999.
16. Sarafian V, Chossiere D, Hirtz L, Pinget M. [Thyroid nodules: histological approach using
microbiopsies obtained with a biopsy gun: preliminary study]. Nodules thyroidiens. Annales d’
Endocrinologie 2001; 62(3): 230-4.
17.*** EFES Thyroid International Course, Debrecen, Hungary, June 2001.
18. Raber W, Gessl A, Nowotny P, Vierhapper H. Thyroid ultrasound versus antithyroid peroxidase
antibody determination: a cohort study of four hundred fifty-one subjects. Thyroid 2002; 12(8): 725-31.
D. Peretianu
76
19. Vayssairat M, Mimoun M, Houot M, Abuaf N, Rouquette AM, Chaouat M. Thyroidite de Hashi-
moto et protheses mammaires en silicone: 2 observations. Journal des Maladies Vasculaires 1997; 22
(3):198-9.
20. Tonacchera M, Agretti P, De Marco G, Perri A, Pinchera A, Vitti P, Chiovato L. Thyroid resistance
to TSH complicated by autoimmune thyroiditis. J.Clin.Endocrinol.Metab. 2001; 86: 4543-6.
21. Loy M, Cianchetti ME, Cardia F, Melis A, Boi F, Mariotti S. Correlation of computerized gray-
scale sonographic findings with thyroid function and thyroid autoimmune activity in patients with
Hashimoto’s thyroiditis. J.Clin.Ultrasound 2004; 32(3):136-40.
22. Smutek D, Sara R, Sucharda P. Relation between quantitative description of ultrasonographic
image and clinical and laboratory findings in lymphocytic thyroiditis. Endocrine Regulations 2003;
37(3): 181-7.
23. Smutek D, Sara R, Sucharda P, Tjahjadi T, Svec M. Image texture analysis of sonograms in
chronic inflammations of thyroid gland. Ultrasound in Medicine & Biology 2003; 29(11):1531-43.
24. Mazziotti G, Sorvillo F, Iorio S, Carbone A, Romeo A, Piscopo M, Capuano S, Capuano E, Amato
G, Carella C. Grey-scale analysis allows a quantitative evaluation of thyroid echogenicity in the
patients with Hashimoto’s thyroiditis. Clinical Endocrinology 2003; 59(2):223-9.
25. Schiemann U, Avenhaus W, Konturek JW, Gellner R, Hengst K, Gross M. Relationship of clinical
features and laboratory parameters to thyroid echogenicity measured by standardized grey scale
ultrasonography in patients with Hashimoto’s thyroiditis. Medical Science Monitor 2003; 9(4):MT13-7.
26. Smutek D, Sucharda P, Sara R. Quantitative indicators of sonographic image of thyroid gland and
their relation to antithyroid antibodies in Hashimoto’s lymphocytic thyroiditis. Studies in Health
Technology & Informatics 2002; 90:8-12.
27. Rieu M, Portos C, Lissak B, Laplanche S, Sambor B, Berrod JL, Fombeur JP. Relationship of
antibodies to thyrotropin receptors and to thyroid ultrasonographic volume in euthyroid and
hypothyroid patients with autoimmune thyroiditis. J.Clin.Endocrinol.Metab. 1996; 81(2): 641-5.
28. Lindberg B, Svensson J, Ericsson UB, Nilsson P, Svenonius E, Ivarsson SA. Comparison of some
different methods for analysis of thyroid autoantibodies: importance of thyroglobulin autoantibodies.
Thyroid 2001; 11(3):265-9.
29. Parkes AB, Adams H, Othman S, Hall R, John R, Lazarus JH. The role of complement in the
pathogenesis of postpartum thyroiditis: ultrasound echogenicity and the degree of complement-
induced thyroid damage. Thyroid 1966; 6(3):177-82.
30. Christensen L, Blichert-Toft M, Brandt M, Lange M, Bjerregaard Sneppen S, Ravnsbaek J,
Mollerup CL, Strange L, Jensen F, Kirkegaard J, Sand Hansen H, Sorensen SS, Feldt-Rasmussen U.
Thyroperoxidase (TPO) immunostaining of the solitary cold thyroid nodule. Clin.Endocrinol. 2000:
53, 2: 161-9.
31. Padberg S, Heller K, Usadel KH, Schumm-Draeger PM. One-year prophylactic treatment of
euthyroid Hashimoto’s thyroiditis patients with levothyroxine: is there a benefit? Thyroid 2001;
11( 3):249-55.
32. Takasu N et al Test for recovery from hypothyroidism during thyroxine therapy in Hashimoto’s
thyroiditis. Lancet 1990; 336:1084-1086.
33. Ursu HI, Peretianu D, Saragea M. Aspecte clinice ale unor boli cu patogenie imuna. Tratat de
Fiziopatologie (Treatise of Pathophysiology) M Saragea (ed.), II, Editura Academiei, Bucuresti, 1987,
303-324.
ATPO versus echographic pattern in Hashimoto thyroiditis
77
34. Zosin I. Tiroidita (auto)imuna (boala (auto)imuna tiroidiana. Tratat de Endocrinologie Clinica
(Treatise of Clinical Endocrinology) S.M.Milcu (ed.) I, Editura Academiei, Bucuresti, 1992, 380-389.
35. Peretianu D, Saragea M. Definirea bolii imune - mecanisme si criterii. In “Imunitatea in teoria si
practica medicinii. Vol.I. (The Immunity in the theory and practice of medicine)” D.Peretianu,
M.Saragea, (eds.), Editura ALL, Bucuresti, 1996, 257-365.
36. Akamizu T, Kohn LD, Hiratani H, Saijo M, Tahara K, Nakao K. Hashimoto’s Thyroiditis with
Heterogeneous Antithyrotropin Receptor Antibodies: Unique Epitopes May Contribute to the
Regulation of Thyroid Function by the Antibodies. J.Clin.Endocrinol.Metab. 2000; 85:2116-2121.
37. Bermann M, Magee M, Koenig JRJ, Kaplan MM., Arscott P, Maastricht J, Johnson J, Baker JR,
Jr. Differential autoantibody responses to thyroid peroxydase in patients with Graves’ disease and
Hashimoto’s thyroiditis. Journal of Clinical Endocrinology & Metabolism 1993; 77:1098-1101.
D. Peretianu
78