antimony · web viewespecially modern aircraft industry uses antimony trioxide as a fire...
TRANSCRIPT

REPORT ON CRITICAL RAW MATERIALS FOR THE EU CRITICAL RAW MATERIALS PROFILES

For DG Enterprise and Industry
Contents
REPORT ON CRITICAL RAW MATERIALS FOR THE EU 1
1 Critical Raw Materials 11.1 Antimony (Stibium) 11.2 Beryllium 111.3 Borates 171.4 Chromium 261.5 Cobalt (Cobaltum) 341.6 Coking coal 421.7 Fluorspar (Fluorite) 501.8 Gallium 571.9 Germanium 671.10 Indium 771.11 Magnesite 861.12 Magnesium 921.13 Natural graphite 991.14 Niobium 1091.15 Phosphate rock 1161.16 Platinum group metals* 1231.17 Rare earth elements (Light and Heavy)* 1461.18 Silicon metal (Silicium) 1841.19 Tungsten (Wolframium) 193
*Separate profiles for the metals in these groups are provided with the group profile.
See separate documents for main report and non-critical raw material profiles.

For DG Enterprise and Industry
Glossary
APT ammonium paratungstateBGR German Federal Institute for Geosciences and Natural Resources BGS British Geological SurveyBRGM Bureau de Recherches Géologiques et Minières CAGR compound annual growth rateCCM Caustic calcined magnesiteCIGS Copper indium gallium (di)selenideCIS Copper indium (di)selenideDBM Dead burned magnesiteDRC Democratic Republic of the CongoEEA European Environment AgencyENRC Eurasian Natural Resources CorporationEOL-RR end-of-life recycling rateFAO Food and Agriculture Organization of the United Nations FCCs fluid cracking catalystsFM Fused MagnesiteHREEs Heavy Rare Earth ElementsIC integrated circuitIR infrared radiationITO Indium Titanium OxideLCD Liquid-Crystal DisplayLED light emitting diodeLi-ion lithium-ionLREEs Light Rare Earth ElementsMG-Si Metallurgical grade SiliconMMTA Minor Metals Trade AssociationOECD Organisation for Economic Co-operation and Development PBNR pebble bed nuclear reactorPCB printed circuit boardPGM platinum group metalppm parts per millionPTFE PolytetrafluoroethylenePV photovoltaicPVC Polyvinyl ChlorineREACH Registration, Evaluation, Authorisation and restriction of Chemicals REE Rare Earth ElementsSVHC Substances of Very High Concern (REACH) UNEP United Nations Environmental Programme USGS US Geological SurveyWMD World Mining Data
Deposit – A concentration of material of possible economic interest in or on the Earth’s crust.
Reserves – The term is synonymously used for ‘mineral reserve’, ‘probable mineral reserve’ and ‘proven mineral reserve’. In this case, confidence in the reserve is measured by the geological knowledge and data, while at the same time the extraction would be legally, economically and technically feasible and a licensing permit is certainly available.
Resources – The term is synonymously used for ‘mineral resource’, ‘inferred mineral resource’, ‘indicated mineral resource’ and ‘measured mineral resource’. In this case, confidence in the existence of a resource is indicated by the geological knowledge and preliminary data, while at the same time the extraction would be legally, economically and technically feasible and a licensing permit is probable

1
Mineantimony ores
Beneficiation(Liquidation / Flotation)
Concentrates/ crude antimony
Processing tometal / alloy
Manufactureand use
End of life
•Roasting•Flame retardents•Reduction•Batteries•Hydrometallurgy•Plastics•Electrometallury
Recovery
1 Critical Raw Materials
1.1 Antimony (Stibium)
1.1.1 Introduction
Antimony (Sb, atomic number 51) is a silvery-white, shiny, very brittle and semiconducting element. Due to its poor mechanical properties, pure antimony is only used in very small quantities; larger amounts are used for alloys and in antimony compounds.a Like water, liquid antimony expands upon freezing. This anomalous property is used in alloys to minimize shrinkage in the casting process. There are more than 100 known antimony-containing minerals, of which the most important is stibnite (Sb2S3).b
The extraction process of antimony ore depends on the content of antimony. Ores with more than 90% stibnite are sold unprocessed as crude antimony ore (stibnite). Ores with a content of 45-60% stibnite are processed by liquefaction because of the low melting point of stibnite. Low-grade ores are processed by flotation to obtain crude stibnite.b Following extraction, this material is processed to antimony metal or alloys, which are the basis for the various applications of antimony.
There is no current mining of antimony in the European Union, but the following processing stages (Figure 1, in orange) have been indicated to occur within Europe.c Some important producers of antimony metal and antimony oxide are located in Belgium, Germany, France, Greece, Italy, UK, Netherlands, Romania and Slovakia.b
Figure 1: Supply chain map for antimony
Source: In accordance with Ullmann’s Encyclopedia of Industrial Chemistry: Antimony and Antimony Compounds, 2006 Note: Orange colour represents stages of the supply chain which take place in Europe.
1.1.2 Supply
Primary sources, production and refiningAntimony is a rare element, belonging to the 7th tier (in decreasing order, out of 9) of the order of abundance of the elements, according to Ronov et al. (1969).d The average antimony content of the Earth’s crust has been estimated at 0.20001% (i.e. 1 ppm (parts per million, equivalent to grams per metric tonne). Most antimony lodes occur in volcanic and sedimentary rocks. Deposits have an average antimony content of between 0.1 and 2 wt%.e The most important antimony ore mineral (stibnite, Sb2S3) contains 71.7% antimony. Antimony is commonly mined as a by-product of gold, silver, lead or zinc.f
aAntimon, Römpp Online, 2004
bUllmann’s Encyclopedia of Industrial Chemistry: Antimony and Antimony Compounds, Wiley-VCH Verlag GmbH & Co. KGaA, 2006
cEuropean Mineral Statistics 2007-2011, British Geological Survey, 2013
dA.B. Ronov, A.A. Yaroshevsky, Earth's Crust Geochemistry, in Encyclopedia of Geochemistry and Environmental Sciences, R.W. Fairbridge (ed.), Van
Nostrand, New York, (1969)e
Antimon, Römpp Online, 2004f

2
Ullmann’s Encyclopedia of Industrial Chemistry: Antimony and Antimony Compounds, Wiley-VCH Verlag GmbH & Co. KGaA, 2006

Australia1%
TurkeyRussia1%
2%South Africa
Other2%
2% Bolivia3%
Tajikistan 3%
China86%
Figure 2: Worldwide production of antimony in 2011d
3
Reserves of antimony are shown in Table 1. Over half the global reserves of antimony are located in China. Russia and Bolivia also have considerable reserves. USGS reports that US resources of antimony are located mainly in Alaska, Idaho, Montana, and Nevada.a For refining please see EU trade flows.
Table 1: Worldwide antimony reserves (antimony content)b
Source: USGS
Supply detailsIn 2011, the global market for antimony was roughly 150,000 tonnes (Figure 2). China is the largest producer of antimony with a share of 86% of world production in 2011.
Source: World Mining Data 2013Other producing countries include Turkey, Kazakhstan and Kyrgyzstan. There is no primary antimony production in the EU anymore, although there has been in the past in France and Romaniae. New antimony exploration sites in Armenia, Australia, Canada, China, Georgia, Italy, Laos, Russia, and Turkey are being developed.f
EU trade flows and consumptionOverall, the EU is a net importer of antimony ores and concentrates, importing around net 200 tonnes per year (Figure 3) – with two exceptions; in 2008 EU exports were much lower compared to other years and in 2012 the EU was a net exporter with exports being much larger compared to previous years. As
aUSGS (2013), Mineral Commodity Summaries 2013, Antimony
bSource: USGS (2013), Mineral Commodity Summaries 2013, Antimony
cOfficial Chinese Statistics have a much lower value. See http://www.stats.gov.cn/tjsj/ndsj/2012/indexeh.htm
dThe category others only summarizes several countries in order to clean up the pie diagram, but these countries enter separately the analysis.
eSee for instance Antimony profile by BRGM at http://www.mineralinfo.fr/panoramas.html for more details (in French).
f
Country Reserves (tonnes) %Bolivia 310,000 17China 950,000c
53Russia 350,000 19South Africa 27,000 2Tajikistan 50,000 3Other Countries 150,000 8Total (rounded) 1,800,000 -

4
Mineral Commodity Summaries: Antimony, US Geological Survey, 2013

2 000
1 500
1 000EU Export
500 EU Import
Net Export
02008 2009 2010 2011 2012
-500
-1 000
Figure 3: Trends in extra-EU trade for antimony ores and concentrates (tonnes)
5
mentioned above, antimony is not mined in the EU therefore the net-export in 2012 must be due to ores and concentrates accumulated in previous years.
Source: Eurostat-Comext Database, CN 2617 1000 [accessed August 2013]
Turkey is the largest exporter of antimony ores and concentrates into the EU, accounting for around 62% of all EU imports (Figure 4). Over half of EU exports are to China, with the USA as the second largest export market. Analysis of the value and price per kg of the trade flow suggests that antimony ores and concentrates are exported from the EU for refining to countries such as China, which is a major antimony refiner. It is possible that these ores transit through Europe and into China as no ore production is present in Europe.

6
Figure 4: EU’s major trading partners for antimony ores and concentrates, 2012
EU exports of antimony ores and concentrates (1,519 t)
OtherBrazil 7%
4%
India 6% China
55%
USA 28%
EU imports of antimony ores and concentrates (1,406 t)
Guatema la
6%
Other 0%
Turkey 62%
Bolivia 32%
Source: Eurostat-Comext Database, CN 2617 1000 [accessed August 2013]
Figure 5 shows trade data for unwrought antimony and powders. As can be seen, the EU is a net-importer of this material importing around 20,000 tonnes net per year. This is consistent with the fact that no antimony is produced in the EU. The figure also shows dips in 2009, 2011 and 2012 which are likely to be due to the economic conditions in those years. These figures are much higher than those seen for ores and concentrates reflecting the fact that the EU is an end-user and not a refiner of antimony. These figures, however, do not include data for other antimony-containing substances and products; therefore only capture trade flows of the materials.

25 000
20 000
15 000
10 000
5 000
- 2008 2009 2010 2011 2012-5 000
ExportImport Net-Export
-10 000
-15 000
-20 000
-25 000
Figure 5: Trends in extra-EU trade for unwrought and powdered antimony (tonnes)
7
Source: Eurostat-Comext Database, CN 81101000 [accessed August 2013]
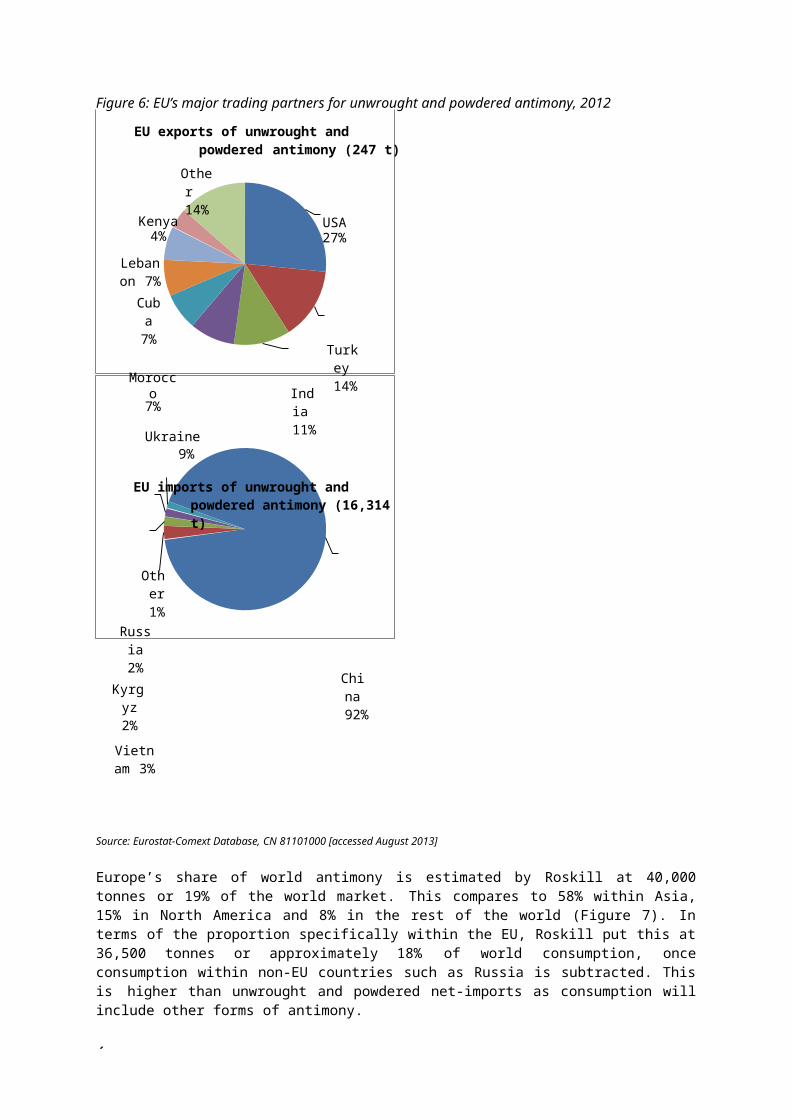
China is by far the largest exporter of unwrought and powdered antimony to Europe (Figure 6); this is consistent with the fact that China is the largest producer of antimony worldwide. Exports of this form of antimony are negligible compared to imports. The major trading partners are the US, Turkey and India.

8
Figure 6: EU’s major trading partners for unwrought and powdered antimony, 2012
EU exports of unwrought and powdered antimony (247 t)
Other 14%
Kenya4%
Lebanon 7%Cuba 7%
Morocco7% Ukraine
9%India 11%
USA27%
Turkey 14%
EU imports of unwrought and powdered antimony (16,314 t)
Other 1%
Russia 2%
Kyrgyz 2%
Vietnam 3%
China 92%
Source: Eurostat-Comext Database, CN 81101000 [accessed August 2013]
Europe’s share of world antimony is estimated by Roskill at 40,000 tonnes or 19% of the world market. This compares to 58% within Asia, 15% in North America and 8% in the rest of the world (Figure 7). In terms of the proportion specifically within the EU, Roskill put this at 36,500 tonnes or approximately 18% of world consumption, once consumption within non-EU countries such as Russia is subtracted. This is higher than unwrought and powdered net-imports as consumption will include other forms of antimony.
Rest of World8%
North America 15%
Europe19%
Asia58%
Figure 7: World Antimony Consumption by Geographic Region, 2011 (%)
9
Source: Roskill Presentation (April 2012), Antimony: Changes in the pattern of supply and demand
1.1.3 Demand and Economic Importance
Prices and marketsFigure 8 shows how the different supply and demand situations worldwide influenced antimony prices over the last century.a There have been several significant price peaks: the first one due to the First World War, the second price peak in the late 1960s when demand for plastic products strongly increased and the next price peak only few years later due to high demand and China restricting its supply. The last significant price peak was in recent years when supply from China decreased due to the closure of several small and illegal mines.Figure 8: Development of real Antimony prices (Prices are deflated, 2011 = 100)
$/mt20 000
18 000First World War
strong demand for Antimonytrioxide; shortage in supply by China
China's export controls; illegal mines in China closed
16 000
14 000
12 000
10 000
Demand for Plastic Products strongly increases
natural desasters in China
8 000
6 000
4 000
2 000
0world economic crisis
Source: DERA, HWWI (2013) Ursachen von Preispeaks, -einbrüchen und –trends bei mineralischen Rohstoffen (Causes of price peaks, collapses and trends of mineral raw materials), Hamburg Institute of International Economics (HWWI) in contract for Deutsche Rohstoffagentur (DERA). April 2013., translated into English by Fraunhofer ISI
Applications
aDERA, HWWI (2013) Ursachen von Preispeaks, -einbrüchen und –trends bei mineralischen Rohstoffen (Causes of price peaks, collapses and trends of mineral

1
raw materials), Hamburg Institute of International Economics (HWWI) in contract for Deutsche Rohstoffagentur (DERA). April 2013.

Ullmann’s Encyclopedia of Industrial Chemistry: Antimony and Antimony Compounds, Wiley-VCH Verlag GmbH & Co. KGaA,
8
Glass, ceramic andother 5%
Plastics: Catalyst and heat stabilizer 6%Flame retardants
43%
Lead alloys14%
Lead-acid batteries32%
Figure 9: European end-use of antimony in 2011
Figure 9 shows the main end-use markets for antimony products in Europe in 2011. These are: a,b
Flame retardants: Most antimony is used in form of antimony trioxide (commonly referred to as ATO), mainly for flame-retardants for plastics and other products. Especially modern aircraft industry uses antimony trioxide as a fire retardant. The use of antimony in flame retardants is not expected to decline since there are few alternative inorganic flame retardants (e.g. aluminium hydroxide, zinc borate). Its increased use after 2004 was caused inter alia by the ban on some extreme toxic organic flame retardants.
Batteries: Antimony is used for lead-acid batteries. This use has declined due to new battery technologies.
Plastics: ATO is used as a catalyst in the production of polyethylene terephthalate (PET), which is used in the manufacture of synthetic textiles (polyester) and plastic containers, such as drinking bottles.
Glass: Antimony trioxide is also for the manufacture of glass and ceramics. Semiconductors: Small but increasing amounts of antimony are used as dopants in the manufacture
of n-type semiconductors. Alloys: Due to its poor mechanical properties, antimony is not used directly as a metal, but it is used
to harden alloys, primarily with lead and tin.c
Source: Roskill (2012), Antimony: Changes in the pattern of supply and demand; MMTA Conference
Future trendsThe market outlook forecast for world antimony supply and demand is shown in Figure 10. As of 2010, the world antimony market was broadly in balance. However, pressures on Chinese formal and informal antimony production, and a lack of secured antimony projects outside China, may mean that a significant market deficit may open up by the middle of the decade. This could cause the antimony price to rise and stimulate further antimony exploration, although there is a risk that sustained or highly volatile antimony prices could cause substitution away from antimony in its largest market, flame retardants.
On the demand-side, the antimony market will be characterised by steady rather than dramatic growth. For the largest market, flame retardants, growth is expected to be close to 3% per year to 2020. This is likely to be slightly above the growth of the overall market, due to the slower growth rates anticipated for antimony’s use in lead acid batteries and plastics catalysts, where the intensity of antimony’s use has decreased in these markets over the past years.
aRohstoffe für Zukunftstechnologien, Angerer, G. et. al., Fraunhofer IRB-Verlag, 2009
b

Ullmann’s Encyclopedia of Industrial Chemistry: Antimony and Antimony Compounds, Wiley-VCH Verlag GmbH & Co. KGaA,
9
Roskill for 2013 CRM studyc

300 000
250 000
200 000
150 000
100 000
OtherPlastic catalyst Lead alloysLead-acid Batteries Flame RetardantsForecast Supply
50 000
02010 2012 2015 2020
Figure 10: World antimony supply and end-use forecasts to 2020 (tonnes)
Ullmann’s Encyclopedia of Industrial Chemistry: Antimony and Antimony Compounds, Wiley-VCH Verlag GmbH & Co. KGaA,
1
Sources: Campine Presentation: Antimony price levels and the impact on end users( (2012) & Roskill Study of the Antimony market (2011)1.1.4 Resource efficiency and recycling
Traditionally, antimony was recycled from old lead-acid batteries on a large scale. The battery industry was the main producer and consumer of secondary antimony, recycling antimonial lead. However, the emergence of new battery technologies is leading to a decline in the amount of recycled, secondary antimony: for low maintenance batteries, calcium is favoured as an additive rather than antimony.a
The main use of antimony, in flame retardants e.g. in textiles or toys, is characterized as a dissipative application, which means that there is no recycling taking place. Most antimony used as antimony oxide ends up in household waste.b
Substitutes for antimony for application in its end uses are shown in Table 33. According to USGS there are substitutes for antimony in its most important applications.a Antimony trioxide (ATO)as a flame retardant could be replaced by different organic compounds and aluminium hydroxide, however none of the alternatives can offer a complete substitute at present. Combinations of cadmium, calcium, copper, selenium, strontium, sulphur and tin substitute for antimony which is used in hardening lead alloys. Asfor antimony-containing chemicals and pigments, different compounds of chromium, tin, titanium, zinc and zirconium are used as substitutes.
Table 2: Substitutability scores for antimony applicationsUse Substitutability scoreFlame retardants 0.7Transportation, incl. batteries 0.7Chemicals 0.5Ceramics and glass 0.3Other 0.5
a

Ullmann’s Encyclopedia of Industrial Chemistry: Antimony and Antimony Compounds, Wiley-VCH Verlag GmbH & Co. KGaA,
1
Mineral Commodity Summaries: Antimony; US Geological Survey, 2013b

1
1.1.5 Specific issues
Several countries have restrictions concerning trade with antimony. According to the OECD´s inventory on export restrictions, China uses export taxes on antimony ores and concentrates and export quotas on antimony and products thereof as well as antimony oxides. Russia has an export tax on antimony waste and scrap and South Africa has a licensing agreement on scrap. There is a wide range of other countries imposing trade restrictions on antimony.
One compound of antimony is present on the REACH SVHC list: Pyrochlore (antimony lead yellow).

1
1.2 Beryllium
1.2.1 Introduction
Beryllium (Be, atomic number 4, formerly also known as glucinium) is a bluish-white, shiny, hard and brittle metal and is highly toxic if inhaled in dust form, leading to berylliosis.a It is a light metal with hexagonal-close-packed structure. Very low density in combination with strength, high melting point, and resistance to acids make beryllium a useful material for structural parts that are exposed to great inertial or centrifugal forces.b
1.2.2 Supply
Primary sources, production and refiningBeryllium is a relatively rare element with a concentration of about 3 ppm (0.0003%, 5th tierc) in the earth’s crust. Until the late 1960s the only beryllium mineral commercially exploited was beryl. Today the most important commercial beryllium mineral is bertrandite ore which is extracted from ores containing 0.2-0.35% beryllium.b
Supply detailsAs noted above, with an abundance of 3 ppm in the Earth’s crust, beryllium is a relatively rare element compared to some other metals. Nevertheless it is concentrated in some minerals, predominantly in beryl and bertrandite. World identified resources of beryllium content in ores are more than 80,000 tonnes, of which around 65% are located in the USA; though, because of the military relevance of beryllium, information on reserves and applications is limited. Total production of beryllium metal is estimated to be 259 tonnes in 2011, rising from 193 tonnes in 2010, (Table 3). The USA is the main producer of beryllium (Figure 11) and only three countries process beryllium ores into beryllium products.d
Table 3: World beryllium metal production, 2010 and 2011Country Production (tonnes)
2010 2011China 20 22
Mozambique 2 2USA 170 235Other 1 1Total 193 259Source: US Geological Survey MCS 2013
Beryllium is not mined in the EU or the wider EEA, although there is evidence that in the past it was mined in Portugal as well as other non-EU countries.e Demand is limited by cost. However, given estimated global reserve levels and annual usage, it appears that there is an abundant supply in the USA of the ores from which all beryllium-based materials are produced. These reserves could satisfy EU and world demand for over 100 years at current consumption rates.
aBeryllium, Römpp Online, 2002
bUllmann’s Encyclopedia of Industrial Chemistry: Beryllium and Beryllium Compounds, Wiley-VCH Verlag GmbH & Co. KGaA, 2005
cA.B. Ronov, A.A. Yaroshevsky, Earth's Crust Geochemistry, in Encyclopedia of Geochemistry and Environmental Sciences, R.W. Fairbridge (ed.), Van Nostrand,
New York, (1969)d
Mineral Commodity Summaries: Beryllium, US Geological Survey, 2013.e

1
Roskill Mineral Services, (2005), Beryllium

Mozambique 1%
China 9%
United States 90%
Figure 11: Worldwide production of beryllium metal in 2011
1
Source: US Geological Survey MCS 2013
Supply chainThe extraction of beryllium from its main sources beryl and bertrandite involves several stages, illustrated in Figure 12. After mining the ores they are first converted to an acid-soluble form by fusion. To obtain comparatively pure beryllium hydroxide or oxide, and in a further step beryllium chloride or fluoride, complex chemical processes are used. These halogenides are then reduced to metallic beryllium with other metals or by melt electrolysis. The beryllium metal obtained is subject to one or more refining processes and finally to further treatment by powder metallurgy or in some cases fusion metallurgy.a The metal or other product is then incorporated into the end product, before being sent on for use. The EU is only involved on a limited scale in this supply chain, except for the manufacturing of products made of pure beryllium and copper beryllium (CuBe) alloys. Unfortunately, more detailed data on the involvement of European firms in the beryllium supply chain were not available.
Figure 12: Supply chain map for berylliumMine
beryllium ores
Acid-soluble form
Beryllium hydroxide or oxide
Beryllium chloride or fluoride
Reduction to metalliic beryllium
Refining process
Further treatment
EU trade flows and consumptionThe EU is a net importer of beryllium, though this varies substantially from year to year (Figure 13). In 2012, EU imports were entirely from the USA, and no export was reported. However, compared to previous years imports were considerable lower. Therefore the EU net export was a small deficit of 0.2 tonnes, this compares to around 20 tonnes for 2010 and 2011. These figures do not capture downstream substances or products containing beryllium so do not give a complete picture of EU beryllium trade.
a

1
Ullmann’s Encyclopedia of Industrial Chemistry: Beryllium and Beryllium Compounds, Wiley-VCH Verlag GmbH & Co. KGaA, 2005

aBesT: http://beryllium.eu/about-beryllium-and-beryllium-alloys/facts-and-figures/production-statistics/ [accessed
1
30
20EU Export
10
0 EU Import
20082009201020112012-10
Net Export
-20
-30
Figure 13: EU trade of unwrought beryllium and beryllium powders (tonnes)
1 000 000900 000800 000700 000600 000500 000400 000300 000200 000100 000
0
1970 1980 1990 2000 2010
Figure 14: Beryllium historical prices (98 US$/tonne)
Eurostat-Comext Database, CN Code 8109 20 00Unwrought Beryllium and Beryllium Powders
An estimate of beryllium consumption for the major European markets (Germany, France and Italy) is available from the Beryllium Science and Technology Association (BeST). BeST estimate that 30.2 metric tonnes of beryllium is supplied, converted and sold as commercial products (i.e. pure, alloy and beryllium contained in beryllium oxide ceramics) within these major European countries.a This compares to 400 tonnes of annual worldwide production and consumption of beryllium. This means that Europe’s share equates to around 7.5% of world beryllium consumption.
This figure is higher than that shown above as beryllium may be imported in other forms.
1.2.3 Demand and Economic Importance
PricesHistorical prices for beryllium are shown in Figure 14. Prices have remained relatively constant for longperiods; however, a large drop is seen after 2000 linked to a reducing market size and sales of US stockpiles.
Source: USGS (2012- ), Data Series 140 - ,Historical Statistics for Mineral and Material Commodities in the United States [accessed February 2013]. Figures are indexed to 1998 values.
Applications

Ullmann’s Encyclopedia of Industrial Chemistry: Beryllium and Beryllium Compounds, Wiley-VCH Verlag GmbH & Co. KGaA,
1
Rubber, plasticsand glass 3%
Metals 3%Aircraft, shipbuilding and trains
10%
Others4%
MechanicalEquipment 25%
Electronicequipment &
Road transportdomestic appliances15%20%
Electronics and IT20%
Figure 15: End-use of beryllium in Europe in 2012 (by weight)
Beryllium’s superior chemical, mechanical and thermal properties make it a favourable material for high technology equipment (e.g. in aerospace) for which low weight and high rigidity are important qualities. A large share of the world beryllium production is used for military purposes. Due to the high price, only small amounts of beryllium are used in the civilian sector.
The main use of beryllium is the production of CuBe alloy, which inherits some of the unique properties of beryillium metal with extreme resistance to corrosion and to mechanical wear, high dimensional stability through a wide range of temperatures. CuBe alloy is widely used in modern aeronautics for instance in landing gear components or in electric/ electronic connectors. It is also used for the manufacture of moulds for the production of the formed plastic objects and for the production of paramagnetic tooling.
Source: BeST2013
The main uses of beryllium are:a,b
Consumer electronics and telecommunications products: Beryllium is used due to its favourable electric conductivity.
Engineering/construction: Alloys with beryllium find use in structural parts that have to be light but are exposed to great forces (e.g. aircraft industry). In this field the mechanical and thermal properties of beryllium are vital.
Ceramics: Beryllium oxide (BeO) is used for high performance ceramics. Specialty applications: Different properties (e.g. x-ray transparency) make beryllium valuable in
applications in medical devices, physical instruments or in the efforts to develop controlled nuclear fusion reactors.
1.2.4 Outlook
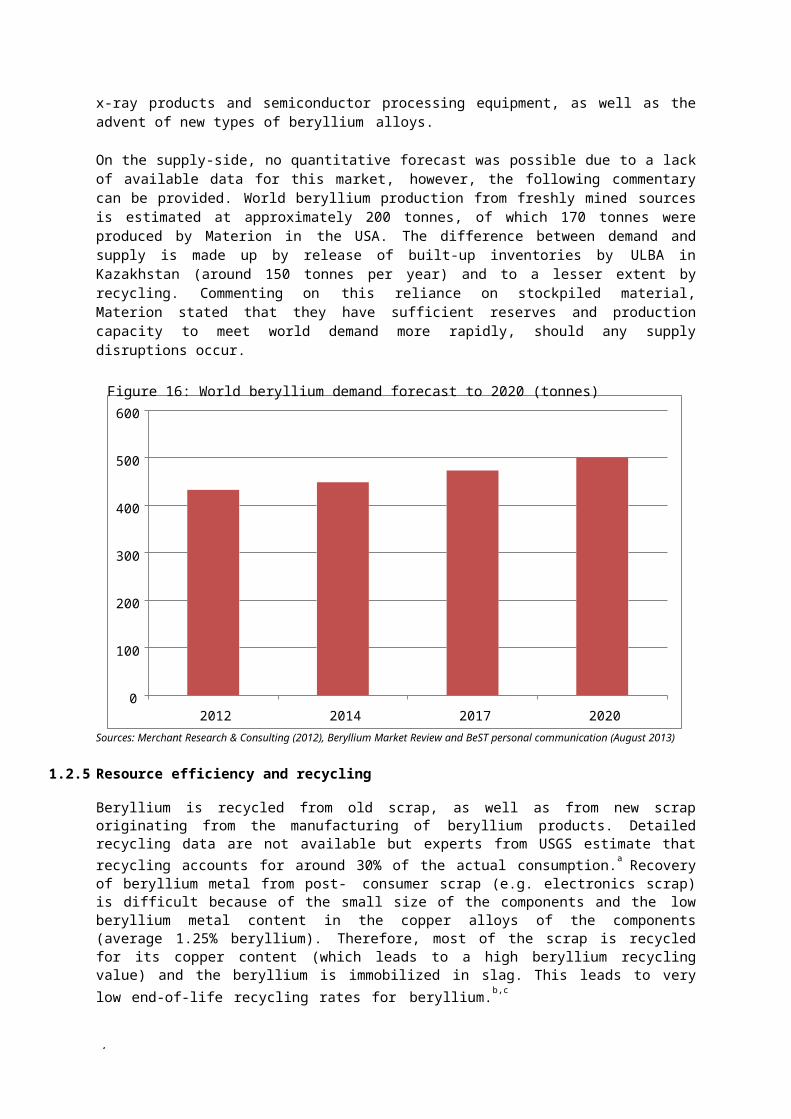
The market outlook forecast for world beryllium demand is shown in Figure 16. This shows world beryllium demand increasing in 2012 from the current baseline, rising to 500 tonnes by 2020, at an overall rate of 1.8% per year. It was not possible to split the forecast by major end-market, due to the lack of available data. However, the larger increases are expected defence applications and increased demand for beryllium based-metals used in commercial applications such as (nonmedical and industrial)
aBeryllium Science and Technology Association: http://beryllium.eu/about-beryllium-and-beryllium-alloys/uses-and-applications-of-beryllium/, accessed 26th
August 2013

Ullmann’s Encyclopedia of Industrial Chemistry: Beryllium and Beryllium Compounds, Wiley-VCH Verlag GmbH & Co. KGaA,
1
b

1
600
500
400
300
200
100
02012 2014 2017 2020
Figure 16: World beryllium demand forecast to 2020 (tonnes)
x-ray products and semiconductor processing equipment, as well as the advent of new types of beryllium alloys.
On the supply-side, no quantitative forecast was possible due to a lack of available data for this market, however, the following commentary can be provided. World beryllium production from freshly mined sources is estimated at approximately 200 tonnes, of which 170 tonnes were produced by Materion in the USA. The difference between demand and supply is made up by release of built-up inventories by ULBA in Kazakhstan (around 150 tonnes per year) and to a lesser extent by recycling. Commenting on this reliance on stockpiled material, Materion stated that they have sufficient reserves and production capacity to meet world demand more rapidly, should any supply disruptions occur.
Sources: Merchant Research & Consulting (2012), Beryllium Market Review and BeST personal communication (August 2013)
1.2.5 Resource efficiency and recycling
Beryllium is recycled from old scrap, as well as from new scrap originating from the manufacturing of beryllium products. Detailed recycling data are not available but experts from USGS estimate that recycling accounts for around 30% of the actual consumption.a Recovery of beryllium metal from post- consumer scrap (e.g. electronics scrap) is difficult because of the small size of the components and the low beryllium metal content in the copper alloys of the components (average 1.25% beryllium). Therefore, most of the scrap is recycled for its copper content (which leads to a high beryllium recycling value) and the beryllium is immobilized in slag. This leads to very low end-of-life recycling rates for beryllium.b,c
Due to its high costs beryllium is only used when crucial. Therefore substitution in these applications is generally not viable. Nevertheless titanium, high-strength grades of aluminium or pyrolytic graphite may replace beryllium (composites) for some uses. Beryllium-copper alloys sometimes are substituted with other copper alloys containing nickel and silicon, titanium or tin as alloying elements. These substitutions can result in performance losses.d
aMineral Commodity Summaries: Beryllium, US Geological Survey, 2013.
bBeryllium Science and Technology Association: http://beryllium.eu/health-environment-legislation/recycling/, accessed 26th August 2013
cRecycling Rates of Metals, United Nations Environment Programme, 2011
dMineral Commodity Summaries: Beryllium, US Geological Survey, 2013.

1
Table 4: Substitutability scores for beryllium applicationsApplication/Sector Substitutability scoreRubber, plastics and glass 0.7Road transport 1Metals 1Mechanical equipment 1Electronics & IT 0.7Aircraft, shipbuilding and trains 1Electrical equipment and domestic appliances 1Others 0.5
1.2.6 Specific issues
Several countries have restrictions concerning trade with beryllium. According to the OECD´s inventory on export restrictions, Russia uses export taxes on beryllium waste and scrap and China has a licensing agreement on unwrought beryllium, powders and articles thereof. There is a wide range of other countries imposing trade restrictions on beryllium. For the USA, there are no trade restrictions reported.
Mine borateminerals
Purify & refineAdd to glassmanufacturing process
Manufacture ofproduct,
e.g. cookware, IFGEnd of life
1
1.3 Borates
1.3.1 Introduction
Borates are inorganic salts of boron, which the metal boron (B, atomic number 5) and boron containing substances are derived from. The major deposits are found in Turkey and in California.a Borates are essential to plant growth. Its major uses globally are in agriculture, ceramics, detergents, ferro-boron, and glass.
A supply chain map for the use of borates in glass is shown in Figure 17. Borates are mined from mineral deposits; for most applications, borates require refining as the ores are not of sufficient quality. Refining occurs through recrystallization of the minerals; the ore is leached with hot water, insoluble impurities are removed, finally, the concentrated borate solutions are cooled in crystallizers to produce high purity sodium borate or boric acid.b
Figure 17: Supply chain map for borates in glass
Note: Orange colour represents stages of the supply chain which take place in Europe.
During the manufacturing of glass, boron can be added in a number of forms including boric acid and disodium tetraborate (also known as borax). These borates are added as fluxes and are network formers, reacting with the other glass raw materials (e.g. sand) to form a new chemical substance, glass. Borosilicate glass has increased resistance to chemicals and to heat and has a higher mechanical strength.c In addition, borates lower the melting temperature during glass manufacturing and inhibit crystallisation of the glass, facilitating the production process.
1.3.2 Supply
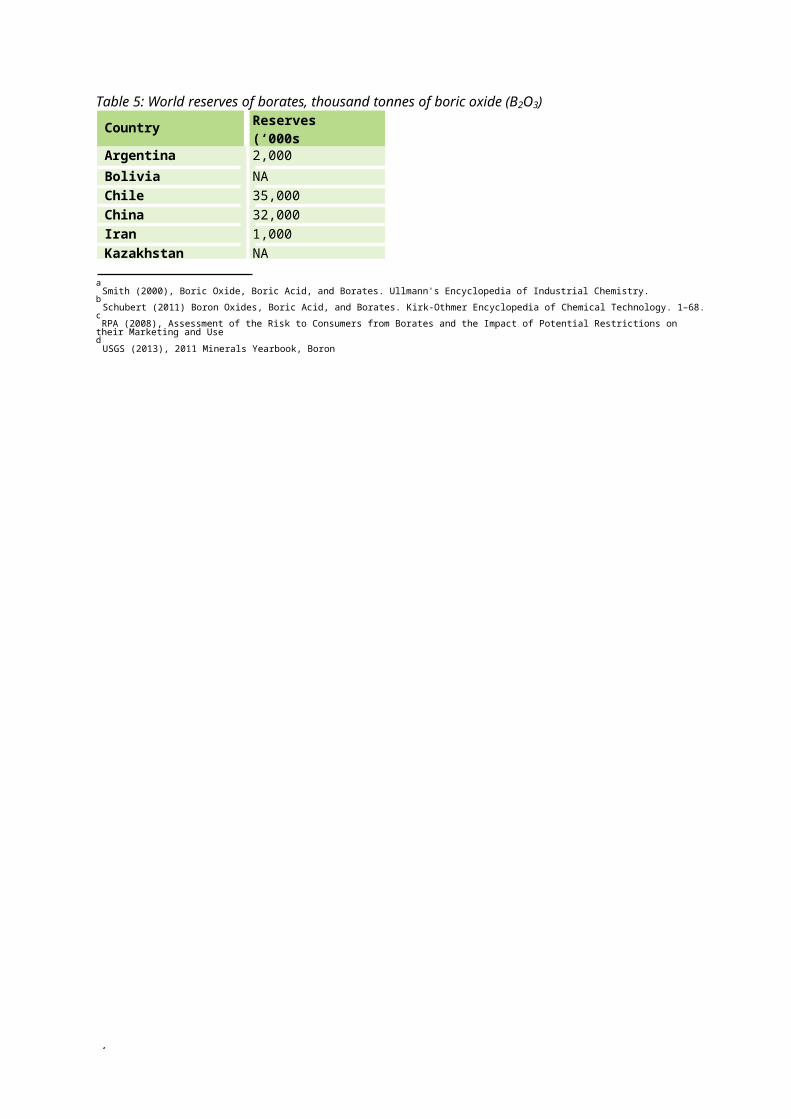
Primary sources and refiningOver 150 borate minerals are known; however, just 4 of these make up 90% of the minerals used in industry: the sodium borates tincal and kernite, the calcium borate colemanite, and the sodium-calcium borate ulexite. Borate deposits are associated with volcanic activity and arid climates, and the largest borate deposits are found in Turkey and California. These reserves have very high borate content, ranging from 25% to 32%. Lower quantities are found in the Andean belt of South America; these areextracted in Argentina, Bolivia, Chile and Peru.d Estimated global reserves for borates, quoted asequivalent tonnes of boric oxide (B2O3) are shown in Table 5.
Table 5: World reserves of borates, thousand tonnes of boric oxide (B2O3)
Country Reserves (‘000s tonnes)
Argentina 2,000Bolivia NAChile 35,000China 32,000Iran 1,000Kazakhstan NA
aSmith (2000), Boric Oxide, Boric Acid, and Borates. Ullmann's Encyclopedia of Industrial Chemistry.
bSchubert (2011) Boron Oxides, Boric Acid, and Borates. Kirk-Othmer Encyclopedia of Chemical Technology. 1–68.
cRPA (2008), Assessment of the Risk to Consumers from Borates and the Impact of Potential Restrictions on their Marketing and Use
dUSGS (2013), 2011 Minerals Yearbook, Boron

1
Peru 4,000
Russia 40,000Turkey 60,000USA 40,000Total (rounded) 210,000
Source: USGS (2013), Mineral Commodity Summaries 2013, Boron
Some applications permit the use of unrefined borates, such as colemanite and ulexite; however, these must be treated to provide suitable quality and consistency. All other applications require refined borates. Several commercial forms of borates exist; the most common are boric acid and borax (disodium tetraborate), as the anhydrous, pentahydrate or the decahydrate forms.
As described above, sodium borate salts are refined through recrystallization. In boric acid production, the mineral is leached with an acid, commonly sulphuric acid, resulting in a hot concentrated solution containing boric acid, sodium or calcium sulphate and other impurities. Insoluble impurities are removed by filtration, and the slurry is subsequently dewatered producing a moist cake of boric acid. The crystals are washed to remove further impurities and dried into a granular product.a
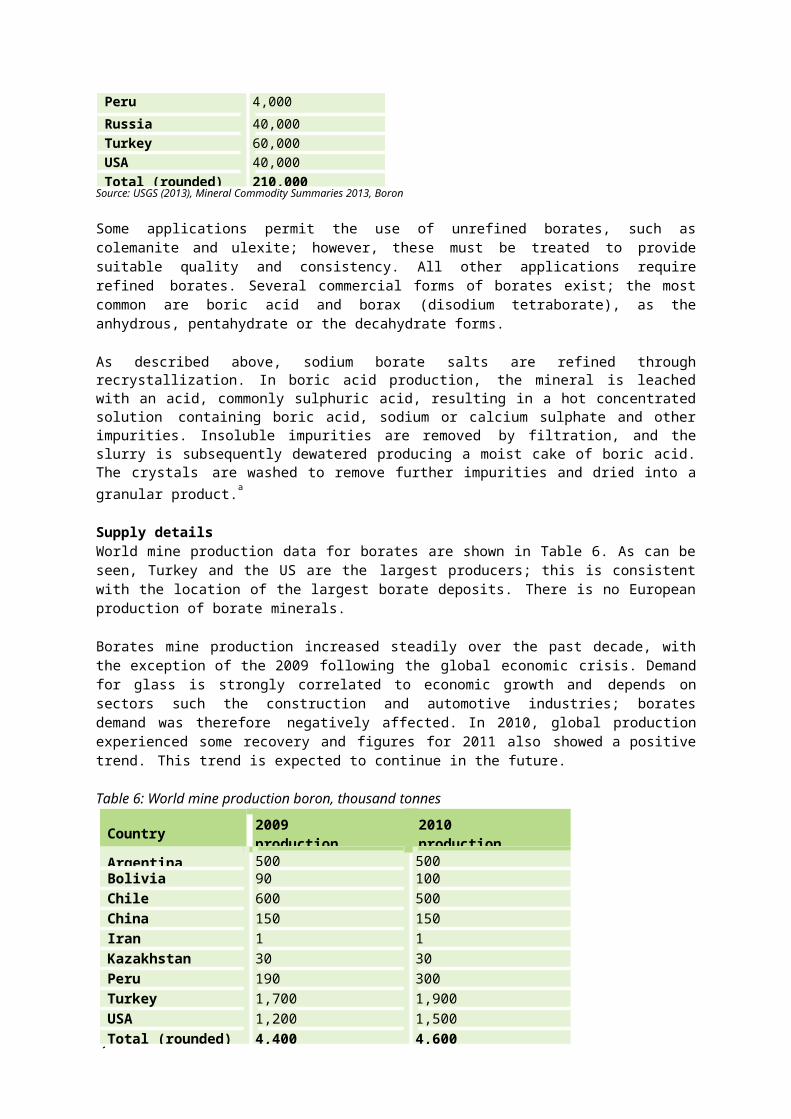
Supply detailsWorld mine production data for borates are shown in Table 6. As can be seen, Turkey and the US are the largest producers; this is consistent with the location of the largest borate deposits. There is no European production of borate minerals.
Borates mine production increased steadily over the past decade, with the exception of the 2009 following the global economic crisis. Demand for glass is strongly correlated to economic growth and depends on sectors such the construction and automotive industries; borates demand was therefore negatively affected. In 2010, global production experienced some recovery and figures for 2011 also showed a positive trend. This trend is expected to continue in the future.
Table 6: World mine production boron, thousand tonnes
Source: World Mining Data 2012
EU trade flows and consumptionOverall, the EU is a net importer of natural borates, as can be seen in Figure 18, around 100,000 tonnes of natural borates are imported net per year. Figures for 2009 and 2010 are consistent with the reduction in borates production experienced in 2009, as described above. b
aSchubert (2011), Boron Oxides, Boric Acid, and Borates. Kirk-Othmer Encyclopedia of Chemical Technology. 1–68.
bIt is to be noted that today there is no extraction of natural borates in the EU. These (e.g. tincal, kernite, colemanite, ulexite) are not usually imported into
the EU as such. Instead, “refined” products are imported (i.e. boric acid, disodium tetraborates (Borax) and others).
Country 2009 production (‘000s tonnes)
2010 production (‘000s tonnes)
Argentina 500 500Bolivia 90 100Chile 600 500China 150 150Iran 1 1Kazakhstan 30 30Peru 190 300Turkey 1,700 1,900USA 1,200 1,500Total (rounded) 4,400 4,600

150 000
100 000
50 000
02008 2009 2010 2011 2012
ExportImport Balance
-50 000
-100 000
-150 000
Figure 18: Trends in extra-EU trade for natural borates (tonnes)
500 000400 000300 000200 000100 000
--100 000-200 000-300 000-400 000-500 000
2008 2009 2010 2011 2012
ExportImport Net-Export
Figure 19: Trends in extra-EU trade for refined borates (tonnes)
1
Source: Eurostat-Comext Database, CN 2528 [accessed November 2013]
These statistics shown above do not include figures for downstream uses of borates or boron, such as refined borax or subsequent products; therefore, do not necessarily provide a complete picture of EU trade. Figure 19 shows import and exports for refined borates, such as borax and boric acids. As can be seen, Europe is a net-importer of refined borates, importing around 300,000 tonnes net per year. This figure is three times larger than imports for natural borates, showing that these materials are generally not refined in the EU.
Import-export figures for 2008 to 2012 show the same trends for refined and natural borates. In both cases, 2009 and 2012 experienced strong reductions in demand due to global economic crisis. However, in 2011, imports for refined borates decreased from 2010 levels, unlike natural borates which increased strongly. An overall, decreasing trend in net-imports is observed, showing the market has not recovered since the 2009.
Source: Eurostat-Comext Database, CN 2810 and CN 2840 combined [accessed November 2013]
The major exporting country of natural borates to the EU in 2012 was Turkey which exported 116,000 tonnes of natural borates, covering 97% of all imports (Figure 20). The EU exports natural borates to a

2
EU imports of natural borates (107,296 t)Other~0%
Argen-tina 2%
Turkey 98%
EU exports of natural borates (6,723 t)Other
Indonesia4%2%ThailandIndia
2%34%Malaysia 3%Ukraine 4%
Mexico 7%
RussiaEgypt8%26%
Algeria 10%
Figure 20: EU’s major trading partners for natural borates, 2012
EU imports of refined borates (302,287 t)RussiaOther
1%4%Chile 1%
Peru 2%
USA 6%
Turkey 86%
EU exports of refined borates (25,076 t)Other27%
Norway29%
Not Specified 3%
China3%India
Ukraine10%4%
Malaysia4%Cote Switzer- D'IvoireUSA land5%7%8%
Figure 21: EU’s major trading partners for refined borates, 2012
number of countries, including India and Egypt; however, these figures are negligible compared to imports.
Source: Eurostat-Comext Database, CN 2528 [accessed November 2013]* Countries and territories not specified for commercial or military reasons in the framework of trade with third countries.
Figure 21 shows the EU’s major trading partners of refined borates in 2012. Once again, Turkey is the major source of borates in the EU, followed by the USA and Peru. These countries are also the major mine producers of borates. The EU exports refined borates to a number of countries including Norway, India, Switzerland as well as the USA. As for natural borates, these figures are over a factor of ten lower than imports.
Source: Eurostat-Comext Database, CN 2810 and CN 2840 combined [accessed November 2013]
For borates, EU consumption is estimated at approximately 285,000 tonnes (borate equivalent), which represents around 15% of world consumption. Differences to trade data are due to different units being reported: trade data are presented in gross weight whereas consumption data are in borate equivalents.
2
Americas29%
EMEAI23%
APAC48%
Figure 22: Global Demand for Borates by Major Geographic Region, 2011f (%)
In terms of other geographic regions, Asia Pacific (APAC) is the world’s largest consumer of borates, accounting for nearly half of world consumption (Figure 22). The Americas represent 29% of world borates demand, with the remaining 8% split between the Middle East, Africa and India (once the European demand is deducted from EMEAI).
Source: Rio Tinto Presentation (March 2010), the Global Outlook for Borates; Note: EMAI represents Europe, Middle East, Africa and India
OutlookEti Maden, a Turkish state owned company which is the world’s major producer, is planning to expand its capacity from 1.7 million tonnes of boron chemicals to a capacity of 5.5 million tonnes in 2023.a
Borax, a company owned by the British-Australian multinational Rio Tinto and second world producer, is also planning to expand its capacity. Rio Tinto is exploring a lithium-borate deposit in Western Serbia; the project is still in its prefeasibility stages.b It is estimated that 16.2 million tonnes of borate are present only in the lower zone of the deposit.c A Canadian company, Erin Ventures Inc., is also exploring a property in Serbia, which it believes to hold borate deposits of a concentration similar to those found in Turkey.d
1.3.3 Demand and economic importance
Prices and marketsBorate prices decreased throughout 2008 and 2009 as can be seen in Figure 23. The price cut was a reflection of an imbalance between supply and demand created by the global economic crisis. The price increase from 2010 to 2011 is a result of stabilisation in market conditions.e
aEti Maden (2011), Eti Mine Works General Directorate. http://en.etimaden.gov.tr/d_en/file/2011annualreport.pdf [Accessed February 2013]
bRio Tinto (n.d.), Inferred Resource at Jadar lithium project (Serbia). http://www.riotinto.com/shareholders/517_17032.asp [Accessed February 2013]
cRio Tinto (2011), Project overview. Energy for the future. http://www.riotintominerals.com/documents/RTM.JadarFactSheets.Sept2011.pdf [Accessed
February 2013]d
Industrial Minerals (2013), Supply Situation Report: Not so boron.e
2
USGS (2013), 2011 Minerals Yearbook, Boron

1 400
1 200
1 000
800
600
400
200
0
1970 1980 1990 2000 2010
Figure 23: Borates historical price volatility (98 US$/tonne)
Flame retardants1%
Other2%
Glass (insulation)27%
Detergents1%
Industrial fluids 2%
Construction materials 4%Metallurgy 5%
Glass24%
Chemicals7%Agriculture
13%Frits & ceramics
14%
Figure 24: European boron consumption
2
Source: USGS (2012- ), Historical Statistics for Mineral and Material Commodities in the United States [accessed February 2013]. Figures are indexed to 1998 values.
1.3.4 Applications
As can be seen in Figure 24, over three quarters of borates are used in glass and fibreglass applications, ceramics and agriculture. They also have several other applications within the construction, materials and chemicals industries.
Source: IMA-Europe
Glass: Borates bring several benefits to glass, both in the manufacturing process and in the final product. Borates act as a powerful flux and lower glass batch melting temperatures, they reduce the tendency of the glass to crystallise, control the relationship between temperature, viscosity and surface tension, and they increase chemical and mechanical durability. Boron is used in Pyrex cookware, laboratory glassware, pharmaceutical, lighting and domestic appliances (borosilicate glass); in LCDs used in tablets and televisions; in insulation fiberglass (IFG) for thermal and mechanical insulation; and textile fiberglass (TFG) for reinforcement of various materials including in

2
electronics and aerospace applications. A fast growing application of borosilicate glass is in solar thermal heating; these are used in both domestic and industrial technologies. In the former borosilicate glass tubes contain a solar collector in order to capture the energy. In the latter, these tubes are used to carry heat transfer fluids.
Agriculture: Boron is an essential micronutrient for plant growth, crop yield and seed development. Boron regulates the passage of glucose in cells, cell division and growth and the metabolism of photosynthesis. Although only low amounts of boron are required, its deficiency in soil can have severe effects on the crops. Small concentrations of boron are added to fertilizers in order to maximise crop yield and to ensure healthy growth and development of the plants.
Wood preservatives: Boric acid, borax (disodium tetraborates), disodium octaborate tetrahydrate and boric oxide are permitted for use in wood preservatives under the Biocidal Products Regulation (EU) 528/2012). These compounds protect the wood from insects and fungal decay but are safe for human health and the environment. These compounds are water soluble and therefore are absorbed by the wood allowing penetration into the surface. However, this also means that use of these compounds is limited mainly to wood not exposed to rain as the preservatives may be washed away.a
Cleaning and detergents: Borates are used in laundry detergents, household and industrial cleaning products. Borates enhance stain removal and bleaching, provide alkaline buffering, soften water and improve surfactant performance.
Ceramics: Borates are added to ceramics and enamel frits in order to enhance chemical, thermal and wear resistance. They also regulate the thermal expansion coefficient of the ceramic ensuring a good fit between the glaze and the clay. Borates are also used to initiate glass formation and to reduce the glass viscosity, resulting in a smoother surface.
Metallurgy: Boron is used as an additive for steel and other ferrous metals as its presence ensures higher strength at a lower weight. For example, ferro-boron is a low is the lowest cost boron additive for such alloy. These alloys are employed in the manufacturing of safe and fuel efficient vehicles.b
Other uses of borates are as fire retardants in timber, cellulosic insulation, PVC and textiles; in nuclear power plants in control rods to capture neutrons; in cosmeticsc and pharmaceuticals; and corrosion inhibitors.
1.3.5 Outlook
The market outlook forecast for borates supply and demand is shown in Figure 25, it should be noted that this is a global forecast. This shows that there is currently a significant surplus in the world borates market (at nearly 20% of world supply), although it is noted that currently two countries – US and Turkey– account for more than two-thirds of borates supply. Some further expansions in world production are expected, the vast majority of which is expected to take place in Europe (Turkey or possibly Serbia). These increases would take Europe’s share of world production to 50% of the world market by 2020. However, overall the current market surplus that exists is expected to be considerably reduced by 2020.
In terms of market demand, the overall market is expected to grow at around 4.2% per year to 2020. The largest market for borates, fibreglass, is anticipated to have growth rates comparable to the market as a whole. Of the other markets, strong growth is forecast for the borosilicate glass and agriculture segments of the market, which are expected to register annual growth rates of 11% and 7% respectively. Slower growth is anticipated in the ceramics, detergents and other market segments.
aPommer and Jaetsch (2007), Wood, Preservation. Ullmann's Encyclopedia of Industrial Chemistry.
bUSGS (2013), 2011 Minerals Yearbook, Boron
cBorates have been assessed to be safe within the scope of the Cosmetics Regulation (EC) No 1223/2009

Figure 25: World borates supply and end-use forecasts to 2020 (‘000s tonnes of B2O3)3 000
2 500
2 000
1 500
1 000
OtherDetergents Agriculture Ceramics Borosilicate glass FibreglassSupply
500
-2012 2014 2017 2020
2
Source: Roskill Information Services for 2013 CRMs study1.3.6 Resource efficiency and recycling
According to USGS, recycling of borate products was insignificant.a Fertilisers, chemicals and detergents are not likely to be recycled considering these products are consumed with use. Borosilicate glass and ceramic cannot be recycled with normal glass because these materials have a higher heat resistance and therefore higher melting point compared to conventional glass. The presence of this kind of glass during recycling causes defects in the recycled glass; each shard of high temperature glass can cause the rejection of several meters of product.b Ceramic material can be recycled for use as aggregates in construction materials.c
Borates can be substituted with other materials in soaps, detergents, enamel and insulation as can be seen in Table 7. For example, some ceramics can use phosphates as glass-producing substances. Sodium and potassium salts of fatty acids can act as cleaning and emulsifying agents in soaps and sodium percarbonate can act as a substitute in detergents.Table 7: Available substitutes for borates
aUSGS (2013), 2011 Minerals Yearbook, Boron
bWRAP (2008), Collection of flat glass for use in flat glass manufacture.
cNatural Stone (n.d) http://www.ced.ltd.uk/gravels/aggregates/traxmax.htm; http://www.eco-
innovation.eu/index.php?option=com_content&view=article&id=387%3Aceramic-building-waste-recycling&catid=51%3Abelgium&Itemid=51
Use Substitutes/Rationale Substitutability score
Soaps and Sodium and potassium salts of fatty acids: currently competing 0.7Borosilicate glass No alternative available 1
Ceramics Glass producing substances like phosphates 0.7
Fibreglass No alternative available 1
Ferro-boron No alternative available 1
Others Arbitrary assumption 0.5

2
1.3.7 Specific issues
Diboron trioxide, tetraboron disodium heptaoxide(hydrate) (disodium tetraborate), boric acid, and lead bis (tetrafluoroborate), have been identified as Substances of Very High Concern (SVHC) under REACH legislation and were added to the candidate list in 2010. These compounds have also been classified as toxic for reproduction under category 1B of the EU CLP legislation. In addition, the Polish Government has asked for a review of the classification of borates as toxic for reproduction.a
Exports from Argentina of natural, concentrated and refined borates are subject to a 5% export tax.b
aECHA (n.d.), Registry of submitted Harmonised Classification and Labelling intentions. http://echa.europa.eu [Accessed October 2013]
bOECD (n.d.), Inventory of Restrictions on Exports of Raw Materials. http://qdd.oecd.org/Subject.aspx?subject=1189A691-9375-461C-89BC-48362D375AD5.
[Accessed February 2013]

2
1.4 Chromium
1.4.1 Introduction
Chromium (Cr, atomic number 24) is a silvery-white, corrosion-resistant, hard metal that is an essential component of stainless steel and other alloy steels, where it is used as ferrochromium. Its compounds have been extensively utilised as colouring pigments, but their use has decreased due to environmental concerns. The natural mineral chromite is also used in refractories.a
The biggest share (>90%) of the global chromite production is destined for use in the metallurgical industry, mainly in the production of ferrochromium. The remaining chromite is used in the aeronautics (for the protection of aluminium aircraft bodies), foundry, chemical and refractory sectors. Therefore chromite and ferrochromium production follow the same pattern (Figure 27). Supply situation of ferrochromium is of strategic importance for stainless steel production.b
1.4.2 Supply
Primary sources, production and refiningThough chromium can be found in many different materials, chromite ((Fe, Mg)O∙(Cr, Al)2O3) is the only commercial source of chromium. The composition of chromite varies greatly but rarely contains more than 50% of chromium oxide.c Chromium is a relatively common element with the Earth’s crust, containing around 0.1% of this metal.d It is in the second tier of the elements by order of abundance.e
World resources of chromite are estimated to be larger than 12 billion tonnes of ore. This is sufficient to meet demand for centuries. About 95% of these resources are located in South Africa and Kazakhstan.f
Known reserves of chromium ore are estimated at greater than 460,000,000 tonnes (Table 8). As for resources and supply, these are largely located in Kazakhstan and South Africa. However, several important producing countries such as Turkey is omitted from this list.
The Bushveld Complex in South Africa covers more than 60,000 km2 and includes at least 14 chromitite horizons of economic or potentially economic importanceg. Several of the chromitite horizons contain significant grades of PGMs: chromite ore is a co-product with platinum group metals (PGMs), specifically from mines in the UG2 chromitite horizonh. Increased demand for PGM may result in an increasing output of chromite ore.i The Bushveld Complex contains the world’s largest resources both of chromium and of PGMs.j
Table 8: Estimated reserves of chromium, based on shipping grade chromium oreCountry Reserves
1,000 tonnes Percentage
India 54,000 12%
aEuropean Mineral Statistics: 2007-11, British Geological Survey, 2013
bThe Economics of Chromium, Roskill Information Services, 2009
cUllmann’s Encyclopedia of Industrial Chemistry: Chromium and Chromium Alloys, Wiley-VCH Verlag GmbH & Co. KGaA, 2000
dChrom, Römpp Online, 2007
eA.B. Ronov, A.A. Yaroshevsky, Earth's Crust Geochemistry, in Encyclopedia of Geochemistry and Environmental Sciences, R.W. Fairbridge (ed.), Van
Nostrand, New York, (1969)f
Mineral Commodity Summaries: Chromium, US Geological Survey, 2013.g
Vermaak, C. F. (1986): Summary aspects of the economics of chromium with special reference to Southern Africa. In: Anhaeusser, C.R. and Maske, S. (Eds.)Metal Deposits of Southern Africa, Geological Society of South Africa, pp. 1155-1181h
Mudd, G. M. (2012): Key trends in the resource sustainability of platinum group elements. Ore Geology Reviews 46, 106-117.iUllmann’s Encyclopedia of Industrial Chemistry: Platinum Group Metals and Compounds, Wiley-VCH Verlag GmbH & Co. KGaA, 2001
jCawthorn, R.G. (2010): The Platinum Group Element Deposits of the Bushveld Complex in South Africa. Platinum Metals Review 54, 205-215.

Russia2%
Brazil 2%Oman 2%Pakistan 2%
Zimbabwe Other2% 4%
South Africa43%
Finland3%Turkey 7%
India13% Kazakhstan
20%
Figure 26: Worldwide production of chromium in 2010
2
Kazakhstan 210,000 45%
South Africa 200,000 43%USA 620 0.1%Total >460,000
Source: USGS MCS 2013 Chromium
For refining please see section on supply chain.
Supply detailsSupply of chromium is estimated to be 11,103,881 tonnes in 2010. South Africa was the largest producer of chromium in the world with an output of 4.8 million tonnes (43% of world production). As shown in Figure 26, Kazakhstan (20%) and India (13%) were the next largest producers for chromium. Within the EU, only Finland (294,500 tonnes) produced chromium in 2010. If Turkey is also considered (799,873 tonnes), the total amount from these two counties covered only around 50% of European demand.
Source World Mining Data 2012
Supply chainThe recovery of chromium involves several stages, illustrated in Figure 27. After mining chromium ores, chromium can be extracted by alkaline or acidic dissolution. In alkaline dissolution, finely ground chrome ore is roasted with Na2CO3 under oxidizing conditions at ca.1100°C. The solution containing hexavalent chromium (CrVI) can either be reduced with SO2 and used for electrowinning, or Na2Cr2O7 can be crystallized. The latter can be converted to CrO3 for use in electrolysis or to Cr2O3 for use in metallothermics. In acidic dissolution, parts of iron (Fe), aluminium (Al) and magnesium (Mg) are also contained, which must be removed before further processing, for example by crystallization as iron ammonium sulphate. The chromium in the resulting solution is in the +3 valence state and with additional purification it is used to produce electrolytic Cr.a
aUllmann’s Encyclopedia of Industrial Chemistry: Chromium and Chromium Alloys, Wiley-VCH Verlag GmbH & Co. KGaA, 2000

2
Figure 27: Supply chain map for chromium
Note: Orange colour represents stages of the supply chain which have been identified as taking place in Europe.
Some capacity at each stage was been identified in the EU, though they are believed to be on a relatively small scale compared to the global capacity. For example, ore is mined and processed in Finland to produce ferrochromium for input into the steel industry. Chrome based chemicals are also produced in the EU, for example in the UK. While this picture suggests that chromium supply chain it is extensive in the EU, a full detailed analysis was not found, and it is likely that each is on a small scale compared to global capacity at each stage.
EU trade flows and consumptionHistorically the EU has been an importer of chromium ores and concentrates (Figure 28), due to a lack of internal supply and to demand from the steel industry. This data does not include information on downstream uses of chromium and its applications, and only refers to the raw material and concentrates.

800 000
600 000
400 000
200 000
02008 2009 2010 2011 2012
EU ExportEU Import Net Export
-200 000
-400 000
-600 000
-800 000
Figure 28: EU trade flows for chromium ores and concentrates, tonnes
EU Imports of Chromium Ores and Concentrates (327,951 t)Other 4%
Turkey16%South
Africa80%
EU Exports of Chromium Ores and Concentrates (59,470 t)Other 9%
RussiaNot63%
specified4%
Chile 5%Ukraine 5%
China 14%
Figure 29: EU’s major trading partners for chromium ores and concentrates, 2012
3
Eurostat-Comext Database, CN Code 26100000 Chromium ores and concentrates
The vast majority of material is imported from South Africa, with smaller contributions from Turkey and a range of countries. Exports are strongly linked to Russia, with various other countries supplied. The destination of around 4% of exports is unspecified due to commercial or military reasons.
Eurostat-Comext Database, CN Code 26100000 Chromium ores and concentrates
Europe’s share of world chromium metal consumption is estimated by Roskill at 1.8 million tonnes, which equates to approximately 18.5% of the total world consumption (9.7 million tonnes).a
This estimate is comparable to Europe’s share of world stainless steel end-use consumption (the main market for chromium). For stainless steel, Europe’s share is estimated at 20% of world consumption and compares to 41% in China, 17% in other Asia, 10% in the Americas and 12% in the rest of the world, as shown in Figure 30.Figure 30: World Stainless Steel End-use Consumption by Geographic Region, 2011 (%)
aRoskill Information Services, written communication (November 2013)

3
Rest of World12%
Americas 10%China41%
Europe20%
Other Asia17%
3 000
2 500
2 000
1 500
1 000
500
01970 1980 1990 2000 2010
Figure 31: Chromium historical price volatility (98 US$/tonne)
Source: KPMG (2012), Chrome and Ferrochrome Special Commodity Insights Bulletin
1.4.3 Demand and Economic Importance
PricesThe price for chromium remained relatively stable until the past decade, where prices rose considerably due to increasing demand from the stainless steel industry. Latterly prices fell as a result of dropping steel demand due the global financial crisis, though prices are beginning to see rises again as the steel market re-establishes itself. Despite this chromium ranks as moderately volatile compared to other materials.
Source: USGS (2012- ), Historical Statistics for Mineral and Material Commodities in the United States [accessed February 2013]. Figures are indexed to 1998 values.
3
Other1%
Superalloys2%
Steel9%
Stainless steel88%
Figure 32: End-use of chromium in the USA in 2012
ApplicationsChromium is used in several industries of which the biggest share is taken by the steel industry. As shown in Figure 32; data regarding European consumption were not available at the time of writing. The different uses can be found in the list below:a,b
Metallurgical industry: Chromium in steel alloys has a strengthening effect through forming stable metal carbides at the grain boundaries. Furthermore it increases corrosion resistance of steel. Therefore most quantities of chromium are used for stainless steel, which requires a minimum of 10.5% Cr by mass. Chromium is also an important alloying element in nickel-based alloys and also used as surface coating material due to its corrosion resistance.
Refractories and foundries: Chromite is used for manufacturing bricks and other devices in the refractory industry.
Pigments: Different chromium compounds are used for pigments such as chrome yellow. Due to environmental and health concerns related to hexavalent chromium this usage declined in the past few years.
Other chemicals: Chromium containing chemicals are used for leather tanning, drilling muds, cosmetics, catalysts or wood preservatives.
Emerging technologies include seawater desalination, orthopedic implants. However, these are not expected to have significant influence on total demand up to 2030.
Source: US Geological Survey, Mineral Industry Surveys, Dec 2012
1.4.4 Outlook
The market outlook forecast for world ferrochromium supply and demand is shown in Figure 33. Ferrochromium represents by far the largest market for chromium, accounting for around 95% of total demand. Ferrochromium consumption will track demand for stainless steel, which is expected to continue to grow strongly in China and the rest of Asia, although in the rest of the world demand growth for stainless steel will be far more gradual. Overall the demand for stainless steel and therefore chromium is forecast in the range 4-5% per year to 2020. However, some commentators forecast higher rates of demand growth than this.
aInternational Chromium Development Association: http://www.icdacr.com/index.php?option=com_content&view=article&id=104&Itemid=167&lang=en,
accessed 26th August 2013b
Ullmann’s Encyclopedia of Industrial Chemistry: Chromium and Chromium Alloys, Wiley-VCH Verlag GmbH & Co. KGaA, 2000

14 000
12 000
10 000
8 000
6 000DemandSupply
4 000
2 000
02011 2014 2016 2020
Figure 33: World ferrochromium supply and demand forecasts to 2020 (‘000s tonnes)
3
Sources: Metal Pages (Aug 2013), Speciality alloys market briefing & KPMG, SMR, ENRC presentations (2012-2013)
On the supply-side, no significant supply restraints have been identified and some idle ferrochromium capacity in South Africa could be restarted and help meet the growing demand. In China ferrochromium capacity utilisation rates are also expected increase to nearer 80%, up from 65%, in the coming years. Overall the market is expected to remain broadly in balance during the coming decade.
1.4.5 Resource efficiency and recycling
For Europe reliable recycling information is not available. The recycling rate in the USA is approximately 30% (as share of recycled stainless steel in the apparent consumption). In its major applications in the metallurgical sector (stainless steel, superalloys) chromium has no direct substitutes.a Different steel grades may be due to environmental and health concerns (carcinogenic potential) inorganic chromium compounds used for pigments or in leather tanning are more and more substituted with organic materials.b
Table 9: Substitutability scoring used in the analysis - by sectorsApplication Substitutability Score
Stainless steel 1
Steel 0.7
Superalloys 1
1.4.6 Specific issues
Several countries have restrictions concerning trade with chromium. According to the OECD´s inventory on export restrictions, export taxes on chromium waste and scrap are used by Russia (6.5%) and Pakistan (25%). Licensing agreements exist in India for chromium ores and concentrates. In South Africa these agreements extend to chromium and articles thereof, waste and scrap, unwrought chromium and powders.
Company concentration is also a concern for chromium. Most chromium resources in South Africa are located in the Bushveld Igneous Complex; which is estimated to contain nearly 70% of world reserves of
aMineral Commodity Summaries: Chromium, US Geological Survey, 2013.
b

3
Chrom, Römpp Online, 2007

3
chromite.a Samancor Company is the largest producer, mining about 3 million tonnes per annum. 76% (2.3 million tonnes) of Samancor’s production is used by the company to produce various grades of ferrochromium; only 23% of the chromite are exported.b
The top three of worldwide producers of ferrochromium are English-Kazakh ENRC (Eurasian Natural Resources Corporation), English-Russian Kermas Group and Swiss Glencore Xstrata - together accounting for 45% of world production. As for ferrochromium, China and Chinese companies account for the second biggest share in production (~28%) after South Africa (~37%), but are growing faster than the average market.c
Environmental and health concerns have been raised over some chromium compounds; Hexavalent [Cr(VI)] compounds are especially toxic to humans and thus the EC regulates the usage and content of hexavalent chromium.d This leads to declining usage of chromium in some applications. There are concerns that it could drive aeronautics construction out of the European Union as there is currently no substitute available to replace the use of hexavalent chromium to protect aluminium parts from corrosion. There are twelve substances on the SVHC candidate list: dichromium tris(chromate), pentazinc chromate octahydroxide, potassium hydroxyl-octaoxo-dizincate dichromate, chromic acid and dichromic acid (and oligomers), chromium trioxide, ammonium dichromate, sodium chromate, potassium chromate, lead sulfochromate yellow (C.I. pigment yellow 34), lead chromate, sodium dichromate, lead chromate molybdate sulphate red (C.I. pigment red 104).
aMBendi Information Services: http://www.mbendi.com/indy/ming/chrm/af/sa/p0005.htm#Facilities, accessed 26th August 2013
bSamancor Ltd: http://www.samancorcr.com/content.asp?subID=8, accessed 26th August 2013
cDERA-Rohstoffliste 2012, Bundesanstalt für Geowissenschaften und Rohstoffe, 2012
dEuropean Commission: http://eur-lex.europa.eu/LexUriServ/LexUriServ.do?uri=OJ:L:2011:085:0003:0007:EN:PDF, accessed 26th August 2013

3
1.5 Cobalt (Cobaltum)
1.5.1 Introduction
Cobalt (Co, atomic number 27) is a transition metal appearing in the periodic table between iron and nickel. It is very hard and has fairly low thermal and electrical conductivity. Since cobalt is ferromagnetic, it can be magnetised to produce permanent magnets. Cobalt keeps its magnetic properties even at high temperatures up to 1,121°C (Curie Point) which is higher than any other metal. Cobalt melts at 1,493°C and its boiling point is 3,100°C. It is also able to form alloys with many other metals, imparting high- temperature strength to some. This makes cobalt a valuable alloying material.
Very little cobalt metal was used until the 20th century as the metallurgical process was unavailable. However, its ores have been used for thousands of years as blue colouring agents for glass or ceramics. The name cobalt seemingly originates from the Erzgebirge region of Saxony which was a silver mining area. In the silver smelting process cobalt caused respiratory problems with the miners (cobalt here is arsenical). The miners blamed this problem on “Kobolde” (gnomes) which jinxed the silver, and hence gave the mineral the name cobalt.a
The supply chain for the European cobalt Industry is depicted in Figure 34. As shown, the EU imports ores and concentrates, impure carbonates and impure hydroxides scrap as well as metal from outside EU to produce cobalt powders and cobalt chemicals. Biotechnology uses are of cobalt are growing, as it is a biologically essential nutrient for fermentation techniques which are used across multiple sectors.
1.5.2 Supply
Primary sources, production and refiningCobalt is the 29th-most abundant element in the Earth’s crust with a concentration of around 25 ppm. In most cases cobalt is produced as a by-product in mining the ores of other metals, mainly copper and nickel which account for 35% and 55% of production respectively. The remaining 10% of the world production originates from primary cobalt operations.b
The world’s most important cobalt resources are located in the Central African Copper Belt in the Democratic Republic of the Congo and Zambia. This region is estimated to contain more than 6 million tonnes of cobalt.c World resources are estimated to be around 15 million tonnes. There may exist an additional 1 billion tonnes of cobalt resources in manganese nodules and crusts on the ocean floor. However, these resources are currently characterized as not economically exploitable.d In Europe there are only smaller known cobalt resources (e.g. in the Kupferschiefer) but there is currently no significant mining of this resource.e
aCobalt Development Institute: http://www.thecdi.com/about-cobalt, accessed 26th August 2013; Cobalt, Römpp Online, 2005
bCobalt Development Institute: http://www.thecdi.com/about-cobalt, accessed 26th August 2013
cCommodity Profiles: Cobalt, British Geological Survey, 2009
dMineral Commodity Summaries: Cobalt, US Geological Survey, 2013

Ores & Concentrates
metal
batteries
Super alloys
non-EU
Scrap
impurecarbonates, impure hydroxides, scrap
EU non-EU
Cobalt Powders
hardmetal & surface treatment
Cobalt Chemicals
CatalystsCatalysts
Coloring, frits, rubber, feed acidColoring, frits, rubber, feed acid
non-EU cobalt industry
Cobalt Raw Materials EU Cobalt Industry EU Cobalt Industry Outlets
hardmetal &surface treatment
Philippines2%
New Caledonia 3%Morocco 3%
Brazil 3%Cuba 3%
Australia 4%Canada 4%
Zambia 6%Russia 6%
South Africa2% Other
2%
Democratic Republicof the Congo 56%
China6%
Figure 35: Worldwide production of cobalt in 2010
3
Figure 34: Supply chain for the EU cobalt industry
Source: Eurometaux (2010), redesigned by Fraunhofer ISI 2013
Supply detailsWorld production of cobalt in 2010 was around 106,000 tonnes per annum. As shown in Figure 35 supply was dominated by the Democratic Republic of the Congo (DRC) with a share of 56%. Though the DRC has many mineral deposits, it is among the poorest countries in the world and is generally considered to be politically unstable. The economic importance of cobalt, in combination with the political situation in the DRC, makes cobalt a strategic sensitive resource.a Other major producers of cobalt are China, the Russian Federation and Zambia, each with a share of 6%.
Source: US Geological Survey MY 2011More recent estimates for world supply and reserves as estimated by USGS are depicted in
a Rohstoffe für Zukunftstechnologien, Angerer, G. et al., Fraunhofer-IRB-Verlag, 2009

3
30 000
20 000
10 000EU Export
02008 2009 2010 2011 2012
EU ImportNet Export
-10 000
-20 000
-30 000
Table 10, showing that the supply situation has changed little according to these evaluations.
Table 10: Supply and reserves of cobalt (tonnes of cobalt content)rves
Source: USGS Commodity Summary Cobalt (2013)
EU trade flows and consumptionTrade flow data from the past five years (Figure 36) shows that the EU has consistently been a net importer of cobalt ores and concentrates, as would be expected due to the lack of production from within the EU. Import has dropped considerably over the past five years. Exports have remained a small part of trade. However, these statistics do not include information on derivative substances and products containing cobalt, and therefore do not represent the entire cobalt market.
Figure 36: Trends in extra-EU trade for cobalt ores and concentrates (tonnes)
Source: Eurostat-Comext Database, Code 2605000 Cobalt Ores and Concentrates
The major export country of the EU is Brazil where approximately 85% of cobalt ores and concentrates are sent (Figure 37). A much larger quantity is imported, almost all of which is from Russia.
Country Estimated mine production (tonnes) Rese2011 2012
Australia 3,900 4,500 1,20 0,000
Brazil 3,500 3,700 89,0 00Canada 7,100 6,700 140, 000China 6,800 7,000 80,0 00DRC 60,000 60,000 3,40 0,000Cuba 4,000 3,700 500, 000Morocco 2,200 1,800 20,0 00New Caledonia 3,200 3,500 370, 000Russia 6,300 6,200 250, 000USA --- --- 33,0 00Zambia 5,400 3,000 270, 000Other Countries 6,700 9,000 1,10 0,000Total 109,000 110,000 7,500,000

EU Import of Cobalt Ores and Concentrates(6,980 t)
Other 1%
United States 3%Russia
96%
Figure 37: EU trade for cobalt ores and concentrates,EU Export of Cobalt Ores and Concentrates
(111 t)China 6%
Cuba 7%Other 2%Brazil 85%
3
2012
Source: Eurostat-Comext Database, Code 2605000 Cobalt Ores and ConcentratesNote: Apart from 2011 and 2012, significant quantities of cobalt ores and concentrates were imported from RDCongo (2009: 573 t, 2010: 520 t, 2013: 845t).
In terms of Europe’s share of world refined cobalt demand, the Cobalt Development Institute estimates this to be approximately 15% of world demand (Figure 38). This equates to approximately 11,000 tonnes of refined cobalt. Europe’s share compares to 40% estimated for China, 30% estimated for other Asia, 12% in the Americas and 3% in the rest of the world.

Rest of the world3%
China40%
Americas12%
Europe15%
Other Asia30%
Figure 38: World Refined Cobalt Apparent Demand by Geographic Region, 2011 (%)
3
Source: CDI Presentation (April 2013), Cobalt: CDI Review & Future Challenges; INSG EEC Meeting
1.5.3 Demand and Economic Importance
Prices and marketsFigure 39 shows how the different supply and demand situations worldwide influenced cobalt prices during the last century. Interestingly, cobalt prices have remained very stable until, in the late 1970s, they were raised dramatically due to increased world demand, especially of the USA, and limited supply essentially from Zaire (today the Democratic Republic of Congo).a As a result, production and recycling increased. Also consumers started to rely more on substitutes. Hence prices went down again in the early 1980s. Since then, prices has been quite volatile – going up with political unrest in Zaire (today the Democratic Republic of Congo) or a reduced Russian supply and decreasing due to worldwide recession, less demand from the aviation industry or world economic crisis.Figure 39: Development of real cobalt prices (Prices are deflated, 2011 = 100)
$/mt300 000
250 000
200 000
150 000
100 000
50 000
0
Collapse of the price due to the collapse of the entire CRD mining production following the civil war, increased production from other sources such as recycling of secundary materials
limited production capacities worldwide, (due to civil war in the DRC)increase in world demand
Zaire has problems in supply, quest for independency of the country causes negative expectations and ongoing political unrest
Political unrest in Zaire
worldwide recession
Decrease in Demand of Aviation Industry
Limited supply; high demand due to stocking from China
World Economic Crisis
Source: DERA, HWWI (2013) Ursachen von Preispeaks, -einbrüchen und –trends bei mineralischen Rohstoffen (Causes of price peaks, collapses and trends of mineral raw materials), Hamburg Institute of International Economics (HWWI) in contract for Deutsche Rohstoffagentur (DERA). April 2013., translated into English by Fraunhofer ISI
aDERA, HWWI (2013) Ursachen von Preispeaks, -einbrüchen und –trends bei mineralischen Rohstoffen. April 2013.

Feedstuffs, biotech,anodising, recording media, electrolysis 3%
Tyre adhesives, soaps, driers (paints/inks) 5%Hardfacing/HSS and other alloys
5%Magnets 7%
Batteries30%
Pigments9% Superalloys
19%
Catalysts9%
Hard materials*13%
Figure 40: Worldwide end-use of cobalt in 2011
3
ApplicationsAs depicted in Figure 40, in 2011 roughly a third of cobalt worldwide was used in batteries. Unfortunately no detailed European end-use data has been available and hence worldwide data has been used in the exercise. The increase in demand for portable electronic devices since the 1980s boosted the demand for high-capacity rechargeable batteries for which cobalt is used. The demand for cobalt over the next ten years is expected to increase due to the emerging use of cobalt in some rechargeable batteries for electric vehicle applications and biotech applications. Cobalt is also increasing used in the biotechnology sector, where it is essential for fermentation techniques which are the basis of bio-precursors of medicinal products and other fermentation products in industrial and healthcare biotechnology. It is estimated that around 100 tonnes is used for this purpose in the EU.
In 2011, 19% of cobalt was used in superalloys (historically the major end-use of cobalt). Cobalt is alloyed mostly with nickel but also with iron to provide superior thermal performance, corrosion and wear resistance in a wide range of alloys used in applications such as jet engines, turbines, space vehicles or chemical equipment.
Another 13% of cobalt worldwide enters hard metals where it is used as a powerful binder for manufacturing of carbide and diamond tools used in metal cutting, drilling, mining and construction. Typically the binder phase is 5- 30% by volume of the component. Furthermore, cobalt is widely used in the oil and gas sector. It is used in hydro-desulphurization (a catalytic chemical process widely used to remove sulphur from natural gas and from refined petroleum products such as gasoline or petrol), where the catalyst must be sulphur-resistant.a Cobalt catalysts also play an important role in bulk chemicalproduction of PTA (a monomeric precursor to polyester) and in a process called hydroformylation which generates aldehydes and alcohols used in the plastics and detergent markets.a In addition, it is also used in the catalysis of gas to liquid processes.b The application of this technology is expected to result in a major new demand for cobalt.c
Source: Cobalt Facts, CDI 2012; * Carbides and diamond tooling
1.5.4 Outlook
aCobalt Development Institute (2013) Catalysts. http://www.thecdi.com/general.php?r=12ENJWIVAD, Accessed 19th July 2013
bUmicore (2013) Catalysts Production & Recycling. http://csm.umicore.com/applications/catalysts/, Accessed 19th July 2013
c

4
Idaho Cobalt (2013) Cobalt Uses. http://www.idahocobalt.com/s/CobaltUses.asp . Accessed 19 July 2013

4
140
120
100
80
60
40
ChemicalsSuperalloys Magnets Carbides & Tools Steel alloysSupply
20
02011 2014 2016 2020
Figure 41: World cobalt supply and end-use forecasts to 2020 (‘000s tonnes)
The market forecast for world cobalt supply and demand is shown in Figure 41. Here the cobalt market has been assessed in 5 categories, with chemicals including uses such as batteries, catalysts, pigments; tyre adhesives, soaps and driers; feedstuffs, biotech, recording media, and electrolysis. This data shows a market that is currently experiencing a slight surplus, due to several expansions in mining capacity that have occurred in the last few years in the DRC and elsewhere around the world. Further expansions are expected to continue in the future. The distribution of refined cobalt production may also change somewhat going forward, as the DRC aims to move up the cobalt value chain by producing greater quantities of cobalt intermediates and refined metal, rather than just exporting cobalt concentrates.
Source: CRU data in CDI Newsletter (2012)

4
On the demand side, overall market growth is expected to be approximately 6% per year to 2020, with strong growth of all of cobalt’s end-markets. Particular growth is expected in the chemicals and superalloys segments of the market, which will be driven by growth in the batteries and aerospace markets. As for the steel alloys market, further strong growth is forecast for this market too. Overall the current market surplus for cobalt is expected to narrow a little towards 2020, although this assumes that not all of the many new of cobalt projects will be developed.
1.5.5 Resource efficiency and recycling
Cobalt is recycled for economic reasons (lower costs compared to cobalt extraction from ores) and for environmental reasons (to prevent damage caused by land filling of batteries). The feedstock for recycling can be divided into new scrap and old scrap: new scrap means all waste from the manufacture such as forging pieces and old scrap results from post-consumer collection. This can be for example old turbine blades (to be molten again) or collected rechargeable batteries. Collection of old scrap is harder as it is often mixed with other scrap containing no cobalt.a The United Nations Environmental Programme (UNEP) estimates an end-of-life recycling rate for cobalt of 68% which is higher than for most other metals. The recycled content is estimated at 32% (lower than most other metals).b From applications such as in pigments, glass, paint, etc. recycling is not possible, as these usages are dissipative.
Substitutes for cobalt are constantly being sought as the metal is rare and the price is volatile. However, as cobalt has unique properties (especially in high temperature usages), replacements often lead to performance losses. Due to the high price of cobalt compounds, considerable effort has been given to finding replacements for cobalt compounds in batteries. For this application a cobalt-manganese-nickel compound can reduce the amount of cobalt needed in the production.
Table 11: Substitutability scores for cobalt applications
Application Substitutability Score
Superalloys 0.7Metallic applications 0.7
Cemented carbides 0.7
Chemical applications 0.7
1.5.6 Specific Issues
Cobalt has been highlighted as a “conflict mineral” due to its extensive mined production in the DRC.
Five substances containing cobalt appear on the SVHC list; cobalt dichloride, cobalt(II) diacetate, cobalt(II) sulphate, cobalt(II) carbonate, and cobalt(II) dinitrate.
aCommodity Profiles: Cobalt, British Geological Survey, 2009
bRecycling Rates of Metals, United Nations Environment Programme, 2011

bCommodity Profiles: Coal, British Geological Survey,
4
Underground oropen-pit mining
Coalcrushing
Separationby size
Washery CokeManufacture
1.6 Coking coal
1.6.1 Introduction
Coal is a combustible, sedimentary, organic rock, which is composed mainly of carbon, hydrogen and oxygen. It is formed from vegetation, which has been consolidated between other rock strata and altered by the combined effects of pressure and heat over millions of years to form coal seams at different ranksa. The composition, rank and the amount of impurities (e.g. Sulphur and Phosphorous), the content of volatile matter and ash strongly condition the possible uses of the coal. For that reason different groups and sub-groups of coal are identified and each of them is used for specific purposes only. This ranking reaches from lignite with a lower calorific value (about 25 MJ/kg) to anthracite (more than 35 MJ/kg).b
The subject of the present criticality analysis is the coking coal – or metallurgical coal – which is derived from coal. Therefore it is considered a primary raw material, i.e. a material extracted in the country of origin and then processed on the EU territory. Almost 100% of coking coal imported into EU is used by the industry for the production of steel.
The preparation of coking coal involves comparatively few stages as illustrated in Figure 42. Coking coal is mined by underground or open-pit mining and also hybrid methods are used. Run-of-mine coal normally requires treatment before marketing in order to remove impurities such as waste rock. The processing depends on the quality of the coal and the intended use. Usually the coal is crushed,separated by size and subsequently treated in an oscillating column of water, in which the unwanted rock fragments sink faster than coal. This method is known as washery.b In the final stage, coking coal is converted to coke by driving off impurities to leave almost pure carbon: the coal softens, liquefies and then re-solidifies into hard but porous lumps: the coking process consists of heating coking coal to around 1000-1100ºC in the absence of oxygen to drive off the volatile compounds (pyrolysis).a
Figure 42: Supply chain map for coking coal
Note: No information on any steps taking place in Europe was available at the time of writing
Coking coal is used to make furnace coke or metallurgical coke (the two terms are equivalent, often simply named coke). Therefore rather than being a raw material, furnace coke but is an intermediate product to be charged in the blast furnace with the iron ore in order to produce pig iron. Coke is produced in coking ovens of the integrated steel production route using coking coal as input.
aWorld Coal Association, http://www.worldcoal.org/coal/ [accessed October 2013]

bGerman Coal Importer Association (Verein der Kohlenimporteure e.V.,
4
1.6.2 Supply
Primary sources and productionThe use of coking coal for metallurgical applications –i.e. steel production – require that certain physical and chemical properties are tested before in order to check the complete compatibility of the raw material with the production process (i.e. maceral composition and reactivity of constituents, CSR index – coke strength after reaction). Moreover, also the content on impurities like S and P, and not only, impose in which industrial processes coking coal can be used. For this reason the coking coal is subdivided in different products: Premium Hard Coking Coal (PHCC), Hard Coking Coal (HCC), High-Volatile HCC (Semi-HCC), semi- soft coking coal (SSCC), Low Vol PCI, each of them identified by different properties and performance when employed in the industrial processes.
In general, EU steel production should be fed using Premium HCC and HCC for maintaining high environmental performance of the installations (i.e. higher quality HCC means use of less raw materials andlower emissions). In particular, the manufacturing of coke in the European integrated steel process routes uses the most advanced technologies that works in compliance with European environmental laws using PHCC and HCC only; any large substitution of these high quality coking coals will surely increase the whole environmental impact.a
Supply detailsThe worldwide production of coal has been around 7.2 billion tonnes in 2012, of which just the 16% has been made available for trading. The seaborne coal traded in 2012 has been composed by steam coal (coal for power plants – 76%) and by metallurgical coal (coal for metal processing - 24%)b, as shown in Figure 43.
Figure 43: Import/export of coal (left) and traded volumes of steam/met. coal (right)
Source: German Coal Importer Association (Verein der Kohlenimporteure e.V., VDKi)
aEUROFER, personal communication.

4
UkraineCanada 2%
3%India 4%
EU4%
USA8%
China53%
Russia8%
Australia18%
Figure 44: Worldwide production of coking coal in 2010
Total world supply of coking coal is estimated at 892 million tonnes in 2010. As can be seen in Figure 44, China was the largest producer of coking coal, producing more than half of world production or as much as 455 million tonnes. However, China does not export coking coal. Other large producers of coking coal were Australia (152 million tonnes), Russia (72 million tonnes) and the USA (68.5 million tonnes). The total European production of coking coal only accounts for about 4% of world production, with Poland and the Czech Republic being the biggest producers within the EU. This compares with 12% of global crude steel production that occurred in the EU in 2010.a
Over recent years there was strong growth in the world production of coking coal, mainly driven by the production in China (from 280 million tonnes in 2005 to over 450 million tonnes in 2010) and the USA (from 45 million tonnes to 70 million tonnes). During this period the output of other large producers was constant or growing slowly.b
Source: World Mining Data 2012
EU trade flows and consumptionThe EU has historically been an importer of coking coal because demand from the steel industry has been higher than the availability of such deposits on European territory (Figure 45). With the exception of 2009, imports have remained relatively consistent at around 40 million tonnes. Exports are consistently below 2% of imports, generally at a few hundreds of tonnes. The majority of coking coal imported into the EU is from the USA, Australia, Canada and Russia (Figure 46). Exports are almost solely to Bosnia and Herzegovina and the Ukraine.
aWorld Steel Association, Monthly crude steel production 2010
bWorld Mining Data 2011, C. Reichl et al., 2011

60 000
40 000
EU Export20 000
EU Import0
2008 2009 2010 2011 2012Net
-20 000Export
-40 000
-60 000
Figure 45: Trends in EU trade for coking coal, 1000 tonnes
4
Source Eurostat-Comext Database, CN Code 27011210 Coking Coal, whether or not pulverised, non-agglomerated
Figure 46: EU trade for coking coal, 2012EU Imports of Coking Coal EU Exports of Coking Coal (3,796 Mt)
United States 41%
Other 8%
(365, 855 Mt) Canada5%
Russia9%
Australia 37%
Bosnia and
Herze- govina
84%
Other 1%
Ukraine 15%
Source Eurostat-Comext Database, CN Code 27011210 Coking Coal, whether or not pulverised, non-agglomerated
The EU’s share of the global coking coal market can be estimated by combining EU production and net imports. This produces an EU apparent consumption figure of nearly 70 million tonnes. This compares to World Mining Data estimates of 900 million tonnes of worldwide production of coking coal, giving the EU approximately an 8% of world coking coal consumption.
In terms of the worldwide picture, BHP Billiton estimates that two thirds of the world’s metallurgical coal is consumed within China, much of it being domestically produced. Other key countries for demand include the EU, the United States and Japan (ROW Developed), India, Brazil and South Korea (Figure 47).

India3%
Brazil2%
EU-277%
ROW Developing 10%
ROW Developed12%
China66%
Figure 47: Global Metallurgical Coal Geographical Demand, 2012 (%)
300
250
200
150
100
50
01996 1997 1998 1999 2000 2001 2002 2003 2004 2005 2006 2007 2008 2009 2010 2011 2012
4
Source: BHP Billiton Presentation (May 2013), Coal Overview;Note: EU-27 percentage calculated using EU apparent consumption figure of nearly 70 million tonnes
1.6.3 Demand
PricesHistorical prices for the downstream product metallurgical coke are shown in Figure 48, based on average quarterly export prices. These show that prices for this intermediate have risen sharply after 2003 after a period of stable prices. These changes in price follow the price changes seen for steel, linked to growing demand from emerging economies. In particular, the strong demand for steel from China due to large infrastructure projects supported and continues to support high prices for coking coal.Figure 48: Coking coal historical pricing (98 US$/tonne).
Source: http://www.steelonthenet.com/files/metallurgical-coal.html, Steelmaking input costs – historic price trends [accessed July 2013]. Figures are indexed to 1998 values.
Moreover, the pricing of coking coal is also influenced by the geographical concentration of the deposits of the main suppliers. The floods in the Australian mining region of Queensland in the beginning of 2009 and of 2011 had a worldwide impact on costs for coking coal (Figure 49 for 2011 event), especially for the high quality coking coal. In 2011, the price increased by 100 US$ from around 210 US$ to 310US$ within the month of January 2011.

Other metallurgy & niche markets10%
Steel production 90%
4
Figure 49: Premium HCC recent trend.
ApplicationsAs shown in Figure 50, use in steel production is the most common application of coking coal worldwide. No explicit European end-use data of coking coal has been available. Almost two thirds of world steel production is made in blast furnaces fired with coking coal previously processed in the coking plants to form coke. Other applications are in alumina refineries, paper manufacturing, and the chemical and pharmaceutical industries. Several chemical products such as ammonia salts, nitric acid and agriculture fertilisers can be produced from the by-products of coke ovens.
Figure 50: Worldwide end-use of coking coal in 2007
Source: Intertechpira
1.6.4 Future trends
The market outlook for world seaborne coking coal supply and demand is shown in Figure 51. Seaborne coking coal accounts for around one third of the total world market; however, this is the only segment of the market that is internationally traded (with the remaining two thirds consumed within the domestic

450
400
350
300
250
200DemandSupply
150
100
50
02011 2014 2017 2020
Figure 51: World seaborne coking coal supply and demand forecasts to 2020 (million tonnes)
4
market, e.g. within China, India and Brazil). Seaborne coking coal therefore best represents the international market for coking coal, with more reliable data available for analysis.
Sources: KPMG (March 2013), Metallurgical coal bulletin; and IHS, BHP Billiton and Anglo American Presentations (2013)
The overall picture suggests that there is currently a tight situation within the coking coal market, brought about by the large rises in demand that have taken place in the Chinese and Indian steel markets. This is expected to continue over the coming decade, with these two countries expected to increase their imports of coking coal by at least 7-8% per year to 2020. In contrast the EU share of market is expected to grow more slowly at 2.5% per year to 2020. The overall market growth will be close to 5% per year to 2020.
On the supply-side, increases in mining capacity are expected to narrow the market deficit over the coming years. These include significant expansions in the already dominant market player, Australia, as well as new entrants to the market such as Mozambique and Indonesia.
Uncertainty is mainly related to the quality of coking coal, extracted when mining projects will be finalized, and to the number of new mining projects that will be brought from the feasibility analysis into the operational conditions. Moreover, also the geological availability of coking coal can strongly alter the future supply conditions: quality and costs-benefits aspects may reduce the volumes of the coking coal qualities (e.g. HCC and Premium HCC) necessary for maintaining high environmental performance and market competitiveness of strategic industrial sectors. Not all the geological deposits actually under exploration or those to be discovered and characterized in the future will deliver high quality coking coal; in addition to that, the geographical location of the mines and the accessibility of the deposits can have a relevant influence on the final cost of the extracted raw material, making sometime the exploitation of these deposits unfeasible. The availability of high quality coking coal may be improved also due to new entrants in the market, Mozambique and Indonesia.
1.6.5 Resource efficiency and recycling
Coal, once burned, cannot be recycled. Currently there are no technologically feasible and economically reasonable alternatives to completely replace coking coal in the production of steel from iron ore. Coking

4
coal can be replaced by pulverized coal (PCI – Low Vol PCI) up to a certain grade, which then requires the remaining hard coking coal to be of higher quality, mainly Premium HCC, otherwise the performance of steel production process can be strongly lowered.a Nevertheless for some production processes natural gas can substitute for as much as 10% of the coking coal.b
Table 12: Substitutability scoring for Coking Coal used in the analysis - by sectorsApplication Substitutability
ScoreSteel production 0.7Other metallurgy 0.5
1.6.6 Specific issues
According to the OECD´s report on “Steelmaking Raw Materials”c, tariff rate have been applied to coking coal from China, Vietnam and Indonesia (respectively, 10%, 20% and 5%). Moreover, China applies also quantitave restrictions (export quotas and export licenses).
Coal ash is a potential source for rare earth elements, gallium and several other strategic materialsd.
aFording Canadian Coal Trust: http://annualreports.fording.ca/2007/discussion/nature-of-operations/the-steel-and-metallurgical-coal-industries.html,
accessed 11th September 2013b
Forbes: http://www.forbes.com/sites/greatspeculations/2012/03/21/u-s-steel-looks-to-natural-gas-to-offset-high-input-costs/, accessed 11th September2013c
OECD: Steelmaking Raw Materials : Market and Policy Developments, DSTI/SU/SC(2012)1/FINAL, 11th October 2012.d
See for instance Mayfield and Lewis (2013) Environmental Review of Coal Ash as a Resource for Rare Earth and Strategic Elements.

5
http://www.flyash.info/2013/051-Mayfield-2013.pdf

5
1.7 Fluorspar (Fluorite)
1.7.1 Introduction
Fluorspar is the commercial name for the mineral fluorite (calcium fluoride, CaF2), which commonly develops well-formed cubic crystals exhibiting a wide range of colours. More than a half of worldwide fluorspar consumption is used to produce hydrofluoric acid, used in pharmaceutical and agrichemical industries. The bulk of remaining fluorspar consumption is due to its low melting point, used as flux in aluminium, steel and ceramics production processes.a
1.7.2 Supply
Primary sources, production and refiningAccording to purity and contamination with other kinds of mineral content, fluorspar is categorized into: acid grade (acidspar): minimum 97% CaF2, up to 1.5% CaCO3, 1.0% SiO2, 0.03-0.1% S, 10-12 ppm As
and 100-150 ppm Pb metallurgical grade (metspar): minimum 80% CaF2, up to 15% SiO2, 0.3% S and 0.5% Pb ceramic grade: 80-96% CaF2, up to 3% SiO2.b
Supply detailsFluorspar reserves are estimated at 240,000,000 tonnes (Table 13). However, data for several producing countries such as Russia, USA and Morocco are not available indicating that this data is not complete.
Table 13: Reserves figures for fluorspar, in thousands of tonnes of calcium fluorideCountry Reserves ,000 t
In 1000 t PercentageBrazil 1,000 0.4%
China 24,000 10%Kenya 2,000 0.8%Mexico 32,000 13%Mongolia 22,000 9.2%Namibia 3,000 1.3%South Africa 41,000 17%Spain 6,000 2.5%Total 240,000 -
Source: USGS MCS 2013
In 2010 the global market for fluorspar was 5.9 million tonnes. In spite of the widespread distribution of resources China is the dominant supplier (Figure 52).c A few other major suppliers are involved in this market however there are many smaller suppliers, several contributing less than 1%. EU supply is found in three countries, accounting for around 3% of world supply.
aEuropean Mineral Statistics 2007-2011, British Geological Survey, 2013
bCommodity Profiles: Fluorspar, British Geological Survey, February 2011
cCommodity Profiles: Fluorspar, British Geological Survey, February 2011

5
Mining ofmineral ores
Pre-concentration
Concentration Flotation End-use
Figure 52: Worldwide production of fluorspar in 2010
Mexico 18%
Mongolia 7%
Russia 4%
South Africa 3%
Namibia2%
Morocco 2%
Other5%
Germany 1%
UK 0.5%
EU 3%
China 56% Spain
2%
Source: World Mining Data 2012
Supply chainFluorspar is generally associated with other minerals, such as quartz, barite, calcite and many others. Before concentrating the CaF2 content to a marketable level by the gravity concentration process, the crushed ore is pre-concentrated in a cone separator. An aqueous suspension of finely ground ferrosilicon is used as separation medium to make use of density differences. The ore is introduced at the top of the cone, where the light particles are skimmed. Heavier particles, rich in fluorspar, drop to the bottom, where they are recovered. Such pre-concentration results in a product containing 40% CaF2 obtained from 20% ore, which constitutes the minimum of economically workable deposits. Finally, flotation provides the different commercial grades of fluorspar.a The overall progression of fluorspar beneficiation is illustrated in Figure 53. Unfortunately, there has been no detailed data available on the involvement of European firms in the different supply steps.
Figure 53: Supply chain map for fluorspar
EU trade flows and consumptionThe EU is a consistently a net importer of acid grade fluorspar (Figure 54), importing 8-15 times the weight in exports. This pattern is matched for both grades for which data are available. 2012 data indicate that about half of fluorspar imported from the EU comes from Mexico, the world’s second largest producer (Figure 55). The remainder is evenly split between four other countries. Morocco and Turkey dominate the export market; Croatia was also an important market before it joined the EU in 2013. This data does not include downstream substances and products derived from fluorspar, and only accounts for the industrial mineral.
aUllmann’s Encyclopedia of Industrial Chemistry: Fluorine Compounds, Inorganic, Wiley-VCH Verlag GmbH & Co. KGaA, 2000

1 000 000
800 000
600 000
400 000EU Export
200 000
0
EU ImportNet Export
20082009201020112012-200 000
-400 000
-600 000
-800 000
Figure 54: EU trade of fluorspar (tonnes)
EU Exports of Fluorspar containing by weight<= 97% and >=97% Calcium Fluoride (84,477 t)
OtherMorocco6%35%
South Africa 5%Egypt 9%
TurkeyCroatia29%
16%
EU Imports of Fluorspar containing by weight<= 97% and >=97% Calcium Fluoride
(644,787 t)MongoliaOther
2%1%Mexico48%
Morocco2%
Kenya 11%
Namibia11%China
13%South Africa 12%
Figure 55: Major EU trading partners for acid grade fluorspar, 2012
5
Eurostat-Comext Database, CN Codes 25292100 Fluorspar containing by weight >97% calcium fluoride and 25292200 Fluorspar containing by weight <=97% Calcium Fluoride
Eurostat-Comext Database, CN Codes 25292100 Fluorspar containing by weight >97% calcium fluoride and 25292200 Fluorspar containing by weight <=97% Calcium Fluoride
Europe’s share of worldwide fluorspar consumption is estimated at 879,000 tonnes or 14% of worldwide fluorspar consumption (Figure 56). This estimate is very similar to that which can be calculated for apparent fluorspar consumption using production and trade statistics. Roskill estimate that China is the world’s largest consumer of fluorspar, with nearly half of worldwide consumption. Other key consumers of the world’s fluorspar include North America, Other Asia and Eurasia (Figure 56).

Eurasia9%
Africa3%
Other Asia 9%
North America15%
South America 1%
W Europe 14%
China49%
Figure 56: World Fluorspar Consumption by Geographic Region, 2011 (%)
5
Source: Roskill (2013), Fluorspar: Global Industry Markets and Outlook; 11th edition
1.7.3 Demand
Prices and marketsFigure 57 shows how the different supply and demand situations worldwide influenced fluorspar prices during the last century.
Figure 57: Development of real fluorspar prices (Prices are deflated, 2011 = 100).lifting of price controls, world demand at
$/mt
600
record peak decline in world supply
500
400
300
200
100
technical innovations improving exploitation of fluorspar
decrease in demand due to weakend steel
increased freight costs, higher Chineses demand
world economic crisis
industry; destockinghigh supply after
lifting of China'sexport quotas
0
Source: DERA, HWWI (2013) Ursachen von Preispeaks, -einbrüchen und –trends bei mineralischen Rohstoffen (Causes of price peaks, collapses and trends of mineral raw materials), Hamburg Institute of International Economics (HWWI) in contract for Deutsche Rohstoffagentur (DERA). April 2013., trend line and translation to English by Fraunhofer ISI
As summarized by the linear trend line, apart from two high price periods, real fluorspar prices had been declining until early 2000s. After it lifted its export quotas by the end of 1997, China exported large

Other 5%Steel 25%
Hydrofluoric acid 52%
Aluminium 18%
Figure 58: Worldwide end-use of fluorspar in 2010
5
amounts of fluorspar in the following years.a Between 2007 and 2009, increased freight costs and decreasing supply from China caused prices to increase. In 2006 China implemented a 10% export tax which was increased to 15% in 2007. Export quotas implemented in 2010 reinforced the price increase.a
ApplicationsWorldwide main end-use markets of fluorspar are (Figure 58) described belowb,c,d; no information regarding the use of fluorspar within the European Union was available at the time of writing. Chemicals: Acid grade fluorspar is used for the production of hydrofluoric acid, which is the basis for
all fluorine-bearing compounds, including important pharmaceuticals and agrochemicals such as refrigerants, non-stick coatings, medical propellants and anaesthetics. Small amounts of hydrofluoric acid are also used in petroleum alkylation, stainless steel pickling, the manufacture of electronics and uranium processing.
Steel: Metallurgical grade fluorspar is added as flux in the manufacture of steel in open hearth oxygen and electric arc furnaces. Fluorspar lowers the melting point and reduces slag viscosity.
Aluminium: Because aluminum cannot be produced by an aqueous electrolytic process, liquid aluminum is produced by the electrolytic reduction of alumina (Al2O3) dissolved in an electrolyte (bath) containing approximately 65% cryolite (NaF3 3∙ NaF; about 2 kg of cryolite are necessary to produce 1 tonne of aluminum). Synthetic cryolite is made from fluorspar. Besides serving as a solvent, cryolite lowers the melting point of the aluminium electrolysis bath to below 1,000°C.
Other: In glass and ceramic industries, ceramic grade fluorspar is used to produce opal glass and opaque enamels. Further applications are in the manufacture of magnesium, calcium metal, welding rod coatings and high quality optics such as camera and telescope lenses. During the past decade, new uses in the form of fluoropolymers (e.g. PTFE resin or Teflon) have emerged. Fluoropolymers stand out due to their thermal stability, high chemical inertness, strong electrical insulation and very low coefficient of friction.
Source: Critical Raw Materials for the EU 2010
aDERA, HWWI (2013) Ursachen von Preispeaks, -einbrüchen und –trends bei mineralischen Rohstoffen. April 2013.
bMineral Commodity Summaries: Fluorspar, US Geological Survey, 2013
cCommodity Profiles: Fluorspar, British Geological Survey, 2011
dUllmann’s Encyclopedia of Industrial Chemistry: Fluorine Compounds, Inorganic, Wiley-VCH Verlag GmbH & Co. KGaA, 2000

9 000
8 000
7 000
6 000
5 000
4 000
3 000
Other metsparSteel metspar Other acidspar Aluminium FluorochemicalsSupply
2 000
1 000
-2012 2014 2017 2020
Figure 59: World fluorspar supply and end-use forecasts to 2020 (‘000s tonnes)
5
1.7.4 Outlook
The outlook forecast for fluorspar is shown in Figure 59. This shows world demand increasing at 2.3% per year to 2020. The larger increases in demand are expected within the fluorochemicals and aluminium segments of the acid grade fluorspar market, with a slower increase expected for the steel metallurgical grade fluorspar market.
As for supply, expansions in world capacity mean that world production is expected to keep pace with and even exceed the forecast increases in demand. From a current position of market balance, a small surplus, of around 10%, is expected to open up by the middle of the coming decade. The largest increases in world production are predicted to take place in North America, whereas China’s share of the world fluorspar market is expected to fall below 50% by 2015.
Source: Roskill Information Services for 2013 CRM study
1.7.5 Resource efficiency and recycling
As fluorspar is mainly used in dispersive applications, recycling of the mineral raw material is impossible.a
However, producers in the USA recycle a few thousand tonnes of synthetic fluorspar per year, primarily from uranium enrichment, but also from petroleum alkylation process and stainless steel pickling. Hydrofluoric acid and fluorides are recycled from smelting operations by primary aluminium producers.b
Fluorspar fluxes in aluminium and steelmaking process can be substituted by aluminium smelting dross, borax, calcium chloride, iron oxides, manganese ore, silica sand and titanium dioxide.c However, fluorosilicic acid, a by-product of the production of phosphoric acid for fertiliser manufacture, is the only substitute which could have a significant impact on global fluorspar extraction. Fluorosilicic acid is widely used as a source of fluorine in the manufacture of aluminium fluoride and also for the fluoridation of drinking water.d
aCommodity Profiles: Fluorspar, British Geological Survey, 2011
bMineral Commodity Summaries: Fluorspar, US Geological Survey, 2013
cMineral Commodity Summaries: Fluorspar, US Geological Survey, 2013
d

5
Fluorspar’s future prospects, G. Clarke, Industrial Minerals magazine p. 38-45, February 2009

5
Table 14: Substitutability scoring for Fluorspar used in the analysis - by sectors
1.7.6 Specific issues
Seven fluorine containing substances appear on the EU’s SVHC list: ammonium pentadecafluoro- octanoate (APFO), pentadecafluoro-octanoic acid (PFOA), henicosafluoro-undecanoic acid, lead bis(tetrafluoroborate), heptacosafluoro-tetradecanoic acid, tricosafluoro-dodecanoic acid, and pentacosafluoro-tridecanoic acid. These are downstream products which are derived from fluorspar.
Application/Sector Substitutability score
Hydrofluoric acid 1
Aluminium 1Steel 0.3

Mine basemetals (bauxite)
Extractgallium as by-product
Purify &refine
SynthesiseGaAs & GaN compounds
Manufacturesemi- conductors
Manufactureand useIC, LED & PV
End of life
Recovery
5
1.8 Gallium
1.8.1 Introduction
Gallium (Ga, atomic number 31) is a soft, silvery-white group 13 metal. It has a low melting point (30°C) but has the largest liquid range compared to any other element.a Gallium forms compounds with group 15 elements, such as gallium arsenide (GaAs) and gallium nitride (GaN), which display semiconductor properties and are mainly employed in light emitting diodes (LEDs), integrated circuits (ICs) and solar cells.
A supply chain map for gallium’s use in semiconductor materials is shown in Figure 60. Primary production for gallium is intrinsically linked to recovery as a by-product, principally during the transformation of bauxite, the aluminium ore and prime source of gallium as a minor by-product, into alumina . Reserves and resources for bauxite are relatively plentiful. Industry estimates suggest that currently only 10% of alumina producers extract gallium.b This is considered to be the major bottleneck in world gallium supply, although further concerns may arise because of the relatively small number of high-purity gallium refiners.
Figure 60: Supply chain map for gallium in semiconductors
Note: Orange colour represents stages of the supply chain which take place in Europe.
After purification, gallium is synthesised mainly with arsenic or nitrogen to produce gallium arsenide (GaAs) and gallium nitride (GaN) compounds which in turn are used as base materials in advanced semiconductors. The former is used for the production of high-performance processors and WIFI chips and the latter for the production of LEDs. Recovery of gallium from semiconductor scrap represents a significant source of additional supply. At present, no recycling of gallium from post-consumer products is known to take place.
1.8.2 Supply
Primary sources, by-production and refiningGallium is a rather abundant trace element: it is present in the Earth’s crust at 18 ppm.c It is not found in its elemental form in the Earth’s crust and occurs mainly as a trace element in minerals with other metals and does not form any economically recoverable concentrations; for this reason it is considered quite rare. Given the low concentration of gallium in metal ores, it is not economically viable to extract these minerals solely to recover the contained gallium.Gallium is principally recovered as a by-product during extraction of aluminium from its ore (bauxite), where it is present at 30-80 g/t (0.003-0.008%).d During the production of alumina, around 70% of the gallium present in bauxite is leached into the Bayer liquid and can be subsequently extracted in plants with such capability.e It is estimated that 90% of gallium is obtained from alumina; the remaining amount is produced from zinc processing.e Given the low concentrations of gallium in bauxite, this can only contribute to a small portion of revenue to alumina refineries. It is estimated that only 10% of these
a Greber (2000), Gallium and Gallium Compounds; Ullmann's Encyclopedia of Industrial Chemistryb
Indium Corporation (2010), Indium, Gallium & Germanium. Supply & Price Outlookc
Emsley (2011), Nature’s Building Blocks: An A-Z guide of the elementsd
Greber (2000), Gallium and Gallium Compounds. Ullmann's Encyclopedia of Industrial Chemistrye

5
Zhao et al. (2012), Recovery of gallium from Bayer liquor: A review. Hydrometallurgy 125–126 (2012) 115–124

6
refineries are extracting gallium; hence there are significant opportunities to expand production should demand and price increase.a
A number of estimates exist for gallium reserves and resources. The USGS estimates that worldwide resources of gallium contained within bauxite exceed 1 million tonnes, and considerable amounts are also thought to be present in zinc ores. As for gallium resources, the Indium Corporation estimates these to be 760,000 tonnes worldwide.b Based on data from the USGS, indicative European resources are estimated to be 21,400 tonnes (Table 15), though these may be overestimates; for example, other figures for Hungary indicate that it has 127 million tonnes of bauxite reserves rather than 300 million tonnes.c
Table 15: Estimated European gallium geological potential estimated using identified bauxite deposits
Country European bauxite reserves
(‘000s tonnes)
Estimated European gallium geological potential (tonnes)
Greece 600,000 12,000
Hungary 300,000 6,000
Turkey 80,000 1,600
Romania 50,000 1,000
France 30,000 600
Italy 5,000 100
Spain 5,000 100
Total 1,070,000 21,400
Source: European Commission JRC IET (2011), Critical Metals in Strategic Energy TechnologiesGallium reserves estimated as 0.002% of bauxite reserves (NB Bauxite figures in kt)
In addition to uncertainty over resource figures, gallium occurs in very low concentrations in ores, so only part of the gallium will be recovered. Extraction will therefore focus on where gallium concentration is highest and most economically recoverable. Furthermore, much of the bauxite is in reserves which will not be mined for many decades; therefore the gallium present will not be available in the short term.
Other sources of gallium are phosphate ores and various kinds of coal; these are thought to be the largest resources of gallium. The gallium concentration in these sources is between 0.01% and 0.1% by weight, and it is uneconomic to treat these materials solely for the extraction of gallium.d Gallium may be obtained from the flue dust resulting from phosphorous production and from the fly ash of coal.
Supply detailsThe world’s major producer of primary gallium, with nearly 70% of the global primary production capacity, is China. As can be seen in Table 16, Germany is the major primary producer in Europe with an estimated capacity of 40 tonnes in 2011. Hungary is the second largest European producer with a capacity of 8 tonnes in 2011; however, actual supply is estimated at 4-5 tonnes.c Over the past 15 years the balance of key producing countries has radically changed; Australia, Japan and Russia used to be
aIndium Corporation (2010), Indium, Gallium & Germanium. Supply & Price Outlook
bIndium Corporation (2011), Sustainability of Indium and Gallium In the Face of Emerging Markets.
cPersonal Communication, Hungarian Office for Mining and Geology

6
major producers in addition to Germany and China, but in that time production in China has expanded dramatically, particularly in 2011 and 2012.Worldwide primary production capacity was 404 tonnes in 2011 and is believed to have increased to 474 tonnes in 2012. Worldwide primary production for 2012 was estimated to be 273 tonnes, a drop of 7% compared to 2011.a European primary production is around 29-34 tonnes per year and therefore represents approximately 11.5% of global production in 2012.b Worldwide consumption in 2011 was estimated to be 218 tonnes.c
Table 16: Estimated world annual primary gallium production capacity, 2011
Source: USGS (2013), Minerals Yearbook 2011, Gallium*Actual supply from Hungary is estimated at 4–5 tonnes by the Hungarian Office for Mining and Geology
Primary gallium quality is generally 4N (99.99% purity); however, quality up to 7N and 9N is required for use in optoelectronics and ICs. China, Japan, the UK and the US are the principal producers of refined gallium. Global refining capacity was estimated at 270 tonnes in 2012; however, it is estimated that 354 tonnes of gallium were refined in the same year.d The difference in these figures is due to some recycling of high purity scrap which is included in refined production data.
Reliable figures for recycled gallium production are not available; however, it is estimated that 50% of the worldwide supply of refined gallium came from recycled new scrap (post-industrial waste).d Gallium is recycled from new scrap in Canada, Germany, Japan, the UK and the US, and total estimated recycling capacity is 198 tonnes.d
EU trade flows and consumptionOverall, the EU is a net exporter of gallium, exporting around 10 tonnes a year of unwrought gallium and gallium powders (Figure 61).e A recent exception to this was in 2010 when the EU imported 22 tonnes net.
The major destination for the EU’s exports of gallium in 2012 was the USA, which imported 31 tonnes of gallium from the EU, although 15 tonnes were subsequently re-imported back into the EU. Analysis of the value and price per kg of the trade flow suggests that crude gallium is exported from the EU to high purity refining such as in the USA. In 2012 the EU imported 12 tonnes of gallium from China, as well as exporting 3 tonnes during the same year. In addition this data does not include downstream substances and products containing gallium, such as gallium arsenide, therefore data should be used with caution.
aUSGS (2013), Mineral Commodity Summaries 2013, Gallium
bEuropean Commission JRC IET (2011), Critical Metals in Strategic Energy Technologies.
cUSGS (2013), Minerals Yearbook 2011, Gallium
dIndium Corporation (2010), Indium, Gallium & Germanium. Supply & Price Outlook; USGS (2013), Minerals Yearbook 2011, Gallium
CountryPrimary production capacity, 2011Tonnes %
China 280 69%Germany 40 10%
Kazakhstan 25 6%South Korea 16 4%Ukraine 15 4%Japan 10 2%Russia 10 2%Hungary* 8 2%World total 404 —

6
eGallium is also included in some other trade categories along with other metals such as thallium, vanadium, niobium, indium, germanium and rhenium

6
120100806040200
-20-40
ExportsImports Net exports
2008 2009 2010 2011 2012
Figure 61: Trends in extra-EU trade for unwrought gallium and gallium powders (tonnes)
Source: Eurostat-Comext Database CN 8112 9289 [accessed July 2013]
Significant intra-EU trade also takes place, notably between the UK, Germany and Slovakia which are all producers of crude or refined gallium. This internal and external trade is likely linked to the world-class manufacturers of GaAs and GaN located within the EU.

6
Figure 62: EU’s major trading partners for gallium, 2012
EU exports of Unwrought and Powdered Gallium (40.7 tonnes)
Switzer- land 11%
United States 77%
China 8%
Japan 4%
EU imports of Unwrought and Powdered Gallium (30.4) tonnes
Ukraine 4%
HongKong 8%
United States 49%
China 39%
Source: Eurostat-Comext Database CN 8112 9289 [accessed July 2013]
Due to relative lack of good quality data, it is quite challenging to produce robust estimates for the EU’s shares of world gallium consumption. However, by triangulating several data sources an approximate estimate can be produced. Actual primary gallium production from the EU is estimated at 29-34 tonnes,a
as opposed to the 48 tonnes listed for EU capacity by the USGS.
Given that the EU is, on average, a net exporter of gallium to the tune of 2 tonnes per year, this puts EU apparent gallium consumption at approximately 30 tonnes per year. This compares to world primary gallium production of 284 tonnes, meaning that the EU’s share of world gallium consumption is therefore estimated at around 11% of world primary gallium production.OutlookMuch of the expansion in world gallium primary production capacity over the past few years has taken place in China, with Chinese capacity more than quadrupling between 2009 and 2011. It is expected that there will be greater utilisation of excess capacity, as well as further capacity expansions in China, in
aEuropean Commission JRC-IET (2011), Critical Metals in Strategic Energy Technologies; Oakdene Hollins and HCSS

4 000 000
3 500 000
3 000 000
2 500 000
2 000 000
1 500 000
1 000 000
500 000
01970 1980 1990 2000 2010
Figure 63: Gallium historical price volatility (98 US$/tonne)
6
order to meet expanding world demand.a Production expansions in China are thought to be the most likely to take place in the future.
There are two projects in Canada. Rio Tinto Alcan and 5N Plus have been collaborating on the development of a new primary source of gallium. It is thought that the process might involve 5N Plus operating a facility to recover gallium adjacent to Rio Tinto’s Vaudreuil alumina facility in Quebec.b
Meanwhile, Orbite Aluminae has announced it will open a facility to recover gallium in the Gaspé region in Quebec, close to an aluminous clay deposit.c
New deposits and mines containing gallium are also currently being developed and explored. For example, South American Silver Corp. has been performing exploratory drilling at Malku Khota.d
However, it is not known whether such projects will become feasible.
1.8.3 Demand and economic importance
Prices and marketsGallium prices decreased significantly between the 1970s and the 1990s. Following this reduction, prices have been relatively stable. Gallium prices increased significantly in 2010 and in the first half of 2011. This is due to the exceptional demand for gallium nitride LEDs in mobile display and backlighting applications. In the third quarter of 2011 and through 2012, gallium prices decreased significantly because the increasing production of gallium exceeded the declining demand from LED producers. Historical gallium prices can be seen in Figure 63.
Source: USGS (2013- ), Historical Statistics for Mineral and Material Commodities in the United States [accessed February 2013]. Figures are indexed to 1998 values.
ApplicationsThe major applications of gallium make use of the metal as a compound with group 15 elements. Gallium arsenide (GaAs) and gallium nitride (GaN) are the most important compounds of gallium: they display
aRoskill (2011), Gallium: Global Industry Markets and Outlook, 8th Edition
b5N Plus (2011), 5N Plus and Rio Tinto Alcan in Discussions Regarding Development of New Primary Gallium Source
cSecor (2012), Orbite: A Strategic Gallium Producer. http://www.orbitealuminae.com/media/upload/filings/Gallium_Version_1_1.pdf [Accessed Feb 2013]
d
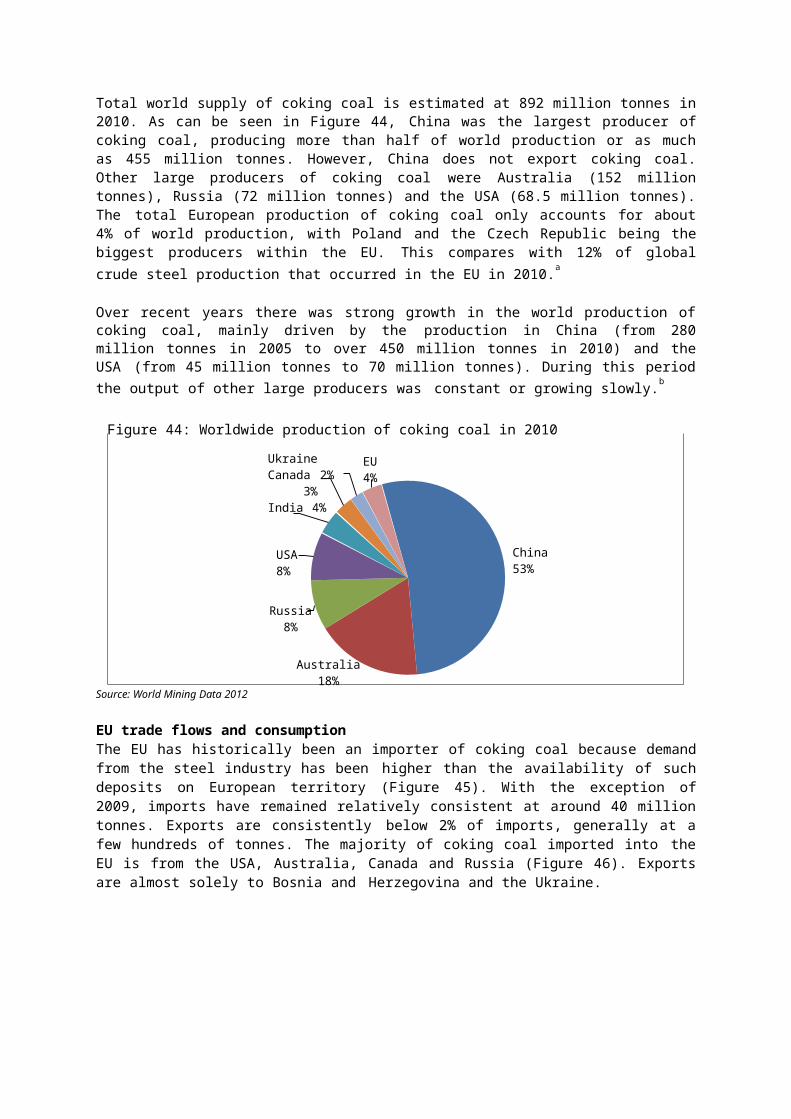
6
Semiconductor Today (2010), New demand puts tension into gallium/indium supply

Alloys, Batteries and Magnets 17%Integrated Circuits 41%Solar 17%
LED 25%
6
semiconductor properties and are mainly employed in LEDs, ICs and solar cells. Other uses of gallium are in medical equipment such as medical imaging, low-melting point alloys in fuses for electrical devices, and dental fillings. Several European companies play an important role in the production of GaAs and GaN wafers, however information about the breakdown of the gallium European market by application was not available at the time of writing, therefore global data is used (Figure 64).
Figure 64: Uses of virgin gallium
Source: Indium Corporation (2010), Indium, Gallium & Germanium. Supply & Price Outlook
Integrated circuits (ICs): These constitute the largest use of gallium in the market. The strong growth of third and fourth generation smartphones, which employ ten times the amount of GaAs, has led to a rapid increase in the use of gallium and ICs. Other applications are in wireless communications, aerospace and defence.
Light emitting diodes (LEDs): LEDs use both GaAs and GaN; however, the latter remains dominant. This technology has experienced a rapid growth due to increasing demand for (LCD) computer monitors, LEDs in mobile phones and LED-based back-lit televisions as it allows for lighter devices with better energy efficiency and higher performance. In 2012, there was only a 1.5% increase in revenues experienced due to a slower-than-expected growth in LED demand. At the same time LED supply became higher than demand, causing prices to decrease and thus generating lower revenue. Although the use of LED-lit TVs has increased, improvements in technology mean that the quantity of LEDs required for a display have halved. It is expected that by 2014 the main uses of LED technology will be in general lighting, signs and automotive applications.a
Laser diodes: GaN semiconductors are used in several applications in domestic, commercial and industrial sectors, including medical technology, research, telecommunications and entertainment. For example, these are used for the blue-violet lasers used in Blu-ray DVD readers. This technology owes its success to its high energy efficiency and reliability.
Photovoltaics (Solar): PV cells used in solar panels are mainly silicon-based semiconductors. An alternative to this are thin film technologies, including copper indium gallium (di)selenide (CIGS). Although these are less efficient than silicon-based cells, they have the advantage of being lightweight, flexible and durable and can be integrated directly into building materials. However, CIGS cells have been slow at entering the commercial market, and silicon-based cells still account for approximately 90% of the market. The main reason for this is thought to be the low price of silicon-based solar cells and a complicated manufacturing process for CIGS solar cells, impeding mass production. Due to these two factors, there was a large oversupply of these kinds of CIGS cells in 2011, resulting in a price drop of 20%. In 2011, it has been reported that CIGS
aUSGS (2013), Mineral Commodity Summaries 2013, Gallium

800
700
600
500
400
300
LEDsSolar PVSemiconductor Supply
200
100
02012 2014 2016 2020
Figure 65: World refined gallium supply and end-use forecasts to 2020 (tonnes)
6
manufacturers have reduced production cost, increased production capacities, improved efficiency and have increased CIGS adoption on commercial rooftops.a
OutlookThe outlook forecast for world gallium supply and demand is shown in Figure 65. However, the world gallium market is not the easiest market to analyse, because of the high growth rates forecast for demand and supply, limited data available on actual production (rather than capacity) and the mix of supply from both primary and recycled sources. The data here is shown for refined gallium production, which includes both sources of market supply. Primary production is estimated to account for around 70% of world gallium production.
Global demand growth for gallium is expected to be strong at around 8% per year to 2020, up to around 650 tonnes. This is higher than the total demand for 2030 forecast previously by Fraunhofer ISI.b The most rapid growth is anticipated for the LED and solar PV segments of the gallium market, which could grow at 13% and 22% per year to 2020; albeit from a relatively small base. For the larger market of semiconductors, slightly more moderate growth of 5% per year is forecast. This strong demand growth may take the market into deficit in the middle of the coming decade.
On the supply-side, production of gallium is price-sensitive and potentially more by-product gallium can be supplied from alumina refineries with appropriate investment should the price rise. There is no shortage of gallium within the waste streams of these alumina refineries, although there is currently a large amount of overcapacity in gallium markets. China’s share of primary gallium is approximately 70% of world production; this is expected to increase further, as the most probable expansions are still anticipated to take place within China, as the economics of gallium recovery are less attractive to potential Russian and other western producers.
Source: Roskill Information Services for 2013 CRM study
aLux Research Inc. (2012), CIGS Solar Market to Nearly Double to $2.35 Billion and 2.3 Gigawatts in 2015. CIGS Solar Market to Nearly Double to $2.35 Billion
and 2.3 Gigawatts in 2015 [Accessed February 2013]b
Fraunhofer ISI (2009), Rohstoffe für Zukunftstechnologien Einfluss des branchenspezifischen Rohstoffbedarfs in rohstoffintensiven Zukunftstechnologien aufdie zukünftige Rohstoffnachfrage

6
1.8.4 Resource efficiency and recycling
As previously mentioned, the major use for gallium is in semiconductors; this requires the gallium to be refined in order to achieve high quality materials. The refining process only uses a low percentage of the gallium input; however, this is recycled and re-introduced in the process. Recycling capacity for gallium new scrap in 2012 was 198 tonnes, with plants in Canada, Germany, Japan, the UK, and the USA.a It is thought that recycling of internal scrap has reached an efficiency of 90% due to the advances in processing techniques. Higher efficiency has also been achieved for LED processing.
Pre-consumer waste of CIGS is also recycled. Umicore in Belgium recovers metals from high grade solar production scrap from CIGS thin film solar cells; this method is economically viable due to the high concentration of metals present in the waste feed. Post-consumer concentrations of gallium in CIGS solar panels are too low, thus large scale processing would not be economically viable. Additionally, post- consumer waste arisings are currently almost non-existent given that these products have only recently been introduced onto the market.b Due to the similarities in the materials and composition of thin film solar cells and LCD flat screen, recyclers are examining the possibility of joining the recycling process for these two products. This combined approach could make the process viable in the short term
No post-consumer (secondary) recycling of gallium scrap is known to take place, with UNEP estimating that less than 1% end-of-life gallium is recycled.c The gallium content in semiconductors is highly dispersed due to their use in printed circuit boards (PCBs), making collection of sufficient quantities for recycling difficult. Separation methods for the recovery of metals from PCBs are available; however, many elements contained in the PCBs, including gallium, are disposed of as slag.d
The potential to substitute for gallium in various applications is shown in Table 17. Due to its unique properties, GaAs in integrated circuit boards used in defence-related applications cannot be substituted.
Table 17: Available substitutes for gallium applications
1.8.5 Specific issues
From the OECD’s inventory of restrictions on exports of raw material it can be seen that several countries have export restrictions on gallium. Most importantly, China uses a mix of export taxes (5%) and export quotas; licensing for export is also required. Russia applies a 6.5% export tax. In both cases this includes
aUSGS (2013), Mineral Commodity Summaries 2013, Gallium
bHagelüken & Meskers (2009), Technology Challenges to Recover Precious and Special Metals from Complex Products.
cBuchert et al (2009), Critical Metals for Future Sustainable Technologies and Their Recycling Potential. UNEP
d
LEDs Organic-based liquid crystals: currently competing
Organic based LEDs: research stages
0.3
Infrared laser diodes Indium phosphide laser diode: currently competing 0.3
Visible laser diode Helium-neon lasers: currently competing 0.3
Solar cells Silicon solar cells and CdTe: currently competing 0.3
Bipolar transistors Silicon-germanium transistors: currently competing 0.3

6
Umicore (2007), Electronic Scrap Recycling at Umicore

6
waste, scrap, powder and unwrought material.a Meanwhile China, Japan and the Republic of Korea are known to be stockpiling gallium.b
aOECD (n.d.), Inventory of Restrictions on Exports of Raw Materials. http://qdd.oecd.org/Subject.aspx?subject=1189A691-9375-461C-89BC-48362D375AD5.
[Accessed February 2013]b
RPA (2012), Stockpiling of Non-energy Raw Materials

Mine zinc andcoal
Extractgermanium as by-product Purify & refine
Depositgermanium dioxide on glass
Manufactureand use of fibre optics End of life
Tailingsrecovery
Reclaim fibreoptics
6
1.9 Germanium
1.9.1 Introduction
Germanium (Ge, atomic number 32) is a group 14 semi-metal. It is a grey-white, hard, lustrous, crystalline and brittle and resembles a metal. However, it also displays non-metal characteristics, such as semiconductivity. Until the early 1970s, its major use was in solid-state electronics; however, it was replaced over the years with cheaper silicon.a Today, its principal applications are as a polymerisation catalyst plastic, in fibre optics, in infrared night-vision devices, and as a semiconductor and substrate in electronic circuitry and solar cells.
A supply chain map for germanium’s use in fibre optics is shown in Figure 66. Primary production for germanium is intrinsically linked to recovery as a by-product, principally of zinc refining. Some germanium is also recovered from coal fly ash. Only 12% of germanium mined outside of China and Russia is refined; this is considered to be a major bottleneck in world germanium supply.b Around 30% of germanium production is accounted for by recycling of new scraps and tailings.c
Figure 66: Supply chain map for germanium in fibre optics
Note: Orange colour represents stages of the supply chain which take place in Europe
Germanium used in fibre optics is used in the form of germanium tetrachloride; this is converted to germanium dioxide and used as a dopant within the core of optical fibres. The high price of refined germanium encourages recycling: new scrap generated during the manufacture of fibre optics is recycled by being fed back into the manufacturing process. Recycling of old scrap has also increased over the past decade.c
1.9.2 Supply and demand statistics
Primary sources, by-production and refiningThe abundance of germanium in the Earth’s crust averages 2 ppm.d As is the case for many minor metals, germanium does not occur in its elemental state in nature, but is found as a trace metal in a variety of minerals and ores. Only a few minerals of germanium have been identified, the major one being germanite. This was the principal source of germanium in the past; however, no ore bodies with commercially viable contents of germanite are known at present.Today, germanium is extracted as a by-product of zinc production and from coal fly ash.e It is estimatedthat 75% of worldwide production of germanium is sourced from zinc ores, mainly the zinc sulfide mineral sphalerite, and 25% from coal. China and Russia are the only countries to recover germanium from coal fly ash; around 30% of Chinese production is derived from this source.
The Germanium Corporation estimated in 2011 that approximately 336 tonnes of germanium were contained in zinc mined in the USA, Australia and India. However only 40-45 tonnes of this germanium
aScoyer et al. (2000), Germanium and Germanium Compounds. Ullmann's Encyclopedia of Industrial Chemistry.
bGermanium Corporation (2011), The Germanium Market
cUSGS (2012), Minerals Yearbook 2011, Germanium
dEmsley (2011) Nature's Building Blocks: An A-Z Guide to the Elements
e

7
Scoyer, et al.(2000), Germanium and Germanium Compounds. Ullmann's Encyclopedia of Industrial Chemistry.

eMetal Pages (September 2011), Germanium scarcity and market growth to underpin prices, says industry
6
were actually refined into germanium, meaning approximately 12% of the germanium mined was refined. This is because only two zinc refineries currently extract germanium as part of their operations (in the USA and Canada).a
Germanium production is carried out in two steps. Primary production consists in the production of germanium concentrate from the ore. Germanium is initially recovered from the leaching of zinc residues or coal fly ash followed by precipitation of a germanium concentrate. The concentrate, mainly germanium dioxide, is then refined. It is converted into germanium tetrachloride, hydrolysed to the oxide and finally reduced to the pure metal by means of either carbon or hydrogen. Further refining is required for high-purity germanium.b
Germanium production is heavily dependent on zinc production (given that the former is mostly produced as a by-product of the latter). For this reason, the germanium market is slow to respond to demand and tends to be volatile. As mentioned above, only 12% of germanium mined outside of China and Russia is refined; therefore there is considerable opportunity to increase capacity in the future. Recovery from coal fly ash could also be increased.
There are several reasons why such a low percentage of germanium is refined from zinc concentrates. Firstly, it was reported that germanium recovery can have a negative impact on zinc recovery, detracting from the core business for these refineries. High germanium zinc concentrates must be sourced in order to make recovery of germanium economic; this may increase the cost of sourcing the concentrate, making it prohibitive. This is of particular importance given that germanium production only accounts for a low percentage of the business’s turnover. For example, at Teck Trail in Canada, germanium accounts for at most 2% of total revenues. Therefore, the investment may not be profitable unless germanium prices are sufficiently high.c
Reserve estimates for germanium are available only for the USA, at 450 tonnes.d Proven reserves of germanium in China are quoted at 3,500 tonnes, with a third of this located in Yunnan province, where the local government is currently implementing a strategic reserve plan to make better use of its germanium reserves.e Global resources of germanium are estimated at 11,000 tonnes in zinc ores and 24,600 tonnes in coal. Around half of total resources are located in Russia and one quarter is located in China as shown in Table 18 and Figure 67.
aGermanium Corporation (2011), The Germanium Market
bMoskalyk (2004), Review of germanium processing worldwide. Miner Eng, 17 (3) (2004), pp. 393–402
cInternational Study Group for Nickel et al (2012), Study of By-Products of Copper, Lead, Zinc and Nickel.
d

eMetal Pages (September 2011), Germanium scarcity and market growth to underpin prices, says industry
6
USGS (2013), Mineral Commodity Summaries 2012; Germanium

USGS (2012), Minerals Yearbook 2011,
6
Other3%
United States 7%Russia49%
DRC11%
China30%
Figure 67: Estimated total global germanium resources by location
Table 18: Estimated global germanium resources by type of source (tonnes)Country Zinc ore and slag Coal and coal ashes TotalCanada 90 - 90China 4,200 6,660 10,860Democratic Republic ofCongo 3,750 - 3,750
Mexico 150 - 150Namibia 530 - 530Russia - 17,500 17,500Ukraine - 100 100USA 2,300 165 2,465Uzbekistan - 180 180Total 11,000 24,600 35,600
Source: BGR (2012), Current and future germanium availability from primary sources; MMTA
Source: BGR (2012), Current and future germanium availability from primary sources; MMTA
Supply detailsIn 2011, total production of germanium was estimated to be around 120 tonnes (Table 19). This comprised germanium recovered from zinc concentrates, fly ash from burning coal, and recycled material. It is estimated that around 30% of global production is supplied by recycling, mostly from scrap generated during the manufacture of fibre-optic cables and infrared optics. Due to the value of refined germanium, this scrap is reclaimed and fed back into the production process.a
Table 19: Germanium refinery production, tonnesCountry Refinery production, tonnes
2010 2011
China 65 70
Canada 25 20
Finland 7 7

USGS (2012), Minerals Yearbook 2011,
7
a

7
14012010080604020
FinlandCISChina Canada USA
02005 2006 2007 2008 2009 2010 2011
Figure 68: Worldwide germanium supply over time (tonnes)
Russia 4 4
USA 8 18
World total 109 119
Source: Germanium Corporation (2011), The Germanium Market
Total production statistics provided by the USGS are comparable to those shown in Table 19, fromthe Germanium Corporation. However, there are some differences in the attribution of non-Chinese production, for example for the USA for which the USGS estimates a production of 3 tonnes compared to 18 tonnes in Table 19.a World Mining Data has more conservative estimates for germanium production, with a global production figure of 66 tonnes in 2011.b Such data discrepancies are characteristic for minor metals, for which statistics tend to be less reliable than other metals.
The major worldwide producer of germanium is China, it was responsible for 60% of total production. It was estimated that 60% of this was produced from zinc ores and 40% from coal fly ash. There are six major Chinese germanium producers, with a collective annual capacity of 115 tonnes.c Figure 68 shows how germanium production has changed over time, from around 70 tonnes in 2005 to the current production of 120 tonnes. This increment is principally a result of Chinese production more than doubling over the same period.
Source: Germanium Corporation (2011), The Germanium Market
A stockpile of germanium is known to be held by the US Defence Logistics Agency; as of 31 December 2011, the total inventory of germanium was 16,362 kg.d The Chinese State Reserve Bureau has also announced plans to buy 20 tonnes of germanium metal for its national stockpile.e
EU trade flows and consumptionOverall, the EU is a net importer of germanium, importing around 15 tonnes per year of unwrought germanium and germanium powdersf (Figure 69). Imports and experts of other substances and products containing germanium are not accounted for in these figures though.
aUSGS (2013), Mineral Commodity Summaries 2012; Germanium
bWorld Mining Congress (2013), World Mining Data Volume 28; Reichl et al
cHard Assets Investor (2009), Germanium: Winkler’s Metal; Tom Vulcan
dUSGS (2013), Minerals Commodity Summaries 2013, Germanium
eMetal Pages (2012), Chinese germanium stockpile price reportedly RMB11,200/kg.
f

7
Germanium is also included in some other trade categories along with other metals such as thallium, vanadium, niobium, gallium, indium and rhenium

40
30
20
10
0
ImportsExportsNet exports
20082009201020112012-10
-20
-30
Figure 69: Trends in extra-EU trade for unwrought germanium and germanium powders (tonnes)
EU Exports of Unwrought and Powdered Germanium (3 tonnes)
United StatesSingapore3%4%
Thailand 3%
Russia 90%
EU Imports of Unwrought and Powdered Germanium (12 tonnes)
Other4%China
47%Russia 14%
United States 35%
Figure 70: EU’s major trading partners for germanium, 2012
7
The major source of imported germanium is China, which exported 5.4 tonnes of germanium to the EU in 2012 (Figure 70); this figure was down from 18 tonnes in 2011. Analysis of the value and price per kg of the trade flow suggests that impure germanium is exported from the EU for high purity refining, for instance, to Russia. In 2012, Russia was the major importer of germanium from the EU: however, it was also one of the principal export sources to the EU.
Source: Eurostat-Comext Database, CN 8112 92 95 [accessed August 2013]
Source: Eurostat-Comext Database, CN 8112 92 95 [accessed August 2013]
For germanium, an estimate of EU’s share of world apparent consumption can be calculated by comparing EU production and net imports to estimated world production. Indium Corporation estimates that EU production of germanium, located in Finland, totals approximately 7 tonnes per year.a In addition, the trade statistics show that the EU is a net importer of germanium to the tune of 9 tonnes per year. This means that EU germanium apparent consumption totals 16 tonnes per year.
aIndium Corporation Presentation (April 2010), Indium, gallium & germanium: supply & price outlook

Other6%
Europe13% China
36%
United States30%
Japan15%
Figure 71: World Germanium Consumption by Geographic Region, 2011 (%)
7
World germanium production totals 120 tonnes per year, so the EU’s share of consumption therefore equates to approximately 13% of total world germanium production. This is put in a global context in Figure 71, which identifies China, United States and Japan as the other key consumers for germanium.
Source: Various – See ILZSG (2012), Study of the By-Products of Copper, Nickel, Lead and Zinc; Oakdene Hollins
OutlookThe outlook on germanium supply depends largely on future demand of germanium and its price. A higher price may result in increased interest shown by zinc refineries. The Germanium Corporation reports that zinc refineries in the USA are becoming more interested in germanium recovery. In India lower germanium concentration in zinc ores makes recovery less likely. In Australia greater germanium output may be possible; however, the largest germanium-containing mine is due to be spent in 2015. It was also reported that some zinc concentrates are currently exported from Australia to China, therefore germanium might be recovered.a In 2010, a zinc mine in Canada stopped production; however, the restart of Gordonsville mine in 2011 at Tennessee, USA, should bring new supply to the market.b
Furthermore, a facility was opened in Canada in 2010 which has capacity for semiconductor processing, purification, and recycling of several metals including germanium.c
Recent reports have indicated a declining germanium content of germanium-containing fly ash. Chinese suppliers have commented that this has resulted in a squeeze in supplies due to the lower recovery rate.d
1.9.3 Demand and economic importance
Prices and marketsHistorical prices for germanium are shown in Figure 72. Germanium prices have been variable over this period of time, showing an all-time peak in1996 due increased demand and production shortage. Following this, germanium prices decreased until 2004 due to a slight decrease in demand, increased supply through recycling and stockpile releases and due to a lower than expected demand for satellite applications. Prices increased until 2008 due to increased use of germanium in infrared equipment and solar cells for satellites for military reasons. Increases in late 2006 and 2007 are reported to be due to the construction of fibre optics networks throughout the world. The global economic crisis in 2008 resulted in a reduction in prices; however, these showed recovery in 2010 and 2011.e
aInternational Study Group for Nickel et al (2012), Study of By-Products of Copper, Lead, Zinc and Nickel.
bIndium Corporation (Dec 2010), Indium, Gallium & Germanium: Supply & Price Outlook
cUSGS (2012), Minerals Yearbook 2011, Germanium
dMetal Pages (Mar 2012), Chinese germanium market steady, eyes renewed demand
eUSGS (2012), Metal Prices in the United States Through 2010

2 500 000
2 000 000
1 500 000
1 000 000
500 000
01970 1980 1990 2000 2010
Figure 72: Germanium historical price volatility (98 US$/tonne)
Other5%
Fibre Optic30%
Electronics andSolar Electric Applications 15%
PolymerisationCatalysts 25%
Infrared Optics25%
Figure 73: Worldwide uses of germanium, 2012
7
Source: USGS (2012- ), Historical Statistics for Mineral and Material Commodities in the United States [accessed February 2013]. Figures are indexed to 1998 values.
It is reported that, in 2012, there was an initial reduction in prices; however, these increased again in the third quarter of the year because of temporary supply disruption and speculation.a In early 2012, three Chinese germanium dioxide plants were shut down because of environmental concerns. Global supply was also tightened by the export tax on germanium dioxide from China. Finally, in mid-2012, one of the major Chinese producers announced it would supply 375 tonnes of germanium dioxide over a period of six years to a single consumer that specialises in solar and hydro projects. This contributed to the perceived supply tightness thus resulting in increased price.b
ApplicationsThe three major uses of germanium are in fibre optics, infrared optics and polymerisation catalysts for PET plastics. Use in electronic applications and solar cells also play and important role. The other applications shown in Figure 73 are mainly for phosphors, metallurgy, and chemotherapy.
Source: USGS (2013), Mineral Commodity summaries 2013, Germanium.
aUSGS (2013), Minerals Commodity Summaries 2013, Germanium
bUSGS (2012), Minerals Yearbook 2011, Germanium

7
Fibre-optics: Germanium oxide is used as a dopant in within the core of optical fibre. Small quantities of this compound are added to the pure silica glass to increase its refractive index; this prevents light absorption and signal loss. This type of fibre is used for high-speed telecommunication. Over the past years there has been substantial growth in this sector with increasing demand for more bandwidth.a
Infrared optics: Germanium is transparent to infrared radiation (IR) wavelengths, both as a metal and in its oxide glass form. For this reason it is used to make lenses and windows for IR radiation. These are mainly used in military applications such as night-vision devices. Uses outside of the military are in advanced firefighting equipment, satellite imagery sensors and medical diagnostics.b
Polymerisation catalysts: Germanium dioxide is used as a catalyst in the production of PET plastics which is used, for instance, for plastic bottles, sheet, film and synthetic textile fibres. There is a drive to move towards different catalysts given the increasing price of germanium.c The use of this catalyst has been declining since 2007; however use as a catalyst for PET production increased in 2011 partially due to increased demand for water bottles in Japan after the Fukushima disaster.a
Solar cells: Germanium-based solar cells are principally used in space-based applications but also in terrestrial installations. Demand for satellites has increased steadily from 2007 to 2011 due to commercial, military, and scientific applications. The advantage of germanium substrates over the more common silicon based solar cells are the smaller size and weight and higher efficiency (over 25%). These solar cells are not common in terrestrial applications because of the cost of their manufacture. However these are considerably more efficient at converting solar energy into electricity, so fewer cells are required in a panel to produce equivalent amounts of power. It is thought that germanium-based cells will compete for a portion of the terrestrial market in thefuture.a
Electronic components: Germanium is used as a semiconductor in several electronic applications. Some examples are high brightness Light Emitting Diodes (LEDs) in devices such as cameras and smartphone display screens. Silicon germanium transistors have been replacing other silicon based components in high speed wireless telecommunications devices due to the higher switching speeds and energy efficiency.a
OutlookThe market outlook forecast for world germanium supply and demand is shown in Figure 74. This shows a moderate overall growth rate in demand, at around 4.4% per year. The largest increases are actually in germanium’s largest end-market: infrared and fibre optics, where demand is anticipated to grow at 5.6% per year. Solar and electronics are also expected to witness good rates of market growth at over 4% per year, although the market for PET catalysts is only expected to be flat.
On the supply-side, there currently exists a small market surplus. However, this is expected to narrow over the coming decade, as supply growth will not quite keep up with demand growth. However, this will depend on the willingness of zinc refiners and coal-fired power plants to engage in germanium market. Given that there are plenty of germanium reserves worldwide, as well as germanium arising in certain waste streams, the supply-demand picture for germanium should be relatively secure.
aUSGS (2012), Minerals Yearbook 2011, Germanium
bHard Assets Investor (2009), Germanium: Winkler’s Metal; Tom Vulcan
cThiele (2001), Int. J. Polym. Mater., 50. p. 387

180160140120100806040200
Solar, ElectronicsPET catalysts Optics, Infrared Production
2012201420162020
Figure 74: World germanium supply and end-use forecasts to 2020 (tonnes)
7
Sources: Indium Corporation Presentation (2013); Melcher & Buchholz Presentation (2012), MMTA Conference
1.9.4 Resource efficiency and recycling
As previously mentioned, approximately 30% of the world’s production comes from recycled new scrap; this has been consistent over the past years. Due to the high value of this material, new scrap is recovered and reinserted in the production process. For example, during the manufacture of optical devices, more than 60% of the germanium metal used is routinely recycled as new scrap.a Pre-consumer recycling of solar cells, fibre optics and infrared devices is likely to increase in the future due to increasing production.
Unlike industrial scrap, only very small amounts of germanium are recovered from post-consumer goods. According to UNEP, less than 1% of end-of-life germanium is recycled.b In most of the products and devices containing germanium the metal is present in trace amounts, making it technically and economically difficult to recover secondary germanium.
Various alternatives are available for the substitution of germanium in its applications (Table 20). However, many of these substitutes result in a loss of performance and are therefore not optimal. Less expensive silicon has replaced germanium in transistors and might do so in other electronic applications in the future. However, there has recently been a shift back to the use of germanium, albeit in materials with silicon, as this will allow the miniaturization of electronics.
Table 20: Available substitutes for germanium applications
Use Substitutes/Rationale Substitutability score
Fibre Optics No alternative available 1Infrared Zinc selenide: currently competing but reduces 1Polymerisation Catalyst Antimony or Titanium: currently competing 0.7
Electronics and LEDs
Gallium, indium, selenium, and tellurium: currently competing but can be less reliable and economic. Silicon: currently competing for transistors
0.7
aInternational Study Group for Nickel et al (2012), Study of By-Products of Copper, Lead, Zinc and Nickel.
bBuchert et al (2009), Critical Metals for Future Sustainable Technologies and Their Recycling Potential. UNEP

7
Others Arbitrary assumption 0.51.9.5 Specific issues
Two of the major germanium producing countries currently impose taxes upon the export of germanium; Russia imposes a tax on the export of germanium waste and scrap (6.5%) and China imposes a tax on the export of germanium oxides (5%). With the introduction of such tax in 2010, the Chinese Government attempted to limit exports of raw materials. At the same time China encouraged the export of more processed products through export tax rebates on products such as germanium ingots and optical lenses.a

7
a OECD (n.d.), Inventory of Restrictions on Exports of Raw Materials. http://qdd.oecd.org/Subject.aspx?subject=1189A691-9375-461C-89BC-48362D375AD5. [Accessed February 2013]

7
1.10 Indium
1.10.1 Introduction
Indium (In, atomic number 49) is a group 13 metallic element. It is a very soft, ductile and malleable silvery metal. Indium is not found in its elemental state in the Earth’s crust; instead, it occurs in minerals of other metals. The most important commercial source of indium is the zinc mineral sphalerite. The major use of indium is as indium-tin oxide (ITO) in flat panel devices (FPDs) including flat screen computer monitors, LCD smart phones, televisions and notebooks. Other applications are in alloys and solders, solar panels, light emitting diodes (LEDs) and laser diodes.
A supply chain map for indium’s use in photovoltaic (PV) cells and FPDs is shown in Figure 75. Primary production for indium is linked to recovery as a by-product, principally of zinc refining. Only 25% of indium contained in mined zinc is refined; this is due to fact that not all indium containing zinc ores are processed indium-capable refineries.a This is considered to be the major bottleneck in indium supply.
Figure 75: Supply chain map for indium in PV thin-film and FPDs technologiesMine base
metals (zinc)
Extract indium as
by-productPurify & refine
Sputter ITO onto glass
panels
Manufacture and use of PV & FPDs
End of life
Recovery
Note: Orange colour represents stages of the supply chain which take place in Europe
After purification, for use in FPDs, indium is synthesised into ITO. ITO is ‘sputtered’ onto either clear glass or plastic, forming a transparent electrical conductor. Recovery of indium from ITO scrap represents two thirds of global indium production. At present, no recycling of indium from post-consumer products is known to take place, though technologies have been developed.
1.10.2 Supply
Primary sources, by-production and refiningIndium is very widely distributed in the Earth’s crust with an abundance of 0.05 ppm. However, like many minor metals, it is very disperse and is not found in large enough concentrations for indium to be mined solely for its extraction. Indium is found as a trace element in many minerals; the major commercial source is sphalerite, a zinc ore mineral. Other sources are lead, copper and tin minerals. Indium is thus a by-product of other mining and refining operations.b
Indium is recovered from the processing of the base metal concentrates. It is obtained through processing slag and zinc dust waste, which is then further purified by electrolysis and/or solvent extraction. The metal can be refined to purities of 99.9999%. Countries with no primary sources refine indium from imported residues and slags.c
The average indium content of zinc deposits varies considerably with location, from less than 1 ppm to over 10 ppm.d Although indium concentrations in ores normally range from 10 to 20 ppm, high levels are found within tin deposits located in both Cornwall (UK) and New Brunswick (Canada). The average indium content of zinc concentrates in key Peruvian and Bolivian mines is estimated to be 187 ppm and 630 ppm respectively.e
aIndium Corporation (2010), The relationship between zinc and indium productions
bChagnon (2010), Indium and Indium Compounds. Kirk-Othmer Encyclopedia of Chemical Technology. 1–12.
cAlfantazi and Moskalyk (2003), Processing of Indium: A Review. Miner. Eng., 16, pp. 687–694
dUSGS (2013), Mineral Commodity Summaries 2013, Indium
e

8
Indium Corporation (2010), The relationship between zinc and indium productions

ePolinares (2012), Fact Sheet:
7
Australia8%
Other6%
Canada12% Peru
50%
Bolivia24%
Figure 76: Zinc mines’ indium output (not necessarily refined), excluding China, 2011
According to the Indium Corporation, indium reserves worldwide are 50,000 tonnes within zinc and copper minerals at existing mines. Above-ground stocks, for example tailings and residues, were estimated at an additional 15,000 tonnes of reserves, although these may prove harder to extract due to their contamination with iron.a
Although there are plentiful reserves of indium worldwide, it is thought that these are not used in an effective manner, with only 25-30% of indium mined, excluding China and Russia, being refined; 25-30% accumulates in residues, whereas 40-50% goes to non-indium-capable refineries and is lost. Furthermore, only 17% of zinc refiners are producing indium. A total of 960 tonnes of indium was available from zinc mined worldwide, excluding China, in 2011; 50% of this in Peru (Figure 76). However, only 282 tonnes of refined indium were produced. Therefore there is an opportunity to increase efficiency and to expand production capacity.b
As stated above, 25-30% of indium is accumulated in residues formed during the refining process. It must be noted that these concentrates are difficult to process due to the high presence of contaminants, such as antimony and cadmium. The residues may also contain low concentrations, exacerbating the problem. Therefore refining of these residues may be uneconomical unless indium prices are high.c
Source: Indium Corporation (2011), The Indium Market
The production of indium is heavily dependent of the production of zinc. Even though there is clear opportunity for expansion in the production of indium, this will be a strategic decision as indium contributes only a small amount of the profit. Analysis of data of Teck Trail’s zinc smelting and refinery operations in Canada suggests that indium recovery could contribute around 3% of total revenues. Production of indium requires investment in refining technology, but the company would also have to undergo active sourcing of indium-containing zinc concentrates to ensure that the overall indium content would be sufficient to justify its recovery. Indium Corporation estimates that, to justify its economic recovery, a minimum indium content of around 100 ppm is required.d
Supply detailsGlobal refined output of indium was estimated to be 670 tonnes in 2012. This is compared to an estimated total capacity of 780 tonnes.e The major worldwide producer of zinc is China, which accounts for more than half the annual production (Table 21).
aIndium Corporation (2012), Indium Sources and Applications; Malcolm Harrower, Minor Metals Conference
bIndium Corporation (2011), The Indium Market
cUSGS (2012), Minerals Yearbook 2010, Indium
d

ePolinares (2012), Fact Sheet:
7
International Study Group for Nickel et al (2012), Study of By-Products of Copper, Lead, Zinc and Nickel.

7
The major European producer is Belgium.a ‘Other’ producers listed in Table 21 with production in 2012 are likely to be Germany, Italy, Kazakhstan, the Netherlands and the UK.b In France, a zinc smelter has an indium recovery plant which produces a concentrate with 20% indium. The concentrate is sold to third parties for further processing. In 2011, the plant committed capital to build a plant on the same site that could refine the indium concentrate. The plant started operating in 2012.c
Table 21: Indium worldwide refinery production, tonnes, 2010 to 2012
CountryRefinery production, tonnes2010 2011 20121e
Belgium 30 30 30Brazil 5 5 5Canada 67 75 70China 340 380 390Germanye 10 10 -Italy 5 5 -Japan 70 70 70Netherlands 5 5 -Republic of Korea 70 70 70Russia NA 5 5Peru 2 2 -Other - - 30World Total 609 662 670Source: USGS (2013), Minerals Yearbook 2011, Indium1 USGS (2013), Minerals Commodity Summaries 2013, Indium e – Estimated,
USGS estimates that global consumption of both primary and secondary indium was more than 1,800 tonnes of which approximately 60% was consumed in Japan.d Indium Corporation’s estimates for world production are lower than those estimated by USGS. It is estimated that 550 tonnes of virgin indium was refined in 2010, 50% of this coming from China. In addition, it is estimated that 950 tonnes of indium was recycled from new scrap. Recycling consists in the recovery of indium from ITO scrap; this practice is concentrated in China, Japan, and the Republic of Korea where ITO production and sputtering take place. For example, Japan is thought to have a recycling capacity of 300 tonnes per year.e
The Republic of Korea stockpiles indium, reportedly 60 days of imports. In 2009, the Government budgeted $200bn for the national metal stockpile, of which 20% was allocated for the procurement of minor metals, including indium. In addition, it was reported that 5 tonnes of indium were purchased by the Government in 2008. Japan has decided to include indium in its rare metals inventory. It is expected that the amount held will be equal to 42 days’ worth of domestic consumption.f China’s State Reserve Bureau bought 30 tonnes of indium from domestic producers in 2009; it is also estimated that 100 tonnes were held in Chinese warehouses.g SMG Indium Resources (USA) holds an independent stock of36.5 tonnes of indium in a secure vault in New York; however, it states it will “lend to the industry” in times of pressure in the market.f
aEuropean Commission (2011), Critical Metals in Strategic Energy Technologies.
bUSGS (2012), Minerals Yearbook 2010, Indium
cNyrstar (2012), Indium Facility at the Auby Smelter.
dUSGS (2012), Mineral Commodity Summaries 2012, Indium
eRoskill (2011), Indium: global industry markets & outlook
fUSGS (2011), Minerals Yearbook 2009, Indium
g

8
RPA (2011), Stockpiling of Non-energy Raw Materials.

45040035030025020015010050
0-50
-100
Exports
Imports
Net exports
2008 2009 2010 2011 2012
Figure 77: Trends in extra-EU trade for unwrought indium and indium powders (tonnes)
EU Exports of Unwrought and Powdered Indium (58 tonnes)OtherJapan6%Thailand4%47%
Switzerlan d9%
South Korea 11%
United States 23%
Figure 78: EU’s major trading partners for indium, 2012EU Imports of Unwrought and Powdered
Indium (65 tonnes)
Other8%
Peru8%South Korea 8%
China24%
Hong KongUnited19%States
9%Japan11% Canada
13%
9
EU Trade Flows and consumptionOverall, the EU is a net importer of unwrought indium and indium powders; excluding data from 2011, which represent a clear exception, around 12 tonnes of unwrought indium and indium powders are imported per year (Figure 77).a A recent exception was in 2011 when the EU exported 163 tonnes net. Note that these figures do not include trade of downstream products and substances containing indium.
Source: Eurostat-Comext Database, CN 81129281 [accessed July 2013]
The major destination country for the EU’s exports of indium in 2012 was Thailand, which imported 28 tonnes of indium from the EU (Figure 78).
Source: Eurostat-Comext Database, CN 81129281 [accessed August 2013]
Analysis of the value and price per kg of the trade flow suggests that crude indium is exported from the EU to high purity refining such as in the China. In 2012, the EU imported 16 tonnes of indium from China, as well as importing 13 tonnes from Hong Kong. Six tonnes of indium were exported overall to these two countries in the same year.
aIndium is also included in some other trade categories along with other metals such as thallium, vanadium, niobium, gallium, germanium and rhenium
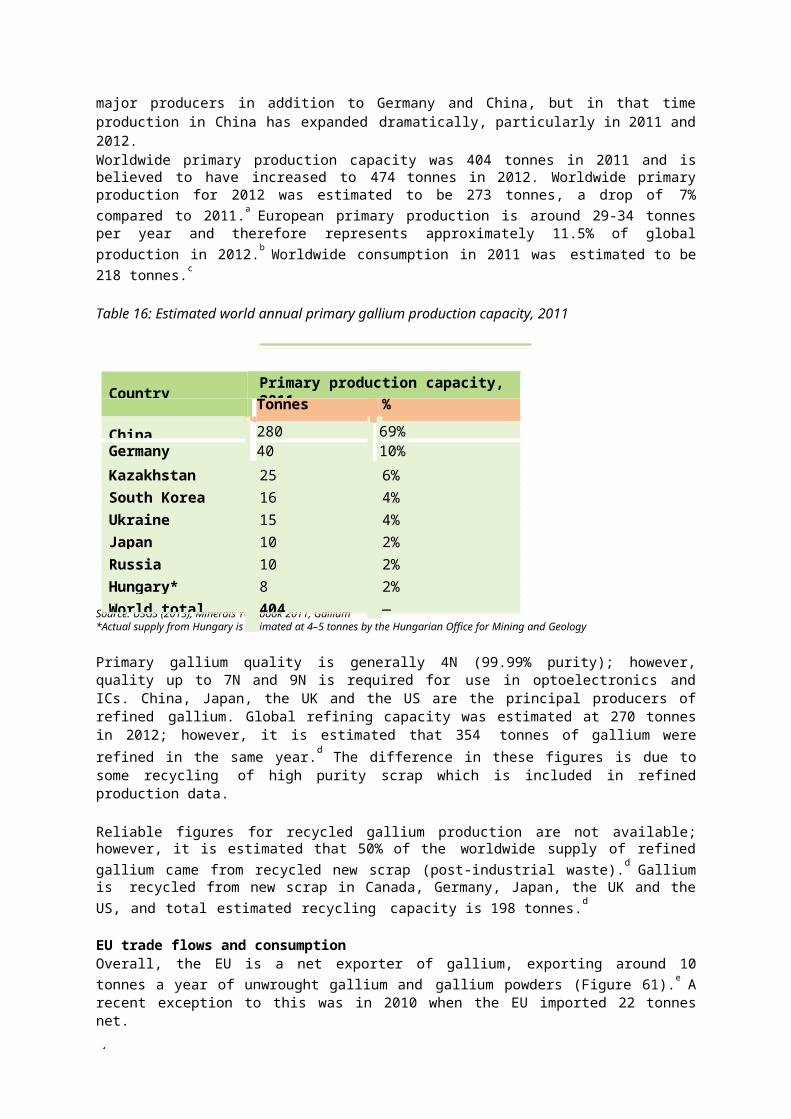
8
Rest of World18%
USA20%
EU9%
China9%
Japan44%
Figure 79: Key Consumers of Indium, 2009 (%)
Significant intra-EU trade also takes place, notably between Belgium, Germany and the UK which are all producers of crude or refined indium.
For indium, an estimate of EU’s share of world apparent consumption can be calculated by comparing EU production and net imports to estimated world production. The USGS estimates that EU production of indium totals 50 tonnes per year (split between Belgium, Germany, Italy, Netherlands and the United Kingdom). For 2012, the EU was a net importer of 7 tonnes of refined indium, which puts EU apparent consumption of indium at 57 tonnes.
This compares to world indium production of 670 tonnes, giving the EU an estimated 9% share of world indium apparent consumption, although notably this excludes imports of indium contained within products. The EU’s share of worldwide consumption is put into perspective in Figure 79, which identifies United States, Japan and China as other key consumers of indium for 2009.
Source: POLINARES (2012), Fact Sheet: Indium
OutlookThere have been no significant changes in refinery production of indium since 2007. Major capacity expansion prior to this period took place in China. Output in China increased from 73 tonnes in 1999 to a peak of 380 tonnes in 2011, making it the major producer of indium worldwide.a Roskill reported that existing primary capacity is currently higher than actual output; therefore future increase in demand could be met in the short term.
There are a number of projects on poly-metallic deposits, including indium, which would contribute to increased production if demand increases. These includeb: Mount Pleasant, Canada (Adex): tin-zinc-indium deposit, target production from 2015 Baal Gammon, Queensland Australia (Monto Minerals): copper-tin-silver-indium Malku Khota, Bolivia (SOAM): silver-indium-gallium-copper-lead Mount Lindsay, Tasmania Australia (Venture Minerals): tin-tungsten-iron-indium Flores Island, Indonesia (JOGMEC Led Joint Venture): zinc-indium.
1.10.3 Demand and economic importance
Prices and marketsGiven the strong dependence of indium supply on that of zinc, indium prices have historically been volatile, as new applications hit the market and supply struggles to keep. The price peak in 2005
aRoskill (2011), Indium: global industry markets & outlook; USGS (2013), Minerals Yearbook 2011, Indium
bInternational Study Group for Nickel et al (2012), Study of By-Products of Copper, Lead, Zinc and Nickel.

1 200 000
1 000 000
800 000
600 000
400 000
200 000
0
1970 1980 1990 2000 2010
Figure 80: Indium historical price volatility (98 US$/tonne)
CompoundSemiconductors & LEDs
3%Alloy/ compounds 4%
Batteries 5%Thermal Interface Materials
6%Photovoltaics 8%
Other8%
Flat Panel Displays56%
Solders10%
Figure 81: Worldwide applications of virgin indium, 2011
8
coincides with the entry of LCD flat panel TVs in the market.b There was a price fall in 2012; most likely due to the decrease in Japanese consumption by almost 70% in the first eight months of the year.a
Source: USGS (2012- ), Historical Statistics for Mineral and Material Commodities in the United States [accessed February 2013]. Figures are indexed to 1998 values.
ApplicationsThe major use of indium is in the form of indium-tin oxide, which is used in LCDs in flat panel devices. In addition, indium is used in several other applications. The second-most important are low-melting-point alloys and solder. Other uses are in solar panels, thermal interface materials, batteries, LEDs and semiconductors.
Source: Indium Corporation (2011), The Indium Market Flat panel devices: ITO thin-film used for electrically conductive purposes in a variety of flat-panel
devices are the major application for indium. The most common use is in LCD TVs but it is also used in monitors, notebooks, mobile phones, calculators, automotive displays amongst others. ITO is deposited as a thin film onto either clear glass or plastic; this acts as a transparent electrical
aUSGS (2013), Mineral Commodity Summaries 2013, Indium
Indi
um, U
nit v
alue

800
700
600
500
400
300
200
OtherLED PV FPDVirgin supply
100
02012 2014 2016 2020
Figure 82: World primary indium supply and end-use forecasts to 2020 (tonnes)
8
conductor, which enables the image to be projected onto the screen of the flat panel display.a Most ITO production is concentrated in Japan. Other major ITO producers are China, the Republic of Korea, and Taiwan.b
Solders: Indium is used in lead-free solders in order to improve the solder’s resistance to thermal fatigue and to reduce crack propagation. The use of indium for this purpose is becoming increasingly important since lead solder has been banned in many countries.c
Low-melting-point alloys: Due to its low melting point, indium is used in alloys in fuses or plugs for fire control systems. Low-melting-point alloys are also used on high-value items as a surface to grip whilst being worked on. The surface can then be removed at low temperatures without affecting the item.
Photovoltaic: Indium is used in thin-film copper indium (gallium) diselenide (CIS or CIGS) solar cells. Although silicon based solar cells currently account for 80% of the market, it is thought that the CIGS market share will increase in the future.d Thin-film cells are less efficient than silicon-based ones; however, they have the advantage of being lightweight, flexible, and durable and can be integrated directly into building materials. Extensive research is being carried out to increase the efficiency of CIS and CIGS cells; a record value of 19.7% efficiency has been achieved although the best commercial modules are currently 11-13% efficient.e
OutlookThe market outlook forecast for primary indium supply and demand is shown in Figure 82.
Source: Indium Corporation Presentation (2013)
For some applications, such as LEDs and PV, demand for indium is expected to grow rapidly, albeit from a low base. By 2020 these two applications could account for 20% of primary indium demand (compared to 7% in 2012). For flat panel displays, indium’s largest end-market, demand growth is still expected to be quite strong at around 5.5% per year, driven in particular due to the rise of smart phones and tablets, as well as steady growth in demand for flat screen TVs, laptops and computers.
aInternational Study Group for Nickel et al (2012), Study of By-Products of Copper, Lead, Zinc and Nickel.
bUSGS (2012), Minerals Yearbook 2010, Indium
cHard Assets Investor (2009), Indium: No Screen Test Needed; Tom Vulcan
dEuropean Commission (2011), Critical Metals in Strategic Energy Technologies.
eSolar Frontier (2013), Solar Frontier Achieves Record 19.7% CIS Efficiency. http://www.solar-frontier.com/eng/news/2013/C014763.html [Accessed online
Februry 2013]; Aberle (2009), Thin-film solar cells. Thin Solid Films, 517 pp. 4706–4710.

8
On the supply-side, production of virgin indium will be driven by zinc refiners’ willingness to recover indium. This may mean that virgin supply grows a little more slowly than primary demand, and may push the market into deficit by the middle of the decade. However, this is expected to be offset by continued increases in the supply of reclaimed indium, at least in the short- to medium-term.
1.10.4 Resource efficiency and recycling
As stated above, the Indium Corporation estimates that 950 tonnes of indium were recycled in 2010; according to these estimates, 63% of the total production of indium was secondary production. Hence recycling has increased by nearly 70% since 2006 when, according to the same estimates, reclaim accounted for approximately 50% of supply.a
A large proportion of secondary indium was produced from the recycling of post-industrial ITO, mainly in China, Japan and the Republic of Korea, as these are also the countries in which ITO and LCD screen production is concentrated. This process generates high amounts of indium scrap for two reasons. Firstly, the ITO sputtering process is very inefficient; only 40% is actually used in the process leaving large amounts available for recycling.b In contrast, the reclaim process is very efficient and can return recovery yields up to 95%, with turn-around times of fewer than 15 days.c
A new technology for sputtering has recently been adopted by some ITO producers. It is estimated that rotary ITO technology uses up to 80% of ITO; thus use of this technology over traditional will result in a decrease in ITO waste by up to a factor of six.b
Only 1% of indium from end-of-use LCDs appears to be recovered. This is mainly due to the fact that only small concentrations are present in each device thus a large number of screens would be required to make this economically viable.d Several research projects are being undertaken in order to achieve indium recycling from LCDs. Examples are the recovery of indium from LCDs in discarded mobile phones by means of chloride-induced vaporisation (which showed 84% recovery) and by pyrolysis followed by acid immersion (which showed nearly 100% recovery).e Significant post-consumer volumes have only recently started to emerge as these devices have been present in the market for few years. In the future, the percentage recycled may increase as more significant numbers of units enter the waste stream.
Presently, indium is also recovered from CIGS post-industrial scrap in Belgium. This is economically viable given the high concentrations of metal found in these materials and the large quantities of scrap lost during production, which is recorded to be 50%.f As for LCDs, post-consumer concentrations of indium in CIGS solar panels are too low, thus large scale processing would not be economical. In addition, post- consumer waste arisings are currently very low given the recent introduction onto the market of these products.g
As previously described, recovery from tailings is difficult due to the low concentration of indium and high amount of contamination. For this reason, recycling from tailings is insignificant. Improvements in technology have made this recovery feasible under good market conditions, when indium prices are high.
The potential to substitute for indium in various applications is shown in Table 22. The price volatility of indium and supply concerns have promoted the development of ITO substitutes, indium’s main use.
aIndium Corporation (2010), Indium, Gallium & Germanium. Supply & Price outlook
bUmicore (2012), ITO rotary target: a game changer for the indium market; Christophe Murez; Minor Metals Conference
cIndium Corporation (2010), The relationship between zinc and indium productions
dUNEP International Resource Panel (2011), Recycling Rates of Metals: A Status Report
eTakahashi et al. (2009), Recovering indium from the liquid crystal display of discarded cellular phones by means of chloride-induced vaporization at relatively
low temperature. Metall. Mater. Trans. A, 40A, pp. 891–900; Wang et al. (2013), Study on the waste liquid crystal display treatment: Focus on the resource recovery. J. Hazard. Mater. 244-245. pp. 342-347f
European Commission (2011), Critical Metals in Strategic Energy Technologies.g
8
Hagelüken & Meskers (2009), Technology Challenges to Recover Precious and Special Metals from Complex Products.

8
Table 22: Available substitutes for indium applications.
Use Substitutes/Rationale Substitutability score
Flat panel displays No available alternative 1Photovolatics Gallium arsenide: currently competing 0.7Semiconductors Gallium arsenide: currently competing 0.7Solders Non-indium based solders 0.7Batteries (alkaline) Alternative battery types 0.3Alloys/compounds Various other compositions available 0.3Thermal interfacematerials Alternative materials based on other metals 0.3
Others Arbitrary assumption 0.5
1.10.5 Specific issues
The supply of indium in China is highly regulated and restricted. Companies are licensed and allocated export quotas; in 2012, 18 companies were allowed to export indium. The 2012 quota was expected to be 231 tonnes, slightly lower than that for 2011.a It was announced that the 2013 export quota will be unchanged from 2012.b Official statistics from China state that less than half of the 2011 export quota was actually utilised.c China also applies an export tax on indium. This was introduced in 2006; in 2009 the tax was reduced from 15% to 5%. Russia also sets an export tax of 6.5%d
aUSGS (2013), Minerals Commodity Summaries 2013, Indium
bhttp://www.chinamining.org/News/2012-11-07/1352267825d59702.html
cMetal Pages (February 2012), China 2011 unwrought indium exports down 15%
d

8
OECD (2009), Export restrictions on strategic raw materials and their impact on trade and global supply
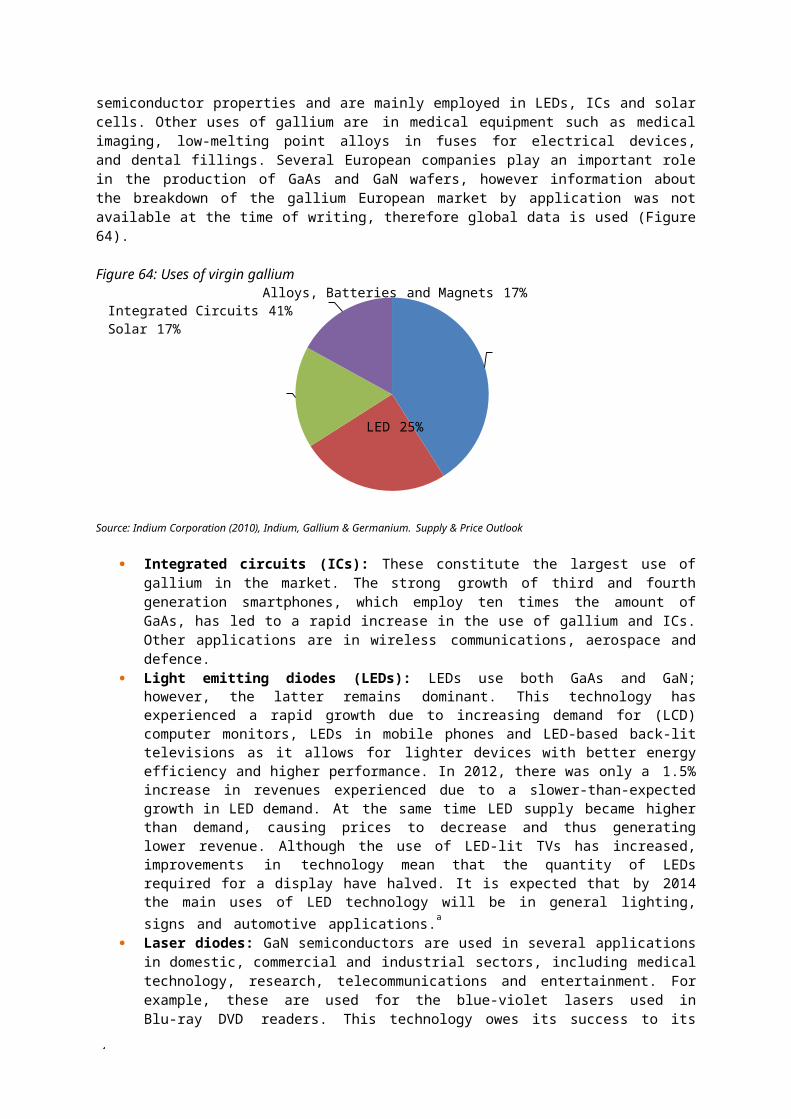
8
Mining andextraction of magnesite
Production ofMagnesia (MgO)
CCM, DBM andFM grades
Application
1.11 Magnesite
1.11.1 Introduction
Magnesite is the common name for the mineral magnesium carbonate (MgCO3). Pure, uncontaminated magnesite contains the equivalent of 47.8% magnesium oxide (MgO).a It provides excellent thermal resistance and is most commonly used in the refractory industry and in fertilisers.b
The most important use of magnesite is in the production of magnesia (MgO) as the commercial grades of caustic calcined magnesite (CCM), dead burned magnesite (DBM) and fused magnesia (FM) (Figure 83). DBM and FM are predominantly used in the refractory industry; CCM is mostly used in chemical-based applications such as fertilisers and livestock feed, pulp and paper, iron and steel making, hydrometallurgy and waste/water treatment. Data on specific EU countries’ involvement in different stages of the supply chain are not available; however, mining is known to occur in Slovakia and Spain.
Figure 83: Supply chain map for Magnesite
Note: Orange colour represents stages of the supply chain which take place in Europe. Colour coding might be incomplete due to the fact that no detailed information on the engagement of European firms in the different steps of the supply chain was available.
1.11.2 Supply
Primary sources, production and refiningAccording to the development and characteristics of deposits, two types of magnesite can be found. Firstly, replacement deposits containing sparry magnesite in carbonate rocks have the highest economic importance, accounting for 80% of the worldwide magnesite extraction. They occur in mainly in Austria, Spain, Slovakia, USA, Korea and China. Secondly, cryptocrystalline magnesite results from the decomposition of serpentine rocks, occurring for example in Greece, Serbia and Turkey. However, theorigin of and relationship between these two types of deposits is poorly understood.ac
Supply detailsAs can be seen in Figure 84, China is the world’s largest producer of magnesite, accounting for 69% of the total world output in 2010. The next largest producers are Slovakia, Russia, Turkey, Austria, Brazil, Spain and Australia, with 25% of production between them. EU production is estimated at 9% of world production with important contributions from Slovakia (6%), Spain (2%) and Greece (1%).
aMagnesit, Römpp Online, 2006
bEuropean Mineral Statistics 2007-2011, British Geological Survey, 2013
cMineralienatlas: Magnesitlagerstätten, Stefan Shorn et al.,
http://www.mineralienatlas.de/lexikon/index.php/Geologisches%20Portrait/Lagerst%E4tten/Magnesitlagerst%E4tten%20- %20%28Lagerst%E4tten%20mit%20kontroversiv%20diskutierter%20Genese%29, accessed on 16th September 2013

OtherSpain 7%Brazil2%
2%Austria
4%Turkey
4%Russia 6%
Slovakia 6%China69%
Figure 84: Worldwide production of magnesite in 2010
100 000
80 000
60 000
40 000
EU Export20 000
EU Import
0 Net Export20082009201020112012
-20 000
-40 000
-60 000
-80 000
Figure 85: EU trade of natural magnesium carbonate (tonnes)
8
Source: World Mining Data 2012
EU trade flows and consumptionThe EU is a net importer of magnesite although this has reduced overtime with substantial growth in exports in 2012, coupled with a fall in imports over the past four years (Figure 85).
The EU has two main trading partners for import and export (Figure 86). The vast majority of natural magnesium carbonate imports arrive from Turkey, which is also one of the larger suppliers. Over three quarters of exports go to India, which has a small amount of domestic production, around 1% of global supply. The remainder is split between a variety of countries, including some of the larger suppliers such as Turkey and Russia.
Eurostat-Comext Database, CN Code 2519100: Natural Magnesium Carbonate

Figure 86: EU trade flows of natural magnesium carbonate, 2012EU Imports Natural MagnesiumEU Exports of Natural Magnesium Carbonate (34,305 tonnes)Carbonate (17,812 tonnes)
Other7%
China8%
Turkey91%
UnitedStates 2%
Russia 3%
Other1%
Thailand5%
Turkey7%
India76%
South America2%
Japan 2%USA 5%
Others12%
Europe10%
China69%
Figure 87: Global Production of Refractories by Geographic Region, 2011 (%)
8
Eurostat-Comext Database, CN Code 2519100: Natural Magnesium Carbonate
Europe’s share of magnesite consumption is estimated at nearly 3 million tonnes, which is approximately 12% of total worldwide magnesite consumption (25.7 million tonnes for 2012). The vast majority of EU consumption is domestically produced, with EU net imports recorded at only 16,500 tonnes for 2012. Roskill comments that very little magnesite is traded globally and most is processed into magnesia in the country of production before it is shipped. These estimates do not take into account magnesite traded and consumed in the form of magnesia, nor do they include the production of synthetic magnesia in Ireland and Netherlands from seawater and brines respectively.
In terms of the worldwide picture for magnesite consumption, Figure 87 shows the global production of refractories (the main market for magnesite, representing 70% of consumption). China is by far the largest market for refractories, with a share of nearly 70%. Europe, USA, Japan and other countries make up the remaining fraction.
Source: Roskill Presentation (2013), Magnesia: The changing face of the industry

Productiontechnology in steel industry changed, demand decreased
Excess supply
Increase indemand for pharmaceutic products and chemical intermediate products
Energyshortages; less export licencses in China
Cement industry1%
Animal feed and fertilisers5%
Environmental 6%
Other5%
Refractory83%
Figure 89: End-use of magnesite in Europe in 2010
8
1.11.3 Demand
Prices and marketsFigure 88 shows price fluctuations due to various supply and demand influences since 1979.a Prices have dropped considerably since their peak the early 1980s, plateauing for a number of years. Recent years have seen some price increases linked to increased demand from some applications, energy shortages and a reduction in export licenses in China.
Figure 88: Development of real magnesite prices (Prices are deflated, 2011 = 100)
$/mt350
300
250
200
150
100
50
0
Source: DERA, HWWI (2013) Ursachen von Preispeaks, -einbrüchen und –trends bei mineralischen Rohstoffen (Causes of price peaks, collapses and trends of mineral raw materials), Hamburg Institute of International Economics (HWWI) in contract for Deutsche Rohstoffagentur (DERA). April 2013, translated to English by Fraunhofer ISI
ApplicationsFigure 89 provides an overview of the different end-uses.
Source: Critical Raw Materials for the EU 2010
aDERA, HWWI (2013) Ursachen von Preispeaks, -einbrüchen und –trends bei mineralischen Rohstoffen. April 2013.
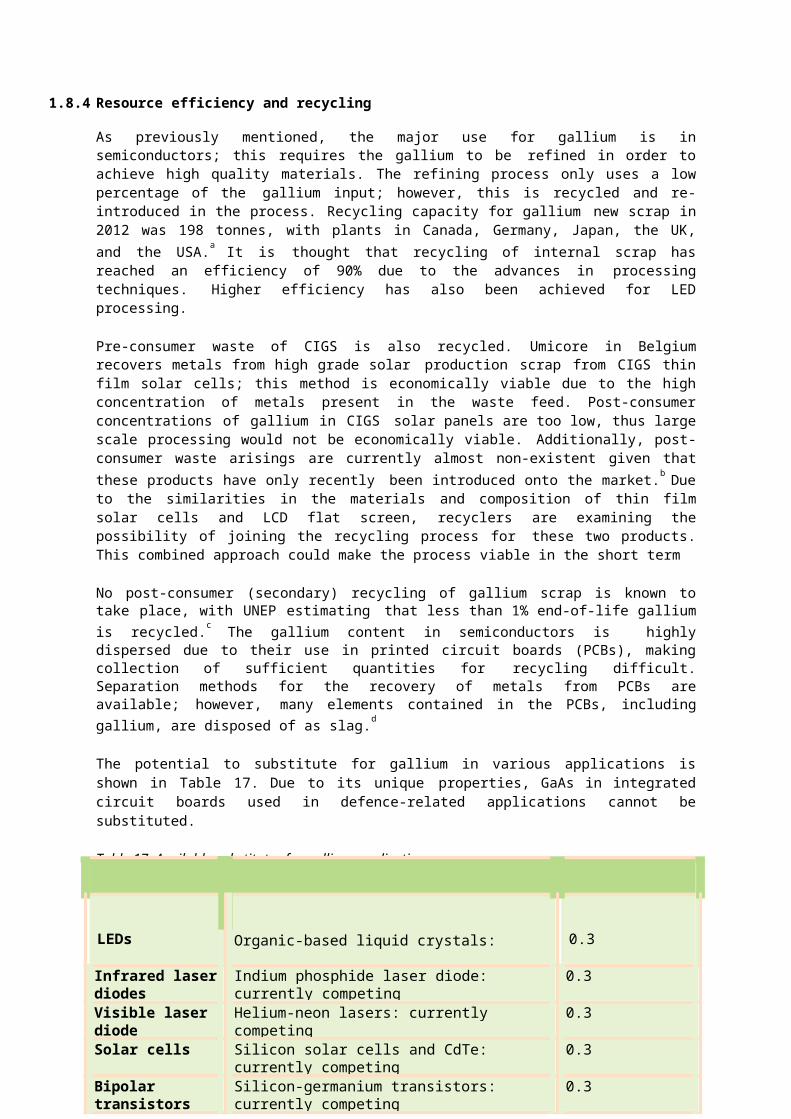
9
35 000
30 000
25 000
20 000
15 000
10 000
OthersAgriculture Industrial RefractoriesSupply
5 000
02012 2014 2017 2020
Figure 90: World magnesite supply and end-use forecasts to 2020 (‘000s tonnes)
The main use for magnesite is in the production of magnesia for refractory industries (steel, cement and other refractory totalling approximately 84% of the world production). Nevertheless, magnesia is not only produced from Magnesite. There are alternative sources of magnesia such as dolomite. The remaining 16% of Magnesite is used for environmental, agricultural and other applications (e.g. sports). Magnesite is rarely used without being calcined into magnesia although small amounts are sold for construction (e.g. slag conditioning and hydraulic construction).
1.11.4 Outlook
The market outlook forecast for the world supply and demand of magnesite is shown in Figure 90. Demand growth will be driven primarily by the dominant end-market (refractories) which is expected to grow at 2.7% per year to 2020. However, demand growth in the remaining end-markets is actually expected to be stronger, exceeding 3% per year, meaning that the overall market growth will be close to 3% per year to 2020.
As for the supply-side for magnesite, an overall contraction in world magnesite production is expected until 2014, with reductions in production expected within China over the next couple of years. Further forward to 2020, there will be gradual additions to world production with overall supply increasing at 1.3% per year to 2020. As a result, the current surplus apparent in world magnesite markets will narrow, and appears to move towards a market deficit by 2020. However, there is unlikely to be a market deficit since magnesia, the main magnesite product, is also produced from other feedstocks which could make up some shortfall, with capacity increases planned for synthetic magnesia production. The overall geographic distribution of producing countries will be relatively unchanged, with 60% of world production located in China and 30% in Europe.
Source: Roskill Information Services for 2013 CRM Study
1.11.5 Resource efficiency and recycling
As magnesite is predominantly used in the calcined form as magnesia it cannot be recycled directly. Animal feed and fertilisers are consumed, so there is still no chance of recycling. However, up to 10% of refractory bricks are recycled, giving a small potential to reduce primary magnesite usage.

9
Substituting for magnesia is considered to be very difficult in the steel industry (estimated to be about 5%), while in the cement industry this could be as high as 30% (e.g. by bauxite or alumina); however, in neither application it is completely substituted.
Table 25: Substitutability scores for magnesite applicationsApplication Substitutability Score
Agricultural uses 1Environmental 0.7Refractory Materials 0.7Cement 0.7

Mining ofmagnesium raw materials•Ores: dolomite, magnesite, brucite•Salt•Brine
ExtractionRefining:
Removing of impurities Casting Manufactureand use
End of life
•Electrolysis•Thermal reduction "Pidgeon Process"
•Al alloys•Mg alloys•DesulfurizationRecovery (minor amounts)
9
1.12 Magnesium
1.12.1 Introduction
Magnesium (Mg, atomic number 12) is an alkaline earth metal which does not occur in its elemental form in nature. It is found in numerous different forms in seawater, minerals, brines and rocks, and is the eighth most abundant element in the Earth’s crust (average magnesium content: 2%).
A noticeable chemical characteristic is its combustion behaviour. Magnesium burns in the air with an intense white, non-flickering flame. The exothermic reaction releases enough energy in form of heat to sustain burning in the environment of water; this decomposes into hydrogen and oxygen. The latter reacts with magnesium to form magnesium oxide. Accordingly, magnesium fires are extinguished with dry salts or fluxes.ab
Magnesium is mainly produced from magnesite, (dolomite(66 %), salt and brine deposits (29 %), and seawater (5 %)c. The supply chain for magnesium is shown in Figure 91. In 2012, there was no primary production within the EU; however, magnesium is mined in neighbouring countries such as Serbia and Ukraine.a
Figure 91: Supply chain map for commercially produced magnesium
Source: In accordance with Ullmann’s Encyclopedia of Industrial Chemistry: Magnesium, 2003 Note: Orange colour represents stages of the supply chain which take place in the EU
Magnesium die-castings are used by car-makers in applications where to saving weight is important, as well as by the aerospace industry, and for sports goods and power toolsd. The main countries in Europe producing fused magnesia are France, Germany, the UK, and Austria. Magnesium chloride solutions (produced in Germany, Netherlands, France, and Italy) are another major use of magnesium; two thirds of magnesium chloride solutions reaching the market originating from Germany are a by-product from the potash industrye.
aUllmann’s Encyclopedia of Industrial Chemistry: Magnesium, Wiley-VCH Verlag GmbH & Co. KGaA, 2003
bMagnesium, Römpp Online, 2006
cMineral Commodity Summaries: Magnesium, U.S. Geological Survey, 2013
dCP Fluorspar, British Geological Survey, 2004
e

9
Ullmann’s Encyclopedia of Industrial Chemistry: Magnesium Compounds, Wiley-VCH Verlag GmbH & Co. KGaA, 2011

9
1.12.2 Supply
Primary sources, production and refiningThe prime raw material sources for magnesium are minerals (dolomite, magnesite and brucite), magnesium-rich salts (carnallite, bischofite, kainite and langbeinite), magnesium-rich brines, and seawater. Magnesium-rich brines are gained as by-products from potash production or extracted from surface and underground brine deposits. Magnesium silicates have not been used thus far for magnesium production.
Magnesium metal production is carried out using either electrolytic methods or by metallothermic reduction. The specific physical and chemical features of the source raw materials lead to considerable variation in the process technology employed. In practice a range of methods is utilised to minimise the content of impurities in the source materials and in the final metal product. To refine magnesium, the source mineral is melted and the higher density impurities sink to the bottom of the melt as sludge. Which metallic impurities are present depends on the choice of raw materials and the type of extraction process.
Large resources from which magnesium may be recovered are widespread globally. Resources of dolomite and other magnesium bearing minerals are thought to be very large. Resources of magnesium bearing brines are estimated to be in the range of billions of tonnes.a
Supply detailsEstimated primary world production of magnesium is shown in Table 23. China is by far the largest producer of mined magnesium, producing roughly 90% of world supply (Table 23). However, magnesium resources are widespread globally and the remainder comes from Russia (5%), Israel (4%), Kazakhstan (3%), Brazil (2%) and small amounts from Serbia and Ukraine. Information on US magnesium primary production is withheld.
Table 23: Estimated world primary production of magnesium, 2009-2011
CountriesMine production (tonnes)
%2009 2010 2011
China 501,000 654,000 661,000 86Russia 37,000 37,000 37,000 5Israel 19,405 (r) 23,309 (r) 30,000 4Kazakhstan 21,000 21,000 21,000 3Brazil 16,000 16,000 16,000 2Ukraine 2,000 2,000 2,000 0Serbia 1,500 1,500 1,500 0USA W W W -Total(rounded) 598,000 755,000 771,000 -Source: USGS (2013), 2011 Minerals Yearbook, Magnesium, W – Withheld, r – reported figure
It was reported that both China and Israel are planning to expand their primary production capacity for magnesium. Armenia and Australia have announced plans to introduce new capacity.a Malaysia and South Korea have opened plants since 2010 and Iran is likely to follow in 2013.b
aUSGS (2013), 2011 Minerals Yearbook, Magnesium
bRoskill (2013), Magnesium Metal: global Industry Markets & Outlook

9
Figure 92: Estimates world annual primary magnesium production by country, 2011
Brazil 2%
Other 0%
Kazakhstan3%
IsraelRussia 4%
5%
China 86%
Source: USGS (2013), 2011 Minerals Yearbook, Magnesium
EU trade flows and consumptionThe EU is a net importer of unwrought magnesium, importing around 126,000 tonnes per year (Figure 93). There was an exception in 2009 when EU imports were nearly half of those of other years due to the global economic crisis. EU imports of high and low purity magnesium are similar, around 60,000 tonnes per year. EU exports of magnesium of low purity are around twice of those for high purity magnesium. These figures do not account for trade in other substances and products containing magnesium, which is likely to account for substantial flows of this metal.
Figure 93: Trends in extra-EU trade for unwrought magnesium, containing >= 99.8% and <=99.8% by weight of magnesium (tonnes)
Source: Eurostat-Comext Database, CN 8104 19 00 and CN 8104 11 00 [accessed August 2013]
Around 90% of EU imports come from China for both higher and lower purity magnesium (Figure 94); this is consistent with China being by far the largest worldwide producer. The distribution of receiving countries is different for higher and lower purity magnesium. High purity magnesium is mostly exported to Norway (34%), the USA (18%) and Turkey (17%); low purity magnesium is mainly exported to the USA (32%) and Switzerland (29%). Some high purity magnesium was exported to Croatia in 2012 (before it joined the EU in 2013).
200
150
100 50
EU Export
0 Net 2008 2009 2010 2011
-50
-100
-150

Figure 94: EU’s major trading partners for unwrought magnesium, 2012
Combined EU Exports of UnwroughtMagnesium* (9,124 tonnes)Norway 10%
Combined EU Imports of UnwroughtMagnesium*(125,952 tonnes)
OtherUSA5%28%
Mexico5%
Other2%
China91%
Serbia9% Israel
5%
Brazil12%
Croatia1%
Switzer-land 25%
Russia2%
Turkey5%
Others14% North America
20%Other Asia
10%
Europe15%
China31%
CIS10%
Figure 95: World Magnesium Metal Consumption by Geographic Region, 2012 (%)
9
Source: Eurostat-Comext Database, CN 8104 19 00 and CN 8104 11 00 [accessed August 2013]* Containing >= 99,8% and <=99,8% By Weight of Magnesium
Europe’s share of world magnesium metal apparent consumption is estimated by Roskill to be 165,000 tonnes for 2012, which equates to 15% of the 1.1 million tonnes of world production. The share specifically attributed to the EU is approximately 130,000 tonnes or 12% of world consumption, once consumption on non-EU countries such as Norway and Turkey is subtracted from the total.
Other large consumers of magnesium metal include China (31%), North America (20%), CIS (10%) and other Asia at 10% (Figure 95). It is noted that ‘others’ account for 14% of world magnesium apparent consumption, some of which represents the statistical differences between imports and exports in the trade data.
Source: Roskill Information Services for 2013 CRM study
1.12.3 Demand
Prices and marketsVariations in magnesium prices due to supply and demand influences are shown in Figure 96.a The trend line shows that magnesium prices have decreased over the last century. Nevertheless, there have been some price peaks - such as a significant one in the mid-1970s when high energy costs, inflation and an increasing demand for aluminium cans, which contain magnesium, made prices rise. In 2007 and 2008,
aDERA, HWWI (2013) Ursachen von Preispeaks, -einbrüchen und –trends bei mineralischen Rohstoffen. April 2013.

9
the USA supplied less magnesium at the same time as energy and transport costs rose in China leading to increased prices before a fall due to the world economic recession. In 2010 and 2011, magnesium prices were reasonably stable.
Figure 96: Development of real Magnesium prices (Prices are deflated, 2011 = 100)
$/mt
16 000
14 000
12 000
Second World War
millitary stocks are sufficiently high
excess supply; breakdown of USSR
higher demand by automotive industry
supply in USA
10 000
8 000
6 000
Price Controlsin USA
decreases; increasing energy prices and transport costs in China
4 000
2 000
0
excess supply due to high production during second world war
increase use of aluminim cans
USA lifts import tax for Canada
Source: DERA, HWWI (2013) Ursachen von Preispeaks, -einbrüchen und –trends bei mineralischen Rohstoffen (Causes of price peaks, collapses and trends of mineral raw materials), Hamburg Institute of International Economics (HWWI) in contract for Deutsche Rohstoffagentur (DERA). April 2013., trend line and translation to English by Fraunhofer ISI
ApplicationsAs can be seen in Figure 97, aluminium alloys and magnesium die-casting are the major applications of magnesium, each accounting for about 40% of total consumption. In general, almost all aluminium alloys contain some magnesium, typically less than 1%. Selected groups of alloys may have higher magnesium contents, ranging from 1% to 11%. Aluminium alloys containing magnesium are used in a wide range of industries: packaging (35% of magnesium use in aluminium alloys), transport (25%) and construction (21%) are the three most important.
Apart from its use in aluminium alloys, magnesium is the principal constituent of magnesium alloys used in magnesium castings. Such castings are chiefly used by the automobile industry (as well as in aerospace components) because of the need for lightweight materials and premium corrosion performance. They are also used in defence applications and consumer goods such as laptops or mobile phones.
Magnesium is also an efficient desulphurising agent and is used in the manufacture of crude steel. In addition, magnesium has a range of other metallurgical, chemical and electrochemical uses, although these all remain relatively minor sources of consumption.

Nodular cast iron1%
Others8%
Aluminium Alloys40%
Steel desulphurisation12%
Magnesium die-casting39%
Figure 97: End-use of magnesium in Europe, 2012
3 000
2 500
2 000
1 500
1 000
500
OtherIron nodularisation Titanium refining Steel desulphurisation Die Casting Aluminium alloysCapacity
02012 2014 2017 2020
Figure 98: World magnesium capacity and end-use forecasts to 2020 (‘000s tonnes)
9
Source: Roskill 2013
Future trendsThe forecast for the magnesium metal market is shown in Figure 98. The overall market is characterised by significant excess capacity, with production currently at around 60% of rated capacity. However, further increases are expected in world primary and secondary magnesium production capacity, which will reduce capacity utilisation rates to nearer 50% in the middle of the decade. Whilst China is still expected to remain the dominant world producer, new projects are in progress in Iran, Australia, Canada, Russia and USA. Consolidation of the smaller Chinese producers is also expected. Approximately 12% of world magnesium production will be from secondary sources.
As for world demand, this is expected to grow at around 5% per year, with significant growth anticipated in both of the major end-markets for magnesium metal (aluminium alloys and die casting). However, forecast demand for some of the smaller end-markets will be somewhat slower at 2-4%.
Source: Roskill Information Services (September 2013)

9
1.12.4 Resource efficiency and recycling
Only a very small amount of magnesium is recycled. About 24,000 tonnes of magnesium, 3% of the world’s primary production, was recovered from old scrap in 2012. The USA is the major recycler of magnesium worldwide; it is reported that secondary production in 2012, for old and new scrap, was 75,000 tonnes.a It is reported that magnesium recycling takes place in Germany and that a new plant was due to open in 2012 in Romania.b Magnesium is also recycled within aluminium alloys.
UNEP reports that 39% of end-of-life magnesium is recycled.
Substitution scores for magnesium for application in its end uses are shown in Table 24.
Table 24: Substitutability scoring for Magnesium used in the analysis - by sectorsUse Substitutability score
Aluminium alloys 0.7
Magnesium die-casting 0.7
Steel desulphurisation 0.3
Nodular cast iron 0.7
Other 0.5
1.12.5 Specific issues
Several countries have restrictions concerning trade with magnesium. According to the OECD´s inventory on export restrictions, Russia uses export taxes on magnesium waste and scrap of 20% and Brazil has a licensing agreement on magnesium, articles thereof, magnesium waste and scrap, raspings, turnings, granules and powders.
aMineral Commodity Summaries: Magnesium, U.S. Geological Survey, 2013
bUSGS (2013), 2011 Minerals Yearbook, Magnesium
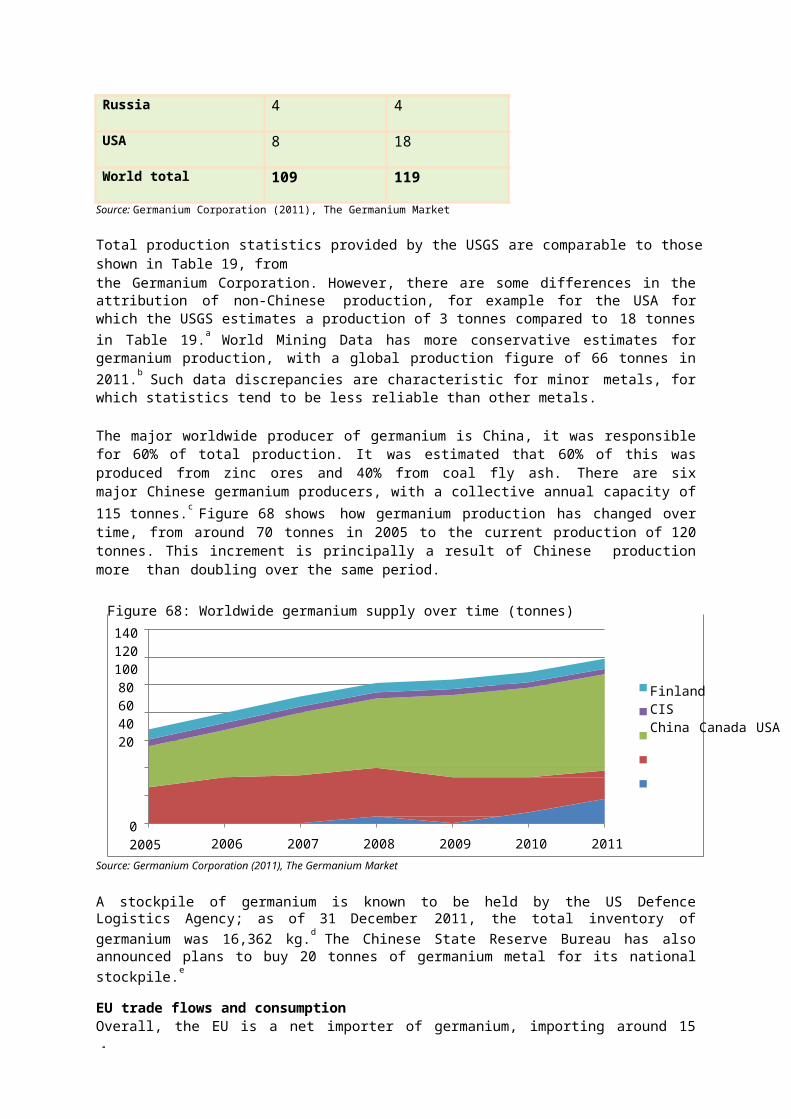
ConcentratiMine flake graphiteon and
purification
Milling ancclasificationProcessing to produce by flake sizespherical graphite
Manufacture of anode materials
Manufacture and use of cells End of life
1
1.13 Natural graphite
1.13.1 Introduction
Graphite is one of three pure forms of carbon (C, atomic number 6), the others being diamond and fullerenes. It is grey to black in colour, opaque, and often has a metallic lustre. It is a soft, light mineral, is flexible but not elastic and has a high melting point of 3,390°C. Graphite’s layer atomic structure is responsible for many of its unique properties. It exhibits both metallic and non-metallic properties, including high thermal resistance, lubricity, inertness as well as thermal and electrical conductivity. The focus of this work is natural graphite.
Owing to its diverse properties, graphite is used in a wide variety of applications. Most of graphite usage today is in refractory applications. Other key industrial applications for graphite include lubricants, steelmaking, metal casting, brake linings. Due to its combination of conductivity and high thermal stability, graphite is also used in fuel cells, batteries and pebble bed nuclear reactors. An important emerging use for graphite is for lithium-ion (Li-ion) batteries used in hybrid and electric vehicles. Future demand for graphite will increase significantly when electric vehicles gain market momentum.
A supply chain map for the use of graphite in batteries is shown in Figure 99 (with stages in the EU highlighted in orange). At present only the final steps of the supply chain occur in the EU. Anode materials for use in batteries are primarily manufactured in Europe by SGL Group, this takes place on a large scale in Germany and Poland. Manufacture of Li-ion batteries is limited in the EU, cell manufacture is concentrated in the Far East and North America. However, battery assembly occurs more widely in Europe, this practice is increasing with the electrification of road transport. Within Europe companies such as Axeon, Varta and Saft manufacture batteries in countries such as Poland, UK and Germany. End of life treatment facilities for Li-ion batteries exist throughout Europe. At present recycling of graphite from post-consumer products does not take place as, during the pyrometallurgical process which is employed for battery recycling, graphite materials are lost.
Manufacturers of Li-ion batteries place stringent requirements on the purity of anode graphitea, as the presence of trace elements can have significant effects on the electrochemical properties.b As a consequence, a complicated and low-yielding purification and rounding process is required.c Following rounding and purification, the graphite can be used to produce anode materials which are then used in the manufacturing process for Li-ion cells.
Figure 99: Supply chain map for graphite in batteries
Note: Orange colour represents stages of the supply chain which take place in Europe
There are three forms of natural graphite, which are characterised by their mode of formation, these are: amorphous, flake and vein or lump. Each of these forms of graphite is found in types of ore deposits and have different end uses. Consequently, each form of graphite will be considered in turn, permitting that suitable data is available. Other important forms of graphite include spherical graphite, expandable graphite and graphene; all of which are produced from flake graphite.
1.13.2 Supply
aSpherical graphite is used for the production of anode materials, but synthetic graphite can also be used. Flake graphite with a particle size fraction of -100
mesh and a purity of at least 95% is required for production of anode-grade graphite.b
Carbon-based anodes – A “rare earth” situation, Michael Steinrötter, Batteries & Energy Storage Technologies, Winter 2011.c
A wet chemical process is employed to purify the spherical graphite and remove any metal elements present.

cRefractory-grade graphite: how healthy is it? Simon Moores, Industial Minerals, presentation
1
In nature, graphite is found in metamorphic rocks such as marble, schist and gneiss. Flake and amorphous graphite are mined both underground and in open pits; vein graphite is only mined underground. However, graphite can also be synthesised from oil-based feedstocks; at present the cost of synthetic graphite is higher than that for naturally occurring graphite. Synthetic graphite accounts for a significant share of the graphite market, in particular in North America.a In 2011 synthetic graphite contributed 56% to global graphite markets.b The production of synthetic graphite powder typically involves a small number of specialised producers in North America, Europe and Japan. High production costs and processing knowledge limit growth in this area. Note that discussions below focus on natural graphite.
SupplyWorld mine production of natural graphite (all three forms) was estimated for 2012 was estimated at1.1 million tonnes. China is the world’s dominant producer accounting for 68% of world supply in 2012 (Table 25). Both China and India (the world’s second largest producer) have high political risk ratings. In 2012 Brazil had a 16% share of the world flake graphite production, and is increasing its output.c
However, the focus of Brazilian producers is domestic supply and not exports. Within the EU, import dependence on natural graphite is around 95%.
Table 25: Natural graphite production concentration in 2012
raphite
Source: (US Geological Survey, 2013)
Amorphous graphiteOf all three forms, amorphous graphite is the most abundant in the ground and least valuable. Amorphous graphite has a micro-crystalline structure and is normally found as large lumps. It is a seam mineral and is formed from by the metamorphism of previously existing anthracite coal seams. Deposits of amorphous graphite are often found with coal deposits; however, separation of amorphous graphite from coal is a far from trivial process and results in a lower quality product.
a USGS, Statistics and Information, Graphite, Available: http://minerals.usgs.gov/minerals/pubs/commodity/graphite/ (Accessed 12.2.2012).b
CountryMine production, 2012
Reserves (tonnes) Type of Gtonnes percentage
China 750,000 68% 55,000,000 Amorphous, Flake
India 150,000 14% 11,000,000 Flake
Brazil 75,000 7% 360,000 Flake
North Korea 30,000 3% 11,000 Amorphous, Flake
Canada 26,000 3% # Flake
Sri Lanka 10,000 1% 8 Flake, Vein
Turkey 10,000 1% # Amorphous
Mexico 8,000 1% 3,100,000 Amorphous, Flake
Romania 7,000 1% # Amorphous
Norway 7,000 1% 1,000,000 Amorphous, Flake
Ukraine 6,000 0% # Flake
Madagascar 5,000 0% 940,000 Flake
Other countries 7,000 1% 6,600,000 —
World total 1,100,000 — 77,000,000

cRefractory-grade graphite: how healthy is it? Simon Moores, Industial Minerals, presentation
1
Graphite: Anatomy of a bull market, presentation by Chris Berry, House Mountain Partners Inc., Graphite Express Conference Vancouver, 2012

1
This form of graphite accounted for 44% of production in 2012.a Large deposits of amorphous graphite can be found in China, India, Brazil, North Korea, Mexico and the USA. Most amorphous graphite is produced in China (89% of world production in 2012).a Asia dominates production of amorphous graphite, as shown in Table 26.
Table 26: Amorphous graphite production by region, 2012
Region Mine production, 2012tonnes percentage
Asia 405,100 93%Other 32,150 7%World total 437,250 -Source: Roskill Information Services Natural and Synthetic Graphite, Global Industry Markets and Outlook, 8th Edition
Flake graphiteFlake or crystalline graphite consists of multiple layers of stacked graphene. It occurs in metamorphic rock as separate crystallised layersb, in concentrations of 5-10% of the ore body. Compared to amorphous graphite, it is less common and of higher purity.b Flake graphite accounted for 55% of world natural graphite production in 2012. As with the amorphous form, China dominates the production of flake graphite. This form of graphite is also mined in Austria, Brazil, Canada, Germany and Madagascar. Table 27 shows the world flake graphite production by region for 2012.
Table 27: Flake graphite production by region, 2012
RegionMine production, 2012tonnes percentage
Asia & Oceania 423,760 77%South America 75,000 14%North America 26,000 5%Europe 19,100 3%Africa & Middle East 6,000 1%
World total 549,860 -Source: Roskill Information Services Natural and Synthetic Graphite, Global Industry Markets and Outlook, 8th Edition
Following extraction and crushing, flotation methods are used in order to concentrate and purify flake graphite. Following this the material is milled and ground before classification by flake size, and blends with defined flake size distribution are then created. The size of the graphite flake is of commercial importance. There are three primary sizes of flake graphite available: coarse, medium and fine. Coarse flake graphite is +80 mesh, medium flake is +100 mesh and fine flake is -100 mesh.
Flake graphite is further processed to produce spherical graphite, which is used in Li-ion batteries. Compared to flake, spherical graphite has better electrochemical performance which is critical for use in batteries. To produce it, graphite flakes are milled into spheres and then coated with carbon. However, this is a complex synthesis with low yields and the materials costs are greatly increased.
Expandable graphite and graphene are also produced from flake graphite. Expandable graphite is formed by expanding the carbon layers of flake graphite and introducing atoms or small molecules to this space. Expandable graphite is primarily used as a flame retardant; in comparison to other flame retardants it is free from halogens and heavy metals, is low cost and suitable for a wide range of applications. Graphene
aIndustrial Minerals, Graphite Market Tracker, http://www.indmin.com/MarketTracker/197195/Graphite.html?id=GT-C accessed 13/02/13
b
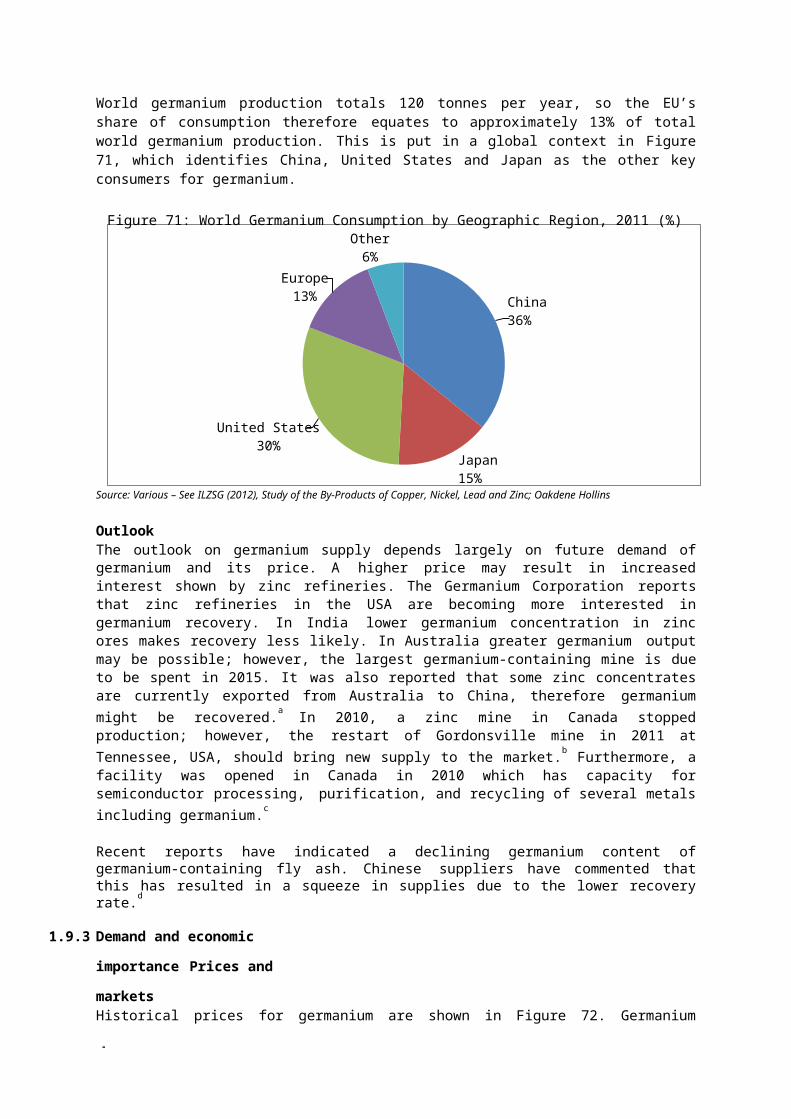
1
Graphite 2010 Minerals Yearbook, Donald W. Olson, USGS, May 2012

200 000
150 000
100 000
50 000
0
2008 2009 2010 2011 2012
ExportsImports Net Exports
-50 000
-100 000
-150 000
-200 000
Figure 100: Trends in EU trade for natural graphite (tonnes)
1
is a relatively new discovery (2004) and as yet it is produced in limited quantities. Carbon nanotubes, an even newer discovery, consist of graphene.
Vein graphiteVein or lump graphite is the most valuable and rarest form of graphite.b Vein graphite is also the purestform of graphite. It is named due to the fact that it is only found in veins and fissures in the enclosing ore. This form of graphite is only mined commercially from Sri Lanka and in 2012 accounted for 1% of world production for natural graphite.a Approximately 3,500 tonnes of vein graphite was produced in Sri Lanka during 2012.
EU trade flows and consumptionOverall, the EU is a net importer of graphite and imports around 100,000 tonnes per year. The trends in EU trade for graphite from 2008 to 2012 are shown in Figure 100. These do not account for trade in products derived from this material such as batteries.
Source: Eurostat-Comext Database, Code 25041000 [accessed July 2013]
The major destinations for the EU’s exports of natural graphite in 2012 were Japan, Turkey, South Korea and Russia, as shown in Figure 101. Significant intra-EU trade also takes place.

Figure 101: EU’s major trading partners for natural graphite, 2012EU Exports of Graphite (4,974 tonnes)EU Imports of Graphite (80,990 tonnes)
Switzer-land 3%
Other13%
Turkey14%
Ukraine3%
Other 7%
Brazil4%
Japan13%
China57%
China7%India 7%
Canada4%
SouthKorea 11%
Belarus5%
Ukraine9% USA
9%
Russia10%
Norway9%
Brazil15%
Other 3%South America
8%North America 9%
Europe 13%
Asia 67%
Figure 102: World Natural Graphite Consumption by Geographic Region, 2012 (%)
1
Source: Eurostat-Comext Database, Code 25041000 [accessed July 2013]
Europe’s consumption of natural graphite in 2012 is estimated at 123,000 tonnes (87,000 tonnes of flake graphite and 36,000 tonnes of amorphous graphite). This puts Europe’s share of natural graphite consumption at 13% of the worldwide total (Figure 102). The share specifically attributable to the EU-27 is approximately 78,000 tonnes or 8% of worldwide natural graphite consumption, based upon the analysis of trade statistics.
Asia represents the largest market for natural graphite at two thirds of world consumption. North and South America both account for around 8-9% of the world market, with 3% in other countries (Figure 102).
Source: Source: Roskill Information Services Natural and Synthetic Graphite, Global Industry Markets and Outlook, 8th Edition
1.13.3 Economic importance
Prices and marketsGraphite pricing is determined by chemical and physical characteristics: the carbon content and particle size, as well as the form of graphite. In general, the price increases with increasing mesh size and carbon content. Historical natural graphite prices can be seen in Figure 103.

1 000900800700600500400300200100
0
1970 1980 1990 2000 2010
Figure 103: Natural graphite historical price volatility (98US$/tonne)
Figure 104: Worldwide uses of graphite, 2010 (tonnes)Others; 10%
Lubricants; 14% Steel , Foundries &Refractories, 41%
Batteries ; 10%
Automotive parts;14% Carbon brushes;
11%Source: Northern Graphite Corporation and Mackie Research Capital, 2011a
1
Source: USGS (2012- ), Historical Statistics for Mineral and Material Commodities in the United States [accessed February 2013]. Figures are indexed to 1998 values.
ApplicationsDue to its combination of metallic and non-metallic properties, graphite is used for a wide variety of applications, summarised in Figure 104. The largest market for graphite is in traditional industries such as steel and refractories; high thermal stability makes graphite suitable for these applications.
Major markets for graphite are as follows: Refractory applications: Graphite has been used for refractory applications for over 100 years, and
the industry is the leading consumer of flake graphite - in 2010 accounting for almost 49% of flake graphite consumption.b Refractory applications involve the use of extremely high temperatures; therefore materials are required which are able to withstand such conditions. High temperature graphite bricks, linings and shapes are used in refractory applications. Magnesia-graphite bricks areused in preference to graphite for high-temperature and corrosive conditions including steel and iron blast furnaces and ladles. Alumina-graphite shapes are also fundamental for refractory applications and are used as continuous casting ware.
ahttps://secure.mackieresearch.com/login/sample_research/NGC_08-10-11_Report.pdf accessed 21.02.13

1
Steel industry: In steel-making, the main use of graphite is as an agent for increasing the carbon content of steel. The market for graphite use as steel raisers is highly competitive and under threat from alternatives which include other forms of graphite. Graphite is also required for other aspects of steel production such as liners for ladles and crucibles, and refractory applications. Flake graphite is also used to make expanded graphite, which is used for insulation in the steel making process. Graphite powder can also be used as a thermal blanket for the continuous steel casting process.a
Foundry applications: Due to its high thermal stability, graphite is used in a variety of foundry applications. An example is the use of fine flake or amorphous grade graphite with water based paint to create a foundry facing mould wash. The inside of a mould is painted with this wash, which creates a fine graphite coat which eases the separation of an object cast from the mould. Graphite washes also protect foundry equipment from corrosion.
Automotive parts: Due to its light weight and natural lubricity, graphite plays an integral role in automotive engineering. Graphite is used in brake linings, exhaust systems, motors, clutch materials and gaskets. Graphite is also essential for emerging applications in the automotive industry such as electric vehicle batteries and fuel cells.
Lubricants: A traditional use of graphite is as an industrial lubricant. Flakes of graphite are able to slip over one another thus giving graphite a ‘greasy’ texture. Graphite lubricants are often used in applications where oil or grease lubricants are not recommended. However, changes in technology have reduced the demand for graphite as a lubricant.
Batteries: Graphite is widely used as in many types of primary or secondary, portable and industrial batteries as anodes. Graphite is favoured for anodes in Li-ion batteries, the most commonly used battery type for both portable devices such as mobile phones and laptops as well as for electric vehicles. High purity flake or synthetic graphite are commonly used for battery anodes.
Carbon brushes: A common use of graphite is for brushes found in electric motors, alternators and electric generators. Graphite brushes effectively transfer electric current to a rotating armature whilst minimising frictional wear. Typically synthetic or flake graphite are used for this application.
Other applications for graphite include: antiknock gasoline additives, drilling mud, electrical and electronic devices, industrial diamonds, thermally conductive polymers, magnetic tape, mechanical products, pencils, advanced ceramics, paints and polishes and soldering/welding.b
Emerging high-technology applications for graphite include: fuel cells, pebble bed nuclear reactors (PBNRs), Li ion batteries, vanadium redox batteries, ceramic armour tiles, oil sand recovery, electro- consolidation, non-slip paving and production of graphene.b High-tech emerging applications such as fuel cells and Li-ion batteries will require flake or high grade synthetic graphite.
It is vital to consider the different types of graphite each in turn, as they will be subject to different supply issues and risks. Applications by type of graphite are shown in Table 28 - there are some uses for which either amorphous of flake graphite can be used.
Table 28: Applications by type of graphite
Source: BRGM and Northern Graphite Corporation.
aIndustrial Minerals Laboratory Manual Flake Graphite, C. J., Mitchell, British Geological Survey, 1993.
bGraphite Industry Report, Syrah Resources, 2012
Type of Graphite Applications
Natural: AmorphousCarbon brushes, heat sinks, coated conductors, refractory applications, brake pads, clutches, foundry applications, steel alloys, Lubricant additives, pencils, paints, rubber and polymer composites, thread compounds,
Natural: Flake
Batteries, carbon brushes, heat sinks, coated conductors Lubricant additives, pencils, refractory applications, graphite shapes, coated conductors brake pads, clutches, foundry applications, powder metallurgy, drilling mud additives, nuclear reactors, flame retardants, synthetic diamonds.
Natural: Vein Foundry applications, lubricants, powder metallurgy , electrical components, carbon brushes

1 600
1 400
1 200
1 000
800
600
400
200
OthersGraphite Shapes Recarburising Friction products Lubricants Batteries Foundries RefractoriesSupply
-2012 2014 2017 2020
Figure 105: World natural graphite supply and end-use forecasts to 2020 (‘000s tonnes)
1
1.13.4 Outlook
The market outlook forecast for world natural graphite supply and demand is shown in Figure 105. Overall, the current small surplus is expected to widen to around 15% of world supply by 2017. Much of the recent expansion in primary production of graphite has taken place in China and Brazil, though there are potentially large increases in world flake production planned from North and South America, which could represent around 40% of flake natural graphite supply by 2020. There are currently around 70 graphite projects worldwide at an early exploration stage, around 50 of which are located in Canada. It is probably that many of these projects will not ultimately be successful, so the supply growth forecast for flake graphite could be nearer 3% per year, rather than the 6% forecast here. Supply growth in Asia for both flake and amorphous grades will be steadier, at nearer 2% growth per year.
Source: Source: Roskill Information Services for 2013 CRM study
Graphite demand is expected to grow in the near future at around 3.4% per year to 2010, as a result in growth from traditional and emerging markets. Growth in the largest market, refractories, is roughly expected to track this rate of demand growth at around 3% per year. Stronger growth is forecast for flake grades of natural graphite, particularly for the batteries, friction products, lubricants and graphite shapes. Slower growth is forecast for graphite consumption in foundries
Graphite anodes in lithium-ion batteries are viewed as a particularly important developing market. These batteries can be found in mobile phones, laptops, tablet computers and other portable high tech equipment as well as in electric vehicles. This is an important application of graphite for Europe, as consumption of Li-ion batteries is rising. European battery manufacturers are increasing capacity to cope with demand. Nissan and Daimler are heavily investing in manufacture of Li-ion batteries and are expected to have capacity for the equivalent of 100,000 electric vehicles in Europe by 2015.a Electric vehicle batteries require a large amount of spherical graphite; for example, it is reported that 38.5kg is needed for a Nissan LEAF battery pack.b Li-ion batteries require about 10 times more graphite than lithium by weight. Demand for graphite from the battery market is expected to grow by 25% a year up to 2020, which will require 370,000 tonnes of high purity large flake graphite. c
aElectric Cars: Plugged In 2, Deutsche Bank Global Markets Research, 2009.
bCarbon-based anodes – A “rare earth” situation, Michael Steinrötter, Batteries & Energy Storage Technologies, Winter 2011.
cGraphite: Anatomy of a bull market, presentation by Chris Berry, House Mountain Partners Inc., Graphite Express Conference Vancouver, 2012.

1
Spherical graphite which is produced from flake graphite is required for batteries. However, the process is inefficient and to produce one tonne of spherical graphite requires three tonnes of flake graphite.a It is likely that much of this demand will have to be met by synthetic graphite.
Another emerging application for graphite is graphene, first discovered in 2004. Graphene is a better conductor of heat and electricity than copper. Naturally there has been significant interest in exploiting these exceptional properties and many companies are undertaking research on graphene. Potential applications for graphene include electronics, desalination, solar cells, energy storage and biodevices. Graphene has been suggested as a potential successor to silicon in microchips, silver in solar panels and copper in electronics.
Other future applications requiring natural graphite include fuel cells, vanadium redox batteries and pebble bed nuclear reactors. PBNRs are small, modular reactors which are safer than the current generation of nuclear reactors. They are fuelled by uranium which is embedded in tennis ball sized spheres of graphite: a large amount of graphite is required to start-up and fuel them. PBNRs could require 400,000 tonnes of large flake graphite by 2020. Vanadium redox batteries offer significant storage capacity, long lifetimes and low maintenance and are therefore expected to be used for stationary power storage. However, these batteries require around 300 tonnes of flake graphite per 1,000 megawatt of storage capacity. Fuel cells convert chemical energy from fuel source, normally hydrogen, methanol or natural gas, to generate electricity. Proton membrane exchanges used in fuel cells require around 60 kg of graphite per vehicle. At present it is not clear when significant demand will arise from any of these three emerging applications.
1.13.5 Resource efficiency and recycling
At present, recycling of graphite from old scrap is very limited and only occurs for a few applications of graphite. A lack of economic incentive combined with technical challenges has stalled the market for recycled graphite. There is little to no information available on the global quantities and values of recycled graphite.
High-quality flake graphite is not commonly recovered, and although from some applications it is technically feasible the relative abundance of graphite inhibits recycling. For example, recycling of batteries does not target graphite and during pyrometallurgical recovery processes it is valorised in the smelter and lost. However, it possible to recover graphite from batteries if a hydrometallurgical process is employed. At present such processes are in the pilot plant stage. For applications such as brake pads and carbon brushes it is not technically feasible to recycle or recover the graphite used. In these applications the graphite is designed to be dissipated. However, there is a growing market for recycled refractory graphite materials. Products such as refractory brick linings, magnesia-graphite bricks and alumina-graphite shapes are being recycled into products such as thermal insulation and brake linings.b
The most common substitutes for graphite are other forms of carbon, for instance in steelmaking coke or anthracite can be used as carbon raisers. In some foundry applications it is possible to use calcined coke instead of natural graphite. For lubricant applications, molybdenum disulphide is a good substitute for graphite although it is sensitive to oxidising conditions.a For Li-ion batteries, lithium titanate compounds are good substitutes for graphite anodes.
Synthetic graphite can be used as a substitute for natural graphite in some applications. The rising price of natural graphite may lead to increasing substitution with synthetic graphite. Applications where synthetic can be used in place of natural graphite include: batteries, brake linings, lubricants and carbon brushes. Synthetic graphite cannot be used as a substitute for natural graphite in refractory applications.
aGraphite juniors should not ignore traditional markets – panel, Jessica Roberts, Jack Elliott, Siobhan Lismore, Industrial Minerals, January 2012
bUSGS, Statistics and Information, Graphite, Available: http://minerals.usgs.gov/minerals/pubs/commodity/graphite/ (Accessed 12.2.2012).
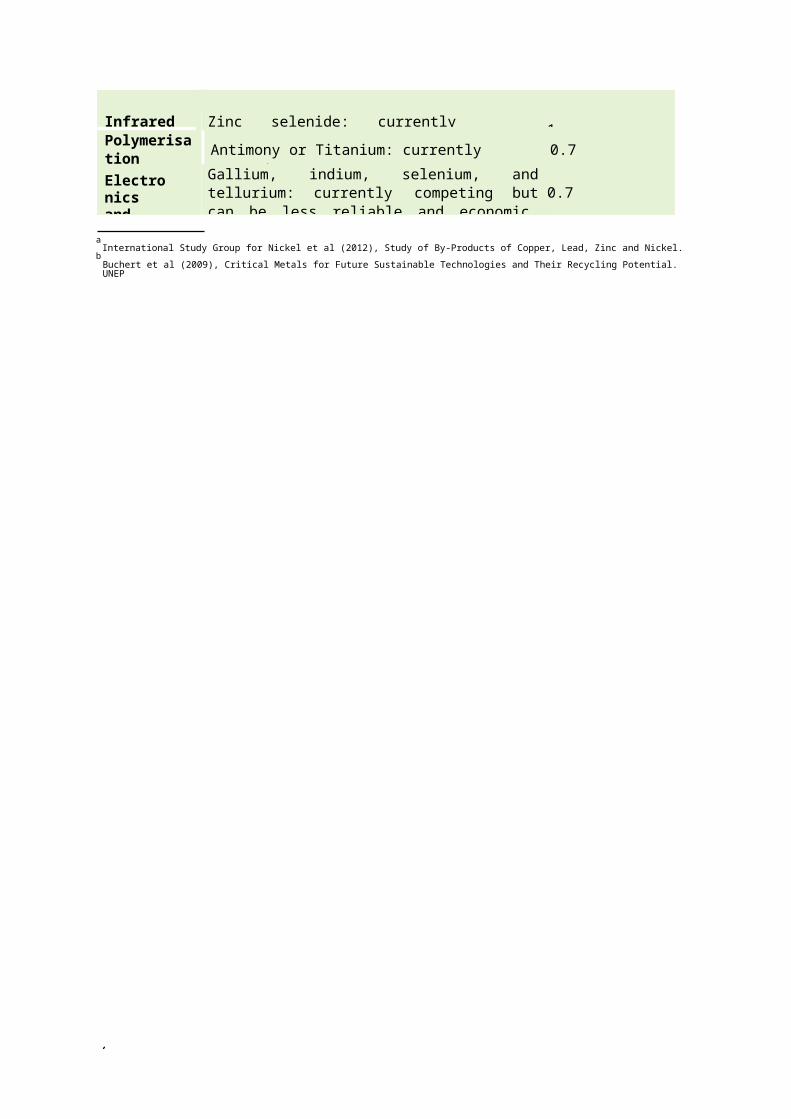
[Accessed September
1
Table 29: Available substitutes for natural graphite applications
Use Substitutes/Rationale Substitutability score
Refractory applications
Ceramics/silicon carbide/andalusite/ bauxite/chromite/kyanite 0.3
Foundry applications Synthetic graphite/coke 0.7Automotive parts Composite materials/organic materials 0.3Batteries Synthetic graphite/titanium/lithium 0.7
LubricantsMolybdenum disulphide/lithiumcompounds/mica/talc 0.3
Other Arbitrary assumption 0.5
1.13.6 Specific issues
From the OECD’s inventory of restrictions on exports of raw material it can be seen that China has export restrictions on natural graphite in place.a China applies a 20% export tax on natural graphite.
aOECD (n.d.), Inventory of Restrictions on Exports of Raw Materials. http://qdd.oecd.org/Subject.aspx?subject=1189A691-9375-461C-89BC-48362D375AD5.

Niob, Römpp Online,
1
1.14 Niobium
1.14.1 Introduction
Niobium (Nb, atomic number 41), also known as Columbium, until 1949 when ‘niobium’ was finally accepted, is a metallic element with chemical properties similar to tantalum and vanadium. Niobium is a soft, ductile, light grey - but if polished lustrous white - metal, which resists all acids with the exceptions of hot acid sulphur and hydrogen fluoride. Niobium is mainly used in the manufacture of steel for construction and high temperature applications. Recently, high-strength and low-alloy steels for automobile industry, pylons, offshore platforms and pipelines have become a more important use of niobium.a
Since there is no primary niobium production in Europe, scrap is the only available intra-European raw material source. It is directly processed in steel production. Ores and concentrates, oxides and niobium metal have to be imported. Whereas niobium metal is also processed directly in steel production, ores, concentrates and oxides run through different oxide or metal powder inter-stages. Figure 106 provides an overview of the whole EU niobium supply chain.
Figure 106: Supply chain map of niobium
Source: Eurometaux
1.14.2 Supply
Primary sources, production and refiningWorldwide, niobium is very widespread, but rarely accumulated in high concentrations. Overall there are around 60 niobium-containing minerals.b Generally, two types of niobium ore deposits are known. In primary deposits, pyrochlore – the most important niobium mineral – is always interstratified in carbonatites. In Canadian deposits, for example, calciopyrochlore is interstratified in dolomite, containing 0.5-0.7% niobium pentoxide. In secondary deposits, mainly located in Brazil, the niobium pentoxide content has been enriched to 3% by weathering.
Pyrochlore concentrates containing 50-60% niobium pentoxide are obtained by conventional extraction processes, such as crushing, grinding, magnetic separation and flotation. Brazilian concentrates are also treated chemically to remove impurities; concentrates are roasted in a rotary furnace and subsequently leached. Whereas in case of most Brazilian pyrochlore concentrates this procedure is sufficient to
aNiob, Römpp Online, 2006
b

1
convert it directly into ferro-niobium, concentrates from other sources have to be chemically pre-treated before niobium can be obtained. These additional processes are generally regarded as uneconomic.a
The second most important niobium mineral is columbite, in which niobium is always present with tantalum. These ores are referred to as columbites if the niobium pentoxide content is greater than that of tantalum pentoxide, otherwise they are known as tantalites. They occur as primary deposits in granites and pegmatites, or in alluvial secondary deposits. A complex chemical process of blendings, decompositions, filtrations, solvent extractions and calcinations is necessary to remove impurities and to separate niobium and tantalum. However, niobium and tantalum can be produced with high yield (>95%) and purity (>99.9%) due to sophisticated process control and optimization. A modern alternative to this extraction process is the chlorination process, which occurs in two versions: reductive chlorination ofnatural and synthetic raw materials, and chlorination of tantalum-niobium ferroalloys.a
World reserves of niobium are shown in Table 30. Almost all world reserves are located in Brazil although around 5% of global reserves are in Canada. The USA has around 150,000 tonnes of niobium resources but extraction of these is not economic at current niobium prices. It is thought that niobium resources are more than adequate to supply future needs.b
World reserves of niobium as published by USGS are shown in Table 30. USGS sees almost all world reserves to be located in Brazil and over 5% of global reserves in Canada. Nevertheless, the USA has around 150,000 tonnes of niobium resources but extraction of these is not economically feasible at current niobium prices. Morevover, there are several deposits in Europe, for instance in Finland (Sokli)c
and Norway. It is thought that niobium resources are more than adequate to supply future needs.d
Supply detailsTable 30 shows figures for global production of mineral concentrates of niobium. As can be seen, production is concentrated in Brazil. Niobium is also mined in Canada and Nigeria.
Table 30: World production of mineral concentrates of niobium and reserves, tonnes of niobium content
CountryProduction (tonnes)
% Reserves (tonnes)2009 2010
Brazil 58,000 58,000 92 4,100,000
Canada 4,330 4,420 7 200,000
Nigeria 360 480 1 -
Other 340 270 0 -
Total (rounded) 63,000 63,200 - >4,000,000
Source: USGS (2013), Minerals Yearbook 2011, Niobium and TantalumEU trade flows and consumptionTrade statistics are shown are for imports and exports from the EU of ferro-niobium. Data for niobium ores and metal are not available; however, ferro-niobium is the leading commercial niobium-containing material and contains on average 60% niobium.e Overall, the EU is a net importer of ferro-niobium, importing around 19,000 tonnes per year (Figure 107). A clear exception to this was in 2009 when imports were nearly halved. Demand for ferro-niobium depends heavily on the demand for steel, and trade in steel is not captured in these statistics. Figures for 2009 clearly reflect the effect of the global economic crisis. Imports have increased since 2009, but have not yet recovered to 2008 levels.
aUllmann’s Encyclopedia of Industrial Chemistry: Niobium and Niobium Compounds, Wiley-VCH Verlag GmbH & Co. KGaA, 2011
bUSGS (2013), Mineral Commodity Summaries 2013, Niobium (Colombium)
cfem.lappi.fi/c/document_library/get_file?folderId=48927&name=DLFE-2796.pdf
dUSGS (2013), Mineral Commodity Summaries 2013, Niobium (Colombium)
e

1
USGS (2013), Minerals Yearbook 2011, Niobium and Tantalum

25 00020 00015 00010 0005 000
0-5 000
-10 000-15 000-20 000-25 000
2008 2009 2010 2011 2012
EU ExportEU Import Net Export
Figure 107: Trends in extra-EU trade for ferro-niobium (tonnes)
1
Source: Eurostat-Comext Database, CN 7202 9300 [accessed August 2013]
The vast majority of ferro-niobium imports into the EU come from Brazil, followed by Canada (Figure 108). This is consistent with production data for niobium. Exports of ferro-niobium are negligible compared to imports. This material is exported to a number of countries, the major destinations being Iran and the USA.

1
Figure 108: EU’s major trading partners for ferro-niobium, 2012
EU Exports of Ferro-Niobium (863t)
Argentina 3%
Other 16% Iran
27%
Peru 3%
Serbia 4%
Kazakhstan 5%
Canada 5%
Turkey 6%
Russia 8%
India 8%
United States 15%
EU import of Ferro-Niobium (19,457 t))
Canada 14%
Brazil 86%
Source: Eurostat-Comext Database, CN 7202 9300 [accessed August 2013]
The EU’s share of ferro-niobium is estimated to be approximately 24% of world consumption (Figure 109). Roskill comment that this is around 13,000 tonnes of contained niobium, which equates to a slightly lower estimate of 22% of the 60,300 tonnes of world niobium production.
Other major niobium consuming regions include China (25%), Japan (10%), other Asian countries (11%), Americas (21%) and CIS (7%).

CIS7%
Rest of World2%
China25%
EU24%
Japan10%
Americas21%
Other Asia11%
Figure 109: World consumption of Ferro-niobium by Region (%)
60 000
50 000
40 000
30 000
20 000
10 000
01970 1980 1990 2000 2010
Figure 110: Niobium historical price volatility (98 US$/tonne).
1
Source: Niobec Company Literature (March 2012), Niobium 101
1.14.3 Demand and Economic Importance
Prices and marketsHistorical prices for niobium are shown in Figure 110. Niobium increased throughout the 1970s until a large peak in prices in the late ‘70s due to increased demand, particularly for steel making. In 1980, an important change in the supply of niobium took place. New plants that produced niobium dioxide from pyrochlore were established in Brazil and the USA; this lowered the price due to increased supply from the large quantities of pyrochlore produced in Brazil and Canada. Prices were steady until 2006, with the exception of a small peak in 2001. The increase in the late 2000s is likely to be due to increase demand for steel, particularly from China.a
Source: USGS (2012- ), Historical Statistics for Mineral and Material Commodities in the United States [accessed February 2013]. Figures are indexed to 1998 values.ApplicationsMajor global end uses for niobium are shown in Figure 111. These are:
aUSGS (2012), Metal Prices in the United States Through 2010

Steel: Chemicalindustry 3%
Others6% Steel: Structural
31%
Superalloys8%
Steel: Pipeline24%
Steel: Automotive28%
Figure 111: Worldwide end-use of niobium
1
Source: Heraeus 2010 (taken from CBMM)
High-strength low-alloy (HSLA) steels: Niobium-containing HSLA steels are mainly used in: Construction: 31% of total ferro-niobium consumption. Used for lightweight structures that
require additional strength and corrosion resistance, and as high strength reinforcing bars with good weldability.
Automotive: 28% of total ferro-niobium consumption. Used to improve fuel efficiency through weight reduction.
Oil and gas pipelines: 24% of total ferro-niobium consumption. Used for the pipelines’ superior ability to withstand increased pressure and volumes over greater distances.
Alloys: Niobium is also used in special alloys for the nuclear and the aircraft industries. Small applications: Smaller quantities of niobium are used in many other applications, such as
magnets, superconductors, jewellery, thermometers, capacitors or catalysts.
Future trendsThe market outlook forecast for the world production capacity and consumption of ferro-niobium is shown in Figure 112. Ferro-niobium is by far the largest market for niobium, representing over 90% of worldwide niobium demand. Strong demand growth is forecast for ferro-niobium, at over 8% per year. There are two main factors driving this strong growth rate. Firstly, there is the general strong global demand for steel in construction, infrastructure and automotive applications. However, there is also a trend towards greater use of HSLA steel, for which niobium is one key alloying element. Putting together these two trends means that the growth in worldwide demand for ferro-niobium is likely to exceed the overall trend for steel, due to the higher intensification of use expected for niobium.
On the supply-side, there are three main producers of niobium worldwide. The largest of these, CBMM in Brazil, has announced further rises in its production capacity, which will reach a total capacity of 150,000 tonnes of ferro-niobium in the coming decade. Other rises in capacity or the opening of new deposits mean that total worldwide ferro-niobium will keep pace with - and slightly exceed - consumption forecasts.

250
200
150
Consumption
100Capacity
50
02010 2012 2015 2020
Figure 112: World ferro-niobium capacity and consumption forecasts to 2020 (‘000s tonnes)
1
Source: Niobec (March 2012), Niobium 101
1.14.4 Resource efficiency and recycling
Recovery of niobium itself from scrap is negligible, but a reduction of niobium consumption is achieved by the recycling of niobium-containing steels and superalloys. Data on the absolute amount of niobium recycled are not available, but according to USGS it may be as much as 20% of apparent consumption.a
Substitution of niobium is possible, but it may involve higher costs and/or a loss in performance (Table 31). The following materials can be substituted for niobium:
molybdenum and vanadium, as alloying elements in HSLA steels tantalum and titanium, as alloying elements in stainless and high-strength steels ceramics, molybdenum, tantalum and tungsten in high-temperature applications.a
Table 31: Substitutability scores for niobium applicationsUse Substitutability scoreSteels 0.7Superalloys 0.7
1.14.5 Specific issues
According to the OECD’s inventory of trade restrictions, the Dominican Republic and Vietnam are using export taxes of 5% and 20% on niobium ores and concentrates. Licensing agreements are applied by Grenada, Rwanda and the Philippines. For Brazil and Canada no trade restrictions are reported.
aMineral Commodity Summaries: Niobium, U.S. Geological Survey, 2013

Minephophate rock
Bene-ficiation
Concen-trates
Processing Phos-phorous
Fertilizers Agriculture Food
1
1.15 Phosphate rock
1.15.1 Introduction
Phosphate rock consists mainly of apatite mineralsa. The term phosphate rock describes a range of commercially mined phosphorus-bearing minerals, which are mainly utilized to produce fertilisers. Other applications are e.g., detergents and animal feedstocksb. Phosphate rock is the only important resource for phosphorus production worldwide.c
Phosphorus is vital for all living things, plants and animals.d The growing world population and thus, the growing need for food leads to an increased demand for phosphate fertilizers for agriculture.e The USGS estimates that the world consumption of phosphorus pentoxide will increase from 42 million tonnes in 2012 to 45 million tonnes in 2016.e
Sedimentary marine phosphorites are the principal deposits for phosphate rock.e Depending on the mineralogical, textural and chemical characteristics (e.g., ore grade, impurities), as well as the local availability of water around the mining site, different refining processes are applied to obtain phosphate rock concentrates.f Phosphorites are also known to be enriched in uranium and have been exploited as uranium ores in the USA.g Processing of phosphorite creates large tonnages of waste phosphogypsum, 30 million tonnes annually in Florida alone: the uranium content of the phosphogypsum is such that it cannot be used for alternative purposes.h The largest share (82%) of the produced phosphorus is used for fertilizers.i The supply chain for phosphate rock used in fertilizers is depicted in Figure 113. It can be assumed that European firms are involved in all of these stages, but no complete data is available.
Figure 113: Supply chain diagram for phosphate rock in fertilizers
1.15.2 Supply
Primary sources, production and refiningSedimentary marine phosphorites are widely distributed. It is estimated that world resources of phosphate rock total 300 billion tonnes; world reserves are shown in Table 32. The biggest deposits are located in northern Africa, China, the Middle East, and the USA.j Large deposits of phosphates are also located on the continental shelf and on seamounts in the Atlantic and Pacific Oceans, but exploiting these deep-sea sources is still too costlyk. Besides the sedimentary phosphate deposits, some igneous rocks are rich in phosphate minerals (apatite), generally without significant contents of uraniuml. However, sedimentary deposits are more abundantm and usually higher in gradea; 80% of the global production of phosphate rock is exploited from sedimentary phosphate deposits.n
aEncyclopedia of the elements: Phosphorous, Enghag, Wiley-VCH Verlag GmbH & Co. KGaA, 2004
bBritish Geological Survey: European Mineral Statistics 2007-2011
cminerals.usgs.gov/minerals/pubs/comoodity/phosphate_rock/ retrieved online2013-09-15 – page last updated 2013-09-04
dEncyclopedia of the elements: Phosphorous, Enghag, Wiley-VCH Verlag GmbH & Co. KGaA, 2004
eMineral Commodity Summaries: Phosphate rock, US Geological Survey, 2013
fWorld Phosphate Rock Reserves and Resources, International Fertilizer Development Center (IFDC) 2010
g http://world-nuclear.org/info/Nuclear-Fuel-Cycle/Uranium-Resources/Uranium-from-Phosphates/#.UmKNc_kweCY, accessed November 8th 2013
h http://www.epa.gov/radiation/neshaps/subpartr/about.html, accessed November 8th 2013
iWorld Phosphate Rock Reserves and Resources, International Fertilizer Development Center (IFDC) 2010
jMineral Commodity Summaries: Phosphate rock, US Geological Survey, 2013
kwww.mineralseduction.org/minerals/phosphate-rock retrieved online 2013-09-15
lAs to the uranium content see PhosAgro’s annual report 2012, http://www.phosagro.com/investors/reports/year/

1
mwww.mineralseduction.org/minerals/phosphate-rock retrieved online 2013-09-15
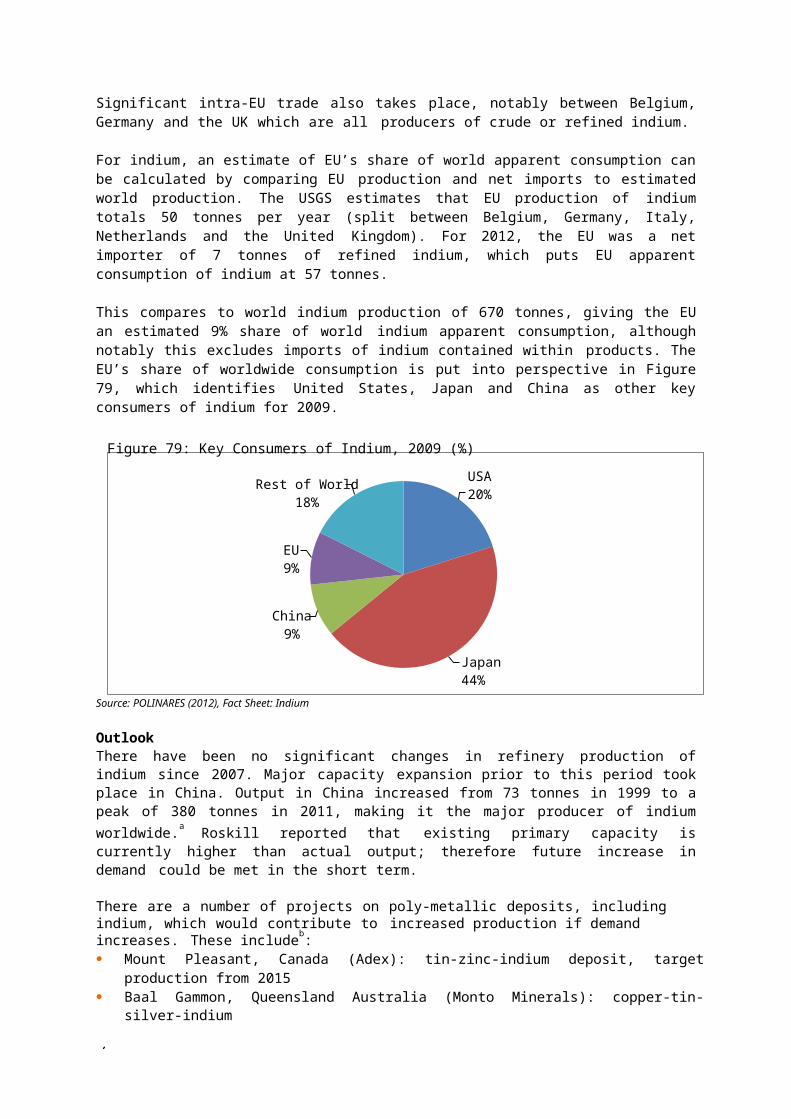
1
Table 32: World phosphate rock reserves, ‘000s tonnesCountry Reserves %Morocco 50,000,000 74.6China 3,700,000 5.5Algeria 2,200,000 3.3Syria 1,800,000 2.7Jordan 1,500,000 2.2South Africa 1,500,000 2.2USA 1,400,000 2.1Russia 1,300,000b 1.9Peru 820,000 1.2Saudi Arabia 750,000 1.1Australia 490,000 0.7Iraq 460,000 0.7Other countries 390,000 0.6Brazil 270,000 0.4Israel 180,000 0.3Senegal 180,000 0.3Egypt 100,000 0.1Tunisia 100,000 0.1Togo 60,000 0.1Mexico 30,000 0.0India 6,100 0.0Canada 2,000 0.0World total(rounded) 67,000,000Source: USGS (2013) Mineral Commodity Summaries: Phosphate rock
Supply detailsPhosphate rock is exploited in several countries worldwide. In 2010, the global market for phosphate rock was 54 million tonnes. Although most phosphate rock resources are located in Morocco, China is the dominant supplier. The largest phosphate rock mining countries are shown in Figure 114, with China, the USA, and Morocco being the biggest three, manufacturing respectively 38%, 17%, and 15% of global production in 2010.
Global production of phosphate rock was estimated to have grown up to 210 million tonnes in 2012, due to an increased production in China and Saudi Arabiac.
aWorld Phosphate Rock Reserves and Resources, International Fertilizer Development Center (IFDC) 2010
bThere are indications that Russian reserves are much bigger. For instance PhosAgro states in their 2012 annual report their reserves as 2,100,000,000 t with
< 0.1 ppm Cd and low radioactivity.c
Mineral Commodity Summaries: Phosphate rock, US Geological Survey, 2013
South Africa2%
Egypt2%
Syria2%
Russia 3%Jordan 4%Brazil 4%
Tunisia 4%
Israel2%
Other8%
China38%
MoroccoUSA15%17%
Figure 114: Worldwide production of phosphate rock, 2010.
1
Source: World Mining Data (2012)
EU trade flows and consumptionOverall, the EU is a net importer of natural phosphates, importing around 4 million tonnes net per year of Natural Calcium Phosphates and Natural Aluminium Calcium Phosphates, Natural and Phosphatic Chalk, Unground and Ground (Figure 115). A clear exception was in 2009 when around 2 million tonnes of phosphates were imported. Overall, a decreasing trend in imports was recorded between 2008 and 2012. These figures do not capture trade in the downstream uses of these materials, therefore care is needed with their use.
Figure 115: Trends in extra-EU trade for natural calcium phosphates and natural aluminium calcium phosphates, natural and phosphatic chalk, unground and ground (tonnes)
Source: Eurostat-Comext Database, CN 2510 1000 and CN 2510 2000 [accessed August 2013]
Morocco is the biggest importer of phosphates into the EU, covering around 33% of all imports. Other major importers include Algeria, Russia, Israel and Jordan (Figure 116). EU exports are mainly towards Norway; however, these amounts are negligible compared to imports.
10 000 000
8 000 000
6 000 000
4 000 000
2 000 000
0
-2 000 000
20 20 20 20 20 EU Export
EU

1
AfricaOceania 3%
3%Europe
10%Americas
26%
West &South Asia 23%
East Asia35%
Figure 117: World regional phosphate demand for fertiliser and industrial uses, 2011 (%)
Figure 116: EU’s major trading partners for natural calcium phosphates and natural aluminium calcium phosphates, natural and phosphatic chalk, unground and ground, 2012
EU Exports of phosphates, Unground and Ground (74,989 t)
Other1%
EU Imports of phosphates, Unground and Ground (6,201,389 t)
OtherSenegalIndonesia
1%
Vietnam 2%
Norway 58%
1%3%
South Africa 3%
Togo 5%
Morocco 33%
Switzerland 11%
Russia 27%
Syria 7%
Egypt 7%
Jordon 8% Israel
9%
Algeria 13%
Russia 11%
Source: Eurostat-Comext Database, CN 2510 1000 and CN 2510 2000 [accessed August 2013]
The UNFAO estimates that Europe’s share of phosphates consumption totalled approximately 4.6 million tonnes for 2011, including both fertiliser and industrial uses. The represented 10% of world phosphates demand, which it put at 46.1 million tonnes for 2011.
However, the share specifically attributed to the EU, is likely to be nearer 7% once Russia and Central Asian countries are subtracted from the Europe total. Worldwide the largest phosphate consuming regions are the Americas with 26%, East Asia at 35% and West and South Asia at 23% of worldwide consumption (Figure 117).
Source: UNFAO (2012), Current world fertiliser trends and outlook to 2016
Future trendsExploration activities and mine expansions took place in Australia and Africa in 2011. There are two major projects in Africa: the expansion of a phosphate mine in Morocco and a new project off the Namibian coast. Smaller projects are under various stages of development in several African countries, such as Angola, Congo (Brazzaville), Guinea-Bissau, Ethiopia, Mali, Mauritania, Mozambique, Uganda, and

1
1009080706050403020100
1970 1980 1990 2000 2010
Figure 118: Phosphate rock historical price volatility (98 US$/tonne).
Zambia. Expansion of production capacity was planned in Egypt, Senegal, South Africa, Tunisia, and Togo. Other development projects for new mines or expansions are on-going in Brazil, China, and Kazakhstan.a
1.15.3 Demand
Prices and marketsHistorical prices for phosphate rock are shown in Figure 118.
Source: USGS (2012- ), Historical Statistics for Mineral and Material Commodities in the United States [accessed February 2013]. Figures are indexed to 1998 values.
Following a peak in prices in 1975, phosphate rock prices decreased steadily until the late 80s followed by a relatively stable price. A sharp increase was experienced in 2006 with prices peaking to an all-time high in 2009. Lower prices in 2010 are thought to be due to the economic crisis.
ApplicationsPure phosphorus, partially obtained from phosphate rock, is used for the production of chemicals.b
Phosphorus is a vital part of plant and animal nourishment. The largest share phosphorus is used as basis for nitrogen-phosphorus-potassium fertilisers, globally utilised on food cropsc. Besides fertilisers, phosphate is also used in dishwater powders and detergentsd and to produce calcium phosphate feed supplements for animals.b Guano, bone meal or other organic sources are of less economic importance as phosphate sources, because of the higher cost per unite.
aUSGS (2013) Minerals Yearbook: Phosphate Rock
bwww.mineralseduction.org/minerals/phosphate-rock retrieved online 2013-09-15
cminerals.usgs.gov/minerals/pubs/comoodity/phosphate_rock/ retrieved online2013-09-15 – page last updated 2013-09-04
dEncyclopedia of the elements: Phosphorous, Enghag, Wiley-VCH Verlag GmbH & Co. KGaA, 2004
e

1
World Phosphate Rock Reserves and Resources, International Fertilizer Development Center (IFDC) 2010

1
Other 5%
Wet-process phosphoric acid and super-phosphoric acid95%
Figure 119: End-use of Phosphate Rock in the USA in 2012
60 000
50 000
40 000
30 000
20 000
IndustrialFertiliser Supply
10 000
02011 2014 2016 2020
Figure 120: World phosphates supply and end-use forecasts to 2020 (‘000s tonnes)
Source: USGS (2013) Mineral Commodity Summaries: Phosphate rock
Future trendsThe market outlook for the world supply and demand for phosphates is shown in Figure 120. This indicates a market currently witnessing a slight surplus, which is expected to increase over the coming decade to give a moderate to large surplus by the middle and end of the decade. Demand is expected to grow at around 2% per year, for the largest market of fertilisers, and also for the phosphates market overall. The major demand drivers are increased application of phosphate fertilisers, particularly in India, but also in Brazil and to a lesser extent in China.
On the supply-side, considerable increases in world capacity and production of phosphate rock and also phosphoric acid means that the market is expected to remain in surplus. The most significant increases are expected to take place in Africa and China, and also in Brazil (for phosphoric acid). Capacity utilisation rates are expected to remain at around 80% in the coming decade.
Sources: UNFAO (2012), Current world fertiliser trends and outlook to 2016; and IFA, CRU presentations (2013)

1
Resource efficiency and recyclingPhosphate rock is not recyclable, and for its application in agriculture, phosphate rock cannot be replaced.a,b Furthermore, phosphate rock is a non-renewable resource.b In the future, the phosphorus deposits on the ocean’s floor may be exploited when an economical way of deep ocean mining is devised.c
There are no alternatives to the use of phosphate in fertilisers and animal feed as shown in Table 33.
Table 33: Substitutability scores for phosphate rock applicationsUse Substitutes Substitutability scoreChemicals No alternative available 1Other Arbitrary assumption 0.5
1.15.4 Specific issues
Two phosphate compounds are present in the REACH substances of very high concern (SVHC) list: trilead dioxide phosphonate and tris(2-chloroethyl)phosphate.
Sedimentary phosphates, as well as their enrichment in uranium, are also commonly enriched in cadmium. There are ideas considering the introduction of a penalty for the content of cadmium in fertilizers. d
aMineral Commodity Summaries: Phosphate rock, US Geological Survey, 2013
bWorld Phosphate Rock Reserves and Resources, International Fertilizer Development Center (IFDC) 2010
cwww.mineralseduction.org/minerals/phosphate-rock retrieved online 2013-09-15
dSee http://ec.europa.eu/environment/enveco/taxation/pdf/cadium.pdf
Mining &Processing
Production ofmetal salts
CatalyticConverter
Installation Use End of Life
1
1.16 Platinum group metals*
*Profiles for the individual metals are provided in Sections 1.16.7 to 1.16.10.
1.16.1 Introduction
The Platinum Group Metals (PGMs) consist of six precious metals, (platinum (Pt), palladium (Pd), rhodium (Rh), ruthenium (Ru), iridium (Ir) and osmium(Os))a. These metals share geological sources and similar properties, such as high melting point, high density and catalytic activity. Their unique mixture of characteristics means that they find unique applications across several sectors. This importance, combined with their poor substitutability and rarity results in all of the PGMs being amongst the most valuable of metals.
Though they share common sources and similar properties, the abundance and applications of each metal varies. Platinum and palladium are the most common PGMs and have the total largest market size. The other PGMs are rarer, and consequently are not as widely used. The largest application for the PGMs, specifically palladium, platinum and rhodium, is in autocatalysts for emissions control.
A supply chain for PGM use in automotive catalysts is shown in Figure 121 which is the dominant market. Whilst this varies between sources and applications, a general case is discussed below. As PGMs are mined at very low concentrations compared with most other metals, a number of concentration processing steps are required including crushing and milling, froth flotation, and in some cases magnetic separation or dense media separation.b
Figure 121: Supply chain map for PGMs automotive catalysts
• Ore mined,• Crushing & milling,• Froth flotation• Other processes
•Refiningof metals via pyro- and hydro=- metallurgical processes
•Metal salts supplied
•Deposition of metal on support
•Assembly catalytic converter
•Installed on vehicle during manufacture or as a replacement
•Typically linked to vehicle, and ELV practices
Recovery,Pre-processing
Stages occurring in the EU on a large scale highlighted in orange
This concentrate then undergoes a smelting process to extract a mixture of PGMs from any base metals present. Further separation of the individual metals takes place at a specialist precious metals refinery through hydrometallurgy to separate out the PGMs salts. These may be further refined by a small number of refiners to the metals or other forms. In the case of automotive catalysts the PGMs are supplied as salts. The concentration process typically occurs close to the mining site due to the large tonnages of materials that require processing; however refining stages may take place in a separate country with several EU companies undertaking this process. These refineries may also process recycled materials. Where PGMs are a by-product of nickel and copper production, different treatment may be needed due to the high sulphur content of the ore. In particular, additional separation stages from the base metal are required to ensure the purity of the PGMs.
aPlatinum: Pt, atomic number 78; Palladium: Pd, atomic number 46; Rhodium: Rh, atomic number 45; Ruthenium: Ru, atomic number 44; Iridium: Ir, atomic
number 77; Osmium: Os, atomic number 76b

1
Platinum, 2009, British Geological Survey

1
In the case of catalytic converters the PGM precursor salts are used to finely disperse the PGMs on an aluminium oxide honeycomb, which also contains cerium oxide; this is then used within the catalytic converter. Manufacturing of these does occur within the EU by specialist manufactures, as does placing into vehicles by assemblers. Recovery of these PGMS is typically linked to the recovery of End-of-life Vehicles (ELVs), which is well established, and the process is highly efficient through precious metal refineries.
In other applications the salts or the purified metal may be used depending on particular requirements. For example, metal is supplied to the jewellery and electronics industry, with the consequent stages occurring within the EU linked to the manufacturing base in these applications. Production of metal also occurs within the EU, as a follow on stage from salt production. This involves heat treatment of the metal salts to produce the pure PGM. Alloying between PGMs may take place at this stage. Supply to the chemicals sector is often in the salts form, where other chemicals and catalysts are derived from these precursor materials. Overall, these supply chains are similar to that seen above for the automotive sector, with EU activity across all stages after the initial mining and processing.
PGMs can be recovered from most applications through pre-treatment and refining, with most losses associated with product collection. This depends on the application, for example recovery from automotive catalysts is higher than for electrical items. For jewellery there is also a significant resale market.
1.16.2 Supply of PGMs
Primary sources, refining and by-productionThe abundance of PGMs in the Earth’s crust is considerably lower than most other metals, with an average concentration of platinum and palladium of approximately 0.005 ppm per tonne. Iridium, rhodium and ruthenium each have an abundance of about 0.001g per tonne.a Concentrations in ore bodies that are considered viable for production range from 1 to 10 ppm, with the ratio of individual PGMs varying. These high concentrations of PGMs are found in deposits of several types, often with nickel and copper. PGM resources can be broadly split into two types: platinum-palladium rich deposits nickel-copper based deposits which are enriched in palladium relative to platinum.
Large platinum-palladium rich deposits are found in South Africa (Bushveld complex), USA (Stillwater), Zimbabwe (Great Dyke) and Canada (Lac des Iles). These deposits are the main sources and reserves of PGMs at present. The largest known PGM resources are found in the Bushveld complex, which is estimated to contain about 95% of known PGM reserves.
Nickel-copper deposits exist in Russia (Norilsk and Penchenga), Canada (Sudbury, Thompson, Raglan), China (Jinchuan) and Australia (Kambalda). Within Europe, several deposits have been identified in Finland, with production from one mine (Keivitsa). From this ore type, PGMs can be considered by- products or co-products rather than primary products due to their value when compared to the other metals produced. For instance PGMs can be estimated to account for 25% of the revenue from metals by Norilsk, with nickel and copper accounting for 43% and 27% respectively.b Based on production figures for Russia and Canada below it can estimated that these sources account for around 30% of all production, though proportions for palladium (48%), platinum (18%) and rhodium (11%) vary.
Production of purified PGMs from ores is complex and technically demanding due to the low PGM contents of the ores and to the similar properties of the metals themselves. Ores may be extracted using underground mining or open-pit mining, and processing is dependent on size, grade and type of deposit. However, for all ore types the first stage involves the concentration of the ore through crushing, milling,
aPlatinum: Definition, mineralogy and deposits, BGS, 2009
bInternational Study Group for Nickel et al (2012), Study of By-Products of Copper, Lead, Zinc and Nickel.

1
froth flotation and similar techniques. These concentration processes are necessary to allow further processing, but may result in a loss of over 50% of the PGMs present.
Platinum-palladium rich ores are smelted to remove silicon, then to remove iron and sulphur. The end result is ingots of around 60% mixed PGMs which are then sent for further specialist refining. Base metals such as copper and nickel may be removed from these ingots stage depending on the source. For nickel-copper dominant deposits the concentrate is used to produce a nickel-copper-PGM matte, from which the base metals are removed at a base metal refinery. The PGMs remain in a copper concentrate; a combination of electrowinning and smelting is then used to separate the remaining copper and nickel, with a PGM concentrate produced from the electrochemical anode slimes. This is sent for PGM refining.
Due to the complexity and scale of refining, production of the PGMs from concentrates often takes place at a different location. For example the major producers in South Africa, such as Anglo American Platinum, Impala Platinum, Lonmin and Northam refine concentrates from smaller mining companies that do not have their own processing facilities. The similar properties of the PGMs means that refining is complex and lengthy, with companies keeping details undisclosed. Nevertheless processing is known to involve a series of hydrometallurgical steps involving solvent extraction, which remove remaining base metals, then separate and purify the PGMs. Additional electrolytic and smelting stages may be introduced depending on the ore type. The PGMs are supplied in several forms including bullion, salts, specific compounds and components. Isolation of palladium and platinum is the focus of these processes due to their higher economic value, rather than the other PGMs. Within the EU production of refined PGM is common and takes place in Belgium, Germany, Norway, and the UK, and is linked to primary and secondary production of the metals. Several EU based companies are involved in PGM production or refining, including Anglo American (through Anglo Platinum), Glencore Xstrata and Johnson Matthey.
Supply detailsThe largest primary suppliers of PGMs are located in South Africa and Russia, which respectively have platinum-palladium rich and nickel-copper deposits. Therefore supply from South Africa favours platinum and supply from Russia is dominated by palladium. This variation allows some flexibility in supply ratio of these metals. However, the supply of the other PGMs is driven by the production of platinum and palladium, and is reliant on demand for these two metals, particularly platinum.
In addition to mined production, recycling and palladium sales from Russian stocks also contribute a significant proportion to total supply for many of the metals. This is discussed in more detail below for each PGM.
Reserves of PGMs are estimated at 66,000 tonnes by the USGS, with over 95% located in South Africa (Table 34), and the majority of this at the Bushveld complex. However, figures from Norilsk Nickel estimate that proven and probable reserves of PGMs at their Talnakh site in Russia are 2,400 tonnes, exceeding USGS estimates.a Other estimates for PGMs reserves exist; for example, Mudd estimates global at 90,700 tonnes, with around 70% located in South Africa.b
Table 34: World Supply and Reserves and EU Trade of all PGMs by country in 2012, tonnesCountry Total Supply (2012) Total % (2012) ReservesSouth Africa 264 61% 63,000Russia 117 27% 1,100‡
Zimbabwe 22 5% †Canada 11.9 3% 310US 7.5 2% 900Other Countries 8 2% 800
ahttp://www.nornik.ru/en/our_products/MineralReservesResourcesStatement/, accessed June 2013
b Mudd (2012), ‘The Pl atinum Gro up Metals: As sessing Glo bal Trends in R esources and Production’, Ore Ge ol. Rev. 46. pp106 -117

1
World total 430 -- 66,110‡
Other SupplyRecycling 134 -- --Stock Sales Russia 8 -- --Total Supply 572 -- --Sources: USGS (2012), Platinum Group Metals 2011 Minerals Yearbook and Johnson Matthey (2012) Platinum 2012 Interim Review, UN Comtrade† Zimbabwe PGM reserves included within other countries
a‡ This likely a large underestimate as other figures for Norislk Nickel indicate they have in excess of 12,200 tonnes of PGM resources
Information on the individual supply of the PGMs is shown in Table 35. This highlights the differences in supply associated with each location, clearly showing the importance of South Africa to platinum production, and a more balanced situation for palladium. Further detail is provided in individual sections below.
Table 35: Estimated World Mined Production and Supply of selected PGMs, 2012Country Platinum Palladium Rhodium Other PGMs
(Ru, Ir, Os)
Tonnes % Tonnes % Tonnes % Tonnes %South Africa 132 73% 75 42% 18 82% 39 80%Russia 25 14% 81 46% 2 9% 9 19%Zimbabwe 11 6% 9 5% 1 5% 1 2%Canada 7 4% 4 2% 0.5 2% 0.4 1%US 4 2% 3 2% 0.5 2% 0 0%Other Countries 3 2% 5 3% 0 0% 0 0%World total 182 -- 177 -- 22 -- 49 --
Other SupplyRecycling 57 -- 70 -- 7 -- -- --Stock Sales Russia -- -- 8 -- -- -- -- --Total Supply 239 -- 255 -- 29 -- 49 --Sources: USGS (2012), Platinum Group Metals 2011 Minerals Yearbook and Johnson Matthey (2012) Platinum 2012 Interim Review
Less than 2 tonnes of PGMs are mined in the EU in Finland and Poland, therefore the majority of primary supply is imported from outside the EU.
The general outlook for PGM production is growth, with many existing mining sites planning to increase supply. This indicates there is spare production capacity available from existing infrastructure. However, according to Mudd, ore grades have been gradually declining for most mining companies.b Despite some mining sites reducing production due to safety stoppages and industrial unrest, overall production has remained relatively constant and other supplies have been able to keep up with demand. Johnson Matthey predict a 5% growth in PGMs from existing mining sites, driven by growing demand for platinum and palladium For example production of palladium is set to increase from Norilsk Nickel representing an increase of about 18% of today’s palladium market. This is roughly equivalent to the recent contributions to supply from Russian stockpiles. Primary production of the other PGMs is linked to production of platinum and palladium, therefore this is set to grow in line with production of these metals.
a Mudd (2012), ‘The Pl atinum Group Metals: Ass ess ing Global Trends in R esources and Production’, Ore Geol. R ev. 46. pp106 -117

35030025020015010050
0-50
-100
ExportsImports Net Exports
2008 2009 2010 2011 2012
Figure 122: Trends in extra EU trade for all PGMs in wrought, unwrought and powder form (tonnes)
1
In addition to existing supply, new supply is also under development at several sites, for example in Canada (Lac de Iles and Nickel Rim South), Zimbabwe (Unki), and Russia (Maslovskoe). It should also be noted that recycling levels of palladium, platinum and rhodium are predicted to grow in the future as the recovery from catalytic converters increases.
EU trade flows and consumptionOverall trade flows of PGMs in wrought, unwrought or powder form for the EU vary from year to year (Figure 122). Prior to 2010 trade was relatively balanced, with exports for platinum, palladium relatively in balance, and rhodium and the other PGMs having an imbalance in favour of exports for the unwrought and powder forms. Semi-manufactured forms showed net-export for all except palladium. A large imbalance is seen in 2010, mainly associated with a three-fold increase in platinum imports; this trend continued to a lesser extent in 2011, returning to pre-2010 levels in 2012. Variations for each contributing metal are seen, and are discussed individually in the sections below.
The largest share of PGM exports from the EU was to the USA; the USA was also one of the large importers to the EU supplying 27 tonnes, with variation seen for each of the PGMs. Substantial but smaller quantities are exported to a group of around 5 countries. Imports to the EU occur from major producing countries, such as South Africa and Russia. Switzerland also makes a large contribution most likely from output from its refineries.
Significant intra EU trade occurs between many countries, with Belgium, Germany, Slovakia and United Kingdom being important traders.
Source: Eurostat Comext Database, CN 7110 [accessed August 2013]

1
Figure 123: The EU’s major trading partners for PGMs, 2012 (tonnes)EU Exports of PGMs in wrought, Powder,
and Semi-manufactured Forms (168tonnesJ)apan
Other 20%
6%Singapore
7%Hong Kong 10%
China 10%
United States 34%
Switzerlan d
13%
EU Imports of PGMs in wrought, Powder, and Semi-manufactured Forms (122
tonnes)Norway
South Africa 32%
Other 5%Canada
2%
5%Switzerlan
d15%
Russia 19%
United States 22%
Source: Eurostat Comext Database CN 7110 [accessed August 2013]
For the platinum group metals, detailed regional demand data is available for platinum, palladium and rhodium, as compiled by Johnson Matthey. Note that this data is for gross demand and therefore includes recycled production.
This data estimates Europe’s share of worldwide platinum group metals demand at 127 metric tonnes, or 22% of worldwide consumption (estimated at nearly 580 tonnes). Other important worldwide consumers include Japan (15%), North America (21%) and China (23%), as shown in Figure 124.

Rest of World19%
Europe22%
China23%
Japan15%
North America21%
Figure 124: World Demand for Platinum Group Metals (Pt + Pd + Rd) by Geographic Region, 2012 (%)
25 000 000
20 000 000
15 000 000
10 000 000
5 000 000
01960 1970 1980 1990 2000 2010
Figure 125: Historical composite price for PGMs, unit value (98$/t)
1
Source: Johnson Matthey (2013), Platinum 2013
1.16.3 Demand and economic importance
Prices and marketsThe historical weighted price for the PGMs is shown in Figure 125, based on a tonne of metal. Prices have oscillated considerably over the past 40 years; they were recently close to highs, though have dropped a little in the recent past.
Source: USGS (2012), Metal Prices in the United States Through 2010
PGMs are traded using different mechanisms. Platinum and palladium are typically exchange traded and traded over the counter. Other platinum group metals are more commonly traded through long-term supply contracts and individual trades between large consumers and suppliers and trading houses.
ApplicationsDue to their cost and small production volumes PGMs are generally used in small amounts for specific high-value applications (Table 36).
Table 36: World demand for PGMs for 2012Application Platinum Palladium Rhodium Other PGMs Total

Johnson Matthey (2013), Platinum 2012 Interim
1
Source: Johnson Matthey (2012) Interim Review*Excluding Investment
Across the group, PGM’s main uses are in catalysts for the automotive and chemical industries and in electronics. Other important uses include jewellery and investment. However, each PGM has different properties therefore uses are generally metal specific.
Autocatalysts: Autocatalysts are the major application for PGMs, where they are essential for the function of catalytic converters to reduce emissions from petrol and diesel engines. Platinum in light duty diesel engines accounted for 60% of use, with around 20% for both light duty petrol and heavy duty diesel engines. Close to 90% of palladium in autocatalysts is used for light duty petrol engines, with the remainder used in light duty diesel. Platinum and palladium can interchanged to certain extent, depending on the prices and demand for each, however they cannot be considered not fully substitutable. Autocatalysts are the principal application for rhodium accounting for almost 80% of demand. Rhodium is essential for the function of three-way catalytic converters which reduce emissions of nitrogen oxides, which are becoming increasingly common.a
Jewellery: The value and properties of PGMs means they are suitable and desirable for high value jewellery, which accounts for over a fifth of their consumption.
Catalysts in chemical, electrochemical and petrochemical applications: PGMs are widely used as catalysts in the industrial sector, primarily in the chemicals and petroleum industries. Their properties and high value mean they are particularly suitable for catalytic processes, where only a small quantity of the metal can have a large impact on production and they can generally be recovered at the end of the process. Almost all PGMs are used as catalysts on an industrial scale. Platinum is used as a catalyst in a variety of processes, with the most important being petroleum refining (where it is combined with rhenium) and nitric acid production. Palladium and rhodium areboth used in the production of several plastics and polymer precursors. Ruthenium is used in ammonia production, as well as with iridium in electrochemical processes. a
Electronics: PGMs find various uses in the electronics industry. Both platinum and palladium are used in the construction of some printed circuit boards. The use of palladium in electronics has grown with the miniaturisation of electronics for applications such as mobile phones; palladium is
Tonnes %* Tonnes %* Tonne s
%* Tonne s
%* Tonnes %*
Autocatalysts 95 40% 202 70% 22 80% 0 0% 321 55%Jewellery 85 36% 14 5% 0 0% 0 0% 99 17%All Industrial (total)
56 24% 75 26% 4 13% 27 88% 162 23%
Chemical 14 6% 16 6% 3 9% 4 12% 37 6%
Electronics 6 3% 38 13% 0.2 1% 17 57% 61 10%Electrochemical 0 0% 0 0% 0 0 6 20% 6 1%Glass 7 3% 0 0% 1 4% 0 0% 8 1%Petroleum Production
6 3% 0 0% 0 0% 0 0% 6 1%
Medical (incl. dental)
7 3% 17 6% 0 0% 0 0% 17 3%
Other 15 6% 4 1% 2 7% 3 11% 32 5%
Investment 15 -- 12 -- 0 -- 0 -- 27 --
Total 251 302 30 31 614
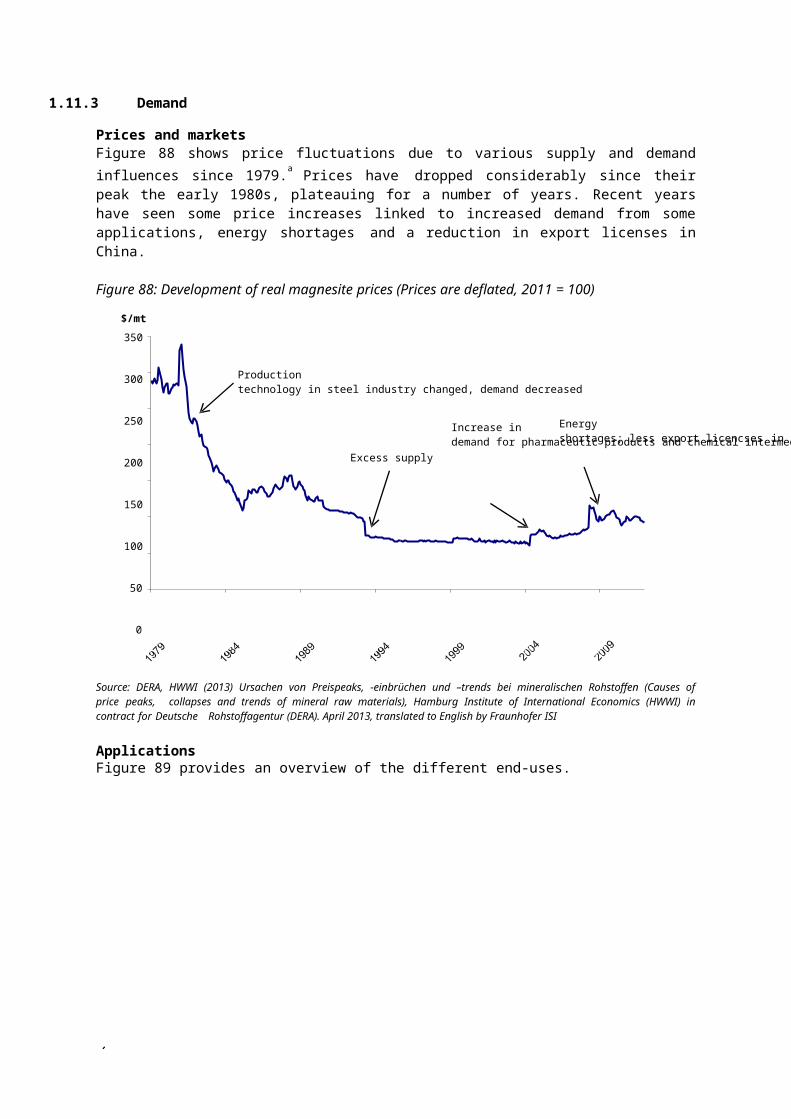
Johnson Matthey (2013), Platinum 2012 Interim
1
a

Johnson Matthey (2013), Platinum 2012 Interim
1
used in multi-layered ceramic capacitors. Specific uses for platinum and ruthenium are in computer hard disk drives, and iridium is linked to the manufacturing process for LEDs and is used in Organic LEDs.a
Glass: PGMs are used in the manufacture of some glass types when high processing temperatures are used. The metal’s high melting point, strength and resistance to corrosion mean they are suitable for this purpose. Both platinum and rhodium are used during the production of glass fibre, LCD manufacture, as well as other types of glass. b
Medical industry: PGMs find uses in dental applications, specifically alloys for fillings and bridges. These metals are also used in components in medical scanners, sensors and drugs.
Investments: The value of the PGMs means that they are used as investments, which can influence the market for these materials. This particularly influences platinum and palladium trading, as these are the largest volume. Limited investment has been seen for some of the other PGMs.
Future growth uses for PGMs are expected to be emissions controls systems, fuel cells (mobile and stationary applications) and superalloys, all of which are minor uses at present.
Current demand EU demand for platinum and palladium is estimated at 27% and 22% of the world’s supply respectively. The majority of this is associated with autocatalysts, with other uses accounting for smaller proportions.
1.16.4 Outlook
Figure 126: World platinum group metals supply and demand forecasts to 2020 (tonnes)900
800
700
600
500
400
300
200
100
0
Pt+Pd+Rh
Industrial
Jewellery
Autocatalysts
Supply
2012 2014 2016 2020Sources: Lonmin & GFMS Presentations (2013), and Johnson Matthey Yearbook data (2013)
The market outlook forecast for the world supply and demand of platinum group metals is shown in Figure 126. This combined forecast includes platinum, palladium and rhodium, the three platinum group metals for which reliable supply and demand data is available. Individual forecasts for these three metals can be found in individual material sections below.
Overall reasonably strong demand growth is expected for all three of these metals at around 4-5% per year. The strongest growth in expected in the autocatalysts end-market, as ageing car fleets need to be replaced across the world by more efficient catalytic convertors, as regulatory requirements for exhaust fumes continue to tighten, particularly in developing nations. The growth in off-road, heavy duty diesel and fuel cell vehicles will provide a further boost to autocatalysts demand. Demand for platinum
a

Johnson Matthey (2013), Platinum 2012 Interim
1
International Nickel Study Group et al (2012), Study of the By-Products of Copper, Lead, Zinc and Nickelb

1
jewellery is also anticipated to remain strong, particularly in China. In comparison, demand for industrial applications is expected to grow somewhat more slowly.
On the supply-side, disruptions in production from South Africa have had short-term and long-term implications for world platinum supply. Continued concerns about political risk may lead to further underinvestment in the country, meaning that platinum (and rhodium) supply is unlikely to keep pace with rising world demand. Recycling will help fill some of the supply gap, but will not do so completely. For palladium, too, the market is forecast to move towards deficit. The diminishing Russian palladium stockpile only adds to these concerns.
In the medium term PGM demand will remain strongly linked to the automotive industry. The high price of these metals mean that substitution is desirable, however viable replacements have not been found for their main applications. Some inter-substitution between PGMs is possible for certain applications. For instance in diesel engine catalytic converters a certain proportion of platinum may be substituted with additional palladium (up to 25% according to the USGS)a; this may occur when the price differential between the metals is high enough to justify the price of the additional palladium required to achieve the desired performance. Ruthenium has also found use in 4th generation nickel super-alloys in jet engine turbines, which is likely to be a growing use in the future. b
In the longer term the growth of the electric vehicle market could reduce demand for platinum, palladium and rhodium, though hybrid technology is still reliant on these catalysts to curb emissions. This will also impact supply of other PGMs which relies on the other metals. However, growth in the use of fuel cell catalysts could help to balance out some of this reduction in demand.
1.16.5 Resource efficiency and recycling
The high value and uses of PGMs means that recycling is both desirable and common both in industrial and end user applications. According to UNEP figures post-consumer recycling levels are greater than 50% for all the PGMs (with the exception of iridium and osmium), with high proportions of recycled content present in many applications. Supply statistics indicate that over 20% of supply originates fromrecycling, though actual figures vary with the individual metals: platinum (25%), palladium (23%) and rhodium (11%).c
Recycling of PGMs from autocatalysts is well established, and estimated to reach a global average of 50- 60%.c Due to service periods and changes to market size the contribution of recycling to autocatalyst is estimated at 33% of gross demand.c Recycling of autocatalysts in Europe appears to be slightly lower than the global average (Table 37); this might be due partly to the export of a proportion of used vehicles, mainly to Africa, bringing a part of the used autocatalysts out of the European recycling loop. Recycling of metals from this use could be increased through improved collection of the autocatalysts at end-of-life.d
Table 37: Estimated contribution of recycling to autocatalyst demand (2012)Global Europe
Platinum 33% 30%Palladium 24% 21%Rhodium 29% --Source: Johnson Matthey
aUSGS (2010), Platinum Group Metals Minerals Yearbook
bFraunhofer Institute (2009), Raw materials for future technologies
cUNEP(2011), A Report of the Working Group on the Global Metal Flows to the International Resource Panel,
dEuropean Pathway to Zero Waste (2011), Study into the feasibility of protecting and recovering critical raw materials through infrastructure development in

1
the south east of England; Oakdene Hollins

1
Recycling in industrial uses of PGMs, such as catalysts for the chemical and petrochemical industry and in glass production, is estimated to reach 80-90%.a The nature of the catalysts and their value mean that they are often used for several years before being recycled, with primary supply associated with lifecycle losses and a growth in market for products.
Table 38: Substitution of PGMs
Substitution of PGMs has long been a target due to the high cost of the metals. In general the best and typically only substitution for one PGM is another PGM. For example at present there is no known alternative for PGMs used in autocatalysts. Some inter-substitution is possible in autocatalysts for diesel engines where some platinum may be substituted by palladium (though not fully). This may occur when the price differential between the metals is large enough. At present rhodium is not substitutable for this use. A similar situation is present with other industrial uses, therefore recycling is often viewed as the most practical resource efficient action in the short to medium term.
In general PGMs will not be used unless it is necessary due to their costs, therefore substitution options are limited.
1.16.6 Specific issues
PGMs as a group or specific PGMs are considered as ‘at risk’ or ‘critical’ materials by many territories, including the US and South Korea, mainly due to their concentrated supply. However, at present PGMs and PGM containing products are traded throughout the world, and no absolute restrictions on trade have been identified.
At present Russia applies a 6.5% export tax on all PGM exports. Strikes by South African miners through 2012 have impacted on production and may do so in the future.
Several countries hold stockpiles of PGMs including the US National Defence Stockpile, the Russian State Precious Metals Repository and the South Korean Government. The USA stockpile holds iridium and platinum. Until recently these were being sold off but this has now halted due to concerns over supply though none of the PGMs are recommended for stockpiling. The metal content and size of the Russian PGM stockpile is unclear, though it is thought to mainly hold palladium, which has contributed around several tonnes to world palladium supply annually since 1990. It is unclear how long this might continue. The South Korean stockpile is understood to contain around 60 days of domestic consumption.
aRecycling the Platinum Group Metals: A European Perspective, Hagelüken, C., Platinum Metals Review, 2012, 56, (1), 29–35
Use Substitutes/Rationale Substitutabilit y score
No suitable replacement, though some switching between
Electronics No suitable replacement at present 1Jewellery Alternative metals available subject to consumer choice. 0.3Medical alloys Alternative composites available 0.3Petroleumproduction Not suitable alternative available 1
Autocatalyst No suitable replacement 1Other Arbitrary assumption 0.5

Canada2%
Zimbabwe 5%
US2%
Other Countries3%
South Africa42%
Russia46%
Figure 127: Palladium supply by country, 2012
100
80
60
40
20
ExportsImports Net Exports
02008 2009 2010 2011 2012
-20
-40
Figure 128: Trends in EU trade flows for unwrought and powdered palladium (tonnes)
1
1.16.7 Palladium
Palladium (Pd) is one of the two most common PGMs and has the largest production. Its common uses are in autocatalysts and chemical and electrical uses.
SupplyPalladium supply in 2012 is estimated at approximately 255 tonnes, with 177 tonnes from primary production, 70 tonnes from recycling, and 8 tonnes from Russian stock sales. The primary suppliers were Russia (46%) and South Africa (42%). Other minor suppliers include Zimbabwe, Canada and the US.
Source: USGS (2012), Platinum Group Metals 2011 Minerals Yearbook and Johnson Matthey (2012) Platinum 2012 Interim Review
EU trade flowsHistorically trade flows for unwrought and powdered palladium have been in deficit by up to 25 tonnes, though varying over time (Figure 128). More recently exports have exceeded imports in 2012 for these materials, however not all palladium containing substances and products are included in these figures.
Source: Eurostat-Comext Database, Code 711021 Palladium in Unwrought and Powder Form [accessed August 2013]
The largest share of palladium exports from the EU was to the USA at 22 tonnes, with the USA also being one of the large importers to the EU supplying 9 tonnes (Figure 129). China and Switzerland are important export partners; however a large proportion is exported in smaller quantities to other countries around the globe. With the exception of Switzerland, the largest importers to the EU are

EU Exports of Palladium in Unwrought or Powder Forms (69 tonnes)
OtherSouth21%Korea
7%Brazil 8%United States
31%Switzer-land 15%
China 18%
EU Imports of Palladium in Semi- Manufactured Forms (56 tonnes)OtherNorway
5%7%South Africa 16%Russia33%
United States 16%Switzer-
land 23%
Figure 129: EU’s major trading partners for unwrought and powered palladium (tonnes)
1
countries that have significant primary product such as Russia, which is a larger primary producer of palladium. Whilst Switzerland does not have primary production it is an important refining country.
Source: Eurostat-Comext Database, Code 711021 Palladium in Unwrought and Powder Form [accessed August 2013]
The most important countries for Intra-EU trade are Belgium, Germany, Italy and the United Kingdom.
Demand and applicationsDemand for palladium is estimated to be 302 tonnes in 2012, including 12 tonnes associated with investment. The highest application demand for palladium is associated with autocatalysts for petrol engines (70%), electronics (13%), chemical catalysts (6%) and dental uses (6%).a
European demand for palladium is estimated at 61 tonnes for 2012, or 58 tonnes excluding investment.b
The applications associated with EU demand match the average world demand reasonably well; most variations are seen with additional consumption for jewellery in the EU, and lower industrial consumption. A summary of European demand for palladium is shown in Figure 130.
Table 39: 2012 World and European palladium demand
Application World Demand EU DemandTonnes %* Tonnes %*
Autocatalysts 202 70% 43 69%Jewellery 14 5% 2 10%Industrial Uses (total) 75 26% 8 19%Chemical 16 6% 3 5%Electrical 38 13% 1 10%Medical (incl dental) 17 6% 3.0 4%Other 4 1% 1 2%Investment 12 -- 3 ---Total 302 57.1Source: USGS and Johnson Matthey
aPercentages exclude investment which accounts for 12 tonnes.
bJohnson Matthey (2012) Platinum 2012 Interim Review

Jewellery4%Other Electrical
2% 10%
Medical4%
IndustrialUses 19%
Autocatalysts75%
Chemical5%
Figure 130: European application demand for palladium, 2012
1
Source: USGS (2012), Platinum Group Metals 2011 Minerals Yearbook and Johnson Matthey (2012) Platinum 2012 Interim Review
Resource efficiency and recyclingEnd-of-life recycling rates for palladium are estimated to be around 65% across all applications, and are well integrated into many markets.a Autocatalysts recycling is estimated to be between 50% and 55% by the UNEP. Johnson Matthey estimate that 27% of 2012 supply arises from recycled autocatalyst palladium. In industrial uses such as chemical catalysts recycling rates of up to 90% are possibly due to the type of application and close control over usage and recovery. By contrast recovery from some smaller uses such as electronics and the dentistry industry is below 20% according to the UNEP. Recycling from jewellery and coins is estimated to be between 90 and 100%.
As with the other PGMs, alternatives for palladium have been investigated due to its cost; however replacement is generally by another PGM. Overall strategies to minimise use appear to focus on dematerialisation and recovery rather than direct substitution.
Supply and demand forecastsThe market for palladium is reasonably balanced, however predicted growth in the autocatalysts sector and decreasing supplies from Russian stockpiles mean that it is likely to be in slight deficit (Figure 131).
Figure 131: World palladium supply and demand forecasts to 2020 (tonnes)
450
400
350
300
250
200
150
100
50
0
Pd
Industrial
Jewellery
Autocatalysts
Supply
2012 2014 2016 2020
Sources: Lonmin & GFMS Presentations (2013), and Johnson Matthey Yearbook data (2013)
a

1
UNEP International Resource Panel (2011), Recycling Rates of Metals: A Status Report

Canada4%
US2% Other Countries
2%
Zimbabwe6%
Russia14%
South Africa72%
Figure 132: Platinum supply by country, 2012
150125100755025
0-25-50-75
-100-125
ExportsImports
2008 2009 2010 2011 2012 Net Exports
Figure 133: Trends in EU trade flows for unwrought and powdered platinum (tonnes)
1
1.16.8 Platinum
Platinum (Pt) is one of the two most common PGMs, primarily used in autocatalysts, jewellery and catalysts.
SupplyPlatinum supply in 2012 is estimated at approximately 239 tonnes, with 182 tonnes and 57 tonnes arising from primary supply and recycling respectively. The majority, 132 tonnes of this was supplied from South Africa, with Russia, Zimbabwe, Canada and the USA being other major sources.
Source: USGS (2012), Platinum Group Metals 2011 Minerals Yearbook and Johnson Matthey (2012) Platinum 2012 Interim Review
EU trade flowsTrade flows for unwrought and powdered platinum varied over the last 5 years (Figure 133), being fairly balanced in most years except 2010. A large deficit is seen in 2010 associated with a threefold increase in imports and a halving of exports, linked to reduced demand from the automotive industry. This imbalanced continued through 2011 to a lesser extent, returning to close to parity in 2012. It should be noted that these figures do not take platinum in other forms and products not linked to the trade code used.
Source: Eurostat-Comext Database, Code 711011 Platinum in Unwrought and Powder Form [accessed August 2013]

EU Exports of Platinum in Unwrought or Powder Forms (48 tonnes)Japan
5%Mace-Otherdonia
13%12%
Switzer- land 14%
United States42%Hong Kong
14%
EU Imports of Platinum in Unwrought or Powder Forms (36 tonnes)NorwayRussiaOther4%5%2%Switzer-
land 11%
United States 15%SouthAfrica 63%
Figure 134: EU’s major trading partners for unwrought and powered Platinum (tonnes)
1
The largest share of platinum exports from the EU was to the US at 20 tonnes, with the USA also being the second largest importers to the EU supplying 6 tonnes (Figure 134). Other exports are split over several other countries. Imports to the EU are dominated by South Africa, linked to primary production.
Source: Eurostat-Comext Database, Code 711021 Palladium in Unwrought and Powder Form [accessed August 2013]
Important countries for EU Intra-trade are Belgium, Germany, Slovakia, and the United Kingdom.
Demand and applicationsWorld demand for platinum is estimated to be 251 tonnes, including 15 tonnes associated with investment (Table 40). The highest application demand for platinum is associated with autocatalysts for light duty diesel engines (40%), jewellery (36%) and industrial uses (24%).a European demand for platinum is estimated at 60 tonnes for 2012, or 57 tonnes excluding investment.b The applications associated with European demand vary from the average world demand, with a much larger proportion associated with autocatalysts and a lower proportion associated with jewellery. A summary of European demand for platinum is provided in Table 40.
Table 40: 2012 World and EU platinum demand
Application World Demand European DemandTonnes %* Tonnes %*
Autocatalysts 95 40% 39 69%Jewellery 85 36% 6 10%Industrial Uses (total) 56 24% 8 14%Chemical 14 6% 3 6%Electrical 6 3% 1 1%Glass 7 3% 1 1%Petroleum 6 3% 1 1%Medical 7 3% 3.0 5%Other 15 6% 4.4 8%Investment 15 -- 2.8 ---Total 251 57.1*excluding investment Source: Johnson Matthey
aPercentages excludes investment which accounts for 15 tonnes.
bJohnson Matthey (2012) Platinum 2012 Interim Review

1
Jewellery10% Other
8%
ElectricalGlass1%1%
Petroleum1%
Medical5%
IndustrialUses 14%
Autocatalysts68%
Chemical6%
Figure 135: EU application demand for platinum, 2012
Source: Johnson Matthey (2012) Platinum 2012 Interim Review
Resource efficiency and recyclingEnd-of-life recycling rates for platinum are estimated to be around 65% across all applications.a Recycling of platinum is well established in many markets, however there is a variation across applications. In the largest use, autocatalysts recycling is estimated to be between 50 and 55% by the UNEP, and Johnson Matthey estimated that 33% of autocatalyst supply in 2012 arises from recycled sources. With industrial uses such as chemical catalysts, up to 90% recovery rates may be seen due to the type of application and close control over usage and recovery. By contrast recovery from some smaller uses such as electronics, have much lower recovery rates, which are estimated to be below 5%. Recycling from jewellery and coins is estimated to be between 90 and 100%.
Alternatives for platinum in most applications have been sought due to its cost; however very few alternatives have been found, particularly for autocatalysts and industrial catalysts. Some replacement by palladium is possible in autocatalysts, and this occurs when economically viable. Overall strategies to minimise use appear to focus on dematerialisation and recovery rather than direct substitution, such as the minimisation of use in fuel cell catalysts.b
Supply and demand forecastsFigure 136: World platinum supply and demand forecasts to 2020 (tonnes)
400
350
300
250
200
150
100
50
0
Pt
Industrial
Jewellery
Autocatalysts
Supply
2012 2014 2016 2020
Sources: Lonmin & GFMS Presentations (2013), and Johnson Matthey Yearbook data (2013)
aUNEP International Resource Panel (2011), Recycling Rates of Metals: A Status Report
b

1
EU JRC (2013), Critical Metals in Low-Carbon Energy Technologies

1
The demand for platinum is predicted to grow, primarily linked to the growth in demand from the automotive industry; however slight growth in the other major applications is predicted (Figure 137Figure 136). Supply is predicted to fall behind, partly due to uncertainties over the supply from countries such as South Africa.

1
Zimbabwe5%
CanadaUS2% 2%
Russia9%
South Africa82%
Figure 137: Rhodium supply by country, 2012
14121086420
ExportsImports Net Exports
20082009201020112012
Figure 138: Trends in extra-EU trade for unwrought and powdered rhodium (tonnes)
1.16.9 Rhodium
Rhodium supply and demand is around 10% of platinum and palladium and can be considered a by- product of these metals. It is primarily used in three-way catalytic converters to reduce vehicle emissions.
Supply2012 supply for rhodium is estimated at 29 tonnes, with 7 tonnes of this coming from recycled autocatalysts, and 22 tonnes from primary production. The main mined source of rhodium is from South Africa, with various other countries contributing smaller amounts to supply.
Source: USGS (2012), Platinum Group Metals 2011 Minerals Yearbook and Johnson Matthey (2012) Platinum 2012 Interim Review
EU trade flowsExports for unwrought and powdered rhodium have consistently exceeded imports over the past five years (Figure 138). A decrease in the surplus was seen to 2010 with an increase beyond, following a similar pattern to platinum. These statics only account for a portion of trade, as rhodium will also be traded in products, which are not accounted for by these statistics.
Source: Eurostat-Comext Database, Code 711031 Rhodium in Unwrought and Powder Form [accessed August 2013]
The major destination countries for this form of rhodium are Hong Kong (4 tonnes) and the USA (3 tonnes) (Figure 139). As with the other PGMs, imports are closely linked to producing countries such as South Africa and Russia.

Figure 139: EU’s major trading partners for unwrought and powdered rhodium (tonnes)EU Exports of Rhodium in Unwrought or
Powder Forms (12 tonnes)EU Imports of Rhodium in Unwrought or
Powder Forms (4 tonnes)
UnitedStates 29%
HongKong 35% China
3%UnitedStates 6%
Japan8%
Other5%
China18%
Japan13%
SouthAfrica 57% Russia
26%
Electrical1%
Other7%
Glass4%
IndustrialUses 13%
Autocatalysts80%
Chemical9%
Figure 140: Application demand for rhodium, 2012
1
Source: Eurostat-Comext Database, Code 711031 Rhodium in Unwrought and Powder Form [accessed August 2013]
Belgium, Germany and the Netherlands are the most important countries for Intra EU trade.
Demand and applicationsDemand for rhodium in 2012 is estimated at 30 tonnes. The primary use for rhodium is in 3-way catalytic converters used to reduce tailpipe emissions from vehicles. Rhodium is specifically used to reduce NOx
emissions, which is not possible using other catalysts. Other uses include catalysts in the chemicals sector and in the production of fibreglass.
Source: Johnson Matthey (2012) Platinum 2012 Interim Review
Resource efficiency and recyclingEnd-of-life recycling rates are estimated to be between 50 and 60% overall. In the major use, autocatalysts, the UNEP estimate a 45-50% recycling rate, Johnson Matthey estimate that 23% of autocatalyst supply arises from recycled rhodium from autocatalysts. As with the other PGMs, recycling from industrial uses is estimated to be 90% and from electronics is about 5-10%.

60
50 Rh
40
30
20
IndustrialAutocatalysts Supply
10
02012 2014 2016 2020
Figure 141: World rhodium supply and demand forecasts to 2020 (tonnes)
1
Substitution of rhodium is of interest as up until early 2012 it was more expensive than platinum. However, at present there are no alternatives for its main use in autocatalysts. Therefore dematerialisation strategies are most likely to succeed, however stricter emissions controls and larger engines reduce the impact of this.
Supply and demand forecastsDemand for rhodium is strongly linked to demand for autocatalysts; therefore an increase in demand is predicted. Its supply is linked to platinum production, which is expected to fall behind demand due to political uncertainties in South Africa, the major producing country.
Sources: Lonmin & GFMS Presentations (2013), and Johnson Matthey Yearbook data (2013)

Zimbabwe2%
Canada1%
Russia18%
South Africa79%
Figure 142: Estimated supply of other PGMs by country, 2012
1
1.16.10 Other PGMs (ruthenium, iridium and osmium)
IntroductionThe other PGMs include ruthenium (Ru), iridium(Ir) and osmium(Os).
Supply and demand statisticsTotal supply of the other PGMs in 2012 is estimated to be 49 tonnes, the majority of this (79%) is mined in South Africa. No recycling is included in this supply figure.
Source: Oakdene Hollins estimations based on USGS (2012), Platinum Group Metals 2011 Minerals Yearbook and Johnson Matthey (2012) Platinum 2012 Interim Review.
EU trade flowsTrade flow data from the past 5 years shows that the EU has consistently been a net exporter of the other PGMs linked to the refining of these metals (Figure 143). However, other trade linked to products is not accounted for.
Figure 143: Trends in extra-EU trade for unwrought and powdered iridium, osmium and ruthenium (tonnes)
Source: Eurostat-Comext Database, Code 711041 Iridium, Osmium and Ruthenium in Unwrought and Powder Form [accessed August 2013]
Note: Exports of semi-final products around 3 t per year, imports of semi-final products 1 t per year
45
40
35
30
25
20
Exports
Imports
Net
2008 2009 2010 2011

1
In contrast to the palladium, platinum and rhodium, EU exports of other PGMs are dominated by Singapore, due to their different uses such as in the electrical sector. EU Imports are primarily from the larger PGM producers South Africa and Russia.

1
Other11%
Chemical12%
Electro-chemical20%
Electrical57%
Figure 145: Application demand for ruthenium and iridium, 2012
Figure 144: EU’s major trading partners for unwrought and powdered iridium, osmium and ruthenium (tonnes)
EU Exports of Iridium, Osmium and Ruthenium in Unwrought or Powder
Forms (22 tonnes)
United States18% Singapore
53%
EU Imports of Iridium, Osmium and Ruthenium in Unwrought or Powder
Forms (6 tonnes)
Other 13%
Japan 10%
Japan 11%
South Africa 67% Russia
10%
Hong Kong 9%
Other 9%
Source: Eurostat-Comext Database, Code 711041 Iridium, Osmium and Ruthenium in Unwrought and Powder Form [accessed August 2013]
Economic importanceDemand for the other PGMs for 2012 is estimated at 31 tonnes, with approximately 78% for ruthenium and 22% for iridium. Figures for osmium are not widely available, but they are understood to be much smaller than ruthenium and iridium. The major uses for ruthenium are in the electronics sector, (particularly for hard disk drives) and as catalysts in the chemicals sector. The primary uses for iridium are found in the electronics, chemical and electrochemical sectors.
Source: Johnson Matthey (2012) Platinum 2012 Interim Review
Resource efficiency and recyclingRecycling of ruthenium and iridium is not as common as the other PGMs due to their uses. The UNEP estimate that recycling rates for ruthenium to be 5%-15% and iridium to be 20%-30%. This is primarily from industrial applications such as catalysts. Recycling from the other uses is low. Johnson Matthey estimates show that recycling contributed no supply in 2012 for these metals.
As with the other PGMs, substitution is appealing due to costs but is generally not possible for existing applications.

1
1.17 Rare earth elements (Light and Heavy)*
*Profiles for the individual metals are provided in Sections 1.17.7 to 1.17.17
1.17.1 Introduction
The term ‘rare earth elements’ (REEs) is a collective name for the 15 elements in the lanthanide group: lanthanum, cerium, praseodymium, neodymium, promethiuma, samarium, europium, gadolinium, terbium, dysprosium, holmium, erbium, thulium, ytterbium and lutetium. Due to some similar properties, scandium and yttrium are also often considered as rare earth elements, making a total of 17 elements when the widest definition of this group is used. As a group, the REEs are all metallic in nature and are typically discussed together due to their similar chemical and physical properties. In addition, with the exception of scandium, they are obtained from the same ore deposits, although the metal ratio does differ considerably between different deposit types.
In this analysis a distinction is made between ‘light’ and ‘heavy’ rare earth elements (Table 41). This is partly based on their respective chemical properties and geological availability, but also upon their market values and respective end-markets. Scandium is treated separately within this study as generally it is not produced from the same deposits as the other REEs. In this analysis scandium is not a critical raw material, therefore its profile can be found in the separate document for non-critical raw materials.
Table 41: Classification of REE in the EU Critical Raw Materials study
The rare earths range in abundance from cerium, the most naturally abundant, to thulium and lutetium, the least abundant. Table 42, shows the average distribution of REE across 51 deposits. These have been calculated from REE grades reported in the resources and reserves by companies that publish these figures according to the JORC, NI-43-101 or comparable reporting standards.b
Table 42: Average distribution of the individual REE across 51 depositsc
aPromethium (Pr, atomic number 61) does not occur in nature and is not discussed further here
bdata on Chinese deposits is unavailable. In addition data is missing for most deposits developed by companies financed by private equity, by the cash
reserves (no and/or for currently mined deposits where rare-earth occur as a by-product. No reporting obligations apply to such cases.c
P. Christmann (BRGM), personal communication
Metal Grouping for study
Rare
Earth Elements
Scandium ScandiumLanthanum,
Cerium, Praseodymium,
Rare Earth Elements -Light (LREE)
Europium, Gadolinium, Terbium, Dysprosium,
Erbium, Yttrium,
Rare Earth Elements -Heavy (HREE)
Light Rare EarthElementsLanthanum 24.9%Cerium 43.2%Praseodymium 4.6%
Heavy Rare Earth Elements
Europium 0.3% Erbium 0.5%Gadolinium 1.4% Thulium 0.1%Terbium 0.2% Ytterbium 0.4%
d IMCOA presentation (April 2012), The Global Rare Earths Industry: A Delicate Balancing Act; Kingsnorth
1
This data demonstrates the non-uniform occurrence of the REEs, and highlights the rarity of certain REEs, especially the heavy REEs. This is significant as demand ratios do not match their natural abundance, and several of the heavy REEs are in great demand due to their link with certain applications. For example, dysprosium is used in high performance magnets and europium and terbium are used in energy saving light bulbs. However, it should be noted that even thulium is geologically less rare than either gold or platinum.
The first stages in production of REEs are the mining and concentration of the rare earth ores and the separation into the individual rare earth oxides by solvent extraction. This processing is complex as the individual REEs are chemically similar, and each ore body requires specific technology developed uniquely for that particular deposit in order to extract and separate the REEs. The next stage is to refine and purify the rare earth oxides into their metals using ion-exchange purification to achieve the highest purities.
Figure 146 shows the main stages in the supply chain for permanent magnets. For the forming of the metals into magnet alloy powders and the manufacturing of the actual magnet, intellectual property plays a significant role in the supply chain. Two main types of permanent magnets are produced: higher performance sintered magnets for electric drive and wind turbine applications, and bonded magnets for other applications such as electronics. With regard to the manufacture of REE based permanent magnets, around 75-80% occurs in China, 17-25% in Japan and 3-5% in Europe.a Key European companies for permanent magnets include Vacuumschmelze (Germany) and Arnold Magnetics (UK).
Figure 146: Supply chain map for permanent magnetsb
Mine & separate oxides
Purify metals
Alloys & magnet powders
Magnet manufacture
Components for motors & generators
Intallation& use Disposal
Note: Orange colour represents stages of the supply chain which take place in Europe
Figure 147 shows the main stages in the supply chain map for phosphors. Within the EU, a French company Rhodia-Solvay is actively involved in the manufacture of phosphor powders and coatings, and has recently developed a rare earth recycling process for end-of-life phosphor lamps. Nonetheless, Europe remains a relatively minor player for phosphor production, with less than 5% of world phosphor demand located within Europe. China, Japan and North East Asia retain dominance in this market, with 60-65% of rare earth demand for phosphors located in China, and approximately 25% located in Japan and North East Asia for 2011.c
Figure 147: Supply chain map for phosphorsMine & Application Light bulbseparate
oxidesPurifyoxides
Phosphorpowders of phosphor
coatingsassembly & distribution
Intallation& use Disposal
Note: Orange colour represents stages of the supply chain which take place in Europe
Figure 148 shows the main stages in the supply chain map for NiMH batteries. Very limited production of battery grade alloys, electrode, or cell construction and assembly of batteries takes place within the EU. IMCOA estimate that more than 90% of these activities take place within China, Japan and North East Asia, with more than 70% within China alone. d However, NiMH batteries do find their installation and use within a variety of electronic and vehicle applications.
a Öko-Institut (2011), Study on Rare Earths and Their Recycling.
b See US Department of Energy (2010 & 2011), Critical Materials Strategy; for more information on these rare earth supply chain maps c
IMCOA presentation (April 2012), The Global Rare Earths Industry: A Delicate Balancing Act; Kingsnorth D.J.
Neodymium 16.2%Samarium 2.2%
Dysprosium 0.9% Lutetium 0.1%Holmium 0.2% Yttrium 4.9%
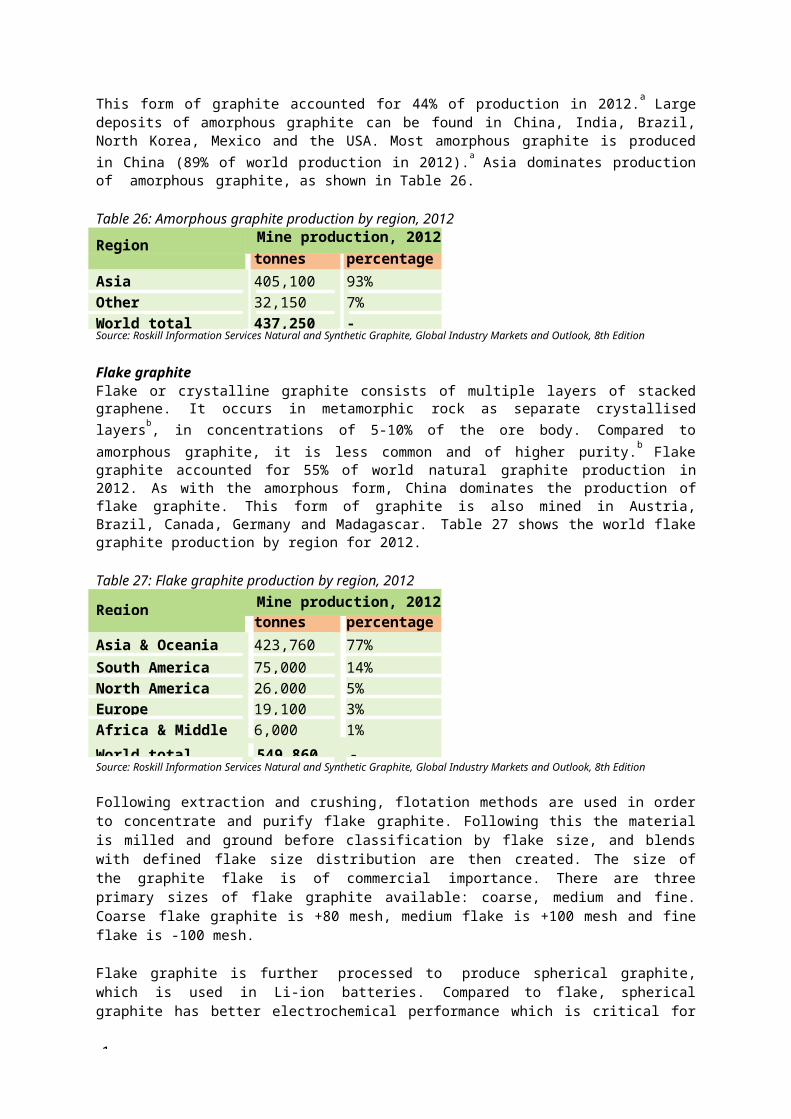
1
Figure 148: Supply chain map for NiMH batteriesMine & Cellseparate
oxidesPurifyoxides
Batterygrade alloys
Batteryelectrodes construction
& assembly
Intallation& use Disposal
Note: Orange colour represents stages of the supply chain which take place in Europe
1.17.2 Supply and demand statistics
Primary sources, production and refiningDespite the name, rare earth elements are not particularly uncommon, they just are relatively evenly distributed in the Earth’s crust, not often forming deposits. REE reserves are estimated by the USGS at 110 million tonnes, with an estimated half of world reserves located in China (Table 43). However, this USGS figure is likely to be an underestimated as it does not appear to have been updated in response to significant recent exploration activity and the existence of non-conventional REE sources, such as sedimentary phosphate deposits, a potentially huge resource.
The major ore types from which rare earths are currently produced are bastnaesite, ionic clays, loparite (specific to the Kola Peninsula) and monazite, with eudialyte and xenotime likely to become economically important in the near future, as these minerals are enriched in heavy REE and have a low radioactivity, a problem in many REE deposits. So far there are about 200 REE minerals known but processes to recover individual REE are available only for the abovel list, excluding eudialyte and xenotime. The world’s current largest rare earth mine (Bayan Obo in Inner Mongolia, China), for example, produces rare earths as a by- product of iron ore mining. Rare earth production of heavy REEs is concentrated Southern China, based on ionic clay deposits. Potential rare earth producers include various poly-metallic or by-product sources including iron, zirconium-hafnium, niobium-tantalum, phosphates, tin and titanium.
Supply detailsWorld mine production of REEs for 2012 was estimated by the USGS at 110,000 tonnes. However, this estimate is likely to exclude significant illegal production, of the order 20,000-25,000 tonnes – some of which is processed by official plants.
Based on the USGS data, China is the world’s dominant producer, accounting for 87% of world supply – even though China has around half of world reserves identified by the USGS (Table 43). However, this actually represents a reduction in China’s market power, which stood at 95% in 2011.a This is as a result of rare earth production reopening at Mountain Pass mine in California, USA (previously mined from 1952 to 2002), and increased production at Mount Weld in Australia. No rare earth production is located within the EU.
Table 43: World reserves of rare earth elements
)
Source: US Geological Survey (2013), Mineral Commodity Summaries
a
Country Mine production (in tonnes, 2012)
China 95,000 86.8% 55,000,000 4 8.3%United States 7,000 6.4% 13,000,000 1 1.4%Australia 4,000 3.7% 1,600,000 1.4%India 2,800 2.6% 3,100,000 2.7%Malaysia 350 0.3% 30,000 0.0%Brazil 300 0.3% 36,000 0.0%
World total 110,000 110,000,000

1
US Geological Survey (2013), Mineral Commodity Summaries

1
Data on the market supply of individual rare earth elements has been compiled by Roskill Information Services (Table 44). Roskill estimates world production of REEs to be slightly higher, at 127,000 tonnes for 2012 - although this does not include the 4,000 tonnes of mined material from Mount Weld in Australia which currently awaits processing and appears likely to enter the supply chain in the next year.
Roskill’s estimates are based on annual production figures published by producers, disaggregated by element. For projects outside China, data on mine production and the relative occurrence of elements by project, and by deposit, is generally well-documented. This data are believed to be accurate, in accordance with reporting standards. Roskill makes a significant distinction between mining and market supply. They argue that some processing of the mined material is necessary to convert it at least into a chemical concentrate that enters the supply chain. Therefore mined stockpiles, such as in Brazil where the facility has stopped processing rare earths, do not qualify as current supply, but rather as potential future supply.
Table 44: Estimated world mine production in tonnes of rare earth oxides, 2012,±15%†
Rare Earth China USAAustralia* India Russiaa Total %
Lanthanum 29,320 2,661 1,040 169 700 33,890 26%
Cerium 41,875 3,934 2,040 363 1,436 49,64838%
Praseodymium 5,700 347 160 42 95 6,344 5%
Neodymium 19,750 960 600 139 220 21,669 17%
Samarium 2,470 64 72 20 24 2,650 2%Europium 340 8 16 3 367 0%Gadolinium 2,215 14 40 9 5 2,283 2%Terbium 340 2 4 2 348 0%Dysprosium 1,350 2 8 2 1,362 1%
Erbium 860 8 2 870 1%Yttrium 9,915 8 2 9,925 8%
Ho, Tm, Yb, Lu 1,715 10 8 11 1,744 1%
Total 115,850 8,000 4,000 750 2,500 131,100 -
Source: Roskill Information Services / Dudley Kingsnorth, IMCOA (March 2013) & *USGS Data for Australia†This reflects uncertainty related to Chinese mineral and metal production statistics
Reliable data for actual production in China, however, are much less readily available. Official production data are published, but these data do not incorporate a substantial supply volume from illegal mines, which is estimated to account for around 15-30% of total Chinese production (15,000-25,000 tonnes), although this figure is not well-established. For example, Roskill relies on third-party reporting of illegal mining activities to estimate production from these mines. Total production figures for the country as a whole are believed to be reasonably accurate. Regionally, heavy rare earths are primarily produced in the south, whereas light rare earths dominate in the west and north of the country. Since data on illegal mining are not available on a region-by-region basis, estimates of production-by-element for China are less robust than those for total production.
aThe different statistics in relation to Russian production of rare earths can be explained by two different statistical sources. In addition table 44 provides
more specific information on rare earth oxides.

1
25 000
20 000
15 000
10 000
5 000
ExportsImports
02008 2009 2010 2011 2012 Net Exports
-5 000
-10 000
-15 000
-20 000
Figure 149: Trends in extra-EU trade for rare earths (tonnes)
Primarily on account of the difficulties associated with estimating Chinese production, Roskill estimates that the production data are accurate within a 15% error margin. In the case of all the heavy REEs – but most particularly those from holmium (Ho) to ytterbium (Yt) – supply data are theoretical rather than actual as these elements may not be recovered if the processor has no orders for these elements. Data for the supply of rare earths from Mount Weld have also been included within these figures, on the basis that it will shortly constitute market supply. China’s share of world rare earth production is approximately 87%. However, for heavy REEs China’s share is approximately 99% of world supply.
EU trade flows and consumptionOverall the EU is a significant net importer of rare earth compounds, metals and alloys, importing around 8,000 tonnes per year (Figure 61). However, back in 2008 the EU imported a total of nearly 20,000 tonnes of rare earths. These figures do not take into account REEs imported and exported in products or other forms.
Source: Eurostat-Comext Database CN 28461000, 28053010, 28053090, 28469000 [accessed September 2013]
The largest source of the EU’s imports for 2012 was China (Figure 150); however, the EU has been able to diversify its sources of supply considerably since 2010, with Russia and the USA having now become important suppliers for the EU, although it is only in 2013 that USA became again a producer of REE, further to the re-opening of Molycorp’s Mountain Pass mine.
In terms of destinations for the EU’s exports, the USA and Japan dominate, although the EU exports rare earths to many countries around the world. Notably, this includes significant rare exports from Estonia from the Silmet rare earths separation and processing facility (now owned by Molycorp).

1
Others8%
USA12%
NE Asia &Japan 22%
China58%
Figure 151: Estimated Demand for Rare Earths by Geographic Region, 2010 (%)
Figure 150: EU’s major trading partners for rare earths, 2012 (tonnes)
Exports of REE (4,014 tonnes)Imports of REE (12,273 tonnes)
Other
Korea 3%
China 5%
Other16%
United States 44%
United States 17%
Japan 2%5%
China 41%
Japan 32% Russia
35%Source: Eurostat-Comext Database CN 28461000, 28053010, 28053090, 28469000 [accessed September 2013]
Europe is not directly a large consumer of rare earths and tends to listed within ‘others’, meaning that Europe’s share of world rare earths consumption was at most 8% for 2010 (Figure 151). Analysis of more recent trade statistics shows that, for 2012, the EU was a net importer of 8,255 tonnes of rare earths.
When compared to estimates for world rare earth consumption of 113,000 tonnes for 2012, this equates the EU share of rare earth consumption at close to 7%. Notably, this estimate for apparent consumption excludes the rare earth content of imported products, including batteries, magnets and compact fluorescent lamps. Worldwide, China represents the world’s largest rare earth consumer at around 60% of the world market. Other Asian countries account for a further 22%, with the United States representing 12% of the world market (Figure 151).
Source: Roskill/IMCOA Presentation (2011), Rare earths – an evaluation of current and future supply
OutlookGiven the level of exploration and mine development activity underway for rare earths, it is useful to provide commentary regarding the major future suppliers. There are hundreds of prospects currently being explored although, in reality - given the size of the rare earths’ markets and the economic viability of each of these - only a limited number can be expected to reach commercialisation.

45 00040 00035 00030 00025 00020 00015 00010 0005 000
0
1960 1970 1980 1990 2000 2010
Figure 152: Historical prices for rare earth elements, unit value (98 US$/t)
1
A complete list of the most advanced rare earth projectsa is provided by Technology Metals Research, and consists of 49 advanced rare earth projects by 43 different companies in 43 different countries.b In addition, at least four different joint venture projects involving major Japanese corporations are known to be in the pipeline.c However, a lack of finance is delaying many of these projects, pushing back their projected start-up dates. Moreover, the performance of the two main mines located outside of China, Mountain Pass (Molycorp, USA) and Mount Weld Lynas, Australia) is rather beyond the expectations, as shown by recent company statements.d
Norra Kärr (Sweden), owned by Tasman Metals, is of note as the only advanced rare earths project located within the EU, although development projects also exist in Germany, Greenland and Turkey. Norra Kärr has a total resource of 58.1 million tonnes, at a grade of 0.59%, implying 0.34 million tonnes of rare earth oxide in-situ. The attraction of the Norra Kärr deposit, however, is its relative enrichment in heavy rare earth oxides, which comprise approximately 50% of the rare earth oxide distribution. Tasman Metals has also postponed its pre-feasibility study due to a lack of finance.
1.17.3 Demand
Prices and marketsHistorical prices for REEs are shown in Figure 152. For much of the last 40 years rare earth prices have been stable at around $5,000-$10,000 per tonne. In 2009-2011 prices for rare earths rose dramatically, following China’s decision to significantly tighten its export quotas - although they have since returned to a lower level. However, as of mid-2013 indications from the market are that prices are rising.
Source: USGS (2012), Metal Prices in the United States Through 2010
ApplicationsRare earth elements are used for a wide variety of applications, although four markets (magnets, metallurgy, catalysts and polishing powder) accounted for nearly three quarters of total rare earth use in 2012 (Figure 153). Glass, phosphors and ceramics are also important applications for certain rare earths.
aAdvanced project are defined as where either the mineral resource or reserves have been formally defined or where the project has been subject to past
mining campaigns for which reliable historic data is availableb
Technology Metals Research http://www.techmetalsresearch.com/metrics-indices/tmr-advanced-rare-earth-projects-index/ [accessed January 2013]c Ernst & Young (2011), Technology Minerals: The rare earths race is on!d
Molycorp (2013), Form 8-K Current Report Pursuant To Section 13 Or 15(D) Of The Securities Exchange Act Of 1934. http://phx.corporate-ir.net/ [Accessed

1
November 2013]
Other Ceramics7%5% Magnets
20%
Phosphors7%
Glass 7%
Batteries8%
Polishing15%
Other Catalysts 1%Autocatalysts 6%
FCCs13%
Othermetallurgy 10%
Figure 153: Rare earth use by application, 2012 (tonnes)
1
Source: Roskill Information Services / Dudley Kingsnorth, IMCOA (March 2013)
Descriptions of the major markets for rare earth elements are as follows: Magnets: Many rare earth elements have important magnetic characteristics, notably Neodymium-
Iron-Boron magnets (also containing praseodymium and dysprosium) and samarium cobalt. Key applications for permanent magnets include industrial motors, hard disc drives and automotive applications. Emerging and growing markets for permanent magnets are expected to be hybrid and electric vehicles, and wind turbines.a
Batteries: Nickel metal hydride batteries (NiMH) are the first choice for portable tools, containing mostly lanthanum and cerium. NiMH batteries have also been extensively used in hybrid vehicles, although increasingly Li-ion batteries are expected to be used for this application.b
Metallurgy: light rare earths are used to improve the mechanical characteristics of alloyed steel, for desulphurisation, to bind trace elements in stainless steel and in magnesium and aluminium alloys.
Catalysts: An important use for rare earth metals is in catalysts, for example lanthanum used in fluid catalytic cracking in oil refineries, and cerium in catalytic converters for cars. Use of lanthanum as an FCC increases oil refinery yields by up to 7%.c
Polishing powders and glass additives: cerium oxide is a widely used polishing agent and as an additive in the production of glass such as for decolourisation and removal of impurities.
Phosphors: heavy rare earth elements are important constituents of tri-band phosphor lighting used for linear fluorescent tubes and compact fluorescent lamps, as well as CCFL LCD backlights for flat panel displays. Given increasingly stringent regulations on the energy efficiency and the demise of CRT screens, this is a growing market; although competition with LED lighting should be expected.
Other applications for rare earths include ceramics, fibre optics and lasers.
Data on demand for individual REEs is based on top-down and bottom-up estimates of consumption, compiled by Roskill Information Services (Table 45). The top-down approach is based on estimated consumption by country, which is reported in official statistics and cross-checked by Roskill against trade data as reported by both the exporting and importing nation. However, information about the breakdown of the European market by application was not available at the time of writing.
aArnold Magnetic Technologies Presentation, (2011), Permanent Magnet Materials and Current Challenges
bDeutsche Bank Global Markets Research, (2009), Electric Cars: Plugged In 2
cLynas Presentation (April 2010), International Minor Metals Conference

1
The bottom-up approach is based on calculations of consumption of rare earth elements by industry, taking into consideration estimated production of intermediate and end-use products such as magnets, batteries, phosphors, etc., as well as estimates of the average content of specific REEs in these products. Roskill believes that the resulting estimates of demand are accurate to within 15%. As with the supply data, the uncertainty in these data mostly relates to the divergent estimates for Chinese consumption.
Table 45: World use of individual rare earth elements, in tonnes of rare earth oxides, 2012, ±15%
Rare earth element Magnets Batteries Other
metallurgy
Fluid cracking catalysts
Auto- catalysts
Other catalysts
Lanthanum 8,185 3,085 13,950 450Cerium 1,275 8,490 800 5,965 1,250Praseodymium 3,600 195
Neodymium 17,640 480 340Samarium 500EuropiumGadolinium 360 290Terbium 70Dysprosium 835ErbiumYttriumHo, Tm, Yb, Lu
Total 23,000 9,460 12,540 14,750 6,750 1,250
Rare earth element Polishing Glass Phosphors Ceramics Other Total
Lanthanum 470 1,600 455 365 2,930 31,495
Cerium 16,375 5,500 1,690 365 3,815 45,525Praseodymium 105 570 365 110 4,945Neodymium 55 260 185 895 75 19,925Samarium 15 515Europium 410 15 425Gadolinium 230 140 1,020Terbium 205 15 290Dysprosium 15 845Erbium 390 135 15 540Yttrium 6,020 1,600 30 7,650Ho, Tm, Yb, Lu 75 75Total 17,000 7,750 8,000 5,500 7,250 113,250Source: Roskill Information Services / Dudley Kingsnorth, IMCOA (March 2013) for 2013 CRM study
OutlookThe overall market forecast for the world supply and demand of rare earth elements is shown in Figure 154 based on data gathered from industry combined with analysis of trends (this is described below). This process is briefly described at the end of this section to provide greater clarity. Based on this analysis, over all the REEs, a significant surplus currently exists, and this is expected to increase as the decade progresses. World supply of REEs is expected to increase at over 7% per year, as rare earth mines have opened such as Mountain Pass (USA), Mount Weld (Australia); or new mines will open, such as

250 000
Total REE200 000
150 000
100 000
50 000
OtherCeramics Phosphors Glass/Polishing Catalysts Metallurgy MagnetsSupply
02012 2014 2017 2020
Figure 154: World rare earth elements supply and demand forecasts to 2020 (tonnes)
250 000LREE
200 000Other
150 000 CeramicsPhosphors
100 000Glass/PolishingCatalysts
50 000MetallurgyMagnets
0 Supply
2012 2014 2017 2020
Figure 155: World light rare earth elements supply and demand forecasts to 2020 (tonnes)
1
Indian Rare Earths, Steenkampskraal (South Africa), Dubbo (Australia) and a couple of small mines in Kazakhstan. The opening of these mines will lower China’s share of rare earths supply to nearer to 60% of the total world market.
Sources: Roskil for 2013 CRM study l, IMCOA and Technology Metal Research Reports and Presentations (2012-2013)
However, Dubbo is the only one of these forthcoming mines that has a significant proportion of heavy rare earths in its deposit. The forecast for heavy REEs, therefore, is for the overall deficit to continue until at least 2016, until more substantial supply opportunities are realised towards the end of the decade (Figure 156). The situation is expected to be most acute for yttrium, terbium and europium; although it could also be tight for erbium and dysprosium. For light REEs, large surpluses are anticipated overall (Figure 155) and particularly for cerium, praseodymium and samarium. For neodymium, the situation could remain quite tight, if the uptake of hybrid and electric vehicles is realised more strongly or earlier than anticipated. Individual REE forecasts can be found in their respective profiles below.
Sources: Roskill, IMCOA and Technology Metal Research Reports and Presentations (2012-2013)
On the demand side strong growth is expected overall, at over 6% per year to 2020. The highest demand growth is forecast in the magnets, phosphors and ceramics end-markets, in which growth is forecast to exceed 7% per year. The importance of these markets for the heavy rare earth elements explains the

25 000HREE
20 000
15 000
10 000
5 000
OtherCeramics Phosphors Glass/Polishing Metallurgy MagnetsSupply
02012 2014 2017 2020
Figure 156: World heavy rare earth elements supply and demand forecasts to 2020 (tonnes)
350000
300000
250000
200000
150000
100000
HatchIMCOALynas USGS
50000
0200020022004200620082010201220142016
Figure 157: Estimates and projections of annual metal production for rare earth elements (tonnes)
1
higher trend growth expected for heavy versus light REEs. More moderate growth is forecast for the metallurgical, catalysts and glass/polishing end-markets, at nearer 4% per year to 2020.
Sources: Roskill, IMCOA and Technology Metal Research Reports and Presentations (2012-2013)
Future supply of REE is of wide interest and subject to much debate due to the profile they have received over recent years. However, it is difficult to predict how REE supply will develop further into the future, and there are many views on the future supply of these metals. Prediction is particularly difficult as there is large uncertainty over the number and details of on-going development projects, and the assessment over how successful these will be in achieving production. Several high level estimates and projections are available for supply from different sources, showing this variation in views (Figure 157). However, analysis within this study required the detail on each of the REEs, therefore in-house forecasts were generated. a A supply forecast was developed based on known projects REE underway and estimated production over time. Overall, this forecast agrees with the more conservative estimates of Lynas and USGS (Figure 154 & Figure 157), reaching 205,000 tonnes in 2017.
Sources: US Geological Survey, 2012) data till 2010,interpolation and extrapolation of Lynas Corporation Ltd, 2010, IMCOA in US Dept. of Energy, 2011, Hatch, 2011.
aThis is a similar approach taken in a recent study by the JRC

2015
2010
0% 20% 40% 60% 80% 100%
LaCe Pr Nd Sm Eu Gd Tb Dy YOthers
Figure 158: Forecast changes in the composition of world rare earth supply
1
To forecast data for individual metals, trends in composition of mined REE were produced based on predicted mining volumes and compositional data for each project. Due to differences in deposit composition, mined REE composition does not remain constant over time, depending on the different deposits mined, (Figure 158). Therefore to allow for future variations in individual REE supply, this composition was projected forward based on project data, and combined with the overall estimated production figures to generate a forecast for each REE.
Sources: IMCOA in US Dept. of Energy, 2011, Roskill for 2013 CRM study
As stated above, there are many different views on supply. However, the figures for the individual metals calculated for this study agree well with one industry viewa, though are more optimistic that figures produced by the US Department of Energy by around 10%.b
1.17.4 Resource efficiency and recycling
End-of-life recycling rates for all of the rare earth elements are below 1%, according to the recent report by UNEP.c However, REEs are recycled from pre-consumer scrap, notably permanent magnet scrap. For example, in Japan approximately one third of the rare earths used to manufacture permanent magnets went into new scraps, i.e. post-industrial waste streams, which was then recycled.d A recent study on the feasibility of recovering the EU’s critical raw materials, including rare earths, identified the following opportunities as representing reasonable potential for recoverye: Permanent magnets: hard disk drives are a current opportunity, based on research published by the
University of Birmingham and pilot operations by Hitachi, with long term potential from wind turbines and hybrid/electric vehicles once they reach the end of their lifetime.
NiMH batteries: from both portable electronics and hybrid/electric vehicles if they can be collected and identified. Umicore and Rhodia have now announced a jointly-developed process to recover rare earth concentrate that can then be refined into rare earth materials.f
Phosphors: Rhodia has developed a new process for the recovery and separation of rare earths contained in used fluorescent powder in lighting applications.g As of early 2012 this is in commercial operation, and will reach full capacity of 1,000 tonnes per year of powder processing by 2013.
As for rare earth substitution, most applications have possible substitutes, although with significant loss of performance. Often the greatest substitutability potential is between the different individual rare
aThe Global Rare Earths Industry: A Delicate Balancing Act (2012), D. Kingsnorth presentation at Deutsche Rohstoffagentur,Berlin, April 2012.
bCritical materials strategy (2011). U.S. Department of Energy (Washington, DC, USA
cUNEP International Resource Panel (2011), Recycling Rates of Metals: A Status Report
d University of Tokyo Presentation (March 2012), 2nd Trilateral Workshop on Critical Materials
e European Pathway to Zero Waste (2011), Study into the feasibility of protecting and recovering critical raw materials; Oakdene Hollinsf Rhodia Press Release (June 2011), http://www.rhodia.com/en/news_center/news_releases/Umicore_rare_earth_160611.tcm [accessed January 2013]g
Rhodia Press release (January 2011), http://www.rhodia.com/en/news_center/news_releases/Rare_earths_130111.tcm [accessed January 2013]

1
earth elements rather than for rare earths as a group. The overall substitutability of REEs is summarised in Table 46 and is slightly lower than previouslya, due to the research advances made for certain uses.
Table 46: Substitutability of rare earth elements by application *Data from Table 45
The recent high and volatile prices have stimulated considerable research and innovation in this area. Major developments are noteworthy for magnets, batteries, phosphors, metallurgy and autocatalysts:bc
Magnets: approaches include reduction of dysprosium content, new or alternative magnetic materials, technology choices such as induction motors or geared systems. However, rare earth magnets are often still preferred due to the high performance offered.
Batteries: replacement of NiMH batteries with Li-ion batteries is developing for many applications. This has occurred already in number of applications, including within some hybrid vehicles.
Phosphors: reduction in terbium and europium content within phosphor powders, and alternative technologies such as LEDs, OLEDs and quantum dots. LED lighting in particular is expected to rapidly gain market penetration over the coming decade, and has much lower rare earth content.
Metallurgy: rare earths are used in small quantities for the production of iron, steel and aluminium alloys; although their use is considered to be not essential.
Autocatalysts: the use of cerium is not considered to be completely substitutable; however, some reduction in materials use (dematerialisation) is possible.
For the other applications of rare earth elements – such as fluid cracking catalysts (FCCs), polishing, glass and ceramics – the substitutability score remains unchanged from the previous study.d However, distinctions will be made between individual REEs in the separate profiles.
1.17.5 Specific issues
REE have attracted considerable recent attention particularly with regard to China’s interventions as the dominant market player. As for the history of Chinese REE export quotas, this shows a steady decline between 2004 and 2009, before a sudden 40% drop in quotas allocated in 2010. Since 2011, REE export quotas have stabilised. However, in the last two years exports have been lower than the declared export
aEU (2010) Critical Raw Materials at EU Level
bEuropean Commission JRC (2013), Critical Metals in Low-Carbon Energy Technologies
cEuropean Pathway to Zero Waste (2011), Study into the feasibility of protecting and recovering critical raw materials; Oakdene Hollins
dEU (2010) Critical Raw Materials at EU Level
Use Substitutes Score
Magnets
Options exist to reduce or replace the rare earth content of magnets, including alternative magnetic materials and alternative motor technologies (induction, switched reluctance)
0.7
BatteriesThere is a growing shift to Li-ion batteries in the major markets for NiMH batteries, including for e-mobility 0.3
Other metallurgy The use of REE in other metallurgy is not essential 0.3Fluid cracking catalysts Not easily substitutable 1.0Autocatalysts Some dematerialisation is possible 0.7Other catalysts Not easily substitutable 1.0Polishing Some dematerialisation is possible 0.7Glass Not easily substitutable 1.0Phosphors (lighting and displays)
The falling cost of LEDs means that there is now a viable competitor for fluorescent lamps for low-energy lighting 0.7
Ceramics Not easily substitutable in either construction or electronics 1.0Chemicals (other) Not easily substitutable 1.0Other Some of the minor markets have substitutes 0.5

1
quotas. China is also in the process of building a stockpile of these metals. A trade-dispute is currently underway at the World Trade Organisation on the legality of China’s export quota system.
In addition to export quotas, China also highly regulates the REE market by imposing measures that may act as restraints on exports, including taxes and export licensing. The current rates of tax levied on Chinese exports of rare earth products are:a
ferro / rare earth alloys at a rate of 20% Eu, Tb, Dy, Y oxides, carbonates or chlorides, rare earth metals (except neodymium) at a rate of 25% all other rare earth oxides, carbonates and chlorides and neodymium metal at a rate of 15%.
Industry consolidation in China has accelerated in recent years resulting in the closure of hundreds of mines and the acquisition of many smaller producers by the country’s major mining companies.
In terms of government stockpiles, South Korea designated rare earths as “strategic critical elements” and is building up a stockpile equivalent to 60 days of domestic consumption.b Japan considers REEs as “metals to be watched with care”, and stockpiling may be considered.c Numerous other studies have highlighted the REEs as among the metals with the highest possible supply risks with particular reference to their use in emerging energy technologies such as lighting applications, hybrid/electric vehicles, and wind turbines.d As for environmental impacts, REE mining and processing is widely quoted as causing significant environmental degradation if not properly regulated. This includes in particular the leaching of heavy metals and radioactive tailings into groundwater and agricultural land.e In addition the processing and separation of REE is known to be water intensive and potentially polluting.
Many REE deposits have variable quantities of uranium and thorium as by-products. The absence of a market for thorium requires that thorium, or thorium bearing waste be stored with particular precautions, following the guidance of the International Atomic Energy Agency.
aOECD (2009), Export restrictions on strategic raw materials and their impact on trade and global supply
bSouth Korean Ministry of Knowledge Economy in APS, MRS & MITEI (2010), Critical elements for new energy technologies
cJOGMEC (2010), The Mineral Resources Policy of Japan Presentation
dUS Department of Energy (2011), Critical Materials Strategy Update 2011 & EC JRC (2013), Critical Metals in Low-Carbon Energy Technologies
e

1
European Parliament Green and EFA Group (2011), Study on Rare Earths and Their Recycling; Ӧko Institut

1
LaIndiaRussia0,5%2,1%Australia 3,1%United States 7,9%
China 86,5%
Figure 159: Lanthanum supply by country, 2012
CeramicsPhosphors 1%2%
LaOther
9%Glass5%
Polishing 2%
Batteries26%
Autocatalysts1% Other
metallurgy 10%
FCCs44%
Figure 160: Lanthanum end-use, 2012
1.17.6 Lanthanum
IntroductionLanthanum (La, atomic number 57) is a light rare earth element, is the second most abundant REE after Cerium (Table 42).
Supply and demand statisticsSupply of lanthanum is estimated at approximately 34,000 tonnes per year, 86.5% of which originates in China. Supply from the USA accounts for 8% of world supply, with some additional supply from Australia and Russia.
Source: Roskill Information Services / Dudley Kingsnorth, IMCOA (March 2013) & USGS Data for Australia
Economic importanceLanthanum is used for a variety of applications (Figure 160); its three main uses are in FCCs (44%), nickel- metal hydride batteries (26%) and metallurgical uses other than batteries (10%). Other uses for lanthanum include autocatalysts, polishing, glass, phosphors, ceramics, fertiliser, algal control and cement. Total world consumption for lanthanum is estimated at 31,500 tonnes, indicating a small surplus. Information about the breakdown of the European market by application was not available at the time of writing.
Source: Roskill Information Services / Dudley Kingsnorth, IMCOA (March 2013)

1
70 000
La60 000
50 000
40 000
30 000
20 000
OtherCatalysts Metallurgy Supply
10 000
02012 2014 2017 2020
Figure 161: World lanthanum supply and demand forecasts to 2020 (tonnes)
OutlookThe world outlook for lanthanum supply and demand is shown in Figure 161. The overall demand for lanthanum is expected to increase by around 5.5% per year. However, supply is expected to more than keep up, moving the market into an increasing surplus as new deposits will have to be mined to satisfy the need for much rarer heavy REE.
Sources: Roskill, IMCOA and Technology Metal Research Reports and Presentations (2012-2013)
Resource efficiency and recyclingEnd-of-life recycling rates for lanthanum are below 1%, according to the recent report by UNEP.a
However, this is likely to improve as Rhodia and Umicore have announced a process for industrial-scale recycling of lanthanum from nickel - metal hydride batteries, such as the large ones used in hybrid electric vehicles.b As for substitution, several applications have possible substitutes, although with significant loss of performance or a greater cost. However, nickel-metal hydride batteries are being superseded by Li-ion batteries in many applications due to better performance. In some of its minor uses, lanthanum is thought to be relatively readily substitutable.
Specific issuesLanthanum is subject to export quotas and taxes from China, the main producing country. South Korea and Japan are both thought to have stockpiles.
aUNEP International Resource Panel (2011), Recycling Rates of Metals: A Status Report
bRhodia (2011), Umicore and Rhodia develop unique rare earth recycling process for rechargeable batteries.
http://www.rhodia.com/en/news_center/news_releases/Umicore_rare_earth_160611.tcm [Accessed November 2013]

RussiaCeIndia2,9%
0,7%Australia 4,1%United States 7,9%
China 84,3%
Figure 162: Cerium supply by country, 2012
CeCeramics
1%Phosphors 4%
Glass 12%
Other8%
Batteries3%
Other metallurgy 19%FCCs 2%
Autocatalysts 13%
Polishing36%
Other Catalysts3%
Figure 163: Cerium end-use, 2012
1
1.17.7 Cerium
IntroductionCerium (Ce, atomic number 58) is a light rare earth element. It is, by far, the most abundant REE, with an average proportion of 43.2% by weight of REE (Table 42).
Supply and demand statisticsSupply of cerium is estimated at approximately 49,000 tonnes per year, 84% of which originates in China (Figure 162). Supply from the USA accounts for 8% of world supply, with some additional supply from Australia and Russia.
Source: Roskill Information Services / Dudley Kingsnorth, IMCOA (March 2013) & USGS Data for Australia
Economic importanceCerium is used for a variety of applications (Figure 163), but the four main uses are polishing (36%), metallurgy other than batteries (19%), autocatalystsa (13%) and glass (12%). Other uses for cerium include batteries, fluid cracking catalysts, other catalysts, phosphors, ceramics, fertiliser, water treatment, paints and coatings. Total world consumption for cerium is estimated at 45,500 tonnes, indicating a small surplus. Information about the breakdown of the European market by application was not available at the time of writing.
Source: Roskill Information Services / Dudley Kingsnorth, IMCOA (March 2013)
ai.e. catalysts for the treatment of automotive exhaust gas

1
120 000
Ce100 000
80 000
60 000
40 000
OtherGlass/Polishing Catalysts Metallurgy Supply
20 000
02012 2014 2017 2020
Figure 164: World cerium supply and demand forecasts to 2020 (tonnes)
Resource efficiency and recyclingEnd-of-life recycling rates for cerium are below 1%, according to the recent report by UNEP.a As for substitution, most applications have possible substitutes, although with significant loss of performance. In some of its minor uses, cerium is thought to be relatively readily substitutable.
OutlookThe world outlook for cerium supply and demand is shown in Figure 164. The overall demand for cerium is expected to increase by around 6% per year. However, as for lanthanum, supply is expected to more than keep up, moving the market into an increasing surplus.
Sources: Roskill, IMCOA and Technology Metal Research Reports and Presentations (2012-2013)
Specific issuesCerium is subject to export quotas and taxes from China, the main producing country. South Korea and Japan are both thought to have stockpiles.
aUNEP International Resource Panel (2011), Recycling Rates of Metals: A Status Report

India0,7%
Australia 2,5%United States
5,5%
PrRussia 1,5%
China89,8%
Figure 165: Praseodymium supply by country, 2012
Ceramics7%
PrOther 2%
Phosphors12%
Polishing 2%
Other metallurgy 4%
Magnets73%
Figure 166: Praseodymium end-use, 2012
1
1.17.8 Praseodymium
IntroductionPraseodymium (Pr, atomic number 59) is a light rare earth element. It is a less common REE than cerium and lanthanum, with only 4.6% available on average (Table 42). However it is still amongst the most common REE.
Supply and demand statisticsSupply of praseodymium is estimated at approximately 6,300 tonnes per year, 90% of which originates in China (Figure 165). Supply from the USA accounts for 5.5% of world supply, with some additional supply from Australia and Russia.
Source: Roskill Information Services / Dudley Kingsnorth, IMCOA (March 2013) & USGS Data for Australia
Economic importanceMost praseodymium is used in magnet applications in NdFeB magnets (73%), although phosphors, ceramics and metallurgical uses other than batteries are also important applications (Figure 166). Other uses for praseodymium include polishing and fibre amplifiers. Total world consumption for praseodymium is estimated at 5,000 tonnes, indicating a significant surplus. Information about the breakdown of the European market by application was not available at the time of writing.
Source: Roskill Information Services / Dudley Kingsnorth, IMCOA (March 2013)

14 000
12 000 Pr
10 000
8 000
6 000
OtherMagnets Supply
4 000
2 000
02012 2014 2017 2020
Figure 167: World praseodymium supply and demand forecasts to 2020 (tonnes)
1
Resource efficiency and recyclingEnd-of-life recycling rates for praseodymium are below 1%, according to the recent report by UNEP.a
Most applications have possible substitutes, although with significant loss of performance. However, for magnets, praseodymium is already used as an inferior substitute for neodymium; however this application has, by far, not the same economic importance than NdFeB magnets.
OutlookThe world outlook for praseodymium supply and demand is shown in Figure 167. The overall demand for praseodymium is expected to increase by around 6% per year, providing a number of deposits now under investigation outside of China come into production in the coming years. However, supply is expected to more than keep up, keeping the market in significant surplus.
Sources: Roskill, IMCOA and Technology Metal Research Reports and Presentations (2012-2013)
Specific issuesPraseodymium is subject to export quotas and taxes from China, the main producing country. South Korea and Japan are both thought to have stockpiles.
aUNEP International Resource Panel (2011), Recycling Rates of Metals: A Status Report

NdRussia
India1,0%0,6%
Australia 2,8%United States
4,4%
China 91,1%
Figure 168: Neodymium supply by country, 2012 (21,000 tonnes)
Phosphors1%
Glass 1%
Ceramics5%
NdOther<1%
Autocatalysts2%
Other metallurgy 2%
Magnets89%
Figure 169: Neodymium end-use, 2012 (19,900 tonnes)
1
1.17.9 Neodymium
IntroductionNeodymium (Nd, atomic number 60) is a light rare earth element. It is quite abundant, ranking third amongst the REE, with an average of 16.2% by weight in deposits (Table 42)
Supply and demand statisticsSupply of neodymium is estimated at approximately 21,000 tonnes per year, 91% of which originates in China (Figure 168). Supply from the USA accounts for 4.4% of world supply, with some additional supply from Australia and Russia.
Source: Roskill Information Services / Dudley Kingsnorth, IMCOA (March 2013) & USGS Data for Australia
Economic importanceMost neodymium is used in magnet applications in NdFeB magnets(89%), (Figure 169). Other uses for neodymium include metallurgical uses other than batteries, autocatalysts, polishing, glass, phosphors, lasers and ceramics. Total world consumption for neodymium is estimated at 19,900 tonnes, indicating a small surplus. Information about the breakdown of the European market by application was not available at the time of writing.
Source: Roskill Information Services / Dudley Kingsnorth, IMCOA (March 2013)

45 00040 000
Nd35 00030 00025 00020 00015 000
OtherMagnets Supply
10 0005 000
0
2012 2014 2017 2020
Figure 170: World neodymium supply and demand forecasts to 2020 (tonnes)
1
Resource efficiency and recyclingEnd-of-life recycling rates for neodymium are below 1%, according to the recent report by UNEP.a Most applications have possible substitutes, although with significant loss of performance. In some of its low value uses, where neodymium is included within mischmetal, neodymium is considered to be relatively readily substitutable. However this application has much lower importance than in magnets.
OutlookThe world outlook for neodymium supply and demand is shown in Figure 170. The overall demand for neodymium is expected to increase by around 7% per year, providing a number of deposits now under investigation outside of China come into production in the coming years. Supply is expected to keep up with demand, although the market balance will remain reasonably tight.
Sources: Roskill, IMCOA and Technology Metal Research Reports and Presentations (2012-2013)
Specific issuesNeodymium is subject to export quotas and taxes from China, the main producing country. South Korea and Japan are both thought to have stockpiles.
aUNEP International Resource Panel (2011), Recycling Rates of Metals: A Status Report
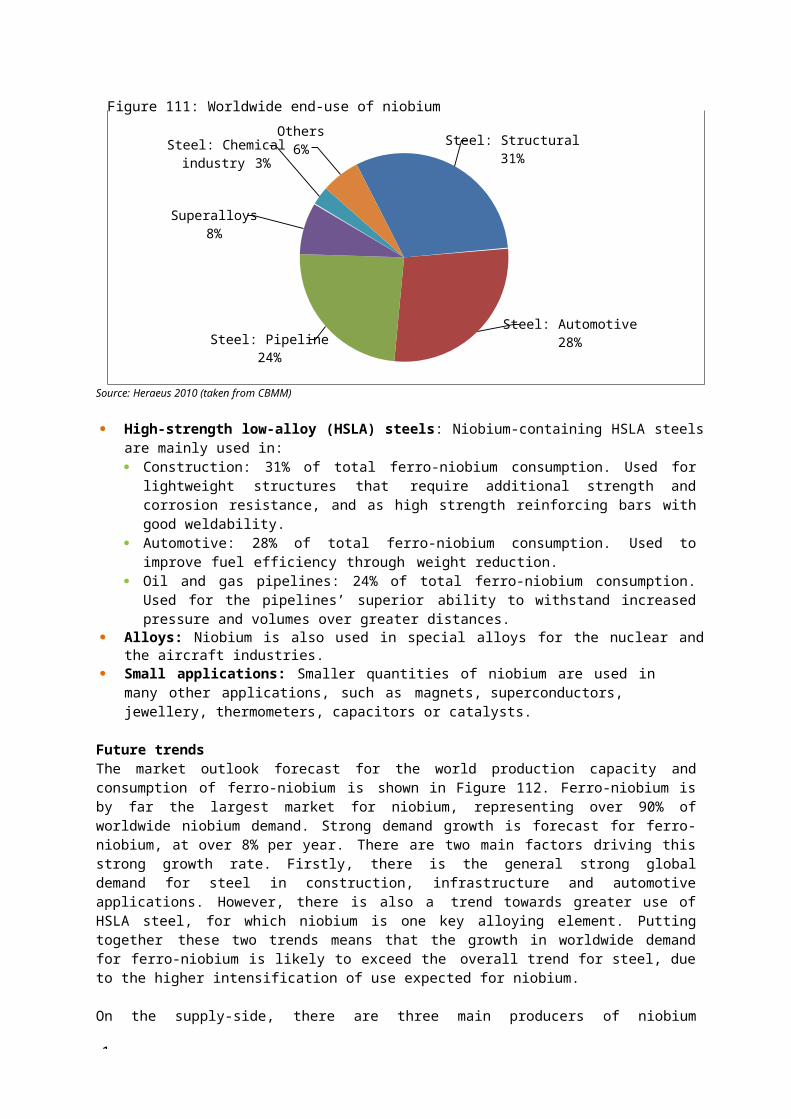
Sm
Russia India 0,9%0,8%
Australia2,7%
United States 2,4%
China 93,2%
Figure 171: Samarium supply by country, 2012
SmOther 3%
Other metallurgy 10%
Magnets 97%
Figure 172: Samarium end-uses, 2012
1
1.17.10 Samarium
IntroductionSamarium (Sm, atomic number 62) is a light rare earth element. It is relatively rare, forming only, in average, 2.2% of the REE elements known (Table 42).
Supply and demand statisticsSupply of samarium is estimated at 2,600 tonnes per year, 93% of which originates in China (Figure 171). Supply from the USA and Australia accounts for around 5% of world supply.
Source: Roskill Information Services / Dudley Kingsnorth, IMCOA (March 2013) & USGS Data for Australia
Economic importanceMost samarium is used in Sm-Co magnet applications (97%) as shown in Figure 172. These magnets, although having lesser magnetic performances than Nd-Fe-B magnets, are suited for operations in warm environments such as the motors of some high-speed trains. Other uses for samarium include the nuclear industry. Total world consumption for samarium is estimated at 500 tonnes, indicating a large surplus. Information about the breakdown of the European market by application was not available at the time of writing.
Source: Roskill Information Services / Dudley Kingsnorth, IMCOA (March 2013)

5 0004 5004 0003 500
Sm
3 0002 5002 0001 5001 000500
0
OtherMagnets Supply
2012201420172020
Figure 173: World samarium supply and demand forecasts to 2020 (tonnes)
1
Resource efficiency and recyclingEnd-of-life recycling rates for samarium are below 1%, according to the recent report by UNEP.a Most applications have possible substitutes, although with significant loss of performance. In its main use (for magnets), samarium is considered to have already been widely substituted by NdFeB magnets.
OutlookThe world outlook for samarium supply and demand is shown in Figure 173. The overall demand for samarium is expected to increase by around 10% per year. However, given that there is already a very large surplus for samarium, few concerns should be expressed over this strong growth in demand.
Sources: Roskill, IMCOA and Technology Metal Research Reports and Presentations (2012-2013)
Specific issuesSamarium is subject to export quotas and taxes from China, the main producing country. South Korea and Japan are both thought to have stockpiles.
aUNEP International Resource Panel (2011), Recycling Rates of Metals: A Status Report

1
Russia0,9%
Eu
Australia4,3%
United States 2,2%
China92,6%
Figure 174: Europium supply by country, 2012
Eu
Other 4%
Phosphors 96%
Figure 175: Europium end-use, 2012
1.17.11 Europium
IntroductionEuropium (Eu, atomic number 63) is a heavy rare earth element. It is one of the very rare REE elements, representing only, in average, 0.3% of the REE deposits for which reserves and resources calculations were available to compute (Table 42).
Supply and demand statisticsSupply of europium is estimated at 350 tonnes per year, 93% of which originates in China (Figure 174). Supply from Australia accounts for 4.3% of world supply, with additional supply from the USA and Russia.
Source: Roskill Information Services / Dudley Kingsnorth, IMCOA (March 2013) & USGS Data for Australia
Economic importanceThe majority of europium is used within phosphors (96%) as shown in Figure 175. These phosphors are essential inputs for the production of compact fluorescent lamps (CFLs), LEDs and of videoscreens, making europium a very strategic resource. Other uses for europium include the nuclear industry, and in fluorescent dyes used to prevent counterfeiting of Euro banknotes. Total world consumption for europium is estimated at 425 tonnes, indicating a significant deficit. Information about the breakdown of the European market by application was not available at the time of writing.
Source: Roskill Information Services / Dudley Kingsnorth, IMCOA (March 2013)

1
900800
Eu700600500400300200
OtherPhosphors Supply
1000
2012 2014 2017 2020
Figure 176: World europium supply and demand forecasts to 2020 (tonnes)
Resource efficiency and recyclingEnd-of-life recycling rates for europium are below 1%, according to the recent report by UNEP.a At present, competing LED lighting can, to a certain extent, substitute phosphor based light sources, though LEDs are typically more costly.
OutlookThe world outlook for europium supply and demand is shown in Figure 176. The overall demand for europium is expected to increase by around 8% per year. Supply is also expected to increase at a similar rate. However, there is currently a significant deficit for europium and this is expected to persist.
Sources: Roskill, IMCOA and Technology Metal Research Reports and Presentations (2012-2013)
Specific issuesEuropium is subject to export quotas and taxes from China, the main producing country. South Korea and Japan are both thought to have stockpiles.
aUNEP International Resource Panel (2011), Recycling Rates of Metals: A Status Report

GdRussia
India0,2%Australia 0,4%1,8%
United States0,6%
China 97,0%
Gd
Other14%
Magnets35%
Phosphors23%
Other metallurgy28%
Figure 178: Gadolinium end-use, 2012
1
1.17.12 Gadolinium
IntroductionGadolinium (Gd, atomic number 64) is a heavy rare earth element. It is quite rare, forming 1.4% on average of REE deposits surveyed in Table 42.
Supply and demand statisticsSupply of gadolinium is estimated at 2,250 tonnes per year, 97% of which originates in China (Figure 177).
Figure 177: Gadolinium supply by country, 2012
Source: Roskill Information Services / Dudley Kingsnorth, IMCOA (March 2013) & USGS Data for Australia
Economic importanceGadolinium has three major applications (Figure 178): magnets – in China only – (35%), metallurgical uses other than batteries (28%) and phosphors (23%). Other uses for gadolinium include the nuclear industry and as a medical contrast agent. Total world consumption for gadolinium is estimated at 1,000 tonnes, indicating a large surplus. Information about the breakdown of the European market by application was not available at the time of writing.
Source: Roskill Information Services / Dudley Kingsnorth, IMCOA (March 2013)

3 000
Gd2 500
2 000
1 500
1 000
OtherPhosphorsOther metallurgy MagnetsSupply
500
02012 2014 2017 2020
Figure 179: World gadolinium supply and demand forecasts to 2020 (tonnes)
1
Resource efficiency and recyclingEnd-of-life recycling rates for gadolinium are below 1%, according to the recent report by UNEP.a
Gadolinium’s use in magnets is considered to be relatively readily substitutable, however it is currently irreplaceable in medical imagery uses.
OutlookThe world outlook for gadolinium supply and demand is shown in Figure 179. The overall demand for gadolinium is expected to increase by around 9% per year relating to uses in magnets (linked to a possible growth in magnetic refrigeration) and in medical imagery. However, the market is currently in significant surplus, meaning that supply is expected to more than keep up.
Sources: Roskill, IMCOA and Technology Metal Research Reports and Presentations (2012-2013)
Specific issuesGadolinium is subject to export quotas and taxes from China, the main producing country. South Korea and Japan are both thought to have stockpiles.
aUNEP International Resource Panel (2011), Recycling Rates of Metals: A Status Report

Tb
Australia1,2%
United States 0,5%
Russia0,5%
China97,9%
Figure 180: Terbium supply by country, 2012
TbOther 5%Magnets
24%
Phosphors 71%
1
1.17.13 Terbium
IntroductionTerbium (Tb, atomic number 65) is a heavy rare earth element and one of the rarest REEs (0.2% in Table 42)
Supply and demand statisticsSupply of terbium is estimated at 340 tonnes per year, 98% of which originates in China (Figure 180).
Source: Roskill Information Services / Dudley Kingsnorth, IMCOA (March 2013) & USGS Data for Australia
Economic importanceThe majority of terbium is used within phosphors (71%), although magnets are also an important application (24%). Other uses for terbium include speciality alloys. Total world consumption for terbium is estimated at 290 tonnes, indicating a significant surplus. Information about the breakdown of the European market by application was not available at the time of writing.
Figure 181: Terbium end-uses, 2012
Source: Roskill Information Services / Dudley Kingsnorth, IMCOA (March 2013)

600
Tb500
400
300
200
OtherPhosphors Magnets Supply
100
02012 2014 2017 2020
Figure 182: World terbium supply and demand forecasts to 2020 (tonnes)
1
Resource efficiency and recyclingEnd-of-life recycling rates for terbium are below 1%, according to the recent report by UNEP.a At present, competing LED lighting can, to a certain extent, substitute phosphor based light sources, though LEDs are typically more costly.
OutlookThe world outlook for terbium supply and demand is shown in Figure 182. The overall demand for terbium is expected to increase by around 8% per year. Supply is also expected to increase at a similar rate. However, there is currently a significant deficit for terbium, which is expected to persist due to differences between demand for REE and their natural abundance.
Sources: Roskill, IMCOA and Technology Metal Research Reports and Presentations (2012-2013)
Specific issuesTerbium is subject to export quotas and taxes from China, the main producing country. South Korea and Japan are both thought to have stockpiles.
aUNEP International Resource Panel (2011), Recycling Rates of Metals: A Status Report

Australia0,6%
United States 0,2%
Russia0,2%
Dy
China99,1%
Figure 183: Dysprosium supply by country, 2012
DyOther 2%
Magnets 98%
Figure 184: Dysprosium end-use, 2012
1
1.17.14 Dysprosium
Introduction
Dysprosium (Dy, atomic number 66) is a heavy rare earth element. It makes up 0.9% of the REE resources and reserves compiled in Table 42.
Supply and demand statisticsSupply of dysprosium is estimated at 1,350 tonnes per year, 99% of which originates in China (Figure 183).
Source: Roskill Information Services / Dudley Kingsnorth, IMCOA (March 2013) & USGS Data for Australia
Economic importanceMost dysprosium is used in magnets (98%) as shown in Figure 184, where it essential to enable the use of NdFeB magnets at elevated temperatures. Other uses for dysprosium include lasers and the nuclear industry. Total world consumption for dysprosium is estimated at 850 tonnes, indicating a significant surplus. Dysprosium is perceived as one of the most significant raw materials in criticality studies (particularly those related to energy technologiesa) due to growing demand for permanent magnets for applications such as direct-drive wind turbines, combined with restricted supply. Information about the breakdown of the European market by application was not available at the time of writing.
Source: Roskill Information Services / Dudley Kingsnorth, IMCOA (March 2013)
aSee for instance EC JRC (2010 & 2013) Assessing metals as Supply Chain Bottlenecks in Priority Energy Technologies & Critical Metals in Low-Carbon Energy
Technologies, and US Department of Energy (2011), Critical Materials Strategy.

2 0001 8001 6001 4001 2001 000800600400200
0
Dy
OtherMagnets Supply
2012201420172020
Figure 185: World dysprosium supply and demand forecasts to 2020 (tonnes)
1
Resource efficiency and recyclingEnd-of-life recycling rates for dysprosium are below 1%, according to the recent report by UNEP.a
Substitution of magnets is not possible for many applications at present, however this is a large area for research. Specific concerns over dysprosium have led to a large amount of research aimed at eliminating or reducing its use from NdFeB magnets. This has led to a reduction in the amount of dysprosium required to achieve the same magnetic performance, however complete a substitute has not been found.
OutlookThe world outlook for dysprosium supply and demand is shown in Figure 185. The overall demand for dysprosium is expected to increase by around 9% per year. Supply is expected to just about keep up with demand, although the market balance will remain increasing tight as the decade progresses.
Sources: Roskill, IMCOA and Technology Metal Research Reports and Presentations (2012-2013)
Specific issuesDysprosium is subject to export quotas and taxes from China, the main producing country. South Korea and Japan are both thought to have stockpiles.
aUNEP International Resource Panel (2011), Recycling Rates of Metals: A Status Report

ErRussia 0,2%
Australia 0,9%
China 98,9%
ErOther 3%
Phosphors 25%
Glass 72%
1
1.17.15 Erbium
IntroductionErbium (Er, atomic number 68) is a heavy rare earth element. a rare element, making only 0.5% of the resources and reserves compiled in Table 42.
Supply and Demand StatisticsSupply of erbium is estimated at 860 tonnes per year, 99% of which originates in China (Figure 186).
Figure 186: Erbium supply by country, 2012
Source: Roskill Information Services / Dudley Kingsnorth, IMCOA (March 2013) & USGS Data for Australia
Economic importanceThe majority of erbium is used in glass (72%), although phosphors are also an important application (Figure 187). Other uses for erbium include lasers and the nuclear industry. Total world consumption for erbium is estimated at 540 tonnes, indicating a significant surplus. Information about the breakdown of the European market by application was not available at the time of writing.
Figure 187: Erbium end-use, 2012
Source: Roskill Information Services / Dudley Kingsnorth, IMCOA (March 2013)

1 200
1 000 Er
800
600
400
OtherPhosphors GlassSupply
200
02012 2014 2017 2020
Figure 188: World erbium supply and demand forecasts to 2020 (tonnes)
1
Resource efficiency and recyclingEnd-of-life recycling rates for erbium are below 1%, according to the recent report by UNEP.a Most applications have possible substitutes, although with significant loss of performance.
OutlookThe world outlook for erbium supply and demand is shown in Figure 188. The overall demand for erbium is expected to increase by around 6% per year. Supply growth is expected to exceed this rate of increase, gradually moving the market from a current deficit to a small surplus by 2020.
Sources: Roskill, IMCOA and Technology Metal Research Reports and Presentations (2012-2013)
Specific issuesErbium is subject to export quotas and taxes from China, the main producing country. South Korea and Japan are both thought to have stockpiles.
aUNEP International Resource Panel (2011), Recycling Rates of Metals: A Status Report

1
YUnited States 0,1%
China 99,9%
Figure 190: Yttrium end-use, 2012
YCeramics
21%
Other<1%
Phosphors79%
1.17.16 Yttrium
IntroductionYttrium (Y, atomic number 39) is a heavy rare earth element and relatively abundant, making up 4.9% of the resources and reserves compiled in Table 42.
Supply and demand statisticsSupply of yttrium is estimated at 9,925 tonnes per year, 99.9% of which originates in China (Figure 189).
Figure 189: Yttrium supply by country, 2012
Source: Roskill Information Services / Dudley Kingsnorth, IMCOA (March 2013) & USGS Data for Australia
Economic importanceThe two main uses of yttrium are phosphors (79%) and ceramics (21%), as shown in Figure 190. The majority of phosphors are used in lighting (70%) and displays (22%), and ceramics in electronics. Other uses for yttrium include speciality alloys and lasers. Total world consumption for yttrium is estimated at 7,650 tonnes, indicating a significant surplus. Information about the breakdown of the European market by application was not available at the time of writing.
Source: Roskill Information Services / Dudley Kingsnorth, IMCOA (March 2013)

1
16 000
14 000 Y
12 000
10 000
8 000
6 000
OtherCeramics Polishing Supply
4 000
2 000
02012 2014 2017 2020
Figure 191: World yttrium supply and demand forecasts to 2020 (tonnes)
Resource efficiency and recyclingEnd-of-life recycling rates for yttrium are below 1%, according to the recent report by UNEP.a At present, competing LED lighting can, to a certain extent, substitute phosphor based light sources, though LEDs are typically more costly.
OutlookThe world outlook for yttrium supply and demand is shown in Figure 191. The overall demand for yttrium is expected to increase by around 8% per year. Supply is also expected to increase at a similar rate. However, there is currently a significant deficit for yttrium which is expected to persist.
Sources: Roskill, IMCOA and Technology Metal Research Reports and Presentations (2012-2013)
Specific issuesYttrium is subject to export quotas and taxes from China, the main producing country. South Korea and Japan are both thought to have stockpiles.
aUNEP International Resource Panel (2011), Recycling Rates of Metals: A Status Report
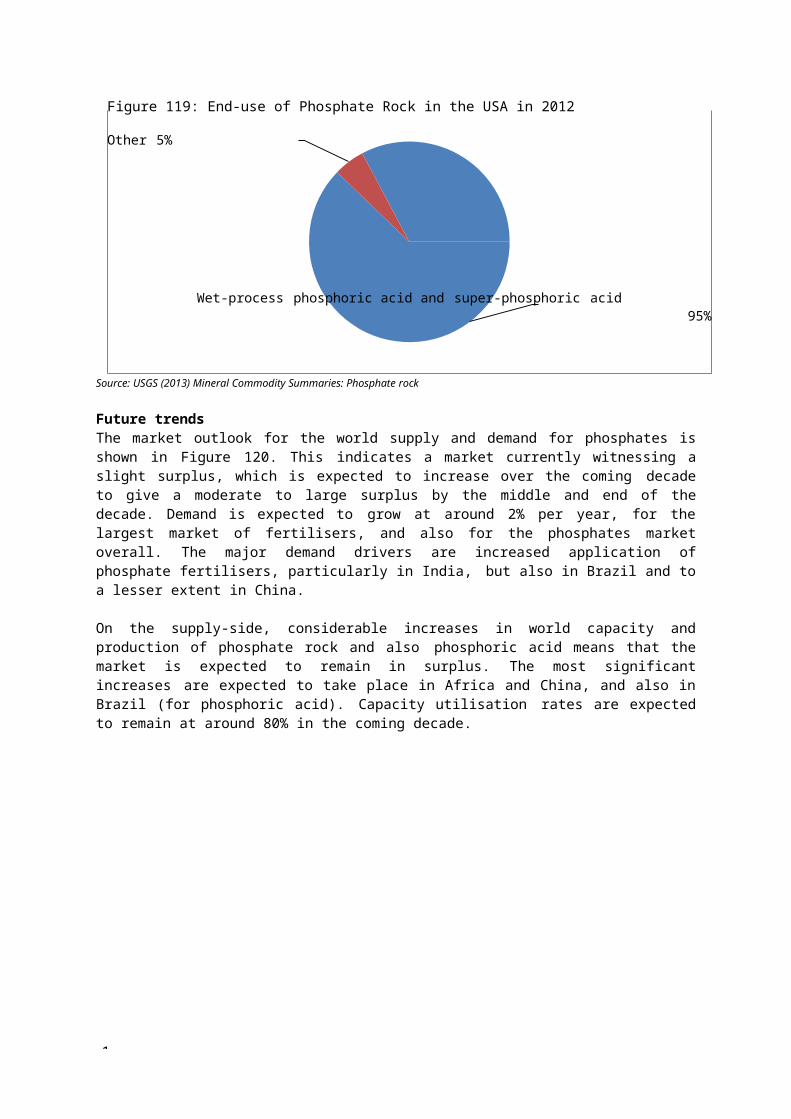
Ho,Tm,Yb,Lu
India Russia 0,4% 0,6%Australia 0,6%
China 98,4%
Figure 192: Holmium, Thulium, Ytterbium and Lutetium supply by country, 2012
Ho,Tm,Yb,Lu
Other 100%
1
1.17.17 Holmium, Thulium, Ytterbium, Lutetium
IntroductionHolmium (Ho, atomic number 67), thulium (Tm, atomic number 68), ytterbium (Yb, atomic number 70) and lutetium (Lu, atomic number 71) are all heavy rare earth elements. All these are very rare, the most abundant element, ytterbium, making up only 0.4% of the known resources and reserves (Table 42).
Supply and demand statisticsSupply of holmium, thulium, ytterbium and lutetium collectively is estimated at 1,740 tonnes per year, 98% of which originates in China, Figure 192.
Source: Roskill Information Services / Dudley Kingsnorth, IMCOA (March 2013) & USGS Data for Australia
Economic importanceThe use of holmium, thulium, ytterbium and lutetium in individual applications is too small to be estimated with accuracy, hence its inclusion with ‘other’ (Figure 193). Total use of holmium, thulium, ytterbium and lutetium is estimated at 75 tonnes, indicating a large surplus. Information about the breakdown of the European market by application was not available at the time of writing.
Figure 193: Holmium, thulium, ytterbium and lutetium end-use, 2012
Source: Roskill Information Services / Dudley Kingsnorth, IMCOA (March 2013)

1 400
1 200 Ho-Tm-Yb-Lu
1 000
800
600OtherSupply
400
200
02012 2014 2017 2020
Figure 194: World Ho-Tm-Yb-Lu supply and demand forecasts to 2020 (tonnes)
1
Their major uses are as follows: Holmium: pigments, magnets, lasers and nuclear. Thulium has no real commercial use; but glass, phosphors and fibre optics have potential. Ytterbium: fibre optics, lasers, photovoltaics, stress gauges. Lutetium: phosphors, PET detectors, glass.
Resource efficiency and recyclingEnd-of-life recycling rates for holmium, thulium, ytterbium and lutetium are all below 1%, according to the recent report by UNEP.a Most applications have possible substitutes, given the large market surplus and the relative lack of commercial applications for these metals.
OutlookThe world outlook for Ho-Tm-Yb-Lu supply and demand is shown in Figure 194. The overall market is expected to increase by around 8% per year. However, given that there is already a very large surplus, few concerns should be expressed over this strong demand growth.
Sources: Roskill, IMCOA and Technology Metal Research Reports and Presentations (2012-2013)
Specific issuesHolmium, thulium, ytterbium and lutetium are all subject to export quotas and taxes from China, the main producing country. South Korea and Japan are both thought to have stockpiles.
aUNEP International Resource Panel (2011), Recycling Rates of Metals: A Status Report
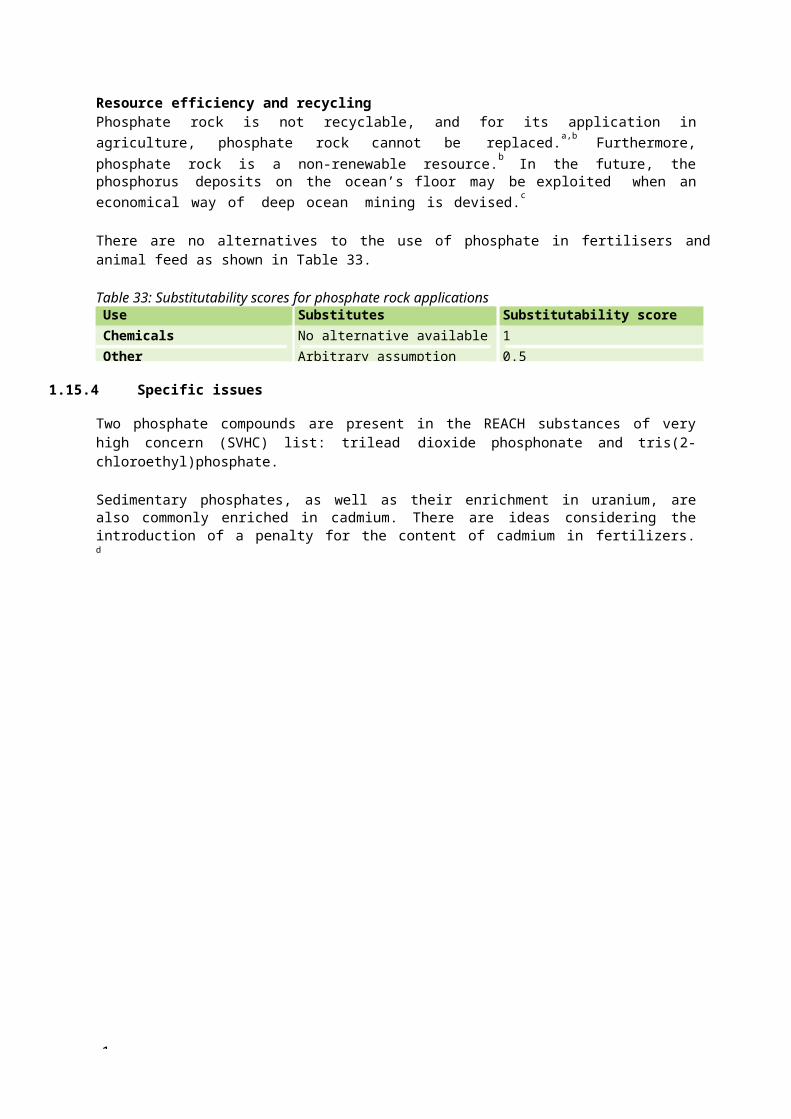
aRanjan et al. (2011), Silicon Solar Cell Production, Computers & Chemical Engineering, Volume 35, Issue
1
1.18 Silicon metal (Silicium)
1.18.1 Introduction
Silicon (Si, atomic number 14) is a group 14 non-metal, situated between carbon and germanium. Silicon, in its pure form, is a grey metallically lustrous solid. It is the second most abundant element in the crust (27.5%), after oxygen (50.5%). In nature, it is not found in its elemental form but occurs only in silicates and oxides (silica). Silicates account for approximately 75% of the Earth’s crust; quartz is the most abundant form of free silica. Extremely high purity quartz is required to produce silicon metal. Lower grade quartz is used for a variety of applications; these are described in the relevant section on silica sand. This section focuses on the production and uses of metallurgical grade silicon.
Metallurgical grade silicon (MG-Si) is also known as silicon metal in the industry, not because it has metallic properties but due to its lustrous appearance. MG-Si is used in aluminium and chemical applications; it is also a raw material for solar and electronic grade silicon but must be refined further to ultrahigh-purity grades.
Pure silicon is a semiconductor; its electrical resistivity decreases with increasing temperature and with increasing concentrations of elements such as boron, aluminium, gallium and phosphorous. Its conductivity can be carefully controlled through doping. For this reason, silicon is used extensively in electronic devices such as transistors, printed circuit boards, integrated circuits and solar panels. Although silicon plays an important role in electronics, the quantities required are relatively small due to the small dimensions of electronic devices. The major uses of silicon by quantity are in metallurgy, such as the production of aluminium, and in the chemical industry.
A supply chain map for silicon’s use in photovoltaics is shown in Figure 195. Quartz minerals are turned into MG-Si through carbothermic reduction; this is then purified into polysilicon of suitable purity for use in solar cells, generally via the siemens process. This is a very energy intensive process and therefore requires high cost of production. For this reason poly-crystalline producers are often located in areas with low energy cost.
Figure 195: Supply chain map for silicon metal in photovoltaic cells
Mine quartz mineral
Reduction to metallurgical grade silicon
Purify to polysilicon
Manufacture silicon wafers
Manufacture and use solar
cellsEnd of life
Note: Orange colour represents stages of the supply chain which take place in Europe
In the next step, thin silicon wafers are produced. High-purity silicon is melted into blocks which are then hardened. Square columns are made from the blocks and are then cut into silicon wafers. Thin wafers are advantageous as they require less material to be produced; however, these can be difficult to handle. Silicon wafers are treated to enhance their electrical and optical properties and are finally integrated into panels.a
As can be seen in Figure 195, silicon wafers and solar cells containing silicon are produced in Europe. Aluminium alloys and the chemical industries are the major uses of silicon in Europe (see section 0), and these too are produced in the EU.
1.18.2 Supply and demand statistics
Primary sources, production and refining

MMTA (n.d.), Silicon Market Overview, Roskill Information Services; Euroalliages (2013), email
1
Silica as high purity quartz or quartzite is used as the raw material for silicon metal production. Quartz is one of the main products of slowly cooled silica-rich magmas; quartzite is a metamorphic rock, which has suffered high temperatures and pressure, and in which quartz is a major component. No systematic data is available on high-purity quartz and quartzite mining and production. High purity quartz is currently mined from deposits in Spruce Pine, North Carolina, Norway and Russia.a
Quartz is reduced to silicon metal by carbothermic reduction. This takes place in a furnace containing quartz and carbon materials, such as coke and charcoal. Molten silicon metal is produced at the bottom of the furnace. The silicon produced has a purity if approximately 98.5%; the main impurities are iron, aluminium and calcium. Most silicon applications require further refining to reach 99.5% purity; this is done by treating the molten silica with oxidative gas and slag forming additives. Silicon of this purity is known as metallurgical grade silicon and is used in the aluminium and chemical industries. Semiconductor and solar grade silicon (polysilicon) must be of ultra-high purity (between 6N and 9N) toensure semiconducting properties; this is commonly done through the Siemens process. b
Supply detailsAccording to the British Geological Survey, 1.9 million tonnes of silicon metal were produced in 2011 (Table 47). Estimates for worldwide pure silicon production in 2010 vary between 1.76 million tonnes, as reported by Roskill, to around 2 million tonnes, as reported by CRU International; these are consistent with data shown in the table below and with data provided by Euroalliages, the European Association of ferro-alloys and silicon producers.c
Table 47: World production of silicon metal, 2010-2011, thousand tonnes
11
Source: BGS (2013), World Mineral Production 2007-2011.
China is by far the major producer of silicon metal; it accounts for 56% according to data shown above. The other major producers are Brazil, Norway, France and the US. Other producing EU countries are Germany and Spain.
Chinese production output has increased significantly over the last two decades, with an estimated increase in production from less than 300,000 tonnes in the 1990s to 820,000 tonnes in 2007, to over 1
a
CountryProductiontonnes)
%2010 2011
Australia 33 33 2Brazil 184 210 11Canada 30 30 2China 1,050 1,050 56France 112 112 6Germany 30 30 2Norway 150 150 8Russia 49 49 3SouthAfrica 46
483
Spain 33 33 2USA 143 143 8Total 1,860 1,888 -

MMTA (n.d.), Silicon Market Overview, Roskill Information Services; Euroalliages (2013), email
1
Norges Geologiske Undersøkelse (2008), High Purity Quartz. http://www.ngu.no [Accessed November 2013]b
Ranjan et al. (2011), Silicon Solar Cell Production, Computers & Chemical Engineering, Volume 35, Issue 8.c

Euroalliages (2013), email
1
million tonnes in 2010. Overall, silicon metal world production rose on average by 4.9% between 1999 and 2010. a A dip was experienced in 2009 during the financial crisis, but production recovered fully in 2010. Roskill reported that world production only accounts for 70% of overall capacity because of significant overcapacity in China.b It is thought that there are up to 200 operations in China with a total annual capacity as high as 1.5 million tonnes.c
EU trade flows and consumptionOverall, the EU is a net importer of silicon metal, importing around 342 thousand tonnes a year of silicon with low purity (Figure 196). This does not include products derived from or containing silicon.
Figure 196: Trends in extra-EU trade for silicon containing < 99.99% by weight of silicon (thousand tonnes)
Source: Eurostat-Comext Database, Code 28046900 [accessed July 2013]
The major exporter of silicon into the EU in 2012 was Norway (Figure 197), which exported 136,000 tonnes to the EU. Norway is closely followed by Brazil which is responsible for around 25% of all silicon imported into the EU. Values for export are insignificant compared to imports; the major destination for exported silicon is the US. However, it is worth noting that the EU exports some 30 000 tonnes of highly concentrated Silicon (CN 2804 61 00) mainly to China, Korea and Japan.
Significant intra-EU trade also takes place, with Germany, France and Spain being the major importers and Germany, France, the UK and Italy being the major exporters.
Europe’s consumption of silicon metal is estimated by Roskill to be approximately 540,000 tonnes for 2012. This equates to around a quarter of the world’s 2.2 million tonnes consumption. Euroalliages reported that European consumption in 2010 totalled around 566 thousand tonnes. d
Other key consumers of silicon metal include the world’s largest, China at 31%, the Americas (16%), Japan (10%), South Korea (5%) and other Asia at 8% (Figure 198).
aMMTA (n.d.), Silicon Market Overview, Roskill Information Services
bRoskill (2011), Silicon and ferrosilicon: global industry markets & outlook
500
400
30
-
20 20 20 20 20 EU Export
EU
Import
-200
-3

Euroalliages (2013), email
1
cMMTA (n.d.), Silicon Market Overview, Roskill Information Services
d

1
Figure 197: EU’s major trading partners for silicon, 2012EU Exports of Silicon Containing <99,99% by Weight of Silicon (6,517 t)
EU Imports of Silicon Containing <99,99% byWeight of Silicon (359,427 t)
OtherRussia10%2%Serbia
2%South Africa
UnitedStates 66% Laos
2%
Other2%
Norway38%
3% Norway3%
UnitedStates 2%
Australia 3%
Unites ArabEmirates 4%Switzerland 4%
India6%
Thailand4%
Bosnia andHerzegovin a
4%
Notspecified* 6% Russia
7%China8%
Brazil24%
Rest of WorldOther Asia
8%South Korea 5%
5% Europe25%
Japan10%
Americas16%
China31%
Figure 198: World Silicon Metal Consumption by Geographic Region, 2012 (%)
Source: Eurostat-Comext Database, Code 28046900 [accessed July 2013]* Countries not specified for commercial or military reasons
Source: Roskill Information Services for 2013 CRM study
OutlookNew silicon plants and plant expansions are scheduled over the next years outside of the EU in order to respond to growing demand. Several projects have been reported to be due to completion by 2015, including new or expanded capacity in China, Malaysia, Uzbekistan, Australia and Iceland.a Production capacity for polycrystalline silicon is expected to increase to about 491 thousand tonne per annum by 2015, with China as the leading producer followed by the Republic of Korea and the US.b
a USGS (2013), Minerals Yearbook 2011, Silicon
b USGS (2013), Minerals Yearbook 2011, Silicon

4500
4000
3500
3000
2500
2000
1500
1000
500
0200220032004200520062007200820092010201120122013
Figure 199: Silicon metal European price (US$/tonne).
1
1.18.3 Demand
Prices and marketsEuropean silicon metal prices are shown in Figure 199. Silicon metal prices increased slowly between 2002 and late 2007. A sharp increase in prices was experienced following this period, with peak price around spring 2008. The economic recession in 2008 and 2009 resulted in prices decreasing sharply back to 2007 levels. Another pike in silicon prices was experienced in 2011. Prices have decreased once again since 2011; however, prices have shown an increasing trend since 2012.
The figures shown below refer to metallurgical grade silicon and therefore do not cover high-purity silicon. Import data for the US in 2010 indicate that the price of ultra-pure silicon had an average price as much as 20 times the value of silicon used for metallurgical and chemical applications.a
Source: CRU (2013), Silicon Metal Market Outlook
Global demand for silicon in 2010 was estimated at 1.8 million tonnes. Demand for silicon grew on average by 8% annually between 2002 and 2012; a 20% reduction in the market was seen in 2009 but this was fully recovered in 2010. The main drive for this increment was demand from emerging countries and more recently from the expansion of the solar cell market; this moved from 3% of total silicon use in the mid-2000s up to 12% in 2010.b
The USGS reported that the worldwide production and consumption of ultrahigh-grade silicon for use in solar and semiconductor applications rose by 62% to 235 thousand tonnes in 2011 compared to 2010; 89% was used in the solar cell market and the remaining in semiconductors.c
ApplicationsThe major uses of silicon metal are shown in Figure 200 and Figure 201. Other applications of silicon are in explosives, refractories and ceramics.
a USGS (2012), Metal Prices in the United States
b Through 2010MMTA (n.d.), Silicon Market Overview, Roskill Information Services
cUSGS (2013), Minerals Yearbook 2011, Silicon

cSolar Grade Silicon Feedstock https://web.engr.oregonstate.edu/~yokochia/wiki/uploads/Documents/ch05%20silicon
1
Electronic andSolar 8%
Aluminium38%
Chemicals54%
Figure 201: European end uses for silicon metal, 2010.
Figure 200: Global uses of silicon metal, 2010.
Semiconductors Other
3% 5%
Solar photovoltaic 12%
Aluminium alloy 45%
Silicone and silane chemicals
35%
Roskill (2011), Silicon and ferrosilicon: global industry markets & outlook
Source: Euroalliages (2013), email communication.
The major uses of silicon are in the aluminium and chemical industries, electronic and solar uses are lower by tonnage but play an important role: Aluminium: Silicon is dissolved in molten aluminium to improve the viscosity of the liquid aluminium
and to improve the mechanical properties of aluminium alloys. There are two important groups of aluminium alloys which contain silicon as a main element: casting alloys and wrought alloys. In the former the silicon content is 7% to 12%; wrought alloys contain magnesium and silicon, where the silicon content is between 0.5% and 1%.a The primary use is in castings in the automotive industry due to improved casting characteristics described above and the reduced weight of the components.
Chemical industry: Silicon is used to produce silicones, synthetic silica and silanes. Silicone products are used as surfactants, lubricant, sealants and adhesives, and in insulating rubbers among other uses.b Synthetic silica is also known as fumed silica and is used fumed silica is as additives in silicone rubbers used to increase the mechanical strength and the elasticity of these elastomers. Silanes are used in the glass, ceramic, foundry and painting industries.c
Solar cells: Silicon solar cells are the most common cells used in commercially available solar panels. Crystalline silicon PV cells have laboratory energy conversion efficiencies as high as 25% for single- crystal cells and 20.4% for multicrystalline cells. However, industrially produced solar modules currently achieve efficiencies ranging from 18%–24%. Solar cell prices dropped significantly in 2011, partly due to polysilicon selling price decrease resulting from over production.
aSolar Grade Silicon Feedstock https://web.engr.oregonstate.edu/~yokochia/wiki/uploads/Documents/ch05%20silicon%20feedstock.pdf
bhttp://onlinelibrary.wiley.com/doi/10.1002/0471238961.1909120918090308.a01.pub2/full

Euroalliages (2013), email
1
3 000
2 500
2 000
1 500
1 000
OtherSemiconductors Chemicals Aluminium alloys Supply
500
-2012 2014 2017 2020
Figure 202: World silicon metal supply and end-use forecasts to 2020 (‘000s tonnes)
Electronics: Ultra-high purity grade silicon is used for the production of silicon semiconductors. Semiconductor-grade silicon metal used in making computer chips is crucial to modern technology.
1.18.4 Outlook
The outlook forecast for silicon metal according to Roskill Information Services is shown in Figure 202. This shows world demand increasing at 2.7% per year to 2020. This less optimistic than the forecast provided by Euroalliages, which expects the market to grow by 5.8% between 2013 and 2018.a The fastest growth in silicon metal demand is taking place in China, where the annual growth rate is approximately 5% per year. In terms of end-markets, the most significant growth is occurring in the semiconductors, including solar, and chemicals segments, which have growth rates of approximately 5% and 3% respectively. Steadier growth is expected for the largest end-market, aluminium alloys.
The CRU outlook for silicon metal forecasts faster growth for this material. The growth rate for demand in China is expected to grow by 9.5% per year between 2013 and 2018. Furthermore, growth rates for the solar and chemical markets are predicted to be 11.9% and 3.9% respectively over the same time period.
According to Roskill, the market for silicon metal is currently in a slight deficit of approximately 5%; however, increases in world production will narrow this deficit from 2014 onwards, returning the market back into balance. Euroalliages, the European Association of ferro-alloys and silicon producers does not agree there is a deficit and, in contrast, has stated that demand is currently lower than production, resulting in decreased silicon prices. This variance disparity, and differences in views over demand demonstrate that there are differing opinions over the future of the silicon metal market.
In terms, of the distribution of producing countries, this is expected to remain fairly stable to 2020, with China retaining around 55% share of the world production and Europe its 15% share. However, the evolution of the European market share will depend on a series of European policies currently being drafted and on the issue regarding anti-dumping case against Chinese silicon producers (see specific issues section below).
Source: Roskill Information Services for 2013 CRM study1.18.5 Resource efficiency and recycling

Euroalliages (2013), email
1
a

1
Silicon recycling is in the form of aluminium scrap and through the recycling of WEEE. Recycling of pure silicon does not happen; the components are recycled as metal alloys to be used again as alloys. According to Euroalliages, aluminium scrap contains 4% silicon; additional silicon has to be added to reach the average content of 7% to 12%.a
End-of-life recycling of silicon in the polysilicon market is difficult to concretise due to the fact that the polymarket is a relatively “new” market and the major part of the polysilicon in the solar industry has been used in the last five years and has not come to a point of recycling.
Silicon wafer new scrap is currently being recycled; however, no further data are available.
The potential to substitute for silicon in various applications is shown in Table 48.
Table 48: Available substitutes for silicon applications
1.18.6 Specific issues
The EU operates anti-dumping measures towards silicon metal imports from China. Further to an anti- circumvention request, the anti-dumping measures were extended to South Korea in 2007. The anti- dumping duties were introduced in 1990 for China and 2007 for Korea; these were set at a rate of 49%. The anti-dumping duties were lowered in 2010; a rate of 19% applies to all silicon metal imports from this area except those from Daton Jinneng Industrial Silicon Co. Ltd, for which a rate of 16.3% applies.b The anti-dumping measures were extended to Taiwan in April 2013; this was also set a rate of 19%.c
The European Commission is carrying out anti-dumping and anti-subsidy investigations towards China to find out whether unfair trade practices are being used. In June 2013, the EU announced that it would set anti-dumping duties on imports of solar panels, cells and wafers from China. A provisional rate was foreseen to be imposed in two steps, starting with 11.8% on 6 June and 47.6% on average on 6 August. However, on 27 July 2013 an agreement was achieved to set a minimum price level and to limit Chinese exports until the end of 2015.d
China used to set export tariffs on ferrosilicon and silicon metal, 25% and 15% respectively, in order to reduce export and retain these materials for domestic use. The World Trade Organization ruled against these taxes requiring China to remove export tariffs and quotas. In December 2012, the Chinese Minister of Finance announced that the export tax would be removed from January 2013.e European market
aEuroAlliages (2013), email communication
bCOUNCIL IMPLEMENTING REGULATION (EU) No 467/2010 of 25 May 2010 imposing a definitive anti-dumping duty on imports of silicon originating in the
People’s Republic of China, as extended to imports of silicon consigned from the Republic of Korea, whether declared as originating in the Republic of Korea or not, following an expiry review pursuant to Article 11(2) and a partial interim review pursuant to Article 11(3) of Regulation (EC) No 1225/2009c
Council Implementing Regulation (EU) No 311/2013 of 3 April 2013 extending the definitive anti-dumping duty imposed by Implementing Regulation (EU) No467/2010 on imports of silicon originating in the People’s Republic of China to imports of silicon consigned from Taiwan, whether declared as originating in Taiwan or notd
European Commission (2013), European Commission - MEMO/13/729 26/07/2013e
Use Substitutes Substitutability score
ChemicalsAlternatives such as thermoplastics and rubber can substitute for silicones in some applications; these offer different performance and costs associated
0.7
Metallurgy No alternative available 1Solar cells Thin films solar cells such as CIGS, CIS and CdTe cells: currently competing 0.7
ElectronicsGallium arsenide and germanium can be used as substitutes in semiconductor and infrared applications. 0.7
Others Arbitrary assumption 0.5

1
Metal Pages (2012), Cancellation of Chinese silicon export tax unlikely to impact US silicon market. https://www.metal-pages.com/ [Accessed July 2013]

1
players have observed that this has been the case and that silicon prices dropped accordingly since the beginning of 2013 with export increasing sharply (up 43% at end of August 2013).a
Increasing environmental concerns in China have led the government to impose electricity and emissions restriction of energy-intensive industries as part of a 5-year plan published in September 2010. In 2010, electricity was cut in the so-called Silicon Land, where production is concentrated, causing prices to rise sharply.b
aEuroalliages (2013), email communication
bUSGS (2013); Minerals Yearbook 2011, Silicon

1
1.19 Tungsten (Wolframium)
1.19.1 Introduction
Tungsten (W, atomic number 74) is relatively rare in the Earth’s crust with an estimated abundance of 1.5 ppm.a Tungsten has the highest melting point of all metalsb; therefore it is used for manufacturing filaments for light bulbs, which is the most common applicationc. Another special property is its high density of 19.26g/cm3; hence the name for this material is derived from the Swedish expression “tung sten” which means heavy stone.d Thus, tungsten is 19.3 times heavier than water and 1.7 times heavier than lead. In its unprocessed state, tungsten is brittle and consequently difficult to work.e Tungsten carbide is one of the hardest materials (2350 DPH30).d Due to this characteristic, it is used for cutting tools which represents the largest use of the element tungsten.f
A supply chain map for tungsten is shown in Figure 203. After mining, the ore is concentrated, usually nearby. After this stage the concentrated ore is mixed with in-process and end-of-life scrap and pre- treated to remove impurities. After this stage ammonium paratungstate (APT) is most commonly produced; this is the most common intermediate, used to manufacture other tungsten chemicals and products. All these stages occur within the EU to some extent; mining and concentration occurs on a smaller scale than the upstream processes.
Figure 203: Supply chain map for tungstenMine
tungsten ores
Conentration of low
ore grades
Pre-
treatement Purification
Recovery
Production of high-
purity ATP
Manufacture end-
products:• Hard metals• Tungsten alloys• Chemicals• etc.
End of life
Note: Orange colour represents stages of the supply chain which take place in Europe to some extent
1.19.2 Supply
Primary sources, production and refiningIn nature, tungsten does not occur in metallic form but in 45 mineralsg, of which only two, wolframite and scheelite, have any economic importance.h Economically recoverable ores contain 0.1-2.5% WO3.b With few exceptions, tungsten is mined in relatively small underground mines which extract less than 2,000 tonnes of ore per day.i For commercial trading 65-75% WO3 content is required for further refining; hence the ores first have to be treated.j Beside tungsten ores, today about 30% of tungsten scrap is used as raw material.k
aMetalle: Die Refraktärmetalle Niob, Tantal, Wolfram, Molybdän und Rhenium, Winnacker-Küchler, 2012
bUllmann’s Encyclopedia of Industrial Chemistry: Tungsten, Tungsten Alloys, and Tungsten Compounds, Wiley-VCH Verlag GmbH & Co. KGaA, 2012
cEuropean Mineral Statistics 2007-2011, British Geological Survey, 2013
dEncyclopedia of the elements: Tungsten, Enghag, Wiley-VCH Verlag GmbH & Co. KGaA, 2004
eFacts on File Dictionary of Chemistry (4th edition), Daintith, 2005
fEuropean Mineral Statistics 2007-2011, British Geological Survey, 2013
gInternational Mineral Association (IMA), Commission on New Minerals, Nomenclature and Classification: List of Mineral Names, 03/2009 (updated 02/2012)
hITIA www.itia.info
iAudion, Labbé, avec collaboration extérieure de la CEIS (2010) - Panorama mondial 2011 du marché du tungstène. Rapport public. BRGM/RP-61341-FR
jAudion, Labbé, avec collaboration extérieure de la CEIS (2010) - Panorama mondial 2011 du marché du tungstène. Rapport public. BRGM/RP-61341-FR

1
kMetalle: Die Refraktärmetalle Niob, Tantal, Wolfram, Molybdän und Rhenium, Winnacker-Küchler, 2012

1
Common processes to obtain tungsten concentrates from ores are sorting, gravity separation, froth flotation, magnetic, and electrostatic separation.a The ore-dressing plants are usually close to the mines to keep transportation costs low.b Economically, the most important tungsten ores are wolframite and scheelite. The latter is concentrated by gravimetric methods or froth flotation or a combination of both, while wolframite is treated with gravity methods and/or magnetic separation to obtain tungsten ore concentrates.m
Following this first concentration step, a pre-treatment of the derived concentrates and of some scrap is applied to remove remaining impurities.m Subsequently, APT (chemical formula: (NH4)10[H2W12O42]*H2O), which is the main and highly pure intermediate product, is produced.j APT is in turn used to produce the chemicals blue and yellow tungsten oxide and tungstic acid, as well as tungsten metal, tungsten powder, ferrotungsten, and other tungsten alloys.j
Supply detailsMajor tungsten deposits are located in China, Canada and Russia.m The biggest deposits in Europe currently in use are situated in Portugal and Austriac (Table 49).
Table 49: World tungsten mine production and reserves, tonnes of tungsten contentCountry Mine production Mine production Reserves
2011 2012 eUSA NA NA 140,000
Austria 1,100 1,100 10,000Bolivia 1,100 1,100 53,000Canada 1,970 2,000 120,000China 61,800 62,000 1,900,000Portugal 820 820 4,200Russia 3,500 3,500 250,000Other countries 2,700 3,000 760,000World total(rounded) 73,100 73,000 3,200,000Source: Mineral Commodity Summaries: Tungsten, US Geological Survey, 2013(e) Estimated. (NA) Not available.
In 2010, about 85% of the world’s tungsten production came from China (Figure 204). Other than China, there are several tungsten producing countries, such as Russia, Bolivia, Vietnam, Austria, Rwanda and Portugal, which make minor contributions to global tungsten production. China is not only the most important supplier of tungsten but also its largest consumer. To ensure the domestic supply, the Chinese government has put a range of measures to limit exports of several kinds of tungsten.d The EU relies heavily on tungsten imports. Europe’s import dependence for tungsten is estimated at 74%.e
aLassner, Schubert: Tungsten - Properties, Chemistry, Technology of the Element, Alloys, and Chemical Compounds, Kluwer Academic, 1999
bUllmann’s Encyclopedia of Industrial Chemistry: Tungsten, Tungsten Alloys, and Tungsten Compounds, Wiley-VCH Verlag GmbH & Co. KGaA, 2012
cEncyclopedia of the elements: Tungsten, Enghag, Wiley-VCH Verlag GmbH & Co. KGaA, 2004
dMetal Pages, World Tungsten Report, 2012
e

1
Polinares working paper n. 14, European dependence on and concentration tendencies of the material production, March 2012

China85%
Russia 4%Bolivia 2%Vietnam 1%Austria 1%Rwanda 1%Portugal 1%Peru 1%Thailand 1%
Canada 1%
Figure 204: Worldwide production of tungsten in 2010
20 000
15 000
10 000
EU Export5 000
EU Import
0 Net Export20082009201020112012
-5 000
-10 000
-15 000
Figure 205: Trends in extra-EU trade for tungsten ores and concentrates, tonnes
1
Source: World Mining Data 2012
EU trade flows and consumptionTrade flow data for the past five years shows that, after a period of relative balance in import and export, there has been a large growth in import in the last year – imports grew even further up to 70 000 t in 2013. These figures do not include trade of substances and articles derived from tungsten ores and concentrates such as APT.
Source: Eurostat-Comext Database, Code 26110000 [Accessed November 2013]
Data for 2012 shows that the major export partners of the EU are the USA, Brazil, Japan, and several other countries (Figure 206). By contrast, data for EU imports show that they are dominated by Russia, exceeding total Russian supply, indicating that this is imported to Russia prior to export to the EU.

1
8 000
6 000
4 000
2 000
ExportImport Net-export
02008 2009 2010 2011 2012
-2 000
-4 000
Figure 207: Trends in extra-EU trade for tungsten, tonnes
Figure 206:EU exports and imports of tungsten ores and concentrates, 2012EU Export of Tungsten Ores and
Concentrates(3,655 t)
EU Import of Tungsten Ores and Concentrates
(14,977 t)
China 2%
Norway4%
Thailand1% Other
1% United States 65%
Bolivia 2%
Vietnam 5%
Japan 7% Russia
98%
Brazil 15%
Source: Eurostat-Comext Database, Code 26110000 [Accessed November 2013]
Trends for unwrought tungsten, articles of tungsten and tungsten waste and scrap are shown in Figure207. The EU is overall a net-importer importer importing on average 1,100 tonnes between 2008 and 2012. These figures do not include all forms of tungsten and are therefore not complete.
Source: Eurostat-Comext Database, CN 8101, tungsten "wolfram" and articles thereof, n.e.s.; tungsten waste and scrap (excl. Ash and residues containing tungsten) [Accessed November 2013]
Figure 208 shows the major trading partners for unwrought tungsten, articles of tungsten and tungsten waste and scrap. As can be seen, the US is both the major importer and exporter of these materials. This likely to be due to different forms of tungsten being produced and used in different countries.

EU Imports of tungsten (4,508 t)ThailandOther
1%11%Pakistan South 2% Korea3%
USA24%
Japan4%South Africa 6%Russia 6%
China13%
India7% Turkey
7%Canada
8%
Switzerland8%
2
Figure 208: EU exports and imports of tungsten , 2012
Source: Eurostat-Comext Database, CN 8101, tungsten "wolfram" and articles thereof, n.e.s.; tungsten waste and scrap (excl. Ash and residues containing tungsten) [Accessed November 2013]
Europe’s share of world primary and secondary tungsten consumption is estimated at 12,000 tonnes or 13% of the world total of 90,000 tonnes for 2011.
China is the world’s largest tungsten consumer, with approximately half of total world consumption. The United States accounts for 14% and Japan 11%, with 11% in other countries (Figure 209).
SouthKorea 3%
Japan4%
Switzerland 6%
Isr
South
Taiwan Ot
h
EU export of tungsten (3,713
Chi
US
Hong Kong

Others 11%Japan 11%
China 51%USA14%
Europe 13%
Figure 209: World (Primary and Secondary) Tungsten Consumption by Country, 2011 (%)
800
700
increasingEuropean demand
global inflation;strong demand; reports on short supply from China
strong demand of theUS government
600industrial activityin Europe increases; Vietnam War
500
decreasing demand;increasing production; global recession
World War I
400
300
decline of Chinese exports;reduction of export incentives; globally increasing demand
200
100 elimination of British stocks;increased production in US
collapse in exportsand increasing de- mand in eastern Europe
0
2
Source: Roskill Presentation (December 2012), Tungsten: Trends in demand and a short primer on China
1.19.3 Demand
Prices and marketsDue to its exceptional properties, tungsten has been considered economically important throughout the last century. Figure 210 shows how the different supply and demand situations worldwide influenced tungsten prices during that time. Tungsten prices have been more stable and less volatile during the 1980s and 1990s compared to historical trends. It was not until 2005/2006 that prices climbed again when global demand increased while Chinese exports declined. a
Figure 210: Development of real tungsten prices (Prices are deflated, 2011 = 100).
$/mt

2
aDERA, HWWI (2013) Ursachen von Preispeaks, -einbrüchen und –trends bei mineralischen Rohstoffen. April 2013.

1
Superalloys6%
Tungsten alloys4%
Alloy steels (>80%tool steel) 13%
Fabricated products17%
Cemented carbides60%
Figure 211: Worldwide end-use of tungsten in 2010
Source: DERA, HWWI (2013) Ursachen von Preispeaks, -einbrüchen und –trends bei mineralischen Rohstoffen (Causes of price peaks, collapses and trends of mineral raw materials), Hamburg Institute of International Economics (HWWI) in contract for Deutsche Rohstoffagentur (DERA). April 201, translated into English by Fraunhofer ISI
ApplicationsDue to its exceptional physical properties, tungsten is used for a wide range of applications. The largest share (60%) is used for the production of cemented carbides. The rest is used for fabricated products, alloy steels, super alloys and tungsten alloys (Figure 211). Worldwide data is shown as European data was not available at the time of writing.
Source: Critical Raw Materials for the EU 2010
The majority of tungsten is used for hard metals whose main component is tungsten carbide (WC). They are characterized by high wear resistance even at high temperatures. Therefore hard metals are used for cutting and drilling tools.a Similar properties arise from the addition of tungsten to steel.a
The widest range of applications is represented by tungsten alloys. They are used in lighting technology, electrical and electronic technology, high-temperature technology (e.g. furnaces, power stations), welding, spark erosion, space travel and aircraft devices, armaments and laser technology.a
1.19.4 Outlook
The outlook forecast for the world tungsten supply and demand is shown in Figure 212. Overall market growth for tungsten is expected to be reasonably strong, with annual growth forecast at around 4.5% per year to 2020. Particularly strong growth is expected in the tungsten chemicals sector, with the size of this market segment expected to double by 2020. Demand growth in the more established cemented carbides, steel alloy and tungsten products will be slightly more moderate at 3-4% per year.
On the supply side, higher prices have stimulated greater interest in both new mine projects and also recycling. Considerable growth is expected to take place for secondary production, in particular. The share of secondary tungsten is anticipated to increase from around a quarter to nearer a third of total world tungsten supply by 2020. In terms of primary production, Asia’s share of world tungsten mine production is expected to fall below 80% by 2020, with corresponding increases in Europe, North America and Australia, where there are quite a number of development projects. Some of these have reported
aUllmann’s Encyclopedia of Industrial Chemistry: Tungsten, Tungsten Alloys, and Tungsten Compounds, Wiley-VCH Verlag GmbH & Co. KGaA, 2012

140 000
120 000
100 000
80 000
60 000
40 000
Chemicals/OtherTungsten products Steel alloys Cemented carbidesSupply
20 000
-
2012 2014 2017 2020
Figure 212: World total tungsten supply and end-use forecasts to 2020 (tonnes)
2
mine plans for the life of the mines of only 4-5 years; although it is likely that the mines will continue beyond these initial life times, as further reserves are identified and exploited.
Overall, the market for tungsten is expected to remain roughly in balance, with a small surplus opening up by 2014, as some new mines reach the market. However, by 2017 and 2020, demand is expected to catch up again with these scheduled production increases.
Source: Roskill Information Services for 2013 CRM study
2
Scheelite /wolframite ore concentrates
Primary tungsten66%
Secondarytungsten (scrap) 34%
Total tungstendemand 100%
Final products90%
Scrap originatedduring processing 10%
Scrap fromused parts 24%
1.19.5 Resource efficiency and recycling
Compared to tungsten-bearing ores, tungsten scrap has high tungsten content; therefore recycling is important to supply the total tungsten demand (Figure 213). Moreover the value of further metals in tungsten alloys (e.g. tantalum, cobalt, nickel) leads to economic recycling, as well as environmental benefits.a In the quantitative assessment, a recycling rate of 0.37 has been used.
Figure 213: Tungsten flowchart: Primary and secondary tungsten
Source: Ullmann’s Encyclopedia of Industrial Chemistry: Tungsten, Tungsten Alloys, and Tungsten Compounds, Wiley-VCH Verlag GmbH& Co. KGaA, 2012
Due to tungsten’s unique properties, substitutes for most applications result in a loss of performance or in an increased cost; however, there are some potential substitutes for tungsten. In cemented carbides and other applications, tungsten and its compounds can be replaced by molybdenum, titanium, ceramics depleted uranium or hardened steel. For lightning equipment tungsten filaments can be substituted by carbon nanotube filaments, light-emitting diodes or other light sources.a
Figure 214: Substitutability of tungsten scoring used in the analysisUse Substitutability score
Tungsten alloys 0.7Superalloys 1.0Fabricated products 1.0Alloy steels (mainly tool steel, >80%) 0.7Cemented carbides 0.7
aMineral Commodity Summaries: Tungsten, US Geological Survey, 2013

2
1.19.6 Specific issues
China - the world’s largest supplier of tungsten ores, concentrates and intermediates - has placed restrictions on exports of these materials. The export quota for tungsten has been falling over time, reducing from 15,700 tonnes to 15,400 tonnes between 2011 and 2012. a A trade dispute is currently underway at the World Trade Organisation on the legality of China's export quota system.
According to the Directive 2005/32/EG the European Parliament establishes a framework for ecodesign requirements for energy using products. As a consequence, some kinds of incandescent lamps were phased out from the EU market from 2009 to 2012.b However, the amount of tungsten used for light bulbs represents only a minor part of the total quantity of tungsten traded worldwide.
aWorld Tungsten Summary, Metal Pages Ltd. 2012
bec.europa.eu/energy/efficiency/ecodesign/doc/committee/2008_12_08_technical_briefing_household lamps.pdf, retrieved online: 30 August 2013