antimony basic supply & demand statistics -...
TRANSCRIPT

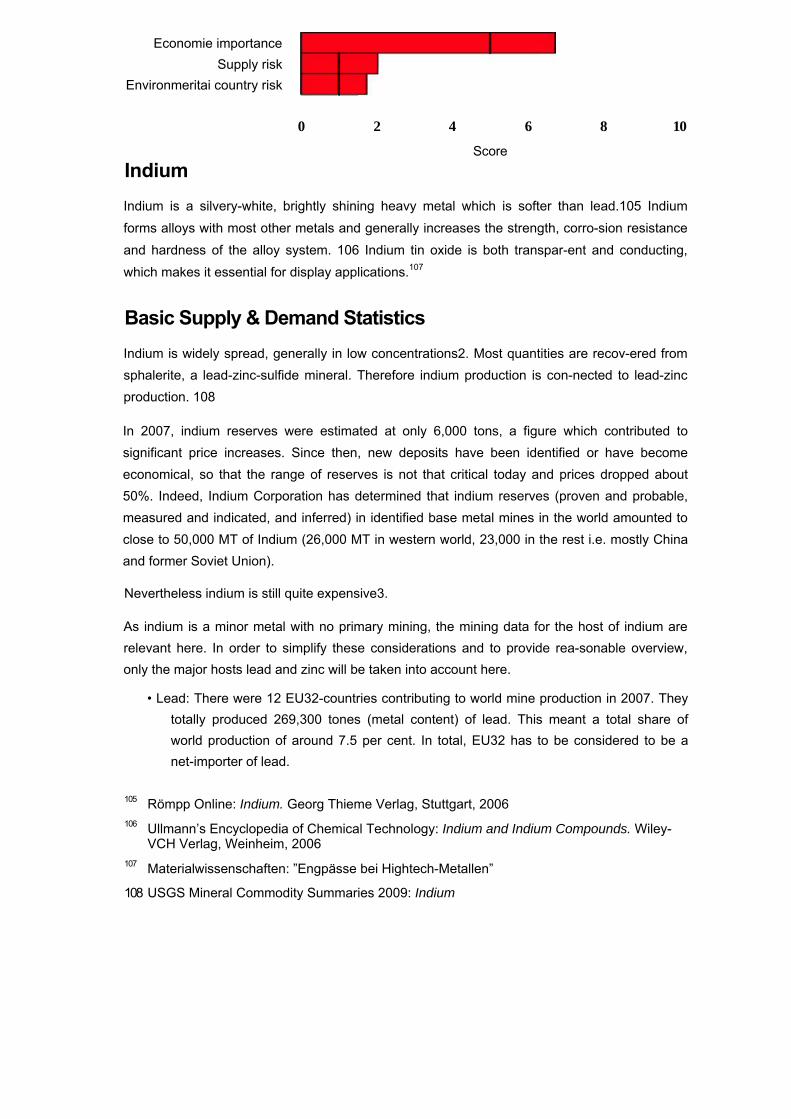
Economie importance Supply risk
Environmeritai country risk
Antimony (Sb, atomic number 51) is a silvery-white shining, very brittle and semicon-ducting element. Due to its poor mechanical properties, pure antimony is only used in very small quantities, larger amounts are used for alloys and in antimony compounds.8
There are more than 100 known antimony-containing minerals, the most important of which is antimonite.9
Basic Supply & Demand Statistics
Antimony is midrange concerning its abundance in the earth’s crust (0.0001%). It oc-curs in volcanic rocks and in sandstone with an average antimony content of approxi-mately 1g/ton.1 The most important antimony ore is antimonite (Sb2S3) which contains 71.7% antimony. Often antimony is a byproduct of gold, silver, lead, tungsten or zinc mines.
World resources are primarily located in Bolivia, China, Mexico, Russia and South Af-rica. The EU is dependent entirely on imports, though total EU consumption in 2007 (792 tons) only accounted for 0.5% of the world production.
Less than 1 per cent of world production of antimony is produced in Europe (including Turkey excluding Russia) countries. Only Turkey shows a marginal production (see point 5). From 2008 to 2009 world production decreased by 5%.
(in Reserves 1000t; 2010)
Production (in 1000t; 2009)
EU imports (in t; 2007)
USA Bolivia China Russia (recover-able)
-310 14,7% 790 37,4% 350 16,6%
-4.5 2,4% 170 91,2% 3 1,6%
608 76,8% 122 15,4%
8 Römpp Online: Antimon. Georg Thieme Verlag, Stuttgart, 2004 9 Ullmann’s Encyclopedia of Chemical Technology: Antimony and Antimony Compounds. Wiley-
VCH Verlag, Weinheim, 2006
Antimony
South Africa 44 2,1% 3 1,6%
Tajikistan 50 2,4% 2 1,1% Thailand 420 19,9% - Japan 14 1,8% Peru 48 6,1% Others 150 7,1% 4 2,1% Total 2,114 186.5 792 Source: USGS 2010; trade data provided by BGS based on EU comtrade (HS 261710)
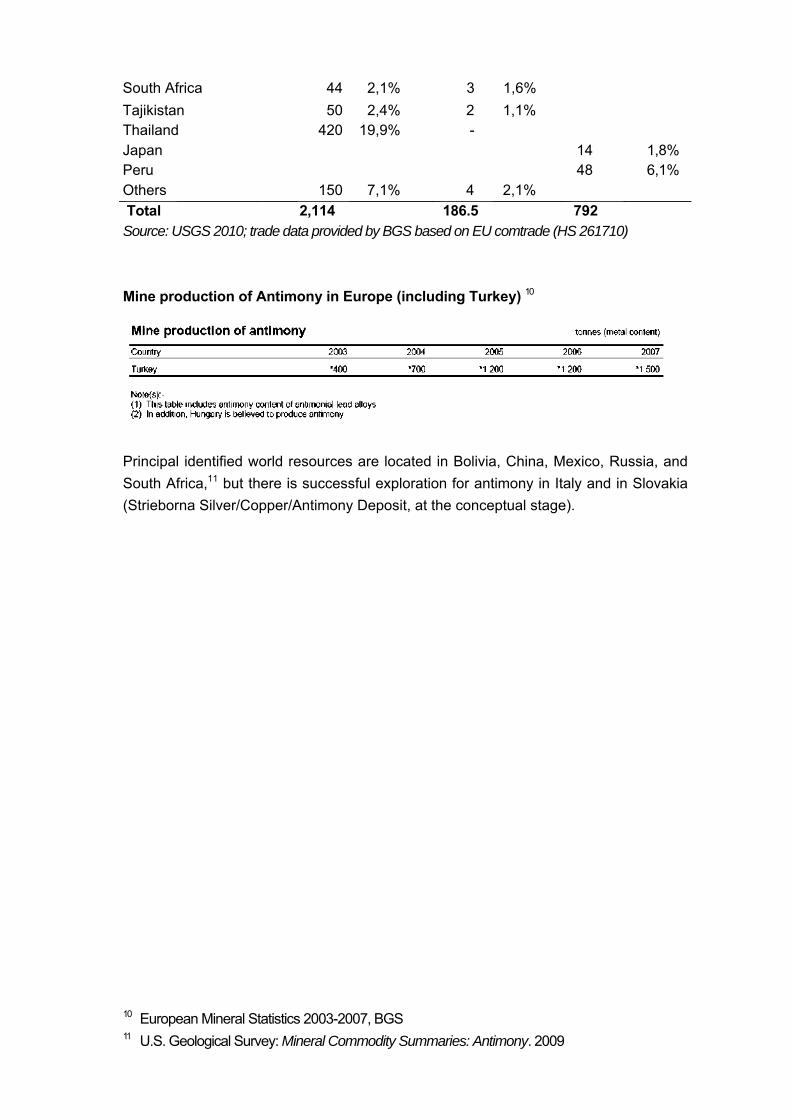
Mine production of Antimony in Europe (including Turkey) 10
Principal identified world resources are located in Bolivia, China, Mexico, Russia, and South Africa,11 but there is successful exploration for antimony in Italy and in Slovakia (Strieborna Silver/Copper/Antimony Deposit, at the conceptual stage).
10 European Mineral Statistics 2003-2007, BGS 11 U.S. Geological Survey: Mineral Commodity Summaries: Antimony. 2009
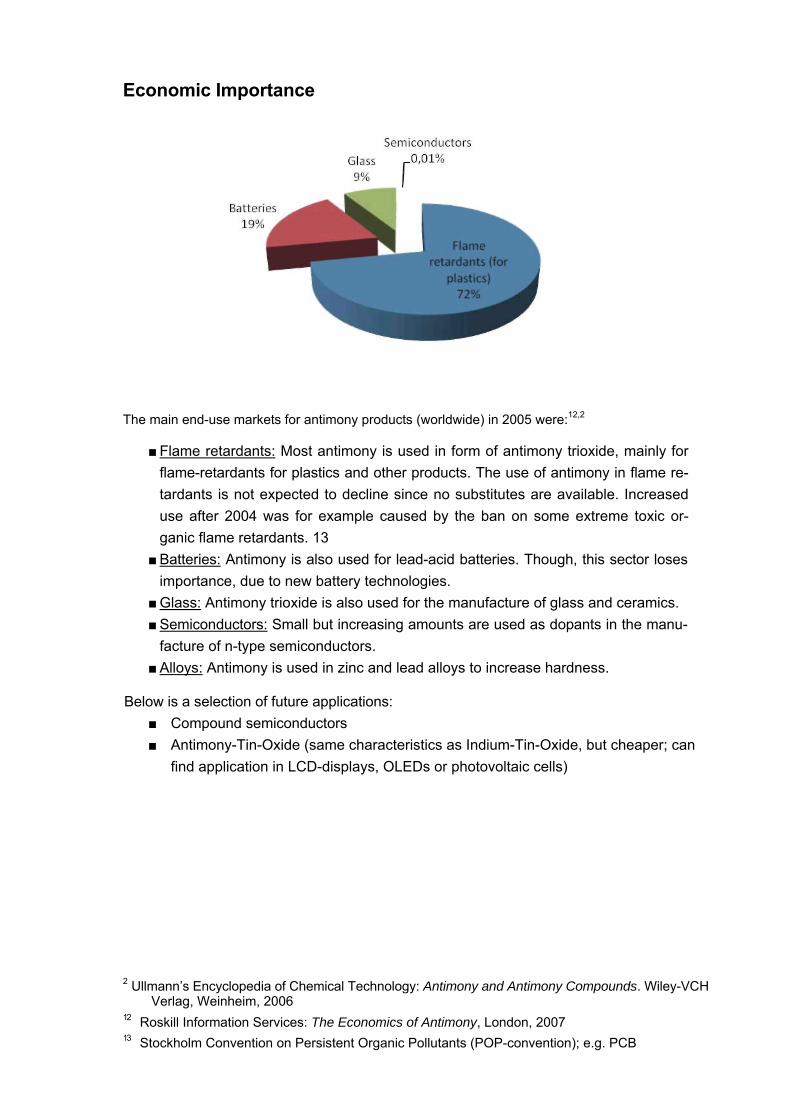
Economic Importance
The main end-use markets for antimony products (worldwide) in 2005 were:12,2
■ Flame retardants: Most antimony is used in form of antimony trioxide, mainly for flame-retardants for plastics and other products. The use of antimony in flame re-tardants is not expected to decline since no substitutes are available. Increased use after 2004 was for example caused by the ban on some extreme toxic or-ganic flame retardants. 13
■ Batteries: Antimony is also used for lead-acid batteries. Though, this sector loses importance, due to new battery technologies.
■ Glass: Antimony trioxide is also used for the manufacture of glass and ceramics. ■ Semiconductors: Small but increasing amounts are used as dopants in the manu-
facture of n-type semiconductors. ■ Alloys: Antimony is used in zinc and lead alloys to increase hardness.
Below is a selection of future applications: ■ Compound semiconductors ■ Antimony-Tin-Oxide (same characteristics as Indium-Tin-Oxide, but cheaper; can
find application in LCD-displays, OLEDs or photovoltaic cells)
2 Ullmann’s Encyclopedia of Chemical Technology: Antimony and Antimony Compounds. Wiley-VCH Verlag, Weinheim, 2006
12 Roskill Information Services: The Economics of Antimony, London, 2007 13 Stockholm Convention on Persistent Organic Pollutants (POP-convention); e.g. PCB

Antimony demand probably will decrease in the next decades, because of the declining importance for batteries and flame-retardants. In fact, the demand for antimony for mi-cro capacitors will increase, but in this sector only small amounts are necessary.14
Resource Efficiency: Recycling & Substitution
Traditionally, antimony was recycled from old lead-acid batteries on a large scale, but new battery technologies lead to a declining amount of recycled antimony. Available information differs from 3%15 to 20%16 recycled antimony from old scrap.
Traditionally, the bulk of secondary antimony has been recovered as antimonial lead, most of which was generated by and then consumed by the battery industry. Changing trends in that industry in recent years, however, have generally reduced the amount of secondary antimony produced; the trend to low-maintenance batteries has tilted the balance of consumption away from antimony and toward calcium as an additive.17
Some uses of antimony are characterized as dissipative, which means that there is no recycling possible. The use of antimony in flame retardants is a dissipative application.
There are substitutes for antimony in its most important applications. ■ Compounds of chromium, tin, titanium, zinc and zirconium substitute for anti-
mony chemicals in paint, pigments, and enamels. ■ Combinations of cadmium, calcium, copper, selenium, strontium, sulphur and tin
can be used as substitutes for hardening lead. ■ Selected organic compounds and hydrated aluminium oxide are widely ac-
cepted substitutes as flame retardants.9
Specific Issues
Several countries have restrictions concerning trade with antimony. According to the EU Commission’s inventory on export restrictions, China, Russia and South Africa re-sort to export restrictions on antimony waste and scrap. China uses export quotas, while Russia imposes an export tax (6.5%), and South Africa a system of non-automatic export licensing. Tanzania applies an export ban on waste and scrap.
14 Fraunhofer Institut für System und Innovationsforschung and Institut für Zukunftsstudien und Technologiebewertung: Rohstoffe für Zukunftstechnologien, 2009, Fraunhofer IRB Verlag, Stuttgart
15 UNEP Draft Report 16 Carlin (2006) 17 U.S. Geological Survey: Mineral Commodity Summaries: Antimony. 2010
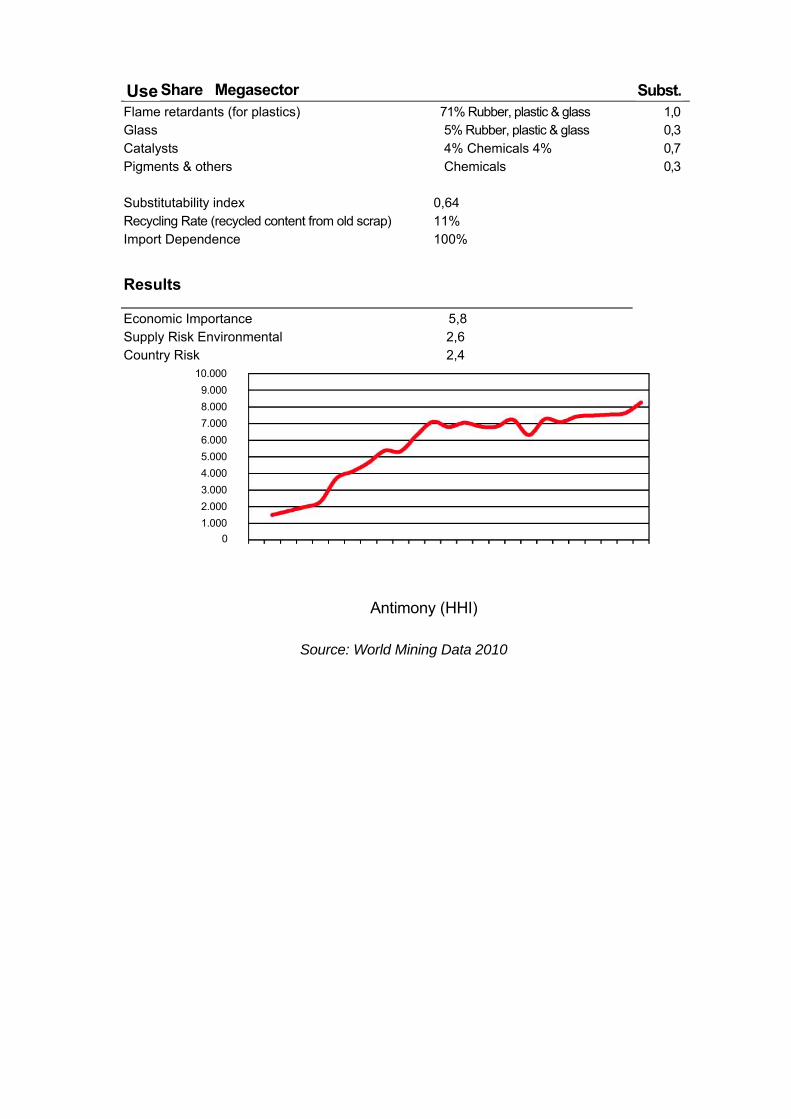
Share Megasector
Flame retardants (for plastics) Glass Catalysts Pigments & others
71% Rubber, plastic & glass 5% Rubber, plastic & glass 4% Chemicals 4% Chemicals
1,0 0,3 0,7 0,3
Substitutability index Recycling Rate (recycled content from old scrap) Import Dependence
0,64 11% 100%
Results
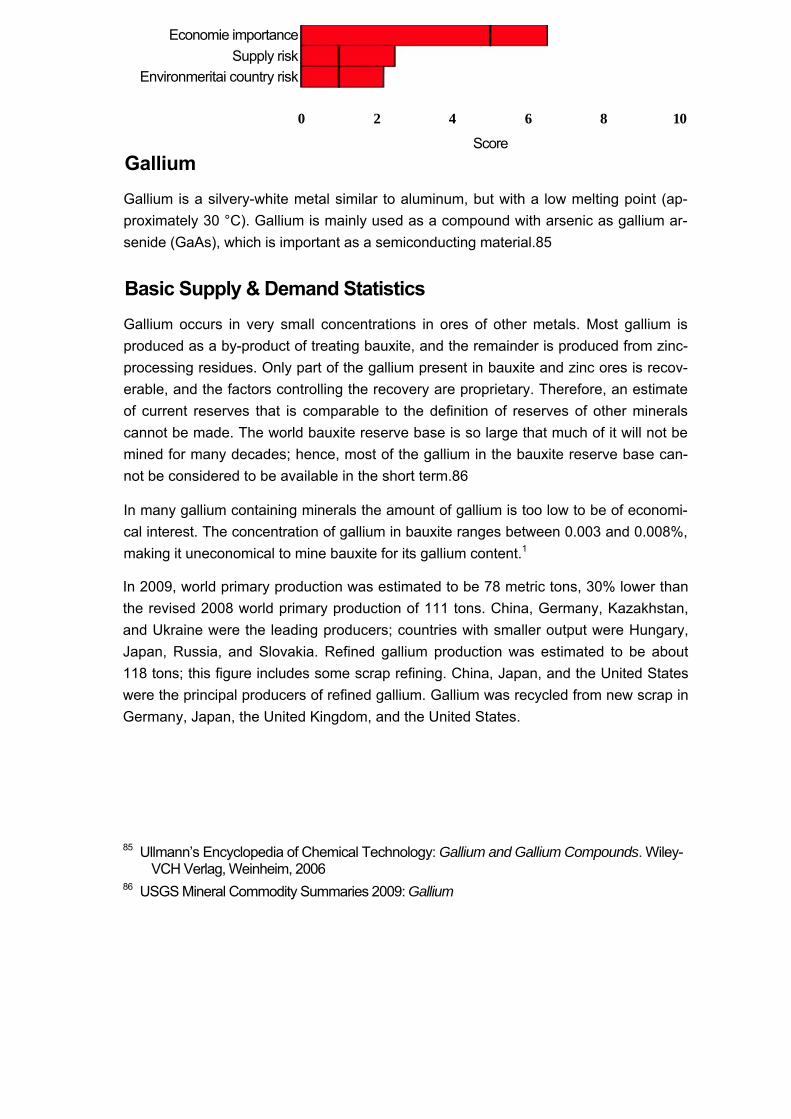
Economic Importance Supply Risk Environmental Country Risk
5,8 2,6 2,4
10.000 9.000 8.000 7.000 6.000 5.000 4.000 3.000 2.000 1.000
0
Antimony (HHI)
Source: World Mining Data 2010
Use Subst.
Economie importance Supply risk
Environmental country risk I -------------- 1 ------------- 1 ------------- 1 ------------- 1 ------------- 1 0 2 4 6 8 10
Score Beryllium
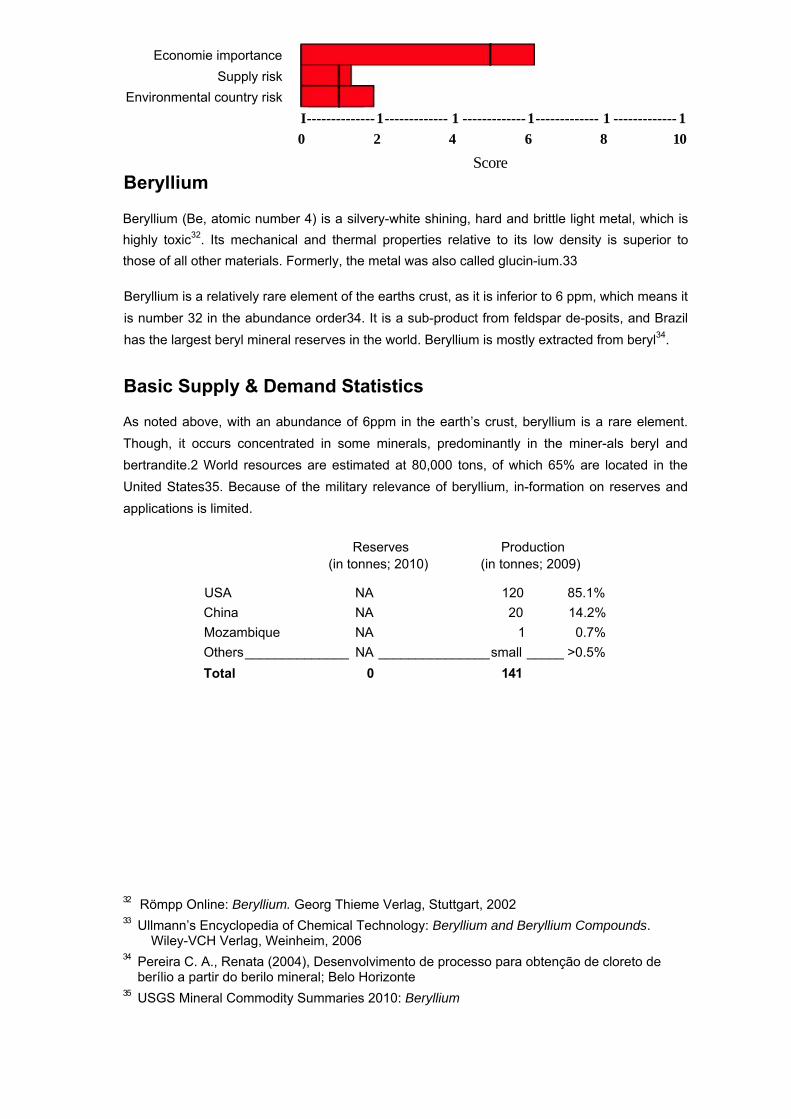
Beryllium (Be, atomic number 4) is a silvery-white shining, hard and brittle light metal, which is highly toxic32. Its mechanical and thermal properties relative to its low density is superior to those of all other materials. Formerly, the metal was also called glucin-ium.33
Beryllium is a relatively rare element of the earths crust, as it is inferior to 6 ppm, which means it is number 32 in the abundance order34. It is a sub-product from feldspar de-posits, and Brazil has the largest beryl mineral reserves in the world. Beryllium is mostly extracted from beryl34.
Basic Supply & Demand Statistics
As noted above, with an abundance of 6ppm in the earth’s crust, beryllium is a rare element. Though, it occurs concentrated in some minerals, predominantly in the miner-als beryl and bertrandite.2 World resources are estimated at 80,000 tons, of which 65% are located in the United States35. Because of the military relevance of beryllium, in-formation on reserves and applications is limited.
Reserves Production (in tonnes; 2010) (in tonnes; 2009)
USA NA 120 85.1% China NA 20 14.2% Mozambique NA 1 0.7% Others ______________ NA _______________ small _____ >0.5% Total 0 141
32 Römpp Online: Beryllium. Georg Thieme Verlag, Stuttgart, 2002 33 Ullmann’s Encyclopedia of Chemical Technology: Beryllium and Beryllium Compounds.
Wiley-VCH Verlag, Weinheim, 2006 34 Pereira C. A., Renata (2004), Desenvolvimento de processo para obtenção de cloreto de
berílio a partir do berilo mineral; Belo Horizonte 35 USGS Mineral Commodity Summaries 2010: Beryllium
Source: USGS 2010; ComExt (CN 8112 12 00)
Demand is limited by cost. Beryllium is not mined within the EEA. However, given esti-mated global reserve levels and annual usage, it appears that there is a abundant sup-ply in the USA of the ores from which all Beryllium based materials are produced, re-serves which could satisfy EU and world demand for over 100 years at current usage rates.
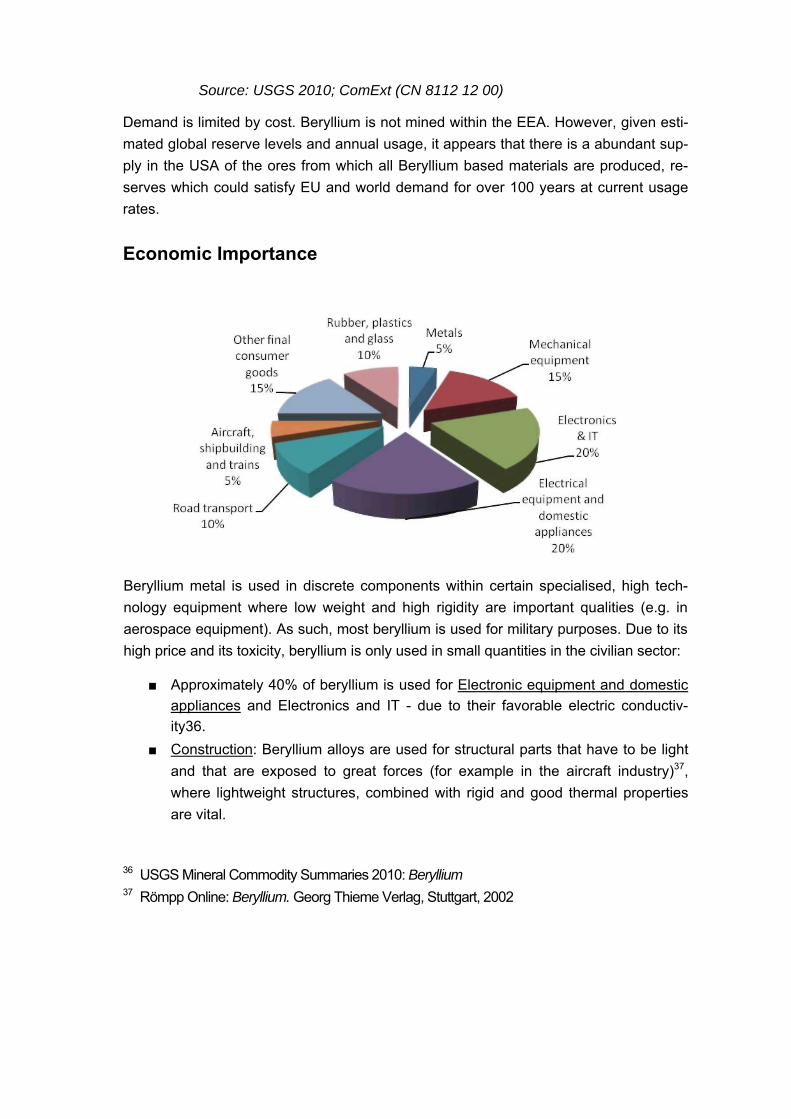
Economic Importance
Beryllium metal is used in discrete components within certain specialised, high tech-nology equipment where low weight and high rigidity are important qualities (e.g. in aerospace equipment). As such, most beryllium is used for military purposes. Due to its high price and its toxicity, beryllium is only used in small quantities in the civilian sector:
■ Approximately 40% of beryllium is used for Electronic equipment and domestic appliances and Electronics and IT - due to their favorable electric conductiv-ity36.
■ Construction: Beryllium alloys are used for structural parts that have to be light and that are exposed to great forces (for example in the aircraft industry)37, where lightweight structures, combined with rigid and good thermal properties are vital.
36 USGS Mineral Commodity Summaries 2010: Beryllium 37 Römpp Online: Beryllium. Georg Thieme Verlag, Stuttgart, 2002
■ Other applications where beryllium is used are38,39: o CT scanners and X-ray machines: Beryllium metal is used for x-ray
transparent windows. o Ceramics: Beryllium oxide (BeO) is used for special ceramics. o Physical instruments: Beryllium has properties that make it interesting
for a variety of physical instruments (e.g. neutron monochromators). o Joint European Torus Reactor and International Thermonuclear reactor:
Important role in_European efforts to develop controlled nuclear fusion energysystems, as a possible future alternative to the burning of fossil fuel.
Resource Efficiency: Recycling & Substitution
Recycling
About 19% of beryllium consumption40 is recycled content from old scrap.
Approximately 50% of the “First Processing” materials are recovered as scrap that is recycled through an active “Secondary Processing” industry within the EU, or re-exported to the original smelting companies outside the EU. Within the 50% scrap re-covered, approximately 90% of the Beryllium contained is recovered, and returned in First Processed alloys. The beryllium contained in post consumer scrap is not recov-ered specifically, but is contained in the slag produced by copper recycling proc-esses41.
Substitution
Due to its high costs beryllium is only used in applications where its properties are cru-cial. Therefore it is hard to substitute. Nevertheless certain metal matrix or organic composites, high-strength grades of aluminum, pyrolytic graphite, silicon carbide, steel, or titanium may be substituted for beryllium metal or beryllium composites. There are some more possible substitutes in specific alloys, but often combined with a loss in performance42.
38 Römpp Online: Beryllium. Georg Thieme Verlag, Stuttgart, 2002 39 Ullmann’s Encyclopedia of Chemical Technology: Beryllium and Beryllium Compounds.
Wiley-VCH Verlag, Weinheim, 2006 40 Civic, 2009 41 USGS Mineral Commodity Summaries 2010: Beryllium 42 USGS Mineral Commodity Summaries 2010: Beryllium
Specific issues
The most significant threats originate from perceived risks associated with the use of beryllium in electronic products. EU regulatory fears and NGO propagated “banning” of the use of materials containing beryllium lead to unwarranted attempts to find substi-tutes that do not offer the same qualities with respect to performance, sustainability and environmental protection. The data that authorities rely on is not current and does not reflect the most recent scientific studies. In general, authorities are reluctant to break from the past and are not open to new scientific studies even if they are conducted in accord with OECD guidelines or originate from proven workplace strategies.
Algeria and South Africa resort to non-automatic export licensing to limit the quantities of waste and scrap exported. Russia applies a 6.5% export tax on waste and scrap.
Economie importance Supply risk
Environmeritai country risk
Score
Cobalt
Cobalt (Co), a transition metal appearing in the periodic table between iron and nickel, is very hard, retains its strength at high temperatures and has fairly low thermal and electrical conductivity. Cobalt is also ferromagnetic and can therefore be magnetised. Other properties that are important in industrial applications are its ability to form alloys with many other metals, imparting strength at high temperatures, and its ability to keep its magnetic properties at high temperatures.
The CDI (Cobalt Development Institute) is the authoritative source of information re-garding the global cobalt market and cobalt applications69.
Basic Supply & Demand Statistic
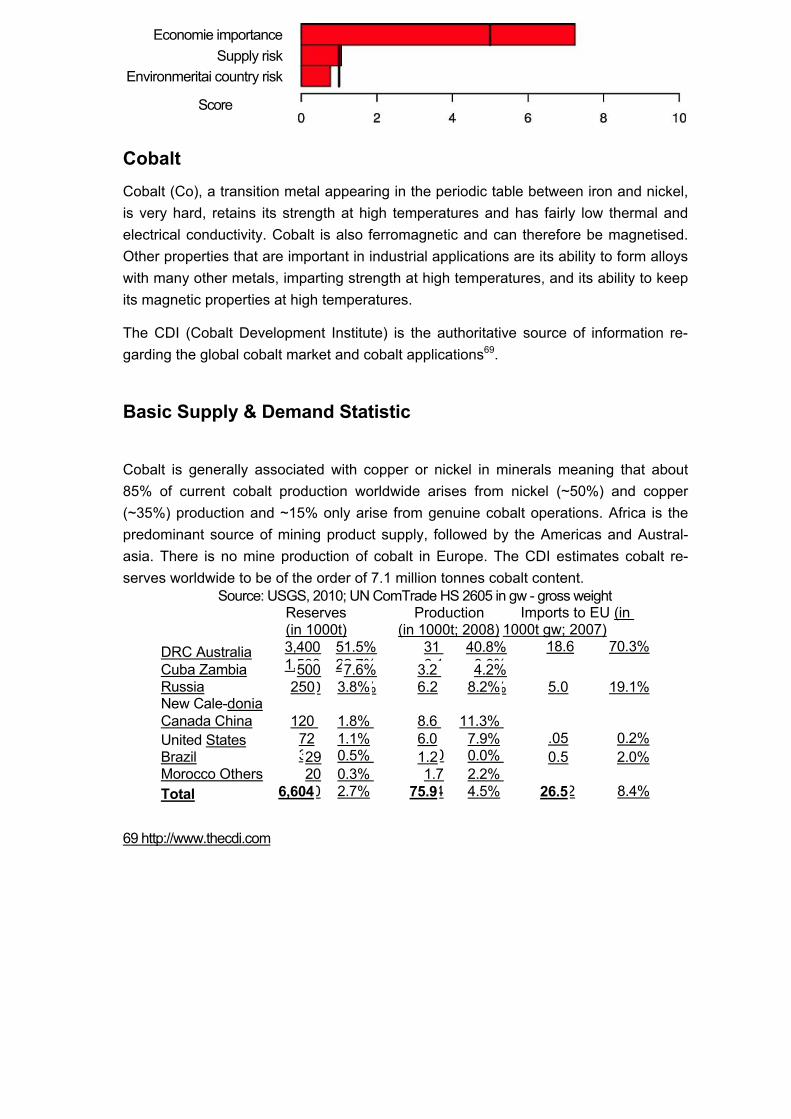
Cobalt is generally associated with copper or nickel in minerals meaning that about 85% of current cobalt production worldwide arises from nickel (~50%) and copper (~35%) production and ~15% only arise from genuine cobalt operations. Africa is the predominant source of mining product supply, followed by the Americas and Austral-asia. There is no mine production of cobalt in Europe. The CDI estimates cobalt re-serves worldwide to be of the order of 7.1 million tonnes cobalt content.
Source: USGS, 2010; UN ComTrade HS 2605 in gw - gross weight Imports to EU (in
1000t gw; 2007) DRC Australia Cuba Zambia Russia New Cale-donia Canada China United States Brazil Morocco Others Total
69 http://www.thecdi.com
Reserves (in 1000t)
Production (in 1000t; 2008)
3,400 1,500
51.5% 22.7%
31 6.1
40.8% 8.0%
18.6 70.3%
500 270
7.6% 4.1%
3.2 6.9
4.2% 9.1%250 3.8% 6.2 8.2% 5.0 19.1%
230 3.5% 1.6 2.1%120 72
1.8% 1.1%
8.6 6.0
11.3% 7.9% .05 0.2%
33 0.5% 0.4%
0 0.0% 1.6%
29 1.2 0.5 2.0% 20
180 0.3% 2.7%
1.7 3.4
2.2% 4.5% 2.2 8.4% 6,604 75.9 26.5
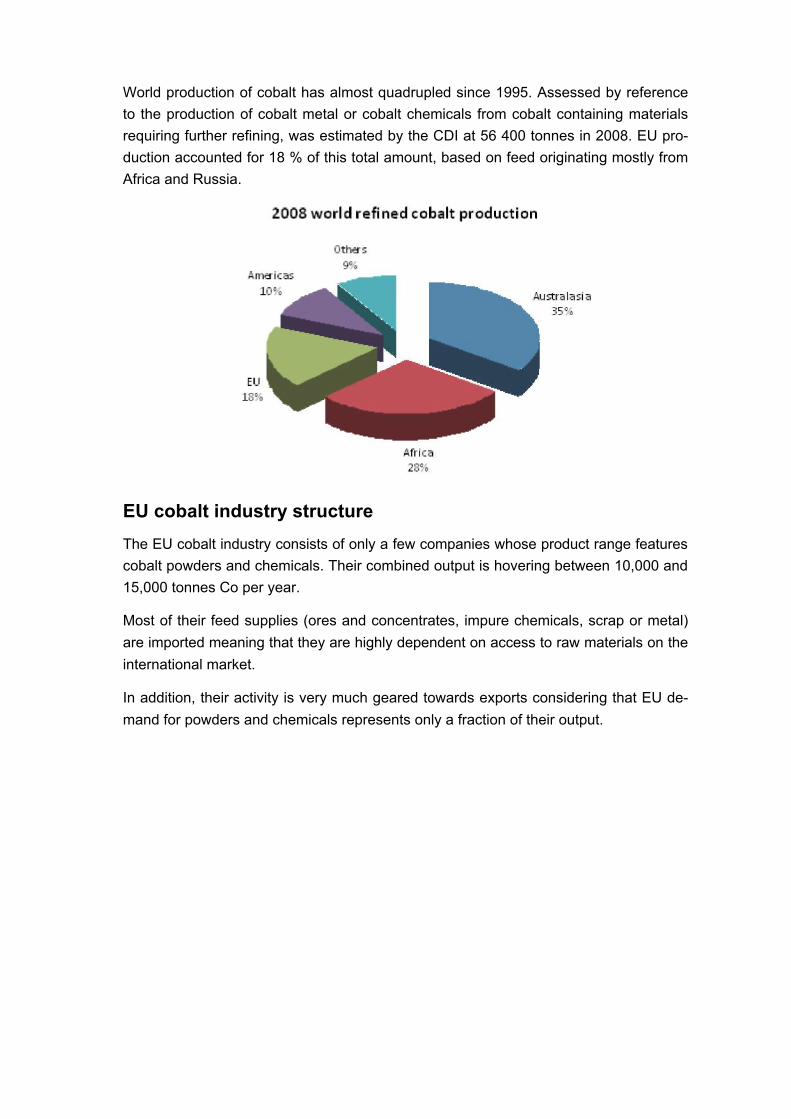
World production of cobalt has almost quadrupled since 1995. Assessed by reference to the production of cobalt metal or cobalt chemicals from cobalt containing materials requiring further refining, was estimated by the CDI at 56 400 tonnes in 2008. EU pro-duction accounted for 18 % of this total amount, based on feed originating mostly from Africa and Russia.
EU cobalt industry structure
The EU cobalt industry consists of only a few companies whose product range features cobalt powders and chemicals. Their combined output is hovering between 10,000 and 15,000 tonnes Co per year.
Most of their feed supplies (ores and concentrates, impure chemicals, scrap or metal) are imported meaning that they are highly dependent on access to raw materials on the international market.
In addition, their activity is very much geared towards exports considering that EU de-mand for powders and chemicals represents only a fraction of their output.

The EU Cobalt Value Chain70 (Source: Eurometaux)
Economic importance
70 Eurometaux
Rechargeable batteries: today’s main cobalt end-use sector, including nickel-cadmium batteries, nickel-metal hydride batteries and lithium-ion batteries, with the highest proportion of cobalt found in high-performance models (the cathode of lithium-ion batteries may contain up to 60 per cent of lithium-cobalt oxide).
■ Superalloys/wear resistant alloys: historically the major end-use of cobalt which is alloyed with other metals (mostly nickel, but also iron) to provide superior thermal, corrosion and wear resistance to a wide range of alloys developed for applications in e.g. jet engines, all types of turbines, space vehicles, certain parts of motors, chemical equipment, etc.
■ Hardmetals: cobalt is a powerful binder for the manufacture of carbide and diamond tools by the hardmetal industry.
■ Catalysts: Co-based catalysts are widely used in the petro-chemical and plastics industries.
■ Magnetic alloys: cobalt unique feature in magnet applications is to ensure perma-nent and stable magnetism at high temperature, which makes Co containing mag-netic alloys still the preferred material for high-demanding magnet applications even though substitutes have been developed and implemented for less demand-ing applications as a result of price volatility in particular.
• Others: cobalt has many other applications where it is used in the form of oxides or salts, such as pigment in ceramic and glazing, as a decolouriser in glass, as a drier in paints, as an adhesive in rubber applications, as an oligo-element in agriculture and medicine, etc.
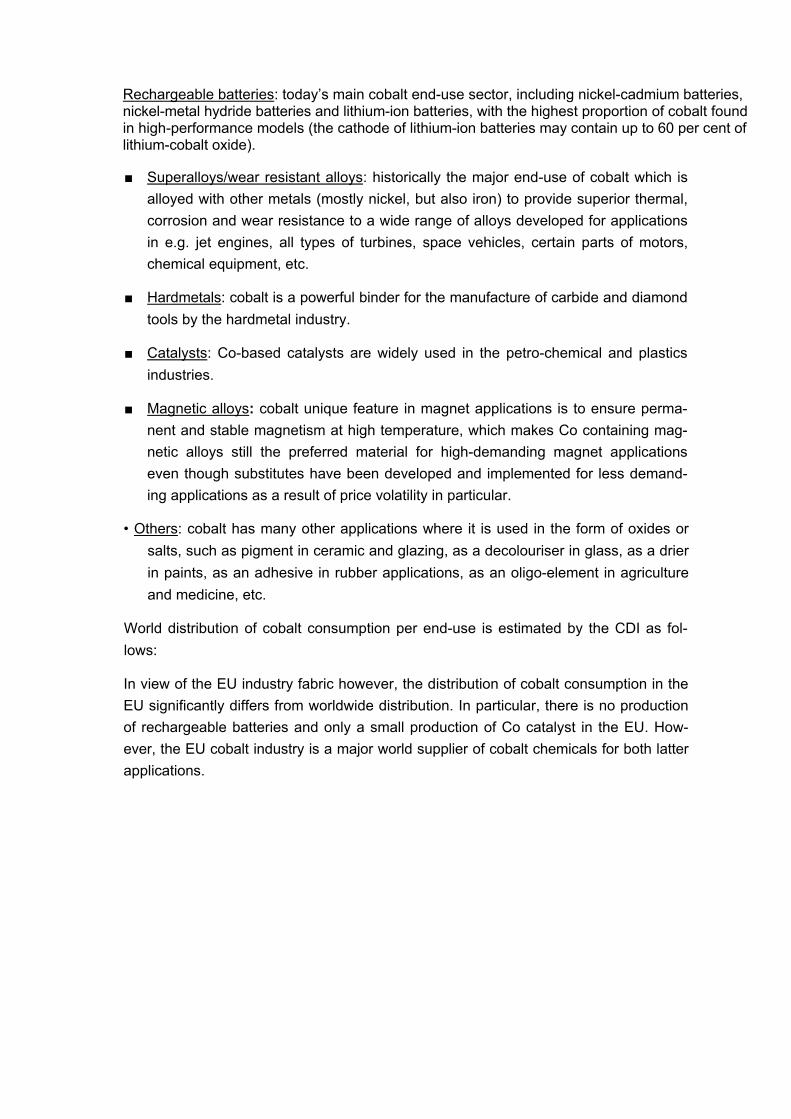
World distribution of cobalt consumption per end-use is estimated by the CDI as fol-lows:
In view of the EU industry fabric however, the distribution of cobalt consumption in the EU significantly differs from worldwide distribution. In particular, there is no production of rechargeable batteries and only a small production of Co catalyst in the EU. How-ever, the EU cobalt industry is a major world supplier of cobalt chemicals for both latter applications.
Source: Eurometaux
Future consumption will be affected by two major developments:
■ the growth of use sectors in Asia will shift market demand for cobalt products to-wards these regions (e.g. rechargeable batteries production is already concen-trated in Asia) and will therefore require high export competitiveness from the EU cobalt industry,
■ the growth of chemical applications will result in an increased demand for Co chemicals, in particular for Co-based catalysts (e.g. for gas-to-liquid technology for the processing of natural gas into synthetic diesel fuel for instance), and for re-chargeable batteries whose fast growth of production is likely to offset some substi-tution of cobalt by other metals (manganese and nickel).
Both trends will require from the EU cobalt industry a continued and improved competi-tiveness on export as export outlets will become even more important for the EU cobalt enterprises than it is at the present time.
Competitiveness and level playing-field in access to raw materials will in this respect remain a key factor to secure such competitiveness on export.
Recycling and substitution
Recycling of cobalt has developed naturally for economic reasons (price volatility, cost benefits) and because of the geopolitical structure of supply (historical predominance of Central African countries). Recycling of alloy and hardmetal scrap is generally operated by and within the superalloy and metal carbide sectors and cobalt is recovered, in fact, in alloyed or mixed form. Some recovered hardmetal materials are recycled, however, through the cobalt industry route. Recycling of catalysts and batteries is also done via the cobalt industry. These end-of-life products are an increasingly important source of cobalt supply for the EU cobalt industry in particular. Cobalt recycling from applications in pigments, glass, paints, etc is not possible as these usages are dissipative.
The End of Life Recycling Rate (EOL-RR) of cobalt is estimated at 68% by UNEP (higher than for most other metals), and the Recycled Content (RC) rate is estimated at 32% (lower than most other metals).
Substitutes for cobalt are constantly being sought mainly because of the metal price volatility. However, due to the unique properties of cobalt, there are limited options for substitution and almost all substitutes result in reduced product performance. So far, substitution has mostly affected the magnet applications but substitution in battery ap-plications is gearing up.
Specific issues
On the supply side, the EU cobalt industry is sourcing all of its primary cobalt feed from outside the Community, with a strong reliance on African producers as regards ores and metal. It meets increasing competition from Chinese cobalt producers which are also out on the market for feed supplies, focusing on African sources. These producers derive a purchasing edge (they can overprice the raw materials they need) from their operating conditions in China (low financial costs linked to State support, low compli-ance with EHS legislation, etc) and generally take advantage of lower ethics in secur-ing supply from “grey” channels. Terms of competition are therefore not “equal” and this is a serious cause for concern in view of the size of the Chinese cobalt industry and its rate of development under State incentive policies.
Cobalt containing materials for recycling (from industrial processes or end-of-life prod-ucts) are complementing EU cobalt industry’s primary feed supplies in increasing pro-portions and are purchased from both EU and international market. There is, however, a growing concern about the deterioration of terms of competition for these materials as well, due to the behaviour of Chinese producers encouraged by above mentioned policies.
On the demand side, the EU cobalt industry has historically developed a world leader-ship as top ranking supplier of cobalt powders and chemicals, meeting more than 65% of global requirements in most end-use sectors for powders and chemicals. The EU market is the industry’s natural outlet but is significantly less important in size and product scope than the international market, in particular regarding certain applications such as catalysts and rechargeable batteries. Demand growth occurs outside the EU and competitiveness on the export market is essential to the development of the EU cobalt industry. It is increasingly confronted on this export market with Chinese compe-tition whose pricing policy is erratic and destructive of the normal price structure (prices for added value products are quoted below metal price).
Under these circumstances, securing a level playing-field in access to cobalt raw mate-rials is increasingly seen as a vital conditions for ensuring the future viability of the EU cobalt industry.
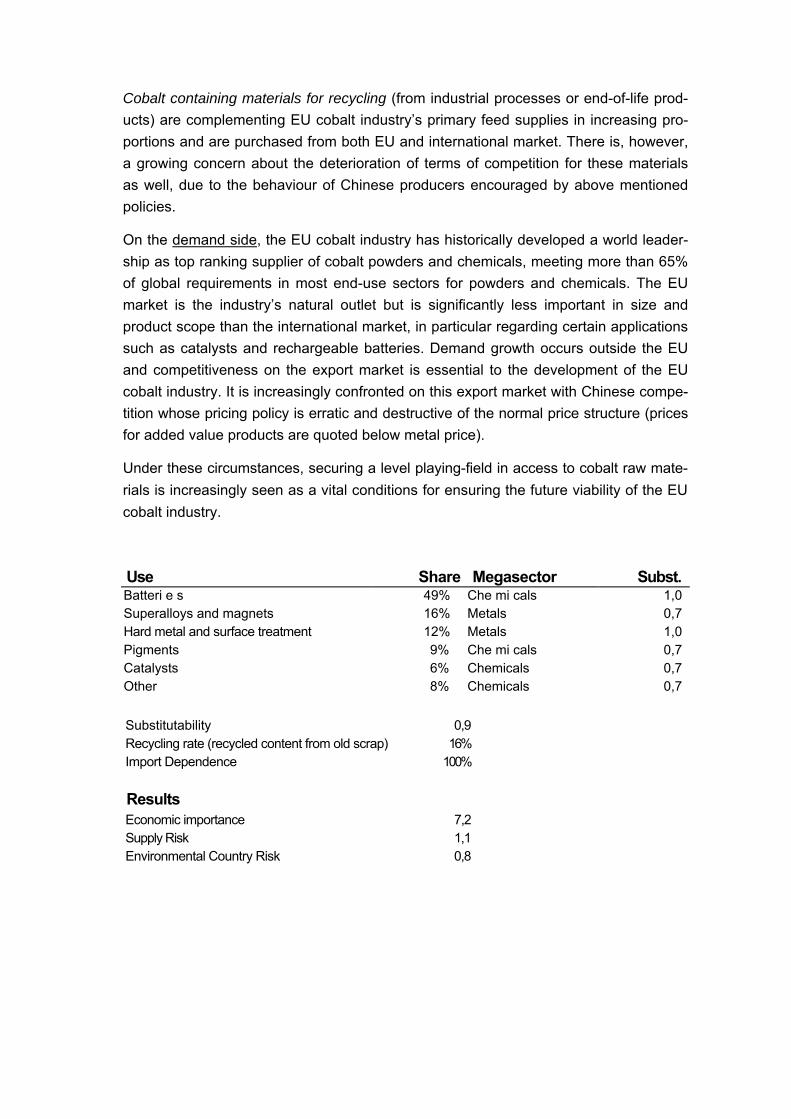
Use Share Megasector Subst.
Batteri e s 49% Che mi cals 1,0 Superalloys and magnets 16% Metals 0,7 Hard metal and surface treatment 12% Metals 1,0 Pigments 9% Che mi cals 0,7 Catalysts 6% Chemicals 0,7 Other 8% Chemicals 0,7
Substitutability 0,9 Recycling rate (recycled content from old scrap) 16% Import Dependence 100%
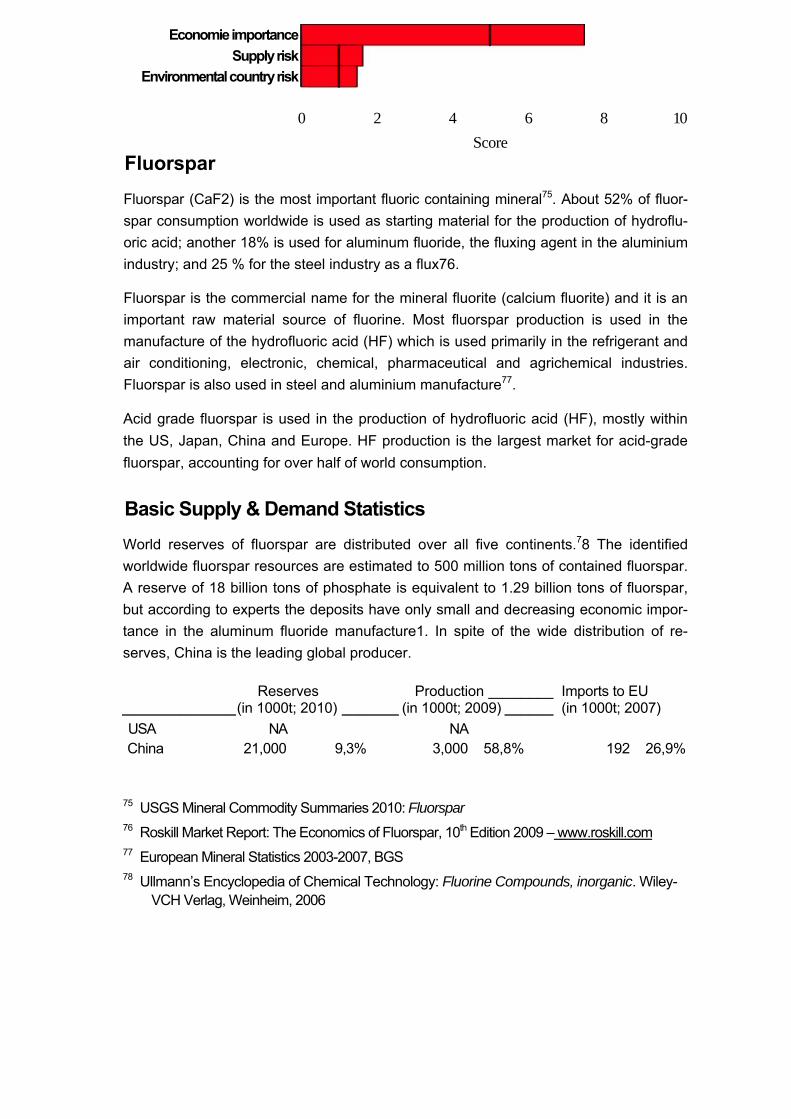
Results Economic importance 7,2 Supply Risk 1,1 Environmental Country Risk 0,8

10.000 9.000 8.000 7.000 6.000 5.000 4.000
3.000 2.000 1.000
0 -I—i—i—i—i—i—i—i—i—i—i—i—i—i—i—i—i—i—i—i—i—i—i—i—i—
Cobalt (HHI)
Source: World Mining Data, 2010
Economie importance Supply risk
Environmental country risk --------------------------------------------------- 1 ------------- 1 ------------- 1------------- 1 ------------- 1
0 2 4 6 8 10
Score
Fluorspar
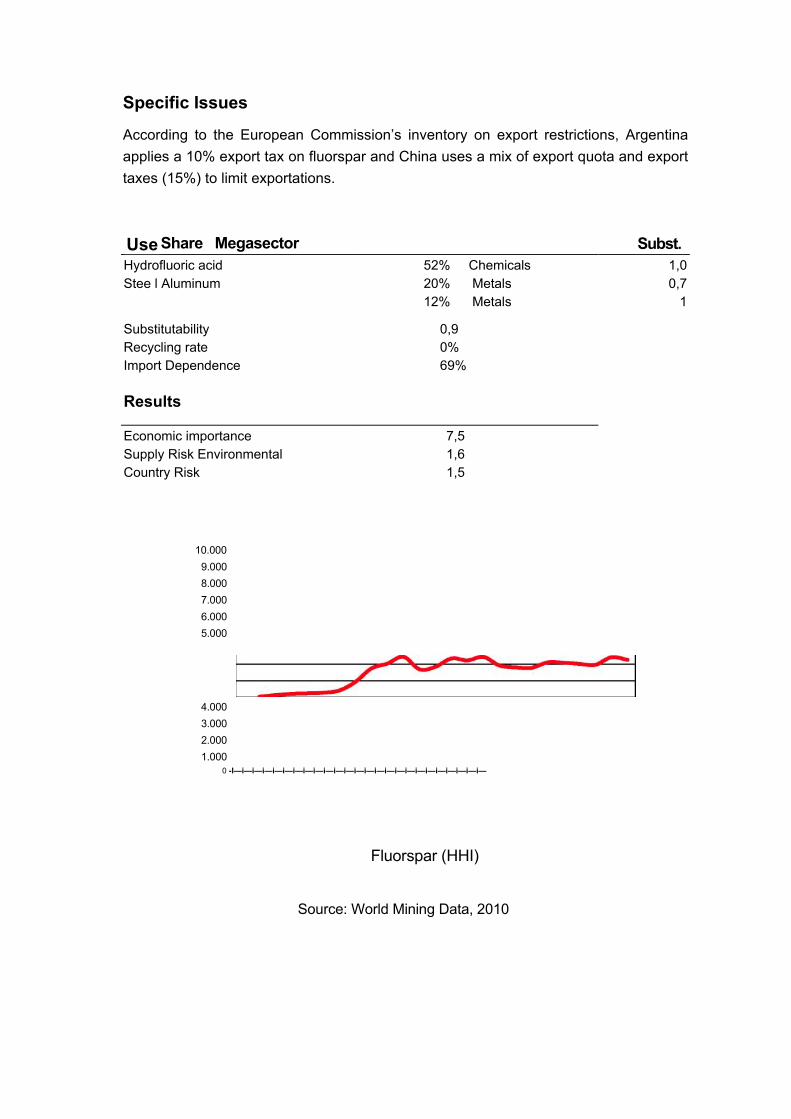
Fluorspar (CaF2) is the most important fluoric containing mineral75. About 52% of fluor-spar consumption worldwide is used as starting material for the production of hydroflu-oric acid; another 18% is used for aluminum fluoride, the fluxing agent in the aluminium industry; and 25 % for the steel industry as a flux76.
Fluorspar is the commercial name for the mineral fluorite (calcium fluorite) and it is an important raw material source of fluorine. Most fluorspar production is used in the manufacture of the hydrofluoric acid (HF) which is used primarily in the refrigerant and air conditioning, electronic, chemical, pharmaceutical and agrichemical industries. Fluorspar is also used in steel and aluminium manufacture77.
Acid grade fluorspar is used in the production of hydrofluoric acid (HF), mostly within the US, Japan, China and Europe. HF production is the largest market for acid-grade fluorspar, accounting for over half of world consumption.
Basic Supply & Demand Statistics
World reserves of fluorspar are distributed over all five continents.78 The identified worldwide fluorspar resources are estimated to 500 million tons of contained fluorspar. A reserve of 18 billion tons of phosphate is equivalent to 1.29 billion tons of fluorspar, but according to experts the deposits have only small and decreasing economic impor-tance in the aluminum fluoride manufacture1. In spite of the wide distribution of re-serves, China is the leading global producer.
Reserves Production ________ Imports to EU ______________ (in 1000t; 2010) _______ (in 1000t; 2009) ______ (in 1000t; 2007) USA NA NA China 21,000 9,3% 3,000 58,8% 192 26,9%
75 USGS Mineral Commodity Summaries 2010: Fluorspar 76 Roskill Market Report: The Economics of Fluorspar, 10th Edition 2009 – www.roskill.com 77 European Mineral Statistics 2003-2007, BGS 78 Ullmann’s Encyclopedia of Chemical Technology: Fluorine Compounds, inorganic. Wiley-
VCH Verlag, Weinheim, 2006
Kenya 2,000 0,9% 45 0,9% 44 6,1%Mexico 32,000 14,1% 925 18,1% 170 23,8%Mongolia 12,000 5,3% 280 5,5% 1.6 0,2%Morocco NA 40 0,8% 13.9 2,0%Namibia 3,000 1,3% 60 1,2% 112.6 15,7%Russia NA 210 4,1% South Africa 41,000 18,1% 180 3,5% 180.3 25,2%Spain 6,000 2,6% 110 2,2% others 110,000 48,5% 250 4,9% Total 227,000 5,100 715
Source: USGS 2010; trade data provided by BGS based on EU comtrade (HS 252921and HS252922)
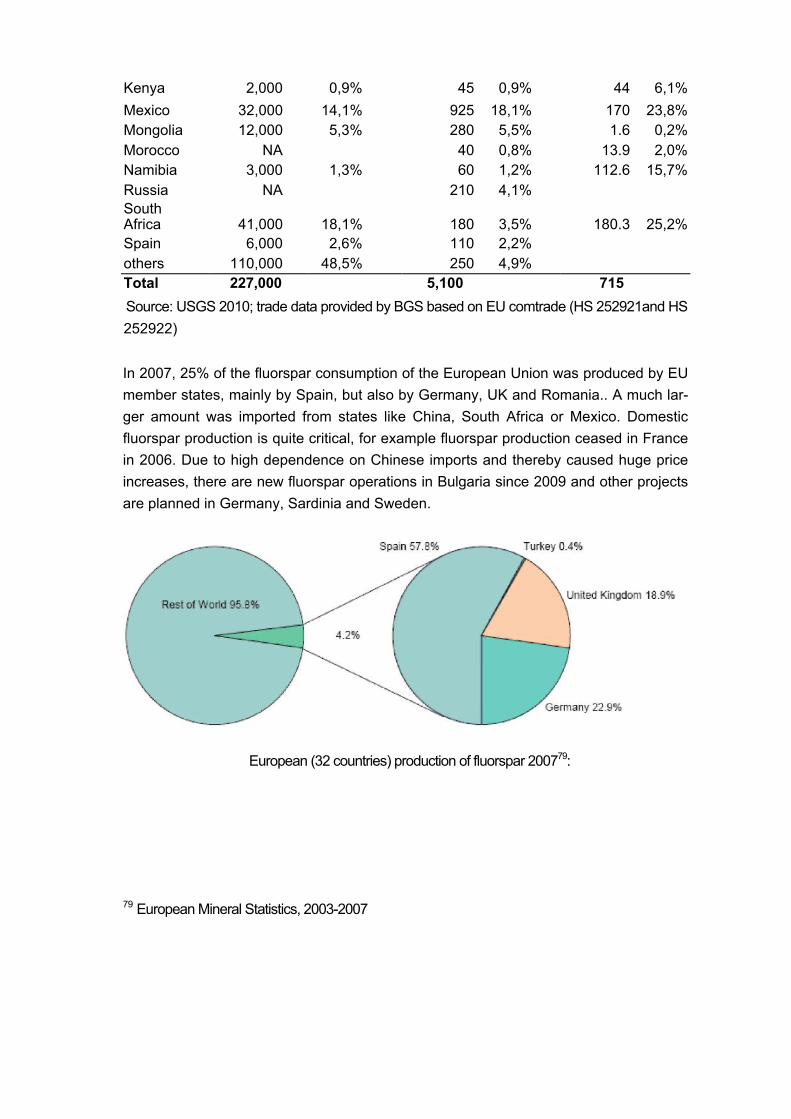
In 2007, 25% of the fluorspar consumption of the European Union was produced by EU member states, mainly by Spain, but also by Germany, UK and Romania.. A much lar-ger amount was imported from states like China, South Africa or Mexico. Domestic fluorspar production is quite critical, for example fluorspar production ceased in France in 2006. Due to high dependence on Chinese imports and thereby caused huge price increases, there are new fluorspar operations in Bulgaria since 2009 and other projects are planned in Germany, Sardinia and Sweden.
European (32 countries) production of fluorspar 200779:
79 European Mineral Statistics, 2003-2007
Economic Importance
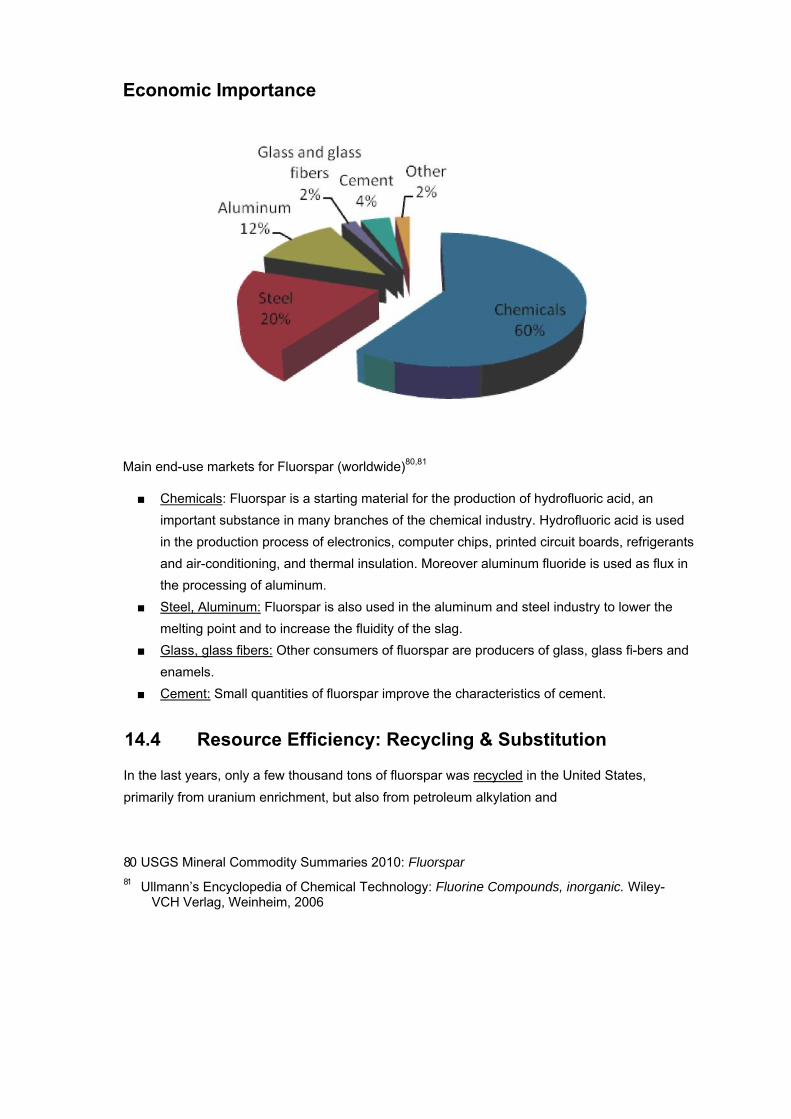
Main end-use markets for Fluorspar (worldwide)80,81
■ Chemicals: Fluorspar is a starting material for the production of hydrofluoric acid, an important substance in many branches of the chemical industry. Hydrofluoric acid is used in the production process of electronics, computer chips, printed circuit boards, refrigerants and air-conditioning, and thermal insulation. Moreover aluminum fluoride is used as flux in the processing of aluminum.
■ Steel, Aluminum: Fluorspar is also used in the aluminum and steel industry to lower the melting point and to increase the fluidity of the slag.
■ Glass, glass fibers: Other consumers of fluorspar are producers of glass, glass fi-bers and enamels.
■ Cement: Small quantities of fluorspar improve the characteristics of cement.
14.4 Resource Efficiency: Recycling & Substitution
In the last years, only a few thousand tons of fluorspar was recycled in the United States, primarily from uranium enrichment, but also from petroleum alkylation and
80 USGS Mineral Commodity Summaries 2010: Fluorspar 81 Ullmann’s Encyclopedia of Chemical Technology: Fluorine Compounds, inorganic. Wiley-
VCH Verlag, Weinheim, 2006
stainless steel pickling82. Compared to the total amount used, this is a very low per-centage. Experts speak of less than 1% in the European Union and there is no increas-ing recycling potential conceivable.
Primary aluminium producers recycle HF and fluorides from smelting operations. HF is recycled in the petroleum alkylation process.83
Substitution possibilities are limited, only fluorosilicic acid from phosphate manufacture is used for aluminum fluoride9.
Aluminium smelting dross, borax, calcium chloride, iron oxides, manganese ore, silica sand and titanium dioxide have been used as substitutes for fluorspar fluxes.
By-product fluorosilicic acid from phosphoric acid production has been used as a sub-stitute in aluminium fluoride production and also has the potential to be used as a sub-stitute in HF production10, but only some 15% is used from this source worldwide, and the use is diminishing. However the production process uses 5-6 times more energy than the fluorspar process84.
82 USGS Mineral Commodity Summaries 2010: Fluorspar 83 USGS Mineral Commodity Summaries 2009: Fluorspar 84 EU BREF Large Volume Inorganic Chemicals -
ftp://ftp.jrc.es/pub/eippcb/doc/lvic_bref_0907.pdf
Specific Issues
According to the European Commission’s inventory on export restrictions, Argentina applies a 10% export tax on fluorspar and China uses a mix of export quota and export taxes (15%) to limit exportations.
Share Megasector
Hydrofluoric acid Stee l Aluminum
52% Chemicals 20% Metals 12% Metals
1,00,7
1
Substitutability Recycling rate Import Dependence
0,9 0% 69%
Results
Economic importance Supply Risk Environmental Country Risk
7,5 1,6 1,5
10.000 9.000 8.000 7.000 6.000 5.000
4.000 3.000 2.000 1.000
0 -I—i—i—i—i—i—i—i—i—i—i—i—i—i—i—i—i—i—i—i—i—i—i—i—i—
Fluorspar (HHI)
Source: World Mining Data, 2010
Use Subst.
Economie importance Supply risk
Environmeritai country risk I -------------------------------------------------- 1 ------------- 1 ------------- 1------------- 1 ------------- 1
0 2 4 6 8 10
Score Gallium
Gallium is a silvery-white metal similar to aluminum, but with a low melting point (ap-proximately 30 °C). Gallium is mainly used as a compound with arsenic as gallium ar-senide (GaAs), which is important as a semiconducting material.85
Basic Supply & Demand Statistics
Gallium occurs in very small concentrations in ores of other metals. Most gallium is produced as a by-product of treating bauxite, and the remainder is produced from zinc-processing residues. Only part of the gallium present in bauxite and zinc ores is recov-erable, and the factors controlling the recovery are proprietary. Therefore, an estimate of current reserves that is comparable to the definition of reserves of other minerals cannot be made. The world bauxite reserve base is so large that much of it will not be mined for many decades; hence, most of the gallium in the bauxite reserve base can-not be considered to be available in the short term.86
In many gallium containing minerals the amount of gallium is too low to be of economi-cal interest. The concentration of gallium in bauxite ranges between 0.003 and 0.008%, making it uneconomical to mine bauxite for its gallium content.1
In 2009, world primary production was estimated to be 78 metric tons, 30% lower than the revised 2008 world primary production of 111 tons. China, Germany, Kazakhstan, and Ukraine were the leading producers; countries with smaller output were Hungary, Japan, Russia, and Slovakia. Refined gallium production was estimated to be about 118 tons; this figure includes some scrap refining. China, Japan, and the United States were the principal producers of refined gallium. Gallium was recycled from new scrap in Germany, Japan, the United Kingdom, and the United States.
85 Ullmann’s Encyclopedia of Chemical Technology: Gallium and Gallium Compounds. Wiley- VCH Verlag, Weinheim, 2006
86 USGS Mineral Commodity Summaries 2009: Gallium
There were 60 known producers of gallium in 18 countries for 2003.87 17 companies in seven EU32-countries (Czech Republic [1], France [4], Germany [5], Hungary [2], Nor-way [1], Slovakia [1], UK [3]) are named and nearly all produce gallium metal.
Although fairly widespread in the earth’s crust, gallium never occurs in workable con-centrations. It is occasionally found in zinc ores and bauxite in quite small contents. A further source of gallium is fly ash from the combustion of coal. The content is reported to amount to 1.5%.3 Phosphate contains traces of gallium, too.88
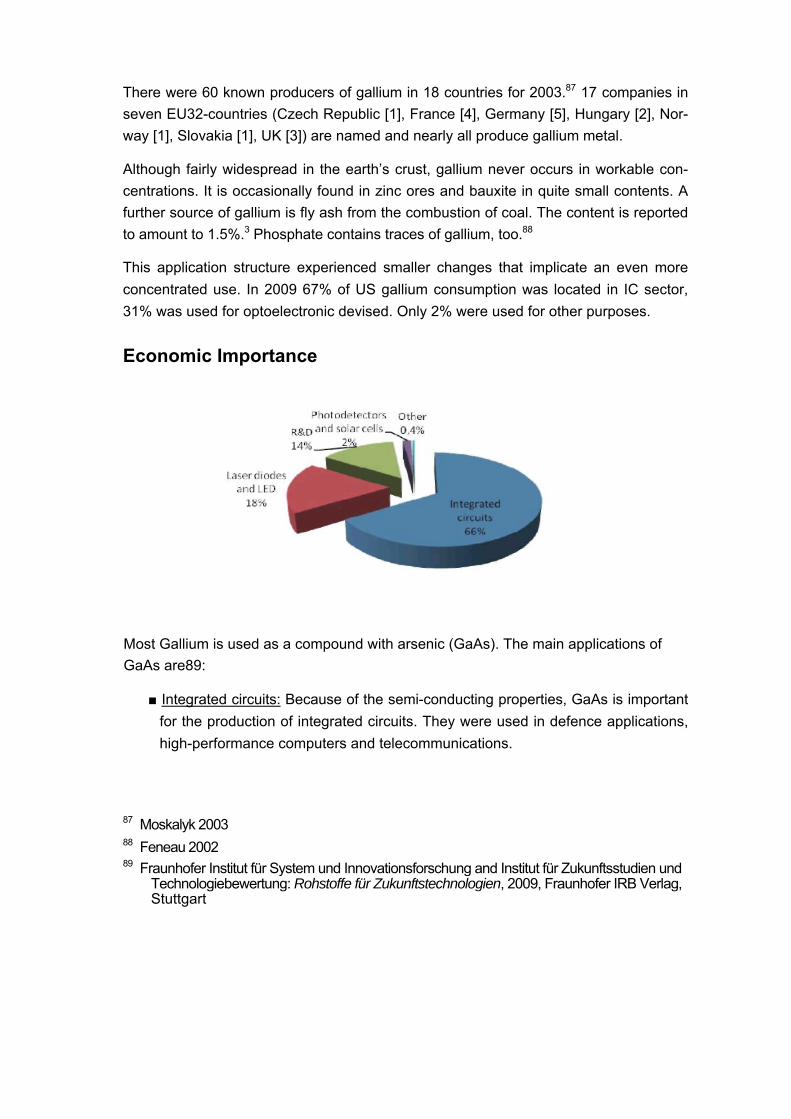
This application structure experienced smaller changes that implicate an even more concentrated use. In 2009 67% of US gallium consumption was located in IC sector, 31% was used for optoelectronic devised. Only 2% were used for other purposes.
Economic Importance
Most Gallium is used as a compound with arsenic (GaAs). The main applications of GaAs are89:
■ Integrated circuits: Because of the semi-conducting properties, GaAs is important for the production of integrated circuits. They were used in defence applications, high-performance computers and telecommunications.
87 Moskalyk 2003 88 Feneau 2002 89 Fraunhofer Institut für System und Innovationsforschung and Institut für Zukunftsstudien und
Technologiebewertung: Rohstoffe für Zukunftstechnologien, 2009, Fraunhofer IRB Verlag, Stuttgart
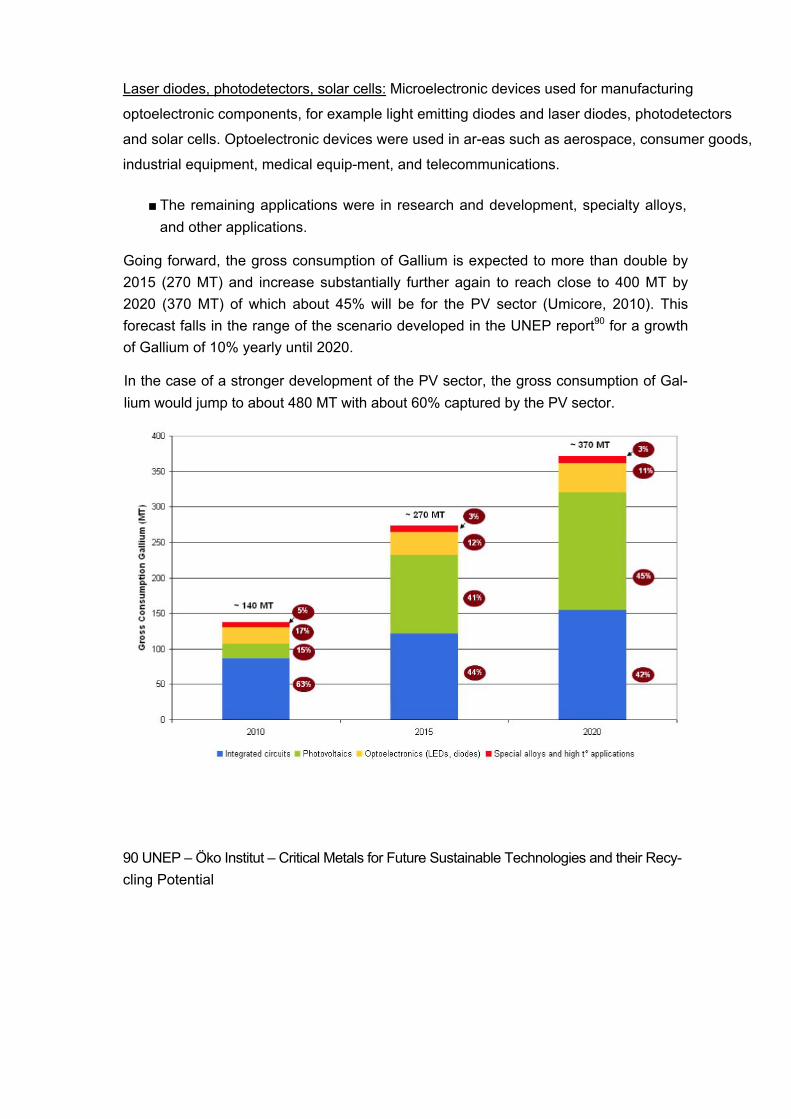
Laser diodes, photodetectors, solar cells: Microelectronic devices used for manufacturing
optoelectronic components, for example light emitting diodes and laser diodes, photodetectors
and solar cells. Optoelectronic devices were used in ar-eas such as aerospace, consumer goods,
industrial equipment, medical equip-ment, and telecommunications.
■ The remaining applications were in research and development, specialty alloys, and other applications.
Going forward, the gross consumption of Gallium is expected to more than double by 2015 (270 MT) and increase substantially further again to reach close to 400 MT by 2020 (370 MT) of which about 45% will be for the PV sector (Umicore, 2010). This forecast falls in the range of the scenario developed in the UNEP report90 for a growth of Gallium of 10% yearly until 2020.
In the case of a stronger development of the PV sector, the gross consumption of Gal-lium would jump to about 480 MT with about 60% captured by the PV sector.
90 UNEP – Öko Institut – Critical Metals for Future Sustainable Technologies and their Recy-cling Potential
Resource Efficiency: Recycling & Substitution
Recycling
Temporarily Gallium is not recycled from old scrap. There is hardly any old scrap yet available. Substantial quantities of new scrap generated in the manufacture of GaAs-base devices are reprocessed91.
Substitution
Liquid crystals made from organic compounds are used in visual displays as substi-tutes for LEDs. Researchers also are working to develop organic-based LEDs that may compete with GaAs in the future.
Indium phosphide components can be substituted for GaAs-based infrared laser diodes in some specific-wavelength applications, and GaAs competes with helium-neon lasers in visible laser diode applications.
Silicon is the principal competitor with GaAs in solar cell applications.
GaAs-based ICs are used in many defense-related applications because of their unique properties, and there are no effective substitutes for GaAs in these applications. GaAs in heterojunction bipolar transistors is being challenged in some applications by silicon-germanium.7
Specific Issues
According to the EU Commission’s inventory on export restrictions, South Africa resorts to non-automatic export licensing to limit the quantities of metal exported (incl. waste and scrap). China uses a mix of export quota and export taxes (5%). Russia applies a 6.5% export tax on gallium waste and scrap.
Supply and demand seem to balance today on EU level but it is not certain that future EU needs could be met considering that 40 to 50% of produced Gallium will result from recycling in the future and that most of the recycling could take place mostly in Japan. In order to ensure that the EU industry is self sustaining in the future, it will be neces-sary to retain gallium-containing scrap and favour recycling processes.
91 USGS Mineral Commodity Summaries 2009: Gallium

Economie importance Supply risk
Environmeritai country risk
Germanium
Germanium is a very brittle, grey-white shining semiconducting element, which shows volumetric expansion during solidification.92 Historically it played an important roll in the development of transistors. Today it is replaced by cheaper silicon in this sector on a large scale. Nonetheless, there are a variety of other high-tech products using germanium. 93
Basic Supply & Demand Statistic
Germanium can be recovered form minerals like germanite, renierite or argyrodite and also from coal ashes produced in power plants. Germanium today is nearly exclusively produced as a by-product of other metal mining. This includes the extraction of copper, lead or zinc. Traded germanium is mostly enriched in refineries.2
Reserves Production EU imports (in t; 2010) (in t; 2009) (in t; 2007)
USA 450 4.6 3,3% 5.8 18,6%
China NA 100 71,6% 22.5 72,3% Hong Kong NA 2.2 7,1% South Korea NA 0.2 0,6% Japan NA 0.2 0,6% Singapore NA 0.2 0,6% Russia NA 5 3,6% others NA 30 21,5% Total NA 139.6 31.1 Source: USGS 2010; trade data from ComExt (CN 8112 92 95).
92 Römpp Online: Germanium. Georg Thieme Verlag, Stuttgart, 2007 93 Ullmann’s Encyclopedia of Chemical Technology: Germanium and Germanium Compounds.
Wiley-VCH Verlag, Weinheim, 2006
Germanium reserves are associated with zinc and zinc-lead-copper sulfide ores.94 There is no quantitative data available concerning germanium resources.
Germanium raw material is not recovered within the European Union, though imported ores are refined and germanium metal is exported95. The main import source for the EU is China.
There are 24 known producers of germanium in 10 countries. Moskalyk names seven companies in five EU32-countries (Belgium [1], France [1], Germany [3], Spain [1], UK [1]). Four of them exclusively produce germanium metal while two produce germanium metal as well as germanium dioxide. One producer solely produces germanium diox-ide. Special production figures are not available.
Economic Importance
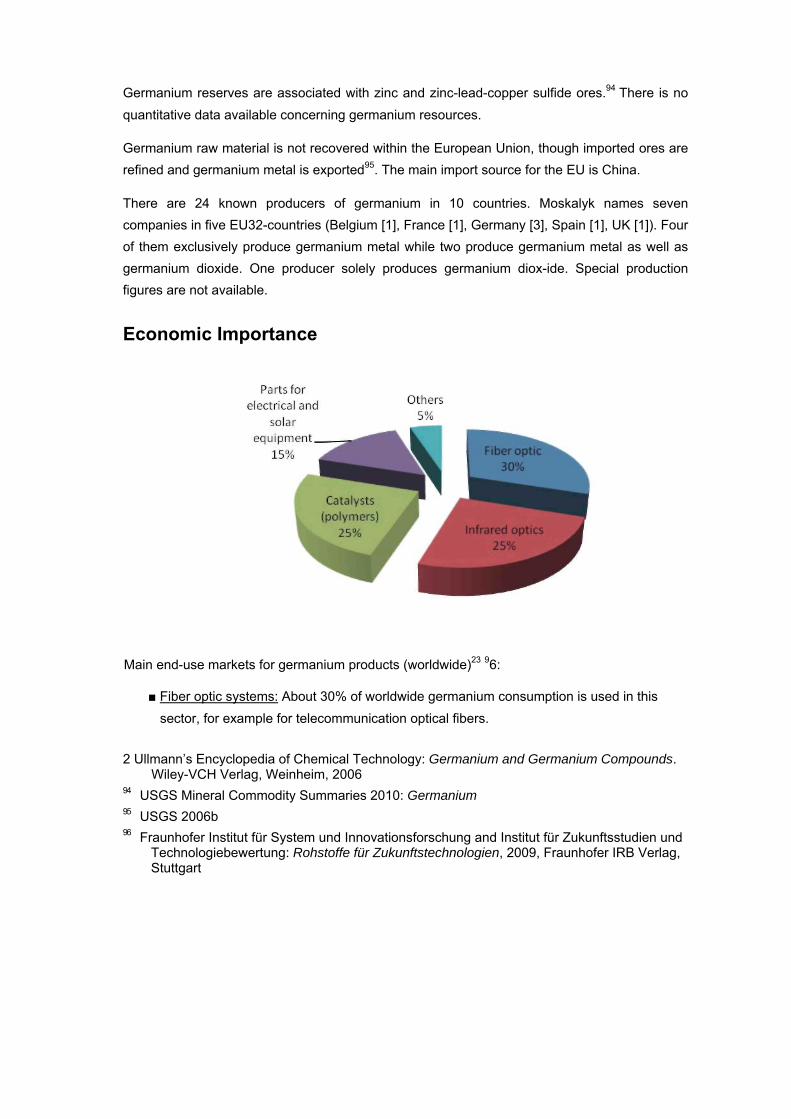
Main end-use markets for germanium products (worldwide)23 96:
■ Fiber optic systems: About 30% of worldwide germanium consumption is used in this sector, for example for telecommunication optical fibers.
2 Ullmann’s Encyclopedia of Chemical Technology: Germanium and Germanium Compounds. Wiley-VCH Verlag, Weinheim, 2006
94 USGS Mineral Commodity Summaries 2010: Germanium 95 USGS 2006b 96 Fraunhofer Institut für System und Innovationsforschung and Institut für Zukunftsstudien und
Technologiebewertung: Rohstoffe für Zukunftstechnologien, 2009, Fraunhofer IRB Verlag, Stuttgart
Infrared optics: 25% of produced germanium is used for high quality lenses and window material for infrared applications.
■ Polymerisation catalysts: Germanium is an important catalyst in the production of polyesters and synthetic textile fibers (also 25%).
■ Parts for electrical and solar equipment: 15% are used for electric and solar elec-tric applications (solar cells, LEDs, photodetectors...)
■ Other: Minor applications (5%) are in metallurgy and medicine.
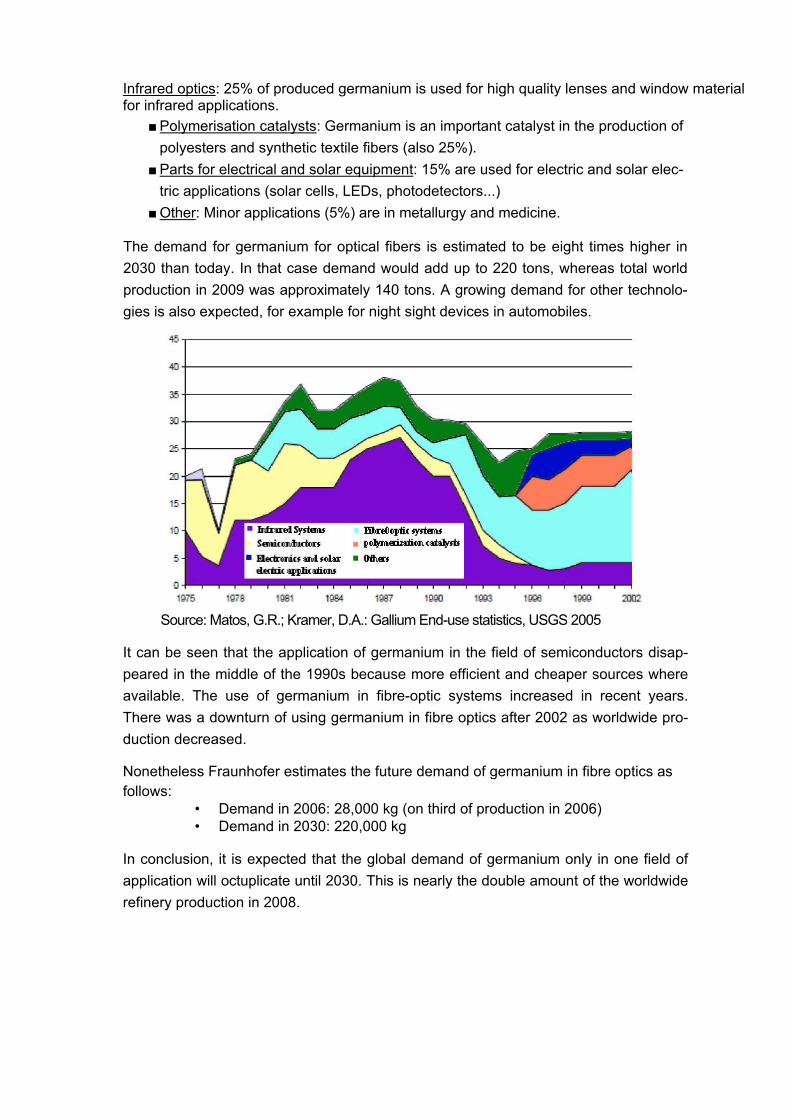
The demand for germanium for optical fibers is estimated to be eight times higher in 2030 than today. In that case demand would add up to 220 tons, whereas total world production in 2009 was approximately 140 tons. A growing demand for other technolo-gies is also expected, for example for night sight devices in automobiles.
Source: Matos, G.R.; Kramer, D.A.: Gallium End-use statistics, USGS 2005
It can be seen that the application of germanium in the field of semiconductors disap-peared in the middle of the 1990s because more efficient and cheaper sources where available. The use of germanium in fibre-optic systems increased in recent years. There was a downturn of using germanium in fibre optics after 2002 as worldwide pro-duction decreased.
Nonetheless Fraunhofer estimates the future demand of germanium in fibre optics as follows:
• Demand in 2006: 28,000 kg (on third of production in 2006) • Demand in 2030: 220,000 kg
In conclusion, it is expected that the global demand of germanium only in one field of application will octuplicate until 2030. This is nearly the double amount of the worldwide refinery production in 2008.
Resource Efficiency: Recycling & Substitution
Worldwide, about 30% of the total germanium consumed is produced from recycled materials.
During the manufacture of most optical devices, more than 60% of the germanium metal used is routinely recycled as new scrap. Germanium scrap was also recovered from the window blanks in decommissioned tanks and other military vehicles. In the European Union, recent technological advancements in the production of optical fibres has reduced, somewhat, the available supply of germanium scrap.97
The less expensive silicon can be a substitute in some electronic applications in the future, like it is in transistors today. Nevertheless germanium is still the most reliable material for high-frequency applications. Indeed it is even more economical for LEDs than most possible substitutes.
For infrared applications, zinc selenide and germanium glass are suitable if a loss in performance is acceptable.
Titanium might be a potential catalyst for polymerisation.6
Specific Issues
According to the EU Commission’s inventory on export restrictions, Algeria resorts to non-automatic export licensing to limit the quantities of germanium waste and scrap exported. Russia applies a 6.5% export tax.
97 USGS Mineral Commodity Summaries 2009: Germanium
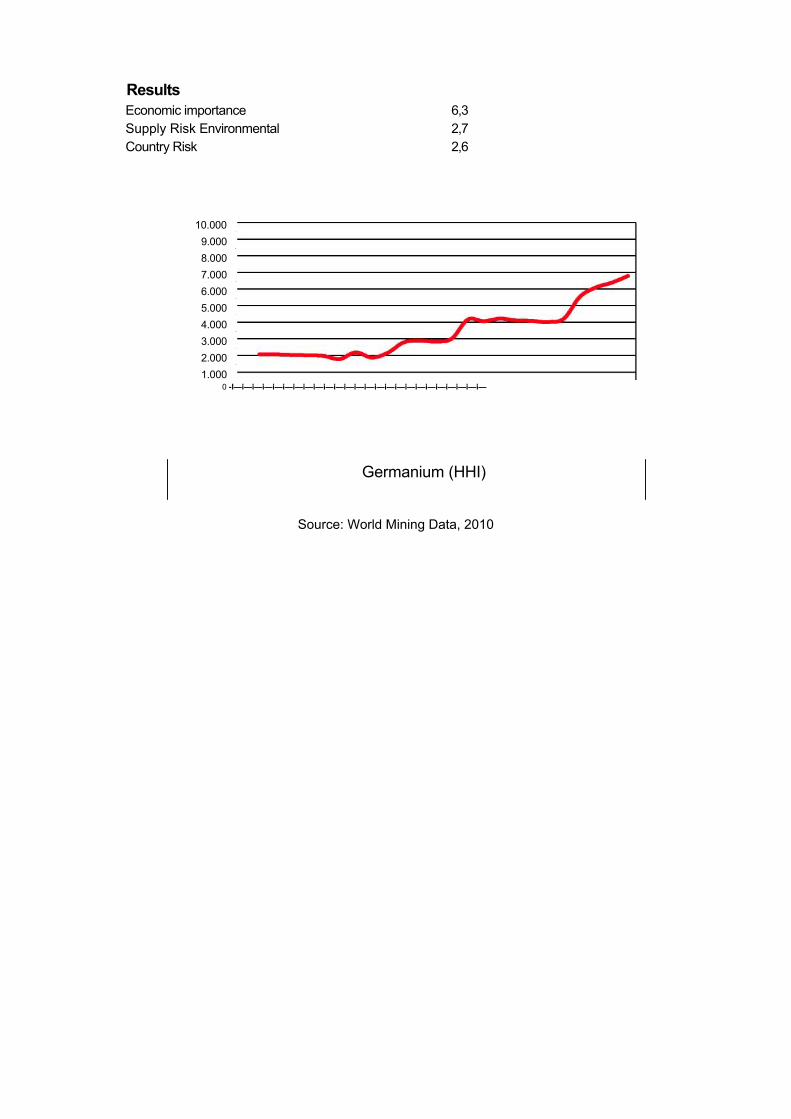
Results Economic importance Supply Risk Environmental Country Risk
6,3 2,7 2,6
10.000 9.000 8.000 7.000 6.000 5.000 4.000 3.000 2.000 1.000
0 -I—i—i—i—i—i—i—i—i—i—i—i—i—i—i—i—i—i—i—i—i—i—i—i—i—
Germanium (HHI)
Source: World Mining Data, 2010
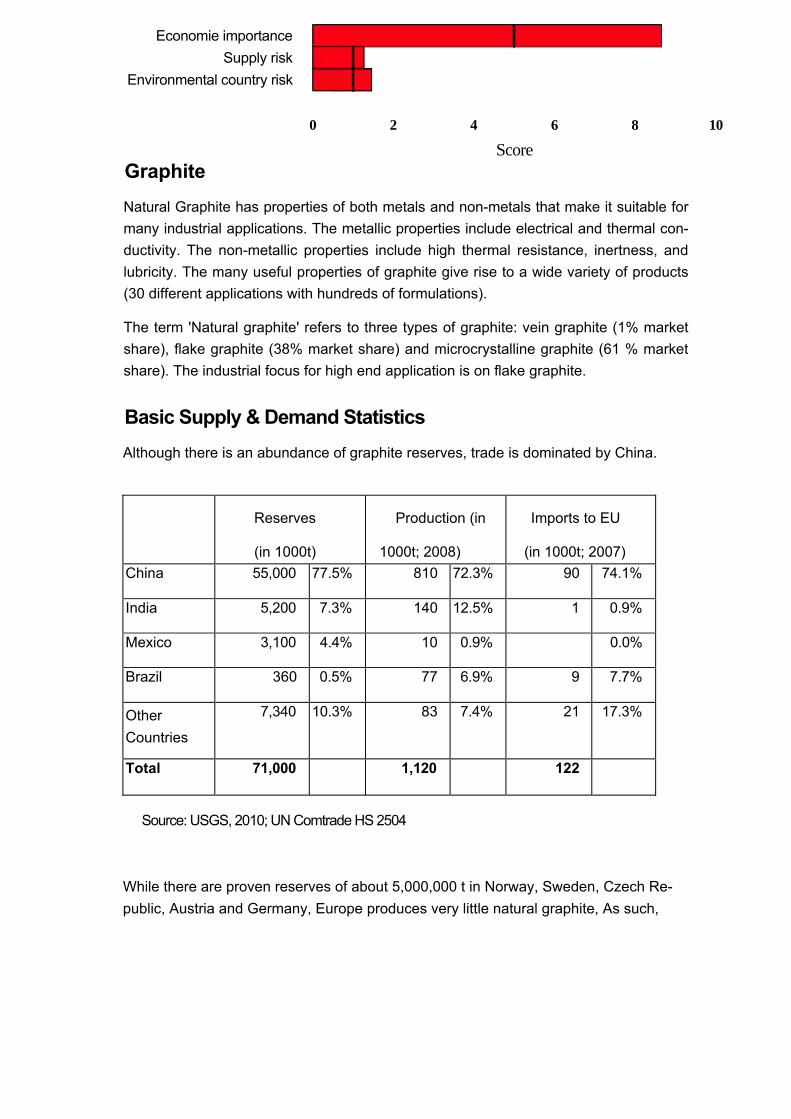
Economie importance Supply risk
Environmental country risk
I -------------- 1 -------------- 1 -------------- 1 -------------- 1 -------------- 1 0 2 4 6 8 10
Score
Graphite
Natural Graphite has properties of both metals and non-metals that make it suitable for many industrial applications. The metallic properties include electrical and thermal con-ductivity. The non-metallic properties include high thermal resistance, inertness, and lubricity. The many useful properties of graphite give rise to a wide variety of products (30 different applications with hundreds of formulations).
The term 'Natural graphite' refers to three types of graphite: vein graphite (1% market share), flake graphite (38% market share) and microcrystalline graphite (61 % market share). The industrial focus for high end application is on flake graphite.
Basic Supply & Demand Statistics
Although there is an abundance of graphite reserves, trade is dominated by China.
Reserves
(in 1000t)
Production (in
1000t; 2008)
Imports to EU
(in 1000t; 2007) China 55,000 77.5% 810 72.3% 90 74.1%
India 5,200 7.3% 140 12.5% 1 0.9%
Mexico 3,100 4.4% 10 0.9% 0.0%
Brazil 360 0.5% 77 6.9% 9 7.7%
Other Countries
7,340 10.3% 83 7.4% 21 17.3%
Total 71,000 1,120 122
Source: USGS, 2010; UN Comtrade HS 2504
While there are proven reserves of about 5,000,000 t in Norway, Sweden, Czech Re-public, Austria and Germany, Europe produces very little natural graphite, As such,
import dependence is in the region of 95%. In terms of production evolution, world pro-duction of natural graphite amounted to 11,200,000 tonnes in 2008, up significantly from circa 7,500,000 tonnes in 1995.
Economic Importance
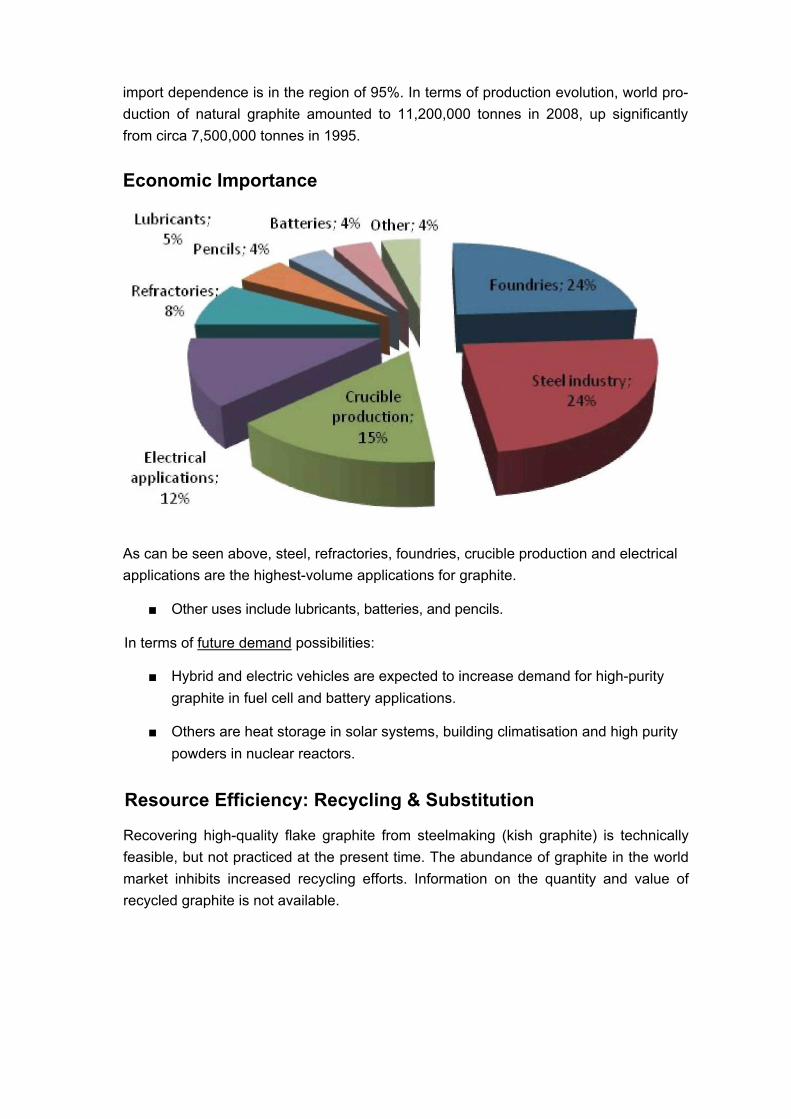
As can be seen above, steel, refractories, foundries, crucible production and electrical applications are the highest-volume applications for graphite.
■ Other uses include lubricants, batteries, and pencils.
In terms of future demand possibilities:
■ Hybrid and electric vehicles are expected to increase demand for high-purity graphite in fuel cell and battery applications.
■ Others are heat storage in solar systems, building climatisation and high purity powders in nuclear reactors.
Resource Efficiency: Recycling & Substitution
Recovering high-quality flake graphite from steelmaking (kish graphite) is technically feasible, but not practiced at the present time. The abundance of graphite in the world market inhibits increased recycling efforts. Information on the quantity and value of recycled graphite is not available.
Share Megasector
Foundries 24% Metals 0,7Steel industry 24% Metals 0,3Crucible production 15% Metals 0,7Electrical applications 12% Electronics & ICT 0,7Refractories 8% Mechanical Equipment 0,7Lubricants 5% Chemicals 0,3Pencils 4% Other Final Consumer Goods 0,3Batteries 4% Electronics & ICT 0,3Other 4% Other Final Consumer Goods 0,5
Substitutability 0,5
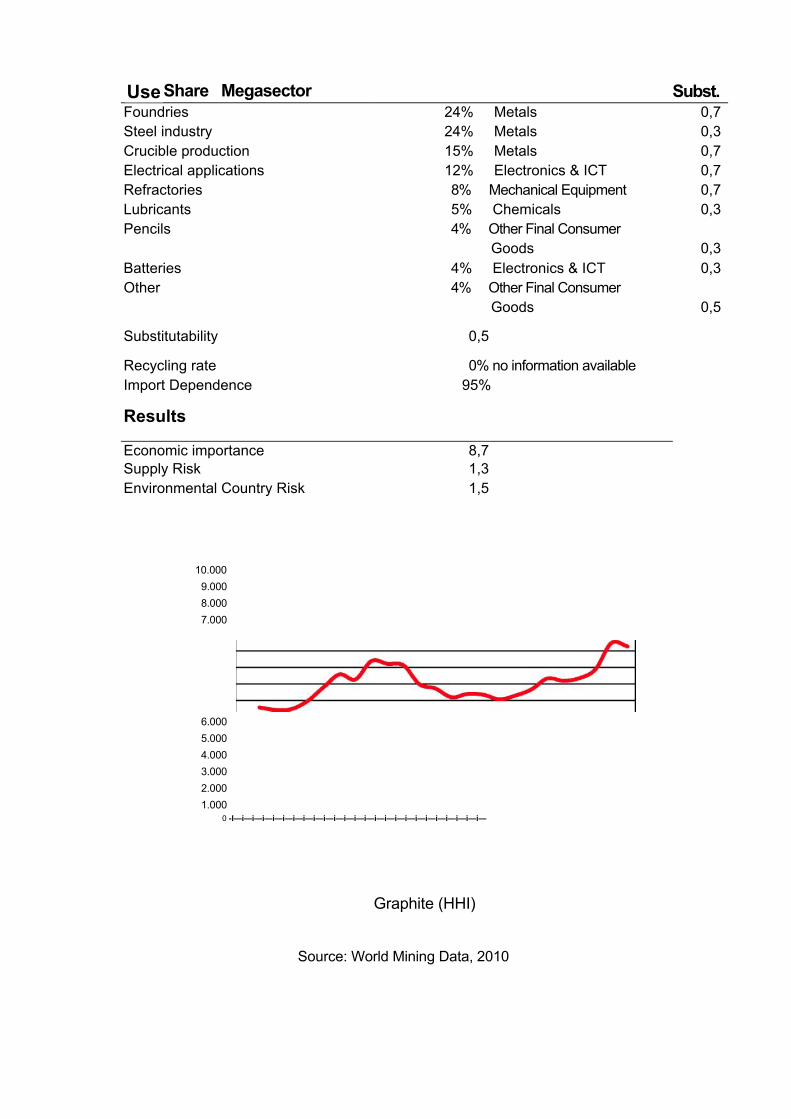
Recycling rate 0% no information available Import Dependence 95%
Results
Economic importance 8,7 Supply Risk 1,3 Environmental Country Risk 1,5
10.000 9.000 8.000 7.000
6.000 5.000 4.000 3.000 2.000 1.000
0 -I—i—i—i—i—i—i—i—i—i—i—i—i—i—i—i—i—i—i—i—i—i—i—i—i—
Graphite (HHI)
Source: World Mining Data, 2010
Use Subst.
Economie importance Supply risk
Environmeritai country risk I -------------- 1 ------------- 1 ------------- 1 ------------- 1 ------------- 1 0 2 4 6 8 10
Score Indium
Indium is a silvery-white, brightly shining heavy metal which is softer than lead.105 Indium forms alloys with most other metals and generally increases the strength, corro-sion resistance and hardness of the alloy system. 106 Indium tin oxide is both transpar-ent and conducting, which makes it essential for display applications.107
Basic Supply & Demand Statistics
Indium is widely spread, generally in low concentrations2. Most quantities are recov-ered from sphalerite, a lead-zinc-sulfide mineral. Therefore indium production is con-nected to lead-zinc production. 108
In 2007, indium reserves were estimated at only 6,000 tons, a figure which contributed to significant price increases. Since then, new deposits have been identified or have become economical, so that the range of reserves is not that critical today and prices dropped about 50%. Indeed, Indium Corporation has determined that indium reserves (proven and probable, measured and indicated, and inferred) in identified base metal mines in the world amounted to close to 50,000 MT of Indium (26,000 MT in western world, 23,000 in the rest i.e. mostly China and former Soviet Union).
Nevertheless indium is still quite expensive3.
As indium is a minor metal with no primary mining, the mining data for the host of indium are relevant here. In order to simplify these considerations and to provide rea-sonable overview, only the major hosts lead and zinc will be taken into account here.
• Lead: There were 12 EU32-countries contributing to world mine production in 2007. They totally produced 269,300 tones (metal content) of lead. This meant a total share of world production of around 7.5 per cent. In total, EU32 has to be considered to be a net-importer of lead.
105 Römpp Online: Indium. Georg Thieme Verlag, Stuttgart, 2006 106 Ullmann’s Encyclopedia of Chemical Technology: Indium and Indium Compounds. Wiley-
VCH Verlag, Weinheim, 2006 107 Materialwissenschaften: ”Engpässe bei Hightech-Metallen”
108 USGS Mineral Commodity Summaries 2009: Indium
• Zinc: There were 11 EU32-countries contributing to world mine production in 2007. They totally produced 945,000 tones (metal content) of zinc. This meant a total share of world production of around 8.6 per cent. In total, EU32 has to be considered to be a net-importer of zinc ore (BGS EMS 2008).109
Production EU imports (in t; 2008) (in t; 2006)
Belgium (1) 30 5,3%
Canada 50 8,8% China 330 58,1% 47,3 81,3% Japan (1) 60 10,6% 0,5 0,9% Korea 50 8,8% 0,0% Peru 6 1,1% 1,5 2,6% Russia 12 2,1% 1,6 2,7% Hong Kong 2,3 4,0% Norway 0,6 1,0% USA 2,2 3,8% Singapore 2,2 3,8% Switzerland others 30 5,3%
Total 568 58
Source: USGS 2010; trade data provided by ComExt (CN 8112 92 81) (1) Imports of lend and zinc
As Europe is import dependent on the hosts of indium, it can be stated that Europe is import-dependent on Indium, too. This observation will be amplified by the fact that Belgium seems to be the only European country active in refining indium metal.
There are two different reasons for these developments: • 30% of indium-containing base metal concentrates still do not reach “indium-
capable” smelters and this indium continues to be lost; • 70% of the indium-containing concentrates that do reach indium-capable smelt-
ers are only extracted at a final average rate of about 50%.
109 European Mineral Statistics 2008, BGS
Economic Importance
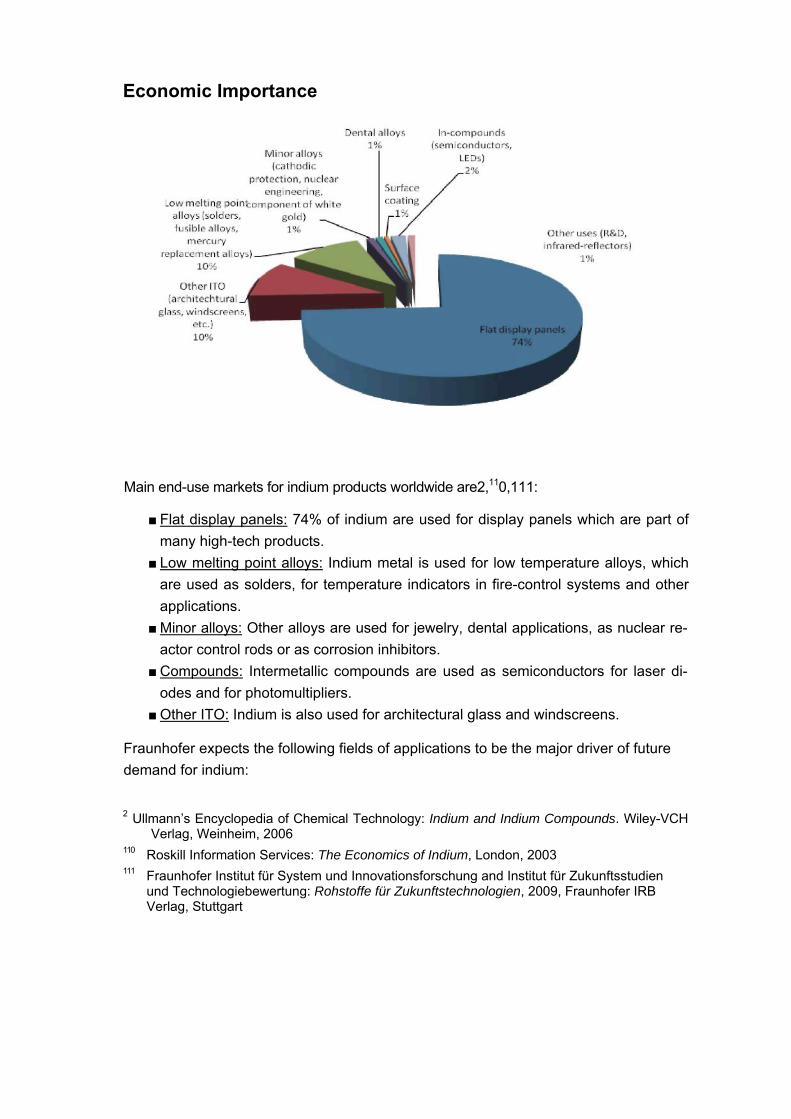
Main end-use markets for indium products worldwide are2,110,111:
■ Flat display panels: 74% of indium are used for display panels which are part of many high-tech products.
■ Low melting point alloys: Indium metal is used for low temperature alloys, which are used as solders, for temperature indicators in fire-control systems and other applications.
■ Minor alloys: Other alloys are used for jewelry, dental applications, as nuclear re-actor control rods or as corrosion inhibitors.
■ Compounds: Intermetallic compounds are used as semiconductors for laser di-odes and for photomultipliers.
■ Other ITO: Indium is also used for architectural glass and windscreens.
Fraunhofer expects the following fields of applications to be the major driver of future demand for indium:
2 Ullmann’s Encyclopedia of Chemical Technology: Indium and Indium Compounds. Wiley-VCH Verlag, Weinheim, 2006
110 Roskill Information Services: The Economics of Indium, London, 2003 111 Fraunhofer Institut für System und Innovationsforschung and Institut für Zukunftsstudien
und Technologiebewertung: Rohstoffe für Zukunftstechnologien, 2009, Fraunhofer IRB Verlag, Stuttgart
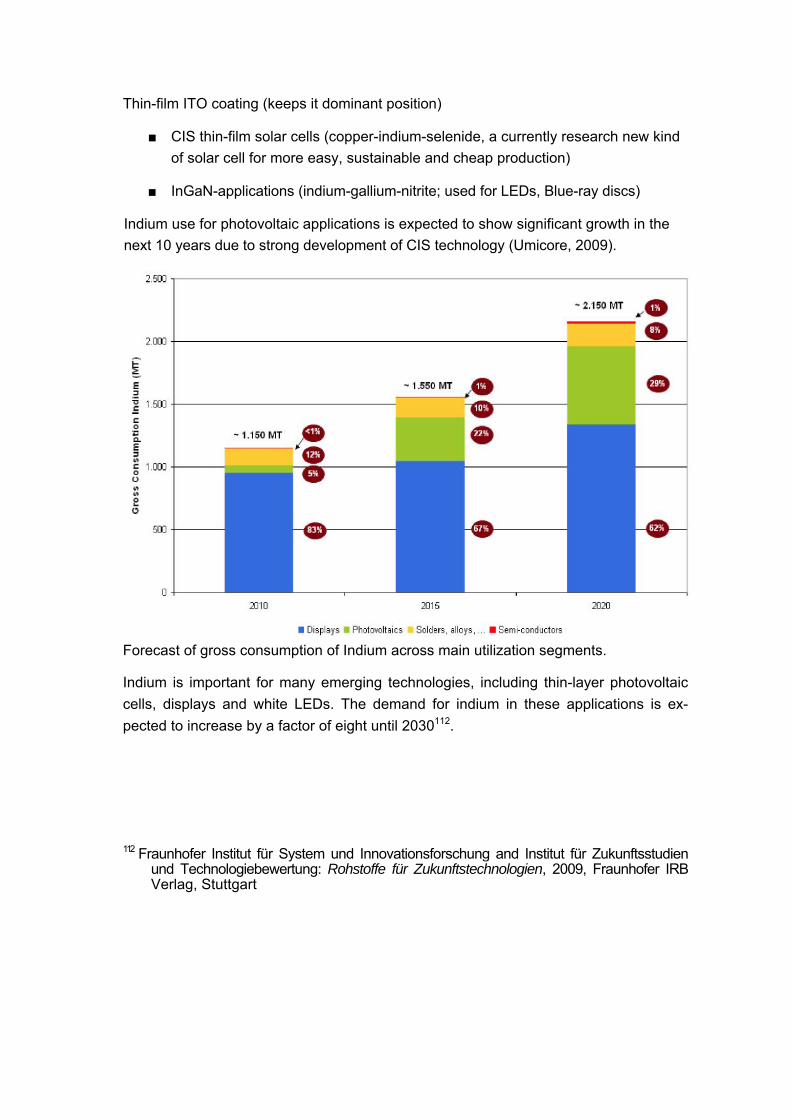
Thin-film ITO coating (keeps it dominant position)
■ CIS thin-film solar cells (copper-indium-selenide, a currently research new kind of solar cell for more easy, sustainable and cheap production)
■ InGaN-applications (indium-gallium-nitrite; used for LEDs, Blue-ray discs)
Indium use for photovoltaic applications is expected to show significant growth in the next 10 years due to strong development of CIS technology (Umicore, 2009).
Forecast of gross consumption of Indium across main utilization segments.
Indium is important for many emerging technologies, including thin-layer photovoltaic cells, displays and white LEDs. The demand for indium in these applications is ex-pected to increase by a factor of eight until 2030112.
112 Fraunhofer Institut für System und Innovationsforschung and Institut für Zukunftsstudien und Technologiebewertung: Rohstoffe für Zukunftstechnologien, 2009, Fraunhofer IRB Verlag, Stuttgart
Resource Efficiency: Recycling & Substitution
Recycling possibilities for indium are limited. Only very small quantities of indium are recycled from old scrap, in fact less than 1%, mainly from indium tin oxide (ITO) prod-ucts, such as scrap LCD panels. Nevertheless ITO recycling is highly inefficient113.
A number of smelters have accumulated large amounts of tailings and slags over the years and continue to do so. These indium-containing materials are more difficult and thus more expensive to treat. However, they can be treated if demand and price war-rants. A recent Indium Corporation study has identified that the total residue reserves worldwide amount to over 15,000mt of indium and that another 500 mt of indium is generated every year in residue form.
Indium Corporation therefore concludes that based on mining reserves (100 years at a rate of 500mt of virgin indium per year), plus residue reserves (30 years at a rate of 500mt per year), combined with continued improvements in recoveries of virgin and reclaimed materials, and on-going exploration, indium will be available for a long pe-riod of time.
Indium’s recent price volatilities and supply concerns made antimony tin oxides inter-esting as substitute for ITO in LCD panels. Carbon nanotube coatings are an alterna-tive to ITO coatings in flexible displays, solar cells and touch screens. There are some more substitutes for ITO depending on the application. Moreover indium can be re-placed by gallium arsenide in some semiconducting products and by hafnium in nu-clear reactor control rod alloys9.
Specific issues
According to the EU Commission’s inventory on export restrictions, China applies a combination of export quotas and export tax (5%), while Russia applies a 6.5% export tax. South Africa applies a non-automatic export licensing system. Tanzania has set up an export ban on indium.
Supply and demand seem to balance today on EU level but in order to ensure that the EU industry is self sustaining in the future, it will be necessary to retain indium-containing scrap, increase recovery (primary and secondary) and recycling / refining processes.
113 USGS Mineral Commodity Summaries 2009: Indium
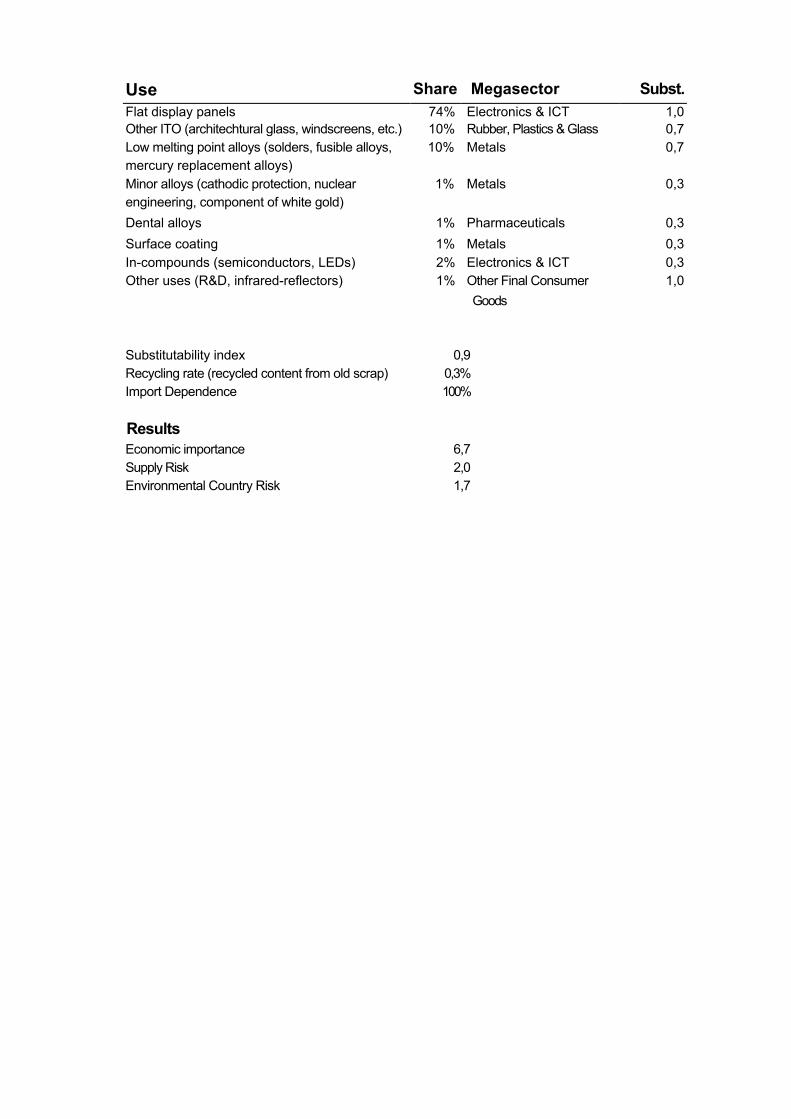
Use Share Megasector Subst.Flat display panels 74% Electronics & ICT 1,0Other ITO (architechtural glass, windscreens, etc.) 10% Rubber, Plastics & Glass 0,7Low melting point alloys (solders, fusible alloys, 10% Metals 0,7mercury replacement alloys) Minor alloys (cathodic protection, nuclear 1% Metals 0,3engineering, component of white gold) Dental alloys 1% Pharmaceuticals 0,3Surface coating 1% Metals 0,3In-compounds (semiconductors, LEDs) 2% Electronics & ICT 0,3Other uses (R&D, infrared-reflectors) 1% Other Final Consumer 1,0
Goods
Substitutability index 0,9 Recycling rate (recycled content from old scrap) 0,3% Import Dependence 100%
Results Economic importance 6,7 Supply Risk 2,0 Environmental Country Risk 1,7
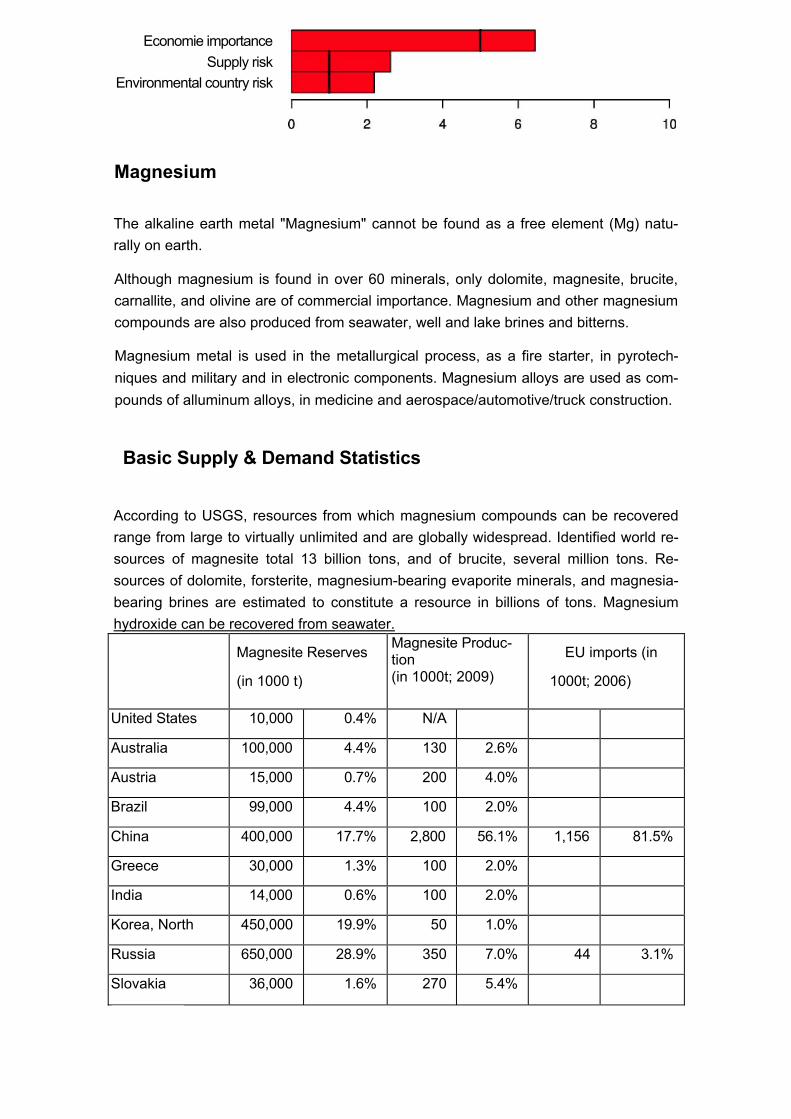
Economie importance Supply risk
Environmental country risk
The alkaline earth metal "Magnesium" cannot be found as a free element (Mg) natu-rally on earth.
Although magnesium is found in over 60 minerals, only dolomite, magnesite, brucite, carnallite, and olivine are of commercial importance. Magnesium and other magnesium compounds are also produced from seawater, well and lake brines and bitterns.
Magnesium metal is used in the metallurgical process, as a fire starter, in pyrotech-niques and military and in electronic components. Magnesium alloys are used as com-pounds of alluminum alloys, in medicine and aerospace/automotive/truck construction.
Basic Supply & Demand Statistics
According to USGS, resources from which magnesium compounds can be recovered range from large to virtually unlimited and are globally widespread. Identified world re-sources of magnesite total 13 billion tons, and of brucite, several million tons. Re-sources of dolomite, forsterite, magnesium-bearing evaporite minerals, and magnesia-bearing brines are estimated to constitute a resource in billions of tons. Magnesium hydroxide can be recovered from seawater.
Magnesite Reserves
(in 1000 t)
Magnesite Produc-tion (in 1000t; 2009)
EU imports (in
1000t; 2006)
United States 10,000 0.4% N/A
Australia 100,000 4.4% 130 2.6%
Austria 15,000 0.7% 200 4.0%
Brazil 99,000 4.4% 100 2.0%
China 400,000 17.7% 2,800 56.1% 1,156 81.5%
Greece 30,000 1.3% 100 2.0%
India 14,000 0.6% 100 2.0%
Korea, North 450,000 19.9% 50 1.0%
Russia 650,000 28.9% 350 7.0% 44 3.1%
Slovakia 36,000 1.6% 270 5.4%
Magnesium
Spain 10,000 0.4% 130 2.6%
Turkey 49,000 2.2% 600 12.0%
Other countries 390,000 17.3% 160 3.2% 218 15.4%
World total 2,253,000 30,190 1,418
Source: USGS; ComExt Data CN 8104 19 00; CN 8104 11 00
The figures above refer to magnesite production and not to magnesium metal. Produc-tion of later in 2009 is estimated at 570,000 tonnes, of which 470,000 was produced in China.
Economic Importance
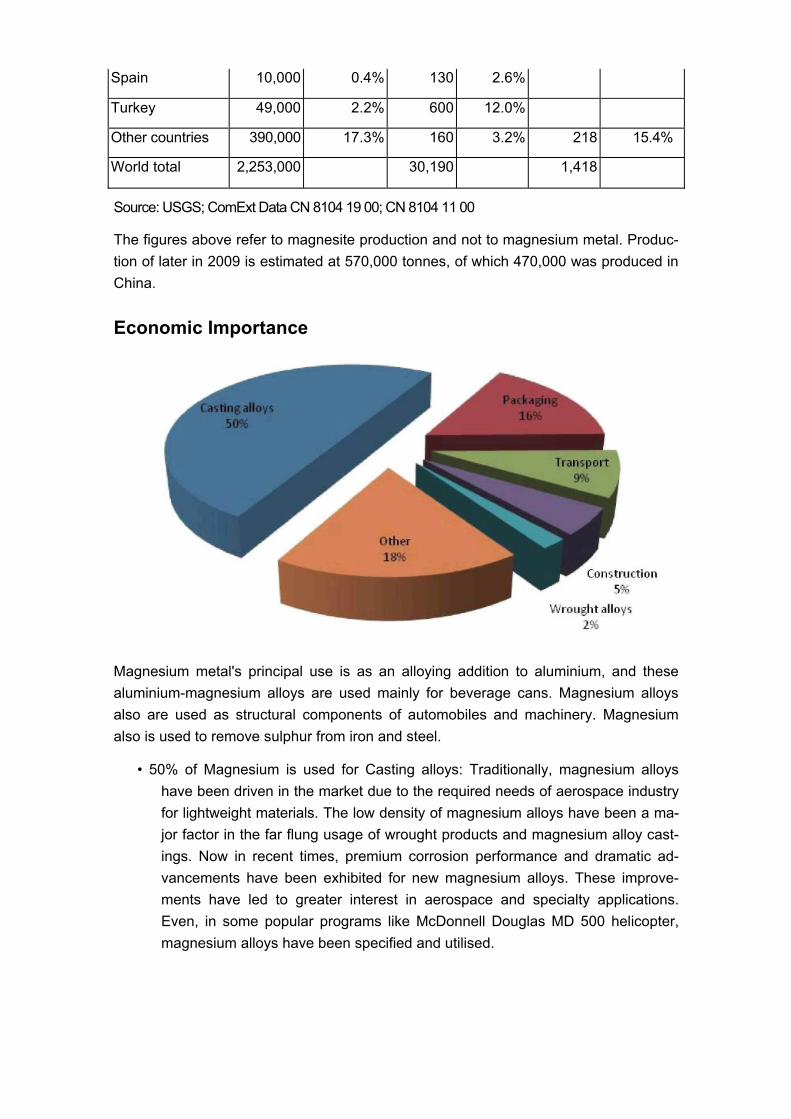
Magnesium metal's principal use is as an alloying addition to aluminium, and these aluminium-magnesium alloys are used mainly for beverage cans. Magnesium alloys also are used as structural components of automobiles and machinery. Magnesium also is used to remove sulphur from iron and steel.
• 50% of Magnesium is used for Casting alloys: Traditionally, magnesium alloys have been driven in the market due to the required needs of aerospace industry for lightweight materials. The low density of magnesium alloys have been a ma-jor factor in the far flung usage of wrought products and magnesium alloy cast-ings. Now in recent times, premium corrosion performance and dramatic ad-vancements have been exhibited for new magnesium alloys. These improve-ments have led to greater interest in aerospace and specialty applications. Even, in some popular programs like McDonnell Douglas MD 500 helicopter, magnesium alloys have been specified and utilised.

• Magnesium is also used for Al-alloys: Packaging (beverages). It is used for the coating of the aluminum beverage packages.
24.4 Resource Efficiency: Recycling & Substitution
The recycling rate for magnesium is 33%. As with most other metals, recycling helps reduce energy costs and import dependency. This rate should increase in the coming years.
Aluminum and zinc may substitute for magnesium in castings and wrought products, while chromite and silica substitute for magnesia in some refractory applications.
Use Share Megasector Subst.Casting alloys (mainly car parts) 50% Road transport 1Wrought alloys 2% Metals 0,7Al-alloys: Packaging (beverages) 17% Beverages 0,7Al-alloys: Transport 9% Road transport 0,7Al-alloys: Construction 5% Construction material 0,7Al-alloys: Other 3% Metals 0,7Other 15% Other Final Consumer
Goods 0,5
Substitutability Index 0,82 Recycling Rate (recycled content from old scrap) 14% Import Dependence 100%
Results Economic Importance 6,4 Supply Risk 2,6 Environmental Country Risk 2,2
Niobium
Niobium, also known as Columbium (Cb), is a metallic element which is very similar to tantalum concerning its chemical properties. One of these is a good resistance against most organic and inorganic acids.161 Niobium is only found in connection with the tran-sition metal tantalum. They have to be separated from each other in a complex chemical procedure.
Niobium is a soft and ductile metallic element that is used mainly in special steels and superalloys.162
The steel industry is by far the largest consumer of niobium.163
Basic Supply & Demand Statistics
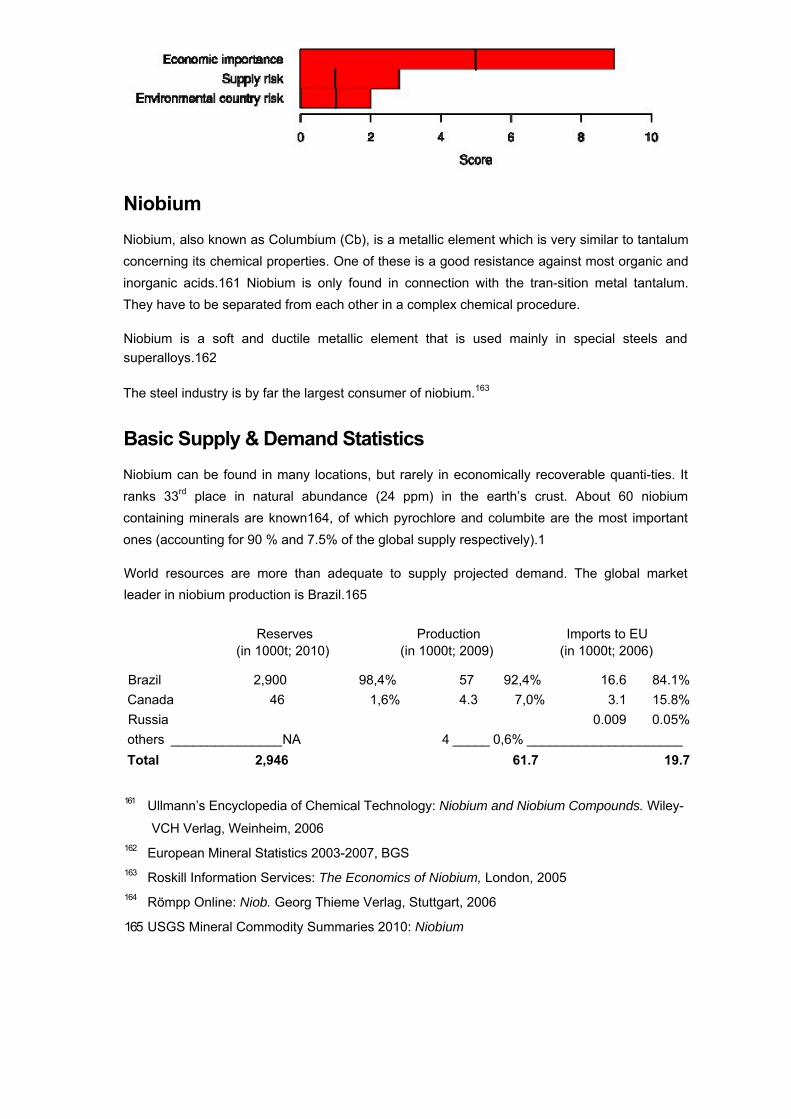
Niobium can be found in many locations, but rarely in economically recoverable quanti-ties. It ranks 33rd place in natural abundance (24 ppm) in the earth’s crust. About 60 niobium containing minerals are known164, of which pyrochlore and columbite are the most important ones (accounting for 90 % and 7.5% of the global supply respectively).1
World resources are more than adequate to supply projected demand. The global market leader in niobium production is Brazil.165
Reserves Production Imports to EU (in 1000t; 2010) (in 1000t; 2009) (in 1000t; 2006)
Brazil 2,900 98,4% 57 92,4% 16.6 84.1% Canada 46 1,6% 4.3 7,0% 3.1 15.8% Russia 0.009 0.05% others _______________ NA 4 _____ 0,6% _____________________ Total 2,946 61.7 19.7
161 Ullmann’s Encyclopedia of Chemical Technology: Niobium and Niobium Compounds. Wiley-
VCH Verlag, Weinheim, 2006 162 European Mineral Statistics 2003-2007, BGS 163 Roskill Information Services: The Economics of Niobium, London, 2005 164 Römpp Online: Niob. Georg Thieme Verlag, Stuttgart, 2006
165 USGS Mineral Commodity Summaries 2010: Niobium
Source: USGS 2010; trade data from ComExt (CN 7202 93 00 Ferro-niobium)
Main import source is Brazil, with smaller quantities being imported from Canada.
European countries exported some tantalum and niobium, although there is no domes-tic production.
The Moreira Salles Group controlled in 2007 nearly 85% of Niobium production, fol-lowed by Anglo American plc (8%) and Iamgold corp (7%).
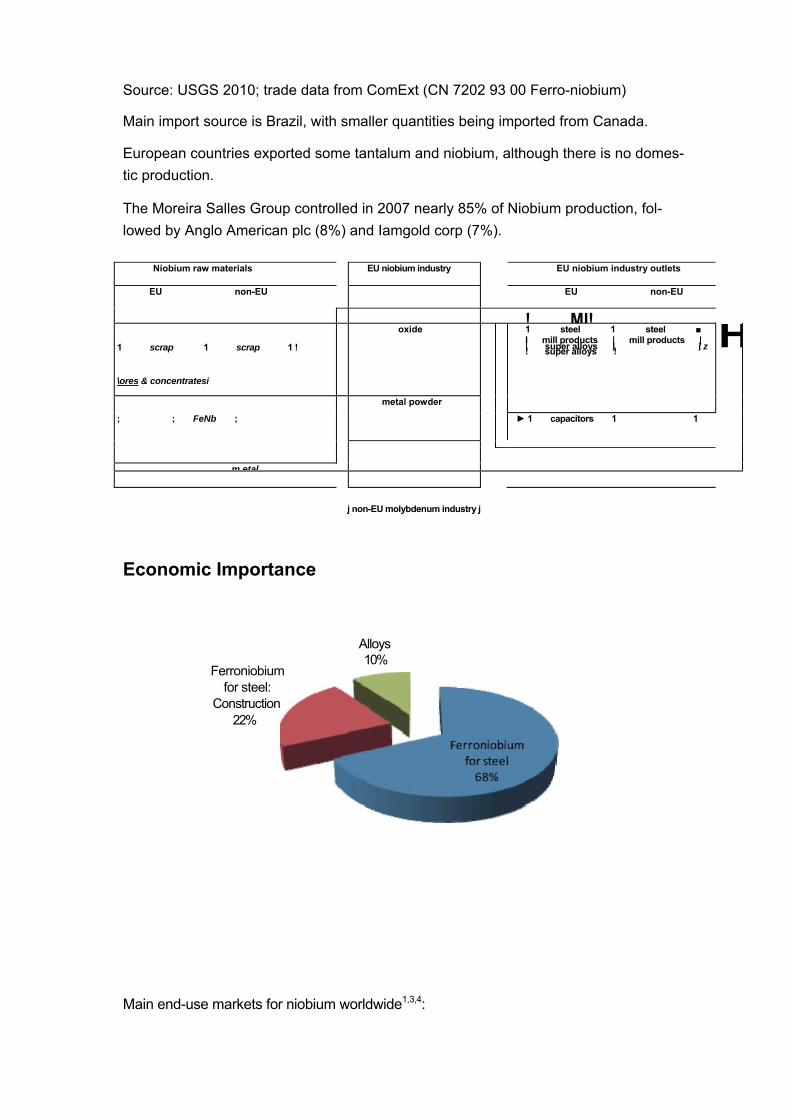
Niobium raw materials EU niobium industry EU niobium industry outlets EU non-EU EU non-EU
! MI!1 scrap 1 scrap 1 !
\ores & concentratesi
oxide 1 steel 1 steel ■I mill products | mill products | | super alloys j j z ! super alloys ! H
metal powder
; ; FeNb ; ► 1 capacitors 1 1
m etal
j non-EU molybdenum industry j
Economic Importance
Ferroniobium for steel:
Construction 22%
Alloys 10%
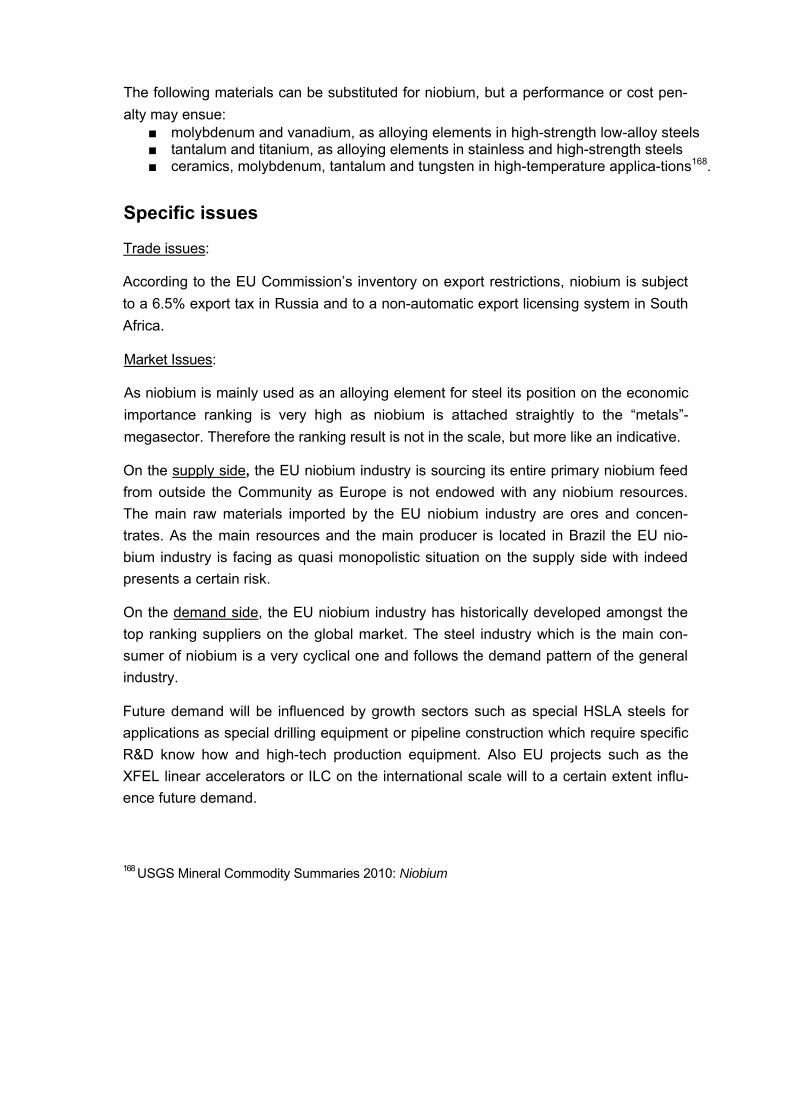
Main end-use markets for niobium worldwide1,3,4:

Ferroniobium for steel: The vast majority of niobium is used in the steel industry for iron-niobium alloys (containing 40-70% Nb). In construction, they are valued for their strength, even at high temperatures. About 10 % of total steel production uses niobium.
■ Ferroniobium for steel, Construction: Used in different indusrties for construction, for example car bodies, off-shore platforms and for pipelines.
■ Alloys: Niobium is also used in special alloys which are used in the nuclear and in the aircraft industry (fuel cell cans, gas turbines...).
■ Small applications: Moreover smaller quantities of niobium are used in many other applications, such as magnets, superconductors, jewelry, thermometers, capacitors or catalysts.
Due to the increased mechanical resistance and other beneficial characteristics of nio- bium-containing products, it finds application in the following fields:
■ Pipeline construction ■ Nuclear technology ■ Aerospace construction ■ Niob-electrolyte-condensators (used e.g. in notebooks or mobile phones) ■ Potassium niobate (laser technology) ■ Superconductors (below temperatures of 9.5 K, e.g. magnets used in the LHC at the
CERN)
In 2030, the demand for niobium in the production of microcapacitors probably will be six times higher than today. Nevertheless that will be only 3% of total niobium con-sumption. High temperature resistant steel will be important for many other emerging technologies, but no quantitative projection is available166. There are also recent re-ports on new end-use, with a solid niobic acid catalyst included in the conversion of palm oil to bio-diesel, but this use will not affect significantly to the global demand.
Resource Efficiency: Recycling & Substitution
Niobium is recycled when niobium-bearing steels and superalloys are recycled; scrap recovery specifically for niobium content is negligible. The amount of niobium recycled is not available, but it may be as much as 20% of primary niobium.167
Though substitution of niobium is possible, it may involve higher costs and/or a loss in performance.
166 Fraunhofer Institut für System und Innovationsforschung and Institut für Zukunftsstudien und Technologiebewertung: Rohstoffe für Zukunftstechnologien, 2009, Fraunhofer IRB Verlag, Stuttgart
167 USGS Mineral Commodity Summaries 2009: Niobium
The following materials can be substituted for niobium, but a performance or cost pen-alty may ensue:
■ molybdenum and vanadium, as alloying elements in high-strength low-alloy steels ■ tantalum and titanium, as alloying elements in stainless and high-strength steels ■ ceramics, molybdenum, tantalum and tungsten in high-temperature applica-tions168.
Specific issues
Trade issues:
According to the EU Commission’s inventory on export restrictions, niobium is subject to a 6.5% export tax in Russia and to a non-automatic export licensing system in South Africa.
Market Issues:
As niobium is mainly used as an alloying element for steel its position on the economic importance ranking is very high as niobium is attached straightly to the “metals”-megasector. Therefore the ranking result is not in the scale, but more like an indicative.
On the supply side, the EU niobium industry is sourcing its entire primary niobium feed from outside the Community as Europe is not endowed with any niobium resources. The main raw materials imported by the EU niobium industry are ores and concen-trates. As the main resources and the main producer is located in Brazil the EU nio-bium industry is facing as quasi monopolistic situation on the supply side with indeed presents a certain risk.
On the demand side, the EU niobium industry has historically developed amongst the top ranking suppliers on the global market. The steel industry which is the main con-sumer of niobium is a very cyclical one and follows the demand pattern of the general industry.
Future demand will be influenced by growth sectors such as special HSLA steels for applications as special drilling equipment or pipeline construction which require specific R&D know how and high-tech production equipment. Also EU projects such as the XFEL linear accelerators or ILC on the international scale will to a certain extent influ-ence future demand.
168 USGS Mineral Commodity Summaries 2010: Niobium

The EU niobium industry is increasingly confronted with Chinese competition whose pricing policy is erratic and destructive of the normal price structure (prices for value added products are quoted below metal price).
Under these circumstances, securing a level playing field in access to niobium raw ma-terial is increasingly seen as a vital condition for ensuring the future viability of the EU niobium industry.
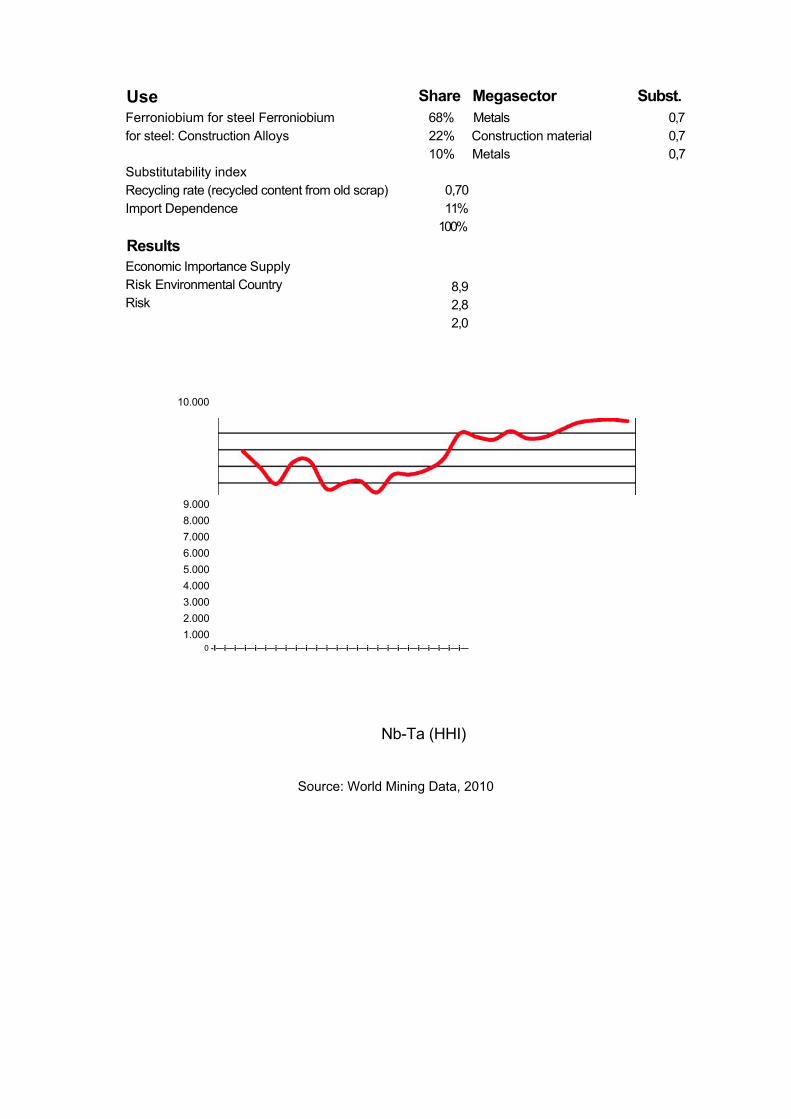
Use Share Megasector Subst.
Ferroniobium for steel Ferroniobium for steel: Construction Alloys
Substitutability index Recycling rate (recycled content from old scrap) Import Dependence
Results Economic Importance Supply Risk Environmental Country Risk
68% Metals 22% Construction material 10% Metals
0,70 11%
100%
8,9 2,8 2,0
0,7 0,7 0,7
10.000
9.000 8.000 7.000 6.000 5.000 4.000 3.000 2.000 1.000
0 -I—i—i—i—i—i—i—i—i—i—i—i—i—i—i—i—i—i—i—i—i—i—i—i—i—
Nb-Ta (HHI)
Source: World Mining Data, 2010
Economie importance Supply risk
Environmeritai country risk
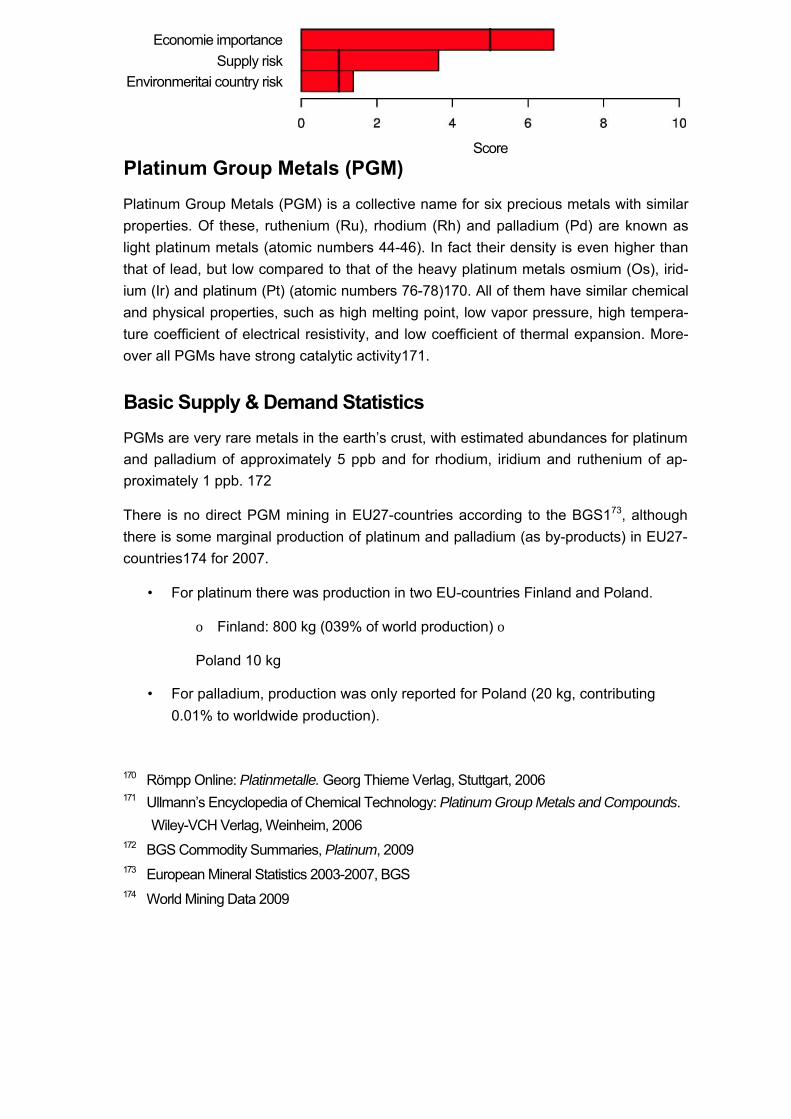
Score Platinum Group Metals (PGM)
Platinum Group Metals (PGM) is a collective name for six precious metals with similar properties. Of these, ruthenium (Ru), rhodium (Rh) and palladium (Pd) are known as light platinum metals (atomic numbers 44-46). In fact their density is even higher than that of lead, but low compared to that of the heavy platinum metals osmium (Os), irid-ium (Ir) and platinum (Pt) (atomic numbers 76-78)170. All of them have similar chemical and physical properties, such as high melting point, low vapor pressure, high tempera-ture coefficient of electrical resistivity, and low coefficient of thermal expansion. More-over all PGMs have strong catalytic activity171.
Basic Supply & Demand Statistics
PGMs are very rare metals in the earth’s crust, with estimated abundances for platinum and palladium of approximately 5 ppb and for rhodium, iridium and ruthenium of ap-proximately 1 ppb. 172
There is no direct PGM mining in EU27-countries according to the BGS173, although there is some marginal production of platinum and palladium (as by-products) in EU27-countries174 for 2007.
• For platinum there was production in two EU-countries Finland and Poland.
o Finland: 800 kg (039% of world production) o
Poland 10 kg
• For palladium, production was only reported for Poland (20 kg, contributing 0.01% to worldwide production).
170 Römpp Online: Platinmetalle. Georg Thieme Verlag, Stuttgart, 2006 171 Ullmann’s Encyclopedia of Chemical Technology: Platinum Group Metals and Compounds.
Wiley-VCH Verlag, Weinheim, 2006 172 BGS Commodity Summaries, Platinum, 2009 173 European Mineral Statistics 2003-2007, BGS 174 World Mining Data 2009
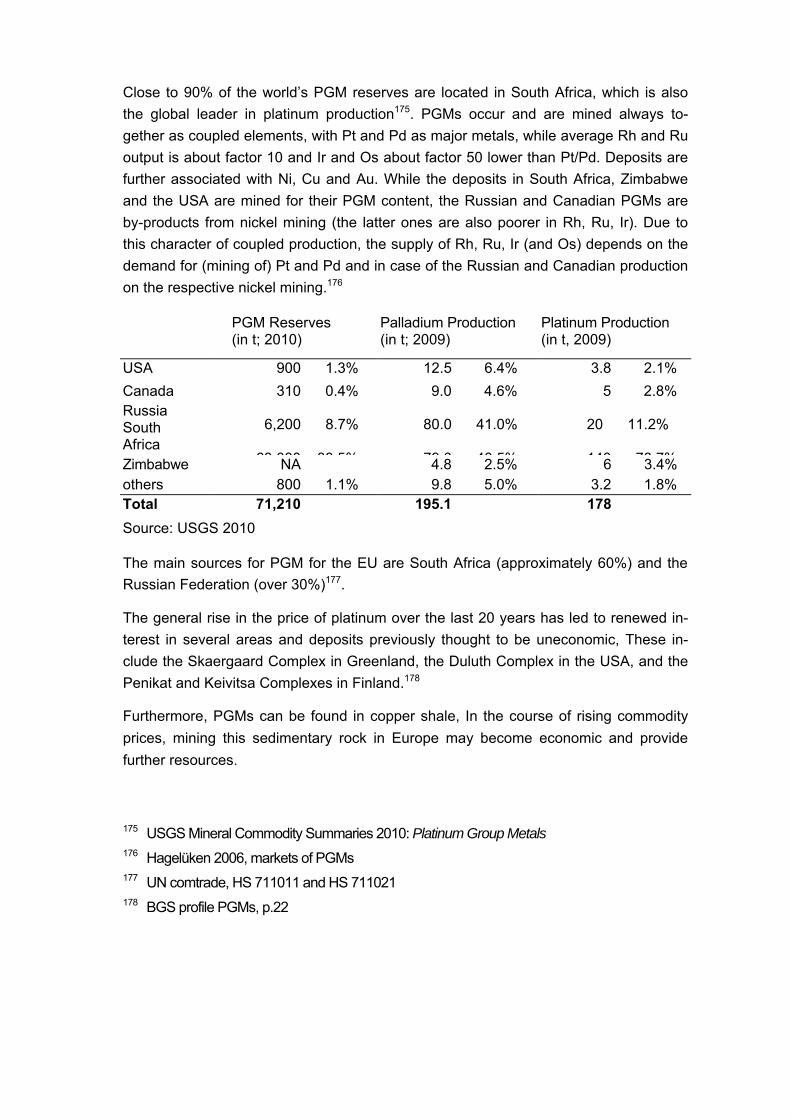
Close to 90% of the world’s PGM reserves are located in South Africa, which is also the global leader in platinum production175. PGMs occur and are mined always to-gether as coupled elements, with Pt and Pd as major metals, while average Rh and Ru output is about factor 10 and Ir and Os about factor 50 lower than Pt/Pd. Deposits are further associated with Ni, Cu and Au. While the deposits in South Africa, Zimbabwe and the USA are mined for their PGM content, the Russian and Canadian PGMs are by-products from nickel mining (the latter ones are also poorer in Rh, Ru, Ir). Due to this character of coupled production, the supply of Rh, Ru, Ir (and Os) depends on the demand for (mining of) Pt and Pd and in case of the Russian and Canadian production on the respective nickel mining.176
PGM Reserves (in t; 2010)
Palladium Production (in t; 2009)
Platinum Production (in t, 2009)
USA 900 1.3% 12.5 6.4% 3.8 2.1%
Canada 310 0.4% 9.0 4.6% 5 2.8% Russia South Africa
6,200 8.7%
63 000 88 5%
80.0 41.0%
79 0 40 5%
20 11.2%
140 78 7%Zimbabwe NA 4.8 2.5% 6 3.4% others 800 1.1% 9.8 5.0% 3.2 1.8% Total 71,210 195.1 178
Source: USGS 2010
The main sources for PGM for the EU are South Africa (approximately 60%) and the Russian Federation (over 30%)177.
The general rise in the price of platinum over the last 20 years has led to renewed in-terest in several areas and deposits previously thought to be uneconomic, These in-clude the Skaergaard Complex in Greenland, the Duluth Complex in the USA, and the Penikat and Keivitsa Complexes in Finland.178
Furthermore, PGMs can be found in copper shale, In the course of rising commodity prices, mining this sedimentary rock in Europe may become economic and provide further resources.
175 USGS Mineral Commodity Summaries 2010: Platinum Group Metals 176 Hagelüken 2006, markets of PGMs 177 UN comtrade, HS 711011 and HS 711021 178 BGS profile PGMs, p.22

In Europe there are 7 projects for PGM metals in Finland, one is at the pre-feasibility stage, the others are at conceptual stage.
The three largest companies Norilsk Nickel Mining & Metallurgical Company, Anglo American plc and Impala Platinum Holdings Ltd control nearly 70% of the platinum market.
Economic Importance
Main end-use markets for PGMs are4,179,180:
■ Autocatalysts: Pt, Pd and Rh are used for automotive catalytic converters and diesel particulate filters in order to reduce air pollution.
■ Jewelry: Approximately 20% of PGMs are used for jewelry. ■ Electronics and electrics: In this sector PGMs are used in a variety of applica-
tions, such as computer hard discs (Pt, Ru), multilayer ceramic capacitors (Pd) or hybridized integrated circuits.
4 USGS Mineral Commodity Summaries 2010: Platinum Group Metals 179 Fraunhofer Institut für System und Innovationsforschung and Institut für Zukunftsstudien
und Technologiebewertung: Rohstoffe für Zukunftstechnologien, 2009, Fraunhofer IRB Verlag, Stuttgart
180 Hagelüken
Dental alloys: Their high corrosion resistance make PGMs interesting for dental applications. ■ Catalysts: PGMs are not only used for autocatalysts, but also as catalysts in the
chemical industry and for petroleum refining. ■ Glass making equipment: Minor applications include glass making equipment,
especially LCDs. ■ Investment tools: Due to their high prices, PGMs are used as investment tools.
PGMs are expected to play an important role in emerging technologies. Especially for fuel cell driven vehicles, platinum demand in 2030 is estimated to exceed world produc-tion of 2006 by far. 181
Beside the actual application distribution, new technologies and expanding markets can be estimated in the following fields:
■ “Four way catalysts” in car engines to control the gas and particulate emissions in one single system
■ increased use in emission control in stationary applications (generators, tur-bines and industrial processes such as cement, glass and nitric acid manufac-ture)
- fuel cells ■ further increase of ruthenium and rhenium in nickel-based superalloys that are
used in turbine blades for jet engines ■ increased medical application in anti-cancer drugs or ICDs (Implantable Cardiac
Defibrillator).
Resource Efficiency: Recycling & Substitution
Due to their high value, recycling of PGMs is quite efficient, especially from industrial process catalysts182 and PGM equipment used in the glass industry.
Although not visible in demand statistics, these industrial PGM applications account for about 50% of the global gross PGM demand, In most applications, more than 90% of the PGMs originally used finally - also after lifetimes of many years - are recovered, Since most industrial users keep the property of the PGMs throughout their lifecycle (closed loop), they appear on the markets as net buyers only to cover lifecycles losses or market growth (expansion or new applications), The demands reported for the
181 Fraunhofer Institut für System und Innovationsforschung and Institut für Zukunftsstudien und Technologiebewertung: Rohstoffe für Zukunftstechnologien, 2009, Fraunhofer IRB Verlag, Stuttgart
182 Hagelüken 2006, Precious metals process catalysts
chemical, oil-refining or glass sector are net figures (=new demand), these reflect only a fraction of the much larger gross demand.
There is no universal technique for recovering PGMs from post-consumer scrap, such as electronic items, jewellery, and automotive catalysts.
- Automotive catalysts are particularly important sources for recycled PGMs and quantities continue to rise due to rising numbers of End-of-Life vehicles being catalyst equipped. On a global scale only between 50-60% of PGMs used in automotive cata-lysts finally are recovered; in Europe, this is well below 50%, mainly due to high exports of old cars/ELVs into regions without proper recycling systems. The EU mandatory removal of autocatalysts from ELVs is supportive for PGM recycling rates, however does not affect old cars exported from the EU.
- Recycling of PGMs from other consumer applications however is much worse, For PGMs in electronic applications, recovery rates are probably only in the range of 10%. The EU WEE directive currently provides here only little support since under the mass based recycling targets no incentives exist to secure optimum access to PGM contain-ing components and their most appropriate recovery, and other than for autocatalysts the economic motivation for PGM recycling is much lower,
- The challenge in PGMs in autocatalysts and other consumer applications thus is the collection and channeling through the recycling chain to the metal recovery processes itself, The latter ones are highly efficient and obtain metal recovery rates of well over 95%183.
-To a certain extent, PGMs are also used in a rather dissipative way which puts eco-nomic and technical challenges on recycling. Examples are Ru and Pt in hard disks (today about 80% of Ru and 5% of Pt), Pt in silicones, Pt and Ir in spark plugs, Pt in sensors, and PGMs in medical applications or galvanoplating.
PGMs in jewelry, coinage and other investment applications are usually manufactured for an “eternal life”, so here hardly any lifecycle losses occur and if e.g. old jewelry is handed in it is recycled with very high yields.
In automotive catalytic converters platinum can often be replaced by palladium and the other way round, driver is here often the current price ratio. However, a general substi-tution effort can just flip the prices as was the case end of the 1990s. Since Pd for many years was cheaper than Pt, the automotive industry widely switched to Pd domi-
183 Hagelüken 2007, Challenge of open cycles
nated catalysts, with the effect that Pd reached an all time price high in 2000/01, sur-passing Pt, before it fall back again in 2001. The European boom in diesel cars then further triggered the Pt demand, since originally diesel catalysts only worked with Pt. In the meantime, new technologies allow for a partial substitution of Pt with Pd in diesel (but Pt remains the dominating metal). Rh is not needed in diesel catalysts but so far cannot be substituted in catalysts for spark ignition engines and is there always used in combination with Pt or Pd or both.
Generally PGMs often can substitute for each other, but since Pt and Pd mine produc-tion is in the same magnitude this does not necessarily help but can shift the problem from one scarce metal to another. In some multi-layer ceramic capacitors (MLCC) used in electronic devices silver-palladium pastes have been substituted by base metals (Ni, Cu), but at the cost of a lower performance. So in many high tech electronic devices still Pd is used in MLCCs184.
New developments in automotive catalyst technologies help to save PGMs, because they need smaller quantities than older models and still achieve better results185. How-ever, tighter and tighter emission standards lead to almost constant PGM loading in car catalysts.
Specific issues
According to the EU Commission’s inventory on export restrictions, Russia applies a 6.5% export tax on all PGMs.
184 Hagelüken 2006, markets for PGMs 185 USGS, MCS 2010, Platinum Group Metals)

Share Megasector
Autocatalysts 53% Road Transport 1,0 Jewelry 20% Other Final Consumer
Goods 0,0
Electronics and electrics (capacitors, hard drives, 11% Electronics & ICT 1,0 themocouples) Dental alloys 6% Pharmaceuticals 0,3 Catalysts: Chemicals 6% Chemicals 1,0 Glass making equipment (esp. LCD) 2% Mechanical Equipment 1,0 Catalysts: Petroleum 1% Refining 1,0 Other 1% Other Final Consumer
Goods 0,5
Substitutability index 0,75
Recycling rate (Recycled content from old scrap) 35% Import Dependence 100%
Results
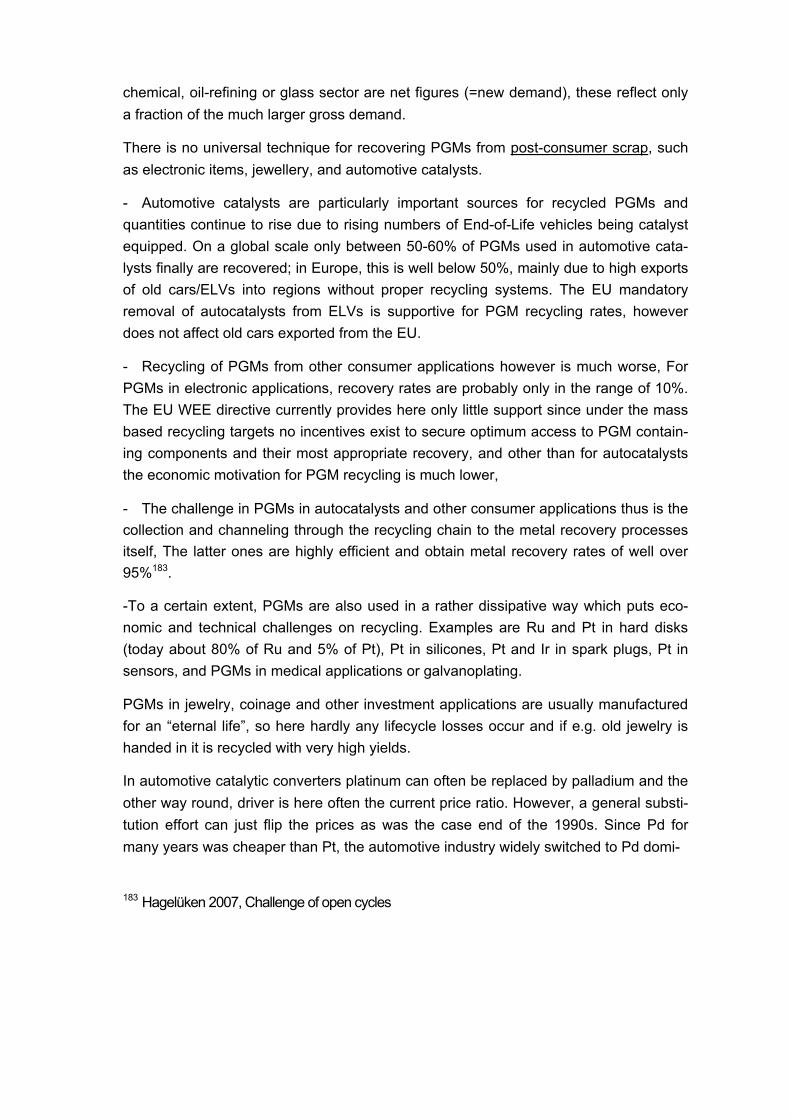
Economic Importance 6,7 Supply Risk 3,6 Environmental Country Risk 1,4 (Platinum)
10.000 9.000 8.000 7.000 6.000 5.000 4.000 3.000 2.000 1.000
0
Use Subst.
Economie importance Supply risk
Environmeritai country risk
The term “rare earth elements” is a collective name for the elements scandium (atomic number 21), yttrium (39), lanthanum (57) and the 14 elements following lanthanum in the periodic table (the so called lanthanides): Cerium, Praseodymium, Neodymium, Promethium, Samarium, Europium, Gadolinium, Terbium, Dysprosium, Holmium, Er-bium, Thulium, Ytterbium, and Lutetium. In spite of their name, some of these elements are not as rare as their name suggests. For example Thulium, the rarest stable element of the group, is less rare than gold or platinum. They occur chiefly in the minerals bast-naesite and monazite, can only be mined together (their relative abundance varying between deposits) and their production in pure form is cost-intensive.186,187,188 Often rare earths are split between ‘light’ rare earth elements189 and ‘heavy’ rare earth ele-ments190.
Basic Supply & Demand Statistic
The worldwide reserves of rare earth metals (excluding Scandium) are estimated to be around 99,000,000 tonnes. Although China has only about one third of the world’s re-serves, it produced 97% of the rare earths in 2009.191
USA Australia Brazil China India
Reserves (in 1000t; 2009)
13.2% 5.5%
< 0.1% 36.5%
3.1%
Production (in 1000t; 2009)
0,5% 97,0%
2,2%
EU imports (in 1000t; 2007)
15.8 89,7% 0.07 0,4%
186 Römpp Online: Seltenerdmetalle. Georg Thieme Verlag, Stuttgart, 2007 187 British Geological Survey: European Mineral Statistics 2003-2007. 188 Liedke & Elsner: Seltene Erden. BGR Commodity Top News Nr. 31, Hannover, 2009. 189 lanthanum, neodymium, praseodymium, samarium 190 dysprosium, erbium, europium, gadolinium, holmium, lutetium, terbium, thulium, ytterbium,
yttrium 191 USGS Mineral Commodity Summaries 2010: Rare Earths
Rare Earth Elements
13,000 5,400
48 36,000
3,100
--
0.651202.7
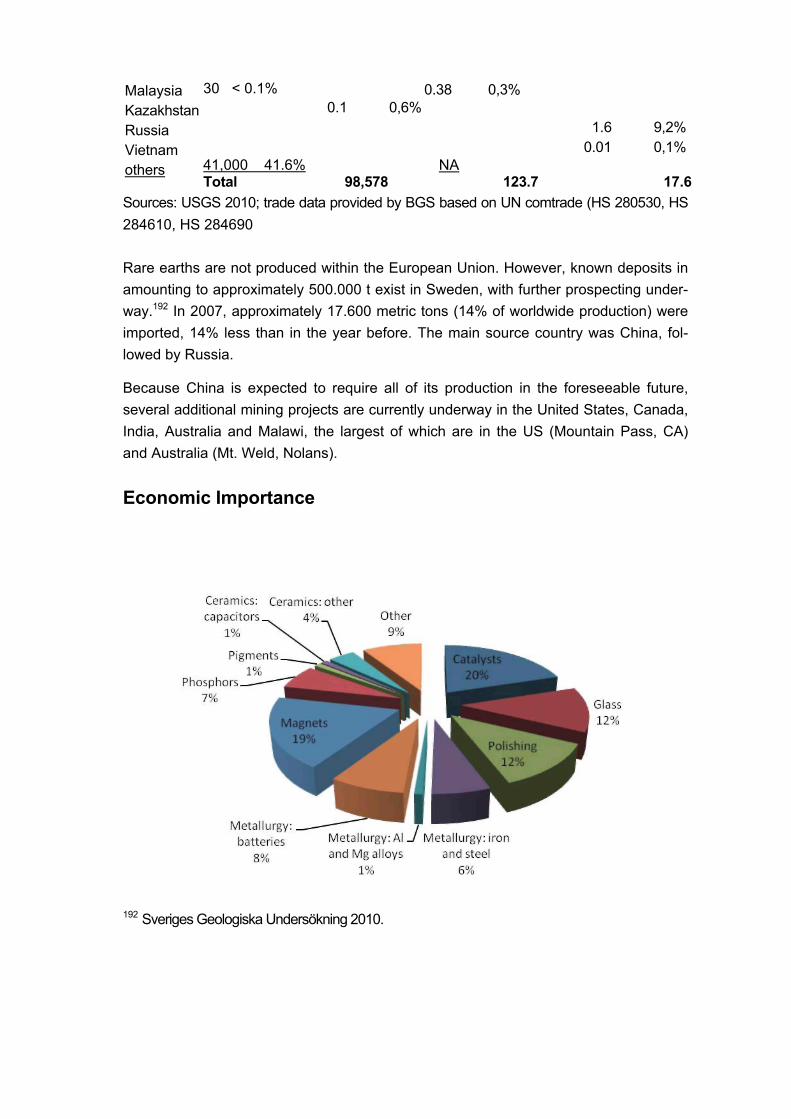
30 < 0.1% 0.1 0,6%
1.6 9,2% 0.01 0,1%
41,000 41.6% Total 98,578 123.7 17.6
Sources: USGS 2010; trade data provided by BGS based on UN comtrade (HS 280530, HS 284610, HS 284690
Rare earths are not produced within the European Union. However, known deposits in amounting to approximately 500.000 t exist in Sweden, with further prospecting under-way.192 In 2007, approximately 17.600 metric tons (14% of worldwide production) were imported, 14% less than in the year before. The main source country was China, fol-lowed by Russia.
Because China is expected to require all of its production in the foreseeable future, several additional mining projects are currently underway in the United States, Canada, India, Australia and Malawi, the largest of which are in the US (Mountain Pass, CA) and Australia (Mt. Weld, Nolans).
Economic Importance
192 Sveriges Geologiska Undersökning 2010.
Malaysia Kazakhstan Russia Vietnam others
0.38 0,3%
NA
As there are many different elements among the rare earths, there are many different uses as well. The most important ones are1,3,193,194:
■ Catalysts: An important use for rare earth metals is in catalysts, for example Lan-thanum are used in catalytic cracking in oil refineries and Cerium is necessary in catalytic converters for cars.
■ Magnets: Many rare earth elements have interesting magnetic characteristics which makes them important for high temperature superconductors and perma-nent magnetic substances. For example, Neodymium-Iron-Boron magnets are the strongest known permanent magnets. Other rare earths used in these appli-cations are Dysprosium, Samarium, Terbium and Praseodymium.
■ Polishing and Glass: Cerium oxide is a widely used polishing agent. ■ Batteries: Nickel metal hydride batteries (containing Lanthanum) are the first
choice for portable tools and are extensively used in hybrid vehicles. ■ Metallurgy: Rare earths (especially Cerium, Lanthanum and Neodymium) are
used to improve mechanic characteristics of alloyed steel, for desulfurisation, and to bind trace elements in stainless steel. Smaller shares are also used for mag-nesium and for aluminum alloys.
■ Other applications include the processing of phosphors and pigments and the manufacturing of capacitors and ceramics.
A number of merging technologies rely on the properties of rare earths, for example:
■ The anodes of solid state fuel cells use either Scandium or Yttrium. ■ Yttrium is also necessary for high temperature superconductors and is used in la-
sers. ■ Neodymium will see increased use for high performance permanent magnets in
the context of electromobility and for wind power generators.
1 Römpp Online: Seltenerdmetalle. Georg Thieme Verlag, Stuttgart, 2007 3 Liedke & Elsner: Seltene Erden. BGR Commodity Top News Nr. 31, Hannover, 2009. 193 Ullmann’s Encyclopedia of Chemical Technology: Rare Earth Elements. Wiley-VCH Verlag,
Weinheim, 2006 194 Fraunhofer Institut für System und Innovationsforschung and Institut für Zukunftsstudien
und Technologiebewertung: Rohstoffe für Zukunftstechnologien, 2009, Fraunhofer IRB Verlag, Stuttgart

Resource efficiency, recycling and substitution
Only small quantities, circa 1% have been recycled from old scrap195, mainly from permanent magnet scrap.2
For most applications substitutes for rare earths are available but with loss of perform-ance.2
Specific issues
An intrinsic issue pertaining to rare earths is that their relative amounts in ore bodies is fixed (though different for each deposit) but the demand does not necessarily match these relative concentrations. Thus, while relative shortages are expected for Lantha-num, Dysprosium, Terbium, Neodymium and Europium, Cerium is expected to remain relatively abundant.3
China controls the exports of rare earths in a tight way. Quotas have been falling con-tinuously since 2005, although due to the recession non-Chinese demand did not ex-ceed supply during 2009. In particular the announcement that China will ban exports of unprocessed heavy rare earths by 2015 has raised major concerns. It seems that the underlying rationale is to bring more and more of the manufacturing chain into China. China is also known to have been stockpiling rare earths for its own consumption fol-lowing the depressed prices. In addition, China introduced an export tax in 2006 with the effect of raising prices for rare earth raw materials by 31% and severely undermin-ing the competitiveness of non-Chinese magnet makers for example. There is wide-scale concern that China may soon greatly restrict or even ban the export of particular rare earth elements in order to guarantee supply for its own rapidly expanding demand from wind energy, electric bikes and hybrids.196
There are currently many new mine projects outside of China in the pipeline that could ease the expected pressures on supply and demand. The new mine Mount Weld in Australia is scheduled to commence product next year; whereas other deposits have been identified in the US, Canada, Australia and Greenland. It is expected that the supply from the rest of the world will become a larger share of world demand. However, the development of new mines could take as many as 10 years. Hence some pressure
2 USGS Mineral Commodity Summaries 2010: Rare Earths 3 Liedke & Elsner: Seltene Erden. BGR Commodity Top News Nr. 31, Hannover, 2009. 195 UNEP – The recycling of metals (upcoming) 196 Source: “Lanthanides Resources and alternatives”. Oakdene Hollins, UK. March 2010
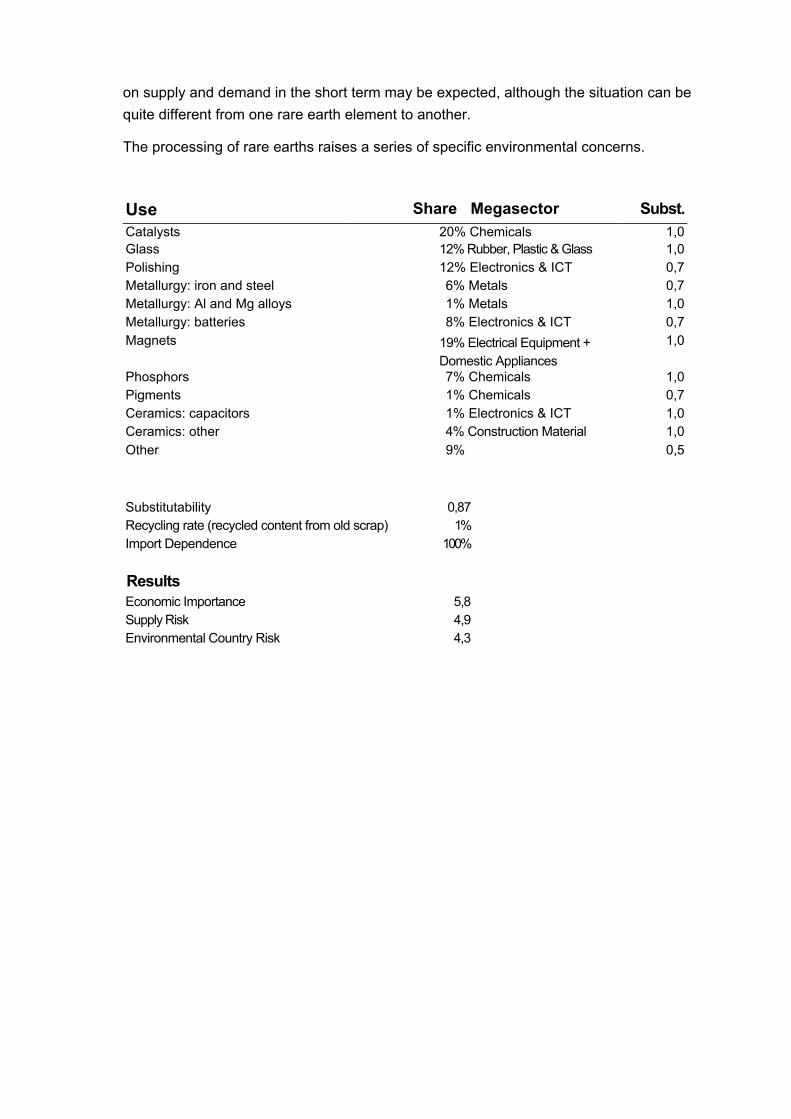
on supply and demand in the short term may be expected, although the situation can be quite different from one rare earth element to another.
The processing of rare earths raises a series of specific environmental concerns.
Use Share Megasector Subst.Catalysts 20% Chemicals 1,0Glass 12% Rubber, Plastic & Glass 1,0Polishing 12% Electronics & ICT 0,7Metallurgy: iron and steel 6% Metals 0,7Metallurgy: Al and Mg alloys 1% Metals 1,0Metallurgy: batteries 8% Electronics & ICT 0,7Magnets 19% Electrical Equipment +
Domestic Appliances 1,0
Phosphors 7% Chemicals 1,0Pigments 1% Chemicals 0,7Ceramics: capacitors 1% Electronics & ICT 1,0Ceramics: other 4% Construction Material 1,0Other 9% 0,5
Substitutability 0,87 Recycling rate (recycled content from old scrap) 1% Import Dependence 100%
Results Economic Importance 5,8 Supply Risk 4,9 Environmental Country Risk 4,3
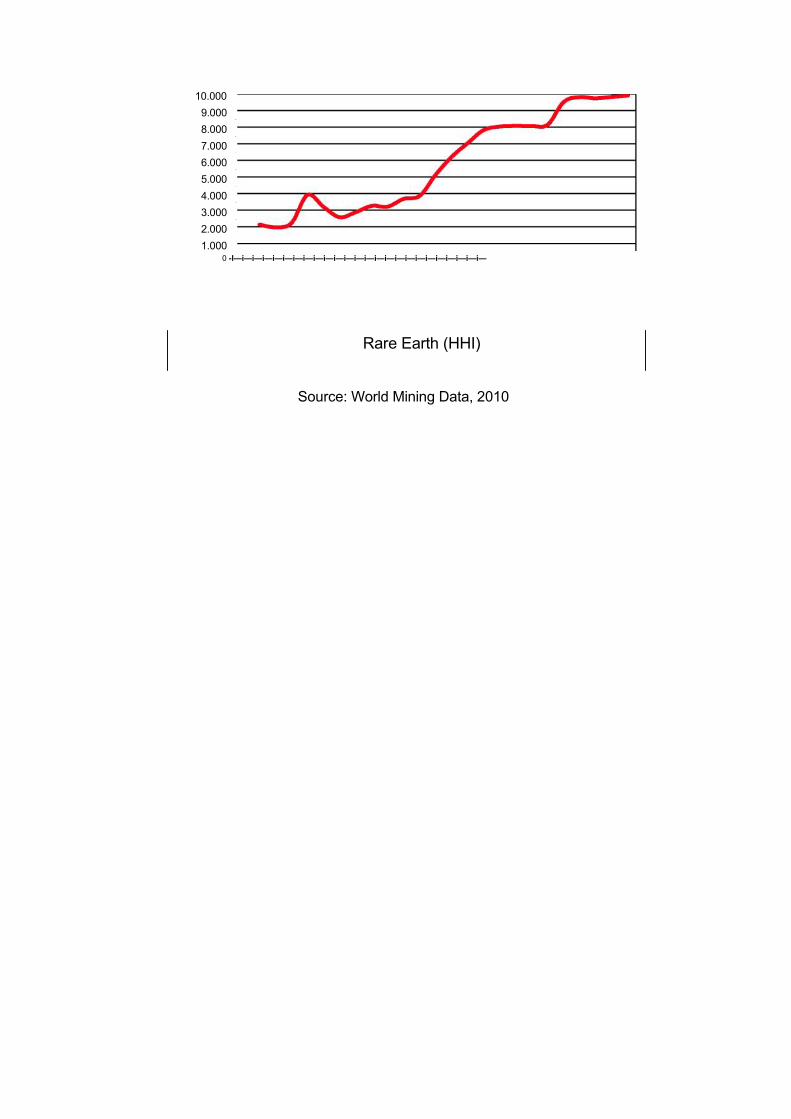
10.000 9.000 8.000 7.000 6.000 5.000 4.000 3.000 2.000 1.000
0 -I—i—i—i—i—i—i—i—i—i—i—i—i—i—i—i—i—i—i—i—i—i—i—i—i—
Rare Earth (HHI)
Source: World Mining Data, 2010
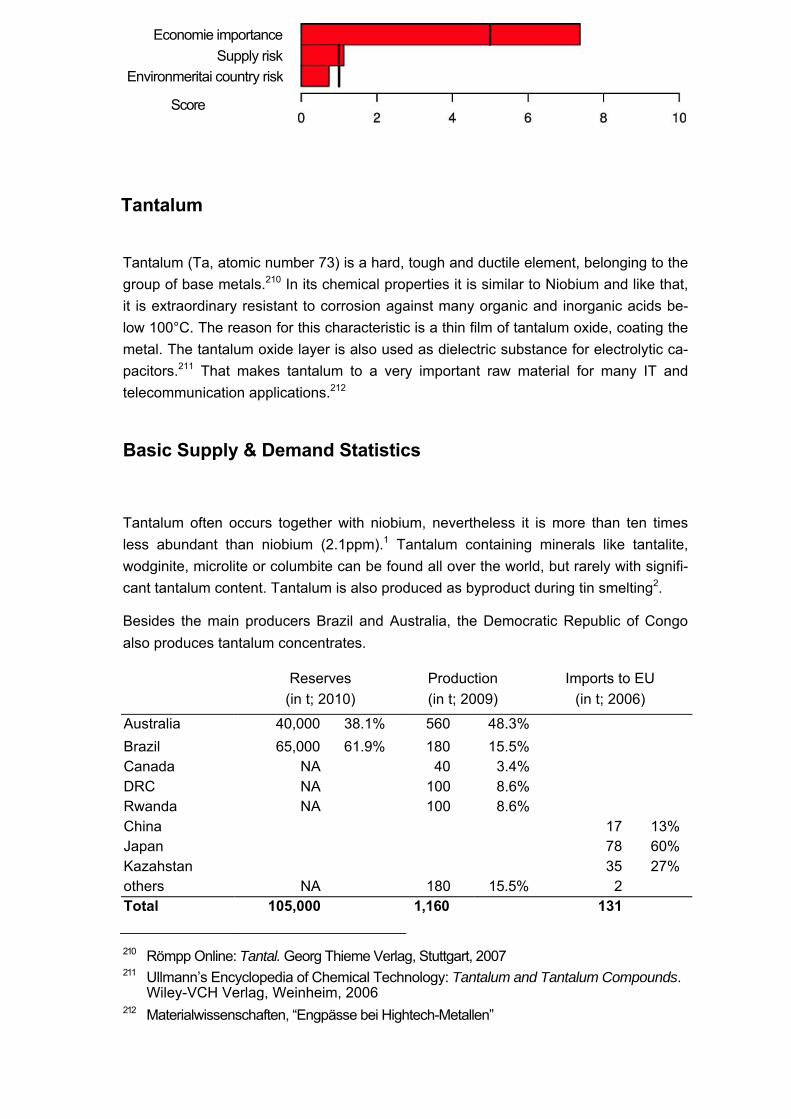
Economie importance Supply risk
Environmeritai country risk
Score
Tantalum
Tantalum (Ta, atomic number 73) is a hard, tough and ductile element, belonging to the group of base metals.210 In its chemical properties it is similar to Niobium and like that, it is extraordinary resistant to corrosion against many organic and inorganic acids be-low 100°C. The reason for this characteristic is a thin film of tantalum oxide, coating the metal. The tantalum oxide layer is also used as dielectric substance for electrolytic ca-pacitors.211 That makes tantalum to a very important raw material for many IT and telecommunication applications.212
Basic Supply & Demand Statistics
Tantalum often occurs together with niobium, nevertheless it is more than ten times less abundant than niobium (2.1ppm).1 Tantalum containing minerals like tantalite, wodginite, microlite or columbite can be found all over the world, but rarely with signifi-cant tantalum content. Tantalum is also produced as byproduct during tin smelting2.
Besides the main producers Brazil and Australia, the Democratic Republic of Congo also produces tantalum concentrates.
Reserves Production Imports to EU (in t; 2010) (in t; 2009) (in t; 2006)
Australia 40,000 38.1% 560 48.3%
Brazil 65,000 61.9% 180 15.5% Canada NA 40 3.4% DRC NA 100 8.6% Rwanda NA 100 8.6% China 17 13% Japan 78 60% Kazahstan 35 27% others NA 180 15.5% 2 Total 105,000 1,160 131
210 Römpp Online: Tantal. Georg Thieme Verlag, Stuttgart, 2007 211 Ullmann’s Encyclopedia of Chemical Technology: Tantalum and Tantalum Compounds.
Wiley-VCH Verlag, Weinheim, 2006 212 Materialwissenschaften, “Engpässe bei Hightech-Metallen”
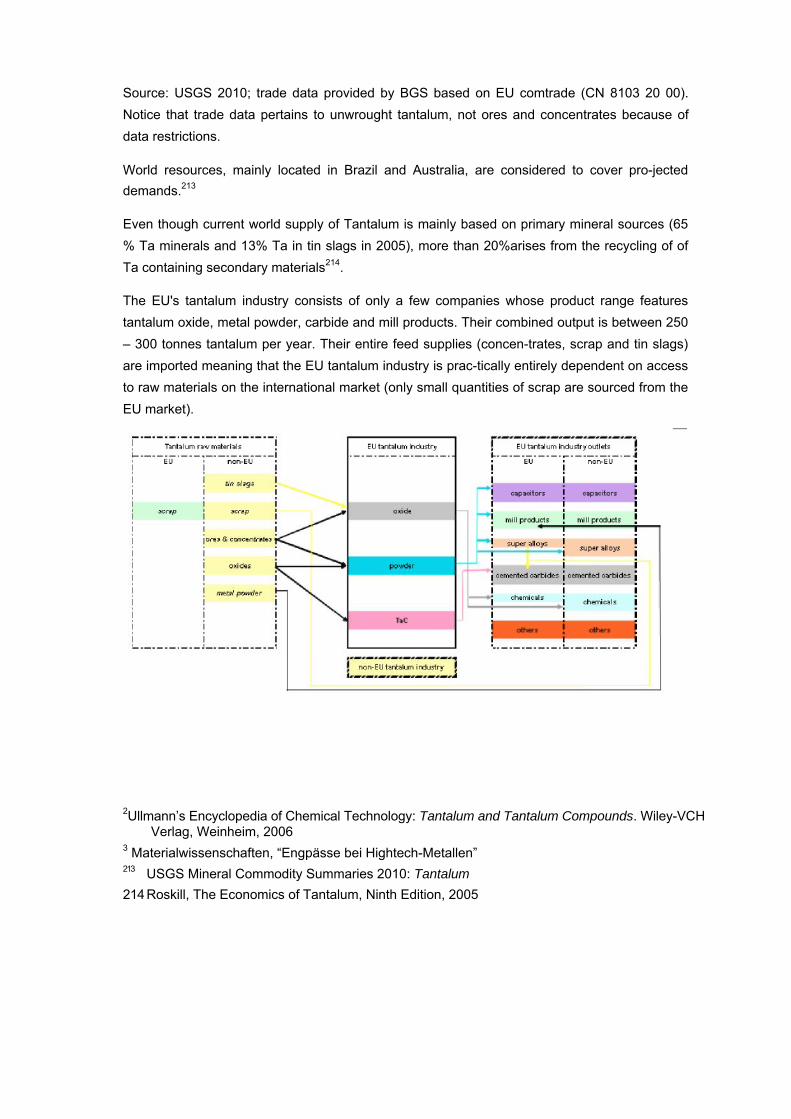
Source: USGS 2010; trade data provided by BGS based on EU comtrade (CN 8103 20 00). Notice that trade data pertains to unwrought tantalum, not ores and concentrates because of data restrictions.
World resources, mainly located in Brazil and Australia, are considered to cover pro-jected demands.213
Even though current world supply of Tantalum is mainly based on primary mineral sources (65 % Ta minerals and 13% Ta in tin slags in 2005), more than 20%arises from the recycling of of Ta containing secondary materials214.
The EU's tantalum industry consists of only a few companies whose product range features tantalum oxide, metal powder, carbide and mill products. Their combined output is between 250 – 300 tonnes tantalum per year. Their entire feed supplies (concen-trates, scrap and tin slags) are imported meaning that the EU tantalum industry is prac-tically entirely dependent on access to raw materials on the international market (only small quantities of scrap are sourced from the EU market).
2Ullmann’s Encyclopedia of Chemical Technology: Tantalum and Tantalum Compounds. Wiley-VCH Verlag, Weinheim, 2006
3 Materialwissenschaften, “Engpässe bei Hightech-Metallen” 213 USGS Mineral Commodity Summaries 2010: Tantalum 214 Roskill, The Economics of Tantalum, Ninth Edition, 2005
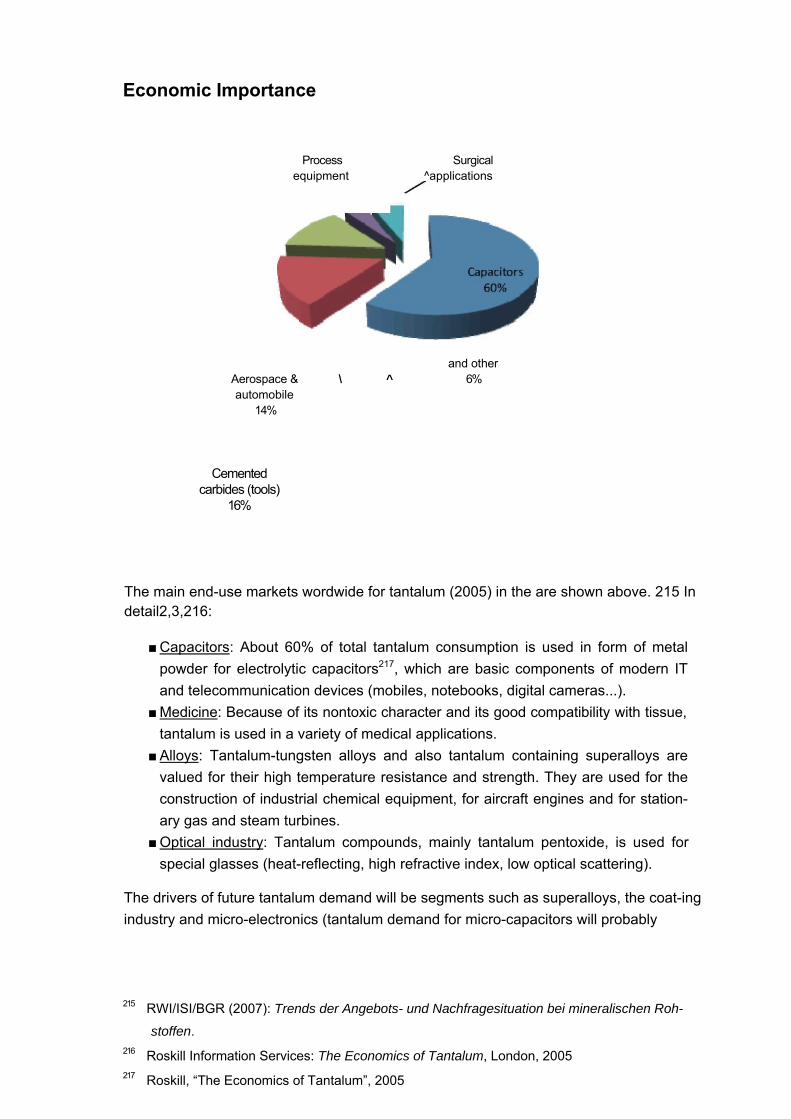
Economic Importance
Process Surgical equipment ^applications
and other Aerospace & \ ^ 6% automobile
14%
The main end-use markets wordwide for tantalum (2005) in the are shown above. 215 In detail2,3,216:
■ Capacitors: About 60% of total tantalum consumption is used in form of metal powder for electrolytic capacitors217, which are basic components of modern IT and telecommunication devices (mobiles, notebooks, digital cameras...).
■ Medicine: Because of its nontoxic character and its good compatibility with tissue, tantalum is used in a variety of medical applications.
■ Alloys: Tantalum-tungsten alloys and also tantalum containing superalloys are valued for their high temperature resistance and strength. They are used for the construction of industrial chemical equipment, for aircraft engines and for station-ary gas and steam turbines.
■ Optical industry: Tantalum compounds, mainly tantalum pentoxide, is used for special glasses (heat-reflecting, high refractive index, low optical scattering).
The drivers of future tantalum demand will be segments such as superalloys, the coat-ing industry and micro-electronics (tantalum demand for micro-capacitors will probably
215 RWI/ISI/BGR (2007): Trends der Angebots- und Nachfragesituation bei mineralischen Roh-
stoffen. 216 Roskill Information Services: The Economics of Tantalum, London, 2005 217 Roskill, “The Economics of Tantalum”, 2005
Cemented carbides (tools)
16%
triple in the next two decades218). Demand from the very price sensitive sector of elec-tronics will be strongly influenced however by tantalum price developments which may enhance miniaturisation and trigger substitution.
The EU tantalum industry has historically developed amongst the top ranking suppliers of tantalum products on the global market. Although the EU market is the industry’s natural outlet, its activity is very much export oriented as demand for tantalum and tan-talum products is geographically widespread in the world (e.g. the electronics and automotive industries).
Resource Efficiency: Recycling & Substitution
Recycling of tantalum is operated in the cemented carbide and alloy sectors where tantalum is recovered from scrap in mixed or alloy form. Recycling from capacitors, the main user of tantalum, is difficult and insufficiently developed. Information about recy-cled content from old scrap differ form less than 1% to 9%.219
There are efforts to substitute tantalum in capacitors by aluminum and ceramics. Nio-bium might be used in carbides, and glass, niobium, platinum, titanium, and zirconium in corrosion-resistant equipment. Moreover hafnium, iridium, molybdenum, niobium, rhenium, and tungsten can be used for high-temperature applications. When tantalum is substituted, most applications loose some effectiveness.220
Specific Issues
Trade Issues:
According to the European Commission’s inventory on export restrictions, South Africa applies a non-automatic export licensing system on Tantalum ores and concentrates as well as on Tantalum metal under various forms, including waste and scrap. Tantalum scrap is subject to an export ban in Tanzania.
Market Issues:
218 Fraunhofer Institut für System und Innovationsforschung and Institut für Zukunftsstudien und Technologiebewertung: Rohstoffe für Zukunftstechnologien, 2009, Fraunhofer IRB Verlag, Stuttgart
219 UNEP (upcoming), The Recycling of Metals: A Status Report, Report of the Global Metal Flows Group to the International Panel for Sustainable Resource Management. Graedel T. et al.
220 USGS Mineral Commodity Summaries 2010: Tantalum
On the supply side, the EU tantalum industry is sourcing its entire primary tantalum feed from outside the EU as Europe is not endowed with any tantalum resources. The main raw materials imported by the EU tantalum industry are ores and concentrates, tin slags and scrap.
Shrinking demand for electronics brought on by the 2008 recession led to a drop in tantalum capacitor demand, which in turn forced primary tantalum producers to se-verely cut back production. The world’s largest producer, responsible for about a third of total global production, Australia-based Talison, stopped operating in 2008 and was followed by two other major mining producers whose operations were made economi-cally unviable by the recession. These closures lead to a 40 per cent cut in total world tantalum production.
World tantalum supply may appear to be seriously insufficient once demand picks up. Roskill Information Services reports that even a modest recovery in tantalum demand in the next few years could create a real supply squeeze by 2012. Some tantalum processors are already confronted with a lack of supplies.
On the demand side, the EU tantalum industry is increasingly confronted with Chinese competition, both on the EU and world market, where demand growth actually occurs. China’s pricing policy is extremely detrimental to the industry as it is erratic and de-structive of the normal price structure (prices for value added products are quoted be-low metal price).
Under these circumstances, securing a level playing –field in access to tantalum raw materials is increasingly seen as a vital condition for ensuring the future viability of the EU tantalum industry.

Share Megasector
Capacitors Cemented carbides (tools) Aerospace & automobile Process equipment Surgical applications and other
60% Electronics & ICT 16% Mechanical Equipment 14% Road transport 4% Mechanical Equipment 6% Electronics & ICT
0,3 0,3 0,7 0,7 0,7
Substitutability index Recycling rate (recycled content) Import Dependence
0,40 4%
100%
Results
Economic Importance Supply Risk Environmental Country Risk
7,4 1,1 0,7
Tantalum 193
Use Subst.
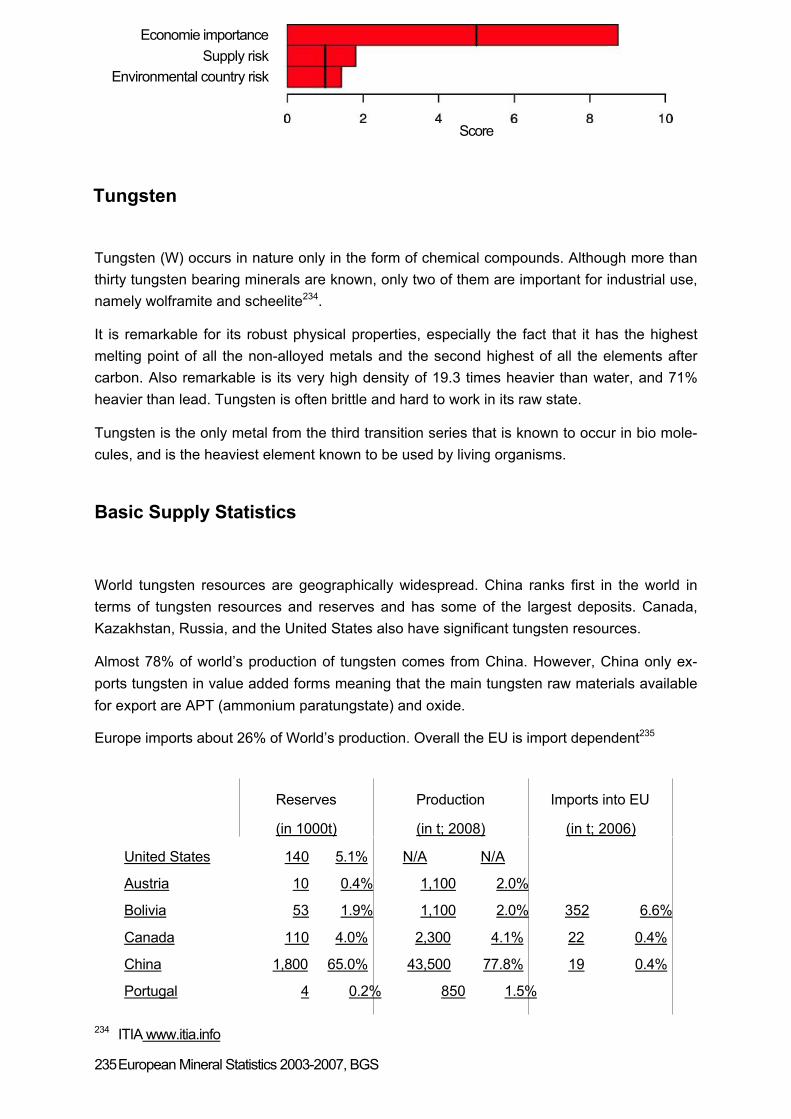
Tungsten (W) occurs in nature only in the form of chemical compounds. Although more than thirty tungsten bearing minerals are known, only two of them are important for industrial use, namely wolframite and scheelite234.
It is remarkable for its robust physical properties, especially the fact that it has the highest melting point of all the non-alloyed metals and the second highest of all the elements after carbon. Also remarkable is its very high density of 19.3 times heavier than water, and 71% heavier than lead. Tungsten is often brittle and hard to work in its raw state.
Tungsten is the only metal from the third transition series that is known to occur in bio mole-cules, and is the heaviest element known to be used by living organisms.
Basic Supply Statistics
World tungsten resources are geographically widespread. China ranks first in the world in terms of tungsten resources and reserves and has some of the largest deposits. Canada, Kazakhstan, Russia, and the United States also have significant tungsten resources.
Almost 78% of world’s production of tungsten comes from China. However, China only ex-ports tungsten in value added forms meaning that the main tungsten raw materials available for export are APT (ammonium paratungstate) and oxide.
Europe imports about 26% of World’s production. Overall the EU is import dependent235
Reserves
(in 1000t)
Production
(in t; 2008)
Imports into EU
(in t; 2006)
United States 140 5.1% N/A N/A
Austria 10 0.4% 1,100 2.0%
Bolivia 53 1.9% 1,100 2.0% 352 6.6%
Canada 110 4.0% 2,300 4.1% 22 0.4%
China 1,800 65.0% 43,500 77.8% 19 0.4%
Portugal 4 0.2% 850 1.5%
234 ITIA www.itia.info
235 European Mineral Statistics 2003-2007, BGS
Economie importance Supply risk
Environmental country risk
Score
Tungsten

Russia 250 9.0% 3,000 5.4% 4026 75.6%
Other countries 400 14.5% 4,100 7.3% 910 17.1%
World total 2,767 55,950 5,329
Source: USGS; UN Comtrade HS 2611
Origins 2007 EU Imports of Tungsten raw materials (in t)
Ores & con-centrates
APT Oxides
Russia 190 240 737
Kenya 68
Tanzania 57
USA 17 440 975
Canada 34
China 1 1 470 2,531
Total 2,790 2,190 4,320
Source: 2841 80 and 2825 90 40 expressed in W content
As noted above, Europe imports about 26% of World’s production: ~2 500 t W as ore, ~2 100 t W as APT and ~4 000 t W as oxides. There are two tungsten mines in production in the EU, in Portugal and in Austria (production of the latter is captive).
EU Tungsten Industry Structure
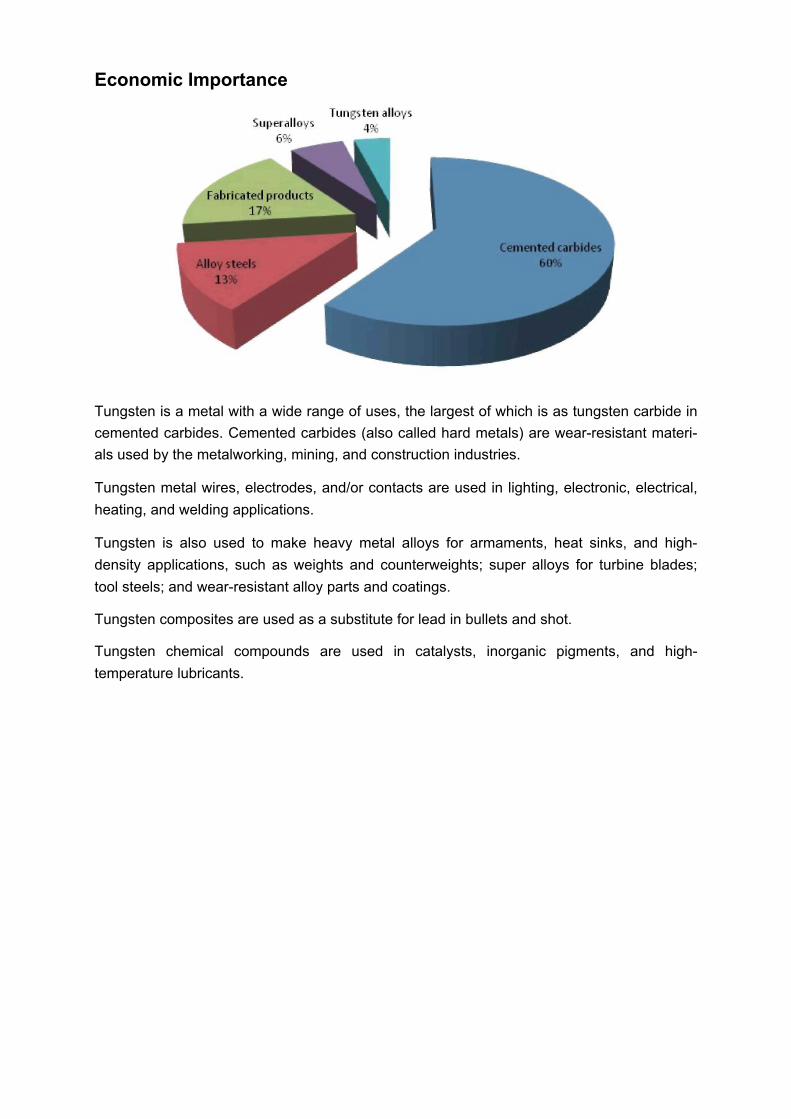
Economic Importance
Tungsten is a metal with a wide range of uses, the largest of which is as tungsten carbide in cemented carbides. Cemented carbides (also called hard metals) are wear-resistant materi-als used by the metalworking, mining, and construction industries.
Tungsten metal wires, electrodes, and/or contacts are used in lighting, electronic, electrical, heating, and welding applications.
Tungsten is also used to make heavy metal alloys for armaments, heat sinks, and high-density applications, such as weights and counterweights; super alloys for turbine blades; tool steels; and wear-resistant alloy parts and coatings.
Tungsten composites are used as a substitute for lead in bullets and shot.
Tungsten chemical compounds are used in catalysts, inorganic pigments, and high-temperature lubricants.

Application of Tungsten in Europe
Others 11%
Steel/Alloys 9%
Cemented Carbides
72%
Resource Efficiency: Recycling & Substitution
According to the ITIA, recycling is an important factor in the world's tungsten supply (see flow chart below), and the tungsten processing industry is able to treat almost every kind of tungsten-containing scrap and waste to recover tungsten, and, if present, other valuable constituents. Tungsten scrap, due to its high tungsten content in comparison to ore, is a valuable raw material. The recycling of scrap is very high in several countries but is probably in the range of 35-40% minimum as a global average depending on economic conditions.
Flowsheet of primary and secondary tungsten
Mill Products 8%

Contaminated cemented carbide scrap, turnings, grindings and powder scrap are oxidised and chemically processed to APT in a way similar to that used for the processing of tungsten ores. If present, cobalt, tantalum and niobium are recovered in separate processing lines. Other tungsten containing scrap and residues might require a modified process.
Clean cemented carbide inserts and compacts are converted to powder by the zinc process (treatment with molten zinc which is dissolved in the cobalt phase and is then distilled off, leaving a spongy material which is easily crushed). This powder is added back to the manu-facture of ready-to-press powder. By this process, not only tungsten carbide but also cobalt, tantalum carbide and other carbides are recycled.
Recycling of tungsten in high speed steel is high, and a typical melt contains 60 to 70% scrap, including internally generated scrap.
On the other hand, recycling in such applications as lamp filaments, welding electrodes and chemical uses is low. The reasons for this are that the use of tungsten in certain applications is dissipative (e.g. chemical applications) or the collection and recycling treatment of the products containing tungsten are insufficiently developed (e.g. lamps).
On the other hand, recycling in such applications as lamp filaments, welding electrodes and chemical uses is low.
Potential substitutes for cemented tungsten carbides include cemented carbides based on molybdenum carbide and titanium carbide, ceramics, ceramic-metallic composites (cermets), diamond tools, and tool steels.
Potential substitutes for other applications are as follows:
■ molybdenum for certain tungsten mill products;
■ molybdenum steels for tungsten steels;
■ lighting based on carbon nano-tube filaments, induction technology, and light-emitting diodes (LEDs) for lighting based on tungsten electrodes or filaments;
■ depleted uranium for tungsten alloys or unalloyed tungsten in weights and counter-weights; and
■ depleted uranium alloys for cemented tungsten carbides or tungsten alloys in armor-piercing projectiles.
In general, however, substitution would result in increased cost, a loss in product perform-ance or more toxic and less environmentally friendly material alternatives.
In some applications, substitution would result in either increased cost or in a loss of product performance.
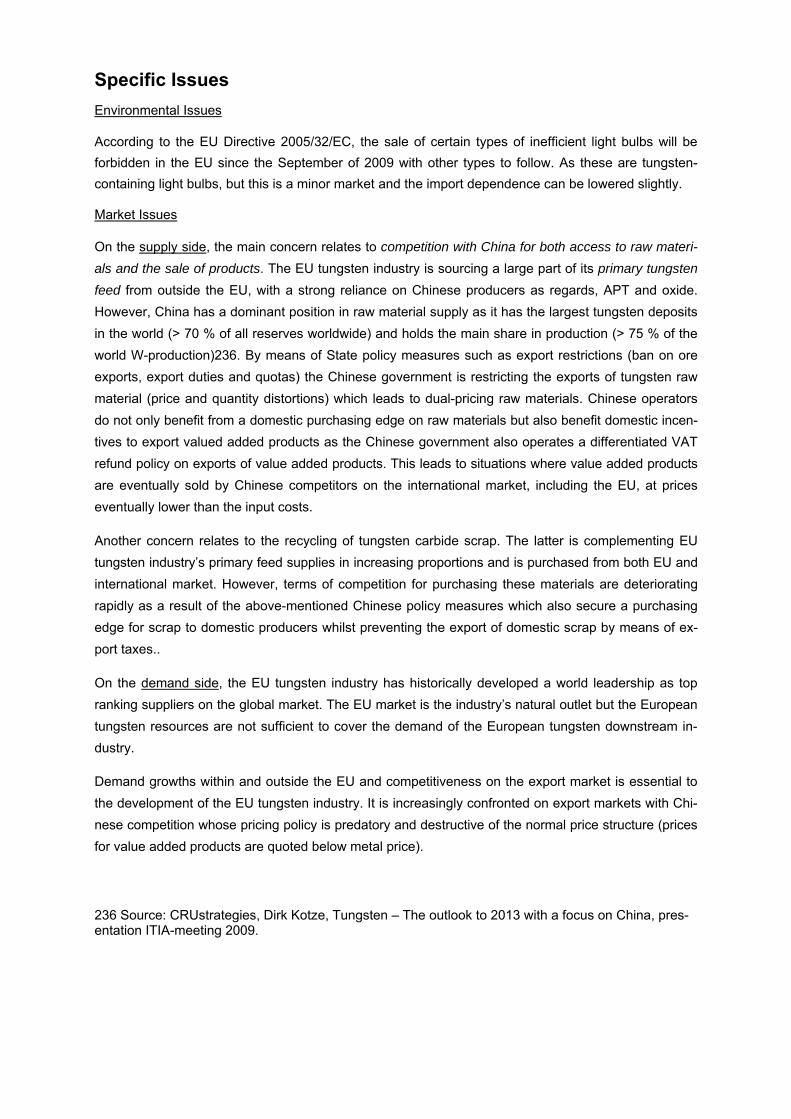
Specific Issues
Environmental Issues
According to the EU Directive 2005/32/EC, the sale of certain types of inefficient light bulbs will be forbidden in the EU since the September of 2009 with other types to follow. As these are tungsten-containing light bulbs, but this is a minor market and the import dependence can be lowered slightly.
Market Issues
On the supply side, the main concern relates to competition with China for both access to raw materi-als and the sale of products. The EU tungsten industry is sourcing a large part of its primary tungsten feed from outside the EU, with a strong reliance on Chinese producers as regards, APT and oxide. However, China has a dominant position in raw material supply as it has the largest tungsten deposits in the world (> 70 % of all reserves worldwide) and holds the main share in production (> 75 % of the world W-production)236. By means of State policy measures such as export restrictions (ban on ore exports, export duties and quotas) the Chinese government is restricting the exports of tungsten raw material (price and quantity distortions) which leads to dual-pricing raw materials. Chinese operators do not only benefit from a domestic purchasing edge on raw materials but also benefit domestic incen-tives to export valued added products as the Chinese government also operates a differentiated VAT refund policy on exports of value added products. This leads to situations where value added products are eventually sold by Chinese competitors on the international market, including the EU, at prices eventually lower than the input costs.
Another concern relates to the recycling of tungsten carbide scrap. The latter is complementing EU tungsten industry’s primary feed supplies in increasing proportions and is purchased from both EU and international market. However, terms of competition for purchasing these materials are deteriorating rapidly as a result of the above-mentioned Chinese policy measures which also secure a purchasing edge for scrap to domestic producers whilst preventing the export of domestic scrap by means of ex-port taxes..
On the demand side, the EU tungsten industry has historically developed a world leadership as top ranking suppliers on the global market. The EU market is the industry’s natural outlet but the European tungsten resources are not sufficient to cover the demand of the European tungsten downstream in-dustry.
Demand growths within and outside the EU and competitiveness on the export market is essential to the development of the EU tungsten industry. It is increasingly confronted on export markets with Chi-nese competition whose pricing policy is predatory and destructive of the normal price structure (prices for value added products are quoted below metal price).
236 Source: CRUstrategies, Dirk Kotze, Tungsten – The outlook to 2013 with a focus on China, pres-entation ITIA-meeting 2009.
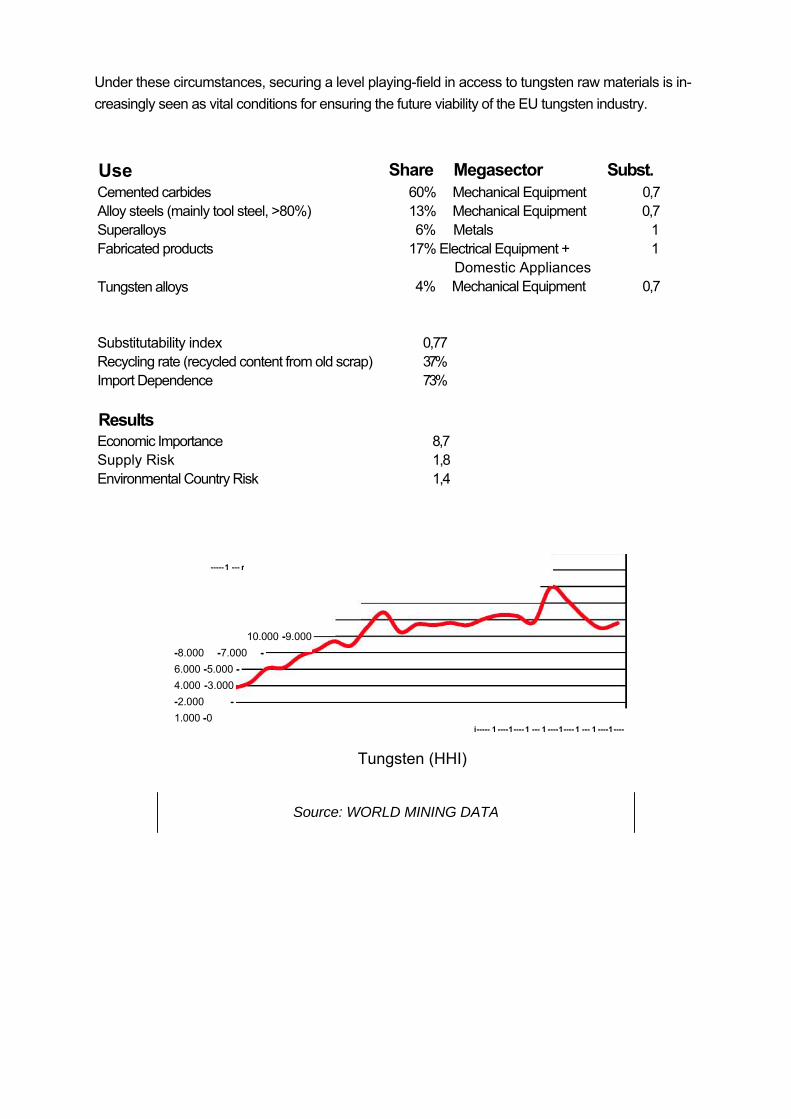
Under these circumstances, securing a level playing-field in access to tungsten raw materials is in-creasingly seen as vital conditions for ensuring the future viability of the EU tungsten industry.
Use Share Megasector Subst.
Cemented carbides Alloy steels (mainly tool steel, >80%) Superalloys Fabricated products
Tungsten alloys
60% Mechanical Equipment 0,7 13% Mechanical Equipment 0,7 6% Metals 1
17% Electrical Equipment + 1 Domestic Appliances
4% Mechanical Equipment 0,7
Substitutability index 0,77 Recycling rate (recycled content from old scrap) 37% Import Dependence 73%
Results Economic Importance Supply Risk Environmental Country Risk
8,7 1,8 1,4
10.000 -9.000 -8.000 -7.000 -6.000 -5.000 -4.000 -3.000 -2.000 -1.000 -0
i ----- 1 ---- 1 ---- 1 --- 1 ---- 1 ---- 1 --- 1 ---- 1 ----
Tungsten (HHI)
Source: WORLD MINING DATA
----- 1 --- r