anticyclones cause weather too: an understanding of worldwide strong anticyclones and...
Post on 22-Dec-2015
218 views
TRANSCRIPT

Anticyclones Cause Weather Too: An Understanding of Worldwide
Strong Anticyclones and Anticyclogenesis
Matthew L. Doody, Lance Bosart and Daniel Keyser
Department of Earth and Atmospheric Sciences, University at Albany, State University of New York, Albany, New York
NROW VIII 1-2 November, 2006
NSF ATM-0434189

Purposes
• Examine global regions where strong anticyclones and anticyclogenesis occur.
• Determine various thresholds and timescales to enhance the climatology.
• Find any possible interannual variability.
• Link strong anticyclones to geographical features.
• Lead into a study of predictability of strong anticyclones and anticyclogenesis.

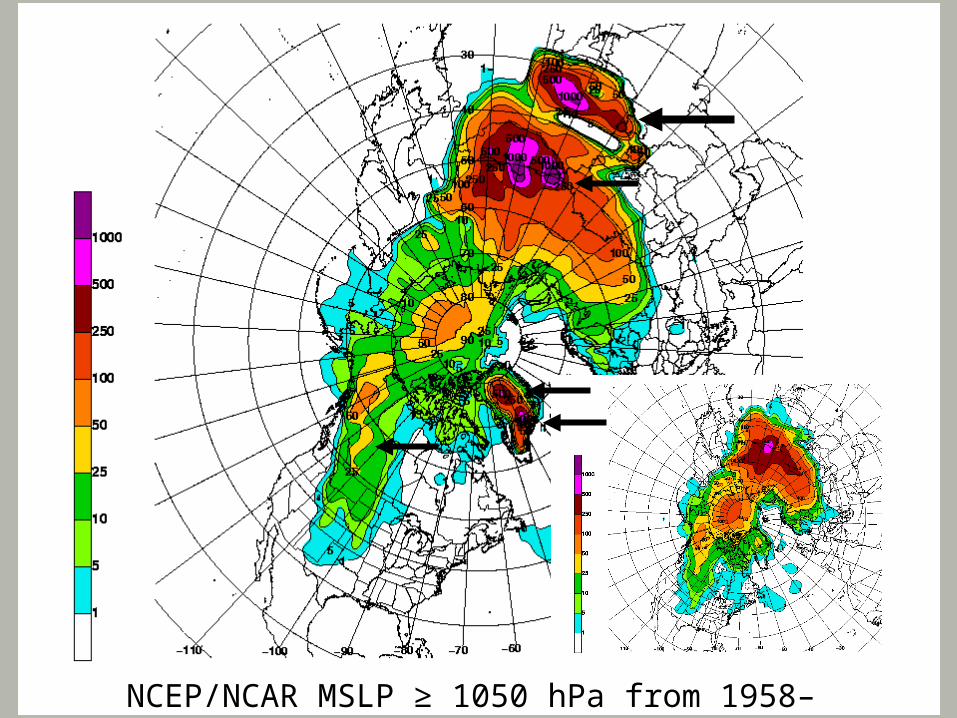
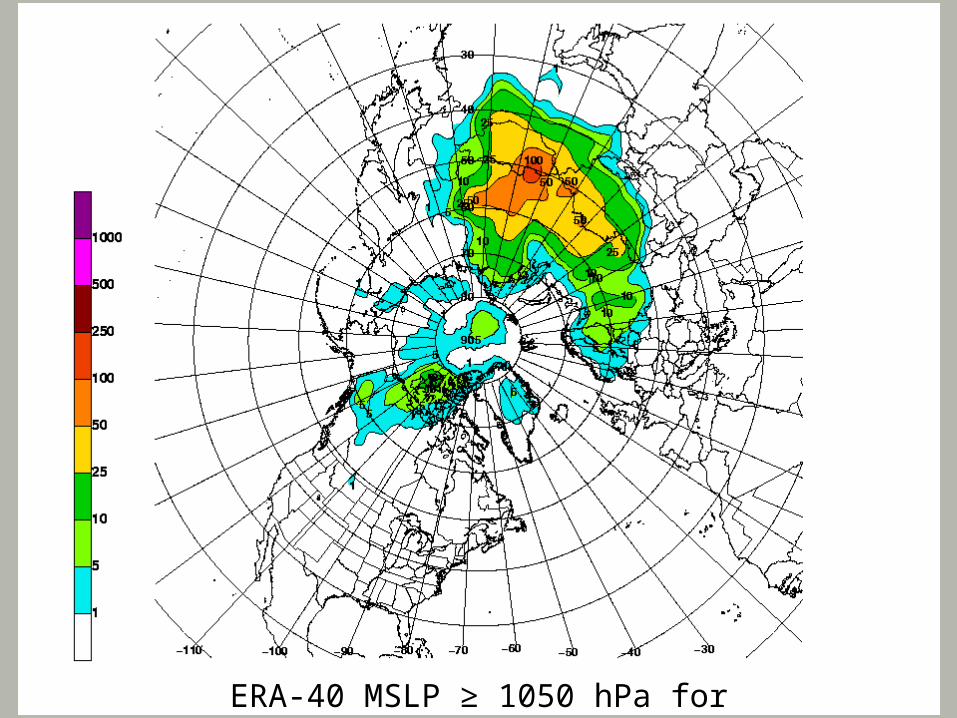
Data and Methodology• Data used consisted of:
NCEP/NCAR Global Reanalysis at 2.5° resolution.ECMWF ERA-40 Global Reanalysis at
2.5° resolution.Both data sets were used from 1958–
2000• Thresholds were set for the MSLP.• At each gridpoint a counter was used to sum
the number of times the MSLP ≥ the threshold.• Counts were only done at 0000 and 1200 UTC
to mitigate double counting.

Data and Methodology
• After tabulation of the data it was then contoured objectively to show the regions where the threshold was met or exceeded.
• It is important to note that the figures that follow do not count coherent closed anticyclones, but simply the number of times the MSLP met or exceeded the defined threshold.

Outline
• Compare and contrast the two datasets.
• Examine the Northern Hemisphere (NH) at various thresholds as well as at monthly timescales.
• Same as above for the Southern Hemisphere (SH).
• Interannual variability.
• Time series of maximum count for ≥ 1050 hPa for each year throughout the datasets.

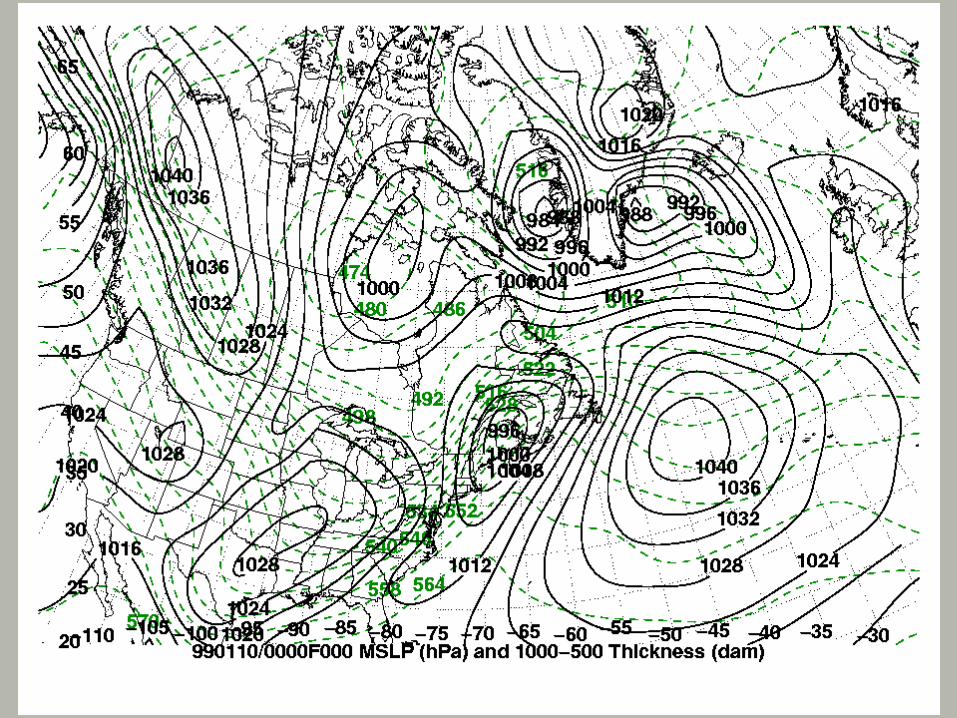
http://www.lpi.usra.edu/education/fieldtrips/2005/maps/index.html

ERA-40 MSLP ≥ 1050 hPa from 1958–2000
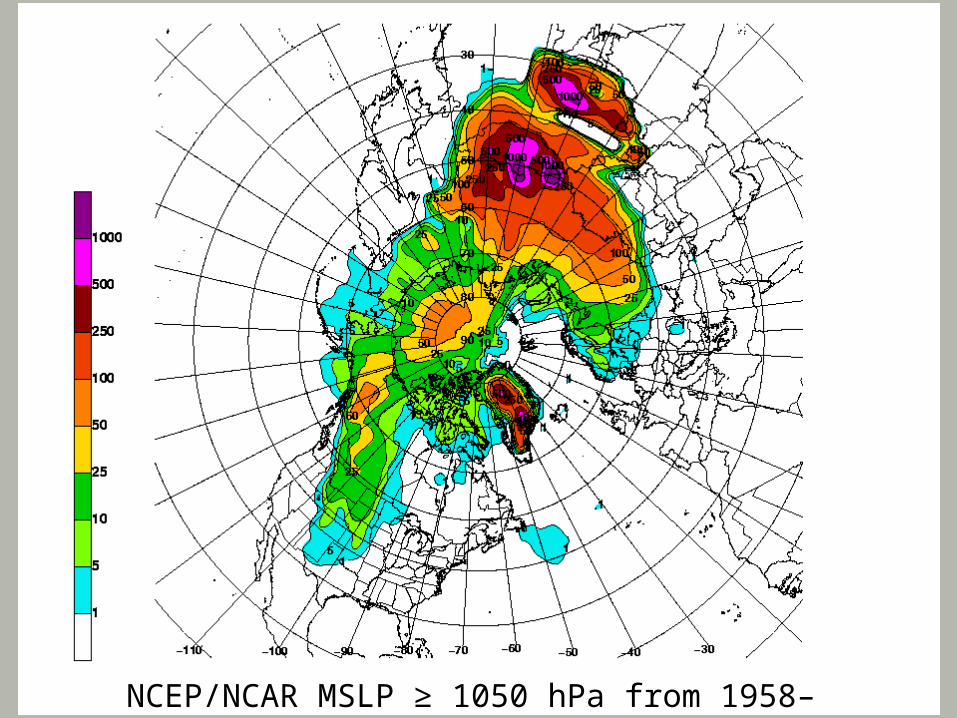
NCEP/NCAR MSLP ≥ 1050 hPa from 1958–2000
NCEP/NCAR MSLP ≥ 1050 hPa from 1958–2000

ERA-40 MSLP ≥ 1040 hPa from 1958–2000

ERA-40 MSLP ≥ 1060 hPa from 1958–2000

Northern Hemisphere Winter
Threshold: ≥ 1050 hPa

ERA-40 MSLP ≥ 1050 hPa for October
ERA-40 MSLP ≥ 1050 hPa for November

ERA-40 MSLP ≥ 1050 hPa for December

ERA-40 MSLP ≥ 1050 hPa for January

ERA-40 MSLP ≥ 1050 hPa for February

ERA-40 MSLP ≥ 1050 hPa for March
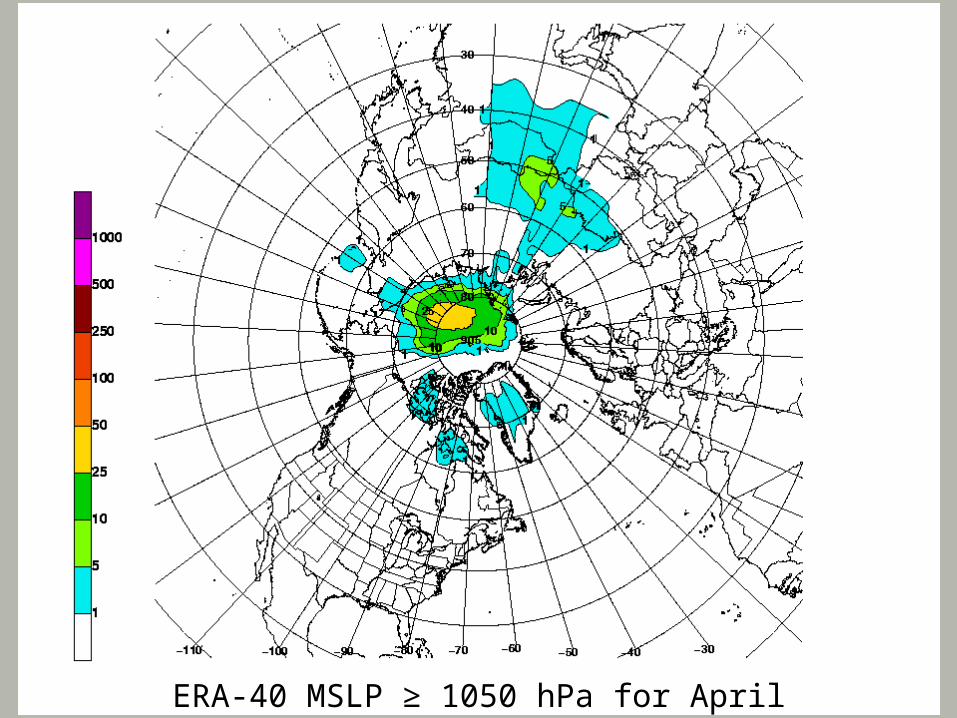
ERA-40 MSLP ≥ 1050 hPa for April
Northern Hemisphere Summer
Threshold: ≥ 1035 hPa

ERA-40 MSLP ≥ 1035 hPa for May
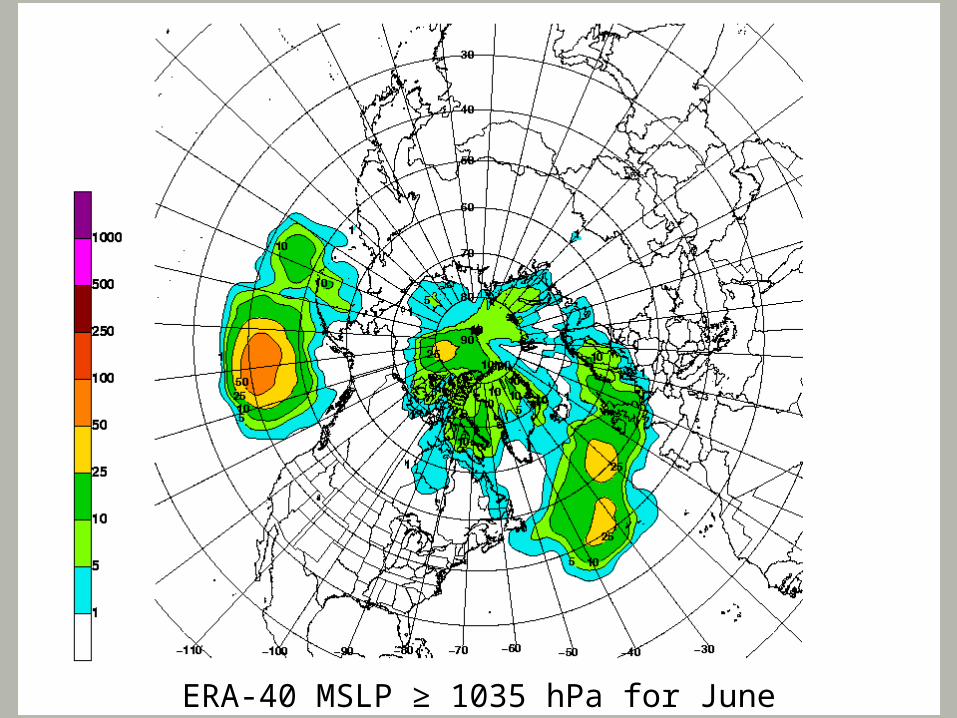
ERA-40 MSLP ≥ 1035 hPa for June

ERA-40 MSLP ≥ 1035 hPa for July

ERA-40 MSLP ≥ 1035 hPa for August

ERA-40 MSLP ≥ 1035 hPa for September

Southern Hemisphere

ERA-40 MSLP ≥ 1040 hPa from 1958–2000

Hoskins and Hodges (2005)

ERA-40 MSLP ≥ 1050 hPa from 1958–2000
Southern Hemisphere Winter
Threshold: ≥ 1040 hPa

ERA-40 MSLP ≥ 1040 hPa for May
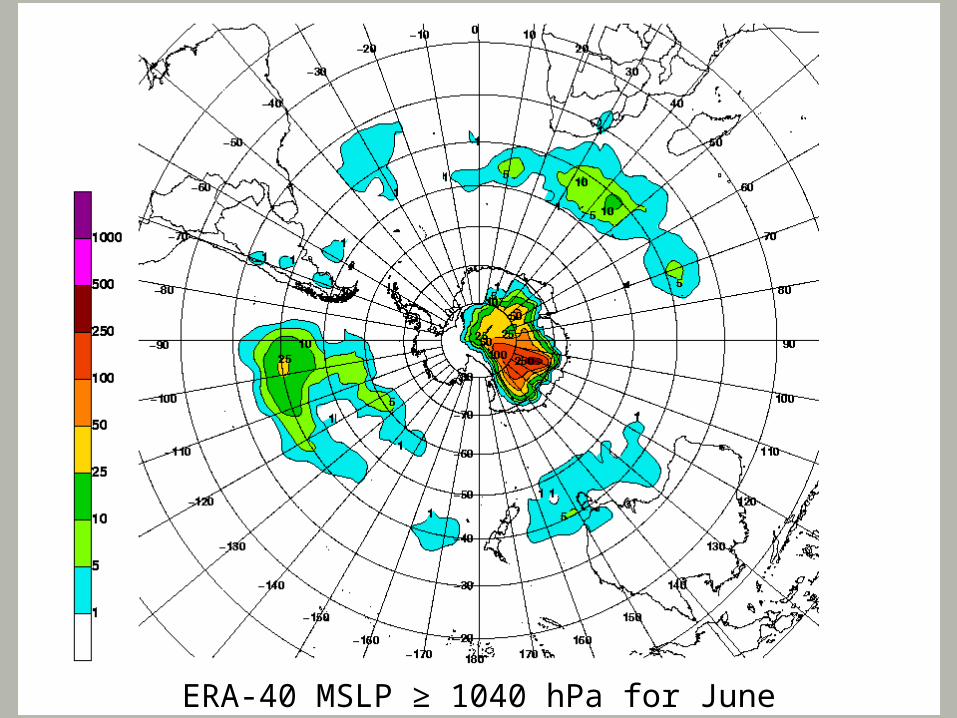
ERA-40 MSLP ≥ 1040 hPa for June
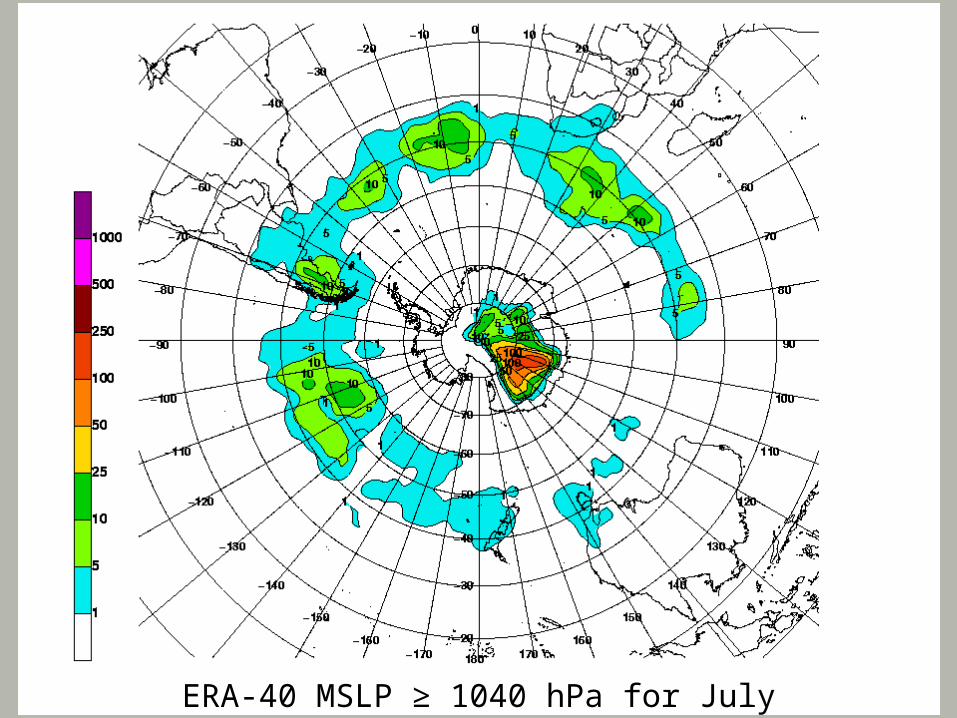
ERA-40 MSLP ≥ 1040 hPa for July
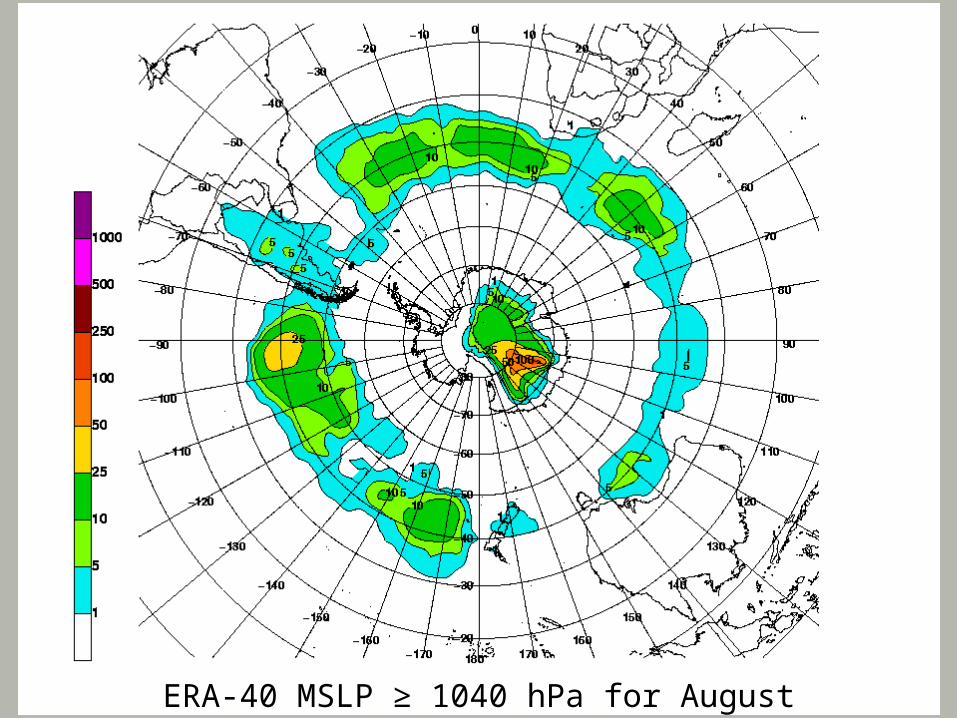
ERA-40 MSLP ≥ 1040 hPa for August
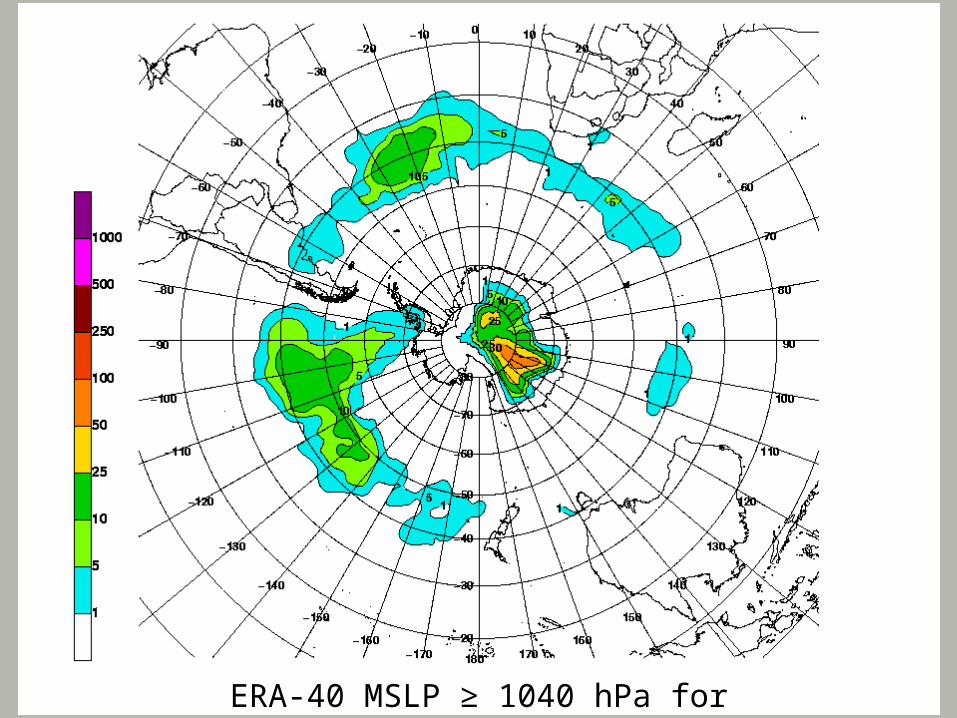
ERA-40 MSLP ≥ 1040 hPa for September

ERA-40 MSLP ≥ 1040 hPa for October

Southern Hemisphere Summer
Threshold: ≥ 1035 hPa

ERA-40 MSLP ≥ 1035 hPa for November

ERA-40 MSLP ≥ 1035 hPa for December
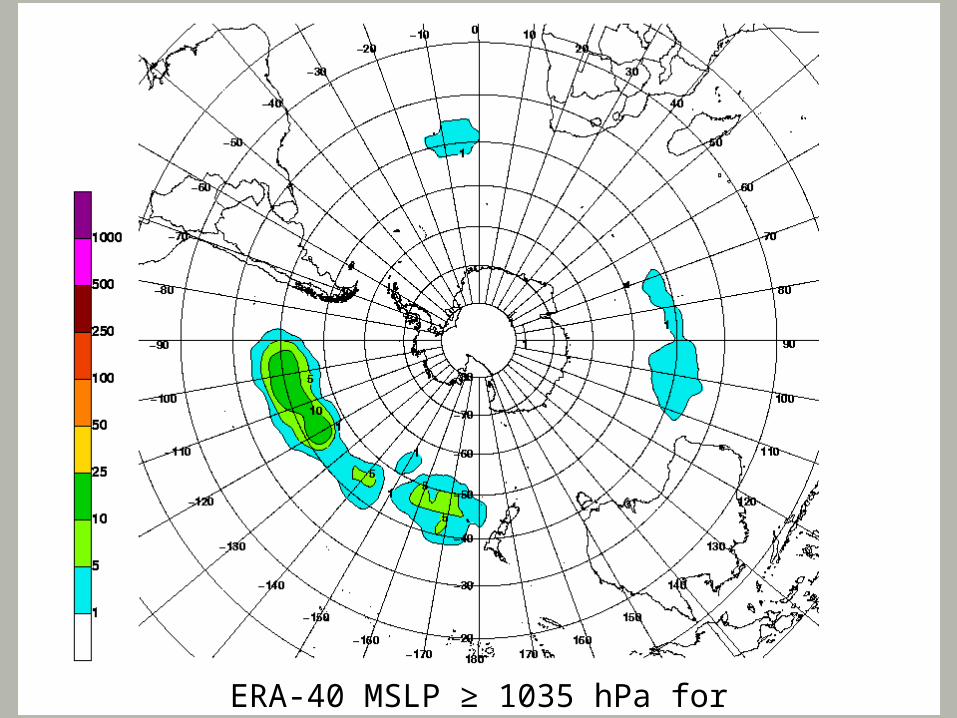
ERA-40 MSLP ≥ 1035 hPa for January

ERA-40 MSLP ≥ 1035 hPa for February

ERA-40 MSLP ≥ 1035 hPa for March

ERA-40 MSLP ≥ 1035 hPa for April
Interannual Variability
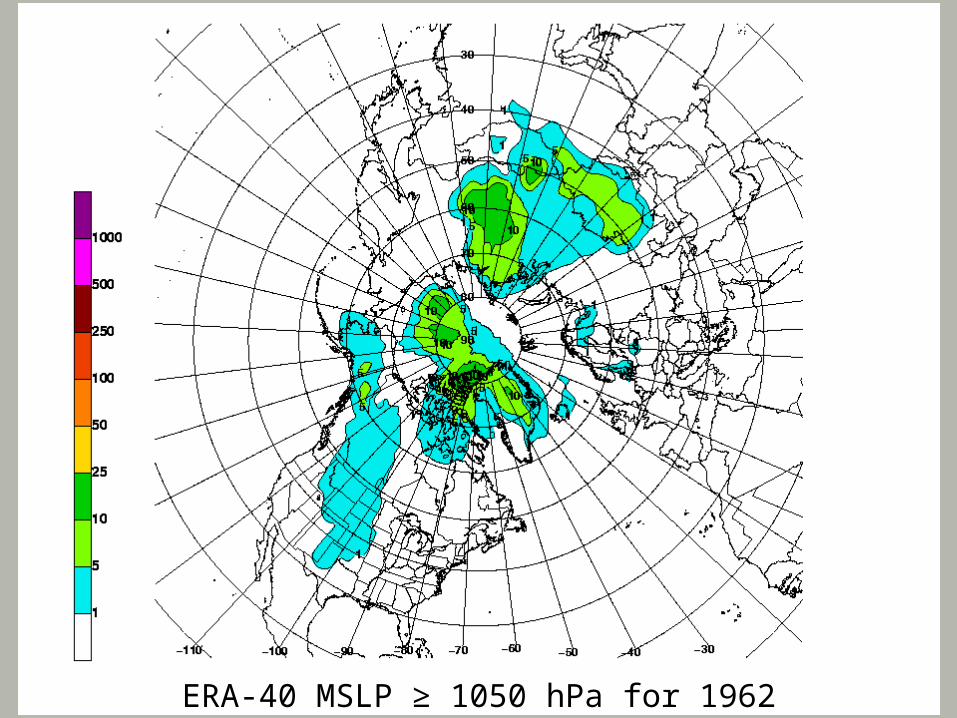
ERA-40 MSLP ≥ 1050 hPa for 1962
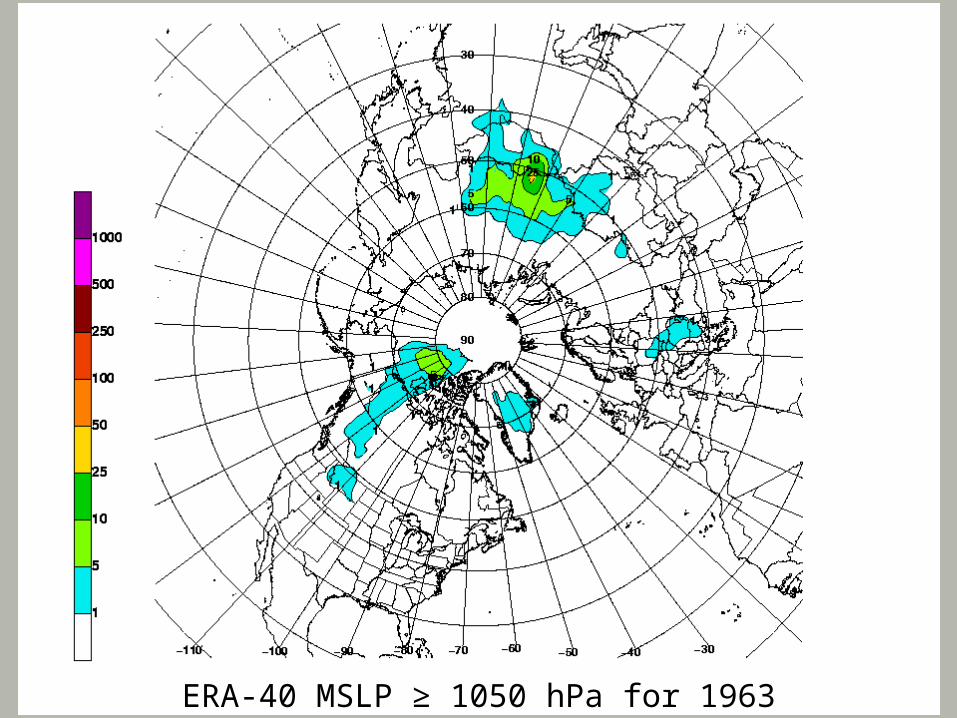
ERA-40 MSLP ≥ 1050 hPa for 1963
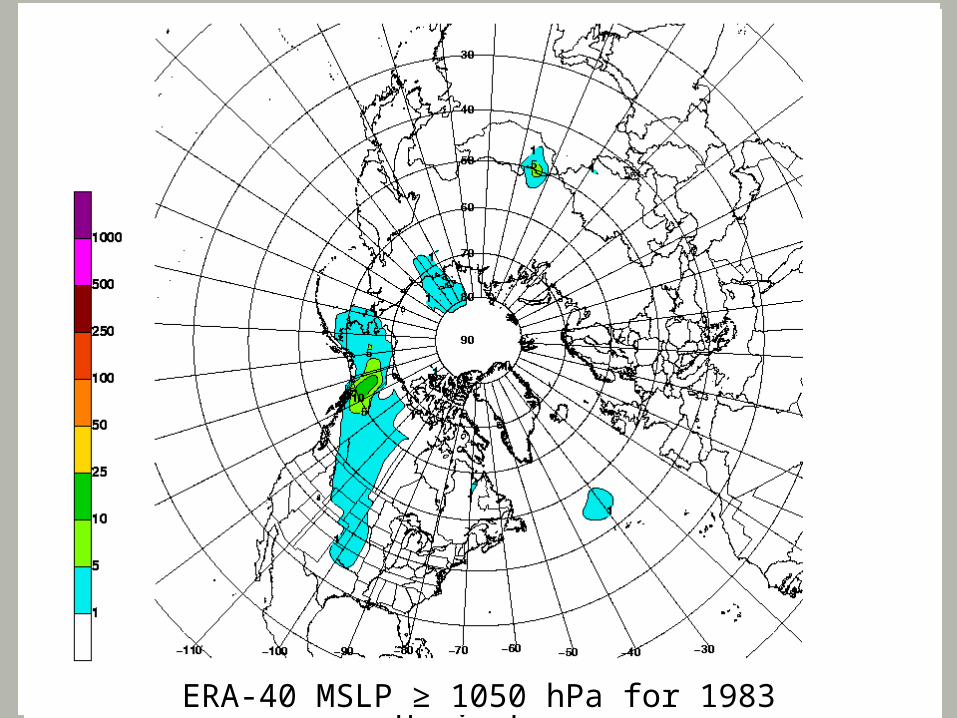
ERA-40 1050+ for 1983 Western HemisphereERA-40 MSLP ≥ 1050 hPa for 1983
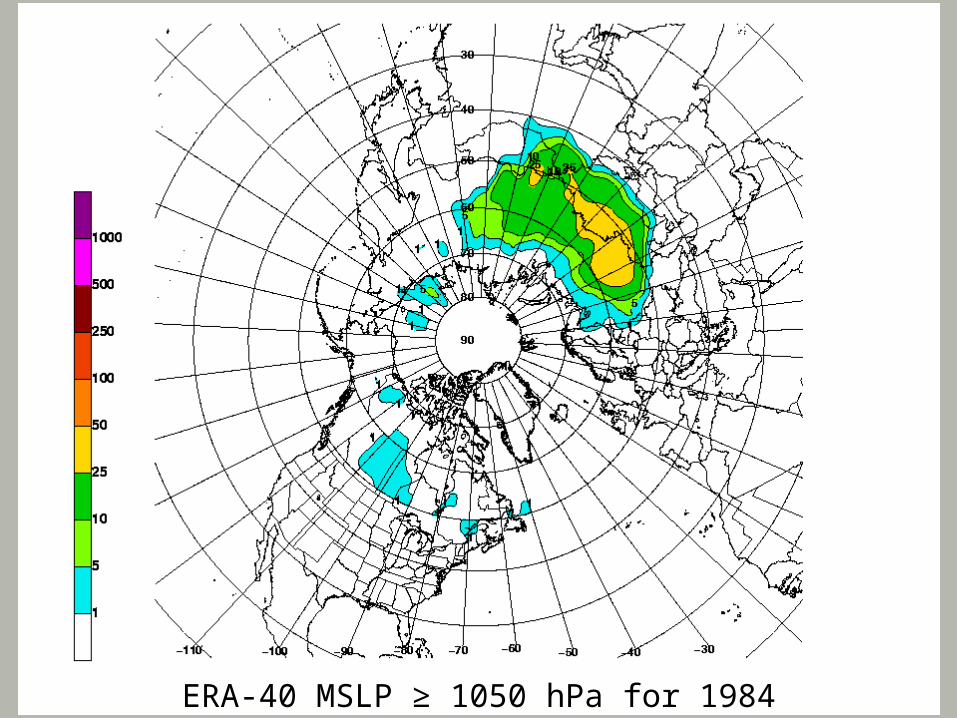
ERA-40 MSLP ≥ 1050 hPa for 1984

Time Series Of Maximum Count In The NH For Each Year

Maximum 1050+ Count From ERA-40
y = -0.2818x + 33.944
0
10
20
30
40
50
60
70
80
90
100
1958
1960
1962
1964
1966
1968
1970
1972
1974
1976
1978
1980
1982
1984
1986
1988
1990
1992
1994
1996
1998
2000
Year
Max
imu
m
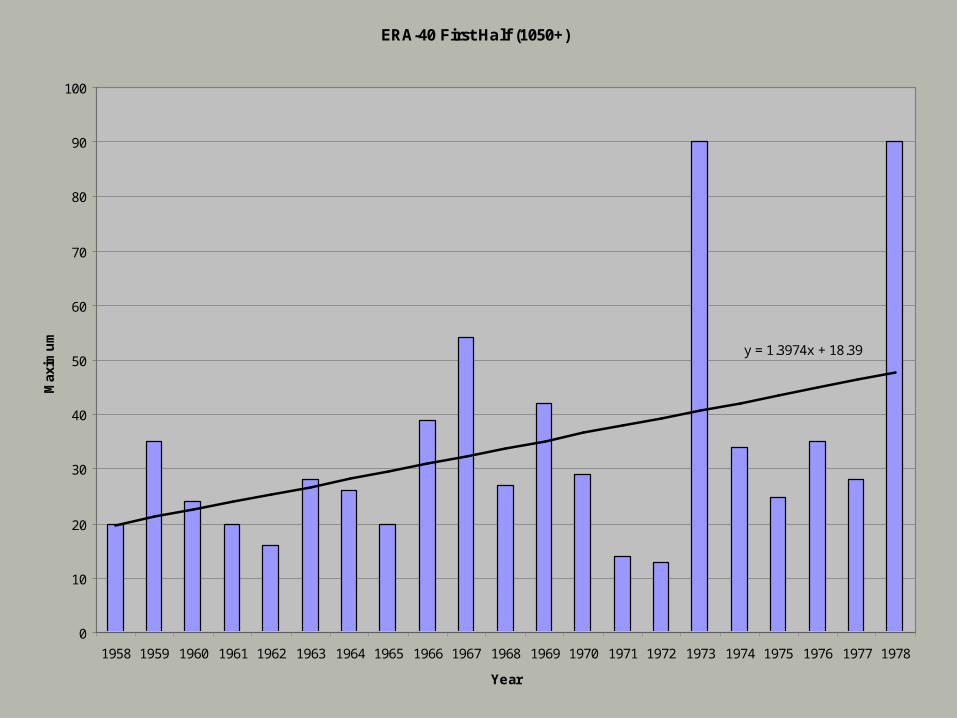
ERA-40 First Half (1050+)
y = 1.3974x + 18.39
0
10
20
30
40
50
60
70
80
90
100
1958 1959 1960 1961 1962 1963 1964 1965 1966 1967 1968 1969 1970 1971 1972 1973 1974 1975 1976 1977 1978
Year
Max
imu
m
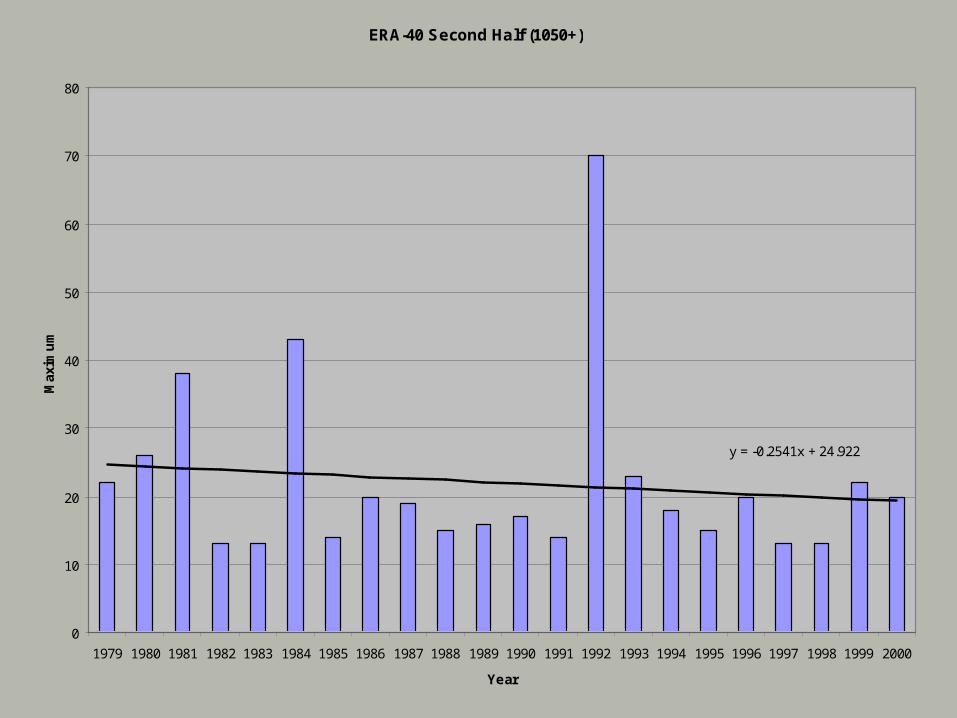
ERA-40 Second Half (1050+)
y = -0.2541x + 24.922
0
10
20
30
40
50
60
70
80
1979 1980 1981 1982 1983 1984 1985 1986 1987 1988 1989 1990 1991 1992 1993 1994 1995 1996 1997 1998 1999 2000
Year
Max
imu
m
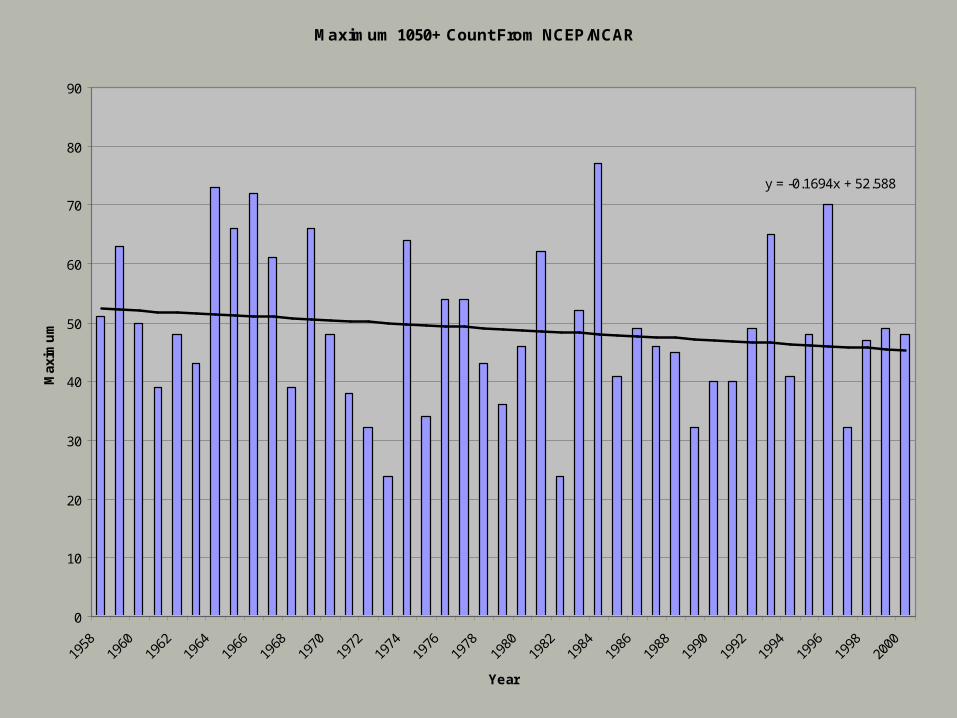
Maximum 1050+ Count From NCEP/NCAR
y = -0.1694x + 52.588
0
10
20
30
40
50
60
70
80
90
1958
1960
1962
1964
1966
1968
1970
1972
1974
1976
1978
1980
1982
1984
1986
1988
1990
1992
1994
1996
1998
2000
Year
Max
imu
m

NCEP/NCAR First Half (1050+)
y = -0.5896x + 57.057
0
10
20
30
40
50
60
70
80
1958 1959 1960 1961 1962 1963 1964 1965 1966 1967 1968 1969 1970 1971 1972 1973 1974 1975 1976 1977 1978
Year
Max
imu
m
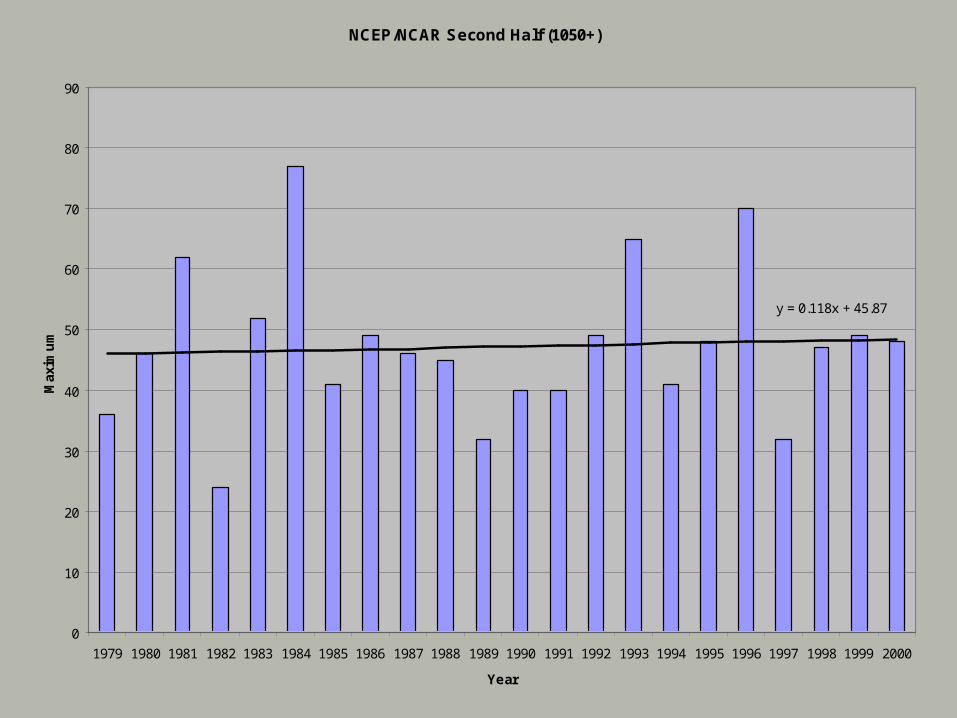
NCEP/NCAR Second Half (1050+)
y = 0.118x + 45.87
0
10
20
30
40
50
60
70
80
90
1979 1980 1981 1982 1983 1984 1985 1986 1987 1988 1989 1990 1991 1992 1993 1994 1995 1996 1997 1998 1999 2000
Year
Max
imu
m

Conclusions• ERA-40 was better at masking terrain than NCEP/NCAR.• Cool season maxima occurred primarily over the
continents while warm season maxima occurred primarily over the oceans in the NH.
• Distinct variability on the interannual timescale between the eastern and western halves of the NH.
• SH strong anticyclones tend to occur along time-mean storm track.
• Seasonal threshold contrast much smaller in SH due to oceans.
• SH contintental maxima tend to occur on lee of higher terrain.
• Both data sets support a decline in high threshold count during latter half of twentieth century.

Future Work
• Understand dynamical reasons for SH strong anticyclones remaining in time-mean storm track.
• Relate interannual variability to global teleconnections.
• Learn role of arctic-extratropical interactions to strong anticyclones and anticyclogenesis.
• Discuss key predictability issues associated with these anticyclones and their associated cold surges.

Thank [email protected]
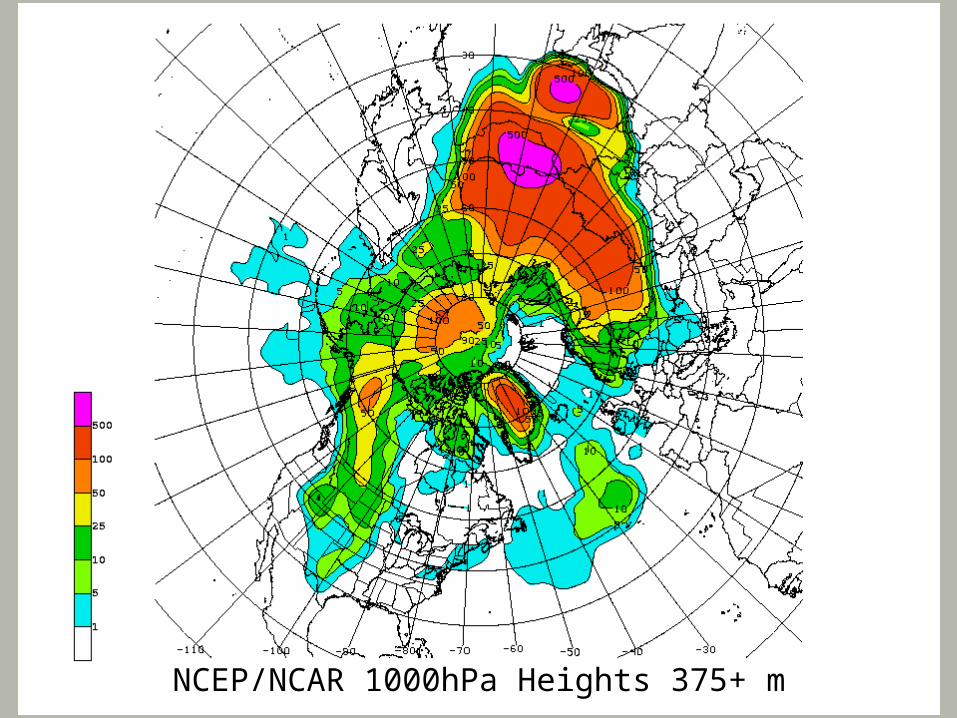
NCEP/NCAR 1000hPa Heights 375+ m