anthropometric survey manual completever...crs anthropometric survey manual page i acknowledgements...
TRANSCRIPT

Anthropometric Survey Manual
Catholic Relief Services 209 West Fayette Street Baltimore, MD, USA

CRS Anthropometric Survey Manual Page i
ACKNOWLEDGEMENTS The authors would like to thank the following for their role in testing and commenting on the manual. Participants in a workshop on anthropometry - organized by Save the Children in Washington, DC in 1998 -, CRS The Gambia, GAFNA, and the Ministry of Health of The Gambia pre-tested the sections of the manual that describe data analysis. Participants at a workshop held for CRS field health staff in Nairobi, Kenya in June 1998 provided valuable comments on an early draft and suggested ways to make it more “user friendly” and adaptable to a variety of audiences. Bruce Cogill of the FANta Project at the Academy for Educational Development (AED), Laura Caulfield of Johns Hopkins University School of Public Health, Bart Burkhalter of BASICS and AED and Roy Miller (then of AED) deserve special thanks as well for participating in a consultative group convened by CRS to discuss many issues related to anthropometric surveys Paul Macek then of CRS/Benin and the CRS Benin health team deserve a special thanks for sharing their experiences with anthropometric studies and critically evaluating and testing the manual. The CRS Guatemala team also provided useful comments and insights based on their experiences as well. A special thanks goes to Vicki Denman for valuable comments and keen insights. Finally Irwin Shorr graciously gave his time to reviewing and commenting on the manual and provided key resources for it. His commitment to quality in training and documentation is greatly appreciated. Permission was obtained from Oxford University Press to include the article: International Journal of Epidemiology, Vol 25, No. 1, pp 198-203. “A Not Quite as Quick but Much Cleaner Alternative to the Expanded Programme on Immunization (EPI) Cluster Survey Design.” Permission was obtained from the World Health Organization to include the following articles: WHO Working Group. Use and interpretation of anthropometric indicators of nutritional status. Bulletin of the World Health Organization, 64(6):929-941, 1986. Gorstein J, Sullivan K, Yip R, de Onis M, Trowbridge F, Fajans P, Clugston G. Issues in the assessment of nutritional status using anthropometry. Bulletin of the World Health Organization, 72(2): 273-283, 1994. Permission was obtained from Lippincott Williams & Wilkins to include an excerpt from Linear Growth Retardation in Less Developed Countries. This publication was made possible through support provided by The Partnership for Child Health Care, Inc./BASICS with financing form the US Agency for International Development, under the terms of Contract No. HRN-C-00-93-00031-00. Support was also provided by the office of Food for Peace, Bureau for Humanitarian Response, United States Agency for International Development, under the terms of Grant No. FAO-0801-G-3034-00. The opinions expressed herein are those of the author(s) and do not necessarily reflect the views of the US Agency for International Development or the BASICS project.

CRS Anthropometric Survey Manual Page ii
TABLE OF CONTENTS ACKNOWLEDGEMENTS ............................................................................................................i TABLE OF CONTENTS AND BOXES ........................................................................................ii ACRONYMS AND INITIALS .......................................................................................................v NOTE TO THE READER ..............................................................................................................vi SECTION ONE: ANSWERS TO GENERAL QUESTIONS ABOUT ANTHROPOMETRIC SURVEYS
1. What Is An Anthropometric Survey? ............................................................................1 2. Why Should CRS Projects Do The Survey?..................................................................2 3. When Should CRS Projects Do The Survey? ................................................................4 4. Who Should Be On The Survey Team?.........................................................................4 5. Who Should Design The CRS Survey? .........................................................................5 6. Who Should Do The CRS Survey?................................................................................5 7. Who Should Process The Data?.....................................................................................6 8. Who Should Analyze The Data?....................................................................................6 9. Who Should Write The Report? ....................................................................................7 10. Who Should Surveyors Measure?..................................................................................7 11. How Many Children Should Surveyors Measure? ........................................................8 12. How Should the Survey Team Find Children To Measure?..........................................9 13. How Should Surveyors Measure Children?.................................................................10 14. How Should Surveyors Record Measurements?..........................................................11 15. How Should Data Processors Handle The Data?.........................................................12 16. How Should Data Analysts Handle The Data?............................................................12 17. What Should The Report Contain? ..............................................................................12 18. How Should CRS Projects Use The Report?...............................................................16 19. How Much Time Will The Survey Take?....................................................................16 20. What Equipment Will The Survey Team Need? .........................................................16 21. How Much Will The Survey Cost?..............................................................................16
SECTION TWO: HOW TO DO AN ANTHROPOMETRIC SURVEY
1. Preparing for the Survey ..............................................................................................17 1.1 Determining Survey Objectives.......................................................................17 1.2 Identifying the Survey Team ...........................................................................18 1.3 Preparing a Time Schedule ..............................................................................22 1.4 Preparing a Scope of Work for the Survey Team............................................24 1.5 Determining the Sampling Methodology.........................................................25 1.6 Determining the Size of the Sample ................................................................25 1.7 Gathering Population Data for Sampling Purposes .........................................29

CRS Anthropometric Survey Manual Page iii
1.8 Selecting Clusters...................................................................................................33 1.9 Obtaining Permission to Do the Survey.................................................................59 1.10 Adapting the Survey Questionnaire .......................................................................59 1.11 Making Copies of the Questionnaire .....................................................................61 1.12 Obtaining Maps......................................................................................................61 1.13 Preparing Transportation Plans..............................................................................61 1.14 Obtaining Measuring Instruments..........................................................................61 1.15 Preparing Training Plans........................................................................................62 1.16 Recruiting and Training Surveyors and Survey Supervisors Selecting a Training Site........................................................................................64 1.17 Getting Ready for Data Analysis ...........................................................................72
2. Doing the Survey ...............................................................................................................73
2.1 Finding Children to Measure .................................................................................73 2.2 Estimating the Age of the Child.............................................................................82 2.3 Measuring Children, Completing Survey Questionnaires, Ensuring Quality........87
3. Entering, Analyzing, and Presenting Data.......................................................................113 4. Using Survey Findings.....................................................................................................145 APPENDICES Appendix A Epi Info .................................................................................................................A1 Appendix B “A Not Quite as Quick but Much Cleaner Alternative to the Expanded Programme
on Immunization (EPI) Cluster Survey Design (International Journal of Epidemiology) ........................................................................................................B1
Appendix C “Issues in the assessment of nutritional status using anthropometry (Bulletin of the World Health Organization) ..................................................................................C1
Appendix D “Use and interpretation of anthropometric indicators of nutritional status (WHO Working Group, Bulletin of the World Health Organization) ...............................D1
Appendix E “Poverty and Stature in Children” (excerpt from Linear Growth Retardation in Less Developed Countries)..................................................................................... E1
Appendix F Glossary ................................................................................................................ F1 BOXES Section One Box 1.1 Anthropometric Survey, Baja Verapaz and Izabal, Guatemala, 1997 Excerpts from Executive Summary ...............................................................................1 Box 2.1 Excerpts from Reports on Meeting of Anthropometry Consultative Group Purpose of Anthropometric Surveys..............................................................................2 Box 2.2 Excerpts from Letter from Office of Food for Peace to CRS, Part 1.............................3 Box 3.1 Excerpts from Letter from Office of Food for Peace to CRS, Part II ............................4

CRS Anthropometric Survey Manual Page iv
Box 10.1 Excerpts from Report on Meeting of Anthropometry Consultative Group Sampling Issues .............................................................................................................7 Box 10.2 Excerpts from Letter from Office of Food for Peace to CRS, Part III...........................8 Box 11.1 Excerpts from Report on Meeting of Anthropometry Consultative Group Sampling Issues .............................................................................................................9 Box 13.1 How to Weigh and Measure Children .........................................................................11 Box 17.1 “Primary Health Care for Mothers and Children” Project, Report on Anthropometric
Survey, Baja Verapaz and Izabal, Guatemala Table of Contents.........................................................................................................13 Box 17.2 “Primary Health Care for Mothers and Children” Project, Report on Anthropometric
Survey, Baja Verapaz and Izabal, Guatemala Table 1 Anthropometric Indicators for Baja Verapaz and Izabal ................................13 Box 17.3 “Primary Health Care for Mothers and Children” Project, Report on Anthropometric
Survey, Baja Verapaz and Izabal, Guatemala Table 2 Severity of Undernutrition in Baja Verapaz and Izabal..................................14 Box 17.4 “Primary Health Care for Mothers and Children” Project, Report on Anthropometric
Survey, Baja Verapaz and Izabal, Guatemala Table A10.1.8 Mean Z-Score: Height for Age – by Age Group and Sex...................14 Box 17.5 “Primary Health Care for Mothers and Children” Project, Report on Anthropometric
Survey, Baja Verapaz and Izabal, Guatemala Figure 1 Distribution of Height for Age Z-Scores.......................................................15 Box 17.6 “Primary Health Care for Mothers and Children” Project, Report on Anthropometric
Survey, Baja Verapaz and Izabal, Guatemala Figure 4 Low Height for Age.......................................................................................15 Section Two Box 1 Excerpts from Report on Anthropometric Survey, Baja Verapaz and Izabal, Guatemala, 1997........................................................................................17 Box 2 Objectives of Child Health Survey, The Gambia, 1998 ..............................................18 Box 3 Number of People Required for Anthropometric Survey ............................................21 Box 4 Determining the Number of Survey Teams .................................................................21 Box 5 Computer Tabulation .................................................................................................144

CRS Anthropometric Survey Manual Page v
ACRONYMS AND INITIALS CI 95% Confidence interval BHR Bureau for Humanitarian Response CRS Catholic Relief Services DHS Demographic and Health Survey n Number (of children in the group described) FFP Food for Peace PL Public Law PSU Primary sampling unit UNICEF United Nations Children’s Fund USA United States of America WHO World Health Organization MOH Ministry of Health HAZ Height for Age z-score WAZ Weight for Age z-score WHZ Weight for Age z-score

CRS Anthropometric Survey Manual Page vi
NOTE TO THE READER This manual was developed to assist CRs, Field Offices engaged in Food Assisted Child Survival (FACS) activities, respond to USAID/BHR/FFP’s requirement that results reports include anthropometric data from population based surveys. While the manual is designed to guide Field Offices in this specific type of programming, it also provides an array of useful information and resources for all those conducting, or planning on hiring other to conduct, population-based anthropometric surveys. It is designed to introduce key issues at all levels of survey implementation, including planning, training, sampling, field work, analysis, and report writing. Section One of the manual answers general questions that CRS FACS Project Managers (and Country Representatives) may have about anthropometric surveys. It uses examples from CRS anthropometric surveys to explain what is involved in planning, doing, and writing about these surveys. Section Two of the manual gives specific guidance on planning, carrying out, and writing about anthropometric surveys. It contains copies of useful materials from published and unpublished literature. Readers who are already familiar with anthropometric surveys but need answers to specific questions can skip Section One and go directly to the relevant part of Section Two. Appendices C, D and E provide more detailed information on the subject of assessing nutritional status using anthropometry. If after reading the materials, readers still have questions, they should contact the following address: Program Quality and Support Department Catholic Relief Services 209 West Fayette Street Baltimore, MD, 21201, USA Phone: 1-410-625-2220 Fax: 1-410-234-3182 Comments and suggestions about the manual are welcome and should be directed to the above address. These comments will be incorporated in future versions of the manual.

CRS Anthropometric Survey Manual Page vii
Section One: Answers to General
Questions About Anthropometric Surveys

CRS Anthropometric Survey Manual-Section One: Answers to General Questions Page 17
1. WHAT IS AN ANTHROPOMETRIC SURVEY?
It is a survey to record the weights, heights, and ages of a sample of children in the project area. The survey team selects the sample in such a way that the children in the sample represent all children in the project area. The team measures children using weighing scales and height- measuring boards and, as much as possible, uses written documents to determine their ages. The data are then entered into a computer program. The program compares each child’s measurements with those of a reference group. The computer program then generates a summary of the findings of the survey. The summary contains three values that help project staff understand the extent of undernutrition in their area. These values answer the following questions: * Are children in the project area short for their age (low height for age)? * Do the children weigh less than they should at their age (low weight for age)? * Do the children weigh less than they should for their height (low weight for height)?
Box 1.1 summarizes an anthropometric survey done by CRS Guatemala in 1997.
Box 1.1 Anthropometric Survey, Baja Verapaz and Izabal, Guatemala, 1997
Excerpts from Executive Summary The second phase of the five-year project “Primary Health Care for Mothers and Children”began in October 1996 in the departments of Baja Verapaz and Izabal. In 1997, separatesurveys were carried out in the two departments to provide a baseline measure of theanthropometric status of children in the age group 18 - 35 months. The sampling universeconsisted of 67 communities in Baja Verapaz and 136 communities in Izabal. The samplingdesign called for a representative probability sample of 300 children in the age group 18 - 35months in each of the two departments. A two-stage sampling process was followed. The primary sampling units (PSUs) were thecommunities. Thirty PSUs were selected in each department with a probability proportionalto size. Ten children were to be measured in each PSU. The final sample consisted of 294children in Baja Verapaz and 290 children in Izabal.

18
2. WHY SHOULD CRS PROJECTS DO THE SURVEY?
By doing an anthropometric survey at the beginning and another one at the end, CRS projects will be able to find out if the nutritional status of children has improved. Even though it is difficult to prove that project activities alone led to the improvement, the finding is strong evidence of project impact.
Box 2.1 describes the opinion of a consultative group on the purpose of anthropometric surveys in CRS projects. Box 2.2 contains excerpts from a letter-from the Office of Food for Peace, United States Agency for International Development (USAID) to CRS-that asks projects funded by Title II to do anthropometric surveys.
Box 2.1 Excerpts from Reports on Meeting of Anthropometry Consultative Group
Catholic Relief Services, Baltimore, 25 February, 1998 Purpose of anthropometric surveys
The main purpose of anthropometric surveys in the context of CRS Title II projects is todocument improvement in the anthropometric status of children between baseline and finalevaluations. Project managers should also use anthropometric data to complement otherbaseline data for analysis of problems in the project area. USAID does not currently require CRS to show that improvement (or lack of improvement)in anthropometric status of children resulted from project activities. However this maybecome a requirement in the future. Even then, all projects should not be asked to do so. Forevaluation of the Title II program as a whole, it will be adequate if a few projects -- selectedto represent a range of field conditions -- can demonstrate the link between their activities andimprovement in anthropometric status. At present, CRS projects do not need to use evaluations designed to demonstrate the link(involving the measurement of children in non project areas) However they should provide

19
Box 2.2 Excerpts from Letter from Office of Food for Peace to CRS, Part 1
August 26, 1997 Mr. Vernon Conaway U.S. Government Relations Officer Dept. of Government Relations Catholic Relief Services USCC 209 West Fayette Street Baltimore MD 21202-3443 Dear Vern: During the review of the CRS Title II Development Activity Proposal for The Gambia on July28, 1997, the CRS Maternal and Child Health Advisor requested that BHR/FFP provide writtenclarification on results reporting requirements for health and nutrition (HN) components of TitleII assisted development activities. Based on USAID policy and Congressional mandates, BHR/FFP will fund HN activities thathave improvements in child nutritional status as an objective. BHR/FFP expects CooperatingSponsors to report on the impact on child nutritional status of HN activities funded by Title II.These HN activities include maternal-child health (MCH) and food assisted child survival(FACS) programs. Such reporting on nutritional status impacts should be in addition toreporting on knowledge and practices, such as child feeding behaviors. In order to evaluate the nutritional impact of HN activities, BHR/FFP requires thatCooperating Sponsors report using anthropometric measures of child nutritional

20
3. WHEN SHOULD CRS PROJECTS DO THE SURVEY?
CRS projects should do the first survey soon after project start. They can combine the anthropometric survey with other parts of the baseline survey. They should do the second survey at the same time as the final evaluation.
Box 3.1 contains excerpts from a letter from USAID to CRS that says when the surveys should be done.
4. WHO SHOULD BE ON THE SURVEY TEAM?
CRS Project Managers need to decide if they will ask CRS staff to carry out the survey or hire consultants. If they choose the second option, CRS staff will still have to commit some time and resources to the survey. They will need to decide who to hire, write a scope of work, review the consultants’ design for the survey, monitor the data collection, and review the survey report. The next five sections (Sections 5 through 9) will guide Project Managers in selecting appropriate staff and consultants for the survey.
Box 3.1 Excerpts from Letter from Office of Food for Peace to CRS, Part II
August 26, 1997
Mr. Vernon Connaway U.S. Government Relations Officer Dept. of Government Relations Catholic Relief Services USCC 209 West Fayette Street Baltimore MD 21202-3443 Dear Vern: During the review of the CRS Title II Development Activity Proposal for The Gambia onJuly 28, 1997, the CRS Maternal and Child Health Advisor requested that BHR/FFP providewritten clarification on results reporting requirements for health and nutrition (HN)components of Title II assisted development activities. In order to evaluate the nutritional impact of HN activities, BHR/FFP requires thatCooperating Sponsors report using anthropometric measures of child nutritionalstatus.....Anthropometric data should be collected for baseline, mid-term (optional), andfinal evaluations. (Emphasis added.)

21
As you read these sections, you will note that many kinds of skills are needed to design and do the survey and to analyze and present survey findings. But this does not mean that the survey team should be very large. Some Project Managers will be able to find people who have many of these skills; the survey team can ask these people to carry out many of the survey tasks. Whatever be the size of the survey team, one project staff member should take the role of the Survey Coordinator. This person will oversee the activities of the survey team. Often this person will be the Project Manager. Sometimes an evaluation officer or the person responsible for the management information system can take on this role.
5. WHO SHOULD DESIGN THE CRS SURVEY?
Persons who design the survey- the Designers-should have designed a population-based health survey in the past. If they have not designed an anthropometric survey before, they will need guidance from someone who has. They should know how to prepare a sampling design for a population-based survey. It will be good if they have received training in sampling methods; but a person without such training can still prepare an adequate design. The important requirement is experience in designing a population-based survey. Someone who has designed an anthropometric survey before should help in deciding how many children should be measured and how they should be measured.
6. WHO SHOULD DO THE CRS SURVEY?
The survey consists of many tasks. The most important is measuring the children and this will be done by the Surveyors. However, before this can happen, the Surveyors will need training. The Survey Trainer should be a person who has trained anthropometric Surveyors in the past. If such a person is not available, someone who has acted as the Survey Coordinator for an anthropometric survey earlier can take on this role. The Surveyors should have experience in handling young children and should be able to read and write. The Survey Coordinator should try to find surveyors who have measured children in the past, either in a survey or in a clinic. Three or four Surveyors should be supervised by one Survey Supervisor. The Supervisor should have experience in overseeing the work of health surveyors. Often, a field supervisor from the project who has participated in health surveys in the past can take on this role. Sometimes, the Survey Supervisor will be a person who did well as a surveyor in an earlier anthropometric survey. Whatever be the background of Survey Supervisors, they should also attend the training given by the Survey Trainer.

22
7. WHO SHOULD PROCESS THE DATA?
The Surveyors will measure children and record their age, sex, weight, and height. In addition they will record identifying information about the children and the communities they live in. In most anthropometric surveys there will be one page of information per child. The Data Processors will enter the information into computer files. They will also ensure that the information in the computer files matches the information recorded by the surveyors. In other words, they will ensure the accuracy of the information in the computer files. The Data Processors should have done similar work with health data in the past. They should know how to type on a computer keyboard. It is helpful if they have experience in entering data using Epi Info software.
8. WHO SHOULD ANALYZE THE DATA?
Data Analyzers will use Epi Info software to analyze data entered by the Data Processors. They should have used statistical software in the past to analyze health data and produce tables with averages and proportions. It is useful if they have experience with Epi Info. They will be asked to compute z-scores from the survey data. Z-scores calculations are used to convert each child’s measurements into a standard score. This score helps in comparing the anthropometric status of children of different ages and sex. They should know also how to calculate confidence intervals for survey findings. Confidence intervals are a way of saying that surveys based on samples result in values that are approximately equal to the value that would result from measurement of all the children in the project area (the “actual value”). This also implies a degree of uncertainty about survey findings. But the amount of the uncertainty can be defined. Often 95% confidence intervals are calculated. Project Managers can be 95% confident that the values within the 95% confidence intervals contain the “actual value”. Epi Info has facilities for calculating z-scores and confidence intervals. Data Analyzers should also be able to account for a feature of the sampling design in their analysis. In the survey, the sample will not be drawn from a list of all the children in the project area. Instead, the survey team will first select some communities from a list of all the communities in the project area. Then the survey team will select children from within the communities that are selected in the first step. This process increases the uncertainty about the survey findings. Epi Info offers a way to include this feature of the sampling design in the analysis. Finally, Data Analyzers should be able to graph survey findings using a software package. Excel is a good software package for preparing graphs. But instead of Excel Data Analyzers

23
may be able to use their experience with another computer spreadsheet such as Lotus 1-2-3. 9. WHO SHOULD WRITE THE REPORT?
The Report Writer should have experience in writing reports on health project activities. The person who takes on this role will need to assemble many pieces of information and produce a readable summary of the survey process and findings. In doing this, the person will have to contact various members of the survey team. The Report Writer should be able to use word processing software such as Microsoft Word or WordPerfect.
10. WHO SHOULD SURVEYORS MEASURE?
Surveyors should measure children less than 59 months old. In many cases, the Project Manager may decide to measure children in a narrower age range -- such as 24 to 59 months. Box 10.1 presents guidance given by the consultative group on this matter. Box 10.2 contains an excerpt from a letter from USAID to CRS that gives some help in making the decision. Notwithstanding boxes 10.1 and 10.2, anthropometric surveys carried out by CRS have used varying age groups, e.g., Benin 18-35 months, India 0-23 months, Guatemala 18-35 months, Ghana 0-23 months. Field offices are encouraged to contact PQSD when determining ages to be included in the survey.
Box 10.1 Excerpts from Report on Meeting of Anthropometry Consultative Group
Catholic Relief Services, Baltimore, 25 February 1998 Sampling Issues
Projects should take the survey sample from children in the age group 24 - 59 monthsusing cluster sampling methodology. Within the recommended age group, projects candecide to limit their sample to a smaller age range (depending on the age group that isexpected to benefit most from project activities). For example, a three-year project -- inwhich the first year is spent doing start-up activities -- may measure children in the age group24 - 47 months. In this project, children who are 48 - 59 months old at project-end would havebeen 24 - 35 months old when project activities began, too old to benefit fully from nutrition-promotion interventions. A four-year project, on the other hand, may measure children in theage group 24 - 59 months. (Emphasis added.) In future, the recommendation on age group may change to 6 - 24 months, since theanthropometric status of children in that group is most sensitive to nutritional interventions. In

24
11. HOW MANY CHILDREN SHOULD SURVEYORS MEASURE?
This depends on a number of considerations. The most important is the amount of time, money, and manpower available for the survey. Another important factor is the amount of improvement in nutritional status the project aims for. The survey team will also need to consider the degree of error the Project Manager is willing to tolerate in the ability of the baseline and final surveys to find improvement. Finally, the number of children selected from each community in the second step of the two-step sampling procedure (described in section 8) affects the decision. It is advisable to consult a sampling statistician in choosing a sample size.
Box 10.2 Excerpts from Letter from Office of Food for Peace to CRS, Part III
August 26, 1997 Mr. Vernon Conaway U.S. Government Relations Officer Dept. of Government Relations Catholic Relief Services USCC 209 West Fayette Street Baltimore MD 21202-3443 Dear Vern: During the review of the CRS Title II Development Activity Proposal for The Gambia on July28, 1997, the CRS Maternal and Child Health Advisor requested that BHR/FFP provide writtenclarification on results reporting requirements for health and nutrition (HN) components ofTitle II assisted development activities. In order to evaluate the nutritional impact of HN activities, BHR/FFP requires that CooperatingSponsors report using anthropometric measures of child nutritional status which currentlyinclude: (1) percentages of stunted children (defined as height-for-age Z-scores less than -2) forchildren between 24 - 60 months, disaggregated by gender; and/or (2) percentages ofunderweight children (defined as weight-for-age Z-scores less than -2) in specified age groupsdisaggregated by gender (Emphasis added )

25
Box 11.1 presents the consultative group’s guidance on sample size. Generally speaking, a sample of 600 children will be adequate. But the survey team must consider all the factors mentioned above. The resulting sample size may be smaller or larger than 600. CRS India conducted a complex “all-India” survey, in which 5820 children were included, whereas the CRS Benin surveys selected 600 children in each of 2 departments.
12. HOW SHOULD THE SURVEY TEAM FIND CHILDREN TO
MEASURE?
The Survey Designers will prepare a plan for finding children. This plan is closely linked with the sampling plan because the number of children measured in each community affects the overall sample size. Two plans are commonly used to find children. Both have a common first step. In this step, the Survey Designers select the communities in which children will be measured. The Survey Designers prepare a list of all the communities in the project area and the population size of each community. They then use this list to select some communities for the survey. Often they select 30 communities using the “probability-proportional-to-size” method. This method gives bigger communities a bigger chance of being selected for the survey.
In the second step, the survey team finds the households in which children will be measured. The Survey Designers may decide to follow a simple option for the selection of households. This is the option suggested by the World Health Organization’s Expanded Programme on Immunization household selection. In this option, the survey team locates the center of the community, spins a pen, and chooses the direction in which
Box 11.1 Excerpts from Report on Meeting of Anthropometry Consultative Group
Catholic Relief Services, Baltimore, 25 February 1998 Sampling Issues
The choice of size of the sample will be based on both statistical and practicalconsiderations. From previous experience in nutritional projects, CRS projects can expectan increase of 0.1 to 0.2 standard deviation units in mean z-scores for height-for-agebetween baseline and final surveys. They will need to measure thousands of children bothduring baseline and final surveys to detect an increase of 0.1 standard deviation units inmean z-score (with a 5% alpha error-the chance of finding an increase where there is none;and a 20% beta error-the chance of not detecting a true increase). This will not be feasible.Projects can compute a more practical sample to tolerate and aiming for an increase of 0.2standard deviation units in mean z-score. For example, a sample size of 4,221 is required todetect an increase of 0.1 standard deviation units in mean z-score, if the alpha error is 5%,the beta error is 20%, the standard deviation for the index is 1.39 (the median value for

26
the pen points when it stops spinning. The team then counts all the houses in that direction and selects a random number between one and the total number of houses in the direction. This identifies the first house that the team should visit. The second house is the one whose front-door is closest to the front-door of the first. The team continues to visit houses till it has measured the required number of children in the desired age group. A second option for the second step is to divided the community into segments. Each segment should have an equal number of households. Each segment should be just big enough to have the required number of children in the desired age group. The survey team assigns each segment a number, writes the numbers on pieces of paper, and after shuffling the pieces, picks one. The team then visits every household in that segment and measures every child in the desired age group. The Survey Designers will decide which option to follow for the second step based on their assessment of the time, money, and manpower available for the survey. The first option is easier to follow but may result in a sample that is not representative of entire project population.
13. HOW SHOULD SURVEYORS MEASURE CHILDREN?
The Surveyor Trainer should train the surveyors to follow the procedures described in the United Nations’ book “How to Weigh and Measure Children”. Box 13.1 contains information about this book. Important sections of the publication are included in Section Two of this manual. An important point to note is that children 0 - 23 months old should be measured lying-down and children 24 -59 months should be measured standing-up.

27
14. HOW SHOULD SURVEYORS RECORD MEASUREMENTS?
The Surveyor Trainer should train the surveyors to follow the procedures described in the United Nations’ book “How to Weigh and Measure Children.” See Box 13.1 above for information about this book. Important sections of the publication are included in Section Two of this manual.
Box 13.1 How to Weigh and Measure Children
Assessing the Nutritional Status of Young Children in Household Surveys National Household Survey Capability Programme
United Nations: Department of Technical Co-operation for Development and Statistical Office New York, 10017 (1986)
Table of Contents I. Introduction A. Purpose and Content of this Manual..........................................................................................1 B. Procedures and Precautions Before Measuring .........................................................................3 II. Nutritional Status Measurement Summary Procedures A. Child Height...............................................................................................................................6 B. Child Length ..............................................................................................................................8 C. Child Weight............................................................................................................................10 D. Child Arm Circumference .......................................................................................................12 III. Step-By-Step Measurement Procedures A. Child Height.............................................................................................................................14 B. Child Length ............................................................................................................................29 C. Child Weight............................................................................................................................42 D. Child Arm Circumference .......................................................................................................51 IV. Quality Control A. Reading Measurements............................................................................................................60 B. Recording Measurements ........................................................................................................62 C. Reading and Recording Measurements ...................................................................................63 D. Checking Your Measurement Technique ................................................................................65 V. Annexes A. Definitions of Terms................................................................................................................67 B. Enumerator Selection and Training Notes...............................................................................69 C A A t 73

28
15. HOW SHOULD DATA PROCESSORS HANDLE THE DATA?
Data Processors should enter the data into an Epi Info file. Two Data Processors should enter each data item. They should then use the facility provided in Epi Info to check for any discrepancies. Finally they should discuss and correct the discrepancies. They should then give the data analysts the corrected file.
16. HOW SHOULD DATA ANALYSTS HANDLE THE DATA?
Data Analysts should use the EPINUT module of Epi Info to analyze the data. As described in Section 8, they should calculate average z-scores for height-for-age, weight-for-age, and weight-for-height. They should also calculate the proportion of children whose z-scores are less than -2 and -3. For each of these values, they should calculate the confidence intervals. In doing the analysis, the Data Analysts should account for the fact that the sample will not be drawn from a list of all the children in the project area. Instead, the survey team will first select some communities from a list of all the communities in the project area. Then the survey team will select children from within the communities that are selected in the first step. Data Analysts should use Excel or similar spreadsheet software to prepare graphs required for the report.
17. WHAT SHOULD THE REPORT CONTAIN?
Box 17.1 presents the table of contents for the report on an anthropometric survey carried out in Guatemala. Sections which are essential to include in the report have been highlighted. The other sections are optional and should be included only if time is available to carry out the required analysis and writing. Box 17.2 presents a summary table from the same report. The Report Writer can use this as an example of how survey data should be presented in one key table. Box 17.3 contains an interpretive table based on the findings of the survey. Box 17.4 presents a detailed table of findings. Boxes 17.5 and 17.6 present graphs from the report.

29
Box 17.2
“Primary Health Care for Mothers and Children” Project Report on Anthropometric Survey, Baja Verapaz and Izabal, Guatemala
28 July 1997 - 10 October 1997 Table 1 Anthropometric Indicators for Baja Verapaz and Izabal
Department Index Indicator
Baja Verapaz Izabal Mean Z-Score -2.03 -1.41 Percent of children with Z-score less tha-2
54.6% 30.9% Height for age
Percent of children with Z-score less tha-3
20.8%
n=293
11.1%
n=288
Weight for age Mean Z-Score -1.72 n=294 -1.30 n=289
Box 17.1 “Primary Health Care for Mothers and Children” Project
Report on Anthropometric Survey, Baja Verapaz and Izabal, Guatemala 28 July 1997 - 10 October 1997
Table of Contents Section Page Executive Summary Acronyms and Initials 1. Introduction .....................................................................................................................................................................1 2. Methodology.....................................................................................................................................................................2 2.1 Sample Design ..................................................................................................................................................................2 2.2 Training of Supervisors and Interviewers .....................................................................................................................2 2.3 Survey Implementation ...................................................................................................................................................2 2.4 Data Analysis ...................................................................................................................................................................3 3. Results...............................................................................................................................................................................4 4. Discussion .......................................................................................................................................................................11 5. Bibliography ....................................................................................................................................................................12 6. Appendices .....................................................................................................................................................................14 Appendix 1 Persons Involved in the Survey Appendix 2 Calculation of Sample Size Appendix 3 Selection of Primary Sampling Units Appendix 4 Survey Questionnaire Appendix 5 Survey Training Schedule Appendix 6 Survey Costs Appendix 7 Unprocessed Data Appendix 8 Data Quality
Appendix 9 Summary Tables of Anthropometric Indicators

30
Percent of children with Z-score less tha-2
43.9% 26.0%
Percent of children with Z-score less tha-3
11.2%
5.5%
Mean Z-Score -0.67 -0.53 Percent of children with Z-score less tha-2
8.9% 4.5% Weight for height
Percent of children with Z-score less tha-3
1.0%
n=293
0.7%
n=286
Box 17.3
“Primary Health Care for Mothers and Children” Project Report on Anthropometric Survey, Baja Verapaz and Izabal, Guatemala
28 July 1997 - 10 October 1997 In 1993, the World Health Organization convened a committee to make recommendations about the use of anthropometry (Expert Committee on Physical Status: The Use and Interpretation of Anthropometry - WHO, 1995). The committee proposed that findings of anthropometric surveys be classified in terms of severity of undernutrition. Table 2 presents such a classification for Baja Verapaz and Izabal.
Table 2 Severity of Undernutrition in Baja Verapaz and Izabal
Department Indicator Baja Verapaz Izabal
Low height for age Very high High Low weight for age Very high High Low weight for height Medium Low
Box 17.4
“Primary Health Care for Mothers and Children” Project Report on Anthropometric Survey, Baja Verapaz and Izabal, Guatemala
28 July 1997 - 10 October 1997
Appendix 10.1 Anthropometric Indicators for Baja Verapaz, Guatemala CRS Anthropometric Survey, 1997
Table A10.1.8 Mean Z-Score: Height for Age - by Age Group and Sex
Age Group (months) Males Females Both Sexes 18 - 23 -2.41
(CI -2.74, -2.08)-2.05
(CI -2.34, -1.75)-2.23
(CI -2.46, -2.01)

31
n=48 n=48 n=96 24 - 29 -2.14
(CI -2.52, -1.77) n=37
-1.31 (CI -1.64, -0.98)
n=43
-1.70 (CI -1.96, -1.43)
n=80 30 - 35 -2.49
(CI -2.82, -2.16) n=62
-1.65 (CI -1.97, -1.33)
n=55
-2.10 (CI -2.34, -1.85)
n=117 18 - 35 -2.38
(CI -2.58, -2.18) n=147
-1.68 (CI -1.87, -1.49)
n=146
-2.03 (CI -2.17, -1.89)
n=293

32
Box 17.5 “Primary Health Care for Mothers and Children” Project
Report on Anthropometric Survey, Baja Verapaz and Izabal, Guatemala 28 July 1997 - 10 October 1997
Figure 1Distribution of Height for Age Z-Scores
0
5
10
15
20
25
-5.25 -4.75 -4.25 -3.75 -3.25 -2.75 -2.25 -1.75 -1.25 -0.75 -0.25 0.25 0.75 1.25 1.75 2.25 2.75 3.25 3.75 4.25 4.75 5.25
Height for Age Z-Scores
Perc
ent C
hild
ren
Reference Baja Verapaz Izabal Box 17.6
“Primary Health Care for Mothers and Children” Project Report on Anthropometric Survey, Baja Verapaz and Izabal, Guatemala
28 July 1997 - 10 October 1997
Figure 4Low Height for Age
0
10
20
30
40
50
60
70
80
90
100
Baja Verapaz Norte (DHS 1995) Izabal Nor-Oriente (DHS 1995)
Perc
ent C
hild
ren
Z-Score<-2 & >=-3 Z-Score < -3

33

34
18. HOW SHOULD CRS PROJECTS USE THE REPORT?
At the beginning of the project, CRS projects should use the findings of the anthropometric survey together with the findings of other parts of the baseline survey and information available from secondary sources (such as Ministry of Health, UNICEF, and WHO). This will help the project staff make decisions about project priorities and strategies. At the end of the project, the main use of the findings of the anthropometric survey is to compare with the baseline data and find out if the nutritional status of children improved in the project area. Section Two gives additional guidance on the subject.
19. HOW MUCH TIME WILL THE SURVEY TAKE?
The time taken for the survey will depend on local conditions and on the design of the survey. The survey can be completed quickly if communication and transport facilities are good, the weather is favorable, the project area is small, enough manpower is available, the sample size is small, and good computers and software are available. Including all parts of the survey (preparation, training, data collection, analysis, and report writing), the survey is likely to take between three and six months.
20. WHAT EQUIPMENT WILL THE SURVEY TEAM NEED?
The most important pieces of equipment the survey team will need are hanging scales and height-measuring boards. In addition, the team will need materials for training Surveyors and Survey Supervisors, collecting and recording data, analyzing data, and preparing the report. These include computers (with Epi Info, Excel, and word processing software such as Microsoft Word or WordPerfect), computer disks, printers, photocopying machines, stationery, flip charts, overhead transparency projectors, and fax machines. Additional guidance about equipment is given in the United Nations’ book “How to Weigh and Measure Children”. See Box 13.1 for information about this book. Important sections of the publication are included in Section Two of this manual.
21. HOW MUCH WILL THE SURVEY COST?
This will depend on local conditions and the design of the survey. The factors mentioned in section 19 will also affect survey costs. Another important consideration is the decision to hire consultants. If the survey team brings in consultants from another country, survey costs will be much higher than if in-country consultants are used or if project staff carry out the survey themselves

35
Section Two: How To Do An
Anthropometric Survey

CRS Anthropometric Survey Manual-Section Two: How To Do An Anthropometric Survey Page 17
1. PREPARING FOR THE SURVEY 1.1 Determining Survey Objectives
Box 1 presents the objectives of a survey carried out in the Guatemala in 1997. Box 2 contains the objectives of a survey conducted in The Gambia in 1998. Note that the main objectives for the anthropometric component (highlighted in both boxes) include statements about the following: * The amount of improvement you would like to detect from baseline to final
survey in a selected anthropometric index. * The age group in which you expect to find improvement. * The level of confidence in survey results that show improvement. * The chance that you will be able to detect improvement (power). It is easier to calculate the sample size for the survey if the survey objective is stated in a way a little different from the examples in the boxes. Use the following format unless you have access to a statistician for calculating the sample size:
The baseline and final survey will allow Catholic Relief Services to detect a decrease of 10% in the proportion of malnourished children 18 - 35 months old. Children with a height-for-age z-score less than -2 are considered to be malnourished.
1.2 Identifying the Survey Team
Box 1 Excerpts from Report on Anthropometric Survey
Baja Verapaz and Izabal, Guatemala, 1997 This anthropometric study was carried out to provide a baseline measure of the anthropometric status of children in the age group 18 - 35 months. Another study will be conducted in the final year of the project and changes in anthropometric status of children in project areas will be documented. The baseline and final survey will allow Catholic Relief Services to detect a change in mean height-for-age z-score (HAZ) of 0.3 between the two surveys among children 18 - 35 months old in each of two departments in Guatemala with 90% confidence and 80% power.
Box 2 Objectives of Child Health Survey, The Gambia, 1998
The baseline and final surveys will allow: 1. Catholic Relief Services to detect a change in mean height-for-age z-score (HAZ) of 0.2 between May 1998 and May 2002 among rural children 0 - 23 months old in The Gambia with 95% confidence and 80% power. 2. The Ministry of Health (MOH) to estimate the mean HAZ in each of six administrative regions in May 1998 among children 0 - 59 months old living in communities served by health centers with 95% confidence that the actual mean HAZ in the study population lies within + 0.2 standard deviations of the estimate. 3. MOH to estimate the 2-week prevalence of diarrhea in each of six administrative regions in May 1998 among children 0 - 59 months old living in communities served by health centers with 95% confidence that the actual prevalence in the study population lies within + 10% of the estimate. 4. MOH to estimate the 2-week prevalence of fever in each of six administrative regions in May 1998 among children 0 - 59 months old living in communities served by health centers with 95% confidence that the actual prevalence in the study population lies within + 10% of the estimate.

CRS Anthropometric Survey Manual-Section Two: How To Do An Anthropometric Survey Page 18
Use the following checklist to identify the survey team. Read through the first column. It lists survey tasks, corresponding roles, and the attributes (education, experience, or skills) required to do the tasks. Next, complete the second column. For each item listed in first column, write the names of one or more CRS staff persons or consultants who have the required attributes. You may repeat the name of a person if that individual has more than one useful attribute. If you are not aware of anybody who possesses a particular attribute, try to think of an organization that may be able to provide you with such a person. Write the name of the organization in the appropriate blank space. For some tasks you may like to write the category of CRS staff who possess the required attributes (instead of writing the names of individuals). For example, you may write “CRS Field Workers” in the second column for the task “collecting data.” Once you have completed the second column, you are ready to select the team. Box 3 will help you decide the number of people you will need to carry out each task. Remember to keep some of the individuals as backups who can take the place of others who are not available when you need them. Box 4 provides guidance on determining the number of survey teams.

CRS Anthropometric Survey Manual-Section Two: How To Do An Anthropometric Survey Page 19
Checklist for Selection of Survey Team
Tasks, Roles, and Attributes
Person
Task 1 Coordinating survey activities (Role: Survey Coordinator) Attribute 1a Experience in coordinating a health survey
If a person with attribute 1a not available, look for a person with the following attribute to do the task: Attribute 1b Experience in coordinating a health project
Task 2 Designing the survey (Role: Survey Designer) Attribute 2a Experience in designing an anthropometric survey (that is, deciding which age group should be measured, what procedures and equipment should be used to measure children, what should be the duration and content of training for Surveyors and Survey supervisors, how should the quality of data collection be checked, and how should the findings be presented) ; plus Attribute 2b Ability to prepare a sampling design for a population-based survey (that is, calculate a sample size, select a method for sampling communities, select a method for locating households in communities, and select a method for selecting children in households)
Available to carry out the task: Available only to guide another person in doing the task:
If a person with attributes 2a plus 2b is available only to guide another person in doing the task, look for a person with the following attributes to do the task: Attribute 2b Ability to prepare sampling design for a population-based survey; plus Attribute 2c Experience in designing population-based survey (that is, deciding which age group should be included, what procedures should be used in the survey, what should be the duration and content of training for Surveyors and Survey supervisors, how should the quality of data collection be checked, and how should the findings be presented)
Task 3 Collecting Data (Role: Surveyor) Attribute 3a Experience in measuring weights and heights of children; plus Attribute 3b Ability to read and write
If enough persons with attributes 3a plus 3b are not available, look for persons with the following attributes to do the task: Attribute 3c Experience in working with young children (for example, in a clinic or day-care center); plus Attribute 3b Ability to read and write
Task 4 Supervising Data Collection (Role: Survey Supervisor)
Attribute 4 Experience in overseeing the work of health surveyors

CRS Anthropometric Survey Manual-Section Two: How To Do An Anthropometric Survey Page 20
Tasks, Roles, and Attributes
Person
Task 5 Training of Surveyors and Survey Supervisors (Role: Survey Trainer) Attribute 5a Experience in training anthropometric Surveyors and Survey Supervisors
If a person with attribute 5a not available, look for a person with the following attribute to do the task: Attribute 5b Experience in coordinating an anthropometric survey
Task 6 Processing Survey Data (Role: Data Processor) Attribute 6a Experience in entering data using Epi Info software
If persons with attribute 6a not available, look for persons with the following attribute to do the task: Attribute 6b Experience in entering data using any software
Task 7 Analyzing Survey Data (Role: Data Analyzer) Attribute 7a Experience in analyzing health survey data using Epi Info software; plus Attribute 7b Ability to prepare graphs using Excel software
If a person with attributes 7a plus 7b is not available, look for a person with the following attributes to do the task: Attribute 7c Experience in analyzing health survey data using any software; plus Attribute 7d Ability to prepare graphs using any software
Task 8 Writing Survey Report (Role: Report Writer) Attribute 8a Experience in writing reports on health surveys; plus Attribute 8b Ability to use word processing software such as Microsoft Word or WordPerfect
If a person with attributes 8a plus 8b is not available, look for a person with the following attributes to do the task: Attribute 8c Experience in writing about health work (that is, preparing project proposals, project reports, or project evaluations); plus Attribute 8b Ability to use word processing software such as Microsoft Word or WordPerfect
CRS Anthropometric Survey Manual-Section Two: How To Do An Anthropometric Survey Page 21
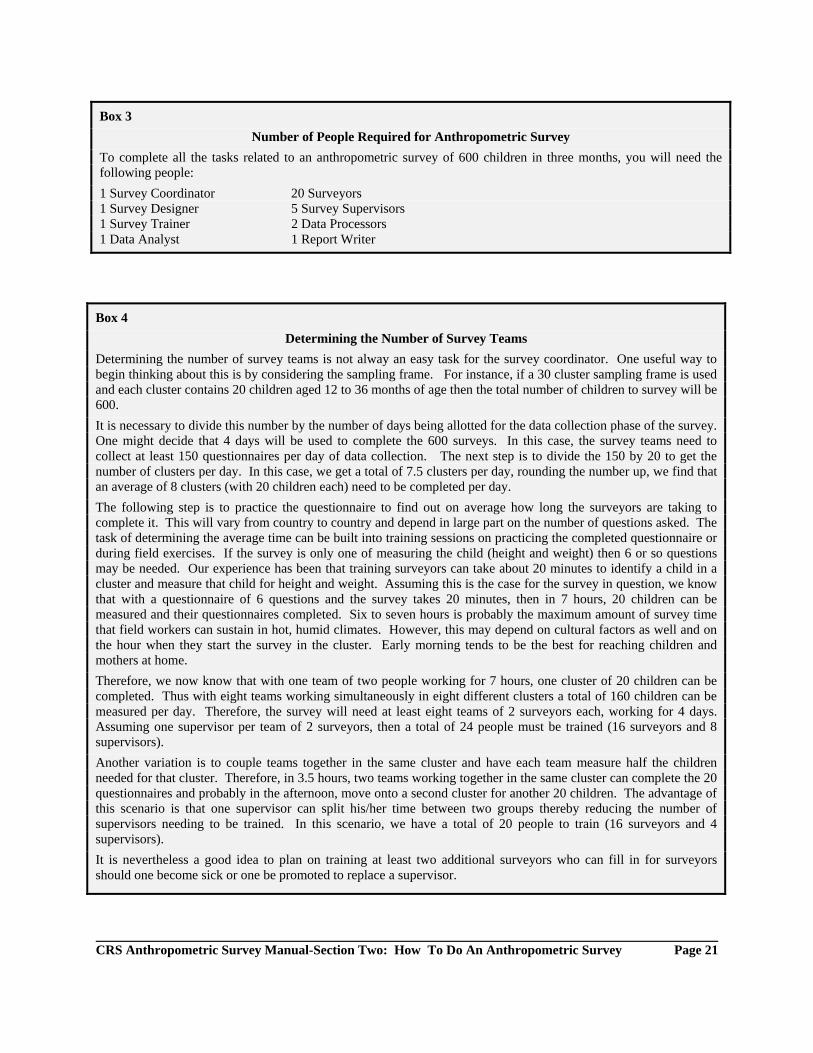
Box 3 Number of People Required for Anthropometric Survey
To complete all the tasks related to an anthropometric survey of 600 children in three months, you will need the following people: 1 Survey Coordinator 20 Surveyors 1 Survey Designer 5 Survey Supervisors 1 Survey Trainer 2 Data Processors 1 Data Analyst 1 Report Writer
Box 4 Determining the Number of Survey Teams
Determining the number of survey teams is not alway an easy task for the survey coordinator. One useful way to begin thinking about this is by considering the sampling frame. For instance, if a 30 cluster sampling frame is used and each cluster contains 20 children aged 12 to 36 months of age then the total number of children to survey will be 600. It is necessary to divide this number by the number of days being allotted for the data collection phase of the survey. One might decide that 4 days will be used to complete the 600 surveys. In this case, the survey teams need to collect at least 150 questionnaires per day of data collection. The next step is to divide the 150 by 20 to get the number of clusters per day. In this case, we get a total of 7.5 clusters per day, rounding the number up, we find that an average of 8 clusters (with 20 children each) need to be completed per day. The following step is to practice the questionnaire to find out on average how long the surveyors are taking to complete it. This will vary from country to country and depend in large part on the number of questions asked. The task of determining the average time can be built into training sessions on practicing the completed questionnaire or during field exercises. If the survey is only one of measuring the child (height and weight) then 6 or so questions may be needed. Our experience has been that training surveyors can take about 20 minutes to identify a child in a cluster and measure that child for height and weight. Assuming this is the case for the survey in question, we know that with a questionnaire of 6 questions and the survey takes 20 minutes, then in 7 hours, 20 children can be measured and their questionnaires completed. Six to seven hours is probably the maximum amount of survey time that field workers can sustain in hot, humid climates. However, this may depend on cultural factors as well and on the hour when they start the survey in the cluster. Early morning tends to be the best for reaching children and mothers at home. Therefore, we now know that with one team of two people working for 7 hours, one cluster of 20 children can be completed. Thus with eight teams working simultaneously in eight different clusters a total of 160 children can be measured per day. Therefore, the survey will need at least eight teams of 2 surveyors each, working for 4 days. Assuming one supervisor per team of 2 surveyors, then a total of 24 people must be trained (16 surveyors and 8 supervisors). Another variation is to couple teams together in the same cluster and have each team measure half the children needed for that cluster. Therefore, in 3.5 hours, two teams working together in the same cluster can complete the 20 questionnaires and probably in the afternoon, move onto a second cluster for another 20 children. The advantage of this scenario is that one supervisor can split his/her time between two groups thereby reducing the number of supervisors needing to be trained. In this scenario, we have a total of 20 people to train (16 surveyors and 4 supervisors). It is nevertheless a good idea to plan on training at least two additional surveyors who can fill in for surveyors should one become sick or one be promoted to replace a supervisor.

CRS Anthropometric Survey Manual-Section Two: How To Do An Anthropometric Survey Page 22
1.3 Preparing a Time Schedule
Use the following list of activities to prepare the time schedule for the anthropometric survey. The list gives estimates of the time that major activities may take. These estimates are based on surveys done in CRS projects in Benin and Guatemala in 1997 and in The Gambia in 1998. In the first two, 600 children in the age group 18 - 35 months were measured. In the third, the sample size consisted of 2,280 children in the age group 0 - 59 months. In all, an anthropometric survey is likely to take 90 - 180 days to complete. In preparing your schedule, you may like to work your way backward from the last activity on the list (“writing the survey report”). Against this activity, write the deadline for survey completion. Then, use the estimates given below to project start dates for the preceding activities. Note that the estimates given below are in the form of ranges. While many survey activities are likely to be completed within the ranges of time given here, some may take less or more time, depending on the local situation.

CRS Anthropometric Survey Manual-Section Two: How To Do An Anthropometric Survey Page 23
Activity Estimate of Time Needed to Complete Activity (In Days) 1. Preparing for the survey .......................................................................................60 - 120 days
Determining survey objectives Identifying and contacting potential members of the survey team Preparing a time schedule Preparing a scope-of-work for the survey team Determining the sampling methodology Determining the size of the sample Gathering population data for sampling purposes Drawing the sample of communities Obtaining permission from authorities Adapting the survey questionnaire Making copies of questionnaire Obtaining maps Preparing transportation plans Obtaining measuring instruments Preparing training plans Reserving a training facility Setting up computers for data analysis
2. Training Survey Supervisors and Surveyors ............................................................3 - 4 days
Training in measurement procedures Implementing quality control procedures during the training
3. Doing the survey.........................................................................................................4 - 12 days
Transporting the survey team to survey sites Finding survey households Finding survey children Completing survey questionnaires Completing other survey forms
4. Analyzing survey data ...............................................................................................5 - 10 days
Entering data into an Epi Info file Generating anthropometric indices using Epi Info Generating anthropometric indicators Preparing graphs
6. Using survey data .....................................................................................................10 - 30 days
Interpreting survey findings Presenting preliminary survey findings and obtaining feedback Writing the survey report
CRS Anthropometric Survey Manual-Section Two: How To Do An Anthropometric Survey Page 24
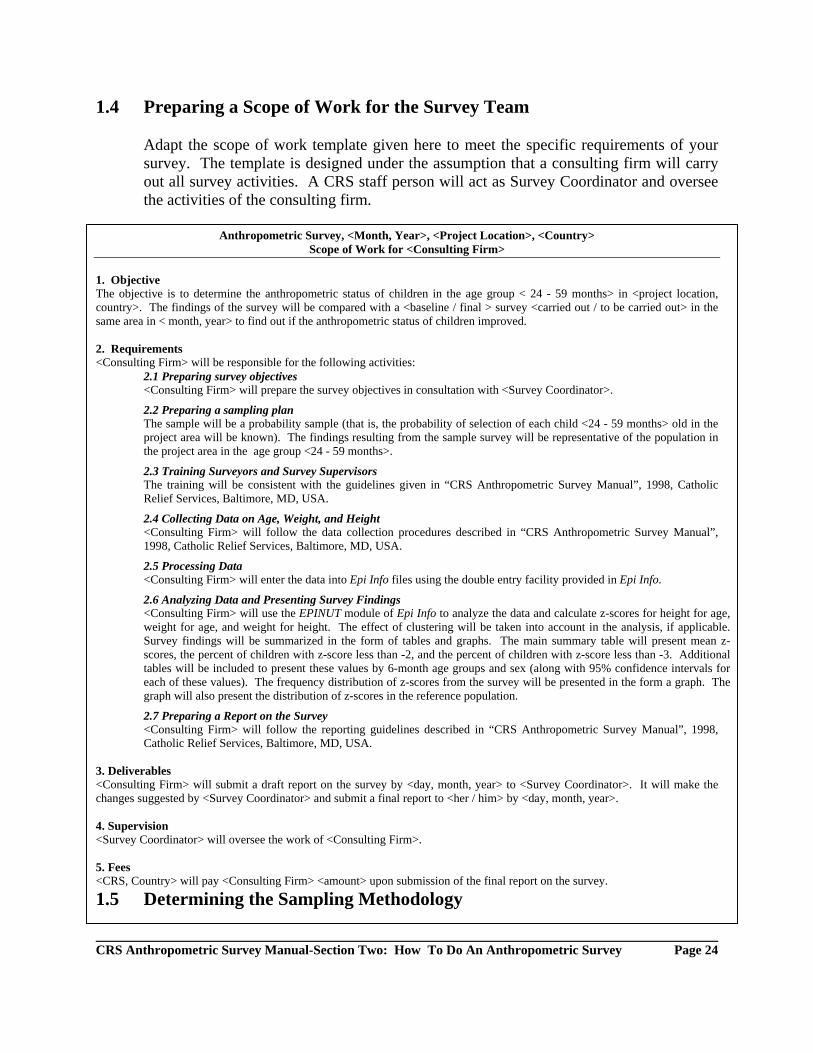
1.4 Preparing a Scope of Work for the Survey Team Adapt the scope of work template given here to meet the specific requirements of your survey. The template is designed under the assumption that a consulting firm will carry out all survey activities. A CRS staff person will act as Survey Coordinator and oversee the activities of the consulting firm.
Anthropometric Survey, <Month, Year>, <Project Location>, <Country>
Scope of Work for <Consulting Firm> 1. Objective The objective is to determine the anthropometric status of children in the age group < 24 - 59 months> in <project location, country>. The findings of the survey will be compared with a <baseline / final > survey <carried out / to be carried out> in the same area in < month, year> to find out if the anthropometric status of children improved. 2. Requirements <Consulting Firm> will be responsible for the following activities:
2.1 Preparing survey objectives <Consulting Firm> will prepare the survey objectives in consultation with <Survey Coordinator>.
2.2 Preparing a sampling plan The sample will be a probability sample (that is, the probability of selection of each child <24 - 59 months> old in the project area will be known). The findings resulting from the sample survey will be representative of the population in the project area in the age group <24 - 59 months>.
2.3 Training Surveyors and Survey Supervisors The training will be consistent with the guidelines given in “CRS Anthropometric Survey Manual”, 1998, Catholic Relief Services, Baltimore, MD, USA.
2.4 Collecting Data on Age, Weight, and Height <Consulting Firm> will follow the data collection procedures described in “CRS Anthropometric Survey Manual”, 1998, Catholic Relief Services, Baltimore, MD, USA.
2.5 Processing Data <Consulting Firm> will enter the data into Epi Info files using the double entry facility provided in Epi Info.
2.6 Analyzing Data and Presenting Survey Findings <Consulting Firm> will use the EPINUT module of Epi Info to analyze the data and calculate z-scores for height for age, weight for age, and weight for height. The effect of clustering will be taken into account in the analysis, if applicable. Survey findings will be summarized in the form of tables and graphs. The main summary table will present mean z-scores, the percent of children with z-score less than -2, and the percent of children with z-score less than -3. Additional tables will be included to present these values by 6-month age groups and sex (along with 95% confidence intervals for each of these values). The frequency distribution of z-scores from the survey will be presented in the form a graph. The graph will also present the distribution of z-scores in the reference population.
2.7 Preparing a Report on the Survey <Consulting Firm> will follow the reporting guidelines described in “CRS Anthropometric Survey Manual”, 1998, Catholic Relief Services, Baltimore, MD, USA.
3. Deliverables <Consulting Firm> will submit a draft report on the survey by <day, month, year> to <Survey Coordinator>. It will make the changes suggested by <Survey Coordinator> and submit a final report to <her / him> by <day, month, year>. 4. Supervision <Survey Coordinator> will oversee the work of <Consulting Firm>.
5. Fees <CRS, Country> will pay <Consulting Firm> <amount> upon submission of the final report on the survey.
1.5 Determining the Sampling Methodology

CRS Anthropometric Survey Manual-Section Two: How To Do An Anthropometric Survey Page 25
Three sampling options are available. A list of all children in the desired age group is needed for simple random sampling and systematic sampling. Such a list is not needed for cluster sampling. Almost all population-based surveys use cluster sampling and this is the recommended sampling method for CRS anthropometric surveys.
1.6 Determining the Size of the Sample 1.6.1 Determining sample size with the help of computer software (Epi Info)
Using Epi Info If you do not have Epi Info installed on your computer, follow the instructions given in Appendix 1 (“Installing Epi Info”). Use the following description to calculate the size of the sample. Note that the instructions given here are for a computer running on Windows 95. If you are using another operating system (such as Windows 3.1), or if the files on your computer are organized into different folders, the screens will look a little different. However, the basic procedures are similar. Click on the <<Start>> button located at the bottom left of the screen. Then click on <<Programs>>. Click on <<EPI Programs>> and then <<Epi Info 6>>. On the screen that appears, click on <<Programs>>. This button is located near the top left corner of the screen. Next, click on <<EPITABLE calculator>>. The following screen will appear. Click on <<Sample>> located near the middle of the top of the screen. Then click on <<Sample size>> and <<Two proportions>>.

CRS Anthropometric Survey Manual-Section Two: How To Do An Anthropometric Survey Page 26
The following screen will appear. You can now enter the required parameters by double clicking on the appropriate boxes and typing the numbers. To calculate the sample size, click on <<Calculate>>. The next page contains an example based on recommended values for the parameters. If you enter the recommended values for the parameters (as shown in the following screen), Epi Info determines that a sample of 252 is required for the baseline and the final survey. Note, however, that this is the sample size for a survey in which simple random sampling is used and

CRS Anthropometric Survey Manual-Section Two: How To Do An Anthropometric Survey Page 27
in which there are no non-responders (children who are included in the sample but cannot be measured). The recommended method is cluster sampling. Multiply the sample size by two for this method. Next, to account for non-response, divide the number by 0.9 (expecting a 10% rate of non-response). The resulting sample size is 560. Finally, you need to account for the fact that the recommended method is to select a certain number of children in each of 30 clusters. If you select 19 children in each cluster, the sample size is 570. To simplify the procedures involved in locating the children in the clusters during the survey, it is best to round this up to 600 (20 children in each of 30 clusters). Therefore, the sample size is 600 for the baseline and the final survey. To quit Epi Info, press the <<F10>> key twice. 1.6.2 Using Sample Size Formulas
The following page provides sample size formulas for both a change in the proportion of malnourished children and a change in mean z-score. Values of standard deviation for anthropometric indices (for some countries) are provided on the following page. You will need these if you decide to calculate a sample size on the basis of expected change in mean z-scores.

CRS Anthropometric Survey Manual-Section Two: How To Do An Anthropometric Survey Page 28

CRS Anthropometric Survey Manual-Section Two: How To Do An Anthropometric Survey Page 29
Reference: Sommerfelt, A Elisabeth and M. Kathryn Stewart. (1994). Children’s Nutritional Status.
Demographic and Health Survey, Comparative Studies No. 12, Claverton, MD: Macro International, Inc.
1.7 Gathering Population Data for Sampling Purposes The following pages contain examples of population data. These data will be used to select clusters. Try to find data similar to those for Enumeration Areas in the example for The Gambia. These are usually available from national census organizations. If these data are not available, use a listing of the names and the population size of each community in the project area (an example of this is also shown). For both types of data, it is good to have up-to-date information. However, you can proceed to the next step (selecting clusters) even if the data are a few years old and locally knowledgeable people tell you that there have been no dramatic changes (such as large migrations) in the project population since the data were collected.

CRS Anthropometric Survey Manual-Section Two: How To Do An Anthropometric Survey Page 30
Reference: Republic of the Gambia. Population and Housing Census of the Gambia 1993. Statistics on
Settlement Volume 10, Banjul: Central Statistics Department, Department of State for Finance and Economic Affairs.

Directory of settlements Area Name BOTH SEXES FEMALES Country/LGA/District/village Total <1 1-4 5-14 15-34 35-54 55-74 75+ N/S Total <1 1-4 5-14 15-34 35-54 55-74 75+ N/S
THE GAMBIA 1,038,145 29,047 139,170 286,444 353,208 146,388 146,388 14,593 17,403 518,195 14,230 69,288 143,068 184,534 69,409 22,865 7,338 7,463
BANJUL 42,326 981 3,833 8,829 18,334 6,553 2,293 587 916 20,058 480 1,895 4,707 8,428 2,711 1,128 334 375
Banjul South 10,745 215 898 2,210 4,713 1,655 682 188 184 5,062 104 440 1,179 2,121 687 346 112 73
Banjul South 10,745 215 898 2,210 4,713 1,655 682 188 184 5,062 104 440 1,179 2,121 687 346 112 73
Banjul Central 11,029 290 1,034 2,324 4,606 1,789 627 165 194 5,401 144 508 1,261 2,230 778 315 90 75
Banjul Central 11,029 290 1,034 2,324 4,606 1,789 627 165 194 5,401 144 508 1,261 2,230 778 315 90 75
Banjul North 20,552 476 1,901 4,295 9,015 3,109 984 234 538 9,595 232 947 2,267 4,077 1,246 467 132 227
Banjul North 20,552 476 1,901 4,295 9,015 3,109 984 234 538 9,595 232 947 2,267 4,077 1,246 467 132 227
Kanifing 228,214 6,094 25,887 53,063 94,942 31,802 8,408 1,870 6,148 109,957 3,062 12,930 27,900 45,606 12,881 3,761 1,095 2,722
K.U.D.C. 228,214 6,094 25,887 53,063 94,942 31,802 8,408 1,870 6,148 109,957 3,062 12,930 27,900 45,606 12,881 3,761 1,095 2,722
Abuko 4,345 131 555 1,068 1,656 629 163 37 106 2,096 65 277 527 871 220 68 24 44
Bakau Wasulun Kunda 2,195 49 156 431 755 385 101 27 291 1,091 30 80 234 359 175 42 18 153
Bakau Newtown 26,687 614 2,576 6,047 11,018 4,211 1,139 238 844 12,853 306 1,268 3,159 5,357 1,762 483 129 389
Bakoteh 6,594 156 763 1,797 2,544 970 223 58 83 3,172 81 383 896 1,220 401 116 35 40
Bunuka Kunda 41,369 1,129 4,990 9,555 17,575 5,290 1,405 288 1,137 19,636 563 2,474 4,950 8,250 2,115 601 177 506
Dippa Kunda 15,081 388 1,639 3,477 6,495 2,170 606 128 178 7,187 181 806 1,812 3,025 962 261 61 79
Eboe Town 2,563 33 224 631 1,142 398 86 16 33 1,235 15 109 300 583 162 37 10 19
Faji Kunda 12,744 384 1,514 3,097 5,189 1,819 472 114 155 6,176 195 763 1,649 2,516 709 208 78 58
Kololi 4,416 90 464 905 1,562 623 161 47 564 2,152 47 257 500 736 244 81 23 264
Kotu 4,419 151 522 1,070 1,778 612 132 15 139 2,314 71 259 622 974 256 62 14 56
Latri Kunda 22,902 530 2,338 5,455 9,612 3,169 938 205 655 11,348 271 1,177 2,955 4,671 1,450 433 111 280
Latri Kunda Sabiji 11,289 329 1,341 2,580 4,782 1,547 427 88 195 5,396 166 689 1,298 2,310 602 191 55 85
Manjai Kunda 4,800 152 560 1,112 1,951 698 161 34 132 2,354 80 301 600 982 262 61 17 51
New Jeshwang 21,656 610 2,692 5,222 8,909 2,760 718 153 592 10,397 302 1,326 2,803 4,248 1,047 323 102 248
Old Jeshwang 8,480 248 1,002 2,058 3,288 1,179 314 87 304 4,216 122 489 1,139 1,668 476 126 37 159
Serre Kunda 18,901 501 1,986 4,073 8,312 2,671 743 195 420 8,891 248 993 2,120 3,841 1,065 350 111 163
Talinding Kunjang 19,773 599 2,565 4,485 8,374 2,671 619 140 320 9,443 319 1,279 2,336 3,995 973 318 93 130
BRIKAMA 234,917 7,112 31,978 65,887 78,563 33,070 12,255 3,951 2,101 115,886 3,499 15,899 32,644 40,145 15,526 5,304 1,971 898
Kombo North 80,478 2,637 10,880 21,758 28,610 11,232 3,721 956 684 39,425 1,314 5,442 11,090 14,350 4,823 1,629 515 262
Banjulunding 2,751 70 362 704 1,030 381 137 39 28 1,381 40 175 365 539 177 56 21 8
Bantambilo (Alk. Busumbala) 40 2 6 15 7 9 1 - - 17 1 2 5 3 6 - - -
Bijilo 1,542 35 198 432 572 196 70 32 7 695 17 98 207 267 66 24 12 4
Brufut 8,644 269 1,183 2,468 2,917 1,240 406 120 41 4,201 124 578 1,226 1,479 547 166 65 16
Busumbala 3,619 170 473 1,045 1,192 504 174 50 11 1,816 80 239 526 638 213 80 34 6
Daranka 363 12 50 112 119 47 13 8 2 188 8 27 52 71 17 7 4 2
Ghana Town & Fishing Site 452 20 79 91 211 43 6 1 1 238 10 40 48 115 22 2 1 -
Jabang 204 10 32 52 67 28 11 2 2 100 4 18 22 34 17 4 - 1
Jamwelli (Pateh Ya) 125 4 19 31 39
Kerewan 458 14 72 122 132 67 27 16 8 221 6 33 58 63 41 10 8 2
Kerr Seringe Ngaga (Hamdalai) 2,278 92 311 511 857 355 99 26 27 1,090 53 159 264 437 118 40 14 5
DISTRIBUTION OF SETTLEMENTS BY POPULATION SIZE, LOCAL GOVERNMENT AREAS AND DISTRICTS

SETTLEMENT SIZE LGA DISTRICTS <200 200-
499 500-999
1000-1499
1500-1999
2000-2499
2500-2999
3000-4999
5000-9999
10000-50000
TOTAL
GAMBIA 1038 444 184 63 28 13 15 20 10 14 1830 BANJUL 1 1 KANFING 1 1 4 2 9 17 BRIKAMA 191 66 27 10 9 3 8 6 4 3 327 KOMBO NORTH 12 6 3 3 2 1 2 3 3 2 37 KOMBO CENTRAL 30 6 3 1 4 3 1 41 KOMBO EAST 18 6 6 1 3 2 1 37 FONI BREFET 6 5 4 1 1 17 FONI BINTANG KARA 34 14 3 1 52 FONI KANSALA 38 6 1 1 46 FONI BONDLI 18 7 1 26 FONI JAROL 9 8 3 20 MANSA KONKO 74 29 29 11 5 149 KIANG WEST 16 7 12 1 36 KIANG CENTRAL 13 5 5 1 24 KIANG EAST 8 4 4 1 17 JARRA WEST 7 3 3 5 2 21 JARRA CENTRAL 13 7 2 1 23 JARRA EAST 17 3 3 4 1 48 KEREWAN 157 98 59 15 3 4 4 1 341 LOWER NUMI 28 19 15 11 3 1 67 UPPER NUMI 21 18 11 3 1 54 JOKADU 15 18 8 1 42 LOWER BADDIBU 10 6 4 3 1 1 25 CENTRAL BADDIBU 18 5 6 2 1 33 UPPER BADDIBU 67 32 15 3 2 1 120 KUNTAUR 224 81 19 5 2 1 332 LOWER SALOUM 47 8 4 1 1 1 62 UPPER SALOUM 61 18 3 82 NIANIJA 20 12 3 35 NIANI 58 18 5 2 1 34 SAMI 36 25 4 2 69 GEORGE TOWN 185 89 18 8 3 2 1 1 1 308 NAMINA DANKUNKU 14 11 1 26 NAMINA WEST 17 13 1 31 NAMINA EAST 25 14 3 2 1 1 46 FULADU WEST 129 51 14 6 1 1 1 1 204 MACCARTHY ISLAND 1 1 BASSE 207 81 32 14 6 2 5 5 3 356 FULADU EAST 97 42 10 7 4 1 2 4 2 169 KANTORA 26 8 5 3 1 1 1 1 46 WULI 46 19 13 4 1 1 1 85 SANDU 38 12 4 1 56

CRS Anthropometric Survey Manual-Section Two: How To Do An Anthropometric Survey Page 33
1.8 Selecting Clusters 1.8.1 Selecting Clusters Using COSAS First, follow the instructions given below to install COSAS. Note that the instructions given here are for a computer running on Windows 95. If you are using another operating system (such as Windows 3.1), or if the files on your computer are organized into different folders, the screens will look a little different. However, the basic procedures are similar. You will need 1,000 kilobytes of free space on drive C: to install the software. Click on the <<Start>> button located at the bottom left of the screen. Then click on <<Programs>> and then on <<MS-DOS Prompt>>.
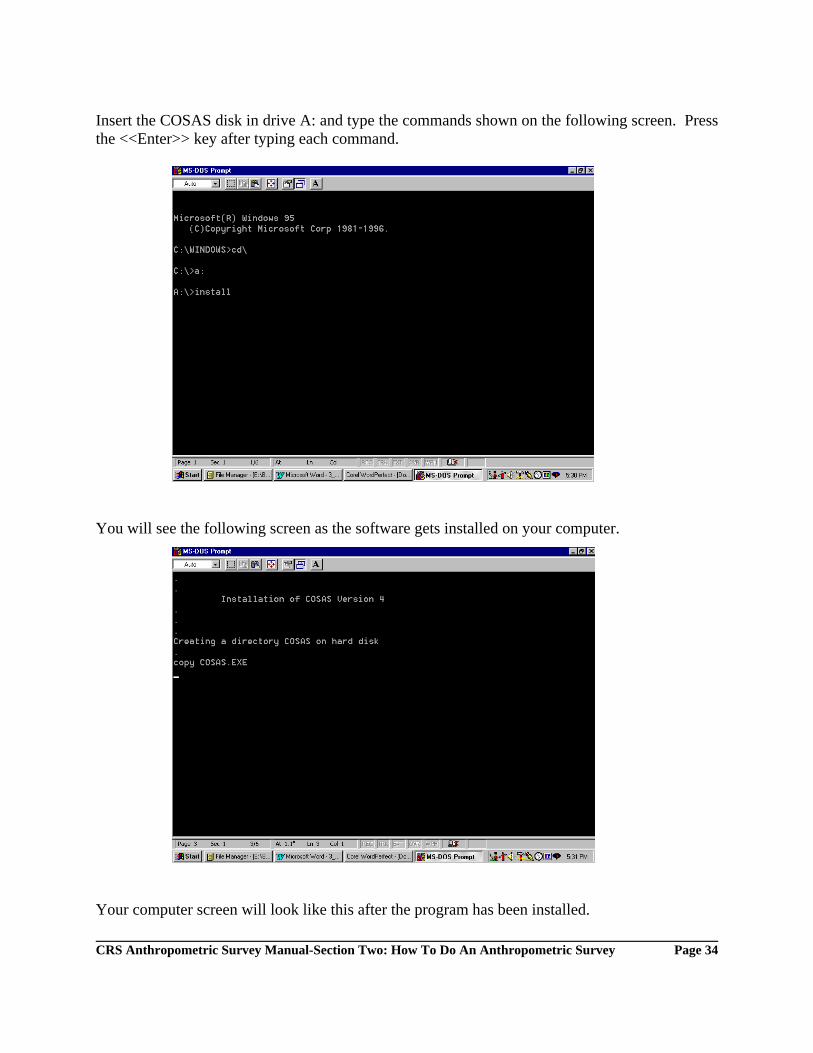
CRS Anthropometric Survey Manual-Section Two: How To Do An Anthropometric Survey Page 34
Insert the COSAS disk in drive A: and type the commands shown on the following screen. Press the <<Enter>> key after typing each command.
You will see the following screen as the software gets installed on your computer.
Your computer screen will look like this after the program has been installed.
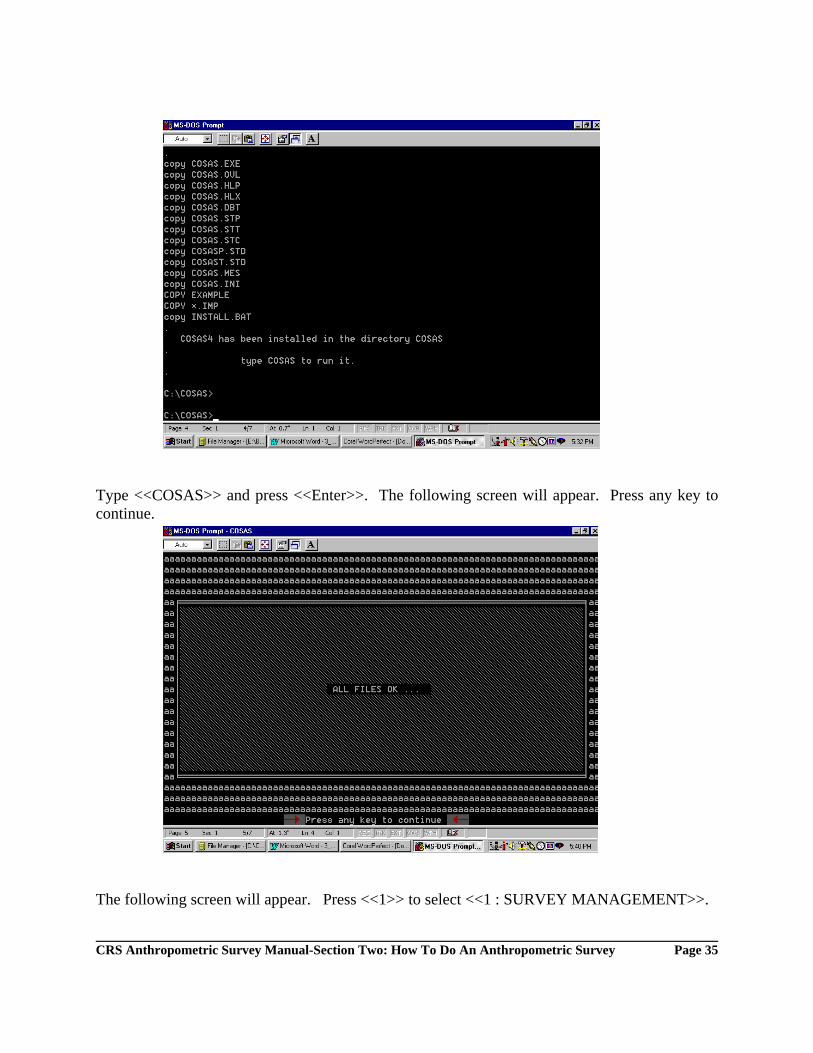
CRS Anthropometric Survey Manual-Section Two: How To Do An Anthropometric Survey Page 35
Type <<COSAS>> and press <<Enter>>. The following screen will appear. Press any key to continue.
The following screen will appear. Press <<1>> to select <<1 : SURVEY MANAGEMENT>>.

CRS Anthropometric Survey Manual-Section Two: How To Do An Anthropometric Survey Page 36
The following screen will appear. Press <<1>> to select <<1 : CHOOSE A SURVEY FILE>>. Insert a disk in drive A:.

CRS Anthropometric Survey Manual-Section Two: How To Do An Anthropometric Survey Page 37
Press <<Enter>> to select << >NEWFILE>>.
Type the name of the survey in the box. Then press <<F10>> to accept the change.

CRS Anthropometric Survey Manual-Section Two: How To Do An Anthropometric Survey Page 38
Press <<Enter>> to continue.
Press <<F10>> and then <<Enter>>.

CRS Anthropometric Survey Manual-Section Two: How To Do An Anthropometric Survey Page 39
Press <<F10>> and then <<Enter>>.
Press <<F10>> and then <<Enter>>.

CRS Anthropometric Survey Manual-Section Two: How To Do An Anthropometric Survey Page 40
The following screen will appear. Press <<5>> to select <<5 : COSTAT>>.
Press <<1>> to select <<1 : CHOOSE A LIST OF LOCALITIES>>.

CRS Anthropometric Survey Manual-Section Two: How To Do An Anthropometric Survey Page 41
Press <Enter> to select <NEWFILE>.
Type the name of the list of localities in the box. Then press <<F10>> to accept the change.

CRS Anthropometric Survey Manual-Section Two: How To Do An Anthropometric Survey Page 42
Press <<2>> to select <<2: EDIT THE CURRENT LIST OF LOCALITIES>>.
Type the name of the first locality in the first box, press <<Enter>>, and then type the population size in the second box and press <<Enter>>.
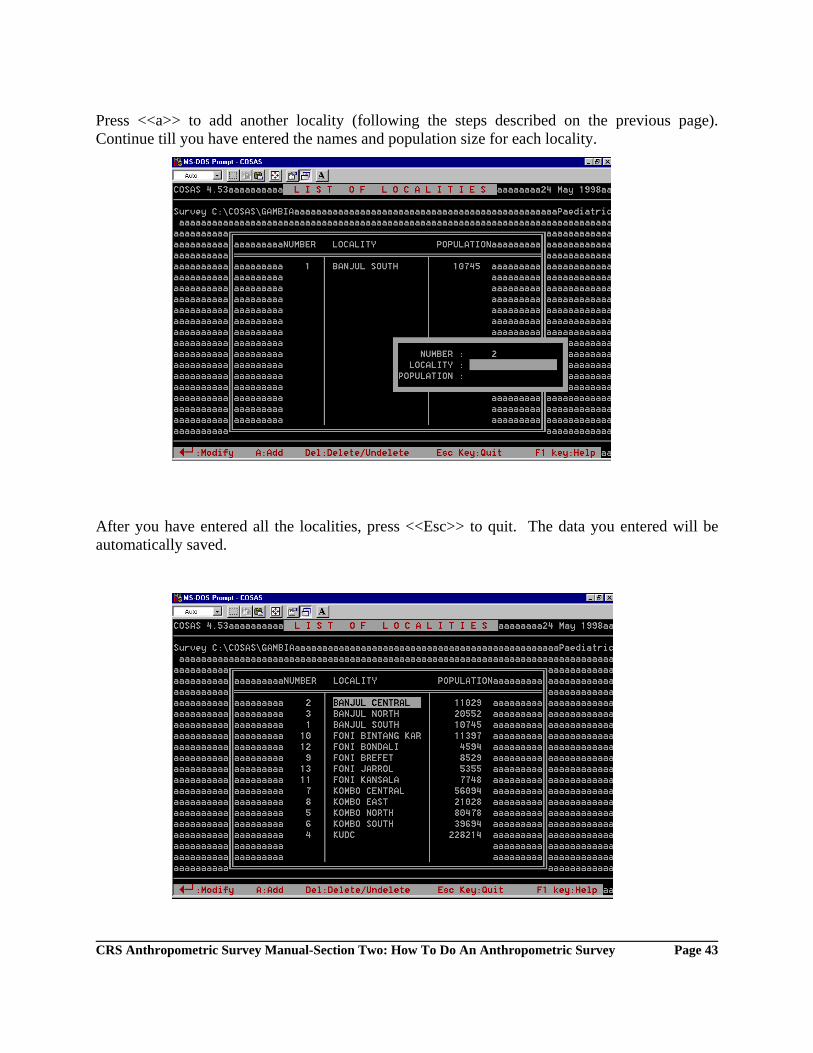
CRS Anthropometric Survey Manual-Section Two: How To Do An Anthropometric Survey Page 43
Press <<a>> to add another locality (following the steps described on the previous page). Continue till you have entered the names and population size for each locality.
After you have entered all the localities, press <<Esc>> to quit. The data you entered will be automatically saved.

CRS Anthropometric Survey Manual-Section Two: How To Do An Anthropometric Survey Page 44
Press <<3>> to generate the list of clusters.
The recommended number of clusters is 30. Press <<Enter>> to continue, unless you wish to select a different number of clusters (in which case, type the number and press <<Enter>>).
Press the <<Down>> key twice and press <<Enter>> to select <<File>>.

CRS Anthropometric Survey Manual-Section Two: How To Do An Anthropometric Survey Page 45
Type the name of the file in the box and press <<Enter>>.

CRS Anthropometric Survey Manual-Section Two: How To Do An Anthropometric Survey Page 46
Click on <<Start>>, then <<Accessories>>, and then <<Notepad>>.
Click on <<File>> and then <<Open>>.

CRS Anthropometric Survey Manual-Section Two: How To Do An Anthropometric Survey Page 47
Scroll through the list of folders in <<Look in>> till you find the folder where your COSAS files are located. Double click on the file in which you saved the results of the COSAS cluster selection procedure.
You have selected the clusters for your survey.

CRS Anthropometric Survey Manual-Section Two: How To Do An Anthropometric Survey Page 48
To quit COSAS, first click on the <<MS-DOS Prompt>> icon at the middle of the bottom of the screen; then press <<5>>, and then <<6>>. Press <<Enter>>. Finally type <<exit>> and press <<Enter>> to return to the Windows screen.
1.8.2 Selecting clusters by hand
The following excerpt from Assessing Community Health Needs and Coverage (from the Primary Health Care Management Advancement Programme-PHC MAP) describes how to select clusters by hand.
CRS Anthropometric Survey Manual-Section Two: How To Do An Anthropometric Survey Page 59
1.9 Obtaining Permission to Do the Survey
You will need to contact appropriate authorities for permission to do the survey in the selected clusters. The appropriate authority may be a person in the Ministry of Health or the district government. You may also need permission from community leaders. Finally and most importantly, obtain consent from the mothers whose children will be measured during the survey.
1.10 Adapting the Survey Questionnaire
Adapt the questionnaire given on the following page to meet the specific requirements of your survey. If you decide to integrate the anthropometric survey with a knowledge, practice, and coverage (KPC) survey, you can prepare a single questionnaire (with an anthropometric segment at the end of the KPC questions).

CRS Anthropometric Survey Manual-Section Two: How To Do An Anthropometric Survey Page 60
Anthropometric Survey, <Month, Year>, <Project Location>, <Country> Questionnaire
Identification Information Name of Surveyor _______________ Name of Survey Supervisor _______________ Name of Village/Community _______________ Cluster Number _______________ Interview Date ____/____/____ Rescheduled Interview Date ____/____/____
Date Month Year Date Month Year Time of Interview _______________ Problems with Interview (comment) _____________________________________________________________ __________________________________________________________________________________________
1 Name of Mother ................................................................................................................................................................_______________ 2 Name of Child ..................................................................................................................................................................._______________ 3 Sex of Child
1 Male........................................................................................................................................................................................................[ ] 2 Female ....................................................................................................................................................................................................[ ]
4 Date of Measurement ............................................................................................................................................................____/____/____
Date Month Year 5 Date of Birth of Child ...........................................................................................................................................................____/____/____
Date Month Year 6 Age of Child (in months) .................................................................................................................................................._______________ 7 Source Used to Verify Child’s Date of Birth
1 Birth Certificate......................................................................................................................................................................................[ ] 2 Health Card ............................................................................................................................................................................................[ ] 3 Estimated (Not Verified with Written Document) ................................................................................................................................[ ] 4 Other (specify) .......................................................................................................................................................................................[ ]
8 Stature
1 Recumbent Length (children less than 24 months) _______________ cm 2 Standing Height (children 24 months old or older) _______________ cm
9 Weight _______________ kg 10 Clothes worn by the child or problems with measurements
1 No clothes and no problems ...................................................................................................................................................[ ] 2 Light clothes............................................................................................................................................................................[ ] 3 Heavy clothes or multiple layers ............................................................................................................................................[ ] 4 Braids in girl’s hair .................................................................................................................................................................[ ] 5 Other (specify) ........................................................................................................................................................................[ ]
11 Status of questionnaire
1 Questionnaire complete ..........................................................................................................................................................[ ] 2 Child refused to be measured .................................................................................................................................................[ ] 3 Mother refused to have child measured..................................................................................................................................[ ] 4 Other (specify) ........................................................................................................................................................................[ ]
Comments __________________________________________________________________ Source: Adapted from Questionnaire developed by Irwin Shorr for Anthropometric Baseline Survey in The Gambia, 1998.
1.11 Making Copies of the Questionnaire

CRS Anthropometric Survey Manual-Section Two: How To Do An Anthropometric Survey Page 61
Add 10% to the number obtained from sample size calculations when deciding how many copies to make. This will ensure that the survey team has enough copies of the questionnaire even if some are lost, damaged, or wrongly filled during the survey.
1.12 Obtaining Maps
See Section 2.1 for examples of kinds of maps that are useful in carrying out an anthropometric survey.
1.13 Preparing Transportation Plans
Ask a project person who is familiar with the selected clusters to advice you in preparing transportation plans. If access to selected clusters is very difficult at certain times of the year (such as the rainy season), do the survey at a different time. It is not advisable to replace selected clusters with other, more accessible clusters.
1.14 Obtaining Measuring Instruments
Instrument for Measuring Length and Height The recommended instrument is the Shorr Infant / Child Height Measuring Board. It can be used to measure both recumbent length of children 0 - 23 months of age and standing height of children 24 - 59 months of age. The board is made of wood, collapses to two pieces to a height of 75 cm, and weighs approximately 6 kg. The price of this board is US$285.00 plus shipping and handling. To obtain more information or to order the boards, contact Irwin J. Shorr at: Shorr Productions Phone: 1-301-774-9006 17802 Shotley Bridge Place Fax: 1-301-774-0436 Olney, Maryland 20832, USA E-mail [email protected] Instrument for Measuring Weight The recommended instrument is the CMS hanging spring dial scale. It is made of polycarbonate and can be used for children who weight up to 25 kg. It is available from Shorr Productions (see address above) at a price of US$55 plus shipping and handling.
Source: Adapted from materials developed by Irwin Shorr for Anthropometric Baseline Survey in Benin, 1997. 1.15 Preparing Training Plans
Adapt the training plan given here to meet the specific requirements of your survey.

CRS Anthropometric Survey Manual-Section Two: How To Do An Anthropometric Survey Page 62
Anthropometric Survey, <Month, Year>, <Project Location>, <Country>
Training of Surveyors and Survey Supervisors Day 1: At a Training Facility (Approximately 4 hours)
1. Introduction to the survey 2. Anthropometric measurements and their purpose in the survey 3. Importance of taking accurate measurements 4. Types of measurement errors 5. Recording measurements 6. Reading measurements 7. Measuring instruments and their care 8. Measurement procedures and precautions 9. Measuring of heights and weights by trainees (of each other)
Day 2: At Source of Children (Approximately 4 hours) Demonstrations to the whole group and practice sessions in small groups (of four persons each) at a source of children (such as a day care center or nursery school).
Training Protocol 1 Demonstration of measurement by trainer 2 Two trainees repeat demonstration of measurement in front of rest of group 3 All trainees practice measurement with children in small groups 4 Discussion in whole group to share small group experiences
Day 3: At Source of Children (Approximately 4 hours) Continuation of day 2 training. Day 4: At Source of Children (Approximately 4 hours)
1. Standardization testing 2. Review of raw data with whole group to identify main reading, recording, and
other errors or trends in measurement test results 3. Further training as required
Note: Age assessment training and work with the survey questionnaire should be built into the above schedule. Source: Adapted from materials developed by Irwin Shorr for Anthropometric Baseline Survey in Benin, 1997. Planning the Standardization Test
It is very important to plan the activities of the standardization test before the event. Several weeks before, arrange a location with a large number of children and a space to

CRS Anthropometric Survey Manual-Section Two: How To Do An Anthropometric Survey Page 63
conduct the testing. Also, ensure that adequate numbers of height boards, scales, and weighing pants are available.
The night before the event, designate people to assist in the testing. Explain the general flow of the standardization test, then assign the following jobs and explain the role that each plays in the standardization test. Group Supervisor
If a large number of people are to be tested, assign them to smaller groups. Each group
will have four or five measuring teams (consisting of two people who will measure children), a tally person, a child coordinator, and a group supervisor.
The role of the group supervisor is to organize the measuring teams in the correct location, collect and return height boards and scales, and supervise the group in the standardization test. The group supervisor will need to explain to the group that when the first sheet is provided to the tally recorder, the measurer will receive the measuring sheet for the second measurement.
Tally Sheet Recorder
The recorder for each group should have the measurement sheets and the tally sheets. The recoder provides the first measurement sheet to each measurer. When the first measurement for all the children is complete, the measurer turns the sheet in and receives a new sheet from the tally recorder for the second set of measurements. The tally sheet is completed for the data on the measurement sheet (with carbon paper to ensure that there are copies for discussion after the test). Child Coordinator
This person assigns the children to measurement groups and marks their hands with the identification numbers (consisting of group and child numbers, e.g. A1....A7, B1....B7). S/he makes sure that children stay with their groups for measurement. Children may get frightened during the exercise and may need to be entertained. The tally sheet recorder can help with the children during the first measurement.
1.16 Recruiting and Training Surveyors and Survey Supervisors Selecting a Training Site
See the following excerpt from How to Weigh and Measure Children (published by the United Nations), “Annex B” and “Use of Form 2: Raw Data of Standardization Test,”

CRS Anthropometric Survey Manual-Section Two: How To Do An Anthropometric Survey Page 64
from Anthropometry as Part of Household Surveys, I.J. Shorr, the World Bank, Washington, DC, 1999, in press.

CRS Anthropometric Survey Manual-Section Two: How To Do An Anthropometric Survey Page 72
1.17 Getting Ready for Data Analysis
You will need the following equipment and supplies 1. Two IBM-compatible personal computers
The computers should run the MS-DOS operating system. Each computer should have: * At least 8 megabytes of random-access memory (RAM); * A hard drive with at least 10 megabytes of free disk space; * A three-and-a-half inch diskette drive; * A color graphics board; * A color monitor; * Windows 3.1 or Windows 95; * Microsoft Word for Windows or Word Perfect for Windows; and * Microsoft Excel for Windows
If Epi Info has not already been installed on the computers, see Appendix 1 for installation instructions. 2. Ten three-and-a-half inch high density diskettes (MS-DOS formatted). 3. Printers and stationery
Two printers should be available. About 1000 sheets of A4 paper should be available.

CRS Anthropometric Survey Manual-Section Two: How To Do An Anthropometric Survey Page 73
2. DOING THE SURVEY 2.1 Finding Children to Measure
See the excerpt from the FANta Sampling Guide on the following pages. For addition guidance see the paper by Turner et al in Appendix B.

CRS Anthropometric Survey Manual-Section Two: How To Do An Anthropometric Survey Page 82
2.2 Estimating the Age of the Child
See the following excerpt from How to Weigh and Measure Children (published by the United Nations), “Annex C.”
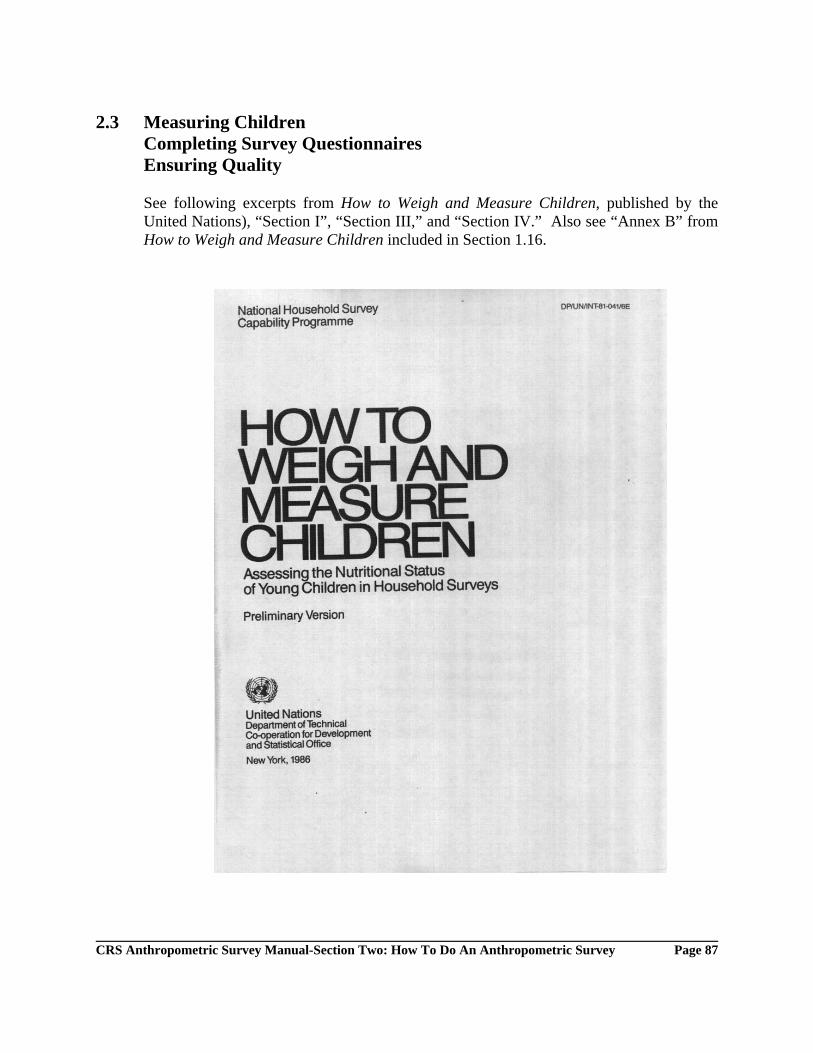
CRS Anthropometric Survey Manual-Section Two: How To Do An Anthropometric Survey Page 87
2.3 Measuring Children Completing Survey Questionnaires Ensuring Quality
See following excerpts from How to Weigh and Measure Children, published by the United Nations), “Section I”, “Section III,” and “Section IV.” Also see “Annex B” from How to Weigh and Measure Children included in Section 1.16.

CRS Anthropometric Survey Manual-Section One: Answers to General Questions Page 1
3. ENTERING, ANALYZING, AND PRESENTING DATA For a instructions about how to obtain a copy and crash course in Epi Info, see Appendix A.
Entering, Analyzing, and Presenting Data Using Epi Info and Excel If you do not have Epi Info installed on your computer, follow the instructions given in Appendix 1 (“Installing Epi Info”). Use the following description to enter data into an Epi Info file, use Epi Info to analyze them, and use Epi Info and Excel to present findings. Note that the instructions given here are for a computer running on Windows 95. If you are using another operating system (such as Windows 3.1), or if the files on your computer are organized into different folders, the screens will look a little different. However, the basic procedures are similar. Click on the <<Start>> button located at the bottom left of the screen. Then click on <<Programs>>. Click on <<EPI Programs>> and then <<Epi Info 6>>.

CRS Anthropometric Survey Manual-Section One: Answers to General Questions Page 2
Using EPED to Edit the Questionnaire On the screen that appears, click on <<Programs>>. This button is located near the top left corner of the screen. Next, click on <<EPED word processor>>.
Press <<F2>>. Then press <<Enter>>. Type the name of the directory where the questionnaire example (EXAMPLE.QES) is located and press <<Enter>>.

CRS Anthropometric Survey Manual-Section One: Answers to General Questions Page 3
Use the <<Up>> and <<Down>> cursor keys to scroll up or down till you find <<EXAMPLE.QES>>. Press <<Enter>>.

CRS Anthropometric Survey Manual-Section One: Answers to General Questions Page 4
The questionnaire is displayed on the screen. You can edit the questionnaire using the function keys of the keyboard (<<F4>> and <<F8>>) as well as other editing keys (such as <<Insert>> and <<Delete>>). When you have finished editing, press <<F9>> to save the file and <<F10>> to exit. If you need instruction in editing Epi Info questionnaires, press <<F3>> and select <<Word Processing Tutorial>> from <<EPIAID MAIN MENU>>. When you are finished select <<Make Epi Info Questionnaire>> from <<EPIAID MAIN MENU>>. Follow on-screen instructions. To get back to <<EPED>> after you finish, press <<F10>>. To see the questionnaire again, press <<F2>> and then <<Enter>> twice. Next, Use the <<Up>> and <<Down>> cursor keys to scroll up or down till you find <<EXAMPLE.QES>>. Press <<Enter>>.

CRS Anthropometric Survey Manual-Section One: Answers to General Questions Page 5
Using ENTER to Enter Data into an Epi Info File Click on <<Programs>> in Epi Info's opening screen. Then click on <<ENTER data>>. Near the bottom of the screen, the default path is described. If this is not where the questionnaire is located, press <<F2>> and follow instructions given on the next page; otherwise skip the next page.

CRS Anthropometric Survey Manual-Section One: Answers to General Questions Page 6
Type the name of directory where the questionnaire file is located in the first box and press <<Enter>>. Then press <<F10>>.
Type the name of the data file in the first box and press <<Enter>>. In the second box enter a number from 1 to 5 corresponding to the command you want to execute. If this is the first time you are working with the questionnaire, enter <<2>>. A new box <<New Questionnaire file (.QES) will pop up near the bottom of the screen.
Press <<F9>> to see list files. Use the <<Direction>> cursors on the keyboard to move to <<example.qes>> and press <<Enter>>.

CRS Anthropometric Survey Manual-Section One: Answers to General Questions Page 7
Press <<Enter>> twice.

CRS Anthropometric Survey Manual-Section One: Answers to General Questions Page 8
The data entry screen will appear.
Type the data for the first child. You will find that in the case of some boxes, such as the one for <<Mother's name>>, you will usually need to press <<Enter>> after typing the data to move to the next box (unless the data fill the entire box). In the case of other boxes, such as the one for <<Child's sex>>, as soon as you enter the data, you will be ready to enter data in the next box. When you have finished entering data for the first child, press <<F10>> and then <<Y>> in response to the question about writing data to disk.

CRS Anthropometric Survey Manual-Section One: Answers to General Questions Page 9
ENTER will display a blank screen for the second child's data. Repeat the steps described on the previous page till you have completed data entry for all the children included in the survey. If you take a break and exit ENTER before entering all the data, you will need to follow the instructions described on the next page to resume data entry; otherwise skip the next page. In the Epi Info opening screen, click on <<Programs>> and the <<ENTER data>>. Type <<1>> in the second box to resume data entry in an existing file.

CRS Anthropometric Survey Manual-Section One: Answers to General Questions Page 10
Using EPINUT to Analyze Data In the Epi Info opening screen, click on <<Programs>> and then <<EPINUT anthropometry>>.
Click on <<Indices>> and then <<Add to a File>>.

CRS Anthropometric Survey Manual-Section One: Answers to General Questions Page 11
To locate the file you've been working with, click on the <<Right Scroll>> button near the bottom of the screen (it looks like this: |>) till you see << ..\ >>. Click on that symbol. Repeat these steps till you see the directory where your data file is located.
Double click on the directory and then double click on the data file.
You will see the following screen. To enter required information in the first four boxes, follow instructions given on the next page.

CRS Anthropometric Survey Manual-Section One: Answers to General Questions Page 12
Click on the <<arrow>> button next to the first box. You will see a list of the variables in the file. Double click on the appropriate variable to place it in the box. Do this for the first four boxes.

CRS Anthropometric Survey Manual-Section One: Answers to General Questions Page 13
If "X" marks are not already on the screen as shown below, click on the appropriate part of the screen to display them. Your screen should look like the following screen when you are finished. Next, click on the <<Options>> button located near the middle of the bottom of the
screen. To change a value, double click on the appropriate box and type the new value. However, it is recommended that you use the values presented by EPINUT. Click on the <<Ok>> button to proceed to the next step.

CRS Anthropometric Survey Manual-Section One: Answers to General Questions Page 14
Click on the <<Process>> button located near the bottom of the left side of the screen.
EPINUT will display the following message when it has finished adding nutritional indices to the data file. Click on OK to move to the next step.
Click on <<Indices>> and then <<Analyze from a file>> in EPINUT's opening screen.

CRS Anthropometric Survey Manual-Section One: Answers to General Questions Page 15
To locate the file you've been working with, click on the <<Right Scroll>> button near the bottom of the screen (it looks like this: |>) till you see << ..\ >>. Click on that symbol. Repeat these steps till you see the directory where your data file is located.

CRS Anthropometric Survey Manual-Section One: Answers to General Questions Page 16
Double click on the directory and then double click on the data file.
To complete the form that appears on the screen, follow instructions given on the next page.

CRS Anthropometric Survey Manual-Section One: Answers to General Questions Page 17
To select variables, click on the arrows next to the boxes for age and sex. Double click on the appropriate variable from the lists that pop-up. Next, double click on the boxes for the lower and upper limit for age and enter the appropriate limits.
The completed form should be similar to the screen shown below. If there are blank areas in the spaces that look like this: <<[ ]>>, click on them to place <<X>> marks in them. Do this till your screen resembles the screen shown here. Then click on the <<Options>> button located near the middle of the bottom of the screen.

CRS Anthropometric Survey Manual-Section One: Answers to General Questions Page 18
Complete this form by clicking on the arrow next to the first box and double clicking on the appropriate cluster variable (as shown on the next page).
You can change the other options given on the form. However, it is recommended that you use the values presented by EPINUT.

CRS Anthropometric Survey Manual-Section One: Answers to General Questions Page 19
The completed form should look like the screen shown below. Next, click on the <<Ok>> button located near the left of the bottom of the screen.
Next, click on the <<Process>> button located near the left of the bottom of the screen.

CRS Anthropometric Survey Manual-Section One: Answers to General Questions Page 20
EPINUT has completed the analysis of the data. To look at a frequency distribution for height for age z-scores, click on the <<Graph>> button located near the right of the middle of the screen. Then click on the <<HAZ>> button on the list that pops-up.
The following graph appears. After you finish viewing the graph, press <<Enter>> to return to the previous screen.

CRS Anthropometric Survey Manual-Section One: Answers to General Questions Page 21
Click on the area next to <<WAZ WAP WAM>> located near the left of the top of the screen. Then click on the <<Graph>> button. Then click on the <<WAZ>> button on the list that pops-up.
The following graph appears. After you finish viewing the graph, press <<Enter>> to return to the previous screen.
Click on the area next to <<WHZ WHP WHM>> located near the left of the top of the screen. Then click on the <<Graph>> button. Then click on the <<WHZ>> button on the list that pops-up.

CRS Anthropometric Survey Manual-Section One: Answers to General Questions Page 22
The following graph appears. After you finish viewing the graph, press <<Enter>> to return to the previous screen.

CRS Anthropometric Survey Manual-Section One: Answers to General Questions Page 23
Click on the windows hidden behind the <<WHZ WHP WHM>> window, till the <<HAZ HAP HAM>> window comes to the front. Then click on the <<arrow>> buttons (they look like this: ^ V) at the right side of the window till you see <<Malnutrition indicators>> for height-for-age. Your screen should look like the screen shown below. The indicators shown in the window are calculated on the basis of height-for-age z-scores. Note down the indicators of interest. You can then type them into a table in a Word or WordPerfect document. (Skip the next two pages to see an example.) Click on the windows hidden behind the <<HAZ HAP HAM>> window, till the <<WAZ WAP WAM>> window comes to the front. Then click on the <<arrow>> buttons (they look like this: ^ V) at the right side of the window till you see <<Malnutrition indicators>> for weight-for-age. Your screen should look like the screen shown below. The indicators shown in the window are calculated on the basis of weight-for-age z-scores. Note down the indicators of interest. You can then type them into a table in a Word or WordPerfect document. (Skip the next page to see an example.)

CRS Anthropometric Survey Manual-Section One: Answers to General Questions Page 24
Click on the windows hidden behind the <<WAZ WAP WAM>> window, till the <<WHZ WHP WHM>> window comes to the front. Then click on the <<arrow>> buttons (they look like this: ^ V) at the right side of the window till you see <<Malnutrition indicators>> for weight-for-age. Your screen should look like the screen shown below. The indicators shown in the window are calculated on the basis of weight-for-height z-scores. Note down the indicators of interest. You can then type them into a table in a Word or WordPerfect document. (See the next page for an example.) Here's an example of a table that you can prepare with the values EPINUT gives you. The figures shown here for Izabal correspond to the figures shown in the previous pages since data from a survey in Izabal, Guatemala were used to compute both sets of figures. (The values are slightly different because the program used for the analysis shown here excluded fewer children as compared to EPINUT.) Note the mean z-scores presented in this table. EPINUT gives you these values too. The next two pages show you where to find them.

CRS Anthropometric Survey Manual-Section One: Answers to General Questions Page 25
Click on the windows hidden behind the <<WHZ WHP WHM>> window, till the <<HAZ HAP HAM>> window comes to the front. Then click on the <<arrow>> buttons (they look like this: ^ V) at the right side of the window till you see <<Characteristics of the distribution>> for height-for-age. Your screen should look like the screen shown below. The mean z-score for height-for-age is given at the right end of the row labeled <<Mean>>.
Click on the windows hidden behind the <<HAZ HAP HAM>> window, till the <<WAZ WAP WAM>> window comes to the front. Then click on the <<arrow>> buttons (they look like this: ^ V) at the right side of the window till you see <<Characteristics of the distribution>> for weight-for-age. Your screen should look like the screen shown below. The mean z-score for weight-for-age is given at the right end of the row labeled <<Mean>>.

CRS Anthropometric Survey Manual-Section One: Answers to General Questions Page 26
Click on the windows hidden behind the <<WAZ WAP WAM>> window, till the <<WHZ WHP WHM>> window comes to the front. Then click on the <<arrow>> buttons (they look like this: ^ V) at the right side of the window till you see <<Characteristics of the distribution>> for weight-for-height. Your screen should look like the screen shown below. The mean z-score for weight-for-height is given at the right end of the row labeled <<Mean>>. To quit EPINUT press <<F10>>. To quit Epi Info, press <<F10>> again.

CRS Anthropometric Survey Manual-Section One: Answers to General Questions Page 27
Using Excel to Make Graphs Instructions For Exporting Data From EPINUT to Make Z-Score Distribution Graphs (Note: The data used in these instructions are from a sample data set provided by EPINUT called "NUTRI.REC".) 1. Once you have created the indices that you want in EPINUT (HAZ, WAZ, WHZ) you can use the “Exp ASCII” command to export the data. 2. When you choose this option you will be asked to specify which index you want to export and then asked to give it a filename. EPINUT will propose a file extension named *.HAZ for the height/age data, *.WAZ for the weight/age data and *.WHZ for the weight/height data. 3. Save the file. It is important to note that EPINUT saves the data in a “comma-delimited ASCII” format. 4. Enter Excel and determine how to import “comma-delimited ASCII” data. 5. Caution! In some versions of EPINUT it seems that the title given to the Z-Score column is incorrect. For example, when exporting height/age z-scores, it has been noted that EPINUT assigns the title Height/Age % of Median. This is incorrect and should be corrected in the spreadsheet. 6. Once the data are imported they will be in the following format:
Height/Age Reference Both sexes Boys Girls -4.75 0 0 0 -4.75 0 0 0 0 -4.25 0 0 0 0 -3.75 0.02 0 0 0 -3.25 0.1 4.1 2 6.4 -2.75 0.45 12.2 9.8 14.9 -2.25 1.59 11.2 13.7 8.5 -1.75 4.31 17.3 13.7 21.3 -1.25 9.13 13.3 9.8 17 -0.75 15.06 20.4 19.6 21.3 -0.25 19.33 7.1 13.7 0 0.25 19.33 7.1 11.8 2.1 0.75 15.06 3.1 2 4.3 1.25 9.13 2 2 2.1 1.75 4.31 0 0 0 2.25 1.59 2 2 2.1 2.75 0.45 0 0 0 3.25 0.1 0 0 0 3.75 0.02 0 0 0 4.25 0 0 0 0 4.75 0 0 0 0 4.75 0 0 0
7. You may now graph the data using the spreadsheet. Please note that the first column above should be the “x-axis” data and the next three columns above are the “series” data. You will note that the curves are not as “smooth” as what you saw in EPINUT.

CRS Anthropometric Survey Manual-Section One: Answers to General Questions Page 28
Making Bar Graphs of % Malnourished The preceding discussion explains how to make the graphs related to the z-score distributions. This section describes how to make the bar graphs for the percent malnourished. For these graphs you will not need to export data but you will have to manually enter the data in a spreadsheet like Excel. The information for the graphs can be taken off the tables generated by EPINUT. This information can be saved in ASCII format (not comma-delimited) by using the “Edit” option when the data tables have been generated. The following table shows how the data can be arranged to make the bar charts. The numbers are percent values. Please note that this information was not taken directly for the EPINUT output. The output gives the total percentage of moderate (<-2.00sd) and severe (<-3.00sd) combined and then the severe alone. In order to do stacked bar charts you need the percent moderate (but not severe) and the percent severe. This is because the graphing program will then show the total percent moderate and severe combined. If you use the EPINUT output you will double count the severe percent. This table thus took the EPINUT output and subtracted the severe from the moderate to get the moderate only percent.
Malnutrition Age Groups Total
18 - 23 24 - 29 30 - 35 Moderate (Boys) 15 10 10 13 Severe (Boys) 4 2 2 3 Moderate (Girls) 17 15 14 15 Severe (Girls) 6 3 2 3 Moderate (Both Sexes) 16 12 12 14 Severe (Both sexes) 5 2 2 3
Using this table you can make three different graphs. The first graph, for example is the percent malnourished among boys by age. To make this graph the “x-axis is the entire top line (18-23.9, 24-29.9, 30-35.9, Total), the “legend title” is the cells containing “Moderate (Boys)” and “Severe (Boys)”. The first “series” is the line - 15, 10, 10, 13 and the second “series” is the line 4, 2, 2, 3. If you select the stacked bar option it should combine and sum these rows (vertically) to get percentages of 19, 12, 12, 16. You can then proceed to make the same graph for girls - by age and for both sexes - by age. The next three pages give examples of graphs prepared with Excel using data from Guatemala.

CRS Anthropometric Survey Manual-Section One: Answers to General Questions Page 29

CRS Anthropometric Survey Manual-Section One: Answers to General Questions Page 30

CRS Anthropometric Survey Manual-Section One: Answers to General Questions Page 31

CRS Anthropometric Survey Manual-Section One: Answers to General Questions Page 32
Box 5 provides additional guidance on computer tabulation.
Box 5 Computer Tabulation
When performing computerized tabulation it is important to have a systematic approach that allows for dual (simultaneous) data entry, in order to reduce time spent tabulating the data, and cross-checking the data, through second, idependant data entry of the same data. For more information on this aspect, the reader should refer to the EPI INFO manual which gives a broad overview how to perform this in EPI INFO. Depending on the sample size and the number of Primary Sampling Units, it will be necessary to determine a unique identifier for each child measured. This should be considered early on in the design of the survey questionnaire. When we refer to a unique identifer, we mean an identification number that is unique for each particular record, i.e., one that is never repeated in the data base. For instance, in many cluster surveys the unique identifier is a variable called IDNUM which is a combination of the cluster number and the household number. For instance, a child who was measured fifth in the cluster number 30 would be identified as child 3005, with the first two digits being cluster and last two signifying household number. Similarly, the IDNUM 0111 is the eleventh child measured in the first cluster. The advantage of this system is it allows data analysis supervisers to rapidly recover an original questionnaire for any child surveyed should an error be noted. In order to quickly recover the original of any given questionnaire, it is useful to collect and organize questionnaires according to cluster number and name. We recommend providing a survey folder (preferably of thick cardboard/plastic and elastic guards) with the cluster number and name clearly written on both sides of the folder to each survey team. Upon their return from the survey sites, the survey coordinator can then quickly verify each cluster by counting the number of questionnaires per folder. This organization of survey questionnaires should then be kept to facilitate the computer data entry. Each data entry person will then procede to treat each questionnaire within the folder. Once a given folder has been entered the name of the data entry person will be written on the front and indicating whether it is the 1st data entry or the second. This should be repeated until all the clusters/questionnaires have entered twice. During data analysis, any flagged records can be quickly recovered to verify that the information is correct and that no important comments were ignored. It is often very useful to review comments with the trainors/survey supervisors in order to clarify whether a given questionnaire should be elimated. On a number occaisons, we have been forced to eliminiate certain questionnaires because of the following problems: incorrect age calculation, children with physical deformities influencing correct height calculation, and improper measuring of a child (incorrect position).

CRS Anthropometric Survey Manual-Section One: Answers to General Questions Page 33
4. USING SURVEY FINDINGS
The following provides a sample report (without appendices). For guidance on interpreting survey findings, read the papers by the WHO Working Group in Appendix D and Gorstein et al in Appendix C.