anthropogenic n deposition increases soil c storage by decreasing the extent of litter decay:...
TRANSCRIPT

Anthropogenic N DepositionIncreases Soil C Storage by
Decreasing the Extent of Litter Decay:Analysis of Field Observations with
an Ecosystem Model
Kyle A. Whittinghill,1,4* William S. Currie,1 Donald R. Zak,1
Andrew J. Burton,2 and Kurt S. Pregitzer3
1School of Natural Resources and Environment, University of Michigan, Ann Arbor, Michigan 48109, USA; 2School of Forest
Resources and Environmental Sciences, Michigan Technological University, Houghton, Michigan 49931, USA; 3College of Natural
Resources, University of Idaho, Moscow, Idaho 83844, USA; 4Earth Systems Research Center, Institute for Earth, Oceans, and Space,University of New Hampshire, Durham, New Hampshire 03824, USA
ABSTRACT
Recent meta-analyses of experimental studies
simulating increased anthropogenic nitrogen (N)
deposition in forests reveal greater soil carbon (C)
storage under elevated levels of atmospheric N
deposition. However, these effects have not yet
been included in ecosystem-scale models of soil C
and N cycling and it is unclear whether increased
soil C storage results from slower decomposition
rates or a reduced extent of decomposition (for
example, an increase in the amount of litter
entering slowly decaying humus pools). To test
these alternatives, we conducted a meta-analysis of
litter decomposition data. We then used the results
from our meta-analysis to model C and N cycling in
four sugar maple forests in Michigan using an
ecosystem process model (TRACE). We compared
model results testing our alternative hypotheses to
field data on soil C storage from a 17-year N
deposition experiment. Using data from published
litter decomposition studies in forests, we deter-
mined that, on average, exogenous N inputs de-
creased lignin decomposition rates by 30% and
increased cellulose decomposition by 9%. In the
same set of litter decomposition studies increased
exogenous N availability increased the amount of
litter entering slowly decaying humus pools in a
manner significantly related to the lignocellulose
index of decaying litter. Incorporating changes to
decomposition rates in TRACE did not accurately
reproduce greater soil C storage observed in our
field study with experimentally elevated N depo-
sition. However, when changes in the extent of
decomposition were incorporated in TRACE, the
model produced increased soil C storage by
increasing the amount of litter entering the humus
pool and accurately represented C storage in plant
and soil pools under experimental N deposition.
Our modeling results and meta-analysis indicate
that the extent of litter decay as humus is formed,
rather than slower rates of litter decay, is likely
responsible for the accumulation of organic matter,
and hence soil C storage, under experimental N
Received 22 July 2011; accepted 28 December 2011;
published online 28 February 2012
Electronic supplementary material: The online version of this article
(doi:10.1007/s10021-012-9521-7) contains supplementary material,
which is available to authorized users.
Author Contributions: Field Experiment Design and Data Collection:
KSP, AJB, DRZ; Design of Current Modeling Study: KAW, WSC, DRZ;
Performed Research and Analyzed Data: KAW, WSC, DRZ; Wrote Man-
uscript: KAW, DRZ, WSC.
*Corresponding author; e-mail: [email protected]
Ecosystems (2012) 15: 450–461DOI: 10.1007/s10021-012-9521-7
� 2012 Springer Science+Business Media, LLC
450

deposition. This effect should be incorporated in
regional to global-scale models simulating the C
balance of forest ecosystems in regions receiving
elevated N deposition.
Key words: ecosystem model; nitrogen deposi-
tion; soil carbon storage; hardwood forests; limit
value; litter decomposition.
INTRODUCTION
Atmospheric nitrogen (N) deposition has been
increasing since pre-industrial times (Galloway and
others 2004; IPCC 2007), wherein the anthropo-
genic production of reactive N presently exceeds
natural N fixation by a factor of two. Increasing
atmospheric N deposition affects terrestrial ecosys-
tems through changes in plant community com-
position, net primary productivity (NPP), and soil
carbon (C) storage. In N-limited northern temper-
ate forests, anthropogenic N can increase biomass
and NPP, and therefore ecosystem C storage
(Townsend and others 1996; Magnani and others
2007; LeBauer and Treseder 2008; Sutton and
others 2008; Xia and Wan 2008; Liu and Greaver
2010). Recent syntheses of experimental N depo-
sition also demonstrate increased C storage in forest
soils resulting from the slowing of microbial decay
(Knorr and others 2005; Janssens and others 2010;
Liu and Greaver 2010). However, the potential for
atmospheric N deposition to increase soil C storage
through decreased decomposition has gone unex-
plored in models of ecosystem biogeochemistry
(Zak and others 2008).
The process of litter decay from fresh litter to soil
organic matter can be conceived in three stages.
After initial leaching of soluble compounds, the
first phase of decomposition is dominated by cel-
lulose metabolism, which is influenced by nutrient
availability and environmental conditions (Berg
and Staaf 1980; Melillo and others 1989; Berg
2000a, b). During this phase of decay, exogenous
inorganic N stimulates the activities of cellulose
degrading organisms, thereby accelerating decom-
position (Fog 1988; Carreiro and others 2000;
Knorr and others 2005). In the second phase of
decomposition, decay is dominated by the micro-
bial metabolism of lignin and lignified carbohy-
drates and is therefore regulated by the rate of
lignin decay (Berg and Staaf 1980; Melillo and
others 1989; Berg 2000a, b). At this point,
decomposition rates can decrease with greater
amounts of exogenous inorganic N, due to a
reduction in the activity of lignolytic enzymes such
as phenol oxidase (Fog 1988; Carreiro and others
2000; Sinsabaugh and others 2005; Knorr and
others 2005). As a result, effects of exogenous N on
soil C storage in experimental studies depend both
on the litter biochemistry (Carreiro and others
2000; Waldrop and others 2004; Keeler and others
2009) and the stage of decomposition examined
(Fog 1988; Berg and Matzner 1997; Neff and others
2002; Knorr and others 2005; Hobbie 2008).
In addition to changes in decomposition rates
during the first two phases of decay, exogenous N
also influences the amount of organic material that
fails to decompose during the first two phases, thus
entering a final, more recalcitrant phase. During this
stage of decay, the lignocelluose index, or ratio of
lignin to lignin plus cellulose, reaches a constant
level (approximately 0.7), and decomposition con-
tinues at a very slow pace (Berg and Staaf 1980;
Melillo and others 1989; Berg 2000a, b). During this
phase, the mixture of secondary compounds and
organic residues that remain become increasingly
dominated by humic substances and can essentially
be considered humified matter, whether in the O
horizon or in mineral soil. Depending on tempera-
ture and moisture regimes, oxygen availability, and
the activities of soil fauna, humus can continue to
decompose; however, in temperate forests it does so
at a much slower rate, typically an order of magni-
tude less than the rate of fresh litter decay. Investi-
gators have described the cumulative percentage of
mass loss from fresh litter, before it reaches the stage
of humus or stabilized organic matter, as the ‘‘limit
value’’ of decomposition for a particular litter in a
particular ecosystem. The limit value can be quan-
tified using the asymptote of an exponential decay
function fit to observations in field incubations (Berg
and others 1996, 2000; Berg 2000a, b; Harmon and
others 2009). Limit values of litter decomposition,
which range from 35 to 100% of accumulated mass
loss, are often negatively correlated with litter N
concentration, meaning N-rich litter has a lower
limit value of decomposition (Berg and others 1996,
2000; Berg 2000a, b; Berg and Meentemeyer 2002).
If exogenous N decreases the limit value, then the
extent of decay in the first two stages of decompo-
sition will decline, that is, there will be an increased
amount of material entering the phase of humus or
stabilized organic matter, and soil C storage should
increase over time.
We constructed hypotheses for changes in
decomposition that could be responsible for in-
Analysis of Field Observations with an Ecosystem Model 451

creases in the accumulation of organic matter in
forest floor and surface mineral soil observed
under elevated N deposition in our field studies.
We hypothesized that increases in organic matter -
under elevated N were due either to: (1)
decreases in the rate of decomposition resulting
from decreased lignin decomposition, despite an
increased rate of cellulose decomposition; or due to
2) decreases in the extent of decomposition resulting
in greater production of stabilized organic matter. To
test these alternatives and examine the relevant
importance of changes in decomposition rate and
extent on soil C storage, we used field results from a
17-year N deposition experiment, a meta-analysis of
data from published litter decomposition studies,
and a biogeochemical process model of coupled
forest C and N cycling, Tracer Redistributions
Among Compartments in Ecosystems (TRACE);
Currie and others 1999). The strength of using such
a model is that it not only simulates decomposition
but also includes C and N interactions such as
immobilization and mineralization in soils, plant
physiology such as tissue allocation and resorption
of C and N, and ecosystem-level feedbacks through
litter production and plant N uptake. We simulated
C and N cycling in four sugar maple stands receiving
ambient and experimental N deposition using
TRACE and compared model results to field obser-
vations. Our goal was to gain an increased under-
standing of the interaction of fine-scale processes, by
which atmospheric N deposition slows decay, with
the ecosystem-level outcome of greater organic
matter and C accumulation in the forest floor and
surface soil.
METHODS
Our study sites are four ecologically and edaphi-
cally matched sugar maple-dominated northern
hardwood forests in northern Michigan, all of
which have received ambient and experimental N
deposition treatments since 1994. We calibrated
TRACE at one of the forest stands under ambient N
deposition. We then ran TRACE under both
ambient and experimental N deposition scenarios
at all four forest stands without further changing
model parameters or model structure. Our model
runs started in 1930 when all four forest stands
were approximately 20 years of age (Burton and
others 2004) and ran for 170 years. We used a
meta-analysis of published litter decomposition
data to test our hypotheses that increased exoge-
nous N (1) alters the rate of litter decomposition or
(2) alters the proportion of litter entering slowly
decaying soil organic matter pools. To examine
how changes in the rate and extent of decomposi-
tion altered soil biogeochemistry and C storage, we
developed three alternative model versions. These
three model versions incorporated results from our
meta-analysis; one with altered decomposition
rates of litter (Rate Model), one with lower limit
values of litter decomposition (Extent Model), and
one with both altered rates and lower limit values
(Rate and Extent Model). We then compared
model results from the original version and the
three modified versions of TRACE to field data from
the 17-year N deposition experiment to determine
whether altered decomposition rates or extent had
a great influence on observed changes in soil C
storage.
Study Sites
The four forests we studied have similar soil prop-
erties, overstory composition, and age of re-estab-
lishment after logging (Pregitzer and others 2004;
Zak and others 2006). In each location, three 30-m
by 30-m plots receive ambient N deposition and
three plots of the same dimensions receive ambient
N deposition plus 3 g NO3- N m2 y-1. The addi-
tional N is delivered to the forest floor in six equal
applications of NaNO3 pellets during the growing
season (May–September). Detailed descriptions of
site characteristics and experimental methods have
previously been provided (Burton and others 2004;
Pregitzer and others 2004; Zak and others 2006).
Model Structure and Parameterization
To explore ecosystem feedbacks and interactions
mediating biogeochemical responses to increased N
deposition, we used the TRACE model of ecosystem
processes (Figure 1). TRACE was developed to
examine fluxes of C and N (including N stable
isotopes) within ecosystems and was initially
parameterized for use with N fertilization experi-
ments at Harvard Forest, Massachusetts (Currie and
Nadelhoffer 1999; Currie and others 1999, 2004).
TRACE runs on a monthly time-step in Visual Basic
6 (Microsoft, Inc.). Within TRACE, plant physiol-
ogy (including photosynthesis) is based on the
PnET-CN model (Aber and others 1997) and soil C
and N cycling are adapted from the DOCMOD
model (Currie and Aber 1997). Pools within
TRACE were chosen to represent measurable pools
whenever possible, making model-data compari-
sons for soil C pools possible. To that end, the
microbial community is represented within TRACE
as part of the soil and litter C and N pools. C and N
pools within litter and the organic horizon are
divided into three operationally defined fractions:
452 K. A. Whittinghill and others

total extractives (polar and non-polar extractable
compounds), acid soluble C (including cellulose
and hemicellulose), and acid insoluble C (including
lignin; Ryan and others 1990). In addition, the
organic and mineral soil horizons contain pools of
C and N in a separate humus pool. Prior versions of
TRACE allowed for interactions between climate
and litter lignin content to control decomposition
rates, but did not include effects of increased N
availability on litter decomposition rates or extent.
For each of the four sugar maple stands described
above, we developed a set of input variables
including climate, ambient N deposition, and initial
pool sizes of C and N in vegetation and soils. Where
possible, we obtained site-specific parameter val-
ues; however, when parameter values were not
available for our study sites, we used either pub-
lished results for North American sugar maple for-
ests or mixed northern hardwoods containing sugar
maple (Supplementary materials, Table S.1). For
non-site-specific parameters, we used values pre-
viously tested for hardwood forests at Harvard
Forest (Currie and Nadelhoffer 1999; Currie and
others 1999, 2004). To initialize soil pools of C and
N, we assumed the forest stands were winter logged
and had similar species composition prior to logging
(Zak, personal observations); therefore, we set initial
soil organic matter pools to present day values for
each stand due to the lack of soil disturbance fol-
lowing harvesting (Supplementary materials, Table
S.1). Climate data (monthly mean maximum
temperature, monthly mean minimum tempera-
ture, and total monthly precipitation) were down-
loaded from NOAA (www.ncdc.noaa.gov/daily
form/) using the closest weather monitoring site to
each forest stand (Hancock Houghton County Air-
port, Houghton County, MI for Site A; Pellston
Regional Airport, Emmet County, MI for Site B;
Mantisee 3e, Mantisee County, MI for Site C; and
Muskegon County Airport, Muskegon County, MI
for Site D). We used ArcGIS (ESRI, Inc.) to obtain
spatially explicit photosynthetically active radiation
and wet and dry N deposition data for all four study
sites from previously created raster data layers; wet
and dry N deposition raster datasets were adapted
from Holland and others (2004). Monthly averages
of daily mean irradiance, used to create our raster
dataset, were estimated by Kittel and others (2004).
Anthropogenic N-Induced Changesin Litter Decomposition
To examine N-induced changes in the rate and
limit value of litter decomposition, we compiled a
database of litter decomposition studies from sev-
eral N addition experiments in boreal, temperate,
and tropical forests (Magill and Aber 1998; Prescott
1995; Prescott and others 1999; Hobbie 2000;
Hobbie and Vitousek 2000; Thirukkumaran and
Parkinson 2000; Table S.2; Figures 2, 3). We in-
cluded only studies which had ambient N deposi-
tion and elevated N deposition treatments, with no
other nutrients added (for example, N addition, but
not N and phosphorous or N and sulfur additions).
All the experiments included in our database have
published decay curves of litter mass remaining
throughout a litter decomposition experiment. We
used DigitizeIt (Bormisoft, Inc.) to extract data from
figures in those papers that did not report exact
values for litter mass remaining over time.
For each individual litter study, we used linear
regression to determine the slope of initial decay
(during the first 12 months of decomposition) and
slope of late stage decay (defined as after the first
12 months of decomposition) in both control and N
addition treatments. To determine whether changes
in decomposition rates were related to the amount of
N addedor the litter lignocellulose index (LCI,defined
Figure 1. Diagram of TRACE model structure (Currie
and others 1999). DON dissolved organic nitrogen; PON
particulate organic nitrogen; CWD coarse woody debris;
FWD fine woody debris; min./imm. mineralization and
immobilization; (O)NH4+ organic soil layer ammonium;
(O)NO3- organic soil layer nitrate; (M)NH4
+ mineral soil
layer ammonium; (M)NO3- mineral soil layer nitrate.
Analysis of Field Observations with an Ecosystem Model 453

as acid-insoluble mass/(acid-soluble + acid-insoluble
mass); Aber and others 1990), we used linear
regression across all studies. All linear regression
analyses were completed using R (www.r-pro-
ject.org, 2010). We determined that N addition
decreased lignin decomposition rates by 30% and
increased cellulose decomposition by 9%, on average
(Figure 2). There were no significant relationships
between the rate of early stage decomposition and
either lignocellulose index or the amount of N added
to decomposing litter (Regression: N: F1,20 = 4.25,
P = 0.052, R2 = 0.18; LCI: F1,19 = 2.65, P = 0.12,
R2 = 0.076), or significant relationships between
the rate of late stage decomposition and either N
addition to litter or litter lignocellulose index
(Regression: N: F1,15 = 0.2018, P = 0.66, R2 = 0.013;
LCI: F1,15 = 0.094, P = 0.76, R2 = 0.007). Therefore,
we increased decomposition in the acid-soluble C
pool (which includes celluloses, primarily decom-
posed during early stages of decay) within TRACE by
multiplying the decay by a factor of 1.09 and
decreased the decomposition of the acid insoluble C
pool (which includes lignin, primarily decomposed
during the late stages of decay) by multiplying the
decay by a factor of 0.7 (Table 1). We will henceforth
refer to this model version as the Rate Model, because
it represents changes in the decomposition rate with
elevated N deposition.
To analyze changes in decomposition limit values
we fit an exponential decay model with an
asymptote to each set of litter decomposition data
for both control and N addition treatments (Fig-
ure 3). To fit exponential decay curves, we used the
drc package (http://cran.r-project.org/web/packa-
ges/drc/index.html) for analyzing dose response
curves in R using the following equation (Harmon
and others 2009):
M tð Þ ¼ 100� Að Þ � e�kt þ A ð1Þ
where M(t) is the percent of initial litter mass
remaining at time t (year), A (%) is the material
that remains after the early phases of decomposi-
tion (the asymptote of the decay curve), and k is
Figure 2. Mass remaining data from leaf litter decom-
position experiments under ambient N deposition (gray
diamonds) and N addition (open triangles) used to calculate
changes in decomposition rates with N addition (Magill
and Aber 1998; Prescott 1995; Prescott and others 1999;
Hobbie 2000; Hobbie and Vitousek 2000; Thirukkumaran
and Parkinson 2000). Tree species include Pinus resinosa,
Acer rubrum, Betula lenta, Quercus velutina, Pinus contorta,
Meterosideros polymorpha, and Populus tremuloides. Average
rates of decomposition used to calculate in model modi-
fications for the ‘‘Rate Model’’ and ‘‘Rate and Extent
Model’’ in the present analysis: early phase decomposi-
tion (solid lines) and second phase decomposition (dashed
lines) under ambient N deposition (gray lines) and ele-
vated N deposition (black lines).
Figure 3. Mass remaining data from leaf litter decom-
position experiments under ambient N deposition (gray
diamonds) and N addition (open triangles) used to calculate
changes in decomposition extent with N addition (Magill
and Aber 1998; Prescott 1995; Prescott and others 1999;
Hobbie 2000; Hobbie and Vitousek 2000; Thirukkumaran
and Parkinson 2000). Lines represent average decompo-
sition under ambient N deposition (gray line) and ele-
vated N deposition (black line) used to calculate in model
modifications for the ‘‘Extent Model’’ and the ‘‘Rate and
Extent Model’’ in the present analysis.
454 K. A. Whittinghill and others

the decomposition rate constant (y-1). We calcu-
lated the decomposition limit value as
LV ¼ 100� A ð2Þ
where LV (%) is the decomposition limit value and
A is as in equation (1). Limit values calculated as
part of our meta-analysis ranged from 47 to 91%
(data not shown), within the range of limit values
from the published literature of 35 to 100% (Berg
and others 1996).
We calculated the percent change in extent of
decomposition in response to exogenous N as:
DE ¼ EC � ENð Þ=EC ð3Þ
where DE is the percent change in the maximum
extent of decomposition, EC is the maximum
extent in the control treatment, and EN is the
maximum extent with exogenous N. We then used
linear regression to determine if the change in
decomposition extent was correlated with either
the amount of N added to decomposing litter or the
initial litter lignocellulose index (LCI). In our lit-
erature database, the asymptote of litter decompo-
sition (A in equation 1) was approximately 60%
higher with exogenous N addition, relative to
ambient N; therefore, N addition increased the
amount of litter entering the humus pool
(Figure 3), lessening the extent of decay. This
relationship was dependent on the initial LCI of
litter (Regression: F1,13 = 10.55, P = 0.006, R2 =
0.41), but not the amount of exogenous N
(Regression: F1,14 = 0.011, P = 0.92, R2 = -0.071).
Therefore, the effect of N addition on the maxi-
mum extent of decomposition was as follows:
DELCI ¼ �4:54þ 16:131 � LCI ð4Þ
where DELCI is the change in the maximum extent
of decomposition in relation to the litter LCI.
Because the limit value represents the point at
which decomposition slows to a very low rate, it
can be represented in TRACE as the amount of
litter entering the slowly decomposing humus pool.
Therefore, we added the change in limit value to
TRACE as an increase in the litter transfer to hu-
mus by multiplying humus transfer by a factor of
1 + DELCI (Table 1). We will henceforth refer to
this model version as the Extent Model, because it
represents a change in the extent of decomposition
with elevated N deposition.
Model Runs and Data Analysis
We simulated C and N cycling in all four study sites
using four different model versions and two levels
of N deposition consisting of (1) the ‘‘Original
Model’’ (for the present analysis this is TRACE 4.5
as described by Currie and others (2004)) under
ambient N and experimental N deposition, (2) the
‘‘Rate Model’’ (with altered cellulose and lignin
decomposition rates) under experimental N depo-
sition, (3) the ‘‘Extent Model’’ (with altered
decomposition limit values) under experimental N
deposition, and (4) the ‘‘Rate and Extent Model’’
(with altered decomposition rates and limit values)
under experimental N deposition. This approach
allowed us to test the relative importance of altered
decomposition rates and limit values for increased
soil C storage under elevated N deposition. For each
of the 20 combinations of model version, N depo-
sition treatment, and field site, we performed a
multivariate Monte Carlo analysis to examine
uncertainty in model predictions. We created a set
of 50 parameter input files in which we varied a
subset of model parameters (63/155 parameters)
stochastically and independently, using the identi-
cal parameter variations for all 20 sets of model
runs to allow direct comparison among model
versions. Within the set of parameter input files,
each parameter varied independently within a
normal distribution with a mean equal to the
nominal value and a standard deviation of 10% of
the nominal value (Currie and Nadelhoffer 1999).
The first of the 50 input files included all parame-
ters at their nominal values. Parameters perturbed
in the Monte Carlo analysis included those that
were not known constants or empirical coefficients,
were not site-specific climate or input parameters,
and were not internally calculated. Examples of
parameters which varied stochastically include the
rates of plant photosynthesis and respiration, the
growing season length, the foliar and fine root litter
chemistry, the ratio of gross to net N mineraliza-
tion, and the rate of humus decay. We used the
program R (www.r-project.org) to analyze the
Table 1. Decomposition Rate and HumificationRate Parameters Differing among TRACE ModelVersions in the Current Analysis
Parameter
description
Original
Model
Rate
Model
Extent
Model
Rate and
Extent
Model
N effect on acid
soluble carbon
decay
1.00 1.09 1.00 1.09
N effect on acid
insoluble carbon
decay
1.00 0.70 1.00 0.70
N effect on transfer
of litter to humus
1.00 1.00 4.00 4.00
Analysis of Field Observations with an Ecosystem Model 455
results from the 800 model runs beginning by cal-
culating means and standard deviations of all pools
and fluxes within TRACE in each year for each
model by treatment by site combination. We then
used analysis of variance in R to examine differ-
ences among sites, differences between ambient
and experimental N deposition for the ‘‘Original
Model,’’ and differences among the three model
versions under experimental N deposition.
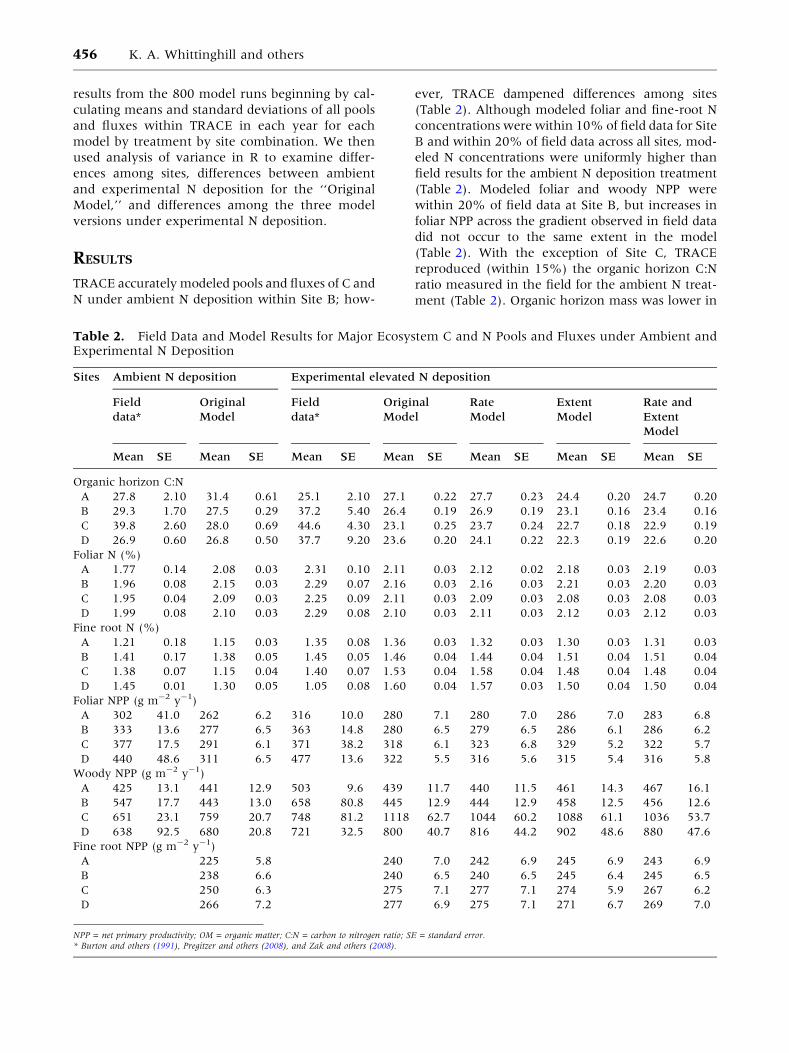
RESULTS
TRACE accurately modeled pools and fluxes of C and
N under ambient N deposition within Site B; how-
ever, TRACE dampened differences among sites
(Table 2). Although modeled foliar and fine-root N
concentrations were within 10% of field data for Site
B and within 20% of field data across all sites, mod-
eled N concentrations were uniformly higher than
field results for the ambient N deposition treatment
(Table 2). Modeled foliar and woody NPP were
within 20% of field data at Site B, but increases in
foliar NPP across the gradient observed in field data
did not occur to the same extent in the model
(Table 2). With the exception of Site C, TRACE
reproduced (within 15%) the organic horizon C:N
ratio measured in the field for the ambient N treat-
ment (Table 2). Organic horizon mass was lower in
Table 2. Field Data and Model Results for Major Ecosystem C and N Pools and Fluxes under Ambient andExperimental N Deposition
Sites Ambient N deposition Experimental elevated N deposition
Field
data*
Original
Model
Field
data*
Original
Model
Rate
Model
Extent
Model
Rate and
Extent
Model
Mean SE Mean SE Mean SE Mean SE Mean SE Mean SE Mean SE
Organic horizon C:N
A 27.8 2.10 31.4 0.61 25.1 2.10 27.1 0.22 27.7 0.23 24.4 0.20 24.7 0.20
B 29.3 1.70 27.5 0.29 37.2 5.40 26.4 0.19 26.9 0.19 23.1 0.16 23.4 0.16
C 39.8 2.60 28.0 0.69 44.6 4.30 23.1 0.25 23.7 0.24 22.7 0.18 22.9 0.19
D 26.9 0.60 26.8 0.50 37.7 9.20 23.6 0.20 24.1 0.22 22.3 0.19 22.6 0.20
Foliar N (%)
A 1.77 0.14 2.08 0.03 2.31 0.10 2.11 0.03 2.12 0.02 2.18 0.03 2.19 0.03
B 1.96 0.08 2.15 0.03 2.29 0.07 2.16 0.03 2.16 0.03 2.21 0.03 2.20 0.03
C 1.95 0.04 2.09 0.03 2.25 0.09 2.11 0.03 2.09 0.03 2.08 0.03 2.08 0.03
D 1.99 0.08 2.10 0.03 2.29 0.08 2.10 0.03 2.11 0.03 2.12 0.03 2.12 0.03
Fine root N (%)
A 1.21 0.18 1.15 0.03 1.35 0.08 1.36 0.03 1.32 0.03 1.30 0.03 1.31 0.03
B 1.41 0.17 1.38 0.05 1.45 0.05 1.46 0.04 1.44 0.04 1.51 0.04 1.51 0.04
C 1.38 0.07 1.15 0.04 1.40 0.07 1.53 0.04 1.58 0.04 1.48 0.04 1.48 0.04
D 1.45 0.01 1.30 0.05 1.05 0.08 1.60 0.04 1.57 0.03 1.50 0.04 1.50 0.04
Foliar NPP (g m-2 y-1)
A 302 41.0 262 6.2 316 10.0 280 7.1 280 7.0 286 7.0 283 6.8
B 333 13.6 277 6.5 363 14.8 280 6.5 279 6.5 286 6.1 286 6.2
C 377 17.5 291 6.1 371 38.2 318 6.1 323 6.8 329 5.2 322 5.7
D 440 48.6 311 6.5 477 13.6 322 5.5 316 5.6 315 5.4 316 5.8
Woody NPP (g m-2 y-1)
A 425 13.1 441 12.9 503 9.6 439 11.7 440 11.5 461 14.3 467 16.1
B 547 17.7 443 13.0 658 80.8 445 12.9 444 12.9 458 12.5 456 12.6
C 651 23.1 759 20.7 748 81.2 1118 62.7 1044 60.2 1088 61.1 1036 53.7
D 638 92.5 680 20.8 721 32.5 800 40.7 816 44.2 902 48.6 880 47.6
Fine root NPP (g m-2 y-1)
A 225 5.8 240 7.0 242 6.9 245 6.9 243 6.9
B 238 6.6 240 6.5 240 6.5 245 6.4 245 6.5
C 250 6.3 275 7.1 277 7.1 274 5.9 267 6.2
D 266 7.2 277 6.9 275 7.1 271 6.7 269 7.0
NPP = net primary productivity; OM = organic matter; C:N = carbon to nitrogen ratio; SE = standard error.* Burton and others (1991), Pregitzer and others (2008), and Zak and others (2008).
456 K. A. Whittinghill and others

modeled results than under field conditions, with the
exception of Site A; however, modeled values fell
within one standard error of measured organic hori-
zon mass for ambient N deposition (Figure 4).
Unlike field results in the experimental N deposi-
tion treatment, TRACE produced significant increases
in foliar, woody, and fine root NPP (Table 2; ANOVA:
foliar: F3,310 = 6.36, P = 0.012; woody: F3,310 = 9.55,
P = 0.002; fine root: F3,310 = 5.17, P = 0.024). How-
ever, this simulated response in foliar NPP was minor
and smaller than model-data discrepancies under ei-
ther ambient or elevated N treatments (Table 2).
TRACE did not reproduce increases in foliar N con-
centrations observed under experimental N deposi-
tion in the field (Table 2); however, TRACE did show
increases in fine root NPP with experimental N
deposition across all four sites, similar to field results
for Sites A, B, and C (Table 2).
Although the ‘‘Original Model’’ produced a sig-
nificant increase in organic horizon mass with
experimental N deposition relative to ambient
(Table 2; Figure 4; ANOVA: F3,310 = 4.01, P =
0.046), the increases were much smaller than those
observed in the field. On average, increases in or-
ganic horizon mass under experimental N deposition
in the ‘‘Original Model’’ were only 5% of observed
increases in organic horizon mass in field experi-
ments (Table 2). Different model versions produced
differences in mass of the organic horizon under
experimental N deposition with the highest organic
horizon masses occurring with the ‘‘Extent Model’’
and the ‘‘Rate and Extent Model’’ (Figure 4;
ANOVA: F2,463 = 155.97, P < 0.001; Tukey’s HSD:
a = 0.05). There were no significant differences in
organic horizon mass between the ‘‘Original Model’’
and the ‘‘Rate Model’’ or between the ‘‘Extent
Model’’ and the ‘‘Rate and Extent Model,’’ indicating
no significant increases in soil C storage with altered
decomposition rates alone (Figure 4; Tukey’s HSD:
a = 0.05). Only model versions with an altered
extent of decomposition approached the magnitude
of change in organic matter mass observed in field
results (Figure 4). Changes in organic horizon mass
in the ‘‘Extent Model’’ and the ‘‘Rate and Extent
Model’’ were accompanied by increases in the
organic horizon humus pool and decreases in the
organic horizon litter pool (Figure 4). Altering
decomposition rate and extent within TRACE did not
lead to significant differences in NPP among model
versions (Table 2; ANOVA: foliar: F3,623 =
0.33, P = 0.81; woody: F3,623 = 0.73, P = 0.53; fine
root: F3,623 = 0.079, P = 0.97). This latter result
indicated that direct effects of decomposition, not
changes in production, were responsible for the
modeled increases in mass of the organic soil horizon.
DISCUSSION
Our results indicate that increases in the extent of
litter mass entering the humus pool before
decomposition rather than simply changes in
decomposition rate lead to increases in soil C stor-
age under experimental N deposition. When both
the rate and the extent of decomposition were
altered in TRACE changes in the extent of decom-
position had a much greater effect on soil C storage
than changes in the rate of decomposition. The
A B C DSite
OrganicHorizonMass(gm2 )
01000
2000
3000
4000
5000 Ambient N
Experimental N
A B C DSite
OrganicHorizonMass(gm2 )
01000
2000
3000
4000
5000 Ambient N:
Original ModelExperimental N:Original ModelRate ModelExtent ModelRate and Extent Model
A B C D
Site
OrganicHorizonHumus(gCm2 )
0500
1000
1500
Ambient N:Original ModelExperimental N:Original ModelRate ModelExtent ModelRate and Extent Model
A B C D
Site
OrganicHorizonLitter(gC
m2 )
0500
1000
1500
Ambient N:Original ModelExperimental N:Original ModelRate ModelExtent ModelRate and Extent Model
A
C D
B
Figure 4. Organic horizon mass in A field plots and B
model results under ambient and experimental (ele-
vated) N deposition. Model results for organic horizon C
humus C pools and D litter C pools under ambient and
elevated N deposition. Here we present model results
from the ‘‘Original Model’’ for both ambient and exper-
imental N deposition, and results from the ‘‘Rate Model,’’
the ‘‘Extent Model,’’ and the ‘‘Rate and Extent Model’’
under experimental N deposition.
Analysis of Field Observations with an Ecosystem Model 457

mechanism for this change in model results was an
increase in humus pools of C in the organic hori-
zon, despite decreases in faster decomposing litter C
pools. This result is supported by empirical
evidence from field studies examining changes in
long-term decomposition with experimental N
addition which demonstrated declines in the extent
of decomposition of 20–50% (Magill and Aber
1998; Sinsabaugh and others 2002). Increasing
DOC export with elevated N deposition observed in
field studies under elevated N deposition (Currie
and others 1996; Pregitzer and others 2004; Liu and
Greaver 2010) is also consistent with increasing
production of humic substances in soils. Some of
these humic substances would be soluble and leach
to ground and surface waters, whereas others re-
main in soil, increasing soil C storage. Our results
emphasize the importance of multi-year (to decade
or longer) studies of how elevated N deposition
affects soil C storage, because the effects of changes
in the extent of decay may take years to decades to
appear as stabilized material accumulates.
One hypothesis proposed for increasing soil C
storage, due to transfer of a greater proportion of soil
organic matter to humus, is alterations in the
chemical composition of soil organic matter through
reactions with exogenous N. As litter decomposes,
inorganic N reacts with phenols and lignin enhanc-
ing the formation of recalcitrant compounds by
increasing the randomization of chemical bonds
which decreases the efficiency of extracellular en-
zymes mediating litter decay (Fog 1988; Berg and
Matzner 1997; Carreiro and others 2000). Therefore,
it is hypothesized that higher N availability might
produce a greater proportion of recalcitrant com-
pounds which enter humus rather than decompos-
ing during the first two phases of decomposition (Fog
1988; Berg and Matzner 1997; Knorr and others
2005; Janssens and others 2010). Our results from
the present modeling analysis and decomposition
meta-analysis are consistent with this mechanism,
indicating that decreases in the extent of decompo-
sition are important for increasing C sequestration in
forest soils under elevated N deposition.
Another hypothesis proposed for increased soil C
storage with elevated N deposition is altered extent of
decomposition due to changes in the microbial com-
munity. Altered microbial community composition
may lead to shifts in microbial resource use and
therefore reduced decomposition of soil organic
matter. In field studies, N addition leads to reduced
microbial biomass and often leads to decreased fungal
to bacterial ratios (Compton and others 2004; Frey
and others 2004; Wallenstein and others 2006; Tre-
seder 2008; Liu and Greaver 2010; van Diepen and
others 2010). In addition, there is evidence for
changes in microbial community composition under
experimental N deposition (Hofmockel and others
2007; Zakand others 2008).Decreases in the amounts
or activities of lignin degrading fungi would decrease
both the rate of lignin decay and the amount of sub-
strate accessible to other microbes as celluloses may
remain chemically protected within lignin molecules.
This could be an important mechanism for increasing
the amount of litter mass eventually stabilized as
humic substances, as indicated in our meta-analysis
and simulated in our modeling analysis.
Within TRACE, changes in decomposition rates
alone were not sufficient to produce observed in-
creases in soil C storage produced by experimental N
deposition under field conditions. Although there is
evidence from field incubations that the rate of litter
decomposition may decrease with elevated N depo-
sition, these changes in rates do not appear to be
sufficient to alter soil C storage over decadal time
scales as observed at our field sites. Rates of hetero-
trophic respiration from the forest floor decrease by
15% on average with N addition, but there is large
variability in the effect of elevated N deposition on
respiration between studies and over time (Bowden
and others 2004; Burton and others 2004; Frey and
others 2004; Zak and others 2006; Janssens and oth-
ers 2010; Liu and Greaver 2010). In addition, changes
in extracellular oxidative enzyme activity with N
addition are highly variable from study to study
showing an increaseor decrease depending on species
composition, but even among forests with relatively
similar composition (Carreiro and others 2000; Saiya-
Cork and others 2002; Sinsabaugh and others 2002,
2005; DeForest and others 2004; Frey and others
2004; Gallo and others 2004; Waldrop and Zak 2006;
Keeler and others 2009).
Despite large differences in ecosystem-level C
and N cycling between model versions, leading to
differences in organic horizon C storage, there were
no differences in foliar NPP among model versions.
This is consistent with the fact that experimental N
deposition did not stimulate production of either
aboveground or belowground litter in our field
experiment (Burton and others 2004; Pregitzer and
others 2008, 2010; Zak and others 2008), suggest-
ing these sites are already N rich. This is supported
by high N mineralization rates in sugar maple for-
ests as compared to N mineralization rates in other
Great Lakes forests (Zak and others 1993), as well
as the substantial leaching loss (�75% of added N)
of N under our experimental N deposition treat-
ment (Pregitzer and others 2004). Furthermore, Liu
and Greaver (2010) report that experimental N
addition increases aboveground litter fall by 20%
458 K. A. Whittinghill and others
on average across a variety of forest and grassland
ecosystems, indicating NPP is more responsive to
changes in N availability at other sites. However,
both model predictions and field data show an in-
crease in bolewood production with N addition
(Pregitzer and others 2008), which may increase C
storage in soils over longer timescales through in-
crease woody litter inputs.
Areas receiving elevated N deposition, including
forests, are expected to increase in geographic extent
in coming decades (Galloway and others 2008).
Changes in litter decomposition and soil organic
matter production are an important factor determin-
ing ecosystem C balance, a set of dynamics that will be
altered by future rates of anthropogenic N deposition
in an uncertain manner. Our present modeling re-
sults, conducted as a direct analysis of our field studies
across a long-term, large-scale field manipulation of
atmospheric N deposition, indicate that changes in the
extent, or end point, of litter decomposition should be
incorporated into regional, biome, or global-scale
models of C and N cycling to accurately simulate
changes in ecosystem C storage. Further research is
needed to determine the importance of litter bio-
chemistry, levels of N deposition, edaphic factors, and
variability among climates and forest types in con-
trolling the changes in decomposition extent that may
result from anthropogenic N deposition.
REFERENCES
Aber JD, Melillo JM, McClaugherty CA. 1990. Predicting long-
term patterns of mass loss, nitrogen dynamics, and soil organic
matter formation from initial fine litter chemistry in temper-
ate forest ecosystems. Can J Bot 68:2201–8.
Aber JD, Ollinger SV, Driscoll CT. 1997. Modeling nitrogen
saturation in forest ecosystems in response to land use and
atmospheric deposition. Ecol Model 101:61–78.
Berg B. 2000a. Initial rates and limit values for decomposition of
Scots pine and Norway spruce needle litter: a synthesis for N-
fertilized forest stands. Can J For Res 30:122–35.
Berg B. 2000b. Litter decomposition and organic matter turn-
over in northern forest soils. For Ecol Manag 133:13–22.
Berg B, Ekbohm G, Johansson MB, McClaugherty C, Rutigliano
F, DeSanto AV. 1996. Maximum decomposition limits of
forest litter types: a synthesis. Can J Bot 74:659–72.
Berg B, Johansson MB, Meentemeyer V. 2000. Litter decom-
position in a transect of Norway spruce forests: substrate
quality and climate control. Can J For Res 30:1136–47.
Berg B, Matzner E. 1997. Effect of N deposition on decomposi-
tion of plant litter and soil organic matter in forest systems.
Environ Rev 5:1–25.
Berg B, Meentemeyer V. 2002. Litter quality in a north European
transect versus carbon storage potential. Plant Soil 242:83–92.
Berg B, Staaf H. 1980. Decomposition rate and chemical changes
of Scots pine needle litter. II. Influence of chemical composi-
tion. In Structure and function of northern coniferous forests.
An ecosystem study. Ecol Bull 32:373–90.
Bowden RD, Davidson E, Savage K, Arabia C, Steudler P. 2004.
Chronic nitrogen additions reduce total soil respiration and
microbial respiration in temperate forest soils at the Harvard
Forest. For Ecol Manag 196:43–56.
Burton AJ, Pregitzer KS, Crawford JN, Zogg GP, Zak DR. 2004.
Simulated chronic NO3- deposition reduces soil respiration in
northern hardwood forests. Glob Change Biol 10:1080–91.
Burton AJ, Pregitzer KS, Reed DD. 1991. Leaf area and foliar
biomass relationships in northern hardwood forests located
along an 800 km acid deposition gradient. For Sci 37:1041–59.
Burton AJ, Pregitzer KS, Zogg GP, Zak DR. 1996. Latitudinal
variation in sugar maple fine root respiration. Can J For Res
26:1761–8.
Carreiro MM, Sinsabaugh RL, Repert DA, Parkhurst DF. 2000.
Microbial enzyme shifts explain litter decay responses to
simulated nitrogen deposition. Ecology 81:2359–65.
Compton JE, Watrud LS, Porteous LA, DeGrood S. 2004. Re-
sponse of soil microbial biomass and community composition
to chronic nitrogen additions at Harvard forest. For Ecol
Manag 196:143–58.
Currie WS, Aber JD, McDowell WH, Boone RD, Magill AH.
1996. Vertical transport of dissolved organic C and N under
long-term N amendments in pine and hardwood forests.
Biogeochemistry 35:471–505.
Currie WS, Aber JD. 1997. Modeling leaching as a decomposi-
tion process in humid montane forests. Ecology 78:1844–60.
Currie WS, Harmon ME, Burke IC, Hart SC, Parton WJ, Silver
W. 2010. Cross-biome transplants of plant litter show
decomposition models extend to a broader climatic range but
lose predictability at the decadal time scale. Glob Change Biol
16:1744–61.
Currie WS, Nadelhoffer KJ. 1999. Dynamic redistribution of
isotopically labeled cohorts of nitrogen inputs in two tem-
perate forests. Ecosystems 2:4–18.
Currie WS, Nadelhoffer KJ, Aber JD. 1999. Soil detrital processes
controlling the movement of 15N tracers to forest vegetation.
Ecol Appl 9:87–102.
Currie WS, Nadelhoffer KJ, Aber JD. 2004. Redistributions of15N highlight turnover and replenishment of mineral soil or-
ganic N as a long-term control on forest C balance. For Ecol
Manag 196:109–27.
DeForest JL, Zak DR, Pregitzer KS, Burton AJ. 2004. Atmo-
spheric nitrate deposition and the microbial degradation of
cellobiose and vanillin in a northern hardwood forest. Soil
Biol Biochem 36:965–71.
Fog K. 1988. The effect of added nitrogen on the rates of decom-
position of organic matter. Biol Rev Camb Philos Soc 63:433–62.
Frey SD, Knorr M, Parrent JL, Simpson RT. 2004. Chronic
nitrogen enrichment affects the structure and function of the
soil microbial community in temperate hardwood and pine
forests. For Ecol Manag 196:159–71.
Gallo M, Amonette R, Lauber C, Sinsabaugh RL, Zak DR. 2004.
Microbial community structure and oxidative enzyme activity
in nitrogen-amended north temperate forest soils. Microb Ecol
48:218–29.
Galloway JN, Townsend AR, Erisman JW, Bekunda M, Cai ZC,
Freney JR, Martinelli LA, Seitzinger SP, Sutton MA. 2008.
Transformation of the nitrogen cycle: recent trends, questions,
and potential solutions. Science 320:889–92.
Galloway JN, Dentener FJ, Capone DG, Boyer EW, Howarth
RW, Seitzinger SP, Asner GP, Cleveland CC, Green PA, Hol-
land EA, Karl DM, Michaels AF, Porter JH, Townsend AR,
Analysis of Field Observations with an Ecosystem Model 459

Vorosmarty CJ. 2004. Nitrogen cycles: past, present, and fu-
ture. Biogeochemistry 70:153–226.
Gough CM, Vogel CS, Harrold KH, George K, Curtis PS. 2007.
The legacy of harvest and fire on ecosystem carbon storage in
a north temperate forest. Glob Change Biol 13:1935–49.
Harmon ME, Silver WL, Fasth B, Chen H, Burke IC, Parton WJ,
Hart SC, Currie WS, Lidet . 2009. Long-term patterns of mass
loss during the decomposition of leaf and fine root litter: an
intersite comparison. Glob Change Biol 15:1320–38.
Hendrick RL, Pregitzer KS. 1996. Temporal and depth-related
patterns of fine root dynamics in northern hardwood forests. J
Ecol 84:167–76.
Hendricks JJ, Aber JD, Nadelhoffer KJ, Hallett RD. 2000.
Nitrogen controls on fine root substrate quality in temperate
forest ecosystems. Ecosystems 3:57–69.
Hobbie SE. 2000. Interactions between litter lignin and soil
nitrogen availability during leaf litter decomposition in a
Hawaiian Montane forest. Ecosystems 3:484–94.
Hobbie SE. 2008. Nitrogen effects on decomposition: a five-year
experiment in eight temperate sites. Ecology 89:2633–44.
Hobbie SE, Vitousek PM. 2000. Nutrient limitation of decom-
position in Hawaiian forests. Ecology 81:1867–77.
Hofmockel KS, Zak DR, Blackwood CB. 2007. Does atmospheric
NO3- deposition alter the abundance and activity of lignino-
lytic fungi in forest soils? Ecosystems 10:1278–86.
Holland EA, Braswell BH, Sulzman JM, Lamarque JF. 2004.
Nitrogen deposition onto the United States and Western
Europe. Data set. http://www.daac.ornl.gov, from Oak Ridge
National Laboratory Distributed Active Archive Center, Oak
Ridge, Tennessee, USA
IPCC. 2007. Summary for policymakers. In: Solomon S, Qin D,
Manning M, Chen Z, Marquis M, Averyt KB, Tignor M, Miller
HL, Eds. Climate Change 2007: The Physical Science Basis.
Contribution of Working Group I to the Fourth Assessment
Report of the Intergovernmental Panel on Climate Change.
Cambridge: Cambridge University Press. p 1–22.
Janssens IA, Dieleman W, Luyssaert S, Subke JA, Reichstein M,
Ceulemans R, Ciais P, Dolman AJ, Grace J, Matteucci G, Pa-
pale D, Piao SL, Schulze ED, Tang J, Law BE. 2010. Reduction
of forest soil respiration in response to nitrogen deposition.
Nat Geosci 3:315–22.
Keeler BL, Hobbie SE, Kellogg LE. 2009. Effects of long-term
nitrogen addition on microbial enzyme activity in eight for-
ested and grassland sites: implications for litter and soil or-
ganic matter decomposition. Ecosystems 12:1–15.
Kittel TGF, Rosenbloom NA, Royle JA, Daly C, Gibson WP, Fisher
HH, Thornton P, Yates DN, Aulenbach S, Kaufman C, McKe-
own R, Bachelet D, Schimel DS, VEMAP2 Participants. 2004.
VEMAP Phase 2 bioclimatic database. I. Gridded historical
(20th) century climate for modeling ecosystem dynamics
across the conterminous USA. Clim Res 27:151–70.
Knorr M, Frey SD, Curtis PS. 2005. Nitrogen additions and litter
decomposition: a meta-analysis. Ecology 86:3252–7.
LeBauer DS, Treseder KK. 2008. Nitrogen limitation of net pri-
mary productivity in terrestrial ecosystems is globally distrib-
uted. Ecology 89:371–9.
Liu LL, Greaver TL. 2010. A global perspective on belowground
carbon dynamics under nitrogen enrichment. Ecol Lett 13:
819–28.
Lovett GM, Weathers KC, Arthur MA, Schultz JC. 2004. Nitro-
gen cycling in a northern hardwood forest: do species matter?
Biogeochemistry 67:289–308.
Magill AH, Aber JD. 1998. Long-term effects of experimental
nitrogen additions on foliar litter decay and humus formation
in forest ecosystems. Plant Soil 203:301–11.
Magnani F, Mencuccini M, Borghetti M, Berbigier P, Berninger
F, Delzon S, Grelle A, Hari P, Jarvis PG, Kolari P, Kowalski AS,
Lankreijer H, Law BE, Lindroth A, Loustau D, Manca G,
Moncrieff JB, Rayment M, Tedeschi V, Valentini R, Grace J.
2007. The human footprint in the carbon cycle of temperate
and boreal forests. Nature 447:848–52.
Melillo JM, Aber JD, Linkins AE, Ricca A, Fry B, Nadelhoffer KJ.
1989. Carbon and nitrogen dynamics along a decay contin-
uum: plant litter to soil organic matter. Plant Soil 115:189–98.
Neff JC, Townsend AR, Gleixner G, Lehman SJ, Turnbull J,
Bowman WD. 2002. Variable effects of nitrogen additions on
the stability and turnover of soil carbon. Nature 419:915–17.
Nowinski NS, Trumbore SE, Jimenez G, Fenn ME. 2009. Alter-
ation of belowground carbon dynamics by nitrogen addition
in southern California mixed conifer forests. J Geophys Res
114:G02005.
Pregitzer KS, Burton AJ, Zak DR, Talhelm AF. 2008. Simulated
chronic nitrogen deposition increases carbon storage in
Northern Temperate forests. Glob Change Biol 14:142–53.
Pregitzer KS, Zak DR, Burton AJ, Ashby JA, MacDonald NW.
2004. Chronic nitrate additions dramatically increase the ex-
port of carbon and nitrogen from northern hardwood eco-
systems. Biogeochemistry 68:179–97.
Pregitzer KS, Zak DR, Talhelm AF, Burton AJ, Eikenberry JR.
2010. Nitrogen turnover in the leaf litter and fine roots of
sugar maple. Ecology 91:3456–62.
Prescott CE. 1995. Does nitrogen availability control rates of
litter decomposition in forests. Plant Soil 168–169:83–8.
Prescott CE, Kabzems R, Zabek LM. 1999. Effects of fertilization
on decomposition rate of Populus tremuloides foliar litter in a
boreal forest. Can J For Res 29:393–7.
R Development Core Team. 2010. R: A language and environ-
ment for statistical computing. R Foundation for Statistical
Computing, Vienna, Austria. ISBN 3-900051-07-0, http://
www.R-project.org/
Roskoski JP. 1980. Nitrogen-fixation in hardwood forests of the
northeastern United States. Plant Soil 54:33–44.
Ryan MG, Melillo JM, Ricca A. 1990. A Comparison of Methods
for Determining Proximate Carbon Fractions of Forest Litter.
Can J For Res 20:166–71.
Saiya-Cork KR, Sinsabaugh RL, Zak DR. 2002. The effects of long
term nitrogen deposition on extracellular enzyme activity in
an Acer saccharum forest soil. Soil Biol Biochem 34:1309–15.
Sinsabaugh RL, Carreiro MM, Repert DA. 2002. Allocation of
extracellular enzymatic activity in relation to litter composi-
tion, N deposition, and mass loss. Biogeochemistry 60:1–24.
Sinsabaugh RL, Gallo ME, Lauber C, Waldrop MP, Zak DR. 2005.
Extracellular enzyme activities and soil organic matter
dynamics for northern hardwood forests receiving simulated
nitrogen deposition. Biogeochemistry 75:201–15.
Staaf H, Berg B. 1982. Accumulation and release of plant
nutrients in decomposing scots pine needle litter—long-term
decomposition in a scots pine forest. 2. Can J Bot 60:1561–8.
Sutton MA, Simpson D, Levy PE, Smith RI, Reis S, van Oijen M,
de Vries W. 2008. Uncertainties in the relationship between
atmospheric nitrogen deposition and forest carbon seques-
tration. Glob Change Biol 14:2057–63.
Thirukkumaran CM, Parkinson D. 2000. Microbial respiration,
biomass, metabolic quotient and litter decomposition in a
460 K. A. Whittinghill and others
lodgepole pine forest floor amended with nitrogen and
phosphorous fertilizers. Soil Biol Biochem 32:59–66.
Townsend AR, Braswell BH, Holland EA, Penner JE. 1996.
Spatial and temporal patterns in terrestrial carbon storage
due to deposition of fossil fuel nitrogen. Ecol Appl 6:806–14.
Treseder KK. 2008. Nitrogen additions and microbial biomass: a
meta-analysis of ecosystem studies. Ecol Lett 11:1111–20.
van Diepen LTA, Lilleskov EA, Pregitzer KS, Miller RM. 2010.
Simulated nitrogen deposition causes a decline of intra- and
extraradical abundance of arbuscular mycorrhizal fungi and
changes in microbial community structure in northern hard-
wood forests. Ecosystems 13:683–95.
Waldrop MP, Zak DR, Sinsabaugh RL, Gallo M, Lauber C.
2004. Nitrogen deposition modifies soil carbon storage
through changes in microbial enzymatic activity. Ecol Appl
14:1172–7.
Waldrop MP, Zak DR. 2006. Response of oxidative enzyme
activities to nitrogen deposition affects soil concentrations of
dissolved organic carbon. Ecosystems 9:921–33.
Wallenstein MD, McNulty S, Fernandez IJ, Boggs J, Schlesinger
WH. 2006. Nitrogen fertilization decreases forest soil fungal
and bacterial biomass in three long-term experiments. For
Ecol Manag 222:459–68.
Xia JY, Wan SQ. 2008. Global response patterns of terrestrial
plant species to nitrogen addition. New Phytol 179:428–39.
Zak DR, Grigal DF, Ohmann LF. 1993. Kinetics of microbial
respiration and nitrogen mineralization in Great Lakes For-
ests. Soil Sci Soc Am J 57:11000–106.
Zak DR, Holmes WE, Burton AJ, Pregitzer KS, Talhelm AF. 2008.
Simulated atmospheric NO3- deposition increases soil organic
matter by slowing decomposition. Ecol Appl 18:2016–27.
Zak DR, Holmes WE, Tomlinson MJ, Pregitzer KS, Burton AJ.
2006. Microbial cycling of C and N in northern hardwood
forests receiving chronic atmospheric NO3- deposition. Eco-
systems 9:242–53.
Analysis of Field Observations with an Ecosystem Model 461