antenna measurements, rcs measurements and measurements … · antenna and pulsed signal...
TRANSCRIPT

Products: Vector Network Analyzers R&S® ZVM, R&S® ZVK; Microwave Signal Generators R&S® SMR
Antenna Measurements, RCS Measurements andMeasurements on Pulsed Signalswith Vector Network Analyzers
R&S ZVM, R&S ZVK
This application note describes the suitability of the R&S® ZVM and R&S® ZVK as multichannel microwavereceivers for antenna measurements and RCS measurements including measurements on pulsed signals.Application examples describe the measurement possibilities on pulsed signals using the R&S® ZVM/ZVK
as stand-alone units. In addition, various R&S® ZVM/ZVK-based antenna measurement systems of theMarch Microwave company are presented in detail.
Prof. Dr. J. Vokurka (March Microwave), Dr. Albert Gleißner (Rohde & Schwarz), Subject to change – August 2004 - id-number 1EZ52_OE

Antenna and pulsed signal measurements with theR&S ZVM/R&S ZVK
1EZ52_OE 2 Rohde & Schwarz
Contents1 Introduction............................................................................................32 Application-Specific Functions of the R&S ZVM/R&S ZVK...............4
2.1 Test Set of R&S ZVM/ZVK: Design, Sensitivity, Attenuators......42.2 Test Set of R&S ZVM/ZVK: Modified Version (Bypass Option) ..92.3 Measurement Speed .................................................................112.4 Frequency-Converting Mode.....................................................122.5 Power Dynamic Range, Power Calibration ...............................142.6 Trigger Functions and Sweep Modes........................................162.7 R&S ZVx Interfaces and Control of System Components.........16
3 Measurements on Pulsed Signals with R&S ZVM / R&S ZVK as Stand-Alone Units................................................................................17
3.1 Synchronous Pulse Measurements (“Long Pulses”)................173.2 Measurements on "Short" Pulses..............................................21
3.2.1 High Pulse Repetition Frequency (PRF) Range.....................213.2.2 Spectral Nulling ......................................................................223.3.3 Dynamic Range, Minimum Possible Pulse Width...................23
3.4 Pulsed S-Parameter and Group-Delay......................................243.4.1 Calibration ..............................................................................243.4.2 S-Parameter Measurements on Carrier and Harmonics ........253.4.3 S-Parameter Measurements with Swept Carrier ....................30
4 Measurement Examples for Antenna and RCS Applications Using the R&S ZVM/R&S ZVK in March MicroWave Systems ...................33
4.1 Antenna Measurements: System Examples, Specifications....334.1.1 Antenna measurements - basic configuration ........................ 354.1.2 Antenna measurements - remote mixer configuration............384.1.3 Antenna measurements - pulse operation option ...................404.1.4 Antenna measurements - pulse profile measurements ..........43
4.2 Radar Cross Section measurements ........................................455 Conclusions .........................................................................................506 References ...........................................................................................507 Additional Information ........................................................................50

Antenna and pulsed signal measurements with theR&S ZVM/R&S ZVK
1EZ52_OE 3 Rohde & Schwarz
1 IntroductionMeasurement systems for antennas cover a wide range of various systemsand measurement methods, from simple matching and transmissionmeasurements to high-resolution measurements of radiation patterns,RCS- (Radar Cross Section), or measurements of pulsed signals over longdistances. The classic use of network analyzers is actually to characterizeRF or MW components like filters or amplifiers by S-parameters. However,because of their basic quality as multichannel microwave receivers, R&S®
network analyzers are highly suited for antenna measurement systems.
R&S® ZVM and R&S® ZVK can be used as a stand-alone unit for a numberof antenna measurements. Many applications in this field, however, requireextensive systems equipped with shielded chambers, reflectors, positioningmechanics, control and evaluation software, etc. The March Microwavecompany (Netherlands) is a supplier of all-in-one measurement systems ofthis kind, including corresponding control and analysis software packages.The R&S® ZVM and R&S® ZVK were integrated into different customizedmeasurement systems in cooperation with Rohde & Schwarz.
This application note is therefore divided essentially into three parts:
Chapter 2: Description of the specifications and functions of which theR&S® ZVM and R&S® ZVK are suitable as multichannel microwavereceivers and core components for antenna measurement systems. Focusis on flexibility of the test set, the four integrated receiver channels and theirsensitivity, the synchronous control of the internal and external signalsources, measurement speed and other useful detail functions. Thesensitivity of up to 140 dBm is outstanding, as are the excellent systemsweep speed values.
Chapter 3: Measurements on pulsed signals using the R&S® ZVM/ZVK asstand-alone units. The measurement speed is discussed, and appropriatemethods for measurements on "long" pulses in a synchronized and settledstate and on "short" pulses in the unsynchronized high PRF(1) mode arepresented. Measurements of the average amplitude of a pulse stream andof the corresponding spectrum, the complex S-parameters or phase andgroup-delay measurements of a pulse stream are possible. Depending onthe repetition rate, the average values of pulses well under a width of0.1 µs can be measured.
Chapter 4: Detailed description of R&S® ZVM-based systems of the MarchMicrowave company including theoretical background. Systems for directtransmission measurements, with external mixing for signal transmissionover long distances, for near/far-field measurements, for RCSmeasurements and for pulse profile measurements - in contrast to R&S®
ZVM/ZVK as stand-alone-units - on single pulses are presented. Forexample, a sensitivity of 80-90 dBsm in a shielded chamber, excellentsystem sweep times and a hitherto unattained resolution for pulse profilingof 5 ns can be achieved.
Note 1: In this application note, the abbreviation “R&S ZVx” is used, standing for both network analyzers, R&S ZVM and R&S ZVK.
Note 2: The R&S logo, Rohde & Schwarz and R&S are registered trademarks of Rohde & Schwarz GmbH & Co. KG and their subsidiaries.
1 Pulse Repetition Frequency

Antenna and pulsed signal measurements with theR&S ZVM/R&S ZVK
1EZ52_OE 4 Rohde & Schwarz
2 Application-Specific Functions of the R&S ZVM/R&S ZVKThe R&S ZVM (10 MHz to 20 GHz) and the R&S ZVK (10 MHz to 40 GHz)are vector network analyzers with an integrated generator and twomeasurement and two reference channels. The following sections describeimportant characteristics of the R&S ZVM and the R&S ZVK that are usefulfor antenna measurements.
2.1 Test Set of R&S ZVM/ZVK:Design, Sensitivity, AttenuatorsOne requirement of many antenna measurement systems is to detectsignals from a number of receivers as loss-free and interference-free aspossible – typically from antennas to capture the horizontally, vertically orcircularly polarized radiation portion or from antennas at different locations.The basic model of the R&S ZVM and the R&S ZVK, featuring twomeasurement and two reference channels, can be used for suchapplications as a four-channel microwave receiver. The quasi-simultaneousmeasurement of up to four signals avoids reconnecting or interference fromexternal switches.The reference paths run via the front panel using cable clips: afterremoving the cable clips, the test signals can be fed to PORT 1 andPORT 2 as well as to R1 CH IN and R2 CH IN. The measured power fromall 4 channels a1, a2, b1 and b2 as well as all ratios of these wavequantities and of course all possible S-parameters can be simultaneouslydisplayed.
Figure 1:
Test set of the Network Analyzers R&S ZVM and R&S ZVK. The optionalGenerator Step Attenuators R&S ZVM/ZVK-B21/22 and Receiver StepAttenuators R&S ZVM/ZVK-B23/24, as well as the additional inputs fordirect receiver access INPUT b1 and INPUT b2 are marked in red.
RemovableCable Clips
ReferenceChannel a2
Measurement Channel b2
PORT 2
INPUT b2ZVM(K)-B24
a2
b2
Generator
ZVM(K)-B23
DC Bias
ZVM(K)-B22
ZVM(K)-B21
PORT 1
ReferenceChannel a1
R1 CH. IN
MeasurementChannel b2
INPUT b1
b1
a1
b2
b1
DC Bias
R1 CH. OUT
R2 CH. OUT
R2 CH IN

Antenna and pulsed signal measurements with theR&S ZVM/R&S ZVK
1EZ52_OE 5 Rohde & Schwarz
Optionally all generator and receiver paths can be equipped withmechanical step attenuators (Figure 1) . The installation of a receiver stepattenuator automatically includes the additional Input b1 or Input b2 fordirect receiver access. The attenuators allow the generation of very smallsignals down to -90 dBm or the direct measurement of powers up to+27 dBm at the standard test ports PORT 1 and PORT 2 and up to+20 dBm via the additional inputs.
In addition, this increases the number of test ports, as six signals can bedetected via PORT 1 and PORT 2, the two reference channel ports andinput b1/b2 without a switching matrix or reconnecting. The mechanicalswitches in the Receiver Step Attenuators R&S ZVM/K-B23 andR&S ZVM/K-B24 and the switch after the generator can be setindependently of each other as follows by using an IEC/IEEE buscommand or manually via softkeys:
MODE: INPUTS : PORT 1 - INPUT b1 or PORT 2 - INPUT b2
MEAS: WAVE QUANTITY : DRIVE PORT 1 - PORT 2
Another advantage of the direct receiver inputs b1 and b2 is that theyprevent coupler loss and thus increase sensitivity. The following diagramsshow the typical sensitivity of the R&S ZVM and R&S ZVK using thestandard test ports PORT 1 and PORT 2 and the direct receiver inputs b1and b2 at different IF bandwidths. The data was collected by terminatingthe unused test ports with MATCHes. No averaging was applied.
Figure 2:Typical sensitivity of the R&S ZVK (up to 40 GHz) using test PORT 1with IF bandwidths of 10 kHz and 10 Hz. The specified data sheetvalues (@ 10 Hz) are indicated by red lines in the bottom diagram.
5 GHz 35 GHz
20 dB/
-140 dBm
20 dBm
5 GHz 35 GHz
20 dB/
-140 dBm
20 dBm
b1 MAGdB
MAGdB
CH1 ↓-140 dBm ↑20 dBm
START 10 MHz STOP 40 GHz5 GHz/CH2 ↓-140 dBm ↑20 dBm
START 10 MHz STOP 40 GHz5 GHz/
Senstivit y ZV K (std): PORT 1, IFBW = 10 kHz / 10 Hz.
FIL1010FIL1010
b1
D1 0 d Bm
D1 0 d Bm
Date: 10.D EC.03 16:07:11

Antenna and pulsed signal measurements with theR&S ZVM/R&S ZVK
1EZ52_OE 6 Rohde & Schwarz
Figure 3:Typical sensitivity of the R&S ZVM (up to 20 GHz) using test PORT 1 withIF bandwidths of 10 kHz and 10 Hz. The specified data sheet values(@ 10 Hz) are indicated by red lines in the bottom diagram.
Figure 4:Typical sensitivity of the R&S ZVK (up to 40 GHz) using Input b1 with IFbandwidths of 10 kHz and 10 Hz.
18 GHz
20 dB/
-140 dBm
20 dBm
18 GHz
20 dB/
-140 dBm
20 dBm
b1 MAGdB
MAGdB
CH1 ↓-140 dBm ↑20 dBm
S TART 10 MHz STOP 20 GHz2 G Hz/CH2 ↓-140 dBm ↑20 dBm
S TART 10 MHz STOP 20 GHz2 G Hz/
Senstivity ZVM (std): PORT 1, IFBW = 10 kHz / 10 Hz.
FIL1010FIL1010
b1
18 GHzD1 0 dB m
D1 0 dB m
Date: 10.DEC.03 16:13:39
5 GHz 35 GHz
20 dB/
-140 dBm
20 dBm
5 GHz 35 GHz
20 dB/
-140 dBm
20 dBm
MAGdB
b1 MAGdB
CH1 ↓-140 dBm ↑20 dBm
START 10 MHz STOP 40 GHz5 GHz/CH2 ↓-140 dBm ↑20 dBm
START 10 MHz STOP 40 GHz5 GHz/
Senstivity ZVK (std): Input b1, IFBW = 10 kHz / 10 Hz.
FIL10k10kFIL10k10k
TRGMANMANTRGMANMAN
EXT
b1
D1 0 dBm
D1 0 dBm
Date: 10.DEC.03 16:22:41

Antenna and pulsed signal measurements with theR&S ZVM/R&S ZVK
1EZ52_OE 7 Rohde & Schwarz
Figure 5:Typical sensitivity of the R&S ZVM (up to 20 GHz) using Input b1 with IFbandwidths of 10 kHz and 10 Hz.
Figure 6:Typical sensitivity of the R&S ZVK (up to 40 GHz) using Input b2 with IFbandwidths of 10 kHz and 10 Hz.
18 GHz
20 dB/
-140 dBm
20 dBm
18 GHz
20 dB/
-140 dBm
20 dBm
b1 MAGdB
MAGdB
CH1 ↓-140 dBm ↑20 dBm
START 10 MHz STOP 20 GHz2 GHz/CH2 ↓-140 dBm ↑20 dBm
START 10 MHz STOP 20 GHz2 GHz/
Senstivity ZVM (std): Input b1, IFBW = 10 kHz / 10 Hz.
FIL1010FIL1010
TRGMANMANTRGMANMAN
EXT
b1
18 GHzD1 0 dBm
D1 0 dBm
Date: 10.DEC.03 16:29:25
5 GHz 35 G Hz
2 0 dB/
- 140 dBm
2 0 dBm
5 GHz 35 G Hz
2 0 dB/
- 140 dBm
2 0 dBm
MAGdB
b2 MAGdB
CH1 ↓-1 40 dBm ↑20 dBm
START 10 MHz STOP 40 GHz5 GHz/CH 2 ↓-1 40 dBm ↑20 dBm
START 10 MHz STOP 40 GHz5 GHz/
Senstivity ZVK (std): Input b2, I FBW = 10 kHz / 10 Hz.
FIL10k10kFIL10k10k
TRGMANMANTRGMANMAN
EXT
b2
D1 0 dBm
D1 0 dBm
Date: 10.DEC.03 16:44 :12

Antenna and pulsed signal measurements with theR&S ZVM/R&S ZVK
1EZ52_OE 8 Rohde & Schwarz
Figure 7:Typical sensitivity of the R&S ZVM (up to 20 GHz) using Input b2 with IFbandwidths of 10 kHz and 10 Hz.
18 G Hz
2 0 dB/
- 14 0 d Bm
2 0 dBm
18 G Hz
2 0 dB/
- 14 0 d Bm
2 0 dBm
b2 MA GdB
MA GdB
CH 1 ↓ -140 dBm ↑20 dBm
STAR T 10 M Hz S TO P 20 G Hz2 GH z/CH2 ↓ -140 d Bm ↑20 dBm
ST ART 1 0 MHz S TO P 20 G Hz2 GH z/
Senstivity ZV M ( st d): In pu t b 2, IFBW = 10 kH z / 10 H z.
FIL1010FIL1010
TRGMANMANTRGMANMAN
EXT
b2
18 G HzD 1 0 dB m
D 1 0 dB m
D ate: 10. DEC. 03 16:47 :02

Antenna and pulsed signal measurements with theR&S ZVM/R&S ZVK
1EZ52_OE 9 Rohde & Schwarz
2.2 Test Set of R&S ZVM/ZVK:Modified Version (Bypass Option)
It can be advantageous to completely decouple the generator path from thereceiver paths – for example, if an active antenna connected to PORT 1 orPORT 2 can only receive and the test signal cannot be output via thestandard ports.Another reason for decoupling is to decrease internal crosstalk in certaincases. If, for example, part of the output power is reflected at PORT 1 dueto non-ideal matching of the connected antenna, crosstalk in theR&S ZVM(ZVK)-B23 switch causes some of the power to get intomeasurement channel b1, which results in a decrease of the sensitivity forthe signal fed to Input b1 and asymmetry of the measured signals.
To avoid such effects, it is possible to output the generator signal via rearpanel jacks of type PC3.5 (R&S ZVM) or 2.92 mm (R&S ZVK)independently of PORT 1 and PORT 2. This modification is available onrequest as option R&S ZVM-B10 or R&S ZVK-B10.
Figure 8:Modified test set of the R&S ZVM/ZVK for decoupling the generator signalfrom all output and receiver paths. The generator signal is output via rearpanel jacks on the R&S ZVM/ZVK (modification is marked in blue).
ReferenceChannel a2
MeasurementChannel b2
PORT 2
ZVM(K)-B24
a2
b2
Generator
ZVM(K)-B23
DC Bias
ZVM(K)-B22
ZVM(K)-B21
PORT 1
ReferenceChannel a1
MeasurementChannel b1
Input b2receiver channel 1
receiver channel 2
receiver channel 3
receiver channel 4
2nd input forreceiver cahnnel 1
Input b1
2nd input forreceiver channel 4
Generator out 2
ZVM/K-B10
Generator out 1a1
b1DC Bias

Antenna and pulsed signal measurements with theR&S ZVM/R&S ZVK
1EZ52_OE 10 Rohde & Schwarz
The sensitivity improvement provided by this R&S ZVM(ZVK)-B10 option ispresented in the following. Settings:
§ Output of –10 dBm at test PORT 1
§ Generation of "worst case condition" by total reflection at PORT 1(caused by connecting a SHORT)
§ Measurement via the direct receiver input b1
The following typical traces compare the sensitivity decreased by crosstalkwith the sensitivity when using the R&S ZVM(ZVK)-B10:
Figure 9:Typical sensitivity of the R&S ZVK (up to 40 GHz, left) and the R&S ZVM(up to 20 GHz, right) at 10 kHz (top) and at 10 Hz (bottom) IF bandwidthusing input b1:Violet traces:Total reflection of the output signal at PORT 1. Reduced sensitivity due tocrosstalk in the R&S ZVM(ZVK)-B23 switch.Dark blue/light blue traces:Increased sensitivity by guiding the signal out via the "Generator Out 1"jack on the rear panel.
18 GHz
20 dB/
-140 dBm
20 dBm
18 GHz
20 dB/
-140 dBm
20 dBmMAGdB
MAGdBCH1 ↓-140 dBm ↑20 dBm
START 10 MHz STOP 20 GHz2 GHz/
b1&M
CH2 ↓-140 dBm ↑20 dBm
START 10 MHz STOP 20 GHz2 GHz/
FIL1010FIL1010
EXT
Sensitivity ZVM (Input b1, ZVK-B10), IFBW = 10 kHz / 10 Hz
b1&M
18 GHzD1 0 dBm
D1 0 dBm
Date: 19.JAN.04 18:10:01
5 GHz 35 GHz
20 dB/
-140 dBm
20 dBm
5 GHz 35 GHz
20 dB/
-140 dBm
20 dBmMAGdB
MAGdBCH1 ↓-140 dBm ↑20 dBm
START 10 MHz STOP 40 GHz5 GHz/CH2 ↓-140 dBm ↑20 dBm
START 10 MHz STOP 40 GHz5 GHz/
EXT
FIL10k10kFIL10k10k
b1&M
Sensitivity ZVK (Input b1, ZVK-B10), IFBW = 10 kHz / 10 Hzb1&M
D1 0 dBm
D1 0 dBm
Date: 19.JAN.04 18:08:50

Antenna and pulsed signal measurements with theR&S ZVM/R&S ZVK
1EZ52_OE 11 Rohde & Schwarz
2.3 Measurement SpeedDue to the data volumes involved in measurements – primarily at a highangular resolution – a high measurement speed is usually required. Anindication of the total time of a frequency sweep is the measurement timeper point, which is specified for the R&S ZVM and R&S ZVK as follows:
Measurement time per frequency point- 10 kHz IF bandwidth- Averaging over at least 400 points
R&S ZVM10 MHz to 20 GHz
R&S ZVK10 MHz to 40 GHz
With system error correction <0.9 ms <1.1 msWith normalization or measurement of wave quantities <0.5 ms <0.7 ms
Table 1:Specified measurement time per point. The data represent themeasurement time per point, calculated as an average value of 400 datapoints distributed over the entire frequency range. Therefore they prescribean upper limit ("worst case").
Besides the number of points, the IF bandwidth and the type of systemerror correction, there are other network analyzer parameters thatdetermine the total time of a sweep. These parameters include theswitching of internal paths and the changing of the LO position at certainfrequency points or frequency-dependent settling times. The sweep timetherefore depends on the frequency and the frequency span. Furthermore,the execution time depends on the sweep mode of the entire system. In thecase of frequency-converting measurements, the R&S ZVx controls up totwo external generators. If the generators are operated in swept mode, theIEC/IEEE bus transfer time increases the sweep speed.Consequently, the total sweep time can only be reliably determined with thespecific measurement settings. The following table gives examples ofdifferent settings. In this case, the typical measurement time per frequencypoint (until data are displayed) is about 0.3 ms for a standard sweep, whichis considerably shorter than the conservative specification for the upperlimit. If the sweep range is decreased, another decrease of themeasurement time can be expected, depending on the position of thesweep range.
R&S ZVM R&S ZVKSweep timesin different operating modes10 kHz IF bandwidth, 401 frequency points(Both, times for the bi-directional and the uni-directional sweep mode are presented)
10 MHz to 20 GHz 10 MHz to 40 GHz
Linear sweep 140 ms / 210 ms 130 ms / 260 ms
Control of an external mixer(2)
(fixed LO signal, no impact on measurement time) 140 ms / 210 ms 130 ms / 260 ms
Control of an external mixer(2)
(conversion to fixed IF with swept external generator) 760 ms 760 ms
Table 2:Examples of sweep times: the times apply to a sweep over the entirefrequency range of the instrument including display of the values.
2 Requires the optional Mixer Measurements R&S ZVR-B4

Antenna and pulsed signal measurements with theR&S ZVM/R&S ZVK
1EZ52_OE 12 Rohde & Schwarz
2.4 Frequency-Converting ModeIn antenna measurement systems, mixers can be used to expand thefrequency range or to convert signals from the high microwave range to theMHz range in order to prevent losses and disturbing effects whentransporting high-frequency signals over long distances.
Systems of this kind can be quickly and flexibly configured with the mixermeasurement option (R&S ZVR-B4). Basically, this option is designed tooperate the R&S ZVM/ZVK internal receivers, the internal generator and upto two external generators in swept or fixed mode in arbitrary frequencyranges, to enable almost unlimited measurements with any kind offrequency converting devices. Examples are the conversion loss, theamplitude of intermodulation products or harmonics of mixers, amplifiers orfrontends. For antenna measurements, the option makes it possible toconfigure up to three sources and capture data from all four receivers of theR&S ZVx, merely by means of entries in the ARBITRARY SYSTEMFREQUENCIES definition table. The external sources are automaticallycontrolled by the R&S ZVx. A sample test set and the configuration of thedefinition table are shown in Figure 11.
This function is based on the hardware concept of all R&S ZVx instrumentsbeing equipped with separate internal generators for generating the outputsignal and supplying the internal mixer stages in the receiver section. Thisis why the frequency ranges of output signals and receivers can be setcompletely independently of each other. The generators are synchronizedvia a common frequency reference, provided from the network analyzer, orone of the external sources. Using the R&S ZVR-B4 software option, theinternal generator of the R&S ZVx and up to two external generators canbe operated in independent frequency ranges and at different levels inswept mode or at a fixed frequency. The frequency range for the receiverscan be defined independently of the generators. This frequency range canalso be swept or set at a fixed frequency, but it is identical for all fourreceivers.
For a detailed description of the frequency-converting mode, refer to theR&S ZVx manual, application notes ([2], [3]), and the "Getting Started II"instructions and presentations ([6]).
Figure 10:Menu of R&S ZVR-B4 option for selectingexternal generators (SRC1 and SRC2) tobe controlled automatically by the networkanalyzer.
■ EXT SOURCES CONFIGSRC TYPE CONNECTION GPIB ADDR STATE1 SMR40B11 GPIB 19 LOCAL2 <NONE>
■ EXT SRC TYPESMR20SMR20B11SMR27SMR27B11SMR30SMR30B11SMR40SMR40B11SMR50SMR50B11

Antenna and pulsed signal measurements with theR&S ZVM/R&S ZVK
1EZ52_OE 13 Rohde & Schwarz
Figure 11:Exemplary test set for a transmission measurement with downward mixingand the associated configuration table of the frequency-converting mode:the external source R&S SMR40 (EXT SRC1) is controlled by theR&S ZVK to output a swept RF signal of 20 GHz to 40 GHz . The internalsource of the R&S ZVK (INT SRC, output to PORT 1) supplies the mixerwith a LO signal offset by 8 MHz. The IF fed via Input b2 to the R&S ZVxreceiver (RECEIVER), which was set to a fixed frequency of 8 MHz.
Owing to the frequency selectivity of the R&S ZVM and R&S ZVK,additional components like external filters for sideband suppression areusually not required for such measurements. Furthermore, the receivers ofthe R&S ZVx operate regardless of the amplitude of the input signal: thereceiver settles stably onto the required frequency during the sweep even ifthere is strong signal suppression or pure noise. This allows a propersweep over the full range, even if there is strong signal suppression insome sub-ranges, typically with frontends as DUT.
All Rohde & Schwarz generators as well as some other generators aresupported for automatic control by way of the IEC/IEEE bus. The driverfiles with the control commands are accessible in ASCII format in theC:\USER\DATA directory on the hard disk; they can therefore be easilymodified and new files for other generators can be created. After theR&S ZVx is restarted, the new driver files are included in the selectionmenu of the R&S ZVR-B4 option (see Figure 10).If the generators are controlled via the IEC/IEEE bus, each frequency valueduring a sweep is individually transferred. With R&S SMR family ofgenerators, the sweep time can be considerably reduced by using theGPIB+TTL mode, in which case the required frequency list is loaded intothe generator at the start of the sweep. The frequency points areincremented with TTL signals during the sweep. The optional control cable(R&S SMR-Z3) required for this can be ordered.
■ ARBITRARY SYSTEM FREQUENCIESBASE FREQUENCY: 20GHz ...40GHz
ON POWER (NUM / DEN) xB + OFFSET RESULTINT SRC / 0 dBm (1 / 1) xB -8MHz 19.992GHz..39.992GHzEXT SRC1 / 10 dBm (1 / 1) xB 20GHz..40GHzEXT SRC2RECEIVER / 8MHz 8MHz
STIMULUS AXIS: BASE FREQUENCY 20GHz..40GHz
Source (R&S SMR40) Tx Modul
Rx Modul
RF(20-40 GHz)
LO(19.992-39.992 GHz)
IFtest(8 MHz)
IEC-Bus
Frq-ref

Antenna and pulsed signal measurements with theR&S ZVM/R&S ZVK
1EZ52_OE 14 Rohde & Schwarz
2.5 Power Dynamic Range, Power CalibrationIt is typical of antenna measurement systems that signals often have to betransported over long distances. For example, although the signalgenerator in the system described in Figure 11 supplies the test signaldirectly to the transmission antenna, the LO signal may have to travelseveral meters. The cable attenuation and frequency response ofpreamplifiers must be taken into account to compensate for losses and toreach a sufficiently flat LO level, which is usually high.In the case of broadband measurements with mixing to a constant low IF,the LO signal covers a sufficiently wide frequency range and aconsiderable frequency response occurs. For an estimate, the followingassumptions are made: a cable length of 10 m with an attenuation ofapproximately 0 dB in the MHz range and of 1 dB per meter at 20 GHz, anda frequency response of ±2 dB per preamplifier, if two amplifiers are used.These assumptions yield a maximum frequency response of 24 dBbetween the lowest and the highest frequency. To nevertheless ensure aflat curve of the LO signal to the mixer, a level correction value for eachfrequency value can be introduced by means of one of the powercalibration methods described in the following:
Power calibration and response correctionThe power calibration option (R&S ZVR-B7) controls an external powermeter via IEC/IEEE bus. The power meter sensor is connected to therequired reference plane in the test set. The power of the output signal a1or a2 is measured at each frequency point by the power meter during acorrection sweep and compared with the desired power. The differencebetween the current and the desired power in the reference plane iseliminated by varying the power from the internal generator of the R&SZVx. To prevent nonlinearities of the generator, this procedure can berepeated as often as necessary at each frequency point. As a result, a levelcorrection list is created, which eliminates the power uncertainty of theinternal generator and, above all, the frequency response of the test set.This list is stored in the R&S ZVx.
The attainable accuracy is mainly determined by the accuracy of the sensorand stability of the test setup and may achieve therefore the range ofseveral tenths of a dB. In addition, this option also allows the levels of theexternal signal generators in the required reference plane to be corrected.
If the level correction is made after a pre-amplifier in the test set, the levelmay be too high for the sensor. In this case, an attenuator whose valuesare precisely known and taken into account in the calibration can beinserted during the calibration. The attenuator is removed on completion ofthe calibration procedure, whereby the required level in the reference planeis exactly applied.
Besides calibrating the generator signals, this option can also be used tocalibrate the reference and measurement channels. Details are describedin the R&S ZVx manual or the application note [4].

Antenna and pulsed signal measurements with theR&S ZVM/R&S ZVK
1EZ52_OE 15 Rohde & Schwarz
Power Dynamic RangeA correction of the frequency response requires a sufficient dynamic rangeof the internal or external generator power. The specified values for thedynamic range of the R&S ZVM and R&S ZVK vary from 15 dB to 25 dBdepending on the instrument (see data sheet [1]). However, the R&S ZVMand R&S ZVK allow the value of the output level to be set several dB abovethe specified value up to the unspecified frequency-specific maximum valueof the generator.
In addition, the hard limitation of the lower level limit of –20 dBm iseliminated after the power calibration.
These two extensions ensure that in practice a typical dynamic range of 30dB to ~40 dB (depending on the frequency) is available for correcting thefrequency response or for a level sweep.
10 dBm
10 dB/
-50 dBm
20 dBm 10 dBm
10 dB/
-50 dBm
20 dBm 10 dBm
10 dB/
-50 dBm
20 dBm 10 dBm
10 dB/
-50 dBm
20 dBm
↓-50 dBm↓-50 dBm
↑20 dBm↑20 dBm
START -40 dBmSTART -40 dBm
STOP 15 dBmSTOP 15 dBm
5 dB/5 dB/
MAGMAG
dBdB
CW1 1 GHzCW2 10 GHz
CH1CH2 ↓-50 dBm
↓-50 dBm↑20 dBm↑20 dBm
START -40 dBmSTART -40 dBm
STOP 15 dBmSTOP 15 dBm
5 dB/5 dB/
CW2 10 GHzCW3 20 GHz
b2b2
MAGMAG
dBdB
CH2CH3 ↓-50 dBm
↓-50 dBm↑20 dBm↑20 dBm
START -40 dBmSTART -40 dBm
STOP 15 dBmSTOP 15 dBm
5 dB/5 dB/
CW3 20 GHzCW4 30 GHz
b2b2
MAGMAG
dBdB
CH3CH4 ↓-50 dBm ↑20 dBm
START -40 dBm STOP 15 dBm5 dB/
CW4 30 GHz
b2 MAGdBCH4
FIL10k10kFIL10k10k
PCOa1a1PCOa1a1PCOa1a1PCOa1a1PCOa1a1
b2
1
2
2: 38.50 dB
40.425 dB1: -29.53 dBm
-30.1 dBm
1
2
2: 37.90 dB
1
2
2: 33.21 dB
1
2
2: 37.25 dB
Figure 12:Unspecified maximum power dynamic range after user power calibration withoption R&S ZVR-B7 of the R&S ZVM (up to 20 GHz) and the R&S ZVK at: 1 GHz (dark blue)10 GHz (light blue)20 GHz (green)40 GHz (yellow)Depending on the frequency, the dynamic range varies from approx. 30 dB toalmost 40 dB.

Antenna and pulsed signal measurements with theR&S ZVM/R&S ZVK
1EZ52_OE 16 Rohde & Schwarz
2.6 Trigger Functions and Sweep ModesAntenna measurements with spatial resolution usually require the sweep tobe synchronized with the positioning system. The R&S ZVx providesvarious trigger settings for this purpose, such as external triggering on therising or falling edge, choice of selecting triggering of a single test point oran entire sweep per trigger, or a trigger delay that can be varied from 1 µsto 255 s with a resolution of 0.5 µs.A practical function is switching the sweep direction, enabling the R&S ZVxto sweep continuously also from the highest to the lowest frequency. Thispermits measurement sequences in which a sweep is triggered andperformed with increasing frequency and then, after switching the sweepdirection, the next sweep is performed with decreasing frequency.
This operating mode enables the frequency points to be recorded alwayswith the desired sequence during moving the positioning system in forwardand reverse direction. This avoids driving the positioning system back tozero position for the next angle sweep and thus greatly cuts downmeasurement time.
2.7 R&S ZVx Interfaces and Control of SystemComponentsVector Network Analyzers R&S ZVx are equipped with several rear panelinterfaces: the serial, parallel, IEC/IEEE bus and LAN interfaces can beused by programs that run on the internal PC of the R&S ZVx to controlother system components or exchange data. Users have full access for thisand all user rights for the Windows NT operating system of the R&S ZVx.Besides these standard interfaces, the USER PORTS digital TTL interfaceis used to query status messages or output control signals. This interface isset or queried either manually or by using an IEC/IEEE bus command.Especially with antenna measurements, this is a simple way to operateexternal switches or to switch between different signal paths in antennas –for example, to change between the horizontally and vertically polarizedradiation characteristics of an antenna.

Antenna and pulsed signal measurements with theR&S ZVM/R&S ZVK
1EZ52_OE 17 Rohde & Schwarz
3 Measurements on Pulsed Signals withR&S ZVM / R&S ZVK as Stand-Alone Units
Since vector network analyzers output only CW signals, a pulsed signal isgenerated by switching the DUT on and off at clocked intervals, or byexternally chopping up the CW signal from the network analyzer or directlyby a suitable signal generator. In the tests described here, a MicrowaveSignal Generator R&S SMR40 with pulse option was used.
Without being integrated in a system, the R&S ZVM/ZVK enables thefollowing measurements on pulsed signals:§ Synchronized measurements of complex S-parameters if the pulses
are "long" and in a settled state compared with the measurement timeper point of the NWA (full pulse, pulse-to-pulse).
§ Measurements of the average amplitude of a pulse stream, average ofcomplex S-parameters as well as phase and group-delaymeasurements in the high PRF range of "short" pulses (Measurementtime per point of NWA “long” in comparison to the pulse length).
Measurements of the pulse profile or derived quantities as contourmeasurements are possible when the instruments are integrated in asystem (see chapter 4).
3.1 Synchronous Pulse Measurements(“Long Pulses”)This measurement method can be used if the pulse in comparison with thesettling and measurement times per point of the NWA is long enough torecord at least one test point during the pulse width. The beginning of themeasurement is synchronized with the pulse signal by a trigger.
At least two sweep modes are possible:
l Operation with a sweep trigger, i.e. a full sweep is performed after atrigger. The setting is made with:SWEEP : DEF TRIGGER : TRIGGER SWEEP POINT.If the pulse width is long enough relative to the measurement time perpoint or a multiple thereof, a pulse profile over time can be recorded.For this purpose, the carrier frequency is selected as the CENTERfrequency and a very narrow span is set with SPAN (the R&S ZVxaccepts a minimum of 100 mHz). The frequency thus remains virtuallyconstant during the sweep, and the x axis can be considered the timeaxis.
l Operation with a point trigger, i.e. switching to the next frequency pointwith each pulse or trigger (pulse-to-pulse measurement). The setting ismade with:SWEEP : DEF TRIGGER : TRIGGER SWEEP POINT.In this case, each frequency point is recorded at a different pulse. Witha finite frequency span, it is possible to measure, for example, thetransmission characteristic of an amplifier in pulsed operation. The timeat which the measurement is to be made during the pulse on state canbe set by means of a trigger delay. For details on such measurementson GSM amplifiers, refer to [5].

Antenna and pulsed signal measurements with theR&S ZVM/R&S ZVK
1EZ52_OE 18 Rohde & Schwarz
Assuming the R&S ZVx is settled in a steady state with each pulse, in thismode the instrument measures using the full dynamic range correspondingto the IF bandwidth. The shortest practical pulse width for this mode isestimated in the following:
The measurement time per point depends mainly on the IF bandwidth. Thiscan be selected in the range from 1 Hz to 10 kHz and at 26.5 kHz (FULL).Thus the shortest measurement time is to attained with the settingAVG : IF BANDWIDTH : FULL.
The measurement time is also influenced by the settling of thepreamplifiers inside the NWA: At each frequency point, the gain is adaptedto the currently applied level, to use the full resolution of the A/D converter,thus attaining maximum sensitivity at each test point. This mode, however,reduces the measurement speed, may yield an incorrect gain with pulsesignals, and produces a delay between the trigger and start of recordingthe current test point. The delay cannot be exactly predicted.It can therefore be helpful to activate the FAST mode (MODE : FASTMODE). This mode deactivates the preamplifiers and sets the fullbandwidth of 26 kHz (subsequently the IF bandwidth can be changed againif necessary via AVG : IF BANDWIDTH, the preamplifiers remaindeactivated). This mode is indicated by the label FST at the right-handedge of the screen. However, the instrument operates at the limits of therequired settling times, which is why increased trace noise can be expectedin fast mode. Trace noise can be considerably reduced by averaging.
To accurately determine the measurement time, the operating principle ofthe instrument must be considered: during the measurement time of afrequency point, the R&S ZVx records a certain number of samples on the
input signal (converted to IF) at the rate of the A/D converter of sµ12.5
1 i.e.
at approx. 200 kHz. The samples are transferred to a digital signalprocessor to calculate the IF filtering and – using the samples from asecond channel used as a reference – to calculate a complex pointer. Theexact sampling time is determined by multiplying the number of samplesrequired for the IF filter by 5.12 µs. Table 3 lists the number of samples andthe sampling time required for a few large bandwidths.
IF bandwidth Number of samplesper test point
Sampling time(fast mode)
Sampling time(minimum, std. mode)
26.5 kHz (full) 8 35.84 µs ~ 80 µs10 kHz 26 128.00 µs ~ 160 µs3 kHz 84 424.96 µs ~ 460 µs
Table 3:Number of samples and sampling time for large IF bandwidths. In the “FastMode”, accurate values can be stated. Due to the varying settling time ofthe pre-amplifiers in the standard mode, values are stated as“approximately”.
Due to the 35 kHz band limitation of the analog path of the R&S ZVx(essentially the aliasing filter), a suitable settling time of approx. 30 µs mustbe taken into account. The shortest pulse whose amplitude can bemeasured with at least one point in the settled state of the networkanalyzer is therefore approx. 65 µs long (approx. 110 µs length in standardmode).
Antenna and pulsed signal measurements with theR&S ZVM/R&S ZVK
1EZ52_OE 19 Rohde & Schwarz
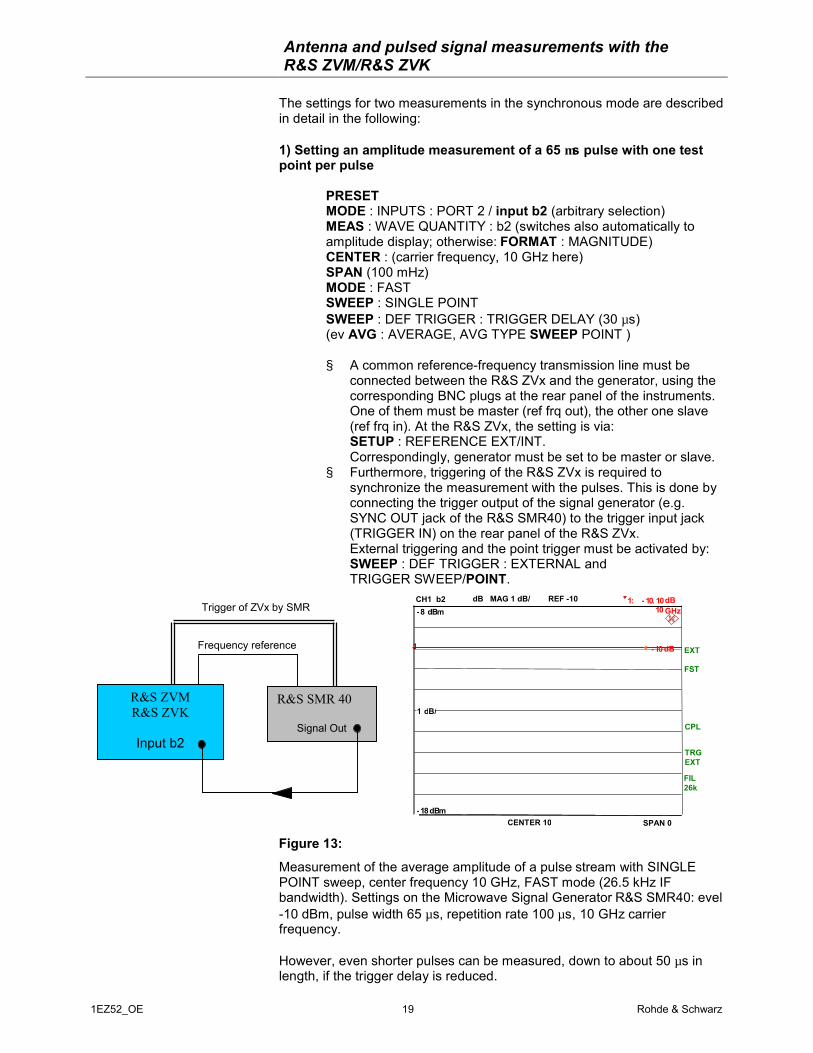
The settings for two measurements in the synchronous mode are describedin detail in the following:
1) Setting an amplitude measurement of a 65 µs pulse with one testpoint per pulse
PRESETMODE : INPUTS : PORT 2 / input b2 (arbitrary selection)MEAS : WAVE QUANTITY : b2 (switches also automatically toamplitude display; otherwise: FORMAT : MAGNITUDE)CENTER : (carrier frequency, 10 GHz here)SPAN (100 mHz)MODE : FASTSWEEP : SINGLE POINTSWEEP : DEF TRIGGER : TRIGGER DELAY (30 µs)(ev AVG : AVERAGE, AVG TYPE SWEEP POINT )
§ A common reference-frequency transmission line must beconnected between the R&S ZVx and the generator, using thecorresponding BNC plugs at the rear panel of the instruments.One of them must be master (ref frq out), the other one slave(ref frq in). At the R&S ZVx, the setting is via:SETUP : REFERENCE EXT/INT.Correspondingly, generator must be set to be master or slave.
§ Furthermore, triggering of the R&S ZVx is required tosynchronize the measurement with the pulses. This is done byconnecting the trigger output of the signal generator (e.g.SYNC OUT jack of the R&S SMR40) to the trigger input jack(TRIGGER IN) on the rear panel of the R&S ZVx.External triggering and the point trigger must be activated by:SWEEP : DEF TRIGGER : EXTERNAL andTRIGGER SWEEP/POINT.
Figure 13:Measurement of the average amplitude of a pulse stream with SINGLEPOINT sweep, center frequency 10 GHz, FAST mode (26.5 kHz IFbandwidth). Settings on the Microwave Signal Generator R&S SMR40: evel-10 dBm, pulse width 65 µs, repetition rate 100 µs, 10 GHz carrierfrequency.
However, even shorter pulses can be measured, down to about 50 µs inlength, if the trigger delay is reduced.
R&S ZVMR&S ZVK
Input b2
R&S SMR 40
Signal Out
Frequency reference
Trigger of ZVx by SMR
1 dB/
-18
-8 dBmdB MAG 1 dB/ REF -10dBm
CH1 b2
CENTER 10GHz
SPAN 0Hz
CPL
EXT
FST
1
1: - 10. 10dBm10 GHz
-10 dBm
TRGEXT
FIL26k
dBm

Antenna and pulsed signal measurements with theR&S ZVM/R&S ZVK
1EZ52_OE 20 Rohde & Schwarz
2) Setting a pulse pattern measurement for "long" pulses
If the pulse width is a multiple of the measurement time, an increasednumber of test points allows the pulse pattern to be displayed. As anexample, a pulse signal with 10 ms pulse period and 5 ms pulse width wasrecorded with the following settings:
PRESET (hint: after PRESET, 10 kHz IF BW and standardoperating mode are default)MODE : INPUTS : PORT 1 / input b1 (arbitrary selection)MEAS : WAVE QUANTITY : b1CENTER : (carrier frequency, 1 GHz here)SPAN (100 mHz)SWEEP : LIN SWEEPSWEEP : NUMBER OF POINTS : 101To display the rising pulse edge clearly, a trigger delay isintroduced:SWEEP : DEF TRIGGER : TRIGGER DELAY (8 ms)
Figure 14:Pulse profile over time (quasi zero span applied). Linear sweep with 101test points. Center frequency 10 GHz, span 100 mHz, IF bandwidth at10 kHz. Settings on the Signal Generator R&S SMR40: level -5.9 dBm,pulse width 5 ms, pulse period 10 ms, 1 GHz carrier frequency.
Estimation:With these settings, the scaling of the above figure corresponds to160 µs/point * 101 points / 10 grid lines = 1.6 ms/grid line. Due to thescreen dump above, the pulse period lasts about 7 grid lines,corresponding to ~ 11 ms, in quite good accordance with the pulse period.
After pressing the SWEEP key, information on the measurement time andthus the x-axis time range is indicated. However, this value refers to theentire data flow up to the display, which is why the pure measurement timeis somewhat shorter.
15 dB/
- 120 dBm
30 dBmMAGdBCH1 b1 15 dB / REF 0 dBm
CENTER 1 GHz SPAN 100 mHz
EXT1
1: - 5. 047 dBm
1 GHz
0 dBm
TRGEXT
FIL10k
10 mHz/

Antenna and pulsed signal measurements with theR&S ZVM/R&S ZVK
1EZ52_OE 21 Rohde & Schwarz
10 dB/
-90 dBm
10 dBmCH1 b1 dB MAG ↓ -90 dBm ↑-10 dBm
200 kHz/ CENTER 1 GHz SPAN 2 MHz
PRT= 100 µs, PW=10 µs
12
3
1:
2:
3:
10 dB/
-90 dBm
10 dBm
1 2 3
1:
2:
-25.33 dBm 1 GHz -0.150 dB 10 kHz -0.587 dB 20 kHz
3:
CH1 b1 dB MAG ↓ -90 dBm ↑-10 dBmPRT= 100 µs, PW=10 µs
10 kHz/ CENTER 1 GHz SPAN 100 kHz
EXT
FST
FIL10
EXT
FST
FIL30
-25.33 dBm 1 GHz -0.138 dB 10 kHz -57.98 dB 100 kHz
3.2 Measurements on "Short" Pulses3.2.1 High Pulse Repetition Frequency (PRF) Range
This method (high PRF) is used when the pulse time is shorter than theminimum measurement time per point. In this case, the measurement timeper point can be set considerably longer than the pulse width or the pulserepetition rate, allowing a series of pulses per frequency point to besampled. Unlike CW signals, ideal pulses exhibit a theoretically unlimitedfrequency spectrum whose spectral line offset ∆f equals to the reciprocal ofthe pulse repetition time (∆f = 1/prt), and whose first null offset ∆F from thecarrier is equal to the reciprocal of the pulse width (∆F = 1/pw). If a pulsesignal is applied with a constant carrier frequency and if the centerfrequency and frequency span are appropriately set on the networkanalyzer, the amplitudes of the carrier and the spectral lines can bemeasured.
The amplitude of the carrier is of primary interest here. Since the pulsepower is spread across the entire spectrum, the carrier's amplitude isproportional to pulse amplitude (pulse desensitization). If the pulses areideally square, the measured carrier amplitude yields the pulse amplitudeafter a correction by:
∗
prtpwlog20 ; (pw = pulse width, prt = pulse repetition time)
Figure 15:
Frequency spectrum of a pulse signal with a period of 100 µs and a pulsewidth of 10 µs, carrier frequency 1 GHz.Left/right screen dump: identical measurement, but different frequencyspan. The corresponding harmonic offset of 10 kHz and the first null at100 kHz are indicated by markers (measurements using the R&S SMR40as the pulse source and the R&S ZVM with f[center] = 1 GHz and f[span] =2 MHz and 100 kHz). The level is set to –5 dBm so that –25 dBm ismeasured on the carrier signal due to desensitization (some cableattenuation of ~0.3 dB contributes).This means that, conversely, the average amplitude of an ideal pulse signalcan be determined with high accuracy by means of the carrier amplitude,applying the desensitization formula and correction of test set response.

Antenna and pulsed signal measurements with theR&S ZVM/R&S ZVK
1EZ52_OE 22 Rohde & Schwarz
3.2.2 Spectral Nulling
Ideal narrowband recording of a single tone at each frequency point of asweep or especially the carrier would require an IF filter with extremelysteep edges, in order to sufficiently suppress adjacent sidebands when thepulse repetition rate is high. In addition disadvantages such as ringing inthe time domain occur with narrowband or squarewave filters. To avoidsuch problems, another method can be used: with a suitable choice ofpulse repetition rate and IF filter of the NWA, the positions of the spurioussignals coincide with the nulls of the IF filter function. For example, theoffset of the first null of the 26.5 kHz IF filter is at 24.45 kHz. If a pulseperiod of 1/24.45 kHz (= 40.9 µs) is selected, the first order spectral linescoincide exactly with the nulls of the filter function.
IFBandwidth
Offset of the firstnull
Pulse period(1st null)
26.5 kHz 24.45 kHz 40.900 µs10 kHz 15.8 kHz 65.876 µs3 kHz 4.575 kHz 218.58 µs1 kHz 1.0875 kHz 919.64 µs
300 Hz 386 Hz 2.5907 ms100 Hz 122.25 Hz 8.1800 ms30 Hz 36.75 Hz 11.527 ms10 Hz 11.85 Hz 84.390 ms3 Hz 3.675 Hz 272.11 ms1 Hz 1.2 Hz 833.33 ms
Table 4:IF bandwidths of the R&S ZVM/R&S ZVK and corresponding frequencyoffsets of the first null of the associated filter function. The pulse periodswhose spurious signals coincide with the nulls of the filter function are listedfor each IF bandwidth.
Figure 16:
Spectral lines of a signal with a 218.58 µs pulse period (dark blue),compared with the filter characteristic of the 3 kHz IF filter (light blue). Withthese settings, the first-order harmonics coincide with the first nulls of thefilter.
2 kHz/ CENTER 1 GHz SPAN 20 kHz2 kHz/ CENTER 1 GHz SPAN 20 kHz
EXT
FST
FIL100
10 dB/
-90 dBm
10 dB/
-80 dBm
20 dBm
CH1 b1 dB MAG ↓-90 dBm ↑10 dBmCH2 b2 dB MAG ↓-80 dBm ↑20 dBm
1 23
1: - 22.58 dBm
1 GHz2: - 0.343 dB 4.575 kHz3: - 0.277 dB - 4.575 kHz

Antenna and pulsed signal measurements with theR&S ZVM/R&S ZVK
1EZ52_OE 23 Rohde & Schwarz
If the pulse periods are shorter, the first spectral line coincides with amultiple of the first null. The positions of higher-order nulls of an IF filter canbe easily measured by using Option Mixer Measurements R&S ZVR-B4 toset the generator of the R&S ZVx to a fixed frequency (or by manuallysetting an external generator), and sweeping only the R&S ZVx receiveraround the carrier position. The resulting trace shows the shape of thecurrent NWA IF filter, as shown in Figure 16.
3.3.3 Dynamic Range, Minimum Possible Pulse Width
Low pulse repetition rates compared with the IF bandwidth or measurementtime require an estimation, if a sufficient high number of pulses per testpoint is recorded. The number of recorded pulses depends on the time perA/D sampling, the number of samples taken at each frequency point(depends on the IF bandwidth) and the pulse repetition rate. For example,with the constant sample time of 5.12 µs of the R&S ZVM/R&S ZVK,assuming a pulse repetition rate of 10 µs and an IF bandwidth of 3 kHz(requires 84 samples per frequency point), yield a measurement time perpoint of 84 * 5.12 µs = 0.43 ms, i.e. 43 pulses per point are recorded.
With very short pulses, the R&S ZVM/R&S ZVK allows for measuring apulse stream with pulse widths down to well under 0.1 µs (if the duty cycleis sufficiently high). For example, the carrier amplitude of a spectrumexhibiting a 0.1 µs pulse width and 10 µs repetition rate can be determinedwith a low level error, stemming from the unsettled state of the NWAsanalog path. Level deviations are eliminated by calibrating the entiresystem.
The aforementioned fact of the naturally occurring dynamic loss equal to20*log(duty cycle) with narrowband reception of the carrier signal mayresult in limitations or an increase of the measurement error in the case ofsmall signals. Owing to the dynamic range of the R&S ZVM and R&S ZVK,however, small signals with a large duty cycle can also be measured. Theunspecified maximum dynamic range of the R&S ZVM (to 16 GHz) ofapprox. 140 dB is assumed as the absolute limit (use of the additionaloptional input b2, the maximum output level and 1 Hz IF bandwidth). If asignal-to-noise ratio of 20 dB is accepted, the remaining 120 dB dynamicrange allows measurements on signals with duty cycles as low as 0.001%.
By employing this method – i.e. setting the center frequency to the carrierfrequency and a quasi-zero span (minimally 100 mHz) or a finite span – theR&S ZVx can be used to measure the average amplitude of pulses down towell below 0.1 µs.

Antenna and pulsed signal measurements with theR&S ZVM/R&S ZVK
1EZ52_OE 24 Rohde & Schwarz
3.4 Pulsed S-Parameter and Group-Delay
The previous sections 3.1 and 3.2 of this chapter described twomeasurement principles:§ In the case of pulses having a width of 55 µs to 65 µs or more, and with
the pulse and measurement sweep synchronized, theR&S ZVM/R&S ZVK can be used to display the amplitude of the pulsein a settled state with at least one point.
§ In the high pulse-repetition-frequency (PRF) range, the networkanalyzer performs unsychronized sampling of a series of pulses duringthe measurement time of a frequency point – with the number of pulsesdetermined by the PRF and the IF bandwidth setting. This coversamplitude and phase measurements on an extremely wide range ofpulsed signals: from pulse widths in the ms range (provided the IF issmall enough) down to pulses under 0.1 µs. The main information issupplied by measuring the carrier signal, whose amplitude – correctedby the pulse desensitization – represents the average amplitude of thepulse stream. Similar to a spectrum analyzer, the harmonics of thepulse signal are also measured if the frequency span is suitable.General pulse profile measurements, however, can only be performedby "gating" the pulses, which is made possible by March MicroWavesystems (see chapter 4).
If the pulsed signal from the generator is split up and one path is routed toa receiver channel of the R&S ZVM/R&S ZVM (Figure 17), it can be usedas a reference for complex S-parameter measurements and, consequently,for phase and group-delay measurements.
3.4.1 CalibrationDifferent test sets are used for antenna measurements, which is why nogeneral calibration instructions can be given. In addition, full two-portcalibration is usually not possible, since in many cases the signal comesfrom an external generator and the R&S ZVM/R&S ZVK is just used as amultichannel receiver. The following calibration methods are possible:§ Calibration of the complete antenna measurement system. This is
typically done by performing calibration measurements on a metalsphere or metal plate in the antenna chamber (see chapter 4).
§ Power calibration (option R&S ZVR-B7, see application note [4]) andnormalization by means of trace mathematics, if measurements withan external pulse source are performed with the R&S ZVM/R&S ZVKas a stand-alone unit.
Normalization is used in the following descriptions for pulsed S-parametermeasurements with the R&S ZVM/R&S ZVK.

Antenna and pulsed signal measurements with theR&S ZVM/R&S ZVK
1EZ52_OE 25 Rohde & Schwarz
3.4.2 S-Parameter Measurements on Carrier andHarmonics
An R&S SMR40 with pulse option is used as the source. Input b1 is usedas the receiver channel for the reference signal and input b2 as thereceiver channel for the test signal.
A pulsed signal with a constant carrier frequency is applied by theR&S SMR40 in this case. The frequency spectrum with which the S-parameters are determined is therefore defined by the harmonics(measurements using a swept carrier are described in the next section).
Figure 17:Test set for S-parameter measurements on pulsed signals.
One of the two units must provide the 10 MHz reference frequency.If it is provided by the R&S SMR, the following setting must be made on theR&S ZVM/R&S ZVK: SETUP : REFERENCE EXTThe required rear-panel jacks on the units must be connected with eachother.
Settings on the R&S SMR (incl. option R&S SMR-B14) for a pulsesignal:
PRESETFREQ 1 GHzLEVEL 0 dBm
Modulation : Pulse : Pulse Mode Source : Pulse GenPulse period: 5 µsPulse width: 0.5 µsPulse delay: 0 µs
R&S ZVM/ZVK
Input b1: used as reference
Input b2: used for the test signal
Coupler forreference signal
DUT(here exemplary: delay line)
10 MHz reffrequency
R&S SMR40
IEC/IEEE bus control

Antenna and pulsed signal measurements with theR&S ZVM/R&S ZVK
1EZ52_OE 26 Rohde & Schwarz
Finally, the following exemplary measurements can be performed onthe R&S ZVM/R&S ZVK:(Figures show traces without a DUT, i.e. on the unimpaired pulse signal.Complex measurements in Display 3 and Display 4, traces normalized.Subsequently a transmission line with a 50 ns delay and 7.5 dB attenuation@ 1 GHz is connected as DUT, the result is depicted in Figure 20 .)
:
Figure 18:Measurement window: amplitude, S-parameter and group delay withpulsed signal (normalized, without DUT)
+8 MHz
5 dB/
- 60 dBm
0 dBm
+2. 5 MHz
5 dB/
- 60 dBm
0 dBm
+2. 5 MHz
10 dB/
- 5 0 dB
50 dB
+2. 5 MHz
1 ns/
- 5 ns
5 ns
↓ - 60 dBm ↑ 0 dBm
CENTER 1 GHz 20 MHz2 MHz /
MAG
↓- 6 0 dBm ↑ 0 dBm
CENTER 1 GHz 6 MHz500 kHz/
MAG
1 0 dB/ REF 0 dB
CENTER 1 GHz 6 MHz500 kHz /
MAGb2
b2
S21USR
D LY 1 ns/ REF 0 s
CENTER 1 GHz 6 MHz500 kHz /
EXT
AVG100100AVG100100
MAT
FI L100100FI L100100
S21USR
12
1 : - 21 . 69 dBm1 GHz
2 : - 0 . 097 dB2 00 kHz
1 2
1 : - 21 . 68 dBm1 GHz
2 : - 0 . 119 dB2 00 kHz
1
1: 0 . 002 dB1 GHz
1
1: - 953. 7 fs1 GHz
0 d B
á 0 s
Display 3:S-parameter measurement (S21 is defined as b2/b1using the direct channel access via Input b1 andInput b2)
Display 2:Discrete spectrum of pulsed signal, but testpoints coincide with position of tones (requiredfor group-delay measurement)
Display 4:Group-delay measurement
Display 1:Discrete spectrum of pulsed signal("arbitrary" number of test points)

Antenna and pulsed signal measurements with theR&S ZVM/R&S ZVK
1EZ52_OE 27 Rohde & Schwarz
Settings on the R&S ZVM/R&S ZVK:PRESET
Switching the test ports:MODE : INPUTS : PORT 1 → INPUT b1MODE : INPUTS : PORT 2 → INPUT b2
Four-channel display:DISPLAY : QUAD CHANNEL QUAD SPLIT
Measurement settings:SPAN (20 MHz)CENTER ( 1GHz)
Decoupling the measurement channels for independent settings:SWEEP : COUPLED CHANNELS (off)
Setup Display 1: Spectrum of pulsed signal (amplitude measurement)(with 5 µs pulse period, 0.5 µs pulse width, as previously
set on the R&S SMR40, page 25 bottom)
(After PRESET, 401 frequency points per channel are set. Otherwise: SWEEP : NUMBER OF POINTS : (401) )
CH1MEAS : WAVE QUANTITY : b2
Setting a marker on the carrier frequency (maximum at 1 GHz):MARKER
Taking into account the amplitude reduction by-20 * log (duty cycle) = -20 * log (0.1) = 20 dB, the level of the carrier isaccurately reproduced, taking about 1.7 dB cable loss into account.
Setup Display 2: Adjustment of the frequency grid (amplitude measurement)
A pulse signal is applied with a constant carrier frequency; the frequencysweep of the network analyzer measures the spectrum of the signal. As aresult, the S-parameters and the group delay can be determined atfrequency points of the harmonics in the subsequent measurements. Forthis reason, the frequency grid must be adapted such that the frequencypoints of the sweep coincide with those of the harmonics.
CH2MEAS : WAVE QUANTITY : b2SPAN (6 MHz)
Corresponding to 1/pulse repetition rate = 1/5 µs:SWEEP : NUMBER OF POINTS : STEP SIZE (200 kHz)

Antenna and pulsed signal measurements with theR&S ZVM/R&S ZVK
1EZ52_OE 28 Rohde & Schwarz
Setup Display 3: S-parameters on pulsed signal (DUT attenuation)
CH3Beginning with the same settings as in Display 2:
SPAN (6 MHz)SWEEP : NUMBER OF POINTS : STEP SIZE (200 kHz)
Yields 31 frequency points (check using ARBITRARY)
Up to now, only amplitude measurements have been performed. Forcomplex S-parameter measurements or phase and group delay, the Inputb1 channel is used as a reference signal. S21 = b2/b1 is to be defined as anS-parameter:
MEAS : DEFINE USER DEF´D S-PARAMS : (setting in the table of S21 = b2/b1)
USER DEF ACTIVE (on) ⇑ (Menu Up) : S21 TRANS FWD
Figure 19:Increased noise or spikes, as can be seen on the left,may occur at the frequency points at which theamplitude becomes very small (primarily at the nulls, theminima of the spectrum – see Display 2 of Figure 18).
Calibration is performed using trace mathematics (normalization):TRACE : DATA TO MEM :SHOW MATH
with: MATH = DATA/MEM (on), SHOW DATA (off)A flat line should now be visible at 0 dB.
¦ USER DEFINED S-PARAMETERSS-PARAM NUMERATOR DENOMINATORS11 / b1
b2S21 b1 a1
/ b2 / b1S12 / b1 b2
b2S22 b1
/ b2
+2.5 MHz
10 dB/
-50 dB
50 dB
500 kHz/ CENTER 1 GHz SPAN 6 MHz
CH3 S21USR dB MAG 10 dB/ REF 0dB
FIL10k
EXT
1
1: 9.343dB1GHz
0 dB

Antenna and pulsed signal measurements with theR&S ZVM/R&S ZVK
1EZ52_OE 29 Rohde & Schwarz
Setup Display 4: Group-delay measurement with pulsed signal
Identical settings as in Display 3:CH4SPAN (6 MHz)SWEEP: NUMBER OF POINTS : STEP SIZE (200 kHz)MEAS : DEFINE USER DEF´D S-PARAMS : (S21=b2/b1) USER DEF ACTIVE (on)⇑ : S21 TRANS FWD
Setting the group-delay measurement:FORMAT : GROUP DELAYSTEP APERTURE (5)
Generation of a noise free trace for Normalization:(The calibration should be performed with averaging)
AVG : IF BANDWIDTH (1 kHz) : ⇑AVG FACTOR 100 : AVERAGE (on) (AVG TYPE SWEEP)
Wait until the execution time has elapsed.Calibration/normalization:
TRACE : DATA TO MEMMATH = DATA − MEM (on)SHOW MATHSHOW DATA (off)MARKER
The marker indicates an extremely small value in the range of femto- toseveral picoseconds, ideally zero, as expected without DUT aftercalibration. The value in the middle of the curve is most accurate.Measurement uncertainty or noise increases further outward, since themeasurements there are made using carriers of smaller amplitude.
In the measurement window below, a DUT was connected(transmission line with 50 ns delay, 7.5 dB attenuation @ 1 GHz)
Figure 20:Measurement window: amplitude, S-parameter and group delay withpulsed signal (DUT: delay line)
Display 1:Spectrum. Amplitude of carriercorresponding to: 0.0 dBm output power -20.0 dB desensitization - 7.5 dB DUT attenuation - 2.0 dB test cable, connectors
Display 2:Like Display 3, but different span andgrid. Frequency points coincide withharmonics.
Display 3:S-parameter of DUT with pulsedsignal (-7.6 dB specified for DUT)
Display 4:Group delay of DUT with pulsedsignal (50 ns specified for DUT)
+2. 5 MHz
5 dB/
-60 dBm
0 dBm
+2. 5 MHz
10 dB/
-50 dB
50 dB+8 MHz
5 dB/
-60 dBm
0 dBm
+2. 5 MHz
10 ns/
0 s
100 ns
2 MHz/ CENTER 1 GHz 20 MHz
b2 MAG ↓ - 60 dBm ↑ 0 dBm
EXT
AVG100
FIL10k
MAT
12
1: - 29. 42 dBm1GHz
2: - 0.123dB200 kHz
1 2
1: - 29. 43dBm1 GHz
2: - 0. 113 dB200 kHz
1
1: - 7. 623 dB1 GHz
1
1: 50. 79 ns1 GHz
0 dB
50 ns
S21 USR MAG 10 dB/ REF 0 dB
500 kHz/ CENTER 1 GHz 6 MHzb2 MAG ↓ - 60 dBm ↑ 0 dBm S21 USR DLY 10 ns REF 50 ns
500 kHz/ CENTER 1 GHz 6 MHz 500 kHz/ CENTER 1 GHz 6 MHz

Antenna and pulsed signal measurements with theR&S ZVM/R&S ZVK
1EZ52_OE 30 Rohde & Schwarz
3.4.3 S-Parameter Measurements with Swept Carrier
The test setup is identical to the one in the preceding section (Figure 17).For instance, the IEC/IEEE bus connection between the IEC SYSTEM BUSconnector on the R&S ZVM/ZVK and the IEC/IEEE jack on the R&S SMRis required here.
In these measurements, the carrier frequency of the pulsed signal from theR&S SMR40 must be swept parallel to the measurement sweep of theR&S ZVM/ZVK. The result of this is, in contrast to the previous section, theS-parameter measurement is not performed at the frequencies of theharmonics but at arbitrary frequency points defined by the START/STOPfrequencies and the number of test points.
The optional Mixer Measurements option (R&S ZVR-B4) is used to sweepthe carrier frequency of the R&S SMR40 parallel to the frequencies of theR&S ZVM/ZVK receivers. Although this is not a frequency convertingmeasurement, the option makes it possible to automatically sweep theexternal generator parallel to the R&S ZVx.
However, this requires a modification of the device driver for thesignal generator used:
When the measurement is started, the option's driver files on the hard diskof the network analyzer reset the signal generator, thereby switching off thepulse generation settings. The driver must therefore first be edited, thePRESET command and the CW generation command deleted ordeactivated and the file saved under a new name. After the R&S ZVM/ZVKis restarted, this modified driver automatically appears in the selectionmenu of the R&S ZVR-B4 option (keyboard and mouse must be connectedbefore the R&S ZVx is switched on):
• The shortcut Alt-PrtScr switches to WIN NT mode• Start WIN NT Explorer• Start NOTEPAD• Open the file C:\USER\DATA\(filename) of the generator used
(SMR40B11 in this case)• Delete the command "*RST;" from the command string• Deactivate the line for the CW mode by keying in ";" at the beginning of
the line• Save the file under a new name, but with the ending *.GEN
(e.g. SMR40MOD here)• Close the editor• End the measurement software by closing the symbol in the WIN NT
status line and restart the measurement software in the START menu(or, alternatively, restart the firmware by switching the instrument offand then on again)

Antenna and pulsed signal measurements with theR&S ZVM/R&S ZVK
1EZ52_OE 31 Rohde & Schwarz
Settings on the R&S SMR (incl. option R&S SMR-B14) for a pulsesignal:
PRESETFREQ 1 GHzLEVEL 0 dBm
Modulation : Pulse : Pulse Mode Source : Pulse GenPulse period: 5 µsPulse width: 0.5 µsPulse delay: 0 µs
Settings on the R&S ZVM/R&S ZVK, control of the external generator:PRESETFORMAT : MAGNITUDE
Switching the test ports:MODE : INPUTS : PORT 1 → INPUT b1MODE : INPUTS : PORT 2 → INPUT b2
Settings for driving the R&S SMR40:MODE : FREQUENCY CONVERS : DEF ARBITRARY
Selecting the generator:Activate table EXT SRC CONFIG (table depicted below)by clicking the title bar or the corresponding softkey.
- Select the modified driver files in the TYPE row- Enter the IEC/IEEE bus address under GPIB ADDR- Switch to REMOTE by clicking the field under STATE
Activate table ARBITRARY SYSTEM FREQUENCIESSTART (1 GHz)STOP (2 GHz)
- Switch off the internal source of the R&S ZVx by clicking the ON field inthe EXT SRC line
- Switch on the external source by clicking the ON field in the EXT SRC1line
- ⇑ (switch to the above menu)- ARBITRARY (on)
¦ ARBITRARY SYSTEM FREQUENCIESBASE FREQUENCY: 1000MHz ...2GHz
ON POWER (NUM / DEN) xB + OFFSET RESULTINT SRCEXT SRC1 / 0 dBm (1 / 1) xB 1000MHz..2GHzEXT SRC2RECEIVER / (1 / 1) xB 1000MHz..2GHz
STIMULUS AXIS: BASE FREQUENCY 1000MHz..2GHz
¦ EXT SOURCES CONFIGSRC TYPE CONNECTION GPIB ADDR STATE1 SMR40MOD GPIB 26 REMOTE2 <NONE>
Antenna and pulsed signal measurements with theR&S ZVM/R&S ZVK
1EZ52_OE 32 Rohde & Schwarz
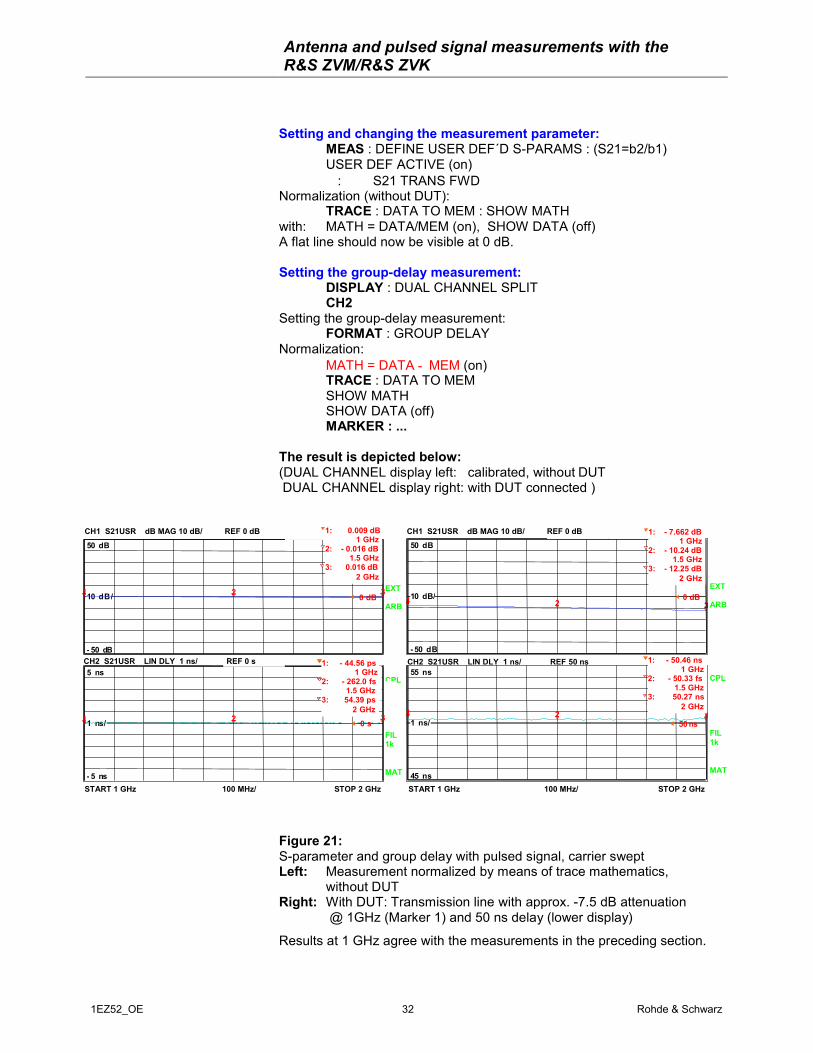
Setting and changing the measurement parameter:MEAS : DEFINE USER DEF´D S-PARAMS : (S21=b2/b1)USER DEF ACTIVE (on)⇑ : S21 TRANS FWD
Normalization (without DUT):TRACE : DATA TO MEM : SHOW MATH
with: MATH = DATA/MEM (on), SHOW DATA (off)A flat line should now be visible at 0 dB.
Setting the group-delay measurement:DISPLAY : DUAL CHANNEL SPLITCH2
Setting the group-delay measurement:FORMAT : GROUP DELAY
Normalization:MATH = DATA − MEM (on)TRACE : DATA TO MEMSHOW MATHSHOW DATA (off)MARKER : ...
The result is depicted below:(DUAL CHANNEL display left: calibrated, without DUT DUAL CHANNEL display right: with DUT connected )
Figure 21:S-parameter and group delay with pulsed signal, carrier sweptLeft: Measurement normalized by means of trace mathematics, without DUTRight: With DUT: Transmission line with approx. -7.5 dB attenuation @ 1GHz (Marker 1) and 50 ns delay (lower display)
Results at 1 GHz agree with the measurements in the preceding section.
10 dB/
- 50 dB
50 dB
1. 9 GHz
1 ns/
- 5 ns
5 ns
CH1 S21USR dB MAG 10 dB/ REF 0 dB
START 1 GHz 100 MHz/ STOP 2 GHz
EXT
ARB
CPL
FIL1k
MAT
1 2 3
1 2 3
0 dB
0 s
10 dB/
- 50 dB
50 d B
1 ns/
45 ns
55 ns
1 2 3
1 2 3
0 dB
50 ns
1: 0.009 dB 1 GHz2: - 0.016 dB 1.5 GHz3: 0.016 dB 2 GHz
CH1 S21USR dB MAG 10 dB/ REF 0 dB
CH2 S21USR LIN DLY 1 ns/ REF 0 s 1: - 44.56 ps 1 GHz2: - 262.0 fs 1.5 GHz3: 64.39ps 2 GHz
1: - 7.662 dB 1 GHz2: - 10.24 dB 1.5 GHz3: - 12.25 dB 2 GHz
EXT
ARB
CPL
FIL1k
MAT
START 1 GHz 100 MHz/ STOP 2 GHz
1: - 44.56 ps 1 GHz2: - 262.0 fs 1.5 GHz3: 54.39 ps 2 GHz
1: - 50.46 ns 1 GHz2: - 50.33 fs 1.5 GHz3: 50.27 ns 2 GHz
CH2 S21USR LIN DLY 1 ns/ REF 50 ns

Antenna and pulsed signal measurements with theR&S ZVM/R&S ZVK
1EZ52_OE 33 Rohde & Schwarz
4 Measurement Examples for Antenna and RCS ApplicationsUsing the R&S ZVM/R&S ZVK in March MicroWave Systems
Antenna and RCS measurements are usually carried out at frequenciesbetween approximately 100 MHz and 100 GHz. For some specialapplications, frequencies as high as 500 GHz have been used recently.The corresponding far-field response can be obtained directly bymeasurements under so called far-field conditions at R=2D2/λ, or bymeasuring the antenna under test in the near field and then compute thefar-field pattern. Far-field ranges can be realized indoors or outdoors forsmall devices in terms of wavelength. For electrically large antennas, thedistance can be as large as several kilometers, which means that testingon outdoor ranges can become difficult and costly. Furthermore, forsensitive devices such as space qualified hardware, these methods cannotbe applied.
As an alternative, a Compact Antenna Test Range (CATR) creates similarelectromagnetic environment as in the far field and it is thus eminentlysuitable for indoor applications. It has been shown during the last twodecades that this technique is attractive for many applications, includingsatellite testing and RCS metrology.
For high-performance data acquisition and processing, high speed multi-channel microwave receivers are required for determining the amplitudeand phase responses. In the following, several configurations includingR&S ZVM/ZVK series analyzers for antenna and RCS measurements willbe tested in operational conditions.
4.1 Antenna Measurements:System Examples, SpecificationsThe radiation pattern of an antenna is completely described by themagnitude and phase of the radiated field components in two orthogonalpolarizations. For instance, an arbitrary elliptically polarized vector E can besubdivided into its Ex and Ey components:
)()( yx tjyy
tjxx eEeE φωφω ++ += aaE (1)
Circular polarization results when Ex and Ey are equal and φx - φy = ±π/2.For linear polarization, one of the two orthogonal components is zero.Polarization losses will occur when, for instance, a receiving antenna hasnot the same polarization as the incoming wave. In many situations, bothco-and cross polarization properties of an antenna under test need to bedetermined accurately. For instance, the cross polarization at -30 to -35 dBbelow the maximum of the main beam should be measured with anaccuracy of ±0.75 dB. It should be noted that similar requirements apply forboth linearly and circularly polarized antennas. The above indicates theimportance of accurate amplitude and phase measurements in mostantenna applications.

Antenna and pulsed signal measurements with theR&S ZVM/R&S ZVK
1EZ52_OE 34 Rohde & Schwarz
Figure 1:Orientation of transmitting and receiving antennas aligned for maximumdirectional radiation and reception.
The Friis Transmission Equation relates the power received to powertransmitted between two antennas operating under the far-field conditionsand separated by a distance R [7]. The ratio of the received to the inputpower is represented by
rtt
r GGRP
P00
2)4
(πλ
= (2)
In this equation it is assumed that the transmitting and receiving antennasare matched to their respective loads and the polarization of the receivingantenna is polarization matched to the incident wave. Furthermore, G0t andG0r represent the gain of the transmitting and receiving antennas alignedfor maximum directional radiation and reception. The term (λ/4πR)2 iscalled the free-space loss factor and it takes into account the losses due tothe spherical spreading of the energy by the antenna.
Experimental investigation has been carried out on a CATR model 4838A(see Photograph 1) for several RF and AUT configurations.
Photograph 1: CATR model 4838A and AUT of 1.8 metres in diameter.
Both swept and CW measurements have been applied at variousfrequency bands. Furthermore, the angular positioning has been carriedout in both continuous and stepped modes. The measurement speed andreceiver performance have been recorded for all configurations.
Transmitting antenna
R
Receiving antenna
Antenna and pulsed signal measurements with theR&S ZVM/R&S ZVK
1EZ52_OE 35 Rohde & Schwarz
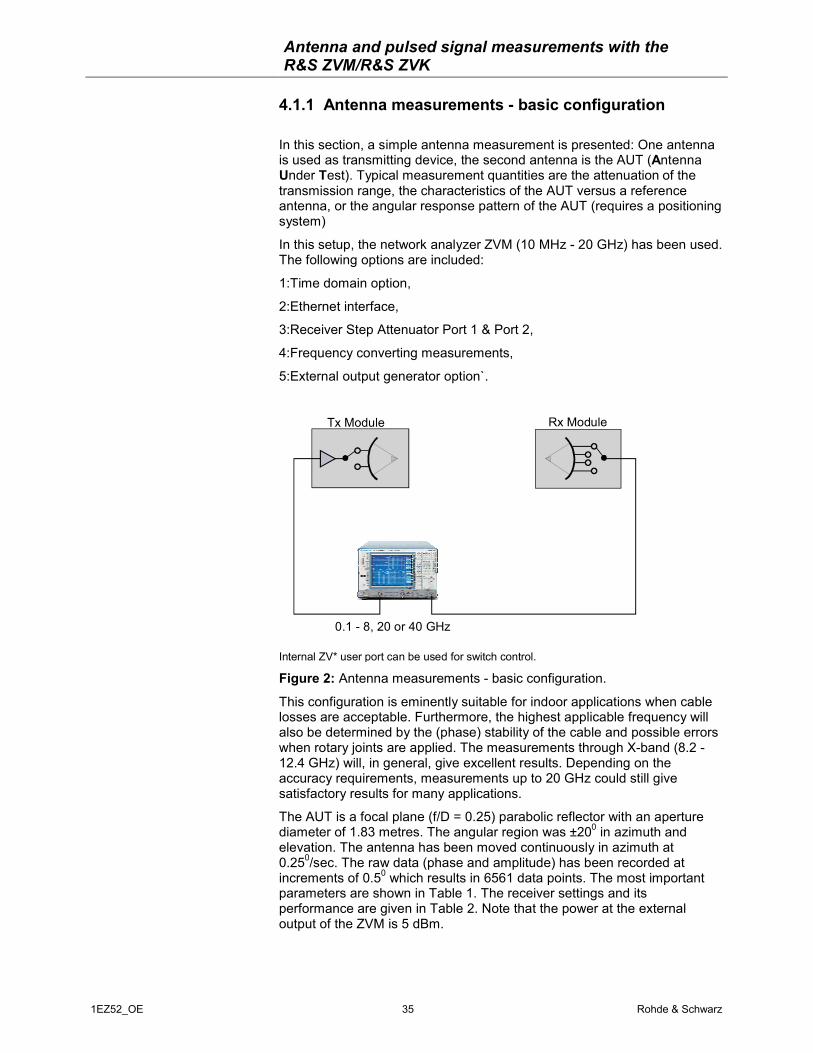
4.1.1 Antenna measurements - basic configuration
In this section, a simple antenna measurement is presented: One antennais used as transmitting device, the second antenna is the AUT (AntennaUnder Test). Typical measurement quantities are the attenuation of thetransmission range, the characteristics of the AUT versus a referenceantenna, or the angular response pattern of the AUT (requires a positioningsystem)
In this setup, the network analyzer ZVM (10 MHz - 20 GHz) has been used.The following options are included:
1:Time domain option,
2:Ethernet interface,
3:Receiver Step Attenuator Port 1 & Port 2,
4:Frequency converting measurements,
5:External output generator option`.
Tx Module Rx Module
0.1 - 8, 20 or 40 GHz
Internal ZV* user port can be used for switch control.
Figure 2: Antenna measurements - basic configuration.
This configuration is eminently suitable for indoor applications when cablelosses are acceptable. Furthermore, the highest applicable frequency willalso be determined by the (phase) stability of the cable and possible errorswhen rotary joints are applied. The measurements through X-band (8.2 -12.4 GHz) will, in general, give excellent results. Depending on theaccuracy requirements, measurements up to 20 GHz could still givesatisfactory results for many applications.
The AUT is a focal plane (f/D = 0.25) parabolic reflector with an aperturediameter of 1.83 metres. The angular region was ±200 in azimuth andelevation. The antenna has been moved continuously in azimuth at0.250/sec. The raw data (phase and amplitude) has been recorded atincrements of 0.50 which results in 6561 data points. The most importantparameters are shown in Table 1. The receiver settings and itsperformance are given in Table 2. Note that the power at the externaloutput of the ZVM is 5 dBm.

Antenna and pulsed signal measurements with theR&S ZVM/R&S ZVK
1EZ52_OE 36 Rohde & Schwarz
Number ofangular points
Measurement speed(degrees/sec)
Retrace speed(degrees/sec)
Average systemload (%)
Measurementtime (h:m:s)
81 x 81 0.25 6 7.9 3:50:25
Table 1: Measurement parameters.
Frequency(GHz)
Number ofFrequency points
Number ofAverages
IF Bandwidth(kHz)
Measurementspeed (msec)
9.5 - 11.5 201 2 10 0.71(3)
Table 2: Receiver settings and performance.
Furthermore, the system control of the receiver and of the positioncontroller has been executed by using the GPIB. The measured data filesare stored directly on the server through LAN.
The acquired data at 10.5 GHz, normalized to 0 dB at the maximum of themain beam, is shown in Figure 3a for the co-polarization and in Figure 3bfor the corresponding cross polarization.
Figure 3a:Co-polarization pattern at 10.5 GHz.
Figure 3b:Cross-polarization pattern at 10.5 GHz.
3 Two channels, single frequency, includes data transfer and system overhead.
1.8 m disha18mhh01n.rep HH (n)FREQUENCY = 10.5 GHz
Log Mag (dBn)Max: 0
-50.
-40.
-30.
-20. -50.
-40.
-30.
-20.
-20.
-10.
0.
10.
20.
ELEVATION (deg)-20. -10. 0. 10. 20.AZIMUTH (deg)
1.8 m disha18mhh01n.rep VH (n)FREQUENCY = 10.5 GHz
Log Mag (dBn)Max: -29.605
-50.
-40.
-30.
-20. -50.
-40.
-30.
-20.
-10.
-5.
0.
5.
10.
ELEVATION (deg)-10. -5. 0. 5. 10.AZIMUTH (deg)

Antenna and pulsed signal measurements with theR&S ZVM/R&S ZVK
1EZ52_OE 37 Rohde & Schwarz
Figure 4a:Co-polarization pattern at 10.5 GHz. ——— gated - - - - - ungated
Figure 4b:Cross-polarization pattern at 10.5 GHz.——— gated- - - - - ungated
In Figure 4a the azimuth scan over ±1700 is shown. In this example thereceiver settings as well as the other system parameters are identical to theprevious experiment. The measurement includes 681 points and thecorresponding measurement time is approximately 23 minutes. Forpurpose of comparison, both (software) gated and ungated data arepresented. It is observed that beyond ±60 degrees, ungated data showsincreased errors in sidelobes caused by (unwanted) reflections from bothside walls of the anechoic chamber.
In Figure 4b both co- and cross polarization patterns are shown onexpanded scale. As in the previous case, gated and ungated data arepresented. It is observed that there are only minor differences betweenthese patterns. The latter indicates that inside the angular region ofapproximately ±50 degrees the influence of the stray radiation is negligible.
Finally, in order to calculate the available power budget for the abovedescribed measurement session, the receiver characteristics, free spacelosses, gain of both receive and transmit antenna, as well as losses due tothe cabling and rotary joints need to be taken into account. For this purposewe rewrite the Friis equation (3)
rttr GGRRR
PP 00211
2
)(1
4 +
=
πλ
(3)
where R1 is the distance between the feed and center of the subreflectorand R2 the distance between center of the subreflector and center of themain reflector. Note that the expression R = R1(R1+R2) applies only fordual-reflector CATR's with cylindrical reflectors.
Furthermore, Pt = 5 dBm, Gt = 12 dB, Gr = 41.2 dB and the free-space lossfactor amounts to 71 dB. In addition, cable losses of 11.5 dB at 10.5 GHzhave been included as well. In conclusion, the received power Pr is equal to-24.3 dBm. Applying the system specifications as defined in this section,we conclude that pattern measurements can be carried out to levels whichare approximately 85 dB below the maximum of the main beam.
1.8 m disha18m175hh01gipn.repA: HH IP (n)FREQ 10.5 GHz ELEV 0 deg
-180. -120. -60. 0. 60. 120. 180.AZIMUTH (deg)
-80.
-60.
-40.
-20.
0.
Log Ma
g (dBn
) 1.8 m disha18175hh01ipn.repB: HH IP (n)FREQ 10.5 GHz ELEV 0 deg
-80.
-60.
-40.
-20.
0.
Log M
ag (dB
n)
1.8 m disha18m175hh01gipn.repA: HH IP (n)FREQ 10.5 GHz ELEV 0 deg
-180. -120. -60. 0. 60. 120. 180.AZIMUTH (deg)
-80.
-60.
-40.
-20.
0.
Log Ma
g (dBn
)
1.8 m disha18175hh01ipn.repB: HH IP (n)FREQ 10.5 GHz ELEV 0 deg
-80.
-60.
-40.
-20.
0.
Log M
ag (dB
n)

Antenna and pulsed signal measurements with theR&S ZVM/R&S ZVK
1EZ52_OE 38 Rohde & Schwarz
4.1.2 Antenna measurements - remote mixerconfiguration
The purpose of this measurement is in principle identical to that onepresented in the chapter before. Just external mixers are introduced, toconvert IFtest (the measurement signal) and IFref down to the MHz range,avoiding attenuation and signal disturbances occuring in the GHz range.
The principle of operation is given in Figure 5. As discussed previously,operation with remote mixers is preferred in certain situations, in particularat higher frequencies.
Tx Module Rx Module
Notes: 1. Switch inside the Rx module can be controlled directly from ZV*.2. Up to 4 channels are available when internal ZV* switches are applied.
In this situation, additional test mixers are required.
RF IFtest
LORF
IFref LO Source
LO
ZV*
Figure. 5: Antenna measurements - remote mixer configuration.
The maximum frequency between the mixer and the receiver willcorrespond to the LO frequency. In this situation, additional source will berequired in order to provide sufficient power at LO input ports of thereference and test mixers. Both RF and LO sources are tuned such that asignal of 20 MHz (or other suitable IF frequency) is generated. This iscalled the fixed IF mode and the measurement speed will correspond tothat of the externally triggered LO sources.
For the purpose of comparison, an azimuth scan over ±1700 has beencarried out. The measurement parameters are given in Table 3. In Table 4,receiver settings and performance are shown. When compared to the basicconfiguration of Section 4.1.1, the measurement speed is approximately 4times slower.
Number ofangular points
Measurement speed(degrees/sec)
Retrace speed(degrees/sec)
Average systemload (%)
Measurementtime (m:s)
681 0.25 N/A 57.3 22:30
Table 3: Measurement parameters, fixed IF.
Frequency(GHz)
Number offrequency points
Number ofaverages
IF Bandwidth(kHz)
Measurementspeed (msec)
8 - 12 401 2 10 2.8 (4)
Table 4: Receiver settings and performance, fixed IF.
4 Two channels, single frequency, includes data transfer and system overhead.

Antenna and pulsed signal measurements with theR&S ZVM/R&S ZVK
1EZ52_OE 39 Rohde & Schwarz
Furthermore, it should be noted that the system load increases to 57.3%,while the positioner speed is still kept at 0.250/sec. The radiation patternsare compared in Figure 6a.
Figure 6a:Co-polarization pattern at 10.5 GHz. ——— no mixers - - - - - fixed IF mode
Figure 6b:Cross-polarization and phase pattern at 10.5 GHz.——— no mixers - - - - - fixed IF mode
We observe that there are only minor differences in recorded patternsbetween both measurement configurations. In Fig. 6b the co-polar patternsand corresponding phase are shown on an expanded scale. Both patternsare identical but there is an angular displacement between bothmeasurements of approximately 0.20. This is caused by lower acquisitionspeed when remote mixers are applied. However, since the positionerrotates at constant speed, it is possible to correct for this effect.
In order to improve the measurement speed, it is possible to use a socalled fixed LO configuration. In this situation the internal source of the ZVxreceiver executes the frequency sweep and the IF frequency spectrum ischanged accordingly. This mode is also fully supported by the receiverfirmware which means that the measurement speed increasesapproximately 4 times when compared to fixed IF and it thus becomesequal to that of the basic configuration. The applicable bandwidth is limitedto that of the IF port of the mixers. For measurements in which thebandwidth does not exceed approximately 1 - 2 GHz, the fixed LO mode isan attractive option. Mixers with sufficient IF bandwidth are available for allfrequencies of interest.
1.8 m disha18m175hh01gipn.repA: HH IP (n)FREQ 10.5 GHz ELEV 0 deg
-180. -120. -60. 0. 60. 120. 180.AZIMUTH (deg)
-80.
-60.
-40.
-20.
0.
Log Ma
g (dBn
)
1.8 m disha18175hh01ipn.repB: HH IP (n)FREQ 10.5 GHz ELEV 0 deg
-80.
-60.
-40.
-20.
0.
Log M
ag (dB
n)
1.8 m disha18m175hh01gipn.repA: HH IP (n)FREQ 10.5 GHz ELEV 0 deg
-10. 0. 10.AZIMUTH(deg)
-80.
-60.
-40.
-20.
0.
Log
Mag
(dBn
)
a18m175hhmixer01gipn.repB: HH IP (n)FREQUENCY = 10.5 GHz
-10. 0. 10. AZIMUTH(deg)
-180.
-120.
-60.
0.
60.
120.
180.
Pha
se (
deg)

Antenna and pulsed signal measurements with theR&S ZVM/R&S ZVK
1EZ52_OE 40 Rohde & Schwarz
4.1.3 Antenna measurements - pulse operation option
Besides measurements with a sinusoidal signal, investigations with apulsed signal are frequently desired. This requires enlargements like apulse source, a trigger generator to provide synchronisation signals, and acontrol software. In addition, in this section RCS (Radar Cross Section)measurements with a signal reflected from a DUT (e.g. airplane model) andnot only unidirectional antenna transmitting measurements are described.
In Figure 7 an antenna measurement configuration with external pulsegenerator is presented.
Figure 7: Antenna measurements with pulse generator.
Typically, these measurements are of importance in testing where limitednumber of frequencies are required, but the pulse operation is still needed.For instance, in indoor satellite testing, a considerable improvement in theaccuracy of pattern measurements can be realized with such a system.This is because the effects of stray radiation can be directly eliminated. Formost indoor applications the gate width of 20 ns or less will be needed inorder to improve the range performance. Other possible applicationsinclude outdoor and RCS testing. The antenna under test is a standardgain horn designed for operation at 1.8 - 2.6 GHz. The aperture dimensionis 360mm x 263mm (W x H) and the corresponding gain is 16 dB at2.0 GHz. For this experiment, the range has been modified such that anunwanted signal is generated which is observed at approximately +34° withrespect to the maximum of the radiation pattern. The correspondingintensity of this signal is -7.8 dB below the pattern peak at 2.0 GHz.
SMR Source
ZVM
Feed Tx
Test RF
Trigger
a1
IEC System
IEC
b2
AUX
Blank
Ext. source trigger Ext. source blank
RF
GPIB/Ethernet
System GPIB10MHz
Ref in
Ref Out
Control (ARCS)
Pulse generatorMMS 400A
Switch TTL
Feed Rx
RS232/IEC/eth0
Reference RF
terminationTx Enable
Trigger

Antenna and pulsed signal measurements with theR&S ZVM/R&S ZVK
1EZ52_OE 41 Rohde & Schwarz
For purpose of comparison, the horn pattern has been recorded at 1.4 Ghz-3.4 GHz and for −1500<θ<+1500. In Figure 8 the ungated normalizedungated pattern is given. The pattern disturbance around +34 degrees isclearly seen at all frequencies. In Figure 9, (software) gated pattern isshown. As expected, the unwanted radiation is fully eliminated and thesepatterns will be used as a reference for an experiment in which the pulsemodulator is used. The measurement parameters and receiver settings aregiven in Tables 5 and 6 respectively.
Number ofangular points
Measurement speed(degrees/sec)
Retrace speed(degrees/sec)
Average systemload (%)
Measurementtime (m:s)
301 4.5 N/A 48 1:06
Table 5: Measurement parameters, pulsed mode.
Frequency(GHz)
Number offrequency points
Number ofaverages
IF Bandwidth(kHz)
Measurementspeed (msec)
2.0 1 512 10 102 (5)
Table 6: Receiver settings and performance.
Figure 8:Ungated pattern for 1.4 GHz to -3.4 GHz
Figure 9:Gated pattern for 1.4 - 3.4 GHz
5 Two channels, single frequency, includes data transfer and system overhead.
sghaz01n.rep VV
Log Mag (dB)Max: 0
-40.
-30.
-20.
-10.
0. -40.-30.
-20.
-10.
0.
-150. -75. 0. 75. 150.AZIMUTH (deg)
3.4
2.9
2.4
1.9
1.4 FREQUENCY (GHz)
sghaz01gn.rep VV
Log Mag (dB)Max: 0
-40.
-30.
-20.
-10.
0. -40.-30.
-20.
-10.
0.
-150. -75. 0. 75. 150.AZIMUTH (deg)
3.4
2.9
2.4
1.9
1.4 FREQUENCY (GHz)

Antenna and pulsed signal measurements with theR&S ZVM/R&S ZVK
1EZ52_OE 42 Rohde & Schwarz
Figure 10:Gated vs. ungated pattern at 2.0 GHz——— gated- - - - - ungated
Figure 11:Gated vs. ungated pattern at 2.0 GHz——— hardware gating- - - - - software gating
In Figure 10, gated vs. ungated pattern is shown at 2.0 GHz. We observethat the unwanted radiation is fully eliminated by applying the pulsegenerator. For purpose of comparison the resulting patterns for "hardware"vs. "software" gating are shown in Figure 11. We observe that bothpatterns are almost identical within the angular region of -1500<θ<+1500.
Furthermore, the transmitting and receiving pulse widths have been set to20 ns. The pulse period is 700 ms. The delay has been adjusted such thatthe effect of eliminating the unwanted stray radiation is clearly visible.
In conclusion, R&S ZVM/ZVK series analyzers give very good performancewhen short pulse operation is required. For some applications, thisconfiguration can perform better and faster than software gating. The gatewidth, pulse period, number of averages and available power should betaken into account in such a comparison.
sghazgateshort101n.repA: VVFREQUENCY = 2 GHz
-150. -100. -50. 0. 50. 100. 150.A Z I M U T H ( d e g )
-40.
-30.
-20.
-10.
0.
Lo
g
Ma
g
(d
B)
sghaz01n.repB: VVFREQUENCY = 2 GHz
-40.
-30.
-20.
-10.
0.
L
og
M
ag
(
dB
)
sghazgateshort101n.repA: VVFREQUENCY = 2 GHz
-150. -100. -50. 0. 50. 100. 150.A Z I M U T H ( d e g )
-40.
-30.
-20.
-10.
0.
Lo
g
Ma
g
(d
B)
sghaz01gn.repB: VVFREQUENCY = 2 GHz
-40.
-30.
-20.
-10.
0.
L
og
M
ag
(
dB
)

Antenna and pulsed signal measurements with theR&S ZVM/R&S ZVK
1EZ52_OE 43 Rohde & Schwarz
4.1.4 Antenna measurements - pulse profilemeasurements
A frequent requirement is to measure the response of the transmissionrange and the DUT to the pulse pattern, i.e. to determine the profile ofundisturbed and disturbed pulses versus time. Such measurements can berealized by a system as depicted below in Figure 12 (the external mixersare not absolutely required):
Figure 12:Antenna and RCS measurement system for pulse profile measurements.
The R&S SMR40 provides the pulsed RF signal. One of the keyinstruments is the trigger generator: It provides trigger logic and triggersignals for the R&S SMR40, the R&S ZVx, and the IF switch. The principleof the measurement is that the pulses are chopped into subranges, and themagnitude and phase values just of the current subrange of the pulse isrepresented by a data point of the ZVx sweep. The R&S ZVx is controlledby point trigger and set to quasi constant frequency (f=f(carrier), span~ 0 Hz), providing a quasi time axis. The NWA works in the high PRFmode, by which the magnitude and phase values are determined bysampling a bunch of pulses. The gating is realized by the external switch.The gate is shifted by a floating delay, thus representing the pulseenvelope by the data points of the sweep (see sketch from Figure 13).
(from trigger generator)
Trigger
Trigger generator synchronizes:u SMR40 pulse generationu ZVM point or sweep triggeru IF switch

Antenna and pulsed signal measurements with theR&S ZVM/R&S ZVK
1EZ52_OE 44 Rohde & Schwarz
Figure 13: Principle of pulse profile measurement
Of course, for a high resolution, a sufficient narrow gate in comparison tothe pulse length is required. To allow the system (e.g. switches) to settle ateach data point, a finite delay (step between gates) is introduced. Figure14 below presents a high resolution pulse profile measurement. Themeasurement was performed with a metal plate at the reference plane ofthe horn antennas, by which it depicts more or less the pulse patterndirectly from the R&S SMR.
Figure 14: Pulse profile measurement results, derived by external software from the ZVM frequency sweep with quasi zero span. System settings:
Pulse Width: 1 µsPulse Period: 10 µsGate length: 5 ns (resolution)Step between gates: 1 nsFrequency: 9.5 GHz
Figure 14 shows pulse profile measurements are possible with a resolutionof up to 5 ns (gate length). Achieving a higher resolution is in in evaluation.Results will be published at a later time.
40dB att, 5ns profiling, termination IF TTL at endpulse1up10n06d5uatt40cw1k512ted.repA: HHFREQUENCY = 9.5 GHz
0. .5 1. 1.5 2.P U L S E ( u s )
-155.
-145.
-135.
-125.
-115.
-105.
Log Mag (dB)
1000 ns
5 ns
pulse delay 600 ns
floating delay measurement time perdata point (1/IFBW)
pulse envelopechopped (gated) pulse
1st data point 2nd data point 3rd data point Etc...

Antenna and pulsed signal measurements with theR&S ZVM/R&S ZVK
1EZ52_OE 45 Rohde & Schwarz
4.2 Radar Cross Section measurements
The development of Radar Cross Section (RCS) measurement techniqueshas grown rapidly during the last two decades. Most importantly, reductionof the detectability of the new generation of military aircraft initiateddevelopment of new indoor test ranges. Furthermore, advanced dataprocessing techniques such as Inverse Synthetic Aperture Radar (ISAR)have been used for imaging of targets in two dimensions (down-range andcross-range) and identifying of individual scatterers inside the imaged area[9]. The latter can be seen as a most important tool for effective reductionof the RCS. Accurate prediction techniques are also available which makesmodelling of complex targets possible. Accurate experimental verificationbecomes even more important. The principle of radar measurements isshown in Fig. 15.
Figure 15:Transmitter, target and receiver geometry for radar range equation.
The radar range equation is defined as
ππλ
σ44
002
21
rt
t
r GGRRP
P
= (4)
The above expression relates the power Pr (delivered to the receiver load)to the input power Pt transmitted by an antenna, after it has been scatteredby a target with a radar cross section (echo area) of σ. Furthermore it isassumed that both antennas are polarization matched and aligned formaximum directional radiation and reception. It should be noted that theabove equation applies for bi-static situation, i.e. the transmitting andreceive antennas are at different locations. When one antenna is used fortransmitting and receiving, R1 = R2 the equation (4) describes a mono-staticradar geometry. If the complete scattering characteristics are required, theradar cross section is usually defined as a matrix.
=
2221
1211
σσσσ
σ (5)
The first subscript refers to the polarization of the transmitting antenna andthe second subscript to that of the receiving antenna. In most cases, twoorthogonal polarizations are defined (for instance vertical and horizontal)and the polarization matrix consists of VV, HH, VH and HV components.
Transmitting antenna
R2
R1
Target
σ
Receiving antenna

Antenna and pulsed signal measurements with theR&S ZVM/R&S ZVK
1EZ52_OE 46 Rohde & Schwarz
In general, the RCS of a target is a function of the polarization of theincident wave, the angle of incidence, the angle of observation, thegeometry of the target, its electrical properties and the frequency ofoperation. The units of RCS of three-dimensional targets are meterssquared (m2) or for normalized values decibel per square meter (dBsm).For calibration purposes, a (metallic) sphere is a popular target. The spherewith radius r (for r≈λ) has the following radar cross section
2rs πσ = (6)
Consequently, a sphere with radius r = 0.564 meter has a radar crosssection of 0 dBsm. For spheres with smaller radius in terms of wavelength,an exact solution for the RCS exists (see Fig. 16). This means that anaccurate calibration is possible with spheres of several centimeters indiameter at most frequencies of interest.
Figure 16: RCS of a metal sphere.
Another frequently used reference target is a flat plate. Its RCScorresponds to 4πA2/λ2, where A is the surface of the flat plate in m2. Theradar cross section of some typical targets is shown in Table 7.
Typical RCSObject
(m2) dBsmAutomobileCommercial airlinerFighter aircraftAdult personBirdInsectAdvanced stealth fighter
100402-610.010.000010.000001
20163-7.780-20-50-60
Table 7: RCS of some typical targets.
0.1
1
1 10Circumference/λ
200.3
5

Antenna and pulsed signal measurements with theR&S ZVM/R&S ZVK
1EZ52_OE 47 Rohde & Schwarz
We observe that for accurate measurements on targets with low RCS,ranges with stable and low background level will be required. The mostpopular systems will usually include a Compact Antenna Test Range,mainly because of a good background performance (levels as low as -80 to-90 dBsm have been realized with dual-reflector CATR's). A typicalhardware configuration is shown in Figure 17.
Figure 17: RCS measurement setup
The measurement parameters, receiver settings and performance aregiven in Tables, 8, 9 and 10.
Number ofangular points
Measurement speed(degrees/sec)
Retrace speed(degrees/sec)
Average systemload (%)
Measurementtime (m:s)
1441 N/A N/A N/A see Note
Table 8: Measurement parameters, stepped mode.Note: Measurement times are approximately 79 and 97 minutes
for 2 and 4 channel configurations, respectively.
Frequency(GHz)
Number offrequency points
Number ofaverages
IF Bandwidth(kHz)
Measurementspeed (msec)
8.0 - 12.0 801 1 10 0.52 (6)
Table 9: Receiver settings and performance, two channels.
Frequency(GHz)
Number offrequency points
Number ofaverages
IF Bandwidth(kHz)
Measurementspeed (msec)
8.0 - 12.0 801 1 10 1.24 (7)
Table 10: Receiver settings and performance, four channels.
6 Two channels, single frequency, includes data transfer and system overhead7 Four channels, single frequency, includes data transfer, switching between two transmitchannels and system overhead.
Available for frequencies up to 40GHz. For higher frequencies active multipliers and external mixers can be used.
Tx, Rx Module
ZV*

Antenna and pulsed signal measurements with theR&S ZVM/R&S ZVK
1EZ52_OE 48 Rohde & Schwarz
In the following, the compact range has been calibrated using a sphere witha diameter of 5 cm with the corresponding RCS of -27.1 dB. The calibrationand measurements have been carried out for two and four channels. InFigure 18, two traces are shown in the time domain. First, the emptychamber (EC) response is recorded. Second, the calibration sphere isplaced on a styrofoam column. After this measurement, the empty chamberresponse is subtracted and the resulting characteristics are generated. Itshould be noted that the sphere is clearly visible at the down-rangeposition of approximately 19.5 meters.
Figure 18:Time domain calibration.- - - - - empty chamber (EC)——— Calibration sphere - EC
Figure 19:Frequency domain data- - - - - predicted——— measured
In Fig. 19, both measurements and predicted characteristics of thecalibration sphere are shown in the frequency domain between 8 - 12 GHz.Note that the latter response has been obtained by Fourier transform of thecorresponding time domain data (gate width is ±1 meter around themaximum response of the calibration sphere). Furthermore, we observethat the background level is approximately 30 dB lower than the sphereresponse (-27.1 dBsm) which is acceptable for most RCS measurements.
After the calibration, RCS measurements have been carried out on a semi-scale model B747 (1:100 scale). The results for HH polarization are shownin Figure 20. An ISAR image clearly identifies the major scatteringlocations.
Sphere 5cmsphere5cm5dbm0dr.rpc
B: ER HH
0. 5. 10. 15. 20. 25. 30.DISTANCE (m)
-160.
-140.
-120.
-100.
-80.
-60.
Log
Mag
(dB)
sphere5cm5dbm0dr.rpcA: CT-ER HH
-160.
-140.
-120.
-100.
-80.
-60.
Log
Mag
(dB)
rcscal02.repB: HH & VV (sm)
8. 9. 10. 11. 12. FREQUENCY (GHz)
-40.
-35.
-30.
-25.
-20.
Log
Mag
(dB
sm)
Sphere 5cmsphere5cm5dbm0dr.rpcA: CT-ER HH GATED
-120.
-115.
-110.
-105.
-100.
Log
Mag
(dB)

Antenna and pulsed signal measurements with theR&S ZVM/R&S ZVK
1EZ52_OE 49 Rohde & Schwarz
Figure 20: RCS response for ±1800 and 8-12 GHz.
Figure 21: ISAR image of a B747 (1:100 scale).
b747 with spacerb747v01cg.rep HH (sm)
Log Mag (dBsm)Max: 3.02854
-40.
-30.
-20.
-10.
0. -40.-30.
-20.
-10.
0.
-180. -90. 0. 90. 180.AZIMUTH (deg)
12.
11.
10.
9.
8. FREQUENCY (GHz)
b747 with spacerb747v01cg.rpiHH (sm)
Log Mag (dBsm)Max: -23.7205
-24.00 -26.00 -28.00 -30.00 -32.00 -34.00 -36.00 -38.00 -40.00 -42.00 -44.00 -46.00 -48.00
-.5 -.25 0. .25 .5C R O S S - R A N G E ( m )
-.5
-.25
0.
.25
.5
DO
WN
-R
AN
GE
(
m)

Antenna and pulsed signal measurements with theR&S ZVM/R&S ZVK
1EZ52_OE 50 Rohde & Schwarz
5 ConclusionsIn conclusion, R&S ZVM/ZVK series vector network analyzers are suitablefor antenna measurements:
§ By means of their hardware design and technical specifications, a lot ofmeasurements are possible using them just as stand-alone-units.Mainly the four channel receiver capability and control of externalsources allow external mixing, magnitude or complex S-parametersand phase/group delay measurements on a pulse stream. Dependingfrom the repetition rate, measurements on a pulse stream can beperformed with a pulse duration down to 0.1 µs and less. Pulse profilingmeasurements are just possible when the pulse duration is muchlonger than 65 µs.
§ Systems of Company March Microwave based on R&S ZVM/ZVK,allow signal transmission over long distances, near/far-fieldmeasurements, pulse profile measurements and complex S-parametermeasurements with down to 5 ns resolution (and even higher).Finally - capturing data from all 4 channels for the full polarizationmatrix (VV, HH, VH and HV) - comprising RCS measurements withvery high system dynamic and system sweep are possible. Full systemcontrol and further data evaluation (like RCS results) is provided byMarch Microwave software packages.
6 References[1] Vector Network Analyzers ZVM, ZVK (data sheet)[2] Application Note 1EZ47_0E: "Using the Frequency Conversion Mode of Vector Network Analyzer
ZVR", (Albert Gleissner, R&S)[3] Application Note 1EZ31_1E: "Measurements on Frequency-Converting DUTs using Vector Network
Analyzer ZVR", (Peter Kraus, R&S)[4] Application Note 1EZ42_2E: "Power Calibration of Vector Network Analyzer ZVR", (A. Gleissner, R&S)[5] Application Note 1EZ42_1E: "Pulsed Measurements on GSM Amplifier SMD Ics with Vector Network
Analyzer ZVR", (Olaf Ostwald, R&S)[6] CD-ROM with documents on R&S ZVx Vector Network Analyzers[7] MARCH Documentation by L.G.T. v.d. Coevering and V.J. Vokurka[8] Balanis, Constantine A., Antenna Theory: analysis and design, 2nd edition, Wiley, New York, 1997, Ch2[9] ARCS version 3.0, March Microwave Systems B.V., 2002
7 Additional InformationPlease contact [email protected] for comments and further suggestions.
March Microwave Systems B.V.: de Huufkes 20, 5674 TM Nuenen, the NetherlandsTel. +31-(0)40-2 833 592, Fax. +31-(0)40-2 831 083, E-mail: [email protected]
ROHDE & SCHWARZ GmbH & Co. KG . Mühldorfstraße 15 . D-81671 München . P.O.B 80 14 69 . D-81614 München .
Telephone +49 89 4129 -0 . Fax +49 89 4129 - 13777 . Internet: http://www.rohde-schwarz.comThis application note and the supplied programs may only be used subject to the conditions of use set forth in the download area of the
Rohde & Schwarz website.