annual site environmental reportannual site environmental ... · annual site environmental...
TRANSCRIPT
2014 Paducah SiteAnnual Site Environmental Report2014 Paducah SiteAnnual Site Environmental Report
FPDP-RPT-0004

This report is intended to fulfill the requirements of U.S. Department of Energy Order (DOE) 231.1B.
The data and information contained in this report were collected in accordance with the Paducah Site
Environmental Monitoring Plan (LATA Kentucky 2013a; LATA Kentucky 2015a) approved by DOE.
This report is not intended to provide the results of all sampling conducted at the Paducah Site. Additional
data collected for other site purposes, such as environmental restoration, remedial investigation reports,
and waste management characterization sampling, are presented in other documents that have been
prepared in accordance with applicable DOE guidance and/or federal or state laws.
20151215 2014 ASER REG
FPDP-RPT-0004
Paducah Site
Annual Site Environmental Report
for Calendar Year 2014
December 2015
Prepared for the
U.S. DEPARTMENT OF ENERGY
Office of Environmental Management
Prepared by
FLUOR FEDERAL SERVICES, INC.,
Paducah Deactivation Project
managing the
Deactivation Project at the
Paducah Gaseous Diffusion Plant
under Task Order DE-DT0007774

THIS PAGE INTENTIONALLY LEFT BLANK
iii
CONTENTS
FIGURES .................................................................................................................................................... vii
TABLES ...................................................................................................................................................... ix
ACRONYMS ............................................................................................................................................... xi
REQUEST FOR COMMENTS .................................................................................................................. xv
EXECUTIVE SUMMARY .................................................................................................................... ES-1
1. INTRODUCTION ............................................................................................................................... 1-1 1.1 SITE LOCATION ..................................................................................................................... 1-1 1.2 GENERAL ENVIRONMENTAL SETTING ........................................................................... 1-2
1.2.1 Climate.............................................................................................................................. 1-2 1.2.2 Surface Water Drainage .................................................................................................... 1-3 1.2.3 Wetlands ........................................................................................................................... 1-3 1.2.4 Soils and Hydrogeology ................................................................................................... 1-3 1.2.5 Vegetation ......................................................................................................................... 1-3 1.2.6 Wildlife ............................................................................................................................. 1-3 1.2.7 Threatened and Endangered Species ................................................................................ 1-4
1.3 SITE MISSION ......................................................................................................................... 1-4 1.4 PRIMARY OPERATIONS AND ACTIVITIES AT THE PADUCAH SITE .......................... 1-4 1.5 DEMOGRAPHIC INFORMATION ......................................................................................... 1-5
2. COMPLIANCE SUMMARY ............................................................................................................. 2-1 2.1 ENVIRONMENTAL RESTORATION AND WASTE MANAGEMENT .............................. 2-1
2.1.1 Comprehensive Environmental Response, Compensation, and Liability Act .............. 2-1 2.1.2 Superfund Amendments and Reauthorization Act ....................................................... 2-1 2.1.3 Resource Conservation and Recovery Act ................................................................... 2-2 2.1.4 Resource Conservation and Recovery Act Hazardous Waste Permit ........................... 2-2 2.1.5 Federal Facility Compliance Act—Site Treatment Plan .............................................. 2-3 2.1.6 National Environmental Policy Act .............................................................................. 2-3 2.1.7 Toxic Substances Control Act ...................................................................................... 2-4 2.1.8 Polychlorinated Biphenyls ............................................................................................ 2-4
2.2 RADIATION PROTECTION ................................................................................................... 2-4 2.2.1 DOE Order 458.1, Radiation Protection of the Public and the Environment ............... 2-4 2.2.2 DOE Order 435.1, Radioactive Waste Management .................................................... 2-5
2.3 AIR QUALITY AND PROTECTION ...................................................................................... 2-5 2.3.1 Clean Air Act ................................................................................................................ 2-5 2.3.2 National Emission Standards for Hazardous Air Pollutants Program .......................... 2-6
2.4 WATER QUALITY AND PROTECTION ............................................................................... 2-6 2.4.1 Clean Water Act ........................................................................................................... 2-6 2.4.2 Kentucky Pollutant Discharge Elimination System...................................................... 2-6 2.4.3 Storm Water Management and the Energy Independence and Security Act
of 2007 .......................................................................................................................... 2-8 2.4.4 Safe Drinking Water Act .............................................................................................. 2-8
iv
2.5 OTHER ENVIRONMENTAL STATUTES ............................................................................. 2-9 2.5.1 Endangered Species Act ............................................................................................... 2-9 2.5.2 National Historic Preservation Act ............................................................................... 2-9 2.5.3 Migratory Bird Treaty Act .......................................................................................... 2-10 2.5.4 Asbestos Program ....................................................................................................... 2-10 2.5.5 Pollutants and Sources Subject to Regulation ............................................................ 2-10 2.5.6 Stratospheric Ozone Protection .................................................................................. 2-10 2.5.7 Floodplain/Wetlands Environmental Review Requirements ...................................... 2-11 2.5.8 Underground Storage Tanks Managed under RCRA Kentucky UST
Regulations ................................................................................................................. 2-11 2.5.9 Solid Waste Management ........................................................................................... 2-11
2.6 DEPARTMENTAL SUSTAINABILITY; FEDERAL LEADERSHIP IN
ENVIRONMENTAL, ENERGY, AND ECONOMIC PERFORMANCE ............................. 2-11 2.6.1 Departmental Sustainability ....................................................................................... 2-11 2.6.2 Federal Leadership in Environmental, Energy and Economic Performance .............. 2-12
2.7 EMERGENCY PLANNING AND COMMUNITY RIGHT-TO-KNOW ACT AND
TITLE III OF SARA ............................................................................................................... 2-12 2.8 OTHER MAJOR ENVIRONMENTAL ISSUES AND ACTIONS ........................................ 2-13
2.8.1 Green and Sustainable Remediation ........................................................................... 2-13 2.8.2 Adapting to Climate Change ...................................................................................... 2-13
2.9 CONTINUOUS RELEASE REPORTING ............................................................................. 2-13 2.10 UNPLANNED RELEASES .................................................................................................... 2-13 2.11 SUMMARY OF PERMITS ..................................................................................................... 2-14
3. ENVIRONMENTAL MANAGEMENT SYSTEM ............................................................................ 3-1 3.1 ENVIRONMENTAL OPERATING EXPERIENCE AND PERFORMANCE
MEASUREMENT ...................................................................................................................... 3-1
3.1.1 Site Sustainability Plan ................................................................................................. 3-2
3.1.2 Waste Minimization/Pollution Prevention ................................................................... 3-2 3.1.3 Depleted Uranium Hexafluoride Cylinder Program ..................................................... 3-6 3.1.4 Environmental Restoration, Waste Disposition, and D&D .......................................... 3-7 3.1.5 Emergency Management .............................................................................................. 3-7 3.1.6 Facility Stabilization, Deactivation, and Infrastructure Optimization .......................... 3-7
3.2 AWARDS AND RECOGNITION ............................................................................................ 3-8 3.2.1 Public Awareness Program ........................................................................................... 3-8 3.2.2 Community/Educational Outreach ............................................................................... 3-8 3.2.3 Citizens Advisory Board .............................................................................................. 3-9 3.2.4 Environmental Information Center ............................................................................. 3-10 3.2.5 Additional Awards ...................................................................................................... 3-10
4. ENVIRONMENTAL RADIOLOGICAL PROTECTION PROGRAM AND DOSE
ASSESSMENT ................................................................................................................................... 4-1 4.1 ENVIRONMENTAL RADIOLOGICAL MONITORING PROGRAM .................................. 4-1
4.1.1 What is Dose? ............................................................................................................... 4-1 4.1.2 Radioactive Materials at the Paducah Site .................................................................... 4-3 4.1.3 What is an Exposure Pathway?..................................................................................... 4-3 4.1.4 Dose Assessment Methodology .................................................................................... 4-4 4.1.5 Air Monitoring and Estimated Dose from Airborne Effluents ..................................... 4-5 4.1.6 Liquid Discharge Monitoring and Estimated Dose from Liquid Effluents .................. 4-7 4.1.7 Sediment Monitoring and Estimated Dose ................................................................. 4-12 4.1.8 Terrestrial Environment Monitoring and Estimated Dose .......................................... 4-15
v
4.1.9 Wildlife ....................................................................................................................... 4-15 4.1.10 Direct Radiation Monitoring and Estimated Dose ...................................................... 4-16 4.1.11 Biota Monitoring and Estimated Dose ....................................................................... 4-18
4.2 CLEARANCE OF PROPERTY CONTAINING RESIDUAL RADIOACTIVE
MATERIAL............................................................................................................................. 4-21 4.3 UNPLANNED RADIOLOGICAL RELEASES ..................................................................... 4-23
5. ENVIRONMENTAL NONRADIOLOGICAL PROGRAM INFORMATION ................................. 5-1 5.1 AIR MONITORING .................................................................................................................. 5-1 5.2 SURFACE WATER MONITORING ....................................................................................... 5-1 5.3 SEDIMENT MONITORING .................................................................................................... 5-1 5.4 BIOTA MONITORING ............................................................................................................ 5-3
5.4.1 Aquatic Life .................................................................................................................. 5-3
6. GROUNDWATER PROTECTION PROGRAM ............................................................................... 6-1 6.1 GEOLOGIC AND HYDROGEOLOGIC SETTING ................................................................ 6-1 6.2 USES OF GROUNDWATER IN THE VICINITY .................................................................. 6-3 6.3 GROUNDWATER MONITORING PROGRAM..................................................................... 6-4 6.4 GROUNDWATER MONITORING RESULTS ....................................................................... 6-5
7. QUALITY ASSURANCE................................................................................................................... 7-1 7.1 FIELD SAMPLING QUALITY CONTROL ............................................................................ 7-2
7.1.1 Data Quality Objectives and Sample Planning ............................................................. 7-2 7.1.2 Field Measurements ...................................................................................................... 7-2 7.1.3 Sampling Procedures .................................................................................................... 7-2 7.1.4 Field Quality Control Samples ..................................................................................... 7-3
7.2 ANALYTICAL LABORATORY QUALITY CONTROL ....................................................... 7-3 7.2.1 Analytical Procedures ................................................................................................... 7-3 7.2.2 Laboratory Quality Control Samples ............................................................................ 7-3 7.2.3 Independent Quality Control ........................................................................................ 7-3 7.2.4 Laboratory Audits/Sample and Data Management Organization ................................. 7-4
7.3 DATA MANAGEMENT .......................................................................................................... 7-4 7.3.1 Project Environmental Measurements System ............................................................. 7-4 7.3.2 Paducah OREIS ............................................................................................................ 7-4 7.3.3 PEGASIS ...................................................................................................................... 7-4 7.3.4 Electronic Data Deliverables ........................................................................................ 7-4 7.3.5 Data Packages ............................................................................................................... 7-5 7.3.6 Laboratory Contractual Screening ................................................................................ 7-5 7.3.7 Data Verification, Validation, and Assessment ............................................................ 7-5
8. REFERENCES .................................................................................................................................... 8-1
GLOSSARY ............................................................................................................................................. G-1
APPENDIX ............................................................................................................................................... A-1

THIS PAGE INTENTIONALLY LEFT BLANK
vii
FIGURES
1.1. Location of the Paducah Site ........................................................................................................ 1-2 2.1. Operations at the C-400 Cleaning Building Interim Remedial Action ......................................... 2-9 3.1. D&D of the C-410/C-420 Feed Plant Complex ............................................................................ 3-8 3.2. DOE Contractor Personnel Demonstrated Groundwater and the Effects on the
Environment to Area Elementary and Middle School Students ................................................... 3-9 3.3. DOE Contractors Celebrate a Safety Milestone ......................................................................... 3-10 4.1. Sources of Radiation ..................................................................................................................... 4-2 4.2. Potential Exposure Pathways ........................................................................................................ 4-4 4.3. Air Monitoring Locations ............................................................................................................. 4-6 4.4. Surface Water Monitoring .......................................................................................................... 4-10 4.5. Sediment Monitoring Locations ................................................................................................. 4-14 4.6. TLD Locations in the Vicinity of the Paducah Site .................................................................... 4-17 6.1. Monitoring Wells Sampled in CY 2014 ....................................................................................... 6-2 6.2. Paducah Site Groundwater Flow System and Water-Bearing Zones ............................................ 6-3 6.3. Locations of Groundwater Contamination Sources ...................................................................... 6-7 6.4. Northwest Plume Groundwater System TCE Removed ............................................................... 6-8 6.5. Northeast Plume Containment System TCE Removed ................................................................. 6-8 6.6. Site Preparation for Implementation of Southwest Plume SWMU 1 (Soil Mixing)
Remedial Action ........................................................................................................................... 6-9

THIS PAGE INTENTIONALLY LEFT BLANK
ix
TABLES
2.1. CERCLA and FFA Significant Milestones for CY 2014 ............................................................. 2-2 2.2. KPDES Noncompliances in CY 2014 .......................................................................................... 2-7 2.3. Federally Listed, Proposed, and Candidate Species Potentially Occurring within the
Paducah Site Study Area ............................................................................................................... 2-9 2.4. Status of EPCRA Reporting........................................................................................................ 2-13 2.5. Permits Maintained by DOE for the Paducah Site for CY 2014 ................................................. 2-14 3.1. DOE Goal Summary Table ........................................................................................................... 3-3 4.1. Radionuclide Atmospheric Releases for CY 2014 (in Curies) for the Paducah Site .................... 4-8 4.2. Dose Calculations for Airborne Releases ..................................................................................... 4-9 4.3. Calculated Radiation Doses from Airborne Releases for the Paducah Site .................................. 4-9 4.4. Ranges of Detected Radionuclides in 2014 Surface Water Samples .......................................... 4-11 4.5. Radiological Activities for Sediment Sampling.......................................................................... 4-15 4.6. Average Annual Dose Estimates for CY 2014 Incidental Ingestion of Sediment ...................... 4-15 4.7. Summary of Potential Radiological Dose to the MEI from the Paducah Site for CY 2014 ....... 4-18 4.8. Summary of Potential Radiological Dose to the Population within 50 Miles of the
Paducah Site for CY 2014 ........................................................................................................... 4-19 4.9. Bayou Creek 2014 Evaluation of Dose to Aquatic and Terrestrial Biota ................................... 4-20 4.10. Little Bayou Creek 2014 Evaluation of Dose to Aquatic and Terrestrial Biota ......................... 4-21 4.11. C-746-U Landfill Authorized Limit Disposals at C-746-U Landfill .......................................... 4-22 5.1. Summary of Surface Water Monitoring at the Paducah Site ........................................................ 5-2 5.2. Ranges of Detected Analytes in 2014 Surface Water Samples ..................................................... 5-2 6.1. Summary of Groundwater Monitoring at the Paducah Site .......................................................... 6-4 6.2. Ranges of Detected Analytes in 2014 Monitoring Well Groundwater Samples ........................... 6-6 6.3. Cumulative TCE Removed at Paducah ......................................................................................... 6-7 6.4. Summary of MCL Exceedances for C-746-S & -T and C-746-U in 2014 ................................... 6-9 7.1. Types of QC Samples ................................................................................................................... 7-3

THIS PAGE INTENTIONALLY LEFT BLANK
xi
ACRONYMS
ACO Administrative Consent Order
AFV alternative fuel vehicle
ALARA as low as reasonably achievable
ASER Annual Site Environmental Report
ASTM American Society for Testing and Materials
ATU alternate treatment unit
BMP Best Management Practices
BCG biota concentration guideline
BWCS B&W Conversion Services, LLC
CAA Clean Air Act
CAB Paducah Citizens Advisory Board
CAP corrective action plan
CERCLA Comprehensive Environmental Response, Compensation, and Liability Act
CFR Code of Federal Regulations
CWA Clean Water Act
CX categorical exclusion
CY calendar year
D&D decontamination and decommissioning
DCS derived concentration technical standard
DNAPL dense nonaqueous-phase liquid
DOE U.S. Department of Energy
DOECAP U.S. Department of Energy Consolidated Audit Program
DQO data quality objective
DUF6 depleted uranium hexafluoride
EA environmental assessment
ED effective dose
EDD electronic data deliverable
EDE effective dose equivalent
EIC Environmental Information Center
EIS environmental impact statement
EISA Energy Independence and Security Act
EM environmental management
EMP Environmental Monitoring Plan
EMS Environmental Management System
EO Executive Order
EPA U.S. Environmental Protection Agency
EPCRA Emergency Planning and Community Right-to-Know Act
EPEAT Electronic Product Environmental Assessment Tool
ERPP Environmental Radiation Protection Program
FFA Federal Facility Agreement
FFC Act Federal Facility Compliance Act
FFCA Federal Facility Compliance Agreement
FFS Fluor Federal Services, Inc.
FPDP Fluor Federal Services, Inc., Paducah Deactivation Project
FR Federal Register
FS feasibility study
FY fiscal year
GDP gaseous diffusion plant
xii
GHG greenhouse gas
GSR green and sustainable remediation
HAP hazardous air pollutant
HPSB high performance and sustainable buildings
ILA industrial, landscaping, and agricultural
ISO International Organization for Standardization
KAR Kentucky Administrative Regulations
KDAQ Kentucky Division for Air Quality
KDEP Kentucky Department for Environmental Protection
KDOW Kentucky Division of Water
KDWM Kentucky Division of Waste Management
KPDES Kentucky Pollutant Discharge Elimination System
LATA Kentucky LATA Environmental Services of Kentucky, LLC
MCL maximum contaminant level
MEI maximally exposed individual
MW monitoring well
N/A not applicable
NEPA National Environmental Policy Act
NEPCS Northeast Plume Containment System
NESHAP National Emission Standards for Hazardous Air Pollutants
NOV Notice of Violation
NPL National Priorities List
NRHP National Register of Historic Places
NWPGS Northwest Plume Groundwater System
OREIS Oak Ridge Environmental Information System
PEGASIS PPPO Environmental Geographic Analytical Spatial Information System
PEMS Project Environmental Measurements System
PGDP Paducah Gaseous Diffusion Plant
PPPO Portsmouth/Paducah Project Office
PUE power usage effectiveness
PWS public water system
QA quality assurance
QC quality control
RCRA Resource Conservation and Recovery Act
REC Renewable Energy Certificate
RI remedial investigation
RGA Regional Gravel Aquifer
SARA Superfund Amendments and Reauthorization Act
SDWA Safe Drinking Water Act
SMP Site Management Plan
SOW statement of work
SSP Site Sustainability Plan
SST Swift & Staley Team
STP Site Treatment Plan
SWMU solid waste management unit
TED total effective dose
TLD thermoluminescent dosimeter
TSCA Toxic Substances Control Act
UCRS Upper Continental Recharge System
UDS Uranium Disposition Services, LLC
UE uranium enrichment

xiii
USEC United States Enrichment Corporation
UST underground storage tank
WKWMA West Kentucky Wildlife Management Area
WM/PP waste minimization/pollution prevention
WMP Watershed Monitoring Plan

THIS PAGE INTENTIONALLY LEFT BLANK
xv
REQUEST FOR COMMENTS
The U.S. Department of Energy (DOE) requires an annual site environmental report from each of the sites
operating under its authority. This report presents the results from the various environmental monitoring
programs and activities carried out during the year. This Paducah Site Annual Site Environmental Report
for Calendar Year 2014 was prepared to fulfill DOE requirements. This report is a public document that
is distributed to government regulators, businesses, special interest groups, and members of the public.
This report is based on thousands of environmental samples collected at or near the Paducah Site.
Significant efforts were made to provide the data collected and details of the site environmental
management programs in a clear and concise manner. The editors of this report encourage comments in
order to better address the needs of our readers in future site environmental reports. You can complete a
comment form online using the following link:
http://form.jotform.us/form/42224884876163
If you prefer, written comments may be sent to the following address:
U.S. Department of Energy
Portsmouth/Paducah Project Office
1017 Majestic Drive, Suite 200
Lexington, Kentucky 40513

THIS PAGE INTENTIONALLY LEFT BLANK
ES-1
EXECUTIVE SUMMARY
The U.S. Department of Energy (DOE) manages work at the Paducah Site to comply with and adhere to
applicable laws, regulations, and site-specific regulatory permits. DOE continues to implement projects in
a manner that protects site personnel, the environment, and the community and strives to maintain full
compliance with current environmental regulations.
The purpose of this Annual Site Environmental Report is to summarize calendar year (CY) 2014
environmental management activities at the Paducah Site, including effluent monitoring, environmental
surveillance, and environmental compliance status and to highlight significant site program efforts.
Annually, DOE implements programs at the Paducah Site to measure any impacts that its operations have
on the environment or the public. Surveillance under these programs includes analyses of surface water,
groundwater, sediment, ambient air, and direct radiation.
DOE and its contractors are committed to enhancing environmental stewardship and to reducing any
impacts that site operations may cause to the environment. The Paducah Site implements sound
stewardship practices in the protection of land, air, water, and other natural or cultural resources
potentially impacted by their operations. An environmental stewardship scorecard assesses agency
performance under the Environmental Management System. The environmental stewardship scorecard for
the Paducah Site in fiscal year 2014 was green (which indicates standards for the Environmental
Management System implementation have been met).
Groundwater programs continue to remediate contamination in off-site groundwater plumes and on-site
source areas. Sediment analysis results show an overall downward trend, and ambient air monitoring
contaminant levels continue either to be not detected or below permitted limits. The internal/external dose
of radiation (based on calculations) from the plant that could be received by a member of the public is
approximately 150 times lower than the acceptable DOE annual dose limit (the DOE annual dose limit is
100 mrem/year).
DOE continues to implement the environmental cleanup program at the Paducah Gaseous Diffusion Plant.
Highlights of accomplishments through 2014 include the following: removed approximately 1,110 gal of
trichloroethene from contaminant source areas at Paducah; progressed in demolition of the C-410 Feed
Plant Complex; converted approximately 12,344 metric tons of depleted uranium hexafluoride to a more
stable oxide and hydrofluoric acid; and recycled 34,808 lb of materials.

THIS PAGE INTENTIONALLY LEFT BLANK
1-1
1. INTRODUCTION
The U.S. Department of Energy (DOE) requires that environmental monitoring be conducted and
documented for its facilities under the purview of DOE Order 231.1B, Environment, Safety, and Health
Reporting. Several other laws, regulations, and DOE directives require compliance with environmental
standards. The purpose of this Annual Site Environmental Report (ASER) is to summarize calendar year
(CY) 2014 environmental management (EM) activities at the Paducah Site, including effluent monitoring
and environmental surveillance, environmental compliance status, and to highlight significant site
program efforts. References in this report to the Paducah Site generally mean the property, programs, and
facilities at or near Paducah Gaseous Diffusion Plant (PGDP) for which DOE has ultimate responsibility.
Several documents are referenced within this ASER; where available, electronic hyperlinks to the
documents are provided within the file.
Environmental monitoring consists of the following two major activities: (1) effluent monitoring and
(2) environmental surveillance. Effluent monitoring is the direct measurement or the collection and
analysis of samples of liquid and gaseous discharges to the environment. Environmental surveillance is
the direct measurement or the collection and analysis of samples consisting of ambient air, surface water,
groundwater, and sediment. Effluent monitoring and environmental surveillance are performed to
characterize and quantify contaminants, assess radiation exposure, demonstrate compliance with
applicable standards and permit requirements, and detect and assess the effects, if any, on the local
population and environment. Samples are collected throughout the year and are analyzed for radioactivity,
chemical constituents, and various physical properties.
The overall goals for DOE/EM are to protect site personnel, the environment, and the community and to
maintain full compliance with all current environmental regulations. The current environmental strategy
is to prevent noncompliance, to identify any current compliance issues, and to develop a system for
resolution. The long-range goal of DOE/EM is to control and reduce exposures of the public, workers,
and the environment to harmful chemicals and radiation.
Prime contractors performing work to support DOE missions at the Paducah Site are the following: B&W
Conversion Services, LLC (BWCS);1 Swift & Staley Inc. (SST);
2 and LATA Environmental Services of
Kentucky, LLC (LATA Kentucky). In July 2013, the United States Enrichment Corporation (USEC), a
private company, began the shutdown of the gaseous diffusion process. In July 2014, DOE awarded a task
order under the Nationwide Environmental Management Indefinite Delivery/Indefinite Quantity
Unrestricted contract to Fluor Federal Services, Inc. (FFS), Paducah Deactivation Project (FPDP) for
deactivation activities at the Paducah Site. In October 2014, USEC terminated its lease with DOE to
operate the PGDP. This report does not include USEC environmental monitoring activities.
1.1 SITE LOCATION
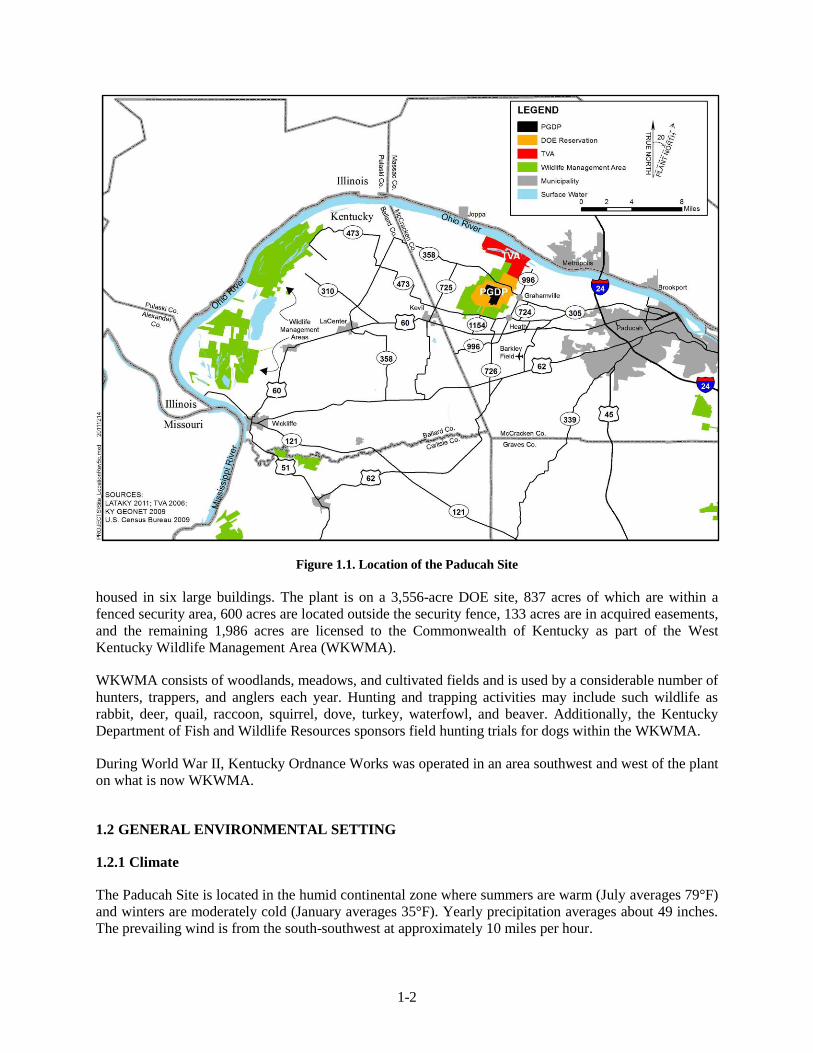
The Paducah Site is located in a generally rural area of McCracken County, Kentucky, 10 miles west of
Paducah, Kentucky, and 3.5 miles south of the Ohio River (Figure 1.1). Prior to 2014, the Paducah Site
was an active uranium enrichment (UE) facility with extensive support facilities. The UE process was
1 BWCS corporate name was changed to BWX Technologies, Inc., in 2015. 2 Swift & Staley Inc. is known as SST at the Paducah Site.
1-2
Figure 1.1. Location of the Paducah Site
housed in six large buildings. The plant is on a 3,556-acre DOE site, 837 acres of which are within a
fenced security area, 600 acres are located outside the security fence, 133 acres are in acquired easements,
and the remaining 1,986 acres are licensed to the Commonwealth of Kentucky as part of the West
Kentucky Wildlife Management Area (WKWMA).
WKWMA consists of woodlands, meadows, and cultivated fields and is used by a considerable number of
hunters, trappers, and anglers each year. Hunting and trapping activities may include such wildlife as
rabbit, deer, quail, raccoon, squirrel, dove, turkey, waterfowl, and beaver. Additionally, the Kentucky
Department of Fish and Wildlife Resources sponsors field hunting trials for dogs within the WKWMA.
During World War II, Kentucky Ordnance Works was operated in an area southwest and west of the plant
on what is now WKWMA.
1.2 GENERAL ENVIRONMENTAL SETTING
1.2.1 Climate
The Paducah Site is located in the humid continental zone where summers are warm (July averages 79°F)
and winters are moderately cold (January averages 35°F). Yearly precipitation averages about 49 inches.
The prevailing wind is from the south-southwest at approximately 10 miles per hour.
1-3
1.2.2 Surface Water Drainage
The Paducah Site is situated in the western part of the Ohio River basin. The confluence of the Ohio River
with the Tennessee River is about 15 miles upstream of the site, and the confluence of the Ohio River
with the Mississippi River is about 35 miles downstream. The Paducah Site is located on a local drainage
divide. Surface water from the east side of the plant flows east-northeast toward Little Bayou Creek, and
surface water from the west side of the plant flows west-northwest toward Bayou Creek. Bayou Creek is a
perennial stream that flows toward the Ohio River along a 9-mile course. Little Bayou Creek is an
intermittent stream that flows north toward the Ohio River along a 7-mile course. The two creeks
converge 3 miles north of the plant before emptying into the Ohio River.
Flooding in the area is associated with Bayou Creek, Little Bayou Creek, and the Ohio River. Maps of the
calculated 100-year flood elevations show that all three drainage systems have 100-year floodplains
located within the DOE boundary at the Paducah Site, but not within the industrialized area of the
Paducah Site (FEMA 2013).
1.2.3 Wetlands
More than 1,100 separate wetlands, totaling over 1,600 acres, were found in a study area of about
12,000 acres in and around the Paducah Site (COE 1994). More than 60% of the total wetland area is
forested.
1.2.4 Soils and Hydrogeology
Soils of the area are predominantly silty loams that are poorly drained, acidic, and have little organic
content. The local groundwater flow system at the Paducah Site is described in Chapter 6.
1.2.5 Vegetation
Much of the Paducah Site has been impacted by human activity. Vegetation communities on the
reservation are indicative of old field succession (e.g., grassy fields, field scrub-shrub, and upland mixed
hardwoods). The open grassland areas, most of which are managed by WKWMA personnel, are mowed
periodically or burned to maintain early successional vegetation, which is dominated by members of the
Compositae family and various grasses. Species commonly cultivated for wildlife forage are corn, millet,
milo, and soybean (CH2M HILL 1992).
Field scrub-shrub communities consist of sun tolerant wooded species such as persimmon, maples, black
locust, sumac, and oaks (CH2M HILL 1991). The undergrowth varies depending on the location of the
woodlands. Wooded areas near maintained grasslands have an undergrowth dominated by grasses. Other
communities contain a thick undergrowth of shrubs, including sumac, pokeweed, honeysuckle,
blackberry, and grape.
Upland mixed hardwood communities contain a variety of upland and transitional species. Dominant
species include oaks, shagbark and shellbark hickory, and sugarberry (CH2M HILL 1991). The
undergrowth here varies, with limited undergrowth for more mature stands of trees, to dense undergrowth
similar to that described for a scrub-shrub community.
1.2.6 Wildlife
Wildlife species indigenous to hardwood forests, scrub-shrub, and open grassland communities are
present at the Paducah Site. A list of representative species is provided in Results of the Site Investigation
1-4
Phase 1 (CH2M HILL 1991). Additionally, the Ohio River, which is 3 miles north of the Paducah Site,
serves as a major flyway for migratory waterfowl (DOE 1995a). Fish populations in Bayou Creek and
Little Bayou Creek are dominated numerically by various species of shiner and sunfish.
1.2.7 Threatened and Endangered Species
A threatened and endangered species investigation identified federally listed, proposed, or candidate
species potentially occurring at or near the Paducah Site (COE 1994). Updated information is obtained on
a regular basis from federal and Commonwealth of Kentucky sources. Currently, potential habitat for
13 species of federal concern exists in the study area. Eleven of these species are listed as “endangered”
under the Endangered Species Act of 1973, one is “threatened,” and one is proposed for listing
(Chapter 2, Table 2.3). While there are potential habitats for endangered species on DOE property, none
of the federally listed or candidate species has been found on DOE property at the Paducah Site.
1.3 SITE MISSION
DOE established the Portsmouth/Paducah Project Office (PPPO) on October 1, 2003, to provide focused
leadership to the EM missions at the Portsmouth, Ohio, and Paducah, Kentucky, gaseous diffusion plants
(GDPs).
The PPPO Lexington, Kentucky, office opened in January 2004, and is located midway between the
Kentucky and Ohio facilities. Although the PPPO manager is located in the Lexington office, frequent
and routine site interactions occur by this office at both the Portsmouth and Paducah Sites. Additionally,
DOE maintains a strong presence at the sites on a daily basis through the Portsmouth and Paducah
Operations Oversight Groups. The PPPO’s goal is to accelerate the site cleanup at the Portsmouth and
Paducah GDPs, eliminating potential environmental threats, reducing the DOE footprint at each of the
sites, and reducing life-cycle cost.
In addition to GDP stabilization, deactivation, and infrastructure optimization, DOE’s PPPO mission is to
accomplish the following at the Portsmouth and Paducah Sites.
Environmental Remediation
Waste Management
Depleted Uranium Hexafluoride (DUF6) Conversion
Decontamination and Decommissioning (D&D)
1.4 PRIMARY OPERATIONS AND ACTIVITIES AT THE PADUCAH SITE
The following two major programs are operated by DOE at the Paducah Site: (1) EM and (2) Uranium
Program. Environmental Restoration (ER); Facility Stabilization, Deactivation, and Infrastructure
Optimization; Waste Management; and D&D are projects under the EM Program. The mission of the ER
Project is to ensure that releases from past operations at the Paducah Site are investigated and that
appropriate response action is taken for protection of human health and the environment in accordance
with the Federal Facility Agreement (FFA) (EPA 1998). The mission of Facility Stabilization,
Deactivation, and Infrastructure Optimization is to remove radioactive and hazardous materials from the
facility, safely shut down facility systems, and optimize infrastructure that will continue to support the
site. The mission of the Waste Management Project is to characterize and dispose of waste stored on-site
in compliance with regulatory requirements and DOE Orders. The major mission of the D&D Project is to
D&D excess buildings (i.e., inactive with no reuse potential) to minimize or eliminate the possible health
1-5
and environmental hazards caused by the uncontrolled release of hazardous substances from contaminated
structures. The major missions of the Uranium Program are to maintain safe, compliant storage of the
DOE DUF6 inventory until final disposition, operation of a facility for the conversion of DUF6 to a more
stable oxide and hydrofluoric acid (HF), and to manage facilities and grounds. The environmental
monitoring summarized in this report supports DOE programs/projects. Additional information regarding
these activities is found in Section 3.1.
The Energy Policy Act of 1992 transferred operational responsibility for the UE enterprise to USEC, a
government corporation that became a publicly held company in 1998. In accordance with the Energy
Policy Act of 1992, USEC assumed responsibility on July 1, 1993, for enrichment operations and leased
from DOE the real property, facilities, and infrastructure necessary for enrichment operations. Until 2013,
USEC enriched uranium at the Paducah Site to supply nuclear fuel to electric utilities worldwide. In 2014,
DOE began the process of planning for lease termination and facility transfer back to DOE, facility
modification, and infrastructure optimization (including stabilization and deactivation of GDP facilities at
the Paducah Site). DOE retains ownership of all facilities, as well as the responsibility for managing the
disposition of legacy waste material and environmental cleanup.
1.5 DEMOGRAPHIC INFORMATION
The population of McCracken County, Kentucky is approximately 65,000 (DOC 2015). The major city in
McCracken County is Paducah, Kentucky, whose population is approximately 25,000 (DOC 2015). Three
small communities are located within 3 miles of the DOE property boundary at the Paducah Site: Heath
and Grahamville to the east and Kevil to the southwest. The closest commercial airport is Barkley
Regional Airport, approximately 5 miles to the southeast. The population within a 50-mile radius of the
Paducah Site is about 534,000 according to the 2010 census. Within a 10-mile radius of the Paducah Site,
the population is about 89,000 (ESRI 2012).

THIS PAGE INTENTIONALLY LEFT BLANK
2-1
2. COMPLIANCE SUMMARY
Principal regulating agencies are the U.S. Environmental Protection Agency (EPA), Region 4, and the
Kentucky Department for Environmental Protection (KDEP). These agencies issue permits, review
compliance reports, participate in joint monitoring programs, inspect facilities and operations, and
oversee compliance with applicable laws and regulations.
The EPA develops, promulgates, and enforces environmental protection regulations and technology-based
standards as directed by statutes passed by the U.S. Congress. In most instances, EPA has delegated
regulatory authority to KDEP when the Kentucky program meets or exceeds EPA requirements.
2.1 ENVIRONMENTAL RESTORATION AND WASTE MANAGEMENT
2.1.1 Comprehensive Environmental Response, Compensation, and Liability Act
DOE and EPA Region 4 entered into an Administrative Consent Order (ACO) in August 1988 under
Sections 104 and 106 of the Comprehensive Environmental Response, Compensation, and Liability Act
(CERCLA). The ACO was in response to the off-site groundwater contamination detected at the Paducah
Site in July 1988.
On May 31, 1994, the Paducah Site was placed on the EPA National Priorities List (NPL), which is a list
of sites across the nation designated by EPA as having the highest priority for site remediation. The EPA
uses the Hazard Ranking System to determine which sites should be included on the NPL.
Section 120 of CERCLA requires federal agencies with facilities on the NPL to enter into an FFA with
the EPA. The FFA, which was signed February 13, 1998, by DOE, EPA, and KDEP, established a
decision making process for remediation of the Paducah Site and coordinates CERCLA remedial action
requirements with Resource Conservation and Recovery Act (RCRA) corrective action requirements.
DOE, EPA, and KDEP agreed to terminate the CERCLA ACO because those activities could be
continued under the FFA. The FFA requires DOE to submit an annual Site Management Plan (SMP) to
EPA and KDEP. The fiscal year (FY) 2014 SMP document was submitted to EPA and KDEP in
December 2013 and a revision was sent in February 2014. After subsequent revisions to reflect milestone
modifications, the final version of the SMP was approved in September 2014 (DOE 2014a). The FFA
requires that DOE submit an annual SMP to EPA and KDEP that summarizes remediation work
completed to date, outlines remedial priorities, and contains schedules for completing future work. A link
to this document can be found in the References Section.
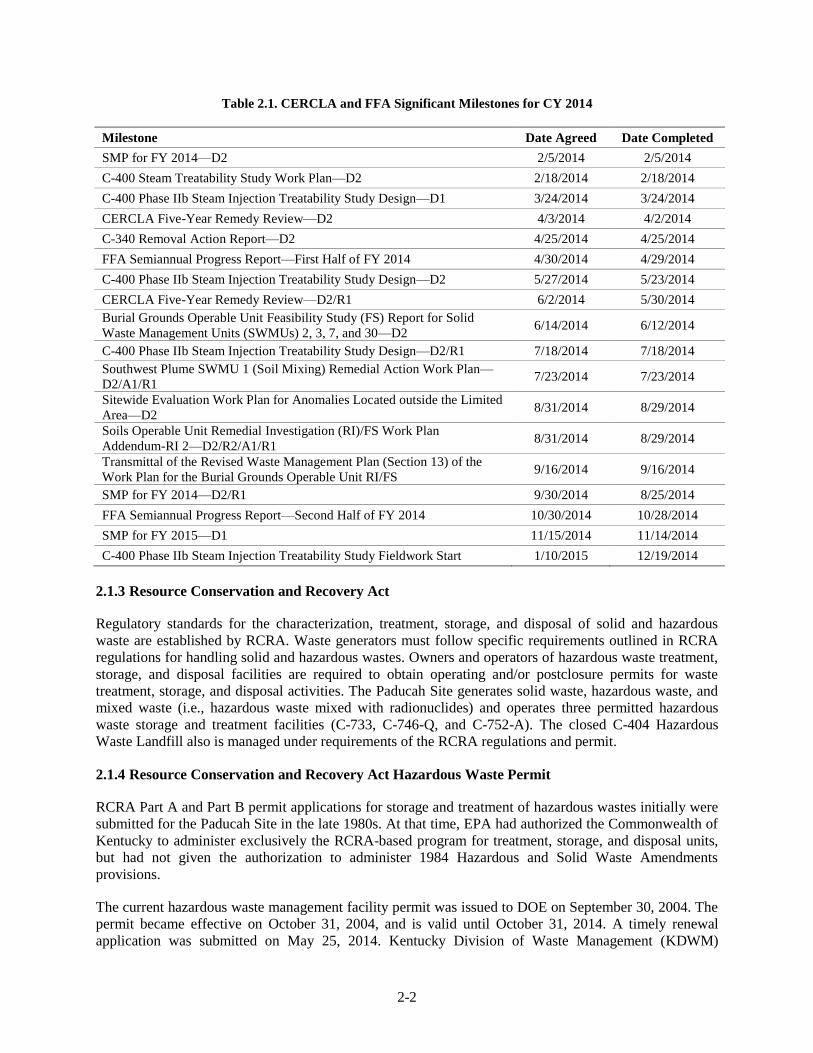
Significant enforceable milestones required under CERCLA and the FFA for CY 2014 at the Paducah
Site are listed in Table 2.1.
2.1.2 Superfund Amendments and Reauthorization Act
The Superfund Amendments and Reauthorization Act (SARA) amended CERCLA on October 17, 1986.
SARA reflected EPA’s experience in administering the complex Superfund program and made several
important changes and additions to the program. Changes of particular importance are (1) increased the
focus on human health problems posed by hazardous waste sites, and (2) encouraged greater citizen
participation in making decisions on how sites should be cleaned up.
2-2
Table 2.1. CERCLA and FFA Significant Milestones for CY 2014
Milestone Date Agreed Date Completed
SMP for FY 2014—D2 2/5/2014 2/5/2014
C-400 Steam Treatability Study Work Plan—D2 2/18/2014 2/18/2014
C-400 Phase IIb Steam Injection Treatability Study Design—D1 3/24/2014 3/24/2014
CERCLA Five-Year Remedy Review—D2 4/3/2014 4/2/2014
C-340 Removal Action Report—D2 4/25/2014 4/25/2014
FFA Semiannual Progress Report—First Half of FY 2014 4/30/2014 4/29/2014
C-400 Phase IIb Steam Injection Treatability Study Design—D2 5/27/2014 5/23/2014
CERCLA Five-Year Remedy Review—D2/R1 6/2/2014 5/30/2014
Burial Grounds Operable Unit Feasibility Study (FS) Report for Solid
Waste Management Units (SWMUs) 2, 3, 7, and 30—D2 6/14/2014 6/12/2014
C-400 Phase IIb Steam Injection Treatability Study Design—D2/R1 7/18/2014 7/18/2014
Southwest Plume SWMU 1 (Soil Mixing) Remedial Action Work Plan—
D2/A1/R1 7/23/2014 7/23/2014
Sitewide Evaluation Work Plan for Anomalies Located outside the Limited
Area—D2 8/31/2014 8/29/2014
Soils Operable Unit Remedial Investigation (RI)/FS Work Plan
Addendum-RI 2—D2/R2/A1/R1 8/31/2014 8/29/2014
Transmittal of the Revised Waste Management Plan (Section 13) of the
Work Plan for the Burial Grounds Operable Unit RI/FS 9/16/2014 9/16/2014
SMP for FY 2014—D2/R1 9/30/2014 8/25/2014
FFA Semiannual Progress Report—Second Half of FY 2014 10/30/2014 10/28/2014
SMP for FY 2015—D1 11/15/2014 11/14/2014
C-400 Phase IIb Steam Injection Treatability Study Fieldwork Start 1/10/2015 12/19/2014
2.1.3 Resource Conservation and Recovery Act
Regulatory standards for the characterization, treatment, storage, and disposal of solid and hazardous
waste are established by RCRA. Waste generators must follow specific requirements outlined in RCRA
regulations for handling solid and hazardous wastes. Owners and operators of hazardous waste treatment,
storage, and disposal facilities are required to obtain operating and/or postclosure permits for waste
treatment, storage, and disposal activities. The Paducah Site generates solid waste, hazardous waste, and
mixed waste (i.e., hazardous waste mixed with radionuclides) and operates three permitted hazardous
waste storage and treatment facilities (C-733, C-746-Q, and C-752-A). The closed C-404 Hazardous
Waste Landfill also is managed under requirements of the RCRA regulations and permit.
2.1.4 Resource Conservation and Recovery Act Hazardous Waste Permit
RCRA Part A and Part B permit applications for storage and treatment of hazardous wastes initially were
submitted for the Paducah Site in the late 1980s. At that time, EPA had authorized the Commonwealth of
Kentucky to administer exclusively the RCRA-based program for treatment, storage, and disposal units,
but had not given the authorization to administer 1984 Hazardous and Solid Waste Amendments
provisions.
The current hazardous waste management facility permit was issued to DOE on September 30, 2004. The
permit became effective on October 31, 2004, and is valid until October 31, 2014. A timely renewal
application was submitted on May 25, 2014. Kentucky Division of Waste Management (KDWM)
2-3
provided several administrative comments on August 28, 2014. A revised application was submitted on
October 10, 2014. Until the Commonwealth of Kentucky issues a new permit, the conditions of the
expired permit remain in effect.
For CY 2014, there were no Notices of Violation (NOVs) issued for the Hazardous Waste Facility Permit
(KY8-890-008-982).
2.1.5 Federal Facility Compliance Act—Site Treatment Plan
The Federal Facility Compliance Act (FFC Act) was enacted in October 1992. This act waived the
immunity from fines and penalties that had existed for federal facilities for violations of hazardous waste
management, as defined by RCRA. It also contained provisions for the development of site treatment
plans (STPs) for the treatment of DOE mixed waste and for the approval of such plans by the
Commonwealth of Kentucky. As a result of the complex issues and problems associated with the
treatment of mixed chemical hazardous and radioactive waste (mixed waste), DOE and KDEP signed,
after consideration of stakeholder input, an Agreed Order/STP on September 10, 1997. The STP
facilitates compliance with the FFC Act. An inventory of mixed waste at the end of December 2014
(approximately 2 m3) was reported in an annual update; subsequently, the reported waste was shipped
off-site in February 2015 (DOE 2015a).
2.1.6 National Environmental Policy Act
An evaluation of the potential environmental impact of certain proposed federal activities is required by
the National Environmental Policy Act (NEPA). In addition, an examination of alternatives to certain
proposed actions is required. Compliance with NEPA, as administered by DOE’s NEPA Implementing
Procedures (10 CFR § 1021) and the Council on Environmental Quality Regulations
(40 CFR § 1500–1508), ensures that consideration is given to environmental values and factors in federal
planning and decision making. In accordance with 10 CFR § 1021, the Paducah Site conducts NEPA
reviews for proposed non-CERCLA actions and determines if any proposal requires preparation of an
environmental impact statement (EIS), an environmental assessment (EA), or is a categorical exclusion
(CX) from preparation of either an EIS or an EA. The Paducah Site maintains records of all NEPA
reviews.
The PPPO began drafting an EA in 2012 to assess the environmental impacts associated with potential
transfer of the Paducah Site real property to third parties for possible economic development. Work
continued on this EA in 2014.
Numerous minor activities conducted in 2014 such as routine maintenance, small-scale facility
modifications, site characterization, facility deactivation, and utility consolidation were within the scope
of an approved EIS, EA, or approved CXs. The DOE Paducah Site Office and the PPPO NEPA
compliance officer approve and monitor the internal applications of previously approved CX
determinations.
In accordance with Section II.E of the June 13, 1994, DOE Secretarial Policy Statement on NEPA,
preparation of separate NEPA documents for environmental restoration activities conducted under
CERCLA no longer is required. Instead, the DOE CERCLA process incorporates “NEPA values.” The
NEPA values are environmental issues that affect the quality of the human environment. Documentation
of NEPA values in CERCLA documents allows the decision makers to consider the potential effects of
proposed actions on the human environment. Actions conducted under CERCLA are discussed in
Chapter 3 of this report.
2-4
2.1.7 Toxic Substances Control Act
In 1976, the Toxic Substances Control Act (TSCA) was enacted with a twofold purpose: (1) to ensure that
information on the production, use, and environmental and health effects of chemical substances or
mixtures is obtained by the EPA; and (2) to provide the means by which the EPA can regulate chemical
substances/mixtures [e.g., polychlorinated biphenyls (PCBs), asbestos, chlorofluorocarbons, and lead].
2.1.8 Polychlorinated Biphenyls
The Paducah Site complies with PCB regulations (40 CFR § 761) and the TSCA-UE-Federal Facility
Compliance Agreement (FFCA). The TSCA-UE-FFCA was signed and went into effect on February 20,
1992 (EPA 1992) and subsequently was modified on September 25, 1997 (BJC 1998). The major
activities performed in 2014 are documented in the PCB Annual Document (LATA Kentucky 2015b).
2.2 RADIATION PROTECTION
The Atomic Energy Act of 1954 provides authority to DOE to implement DOE Order 458.1, Radiation
Protection of the Public and the Environment, and DOE Order 435.1, Radioactive Waste Management.
Under these orders, DOE establishes the requirements for protection of the public and the environment
against any undue risk from radiation associated with radiological activities at DOE sites and ensures
radioactive waste is managed in a manner that is protective of worker and public health, safety, and the
environment. Authorized limits have been approved for the C-746-U Landfill and for DOE-owned
property outside the Limited Area. These limits implement DOE Order 458.1 and ensure that doses to the
public meet DOE standards and are as low as reasonably achievable (ALARA),3 that groundwater is
protected, that future remediation would not be needed, and that no radiological protection requirements
are violated.
The Paducah Site complies with DOE Order 435.1 and DOE Order 458.1. The programs described below
outline ways the Paducah Site complies with these DOE Orders.
2.2.1 DOE Order 458.1, Radiation Protection of the Public and the Environment
To help ensure compliance with the requirements of DOE Order 458.1 for the Paducah Site,
LATA Kentucky implements an Environmental Radiation Protection Program (ERPP)
(LATA Kentucky 2013b). The goals of the ERPP are as follows:
(1) To conduct radiological activities so that exposure to members of the public is maintained within the
dose limits established by the Order;
(2) To control the radiological clearance of real and personal property;
(3) To ensure that potential radiation exposures to members of the public are ALARA;
3 ALARA means “as low as reasonably achievable,” which is an approach to radiation protection to manage and control releases
of radioactive material to the environment, the workforce, and members of the public so that levels are as low as reasonable,
taking into account societal, environmental, technical, economic, and public policy considerations. ALARA is not a specific
release or dose limit, but a process that has the goal of optimizing control and managing release of radioactive material to the
environment and doses so they are as far below the applicable limits as reasonably achievable. ALARA optimizes radiation
protection.
2-5
(4) To monitor routine and nonroutine radiological releases and to assess the radiation dose to members
of the public; and
(5) To protect the environment from the effects of radiation and radioactive material.
2.2.2 DOE Order 435.1, Radioactive Waste Management
The Paducah Site manages low-level, high-level, and transuranic waste in compliance with
DOE Order 435.1 using a number of storage and disposal units. Procedures utilized for management of
these wastes ensure compliance with this Order. The quality assurance (QA) programs in place (see
Chapter 7) ensure compliance with these procedures.
2.3 AIR QUALITY AND PROTECTION
2.3.1 Clean Air Act
Authority for enforcing compliance with the Clean Air Act (CAA) and subsequent amendments resides
with EPA Region 4 and/or the Kentucky Division for Air Quality (KDAQ). The Paducah Site complies
with federal and Commonwealth of Kentucky rules by implementing the CAA and its amendments. Air
emissions at the Paducah Site fall under one of three authorities: the DUF6 Conversion Facility
Conditional Major Air Permit, CERCLA, or the Deactivation Title V Air Permit.
The DUF6 Conversion Facility operates under KDAQ Conditional Major Operating Air Permit
No. F-10-035 R1. The facility has two emission points. Emission point U001 is the stack for the
Conversion Building. Emission point U002 is the stack for HF storage and load-out area.
The Conversion Building houses four parallel process lines. The operation utilizes a one-step fluidized
bed process to convert DUF6 to uranium oxide powder. This is accomplished by reacting DUF6 gas with
steam, nitrogen, and hydrogen that produces HF. The oxide powder is collected and packaged for reuse or
disposal, while HF is a saleable end product. Low levels of HF off-gassed from the conversion process
are captured by a primary and secondary caustic scrubber system. Emissions from oxide handling are
controlled by a high-efficiency particulate air filter system. Air that is displaced during filling and
emptying of HF storage tanks at the HF storage and load-out area is vented through a dedicated scrubber
system.
Additional sources of emissions in 2014 were the Northwest Plume Groundwater System (NWPGS) and
the Northeast Plume Containment System (NEPCS) alternate treatment unit (ATU). These systems are
interim remedial actions under CERCLA that address the containment of groundwater contamination at
the Paducah Site. Instead of being permitted under the CAA, the substantive requirements of the CAA for
the emissions associated with these CERCLA actions are applied to the actions as ARARs. These systems
remove trichloroethene (TCE) contamination from the groundwater by air stripping. At the NWPGS, the
TCE-laden groundwater passes through an air stripper to remove the TCE. The off-gas from the air
stripper then passes through a carbon adsorption system to remove the TCE prior to atmospheric
discharge. At the NEPCS, a new system includes pretreatment filtration and removal of TCE via air
stripping technology. Concentrations of TCE in the Northeast Plume are sufficiently low that a carbon
adsorption system is not required to keep emissions below regulatory threshold levels.
Deactivation of the Paducah Site operates under Title V Permit, V-07-031. This permit was transferred
from USEC to FPDP, effective October 21, 2014, following USEC’s termination of the lease of GDP
facilities. The Title V permit includes 38 emission units. Among these emission units are three boilers,
2-6
one process stack, nine process fugitive emissions sources, one cooling system, and 24 emergency
generators. The C-600 Steam Plant was the only emission point that operated after the lease was
terminated. Emissions from the C-600 Steam Plant for that period were sulfur dioxide, oxides of nitrogen,
and carbon dioxide.
For CY 2014, DOE did not receive any NOVs under the CAA.
2.3.2 National Emission Standards for Hazardous Air Pollutants Program
Airborne emission of radionuclides from DOE facilities are regulated under 40 CFR § 61, Subpart H, the
National Emission Standards for Hazardous Air Pollutants (NESHAP) regulations. DOE also manages
radionuclide air emissions in accordance with the EPA-approved NESHAP Management Plan for
Emission of Radionuclides (LATA Kentucky 2013c). Potential radionuclide sources at the Paducah Site
in 2014 were from deactivation of PGDP, DUF6 Conversion Facility, NEPCS, NWPGS, and fugitive and
diffuse sources. DOE utilized ambient air monitoring data to verify a low emission rate of radionuclides
in off-site ambient air in accordance with the NESHAP Management Plan. The fugitive and diffuse
sources include building ventilation, uranium transfers, transport and disposal of waste, demolition of
contaminated facilities such as the C-410/C-420 Feed Plant Complex, decontamination of contaminated
equipment, and environmental remediation activities. Ambient air data were collected at nine locations
surrounding the Paducah Site in order to measure radionuclides emitted from Paducah Site sources,
including fugitive emissions. All of the DOE air monitors utilized are solar. These solar air monitors are
environmentally friendlier, more dependable, and less energy-consuming than the electrical models they
replaced. These results are discussed in further detail in Chapter 4.
2.4 WATER QUALITY AND PROTECTION
2.4.1 Clean Water Act
The Clean Water Act (CWA) was established primarily through the passage of the Federal Water
Pollution Control Act Amendments of 1972. The CWA established the following four major programs for
control of water pollution:
(1) Regulating point-source and storm water discharges into waters of the United States;
(2) Controlling and preventing spills of oil and hazardous substances;
(3) Regulating discharges of dredge and fill materials into “waters of the United States”; and
(4) Providing financial assistance for construction of publicly owned sewage treatment works.
Discharges from the Paducah Site are regulated under two Kentucky Pollutant Discharge Elimination
System (KPDES) permits.
2.4.2 Kentucky Pollutant Discharge Elimination System
The CWA applies to all nonradiological DOE discharges to waters of the United States. At the Paducah
Site, the regulations are applied through issuance of KPDES permits for effluent discharges to
Bayou Creek and Little Bayou Creek. The Kentucky Division of Water (KDOW) issued KPDES Permit
Number KY0004049 to DOE and LATA Kentucky for Outfalls 001, 015, 017, 019, and 020. On
October 21, 2014, KPDES Permit KY0102083 was transferred from USEC to DOE and FFS for
Outfalls 002, 004, 006, 008, 009, 010, 011, 012, 013, and 016. The KPDES permits call for monitoring as
an indicator of discharge-related effects in the receiving streams. Discharge monitoring reports are issued
monthly and quarterly. Additionally, the KPDES permits require the development and implementation of
2-7
a Best Management Practices (BMP) Plan to prevent or minimize the potential for the release of
pollutants. These BMPs have requirements for all operations and are implemented through the site
Environmental Management System (EMS) and work control.
Two NOVs were received during CY 2014 for alleged exceedances related to the KPDES permit, though
one of them was for alleged exceedances that actually occurred in 2013. Each NOV was for alleged
exceedances of the toxicity water quality standard. Zinc initially was the suspected source of toxicity
failures, so native plants and supplemental wetland varieties were installed to provide natural filtering
capacity along the ditch. However, a preliminary evaluation conducted by an Oak Ridge National
Laboratory toxicologist in 2014 indicated that pathogen interference in the fathead minnow tests was a
likely explanation for much of the apparent toxicity detected in Outfall 017 tests (i.e., the toxicity likely is
unrelated to plant operations) (BWCS 2014). Similarly, failed toxicity tests at Outfall 001 are believed to
have been caused by a naturally occurring pathogen. In November 2014, requirements for the toxicity
reduction evaluation plan for Outfall 017, approved by KDOW, was satisfied by passing six consecutive
months of sampling with no exceedances. KDOW terminated the toxicity reduction evaluation
requirement in January 2015.
(1) On June 4, 2014, BWCS received an NOV letter for exceeding whole effluent toxicity at Outfall 017
October 23 and November 22, 2013. The KPDES permit limit for toxicity is a chronic toxicity unit
(TUc) < 1. The result for October 23, 2013, was TUc = 23.8. The result for November 22, 2013, was
TUc = 5.92.
(2) On August 8, 2014, LATA Kentucky received an NOV letter for exceeding whole effluent toxicity at
Outfall 001 February 26 and March 18, 2014. The KPDES permit limit for toxicity is a TUc < 1. The
result for February 26, 2014, was TUc = 19.2. The result for March 18, 2014, was TUc = 3.0.
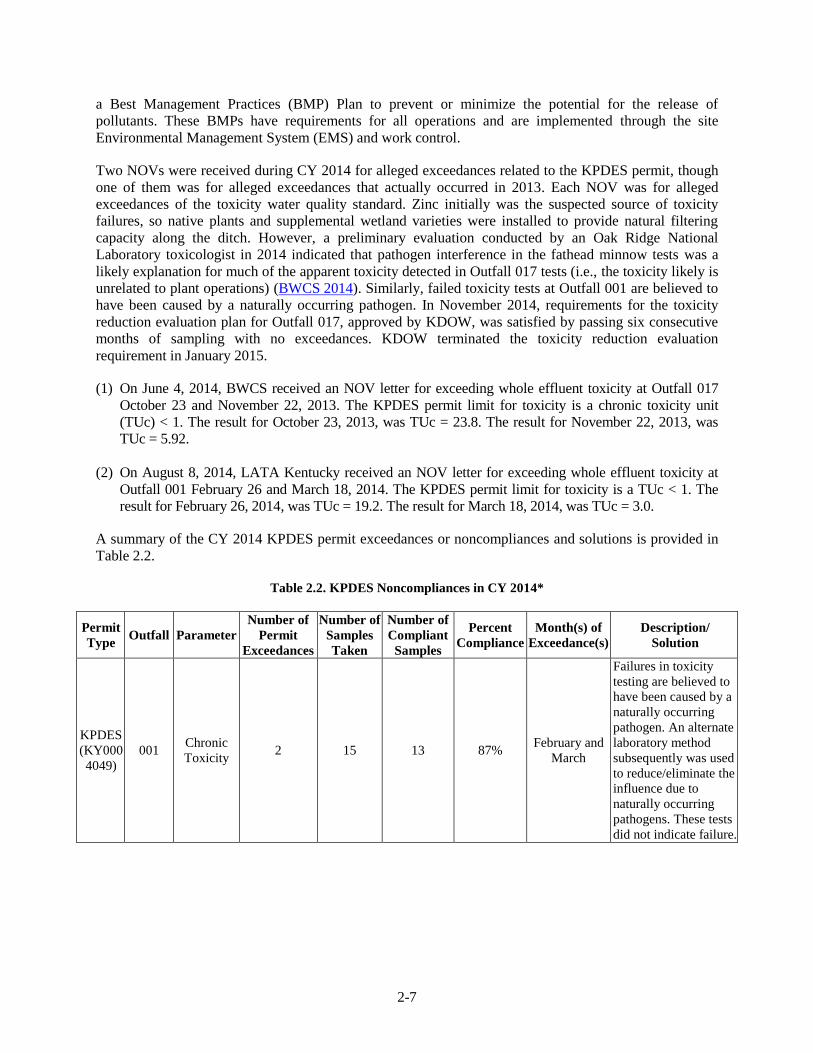
A summary of the CY 2014 KPDES permit exceedances or noncompliances and solutions is provided in
Table 2.2.
Table 2.2. KPDES Noncompliances in CY 2014*
Permit
Type Outfall Parameter
Number of
Permit
Exceedances
Number of
Samples
Taken
Number of
Compliant
Samples
Percent
Compliance
Month(s) of
Exceedance(s)
Description/
Solution
KPDES
(KY000
4049)
001 Chronic
Toxicity 2 15 13 87%
February and
March
Failures in toxicity
testing are believed to
have been caused by a
naturally occurring
pathogen. An alternate
laboratory method
subsequently was used
to reduce/eliminate the
influence due to
naturally occurring
pathogens. These tests
did not indicate failure.
2-8
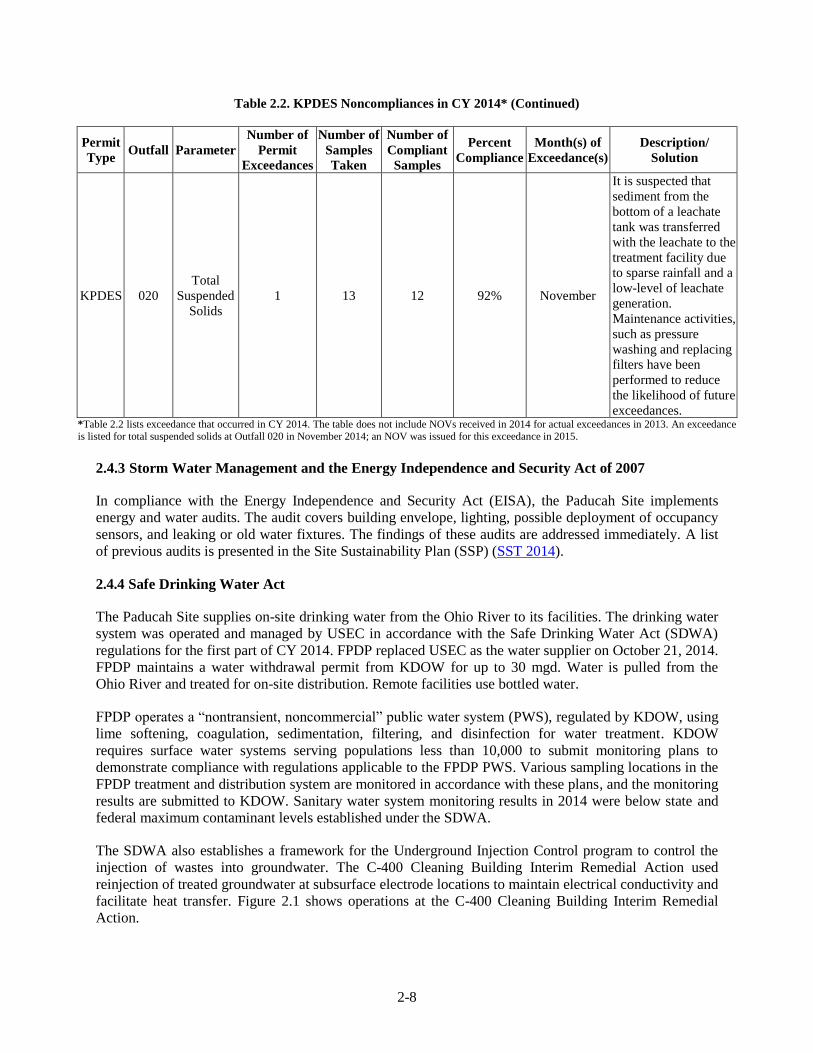
Table 2.2. KPDES Noncompliances in CY 2014* (Continued)
Permit
Type Outfall Parameter
Number of
Permit
Exceedances
Number of
Samples
Taken
Number of
Compliant
Samples
Percent
Compliance
Month(s) of
Exceedance(s)
Description/
Solution
KPDES 020
Total
Suspended
Solids
1 13 12 92% November
It is suspected that
sediment from the
bottom of a leachate
tank was transferred
with the leachate to the
treatment facility due
to sparse rainfall and a
low-level of leachate
generation.
Maintenance activities,
such as pressure
washing and replacing
filters have been
performed to reduce
the likelihood of future
exceedances. *Table 2.2 lists exceedance that occurred in CY 2014. The table does not include NOVs received in 2014 for actual exceedances in 2013. An exceedance is listed for total suspended solids at Outfall 020 in November 2014; an NOV was issued for this exceedance in 2015.
2.4.3 Storm Water Management and the Energy Independence and Security Act of 2007
In compliance with the Energy Independence and Security Act (EISA), the Paducah Site implements
energy and water audits. The audit covers building envelope, lighting, possible deployment of occupancy
sensors, and leaking or old water fixtures. The findings of these audits are addressed immediately. A list
of previous audits is presented in the Site Sustainability Plan (SSP) (SST 2014).
2.4.4 Safe Drinking Water Act
The Paducah Site supplies on-site drinking water from the Ohio River to its facilities. The drinking water
system was operated and managed by USEC in accordance with the Safe Drinking Water Act (SDWA)
regulations for the first part of CY 2014. FPDP replaced USEC as the water supplier on October 21, 2014.
FPDP maintains a water withdrawal permit from KDOW for up to 30 mgd. Water is pulled from the
Ohio River and treated for on-site distribution. Remote facilities use bottled water.
FPDP operates a “nontransient, noncommercial” public water system (PWS), regulated by KDOW, using
lime softening, coagulation, sedimentation, filtering, and disinfection for water treatment. KDOW
requires surface water systems serving populations less than 10,000 to submit monitoring plans to
demonstrate compliance with regulations applicable to the FPDP PWS. Various sampling locations in the
FPDP treatment and distribution system are monitored in accordance with these plans, and the monitoring
results are submitted to KDOW. Sanitary water system monitoring results in 2014 were below state and
federal maximum contaminant levels established under the SDWA.
The SDWA also establishes a framework for the Underground Injection Control program to control the
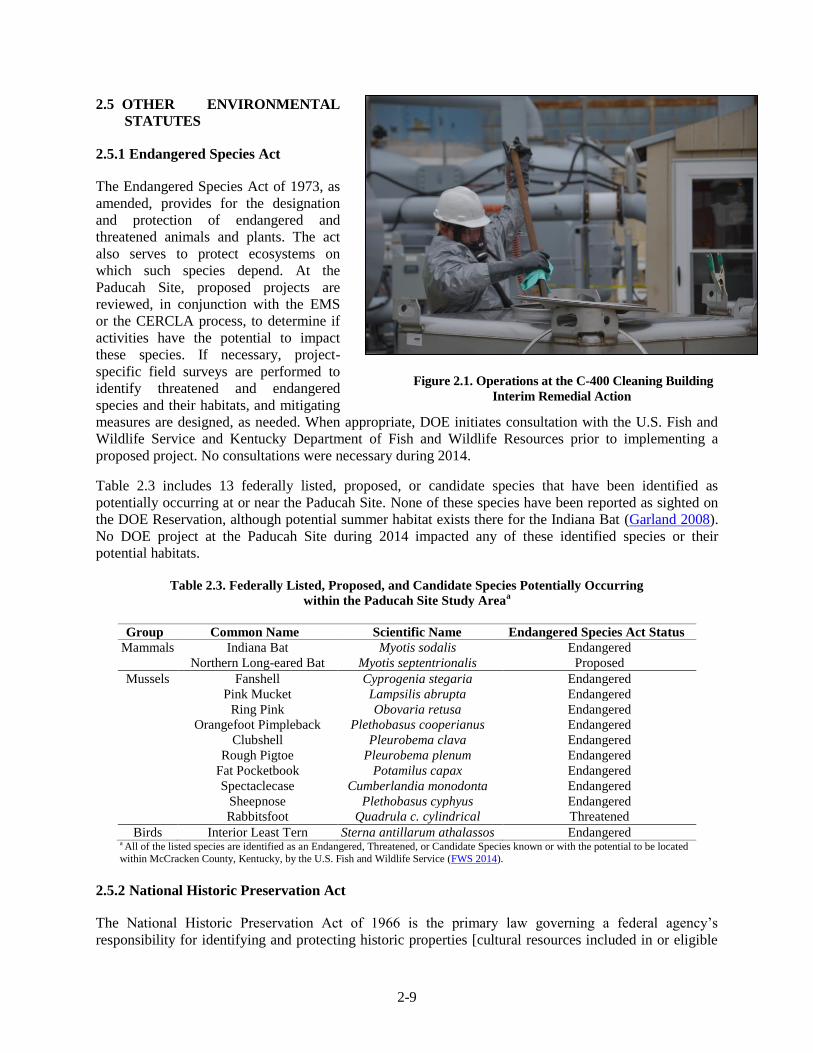
injection of wastes into groundwater. The C-400 Cleaning Building Interim Remedial Action used
reinjection of treated groundwater at subsurface electrode locations to maintain electrical conductivity and
facilitate heat transfer. Figure 2.1 shows operations at the C-400 Cleaning Building Interim Remedial
Action.
2-9
Figure 2.1. Operations at the C-400 Cleaning Building
Interim Remedial Action
2.5 OTHER ENVIRONMENTAL
STATUTES
2.5.1 Endangered Species Act
The Endangered Species Act of 1973, as
amended, provides for the designation
and protection of endangered and
threatened animals and plants. The act
also serves to protect ecosystems on
which such species depend. At the
Paducah Site, proposed projects are
reviewed, in conjunction with the EMS
or the CERCLA process, to determine if
activities have the potential to impact
these species. If necessary, project-
specific field surveys are performed to
identify threatened and endangered
species and their habitats, and mitigating
measures are designed, as needed. When appropriate, DOE initiates consultation with the U.S. Fish and
Wildlife Service and Kentucky Department of Fish and Wildlife Resources prior to implementing a
proposed project. No consultations were necessary during 2014.
Table 2.3 includes 13 federally listed, proposed, or candidate species that have been identified as
potentially occurring at or near the Paducah Site. None of these species have been reported as sighted on
the DOE Reservation, although potential summer habitat exists there for the Indiana Bat (Garland 2008).
No DOE project at the Paducah Site during 2014 impacted any of these identified species or their
potential habitats.
Table 2.3. Federally Listed, Proposed, and Candidate Species Potentially Occurring
within the Paducah Site Study Areaa
Group Common Name Scientific Name Endangered Species Act Status
Mammals Indiana Bat Myotis sodalis Endangered
Northern Long-eared Bat Myotis septentrionalis Proposed
Mussels Fanshell Cyprogenia stegaria Endangered
Pink Mucket Lampsilis abrupta Endangered
Ring Pink Obovaria retusa Endangered
Orangefoot Pimpleback Plethobasus cooperianus Endangered
Clubshell Pleurobema clava Endangered
Rough Pigtoe Pleurobema plenum Endangered
Fat Pocketbook Potamilus capax Endangered
Spectaclecase Cumberlandia monodonta Endangered
Sheepnose Plethobasus cyphyus Endangered
Rabbitsfoot Quadrula c. cylindrical Threatened
Birds Interior Least Tern Sterna antillarum athalassos Endangered a All of the listed species are identified as an Endangered, Threatened, or Candidate Species known or with the potential to be located
within McCracken County, Kentucky, by the U.S. Fish and Wildlife Service (FWS 2014).
2.5.2 National Historic Preservation Act
The National Historic Preservation Act of 1966 is the primary law governing a federal agency’s
responsibility for identifying and protecting historic properties [cultural resources included in or eligible
2-10
for inclusion in the National Register of Historic Places (NRHP)]. Historic properties include buildings of
historic significance and archeological sites. PGDP buildings were assessed in the Cultural Resources
Management Plan (BJC 2006). Archeological resources will be addressed as undisturbed land is
developed for site use, or if undisturbed sites are considered to be impacted by DOE operations.
The Cultural Resources Management Plan identified an NRHP-eligible historic district at the facility. The
PGDP Historic District contains 101 contributing properties and is eligible for the NRHP under National
Register Criterion A for its military significance during the Cold War and for its role in commercial
nuclear power development. The PGDP historic district encompasses the area of the process buildings;
the switchyards; the C-100 Administration Building; cooling towers and pump houses; security facilities;
water treatment facilities; storage tanks; and the support, maintenance, and warehouse buildings. A map
and the rationale for designating the area as such are included in the Cultural Resources Management
Plan.
2.5.3 Migratory Bird Treaty Act
The Memorandum of Understanding on Migratory Birds (2013) between DOE and the U.S. Fish and
Wildlife Service and Executive Order (EO) 13186, Responsibilities of Federal Agencies to Protect
Migratory Birds, direct federal agencies to take certain actions to further implement the Migratory Bird
Treaty Act. The Migratory Bird Treaty Act of 1918 is applicable to the Paducah Site. DOE takes
measures to minimize impacts to migratory birds by avoiding disturbance of active nests. Work control
documents implement this restriction.
2.5.4 Asbestos Program
Numerous facilities at the Paducah Site contain asbestos materials. Compliance programs for asbestos
management include identification of asbestos materials, monitoring, abatement, and disposal. Procedures
and program plans are maintained that delineate scope, roles, and responsibilities for maintaining
compliance with EPA, Occupational Safety and Health Administration, and Kentucky regulatory
requirements, as applicable. During D&D of the C-410/420 Feed Plant Complex, asbestos-containing
transite panels were abated prior to proceeding with demolition (DOE 2010).
2.5.5 Pollutants and Sources Subject to Regulation
Any stationary source with the potential to emit more than 10 tons per year of any hazardous air pollutant
(HAP) or 25 tons per year of any combination of HAPs is considered a major source and is subject to
regulation. The Deactivation Project has the potential to emit more than 10 tons per year of several
pollutants/HAPs, including, but not limited to, sulfur dioxide, oxides of nitrogen, carbon monoxide,
carbon dioxide, particulate matter, hydrochloric acid, HF, and volatile organic compounds. As such,
KDAQ considers the Deactivation Project to be a major source and has issued a Title V Air Permit for
these emissions. Additionally, DUF6 facility has the potential to emit more than 10 tons per year of HF
and is, therefore, a major source; however, the DUF6 HF emissions are limited to no more than 9 tons per
year. As such, KDAQ considers DUF6 conversion activities at the Paducah Site to be a conditional major
source (in Kentucky, a conditional major source is a source where emissions are limited below Title V’s
major source threshold).
2.5.6 Stratospheric Ozone Protection
Prior to October 2014, DOE operated only refrigeration units that contain less than 50 lb of
ozone-depleting substances; therefore, the only CAA Title VI (for Stratospheric Ozone Protection)
provision that applied to the Paducah Site was the requirement to control refrigerants from leaking
2-11
systems. On October 21, 2014, DOE assumed operations of the GDP’s cooling systems, including the
very large R-114 system. This system currently holds approximately 6.3 million lb of R-114 refrigerant.
Releases from the system are tracked and repaired in accordance with 40 CFR § 82 requirements and the
Title V Permit. In addition to the 6.3 million lb of R-114 refrigerant in the cooling systems,
approximately 2.2 million lb of R-114 is stored in railcars at the Paducah Site.
2.5.7 Floodplain/Wetlands Environmental Review Requirements
Title 10 CFR § 1022 establishes procedures for compliance with EO 11988, Floodplain Management, and
EO 11990, Protection of Wetlands. DOE activities did not result in significant impacts to floodplains or
wetlands at the Paducah Site in 2014.
2.5.8 Underground Storage Tanks Managed under RCRA Kentucky UST Regulations
Underground storage tank (UST) systems at the Paducah Site were used to store petroleum products such
as gasoline, diesel fuel, and waste oil. These USTs are regulated under RCRA Subtitle I (40 CFR § 280)
and Kentucky UST regulations (401 KAR Chapter 42).
Of the 18 USTs that have been reported to KDWM under the UST Program, only 2 still were operational
during CY 2014, 14 have been closed in accordance with approved closure plans, and 2 were determined
not to exist. Both of the operational USTs were maintained by USEC until October 2014. After
October 2014, the USTs were inactivated, and plans were initiated to remove the 2 remaining USTs. The
removal was completed in 2015.
2.5.9 Solid Waste Management
The Paducah Site disposes of a portion of its solid waste at its contained landfill facility, C-746-U Solid
Waste Contained Landfill under Solid Waste Permit, SW07300045. Construction of the C-746-U Landfill
began in 1995 and was completed in 1996. The operation permit was received from KDWM in November
1996. Disposal of waste at the landfill began in February 1997. A new operation permit for the
C-746-U Landfill was received from KDWM in November 2006 and is set to expire in 2016. Operating
and groundwater reports for the C-746-U Landfill are submitted quarterly to KDWM.
During 2014, the office waste generated by DOE and its contractors at the plant site was taken off-site for
disposal. (Office waste generated at the C-746-U Landfill itself is disposed of at the landfill.) Waste Path
Services, LLC, in Calvert City, Kentucky, provides off-site disposal services of the office waste from the
Paducah Site. The City of Kevil picks up the office waste from the office complexes in Kevil, Kentucky,
that house administrative personnel who support activities at the site. Recycling is discussed in
Section 3.1.2.
2.6 DEPARTMENTAL SUSTAINABILITY; FEDERAL LEADERSHIP IN ENVIRONMENTAL,
ENERGY, AND ECONOMIC PERFORMANCE
2.6.1 Departmental Sustainability
DOE Order 436.1, Departmental Sustainability, was enacted May 2, 2011. To address requirements in the
order, the site made a commitment to pursue the U.S. Green Building Council’s Leadership in Energy and
Environmental Design and incorporate Guiding Principles for Federal Leadership in High Performance
and Sustainable Buildings (HPSB) design in construction of future buildings. The Paducah Site currently
has no buildings that meet the Guiding Principles of HPSB. No large renovation projects are viable at this
2-12
time for buildings at the Paducah Site, but the site continues to implement small upgrades as opportunities
present themselves through maintenance replacements such as heating, ventilation, and air conditioning
units, etc.
2.6.2 Federal Leadership in Environmental, Energy and Economic Performance
On October 5, 2009, the President signed EO 13514, Federal Leadership in Environmental, Energy, and
Economic Performance. This EO requires federal agencies to inventory, report, and reduce greenhouse
gas (GHG) emissions. This EO requires DOE to calculate an emissions baseline and establish targets for
reduction of GHG. In support of DOE’s goals to reduce GHG emissions, SST submitted an SSP in
December 2014 (SST 2014), and FPDP submitted an SSP in December 2014 (FPDP 2014).
LATA Kentucky supports the SST SSP as implemented through their EMS Program. Details of the
objectives of the SSP are outlined in Chapter 3 of this report.
2.7 EMERGENCY PLANNING AND COMMUNITY RIGHT-TO-KNOW ACT AND TITLE III
OF SARA
Also referred to as Title III of SARA, the Emergency Planning and Community Right-to-Know Act
(EPCRA) requires reporting of emergency planning information, hazardous chemical inventories, and
releases to the environment, including GHGs. The Paducah Site, as a federal facility, is subject to these
reporting requirements.
EPCRA’s primary purpose is to increase the public’s knowledge and access to information of chemical
hazards in their communities. In order to ensure proper and immediate responses to potential chemical
hazards, EPCRA Section 304 requires facilities to notify state emergency response commissions and local
emergency planning committees of releases of hazardous substances and extremely hazardous substances
when the release equals or exceeds the reportable quantity. Sections 311 and 312 of EPCRA require
businesses to report the locations and quantities of chemicals stored on-site to state and local governments
in order to help communities prepare to respond to chemical spills and similar emergencies (when
chemicals exceed a 10,000 lb reporting threshold). EPCRA Section 313 requires EPA and the states to
collect data annually on releases and transfers of certain toxic chemicals from industrial facilities and
make the data available to the public.
The Paducah Site did not have any releases that were subject to EPCRA Section 304 notification
requirements during 2014. In 2014, no EPCRA Section 311 notifications were sent for new chemicals at
the Paducah Site. BWCS manufactured HF in 2014 and submitted a corresponding EPCRA 313 Report.
DOE also submitted an EPCRA 313 Report for HF.
The chemicals stored by all DOE contractors in 2014 (including FPDP) were included in an EPCRA 312
Report. The chemicals reported were activated carbon, argon, biodiesel fuel, diesel fuel, gasoline,
coagulant, calcium hydroxide, calcium oxide, carbon dioxide, chlorine trifluoride, coal,
dichlorotetrafluoroethane (R-114), ferric sulfate, fluorine, HF, lead acid batteries, nitric acid, compressed
nitrogen, cryogenic nitrogen, PCBs, potassium hydroxide, propane, rock salt, sodium carbonate, sodium
thiosulfate, sulfuric acid, uranium hexafluoride (UF6), and uranium oxide. [UF6 was reported though
radioactive material is not subject to EPCRA Sections 311 and 312 (52 FR 38344-01).]
Table 2.4 lists the 2014 EPCRA reporting status for the Paducah Site.
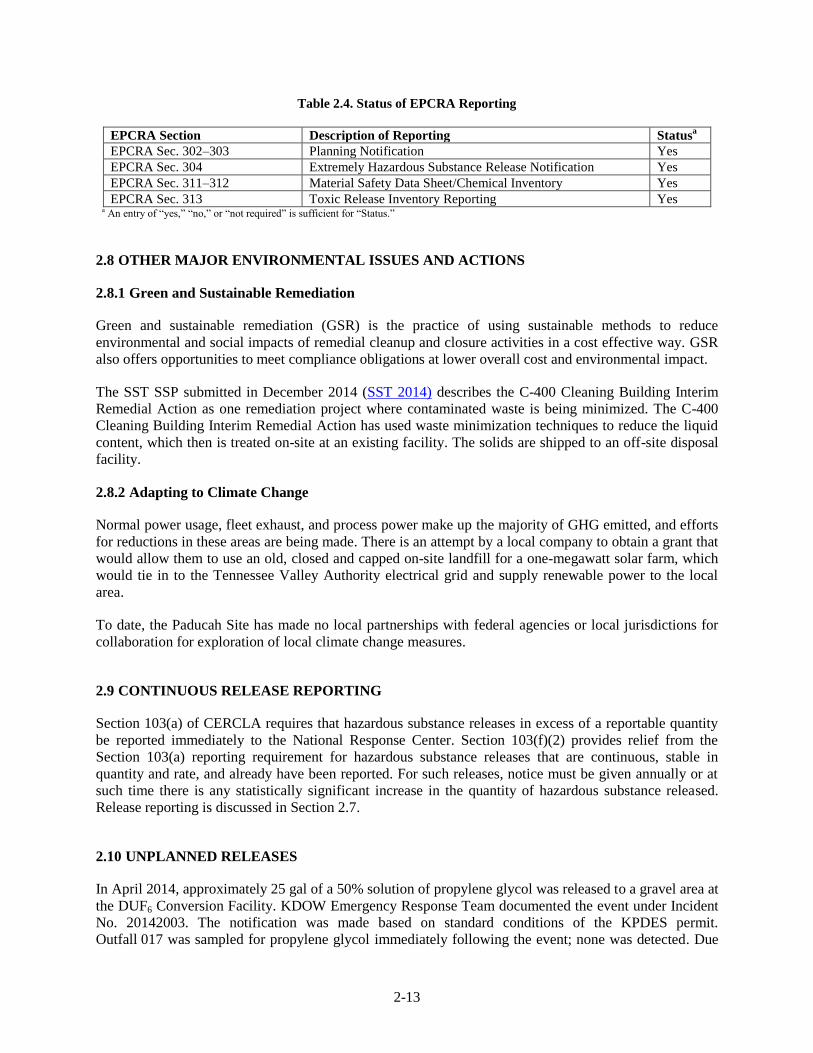
2-13
Table 2.4. Status of EPCRA Reporting
EPCRA Section Description of Reporting Statusa
EPCRA Sec. 302–303 Planning Notification Yes
EPCRA Sec. 304 Extremely Hazardous Substance Release Notification Yes
EPCRA Sec. 311–312 Material Safety Data Sheet/Chemical Inventory Yes
EPCRA Sec. 313 Toxic Release Inventory Reporting Yes a An entry of “yes,” “no,” or “not required” is sufficient for “Status.”
2.8 OTHER MAJOR ENVIRONMENTAL ISSUES AND ACTIONS
2.8.1 Green and Sustainable Remediation
Green and sustainable remediation (GSR) is the practice of using sustainable methods to reduce
environmental and social impacts of remedial cleanup and closure activities in a cost effective way. GSR
also offers opportunities to meet compliance obligations at lower overall cost and environmental impact.
The SST SSP submitted in December 2014 (SST 2014) describes the C-400 Cleaning Building Interim
Remedial Action as one remediation project where contaminated waste is being minimized. The C-400
Cleaning Building Interim Remedial Action has used waste minimization techniques to reduce the liquid
content, which then is treated on-site at an existing facility. The solids are shipped to an off-site disposal
facility.
2.8.2 Adapting to Climate Change
Normal power usage, fleet exhaust, and process power make up the majority of GHG emitted, and efforts
for reductions in these areas are being made. There is an attempt by a local company to obtain a grant that
would allow them to use an old, closed and capped on-site landfill for a one-megawatt solar farm, which
would tie in to the Tennessee Valley Authority electrical grid and supply renewable power to the local
area.
To date, the Paducah Site has made no local partnerships with federal agencies or local jurisdictions for
collaboration for exploration of local climate change measures.
2.9 CONTINUOUS RELEASE REPORTING
Section 103(a) of CERCLA requires that hazardous substance releases in excess of a reportable quantity
be reported immediately to the National Response Center. Section 103(f)(2) provides relief from the
Section 103(a) reporting requirement for hazardous substance releases that are continuous, stable in
quantity and rate, and already have been reported. For such releases, notice must be given annually or at
such time there is any statistically significant increase in the quantity of hazardous substance released.
Release reporting is discussed in Section 2.7.
2.10 UNPLANNED RELEASES
In April 2014, approximately 25 gal of a 50% solution of propylene glycol was released to a gravel area at
the DUF6 Conversion Facility. KDOW Emergency Response Team documented the event under Incident
No. 20142003. The notification was made based on standard conditions of the KPDES permit.
Outfall 017 was sampled for propylene glycol immediately following the event; none was detected. Due
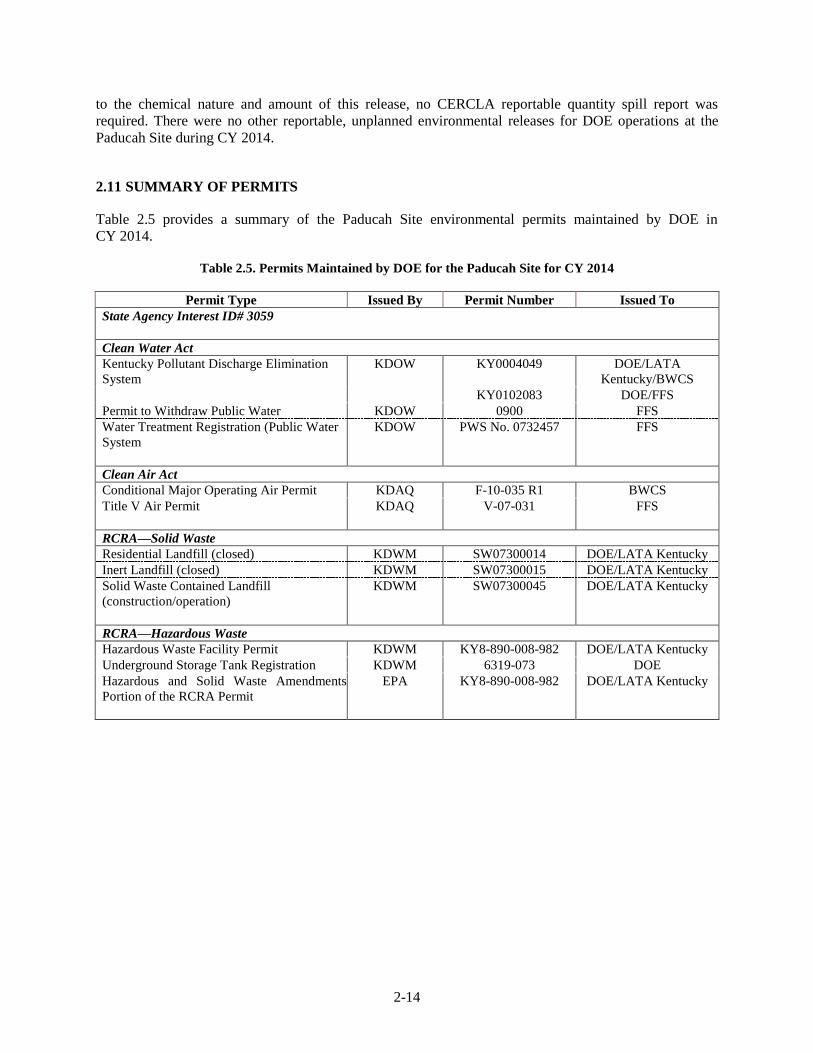
2-14
to the chemical nature and amount of this release, no CERCLA reportable quantity spill report was
required. There were no other reportable, unplanned environmental releases for DOE operations at the
Paducah Site during CY 2014.
2.11 SUMMARY OF PERMITS
Table 2.5 provides a summary of the Paducah Site environmental permits maintained by DOE in
CY 2014.
Table 2.5. Permits Maintained by DOE for the Paducah Site for CY 2014
Permit Type Issued By Permit Number Issued To
State Agency Interest ID# 3059
Clean Water Act
Kentucky Pollutant Discharge Elimination
System
KDOW KY0004049 DOE/LATA
Kentucky/BWCS
KY0102083 DOE/FFS
Permit to Withdraw Public Water KDOW 0900 FFS
Water Treatment Registration (Public Water
System
KDOW PWS No. 0732457 FFS
Clean Air Act
Conditional Major Operating Air Permit KDAQ F-10-035 R1 BWCS
Title V Air Permit KDAQ V-07-031 FFS
RCRA—Solid Waste
Residential Landfill (closed) KDWM SW07300014 DOE/LATA Kentucky
Inert Landfill (closed) KDWM SW07300015 DOE/LATA Kentucky
Solid Waste Contained Landfill
(construction/operation)
KDWM SW07300045 DOE/LATA Kentucky
RCRA—Hazardous Waste
Hazardous Waste Facility Permit KDWM KY8-890-008-982 DOE/LATA Kentucky
Underground Storage Tank Registration KDWM 6319-073 DOE
Hazardous and Solid Waste Amendments
Portion of the RCRA Permit
EPA KY8-890-008-982 DOE/LATA Kentucky
3-1
3. ENVIRONMENTAL MANAGEMENT SYSTEM
The EMS is designed to integrate environmental protection, environmental compliance, pollution
prevention, and continual improvement into work planning and execution throughout all work areas. The
Paducah Site EMS implements sound stewardship practices in the protection of land, air, water, and other
natural or cultural resources potentially impacted by their operations. The EMS objectives are integrated
into the Integrated Safety Management System established by the DOE Policy 450.4A, Safety
Management System Policy. The EMS for two of DOE’s contractors, LATA Kentucky and SST, was
audited and found to satisfy DOE requirements. The EMS for the two remaining contractors was under
development in 2014.
Environmental protection programs at the Paducah Site conform to the five core elements of the
International Organization for Standardization (ISO) EMS standard, ISO 14001. The major elements of
an effective EMS include policy, planning, implementation and operation, checking, and management
review. Through implementation of EMS, effective protection to workers, the surrounding communities,
and the environment can be achieved while meeting operating objectives that comply with legal and other
requirements. EMS feedback information is analyzed to determine the status of the EMS program relative
to implementation, integration, and effectiveness.
During 2014, DOE contractors were responsible for compliance with all applicable laws, regulations,
permit commitments, and other requirements, as defined in their respective contracts. Their
Environmental Policy Statements emphasize conservation and protection of environmental resources by
incorporating pollution prevention and environmental protection into the daily conduct of business. The
DOE contractors implemented this policy through the programs described in this document,
environmental cleanup, pollution prevention programs, and by integrating environmental protection,
environmental regulatory compliance, and continual improvement into the daily planning and
performance of work at the Paducah Site. The environmental policies are communicated to employees
through various methods. The DOE contractor project manager reviews and communicates the
commitments in the policy with all of the other members of the DOE contractor management team. The
policy is further communicated to employees and to subcontractors through sitewide communication,
EMS awareness training, publications, and EMS brochures.
The EMS environmental stewardship scorecard assesses agency performance in environmentally
preferable purchasing; environmental management system implementation; electronics stewardship; high
performance sustainable buildings; and environmental compliance management improvement. The EMS
environmental stewardship scorecard for the Paducah Site in FY 2014 was green (which indicates
standards for EMS implementation have been met).
DOE contractors at the Paducah Site are required to implement EMS requirements. The benefits of EMS
to the facility include (1) reduced risk to the facility mission; (2) improved fiscal efficiency and/or cost
avoidance; (3) heightened knowledge of environmental programs at all levels of the organization;
(4) empowerment of individuals to contribute to the improved environmental conditions at the site; and
(5) integration of the environment into organizational culture and operations. Employees have actively
recommended work controls to be used to protect the environment.
3.1 ENVIRONMENTAL OPERATING EXPERIENCE AND PERFORMANCE MEASUREMENT
DOE and its contractors are committed to enhancing environmental stewardship and to reducing any
impacts that site operations may cause to the environment. The Environmental Monitoring Program at the
3-2
Paducah Site consists of effluent monitoring, environmental surveillance, and air monitoring around the
plant. Requirements for routine environmental monitoring programs were established to measure and
monitor effluents from DOE operations and maintain surveillance on the effects of those operations on
the environment and public health through measurement, monitoring, and calculation. LATA Kentucky
implements the Environmental Monitoring Program for the Paducah Site documented in the
Environmental Monitoring Plan (EMP) (LATA Kentucky 2013a; LATA Kentucky 2015a). These plans
can be found at the following locations:
http://www.latakentucky.com/PublicDocuments/Environmental Monitoring Plan FY 2014/
http://www.latakentucky.com/PublicDocuments/Environmental Monitoring Plan FY 2015/
In addition to environmental monitoring documented in the EMP, BWCS also monitors radionuclide air
emissions as required by their air permit. The results of these programs are discussed in detail in
subsequent chapters of this ASER.
3.1.1 Site Sustainability Plan
In accordance with DOE Order 436.1 and EO 13514, this report provides information concerning the
requirements and responsibilities of managing sustainability on the Paducah Site including (1) to ensure
DOE carries out its missions in a sustainable manner that addresses national energy security and global
environmental challenges, while advancing sustainable, reliable and efficient energy for the future; (2) to
initiate wholesale cultural change to factor sustainability and GHG reductions into all of DOE’s corporate
management decisions; and (3) to ensure that DOE achieves the sustainability goals established in its SSP
pursuant to any applicable laws, regulations, EOs, sustainability initiatives, and related performance
scorecards.
In addition to making physical changes at the facility to increase sustainability, another objective is to
increase awareness in workers and the surrounding community about sustainability opportunities through
public outreach and training. Table 3.1 is taken from the Fiscal Year 2015 Site Sustainability Plan,
Paducah Gaseous Diffusion Plant and contains a brief summary of FY 2014 performance and long-term
planned actions to attain FY 2020 goals (SST 2014).
3.1.2 Waste Minimization/Pollution Prevention
The Waste Minimization/Pollution Prevention (WM/PP) Program at the Paducah Site provides guidance
and objectives for minimizing waste generation. The program is set up to comply with RCRA and the
Pollution Prevention Act, as well as applicable Commonwealth of Kentucky and EPA rules, DOE Orders,
EOs, and the STP. All of the Paducah Site projects are evaluated for WM/PP opportunities. Materials
recycled included oils, paper, toner cartridges, scrap metal (nonradiological), aluminum cans, batteries,
tires, electronics, cardboard, and plastics.
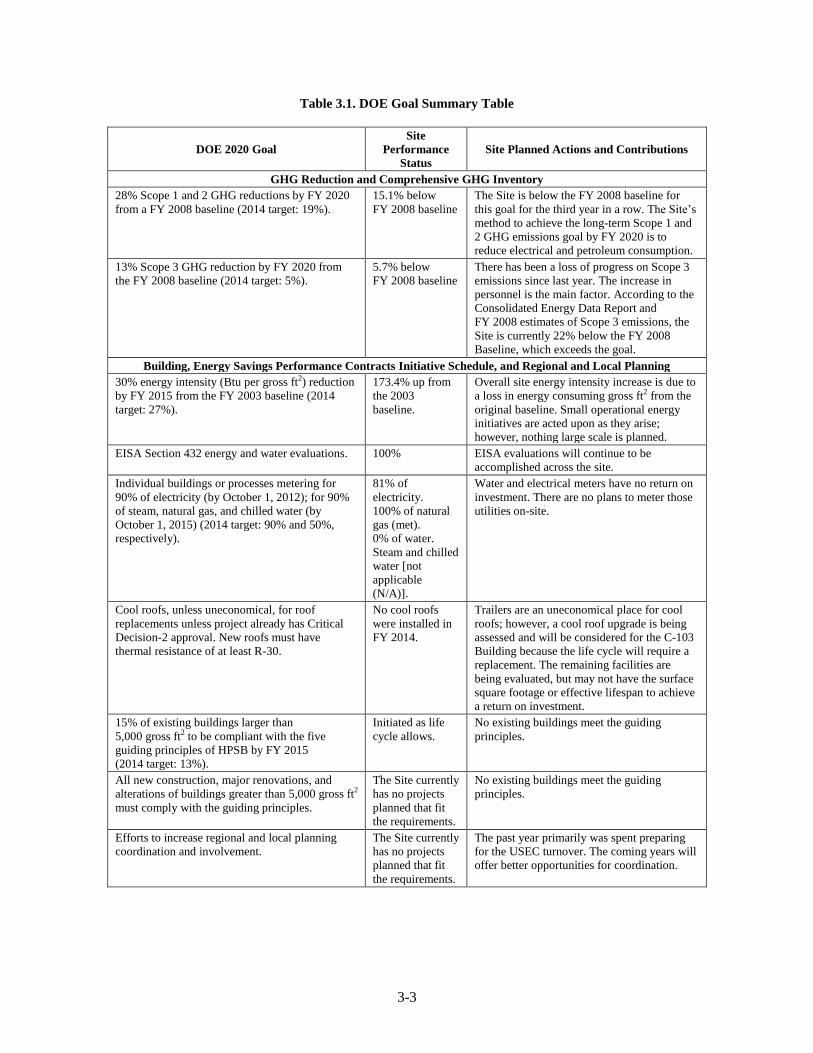
3-3
Table 3.1. DOE Goal Summary Table
DOE 2020 Goal
Site
Performance
Status
Site Planned Actions and Contributions
GHG Reduction and Comprehensive GHG Inventory
28% Scope 1 and 2 GHG reductions by FY 2020
from a FY 2008 baseline (2014 target: 19%).
15.1% below
FY 2008 baseline
The Site is below the FY 2008 baseline for
this goal for the third year in a row. The Site’s
method to achieve the long-term Scope 1 and
2 GHG emissions goal by FY 2020 is to
reduce electrical and petroleum consumption.
13% Scope 3 GHG reduction by FY 2020 from
the FY 2008 baseline (2014 target: 5%).
5.7% below
FY 2008 baseline
There has been a loss of progress on Scope 3
emissions since last year. The increase in
personnel is the main factor. According to the
Consolidated Energy Data Report and
FY 2008 estimates of Scope 3 emissions, the
Site is currently 22% below the FY 2008
Baseline, which exceeds the goal.
Building, Energy Savings Performance Contracts Initiative Schedule, and Regional and Local Planning
30% energy intensity (Btu per gross ft2) reduction
by FY 2015 from the FY 2003 baseline (2014
target: 27%).
173.4% up from
the 2003
baseline.
Overall site energy intensity increase is due to
a loss in energy consuming gross ft2 from the
original baseline. Small operational energy
initiatives are acted upon as they arise;
however, nothing large scale is planned.
EISA Section 432 energy and water evaluations. 100% EISA evaluations will continue to be
accomplished across the site.
Individual buildings or processes metering for
90% of electricity (by October 1, 2012); for 90%
of steam, natural gas, and chilled water (by
October 1, 2015) (2014 target: 90% and 50%,
respectively).
81% of
electricity.
100% of natural
gas (met).
0% of water.
Steam and chilled
water [not
applicable
(N/A)].
Water and electrical meters have no return on
investment. There are no plans to meter those
utilities on-site.
Cool roofs, unless uneconomical, for roof
replacements unless project already has Critical
Decision-2 approval. New roofs must have
thermal resistance of at least R-30.
No cool roofs
were installed in
FY 2014.
Trailers are an uneconomical place for cool
roofs; however, a cool roof upgrade is being
assessed and will be considered for the C-103
Building because the life cycle will require a
replacement. The remaining facilities are
being evaluated, but may not have the surface
square footage or effective lifespan to achieve
a return on investment.
15% of existing buildings larger than
5,000 gross ft2 to be compliant with the five
guiding principles of HPSB by FY 2015
(2014 target: 13%).
Initiated as life
cycle allows.
No existing buildings meet the guiding
principles.
All new construction, major renovations, and
alterations of buildings greater than 5,000 gross ft2
must comply with the guiding principles.
The Site currently
has no projects
planned that fit
the requirements.
No existing buildings meet the guiding
principles.
Efforts to increase regional and local planning
coordination and involvement.
The Site currently
has no projects
planned that fit
the requirements.
The past year primarily was spent preparing
for the USEC turnover. The coming years will
offer better opportunities for coordination.
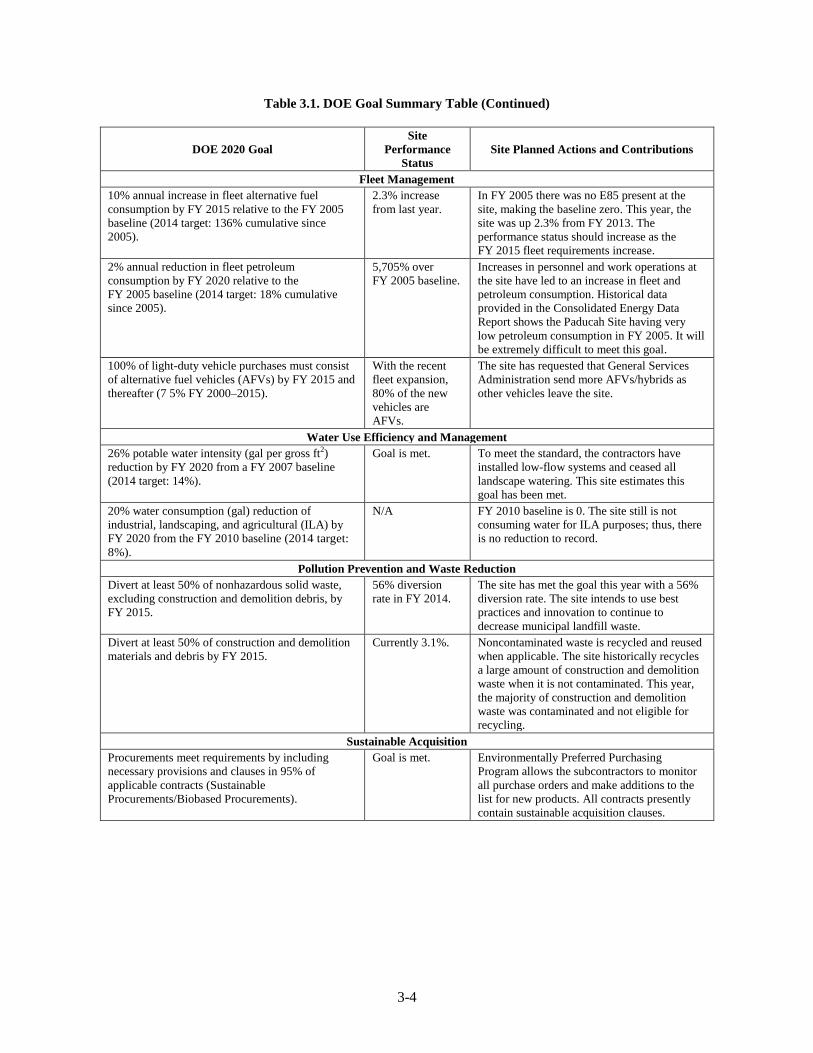
3-4
Table 3.1. DOE Goal Summary Table (Continued)
DOE 2020 Goal
Site
Performance
Status
Site Planned Actions and Contributions
Fleet Management
10% annual increase in fleet alternative fuel
consumption by FY 2015 relative to the FY 2005
baseline (2014 target: 136% cumulative since
2005).
2.3% increase
from last year.
In FY 2005 there was no E85 present at the
site, making the baseline zero. This year, the
site was up 2.3% from FY 2013. The
performance status should increase as the
FY 2015 fleet requirements increase.
2% annual reduction in fleet petroleum
consumption by FY 2020 relative to the
FY 2005 baseline (2014 target: 18% cumulative
since 2005).
5,705% over
FY 2005 baseline.
Increases in personnel and work operations at
the site have led to an increase in fleet and
petroleum consumption. Historical data
provided in the Consolidated Energy Data
Report shows the Paducah Site having very
low petroleum consumption in FY 2005. It will
be extremely difficult to meet this goal.
100% of light-duty vehicle purchases must consist
of alternative fuel vehicles (AFVs) by FY 2015 and
thereafter (7 5% FY 2000–2015).
With the recent
fleet expansion,
80% of the new
vehicles are
AFVs.
The site has requested that General Services
Administration send more AFVs/hybrids as
other vehicles leave the site.
Water Use Efficiency and Management
26% potable water intensity (gal per gross ft2)
reduction by FY 2020 from a FY 2007 baseline
(2014 target: 14%).
Goal is met. To meet the standard, the contractors have
installed low-flow systems and ceased all
landscape watering. This site estimates this
goal has been met.
20% water consumption (gal) reduction of
industrial, landscaping, and agricultural (ILA) by
FY 2020 from the FY 2010 baseline (2014 target:
8%).
N/A FY 2010 baseline is 0. The site still is not
consuming water for ILA purposes; thus, there
is no reduction to record.
Pollution Prevention and Waste Reduction
Divert at least 50% of nonhazardous solid waste,
excluding construction and demolition debris, by
FY 2015.
56% diversion
rate in FY 2014.
The site has met the goal this year with a 56%
diversion rate. The site intends to use best
practices and innovation to continue to
decrease municipal landfill waste.
Divert at least 50% of construction and demolition
materials and debris by FY 2015.
Currently 3.1%. Noncontaminated waste is recycled and reused
when applicable. The site historically recycles
a large amount of construction and demolition
waste when it is not contaminated. This year,
the majority of construction and demolition
waste was contaminated and not eligible for
recycling.
Sustainable Acquisition
Procurements meet requirements by including
necessary provisions and clauses in 95% of
applicable contracts (Sustainable
Procurements/Biobased Procurements).
Goal is met. Environmentally Preferred Purchasing
Program allows the subcontractors to monitor
all purchase orders and make additions to the
list for new products. All contracts presently
contain sustainable acquisition clauses.
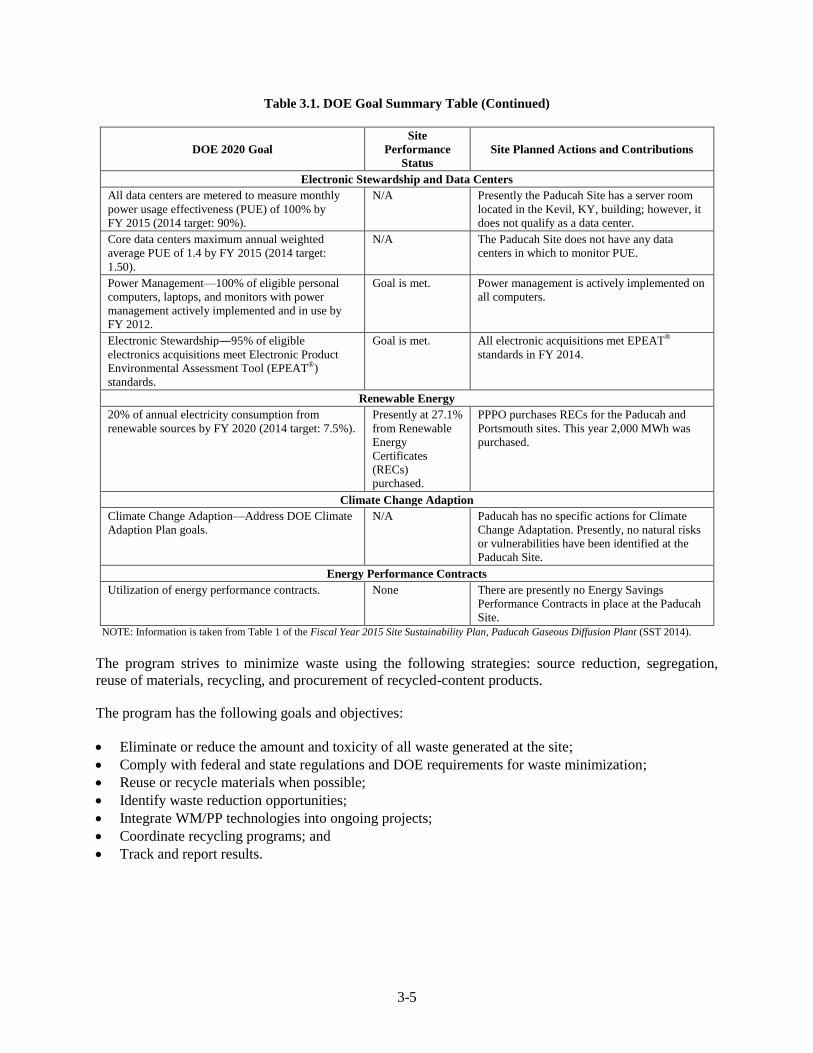
3-5
Table 3.1. DOE Goal Summary Table (Continued)
DOE 2020 Goal
Site
Performance
Status
Site Planned Actions and Contributions
Electronic Stewardship and Data Centers
All data centers are metered to measure monthly
power usage effectiveness (PUE) of 100% by
FY 2015 (2014 target: 90%).
N/A Presently the Paducah Site has a server room
located in the Kevil, KY, building; however, it
does not qualify as a data center.
Core data centers maximum annual weighted
average PUE of 1.4 by FY 2015 (2014 target:
1.50).
N/A The Paducah Site does not have any data
centers in which to monitor PUE.
Power Management—100% of eligible personal
computers, laptops, and monitors with power
management actively implemented and in use by
FY 2012.
Goal is met. Power management is actively implemented on
all computers.
Electronic Stewardship―95% of eligible
electronics acquisitions meet Electronic Product
Environmental Assessment Tool (EPEAT®)
standards.
Goal is met. All electronic acquisitions met EPEAT®
standards in FY 2014.
Renewable Energy
20% of annual electricity consumption from
renewable sources by FY 2020 (2014 target: 7.5%).
Presently at 27.1%
from Renewable
Energy
Certificates
(RECs)
purchased.
PPPO purchases RECs for the Paducah and
Portsmouth sites. This year 2,000 MWh was
purchased.
Climate Change Adaption
Climate Change Adaption—Address DOE Climate
Adaption Plan goals.
N/A Paducah has no specific actions for Climate
Change Adaptation. Presently, no natural risks
or vulnerabilities have been identified at the
Paducah Site.
Energy Performance Contracts
Utilization of energy performance contracts. None There are presently no Energy Savings
Performance Contracts in place at the Paducah
Site.
NOTE: Information is taken from Table 1 of the Fiscal Year 2015 Site Sustainability Plan, Paducah Gaseous Diffusion Plant (SST 2014).
The program strives to minimize waste using the following strategies: source reduction, segregation,
reuse of materials, recycling, and procurement of recycled-content products.
The program has the following goals and objectives:
Eliminate or reduce the amount and toxicity of all waste generated at the site;
Comply with federal and state regulations and DOE requirements for waste minimization;
Reuse or recycle materials when possible;
Identify waste reduction opportunities;
Integrate WM/PP technologies into ongoing projects;
Coordinate recycling programs; and
Track and report results.
3-6
The following are the accomplishments of the WM/PP Program in 2014.
(1) Placed emphasis on using and/or recycling by-products.
(2) Drained filters, reused any gasoline products, and recycled oil.
(3) Handled light bulbs as universal waste and recycled them.
(4) Purchased green tip (low mercury) bulbs.
(5) Continued to review purchases for substitute products with lesser hazard concerns and minimized
inventory of supplies to only what is necessary.
(6) Continued to reduce the amount of radioactive waste through recognized best work practices such as
allowing only material and tools required to perform work into radiologically posted areas.
(7) Verified recyclables to be free of radiological contamination prior to off-site release.
WM/PP efforts for the site are reported in DOE’s Consolidated Energy Data Report. During CY 2014, the
Paducah Site recycled 34,808 lb of materials.
3.1.3 Depleted Uranium Hexafluoride Cylinder Program
A product of the UE process, DUF6 is a solid at ambient temperatures and is stored in large metal
cylinders. At the end of 2014, the Paducah Site managed an inventory of approximately 53,200 cylinders
stored in outdoor facilities, commonly referred to as cylinder storage yards. The inventory varies from
time to time, as a result of DOE agreements to receive or market DUF6. The BWCS-managed cylinder
count at the end of 2014 includes the addition of approximately 8,000 cylinders transferred to DOE from
USEC in October 2014.
Stored as a crystalline solid at less than atmospheric pressure, when DUF6 is exposed to moisture in the
atmosphere, HF and uranyl fluoride form. The uranium by-products form a hard crystalline solid that acts
as a self-sealant within the storage cylinder. The acute hazard potential of DUF6 primarily is chemical
toxicity from any released HF.
The mission of the DUF6 Cylinder Program is to safely store the DOE-owned DUF6 inventory until its
ultimate disposition. DOE has an active cylinder management program that includes cylinder and cylinder
yard maintenance, routine inspections, and other programmatic activities such as cylinder corrosion
studies. The program maintains a cylinder inventory database that serves as a systematic repository for all
cylinder inspection data.
On April 15, 1999, DOE issued the Final Programmatic Environmental Impact Statement for Alternative
Strategies for the Long-Term Management and Use of Depleted Uranium Hexafluoride (DOE 1999). In
2002, DOE selected Uranium Disposition Services, LLC, (UDS) to design, build, and operate facilities at
Paducah, Kentucky, and Portsmouth, Ohio. The facilities would convert the inventory of DUF6 to
triuranium octaoxide (U3O8), a more stable form of uranium that is suitable for disposal or reuse, and HF
that will be sold for commercial use.
Consistent with Public Law 107-206, construction began in July 2004 and continued through 2008.
Physical construction of the facility was completed on December 19, 2008. On March 29, 2011, the
contract transitioned from UDS to BWCS. BWCS announced full operational status in September 2011.
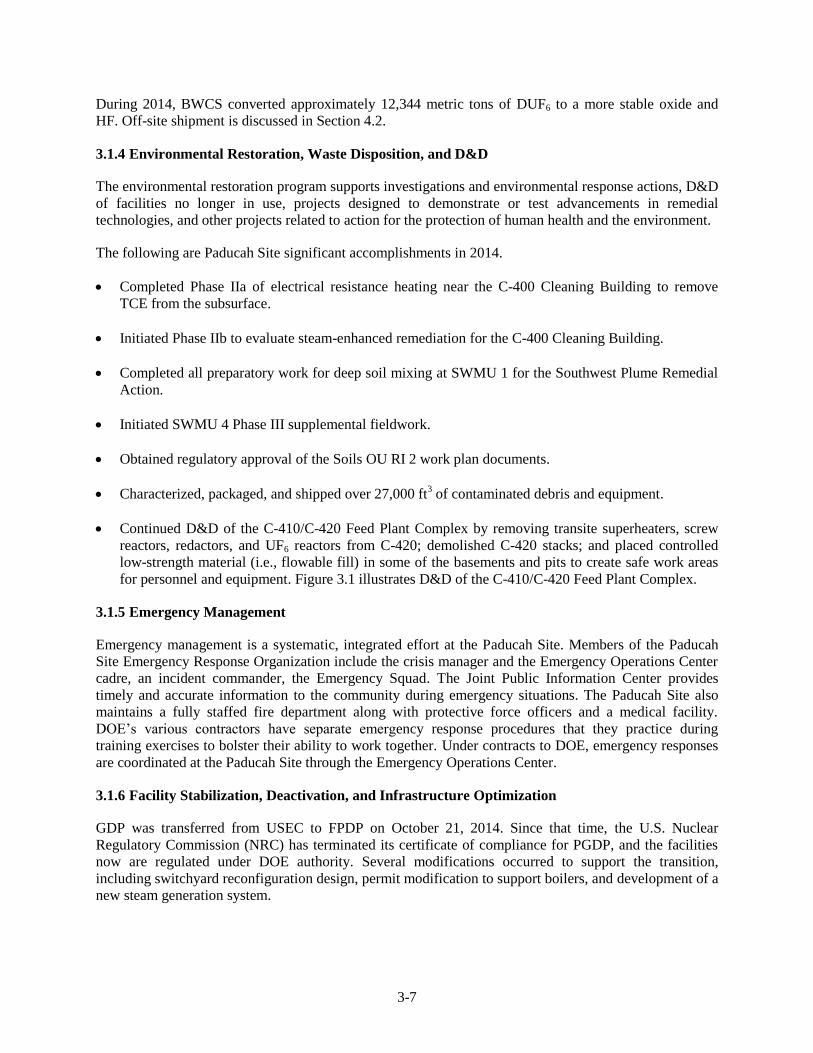
3-7
During 2014, BWCS converted approximately 12,344 metric tons of DUF6 to a more stable oxide and
HF. Off-site shipment is discussed in Section 4.2.
3.1.4 Environmental Restoration, Waste Disposition, and D&D
The environmental restoration program supports investigations and environmental response actions, D&D
of facilities no longer in use, projects designed to demonstrate or test advancements in remedial
technologies, and other projects related to action for the protection of human health and the environment.
The following are Paducah Site significant accomplishments in 2014.
Completed Phase IIa of electrical resistance heating near the C-400 Cleaning Building to remove
TCE from the subsurface.
Initiated Phase IIb to evaluate steam-enhanced remediation for the C-400 Cleaning Building.
Completed all preparatory work for deep soil mixing at SWMU 1 for the Southwest Plume Remedial
Action.
Initiated SWMU 4 Phase III supplemental fieldwork.
Obtained regulatory approval of the Soils OU RI 2 work plan documents.
Characterized, packaged, and shipped over 27,000 ft3 of contaminated debris and equipment.
Continued D&D of the C-410/C-420 Feed Plant Complex by removing transite superheaters, screw
reactors, redactors, and UF6 reactors from C-420; demolished C-420 stacks; and placed controlled
low-strength material (i.e., flowable fill) in some of the basements and pits to create safe work areas
for personnel and equipment. Figure 3.1 illustrates D&D of the C-410/C-420 Feed Plant Complex.
3.1.5 Emergency Management
Emergency management is a systematic, integrated effort at the Paducah Site. Members of the Paducah
Site Emergency Response Organization include the crisis manager and the Emergency Operations Center
cadre, an incident commander, the Emergency Squad. The Joint Public Information Center provides
timely and accurate information to the community during emergency situations. The Paducah Site also
maintains a fully staffed fire department along with protective force officers and a medical facility.
DOE’s various contractors have separate emergency response procedures that they practice during
training exercises to bolster their ability to work together. Under contracts to DOE, emergency responses
are coordinated at the Paducah Site through the Emergency Operations Center.
3.1.6 Facility Stabilization, Deactivation, and Infrastructure Optimization
GDP was transferred from USEC to FPDP on October 21, 2014. Since that time, the U.S. Nuclear
Regulatory Commission (NRC) has terminated its certificate of compliance for PGDP, and the facilities
now are regulated under DOE authority. Several modifications occurred to support the transition,
including switchyard reconfiguration design, permit modification to support boilers, and development of a
new steam generation system.

3-8
Figure 3.1. D&D of the C-410/C-420 Feed Plant Complex
3.2 AWARDS AND RECOGNITION
3.2.1 Public Awareness Program
A comprehensive Community Relations and Public Participation Program exists for DOE activities at the
Paducah Site (DOE 2013a). The purpose of the program is to provide the public with opportunities to
become involved in decisions relating to environmental issues at the site.
3.2.2 Community/Educational Outreach
DOE supported several educational and community outreach activities during 2014.
In February, DOE, along with several area and national businesses and entities, sponsored the Western
Kentucky Regional Science Bowl for area high schools and middle schools. Two area schools, Calloway
County High School and Lone Oak Middle School went on to compete nationally.
In August, DOE participated in a public meeting facilitated by NRC to explain the NRC process for
termination of the certificate authorizing uranium enrichment operations at PGDP. DOE presented the
transition of regulatory authority for PGDP from the NRC back to DOE.

3-9
Figure 3.2. DOE Contractor Personnel Demonstrated Groundwater and the
Effects on the Environment to Area Elementary and Middle School Students
In September and October,
personnel from LATA
Kentucky and teaming
partner S.M. Stoller Corp.
interacted with students at
Ballard County Elementary
School and McCracken
County Middle Schools to
demonstrate groundwater
sampling and discuss the
effects of groundwater
contamination on the
environment (Figure 3.2).
Scientists and samplers used
models, sampling tools,
videos, and illustrations to
help students connect
classroom science to real
world careers.
3.2.3 Citizens Advisory Board
The Paducah Citizens Advisory Board (CAB), a site-specific advisory board chartered by DOE under the
Federal Advisory Committees Act, completed its 18th full year of operation in September 2014. During
the calendar year, the CAB held five regular board meetings and additional subcommittee meetings.
The CAB includes six active subcommittees, which meet as necessary. The subcommittees review issues
for the following areas:
Burial Grounds
Waste Disposal Options
Historical Preservation
Integrated Priority List
Groundwater
Future Use/Adaptive Reuse
All meetings are open to the public and all regular board meetings are publicly advertised. In addition to
its voting members, the CAB also has liaison members representing EPA Region 4, KDWM, Kentucky
Cabinet for Health and Family Services, and WKWMA.
The CAB is composed of up to 18 members, chosen to reflect the diversity of gender, race, occupation,
views, and interests of persons living near the Paducah Site. The CAB is committed to reflecting the
concerns of the communities impacted by environmental management of the plant site. It meets
bimonthly to focus on early citizen participation in environmental cleanup priorities and related issues at
the DOE facility. Additional information concerning the CAB may be obtained at
www.pgdpcab.energy.gov.
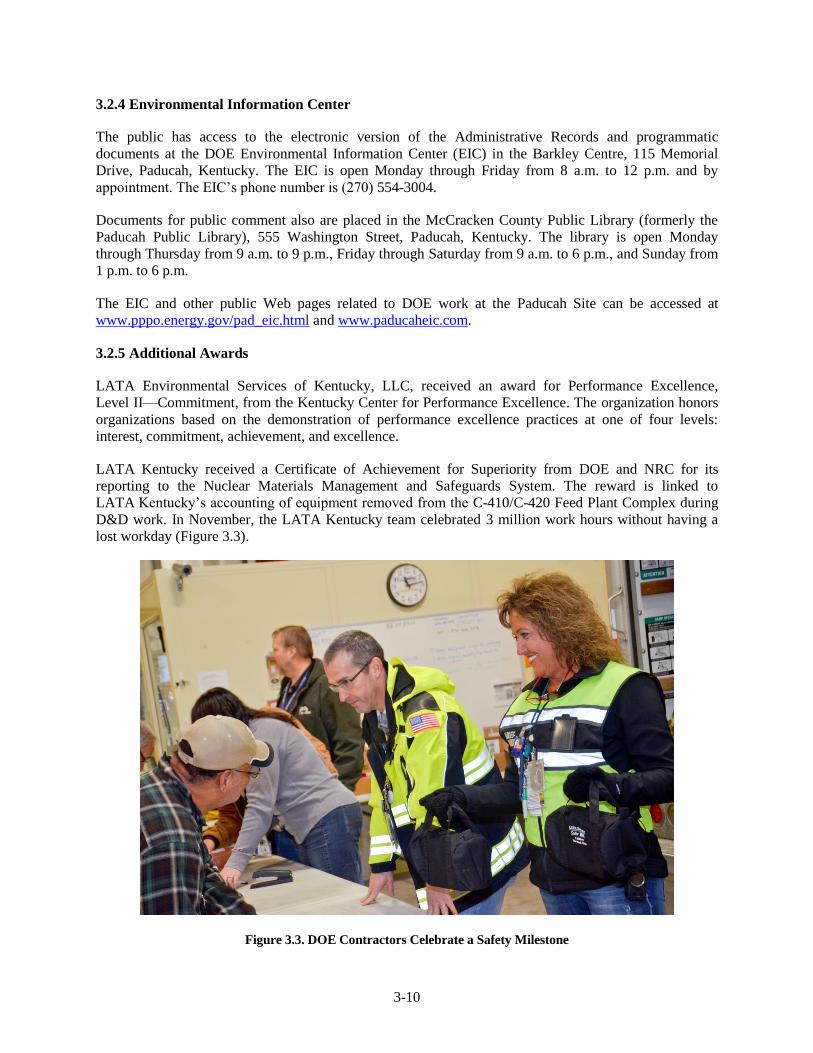
3-10
3.2.4 Environmental Information Center
The public has access to the electronic version of the Administrative Records and programmatic
documents at the DOE Environmental Information Center (EIC) in the Barkley Centre, 115 Memorial
Drive, Paducah, Kentucky. The EIC is open Monday through Friday from 8 a.m. to 12 p.m. and by
appointment. The EIC’s phone number is (270) 554-3004.
Documents for public comment also are placed in the McCracken County Public Library (formerly the
Paducah Public Library), 555 Washington Street, Paducah, Kentucky. The library is open Monday
through Thursday from 9 a.m. to 9 p.m., Friday through Saturday from 9 a.m. to 6 p.m., and Sunday from
1 p.m. to 6 p.m.
The EIC and other public Web pages related to DOE work at the Paducah Site can be accessed at
www.pppo.energy.gov/pad_eic.html and www.paducaheic.com.
3.2.5 Additional Awards
LATA Environmental Services of Kentucky, LLC, received an award for Performance Excellence,
Level II—Commitment, from the Kentucky Center for Performance Excellence. The organization honors
organizations based on the demonstration of performance excellence practices at one of four levels:
interest, commitment, achievement, and excellence.
LATA Kentucky received a Certificate of Achievement for Superiority from DOE and NRC for its
reporting to the Nuclear Materials Management and Safeguards System. The reward is linked to
LATA Kentucky’s accounting of equipment removed from the C-410/C-420 Feed Plant Complex during
D&D work. In November, the LATA Kentucky team celebrated 3 million work hours without having a
lost workday (Figure 3.3).
Figure 3.3. DOE Contractors Celebrate a Safety Milestone
4-1
4. ENVIRONMENTAL RADIOLOGICAL PROTECTION PROGRAM
AND DOSE ASSESSMENT
4.1 ENVIRONMENTAL RADIOLOGICAL MONITORING PROGRAM
Routine DOE operations at the Paducah Site result in releases of radioactive materials to the environment
by atmospheric and liquid pathways. These releases potentially result in a radiation exposure to the
public. In accordance with DOE Order 458.1, Radiation Protection of the Public and the Environment,
DOE has an environmental surveillance program that includes radiological monitoring of pathways which
may contribute to dose to the public. Surveillance includes analyses of surface water, groundwater,
sediment, direct radiation, and ambient air (LATA Kentucky 2013a; LATA Kentucky 2015a). DOE has
established dose limits for the public and biota. The dose limit to the public is 100 millirem (mrem) per
year summed over all sources of ionizing radiation and exposure pathways. Doses are to be optimized
through the application of ALARA principles so that DOE operations will not contribute significantly to
the average annual exposure. Doses to biota are constrained to 1 rad/day for aquatic organisms, 1 rad/day
for terrestrial plants, and 0.1 rad/day for terrestrial animals. To confirm that doses are below public and
biota dose limits, the Paducah Site calculates annual dose estimates using effluent release data,
environmental monitoring, and surveillance data combined with relevant site specific data (such as
meteorological conditions, population characteristics, and stream flows).
Surface water, effluent water, and sediment monitoring programs were impacted by the implementation
of DOE Order 458.1 in CY 2013 and those impacts continued in CY 2014. Modifications based on the
order were implemented to the sampling strategy for these programs. Sampling location changes included
the addition of sampling surface water near KPDES outfall locations. Sample parameters changed to
include the addition of radionuclide analysis at some surface water and sediment locations.
Because USEC ceased leasing production areas in October 2014, the enrichment facilities were returned
to DOE. Air emissions from the previously leased facilities are included as part of the dose limit
calculations for the airborne pathway. USEC had ten KPDES-permitted outfalls during their operational
time frame that were permitted by DOE/FPDP upon facility return in the last quarter of CY 2014. Surface
water is not used as a source of public drinking water on the DOE Reservation; however, data from these
outfalls are included as part the incidental surface water ingestion pathway. To assess fully the potential
dose to the public, a hypothetical set of characteristics was used to postulate an upper bound exposure
scenario. The actual dose received is considerably less than the hypothetical worse case calculated dose.
4.1.1 What is Dose?
Dose is the amount of energy absorbed by the human body as a result of a radioactive source; it is
measured in rem [which equals 0.01 sievert (Sv)] or in mrem, which is one-thousandth of a rem. These
exposures/intakes involve the transfer of energy from radiation to tissue and can result in tissue damage.
Exposures to radiation from radionuclides outside the body are called external exposures; exposures to
radiation from radionuclides inside the body are called internal exposures. This distinction is important
because external exposure occurs only as long as a person is near the radionuclide; simply leaving the
area of the source will stop the exposure. Internal exposure continues as long as the radionuclide remains
inside the body.
Members of the public are routinely exposed to natural and man-made sources of ionizing radiation. An
individual living in the U.S. is estimated to receive an average annual effective dose (ED) of about
620 mrem (6.2 mSv) (NCRP 2009). Half of the radiation dose to a member of the public, about
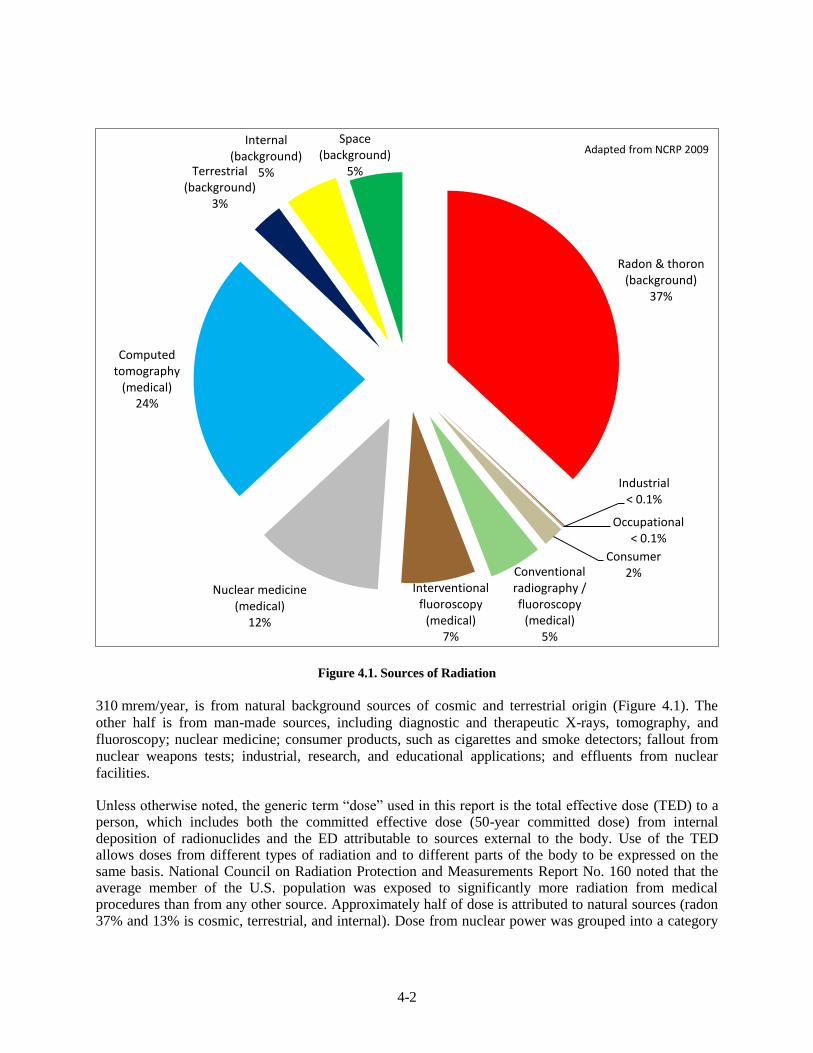
4-2
Figure 4.1. Sources of Radiation
310 mrem/year, is from natural background sources of cosmic and terrestrial origin (Figure 4.1). The
other half is from man-made sources, including diagnostic and therapeutic X-rays, tomography, and
fluoroscopy; nuclear medicine; consumer products, such as cigarettes and smoke detectors; fallout from
nuclear weapons tests; industrial, research, and educational applications; and effluents from nuclear
facilities.
Unless otherwise noted, the generic term “dose” used in this report is the total effective dose (TED) to a person, which includes both the committed effective dose (50-year committed dose) from internal deposition of radionuclides and the ED attributable to sources external to the body. Use of the TED allows doses from different types of radiation and to different parts of the body to be expressed on the same basis. National Council on Radiation Protection and Measurements Report No. 160 noted that the average member of the U.S. population was exposed to significantly more radiation from medical procedures than from any other source. Approximately half of dose is attributed to natural sources (radon 37% and 13% is cosmic, terrestrial, and internal). Dose from nuclear power was grouped into a category
Radon & thoron (background)
37%
Industrial < 0.1%
Occupational < 0.1%
Consumer 2% Conventional
radiography / fluoroscopy
(medical) 5%
Interventional fluoroscopy
(medical) 7%
Nuclear medicine (medical)
12%
Computed tomography
(medical) 24%
Terrestrial (background)
3%
Internal (background)
5%
Space (background)
5%
Adapted from NCRP 2009
4-3
comprising < 0.1%. The remaining dose was from medical exposures (approximately 48% of the total dose).
DOE has established dose limits to the public so that DOE operations will not contribute significantly to this average annual exposure. DOE Order 458.1 establishes 100 mrem/yr (1 mSv/yr) as the total annual dose limit to a member of the public. Each year, DOE operations at the Paducah Site contribute to the public dose through radiological releases and direct radiation. Emissions and effluents are controlled so that releases are maintained ALARA. To confirm that doses to the public and biota are below established limits, the Paducah Site calculates annual dose estimates using effluent release data, direct radiation monitoring data, and environmental monitoring data combined with relevant site specific data (such as meteorological conditions and population characteristics). These dose calculations use various computer codes that model the environmental dispersion of radionuclides that originate from on-site activities.
4.1.2 Radioactive Materials at the Paducah Site
Radioactive materials present at the Paducah Site are the result of processing raw and recycled uranium into nuclear materials. The Paducah Site associated radionuclides and their half-lives are listed below:
Uranium-234 (245,000 year half-life)
Uranium-235 (704,000,000 year half-life)
Uranium-238 (4,470,000,000 year half-life)
Thorium-230 (75,400 year half-life)
Technetium-99 (211,000 year half-life)
Plutonium-238 (87.7 year half-life)
Plutonium-239 (24,100 year half-life)
Neptunium-237 (2,140,000 year half-life)
Americium-241 (432 year half-life)
Cesium-137 (30.2 year half-life) Daughter products for the radionuclides listed above also are present at the Paducah Site in varying concentrations due to the multitude of chemical and physical separation processes historically used at the facility. The monitoring program for radioactivity in liquid and airborne effluents is described fully in the Paducah Site EMP (LATA Kentucky 2013a; LATA Kentucky 2015a).
4.1.3 What is an Exposure Pathway?
An exposure pathway consists of a route for released radioactive material to be transported by an environmental medium from a source to a receptor (person, animal or plant) (Figure 4.2). Routine operations at the Paducah Site release incidental radioactive materials into the environment through atmospheric and liquid discharges. The principal routes by which people potentially are exposed are the following:
Inhalation of gases and particulates;
Ingestion of vegetables, crops, venison, milk, and fish;
Ingestion of surface water and groundwater;
Skin absorption (also called dermal absorption); and
External exposure to ionizing radiation.
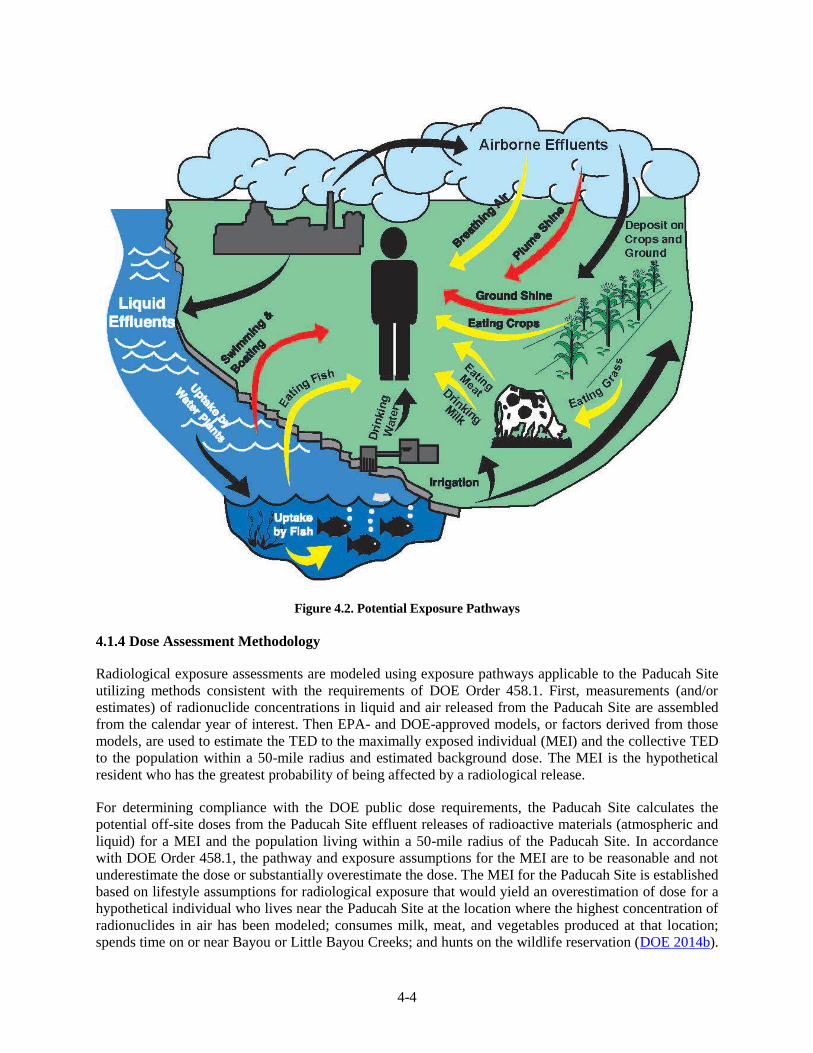
4-4
Figure 4.2. Potential Exposure Pathways
4.1.4 Dose Assessment Methodology
Radiological exposure assessments are modeled using exposure pathways applicable to the Paducah Site
utilizing methods consistent with the requirements of DOE Order 458.1. First, measurements (and/or
estimates) of radionuclide concentrations in liquid and air released from the Paducah Site are assembled
from the calendar year of interest. Then EPA- and DOE-approved models, or factors derived from those
models, are used to estimate the TED to the maximally exposed individual (MEI) and the collective TED
to the population within a 50-mile radius and estimated background dose. The MEI is the hypothetical
resident who has the greatest probability of being affected by a radiological release.
For determining compliance with the DOE public dose requirements, the Paducah Site calculates the
potential off-site doses from the Paducah Site effluent releases of radioactive materials (atmospheric and
liquid) for a MEI and the population living within a 50-mile radius of the Paducah Site. In accordance
with DOE Order 458.1, the pathway and exposure assumptions for the MEI are to be reasonable and not
underestimate the dose or substantially overestimate the dose. The MEI for the Paducah Site is established
based on lifestyle assumptions for radiological exposure that would yield an overestimation of dose for a
hypothetical individual who lives near the Paducah Site at the location where the highest concentration of
radionuclides in air has been modeled; consumes milk, meat, and vegetables produced at that location;
spends time on or near Bayou or Little Bayou Creeks; and hunts on the wildlife reservation (DOE 2014b).
4-5
This person does not drink groundwater because all persons downgradient of the Paducah Site are on
public water. Surface water is not used for irrigation of crops based on survey data results
(CH2M HILL 1991). Furthermore, Little Bayou Creek does not support aquatic life for consumption, and
few game size fish could be caught from Bayou Creek, except when there is a major influx of fish from
the Ohio River during a backwater event. Because of this, fish ingestion is not considered. Dose from
surface water is calculated assuming ingestion at the nearest public withdrawal location, Cairo, Illinois.
Dose from incidental sediment and surface water ingestion is based on assumptions for recreational use of
the Bayou and Little Bayou Creeks on the reservation. Dose associated with airborne releases are
calculated for the hypothetical MEI located at the nearest plant neighbor.
4.1.5 Air Monitoring and Estimated Dose from Airborne Effluents
DOE operations may result in airborne releases from various sources including CERCLA remedial
actions and fugitive emissions. Radionuclide sources at the Paducah Site evaluated in 2014 were the
NWPGS; the NEPCS ATU (The Northeast Plume Treatment Facility Cooling Tower is no longer an air
source due to reconfiguration of the groundwater treatment system); the DUF6 Conversion Facility;
fugitive dust source emissions; and other miscellaneous sources.
Radionuclide sources added to DOE operations as a result of USEC’s ceasing operations are the
following:
C-400 Group (which includes the following C-400 Cleaning Building sources: the C-400
decontamination spray booth, the C-400 No. 5 dissolver/rotary vacuum filter, and the C-400 laundry);
C-400 Cylinder Drying Station;
C-709/C-710 Laboratory Hoods;
C-310 Product Withdrawal Building stack;
Seal Exhaust/Wet Air Group (which includes the seal exhaust systems in the C-310 Product
Withdrawal Building, C-315 Tails Withdrawal Building, and the C-331, C-333, C-335, and C-337
Process Buildings and the wet air exhaust systems in the C-310 Product Withdrawal Building and the
C-331, C-333, C-335, and C-337 Process Buildings); and
C-360 Transfer Facility.
Specific activities that could generate fugitive emissions include transport and disposal of waste,
demolition of contaminated facilities such as the C-410 Feed Plant (demolished in 2014),
decontamination of contaminated equipment, and most environmental remediation activities. Ambient air
monitoring, which monitors fugitive emissions from all Paducah Site operations (including DUF6
Conversion Facility operations), is conducted using nine continuous air monitors surrounding the Paducah
Site reservation. One of these air monitors collects data from a background location. See Figure 4.3 for air
sampling locations. Radiological analytes are presented in the FY 2014 and FY 2015 EMP
(LATA Kentucky 2013a; LATA Kentucky 2015a).
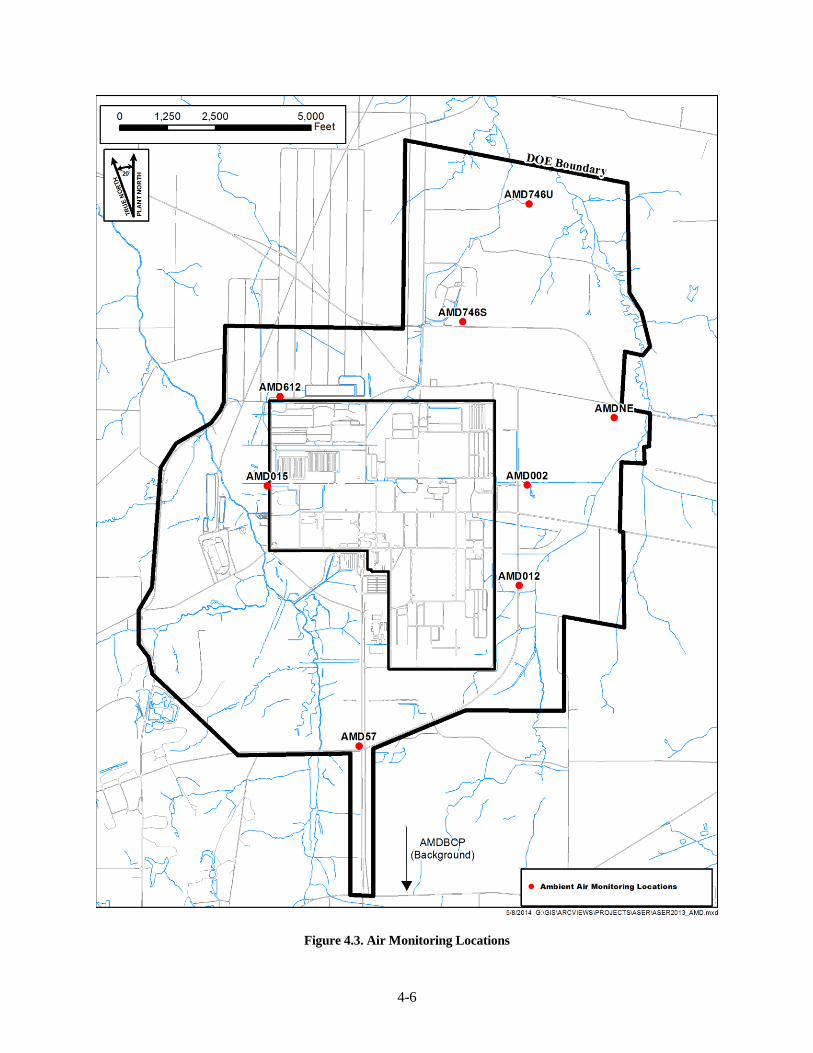
4-6
Figure 4.3. Air Monitoring Locations
4-7
Airborne radionuclide emissions are regulated by EPA under the Clean Air Act and its implementing
regulations. DOE facilities are subject to 40 CFR Part 61, Subpart H, NESHAP, which contains the
national emission standards for radionuclides other than radon from DOE facilities. The applicable
standard is a maximum of 10 mrem (0.1 mSv) effective dose equivalent (EDE)4 to any member of the
public in any year.
Airborne radioactive materials released in 2014 from stacks and diffuse sources on the Paducah Site
(Table 4.1) were modeled using the EPA-approved CAP-88 computer program. This air dispersion model
estimates EDEs based on the ingestion, inhalation, air immersion, and ground surface pathways.
Site-specific data for CY 2014 (radionuclide releases in curies per year) were input into the CAP-88
program, as were on-site meteorological data. Table 4.1 shows the estimates of radionuclide atmospheric
releases in curies (i.e., units of radioactivity), Table 4.2 provides the EDE to the MEI for each individual
point source.
The hypothetical MEI was calculated to potentially receive an EDE of 0.0018 mrem, which is well below
the NESHAP standard of 10 mrem. The dose is one-tenth of that estimated in 2013 and is due to USEC’s
ceasing operations. Based upon 2010 population census data, the collective ED to the entire population
within 50 miles of the Paducah Site is shown in Table 4.3, as estimated by the CAP-88 program.
A complete summary of this emissions data can be found in the National Emissions Standard for
Hazardous Air Pollutants Annual Report for 2014 (LATA Kentucky 2015c).
4.1.6 Liquid Discharge Monitoring and Estimated Dose from Liquid Effluents
4.1.6.1 Surface water
In general, radioactive contaminants released to surface water may remain dissolved or suspended in
surface water, deposited in sediment, deposited on ground or vegetation by irrigation, absorbed into plants
and animals, or may infiltrate to the groundwater.
Surface water leaving the Paducah Site includes rainfall runoff from cylinder yards and landfills and
effluent from site processes (e.g., the C-612 NWPGS and the C-616 Wastewater Treatment Facility). The
discharges from the Paducah Site flow into Bayou and Little Bayou Creeks, which then flow into the
Ohio River.
DOE Order 458.1 requires the control and management of radionuclides from DOE activities in liquid
discharges and sets guidelines for allowable concentrations of radionuclides in effluents to protect public
health. This protection is achieved at the Paducah Site by meeting DOE-STD-1196-2011, Derived
Concentration Technical Standard (DCS), for ingestion limits (DOE 2011).
The DCS value for an isotope is the concentration of the isotope in drinking water that is calculated
(derived) to result in an annual dose of 100 mrem to a person. That is, if the person’s entire annual
drinking water intake contained a radioactive isotope at the DCS level, that person would receive
100 mrem. In reality, people do not intentionally drink any water from surface streams in the area
surrounding the Paducah Site; therefore, the allowable concentrations for the DCSs result in a dose that is
higher than a person would actually receive. The DCS is different for each isotope because of the
differences in radiation type, radioactive energy, and half-life.
4 For radionuclides at the Paducah Site, the EDE is equivalent to the ED.
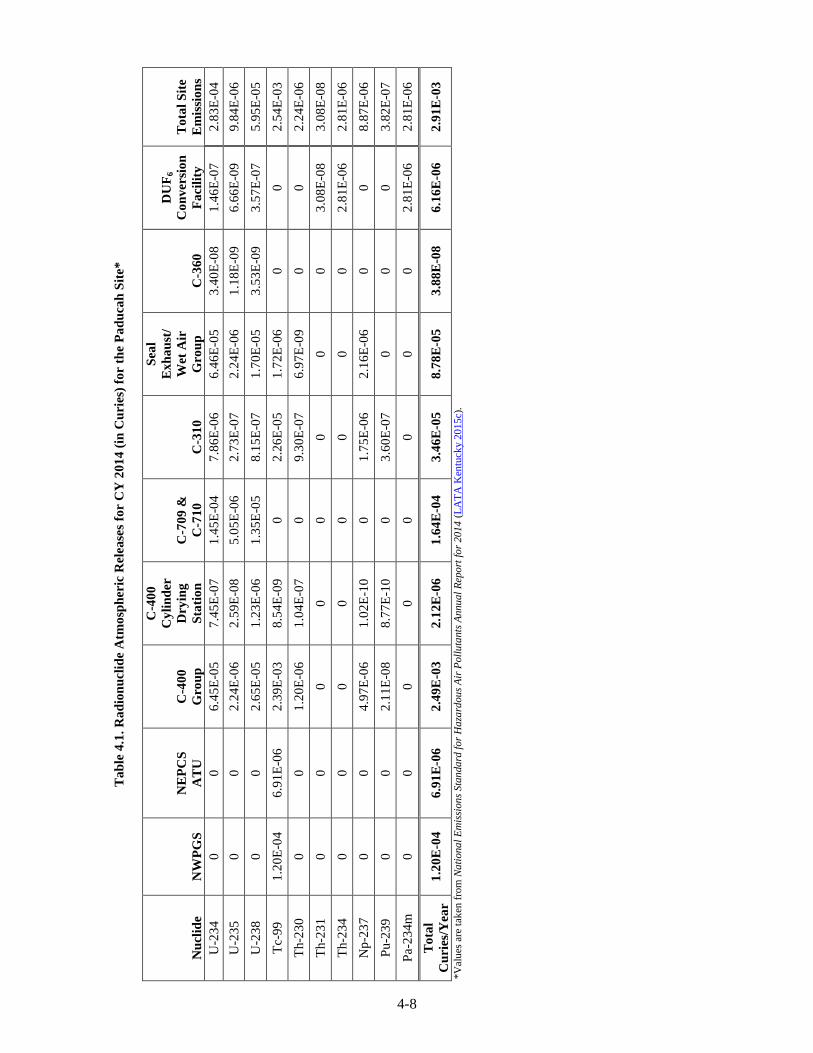
4-8
Ta
ble
4.1
. R
ad
ion
ucl
ide
Atm
osp
her
ic R
elea
ses
for
CY
201
4 (
in C
uri
es)
for
the
Pa
du
cah
Sit
e*
Nu
clid
e
NW
PG
S
NE
PC
S
AT
U
C-4
00
Gro
up
C-4
00
Cy
lin
der
Dry
ing
Sta
tio
n
C-7
09
&
C-7
10
C-3
10
Sea
l
Ex
ha
ust
/
Wet
Air
Gro
up
C
-36
0
DU
F6
Co
nv
ersi
on
Fa
cili
ty
To
tal
Sit
e
Em
issi
on
s
U-2
34
0
0
6
.45
E-0
5
7.4
5E
-07
1.4
5E
-04
7.8
6E
-06
6.4
6E
-05
3.4
0E
-08
1.4
6E
-07
2.8
3E
-04
U-2
35
0
0
2
.24
E-0
6
2.5
9E
-08
5.0
5E
-06
2.7
3E
-07
2.2
4E
-06
1.1
8E
-09
6.6
6E
-09
9.8
4E
-06
U-2
38
0
0
2
.65
E-0
5
1.2
3E
-06
1.3
5E
-05
8.1
5E
-07
1.7
0E
-05
3.5
3E
-09
3.5
7E
-07
5.9
5E
-05
Tc-
99
1.2
0E
-04
6.9
1E
-06
2.3
9E
-03
8.5
4E
-09
0
2.2
6E
-05
1.7
2E
-06
0
0
2.5
4E
-03
Th-2
30
0
0
1
.20
E-0
6
1.0
4E
-07
0
9.3
0E
-07
6.9
7E
-09
0
0
2.2
4E
-06
Th-2
31
0
0
0
0
0
0
0
0
3.0
8E
-08
3.0
8E
-08
Th-2
34
0
0
0
0
0
0
0
0
2
.81
E-0
6
2.8
1E
-06
Np
-23
7
0
0
4.9
7E
-06
1.0
2E
-10
0
1.7
5E
-06
2.1
6E
-06
0
0
8.8
7E
-06
Pu-2
39
0
0
2
.11
E-0
8
8.7
7E
-10
0
3.6
0E
-07
0
0
0
3.8
2E
-07
Pa-
23
4m
0
0
0
0
0
0
0
0
2
.81
E-0
6
2.8
1E
-06
To
tal
Cu
ries
/Yea
r
1.2
0E
-04
6.9
1E
-06
2.4
9E
-03
2.1
2E
-06
1.6
4E
-04
3.4
6E
-05
8.7
8E
-05
3.8
8E
-08
6.1
6E
-06
2.9
1E
-03
*V
alu
es a
re t
aken
fro
m N
ati
ona
l E
mis
sion
s S
tan
da
rd f
or
Ha
zard
ou
s A
ir P
oll
uta
nts
Annu
al
Rep
ort
fo
r 20
14
(L
AT
A K
entu
cky 2
01
5c)
.
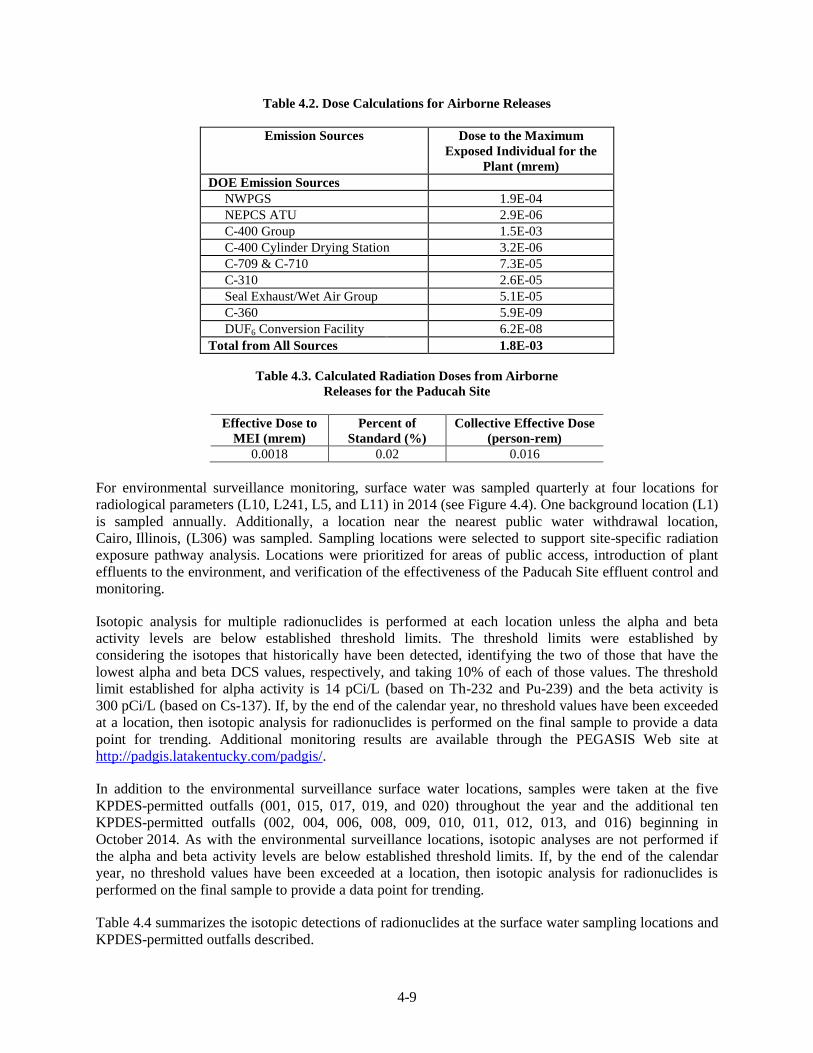
4-9
Table 4.2. Dose Calculations for Airborne Releases
Emission Sources Dose to the Maximum
Exposed Individual for the
Plant (mrem)
DOE Emission Sources
NWPGS 1.9E-04
NEPCS ATU 2.9E-06
C-400 Group 1.5E-03
C-400 Cylinder Drying Station 3.2E-06
C-709 & C-710 7.3E-05
C-310 2.6E-05
Seal Exhaust/Wet Air Group 5.1E-05
C-360 5.9E-09
DUF6 Conversion Facility 6.2E-08
Total from All Sources 1.8E-03
Table 4.3. Calculated Radiation Doses from Airborne
Releases for the Paducah Site
Effective Dose to
MEI (mrem)
Percent of
Standard (%)
Collective Effective Dose
(person-rem)
0.0018 0.02 0.016
For environmental surveillance monitoring, surface water was sampled quarterly at four locations for
radiological parameters (L10, L241, L5, and L11) in 2014 (see Figure 4.4). One background location (L1)
is sampled annually. Additionally, a location near the nearest public water withdrawal location,
Cairo, Illinois, (L306) was sampled. Sampling locations were selected to support site-specific radiation
exposure pathway analysis. Locations were prioritized for areas of public access, introduction of plant
effluents to the environment, and verification of the effectiveness of the Paducah Site effluent control and
monitoring.
Isotopic analysis for multiple radionuclides is performed at each location unless the alpha and beta
activity levels are below established threshold limits. The threshold limits were established by
considering the isotopes that historically have been detected, identifying the two of those that have the
lowest alpha and beta DCS values, respectively, and taking 10% of each of those values. The threshold
limit established for alpha activity is 14 pCi/L (based on Th-232 and Pu-239) and the beta activity is
300 pCi/L (based on Cs-137). If, by the end of the calendar year, no threshold values have been exceeded
at a location, then isotopic analysis for radionuclides is performed on the final sample to provide a data
point for trending. Additional monitoring results are available through the PEGASIS Web site at
http://padgis.latakentucky.com/padgis/.
In addition to the environmental surveillance surface water locations, samples were taken at the five
KPDES-permitted outfalls (001, 015, 017, 019, and 020) throughout the year and the additional ten
KPDES-permitted outfalls (002, 004, 006, 008, 009, 010, 011, 012, 013, and 016) beginning in
October 2014. As with the environmental surveillance locations, isotopic analyses are not performed if
the alpha and beta activity levels are below established threshold limits. If, by the end of the calendar
year, no threshold values have been exceeded at a location, then isotopic analysis for radionuclides is
performed on the final sample to provide a data point for trending.
Table 4.4 summarizes the isotopic detections of radionuclides at the surface water sampling locations and
KPDES-permitted outfalls described.
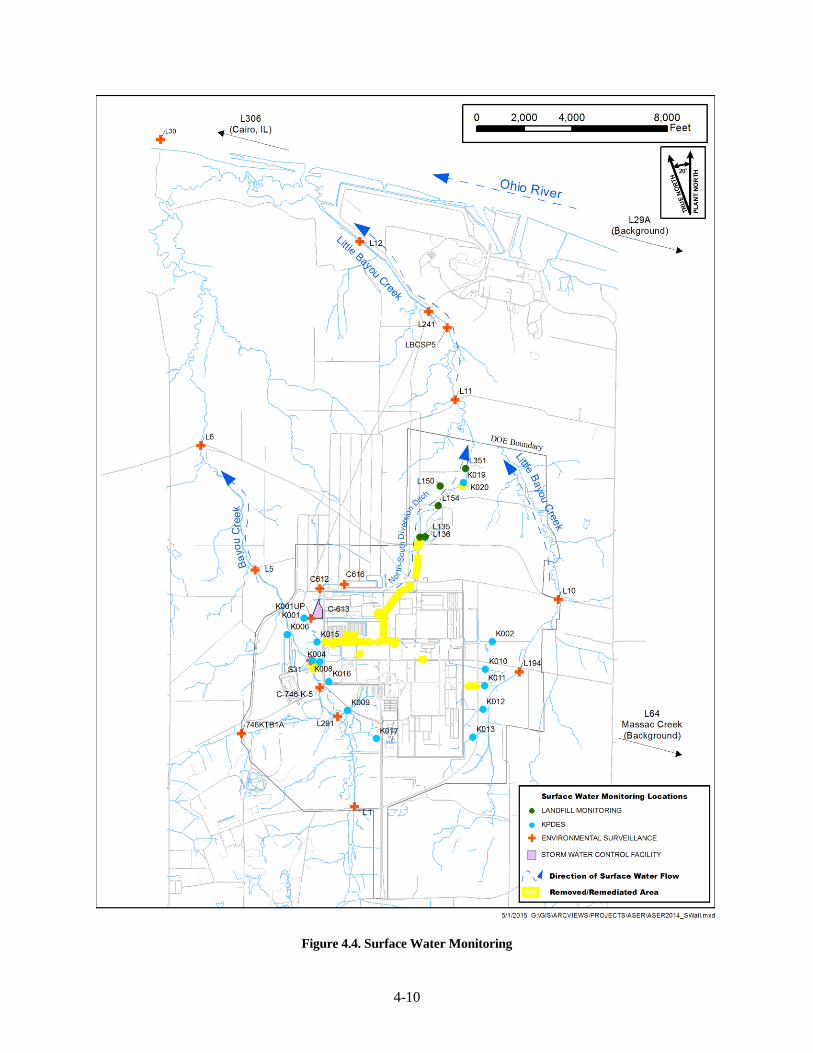
4-10
Figure 4.4. Surface Water Monitoring
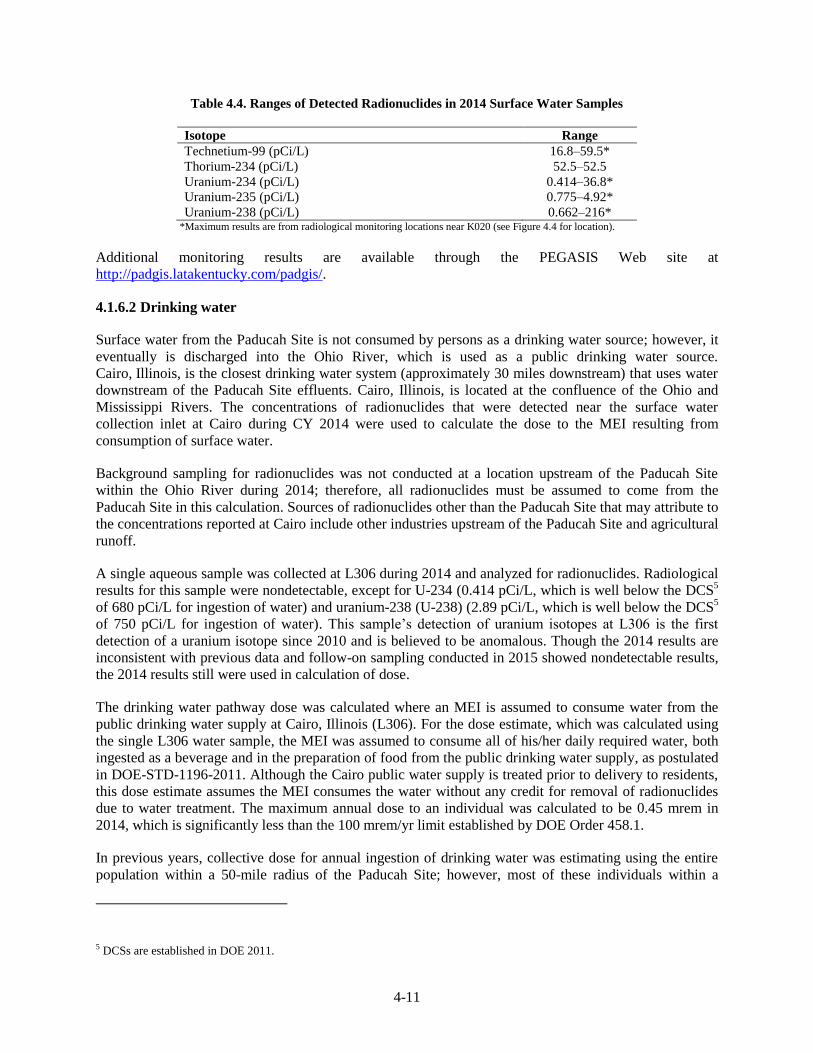
4-11
Table 4.4. Ranges of Detected Radionuclides in 2014 Surface Water Samples
Isotope Range
Technetium-99 (pCi/L) 16.8–59.5*
Thorium-234 (pCi/L) 52.5–52.5
Uranium-234 (pCi/L) 0.414–36.8*
Uranium-235 (pCi/L) 0.775–4.92*
Uranium-238 (pCi/L) 0.662–216* *Maximum results are from radiological monitoring locations near K020 (see Figure 4.4 for location).
Additional monitoring results are available through the PEGASIS Web site at
http://padgis.latakentucky.com/padgis/.
4.1.6.2 Drinking water
Surface water from the Paducah Site is not consumed by persons as a drinking water source; however, it
eventually is discharged into the Ohio River, which is used as a public drinking water source.
Cairo, Illinois, is the closest drinking water system (approximately 30 miles downstream) that uses water
downstream of the Paducah Site effluents. Cairo, Illinois, is located at the confluence of the Ohio and
Mississippi Rivers. The concentrations of radionuclides that were detected near the surface water
collection inlet at Cairo during CY 2014 were used to calculate the dose to the MEI resulting from
consumption of surface water.
Background sampling for radionuclides was not conducted at a location upstream of the Paducah Site
within the Ohio River during 2014; therefore, all radionuclides must be assumed to come from the
Paducah Site in this calculation. Sources of radionuclides other than the Paducah Site that may attribute to
the concentrations reported at Cairo include other industries upstream of the Paducah Site and agricultural
runoff.
A single aqueous sample was collected at L306 during 2014 and analyzed for radionuclides. Radiological
results for this sample were nondetectable, except for U-234 (0.414 pCi/L, which is well below the DCS5
of 680 pCi/L for ingestion of water) and uranium-238 (U-238) (2.89 pCi/L, which is well below the DCS5
of 750 pCi/L for ingestion of water). This sample’s detection of uranium isotopes at L306 is the first
detection of a uranium isotope since 2010 and is believed to be anomalous. Though the 2014 results are
inconsistent with previous data and follow-on sampling conducted in 2015 showed nondetectable results,
the 2014 results still were used in calculation of dose.
The drinking water pathway dose was calculated where an MEI is assumed to consume water from the
public drinking water supply at Cairo, Illinois (L306). For the dose estimate, which was calculated using
the single L306 water sample, the MEI was assumed to consume all of his/her daily required water, both
ingested as a beverage and in the preparation of food from the public drinking water supply, as postulated
in DOE-STD-1196-2011. Although the Cairo public water supply is treated prior to delivery to residents,
this dose estimate assumes the MEI consumes the water without any credit for removal of radionuclides
due to water treatment. The maximum annual dose to an individual was calculated to be 0.45 mrem in
2014, which is significantly less than the 100 mrem/yr limit established by DOE Order 458.1.
In previous years, collective dose for annual ingestion of drinking water was estimating using the entire
population within a 50-mile radius of the Paducah Site; however, most of these individuals within a
5 DCSs are established in DOE 2011.
4-12
50-mile radius of the Paducah Site obtain their daily drinking water from sources other than those
downgradient of the Paducah Site (see Sections 4.1.4 and 6.2). For 2014, an estimated collective dose has
been calculated by multiplying the dose to the MEI from annual ingestion of drinking water from the
Cairo supply (prior to treatment) by the estimated number of residents of Cairo in 2010 (2,830 persons)
(Moonshadow Mobile 2015), which resulted in a representative collective dose of 1.27 person-rem.
4.1.6.3 Incidental ingestion of surface water
Dose to the hypothetical MEI is calculated based on incidental ingestion of surface water due to wading
or swimming in Bayou and Little Bayou Creeks and their tributaries. The assumptions based on Methods
for Conducting Risk Assessments and Risk Evaluation are that a recreator may swim or wade 45 days a
year, for 2.6 hours a day, with an incidental ingestion of 0.05 liters per hour and be in different locations
throughout the wildlife management area (DOE 2014b). The highest monthly surface water results from
the various sampling locations are utilized to calculate the bounding dose to the MEI. The annual dose to
the MEI from incidental ingestion of surface water is 0.14 mrem/year.
Collective dose is not calculated for the incidental ingestion pathway due to the lack of a plausible
exposure scenario. This pathway is more likely to involve individuals; therefore, it is more suited for MEI
dose calculation.
4.1.6.4 Landfill leachate
During CY 2014, 1,000 tons of waste from six different waste streams was disposed of in the
C-746-U Landfill. The waste included building demolition and asbestos removal debris from the C-410
Feed Plant, soils, personal protective equipment, investigation-derived wastes, and other various items.
Authorized Limits have been established for the C-746-U Landfill and, as a result, contaminated material
may be disposed of if it is below acceptable levels. DOE reviews and authorizes disposal of each waste
stream that possesses residual radioactivity to ensure accurate inventory control is maintained. Leachate
from the landfill is sampled routinely and compared to the DCSs set forth by DOE (DOE 2011).
4.1.6.5 Groundwater
DOE has numerous groundwater MWs more fully described in Chapter 6. Groundwater wells that
supplied drinking water downgradient from the Paducah Site have been replaced with public drinking
water, resulting in the loss of that exposure route. A drinking water pathway for consumption of surface
water at the nearest public drinking water source [Ohio River at Cairo, Illinois (L306)] is included in dose
calculations for surface water. Because groundwater is not used as a drinking water source (or for any
other use by residents), it is not considered in the calculation of dose to the MEI. Similarly, it is not
considered in the calculation of cumulative dose to the surrounding population.
4.1.7 Sediment Monitoring and Estimated Dose
Sediment is an important constituent of the aquatic environment. Radionuclides transported by water can
absorb on suspended organic and inorganic solids or be assimilated by plants and animals. Suspended
solids, dead biota, and excreta settle to the bottom and become part of the organic substrata that support
the bottom-dwelling community of organisms. Thus, sediments can play a significant role in aquatic
ecological impacts by serving as a repository for radioactive substances that pass via bottom-feeding biota
to the higher trophic levels thus creating the need for sediment data.
A single sediment sample can represent information that would require a large number of water samples,
spaced over a period of time, to reconstruct. Sediment acts to collect, concentrate, and store specific kinds
4-13
of contaminants at specific locations. Concentrations of contaminants in sediments represent integrated
measures of aqueous contaminant concentrations over some preceding period of time.
4.1.7.1 Sediment Surveillance Program
Sediment sampling at the Paducah Site in CY 2014 included radiological and nonradiological constituents
(LATA Kentucky 2013a; LATA Kentucky 2015a). This sampling occurred in June 2014. Sampling
locations have been selected to facilitate the site-specific radiation exposure pathway analysis and to
provide an indication of the accumulation of undissolved radionuclides in the aquatic environment
(Figure 4.5). Locations were prioritized for areas of public access, introduction of plant effluents to the
environment, any unplanned release, and verification of the effectiveness of the Paducah Site effluent
monitoring.
Sediment radiological analytical results are summarized in Table 4.5 and also may be found on the
PEGASIS Web site at http://padgis.latakentucky.com/padgis/. The radiological results for CY 2014 are
similar in magnitude to those measured during previous years. Overall, radiological concentrations in
sediment are near background concentrations at locations S33 and S34 (Figure 4.5). Locations S1, S2, and
S27 have exhibited concentrations of analyzed radionuclides above background. Location S1 is located on
Bayou Creek within the DOE boundary surrounding the Paducah Site. Location S2 is located downstream
at Little Bayou Creek near the DOE boundary. Location S27 is located within Little Bayou Creek just
north of the DOE Paducah Site boundary. Overall, uranium activity is above background in Little Bayou
Creek and Bayou Creek near and downstream of the plant site. Other radionuclides, although present, are
not of concern.
4.1.7.2 Sediment Dose
For purposes of calculating dose to the hypothetical MEI, it is postulated that exposure to contaminated
sediment in Bayou Creek and Little Bayou Creek could occur during hunting or other recreational
activities. Exposure is possible through incidental ingestion of contaminated sediment. The plausible
ingestion assumption consists of an adult individual (i.e., an Adult Recreational User) who would wade
around at one creek location every other day during the hunting season (104 days/year) and ingest a small
amount of sediment during each visit (100 mg/day). A dose is then calculated based on the radionuclide
activity and the amount of exposure via ingestion. Exposure is calculated using the methods presented in
the Methods for Conducting Risk Assessments and Risk Evaluation (DOE 2014b), which includes the
ingestion, inhalation, and external gamma pathways. Table A.8 of this document provides site-specific
soil screening levels for receptors due to site-related radionuclides. Results from location S20 are
assumed to be background and are subtracted from sample results to arrive at a dose associated with site
releases. The downstream location with the maximum dose is assumed to represent the dose received
from this pathway by the maximally exposed individual from the exposure scenario.
Doses are calculated for ingestion of sediments for both Bayou Creek and Little Bayou Creek using the
radiological results for sediment surveillance samples for CY 2014. The highest annual dose was
calculated to be at location S2 (0.052 mrem/yr), downstream at Little Bayou Creek, This dose calculation
is based on the assumption that a person continually returns to the same location (i.e., S2) although this is
an unlikely scenario because the area currently is posted for contamination control in accordance with
10 CFR § 835 Occupational Radiation Protection. A comparison of sediment sampling data is provided
in Table 4.5. This exposure pathway is the major contributor to the dose received by the MEI. Dose
results for sediment sample locations are provided in Table 4.6.
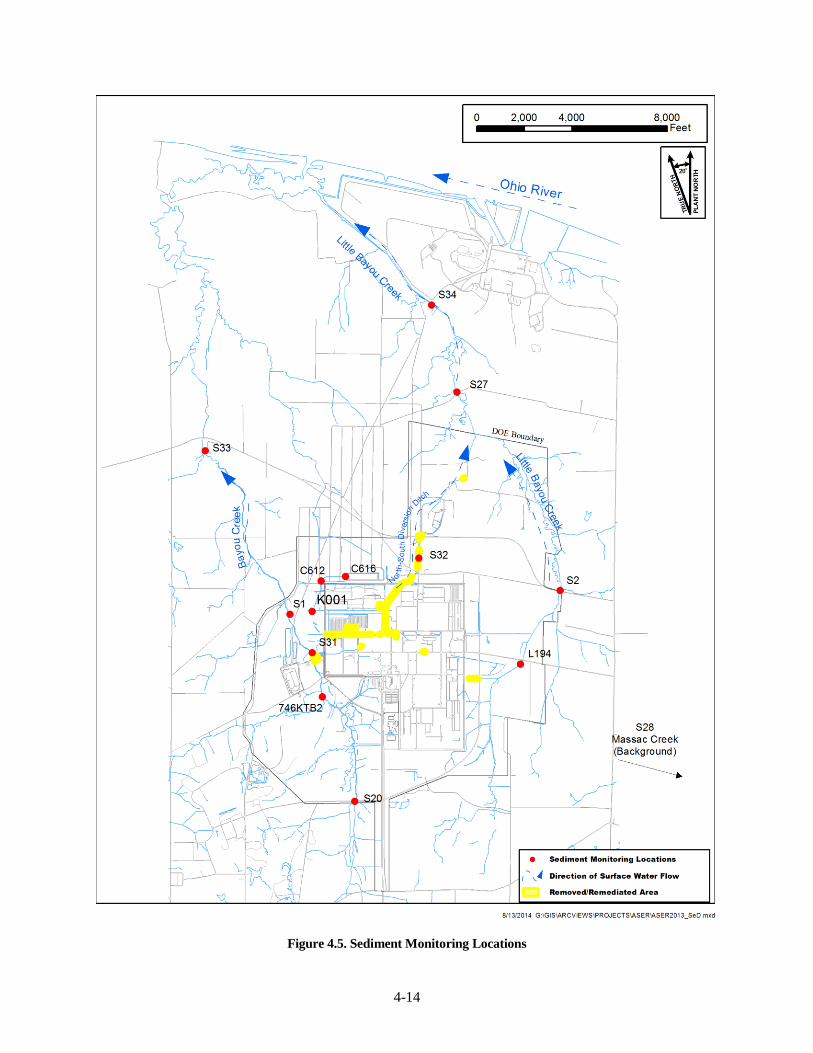
4-14
Figure 4.5. Sediment Monitoring Locations
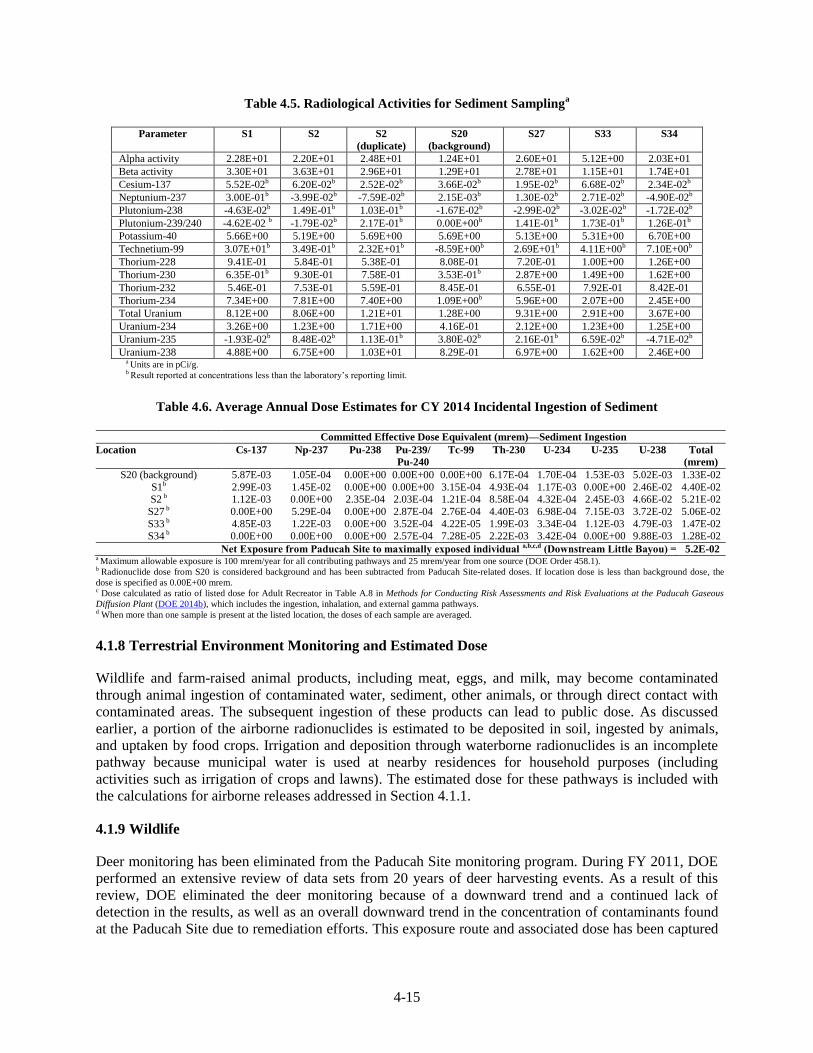
4-15
Table 4.5. Radiological Activities for Sediment Samplinga
Parameter S1 S2 S2
(duplicate)
S20
(background)
S27 S33 S34
Alpha activity 2.28E+01 2.20E+01 2.48E+01 1.24E+01 2.60E+01 5.12E+00 2.03E+01
Beta activity 3.30E+01 3.63E+01 2.96E+01 1.29E+01 2.78E+01 1.15E+01 1.74E+01
Cesium-137 5.52E-02b 6.20E-02b 2.52E-02b 3.66E-02b 1.95E-02b 6.68E-02b 2.34E-02b
Neptunium-237 3.00E-01b -3.99E-02b -7.59E-02b 2.15E-03b 1.30E-02b 2.71E-02b -4.90E-02b
Plutonium-238 -4.63E-02b 1.49E-01b 1.03E-01b -1.67E-02b -2.99E-02b -3.02E-02b -1.72E-02b
Plutonium-239/240 -4.62E-02 b -1.79E-02b 2.17E-01b 0.00E+00b 1.41E-01b 1.73E-01b 1.26E-01b
Potassium-40 5.66E+00 5.19E+00 5.69E+00 5.69E+00 5.13E+00 5.31E+00 6.70E+00
Technetium-99 3.07E+01b 3.49E-01b 2.32E+01b -8.59E+00b 2.69E+01b 4.11E+00b 7.10E+00b
Thorium-228 9.41E-01 5.84E-01 5.38E-01 8.08E-01 7.20E-01 1.00E+00 1.26E+00
Thorium-230 6.35E-01b 9.30E-01 7.58E-01 3.53E-01b 2.87E+00 1.49E+00 1.62E+00
Thorium-232 5.46E-01 7.53E-01 5.59E-01 8.45E-01 6.55E-01 7.92E-01 8.42E-01
Thorium-234 7.34E+00 7.81E+00 7.40E+00 1.09E+00b 5.96E+00 2.07E+00 2.45E+00
Total Uranium 8.12E+00 8.06E+00 1.21E+01 1.28E+00 9.31E+00 2.91E+00 3.67E+00
Uranium-234 3.26E+00 1.23E+00 1.71E+00 4.16E-01 2.12E+00 1.23E+00 1.25E+00
Uranium-235 -1.93E-02b 8.48E-02b 1.13E-01b 3.80E-02b 2.16E-01b 6.59E-02b -4.71E-02b
Uranium-238 4.88E+00 6.75E+00 1.03E+01 8.29E-01 6.97E+00 1.62E+00 2.46E+00 a Units are in pCi/g.
b Result reported at concentrations less than the laboratory’s reporting limit.
Table 4.6. Average Annual Dose Estimates for CY 2014 Incidental Ingestion of Sediment
Committed Effective Dose Equivalent (mrem)—Sediment Ingestion
Location Cs-137 Np-237 Pu-238 Pu-239/
Pu-240
Tc-99 Th-230 U-234 U-235 U-238 Total
(mrem)
S20 (background) 5.87E-03 1.05E-04 0.00E+00 0.00E+00 0.00E+00 6.17E-04 1.70E-04 1.53E-03 5.02E-03 1.33E-02
S1b 2.99E-03 1.45E-02 0.00E+00 0.00E+00 3.15E-04 4.93E-04 1.17E-03 0.00E+00 2.46E-02 4.40E-02 S2 b 1.12E-03 0.00E+00 2.35E-04 2.03E-04 1.21E-04 8.58E-04 4.32E-04 2.45E-03 4.66E-02 5.21E-02
S27 b 0.00E+00 5.29E-04 0.00E+00 2.87E-04 2.76E-04 4.40E-03 6.98E-04 7.15E-03 3.72E-02 5.06E-02
S33 b 4.85E-03 1.22E-03 0.00E+00 3.52E-04 4.22E-05 1.99E-03 3.34E-04 1.12E-03 4.79E-03 1.47E-02 S34 b 0.00E+00 0.00E+00 0.00E+00 2.57E-04 7.28E-05 2.22E-03 3.42E-04 0.00E+00 9.88E-03 1.28E-02
Net Exposure from Paducah Site to maximally exposed individual a,b,c,d (Downstream Little Bayou) = 5.2E-02 a Maximum allowable exposure is 100 mrem/year for all contributing pathways and 25 mrem/year from one source (DOE Order 458.1). b Radionuclide dose from S20 is considered background and has been subtracted from Paducah Site-related doses. If location dose is less than background dose, the
dose is specified as 0.00E+00 mrem. c Dose calculated as ratio of listed dose for Adult Recreator in Table A.8 in Methods for Conducting Risk Assessments and Risk Evaluations at the Paducah Gaseous
Diffusion Plant (DOE 2014b), which includes the ingestion, inhalation, and external gamma pathways. d When more than one sample is present at the listed location, the doses of each sample are averaged.
4.1.8 Terrestrial Environment Monitoring and Estimated Dose
Wildlife and farm-raised animal products, including meat, eggs, and milk, may become contaminated
through animal ingestion of contaminated water, sediment, other animals, or through direct contact with
contaminated areas. The subsequent ingestion of these products can lead to public dose. As discussed
earlier, a portion of the airborne radionuclides is estimated to be deposited in soil, ingested by animals,
and uptaken by food crops. Irrigation and deposition through waterborne radionuclides is an incomplete
pathway because municipal water is used at nearby residences for household purposes (including
activities such as irrigation of crops and lawns). The estimated dose for these pathways is included with
the calculations for airborne releases addressed in Section 4.1.1.
4.1.9 Wildlife
Deer monitoring has been eliminated from the Paducah Site monitoring program. During FY 2011, DOE
performed an extensive review of data sets from 20 years of deer harvesting events. As a result of this
review, DOE eliminated the deer monitoring because of a downward trend and a continued lack of
detection in the results, as well as an overall downward trend in the concentration of contaminants found
at the Paducah Site due to remediation efforts. This exposure route and associated dose has been captured
4-16
in the food chain models associated with the CAP-88 air program. Doses from airborne releases are
described in Section 4.1.1.
4.1.10 Direct Radiation Monitoring and Estimated Dose
4.1.10.1 Direct radiation surveillance
External radiation exposure from DOE’s operations at the Paducah Site potentially contributes to the
overall dose to the public. External radiation exposure is defined as exposure attributed to radioactive
sources outside the body (e.g., cosmic gamma radiation). Sources of external radiation exposure at the
Paducah Site include the cylinder storage yards, the operations inside the cascade building, and small
items such as instrument calibration sources. Cylinder storage yards have the largest potential for a dose
to the public because of their proximity to the Paducah Site security fence.
The external gamma and neutron radiation monitoring program is designed to provide data on external
radiation exposure from DOE operations to members of the public. The primary factor in selecting the
monitoring locations was the potential for a member of the public to be exposed to external radiation.
Secondary factors in selecting monitoring locations were accessibility and representative exposure
potentially received by members of the public and area monitoring for individuals passing through the
DOE site. Environmental thermoluminescent dosimeters (TLDs) with a calcium fluoride and lithium
fluoride matrix were placed at the monitoring locations and collected and analyzed quarterly for a period
of one year.
In 2014, direct radiation was monitored by quarterly placement, collection, and analysis of environmental
TLDs. These monitoring locations are shown in Figure 4.6. Monitoring results indicate that 16 of 52
locations were consistently above background levels, as reported in the Annual Report on External
Radiation Monitoring for CY 2014, Paducah Gaseous Diffusion Plant, Paducah, Kentucky
(LATA Kentucky 2015d). Most of these locations were at or near the Paducah Site security fence in the
vicinity of UF6 cylinder storage yards. Because security protocols prohibited the public from gaining
prolonged access to the PGDP boundary fence in CY 2014, the potential radiation doses calculated at or
in close proximity to the fence are not a significant contributor to the public dose.
4.1.10.2 Direct radiation dose
Due to Paducah Site security protocols in CY 2014, no members of the public routinely were allowed
near the security fence. The external radiation doses measured by TLDs in areas accessible to the public
were not statistically above background; therefore, the ED potentially received by a member of the public
passing through accessible portions of the DOE Reservation are not statistically above background and,
for the purposes of this report, are considered to be negligible. In 2014, TLD-14 and TLD-40 represented
the closest locations that would be accessible to the public. TLD-14 is near Harmony Cemetery, located
north of the plant security fence and south of Ogden Landing Road. Measurements at this location
indicated external radiation doses statistically equivalent to the background radiation level. In 2014,
TLD-40 located on the DOE Reservation boundary with the DOE-leased WKWMA area off of
Dyke Road also indicated external radiation dose measured to be at background levels. The MEI at the
private residences also was calculated to be at background levels. Based on the results of the gamma and
neutron radiation dose measurements made during CY 2014, the ED to the MEI member of the public
from DOE operations was below the applicable DOE limit of 100 mrem within a year, in accordance with
DOE Order 458.1.
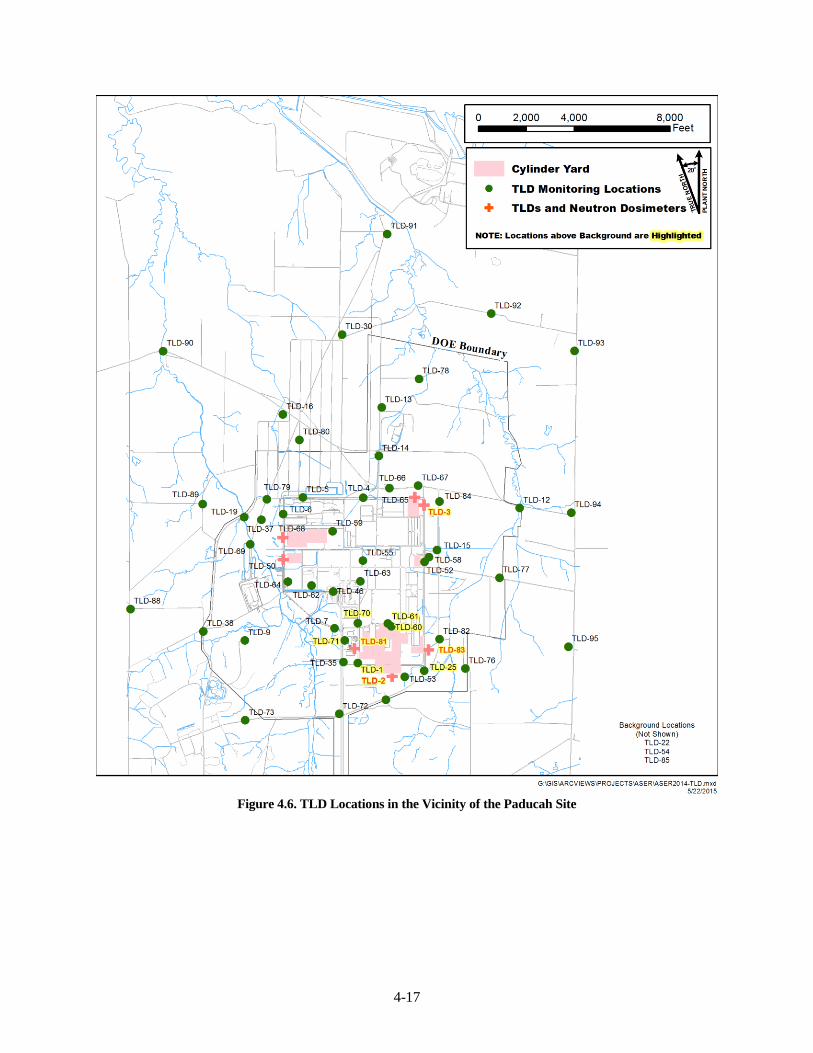
4-17
Figure 4.6. TLD Locations in the Vicinity of the Paducah Site
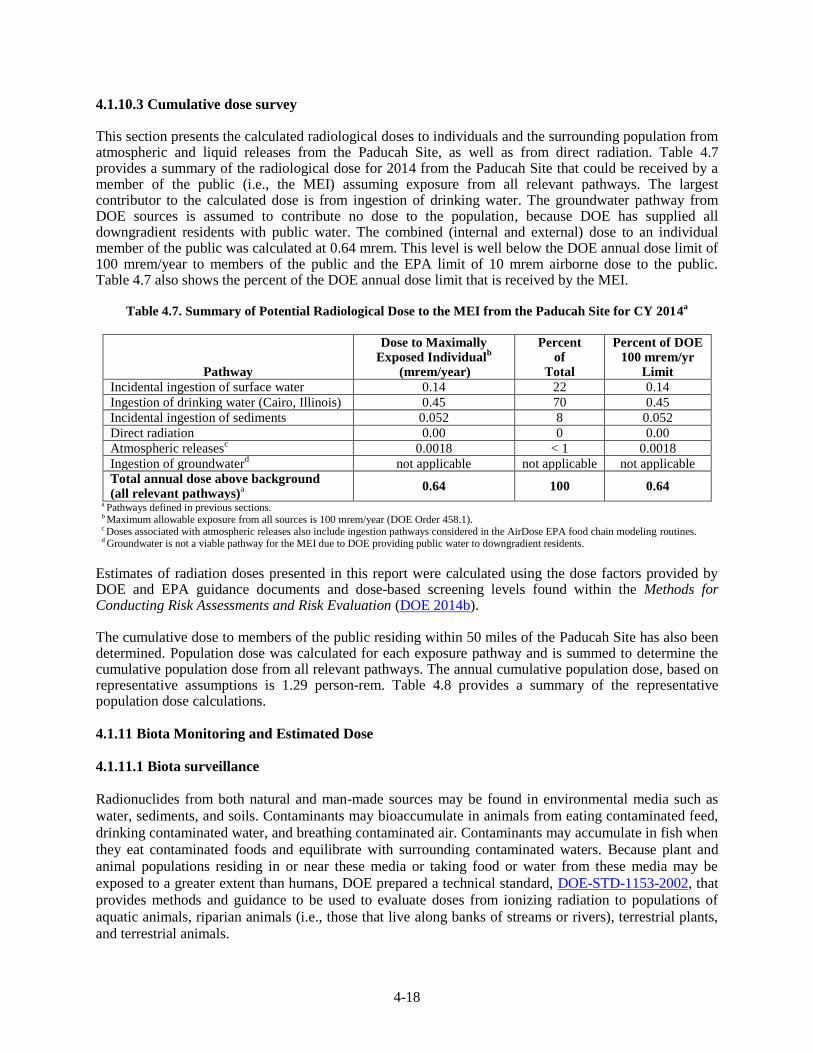
4-18
4.1.10.3 Cumulative dose survey
This section presents the calculated radiological doses to individuals and the surrounding population from atmospheric and liquid releases from the Paducah Site, as well as from direct radiation. Table 4.7 provides a summary of the radiological dose for 2014 from the Paducah Site that could be received by a member of the public (i.e., the MEI) assuming exposure from all relevant pathways. The largest contributor to the calculated dose is from ingestion of drinking water. The groundwater pathway from DOE sources is assumed to contribute no dose to the population, because DOE has supplied all downgradient residents with public water. The combined (internal and external) dose to an individual member of the public was calculated at 0.64 mrem. This level is well below the DOE annual dose limit of 100 mrem/year to members of the public and the EPA limit of 10 mrem airborne dose to the public. Table 4.7 also shows the percent of the DOE annual dose limit that is received by the MEI.
Table 4.7. Summary of Potential Radiological Dose to the MEI from the Paducah Site for CY 2014a
Pathway
Dose to Maximally Exposed Individual
b
(mrem/year)
Percent of
Total
Percent of DOE 100 mrem/yr
Limit
Incidental ingestion of surface water 0.14 22 0.14
Ingestion of drinking water (Cairo, Illinois) 0.45 70 0.45
Incidental ingestion of sediments 0.052 8 0.052
Direct radiation 0.00 0 0.00
Atmospheric releasesc 0.0018 < 1 0.0018
Ingestion of groundwaterd
not applicable not applicable not applicable
Total annual dose above background (all relevant pathways)
a
0.64 100 0.64
a Pathways defined in previous sections. b Maximum allowable exposure from all sources is 100 mrem/year (DOE Order 458.1). c Doses associated with atmospheric releases also include ingestion pathways considered in the AirDose EPA food chain modeling routines. d Groundwater is not a viable pathway for the MEI due to DOE providing public water to downgradient residents.
Estimates of radiation doses presented in this report were calculated using the dose factors provided by DOE and EPA guidance documents and dose-based screening levels found within the Methods for Conducting Risk Assessments and Risk Evaluation (DOE 2014b).
The cumulative dose to members of the public residing within 50 miles of the Paducah Site has also been determined. Population dose was calculated for each exposure pathway and is summed to determine the cumulative population dose from all relevant pathways. The annual cumulative population dose, based on representative assumptions is 1.29 person-rem. Table 4.8 provides a summary of the representative population dose calculations.
4.1.11 Biota Monitoring and Estimated Dose
4.1.11.1 Biota surveillance
Radionuclides from both natural and man-made sources may be found in environmental media such as
water, sediments, and soils. Contaminants may bioaccumulate in animals from eating contaminated feed,
drinking contaminated water, and breathing contaminated air. Contaminants may accumulate in fish when
they eat contaminated foods and equilibrate with surrounding contaminated waters. Because plant and
animal populations residing in or near these media or taking food or water from these media may be
exposed to a greater extent than humans, DOE prepared a technical standard, DOE-STD-1153-2002, that
provides methods and guidance to be used to evaluate doses from ionizing radiation to populations of
aquatic animals, riparian animals (i.e., those that live along banks of streams or rivers), terrestrial plants,
and terrestrial animals.
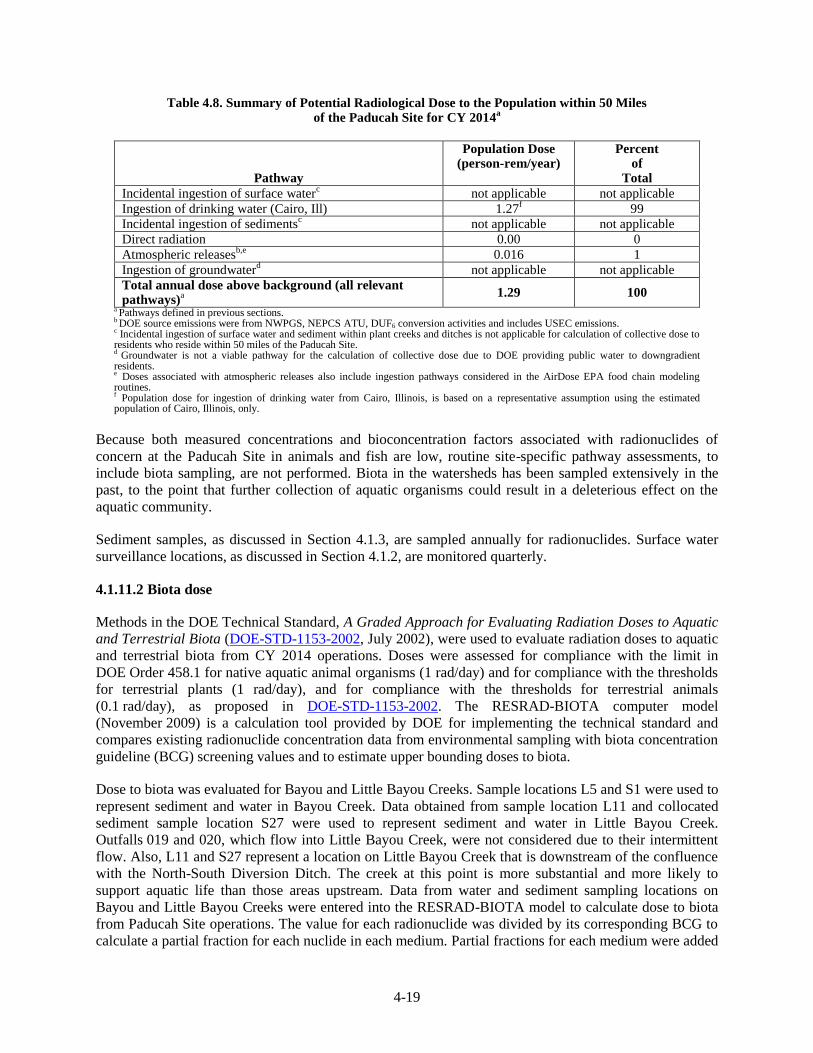
4-19
Table 4.8. Summary of Potential Radiological Dose to the Population within 50 Miles of the Paducah Site for CY 2014
a
Pathway
Population Dose (person-rem/year)
Percent of
Total
Incidental ingestion of surface waterc not applicable not applicable
Ingestion of drinking water (Cairo, Ill) 1.27f 99
Incidental ingestion of sedimentsc not applicable not applicable
Direct radiation 0.00 0
Atmospheric releasesb,e
0.016 1
Ingestion of groundwaterd
not applicable not applicable
Total annual dose above background (all relevant pathways)
a
1.29 100 a Pathways defined in previous sections. b DOE source emissions were from NWPGS, NEPCS ATU, DUF6 conversion activities and includes USEC emissions. c Incidental ingestion of surface water and sediment within plant creeks and ditches is not applicable for calculation of collective dose to residents who reside within 50 miles of the Paducah Site. d Groundwater is not a viable pathway for the calculation of collective dose due to DOE providing public water to downgradient residents. e Doses associated with atmospheric releases also include ingestion pathways considered in the AirDose EPA food chain modeling routines. f Population dose for ingestion of drinking water from Cairo, Illinois, is based on a representative assumption using the estimated population of Cairo, Illinois, only.
Because both measured concentrations and bioconcentration factors associated with radionuclides of
concern at the Paducah Site in animals and fish are low, routine site-specific pathway assessments, to
include biota sampling, are not performed. Biota in the watersheds has been sampled extensively in the
past, to the point that further collection of aquatic organisms could result in a deleterious effect on the
aquatic community.
Sediment samples, as discussed in Section 4.1.3, are sampled annually for radionuclides. Surface water
surveillance locations, as discussed in Section 4.1.2, are monitored quarterly.
4.1.11.2 Biota dose
Methods in the DOE Technical Standard, A Graded Approach for Evaluating Radiation Doses to Aquatic
and Terrestrial Biota (DOE-STD-1153-2002, July 2002), were used to evaluate radiation doses to aquatic
and terrestrial biota from CY 2014 operations. Doses were assessed for compliance with the limit in
DOE Order 458.1 for native aquatic animal organisms (1 rad/day) and for compliance with the thresholds
for terrestrial plants (1 rad/day), and for compliance with the thresholds for terrestrial animals
(0.1 rad/day), as proposed in DOE-STD-1153-2002. The RESRAD-BIOTA computer model
(November 2009) is a calculation tool provided by DOE for implementing the technical standard and
compares existing radionuclide concentration data from environmental sampling with biota concentration
guideline (BCG) screening values and to estimate upper bounding doses to biota.
Dose to biota was evaluated for Bayou and Little Bayou Creeks. Sample locations L5 and S1 were used to
represent sediment and water in Bayou Creek. Data obtained from sample location L11 and collocated
sediment sample location S27 were used to represent sediment and water in Little Bayou Creek.
Outfalls 019 and 020, which flow into Little Bayou Creek, were not considered due to their intermittent
flow. Also, L11 and S27 represent a location on Little Bayou Creek that is downstream of the confluence
with the North-South Diversion Ditch. The creek at this point is more substantial and more likely to
support aquatic life than those areas upstream. Data from water and sediment sampling locations on
Bayou and Little Bayou Creeks were entered into the RESRAD-BIOTA model to calculate dose to biota
from Paducah Site operations. The value for each radionuclide was divided by its corresponding BCG to
calculate a partial fraction for each nuclide in each medium. Partial fractions for each medium were added
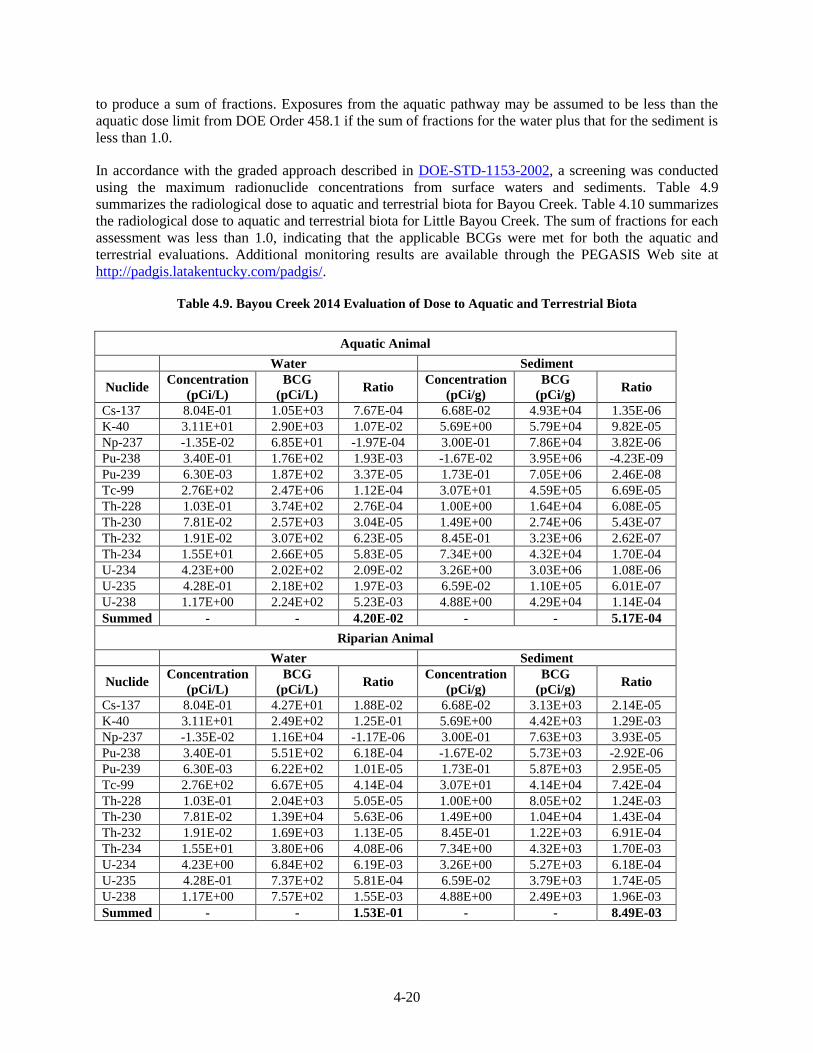
4-20
to produce a sum of fractions. Exposures from the aquatic pathway may be assumed to be less than the
aquatic dose limit from DOE Order 458.1 if the sum of fractions for the water plus that for the sediment is
less than 1.0.
In accordance with the graded approach described in DOE-STD-1153-2002, a screening was conducted
using the maximum radionuclide concentrations from surface waters and sediments. Table 4.9
summarizes the radiological dose to aquatic and terrestrial biota for Bayou Creek. Table 4.10 summarizes
the radiological dose to aquatic and terrestrial biota for Little Bayou Creek. The sum of fractions for each
assessment was less than 1.0, indicating that the applicable BCGs were met for both the aquatic and
terrestrial evaluations. Additional monitoring results are available through the PEGASIS Web site at
http://padgis.latakentucky.com/padgis/.
Table 4.9. Bayou Creek 2014 Evaluation of Dose to Aquatic and Terrestrial Biota
Aquatic Animal
Water Sediment
Nuclide Concentration
(pCi/L)
BCG
(pCi/L) Ratio
Concentration
(pCi/g)
BCG
(pCi/g) Ratio
Cs-137 8.04E-01 1.05E+03 7.67E-04 6.68E-02 4.93E+04 1.35E-06
K-40 3.11E+01 2.90E+03 1.07E-02 5.69E+00 5.79E+04 9.82E-05
Np-237 -1.35E-02 6.85E+01 -1.97E-04 3.00E-01 7.86E+04 3.82E-06
Pu-238 3.40E-01 1.76E+02 1.93E-03 -1.67E-02 3.95E+06 -4.23E-09
Pu-239 6.30E-03 1.87E+02 3.37E-05 1.73E-01 7.05E+06 2.46E-08
Tc-99 2.76E+02 2.47E+06 1.12E-04 3.07E+01 4.59E+05 6.69E-05
Th-228 1.03E-01 3.74E+02 2.76E-04 1.00E+00 1.64E+04 6.08E-05
Th-230 7.81E-02 2.57E+03 3.04E-05 1.49E+00 2.74E+06 5.43E-07
Th-232 1.91E-02 3.07E+02 6.23E-05 8.45E-01 3.23E+06 2.62E-07
Th-234 1.55E+01 2.66E+05 5.83E-05 7.34E+00 4.32E+04 1.70E-04
U-234 4.23E+00 2.02E+02 2.09E-02 3.26E+00 3.03E+06 1.08E-06
U-235 4.28E-01 2.18E+02 1.97E-03 6.59E-02 1.10E+05 6.01E-07
U-238 1.17E+00 2.24E+02 5.23E-03 4.88E+00 4.29E+04 1.14E-04
Summed - - 4.20E-02 - - 5.17E-04
Riparian Animal
Water Sediment
Nuclide Concentration
(pCi/L)
BCG
(pCi/L) Ratio
Concentration
(pCi/g)
BCG
(pCi/g) Ratio
Cs-137 8.04E-01 4.27E+01 1.88E-02 6.68E-02 3.13E+03 2.14E-05
K-40 3.11E+01 2.49E+02 1.25E-01 5.69E+00 4.42E+03 1.29E-03
Np-237 -1.35E-02 1.16E+04 -1.17E-06 3.00E-01 7.63E+03 3.93E-05
Pu-238 3.40E-01 5.51E+02 6.18E-04 -1.67E-02 5.73E+03 -2.92E-06
Pu-239 6.30E-03 6.22E+02 1.01E-05 1.73E-01 5.87E+03 2.95E-05
Tc-99 2.76E+02 6.67E+05 4.14E-04 3.07E+01 4.14E+04 7.42E-04
Th-228 1.03E-01 2.04E+03 5.05E-05 1.00E+00 8.05E+02 1.24E-03
Th-230 7.81E-02 1.39E+04 5.63E-06 1.49E+00 1.04E+04 1.43E-04
Th-232 1.91E-02 1.69E+03 1.13E-05 8.45E-01 1.22E+03 6.91E-04
Th-234 1.55E+01 3.80E+06 4.08E-06 7.34E+00 4.32E+03 1.70E-03
U-234 4.23E+00 6.84E+02 6.19E-03 3.26E+00 5.27E+03 6.18E-04
U-235 4.28E-01 7.37E+02 5.81E-04 6.59E-02 3.79E+03 1.74E-05
U-238 1.17E+00 7.57E+02 1.55E-03 4.88E+00 2.49E+03 1.96E-03
Summed - - 1.53E-01 - - 8.49E-03
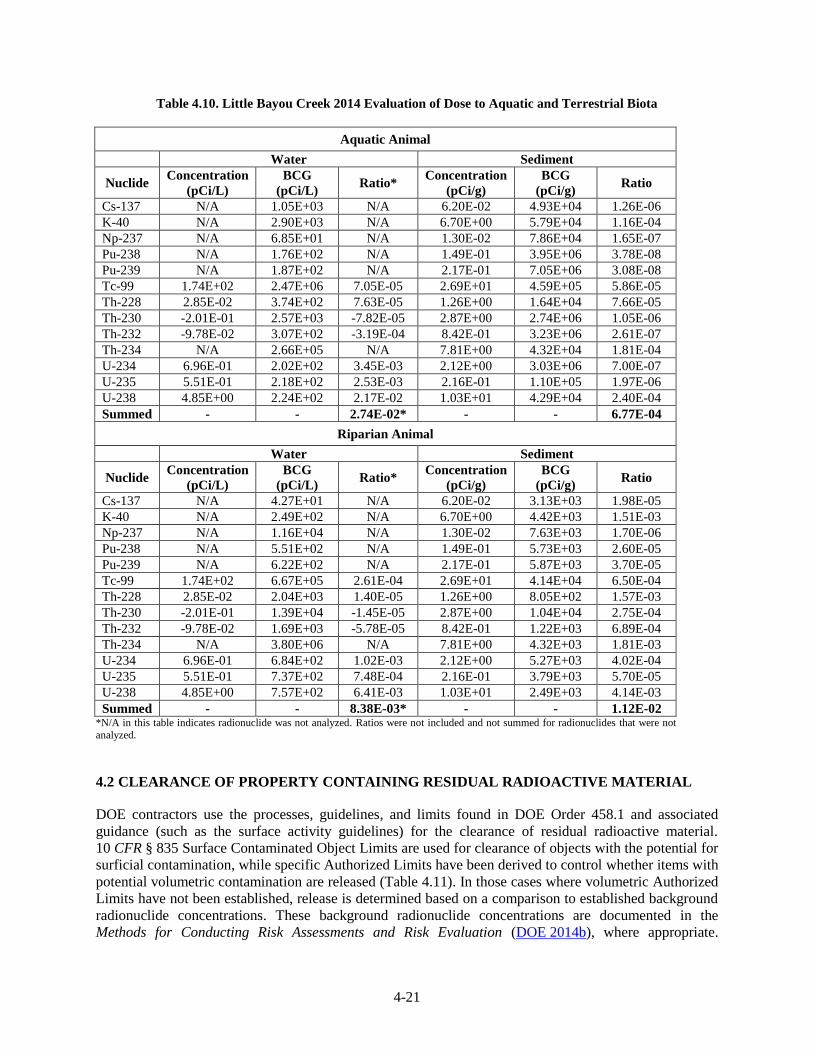
4-21
Table 4.10. Little Bayou Creek 2014 Evaluation of Dose to Aquatic and Terrestrial Biota
Aquatic Animal
Water Sediment
Nuclide Concentration
(pCi/L)
BCG
(pCi/L) Ratio*
Concentration
(pCi/g)
BCG
(pCi/g) Ratio
Cs-137 N/A 1.05E+03 N/A 6.20E-02 4.93E+04 1.26E-06
K-40 N/A 2.90E+03 N/A 6.70E+00 5.79E+04 1.16E-04
Np-237 N/A 6.85E+01 N/A 1.30E-02 7.86E+04 1.65E-07
Pu-238 N/A 1.76E+02 N/A 1.49E-01 3.95E+06 3.78E-08
Pu-239 N/A 1.87E+02 N/A 2.17E-01 7.05E+06 3.08E-08
Tc-99 1.74E+02 2.47E+06 7.05E-05 2.69E+01 4.59E+05 5.86E-05
Th-228 2.85E-02 3.74E+02 7.63E-05 1.26E+00 1.64E+04 7.66E-05
Th-230 -2.01E-01 2.57E+03 -7.82E-05 2.87E+00 2.74E+06 1.05E-06
Th-232 -9.78E-02 3.07E+02 -3.19E-04 8.42E-01 3.23E+06 2.61E-07
Th-234 N/A 2.66E+05 N/A 7.81E+00 4.32E+04 1.81E-04
U-234 6.96E-01 2.02E+02 3.45E-03 2.12E+00 3.03E+06 7.00E-07
U-235 5.51E-01 2.18E+02 2.53E-03 2.16E-01 1.10E+05 1.97E-06
U-238 4.85E+00 2.24E+02 2.17E-02 1.03E+01 4.29E+04 2.40E-04
Summed - - 2.74E-02* - - 6.77E-04
Riparian Animal
Water Sediment
Nuclide Concentration
(pCi/L)
BCG
(pCi/L) Ratio*
Concentration
(pCi/g)
BCG
(pCi/g) Ratio
Cs-137 N/A 4.27E+01 N/A 6.20E-02 3.13E+03 1.98E-05
K-40 N/A 2.49E+02 N/A 6.70E+00 4.42E+03 1.51E-03
Np-237 N/A 1.16E+04 N/A 1.30E-02 7.63E+03 1.70E-06
Pu-238 N/A 5.51E+02 N/A 1.49E-01 5.73E+03 2.60E-05
Pu-239 N/A 6.22E+02 N/A 2.17E-01 5.87E+03 3.70E-05
Tc-99 1.74E+02 6.67E+05 2.61E-04 2.69E+01 4.14E+04 6.50E-04
Th-228 2.85E-02 2.04E+03 1.40E-05 1.26E+00 8.05E+02 1.57E-03
Th-230 -2.01E-01 1.39E+04 -1.45E-05 2.87E+00 1.04E+04 2.75E-04
Th-232 -9.78E-02 1.69E+03 -5.78E-05 8.42E-01 1.22E+03 6.89E-04
Th-234 N/A 3.80E+06 N/A 7.81E+00 4.32E+03 1.81E-03
U-234 6.96E-01 6.84E+02 1.02E-03 2.12E+00 5.27E+03 4.02E-04
U-235 5.51E-01 7.37E+02 7.48E-04 2.16E-01 3.79E+03 5.70E-05
U-238 4.85E+00 7.57E+02 6.41E-03 1.03E+01 2.49E+03 4.14E-03
Summed - - 8.38E-03* - - 1.12E-02 *N/A in this table indicates radionuclide was not analyzed. Ratios were not included and not summed for radionuclides that were not
analyzed.
4.2 CLEARANCE OF PROPERTY CONTAINING RESIDUAL RADIOACTIVE MATERIAL
DOE contractors use the processes, guidelines, and limits found in DOE Order 458.1 and associated
guidance (such as the surface activity guidelines) for the clearance of residual radioactive material.
10 CFR § 835 Surface Contaminated Object Limits are used for clearance of objects with the potential for
surficial contamination, while specific Authorized Limits have been derived to control whether items with
potential volumetric contamination are released (Table 4.11). In those cases where volumetric Authorized
Limits have not been established, release is determined based on a comparison to established background
radionuclide concentrations. These background radionuclide concentrations are documented in the
Methods for Conducting Risk Assessments and Risk Evaluation (DOE 2014b), where appropriate.
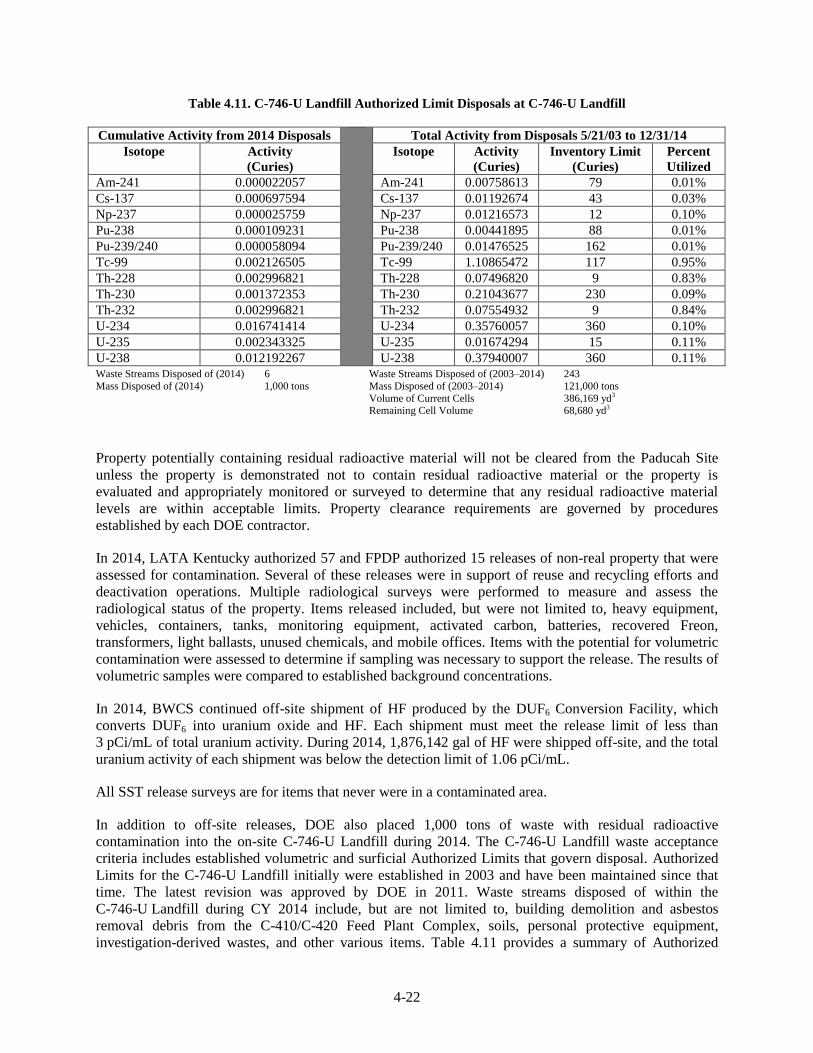
4-22
Table 4.11. C-746-U Landfill Authorized Limit Disposals at C-746-U Landfill
Cumulative Activity from 2014 Disposals Total Activity from Disposals 5/21/03 to 12/31/14
Isotope Activity
(Curies)
Isotope Activity
(Curies)
Inventory Limit
(Curies)
Percent
Utilized
Am-241 0.000022057 Am-241 0.00758613 79 0.01%
Cs-137 0.000697594 Cs-137 0.01192674 43 0.03%
Np-237 0.000025759 Np-237 0.01216573 12 0.10%
Pu-238 0.000109231 Pu-238 0.00441895 88 0.01%
Pu-239/240 0.000058094 Pu-239/240 0.01476525 162 0.01%
Tc-99 0.002126505 Tc-99 1.10865472 117 0.95%
Th-228 0.002996821 Th-228 0.07496820 9 0.83%
Th-230 0.001372353 Th-230 0.21043677 230 0.09%
Th-232 0.002996821 Th-232 0.07554932 9 0.84%
U-234 0.016741414 U-234 0.35760057 360 0.10%
U-235 0.002343325 U-235 0.01674294 15 0.11%
U-238 0.012192267 U-238 0.37940007 360 0.11%
Waste Streams Disposed of (2014) 6 Waste Streams Disposed of (2003–2014) 243
Mass Disposed of (2014) 1,000 tons Mass Disposed of (2003–2014) 121,000 tons
Volume of Current Cells 386,169 yd3 Remaining Cell Volume 68,680 yd3
Property potentially containing residual radioactive material will not be cleared from the Paducah Site
unless the property is demonstrated not to contain residual radioactive material or the property is
evaluated and appropriately monitored or surveyed to determine that any residual radioactive material
levels are within acceptable limits. Property clearance requirements are governed by procedures
established by each DOE contractor.
In 2014, LATA Kentucky authorized 57 and FPDP authorized 15 releases of non-real property that were
assessed for contamination. Several of these releases were in support of reuse and recycling efforts and
deactivation operations. Multiple radiological surveys were performed to measure and assess the
radiological status of the property. Items released included, but were not limited to, heavy equipment,
vehicles, containers, tanks, monitoring equipment, activated carbon, batteries, recovered Freon,
transformers, light ballasts, unused chemicals, and mobile offices. Items with the potential for volumetric
contamination were assessed to determine if sampling was necessary to support the release. The results of
volumetric samples were compared to established background concentrations.
In 2014, BWCS continued off-site shipment of HF produced by the DUF6 Conversion Facility, which
converts DUF6 into uranium oxide and HF. Each shipment must meet the release limit of less than
3 pCi/mL of total uranium activity. During 2014, 1,876,142 gal of HF were shipped off-site, and the total
uranium activity of each shipment was below the detection limit of 1.06 pCi/mL.
All SST release surveys are for items that never were in a contaminated area.
In addition to off-site releases, DOE also placed 1,000 tons of waste with residual radioactive
contamination into the on-site C-746-U Landfill during 2014. The C-746-U Landfill waste acceptance
criteria includes established volumetric and surficial Authorized Limits that govern disposal. Authorized
Limits for the C-746-U Landfill initially were established in 2003 and have been maintained since that
time. The latest revision was approved by DOE in 2011. Waste streams disposed of within the
C-746-U Landfill during CY 2014 include, but are not limited to, building demolition and asbestos
removal debris from the C-410/C-420 Feed Plant Complex, soils, personal protective equipment,
investigation-derived wastes, and other various items. Table 4.11 provides a summary of Authorized

4-23
Limit disposals at the C-746-U Landfill during CY 2014 and the cumulative totals since Authorized Limit
inception in May 2003.
4.3 UNPLANNED RADIOLOGICAL RELEASES
There were no unplanned radiological releases in 2014 that progressed off-site.

THIS PAGE INTENTIONALLY LEFT BLANK
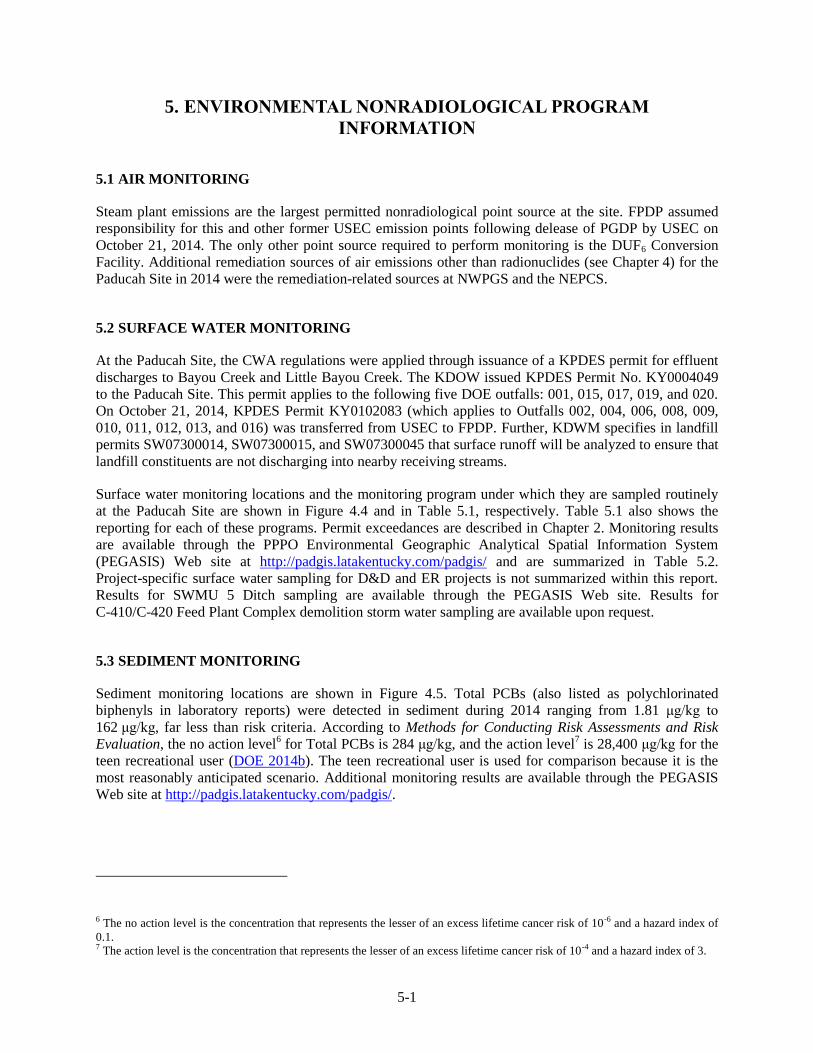
5-1
5. ENVIRONMENTAL NONRADIOLOGICAL PROGRAM
INFORMATION
5.1 AIR MONITORING
Steam plant emissions are the largest permitted nonradiological point source at the site. FPDP assumed
responsibility for this and other former USEC emission points following delease of PGDP by USEC on
October 21, 2014. The only other point source required to perform monitoring is the DUF6 Conversion
Facility. Additional remediation sources of air emissions other than radionuclides (see Chapter 4) for the
Paducah Site in 2014 were the remediation-related sources at NWPGS and the NEPCS.
5.2 SURFACE WATER MONITORING
At the Paducah Site, the CWA regulations were applied through issuance of a KPDES permit for effluent
discharges to Bayou Creek and Little Bayou Creek. The KDOW issued KPDES Permit No. KY0004049
to the Paducah Site. This permit applies to the following five DOE outfalls: 001, 015, 017, 019, and 020.
On October 21, 2014, KPDES Permit KY0102083 (which applies to Outfalls 002, 004, 006, 008, 009,
010, 011, 012, 013, and 016) was transferred from USEC to FPDP. Further, KDWM specifies in landfill
permits SW07300014, SW07300015, and SW07300045 that surface runoff will be analyzed to ensure that
landfill constituents are not discharging into nearby receiving streams.
Surface water monitoring locations and the monitoring program under which they are sampled routinely
at the Paducah Site are shown in Figure 4.4 and in Table 5.1, respectively. Table 5.1 also shows the
reporting for each of these programs. Permit exceedances are described in Chapter 2. Monitoring results
are available through the PPPO Environmental Geographic Analytical Spatial Information System
(PEGASIS) Web site at http://padgis.latakentucky.com/padgis/ and are summarized in Table 5.2.
Project-specific surface water sampling for D&D and ER projects is not summarized within this report.
Results for SWMU 5 Ditch sampling are available through the PEGASIS Web site. Results for
C-410/C-420 Feed Plant Complex demolition storm water sampling are available upon request.
5.3 SEDIMENT MONITORING
Sediment monitoring locations are shown in Figure 4.5. Total PCBs (also listed as polychlorinated
biphenyls in laboratory reports) were detected in sediment during 2014 ranging from 1.81 μg/kg to
162 μg/kg, far less than risk criteria. According to Methods for Conducting Risk Assessments and Risk
Evaluation, the no action level6 for Total PCBs is 284 μg/kg, and the action level
7 is 28,400 μg/kg for the
teen recreational user (DOE 2014b). The teen recreational user is used for comparison because it is the
most reasonably anticipated scenario. Additional monitoring results are available through the PEGASIS
Web site at http://padgis.latakentucky.com/padgis/.
6 The no action level is the concentration that represents the lesser of an excess lifetime cancer risk of 10-6 and a hazard index of
0.1. 7 The action level is the concentration that represents the lesser of an excess lifetime cancer risk of 10-4 and a hazard index of 3.
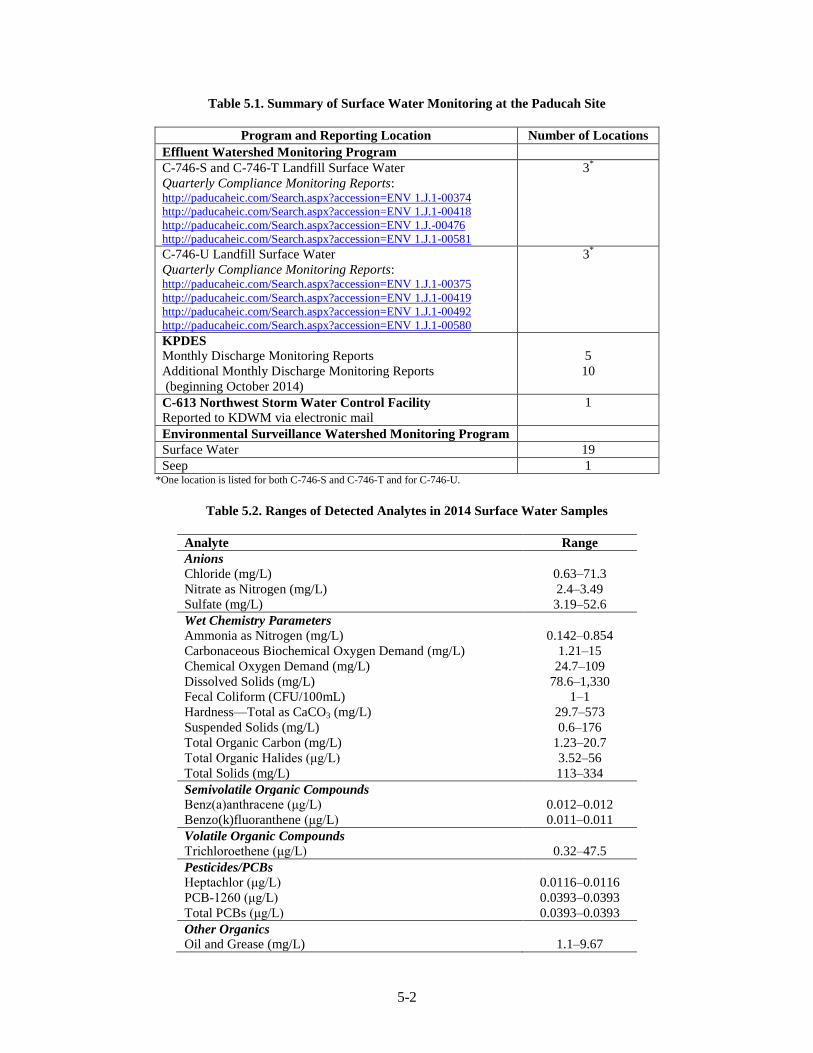
5-2
Table 5.1. Summary of Surface Water Monitoring at the Paducah Site
Program and Reporting Location Number of Locations
Effluent Watershed Monitoring Program
C-746-S and C-746-T Landfill Surface Water
Quarterly Compliance Monitoring Reports: http://paducaheic.com/Search.aspx?accession=ENV 1.J.1-00374
http://paducaheic.com/Search.aspx?accession=ENV 1.J.1-00418
http://paducaheic.com/Search.aspx?accession=ENV 1.J.-00476
http://paducaheic.com/Search.aspx?accession=ENV 1.J.1-00581
3*
C-746-U Landfill Surface Water
Quarterly Compliance Monitoring Reports: http://paducaheic.com/Search.aspx?accession=ENV 1.J.1-00375
http://paducaheic.com/Search.aspx?accession=ENV 1.J.1-00419
http://paducaheic.com/Search.aspx?accession=ENV 1.J.1-00492
http://paducaheic.com/Search.aspx?accession=ENV 1.J.1-00580
3*
KPDES
Monthly Discharge Monitoring Reports
Additional Monthly Discharge Monitoring Reports
(beginning October 2014)
5
10
C-613 Northwest Storm Water Control Facility
Reported to KDWM via electronic mail
1
Environmental Surveillance Watershed Monitoring Program
Surface Water 19
Seep 1 *One location is listed for both C-746-S and C-746-T and for C-746-U.
Table 5.2. Ranges of Detected Analytes in 2014 Surface Water Samples
Analyte Range
Anions
Chloride (mg/L) 0.63–71.3
Nitrate as Nitrogen (mg/L) 2.4–3.49
Sulfate (mg/L) 3.19–52.6
Wet Chemistry Parameters
Ammonia as Nitrogen (mg/L) 0.142–0.854
Carbonaceous Biochemical Oxygen Demand (mg/L) 1.21–15
Chemical Oxygen Demand (mg/L) 24.7–109
Dissolved Solids (mg/L) 78.6–1,330
Fecal Coliform (CFU/100mL) 1–1
Hardness—Total as CaCO3 (mg/L) 29.7–573
Suspended Solids (mg/L) 0.6–176
Total Organic Carbon (mg/L) 1.23–20.7
Total Organic Halides (μg/L) 3.52–56
Total Solids (mg/L) 113–334
Semivolatile Organic Compounds
Benz(a)anthracene (μg/L) 0.012–0.012
Benzo(k)fluoranthene (μg/L) 0.011–0.011
Volatile Organic Compounds
Trichloroethene (μg/L) 0.32–47.5
Pesticides/PCBs
Heptachlor (μg/L) 0.0116–0.0116
PCB-1260 (μg/L) 0.0393–0.0393
Total PCBs (μg/L) 0.0393–0.0393
Other Organics
Oil and Grease (mg/L) 1.1–9.67
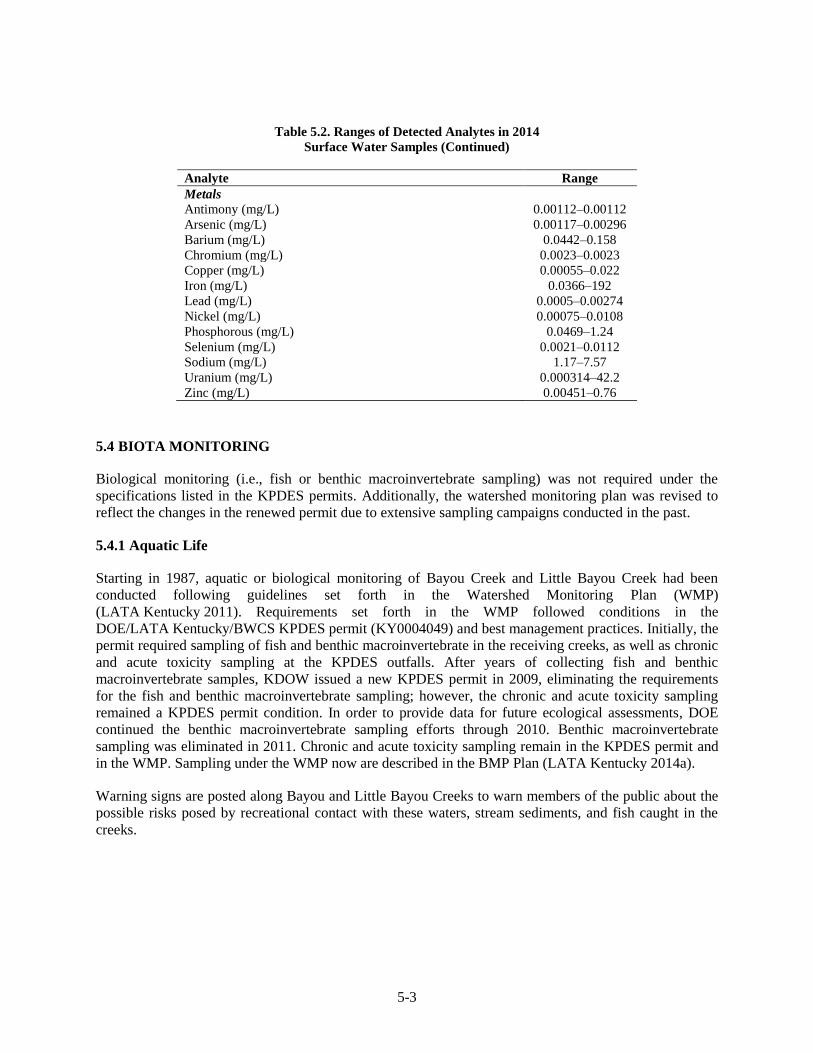
5-3
Table 5.2. Ranges of Detected Analytes in 2014
Surface Water Samples (Continued)
Analyte Range
Metals
Antimony (mg/L) 0.00112–0.00112
Arsenic (mg/L) 0.00117–0.00296
Barium (mg/L) 0.0442–0.158
Chromium (mg/L) 0.0023–0.0023
Copper (mg/L) 0.00055–0.022
Iron (mg/L) 0.0366–192
Lead (mg/L) 0.0005–0.00274
Nickel (mg/L) 0.00075–0.0108
Phosphorous (mg/L) 0.0469–1.24
Selenium (mg/L) 0.0021–0.0112
Sodium (mg/L) 1.17–7.57
Uranium (mg/L) 0.000314–42.2
Zinc (mg/L) 0.00451–0.76
5.4 BIOTA MONITORING
Biological monitoring (i.e., fish or benthic macroinvertebrate sampling) was not required under the
specifications listed in the KPDES permits. Additionally, the watershed monitoring plan was revised to
reflect the changes in the renewed permit due to extensive sampling campaigns conducted in the past.
5.4.1 Aquatic Life
Starting in 1987, aquatic or biological monitoring of Bayou Creek and Little Bayou Creek had been
conducted following guidelines set forth in the Watershed Monitoring Plan (WMP)
(LATA Kentucky 2011). Requirements set forth in the WMP followed conditions in the
DOE/LATA Kentucky/BWCS KPDES permit (KY0004049) and best management practices. Initially, the
permit required sampling of fish and benthic macroinvertebrate in the receiving creeks, as well as chronic
and acute toxicity sampling at the KPDES outfalls. After years of collecting fish and benthic
macroinvertebrate samples, KDOW issued a new KPDES permit in 2009, eliminating the requirements
for the fish and benthic macroinvertebrate sampling; however, the chronic and acute toxicity sampling
remained a KPDES permit condition. In order to provide data for future ecological assessments, DOE
continued the benthic macroinvertebrate sampling efforts through 2010. Benthic macroinvertebrate
sampling was eliminated in 2011. Chronic and acute toxicity sampling remain in the KPDES permit and
in the WMP. Sampling under the WMP now are described in the BMP Plan (LATA Kentucky 2014a).
Warning signs are posted along Bayou and Little Bayou Creeks to warn members of the public about the
possible risks posed by recreational contact with these waters, stream sediments, and fish caught in the
creeks.

THIS PAGE INTENTIONALLY LEFT BLANK
6-1
6. GROUNDWATER PROTECTION PROGRAM
The Results of the Site Investigation Phase 1 (CH2M HILL 1991) determined the primary off-site
contaminants in the Regional Gravel Aquifer (RGA), the primary aquifer for local groundwater users, to
be TCE and technetium-99 (Tc-99). TCE was used until 1993 as an industrial degreasing solvent and
Tc-99 is a fission by-product contained in nuclear power reactor returns that were brought on-site through
1976 for reenrichment of U-235 (DOE 2001). Such reactor returns no longer are used in the enrichment
process; however, Tc-99 still is present in the system. Known or potential sources of TCE and Tc-99
include former test areas, spills, leaks, buried waste, and leachate derived from contaminated scrap metal
previously stored on-site.
Investigations of the on-site source areas of TCE at the Paducah Site are ongoing. The main source and
highest concentration of TCE contamination in the groundwater is near the C-400 Cleaning Building.
TCE has a low solubility and a higher density than water and is included in a chemical group referred to
as dense nonaqueous-phase liquids (DNAPLs). As a result of these characteristics, TCE typically sinks
through the subsurface and may form pools in less permeable layers of the subsurface, as well as the base
of the aquifer. This makes treatment difficult because these pools constitute a continuous source of
dissolved-phase contamination (i.e., plumes) deep within the aquifer.
Groundwater monitoring serves to detect the nature and extent of contamination (i.e., types of
contaminants, concentration of contaminants) and to determine the movement of groundwater near the
plant. Data obtained from the monitoring supports the decision making process for the ultimate
disposition of the contaminants. Figure 6.1 presents monitoring wells sampled in CY 2014 and shows the
2014 TCE plume associated with the Paducah Site (LATA Kentucky 2015e). The TCE plume map is
revised every two years. See Section 6.4 for additional information about the plumes associated with the
Paducah Site.
For access to historical groundwater data, visit the PEGASIS Web site at
http://padgis.latakentucky.com/padgis/ to view data for over 150 MWs and groundwater locations at the
Paducah Site.
6.1 GEOLOGIC AND HYDROGEOLOGIC SETTING
The local groundwater flow systems at the Paducah Site include the following (from shallowest to
deepest): (1) the Terrace Gravel flow system, (2) Upper Continental Recharge System (UCRS), (3) RGA,
and (4) the McNairy flow system. Additional water-bearing zones monitored at the Paducah Site are the
Eocene Sands and the Rubble Zone (i.e., the weathered upper portion of the Mississippian bedrock).
These components are illustrated on Figure 6.2.
Groundwater flow originates south of the Paducah Site within Eocene Sands and the Terrace Gravel.
Groundwater within the Terrace Gravel discharges to local streams and recharges the RGA. Groundwater
flow through the UCRS predominantly is downward, also recharging the RGA. From the plant site,
groundwater generally flows northward in the RGA toward the Ohio River, which is the local base level
for the system. Flow in the McNairy beneath the Paducah Site also is northward to discharge into the
Ohio River.
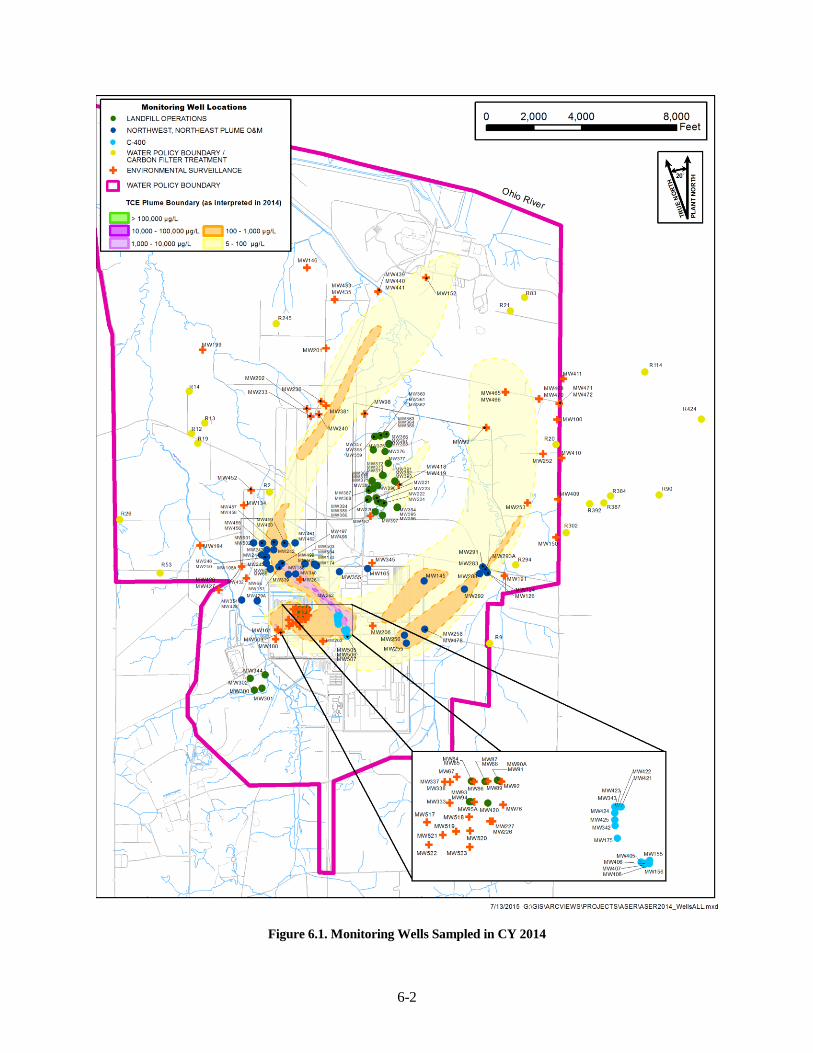
6-2
Figure 6.1. Monitoring Wells Sampled in CY 2014
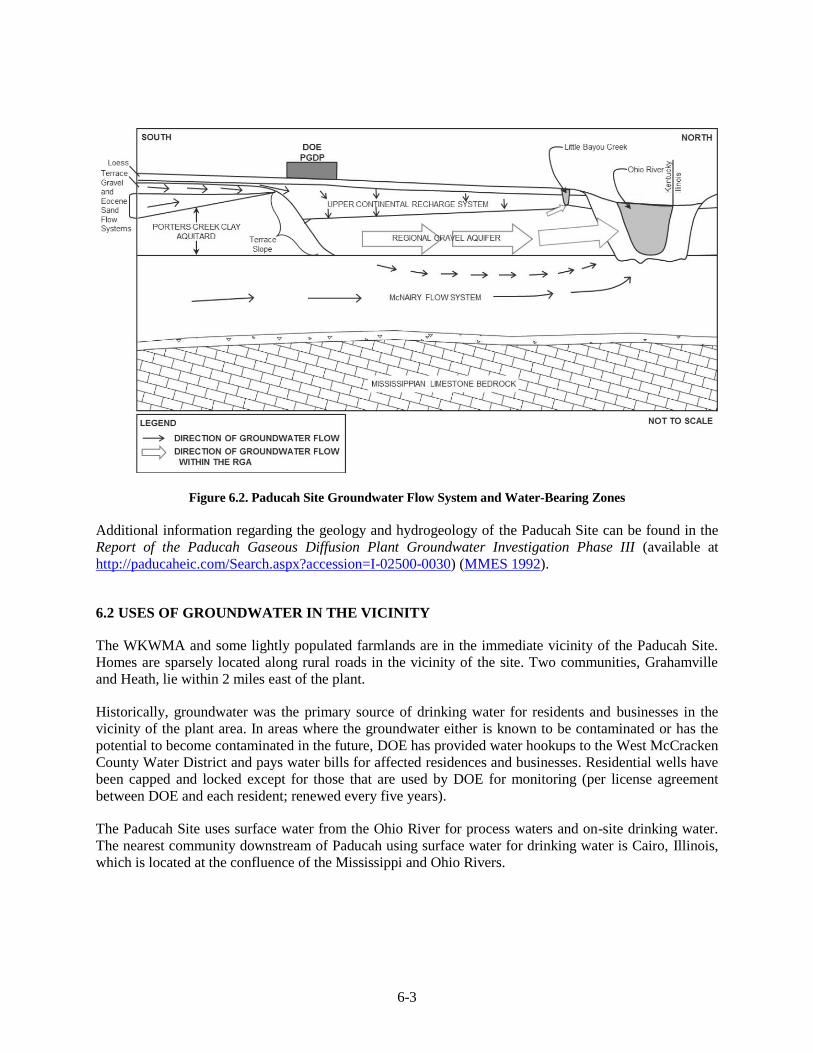
6-3
Figure 6.2. Paducah Site Groundwater Flow System and Water-Bearing Zones
Additional information regarding the geology and hydrogeology of the Paducah Site can be found in the
Report of the Paducah Gaseous Diffusion Plant Groundwater Investigation Phase III (available at
http://paducaheic.com/Search.aspx?accession=I-02500-0030) (MMES 1992).
6.2 USES OF GROUNDWATER IN THE VICINITY
The WKWMA and some lightly populated farmlands are in the immediate vicinity of the Paducah Site.
Homes are sparsely located along rural roads in the vicinity of the site. Two communities, Grahamville
and Heath, lie within 2 miles east of the plant.
Historically, groundwater was the primary source of drinking water for residents and businesses in the
vicinity of the plant area. In areas where the groundwater either is known to be contaminated or has the
potential to become contaminated in the future, DOE has provided water hookups to the West McCracken
County Water District and pays water bills for affected residences and businesses. Residential wells have
been capped and locked except for those that are used by DOE for monitoring (per license agreement
between DOE and each resident; renewed every five years).
The Paducah Site uses surface water from the Ohio River for process waters and on-site drinking water.
The nearest community downstream of Paducah using surface water for drinking water is Cairo, Illinois,
which is located at the confluence of the Mississippi and Ohio Rivers.
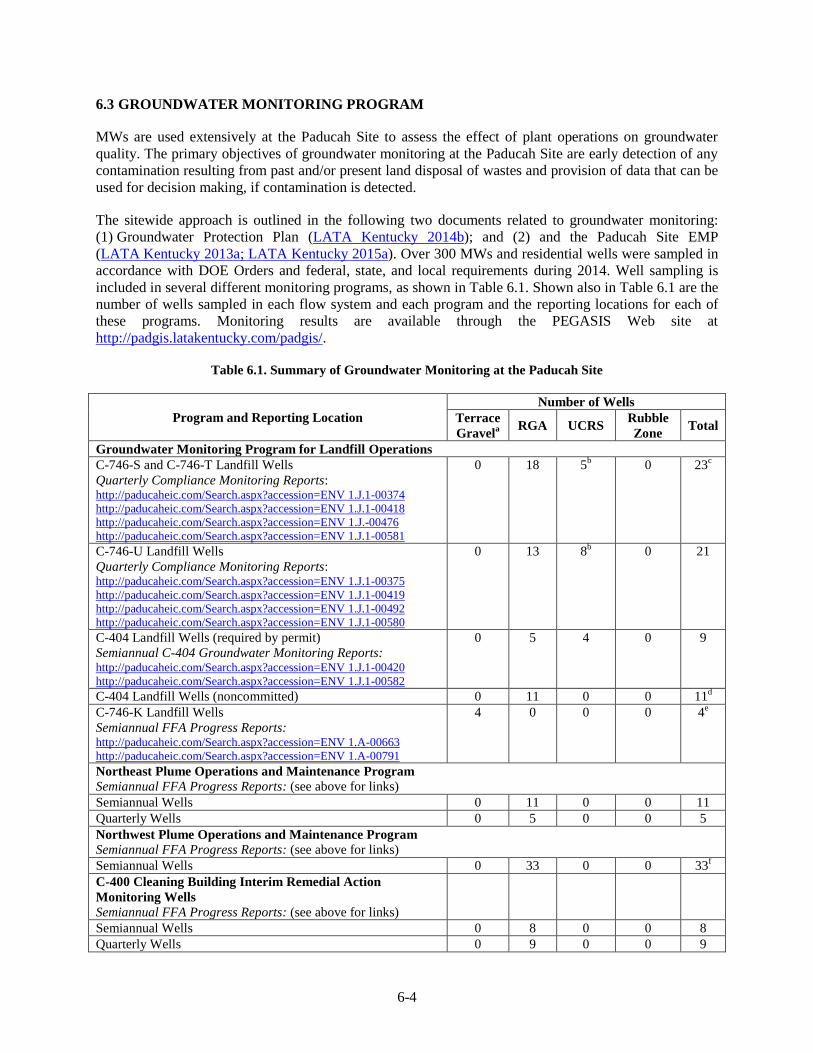
6-4
6.3 GROUNDWATER MONITORING PROGRAM
MWs are used extensively at the Paducah Site to assess the effect of plant operations on groundwater
quality. The primary objectives of groundwater monitoring at the Paducah Site are early detection of any
contamination resulting from past and/or present land disposal of wastes and provision of data that can be
used for decision making, if contamination is detected.
The sitewide approach is outlined in the following two documents related to groundwater monitoring:
(1) Groundwater Protection Plan (LATA Kentucky 2014b); and (2) and the Paducah Site EMP
(LATA Kentucky 2013a; LATA Kentucky 2015a). Over 300 MWs and residential wells were sampled in
accordance with DOE Orders and federal, state, and local requirements during 2014. Well sampling is
included in several different monitoring programs, as shown in Table 6.1. Shown also in Table 6.1 are the
number of wells sampled in each flow system and each program and the reporting locations for each of
these programs. Monitoring results are available through the PEGASIS Web site at
http://padgis.latakentucky.com/padgis/.
Table 6.1. Summary of Groundwater Monitoring at the Paducah Site
Program and Reporting Location
Number of Wells
Terrace
Gravela
RGA UCRS Rubble
Zone Total
Groundwater Monitoring Program for Landfill Operations
C-746-S and C-746-T Landfill Wells
Quarterly Compliance Monitoring Reports: http://paducaheic.com/Search.aspx?accession=ENV 1.J.1-00374
http://paducaheic.com/Search.aspx?accession=ENV 1.J.1-00418
http://paducaheic.com/Search.aspx?accession=ENV 1.J.-00476
http://paducaheic.com/Search.aspx?accession=ENV 1.J.1-00581
0 18 5b 0 23
c
C-746-U Landfill Wells
Quarterly Compliance Monitoring Reports: http://paducaheic.com/Search.aspx?accession=ENV 1.J.1-00375
http://paducaheic.com/Search.aspx?accession=ENV 1.J.1-00419
http://paducaheic.com/Search.aspx?accession=ENV 1.J.1-00492
http://paducaheic.com/Search.aspx?accession=ENV 1.J.1-00580
0 13 8b 0 21
C-404 Landfill Wells (required by permit)
Semiannual C-404 Groundwater Monitoring Reports: http://paducaheic.com/Search.aspx?accession=ENV 1.J.1-00420
http://paducaheic.com/Search.aspx?accession=ENV 1.J.1-00582
0 5 4 0 9
C-404 Landfill Wells (noncommitted) 0 11 0 0 11d
C-746-K Landfill Wells
Semiannual FFA Progress Reports: http://paducaheic.com/Search.aspx?accession=ENV 1.A-00663
http://paducaheic.com/Search.aspx?accession=ENV 1.A-00791
4 0 0 0 4e
Northeast Plume Operations and Maintenance Program
Semiannual FFA Progress Reports: (see above for links)
Semiannual Wells 0 11 0 0 11
Quarterly Wells 0 5 0 0 5
Northwest Plume Operations and Maintenance Program
Semiannual FFA Progress Reports: (see above for links)
Semiannual Wells 0 33 0 0 33f
C-400 Cleaning Building Interim Remedial Action
Monitoring Wells
Semiannual FFA Progress Reports: (see above for links)
Semiannual Wells 0 8 0 0 8
Quarterly Wells 0 9 0 0 9
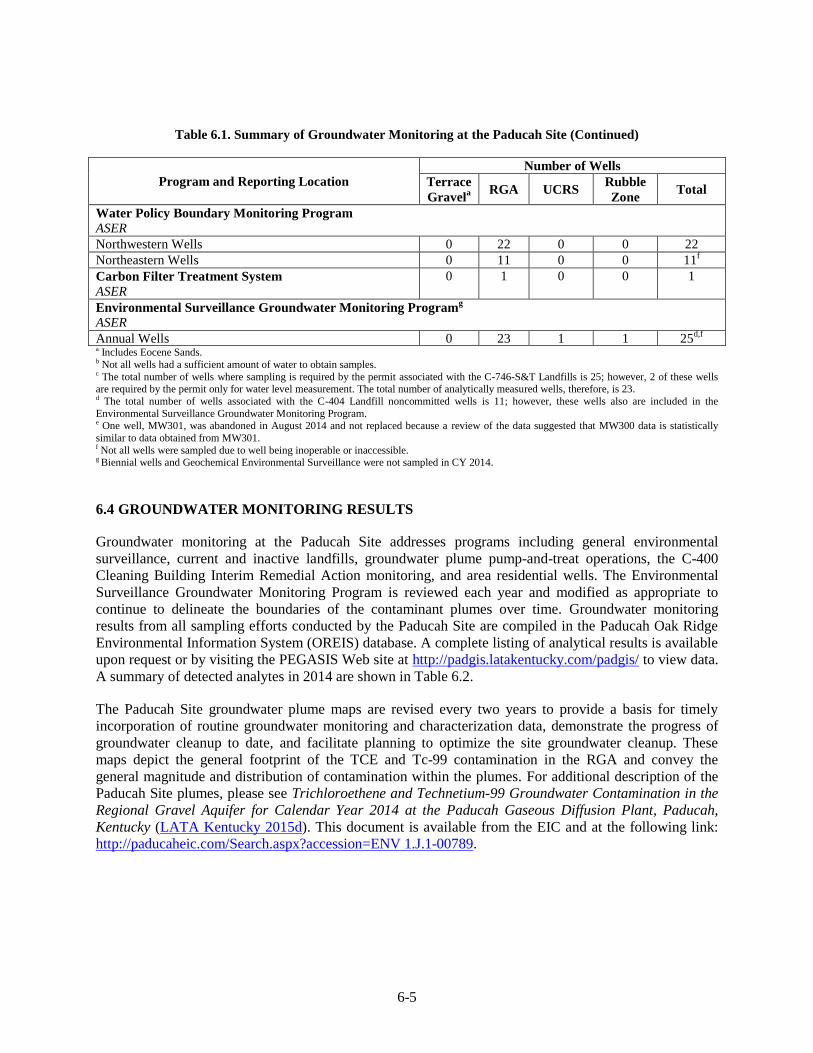
6-5
Table 6.1. Summary of Groundwater Monitoring at the Paducah Site (Continued)
Program and Reporting Location
Number of Wells
Terrace
Gravela
RGA UCRS Rubble
Zone Total
Water Policy Boundary Monitoring Program
ASER
Northwestern Wells 0 22 0 0 22
Northeastern Wells 0 11 0 0 11f
Carbon Filter Treatment System
ASER
0 1 0 0 1
Environmental Surveillance Groundwater Monitoring Programg
ASER
Annual Wells 0 23 1 1 25d,f
a Includes Eocene Sands. b Not all wells had a sufficient amount of water to obtain samples. c The total number of wells where sampling is required by the permit associated with the C-746-S&T Landfills is 25; however, 2 of these wells are required by the permit only for water level measurement. The total number of analytically measured wells, therefore, is 23. d The total number of wells associated with the C-404 Landfill noncommitted wells is 11; however, these wells also are included in the
Environmental Surveillance Groundwater Monitoring Program. e One well, MW301, was abandoned in August 2014 and not replaced because a review of the data suggested that MW300 data is statistically
similar to data obtained from MW301. f Not all wells were sampled due to well being inoperable or inaccessible. g Biennial wells and Geochemical Environmental Surveillance were not sampled in CY 2014.
6.4 GROUNDWATER MONITORING RESULTS
Groundwater monitoring at the Paducah Site addresses programs including general environmental
surveillance, current and inactive landfills, groundwater plume pump-and-treat operations, the C-400
Cleaning Building Interim Remedial Action monitoring, and area residential wells. The Environmental
Surveillance Groundwater Monitoring Program is reviewed each year and modified as appropriate to
continue to delineate the boundaries of the contaminant plumes over time. Groundwater monitoring
results from all sampling efforts conducted by the Paducah Site are compiled in the Paducah Oak Ridge
Environmental Information System (OREIS) database. A complete listing of analytical results is available
upon request or by visiting the PEGASIS Web site at http://padgis.latakentucky.com/padgis/ to view data.
A summary of detected analytes in 2014 are shown in Table 6.2.
The Paducah Site groundwater plume maps are revised every two years to provide a basis for timely
incorporation of routine groundwater monitoring and characterization data, demonstrate the progress of
groundwater cleanup to date, and facilitate planning to optimize the site groundwater cleanup. These
maps depict the general footprint of the TCE and Tc-99 contamination in the RGA and convey the
general magnitude and distribution of contamination within the plumes. For additional description of the
Paducah Site plumes, please see Trichloroethene and Technetium-99 Groundwater Contamination in the
Regional Gravel Aquifer for Calendar Year 2014 at the Paducah Gaseous Diffusion Plant, Paducah,
Kentucky (LATA Kentucky 2015d). This document is available from the EIC and at the following link:
http://paducaheic.com/Search.aspx?accession=ENV 1.J.1-00789.
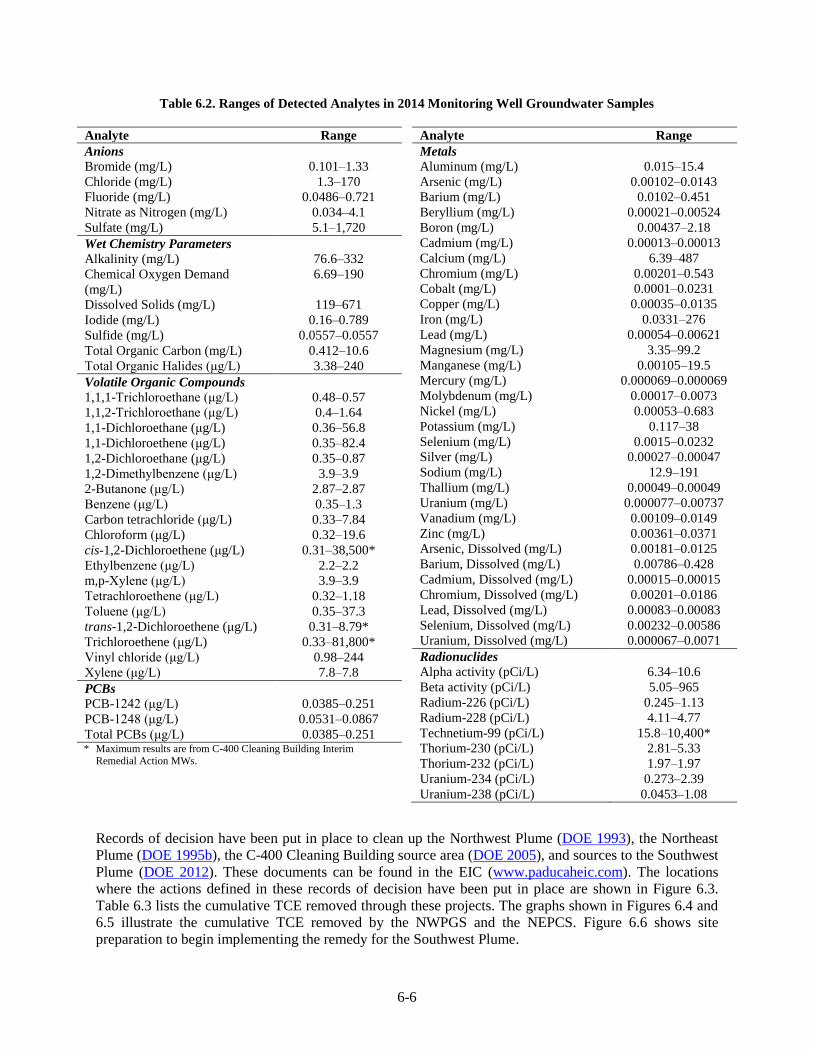
6-6
Table 6.2. Ranges of Detected Analytes in 2014 Monitoring Well Groundwater Samples
Analyte Range
Anions
Bromide (mg/L) 0.101–1.33
Chloride (mg/L) 1.3–170
Fluoride (mg/L) 0.0486–0.721
Nitrate as Nitrogen (mg/L) 0.034–4.1
Sulfate (mg/L) 5.1–1,720
Wet Chemistry Parameters
Alkalinity (mg/L) 76.6–332
Chemical Oxygen Demand
(mg/L)
6.69–190
Dissolved Solids (mg/L) 119–671
Iodide (mg/L) 0.16–0.789
Sulfide (mg/L) 0.0557–0.0557
Total Organic Carbon (mg/L) 0.412–10.6
Total Organic Halides (μg/L) 3.38–240
Volatile Organic Compounds
1,1,1-Trichloroethane (μg/L) 0.48–0.57
1,1,2-Trichloroethane (μg/L) 0.4–1.64
1,1-Dichloroethane (μg/L) 0.36–56.8
1,1-Dichloroethene (μg/L) 0.35–82.4
1,2-Dichloroethane (μg/L) 0.35–0.87
1,2-Dimethylbenzene (μg/L) 3.9–3.9
2-Butanone (μg/L) 2.87–2.87
Benzene (μg/L) 0.35–1.3
Carbon tetrachloride (μg/L) 0.33–7.84
Chloroform (μg/L) 0.32–19.6
cis-1,2-Dichloroethene (μg/L) 0.31–38,500*
Ethylbenzene (μg/L) 2.2–2.2
m,p-Xylene (μg/L) 3.9–3.9
Tetrachloroethene (μg/L) 0.32–1.18
Toluene (μg/L) 0.35–37.3
trans-1,2-Dichloroethene (μg/L) 0.31–8.79*
Trichloroethene (μg/L) 0.33–81,800*
Vinyl chloride (μg/L) 0.98–244
Xylene (μg/L) 7.8–7.8
PCBs
PCB-1242 (μg/L) 0.0385–0.251
PCB-1248 (μg/L) 0.0531–0.0867
Total PCBs (μg/L) 0.0385–0.251 * Maximum results are from C-400 Cleaning Building Interim
Remedial Action MWs.
Analyte Range
Metals
Aluminum (mg/L) 0.015–15.4
Arsenic (mg/L) 0.00102–0.0143
Barium (mg/L) 0.0102–0.451
Beryllium (mg/L) 0.00021–0.00524
Boron (mg/L) 0.00437–2.18
Cadmium (mg/L) 0.00013–0.00013
Calcium (mg/L) 6.39–487
Chromium (mg/L) 0.00201–0.543
Cobalt (mg/L) 0.0001–0.0231
Copper (mg/L) 0.00035–0.0135
Iron (mg/L) 0.0331–276
Lead (mg/L) 0.00054–0.00621
Magnesium (mg/L) 3.35–99.2
Manganese (mg/L) 0.00105–19.5
Mercury (mg/L) 0.000069–0.000069
Molybdenum (mg/L) 0.00017–0.0073
Nickel (mg/L) 0.00053–0.683
Potassium (mg/L) 0.117–38
Selenium (mg/L) 0.0015–0.0232
Silver (mg/L) 0.00027–0.00047
Sodium (mg/L) 12.9–191
Thallium (mg/L) 0.00049–0.00049
Uranium (mg/L) 0.000077–0.00737
Vanadium (mg/L) 0.00109–0.0149
Zinc (mg/L) 0.00361–0.0371
Arsenic, Dissolved (mg/L) 0.00181–0.0125
Barium, Dissolved (mg/L) 0.00786–0.428
Cadmium, Dissolved (mg/L) 0.00015–0.00015
Chromium, Dissolved (mg/L) 0.00201–0.0186
Lead, Dissolved (mg/L) 0.00083–0.00083
Selenium, Dissolved (mg/L) 0.00232–0.00586
Uranium, Dissolved (mg/L) 0.000067–0.0071
Radionuclides
Alpha activity (pCi/L) 6.34–10.6
Beta activity (pCi/L) 5.05–965
Radium-226 (pCi/L) 0.245–1.13
Radium-228 (pCi/L) 4.11–4.77
Technetium-99 (pCi/L) 15.8–10,400*
Thorium-230 (pCi/L) 2.81–5.33
Thorium-232 (pCi/L) 1.97–1.97
Uranium-234 (pCi/L) 0.273–2.39
Uranium-238 (pCi/L) 0.0453–1.08
Records of decision have been put in place to clean up the Northwest Plume (DOE 1993), the Northeast
Plume (DOE 1995b), the C-400 Cleaning Building source area (DOE 2005), and sources to the Southwest
Plume (DOE 2012). These documents can be found in the EIC (www.paducaheic.com). The locations
where the actions defined in these records of decision have been put in place are shown in Figure 6.3.
Table 6.3 lists the cumulative TCE removed through these projects. The graphs shown in Figures 6.4 and
6.5 illustrate the cumulative TCE removed by the NWPGS and the NEPCS. Figure 6.6 shows site
preparation to begin implementing the remedy for the Southwest Plume.
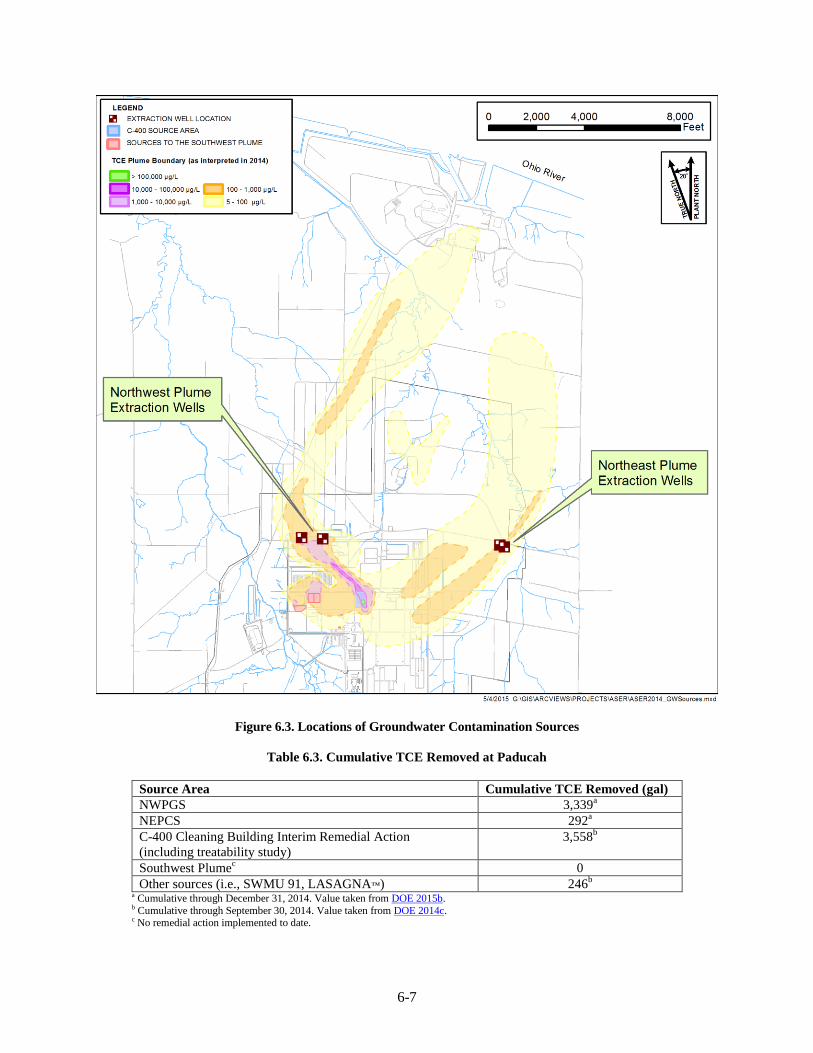
6-7
Figure 6.3. Locations of Groundwater Contamination Sources
Table 6.3. Cumulative TCE Removed at Paducah
Source Area Cumulative TCE Removed (gal)
NWPGS 3,339a
NEPCS 292a
C-400 Cleaning Building Interim Remedial Action
(including treatability study)
3,558b
Southwest Plumec 0
Other sources (i.e., SWMU 91, LASAGNA™) 246b
a Cumulative through December 31, 2014. Value taken from DOE 2015b. b Cumulative through September 30, 2014. Value taken from DOE 2014c. c No remedial action implemented to date.
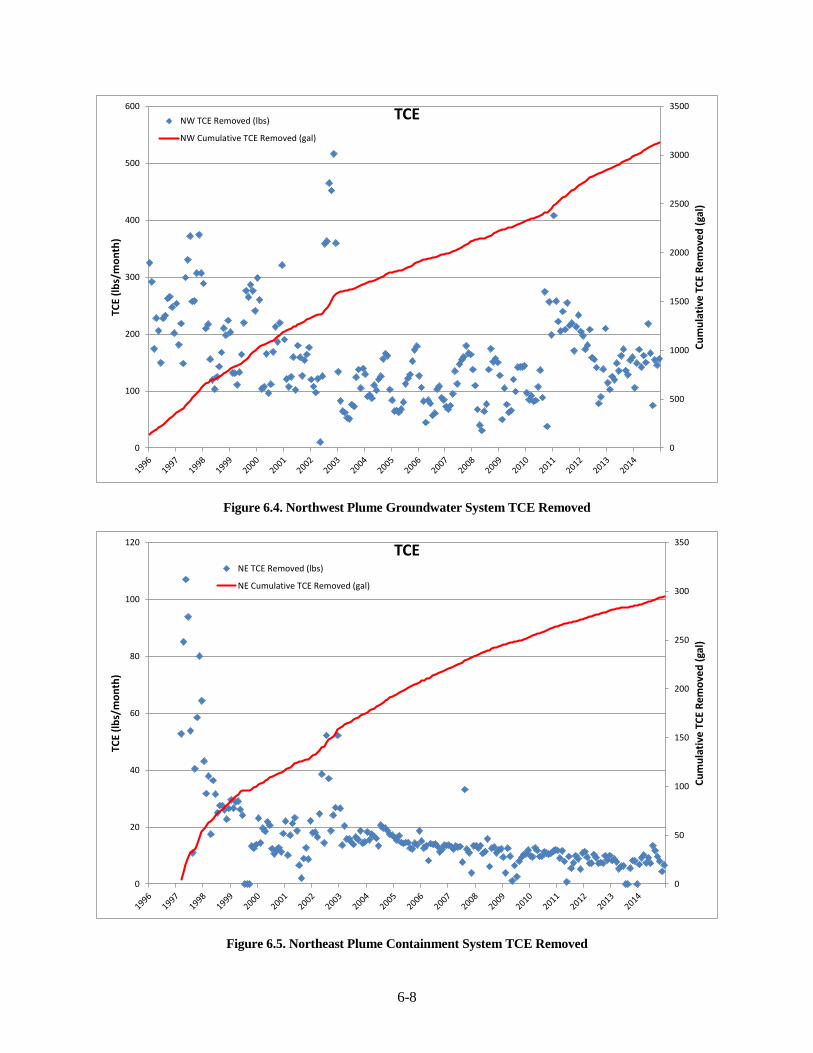
6-8
Figure 6.4. Northwest Plume Groundwater System TCE Removed
Figure 6.5. Northeast Plume Containment System TCE Removed
0
500
1000
1500
2000
2500
3000
3500
0
100
200
300
400
500
600
Cu
mu
lati
ve T
CE
Rem
ove
d (
gal)
TCE
(lb
s/m
on
th)
TCENW TCE Removed (lbs)
NW Cumulative TCE Removed (gal)
0
50
100
150
200
250
300
350
0
20
40
60
80
100
120
Cu
mu
lati
ve T
CE
Rem
ove
d (
gal)
TCE
(lb
s/m
on
th)
TCENE TCE Removed (lbs)
NE Cumulative TCE Removed (gal)
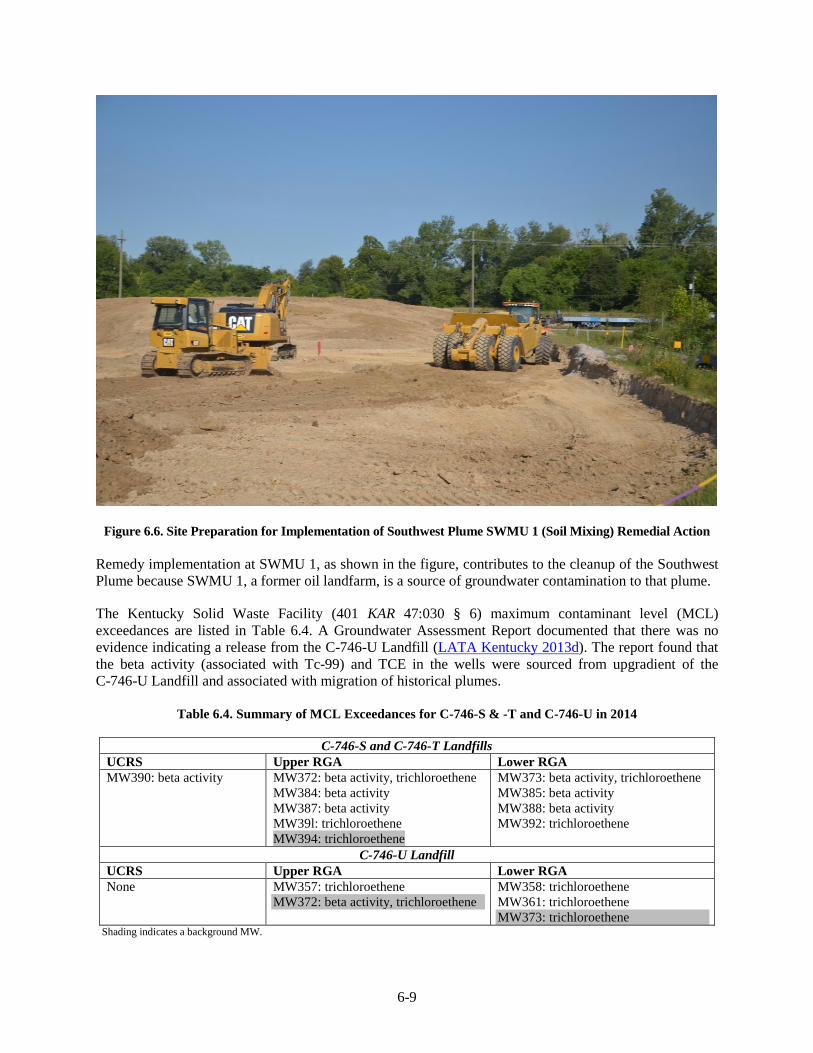
6-9
Figure 6.6. Site Preparation for Implementation of Southwest Plume SWMU 1 (Soil Mixing) Remedial Action
Remedy implementation at SWMU 1, as shown in the figure, contributes to the cleanup of the Southwest
Plume because SWMU 1, a former oil landfarm, is a source of groundwater contamination to that plume.
The Kentucky Solid Waste Facility (401 KAR 47:030 § 6) maximum contaminant level (MCL)
exceedances are listed in Table 6.4. A Groundwater Assessment Report documented that there was no
evidence indicating a release from the C-746-U Landfill (LATA Kentucky 2013d). The report found that
the beta activity (associated with Tc-99) and TCE in the wells were sourced from upgradient of the
C-746-U Landfill and associated with migration of historical plumes.
Table 6.4. Summary of MCL Exceedances for C-746-S & -T and C-746-U in 2014
C-746-S and C-746-T Landfills
UCRS Upper RGA Lower RGA
MW390: beta activity MW372: beta activity, trichloroethene
MW384: beta activity
MW387: beta activity
MW39l: trichloroethene
MW394: trichloroethene
MW373: beta activity, trichloroethene
MW385: beta activity
MW388: beta activity
MW392: trichloroethene
C-746-U Landfill
UCRS Upper RGA Lower RGA
None MW357: trichloroethene
MW372: beta activity, trichloroethene
MW358: trichloroethene
MW361: trichloroethene
MW373: trichloroethene Shading indicates a background MW.

6-10
Statistical analyses also are used to evaluate compliance MWs at the C-746-S and C-746-T Landfill, the
C-746-U Landfill, and the C-404 Landfill. Each report (see Table 6.1) lists any statistical exceedance that
is found.
7-1
7. QUALITY ASSURANCE
The Paducah Site maintains a QA/Quality Control (QC) Program to verify the integrity of data generated
within the Environmental Monitoring Program. Each aspect of the monitoring program, from sample
collection to data reporting, must comply with quality requirements and assessment standards.
Requirements and guidelines for the QA/QC Program at the Paducah Site are established by the
following:
DOE Order 414.1D, Quality Assurance;
Quality Assurance Program and Implementation Plan for the Paducah Environmental Remediation
Project,, PAD-PLA-QM-001;
Commonwealth of Kentucky and federal regulations and guidance from EPA;
American National Standards Institute;
American Society of Mechanical Engineers;
American Society for Testing and Materials (ASTM); and
American Society for Quality Control.
The QA/QC Program specifies organizational and programmatic elements to control equipment, design,
documents, data, nonconformances, and records. Emphasis is placed on planning, implementing, and
assessing activities and implementing effective corrective actions, as necessary. Program requirements are
specified in project and subcontract documents to ensure that requirements are included in
project-specific QA plans and other planning documents. The Paducah Site uses DOE Consolidated Audit
Program (DOECAP)-audited laboratories. DOECAP implements annual performance qualification audits
of environmental analytical laboratories and commercial waste treatment, storage, and disposal facilities
to support complex-wide DOE mission activities.
In 2014, the EMP defined the relationship of each element of the Environmental Monitoring Program.
The Environmental Monitoring Quality Assurance Project Plan (QA Plan) defined the relationship of
each element of the Environmental Monitoring Program to key quality and data management
requirements. The QA Plan is an appendix to the EMP (LATA Kentucky 2013a; LATA Kentucky 2015a).
The Paducah Programmatic Quality Assurance Project Plan was implemented in 2013 (DOE 2013b). This
plan is based on the Uniform Federal Policy for Quality Assurance Project Plans. Additionally, the
following procedures further ensure quality:
Field forms are maintained in accordance with PAD-RM-1009, Records Management, Administrative
Record, and Document Control.
Communication and documentation between the sample and data management organization and field
sampling personnel are conducted in accordance with PAD-ENM-5007, Data Management
Coordination.
7-2
Sample labels and chains-of-custody are completed according to PAD-ENM-2708, Chain-of-Custody
Forms, Field Sample Logs, Sample Labels, and Custody Seals.
Data assessment is conducted by a technical reviewer or their designee according to
PAD-ENM-5003, Quality Assured Data.
Logbooks and data forms are prepared in accordance with PAD-ENM-2700, Logbooks and Data
Forms.
The QA Plan and the procedures cited above were in effect and covered data collected during the time
frame of January through December 2014. Additional subjects included in the QA Plan are training
requirements, sample custody, procedures, and instrument calibration and maintenance.
7.1 FIELD SAMPLING QUALITY CONTROL
7.1.1 Data Quality Objectives and Sample Planning
From the start of any sampling program, data quality objectives (DQOs) play an important role in setting the
number of samples, location of sampling sites, sampling methods, sampling schedules, and coordination of
sampling and analytical resources to meet critical completion times. These sampling program criteria are
documented in the Paducah Site EMP (LATA Kentucky 2013a; LATA Kentucky 2015a). The Paducah
Site EMP is evaluated and modified, as appropriate, using the DQO methodology on an FY basis (i.e.,
October 1 through September 30) following EPA DQO guidance (EPA QA/G-4).
Each sampling location and sample collected is assigned a unique identification number. Each segment of
the identification number sequence is used to designate information concerning the location from which a
sample is collected. To progress from planning to implementing the DQOs, an analytical statement of
work (SOW) for the analytical laboratory was generated from a system within the Paducah Integrated
Data System. From this system, the Project Environmental Measurements System (PEMS), an electronic
database used for managing and streamlining field-generated and laboratory-generated data, is populated
with sample identification numbers, sampling locations, sampling methods, analytical parameters,
analytical methods, and sample container and preservative requirements. This information is used to
produce sample bottle labels and chain-of-custody forms for each sampling event.
7.1.2 Field Measurements
Field measurements for the groundwater and surface water monitoring program are collected in the field
and include water level measurements, pH, conductivity, flow rate, turbidity, temperature, dissolved
oxygen, total residual chlorine, ORP (oxidation/reduction potential), and barometric pressure.
Environmental conditions, such as ambient temperature and weather, also are recorded. Field
measurements are collected, downloaded electronically, recorded on appropriate field forms or recorded
in logbooks, and input into PEMS.
7.1.3 Sampling Procedures
Samples are collected using media-specific procedures, which are written according to EPA-approved
sampling methods. Sample media consist of surface water, groundwater, and sediment. Sample
information recorded during a sampling event consists of the sample identification number, station (or
location), date collected, time collected, and person who performed the sampling. This information, which
is documented in a logbook or data form, on a chain-of-custody form, and on the sample container label,
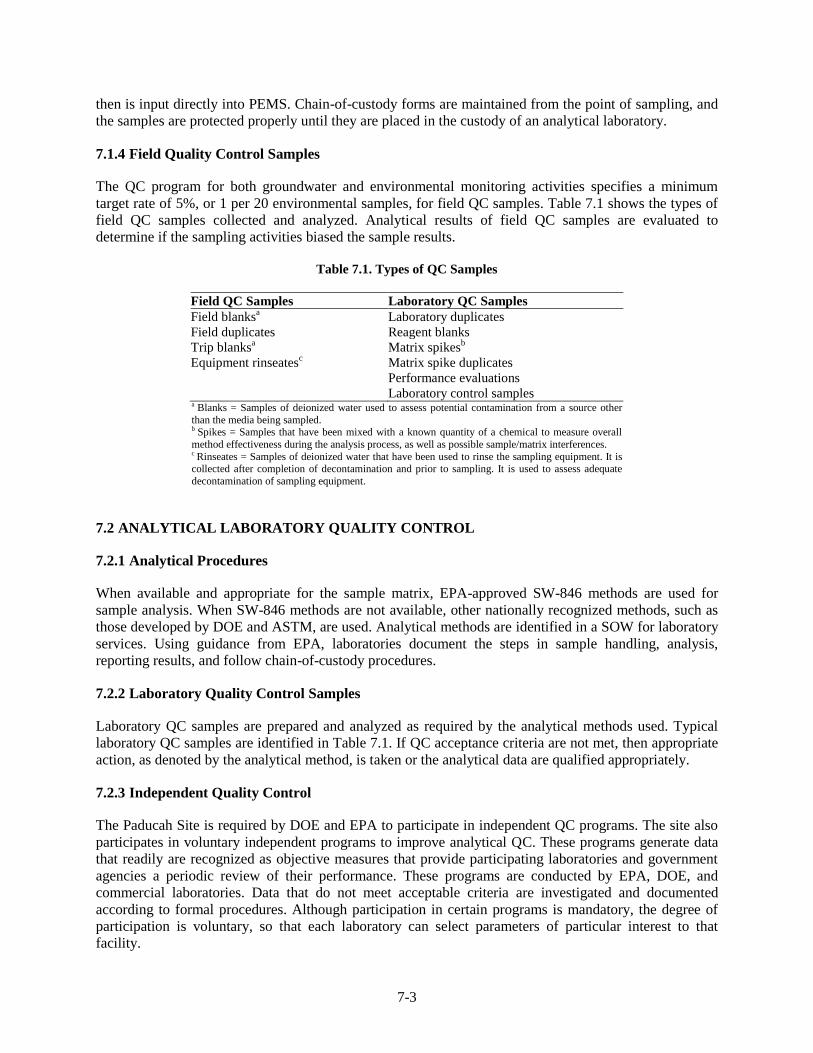
7-3
then is input directly into PEMS. Chain-of-custody forms are maintained from the point of sampling, and
the samples are protected properly until they are placed in the custody of an analytical laboratory.
7.1.4 Field Quality Control Samples
The QC program for both groundwater and environmental monitoring activities specifies a minimum
target rate of 5%, or 1 per 20 environmental samples, for field QC samples. Table 7.1 shows the types of
field QC samples collected and analyzed. Analytical results of field QC samples are evaluated to
determine if the sampling activities biased the sample results.
Table 7.1. Types of QC Samples
Field QC Samples Laboratory QC Samples
Field blanksa Laboratory duplicates
Field duplicates Reagent blanks
Trip blanksa Matrix spikes
b
Equipment rinseatesc Matrix spike duplicates
Performance evaluations
Laboratory control samples a Blanks = Samples of deionized water used to assess potential contamination from a source other
than the media being sampled. b Spikes = Samples that have been mixed with a known quantity of a chemical to measure overall
method effectiveness during the analysis process, as well as possible sample/matrix interferences. c Rinseates = Samples of deionized water that have been used to rinse the sampling equipment. It is collected after completion of decontamination and prior to sampling. It is used to assess adequate
decontamination of sampling equipment.
7.2 ANALYTICAL LABORATORY QUALITY CONTROL
7.2.1 Analytical Procedures
When available and appropriate for the sample matrix, EPA-approved SW-846 methods are used for
sample analysis. When SW-846 methods are not available, other nationally recognized methods, such as
those developed by DOE and ASTM, are used. Analytical methods are identified in a SOW for laboratory
services. Using guidance from EPA, laboratories document the steps in sample handling, analysis,
reporting results, and follow chain-of-custody procedures.
7.2.2 Laboratory Quality Control Samples
Laboratory QC samples are prepared and analyzed as required by the analytical methods used. Typical
laboratory QC samples are identified in Table 7.1. If QC acceptance criteria are not met, then appropriate
action, as denoted by the analytical method, is taken or the analytical data are qualified appropriately.
7.2.3 Independent Quality Control
The Paducah Site is required by DOE and EPA to participate in independent QC programs. The site also
participates in voluntary independent programs to improve analytical QC. These programs generate data
that readily are recognized as objective measures that provide participating laboratories and government
agencies a periodic review of their performance. These programs are conducted by EPA, DOE, and
commercial laboratories. Data that do not meet acceptable criteria are investigated and documented
according to formal procedures. Although participation in certain programs is mandatory, the degree of
participation is voluntary, so that each laboratory can select parameters of particular interest to that
facility.
7-4
The EPA and KDOW require, as part of their QA program, a laboratory QA study. Each laboratory
performing analyses to demonstrate KPDES permit compliance is required to participate. Four
laboratories and the LATA Kentucky sampling organization participated in the study in 2014. Final
results for the Discharge Monitoring Report QA Study Number 34 were “acceptable.” Discharge
Monitoring Report QA Study results were provided to KDOW and EPA, as required.
7.2.4 Laboratory Audits/Sample and Data Management Organization
Laboratory audits are performed annually by DOECAP to ensure that the laboratories are in compliance
with regulations, methods, and procedures. The audited laboratories are included on the
DOECAP-audited listing for use by the sample and data management organization. Findings are
documented and addressed by the audited laboratory through corrective actions. LATA Kentucky reviews
DOECAP audit reports and laboratory corrective action plans for compliance with LATA Kentucky
requirements on an annual basis.
7.3 DATA MANAGEMENT
7.3.1 Project Environmental Measurements System
The data generated from sampling events are stored in PEMS, a consolidated site data system for tracking
and managing data. The system is used to manage field-generated data, import laboratory-generated data,
input data qualifiers identified during the data review process, and transfer data to the Paducah OREIS
database for reporting. PEMS uses a variety of references and code lists to ensure consistency and
standardization of the data.
7.3.2 Paducah OREIS
Paducah OREIS is the database used to consolidate data generated by the Environmental Monitoring
Program. Data consolidation consists of the activities necessary to prepare the evaluated data for the
users. The PEMS files containing the assessed data are transferred from PEMS to Paducah OREIS for
future use. The data manager is responsible for notifying the project team and other data users of the
available data. Data used in reports distributed to external agencies (e.g., the quarterly landfill reports and
the ASER) are obtained from Paducah OREIS and have been through the data review process. [The data
review process is documented in Data and Documents Management and Quality Assurance Plan for
Paducah Environmental Management and Enrichment Facilities, Section 8.4 (DOE 1998)].
7.3.3 PEGASIS
PEGASIS allows access to environmental sampling data and site-specific geographic information system
features through the Internet. PEGASIS includes analytical sample results from various environmental
studies, restoration reports and supporting documents, and maps. Environmental data loaded to Paducah
OREIS has been assessed, verified, and validated (if applicable), as specified in PAD-ENM-5003, Quality
Assured Data. Environmental data from Paducah OREIS is loaded into PEGASIS on a monthly basis.
PEGASIS does not contain data related to waste or facility characterization. Access to PEGASIS is
available at http://padgis.latakentucky.com/padgis/.
7.3.4 Electronic Data Deliverables
A “results only” electronic data deliverable (EDD) is requested for all samples analyzed by each
laboratory. The results and qualifier information from the EDD are checked in addition to the format of
7-5
all fields provided. Discrepancies are reported immediately to the laboratory so corrections can be made
or new EDDs can be issued. Approximately 10% of the EDDs are checked randomly to verify that the
laboratory continues to provide adequate EDDs.
7.3.5 Data Packages
A “forms only” Level III data package is requested from the laboratory when data validation is to be
performed on a specific sampling event or media. All data packages received from the fixed-base
laboratory are tracked, reviewed, and maintained in a secure environment. The following information is
tracked: sample delivery group number, date received, receipt of any EDD, and comments. The contents
of the data package and the chain-of-custody forms are compared and discrepancies identified.
Discrepancies are reported immediately to the laboratory and data validators. All data packages are
forwarded electronically to the Document Management Center for permanent storage.
7.3.6 Laboratory Contractual Screening
Laboratory contractual screening is the process of evaluating a set of data against the requirements
specified in the analytical SOW to ensure that all requested information is received. The contractual
screening includes, but is not limited to, the chain-of-custody form, analytes requested, method used,
units, holding times, and reporting limits achieved. The contractual screening is conducted electronically
upon receipt of data from the analytical laboratory. Any exception to the SOW is identified and
documented.
7.3.7 Data Verification, Validation, and Assessment
Data verification is the process for comparing a data set against a set standard or contractual requirement.
Verification is performed electronically, manually, or by a combination of both. Data verification includes
contractual screening and other criteria specific to the data. Data are flagged as necessary. Verification
qualifiers are stored in PEMS and transferred with the data to Paducah OREIS.
Data validation is the process performed by a qualified individual for a data set, independent from
sampling, laboratory, project management, or other decision making personnel. Data validation evaluates
laboratory adherence to analytical method requirements. Validation qualifiers are stored in PEMS and
transferred with the data to Paducah OREIS. Data from routine sampling events are validated
programmatically at a frequency of 5% of the total data packages. Each of the selected data packages,
which make up 5% of the total number of data packages, is validated 100%. From the environmental
monitoring data, 50 packages were validated in CY 2014.
Data assessment is the process for assuring that the type, quality, and quantity of data are appropriate for
its intended use based on the DQOs. It allows for the determination that a decision (or estimate) can be
made with the desired level of confidence, given the quality of the data set. Data assessment follows data
verification and data validation (if applicable) and must be performed at a rate of 100% to ensure data are
useable. The data assessment is conducted by trained technical personnel in conjunction with other
project team members. Assessment qualifiers are stored in PEMS and transferred with the data to Paducah
OREIS. Data are made available for reporting from Paducah OREIS upon completion of the data
assessment, and associated documentation is filed with the project files. Rejected data identified in the
verification or validation process are noted as rejected in OREIS.

THIS PAGE INTENTIONALLY LEFT BLANK
8-1
8. REFERENCES
BJC (Bechtel Jacobs Company LLC) 1998. The Polychlorinated Biphenyl Annual Compliance Agreement
Report for the Paducah Gaseous Diffusion Plant, January 1 – December 31, 1997, BJC/PAD-10,
Bechtel Jacobs Company LLC, Paducah, KY, June.
BJC 2006. Cultural Resources Survey for the Paducah Gaseous Diffusion Plant, Paducah, Kentucky,
BJC/PAD-688/R1, Bechtel Jacobs Company LLC, Paducah, KY, March.
BWCS (B&W Conversion Services, LLC) 2014. Letter to Ms. Sara Beard, Division of Water,
Commonwealth of Kentucky, from John D. Wollery, President and Project Manager, “Contract
No. DE-AC30-11CC40015, DUF6 Conversion Project Paducah Gaseous Diffusion Plant, Toxicity
Reduction Evaluation (TRE) Second Quarter 2014 Progress Report Agency Interest
Number 3059, Kentucky Pollutant Discharge Elimination System Permit No: KY0004049,”
July 30.
CH2M HILL 1991. Results of the Site Investigation Phase I, at the Paducah Gaseous Diffusion Plant,
Paducah, Kentucky, KY/ER-4, CH2M HILL, Paducah, KY.
CH2M HILL 1992. Results of the Site Investigation, Phase II, at the Paducah Gaseous Diffusion Plant,
Paducah, Kentucky, KY/SUB/13B-97777C P-03/1991/1, CH2M HILL, Paducah, KY.
COE (U.S. Army Corps of Engineers) 1994. Environmental Investigations at the Paducah Gaseous
Diffusion Plant and Surrounding Area, McCracken County, Kentucky, Five Volumes, U.S. Army
Corps of Engineers, Waterways Experiment Station, Vicksburg, MS.
DOC (U.S. Department of Commerce) 2015. McCracken County Quick Facts from the U.S. Census
Bureau, http://quickfacts.census.gov/gfd/states/21/21145.html (accessed April 24, 2015).
DOE (U.S. Department of Energy) 1993. Record of Decision for Interim Remedial Action at the
Northwest Plume at the Paducah Gaseous Diffusion Plant, Paducah, Kentucky,
DOE/OR/06-1143&D4, Science Applications International Corporation, Paducah, KY, July.
DOE 1995a. Environmental Assessment for the Construction, Operation, and Closure of the Solid Waste
Landfill at the Paducah Gaseous Diffusion Plant, Paducah, Kentucky, DOE/EA-1046,
U.S. Department of Energy, Oak Ridge, TN.
DOE 1995b. Record of Decision for Interim Remedial Action at the Northeast Plume at the Paducah
Gaseous Diffusion Plant, Paducah, Kentucky, DOE/OR/06-1356&D2, Jacobs Engineering
Group, Inc., Paducah, KY, June.
DOE 1998. Data and Documents Management and Quality Assurance Plan for Paducah Environmental
Management and Enrichment Facilities, DOE/OR/07-1595&D2, Bechtel Jacobs Company LLC,
Kevil, KY.
DOE 1999. Final Programmatic Environmental Impact Statement for Alternative Strategies for the
Long-Term Management and Use of Depleted Uranium Hexafluoride, DOE/EIS-0269, Office of
Nuclear Energy, Science and Technology, April.
DOE 2001. Feasibility Study for the Groundwater Operable Unit at Paducah Gaseous Diffusion Plant,
Paducah, Kentucky, DOE/OR/07-1857&D2, U.S. Department of Energy, Paducah, KY, August.
8-2
DOE 2005. Record of Decision for Interim Remedial Action for the Groundwater Operable Unit for the
Volatile Organic Compound Contamination at the C-400 Cleaning Building at the Paducah
Gaseous Diffusion Plant Paducah, Kentucky, DOE/OR/07-2150&D2/R2, Bechtel Jacobs
Company LLC, Paducah, KY, July.
DOE 2010. Removal Action Work Plan Addendum for C-410 Complex Infrastructure D&D Project at the
Paducah Gaseous Diffusion Plant, Paducah, Kentucky, DOE/LX/07-0304&D2/R1,
U.S. Department of Energy, Paducah, KY, August.
DOE 2011. DOE Standard, Derived Concentration Technical Standard, DOE-STD-1196-2011, U.S.
Department of Energy, Washington, DC, April.
DOE 2012. Record of Decision for Solid Waste Management Units 1, 211-A, 211-B, and Part of 102
Volatile Organic Compound Sources for the Southwest Groundwater Plume at the Paducah
Gaseous Diffusion Plant, Paducah, Kentucky, DOE/LX/07-0365&D2/R1, U.S. Department of
Energy, Paducah, KY, March.
DOE 2013a. Community Relations Plan under the Federal Facility Agreement at the Paducah Gaseous
Diffusion Plant, DOE/OR/07-2099&D2/R8, U.S. Department of Energy, Paducah, KY, June.
DOE 2013b. Paducah Gaseous Diffusion Plant Programmatic Quality Assurance Project Plan,
DOE/LX/07-1269&D2/R1, U.S. Department of Energy, Paducah, KY, February.
DOE 2014a. Site Management Plan Paducah Gaseous Diffusion Plant, Paducah, Kentucky, Annual
Revision—FY 2014, DOE/LX/07-1292&D2/R1, U.S. Department of Energy, Paducah, KY,
August.
DOE 2014b. Methods for Conducting Risk Assessments and Risk Evaluations at the Paducah Gaseous
Diffusion Plant, Paducah, Kentucky, DOE/LX/07-0107&D2/R4, Volume 1, Human Health,
U.S. Department of Energy, Paducah, KY, September.
DOE 2014c. U.S. Department of Energy Paducah Gaseous Diffusion Plant Federal Facility Agreement
Semiannual Progress Report for the Second Half of Fiscal Year 2014 Paducah, Kentucky,
DOE/LX/07-1296/V2, U.S. Department of Energy, Paducah, KY, October.
DOE 2015a. “2014 Site Treatment Plan Annual Update for the U.S. Department Of Energy, Paducah
Gaseous Diffusion Plant, Paducah, Kentucky, and the Paducah Site Treatment Plan Waste
Minimization Progress Report,” PPPO-02-2833640-15 Jennifer Woodard, Paducah Site Lead to
Mr. Anthony R. Hatton, Director, Kentucky Department for Environmental Protection, March 31.
DOE 2015b. U.S. Department of Energy Paducah Gaseous Diffusion Plant Federal Facility Agreement
Semiannual Progress Report for the First Half of Fiscal Year 2015 Paducah, Kentucky,
DOE/LX/07-2181/V1, U.S. Department of Energy, Paducah, KY, April.
EPA (U.S. Environmental Protection Agency) 1992. Compliance Agreement between the United States
Department of Energy and the United States Environmental Protection Agency, Washington,
D.C., U.S. Environmental Protection Agency, Washington, DC, February.
EPA 1998. Federal Facility Agreement for the Paducah Gaseous Diffusion Plant, U.S. Environmental
Protection Agency, Atlanta, GA, February 13.
8-3
ESRI (Environmental Systems Research Institute, Inc.) 2012. Population layer by zip code created in
conjunction with Tom-Tom from 2010 census data.
FEMA (Federal Emergency Management Agency) 2013. Flood Insurance Rate Map,
http://map1.msc.fema.gov/idms/IntraView.cgi?KEY=36310734&IFIT=1 (accessed March 18,
2013).
FPDP (Fluor Federal Services, Inc., Paducah Deactivation Project) 2014. Fiscal Year 2015 Site
Sustainability Plan for the Fluor Federal Services, Inc. Paducah Deactivation Project, Paducah,
Kentucky, CP2-ES-0102, Fluor Federal Services, Inc., Paducah, KY, December.
FWS (U.S. Fish and Wildlife Service) 2014. “Endangered, Threatened, Proposed & Candidate Species in
McCracken County, Kentucky,” http://www.fws.gov/frankfort/pdf/KY_te_list_by_county.pdf
(updated January 2014).
Garland, Jennifer M. 2008. U.S. Department of the Interior, Fish and Wildlife Service. Frankfort, KY.
“Final Biological Opinion: Proposed Participation In and Approval of Conservation Memoranda
of Agreement for the Indiana Bat (Myotis sodalis),” memorandum to Field Supervisor, Frankfort,
KY, June 5.
Illinois American Water 2015. “2014 Annual Water Quality Report Cairo District,”
http://www.amwater.com/ccr/cairo.pdf (accessed September 1, 2015).
LATA Kentucky (LATA Environmental Services of Kentucky, LLC) 2011. Bayou Creek and Little
Bayou Creek Watershed Monitoring Plan, Paducah Gaseous Diffusion Plant, Paducah,
Kentucky, PAD-PROJ-0003, LATA Environmental Services of Kentucky, LLC, Kevil, KY,
September.
LATA Kentucky 2013a. Environmental Monitoring Plan, Fiscal Year 2014, Paducah Gaseous Diffusion
Plant, Paducah, Kentucky, PAD-ENM-0055/R3, LATA Environmental Services of Kentucky,
LLC, Kevil, KY, November.
LATA Kentucky 2013b. LATA Environmental Services of Kentucky, LLC, Environmental Radiation
Protection Program at the Paducah Gaseous Diffusion Plant, Paducah, Kentucky,
PAD-PROG-0055, LATA Environmental Services of Kentucky, LLC, Kevil, KY, November.
LATA Kentucky 2013c. National Emission Standards for Hazardous Air Pollutants Management Plan
for Emission of Radionuclides for the U.S. Department of Energy Operations at the Paducah Site,
Paducah, Kentucky, PAD-REG-1017, LATA Environmental Services of Kentucky, LLC, Kevil,
KY, November.
LATA Kentucky 2013d. Groundwater Assessment Report for the C-746-U Solid Waste Landfill at the
Paducah Gaseous Diffusion Plant, Paducah, Kentucky, PAD-ENM-0064/R1, LATA
Environmental Services of Kentucky, LLC, Kevil, KY, May.
LATA Kentucky 2014a. Best Management Practices Plan, Paducah Gaseous Diffusion Plant, Paducah,
Kentucky, PAD-REG-1006/R1, LATA Environmental Services of Kentucky, LLC, Kevil, KY,
November.
LATA Kentucky 2014b. Groundwater Protection Plan for the Paducah Gaseous Diffusion Plant,
Paducah, Kentucky, PAD-PROJ-0018/R1, LATA Environmental Services of Kentucky, LLC,
Kevil, KY, February.
8-4
LATA Kentucky 2015a. Environmental Monitoring Plan, Fiscal Year 2015, Paducah Gaseous Diffusion
Plant, Paducah, Kentucky, PAD-ENM-0055/R4, LATA Environmental Services of Kentucky,
LLC, Kevil, KY, January.
LATA Kentucky 2015b. Annual Document of Polychlorinated Biphenyls at the Paducah Gaseous
Diffusion Plant, Paducah, Kentucky, for January 1, 2013–December 31, 2013, PAD-SO-0054,
LATA Environmental Services of Kentucky, LLC, Kevil, KY, June.
LATA Kentucky 2015c. National Emissions Standards for Hazardous Air Pollutants Annual Report for
2014 U.S. Department of Energy Emissions at the Paducah Gaseous Diffusion Plant,
PAD-REG-1024, LATA Environmental Services of Kentucky, LLC, Kevil, KY, June.
LATA Kentucky 2015d. Annual Report on External Radiation Monitoring for CY 2014, Paducah
Gaseous Diffusion Plant, Paducah, Kentucky, PAD-RAD-0624, LATA Environmental Services
of Kentucky, LLC, Kevil, KY, April.
LATA Kentucky 2015e. Trichloroethene and Technetium-99 Groundwater Contamination in the
Regional Gravel Aquifer for Calendar Year 2012 at the Paducah Gaseous Diffusion Plant,
Paducah, Kentucky, PAD-ENR-0136, LATA Environmental Services of Kentucky, LLC, Kevil,
KY, June.
MMES (Martin Marietta Energy Systems, Inc.) 1992. Report of the Paducah Gaseous Diffusion Plant
Groundwater Investigation, Phase III, KY/E-150, Martin Marietta Energy Systems, Inc.,
Paducah, KY, November 25.
Moonshadow Mobile 2015. CensusViewer, Cairo, Illinois Population: Census 2010 and 2000 Interactive
Map, Demographics, Statistics, Quick Facts, accessed from
http://censusviewer.com/city/IL/Cairo, August 28, 2015.
NCRP (National Council on Radiation Protection and Measurements) 2009. “Ionizing Radiation
Exposure of the Population of the United States,” NCRP Report No. 160, National Council on
Radiation Protection and Measurements, Washington, DC.
SST (Swift & Staley Team) 2014. Fiscal Year 2015 Site Sustainability Plan, Paducah Gaseous Diffusion
Plant, SST.SSPP-0001/R1, Swift & Staley Team, Paducah, KY, December.

G-1
GLOSSARY
absorption—The process by which the number and energy of particles or photons entering a body of
matter are reduced by interaction with the matter.
adsorption—The accumulation of gases, liquids, or solutes on the surface of a solid or liquid.
activity—See radioactivity.
air stripping—The process of bubbling air through water to remove volatile organic compounds from the
water.
alpha particle—A positively charged particle emitted from the nucleus of an atom having the same
charge and mass as that of a helium nucleus (two protons and two neutrons).
ambient air—The atmosphere around people, plants, and structures.
analyte—A constituent or parameter being analyzed.
aquifer—A geologic formation, group of formations, or part of a formation capable of yielding a
significant amount of groundwater to wells or springs.
assimilate—To take up or absorb.
atom—Smallest particle of an element capable of entering into a chemical reaction.
authorized limit—A limit on the concentration or quantity of residual radioactive material on the
surfaces or within property that has been derived consistent with DOE directives including the as low as
reasonably achievable (ALARA) process requirements. An authorized limit also may include conditions
or measures that limit or control the disposition of property.
beta particle—A negatively charged particle emitted from the nucleus of an atom. It has a mass and
charge equal to those of an electron.
biota—The animal and plant life of a particular region considered as a total ecological entity.
chain-of-custody form—A form that documents sample collection, transport, analysis, and disposal.
clearance of property—The removal of property that contains residual radioactive material from DOE
radiological control under 10 CFR § 835 and DOE Order 458.1.
closure—Formal shutdown of a hazardous waste management facility under Resource Conservation and
Recovery Act requirements.
compliance—Fulfillment of applicable requirements of a plan or schedule ordered or approved by
government authority.
concentration—The amount of a substance contained in a unit volume or mass of a sample.
G-2
conductivity—A measure of a material’s capacity to convey an electric current. For water, this property
is related to the total concentration of the ionized substances in water and the temperature at which the
measurement is made.
confluence—The point at which two or more streams meet; the point where a tributary joins the main
stream.
congener—Any particular member of a class of chemical substances. A specific congener is denoted by a
unique chemical structure.
contained landfill—A solid waste site or facility that accepts disposal of solid waste. The technical
requirements for contained landfills are found in 401 KAR 47:080, 48:050, and 48:070 to 48:090.
contamination—Deposition of radioactive material on the surfaces of structures, areas, objects, or
personnel; or introduction of microorganisms, chemicals, toxic substances, wastes, or wastewater into
water, air, and soil in a concentration greater than that found naturally.
cosmic radiation—Ionizing radiation with very high energies that originates outside the earth’s
atmosphere. Cosmic radiation is one contributor to natural background radiation.
curie (Ci)—A unit of radioactivity. One curie is defined as 3.7 × 10¹⁰
(37 billion) disintegrations per
second. Several fractions and multiples of the curie are used commonly:
kilocurie (kCi)—103 Ci, one thousand curies; 3.7 × 10
13 disintegrations per second.
millicurie (mCi)—10-3
Ci, one-thousandth of a curie; 3.7 × 10⁷ disintegrations per second.
microcurie (µCi)—10-6
Ci, one-millionth of a curie; 3.7 × 10⁴ disintegrations per second.
picocurie (pCi)—10-12
Ci, one-trillionth of a curie; 3.7 × 10⁻²
disintegrations per second.
daughter—A nuclide formed by the radioactive decay of a parent nuclide.
decay, radioactive—The spontaneous transformation of one radionuclide into a different radioactive or
nonradioactive nuclide or into a different energy state of the same radionuclide.
dense nonaqueous-phase liquid (DNAPL)—The liquid phase of chlorinated organic solvents. These
liquids are denser than water and include commonly used industrial compounds such as tetrachloroethene
and trichloroethene.
derived concentration technical standard (DCS)—A DOE technical standard that documents the
derived concentration value for a radionuclide in water that would result in a dose of 100 mrem in a year
to a gender- and age-weighted reference person using DOE-approved dose conversion factors and
assuming continuous exposure. The standard is established in DOE Order 458.1, Radiation Protection of
the Public and the Environment.
disintegration, nuclear—A spontaneous nuclear transformation (radioactivity) characterized by the
emission of energy and/or mass from the nucleus of an atom.
dose—The energy imparted to matter by ionizing radiation. The unit of absorbed dose is the rad, equal to
0.01 joules per kilogram in any medium.
absorbed dose—The quantity of radiation energy absorbed by an organ divided by the organ’s mass.
Absorbed dose is expressed in units of rad (or gray) (1 rad = 0.01 Gy).
G-3
dose equivalent—The product of the absorbed dose (rad) in tissue and a quality factor. Dose
equivalent is expressed in units of rem (or sievert) (1 rem = 0.01 Sv).
committed dose equivalent—The calculated total dose equivalent to a tissue or organ over a 50-year
period after known intake of a radionuclide into the body. Contributions from external dose are not
included. Committed dose equivalent is expressed in units of rem (or sievert).
committed effective dose equivalent/committed effective dose—The sum of total absorbed dose
(measured in mrem) to a tissue or organ received over a 50-year period resulting from the intake of
radionuclides, multiplied by the appropriate weighting factor. The committed effective dose
equivalent is the product of the annual intake (pCi) and the dose conversion factor for each
radionuclide (mrem/pCi). Committed effective dose equivalent is expressed in units of rem (or
sievert).
effective dose equivalent/effective dose—The sum of the dose equivalents received by all organs or
tissues of the body after each one has been multiplied by an appropriate weighting factor. The
effective dose equivalent includes the committed effective dose equivalent from internal deposition of
radionuclides and the effective dose equivalent attributable to sources external to the body.
collective effective dose equivalent/collective dose equivalent—The sums of the dose equivalents
or effective dose equivalents of all individuals in an exposed population within a 50-mile radius
expressed in units of person-rem (or person-sievert). When the collective dose equivalent of interest
is for a specific organ, the units would be organ-rem (or organ-sievert). The 50-mile distance is
measured from a point located centrally with respect to major facilities or DOE program activities.
downgradient—In the direction of decreasing hydrostatic head.
downgradient well—A well that is installed hydraulically downgradient of a site and that may be capable
of detecting migration of contaminants from a site.
effluent—A liquid or gaseous waste discharge to the environment.
effluent monitoring—The collection and analysis of samples or measurements of liquid and gaseous
effluents for purposes of characterizing and quantifying the release of contaminants, assessing radiation
exposures to members of the public, and demonstrating compliance with applicable standards.
Environmental Restoration—A DOE program that directs the assessment and cleanup of its sites
(remediation) and facilities (decontamination and decommissioning) contaminated with waste as a result
of nuclear-related activities.
exposure (radiation)—The incidence of radiation on living or inanimate material by accident or intent.
Background exposure is the exposure to natural background ionizing radiation. Occupational exposure is
that exposure to ionizing radiation received at a person’s workplace. Population exposure is the exposure
to the total number of persons who inhabit an area.
external radiation—Exposure to ionizing radiation when the radiation source is located outside the
body.
formation—A mappable unit of consolidated or unconsolidated geologic material of a characteristic
lithology or assemblage of lithologies.
G-4
gamma ray—High-energy, short-wavelength electromagnetic radiation emitted from the nucleus of an
excited atom. Gamma rays are identical to X-rays except for the source of the emission.
groundwater, unconfined—Water that is in direct contact with the atmosphere through open spaces in
permeable material.
half-life, radiological—The time required for half of a given number of atoms of a specific radionuclide
to decay. Each nuclide has a unique half-life.
hardness—The amount of calcium carbonate dissolved in water, usually expressed as part of calcium
carbonate per million parts of water.
high-level waste—High-level radioactive waste or HLW means: (1) irradiated reactor fuel; (2) liquid
wastes resulting from the operation of the first cycle solvent extraction system, or equivalent, and the
concentrated wastes from subsequent extraction cycles, or equivalent, in a facility for reprocessing
irradiated reactor fuel; and (3) solids into which such liquid wastes have been converted.
hydrogeology—Hydraulic aspects of site geology.
hydrology—The science dealing with the properties, distribution, and circulation of natural water
systems.
in situ—In its original place; field measurements taken without removing the sample from its origin;
remediation performed while groundwater remains below the surface.
internal dose factor—A factor used to convert intakes of radionuclides to dose equivalents.
internal radiation—Occurs when natural radionuclides enter the body by ingestion of foods or liquids or
by inhalation. Radon is the major contributor to the annual dose equivalent for internal radionuclides.
ion—An atom or compound that carries an electrical charge.
isotopes—Forms of an element having the same number of protons but differing numbers of neutrons in
the nuclei.
long-lived isotope—A radionuclide that decays at such a slow rate that a quantity of it will exist for
an extended period (half-life is greater than three years).
short-lived isotope—A radionuclide that decays so rapidly that a given quantity is transformed
almost completely into decay products within a short period (half-life is two days or less).
laboratory detection limit—The lowest reasonably accurate concentration of an analyte that can be
detected; this value varies depending on the method, instrument, and dilution used.
limited area—The industrial area at PGDP, comprising approximately 644 acres.
lower limit of detection—The smallest concentration or amount of analyte that can be reliably detected
in a sample at a 95% confidence level.
G-5
maximally exposed individual—A hypothetical individual who remains in an uncontrolled area and
would, when all potential routes of exposure from a facility’s operations are considered, receive the
greatest possible dose equivalent.
migration—The transfer or movement of a material through air, soil, or groundwater.
milliroentgen (mR)—A measure of X-ray or gamma radiation. The unit is one-thousandth of a roentgen.
minimum detectable concentration—The smallest amount or concentration of a radionuclide that can
be distinguished in a sample by a given measurement system at a preselected counting time and at a given
confidence level.
monitoring—Process whereby the quantity and quality of factors that can affect the environment or
human health are measured periodically to regulate and control potential impacts.
mrem—The dose equivalent that is one-thousandth of a rem.
natural radiation—Radiation from cosmic and other naturally occurring radionuclide (such as radon)
sources in the environment.
nuclide—An atom specified by its atomic weight, atomic number, and energy state. A radionuclide is a
radioactive nuclide.
outfall—The point of conveyance (e.g., drain or pipe) of wastewater or other effluents into a ditch, pond,
or river.
pathogen—A disease-producing agent; usually refers to living organisms.
person-rem—Collective dose to a population group. For example, a dose of 1 rem to 10 individuals
results in a collective dose of 10 person-rem.
pH—A measure of the hydrogen-ion concentration in an aqueous solution. Acidic solutions have a pH
from 0 to 7, neutral solutions have a pH equal to 7, and basic solutions have a pH greater than 7.
polychlorinated biphenyl (PCB)—Any chemical substance that is limited to the biphenyl molecule and
that has been chlorinated to varying degrees.
polycyclic aromatic hydrocarbon (PAH)—Any organic compound composed of more than one benzene
ring.
process water—Water used within a system process.
quality assurance (QA)—Any action in environmental monitoring to ensure the reliability of monitoring
and measurement data.
quality control (QC)—The routine application of procedures within environmental monitoring to obtain
the required standards of performance in monitoring and measurement processes.
quality factor—The factor by which the absorbed dose (rad) is multiplied to obtain a quantity that
expresses, on a common scale for all ionizing radiation, the biological damage to exposed persons. A
quality factor is used because some types of radiation, such as alpha particles, are more biologically
damaging than others.
G-6
rad—An acronym for radiation absorbed dose. The rad is a basic unit of absorbed radiation dose. (This is
being replaced by the “gray,” which is equivalent to 100 rad.)
radiation detection instruments—Devices that detect and record the characteristics of ionizing
radiation.
radioactivity—The spontaneous discharge of radiation from atomic nuclei. This is usually in the form of
beta or alpha radiation, together with gamma radiation. Beta or alpha emission results in transformation of
the atom into a different element, changing the atomic number by +1 or -2 respectively.
radioisotope—Radioactive isotope. An unstable isotope of an element that decays or disintegrates
spontaneously, emitting radiation. More than 1,300 natural and artificial radioisotopes have been
identified.
radionuclide—An unstable nuclide capable of spontaneous transformation into other nuclides by
changing its nuclear configuration or energy level. This transformation is accompanied by the emission of
photons or particles.
record of decision—A public document that explains which cleanup alternatives will be used to clean up
a Superfund site.
release—Any discharge to the environment. Environment is broadly defined as any water, land, or
ambient air.
rem—The unit of dose equivalent (absorbed dose in rads multiplied by the radiation quality factor). Dose
equivalent is frequently reported in units of millirem (mrem), which is one-thousandth of a rem.
remediation—The correction of a problem. See Environmental Restoration.
reportable quantity—An amount set by a regulation in which release to the environment must be
reported to regulatory agencies.
Resource Conservation and Recovery Act (RCRA)—Federal legislation that regulates the transport,
treatment, and disposal of solid and hazardous wastes.
roentgen—A unit of exposure from X-rays or gamma rays. One roentgen equals 2.58 × 10⁴ coulombs per
kilogram of air.
sievert (Sv)—The SI (International System of Units) unit of dose equivalent; 1 Sv = 100 rem.
source—A point or object from which radiation or contamination emanates.
stable—Not radioactive or not easily decomposed or otherwise modified chemically.
storm water runoff—Surface streams that appear after precipitation.
strata—Beds, layers, or zones of rocks.
surface water—All water on the surface of the earth, as distinguished from groundwater.
suspended solids—Mixture of fine, nonsettling particles of any solid within a liquid or gas.
G-7
terrestrial radiation—Ionizing radiation emitted from radioactive materials, primarily K-40, thorium,
and uranium, in the earth’s soils. Terrestrial radiation contributes to natural background radiation.
thermoluminescent dosimeter (TLD)—A device used to measure external gamma radiation.
total activity—The total quantity of radioactive decay particles that are emitted from a sample.
total solids—The sum of total dissolved solids and suspended solids.
transuranic element—An element above uranium in the Periodic Table, that is, with an atomic number
greater than 92. All 11 TRUs are produced artificially and are radioactive. They are neptunium,
plutonium, americium, curium, berkelium, californium, einsteinium, fermium, mendelevium, nobelium,
and lawrencium.
turbidity—A measure of the concentration of sediment or suspended particles in solution.
upgradient—In the direction of increasing hydrostatic head.
volatile organic compound—Any organic compound that has a low boiling point and readily volatilizes
into air (e.g., trichloroethane, tetrachloroethene, and trichloroethene).
watershed—The region draining into a river, river system, or body of water.
wetland—A lowland area, such as a marsh or swamp, inundated or saturated by surface or groundwater
sufficiently to support hydrophytic vegetation typically adapted to life in saturated soils.

THIS PAGE INTENTIONALLY LEFT BLANK

APPENDIX

THIS PAGE INTENTIONALLY LEFT BLANK
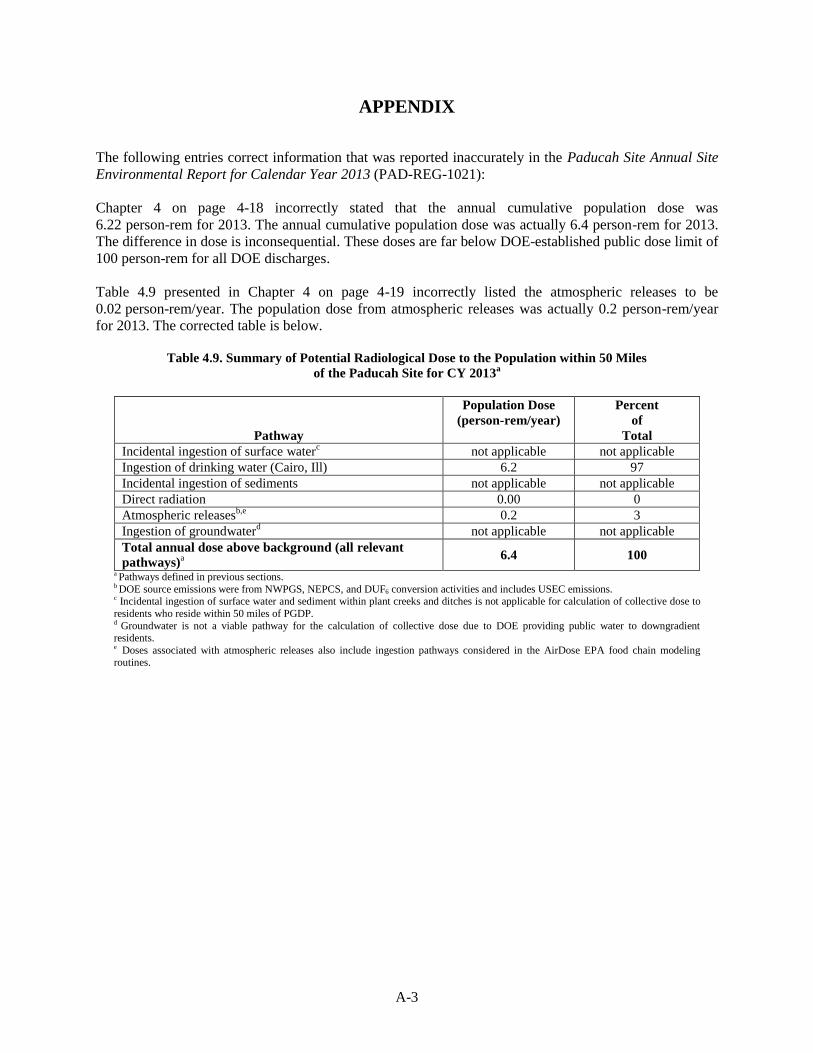
A-3
APPENDIX
The following entries correct information that was reported inaccurately in the Paducah Site Annual Site
Environmental Report for Calendar Year 2013 (PAD-REG-1021):
Chapter 4 on page 4-18 incorrectly stated that the annual cumulative population dose was
6.22 person-rem for 2013. The annual cumulative population dose was actually 6.4 person-rem for 2013.
The difference in dose is inconsequential. These doses are far below DOE-established public dose limit of
100 person-rem for all DOE discharges.
Table 4.9 presented in Chapter 4 on page 4-19 incorrectly listed the atmospheric releases to be
0.02 person-rem/year. The population dose from atmospheric releases was actually 0.2 person-rem/year
for 2013. The corrected table is below.
Table 4.9. Summary of Potential Radiological Dose to the Population within 50 Miles
of the Paducah Site for CY 2013a
Pathway
Population Dose
(person-rem/year)
Percent
of
Total
Incidental ingestion of surface waterc not applicable not applicable
Ingestion of drinking water (Cairo, Ill) 6.2 97
Incidental ingestion of sediments not applicable not applicable
Direct radiation 0.00 0
Atmospheric releasesb,e
0.2 3
Ingestion of groundwaterd
not applicable not applicable
Total annual dose above background (all relevant
pathways)a
6.4 100
a Pathways defined in previous sections. b DOE source emissions were from NWPGS, NEPCS, and DUF6 conversion activities and includes USEC emissions. c Incidental ingestion of surface water and sediment within plant creeks and ditches is not applicable for calculation of collective dose to
residents who reside within 50 miles of PGDP. d Groundwater is not a viable pathway for the calculation of collective dose due to DOE providing public water to downgradient residents. e Doses associated with atmospheric releases also include ingestion pathways considered in the AirDose EPA food chain modeling routines.

THIS PAGE INTENTIONALLY LEFT BLANK