annual shareholders' presentation
TRANSCRIPT

Annual Shareholders’ Presentation12 May 2014

Strong cashflow, consumer play
Multiple locations, multiple brands
Diversified hospitality portfolio
Leading BPO office space provider

MAJOR DEVELOPMENTS – Recent Business Accolades
3
Robinsons Land was awarded by Euromoney as theOverall Best Managed Company in the Philippines
2013 & 2014
MAJOR DEVELOPMENTS – Recent Business Accolades
4
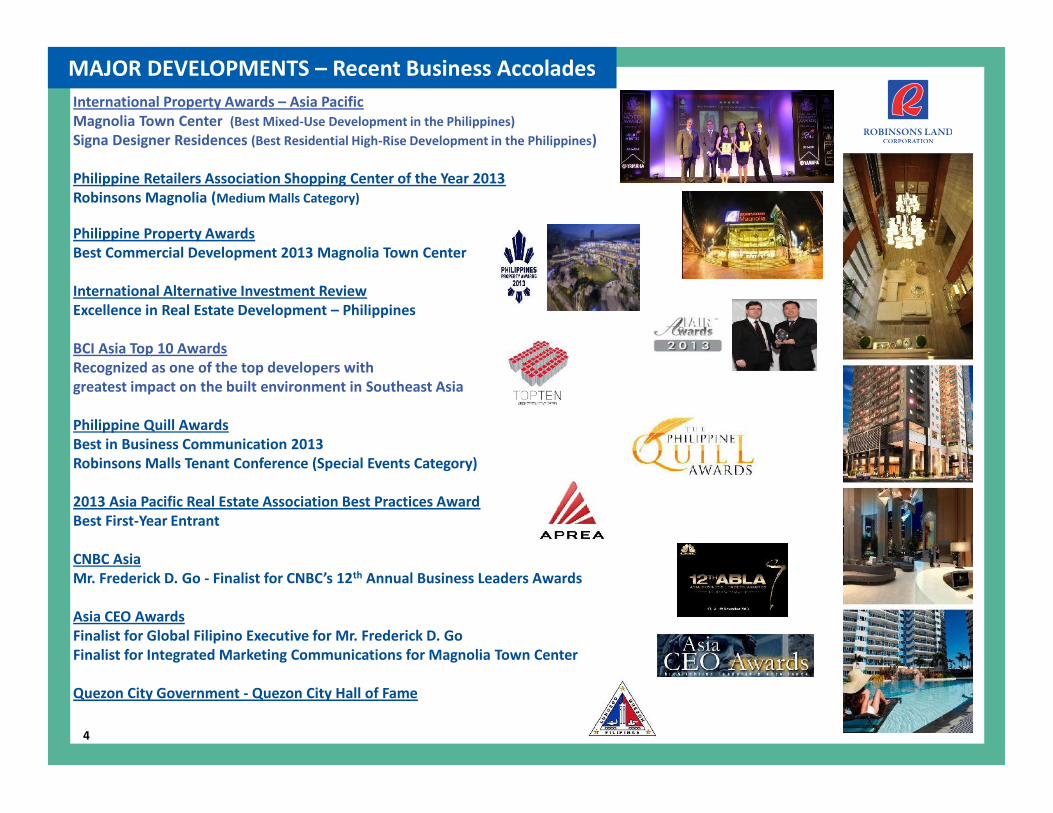
International Property Awards – Asia PacificMagnolia Town Center (Best Mixed-Use Development in the Philippines)Signa Designer Residences (Best Residential High-Rise Development in the Philippines)
Philippine Retailers Association Shopping Center of the Year 2013Robinsons Magnolia (Medium Malls Category)
Philippine Property AwardsBest Commercial Development 2013 Magnolia Town Center
International Alternative Investment ReviewExcellence in Real Estate Development – Philippines
BCI Asia Top 10 AwardsRecognized as one of the top developers withgreatest impact on the built environment in Southeast Asia
Philippine Quill AwardsBest in Business Communication 2013Robinsons Malls Tenant Conference (Special Events Category)
2013 Asia Pacific Real Estate Association Best Practices AwardBest First-Year Entrant
CNBC AsiaMr. Frederick D. Go - Finalist for CNBC’s 12th Annual Business Leaders Awards
Asia CEO AwardsFinalist for Global Filipino Executive for Mr. Frederick D. GoFinalist for Integrated Marketing Communications for Magnolia Town Center
Quezon City Government - Quezon City Hall of Fame

A LEADING PHILIPPINE PROPERTY COMPANY
National Capital Region
Misamis Oriental
Davao del Sur
Leyte
Cebu
South Cotabato
Negros Occidental
Ilocos Norte
DumaguetePalawan
Iloilo
Laguna
Bulacan
Batangas
PampangaTarlac
Cavite
Pangasinan
•Mall•Go Hotel • Mall
• ResidentialProjects
•Malls•Hotel•Office
•Mall•Hotel
•Malls•Hotel
•Malls•Office Buildings•Hotels•Condominiums
•Malls•Hotel• Residential Projects
•Malls•Residential Projects
•Mall•Hotel
• Mall• Residential
Projects
• Mall•Residential Project
•Mall
•Malls•Residential Projects
•Mall•Hotel
•Mall•Residential Projects
•Mall•Condominiums•ResidentialProjects
• Residential ProjectsRizal•Malls
• Mall
Nueva Ecija• Mall
Agusan del Norte
•Mall
9.1 11.0 13.0 15.5
2010 2011 2012 2013
18.8 20.1 21.2 22.8
2010 2011 2012 2013
94.095.8 96.0
98.7
2010 2011 2012 2013
3.5 3.9 4.6 4.7
2010 2011 2012 2013
Tourist Arrivals (in millions)
BPO Revenues (in US$B)
OFW Remittances (in US$B)
Population (in millions)
7.6%
3.9%6.6% 7.2%
2010 2011 2012 2013
GDP Growth Rate
*2013 Based on Estimates
5
DIVERSIFIED BUSINESS MODEL
6
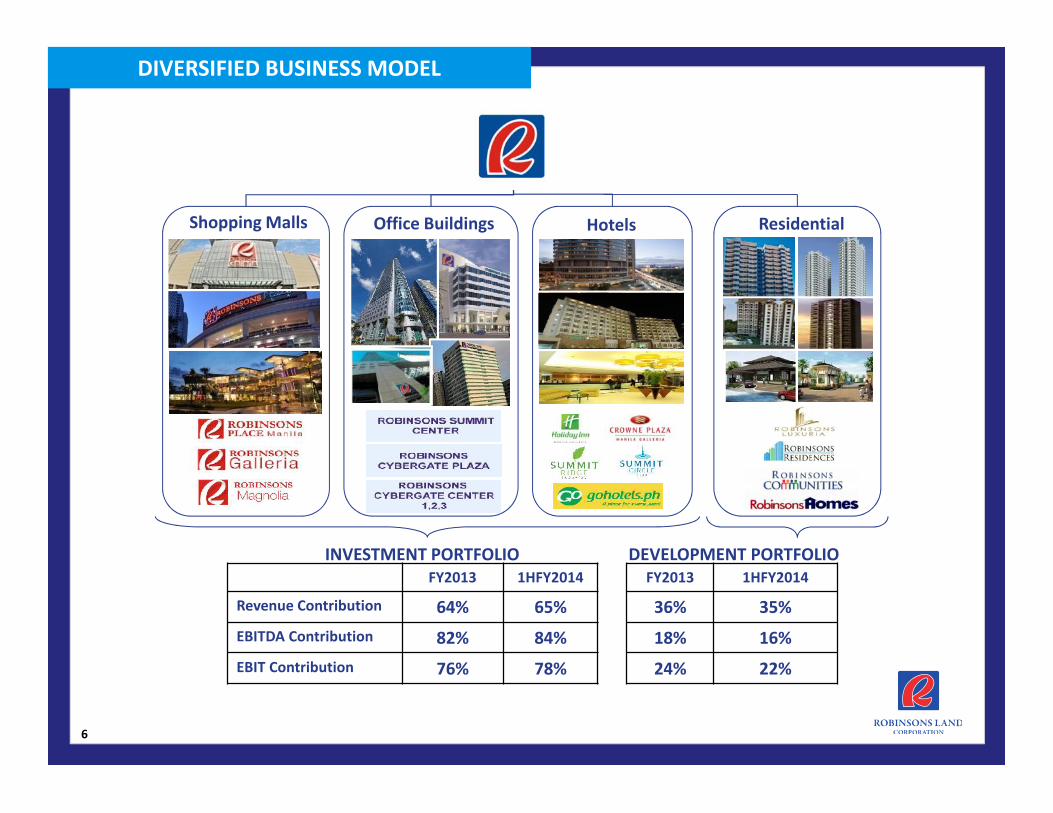
FY2013 1HFY2014 FY2013 1HFY2014
Revenue Contribution 64% 65% 36% 35%EBITDA Contribution 82% 84% 18% 16%EBIT Contribution 76% 78% 24% 22%
ResidentialShopping Malls Office Buildings Hotels
DEVELOPMENT PORTFOLIOINVESTMENT PORTFOLIO
INCOME STATEMENT HIGHLIGHTS
7
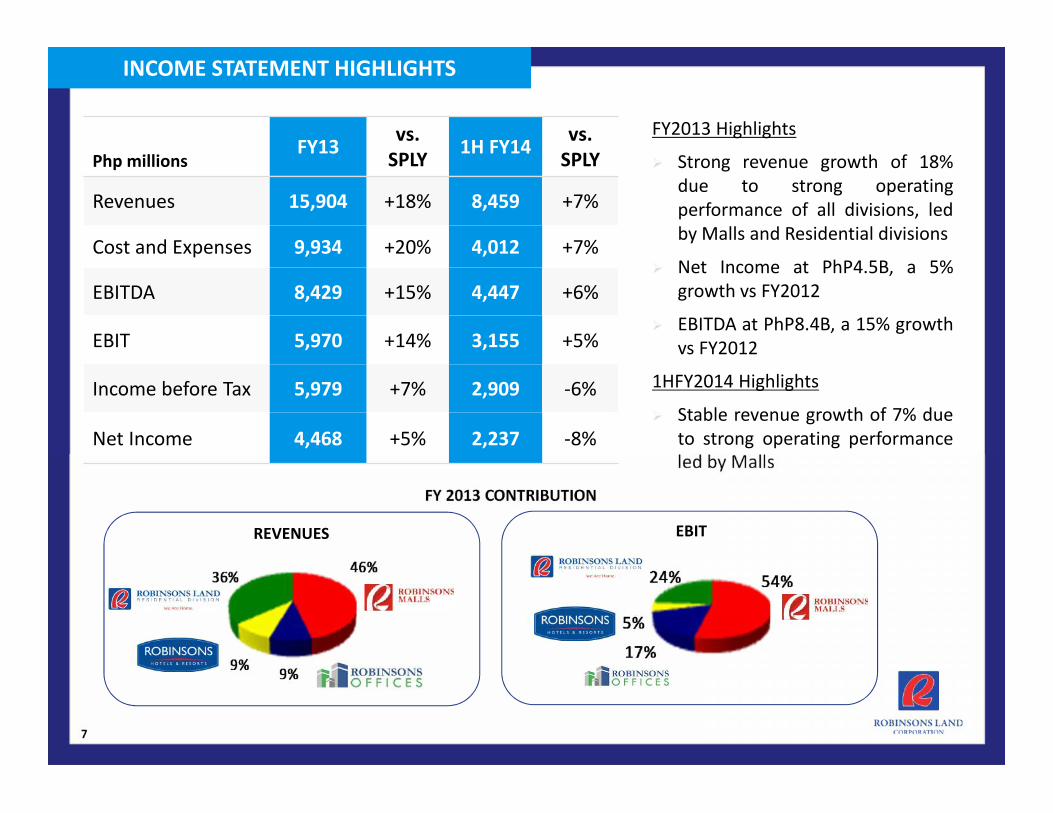
FY2013 Highlights
Strong revenue growth of 18%due to strong operatingperformance of all divisions, ledby Malls and Residential divisions
Net Income at PhP4.5B, a 5%growth vs FY2012
EBITDA at PhP8.4B, a 15% growthvs FY2012
1HFY2014 Highlights
Stable revenue growth of 7% dueto strong operating performanceled by Malls
FY 2013 CONTRIBUTION
EBITREVENUES
Php millionsFY13 vs.
SPLY 1H FY14 vs.SPLY
Revenues 15,904 +18% 8,459 +7%
Cost and Expenses 9,934 +20% 4,012 +7%
EBITDA 8,429 +15% 4,447 +6%
EBIT 5,970 +14% 3,155 +5%
Income before Tax 5,979 +7% 2,909 -6%
Net Income 4,468 +5% 2,237 -8%

STRONG BALANCE SHEET POSITION (as of March 31, 2014)
8
TOTAL ASSETS (PhP MM) SHAREHOLDER’S EQUITY (PhP MM)
RETURN ON EQUITY CURRENT NET DEBT TO EQUITY
70,64774,886
80,056
FY12 FY13 1HFY14
46,57349,395
51,632
FY12 FY13 1HFY14
9% 9% 9%
FY12 FY13 1HFY14
13%
23%26%
FY12 FY13 1HFY14

REVENUES
EBITDA
EBIT
9
Second largest mall operator inthe Philippines with 37 malls
1,025,000 sqm in GLA 1,900,000 sqm in GFA 95% latest system-wide
occupancy Approximately 7,000 retailers Same mall revenue growth has
been tracking 8% in the past 5years
6,429 7,390
3,577 3,990
FY12 FY13 1HFY13 1HFY14
4,492 5,063
2,464 2,761
FY12 FY13 1HFY13 1HFY14
2,999 3,202
1,582 1,757
FY12 FY13 1HFY13 1HFY14
15%
12%
13%12%
7%11%
10
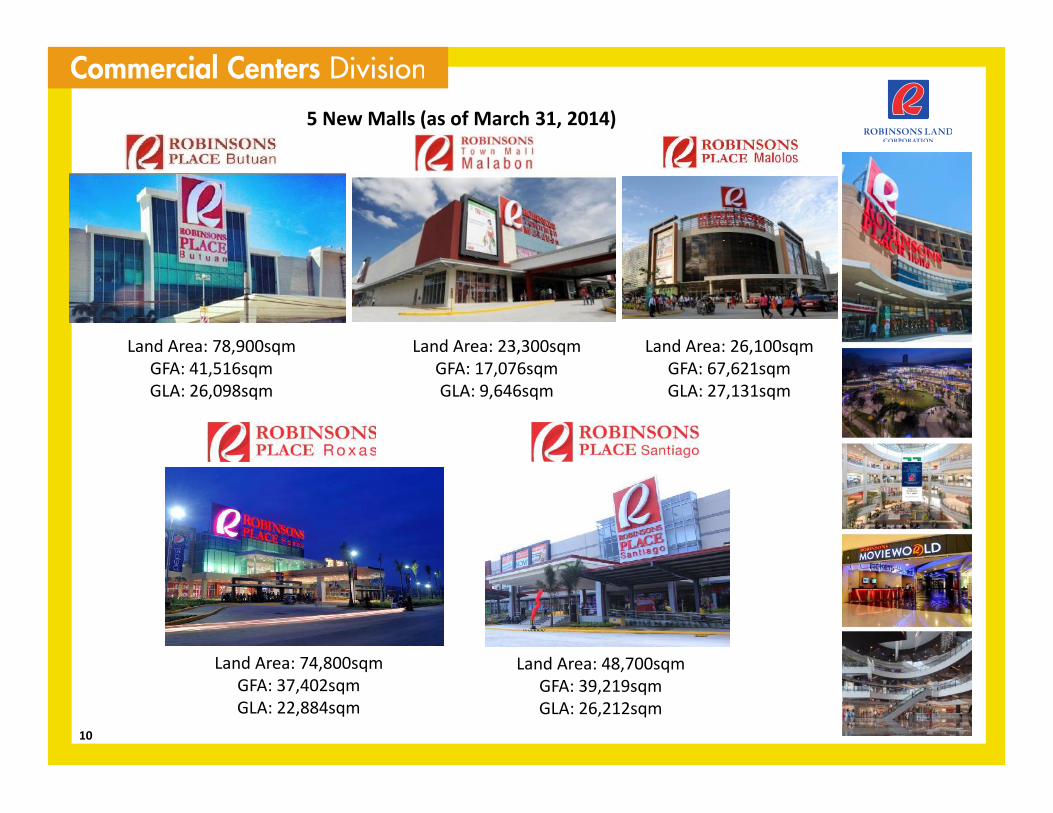
5 New Malls (as of March 31, 2014)
Land Area: 23,300sqmGFA: 17,076sqmGLA: 9,646sqm
Land Area: 78,900sqmGFA: 41,516sqmGLA: 26,098sqm
Land Area: 26,100sqmGFA: 67,621sqmGLA: 27,131sqm
Land Area: 74,800sqmGFA: 37,402sqmGLA: 22,884sqm
Land Area: 48,700sqmGFA: 39,219sqmGLA: 26,212sqm

3,220 3,713 3,9764,492
5,063
2009 2010 2011 2012 2013
4,1275,312 5,759 6,429
7,390
2009 2010 2011 2012 2013
2,048 2,324 2,466 2,999 3,202
2009 2010 2011 2012 2013
CAGR: +16% CAGR: +12%
CAGR: +12%
REVENUES EBITDA
EBIT
11
744,000 813,000 813,000 910,000 913,000
2009 2010 2011 2012 2013
CAGR: +5%
GLA

12
A leading BPO office spaceprovider with 273,000 sqmnet leasable space
Total occupancy is 98% Increased space by 41% or
80,000 sqm in FY 2014 Dominant landlord in the
Ortigas Central BusinessDistrict
REVENUES
EBITDA
EBIT
1,398 1,440
717 729
FY12 FY13 1HFY13 1HFY14
1,345 1,386
691 702
FY12 FY13 1HFY13 1HFY14
961 1,009
497 510
FY12 FY13 1HFY13 1HFY14
3%
2%
3%
2%
5%
3%

13
Cyberscape Alpha33% Leased Out
Cyberscape Beta55% Leased Out

14
CAGR: +7%
1,112 1,182 1,335 1,398 1,440
2009 2010 2011 2012 2013
1,032 1,140 1,302 1,345 1,386
2009 2010 2011 2012 2013
CAGR: +8%
738 842 923 961 1,009
2009 2010 2011 2012 2013
CAGR: +8%
165,000
188,000 193,000 193,000 193,000
2009 2010 2011 2012 2013
CAGR: +4%
REVENUES EBITDA
EBIT GLA
15
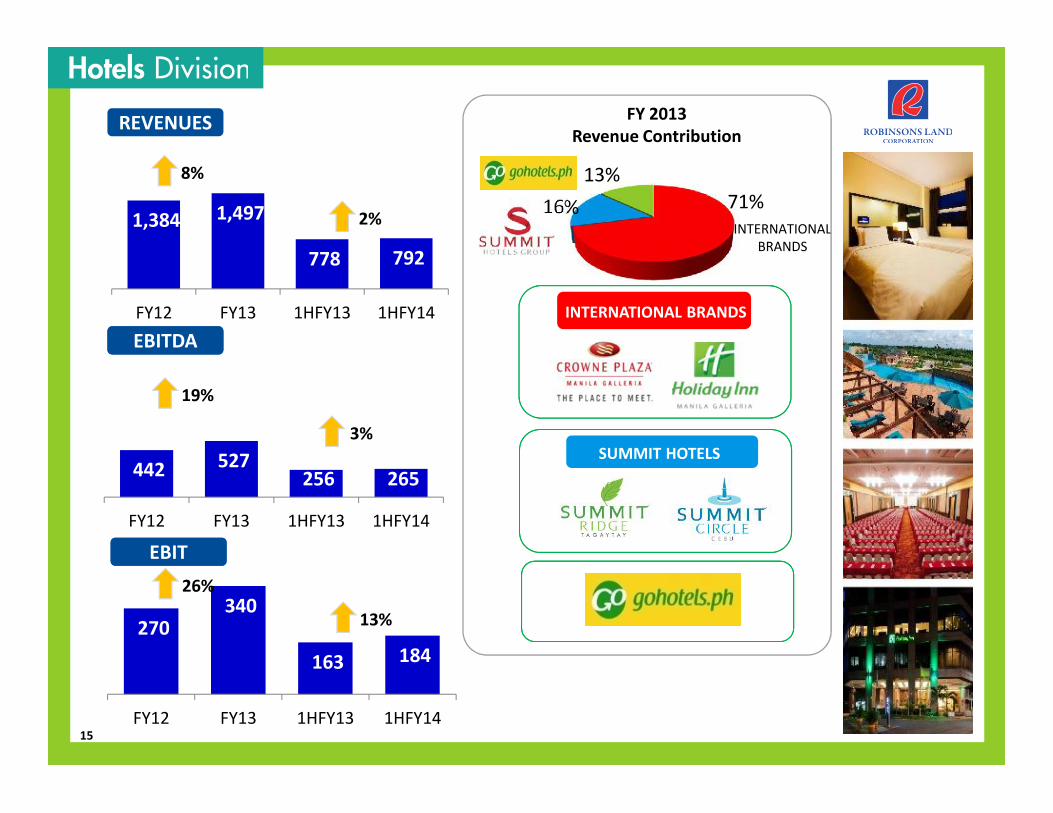
71%16%13%
FY 2013Revenue Contribution
INTERNATIONALBRANDS
INTERNATIONAL BRANDS
SUMMIT HOTELS
REVENUES
EBITDA
EBIT
EBITDA
EBIT
1,384 1,497
778 792
FY12 FY13 1HFY13 1HFY14
442 527256 265
FY12 FY13 1HFY13 1HFY14
270340
163 184
FY12 FY13 1HFY13 1HFY14
8%
2%
19%
3%
26%
13%

16
FY2013 New Hotel
Location: Paco, Manila
Started Operations: June 2013
No. of Rooms: 118
Location: Downtown District of Iloilo City
Started Operations: December 2013
No. of Rooms: 167
FY2014 - New Hotel (as of March 31, 2014)
17
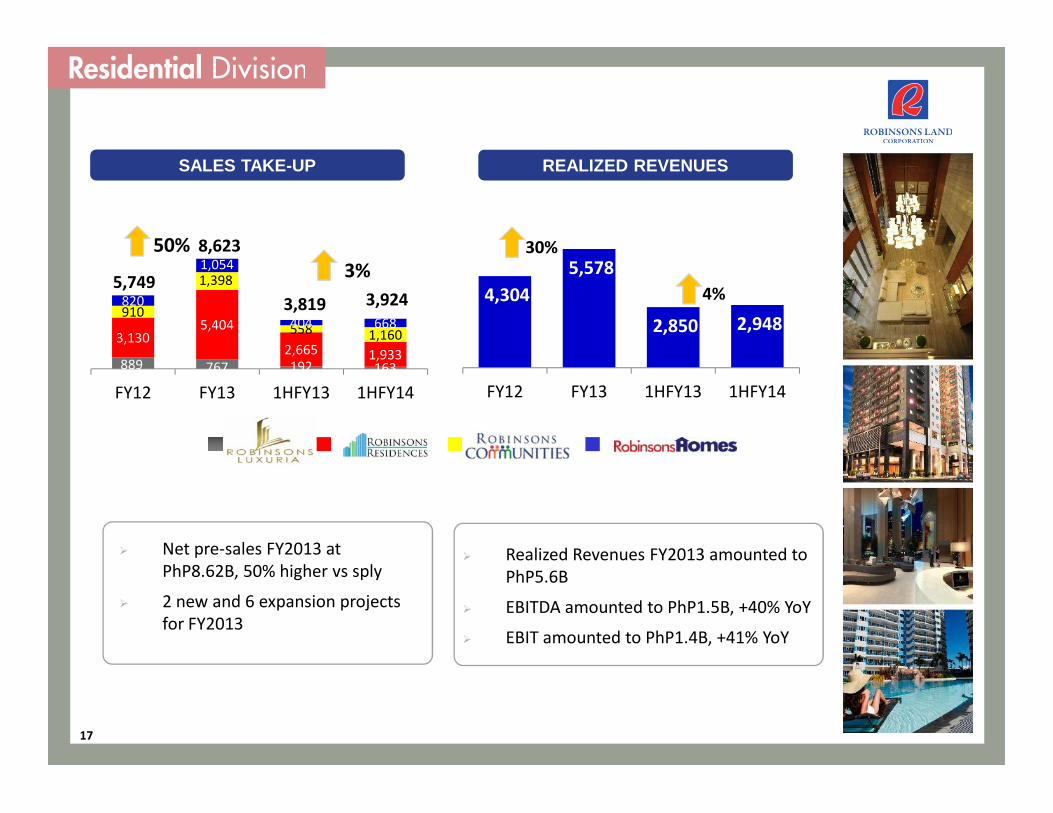
SALES TAKE-UP
5,749
8,623
REALIZED REVENUES
Realized Revenues FY2013 amounted toPhP5.6B
EBITDA amounted to PhP1.5B, +40% YoY
EBIT amounted to PhP1.4B, +41% YoY
Net pre-sales FY2013 atPhP8.62B, 50% higher vs sply
2 new and 6 expansion projectsfor FY2013
30%
4,3045,578
2,850 2,948
FY12 FY13 1HFY13 1HFY14
4%
889 767 192 163
3,1305,404
2,665 1,933
910
1,398
558 1,160
820
1,054
404 668
FY12 FY13 1HFY13 1HFY14
50%3%
3,819 3,924

18
Brighton Parkplace
Brighton Parkplace North
Hanalei Heights
Fernwood Parkhomes
Forest Parkhomes
Forest Parkhomes North
Grand Tierra
Mirada Dos
Rosewood Parkhomes
Robinsons Homes East
San Lorenzo Homes
San Jose Estates
St. Bernice Estates
Bloomfields Cagayan DeOro
Robinsons ResidenzaMilano
Robinsons Vineyard
Southsquare Village
Aspen Heights
Fresno Parkview
Hillsbourough Pointe
Richmond Hills
Robinsons Highlands
Montclair Highlands
Bloomfields Tagaytay
Blue Coast Residences
Bloomfields Davao
Nizanta at Ciudades
Robinsons Place Residences
Fifth Avenue Place
McKinley Park Residences
The Fort Residences
The Magnolia Residences
Vimana Verde Residences
Adriatico Place
East of Galleria
The Trion Towers
Gateway Garden Heights
One Gateway Place
Otis 888
Gateway Regency
The Sapphire Bloc
Woodsville Residences
Azalea Place
Radiance Manila Bay
AmiSa Private Residences
Sonata Private Residences
Signa Designer Residences
Galleria Regency
Gateway Garden Ridge
Woodsville Viverde Mansions
Centennial Place
Bloomfields Novaliches
Escalades at 20th Avenue
Escalades South Metro
The Wellington Courtyard
The Pearl Place
Axis Residences
Escalades East Tower
Acacia Escalades

19
Radiance Manila Bay – North TowerManila
The Sapphire Bloc – West TowerPasig City
Axis ResidencesMandaluyong City
Acacia EscaladesPasig City
The Peal PlacePasig City
Bloomfields Cagayan De OroCagayan De Oro
Bloomfields Heights LipaLipa City
Bloomfields General SantosGeneral Santos City
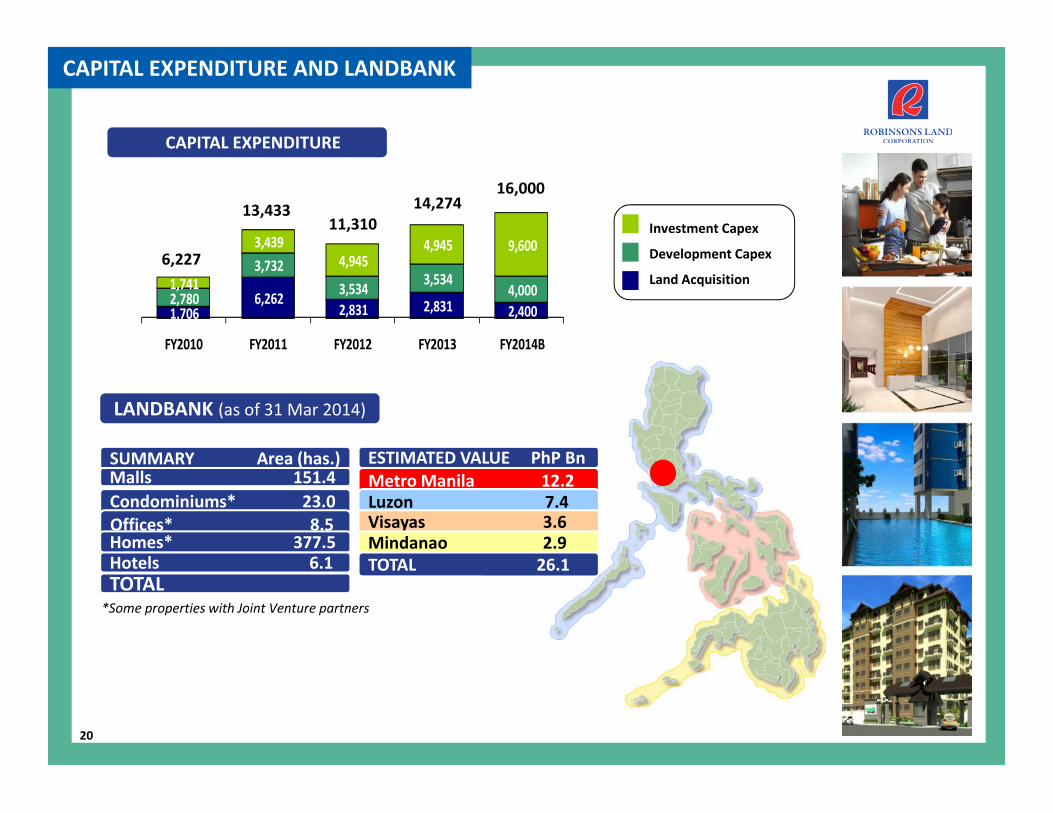
CAPITAL EXPENDITURE AND LANDBANK
20
6,227
13,43311,310 Investment Capex
Development Capex
Land Acquisition
CAPITAL EXPENDITURE
16,000
*Some properties with Joint Venture partners
SUMMARY Area (has.)Malls 151.4Condominiums* 23.0Offices* 8.5Homes* 377.5Hotels 6.1 6.1TOTAL 566.5
ESTIMATED VALUE PhP BnMetro Manila 12.2Luzon 7.4Visayas 3.6Mindanao 2.9TOTAL 26.1
14,274
1,7066,262
2,831 2,831 2,4002,780
3,7323,534 3,534
4,0001,741
3,4394,945
4,945 9,600
FY2010 FY2011 FY2012 FY2013 FY2014B
LANDBANK (as of 31 Mar 2014)

21
MOVING FORWARD – Future Plans & Strategies
FY2013 FY2014 FY2016 FY2017FY2013 FY2014 FY2015 FY2016
GrossLeasableArea(sqm)
1 MallExpansion
+18%
913,0001,077,000
NetLeasableArea(sqm)
+41%
2 New Office BuildingsCyberscape AlphaCyberscape Beta
273,0001,150,000
+12%
7 New Malls
193,000
308,000
1 New OfficeBuilding
Bridgetowne
+7%1,292,000
1 New Mall
FY2011 FY2012 FY2013 FY2014 FY2015
• Palawan• Dumaguete• Tacloban• Bacolod
# of Rooms
• Otis-Manila
233
+26%
7571,122
1,411
Currently evaluating opportunitiesfor 4 new Summit Hotels
• Iloilo• AlphaOrtigas
•Davao•Butuan
639
•Mandaluyong
Beefed up sales force andincreased marketing efforts
3,819 3,924
1HFY13 1HFY14
Sales Take Up(PhPMM)
+11%
+274%+18%
+48%
4 New Malls2 Expansion
343,000+13%
1 New OfficeBuilding
Bridgetowne