annual shareholders meeting presentation
TRANSCRIPT

www.richmont-mines.com Copyright 2012 by Richmont Mines TSX - NYSE Amex: RIC 1
Annual Meeting
May 10, 2012
www.richmont-mines.com
TSX – NYSE Amex: RIC
RICHMONT MINES INC.

www.richmont-mines.com Copyright 2012 by Richmont Mines TSX - NYSE Amex: RIC 2
SAFE HARBOR STATEMENT & CAUTIONARY NOTE TO
U.S. INVESTORS CONCERNING RESOURCE ESTIMATES
This presentation contains forward-looking statements that include risks and uncertainties. The factors that could cause actual results to differ materially from those indicated in such forward-looking statements include changes in the prevailing price of gold, the Canadian-U.S. exchange rate, grade of ore mined and unforeseen difficulties in mining operations that could affect revenue and production costs. Other factors such as uncertainties regarding government regulations could also affect the results. Other risks may be detailed from time to time in Richmont Mines Inc.’s periodic reports and annual notice.
The resource estimates in this presentation were prepared in accordance with Regulation 43-101 adopted by the Canadian Securities Administrators. The requirements of Regulation 43-101 differ significantly from the requirements of the United States Securities and Exchange Commission (the “SEC”). In this presentation, we use the terms “Measured”, “Indicated” and “Inferred” Resources. Although these terms are recognized and required in Canada, the SEC does not recognize them. The SEC permits U.S. mining companies, in their filings with the SEC, to disclose only those mineral deposits that constitute “Reserves”. Under United States standards, mineralization may not be classified as a Reserve unless the determination has been made that the mineralization could be economically and legally extracted at the time the determination is made. United States investors should not assume that all or any portion of a Measured or Indicated Resource will ever be converted into “Reserves”. Further, “Inferred Resources” have a great amount of uncertainty as to their existence and whether they can be mined economically or legally, and United States investors should not assume that “Inferred Resources” exist or can be legally or economically mined, or that they will ever be upgraded to a higher category.
U.S. Investors are urged to consider the disclosure in our annual report on Form 20-F, File No. 001-14598, which may be obtained from us or from the SEC’s web site: http://sec.gov/edgar.shtml .

www.richmont-mines.com Copyright 2012 by Richmont Mines TSX - NYSE Amex: RIC 3
RICHMONT MINES 2011 ANNUAL MEETING
Leveraging Expertise to Drive Value
Richmont Mines...

www.richmont-mines.com Copyright 2012 by Richmont Mines TSX - NYSE Amex: RIC 4
Mission Statement
RICHMONT MINES 2011 ANNUAL MEETING
To become the leading Canada-focused intermediate gold producer To have a health & safety record that is among the best in our industry To operate at the highest level of operational and financial excellence with nominal debt To use our leadership position to serve as a catalyst for consolidation amongst our Canadian peer group To provide our employees with substantial economic and social benefits To provide strong returns for our shareholders

www.richmont-mines.com Copyright 2012 by Richmont Mines TSX - NYSE Amex: RIC 5
Produce 250,000 ozs of gold annually
Build 1,000,000 ozs of gold reserves
Achieve valuation parity with our peer group
Grow through organic production
Grow by means of M & A
Corporate Objectives
RICHMONT MINES 2011 ANNUAL MEETING

www.richmont-mines.com Copyright 2012 by Richmont Mines TSX - NYSE Amex: RIC 6
RICHMONT MINES OVERVIEW
RIC *: TSX (CAN$) NYSE Amex (US$)
52 week price range $6.18 – $13.39 $6.23 – $13.40
Closing price (May 9/12) $6.57 $6.58
Average 3 month volume 177,700 313,400
Mgmt. & Director Ownership ~ 16%
(in CAN$ millions, except closing price) 3/31/ 2012 12/31/2011 12/31/2010
Working capital: $72.2 $68.7 $43.9
Cash & equivalents: $69.3 $63.5 $40.0
Operating cash flow: $6.8 $38.8 $18.3
Closing price TSX: $7.77 $10.94 $5.11
Market capitalization: $260 $362 $160
** Data as of market close May 9, 2012.
RIC has produced over 1.2 million ounces of gold from its operations in Quebec, Ontario and Newfoundland since 1991.

www.richmont-mines.com Copyright 2012 by Richmont Mines TSX - NYSE Amex: RIC 7
RICHMONT MINES 2011 FINANCIAL REVIEW
Key Metric (in CAN$ unless otherwise noted)
2011 2010
Gold sales (ounces) 76,143 68,123
Average selling price $1,553 $1,280
Average cash cost (per ounce) $812 $834
Average selling price (US$) $1,570 $1,243
Average cash cost (US$ per ounce) $821 $810
Earnings $25.9 million $9.3 million
Earnings per share - basic $0.81 $0.33
Operating cash flow $38.8 million $18.3 million
Operating cash flow per share $1.22 $0.64
Total assets $168.0 million $115.3 million
Shareholders equity $134.1 million $94.8 million

www.richmont-mines.com Copyright 2012 by Richmont Mines TSX - NYSE Amex: RIC 8
RICHMONT MINES 2011 REVIEW
2011 Highlights
Strong 2011 Results:
• Record net earnings of $25.9 million, or $0.81 per share, and cash flow
• Reserves replaced at both operating mines
• Wasamac estimated resource base doubled:
• Measured + Indicated Resources: 556,385 Au ounces
• Inferred Resources: 2,130,532 Au ounces
Corporate:
• Notable health & safety milestone achieved at Island Gold Mine, Camflo Mill and Beaufor Mine – 1, 2 and 4 years of no lost-time accident, respectively
• Valentine Lake: completed sale of 70% interest, generating $3.0 million in cash
• Globex: optioned 100% in 5 claims adjacent to Wasamac property

www.richmont-mines.com Copyright 2012 by Richmont Mines TSX - NYSE Amex: RIC 9
RICHMONT MINES 2011 REVIEW
2011 Highlights
Financing:
• October 2011: completed private placement of 980,500 RIC common shares at CAN$10.50; Gross proceeds = CAN$10.3 M
Extensive drilling programs:
• More than 150,000 metres of exploration and definition drilling completed across property portfolio in 2011
Analyst coverage initiated:
• Cosmos Chiu - CIBC (Toronto)
www.richmont-mines.com Copyright 2012 by Richmont Mines TSX - NYSE Amex: RIC 10
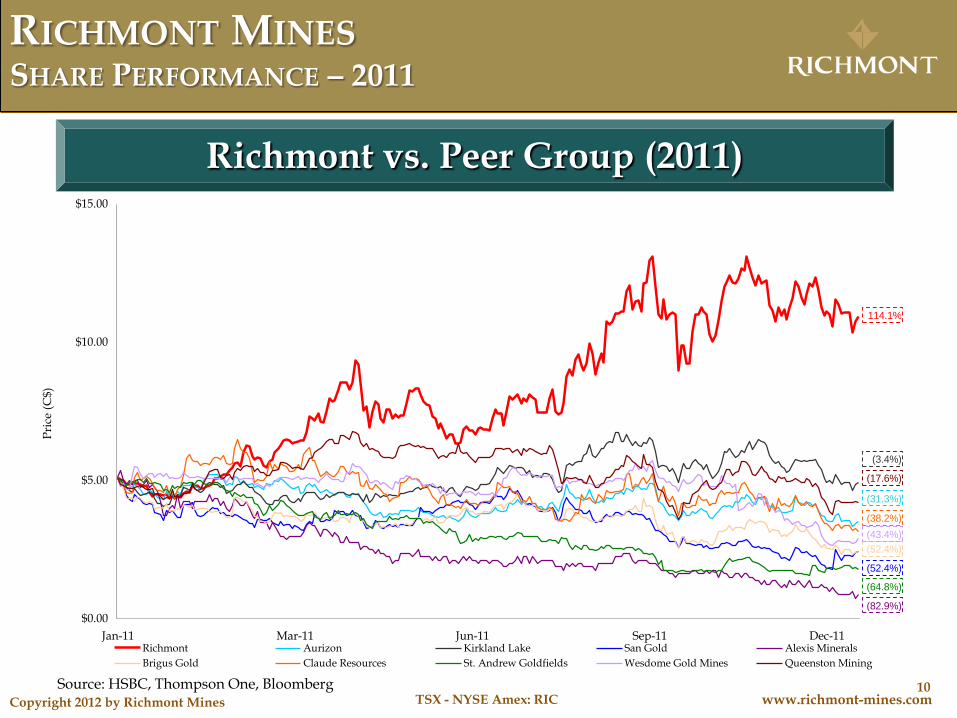
Richmont vs. Peer Group (2011)
$0.00
$5.00
$10.00
$15.00
Jan-11 Mar-11 Jun-11 Sep-11 Dec-11
Pri
ce (
C$
)
Richmont Aurizon Kirkland Lake San Gold Alexis Minerals
Brigus Gold Claude Resources St. Andrew Goldfields Wesdome Gold Mines Queenston Mining
114.1%
(3.4%)
(52.4%)
(43.4%)
(64.8%)
(52.4%)
(82.9%)
(38.2%)
(31.3%)
(17.6%)
RICHMONT MINES SHARE PERFORMANCE – 2011
Source: HSBC, Thompson One, Bloomberg

www.richmont-mines.com Copyright 2012 by Richmont Mines TSX - NYSE Amex: RIC 11
Richmont vs. Peer Group (2011 - Present)
$0.00
$5.00
$10.00
$15.00
Jan-11 Apr-11 Jul-11 Oct-11 Jan-12 May-12
Pri
ce (
C$)
Richmont Aurizon Kirkland Lake San Gold Alexis Minerals
Brigus Gold Claude Resources St. Andrew Goldfields Wesdome Gold Mines Queenston Mining
26.8%
(28.5%)
(60.5%)
(52.9%)
(73.4%)
(66.5%)
(82.9%)
(65.9%)
(30.2%)
(42.1%)
RICHMONT MINES SHARE PERFORMANCE – 2011 TO PRESENT
Source: HSBC, Thompson One, Bloomberg
www.richmont-mines.com Copyright 2012 by Richmont Mines TSX - NYSE Amex: RIC 12
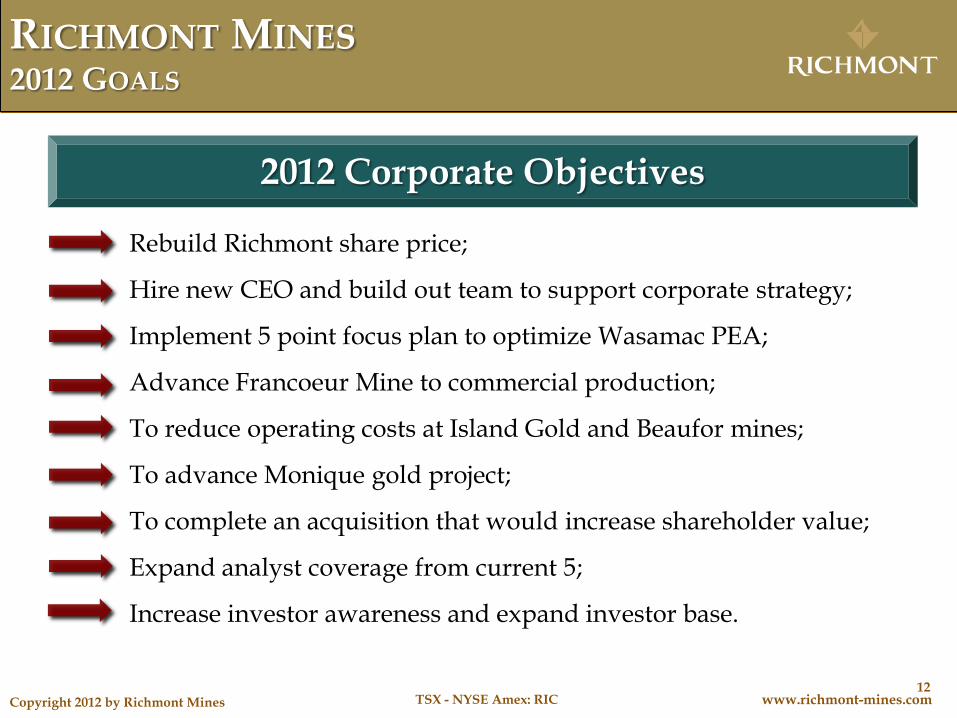
RICHMONT MINES 2012 GOALS
Rebuild Richmont share price;
Hire new CEO and build out team to support corporate strategy;
Implement 5 point focus plan to optimize Wasamac PEA;
Advance Francoeur Mine to commercial production;
To reduce operating costs at Island Gold and Beaufor mines;
To advance Monique gold project;
To complete an acquisition that would increase shareholder value;
Expand analyst coverage from current 5;
Increase investor awareness and expand investor base.
2012 Corporate Objectives
www.richmont-mines.com Copyright 2012 by Richmont Mines TSX - NYSE Amex: RIC 13
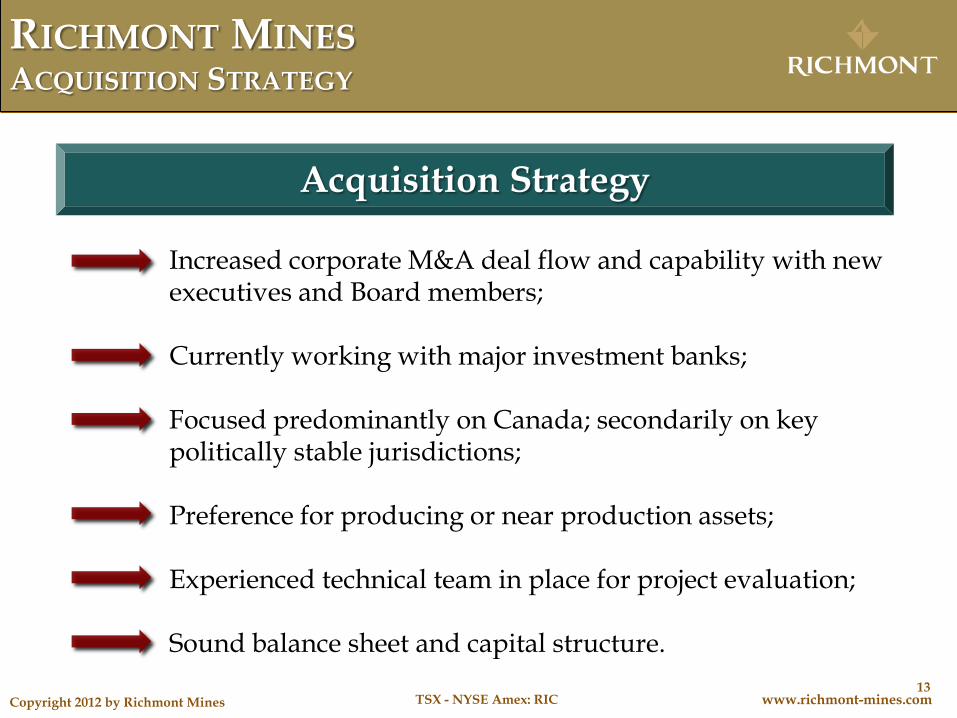
RICHMONT MINES ACQUISITION STRATEGY
Increased corporate M&A deal flow and capability with new executives and Board members;
Currently working with major investment banks;
Focused predominantly on Canada; secondarily on key politically stable jurisdictions;
Preference for producing or near production assets;
Experienced technical team in place for project evaluation;
Sound balance sheet and capital structure.
Acquisition Strategy

www.richmont-mines.com Copyright 2012 by Richmont Mines TSX - NYSE Amex: RIC 14
RICHMONT MINES 2012 RECENT NEWS
2012 News
Corporate:
• RIC Board of Directors expanded: Mr. Bob Buchan and Mr. Ebe Scherkus
• Paul Carmel appointed President & CEO
• Christian Pichette promoted to Executive Vice-President and COO
Analyst coverage initiated:
• Paul Burchell - Dundee Capital Markets (Toronto)
Property portfolio:
• Details of Preliminary Economic Assessment (“PEA”) for Wasamac Gold Project released in Q1 2012:
• 6,000 tpd underground bulk-mine;
• Estimated annual production of 140,000 Au ounces; 14 year mine-life;
• Several areas outlined to improve project economics;
• $15 million budget approved to conduct further surface and underground exploration work and technical studies on the property in 2012;
• 5 point focus plan to optimize Wasamac project announced.

www.richmont-mines.com Copyright 2012 by Richmont Mines TSX - NYSE Amex: RIC 15
RICHMONT MINES Q1 2012 FINANCIAL PERFORMANCE
Results in millions of CAN$ (except per share data, average cash cost and selling price per ounce)
3 mos. ended March 31/12
3 mos. ended March 31/11
Q1 2012 Q1 2011
Total revenue $27.7 $26.3
Net earnings $2.0 $8.7(1)
Net earnings per share $0.06 $0.28(1)
Operating cash flow $6.8 $9.5
Average selling price of gold per ounce (US$) $1,684 $1,384
Average cash cost per ounce (US$) $963 $740
Average selling price of gold per ounce (CAN$) $1,686 $1,369
Average cash cost per ounce (CAN$) $964 $732
Total gold ounces sold 16,430 19,234
(1) Include proceeds of CAN$3 million from sale of Valentine Lake property.
www.richmont-mines.com Copyright 2012 by Richmont Mines TSX - NYSE Amex: RIC 16
RICHMONT MINES 2011 ANNUAL MEETING
Review of Operations

www.richmont-mines.com Copyright 2012 by Richmont Mines TSX - NYSE Amex: RIC 17
845 892 911
1,1131,290
1,559
0
500
1,000
1,500
0
10,000
20,000
30,000
2009 2010 2011 2012FOunces gold sold Cash cost per ounce Selling price
BEAUFOR MINE 2011 OVERVIEW
2011 OVERVIEW:
• 26,947 ozs Au sold (+ 21%)
• 4 yrs no lost-time accident
• Cash costs: CAN$911 (+2%)
• 31,277 metres of exploration & definition drilling
(Ounces) (US$)
Annual Gold Sales
Note: Cash cost includes royalties.
RESERVES + RESOURCES (as of Dec. 31/11) Proven + Probable Reserves: 69,191 Au oz Measured + Indicated Resources: 182,334 Au oz Inferred Resources: 182,185 Au oz
20,854 oz 22,258 oz
Target: 20,000 to 25,000 oz
26,947 oz
www.richmont-mines.com Copyright 2012 by Richmont Mines TSX - NYSE Amex: RIC 18
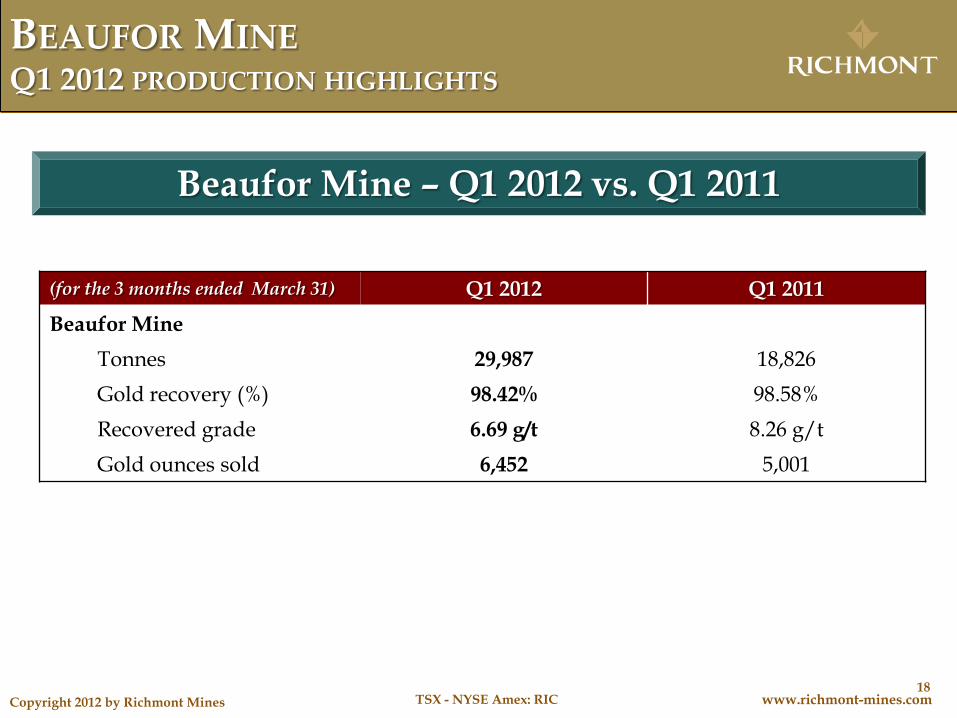
BEAUFOR MINE Q1 2012 PRODUCTION HIGHLIGHTS
(for the 3 months ended March 31) Q1 2012 Q1 2011
Beaufor Mine
Tonnes 29,987 18,826
Gold recovery (%) 98.42% 98.58%
Recovered grade 6.69 g/t 8.26 g/t
Gold ounces sold 6,452 5,001
Beaufor Mine – Q1 2012 vs. Q1 2011

www.richmont-mines.com Copyright 2012 by Richmont Mines TSX - NYSE Amex: RIC 19
BEAUFOR MINE 2012 OVERVIEW
Focus on Exploration, Definition & Development
W Zone: •Portal completed in December 2011 •258 metres of the ramp had been completed at the end of Q1 2012
•One year of development expected to access mineralized zone
Beaufor Mine – 2012 drilling objectives: •10,000 metres of definition drilling •15,000 metres of exploration drilling
Additional drilling from surface will be completed to further evaluate the potential of the W and other previously identified near-surface zones on the Beaufor property during 2012.

www.richmont-mines.com Copyright 2012 by Richmont Mines TSX - NYSE Amex: RIC 20
BEAUFOR MINE 2012 EXPLORATION FOCUS
www.richmont-mines.com Copyright 2012 by Richmont Mines TSX - NYSE Amex: RIC 21
38,037 38,879
Target:45,000 -50,000
841806
758
1,104
1,275
1,549
0
500
1,000
1,500
0
25,000
50,000
75,000
2009 2010 2011 2012F
Ounces gold sold Cash cost per ounce Selling price
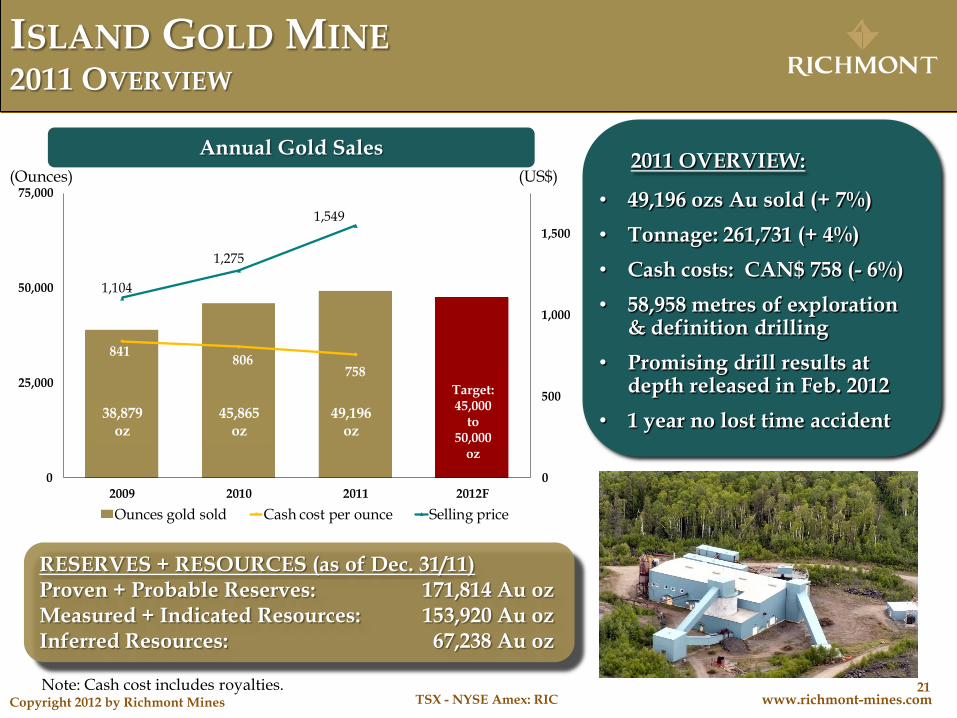
ISLAND GOLD MINE 2011 OVERVIEW
Annual Gold Sales
(Ounces) (US$) 2011 OVERVIEW:
• 49,196 ozs Au sold (+ 7%)
• Tonnage: 261,731 (+ 4%)
• Cash costs: CAN$ 758 (- 6%)
• 58,958 metres of exploration & definition drilling
• Promising drill results at depth released in Feb. 2012
• 1 year no lost time accident
Note: Cash cost includes royalties.
49,196 oz
RESERVES + RESOURCES (as of Dec. 31/11) Proven + Probable Reserves: 171,814 Au oz Measured + Indicated Resources: 153,920 Au oz Inferred Resources: 67,238 Au oz
45,865 oz
38,879 oz
Target: 45,000
to 50,000
oz

www.richmont-mines.com Copyright 2012 by Richmont Mines TSX - NYSE Amex: RIC 22
ISLAND GOLD MINE 2012 OVERVIEW
Four main zones identified (G, C, D, E1E) between -500 metres and -900 metres of vertical depth, over a lateral strike length of 150 metres between the Lochalsh and Island Main zones.
Results from more than 23,000 metres of deep drilling in 2011 confirmed the potential at depth of this mine. Notable intercepts include:
• 13.39 g/t Au over 4.84 metres (Zone E1E) • 16.42 g/t Au over 4.08 metres (Zone E1E) • 22.08 g/t Au over 6.58 metres (G Zone) • 12.28 g/t Au over 7.24 metres (C Zone) • 27.26 g/t Au over 5.88 metres (C Zone) • 33.36 g/t Au over 2.18 metres (D Zone) • 20.22 g/t Au over 2.05 metres (D Zone) Planning 35,000 metres of deep drilling at Island Gold in 2012, with the goal of establishing resources below the current infrastructure.
Deep Drilling Yields Potential at Depth

www.richmont-mines.com Copyright 2012 by Richmont Mines TSX - NYSE Amex: RIC 23
5.37/2.1
6.12/2.0
22.08/6.6
4.47/2.216.42/4.1
27.26/5.9
STH-13.23/3.7 3.81/3.4
12.28/7.2
3.66/2.0
13.39/4.8
20.22/2.1
11.65/2.6
3.39/2.0
3.49/2.1
7.10/3.8
33.36/2.23.20/2.2
3.44/2.7
6.68/2.1
3.80/5.0
6.00/3.8
5.80/2.0
3.64/5.3
8.68/2.34.78/2.0
14.28/2.0
3.97/2.63.82/2.1 4.95/2.6
3.08/2.0
8.51/9.6
10.51/2.9
6.49/2.44.65/2.0
3.96/2.2X-16.65/2.5
3.46/3.13.21/2.4
7.30/2.6
8.21/3.2
3.71/3.3
3.37/2.0
ISLAND GOLD MINE LONGITUDINAL SECTION – DEEP DRILLING RESULTS
Portal
Level 290
-500m
Crown Pillar
W
Planned drifts
Actual ramp and drifts
Mined out
Proven Reserves
Probable Reserves
Indicated Resources
Inferred Resources
Level 190
Level 340
E
-300m
-700m
100 m
Lochalsh
Island Main
Goudreau
Ext. 1 Ext. 2
-900m
Au g/t, Cut 75g / True
thickness metres
4.47/2.2
Dia
base D
yke
Only intersections with a grade of at least 3 g/t Au
over a minimum true width of 2 m are presented here.
D
G
E1E
C
New results
Previous results
Intersections below 3 g/t Au

www.richmont-mines.com Copyright 2012 by Richmont Mines TSX - NYSE Amex: RIC 24
ISLAND GOLD MINE Q1 2012 PRODUCTION HIGHLIGHTS
(for the 3 months ended March 31) Q1 2012 Q1 2011
Island Gold Mine
Tonnes 57,923 72,380
Gold recovery 96.19% 95.73%
Recovered grade 5.36 g/t 6.12 g/t
Gold ounces sold 9,978 14,233
Island Gold Mine – Q1 2012 vs. Q1 2011

www.richmont-mines.com Copyright 2012 by Richmont Mines TSX - NYSE Amex: RIC 25
FRANCOEUR MINE 2011 OVERVIEW
RESERVES + RESOURCES (as of Dec. 31/10(1))
Probable Reserves: 136,749 Au oz Indicated Resources: 18,541 Au oz Inferred Resources: 38,706 Au oz
2011 OVERVIEW:
• 4,999 metres of underground development and 13,911 metres of definition drilling completed in 2011
• 13,077 tonnes of low-grade development ore processed at Camflo Mill , generating 1,265 Au ounces
• 2011 Capex : CAN $19.2 million
• 119 employees at year-end
1) Based on an amended technical report filed on SEDAR (www.sedar.com) on May 19/10 using a gold price of US$800 (CAN$800) per ounce.

www.richmont-mines.com Copyright 2012 by Richmont Mines TSX - NYSE Amex: RIC 26
FRANCOEUR MINE 2012 OVERVIEW
Focus on Development & Production
End of Q2 2012: • Definition drilling results will be used
toward re-estimation of Reserves + Resources using updated mining costs, gold price and cut-off grade;
• Updated mine plan and production guidance will also be provided.
Based on drilling information received to date, mineralized zones appears to be more discontinuous in the upper portion of the West Zone than in original model, grade range of 4.5 g/t – 5.5 g/t Au; 2012 drilling plan: 9,100 metres exploration & 25,000 metres definition.
www.richmont-mines.com Copyright 2012 by Richmont Mines TSX - NYSE Amex: RIC 27
EWSurface
- 500m
-1000m
2 000m
Zone 3Zone 3Zone 3Zone 3Zone 3Zone 3Zone 3Zone 3Zone 3
South ZoneSouth ZoneSouth ZoneSouth ZoneSouth ZoneSouth ZoneSouth ZoneSouth ZoneSouth Zone
North ZoneNorth ZoneNorth ZoneNorth ZoneNorth ZoneNorth ZoneNorth ZoneNorth ZoneNorth Zone
East ZoneEast ZoneEast ZoneEast ZoneEast ZoneEast ZoneEast ZoneEast ZoneEast Zone
Zone 7Zone 7Zone 7Zone 7Zone 7Zone 7Zone 7Zone 7Zone 7
Zone 2Zone 2Zone 2Zone 2Zone 2Zone 2Zone 2Zone 2Zone 2
Zone 1Zone 1Zone 1Zone 1Zone 1Zone 1Zone 1Zone 1Zone 1
Zone 8Zone 8Zone 8Zone 8Zone 8Zone 8Zone 8Zone 8Zone 8
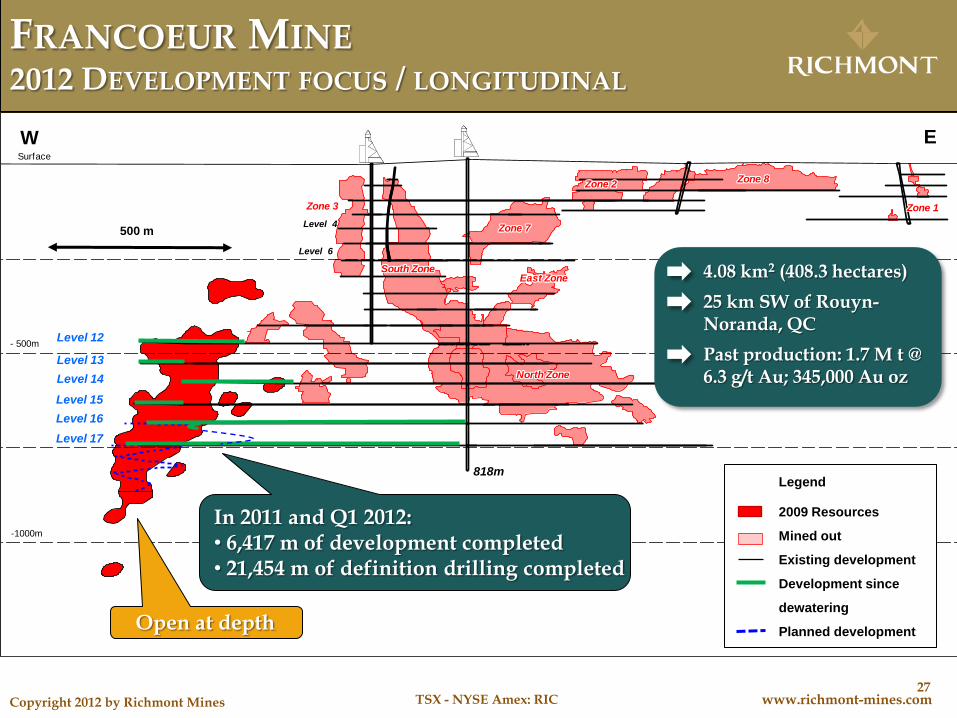
FRANCOEUR MINE 2012 DEVELOPMENT FOCUS / LONGITUDINAL
Level 13
Level 15
Level 16
Level 17
Level 4
Level 6
500 m
Level 14
Level 12
Open at depth
2009 Resources
Mined out
Existing development
Development since
dewatering
Planned development
Legend
4.08 km2 (408.3 hectares)
25 km SW of Rouyn-Noranda, QC
Past production: 1.7 M t @ 6.3 g/t Au; 345,000 Au oz
818m
In 2011 and Q1 2012: • 6,417 m of development completed • 21,454 m of definition drilling completed

www.richmont-mines.com Copyright 2012 by Richmont Mines TSX - NYSE Amex: RIC 28
WASAMAC GOLD PROJECT OVERVIEW
52,000 metre exploration drilling program in 2011 resulted in significantly increased resources:
Dec 31/11 Dec 31/10 Year/year
M + I Resources: 556,385 Au oz 411,073 Au oz + 35% Inferred Resources 2,130,532 Au oz 1,007,875 Au oz + 111%
2012 drill program will encompass approximately 55,000 metres, and will focus primarily on the Main Zone, the extension of Zone 3 and the optioned Globex claims. RIC will continue to advance all technical studies on the property including metallurgical, geotechnical, and geomechanical. Objective: to apply for permits to initiate the development of an exploration ramp in 2012.
Project Overview

www.richmont-mines.com Copyright 2012 by Richmont Mines TSX - NYSE Amex: RIC 29
800
600
400
800
1000
200
600
1175
1350
400
200
WASAMAC GOLD PROJECT RESOURCES (DECEMBER 2011), CUT-OFF: 1.5 G/T AU
Zone 1
Zone 2
-500 m
-1000 m
3500E
4000E
W E
Zone 3
Mined out / Opening
Drillhole Intersections
Measured & Indicated Resources :
3,182,577T at 2.79 g/t Au; 285,262 oz
Au
Inferred Resources:
3,624,125T at 2.84 g/t Au; 331,006 oz
Au
Main Zone
Measured & Indicated Resources :
239,059T at 2.50 g/t Au; 19,238 oz Au
Inferred Resources:
8,822,590T at 2.62 g/t Au; 743,246 oz Au
Measured & Indicated Resources :
1,526,991T at 2.08 g/t Au; 102,351 oz Au
Inferred Resources:
4,704,746T at 2.15 g/t Au; 324,892 oz Au
Indicated Resources :
40,299T at 1.87 g/t Au; 2,419 oz Au
Inferred Resources:
3,170,004T at 2.49 g/t Au; 253,988 oz Au
Measured & Indicated Resources :
6,762,455T at 2.56 g/t Au; 556,385 oz Au
Inferred Resources:
25,686,159T at 2.58 g/t Au; 2,130,532 oz Au
WASAMAC TOTAL RESOURCES
Zone 1
Zone 2
Zone 3
Inferred Resources :
3,932,289T at 2.89 g/tAu;
364,749 oz Au
Main Zone (Old Mine)
Looking 360°
Wasamac Mine / Main Zone (1965-1971)
Production: 1,892,448 T at 4.16 g/t Au
252,923 onces Au
Measured & Indicated Resources :
1,773,529T at 2.58 g/t Au; 147,115 oz Au
Inferred Resources:
1,432,404T at 2.45 g/t Au; 112,650 oz Au
Crown Pillar
250 metres

www.richmont-mines.com Copyright 2012 by Richmont Mines TSX - NYSE Amex: RIC 30
WASAMAC GOLD PROJECT 2012 DRILL PROGRAM
Significant Drill Results & Zone 4 Discovered
2012 drilling program at Wasamac has yielded additional significant results:
• 6.40 g/t Au over 52.80 metres
• 2.83 g/t Au over 71.76 metres
• 3.70 g/t Au over 56.70 metres
• 4.61 g/t Au over 34.94 metres
• 3.80 g/t Au over 7.01 metres
• 3.37 g/t Au over 9.45 metres
• 5.16 g/t Au over 11.11 metres
• 5.19 g/t Au over 7.81 metres
Zone 4: a newly discovered zone which is located on the boundary of the Wasamac property and the optioned Globex claims:
• 7.09 g/t Au over 4.80 metres
Main Zone
Zone 2
Zone 3

www.richmont-mines.com Copyright 2012 by Richmont Mines TSX - NYSE Amex: RIC 31
800
600
400
800
1000
200
600
1175
1350
400
200
Zone 1
Zone 2
-500 m
-1000 m
4000E
5000E
W E
Zone 3
Mined out / Opening
Previous Intersection
WASAMAC TOTAL RESOURCES
Measured & Indicated Resources :
6,762,455 T at 2.56 g/t Au; 556,385 oz Au
Inferred Resources:
25,686,159 T at 2.58 g/t Au; 2,130,532 oz Au
Looking 360°
Wasamac Mine / Main Zone (1965-1971)
Production: 1,892,448 T at 4.16 g/t Au
252,923 ounces Au
250 m
2012 Intersection
2012 Target
-1500 m
RIC
HM
ON
T
GL
OB
EX
OP
TIO
N
Zone 4
2.97/69.47 0.92/3.22
2.10/23.85
3.70/56.70
1.54/4.70
3.70/29.89
2.60/10.60
3.08/5.52
3.56/12.11
1.95/5.17
1.64/14.49
2.58/10.63 3.18/9.66
2.77/15.35
3.43/11.77
1.40/9.99
2.60/10.14
7.12/7.20
1.54/8.17
WS-282-03
2.83 /71.76
WS-292-01
4.61/34.94
WS-282-02
6.40/52.80
WG-516-01
Nil
WG-480-05
Nil
WG-516-02
0.45/2.65 c.l.
WS-11-128A
0.27/4.02
WS-460-01
0.07/4.00
WG-480-04
1.87/9.24
WS-480-01
7.09/5.22
WS-437-01
1.30/4.28
WS-458-03
0.24/4.00
WS-458-01
1.02/4.08
WS-458-02
5.19/7.81
WS-377-02
1.48/7.83
WS-377-01
1.12/5.28
WS-392-02
3.80/7.01
WS-393-01
3.37/9.45
WS-386-02
1.25/5.92
WS-386-01
1.82/4.39
WS-404-02
5.16/11.11
WS-460-03
2.91/6.47
WG-480-02
4.07/4.44
Au g/t (cut at 35g) / True width (m)
c.l. Core length
WASAMAC GOLD PROJECT 2012 DRILL RESULTS & EXPLORATION TARGETS

www.richmont-mines.com Copyright 2012 by Richmont Mines TSX - NYSE Amex: RIC 32
WASAMAC GOLD PROJECT 2012 PROJECT PLAN
Focus: Optimize Project Design & Economics
2012 OBJECTIVES :
1. Increase the resource base included in the mining plan, particularly in the Main Zone by:
a. Completing a technical study with the objective of adding a portion of the existing footwall/hanging wall resource located in the old mine to the mining plan;
b. Additional exploration drilling, with the goal of extending the lateral and vertical extension of known zones;
2. Include the silver grade in the geological and economic models;
3. Evaluate the Wasamac resource using a higher cut-off grade;
4. Evaluating accessing the ore body via ramp only, with a lower production rate, beginning the operation with the larger and higher grade zones to reduce the pre-production capital costs;
5. Completing a detailed study to improve gold metallurgical recovery.

www.richmont-mines.com Copyright 2012 by Richmont Mines TSX - NYSE Amex: RIC 33
MONIQUE PROJECT 2012 PROJECT PLAN
Objectives for Monique in 2012:
• Process a 5,000 tonne bulk sample from this property at the Camflo Mill, located approximately 50 km away;
• Complete more technical work on the property to evaluate the potential extension of the resources at depth using more selective underground mining methods.
Documentation for permitting for an open-pit operation submitted in November 2011; Current estimated open-pit resources of 728,164 tonnes grading 2.35 g/t Au for 55,112 ounces of gold.
Planned Small Open Pit Operation

www.richmont-mines.com Copyright 2012 by Richmont Mines TSX - NYSE Amex: RIC 34
W E
2011 intersection
Previous intersection
Au g/t / True thickness (m) 2.5 / 8.3
Overburden
© 2011 Richmont Mines Inc.
100 m
-100 m
Whittle pit shell
1200m
E
1100m
E
Zone G
Zone J
Open pit Resources (Whittle - December, 2011)
Indicated Resources : 728,164 T at 2.35 g/t Au; 55,112 oz Au
Overburden: 1,442,492 T
Waste Rock: 4,591,447 T
Inferred Resources: 11,605 T at 0.97 g/t Au; 362 oz Au
Cross Section 1180E
Cro
ss S
ecti
on
1180E
MONIQUE EXPLORATION PROPERTY LONGITUDINAL SECTION: G ZONE

www.richmont-mines.com Copyright 2012 by Richmont Mines TSX - NYSE Amex: RIC 35
CAMFLO MILL QUEBEC, CANADA
0
100
200
300
400
500
2008 2009 2010 2011 2012F
Francoeur Monique Custom milling Beaufor
Tonnes (thousands)
Annual Capacity: 425,000 tonnes
Replacement value of >CAN$35 million;
100% owned;
No major capex expected in 2012;
Excess capacity = ability to capitalize on regional discoveries & opportunities.
Francoeur: will be updated at the end of Q2 2012

www.richmont-mines.com Copyright 2012 by Richmont Mines TSX - NYSE Amex: RIC 36
RICHMONT MINES 2012 CAPEX BUDGET AND DRILLING PLAN
Note: Budgeted amount for 2012 drilling programs, planned technical work at Wasamac, advancement of Monique project and a 1,100 metre underground exploration drift at the Island Gold Mine = approximately CAN$25 million
Property Capex
(millions CAN$) Exploration Drilling
(metres) Definition Drilling
(metres)
Island Gold Mine $8.3 45,000 6,500
Beaufor Mine $1.7 15,000 10,000
W Zone – Beaufor Property $6.3 5,000 4,000
Francoeur Mine $5.7 9,100 25,000
Wasamac Property - 32,000 -
Monique Property - 5,000 -
Camflo Mill & Corporate $1.3 - -
Total $23.3 111,100 45,500
Extensive Investment in Asset Base
www.richmont-mines.com Copyright 2012 by Richmont Mines TSX - NYSE Amex: RIC 37
Kjhkjh
Hkjhkj
khkjh
www.richmont-mines.com
TSX – NYSE Amex: RIC