annual runoff and sediment in duhok reservoir watershed...
TRANSCRIPT
Engineering, 2016, 8, 410-422 Published Online July 2016 in SciRes. http://www.scirp.org/journal/eng http://dx.doi.org/10.4236/eng.2016.87038
How to cite this paper: Mohammad, M.E., Al-Ansari, N. and Knutsson, S. (2016) Annual Runoff and Sediment in Duhok Re-servoir Watershed Using SWAT and WEPP Models. Engineering, 8, 410-422. http://dx.doi.org/10.4236/eng.2016.87038
Annual Runoff and Sediment in Duhok Reservoir Watershed Using SWAT and WEPP Models Mohammad E. Mohammad1, Nadhir Al-Ansari2*, Sven Knutsson2 1Department of Dams and Water Resources Engineering, University of Mosul, Mosul, Iraq 2Department of Civil, Environmental and Natural Resources Engineering, Luleå University of Technology, Luleå, Sweden
Received 22 June 2016; accepted 11 July 2016; published 14 July 2016
Copyright © 2016 by authors and Scientific Research Publishing Inc. This work is licensed under the Creative Commons Attribution International License (CC BY). http://creativecommons.org/licenses/by/4.0/
Abstract Estimation of runoff volume and sediment load is the main problem that affects the performance of dams due to the reduction in the storage capacity of their reservoirs and their effect on dam ef-ficiency and operation schedule. The simulation models can be considered for this purpose if the continuous field measurements are not available. Soil and Water Assessment Tool (SWAT) and Water Erosion Prediction Project (WEPP) models were applied to estimate the annual runoff vo-lume and sediment load for Duhok Dam Reservoir in north of Duhok/Iraq for the period 1988- 2011. The estimated annual runoff volume varied from 2.3 to 34.7 MCM for considered period. Those values were affected by rainfall depth, intensity and runoff coefficient. The resultant annual runoff coefficient for the studied area ranged from 0.05 to 0.35 (average was 0.18) causing an av-erage runoff volume of about 14 MCM. The results of sediment routing indicated that the values of sediment yields varied from 50 to 1400 t/km2/year depending on sub basin properties. The aver-age annual sediment load from the whole watershed is about 120 × 103 ton. The estimated total sediment arrived to Duhok Reservoir for the considered period 1988-2011 was about 2.9 × 10⁶ ton. The results indicate that both models gave reasonable results in comparison with measured values. Based on statistical criteria, the results of both models are close to gather.
Keywords Annual Runoff, Annual Sediments, Duhok Dam, SWAT Model, WEPP Model
*Corresponding author.
M. E. Mohammad et al.
411
1. Introduction Sediments are one of the major problems of dam operation. They reduce the storage capacity of the reservoir and they can cause serious problems concerning the operation and stability of the dam [1]. One of the important factors in reservoirs design and operation is the sedimentation problem. Sediment delivered to the reservoir comes from two main sources. The first is the main river entering the reservoir and the second is the side valleys on both sides of the reservoir. Due to the importance of the problem, several empirical methods were developed and later modeling techniques were adopted [2]. These models (empirical and physical) use different methods in estimating the runoff and sediment. The empirical models like Universal Soil Loss Equation USLE, Modified Universal Soil Loss Equation MUSLE are easy to apply and correlate directly the sediment with rainfall and soil properties based on measured values, while the physically based models are based on physical equations for es-timating the runoff and sediment transportation process. Several types of models are used to predict sediment load. Among these [1] [3]-[5] where applied the USLE or modified forms, [6] [7] applied WEPP and GeoWEPP. The WEPP is a physically based model developed by United State Department of Agriculture and Interior to es-timate runoff, sediment load and soil erosion based on soil and climate data, while GeoWEPP is a geospatial model combine between GIS and WEPP. [8] Developed the SWAT ArcView GIS Patch II for steep slope wa-tersheds. SWAT (soil and water assessment tool) is a physically based model which was developed to simulate and predict the runoff, sediment load, and agricultural chemical yields for large and complex watersheds having different soil type [9]. [10] Applied these models and got good results on Apucaraninha River watershed in southern of Brazil. [11] Reviewed and introduced a number of selected papers which present and applied the SWAT (soil and water assessment tool). Other researchers [12]-[15] used the SWAT model to predict sediment transport. Generally, the overall results of the SWAT model were reasonable. [16] [17] Applied both WEPP and SWAT models to simulate runoff and sediment load and compared between them. [12] [18] [19] Applied mod-els based on GIS to estimate the sediment load.
Duhok Dam is an earth fill dam located about 2 km north of Duhok city [20]. The purposes of the dam are water supply and irrigation in addition to recreation. There are a number of studies which were carried out con-cerning Duhok Dam and its reservoir. [20] Applied the remote sensing technique and geographical information system to assess the change in water surface area of Duhok Dam Reservoir for the period 2001 to 2012. Also the available statistical data of water surface fluctuation was interpreted. The results indicated a good matching be-tween predicted water surfaces which was based on remote sensing and ground measurements with limited error were not more than 2.15%. [21] Applied Artificial Neural Network (ANN) of three layer back propagation to model the sediment load of Duhok Dam. The measured time series data of flow for the period 2010-2011 were considered as input, while the sediment loads represents the results of model output. The results indicated that the model is a useful tool for short real time prediction of sediment load under high rainfall intensity if the flow measurements are available. [22] Applied a technique to estimate the sediment concentration at the outlet of Duhok Reservoir watershed. The method was based on runoff turbidity and sediment concentration sampling data at watershed outlet for the period 2008-2009 to estimate the annual sediment load of Duhok Reservoir. The results indicated that the total sediment load was 4082 ton for the considered period. [23] Estimated the runoff and sediment load from the all sub watersheds of Duhok Dam (Bajlor, Sindor, Linava and Dole Germava). The estimated flow volume for the period Nov 1978 to Oct 1979 was 12 × 106 m3, while the maximum suspended load for the period from Dec. 1978 to Feb. 1980 was 5 kg/m3. The estimated sediment load indicates that they have a significant effect of dam storage capacity. [24] Applied the approach of remote sensing and geographical information system (GIS) to analyze the urban growth and land use change in Duhok city for the period 1998, 2007 and 2011. The results indicated that there is an increase in the urban area while cultivated areas decreased for the considered period.
Previous studies concerning Duhok Reservoir dealt with runoff, sediment concentration and load or the fac-tors affecting them are for a specific period. None of the previous studies was concerned with estimating the to-tal sediment load accumulated after 24 years of dam operation. The objective of this research is to evaluate the total sediment load entered Duhok Dam Reservoir since its operation in 1988 till 2011 based on application of both SWAT and GeoWEPP models, also evaluation of the models performance for estimation runoff and sedi-ment load is another objective. It is noteworthy to state that Iraq is suffering from water shortage problems now [25]-[29] and it is very important to know the actual capacity of the reservoirs to attain prudent management of water resources in the country.
M. E. Mohammad et al.
412
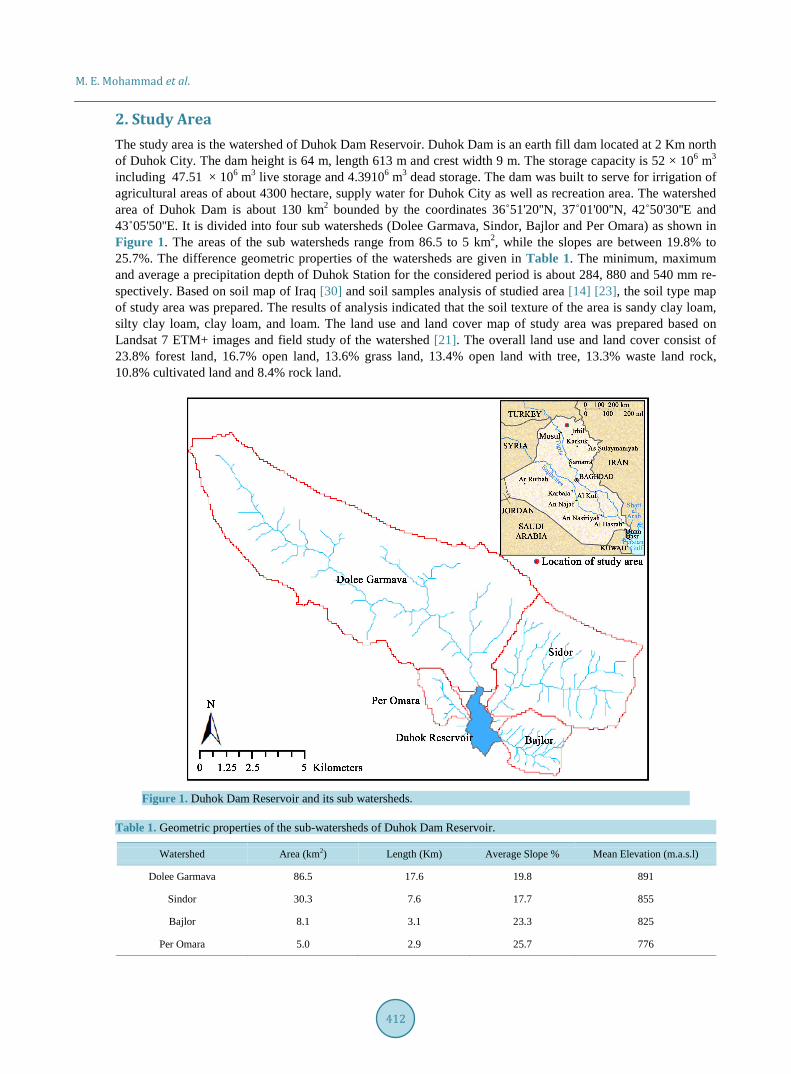
2. Study Area The study area is the watershed of Duhok Dam Reservoir. Duhok Dam is an earth fill dam located at 2 Km north of Duhok City. The dam height is 64 m, length 613 m and crest width 9 m. The storage capacity is 52 × 106 m3 including 47.51 × 10⁶ m3 live storage and 4.39106 m3 dead storage. The dam was built to serve for irrigation of agricultural areas of about 4300 hectare, supply water for Duhok City as well as recreation area. The watershed area of Duhok Dam is about 130 km2 bounded by the coordinates 36˚51'20''N, 37˚01'00''N, 42˚50'30''E and 43˚05'50''E. It is divided into four sub watersheds (Dolee Garmava, Sindor, Bajlor and Per Omara) as shown in Figure 1. The areas of the sub watersheds range from 86.5 to 5 km2, while the slopes are between 19.8% to 25.7%. The difference geometric properties of the watersheds are given in Table 1. The minimum, maximum and average a precipitation depth of Duhok Station for the considered period is about 284, 880 and 540 mm re-spectively. Based on soil map of Iraq [30] and soil samples analysis of studied area [14] [23], the soil type map of study area was prepared. The results of analysis indicated that the soil texture of the area is sandy clay loam, silty clay loam, clay loam, and loam. The land use and land cover map of study area was prepared based on Landsat 7 ETM+ images and field study of the watershed [21]. The overall land use and land cover consist of 23.8% forest land, 16.7% open land, 13.6% grass land, 13.4% open land with tree, 13.3% waste land rock, 10.8% cultivated land and 8.4% rock land.
Figure 1. Duhok Dam Reservoir and its sub watersheds.
Table 1. Geometric properties of the sub-watersheds of Duhok Dam Reservoir.
Watershed Area (km2) Length (Km) Average Slope % Mean Elevation (m.a.s.l)
Dolee Garmava 86.5 17.6 19.8 891
Sindor 30.3 7.6 17.7 855
Bajlor 8.1 3.1 23.3 825
Per Omara 5.0 2.9 25.7 776
M. E. Mohammad et al.
413
3. Descriptions of Applied Models 3.1. SWAT Model Soil and Water Assessment Tool (SWAT) is a continuous simulation model developed by the USDA-Agricul- tural Research Service. It is a physically based model to estimate runoff, nutrient losses, chemical and sediment transport within the watershed scale for daily time step [31]. The surface runoff estimation in the model can be done by two methods, the Soil Conservation Service method (USDA-SCS), Curve Number (CN) method and the Green and Ampt method (Green and Ampt, 1991 as quoted by [32]). The daily precipitation data is required to estimate the surface runoff by SCS curve number method, the curve number estimation is depends on certain soil type (permeability), land use and antecedent soil moisture conditions. The Green and Ampt infiltration me-thod required a sub-daily precipitation data to estimate the infiltration rate based on hydraulic conductivity and metric potential of wetting fronts.
The SCS curve number method was considered in this study, it is an empirical method to estimate the surface runoff based on studies of different rainfall-runoff relationships for small rural watersheds, then developed for different types of soils and land use [32]. The equation of estimating the runoff depth in SCS curve number me-thod is:
( )( )
2day
surfday
a
a
R IQ
R I S
−=
− + (1)
where: Qsurf: Accumulated runoff (mm), Rday: Daily rainfall depth and S: Retention parameter. The retention parameter varies depending on soil type, slope, land cover and management and antecedent
moisture conditions, it is equal to:
100025.4 10SCN
= −
(2)
where: CN: Curve number for normal hydrological condition. The initial abstraction (Ia) is considered equal to 0.2S, so the Equation (1) becomes in the following form:
( )2day
surf dayday
0.2for 0.2
0.8
R SQ R S
R S
−= >
+ (3)
The curve number for normal moisture condition (field capacity) identified based on soil type and land use, then it is modified based on antecedent moisture condition.
The sediment load estimation in SWAT model was executed for each hydrological response unit (HRU) di-vided in to two phase, overland phase and channel flow. The Modified Universal Soil Loss Equation (MUSLE) (31) was considered to estimate the erosion and sediment load ( ), tonSed from rainfall and overland flow in the following form.
( )0.56sur peak hru usle usle usle usle cfrg11.8Sed Q q A K C P L F= (4)
where, surQ : Surface runoff volume (mm/ha),
peakq : Peak runoff flow (m3/s),
hruA : Area of the HRUs (ha),
usleK : Rodibility factor for USLE,
usleC : Crop and management factor for USLE,
usleP : Support practice factor for USLE,
M. E. Mohammad et al.
414
usleL : Topographic factor for USLE,
cfrgF : Coarse fragment factor. Then the simple form of stream power theory was applied to estimate the channel sediment routing including
degradation or deposition. The channel bed and bank erosion will occur when stream flow transport capacity is greater than sediment load (coming from upstream region) at that reach and flow shear stress is greater than the stress required to detach the soil particles. While the deposition will occur in the case that sediment load is greater than transport capacity, the rate of sediment deposition depends on the fall velocity of particles.
3.2. WEPP Model Water Erosion Prediction Project WEPP also as SWAT model is a physically based model to predict flow, soil detachment, deposition and sediment load. It is a continuous simulation model developed by United States De-partments of Agriculture and Interior. The model consider the hydrology, plant growth, flow and erosion and deposition process for hill slopes and relatively small watersheds and it was publicly released in 1995 [33]. The continuous simulation of the model requires more detailed data than empirical or single storm simulation models. The topography as DEM, soil properties, land cover and management in addition to climate data are the main input data to the model.
The surface runoff which is based on excess rainfall is estimated by Green Ampt Mein Larson (GAML) mod-el in the following form:
,,
1 wfinf t e
inf t
f kF
νϕ θ ∆= +
(5)
where: ,inf tf : Infiltration rate at any time (mm/h),
ek : Effective hydraulic conductivity (mm/h), wfϕ : Metric potential of wetting front (mm), νθ∆ : Volumetric water content variation across wetting front, ,inf tF : Cumulative infiltration at time t, (mm).
The sediment load in WEPP model for both hill slope and channel flow consist of detachment, transport and deposition. The steady state continuity equation for sediment load estimation down a hill slope profile is consi-dered in the following form:
dd f iG D Dx= + (6)
where, G: Sediment load (kg/s/m), x: Distance in the flow direction (m),
fD : Rill erosion rate (kg/s/m2), iD : Inter rill sediment delivery to the rill (kg/s/m2).
For channel erosion, a steady state sediment continuity equation is also considered in the following form: d
dsed
L Fq D D
x= + (7)
where, d sedq : Sediment load in the channel (kg/s/m), x: Distance along the channel (m),
LD : Lateral flow of sediment along the channel (kg/s/m2), FD : Rate of detachment or deposition of sediment flow in the channel (kg/s/m2).
4. Models Calibration In order to apply the SWAT and WEPP models to estimate the runoff and sediment load entering Duhok Dam Reservoir from the watershed, the models were calibrated for both runoff and sediment concentration as a first
M. E. Mohammad et al.
415
step to ensure the models ability. Generally, the required input data of the both models included: description of watershed topography as a Digital Elevation Model (DEM) and daily readings of rainfall and other climate data, Duhok Dam and Duhok weather stations (the nearest stations to study area) were considered for that. In addition to climatic data, the soil type and land cover and land management as digital maps are required.
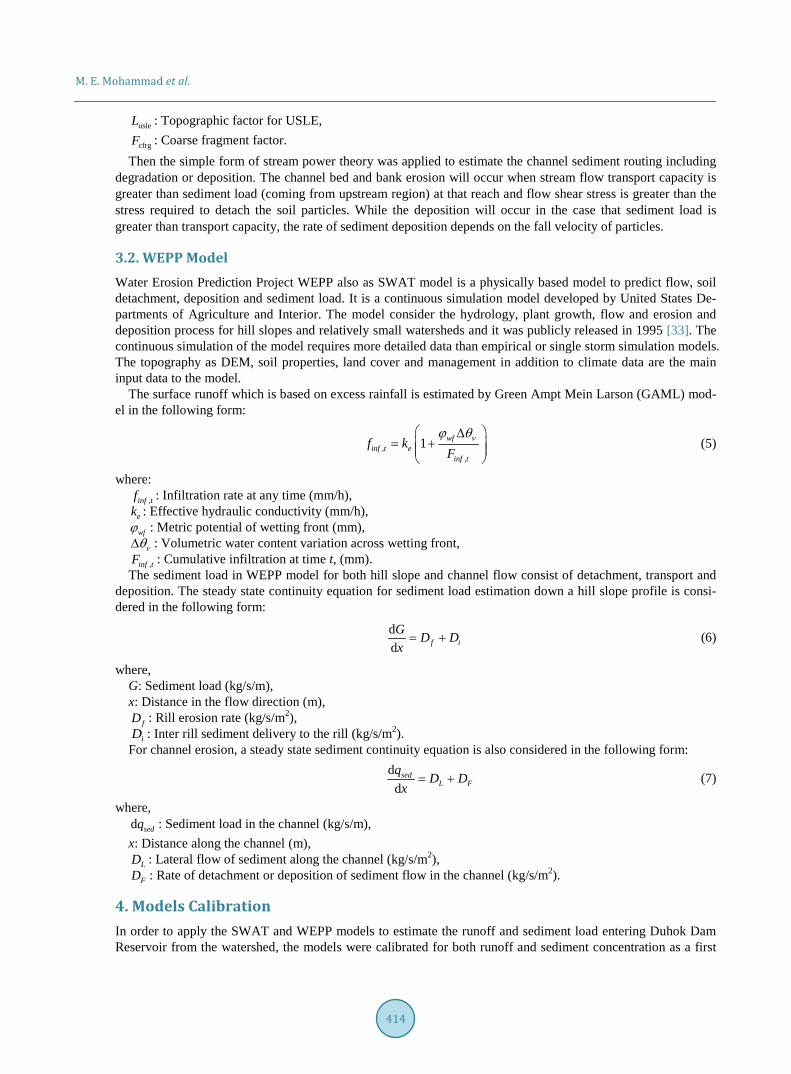
The available measured runoff data are the accumulated monthly values for the rain season 2008-2009 as presented by [22] were considered for models calibration. The effective parameters for flow calibration for SWAT model were the curve number (CN) for each soil type, hydraulic conductivity of the channel, hydraulic conductivity of the soil and Manning’s roughness coefficient for over land flow and channel flow. These para-meters were adjusted within allowable limits in the calibration process to abstain the best results. For WEPP model the effective parameters on runoff calibration is the effective hydraulic conductivity ke in the infiltration Equation (5), in addition to the other parameters mentioned above, these values were changed within reasonable limit for each soil type to reduce the difference between the measured and observed values based on statistical criteria considered for models evaluation. Figure 2 shows the observed and optimal predicted values by SWAT and WEPP models for total monthly runoff. One of the main differences in runoff volume is the measured value of 490.5 × 10³ m3 is that the predicted value were zero for both models. This difference is attributed to the fact that the total monthly rainfall at that month did not exceed 5mm, while there is a measured runoff value, so maybe there is an error in field measurements.
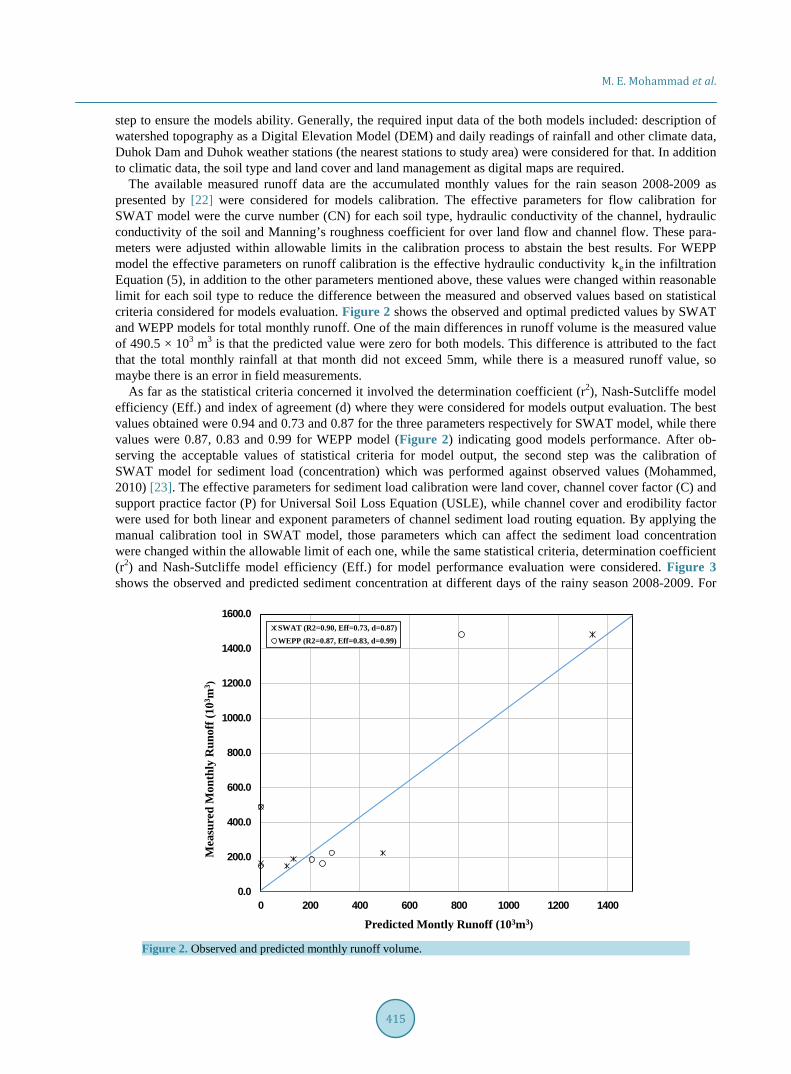
As far as the statistical criteria concerned it involved the determination coefficient (r2), Nash-Sutcliffe model efficiency (Eff.) and index of agreement (d) where they were considered for models output evaluation. The best values obtained were 0.94 and 0.73 and 0.87 for the three parameters respectively for SWAT model, while there values were 0.87, 0.83 and 0.99 for WEPP model (Figure 2) indicating good models performance. After ob-serving the acceptable values of statistical criteria for model output, the second step was the calibration of SWAT model for sediment load (concentration) which was performed against observed values (Mohammed, 2010) [23]. The effective parameters for sediment load calibration were land cover, channel cover factor (C) and support practice factor (P) for Universal Soil Loss Equation (USLE), while channel cover and erodibility factor were used for both linear and exponent parameters of channel sediment load routing equation. By applying the manual calibration tool in SWAT model, those parameters which can affect the sediment load concentration were changed within the allowable limit of each one, while the same statistical criteria, determination coefficient (r2) and Nash-Sutcliffe model efficiency (Eff.) for model performance evaluation were considered. Figure 3 shows the observed and predicted sediment concentration at different days of the rainy season 2008-2009. For
Figure 2. Observed and predicted monthly runoff volume.
0.0
200.0
400.0
600.0
800.0
1000.0
1200.0
1400.0
1600.0
0 200 400 600 800 1000 1200 1400
Mea
sure
d M
onth
ly R
unof
f (10
3 m3 )
Predicted Montly Runoff (103m3)
SWAT (R2=0.90, Eff=0.73, d=0.87)WEPP (R2=0.87, Eff=0.83, d=0.99)
M. E. Mohammad et al.
416
Figure 3. Observed and predicted sediment concentration.
WEPP model, the effective factors on sediment load are inter-rill erodibility (Ki), rill erodibility (Kr) and critical hydraulic shear τc. The best values statistical criteria for runoff values obtained from WEPP model were 0.91, 0.77 and 0.93 for determination of the coefficient (r2), Nash-Sutcliffe model efficiency (Eff.) and index of agree- ment (d) respectively (Figure 3).
5. Models Validation The models were calibrated for both runoff and sediment load based on manual calibration tools by selecting the best values of the parameters effecting both runoff and sediments. The results of statistical criteria indicated ac-ceptable values relative to the measured values for both models, although the parameters did not give a clear in-dication to consider which one of the model is better than the other.
Validation of the model was a necessity before its application. Due to limited available measured data for both runoff and sediments, the models were validated based on available measured annual sediment load data presented by Mohammed, 2010 [23]. Table 2 show the measured and predicted sediment loads based on SWAT and WEPP models. The resultant statistical criteria, determination coefficients (r2) and model efficiency (Eff.) and Index of Agreements (d) are 0.98 and o.60 and 0.84 for SWAT model and 0.84, 0.65 and 0.84 for WEPP model respectively, indicating acceptable model performance.
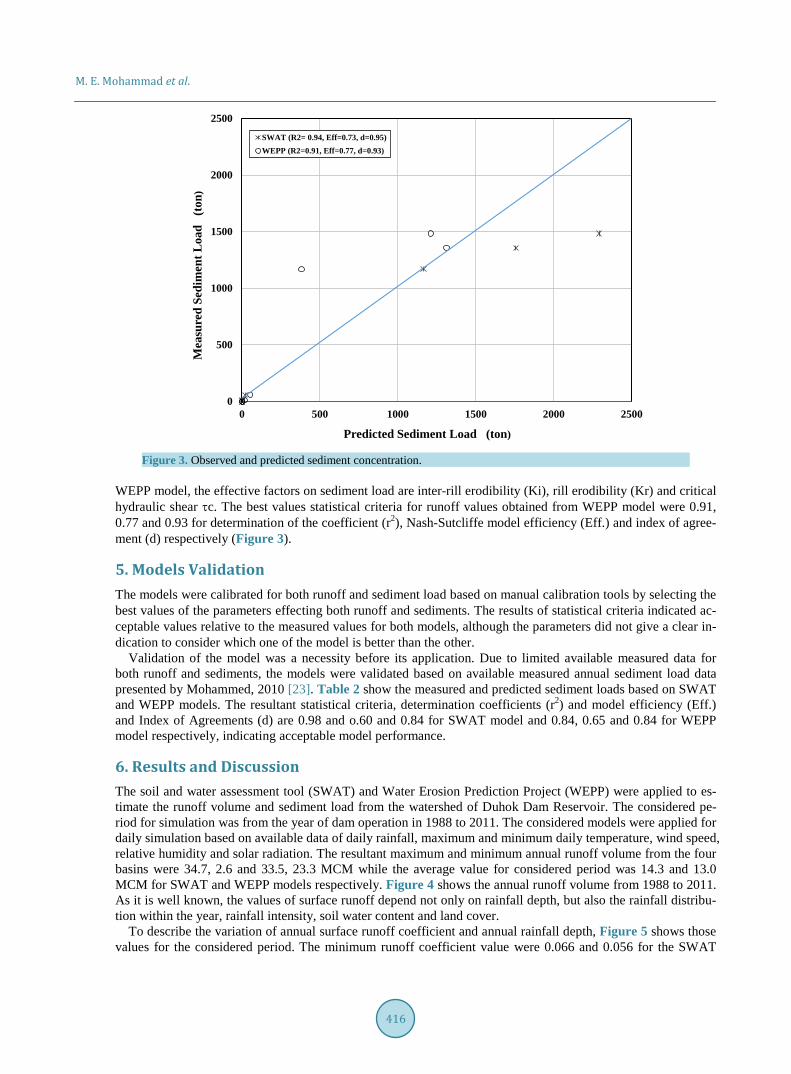
6. Results and Discussion The soil and water assessment tool (SWAT) and Water Erosion Prediction Project (WEPP) were applied to es-timate the runoff volume and sediment load from the watershed of Duhok Dam Reservoir. The considered pe-riod for simulation was from the year of dam operation in 1988 to 2011. The considered models were applied for daily simulation based on available data of daily rainfall, maximum and minimum daily temperature, wind speed, relative humidity and solar radiation. The resultant maximum and minimum annual runoff volume from the four basins were 34.7, 2.6 and 33.5, 23.3 MCM while the average value for considered period was 14.3 and 13.0 MCM for SWAT and WEPP models respectively. Figure 4 shows the annual runoff volume from 1988 to 2011. As it is well known, the values of surface runoff depend not only on rainfall depth, but also the rainfall distribu-tion within the year, rainfall intensity, soil water content and land cover.
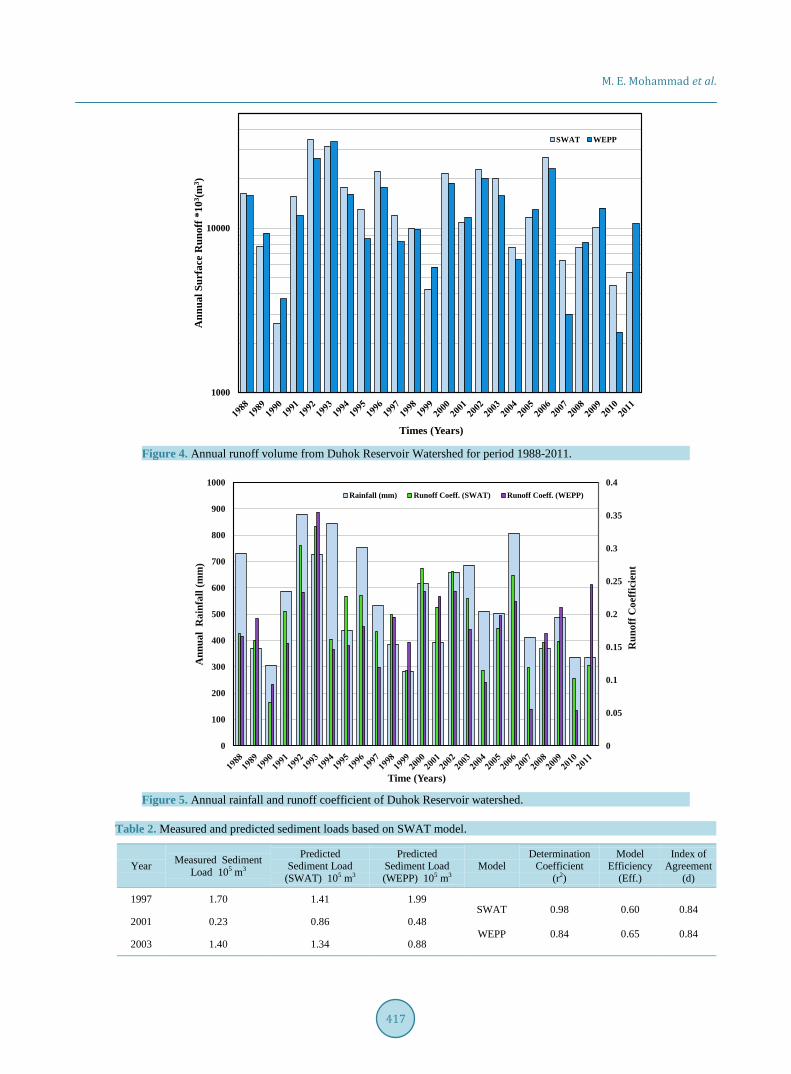
To describe the variation of annual surface runoff coefficient and annual rainfall depth, Figure 5 shows those values for the considered period. The minimum runoff coefficient value were 0.066 and 0.056 for the SWAT
0
500
1000
1500
2000
2500
0 500 1000 1500 2000 2500
Mea
sure
d Se
dim
ent L
oad
(to
n)
Predicted Sediment Load (ton)
SWAT (R2= 0.94, Eff=0.73, d=0.95)WEPP (R2=0.91, Eff=0.77, d=0.93)
M. E. Mohammad et al.
417
Figure 4. Annual runoff volume from Duhok Reservoir Watershed for period 1988-2011.
Figure 5. Annual rainfall and runoff coefficient of Duhok Reservoir watershed.
Table 2. Measured and predicted sediment loads based on SWAT model.
Year Measured Sediment Load 105 m3
Predicted Sediment Load
(SWAT) 105 m3
Predicted Sediment Load (WEPP) 105 m3
Model Determination
Coefficient (r2)
Model Efficiency
(Eff.)
Index of Agreement
(d)
1997 1.70 1.41 1.99 SWAT
WEPP
0.98
0.84
0.60
0.65
0.84
0.84 2001 0.23 0.86 0.48
2003 1.40 1.34 0.88
1000
10000
Ann
ual S
urfa
ce R
unof
f *10
3 (m
3 )
Times (Years)
SWAT WEPP
0
0.05
0.1
0.15
0.2
0.25
0.3
0.35
0.4
0
100
200
300
400
500
600
700
800
900
1000
Run
off C
oeffi
cien
t
Ann
ual
Rai
nfal
l (m
m)
Time (Years)
Rainfall (mm) Runoff Coeff. (SWAT) Runoff Coeff. (WEPP)
M. E. Mohammad et al.
418
and WEPP models respectively, this values happen for the years of rainfall depth below average yearly value (540 mm). That is attributed to the annual rainfall depth was less than the average. The successive years of rela-tively low rainfall depth less than the average values had affected the water content in the soil and this was re-flected on the infiltration rate and runoff coefficient especially in the second year. The maximum rainfall rec-orded in the area was in 1992 where it reached 879 mm. For this reason, the maximum runoff coefficients of 0.33 and 0.35 for the SWAT and WEPP models respectively noticed in 1993 where the rainfall depth reached 727 mm.
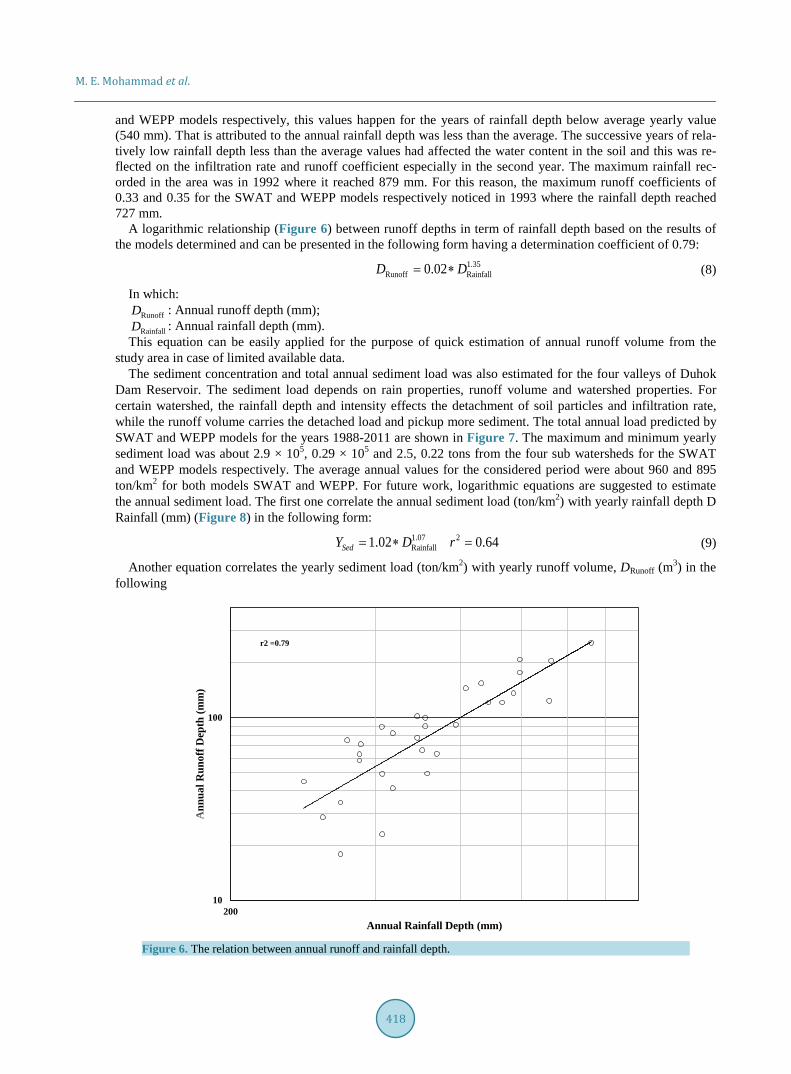
A logarithmic relationship (Figure 6) between runoff depths in term of rainfall depth based on the results of the models determined and can be presented in the following form having a determination coefficient of 0.79:
1.35Runoff Rainfall0.02D D= ∗ (8)
In which: RunoffD : Annual runoff depth (mm); RainfallD : Annual rainfall depth (mm).
This equation can be easily applied for the purpose of quick estimation of annual runoff volume from the study area in case of limited available data.
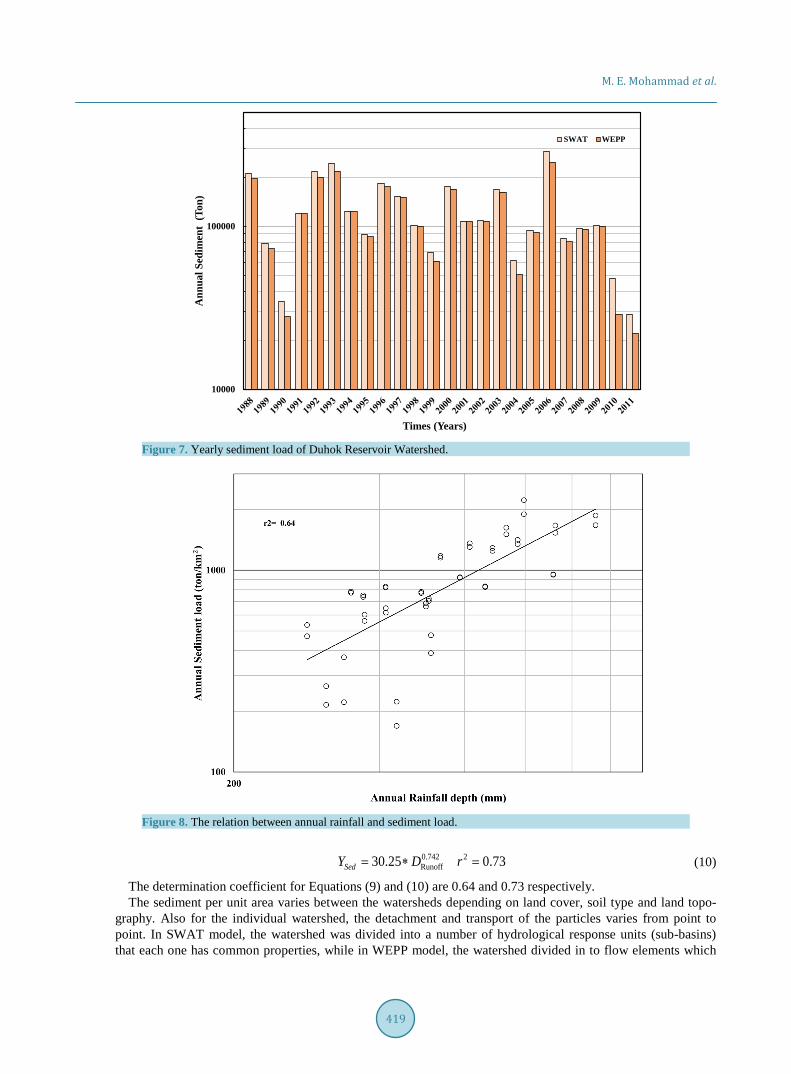
The sediment concentration and total annual sediment load was also estimated for the four valleys of Duhok Dam Reservoir. The sediment load depends on rain properties, runoff volume and watershed properties. For certain watershed, the rainfall depth and intensity effects the detachment of soil particles and infiltration rate, while the runoff volume carries the detached load and pickup more sediment. The total annual load predicted by SWAT and WEPP models for the years 1988-2011 are shown in Figure 7. The maximum and minimum yearly sediment load was about 2.9 × 10⁵, 0.29 × 10⁵ and 2.5, 0.22 tons from the four sub watersheds for the SWAT and WEPP models respectively. The average annual values for the considered period were about 960 and 895 ton/km2 for both models SWAT and WEPP. For future work, logarithmic equations are suggested to estimate the annual sediment load. The first one correlate the annual sediment load (ton/km2) with yearly rainfall depth D Rainfall (mm) (Figure 8) in the following form:
1.07Rainfall
2 0.641.02Sed D rY = =∗ (9)
Another equation correlates the yearly sediment load (ton/km2) with yearly runoff volume, DRunoff (m3) in the following
Figure 6. The relation between annual runoff and rainfall depth.
10
100
200
Ann
ual R
unof
f Dep
th (m
m)
Annual Rainfall Depth (mm)
r2 =0.79
M. E. Mohammad et al.
419
Figure 7. Yearly sediment load of Duhok Reservoir Watershed.
Figure 8. The relation between annual rainfall and sediment load.
0.742Runof
2f3 0.0 2 73. 5Sed rY D= =∗ (10)
The determination coefficient for Equations (9) and (10) are 0.64 and 0.73 respectively. The sediment per unit area varies between the watersheds depending on land cover, soil type and land topo-
graphy. Also for the individual watershed, the detachment and transport of the particles varies from point to point. In SWAT model, the watershed was divided into a number of hydrological response units (sub-basins) that each one has common properties, while in WEPP model, the watershed divided in to flow elements which
10000
100000
Ann
ualS
edim
ent
(Ton
)
Times (Years)
SWAT WEPP
M. E. Mohammad et al.
420
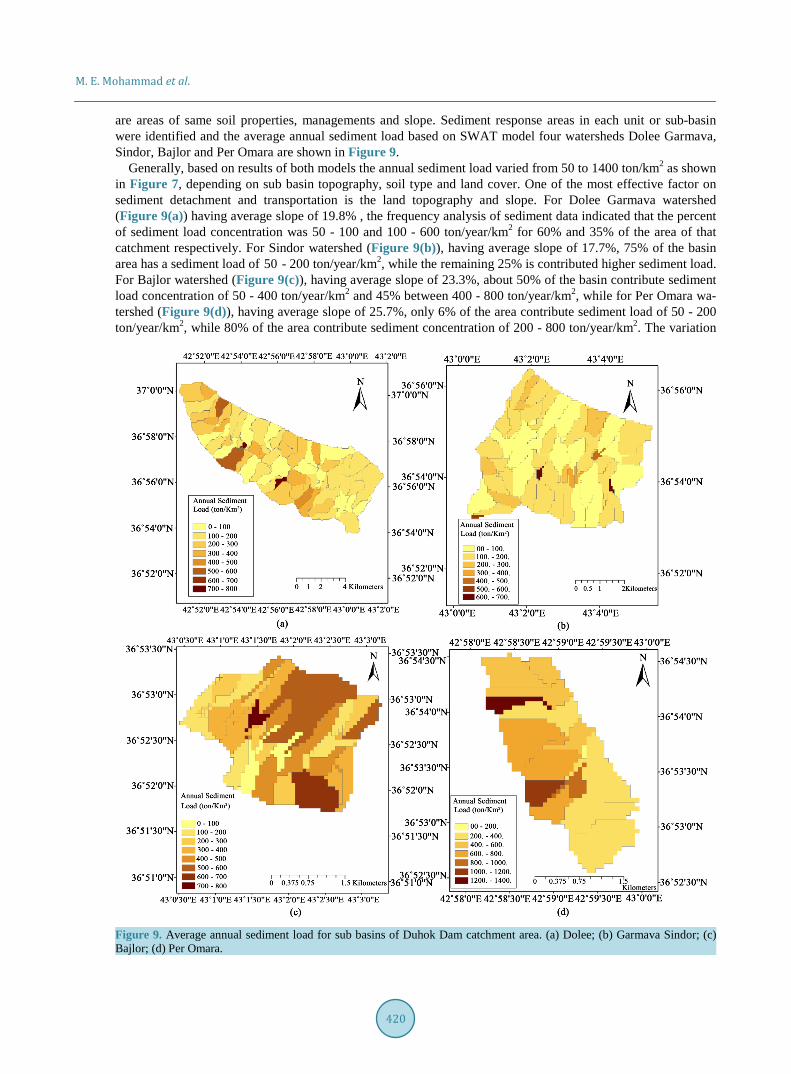
are areas of same soil properties, managements and slope. Sediment response areas in each unit or sub-basin were identified and the average annual sediment load based on SWAT model four watersheds Dolee Garmava, Sindor, Bajlor and Per Omara are shown in Figure 9.
Generally, based on results of both models the annual sediment load varied from 50 to 1400 ton/km2 as shown in Figure 7, depending on sub basin topography, soil type and land cover. One of the most effective factor on sediment detachment and transportation is the land topography and slope. For Dolee Garmava watershed (Figure 9(a)) having average slope of 19.8% , the frequency analysis of sediment data indicated that the percent of sediment load concentration was 50 - 100 and 100 - 600 ton/year/km2 for 60% and 35% of the area of that catchment respectively. For Sindor watershed (Figure 9(b)), having average slope of 17.7%, 75% of the basin area has a sediment load of 50 - 200 ton/year/km2, while the remaining 25% is contributed higher sediment load. For Bajlor watershed (Figure 9(c)), having average slope of 23.3%, about 50% of the basin contribute sediment load concentration of 50 - 400 ton/year/km2 and 45% between 400 - 800 ton/year/km2, while for Per Omara wa-tershed (Figure 9(d)), having average slope of 25.7%, only 6% of the area contribute sediment load of 50 - 200 ton/year/km2, while 80% of the area contribute sediment concentration of 200 - 800 ton/year/km2. The variation
Figure 9. Average annual sediment load for sub basins of Duhok Dam catchment area. (a) Dolee; (b) Garmava Sindor; (c) Bajlor; (d) Per Omara.

M. E. Mohammad et al.
421
of sediment load values within the study area reflect the effect of surface slope and the land cover effect on transported sediment. The presented maps are useful to identify the sub-basin that is feeding the flow with high sediment concentration. These areas are to be treated with different ways for soil conservation to reduce erosion from these sub-basins.
The average annual sediment load for the considered period from the whole watershed was 124.6, 116.3 ton while the total sediment load was 2.99 × 10⁶, 2.79 × 10⁶ ton for both SWAT and WEPP models respectively, which is equivalent to about 2.4 × 10⁶ m3.
7. Conclusion Estimation of runoff and sediment load are important factors in operation schedule and maintenance of the dams. In case of limited filed measurements of runoff and sediment, simulation model can considered for this purpose. Soil and Water Assessment Tool (SWAT) and Water Erosion Prediction Project (WEPP) were applied to esti-mate the annual runoff and sediment load of Duhok Dam watershed in north of Iraq. The models were calibrated and validated based on available field measurements, which gave good agreements. The resultant average an-nual runoff and sediment load of both applied models for considered period 1988-2011 are 13.7 MCM and 120.4 × 10³ ton respectively. Maps of sediment yield per unit area were presented for each sub watershed to identify the sub basins of high sediment yield. Based on models results, relations between runoff-rainfall, sedi-ment-rainfall and sediment-runoff were presented as simple tools to estimate runoff and sediment without details different data required to apply the SWAT or WEPP models.
References [1] Srinivasan, R.T., Ramanarayanan, G.A. and Bednarz, S. (1998) Large Area Hydrologic Modeling and Assessment
Part-II Model Application. Journal of the American Water Resources Association, 34, 91-101. [2] US Department of Interior, Bureau of Reclamation (1972) Erosion and Sedimentation Manual. US Department of
USDA, Soil Conservation Service, National Engineering Handbook Section 4 Hydrology, Chapters 4-10. [3] Fernandez, C.J., McCool Wu, D. and Stockle, C. (2003) Estimation Water Erosion and Sediment Yield with GIS,
RUSLE, and SEDD. Journal of Soil and Water Conservation, 58, 128-136. [4] Kim, H. (2006) Soil Erosion modeling Using RUSLE and GIS on the IMHA Watershed. South Korea, Master Thesis.
Colorado State University, Colorado. [5] Gitas, I., Douros, K., Minakou, C., Silleos, G. and Karydas, C. (2009) Multi-Temporal Soil Erosion Risk Assessment
in N. chalkidiki Using a Modified Usle Raster Model. EARSeL e-Proceedings, 8, 40-52. [6] Baigorria, G. and Romero, C. (2007) Assessment of Erosion Hotspots in a Watershed: Integrating the WEPP Model
and GIS in a Case Study in the Peruvian Andes. Environmental Modelling and Software, 22, 1175-1183. http://dx.doi.org/10.1016/j.envsoft.2006.06.012
[7] Yüksel, A., Akay, A., Gundogan, R., Reis. M. and Cetiner, M. (2008), Application of GeoWEPP for Determining Se-diment Yield and Runoff in the Orcan Creek Watershed in Kahramanmaras, Turkey. Sensors, 8, 1222-1236. http://dx.doi.org/10.3390/s8021222
[8] Kim, J.G., Park, Y., Yoo, D., Kim, N., Engel, B. and Kim, S. (2008) Development of a SWAT ArcView GIS Patch for Accurate Analysis of Soil Erosion and Sediment Yield at Steep Sloping Watershed. American Society of Agricultural and Biological Engineering. Annual International Meeting, 9, 5282-5287.
[9] Ashagre, B. (2009) SWAT to Identify Watershed Management Option: (Anjeni Watershed, Blue Nile Basin, Ethiopia), Master Thesis. Cornell University, New York.
[10] Santos, I.D., Andriolo, M., Gibertoni, R. and Kobiyama, M. (2010) Use of the SWAT Model to Evaluate the Impact of Different Land Use Scenarios on Discharge and Sediment Transport in the Apucaraninha River Watershed, Southern Brazil. International Association of Hydrological Science, 337, 322-328.
[11] Doughlas-Mankin, K.R., Srinivasan. R. and Arnold, J. (2010) Soil and Water Assessment Tool (SWAT) Model: Cur-rent Development and Application. Transactions of the ASABE, 53, 1423-1431. http://dx.doi.org/10.13031/2013.34915
[12] Jain, M., Mishra, S. and Shah, R. (2010) Estimation of Sediment Yield and areas Vulnerable to Soil Erosion and Depo-sition in a Himalayan Watershed Using GIS. Current Science. 98, 213-221.
[13] Betrie, G.D., Mohamed, Y.A., van Griensven, A. and Srinivasan, R. (2011) Sediment Management Modelling in the Blue Nile Basin Using SWAT Model. Hydrology and Earth System Science, 15, 807-818. http://dx.doi.org/10.5194/hess-15-807-2011
M. E. Mohammad et al.
422
[14] Mohammad, E., Al-Ansari, N. and Knutsson, S. (2013) Sediment Delivery From Right Bank Valleys to Mosul Reser-voir, Iraq. Journal of Ecology and Environmental Science, 3, 50-53.
[15] Shawul, A.A., Alamirew, T. and Dinka, M.O. (2013) Calibration and Validation of SWAT Model and Estimation of Water Balance Components of Shaya Mountainous Watershed, Southeastern Ethiopia. Hydroogy and Earth System Sciences, 10, 13955-13978. http://dx.doi.org/10.5194/hessd-10-13955-2013
[16] Shen, Z.Y., Gong, Y.W., Hong, Q., Li, Y.H., Liu R.M. and Xu, L. (2009) A Comparison of WEPP and SWAT for Modeling Soil Erosion of the Zhangjiachong Watershed in the Three Gorges Reservoir Area. Agricultural Water Management, 96, 1435-1442. http://dx.doi.org/10.1016/j.agwat.2009.04.017
[17] Afshar, A.A. and Hassanzadeh, Y. (2015) A Comparison of WEPP and SWAT for Modeling Soil Erosion of Torogh Watershed in Khorasan Razavi Province. 10th International Congress on Civil Engineering, Tabriz, 5-7 May 2015.
[18] Engda, T. (2009) Modeling Rainfall, Runoff and Soil Loss Relationships in the Northeastern Highlands of Ethiopia, Audit Tide Watershed. Master Thesis, Cornell University, Cornell.
[19] Nangia, V., Wymar. P. and Klang, J. (2010) Evaluation of a GIS-Based Watershed Modeling Approach for Sediment Transport. International Journal of Agricultural and Biological Engineering, 3, 1-11.
[20] Mustafa, Y. and Noori, M. (2013) Satellite Remote Sensing and Geographic Information Systems (GIS) to Assess Changes in the Water Level in the Duhok Dam. International Journal of Water Resources and Environmental Engi-neering, 5, 251-259.
[21] Issazadeh, L. and Govay, M. (2014) Reservoir Sediment Prediction in Duhok Dam Using Artificial Neural Network and Conventional Methods. Indian Journal of Fundamental and Applied Life Sciences, 4, 441-446.
[22] Sulaiman, A. (2010) Estimating of Annual Sediments of Duhok Dam By Using River Turbidity Water Samples. Jour-nal of Duhok University Agricultural and Veterinary Science, 13, 82-89.
[23] Mohammed, R. (2010) The Impact of the Man Activity in Duhok Dam Watershed on the Future of Duhok Dam Lake North-Iraq. 1st International Applied Geological Congress, Department of Geology, Islamic Azad University-Mashad Branch, Iran, 26-28 April 2010.
[24] Mohammed, J. (2013) Land Use and Cover Change Assessment Using Remote Sensing and GIS: Dohuk City, Kurdis-tan, Iraq. International Journal of Geomatic and Geosciences, 3, 552-569.
[25] Al-Ansari, N.A. (1998) Water Resources in the Arab Countries: Problems and Possible Solutions. The International Conference on World Water Resources at the Beginning of the 21st Century, Water: A Looming Crisis? Paris, 3-6 June 1998, 367-376.
[26] Al-Ansari, N.A. and Knutsson, S. (2011) Toward Prudent Management of Water Resources in Iraq. Journal of Ad-vance Science and Engineering Research, 1, 53-67.
[27] Al-Ansari, N.A. (2013) Management of Water Resources in Iraq: Perspectives and Prognoses. Journal of Engineering, 5, 667-684. http://dx.doi.org/10.4236/eng.2013.58080
[28] Al-Ansari, N.A., Ali, A. and Knutsson, S. (2014) Present Conditions and Future Challenges of Water Resources Prob-lems in Iraq. Journal of Water Resources and Protection, 6, 1066-1098. http://dx.doi.org/10.4236/jwarp.2014.612102
[29] Al-Ansari, N.A., Ali, A. and Knutsson, S. (2015) Iraq Water Resources Planning: Perspectives and Prognoses. 13th In-ternational Conference on Civil and Construction Engineering (ICCCE), Jeddah, 26-27 January 2015, 2097-2108.
[30] Buringh, P. (1960) Soils and Soil Conditions in Iraq. Republic of Iraq, Ministry of Agriculture, Directorate of Agricul-tural Research and Projects Soils, 322.
[31] Arnold, J.G., Srinivasan, R., Muttiah, R. and. Williams, J. (1998) Large Area Hydrologic Modeling and Assessment Part I: Model Development. Journal of American Water Resources Association, 34, 73-89. http://dx.doi.org/10.1111/j.1752-1688.1998.tb05961.x
[32] Neitsch, S., Arnold, J., Kiniry, J. and Williams, J. (2009) Soil and Water Assessment Tool Theoretical Documentation Version. Blackland Research Center-Texas SA TR, 406.
[33] Flanagan, D.C., Gilley, J.E. and Franti, T.G. (2007) Water Erosion Prediction Project (WEPP): Development History, Model Capabilities, and Future Enhancements. Transactions of American Society of Agricultural and Biological Engi-neers, 50, 1603-1612. http://dx.doi.org/10.13031/2013.23968

Submit or recommend next manuscript to SCIRP and we will provide best service for you: Accepting pre-submission inquiries through Email, Facebook, LinkedIn, Twitter, etc. A wide selection of journals (inclusive of 9 subjects, more than 200 journals) Providing 24-hour high-quality service User-friendly online submission system Fair and swift peer-review system Efficient typesetting and proofreading procedure Display of the result of downloads and visits, as well as the number of cited articles Maximum dissemination of your research work
Submit your manuscript at: http://papersubmission.scirp.org/