annual report - synchrony financial/media/... · annual report 2016 synchrony financial annual...
TRANSCRIPT

Annual Report2016
www.synchronyfinancial.com
Synch
ron
y Fina
ncia
l An
nua
l Rep
ort 20
16

About Synchrony FinancialSynchrony Financial (NYSE: SYF) is one of the nation’s premier consumer financial services companies. As the largest provider of private label credit cards in the United States*, we provide a range of credit products through a diverse group of national and regional retailers, local merchants, manufacturers, buying groups, industry associations and health and wellness providers. We deliver innovative analytics, payments, loyalty and financing solutions to help generate growth for our partners and offer financial flexibility to our customers. Through our partners’ over 365,000 locations across the United States and Canada, and their websites and mobile applications, we offer our customers private label credit cards, Dual Card™, and general purpose co-branded credit cards, promotional financing and installment lending, and loyalty programs. Through Synchrony Bank, we offer FDIC-insured savings products. Engage with us at: www.synchronyfinancial.com
*Based on purchase volume and receivables. The Nilson Report (April 2015, Issue #1062) — based on 2014 data.
SYNCHRONY FINANCIAL(NYSE: SYF) 777 Long Ridge RoadStamford, CT 06902
GENERAL INQUIRIES866-419-4096
INVESTOR INQUIRIES855-818-3056

3
1
Interest and Fee Income Growth
11%
At Synchrony Financial we are working hard to realize a clear purpose: to pioneer the future of financing, improving the success of every business we serve and the quality of each life we touch. We wake up every day obsessed with helping our partners of all sizes grow. It is a bold objective, and I often think about what it will require from each of us — from our frontline employees to our leaders — to build a company that empowers success for all our stakeholders.
Pioneers forge new paths and are inherently optimistic. Expanding the idea of what is possible and creating breakthrough solutions requires confidence in our vision and our opportunities. We began 2016 with this mindset, and our achievements only serve to underscore our passion about the course we’ve set for 2017 and beyond. Our team delivered consistently
strong results in 2016: deepening our partnerships, growing receivables, growing deposits, innovating products through digital solutions, and strengthening our data and analytics capabilities.
In terms of financial performance, we delivered significant revenue growth and substantial operating leverage in 2016, and met or exceeded all metrics for the year's outlook.
A Message from the CEO
Margaret KeanePresident and Chief Executive Officer
Net Interest Margin
16.1%Efficiency
Ratio
31.1%Common Equity
Tier One ratio
17.2%
Total Deposit
Growth
20%
Loan Receivables Growth
12%
Other highlights for the year include:

2
By remaining focused on competitive rates and exceptional customer service, Synchrony Bank — our online bank — grew total deposits to $52.1 billion, $37.9 billion of which were direct deposits. We continued to operate with a strong balance sheet and robust capital levels, and our capital priorities remain consistent: organic growth, dividends and share repurchases, and selective acquisitions that enhance our capabilities to support growth. In July, we began returning capital to shareholders through a quarterly common stock dividend of $0.13 per
share and a share repurchase program of up to $952 million for the four quarters ending June 2017. While we’re excited to return capital to shareholders through dividends and buybacks, our foremost capital priority remains supporting our strong organic growth.
Each of our sales platforms achieved notable accomplishments during the year:
• In Retail Card, organic growth continues to be our biggest opportunity. We are pleased to announce that several of our key existing relationships were renewed, including TJX companies and Stein Mart. We launched the popular 3-2-1 Save rewards value proposition with our long-standing partner, Walmart. We also leveraged our capabilities to attract new partners in the travel and entertainment space through co-branded programs with Cathay Pacific Airways, Marvel Entertainment and Fareportal.
• In Payment Solutions, we are happy to continue to provide consumer financing through existing and new programs. We renewed our five-year partnership with Ashley Furniture HomeStore, one of the nation’s largest providers of home furnishings, as well as our programs with Nationwide Marketing Group, La-Z-Boy and Suzuki, and we launched a new program with Mattress Firm.
• In CareCredit, we signed a new multi-year agreement with Henry Schein Financial Services, the world's largest provider of healthcare products and services. We renewed VCA Animal Hospitals in our network of providers and renewed our CareCredit endorsement relationships with the American Dental Association and American Society of Plastic Surgeons. Additionally, the release of CareCredit's Pay my Provider reinforces our commitment to expanding relationships in the healthcare industry and offering cardholders more opportunities to get the care they need.
PAYMENT SOLUTIONS
• Broad receivables growth led by home furnishings, auto and power
• Loan receivables +15%
• Purchase volume +14%
• Average active accounts +12%
• Interest & fees on loans +14%
CARECREDIT
• Receivables growth led by dental & veterinary
• Loan receivables +10%
• Purchase volume +11%
• Average active accounts +8%
• Interest & fees on loans +9%
RETAIL CARD
• Strong growth across partner programs
• Loan receivables +11%
• Purchase volume +10%
• Average active accounts +6%
• Interest & fees on loans +11%
SYNCHRONY BANK
• Deposit growth: $8.7 billion or 20%
• Total deposits: $52.1 billion
• 72% of funding sourced from deposits

3
3
Our Strategic PrioritiesEXPAND ROBUST DATA, ANALYTICS
AND DIGITAL CAPABILITIES
• Accelerate capabilities: marketing, analytics and loyalty
• Continue to leverage SKU-level data and invest in CRM to differentiate marketing capabilities
• Deliver leading capabilities across digital and mobile technologies
OPERATE WITH A STRONG BALANCE SHEET AND FINANCIAL PROFILE
• Maintain strong capital and liquidity
• Deliver earnings growth at attractive returns
LEVERAGE STRONG CAPITAL POSITION
• Organic growth, program acquisitions and startup opportunities
• Continue capital plan execution through dividends and share repurchase program, subject to Board and regulatory approvals
• Invest in capability-enhancing technologies and businesses
POSITION BUSINESS FOR LONG-TERM GROWTH
• Explore opportunities to expand the core business (e.g., small business and proprietary networks)
• Continue to grow Synchrony Bank — enhance offerings to increase loyalty, diversify funding and drive profitability
GROW OUR BUSINESS THROUGH OUR THREE SALES PLATFORMS
• Grow existing partner penetration
• Continue to innovate and provide robust cardholder value propositions
• Add new partners and programs with attractive risk and return profiles

4
Advantaged in a Competitive EnvironmentLast year the economic climate remained mostly positive, with unemployment relatively stable, yet the market saw only modest increases in overall consumer spending. Many consumers remain cautious as they seek deals and discounts. We view this as an environment that favors our products, which provide deeper discounts and greater rewards to consumers. We use our experience and broad capabilities to work closely with our retail partners to offer a compelling value proposition.
The advantages inherent in our closed loop network are significant. When customers use our cards,
we capture a deep and robust data set. Our advanced analytics capabilities allow us to use this data to craft highly customized offers aligned with the specific needs and preferences of individual consumers. Importantly, this work is done in close collaboration with our partners, with the mutual goal to benefit their customers.
The Power of PartnershipsWe have built a partner-centric business model in each of our three sales platforms: Retail Card, Payment Solutions and CareCredit. A core strength of Synchrony is our diverse and longstanding partner base. The average length of relationship with Retail Card partners is 19 years, and 12 years with our 10 largest programs in Payment Solutions. Within our CareCredit platform, we offer financing through 200,000 unique provider locations, and over 100 professional and other associations, manufacturers and buying groups endorse and promote our credit products to their members.
Those relationships endure because we consistently deliver value and work closely with those we serve. In fact, more than 1,000 Synchrony team members are co-located with our Retail Card partners. All three platforms benefit from our dedicated analytics professionals who interpret customer and transaction data down to the brand, category, SKU and channel (in-store, online or mobile) level. Our SKU and category level coverage has increased to more than 70% of the transactions on our network.
Synchrony Financial is a data-driven and technology-enabled company. We continue to pioneer and expand our digital capabilities to help our partners make smarter decisions and deliver the experiences their customers desire. We have developed a technology platform that can be rapidly
[REVISED DATA TO COME]
[REVISED DATA TO COME]
SYNCHRONY FINANCIALTOTAL LOAN RECEIVABLES
(+10% CAGR)
Majority of growth is organic.
Targeted marketing programs, digital capabilities and value propositions helped drive organic growth.
$ in billions
2012 2013 2014 2015 2016
7668
6152
57
SYNCHRONY FINANCIALPURCHASE VOLUME
$ in billions
2012 2013 2014 2015 2016
85.993.9
103.1113.6
125.5
(+10% CAGR)

3
5
integrated across retailers and mobile wallets, offering customers more choice. We continue to invest in new digital solutions built on agile design principles, such as Synchrony Plug-In (SyPi). SyPi allows cardholders to view account balance, recent transactions, available credit and rewards, and make payments in a secure environment that promotes loyalty through strong customer engagement. These enhancements helped online and mobile purchase volume grow 26%, far exceeding U.S. growth trends, and our Retail Card consumer online sales penetration reached 25% in the fourth quarter.
Performance Built Upon a Strong CultureOur company is built on a strong vision, strategy and execution, but our culture is also critical to our success. We have an unwavering commitment to diversity and inclusion. Research shows that the most diverse and inclusive workplaces generate better insights and ideas and demonstrate higher revenue growth over time. Most importantly, fostering a culture that is unique to Synchrony is the right thing to do for our partners and our employees.
Our seven diversity networks, in which more than 6,000 of our employees participate, play a vital role in promoting an inclusive culture that celebrates individuality and fosters collaboration. We were proud last year to earn a spot on Fortune’s Best Workplaces for Diversity Top 50 list, and to receive a perfect score of 100% on the Human Rights Campaign Foundation’s Corporate Equality Index for the second year in a row, earning the designation as a 2017 Best Place to work for LGBT Equality.
Our Commitment to Our CommunityOur brand promise — Engage more — is also reflected in how we are committed to our communities and how we address the concerns of those in need. Last year we launched our Families That Work corporate citizenship program, which focuses on providing necessary services, such as housing, childcare and economic security to working families. The time and talent of our employees is an invaluable resource, and volunteerism makes a vital contribution to our corporate citizenship focus. In 2016, Synchrony Financial had over 5,500 of our global employees volunteer more than 20,000 hours, which directly impacted over 200 nonprofit organizations.
Also, we are entering the second year in which Synchrony is a major corporate sponsor of Girls Who Code, a philanthropic organization with a single mission to close the gender gap in technology. We are proud to expand opportunities and exposure for women in the technology arena by hosting two Summer Immersion Programs and supporting local clubs.
We have been pioneers since the start, and our focus is still to leverage that same spirit to build a company that delivers increasing value to our shareholders and all our stakeholders. We have never been more passionate about the pursuit of new opportunities to be an innovative leader in our industry.
Our more than 15,000 employees are the pioneers who help Synchrony Financial finance today’s needs and tomorrow’s dreams for our partners and customers. I thank them for their energy and commitment and thank our partners and shareholders for their continued support.
Sincerely,
Margaret KeanePresident and Chief Executive Officer

6
ExecutiveLeadership Team
Paul WhynottEVP and Chief Regulatory Officer
Steve MinEVP and Chief Credit Officer
Bart SchallerEVP and Chief Marketing Officer
Jonathan MothnerEVP, General Counsel and Secretary
Carol JuelEVP and Chief Information Officer
Henry GreigEVP and Chief Risk Officer
Brian DoublesEVP and Chief Financial Officer
Margaret KeanePresident and Chief Executive Officer
Tom QuindlenEVP and CEO, Retail Card
Dave FasoliEVP and CEO, CareCredit
Kurt GrossheimEVP and Chief Operating Officer
Glenn MarinoEVP and CEO, Payment Solutions and Chief Commercial Officer
Mark MartinelliEVP and Chief Audit Executive
Marc ChiniEVP and Human Resources Leader
Neeraj MehtaEVP, Business Strategy and Development
from left to right

3
7
Board of Directors
William GraylinGlobal Co-General Manager of Samsung Pay, Samsung Electronics America, Inc.
Arthur Coviello, Jr.Former Executive Vice President of EMC Corporation, and Executive Chairman, RSA Security, Inc.
Laurel RichieFormer President of the Women’s National Basketball Association, LLC
Roy GuthrieFormer Executive Vice President and Chief Financial Officer of Discover Financial Services, Inc.
Margaret KeanePresident and Chief Executive Officer of Synchrony Financial
Richard HartnackFormer Vice Chairman and Head, Consumer and Small Business Banking of U.S. Bancorp
Jeffrey NaylorFormer CFO and CAO of the TJX Companies, Inc.
Olympia SnoweChairman and CEO of Olympia Snowe, LLCU.S. Senator from 1995–2013 and Member of U.S. House of Representatives from 1979–1995
Paget AlvesFormer Chief Sales Officer of Sprint Corporation
from left to right

Financial Highlights1
For the years ended December 31, 2016 2015
(in millions unless otherwise stated except for per share data and ratios)
Financial Highlights
Net interest income $ 13,530 $ 12,093
Interest and fees on loans $ 14,682 $ 13,179
Net earnings $ 2,251 $ 2,214
Diluted earnings per share $ 2.71 $ 2.65
Shares outstanding2 831.5 835.5
Period End
Total assets $ 90,207 $ 83,990
Loan receivables 76,337 68,290
Deposits 52,055 43,367
Common equity Tier 1 capital ratio3 17.2% 16.8%
Performance Metrics
Purchase volume (in billions)4 $ 125.5 $ 113.6
Active accounts (in thousands)5 71,890 68,314
Average active accounts (in thousands)5 66,928 62,643
Net interest margin6 16.10% 15.85%
Net charge-off ratio7 4.57% 4.36%
30+ delinquency rate8 4.32% 4.06%
Efficiency ratio9 31.1% 33.5%
Return on assets10 2.7% 2.9%
8
¹ Average balances and related selected metrics are presented based upon the use of daily averages.
2 Diluted weighted average shares outstanding.
3 Calculated under Basel III regulatory standards, subject to transition provisions.
4 Purchase volume, or net credit sales, represents the aggregate amount of charges incurred on credit cards or other credit product accounts less returns during the period. Purchase volume includes activity related to our portfolios classified as held for sale.
5 Active accounts represent credit card or installment loan accounts on which there has been a purchase, payment or outstanding balance in the current month.
6 Net interest margin represents net interest income divided by average interest-earning assets.
7 Net charge-off ratio represents net charge-offs as a percentage of average loan receivables.
8 Based on customer statement-end balances extrapolated to the respective period-end date.
9 Efficiency ratio represents (i) other expense, divided by (ii) net interest income, after retailer share arrangements, plus other income.
10 Return on assets represents net earnings as a percentage of average total assets.

UNITED STATESSECURITIES AND EXCHANGE COMMISSION
Washington, D.C. 20549
FORM 10-K(Mark One)
ANNUAL REPORT PURSUANT TO SECTION 13 OR 15(d) OF THE SECURITIESEXCHANGE ACT OF 1934
For the fiscal year ended December 31, 2016
OR
TRANSITION REPORT PURSUANT TO SECTION 13 OR 15(d) OF THE SECURITIESEXCHANGE ACT OF 1934
For the transition period from to
001-36560(Commission File Number)
SYNCHRONY FINANCIAL(Exact name of registrant as specified in its charter)
Delaware 51-0483352(State or Other Jurisdiction ofIncorporation or Organization)
(I.R.S. EmployerIdentification No.)
777 Long Ridge Road
Stamford, Connecticut 06902(Address of principal executive offices) (Zip Code)
(Registrant’s telephone number, including area code) (203) 585-2400
Securities Registered Pursuant to Section 12(b) of the Act:
Title of each class Name of each exchange on which registered
Common stock, par value $0.001 per share New York Stock Exchange
Securities Registered Pursuant to Section 12(g) of the Act:
Title of class
None
Indicate by check mark if the registrant is a well-known seasoned issuer, as defined in Rule 405 of the Securities Act. Yes No
Indicate by check mark if the registrant is not required to file reports pursuant to Section 13 or Section 15(d) of the Act. Yes No
Indicate by check mark whether the registrant (1) has filed all reports required to be filed by Section 13 or 15(d) of the Securities Exchange Act of 1934 during the preceding 12 months (or for such shorter period that the registrant was required to file such reports), and (2) has been subject to such filing requirements for the past 90 days. Yes No

Indicate by check mark whether the registrant has submitted electronically and posted on its corporate Web site, if any, every Interactive Data File required to be submitted and posted pursuant to Rule 405 of Regulation S-T during the preceding 12 months (or for such shorter period that the registrant was required to submit and post such files). Yes No
Indicate by check mark if disclosure of delinquent filers pursuant to Item 405 of Regulation S-K is not contained herein, and will not be contained, to the best of registrant’s knowledge, in definitive proxy or information statements incorporated by reference in Part III of this Form 10-K or any amendment to this Form 10-K.
Indicate by check mark whether the registrant is a large accelerated filer, an accelerated filer, a non-accelerated filer, or a smaller reporting company. See the definitions of “large accelerated filer,” “accelerated filer” and “smaller reporting company” in Rule 12b-2 of the Exchange Act. (Check one):
Large accelerated filer Accelerated filer
Non-accelerated filer (Do not check if a smaller reporting company) Smaller reporting company
Indicate by check mark whether the registrant is a shell company (as defined in Rule 12b-2 of the Act). Yes No
The aggregate market value of the outstanding common equity of the registrant held by non-affiliates as of the last business day of the registrant’s most recently completed second fiscal quarter was $21,081,515,270.
The number of shares of the registrant’s common stock, par value $0.001 per share, outstanding as of February 16, 2017 was 810,786,641.
DOCUMENTS INCORPORATED BY REFERENCE
The definitive proxy statement relating to the registrant’s Annual Meeting of Stockholders, to be held May 18, 2017, is incorporated by reference into Part III to the extent described therein.

3
Synchrony Financial Table of Contents
Part I Page
Item 1. Business .....................................................................................................................................................
Item 1A. Risk Factors ................................................................................................................................................
Item 1B. Unresolved Staff Comments ........................................................................................................................
Item 2. Properties ....................................................................................................................................................
Item 3. Legal Proceedings .......................................................................................................................................
Item 4. Mine Safety Disclosures ..............................................................................................................................
Part II
Item 5. Market for Registrant's Common Equity, Related Stockholder Matters and Issuer Purchases of Equity Securities ....................................................................................................................................................
Item 6. Selected Financial Data ...............................................................................................................................
Item 7. Management's Discussion and Analysis of Financial Condition and Results of Operations .........................
Item 7A. Quantitative and Qualitative Disclosures About Market Risk ........................................................................
Item 8. Financial Statements and Supplementary Data ...........................................................................................
Item 9. Changes in and Disagreements With Accountants on Accounting and Financial Disclosure ........................
Item 9A. Controls and Procedures .............................................................................................................................
Item 9B. Other Information ........................................................................................................................................
Part III
Item 10. Directors, Executive Officers and Corporate Governance ............................................................................
Item 11. Executive Compensation .............................................................................................................................
Item 12. Security Ownership of Certain Beneficial Owners and Management and Related Stockholder Matters.......
Item 13. Certain Relationships and Related Transactions, and Director Independence .............................................
Item 14. Principal Accounting Fees and Services ......................................................................................................
Part IV
Item 15. Exhibits and Financial Statement Schedules ...............................................................................................
Item 16. Form 10-K Summary ...................................................................................................................................
Signatures
7
39
63
64
65
65
66
69
70
107
109
150
150
151
152
152
152
152
152
153
154
155

4
Certain Defined Terms
Except as the context may otherwise require in this report, references to:
• “we,” “us,” “our” and the “Company” are to SYNCHRONY FINANCIAL and its subsidiaries;
• “Synchrony” are to SYNCHRONY FINANCIAL only;
• “GE” are to General Electric Company and its subsidiaries;
• “GECC” are to General Electric Capital Corporation (a subsidiary of GE) and its subsidiaries;
• the “Bank” are to Synchrony Bank (a subsidiary of Synchrony);
• the “Bank Term Loan” are to the term loan agreement, dated as of July 30, 2014, among Synchrony, as borrower, JPMorgan Chase Bank, N.A., as administrative agent, and the lenders from time to time party thereto, as amended;
• the “Board of Directors” are to Synchrony’s board of directors;
• the “GECC Term Loan” are to the term loan agreement, dated as of July 30, 2014, among Synchrony, as borrower, GECC, as administrative agent, and the other Lenders party thereto, as amended;
• “FICO” score are to a credit score developed by Fair Isaac & Co., which is widely used as a means of evaluating the likelihood that credit users will pay their obligations; and
• “EMV” are to new security technology that utilizes embedded security chips in our credit cards.
We provide a range of credit products through programs we have established with a diverse group of national and regional retailers, local merchants, manufacturers, buying groups, industry associations and healthcare service providers, which, in our business and in this report, we refer to as our “partners.” The terms of the programs all require cooperative efforts between us and our partners of varying natures and degrees to establish and operate the programs. Our use of the term “partners” to refer to these entities is not intended to, and does not, describe our legal relationship with them, imply that a legal partnership or other relationship exists between the parties or create any legal partnership or other relationship. The “average length of our relationship” with respect to a specified group of partners or programs is measured on a weighted average basis by interest and fees on loans for the year ended December 31, 2016 for those partners or for all partners participating in a program, based on the date each partner relationship or program, as applicable, started. Information with respect to partner “locations” in this report is given at December 31, 2016. “Open accounts” represents credit card or installment loan accounts that are not closed, blocked or more than 60 days delinquent.
Unless otherwise indicated, references to “loan receivables” do not include loan receivables held for sale.
For a description of certain other terms we use, including “active account” and “purchase volume,” see the notes to “Item 7. Management’s Discussion and Analysis—Other Financial and Statistical Data.” There is no standard industry definition for many of these terms, and other companies may define them differently than we do.
“Synchrony” and its logos and other trademarks referred to in this report, including, CareCredit®, Quickscreen®, Dual Card™ and eQuickscreen™ belong to us. Solely for convenience, we refer to our trademarks in this report without the ™ and ® symbols, but such references are not intended to indicate that we will not assert, to the fullest extent under applicable law, our rights to our trademarks. Other service marks, trademarks and trade names referred to in this report are the property of their respective owners.
On our website at www.synchronyfinancial.com, we make available under the "Investors-SEC Filings" menu selection, free of charge, our Annual Reports on Form 10-K, Quarterly Reports on Form 10-Q, Current Reports on Form 8-K, and amendments to these reports filed or furnished pursuant to Section 13(a) or 15(d) of the Exchange Act as soon as reasonably practicable after such reports or amendments are electronically filed with, or furnished to, the SEC. Materials that we file or furnish to the SEC may also be read and copied at the SEC's Public Reference Room at 100 F Street, N.E., Washington, DC 20549. Information on the operation of the Public Reference Room may be obtained by calling the SEC at 1-800-SEC-0330. Also, the SEC maintains an Internet site at www.sec.gov that contains reports, proxy and information statements, and other information that we file electronically with the SEC.
Industry and Market Data
This report contains various historical and projected financial information concerning our industry and market. Some of this information is from industry publications and other third-party sources, and other information is from our own

5
data and market research that we commission. All of this information involves a variety of assumptions, limitations and methodologies and is inherently subject to uncertainties, and therefore you are cautioned not to give undue weight to it. Although we believe that those industry publications and other third-party sources are reliable, we have not independently verified the accuracy or completeness of any of the data from those publications or sources. Statements in this report that we are the largest provider of private label credit cards in the United States (based on purchase volume and receivables) are based on issue number 1,087 of “The Nilson Report,” a subscription-based industry newsletter, dated May 2016 (based on 2015 data).
Non-GAAP Measures
We present certain capital ratios for the Company at December 31, 2016 and 2015. These capital ratios include common equity Tier 1 capital ("CET1") as calculated under the U.S. Basel III capital rules on a fully phased-in basis, which is not currently required by our regulators to be disclosed and, as such, is considered to be a non-GAAP measure. We believe these capital ratios are useful measures to investors because they are widely used by analysts and regulators to assess the capital position of financial services companies, although these ratios may not be comparable to similarly titled measures reported by other companies. For a reconciliation of the components of these capital ratios to their nearest comparable GAAP component, see “Item 7. —Management’s Discussion and Analysis of Financial Condition and Results of Operations—Capital.”
Cautionary Note Regarding Forward-Looking Statements:
Various statements in this Annual Report on Form 10-K may contain “forward-looking statements” as defined in Section 27A of the Securities Act of 1933, as amended, and Section 21E of the Securities Exchange Act of 1934, as amended (the “Exchange Act”), which are subject to the “safe harbor” created by those sections. Forward-looking statements may be identified by words such as “expects,” “intends,” “anticipates,” “plans,” “believes,” “seeks,” “targets,” “outlook,” “estimates,” “will,” “should,” “may” or words of similar meaning, but these words are not the exclusive means of identifying forward-looking statements.
Forward-looking statements are based on management’s current expectations and assumptions, and are subject to inherent uncertainties, risks and changes in circumstances that are difficult to predict. As a result, actual results could differ materially from those indicated in these forward-looking statements. Factors that could cause actual results to differ materially include global political, economic, business, competitive, market, regulatory and other factors and risks, such as: the impact of macroeconomic conditions and whether industry trends we have identified develop as anticipated; retaining existing partners and attracting new partners, concentration of our revenue in a small number of Retail Card partners, promotion and support of our products by our partners, and financial performance of our partners; cyber-attacks or other security breaches; higher borrowing costs and adverse financial market conditions impacting our funding and liquidity, and any reduction in our credit ratings; our ability to securitize our loans, occurrence of an early amortization of our securitization facilities, loss of the right to service or subservice our securitized loans, and lower payment rates on our securitized loans; our ability to grow our deposits in the future; changes in market interest rates and the impact of any margin compression; effectiveness of our risk management processes and procedures, reliance on models which may be inaccurate or misinterpreted, our ability to manage our credit risk, the sufficiency of our allowance for loan losses and the accuracy of the assumptions or estimates used in preparing our financial statements; our ability to offset increases in our costs in retailer share arrangements; competition in the consumer finance industry; our concentration in the U.S. consumer credit market; our ability to successfully develop and commercialize new or enhanced products and services; our ability to realize the value of strategic investments; reductions in interchange fees; fraudulent activity; failure of third parties to provide various services that are important to our operations; disruptions in the operations of our computer systems and data centers; international risks and compliance and regulatory risks and costs associated with international operations; alleged infringement of intellectual property rights of others and our ability to protect our intellectual property; litigation and regulatory actions; damage to our reputation; our ability to attract, retain and motivate key officers and employees; tax legislation initiatives or challenges to our tax positions and state sales tax rules and regulations; a material indemnification obligation to GE under the Tax Sharing and Separation Agreement with GE (the "TSSA") if we cause the split-off from GE or certain preliminary transactions to fail to qualify for tax-free treatment or in the case of certain significant transfers of our stock following the split-off; regulation, supervision, examination and enforcement of our business by governmental authorities, the impact of the Dodd-Frank Wall Street Reform and Consumer Protection Act (the “Dodd-Frank Act”) and the impact of the Consumer Financial Protection Bureau’s (the “CFPB”) regulation of our business; impact of capital adequacy rules and liquidity requirements; restrictions that limit our ability to pay dividends and repurchase our common stock, and restrictions that limit the Bank’s ability to pay dividends to us; regulations relating to privacy, information security and data protection; use of third-party vendors and ongoing third-party business relationships; and failure to comply with anti-money laundering and anti-terrorism financing laws.

6
For the reasons described above, we caution you against relying on any forward-looking statements, which should also be read in conjunction with the other cautionary statements that are included in “Item 1A. Risk Factors.” You should not consider any list of such factors to be an exhaustive statement of all of the risks, uncertainties, or potentially inaccurate assumptions that could cause our current expectations or beliefs to change. Further, any forward-looking statement speaks only as of the date on which it is made, and we undertake no obligation to update or revise any forward-looking statement to reflect events or circumstances after the date on which the statement is made or to reflect the occurrence of unanticipated events, except as otherwise may be required by the federal securities laws.

7
PART I.
ITEM 1. BUSINESS
Our Company____________________________________________________________________________________________
We are one of the premier consumer financial services companies in the United States. Our roots in consumer finance trace back to 1932, and today we are the largest provider of private label credit cards in the United States based on purchase volume and receivables. We provide a range of credit products through programs we have established with a diverse group of national and regional retailers, local merchants, manufacturers, buying groups, industry associations and healthcare service providers, which we refer to as our “partners.” Through our partners’ over 365,000 locations across the United States and Canada, and their websites and mobile applications, we offer their customers a variety of credit products to finance the purchase of goods and services. During 2016, we financed $125.5 billion of purchase volume, and at December 31, 2016, we had $76.3 billion of loan receivables and 71.9 million active accounts. Our active accounts represent a geographically diverse group of both consumers and businesses, with an average FICO score of 714 for active accounts at December 31, 2016. For the years ended December 31, 2016 and 2015, we had net earnings of $2.3 billion and $2.2 billion, respectively, representing a return on assets of 2.7% and 2.9%, respectively.
Our business benefits from longstanding and collaborative relationships with our partners, including some of the nation’s leading retailers and manufacturers with well-known consumer brands, such as Lowe’s, Walmart, Amazon and Ashley Furniture HomeStore. We believe our partner-centric business model has been successful because it aligns our interests with those of our partners and provides substantial value to both our partners and our customers. Our partners promote our credit products because they generate increased sales and strengthen customer loyalty. Our customers benefit from instant access to credit, discounts and promotional offers. We seek to differentiate ourselves through deep partner integration and our extensive marketing expertise. We have omni-channel (in-store, online and mobile) technology and marketing capabilities, which allow us to offer and deliver our credit products instantly to customers across multiple channels. For example, the purchase volume from our online and mobile channels increased by 26% for the year ended December 31, 2016.
We conduct our operations through a single business segment. Our revenue activities are managed through three sales platforms: Retail Card, Payment Solutions and CareCredit. Retail Card is a leading provider of private label credit cards, and also provides Dual Cards, general purpose co-branded credit cards, and small- and medium-sized business credit products. Payment Solutions is a leading provider of promotional financing for major consumer purchases, offering primarily private label credit cards and installment loans. CareCredit is a leading provider of promotional financing to consumers for health and personal care procedures, products or services, such as dental, veterinary, cosmetic, vision and audiology.
We offer our credit products primarily through our wholly-owned subsidiary, the Bank. Through the Bank, we offer, directly to retail and commercial customers, a range of deposit products insured by the Federal Deposit Insurance Corporation (“FDIC”), including certificates of deposit, individual retirement accounts (“IRAs”), money market accounts and savings accounts. We also take deposits at the Bank through third-party securities brokerage firms that offer our FDIC-insured deposit products to their customers. We have significantly expanded our online direct banking operations in recent years and our deposit base serves as a source of stable and diversified low cost funding for our credit activities. At December 31, 2016, we had $52.1 billion in deposits, which represented 72% of our total funding sources.

8
Ownership and Regulation of Synchrony____________________________________________________________________________________________
The Company was previously an indirectly wholly-owned subsidiary of General Electric Capital Corporation (“GECC”) until the closing of the initial public offering of our common stock (“IPO”) in 2014, which reduced GECC’s ownership in the Company to approximately 84.6% of our common stock. In November 2015, Synchrony Financial became a stand-alone savings and loan holding company following the completion of GE's exchange offer, in which GE exchanged shares of GE common stock for all the remaining shares of our common stock it owned (the “Separation”).
As a savings and loan holding company, the Company is subject to regulation, supervision and examination by the Federal Reserve Board. In addition, as a large provider of consumer financial services, the Company is subject to regulation, supervision and examination by the CFPB.
The Bank is a federally chartered savings association and therefore is subject to regulation, supervision and examination by the Office of the Comptroller of the Currency of the U.S. Treasury (the “OCC”), which is its primary regulator, and by the CFPB. In addition, the Bank, as an insured depository institution, is supervised by the FDIC.
For a discussion of the regulation of the Company and the Bank, see “—Regulation.”
Our Sales Platforms____________________________________________________________________________________________
We offer our credit products through three sales platforms: Retail Card, Payment Solutions and CareCredit. Set forth below is a summary of certain information relating to our Retail Card, Payment Solutions and CareCredit platforms:
Retail Card
Retail Card is a leading provider of private label credit cards, and also provides Dual Cards, general purpose co-branded credit cards and small- and medium-sized business credit products. Retail Card accounted for $10.9 billion, or 74%, of our total interest and fees on loans for the year ended December 31, 2016. Substantially all of the credit extended in this platform is on standard (i.e., non-promotional) terms.
Retail Card’s revenue consists of interest and fees on our loan receivables. Other income earned by the Retail Card sales platform primarily consists of interchange fees earned when our Dual Card or co-brand cards are used outside of our partners’ sales channels and fees paid to us by customers who purchase our debt cancellation products, less loyalty program payments.

9
Retail Card Partners
We have ongoing Retail Card programs with 26 national and regional retailers, which have approximately 45,000 retail locations and include department stores, specialty retailers, mass merchandisers, e-retailers (multi-channel and online retailers) and oil and gas retailers. The average length of our relationship with our ongoing Retail Card partners is 19 years.
During the year ended December 31, 2016, we added the following new Retail Card partners:
Programs commenced in 2016: Programs expected to commence in 2017:Citgo NissanMarvel At HomeGoogle Store Cathay PacificFareportal
We also extended our program agreements with TJX Companies and Stein Mart during the year ended December 31, 2016. Program agreements accounting for 99% of Retail Card interest and fees on loans for the year ended December 31, 2016 currently have an expiration date in 2019 or beyond. Set forth below is certain information regarding the current scheduled expiration dates of our ongoing 26 Retail Card partner programs:

10
______________________
(1) Percentages stated as a proportion of total Retail Card interest and fees on loans for the year ended December 31, 2016.(2) Existing partners as of December 31, 2016 and also reflects the renewal of the Belk program in January 2017.(3) Excludes certain credit card portfolios that were sold, have not been renewed, or expire in 2017, which represent less than
1% of our total Retail Card interest and fees on loans for the year ended December 31, 2016.
Our five largest programs are with Retail Card partners: Gap, JCPenney, Lowe’s, Sam’s Club and Walmart. These programs accounted in aggregate for 54% of our total interest and fees on loans for the year ended December 31, 2016 and 50% of loan receivables at December 31, 2016. Our programs with JCPenney, Lowe's and Walmart each accounted for more than 10% of our total interest and fees on loans for the year ended December 31, 2016. Sam’s Club is a subsidiary of Walmart that is a separate contracting entity with its own program agreement with us, which we report separately from the Walmart program. For purposes of the information provided in this paragraph with respect to Walmart, the interest and fees on loans from the Sam's Club program have not been included.
The length of our relationship with each of these five Retail Card partners is over 17 years, and in the case of Lowe's, 37 years. All of these program agreements have been renewed in recent years and expire in 2019 or beyond.
Retail Card Program Agreements
Our Retail Card programs are governed by program agreements that are each negotiated separately with our partners. Although the terms of the agreements are partner-specific, and may be amended from time to time, under a typical program agreement our partner agrees to support and promote the program to its customers, but we control credit criteria and issue credit cards to customers who qualify under those criteria. We own the underlying accounts and all loan receivables generated under the program from the time of origination. Other key provisions in the Retail Card program agreements include:
Term
Retail Card program agreements typically have contract terms ranging from approximately five to ten years. Many program agreements have renewal clauses that provide for automatic renewal for one or more years until terminated by us or our partner. We typically seek to renew the program agreements well in advance of their termination dates.

11
Exclusivity
The program agreements typically are exclusive for the products we offer and limit our partners’ ability to originate or promote other private label or co-branded credit cards during the term of the agreement.
Retailer share arrangements
Most of our Retail Card program agreements contain retailer share arrangements that provide for payments to our partner if the economic performance of the program exceeds a contractually-defined threshold. Economic performance for the purposes of these arrangements is typically measured based on agreed upon program revenues (including interest income and certain other income) less agreed upon program expenses (including interest expense, provision for loan losses, retailer payments and operating expenses). We may also provide other economic benefits to our partners such as royalties on purchase volume or payments for new accounts, in some cases instead of retailer share arrangements (for example, on our co-branded credit cards). All of these arrangements align our interests and provide an additional incentive to our partners to promote our credit products.
Other economic terms
In addition to the retailer share arrangements, the program agreements typically provide that the parties will develop a marketing plan to support the program, and they set the terms by which a joint marketing budget is funded, the basic terms of the rewards program linked to the use of our product (such as opportunities to receive double rewards points for purchases made on a Retail Card product), and the allocation of costs related to the rewards program.
Termination
The program agreements set forth the circumstances in which a party may terminate the agreement prior to expiration. Our program agreements generally permit us and our partner to terminate the agreement prior to its scheduled termination date for various reasons, including if the other party materially breaches its obligations. Some program agreements also permit our partner to terminate the program if we fail to meet certain service levels or change certain key cardholder terms or our credit criteria, we fail to achieve certain approval rate targets with respect to approvals of new customers, we elect not to increase the program size when the outstanding loan receivables under the program reach certain thresholds, we are not adequately capitalized, certain force majeure events occur or certain changes in our ownership occur. Certain program agreements are also subject to early termination by a party if the other party has a material adverse change in its financial condition. Historically, these rights have not typically been triggered or exercised. Some of our program agreements provide that, upon termination or expiration, our partner may purchase or designate a third party to purchase the accounts and loan receivables generated with respect to its program at fair market value or a stated price, including all related customer data.
Payment Solutions
Payment Solutions is a leading provider of promotional financing for major consumer purchases, offering private label credit cards and installment loans. Payment Solutions accounted for $2.0 billion, or 13%, of our total interest and fees on loans for the year ended December 31, 2016. Substantially all of the credit extended in Payment Solutions is promotional financing.
Payment Solutions’ revenue primarily consists of interest and fees on our loan receivables, including “merchant discounts,” which are fees paid to us by our partners in almost all cases to compensate us for all or part of the foregone interest income associated with promotional financing. The types of promotional financing we offer include: deferred interest (interest accrues during a promotional period and becomes payable if the full purchase amount is not paid off during the promotional period), no interest (no interest on a promotional purchase) and reduced interest (interest is assessed monthly at a promotional interest rate during the promotional period). As a result, during the promotional period we do not generate interest income or generate it at a lower rate, although we continue to generate fee income relating to late fees on required minimum payments.

12
Payment Solutions Partners
In Payment Solutions, we create customized credit programs for national and regional retailers, local merchants, manufacturers, buying groups, industry associations and our own individually-branded industry programs, which are available to local merchants, participating merchants, dealers and retail outlets to provide financing offers to their customers.
At December 31, 2016, our Payment Solutions partners had approximately 120,000 retail locations. Payment Solutions is diversified by program, with no one Payment Solutions program accounting for more than 1.2% of our total interest and fees on loans for the year ended December 31, 2016. At December 31, 2016, the average length of our relationships with our ten largest Payment Solutions programs was 12 years.
_____________________
(1) Based on interest and fees on loans for the year ended December 31, 2016.
(2) Length of relationship based on Sleepy's, which was subsequently acquired by Mattress Firm.
In Payment Solutions, we generally partner with sellers of “big-ticket” products or services (generally priced from $500 to $25,000) to consumers where our financing products provide strong incremental value to our partners and their customers. We also promote all of our programs to sellers through direct marketing activities such as industry trade publications, trade shows and sales efforts by dedicated internal and external sales teams, leveraging our existing partner network or through endorsements from manufacturers, buying groups and industry associations. Our broad array of point of sale technologies and quick enrollment process allow us to quickly and cost-effectively integrate new partners.
During the year ended December 31, 2016, we launched new programs with Mattress Firm and The Container Store, and also extended our program agreements associated with some of our key partner relationships, including Ashley Furniture HomeStore, hhgregg, La-Z-Boy, Nationwide Marketing Group and Suzuki.

13
Payment Solutions Program Agreements
National and Regional Retailers and Manufacturers
The terms of our program agreements with national and regional retailers and manufacturers are typically similar to the terms of our Retail Card program agreements in that we are the exclusive program provider of financing for the national or regional retailer or manufacturer with respect to the financing products that we offer. Some program agreements, however, allow the merchant to use a second source lender after an application has been submitted to us and declined, or in the case of some of our programs, may allow the manufacturer to have several primary lenders. The term of the program agreements generally run from three to five years and are subject to termination prior to the scheduled termination date by us or our partner for various reasons, including if the other party materially breaches its obligations. Some of these programs also permit our partner to terminate the program if we change certain key cardholder terms, exceed certain pricing thresholds, certain force majeure events occur, certain changes in our ownership occur, or there is a material adverse change in our financial condition. A few of these programs also may be terminated at will by the partner on specified notice to us (e.g., several months). Many of these program agreements have renewal clauses which allow the program agreement to be renewed for successive one or more year terms until terminated by us or our partner. We typically negotiate with program participants to renew the program agreements well in advance of their termination dates.
We control credit criteria and issue credit cards or provide installment loans to customers who qualify under those credit criteria. We own the underlying accounts and all loan receivables generated under the program from the time of origination. Our Payment Solutions program agreements set forth the program’s economic terms, including the merchant discount applicable to each promotional finance offering. We typically do not pay fees to our Payment Solutions partners pursuant to any retailer share arrangements, but in some cases we pay a sign-up fee to a partner or provide volume-based rebates on the merchant discount paid by the partner. In addition to the credit programs, we also process general purpose card transactions for some merchants and dealers under programs with manufacturers as their acquiring bank within most of the credit card network associations, for which we receive an interchange fee.
Buying Groups and Industry Associations
The programs we have established with buying groups and industry associations, such as the Home Furnishings Association, Jewelers of America and MEGA Group USA, are governed by program agreements under which we make our credit products available to their respective members or dealers, but these agreements generally do not require the members or dealers to offer our products to their customers. Under the terms of the program agreements, buying groups and industry associations generally agree to support and promote the respective programs. These arrangements may include sign-up fees and volume-based incentives paid by us to the groups and their members.
Individually-Branded Programs
Our individually-branded programs are focused on specific industries, where we create either company-branded or company and partner-branded private label credit cards that are usable across all participating locations within the industry-specific network. For example, our Synchrony Car Care program, comprised of merchants selling automotive parts, repair services and tires, covers over 27,000 locations across the United States, and cards issued may be dual branded with Synchrony Car Care and partners such as Midas, Michelin Tires or Pep Boys. Under the terms of these programs, we establish merchant discounts applicable to each financing offer, and, in some cases, the fees we charge partners for their membership in the network.
Dealer Agreements
For the programs we have established with manufacturers, buying groups, industry associations and individually-branded programs described above, we enter into individual agreements with the merchants and dealers that offer our credit products under these programs. These agreements generally are not exclusive and some parties who offer our financing products also offer financing from our competitors. Our agreements generally continue until terminated by either party, with termination typically available to either party at will upon 15 days’ written notice. Our dealer agreements set forth the economic terms associated with the program, including the fees charged to dealers to offer promotional financing, and in some cases allow us to periodically change the fees we charge.

14
CareCredit
CareCredit is a leading provider of promotional financing to consumers for health and personal care procedures, products or services. CareCredit accounted for $1.8 billion, or 13%, of our total interest and fees on loans for the year ended December 31, 2016. Substantially all of the credit extended in CareCredit is promotional financing.
We offer customers a CareCredit-branded private label credit card that may be used across our network of CareCredit providers. We generate revenue in CareCredit primarily from interest and fees on our loan receivables and from merchant discounts paid by providers to compensate us for all or part of the foregone interest income associated with promotional financing. We also process general purpose card transactions for some providers as their acquiring bank within most of the credit card network associations, for which we obtain an interchange fee.
CareCredit Partners
The vast majority of our partners are individual and small groups of independent healthcare providers, which includes networks of healthcare practitioners that provide elective and other procedures that generally are not fully covered by insurance. The remainder are primarily national and regional healthcare providers and health-focused retailers, including Rite Aid.
During 2016, over 185,000 locations either processed a CareCredit application or made a sale on a CareCredit credit card. No one CareCredit partner accounted for more than 0.3% of our total interest and fees on loans for the year ended December 31, 2016.
We enter into provider agreements with individual healthcare providers who become part of our CareCredit network. These provider agreements are similar to the dealer agreements that govern our relationships with the merchants and dealers offering our Payment Solutions products in that the agreements are not exclusive and typically may be terminated at will upon 15 days’ notice. Multi-year agreements are in place for larger multi-location relationships across all markets. There are typically no retailer share arrangements with partners in CareCredit.
At December 31, 2016, we had relationships with over 100 professional and other associations (including the American Dental Association and the American Animal Hospital Association), manufacturers and buying groups, which endorse and promote our credit products to their members. Of these relationships, over 60 were paid endorsements linked to member enrollment in, and volume under, the relevant program.
15
We screen potential partners using a variety of criteria, including whether the potential provider specializes in one of our approved specialties, carries the appropriate licensing and certifications, and meets our underwriting criteria. We also screen potential partners for reputational issues. We work with professional and other associations, manufacturers, buying groups, industry associations and healthcare consultants to educate their constituents about the products and services we offer. We believe our ability to attract new partners is aided by our customer satisfaction rate, which our research in 2016 showed is 91%. We also approach individual healthcare service providers through direct mail and advertising, and at trade shows.
During the year ended December 31, 2016, we renewed VCA Animal Hospitals in our network of providers and renewed our CareCredit endorsement relationships with the American Dental Association and American Society of Plastic Surgeons.
Our Customers____________________________________________________________________________________________
Acquiring and Marketing to Retail Card & Payment Solutions Customers
We work directly with our partners using their distribution network, communication channels and customer interactions to market our products to their customers and potential customers. We believe our presence at our partners’ points of sale and our ability to make credit decisions instantly for a customer that is already predisposed to make a purchase enables us to acquire new customer accounts at significantly lower costs than general purpose card issuers, who typically market directly to consumers through mass mailings and advertising.
To acquire new customers, we collaborate with our partners and leverage our marketing expertise to create marketing programs that promote our products to creditworthy customers. Frequently, our partners market the availability of credit as part of (and with little incremental cost to) the advertising for their goods and services. Our marketing programs include marketing offers (e.g., 10% off the customer’s first purchase) and consumer communications that are delivered through a variety of channels, including in-store signage, online advertising, retailer website placement, associate communication, emails, text messages, direct mail campaigns, advertising circulars, and outside marketing via television, radio and print. We also employ our proprietary Quickscreen and eQuickscreen acquisition methods to make targeted pre-approved credit offers at the point-of-sale both in-store and online. Our Quickscreen and eQuickscreen technology allows us to run customer information that we have obtained from our partners through our risk models in advance so that when these customers seek to make payment for goods and services at our partners in-store or online point of sale, we can make a credit offer instantly, if appropriate. Based on our experience, due to the personalized and immediate nature of the offer, Quickscreen and eQuickscreen significantly outperform traditional direct-to-consumer pre-approved channels, such as direct mail or email, in response rate and dollar spending.
Acquiring and Marketing to CareCredit Customers
We market our products through our provider network by training our network providers on the advantages of CareCredit products and by making marketing materials available for providers to use to promote the program and educate customers. Our training helps our providers learn to discuss payment options during the pre-treatment consultation phase, including the option to apply for a CareCredit credit card and the offer of promotional credit. According to a 2016 survey of our CareCredit customers, 47% indicated that they would have postponed or reduced the scope of treatment if financing was not offered by their provider. Consumers can apply for our CareCredit products in the provider’s office and/or online via the web or mobile device.
We also market our products to potential and existing customers directly through our web-based partner locator, which allows customers to search for healthcare service providers that accept the CareCredit credit card by desired geography and provider type. According to our records, our CareCredit partner locator averaged over 850,000 hits per month during the year ended December 31, 2016. We believe our partners recognize the locator as an important source of new customer acquisition.

16
Enterprise Customer Engagement ("ECE") / Analytics
After a customer obtains one of our products, our marketing programs encourage card utilization by continuing to communicate our products’ value propositions (such as, depending on the program, promotional financing offers, cardholder events, product discounts, dollar-off certificates, account holder sales, reward points and offers, new product announcements and previews, and free or reduced cost gift wrapping, alteration or delivery services) through our partners’ and our distribution channels.
Through our ECE and data analytics teams, we track cardholder responsiveness to our marketing programs and use this research to target marketing messages and promotional offers to cardholders based on their individual characteristics, such as length of relationship and spending pattern. For example, if a cardholder responds positively to a coupon sent by text message, we will tailor future marketing messages so that they are delivered by text message. Our ability to target marketing messages and promotions is enhanced for Dual Card and general purpose co-branded credit card programs because we receive, collect and analyze data on in-network and all other spending.
Our extensive marketing activities targeted to existing customers have yielded high levels of re-use across both our Payment Solutions and CareCredit sales platforms. During the year ended December 31, 2016, 27% and 51% of purchase volume across our Payment Solutions platform and CareCredit network, respectively, resulted from repeat use at one or more retailers or providers.
Digital and mobile capabilities
We continue to develop our digital capabilities to help drive an improved mobile and online experience for our customers. Our mobile applications deliver customized features, including rewards, retail offers, and alerts. We also have enhanced the digital capabilities of our online banking experience, which, among other things, allows customers to access their accounts from any device. In 2016, we launched SyPi™, a fully-integrated Synchrony plug-in credit feature for our retailers’ apps, which allows credit card holders to easily shop, redeem rewards, and securely manage and make payments on their accounts via their mobile device. SyPi is also inclusive of our proprietary digital card product, which offers customers an easy way to complete transactions in our retailers’ stores without a physical card. We also launched new digital solutions including Pay My Provider™, a post-care bill payment application for CareCredit, and several new digital credit acquisition platforms including tablet applications for our field sales team and our home improvement partners to take credit applications in-stores and in-home. Additionally, we developed a new dApply application for consumers to apply for credit from any device.
We continue to invest in upgrading our digital customer experience with the launch of a fully redesigned Consumer Center for online account servicing for our Payment Solutions and CareCredit customers, and the continued rollout of our revamped eService for our Retail Card partners. We also continue to expand the use of our credit cards within various mobile wallets, such as Apple Pay and Samsung Pay, in order to further enhance the user experience for our customers.
Loyalty Programs
The retail loyalty programs we manage typically provide cardholders with rewards in the form of merchandise discounts that are earned by achieving a pre-set spending level on their private label credit card, Dual Card or general purpose co-branded credit card. The merchandise discounts can be mailed to the cardholder, accessed digitally, or may be immediately redeemable at the partner’s store. Other programs provide cash back or reward points, which are redeemable for a variety of products or awards. These loyalty programs are designed to generate incremental purchase volume per customer, while reinforcing the value of the card to the customer and strengthening customer loyalty. We continue to provide loyalty programs to customers that utilize non-credit payment types such as cash, debit or check. These multi-tender loyalty programs will allow our partners to market to an expanded customer base, and allow us access to additional prospective cardholders.

17
Commercial Customers
In addition to our efforts to acquire consumer cardholders, we are increasing our focus on small to mid-sized commercial customers. We offer these customers private label credit cards and Dual Cards that can be used primarily at our Retail Card partners and are similar to our consumer offerings. We are also increasing our focus on marketing our commercial pay-in-full accounts receivable product that supports a wide range of business customers.
Our Credit Products____________________________________________________________________________________________
Through our platforms, we offer three principal types of credit products: credit cards, commercial credit products and consumer installment loans. We also offer a debt cancellation product.
The following table sets forth each credit product by type and indicates the percentage of our total loan receivables that are under standard terms only or pursuant to a promotional financing offer at December 31, 2016.
Promotional Offer
Credit ProductStandard
Terms OnlyDeferredInterest
OtherPromotional Total
Credit cards 67.1% 16.5% 12.8% 96.4%
Consumer installment loans — — 1.8 1.8
Commercial credit products 1.7% — — 1.7
Other 0.1 — — 0.1
Total 68.9% 16.5% 14.6% 100.0%
Credit Cards
Our credit card products are loans we extend through open-ended revolving credit card accounts. We offer the following principal types of credit cards:
Private Label Credit Cards
Private label credit cards are partner-branded credit cards (e.g., Lowe’s or Amazon) or program-branded credit cards (e.g., Synchrony Car Care or CareCredit) that are used primarily for the purchase of goods and services from the partner or within the program network. In addition, in some cases, cardholders may be permitted to access their credit card accounts for cash advances.
Credit under a private label credit card typically is extended either on standard terms only in our Retail Card sales platform, which means accounts are assessed periodic interest charges using an agreed non-promotional fixed and/or variable interest rate, or pursuant to a promotional financing offer in our Payment Solutions and CareCredit sales platforms, involving deferred interest, no interest or reduced interest during a set promotional period. Promotional periods typically range between six and 48 months, but we may agree to longer terms with the partner. In almost all cases we receive a merchant discount from our partners to compensate us for all or part of the foregone interest income associated with promotional financing. The terms of these promotions vary by partner, but generally the longer the deferred interest, reduced interest or interest-free period, the greater the partner’s merchant discount. Some offers permit customers to pay for a purchase in equal monthly payments with no interest or at a reduced interest rate, rather than deferring or delaying interest charges. For our deferred interest products, approximately 75% to 80% of customer transactions are typically paid off before interest is assessed. In CareCredit, standard rate financing generally applies to charges under $200.

18
We typically do not charge interchange or other fees to our partners when a customer uses a private label credit card to purchase our partners’ goods and services through our payment system.
Most of our private label credit card business is in the United States. For some of our partners who have locations in Canada, we also support the issuance and acceptance of private label credit cards at their locations in Canada and from customers in Canada.
Dual Cards and General Purpose Co-Brand Cards
Our patented Dual Cards are credit cards that function as private label credit cards when used to make purchases of goods or services from our partners, and as general purpose credit cards when used to make purchases from other retailers wherever cards from those card networks are accepted or for cash advance transactions. We currently issue Dual Cards for use on the MasterCard and Visa networks and we currently have the ability to issue Dual Cards for use on the American Express and Discover networks.
We have been granted two U.S. patents relating to the process by which our Dual Cards function as a private label credit card when used to make purchases from our partners and function as a general purpose credit card when used on the systems of other credit card associations.
We also offer general purpose co-branded credit cards that do not also function as private label credit cards.
Credit extended under our Dual Cards and general purpose co-branded credit cards typically is extended on standard terms only. Currently, only Retail Card offers Dual Cards and general purpose co-branded credit cards. At December 31, 2016, we offered Dual Card or general purpose co-branded credit cards through 18 of our 26 ongoing Retail Card programs, of which the majority are Dual Cards. We expect to continue to increase the number of partner programs that offer Dual Cards or general purpose co-branded credit cards and seek to increase the portion of our loan receivables attributable to these products.
Charges using a Dual Card or general purpose co-branded credit card generate interchange income for us in connection with purchases made by cardholders other than in-store or online from that partner.
We currently do not issue Dual Cards or general purpose co-branded credit cards in Canada.
Terms and Conditions
As a general matter, the financial terms and conditions governing our credit card products vary by program and product type and change over time, although we seek to standardize the non-financial provisions consistently across all products. The terms and conditions of our credit card products are governed by a cardholder agreement and applicable laws and regulations.
We assign each card account a credit limit when the account is initially opened. Thereafter, we may increase or decrease individual credit limits from time to time, at our discretion, based primarily on our evaluation of the customer’s creditworthiness and ability to pay.
For the vast majority of accounts, periodic interest charges are calculated using the daily balance method, which results in daily compounding of periodic interest charges, subject to, at times, a grace period on new purchases. Cash advances are not subject to a grace period, and some credit card programs do not provide a grace period for promotional purchases. In addition to periodic interest charges, we may impose other charges and fees on credit card accounts, including, as applicable and provided in the cardholder agreement, cash advance transaction fees and late fees where a customer has not paid at least the minimum payment due by the required due date.
Typically, each customer with an outstanding debit balance on his or her credit card account must make a minimum payment each month. A customer may pay the total amount due at any time without penalty. We also may enter into arrangements with delinquent customers to extend or otherwise change payment schedules and to waive interest charges and/or fees.

19
Commercial Credit Products
We offer private label cards and Dual Cards for commercial customers that are similar to our consumer offerings. We also offer a commercial pay-in-full accounts receivable product to a wide range of business customers. We offer commercial credit products primarily through our Retail Card platform to the commercial customers of our Retail Card partners.
Installment Loans
In Payment Solutions, we originate installment loans to consumers (and a limited number of commercial customers) in the United States, primarily in the power products market. Installment loans are closed-end credit accounts where the customer pays down the outstanding balance in installments. The terms of our installment loans are governed by customer agreements and applicable laws and regulations.
Installment loans are assessed periodic interest charges using fixed interest rates. In addition to periodic interest charges, we may impose other charges and fees on loan accounts, including late fees where a customer has not made the required payment by the required due date and returned payment fees.
Debt Cancellation Products
We offer a debt cancellation product to our credit card customers online and, on a limited basis, by direct mail. Customers who choose to purchase this product are charged a monthly fee based on their ending balance on each billing statement. In return, the Bank will cancel all or a portion of a customer’s credit card balance in the event of certain qualifying life events.
Direct Banking__________________________________________________________________________________________
Through the Bank, we offer our customers a range of FDIC-insured deposit products. The Bank also takes deposits through third-party securities brokerage firms that offer our FDIC-insured deposit products to their customers. At December 31, 2016, we had $52.1 billion in deposits, $37.9 billion of which were direct deposits (which includes deposits from banks and financial institutions) and $14.2 billion of which were brokered deposits. During 2016, direct deposits were received from approximately 300,000 customers that had a total of over 535,000 accounts. Retail customers accounted for 99% of our direct deposits (by volume) at December 31, 2016. The Bank had a 91% retention rate on certificates of deposit balances up for renewal for the year ended December 31, 2016. FDIC insurance is provided for our deposit products up to applicable limits.
We have significantly expanded our online direct banking operations in recent years and our deposit base serves as a source of stable and diversified low cost funding for our credit activities. Our online platform is highly scalable allowing us to expand without having to rely on a traditional “brick and mortar” branch network. We expect the continued growth in our direct banking platform to come primarily from retail deposits.
We are growing our direct banking operations and believe we are well-positioned to benefit from the consumer-driven shift from branch banking to direct banking. According to the 2016 American Bankers Association survey, the percentage of customers who prefer to do their banking via direct channels (internet, mail, phone and mobile) was 80%, while those who prefer branch banking was only 14%.
Our deposit products include certificates of deposit, IRAs, money market accounts and savings accounts. We market our deposit products through multiple channels including digital and print. Customers can apply for, fund, and service their deposit accounts at our branch in Bridgewater, NJ, online or via phone. We have dedicated banking representatives within our call centers to service deposit accounts.
To attract new deposits and retain existing ones, we intend to introduce new deposit products and enhancements to our existing products. These new and enhanced products may include the introduction of checking accounts, overdraft protection lines of credit, a bill payment and person-to-person payment features, and Synchrony-branded debit cards. Our focus on deposit-taking and related branding efforts will also enable us to offer other branded direct-banking products more efficiently in the future.

20
During 2016, we transitioned the core banking and deposit services provided by Fidelity National Information Services, Inc. to Fiserv, Inc. ("Fiserv"). Fiserv provides our platform for online retail deposits including a customer-facing account opening and servicing platform.
We seek to differentiate our deposit product offerings from our competitors on the basis of brand, reputation, convenience, customer service and value. Our deposit products emphasize reliability, trust, security, convenience and attractive rates. We offer rewards to customers based on their tenure or balance amounts, including reduced fees, travel offers and concierge telephone support.
Credit Risk Management____________________________________________________________________________________________
Credit risk management is a critical component of our management and growth strategy. Credit risk refers to the risk of loss arising from customer default when customers are unable or unwilling to meet their financial obligations to us. Our credit risk arising from credit products is generally highly diversified across over 125 million open accounts at December 31, 2016, without significant individual exposures. We manage credit risk primarily according to customer segments and product types.
Customer Account Acquisition
We have developed programs to promote credit with each of our partners and have developed varying credit decision guidelines for the different partners. We originate credit accounts through several different channels, including in-store, mail, internet, mobile, telephone and pre-approved solicitations. In addition, we have, and may in the future acquire, accounts that were originated by third parties in connection with establishing programs with new partners.
Regardless of the channel, in making the initial credit approval decision to open a credit card or other account or otherwise grant credit, we follow a series of credit risk and underwriting procedures. In most cases, when applications are made in-store or by internet or mobile, the process is fully automated and applicants are notified of our credit decision immediately. We generally obtain certain information provided by the applicant and obtain a credit bureau report from one of the major credit bureaus. The credit report information we obtain is electronically transmitted into industry scoring models and our proprietary scoring models developed to calculate a credit score. The risk management team determines in advance the qualifying credit scores and initial credit line assignments for each portfolio and product type. We periodically analyze performance trends of accounts originated at different score levels as compared to projected performance, and adjust the minimum score or the opening credit limit to manage risk. Different scoring models may be used depending upon bureau type and account source.
We also apply additional application screens based on various inputs, including credit bureau information, to help identify potential fraud and prior bankruptcies before qualifying the application for approval. We compare applicants’ names against the Specially Designated Nationals list maintained by the Office of Foreign Assets Control of the U.S. Department of the Treasury (“OFAC”), as well as screens that account for adherence to USA PATRIOT Act of 2001 (the “Patriot Act”) and Credit Card Accountability Responsibility and Disclosure Act of 2009 (the “CARD Act”) requirements, including ability to pay requirements.
We also use pre-approved account solicitations for certain programs. Potential applicants are pre-screened using information provided by our partner or obtained from outside lists, and qualified individuals receive a pre-approved credit offer by mail or email.

21
Acquired Portfolio Evaluation
Our risk management team evaluates each portfolio that we acquire in connection with establishing programs with new partners to ensure the portfolio satisfies our credit risk guidelines. As part of this review, we receive data on the third-party accounts and loans, which allows us to assess the portfolio on the basis of certain core characteristics, such as historical performance of the assets and distributions of credit and loss information. In addition, we benchmark potential portfolio acquisitions against our existing programs to assess relative current and projected risks. Finally, our risk management team must approve the acquisition, taking into account the results of our risk assessment process. Once assets are migrated to our systems, our account management protocols will apply immediately as described below under “—Customer Account Management,” “—Credit Authorizations of Individual Transactions” and “—Collections.”
Customer Account Management
We regularly assess the credit risk exposure of our customer accounts. This ongoing assessment includes information relating to the customer’s performance with respect to its account with us, as well as information from credit bureaus relating to the customer’s broader credit performance. To monitor and control the quality of our loan portfolio (including the portion of the portfolio originated by third parties), we use behavioral scoring models that we have developed to score each active account on its monthly cycle date. Proprietary risk models, together with the FICO scores obtained on each active account no less than quarterly, are an integral part of our credit decision-making process. Depending on the duration of the customer’s account, risk profile and other performance metrics, the account may be subject to a range of account actions, including limits on transaction authorization and increases or decreases in purchase and cash credit limits.
Credit Authorizations of Individual Transactions
Once an account has been opened, when a credit card is used to make a purchase in-store at one of our partners’ locations or online, point-of-sale terminals or online sites have an online connection with our credit authorization system, which allows for real-time updating of accounts. Each potential sales transaction is passed through a transaction authorization system, which takes into account a variety of behavior and risk factors to determine whether the transaction should be approved or declined, and whether a credit limit adjustment is warranted.
Fraud Investigation
We provide follow up and research with respect to different types of fraud such as fraud rings, new account fraud and transactional fraud. We have developed a proprietary fraud model to identify new account fraud and deployed tools that help identify transaction purchase behavior outside a customer’s established pattern. Our proprietary model is also complemented by externally sourced models and tools used across the industry to better identify fraud and protect our customers. We also are continuously implementing new and improved technologies to detect and prevent fraud such as utilizing embedded security chips ("EMV") for our active Dual Card and general purpose co-branded credit card products with all of our retail partners.
Collections
All monthly billing statements of accounts with past due amounts include a request for payment of these amounts. Collections personnel generally initiate contact with customers within 30 days after any portion of their balance becomes past due. The nature and the timing of the initial contact, typically a personal call, e-mail, text message or letter, are determined by a review of the customer’s prior account activity and payment habits.
We re-evaluate our collection efforts and consider the implementation of other techniques, including internal collection activities, use of external vendors and the sale of debt to third-party buyers, as a customer becomes increasingly delinquent. We limit our exposure to delinquencies through controls within the transaction authorization processes, the imposition of credit limits and criteria-based account suspension and revocation processes. In certain situations, we may enter into arrangements to extend or otherwise change payment schedules, decrease interest rates and/or waive fees to aid customers experiencing financial difficulties in their efforts to become current on their obligations to us.

22
Customer Service____________________________________________________________________________________________
Customer service is an important feature of our relationship with our partners. Our customers can contact us via phone, mail, email, eService and eChat. During the year ended December 31, 2016, we handled approximately 260 million calls.
We assign a dedicated toll-free customer service phone number to each of our Retail Card programs. Our Payment Solutions customers access customer service through one general purpose toll-free customer service phone number (except for a few large Payment Solutions programs, which have dedicated toll-free numbers). Our CareCredit platform has its own, dedicated toll-free customer service phone number. We also have dedicated toll-free customer service phone numbers for our deposit business.
We service all programs through our ten domestic and two off-shore call centers. We also provide phone-based customer service through a third-party vendor. Our off-shore facilities are located in Hyderabad, India and Manila, Philippines. We blend domestic and off-shore locations as an important part of our servicing strategy, to maintain service availability beyond normal work hours in the U.S. and to seek optimal costs. Customer service for cards issued to customers in Canada is supported through agents based in the United States.
Given the nature of our business and the high volume of calls, we maintain several centers of excellence to ensure the quality of our customer service across all of our sites. These centers of excellence consist of quality assurance, customer experience, training, workforce and capacity planning, surveillance and process control, tactical operations center, business solutions and technology support.
Production Services____________________________________________________________________________________________
Our production services organization oversees a number of services, including:
• payment processing (more than 605 million paper and electronic payments in 2016);
• embossing and mailing credit cards (more than 55 million cards in 2016);
• printing and mailing and eService delivery of credit card statements (more than 720 million paper and electronic statements in 2016); and
• other letters mailed or sent electronically (more than 80 million in 2016).
All United States customer payments received by mail are processed at one of two centers located in Atlanta, Georgia and Longwood, Florida, both of which are operated by the Bank. United States credit card statement printing and mailing, card embossing and mailing and letter production and mailing for customers are provided through outsourced services with First Data Corporation (“First Data”). While these services are outsourced, we monitor and maintain oversight of these other services. First Data also produces our statements and other mailings for deposit customers.
Card production embossing, mailing, statement printing and mailing services related to cards issued to customers in Canada are outsourced to Canadian suppliers.

23
Technology and Data Security____________________________________________________________________________________________
Products and Services
We leverage information technology and deliver products and services that meet the needs of our partners and enable us to operate our business efficiently. The integration of our technology with our partners is at the core of our value proposition, enabling, among other things, customers to “apply and buy” at the point of sale, and many of our partners to settle transactions directly with us without an interchange fee. A key part of our strategic focus is the continued development of innovative, efficient, flexible technology and operational platforms to support marketing, risk management, account acquisition and account management, customer service, and new product development. We believe that the continued investment in and development of these platforms is an important part of our efforts to increase our competitive capabilities, reduce costs, improve quality and provide faster, more flexible technology services. Therefore, we continuously review capabilities and develop or acquire systems, processes and competencies to meet our business needs.
As part of our continuous efforts to enhance our technologies, we may either develop these capabilities internally or in partnership with third-party providers. We rely on third-party providers to help us deliver systems and operational infrastructure based on strategies and, in some cases, architecture, designed by us. These relationships include: First Data for our credit card transaction processing and production and Fiserv for retail banking.
Data Security
The protection and security of financial and personal information of our consumers is one of our highest priorities. We have implemented a comprehensive information security program that includes administrative, technical and physical safeguards and provides an appropriate level of protection to maintain the confidentiality, integrity, and availability of our Company's and our customers' information. This includes protecting against any known or evolving threats to the security or integrity of customer records and information, and against unauthorized access to or use of customer records or information.
Our information security program is intelligence-led, focused on continuously adapting to an evolving landscape of emerging threats and available technology. Through data gathering and evaluation of emerging threats from internal and external incidents and technology investment, security controls are adjusted on a continuous basis. We work directly with our partners on an ongoing basis to expand our intelligence ecosystem and facilitate awareness and communications of events outside of the Company.
We have developed a security strategy and implemented multiple layers of controls embedded throughout our technology environment that establish multiple control points between threats and our assets. Our security program is designed to provide oversight of third parties who store, process or have access to sensitive data, and we require the same level of protection from such third-party service providers. We evaluate the effectiveness of the key security controls through ongoing assessment and measurement.
In addition, we identify risks that may threaten customer information and perform a variety of vulnerability and penetration testing on the platforms, systems and applications used to provide our products and services. We employ backup and disaster recovery procedures for all the systems that are used for storing, processing and transferring customer information, and we periodically test and validate our disaster recovery plans. We are compliant with the Payment Card Industry (PCI) program.
In connection with the Separation, we have completed the migration of the majority of the transitional services relating to technology and business processes provided by GE. The exit of these remaining services includes the migration of very limited portions of our technology operating environment. As a stand-alone company, our corporate infrastructure is more focused and simplified, creating greater security and resiliency for our clients, partners and customers.

24
Competition____________________________________________________________________________________________
Our industry is highly competitive and is becoming more competitive. We compete for relationships with partners in connection with retaining existing or establishing new consumer credit programs. Our primary competitors for partners include major financial institutions such as Alliance Data Systems, American Express, Capital One, JPMorgan Chase, Citibank, TD Bank and Wells Fargo, and to a lesser extent, potential partners’ own in-house financing capabilities. We compete for partners on the basis of a number of factors, including program financial and other terms, underwriting standards, marketing expertise, service levels, product and service offerings (including incentive and loyalty programs), technological capabilities and integration, brand and reputation. In addition, some of our competitors for partners have a business model that allows for their partners to manage underwriting (e.g., new account approval), customer service and collections, and other core banking responsibilities that we retain.
We also compete for customer usage of our credit products. Consumer credit provided, and credit card payments made, using our cards constitute only a small percentage of overall consumer credit provided and credit card payments in the United States. Consumers have numerous financing and payment options available to them. As a form of payment, our products compete with cash, checks, debit cards, Visa and MasterCard credit cards, as well as American Express, Discover Card, other private-label card brands, and, to a certain extent, prepaid cards. We also compete with non-traditional providers such as PayPal. In the future, we expect our products may face increased competition from new emerging payment technologies, such as Apple Pay, Chase Pay, Samsung Pay and Square, to the extent that our products are not accepted in, or compatible with, such technologies. We may also face increased competition from current competitors or others who introduce or embrace disruptive technology that significantly changes the consumer credit and payment industry. We compete for customers and their usage of our deposit products, and to minimize transfers to competitors of our customers’ outstanding balances, based on a number of factors, including pricing (interest rates and fees), product offerings, credit limits, incentives (including loyalty programs) and customer service. Some of our competitors provide a broader selection of services, including home and automobile loans, debit cards and bank branch ATM access, which may position them better among customers who prefer to use a single financial institution to meet all of their financial needs. In addition, some of our competitors are substantially larger than we are, may have substantially greater resources than we do or may offer a broader range of products and services than we do. Moreover, some of our competitors, including new and emerging competitors in the digital and mobile payments space, are not subject to the same regulatory requirements or legislative scrutiny to which we are subject, which also could place us at a competitive disadvantage.
In our retail deposits business, we have acquisition and servicing capabilities similar to other direct-banking competitors. We compete for deposits with traditional banks, and in seeking to grow our direct-banking business, we compete with other banks that have direct-banking models similar to ours, such as Ally Financial, American Express, Capital One 360 (ING), Discover, Goldman Sachs, Nationwide, Sallie Mae and United Services Automobile Association (“USAA"). Competition among direct banks is intense because online banking provides customers the ability to quickly and easily deposit and withdraw funds and open and close accounts in favor of products and services offered by competitors.
Intellectual Property____________________________________________________________________________________________
We use a variety of methods, such as trademarks, patents, copyrights and trade secrets, to protect our intellectual property, including our brand, "Synchrony." We also place appropriate restrictions on our proprietary information to control access and prevent unauthorized disclosures. Our brands are important assets, and we take steps to protect the value of these assets and our reputation.

25
Employees____________________________________________________________________________________________
At December 31, 2016, we had over 15,000 full time employees. None of our employees are represented by a labor union or are covered by a collective bargaining agreement. We have not experienced any material employment-related work stoppages and consider relations with our employees to be good. We also have relationships with third-party call center providers in the United States and other countries that provide us with additional contractors for customer service, collections and other functions.
Risk Management____________________________________________________________________________________________
Strong risk management is at the core of our business strategy and we have developed processes to manage the major categories of risk we encounter, namely credit, market, liquidity, operational (including compliance) and strategic risk. The following is a description of our overall risk management function.
As described in greater detail below under “—Risk Management Roles and Responsibilities,” we manage our enterprise risk using an integrated framework that includes board-level oversight, administration by a group of cross-functional management committees, and day-to-day implementation by a dedicated risk management team led by the Chief Risk Officer (“CRO”). We also utilize the "Three Lines of Defense" risk management model to demonstrate and structure the roles, responsibilities and accountabilities in the organization for taking and managing risk. The Risk Committee of our Board of Directors has responsibility for the oversight of our risk management program, and three other board committees have other oversight roles with respect to risk management. Several management committees and subcommittees have important roles and responsibilities in administering our risk management program, including the Enterprise Risk Management Committee (the “ERMC”), the Management Committee (the “MC”), the Asset and Liability Management Committee (the “ALCO”) and the Capital Management Committee (the "CMC"). This committee-focused governance structure provides a forum through which risk expertise is applied cross-functionally to all major decisions, including development of policies, processes and controls used by the CRO and risk management team to execute our risk management philosophy.
Our enterprise risk management philosophy is to ensure that all relevant risks in our business activities are appropriately identified, measured, monitored and controlled. Our approach in executing this philosophy focuses on leveraging our strong credit risk expertise to drive enterprise risk management using a strong governance framework structure, a comprehensive enterprise risk assessment program and an effective risk appetite framework.
Risk Categories
Our risk management is organized around five major risk categories: credit risk, market risk, liquidity risk, operational risk (including compliance), and strategic risk. We evaluate the potential impact of a risk event on us (including subsidiaries) by assessing the partner and customer, financial, reputational, and legal and regulatory impacts.
Credit Risk
Credit risk is the risk of loss that arises when an obligor fails to meet the terms of an obligation. Credit risk includes exposure to consumer credit risk from customer loans as well as institutional credit risk, principally from our partners. Consumer credit risk is one of the most significant risks that we face. See “—Credit Risk Management” for a description of our customer credit risk management procedures.

26
Market Risk
Market risk refers to the risk that a change in the level of one or more market prices, rates, indices, correlations or other market factors will result in losses for a position or portfolio. Our principal market risk exposures arise from volatility in interest rates and their impact on our economic value, capitalization levels and earnings. Market risk is managed by the ALCO, and is subject to policy and risk appetite limits on sensitivity of both earnings at risk and the economic value of equity. Market risk metrics are reviewed by ALCO monthly, the Risk Committee on a quarterly basis and the Board of Directors as required.
Liquidity Risk
Liquidity risk is the risk that an institution’s financial condition or overall safety and soundness are adversely affected by a real or perceived inability to meet contractual obligations and support planned growth. Our primary liquidity objective is to maintain a liquidity profile that will enable us, even in times of stress or market disruption, to fund our existing assets and meet all of our liabilities in a timely manner and at an acceptable cost. Policy and risk appetite limits require us and the Bank (and other entities within our business, as applicable) to ensure that sufficient liquid assets are available to survive liquidity stresses over a specified time period. Our risk appetite policies also call for funding diversification, monitoring early warning indicators in the capital markets, and limits on the amounts of certificates of deposit maturities in any one month. Our ALCO reviews liquidity exposures continuously in the context of approved policy and risk appetite limits and reports results quarterly to the Risk Committee, and our Board of Directors as required.
Operational Risk
Operational risk is the risk of loss arising from inadequate or failed processes, people or systems, external events (i.e. natural disasters) or compliance, reputational or legal matters, and includes any of those risks as they relate directly to us and our subsidiaries, as well as to third parties with whom we contract or otherwise do business. Compliance risk arises from the failure to adhere to applicable laws, rules, regulations and internal policies and procedures. Operational risk also includes model risk relating to various financial and other models used by us and our subsidiaries, including the Bank, and is subject to a formal governance process.
Strategic Risk
Strategic risk consists of the current or prospective risk to earnings and capital arising from changes in the business environment and from adverse business decisions, improper implementation of decisions or lack of responsiveness to changes in the business environment. The Enterprise Risk Management team will conduct a formal strategic risk assessment at least annually, and establish risk mitigation plans for top strategic risks. The New Product Introduction ("NPI") Sub-Committee assesses the strategic viability and consistency of each new product or service. All new initiatives require the approval of the NPI Sub-Committee and a select number of new product requests are escalated to the MC and our Board of Directors, in the case of projects deemed more risky or critical to the mission of the business.

27
Risk Management Roles and Responsibilities
Responsibility for risk management flows to individuals and entities throughout our Company, including our Board of Directors, various board and management committees and senior management. We believe our corporate culture and values in conjunction with the risk management accountability incorporated into our integrated Risk Management Framework, which includes our governance structure and three distinct Lines of Defense, has facilitated, and will continue to facilitate, the evolution of an effective risk presence across the Company.
The “First Line of Defense” is comprised of the business areas whose day-to-day business activities involve decision-making and associated risk-taking for the Company. As the business owner, the first line is responsible for identifying, assessing, managing and controlling that risk, and for mitigating our overall risk exposure. The first line formulates strategy and operates within the risk appetite and framework. The “Second Line of Defense,” which includes the independent risk management organization, provides oversight of first line risk taking and management. The second line assists in determining risk capacity, risk appetite, and the strategies, policies and structure for managing risks. The second line owns the risk framework. The “Third Line of Defense” is comprised of our Internal Audit functions. The third line provides independent and objective assurance to senior management and to the Board of Directors that first and second line risk management and internal control systems and its governance processes are well-designed and working as intended.
Set forth below is a further description of the roles and responsibilities related to the key elements of our risk management framework.
Board of Directors
Our Board of Directors, among other things, has approved the enterprise-wide risk appetite statement and framework for the Company, as well as certain other risk management policies and oversees the Company’s strategic plan and enterprise-wide risk management program. Our Board of Directors may assign certain risk management activities to applicable committees and management.
Board Committees
Our Board of Directors has established four committees that assist the board in its oversight of our risk management. These committees and their risk-related roles are described below.
Audit Committee
In coordination with the Risk Committees of the Company and the Bank, the Audit Committee’s role, among other things, is to review: (i) the Company’s major financial risk exposures and the steps management has taken to monitor and control these risks; (ii) the Company’s risk assessment and risk management practices and the guidelines, policies and processes for risk assessment and risk management; (iii) the organization, performance and audit findings of our internal audit function; (iv) our public disclosures and effectiveness of internal controls; and (v) the Company’s risk guidelines and policies relating to financial statements, financial systems, financial reporting processes, compliance and auditing, and allowance for loan losses.
Nominating and Corporate Governance Committee
The Nominating and Corporate Governance Committee’s role, among other things, is to: (i) review and approve certain transactions with related persons; (ii) review and resolve any conflict of interest involving directors or executive officers; (iii) oversee the risks, if any, related to corporate governance structure and practices; and (iv) identify and discuss with management the risks, if any, related to social responsibility actions and public policy initiatives.
Management Development and Compensation Committee
The Management Development and Compensation Committee’s role, among other things, is to: (i) review our incentive compensation arrangements with a view to appropriately balancing risk and financial results in a manner that does not encourage employees to expose us or any of our subsidiaries to imprudent risks, and are consistent with safety and soundness; and (ii) review (with input from our CRO and the Bank’s CRO) the relationship between risk management policies and practices, corporate strategies and senior executive compensation.

28
Risk Committee
The Risk Committee’s role, among other things, is to: (i) assist our Board of Directors in its oversight of the Company’s enterprise-wide risk-management framework, including as it relates to credit, investment, market, liquidity, operational compliance and strategic risks; (ii) review and, at least annually, approve the Company’s risk governance framework and risk assessment and risk management practices, guidelines and policies (including significant policies that management uses to manage credit and investment, market, liquidity, operational, compliance and strategic risks); (iii) review and, at least annually, recommend to our Board of Directors for approval the Company’s enterprise-wide risk appetite (including the Company’s liquidity risk tolerance), and review and approve the Company’s strategy relating to managing key risks and other policies on the establishment of risk limits as well as the guidelines, policies and processes for monitoring and mitigating such risks; (iv) meet separately on a regular basis with our CRO and (in coordination with the Bank’s Risk Committee, as appropriate) the Bank’s CRO; (v) receive periodic reports from management on metrics used to measure, monitor and manage known and emerging risks, including management’s view on acceptable and appropriate levels of exposure; (vi) receive reports from our internal audit, risk management and independent liquidity review functions on the results of risk management reviews and assessments; (vii) review and approve, at least annually, the Company’s enterprise-wide capital and liquidity framework (including its contingency funding plan) and, in coordination with the Bank’s Risk Committee, review, at least quarterly, the Bank’s, liquidity risk appetite, regulatory capital and ratios and internal capital adequacy assessment processes and, at least annually, the Bank’s allowance for loan losses methodology, annual capital plan and resolution plan; (viii) review, at least semi-annually, information from senior management regarding whether the Company is operating within its established risk appetite; (ix) review the status of financial services regulatory examinations; (x) review the independence, authority and effectiveness of the Company’s risk management function and independent liquidity review function; (xi) approve the appointment of, evaluate and, when appropriate, replace, the CRO; and (xii) review disclosure regarding risk contained in the Company’s annual and quarterly reports.
Management Committees
We have established four management committees with important roles and responsibilities in our risk management function: the MC and the ERMC, the ALCO and the CMC. These committees and their risk-related roles are described below.
Management Committee
The MC is under the oversight of the Board of Directors and is comprised of our senior executives and chaired by our Chief Executive Officer. The MC has responsibility for reviewing and approving lending and investment activities of the Company, such as equity investments, acquisitions, dispositions, joint ventures, portfolio deals and investment issues regarding the Company. It is also responsible for overseeing the Company’s approach to managing its investments, reviewing and approving the Company’s annual strategic plan and annual operating plan, and overseeing activities administered by its Credit, Customer Experience, Culture, Information Technology, New Product Introduction, Investment Review and Pricing subcommittees. The MC also reviews management reports provided on a periodic basis, or as requested, in order to monitor evolving issues, effectiveness of risk mitigation activities and performance against strategic plans. The MC may make decisions only within the authority that is granted to it by the Board of Directors and must escalate any investment or other proposals outside of its authority to the Board of Directors for final decision.
ERMC
The ERMC is a management committee under the oversight of the Risk Committee and is comprised of our senior executives and chaired by the CRO. The ERMC has responsibility for risk oversight across the Company and for reporting on material risks to our Risk Committee. The responsibilities of the ERMC include the day-to-day oversight of risks impacting the Company, establishing a risk appetite statement and ensuring compliance across the Company with the overall risk appetite. The ERMC also oversees establishment of risk management policies, the performance and functioning of the relevant overall risk management function, and the implementation of appropriate governance activities and systems that support control of risks.

29
ALCO
The ALCO is a management committee under the oversight of the Risk Committee and is comprised of our senior executives and chaired by the Treasurer. It identifies, measures, monitors, manages and controls market, liquidity and credit (investments and bank relationships) risks to the Company’s balance sheet. ALCO activities include reviewing and monitoring cash management, investments, liquidity, funding and foreign exchange risk activities and overseeing the safe, sound and efficient operation of the Company in compliance with applicable policies, laws and regulations.
CMC
The CMC is a management committee under the oversight of the Risk Committee and is comprised of our senior executives and chaired by the SVP, Capital, Recovery and Resolution Planning. The CMC provides oversight of the Company’s capital management, stress testing, and recovery and resolution planning activities. The CMC supports the Risk Committee in overseeing capital management activities such as the Annual Capital Plan, the Internal Capital Adequacy Assessment Process, the Dodd-Frank Act Stress Testing, the Pre-Provision Net Revenue and Credit Loss Methodologies, the Contingent Capital Plan as needed in the event of a breach, and the Recovery and Resolution Planning Process.
Chief Executive Officer, Chief Risk Officer and Other Senior Officers
Our Chief Executive Officer (“CEO”) has ultimate responsibility for ensuring the management of the Company’s risk in accordance with the Company’s approved risk appetite statement, including through her role as chairperson of the MC. The CEO also provides leadership in communicating the risk appetite to internal and external stakeholders so as to help embed appropriate risk taking into the overall corporate culture of the Company.
The CRO manages our risk management team and, as chairperson of the ERMC, is responsible for establishing and implementing standards for the identification, management, measurement, monitoring and reporting of risk on an enterprise-wide basis. In collaboration with our CEO and the Chief Financial Officer, the CRO has responsibility for developing an appropriate risk appetite with corresponding limits that aligns with supervisory expectations, and this risk appetite statement has been approved by our Board of Directors. The CRO regularly reports to our Board of Directors and the Risk Committee on risk management matters.
Our senior executive officers, that serve as leaders in the "First Line of Defense," are responsible for ensuring that their respective functions operate within established risk limits, in accordance with the Company’s enterprise risk management policy. As members of the ERMC and the MC, they are also responsible for identifying risks, considering risk when developing strategic plans, budgets and new products and implementing appropriate risk controls when pursuing business strategies and objectives. In addition, senior executive officers are responsible for deploying sufficient financial resources and qualified personnel to manage the risks inherent in the Company’s business activities.
Risk Management and Compliance Team
Our risk management and compliance team, led by the CRO, provides oversight of our risk profile and is responsible for maintaining a compliance program that includes compliance risk assessment, policy development, testing and reporting activities. This team effectively serves in a “Second Line of Defense” role by overseeing the operating activities of the “First Line of Defense.”
Internal Audit Team
The internal audit team is responsible for performing periodic, independent reviews and testing of compliance with the Company’s and the Bank’s risk management policies and standards, as well as with regulatory guidance and industry best practices. The internal audit team also assesses the design of the Company's and the Bank's policies and standards and validates the effectiveness of risk management controls, and reports the results of such reviews to the Audit Committee. The internal audit team effectively serves as the “Third Line of Defense” for the Company.

30
Enterprise Risk Assessment Process
The Enterprise Risk Assessment process (ERA) is a top-down procedure that is designed to identify, assess and quantify risk across the Company’s primary risk categories and serves as a basis to determine the Company’s risk profile. Enterprise risk assessments play an important role in directing our risk management activities by helping us to prioritize our initiatives and to focus our resources on the most appropriate risks. The risk leader for each risk category directs the assessment process, reviewing not only the current type and level of risks, but also compliance with regulatory guidance and industry best practices as well as policy and procedural compliance. Progress against any action plans that have been put into place to manage key risks are tracked and reported to the ERMC. Independent risk management utilizes the results of the ERA to assess the appropriateness of risk responses/actions being taken by management to address identified risks. The ERA is performed annually and refreshed quarterly, and is the basis of the Material Risk Inventory used in the strategic and capital planning processes.
Stress testing efforts are an important part of the risk assessment process and they continue to evolve as we model scenarios exploring multi-risk impacts on profitability, liquidity and capital levels. Stress testing activities provide a forward-looking assessment of risks and losses. We seek to integrate the results of our stress testing into our strategic, capital and liquidity planning processes, and use the results to identify portfolio vulnerabilities and develop risk mitigation strategies or contingency plans across a range of stressed conditions.
Risk Appetite Framework
We operate in accordance with a risk appetite statement setting forth our objectives, plans and limits, and expressing our preferences with respect to risk-taking activities in the context of our overall business goals. The risk appetite statement is approved annually by the ERMC and our Board of Directors, with delegated authority to the CRO for implementation throughout the Company. The risk appetite statement serves as a tool to preclude activities that are inconsistent with our business and risk strategy. The risk appetite statement will be reviewed and approved at least annually as part of our business planning process and will be modified, as necessary, to include updated risk tolerances by risk category, enabling us to meet prescribed goals while continuing to operate within our established risk boundaries.
Regulation____________________________________________________________________________________________
General
Our business, including our relationships with our customers, is subject to regulation, supervision and examination under U.S. federal, state and foreign laws and regulations. These laws and regulations cover all aspects of our business, including lending practices, treatment of our customers, safeguarding deposits, customer privacy and information security, capital structure, liquidity, dividends and other capital distributions, transactions with affiliates, and conduct and qualifications of personnel.
As a savings and loan holding company, Synchrony is subject to regulation, supervision and examination by the Federal Reserve Board. As a large provider of consumer financial services, we are also subject to regulation, supervision and examination by the CFPB.
The Bank is a federally chartered savings association. As such, the Bank is subject to regulation, supervision and examination by the OCC, which is its primary regulator, and by the CFPB. In addition, the Bank, as an insured depository institution, is supervised by the FDIC.
The Dodd-Frank Wall Street Reform and Consumer Protection Act
The Dodd-Frank Act, which was enacted in July 2010, significantly restructured the financial regulatory regime in the United States. As discussed further throughout this section, certain aspects of the Dodd-Frank Act are subject to further rulemaking that are taking effect over several years, making it difficult to anticipate the overall financial impact on us or across the industry. See also “Item 1A. Risk Factors—Risks Relating to Regulation—The Dodd-Frank Act has had, and may continue to have, a significant impact on our business, financial condition and results of operations.”

31
Savings and Loan Holding Company Regulation
Overview
As a savings and loan holding company, we are required to register and file periodic reports with, and are subject to regulation, supervision and examination by, the Federal Reserve Board. The Federal Reserve Board has adopted guidelines establishing safety and soundness standards on such matters as liquidity risk management, securitizations, operational risk management, internal controls and audit systems, business continuity, and compensation and other employee benefits. We are regularly reviewed and examined by the Federal Reserve Board, which results in supervisory comments and directions relating to many aspects of our business that require our response and attention.
The Federal Reserve Board has broad enforcement authority over us and our subsidiaries (other than the Bank and the its subsidiaries). Under the Dodd-Frank Act, we are required to serve as a source of financial strength for any insured depository institution that we control, such as the Bank.
Capital
As a stand-alone savings and loan holding company, Synchrony is subject to capital requirements.
The following are the minimum capital ratios to which Synchrony is subject:
• under the Basel III standardized approach, a common equity Tier 1 capital to risk-weighted assets ratio of 7% (the minimum of 4.5% plus a mandatory conservation buffer of 2.5%, which will be fully phased-in by January 1, 2019), a Tier 1 capital to risk-weighted assets ratio of 8.5% (the minimum of 6% plus a phased-in mandatory conservation buffer of 2.5%), and a total capital to risk-weighted assets ratio of 10.5% (a minimum of 8% plus a phased-in mandatory conservation buffer of 2.5%); and
• a leverage ratio of Tier 1 capital to total consolidated assets of 4%.
For a discussion of our capital ratios, see “Item 7. Management’s Discussion and Analysis of Financial Condition and Results of Operations—Capital.”
As of January 1, 2017, we will also be required to conduct stress tests on an annual basis. Under the Federal Reserve Board’s stress test regulations, we are required to utilize stress-testing methodologies providing for results under various scenarios of economic and financial market stress. Prior to January 1, 2017, we were already complying with the stress test requirement in substantial part and sharing results with the Federal Reserve Board. In addition, although as a savings and loan holding company we currently are not subject to the Federal Reserve Board’s Comprehensive Capital Analysis and Review (“CCAR”) rule, the Federal Reserve Board may in the future require us to comply with the CCAR process or some modified version of the CCAR process. Under this process, the Federal Reserve Board would measure our regulatory capital levels under various stress scenarios. Further, while as a savings and loan holding company we currently are not subject to the Federal Reserve Board’s capital planning rule, we prepare and submit a form of capital plan to the Federal Reserve Board for its review.
Liquidity
As a savings and loan holding company with total consolidated assets in excess of $50 billion, we are required to comply with the modified Liquidity Coverage Ratio Rule (“modified LCR Rule”) approved by the Federal Reserve Board in 2014. The modified LCR Rule requires us to calculate, on a monthly basis, the ratio of the amount of our high quality liquid assets to our expected total net cash outflows over a 30-day stress period (“modified LCR Ratio”), and to maintain a modified LCR Ratio above 1.0. Under a rule adopted by the Federal Reserve Board in December 2016, we will be required to disclose our modified LCR Ratio and other associated liquidity data on a quarterly basis commencing with the fourth quarter of 2018.

32
In addition to the modified LCR Rule, we may in the future be required to comply with rules adopted by the Federal Reserve Board to implement the Basel III Net Stable Funding Ratio (“NSFR”) in the United States, which would require us to maintain a minimum acceptable amount of stable funding based on our liquidity characteristics over a one-year period. In June 2016, the Federal Reserve Board proposed a rule to implement the NSFR in the United States. Under the proposed rule, which would be effective January 1, 2018, we would be subject to a modified NSFR, which would be calibrated at 70 percent of the amount of stable funding that would be required of depository institution holding companies with $250 billion or more in total consolidated assets or $10 billion or more in total on-balance sheet foreign exposure.
Finally, the Federal Reserve Board requires bank holding companies of a similar size to us to comply with certain Enhanced Prudential Standards with respect to liquidity management. Among other things, such bank holding companies must maintain diversified liquidity buffers and must regularly conduct liquidity stress tests. While, as a savings and loan holding company, we are not subject to the same Enhanced Prudential Standards that apply to comparable size bank holding companies, we currently comply with many aspects of the liquidity management requirements in those Enhanced Prudential Standards, including the diversified buffer and stress testing requirements.
Dividends and Stock Repurchases
We are limited in our ability to pay dividends or repurchase our stock by the Federal Reserve Board, including on the basis that doing so would be an unsafe or unsound banking practice. Where we intend to declare or pay a dividend, we generally will be required to inform and consult with the Federal Reserve Board in advance to ensure that such dividend does not raise supervisory concerns. It is the policy of the Federal Reserve Board that a savings and loan holding company like us should generally pay dividends on common stock only out of earnings, and only if prospective earnings retention is consistent with the company’s capital needs and overall current and prospective financial condition.
According to guidance from the Federal Reserve Board, our dividend policies will be assessed against, among other things, our ability to achieve applicable Basel III capital ratio requirements. If we do not achieve applicable Basel III capital ratio requirements, we may not be able to pay dividends. Although we currently expect to meet applicable Basel III capital ratio requirements, inclusive of the capital conservation buffer when it is fully phased in by the Federal Reserve Board, we cannot be sure that we will meet those requirements or that even if we do, if we will be able to pay dividends.
In evaluating the appropriateness of a proposed redemption or repurchase of stock, the Federal Reserve Board will consider, among other things, the potential loss that we may suffer from the prospective need to increase reserves and write down assets as a result of continued asset deterioration, and our ability to raise additional common equity and other capital to replace the stock that will be redeemed or repurchased. The Federal Reserve Board also will consider the potential negative effects on our capital structure of replacing common stock with any lower-tier form of regulatory capital issued. Moreover, the approval process for any capital plan we are required to submit could result in restrictions on our ability to pay dividends or make other capital distributions. See “Item 1A. Risk Factors-Risks Relating to Regulation-Failure by Synchrony and the Bank to meet applicable capital adequacy and liquidity requirements could have a material adverse effect on us” and “—We are subject to restrictions that limit our ability to pay dividends and repurchase our common stock; the Bank is subject to restrictions that limit its ability to pay dividends to us, which could limit our ability to pay dividends, repurchase our common stock or make payments on our indebtedness.”
Activities
In general, savings and loan holding companies may only conduct, or acquire control of companies engaged in, financial activities as permitted under the relevant provisions of the Bank Holding Company Act and the Home Owners' Loan Act ("HOLA"). As a savings and loan holding company, our activities are subject to such limitations.
In addition, we are subject to banking laws and regulations that limit in certain respects the types of acquisitions and investments that we can make. For example, certain acquisitions of and investments in depository institutions or their holding companies that we may undertake are subject to the prior review and approval of our banking regulators, including the Federal Reserve Board, the OCC and the FDIC. Our banking regulators have broad discretion on whether to approve such acquisitions and investments. In deciding whether to approve a proposed
33
acquisition or investment, federal bank regulators may consider, among other factors: (i) the effect of the acquisition or investment on competition, (ii) our financial condition and future prospects, including current and projected capital ratios and levels, (iii) the competence, experience and integrity of our management and its record of compliance with laws and regulations, (iv) the convenience and needs of the communities to be served, including the our record of compliance under the Community Reinvestment Act (the “CRA”), (v) our effectiveness in combating money laundering, and (vi) any risks that the proposed acquisition poses to the U.S. banking or financial system.
Certain acquisitions of our voting stock may be subject to regulatory approval or notice under federal law. Investors are responsible for ensuring that they do not, directly or indirectly, acquire shares of our stock in excess of the amount that can be acquired without regulatory approval under the Change in Bank Control Act and the HOLA, which prohibit any person or company from acquiring control of us without, in most cases, the prior written approval of the Federal Reserve Board.
Savings Association Regulation
Overview
The Bank is required to file periodic reports with the OCC and is subject to regulation, supervision, and examination by the OCC, the FDIC, and the CFPB. The OCC has adopted guidelines establishing safety and soundness standards on such matters as loan underwriting and documentation, asset quality, earnings, internal controls and audit systems, risk management, interest rate risk exposure and compensation and other employee benefits. The Bank is periodically examined by the OCC, the FDIC, and the CFPB, which results in supervisory comments and directions relating to many aspects of the Bank’s business that require the Bank’s response and attention. In addition, the OCC, the FDIC, and the CFPB have broad enforcement authority over the Bank.
Capital
The Bank is required by OCC regulations to maintain specified levels of regulatory capital. Institutions that are not well-capitalized are subject to certain restrictions on brokered deposits and interest rates on deposits. The OCC is authorized and, under certain circumstances, required to take certain actions against an institution that fails to meet the minimum ratios for an adequately capitalized institution. At December 31, 2016, the Bank met or exceeded all applicable requirements to be deemed well-capitalized under OCC regulations.
The following are the minimum capital ratios to which the Bank is subject:
• under the Basel III standardized approach, a common equity Tier 1 capital to risk-weighted assets ratio of 7% (the minimum of 4.5% plus a mandatory conservation buffer of 2.5%, which will be fully phased-in by January 1, 2019), a Tier 1 capital to risk-weighted assets ratio of 8.5% (the minimum of 6% plus a phased-in mandatory conservation buffer of 2.5%), and a total capital to risk-weighted assets ratio of 10.5% (a minimum of 8% plus a phased-in mandatory conservation buffer of 2.5%); and
• a leverage ratio of Tier 1 capital to total consolidated assets of 5%.
For a discussion of the Bank’s capital ratios, see “Item 7. Management’s Discussion and Analysis of Financial Condition and Results of Operations—Capital.”
The Bank is also required to conduct stress tests on an annual basis. Under the OCC’s stress test regulations, the Bank is required to utilize stress-testing methodologies providing for results under various scenarios of economic and financial market stress.

34
As an insured depository institution, the Bank is also subject to the Federal Deposit Insurance Act (the “FDIA”), which requires, among other things, the federal banking agencies to take “prompt corrective action” in respect of depository institutions that do not meet minimum capital requirements. The FDIA sets forth the following five capital tiers: “well-capitalized,” “adequately capitalized,” “undercapitalized,” “significantly undercapitalized” and “critically undercapitalized.” A depository institution’s capital tier will depend upon how its capital levels compare with various relevant capital measures and certain other factors that are established by regulation. To be well-capitalized for purposes of the FDIA, the Bank must maintain a common equity Tier 1 capital to risk-weighted assets ratio of 6.5%, a Tier 1 capital to risk-weighted assets ratio of 8%, a total capital to risk-weighted assets ratio of 10%, and a leverage ratio of Tier 1 capital to total consolidated assets of 5%, and not be subject to any written agreement, order or capital directive, or prompt corrective action directive issued by the OCC to meet or maintain a specific capital level for any capital measure. At December 31, 2016, the Bank met or exceeded all applicable requirements to be deemed well-capitalized for purposes of the FDIA.
In addition, the Bank is required to comply with prudential regulation in connection with liquidity. In particular, under OCC guidelines establishing heightened standards for governance and risk management (the "Heightened Standards"), the Bank is required to establish liquidity stress testing and planning processes, which the Bank has done. For a discussion of the Heightened Standards, see “—Heightened Standards for Risk Management Governance” below.
Dividends and Stock Repurchases
OCC regulations limit the ability of savings associations to make distributions of capital, including payment of dividends, stock redemptions and repurchases, cash-out mergers and other transactions charged to the capital account. The Bank must obtain the OCC’s approval or give the OCC prior notice before making a capital distribution in certain circumstances, including if the Bank proposes to make a capital distribution when it does not meet certain capital requirements (or will not do so as a result of the proposed capital distribution) or certain net income requirements. In addition, the Bank must file a prior written notice of a planned or declared dividend or other distribution with the Federal Reserve Board. The OCC or the Federal Reserve Board may object to a capital distribution if: among other things, (i) the Bank is, or as a result of such distribution would be, undercapitalized, significantly undercapitalized or critically undercapitalized, (ii) the regulators have safety and soundness concerns or (iii) the distribution violates a prohibition in a statute, regulation, agreement between us and the OCC or the Federal Reserve Board, or a condition imposed on us in an application or notice approved by the OCC or the Federal Reserve Board. Additional restrictions on dividends apply if the Bank fails the QTL test (described below under “—Activities”).
The FDIA also prohibits any insured depository institution from making any capital distributions (including payment of a dividend) or paying any management fee to its parent holding company if the depository institution would thereafter be “undercapitalized.” If a depository institution is less than adequately capitalized, it must prepare and submit a capital restoration plan to its primary federal regulator for approval. For a capital restoration plan to be acceptable, among other things, the depository institution’s parent holding company must guarantee that the institution will comply with the capital restoration plan. If a depository institution fails to submit an acceptable capital restoration plan, it is treated as if it is “significantly undercapitalized.” A “significantly undercapitalized” depository institution may be subject to a number of requirements and restrictions, including orders to sell sufficient voting stock to become “adequately capitalized,” elect a new Board of Directors, reduce total assets or cease taking deposits from correspondent banks. A “critically undercapitalized” institution may be subject to the appointment of a conservator or receiver which could sell or liquidate the institution, be required to refrain from making payments on its subordinated debt, or be subject to additional restrictions on its activities.
Activities
Under HOLA, the OCC requires the Bank to comply with the qualified thrift lender, or “QTL” test. Under the QTL test, the Bank is required to maintain at least 65.00% of its “portfolio assets” (total assets less (i) specified liquid assets up to 20.00% of total assets, (ii) intangibles, including goodwill and (iii) the value of property used to conduct business) in certain “qualified thrift investments” (primarily residential mortgages and related investments, including certain mortgage-backed securities, credit card loans, student loans and small business loans) in at least nine months of the most recent 12-month period. The Bank currently meets that test. A savings association that fails to meet the QTL test is subject to certain operating restrictions and may be required to convert to a national bank charter.

35
Savings associations, including the Bank, are subject as well to limitations on their lending and investments. These limitations include percentage of asset limitations on various types of loans the Bank may make. In addition, there are similar limitations on the types and amounts of investments the Bank may make.
Insured depository institutions, including the Bank, are subject to restrictions under Sections 23A and 23B of the Federal Reserve Act (as implemented by Federal Reserve Board Regulation W), which govern transactions between an insured depository institution and an affiliate, including an entity that is the institution’s direct or indirect holding company and a nonbank subsidiary of such a holding company. Restrictions in Sections 23A and 23B of the Federal Reserve Act apply to “covered transactions” such as extensions of credit, issuances of guarantees or asset purchases. In general, these restrictions require that any extensions of credit made by the insured depository institution to an affiliate must be fully secured with qualifying collateral and that the aggregate amount of covered transactions is limited, as to any one affiliate of the Bank, to 10% of the Bank’s capital stock and surplus, and, as to all of the Bank’s affiliates in the aggregate, to 20% of the Bank’s capital stock and surplus. In addition, transactions between the Bank and its affiliates must be on terms and conditions that are, or in good faith would be, offered by the Bank to non-affiliated companies (i.e., at arm’s length).
The CRA is a federal law that generally requires an insured depository institution to identify the communities it serves and to make loans and investments, offer products and provide services, in each case designed to meet the credit needs of these communities. The CRA also requires an institution to maintain comprehensive records of CRA activities to demonstrate how it is meeting the credit needs of communities. These records are subject to periodic examination by the responsible federal banking agency of the institution. Based on these examinations, the agency rates the institution’s compliance with CRA as “Outstanding,” “Satisfactory,” “Needs to Improve” or “Substantial Noncompliance.” The CRA requires the agency to take into account the record of an institution in meeting the credit needs of the entire communities served, including low- and moderate- income neighborhoods, in determining such rating. Failure of an institution to receive at least a “Satisfactory” rating could inhibit the institution or its holding company from undertaking certain activities, including acquisitions. The Bank received a CRA rating of “Outstanding” as of its most recent CRA examination.
The FDIA prohibits insured banks from accepting brokered deposits or offering interest rates on any deposits significantly higher than the prevailing rate in the bank’s normal market area or nationally (depending upon where the deposits are solicited) unless it is “well-capitalized,” or it is “adequately capitalized” and receives a waiver from the FDIC. A bank that is “adequately capitalized” and that accepts brokered deposits under a waiver from the FDIC may not pay an interest rate on any deposit in excess of 75 basis points over certain prevailing market rates. There are no such restrictions under the FDIA on a bank that is “well-capitalized.” Further, “undercapitalized” institutions are subject to growth limitations. At December 31, 2016, the Bank met or exceeded all applicable requirements to be deemed well-capitalized for purposes of the FDIA. An inability to accept brokered deposits in the future could materially adversely impact our funding costs and liquidity.
Deposit Insurance
The FDIA requires the Bank to pay deposit insurance assessments. Deposit insurance assessments are affected by the minimum reserve ratio with respect to the federal Deposit Insurance Fund (the “DIF”). The Dodd-Frank Act increased the minimum reserve ratio with respect to the DIF to 1.35% and removed the statutory cap on the reserve ratio. The FDIC subsequently set a reserve ratio of 2% and may increase that ratio in the future. Under the FDIC’s current deposit insurance assessment methodology, the Bank is required to pay deposit insurance assessments based on its average consolidated total assets, less average tangible equity, and various other regulatory factors included in an FDIC assessment scorecard.
In March 2016, the Board of Directors of the FDIC approved a final rule to increase the DIF reserve ratio to the statutorily required minimum level of 1.35 percent. Under a rule adopted by the FDIC in 2011, regular assessment rates for all banks decrease after the reserve ratio first reaches 1.15 percent. Under the final rule adopted in March 2016, banks with at least $10 billion in assets are subject to a surcharge of 4.5 cents per $100 of the assessment base, after making certain adjustments, also after the reserve ratio reaches 1.15 percent. The FDIC expects the reserve ratio will likely reach 1.35 percent after approximately two years of payments of these surcharges. The decrease in regular assessment rates and the surcharge for banks with $10 billion in assets both became effective beginning the third quarter of 2016, which is the first quarter after the reserve ratio reached 1.15 percent.

36
The FDIA creates a depositor preference regime for the resolution of all insured depository institutions, including the Bank. If any such institution is placed into receivership, the FDIC will pay (out of the remaining net assets of the failed institution and only to the extent of such assets) first secured creditors (to the extent of their security), second the administrative expenses of the receivership, third all deposits liabilities (both insured and uninsured), fourth any other general or senior liabilities, fifth any obligations subordinated to depositors or general creditors, and finally any remaining net assets to shareholders in that capacity.
Resolution and Recovery Planning
The Bank is required annually to submit to the FDIC a plan for the Bank’s resolution in the event of its failure. The plan is designed to enable the FDIC, if appointed receiver for the Bank, to resolve the Bank under sections 11 and 13 of the FDIA in a manner that ensures that its depositors receive access to their insured deposits within one business day of the Bank's failure (two business days if the failure occurs on a day other than Friday), maximizes the net present value return from the sale or disposition of the Bank’s assets, and minimizes the amount of any loss realized by the creditors in the resolution. The resolution plan requirement is intended to ensure that the FDIC has access to all of the material information it needs to resolve the Bank efficiently in the event of its failure.
In September 2016, the OCC issued final guidance that will require the Bank to develop and maintain a recovery plan that identifies triggers and options for responding to a wide range of severe internal and external stress scenarios and for restoring the Bank, to the extent it is experiencing or is likely to experience considerable financial or operational stress, to financial strength and viability in a timely manner. The Bank will be required to have in place its recovery plan under this guidance by July 1, 2018.
Heightened Standards for Risk Management Governance
The OCC’s Heightened Standards establish guidelines for the governance and risk management practices of large OCC-regulated institutions, including the Bank. These Heightened Standards require covered banks to establish and adhere to a written governance framework in order to manage and control their risk-taking activities, provide standards for covered banks’ boards of directors to oversee the risk governance framework, and describe the appropriate risk management roles and responsibilities of front line units, independent risk management, and internal audit functions. The Bank believes it complies with the Heightened Standards.
Consumer Financial Services Regulation
The relationship between us and our U.S. customers is regulated under federal and state consumer protection laws. Federal laws include the Truth in Lending Act, the Equal Credit Opportunity Act, HOLA, the Fair Credit Reporting Act (the “FCRA”), the Gramm-Leach-Bliley Act (the “GLBA”), the CARD Act and the Dodd-Frank Act. These and other federal laws, among other things, require disclosures of the cost of credit, provide substantive consumer rights, prohibit discrimination in credit transactions, regulate the use of credit report information, provide financial privacy protections, require safe and sound banking operations, prohibit unfair, deceptive and abusive practices, restrict our ability to raise interest rates on certain credit card balances, and subject us to substantial regulatory oversight. State and, in some cases, local laws also may regulate the relationship between us and our U.S. customers in these areas, as well as in the areas of collection practices, and may provide other additional consumer protections. Moreover, we are subject to the Servicemembers Civil Relief Act, which protects persons called to active military service and their dependents from undue hardship resulting from their military service. The Servicemembers Civil Relief Act applies to all debts incurred prior to the commencement of active duty (including credit card and other open-end debt) and limits the amount of interest, including service and renewal charges and any other fees or charges (other than bona fide insurance) that is related to the obligation or liability.
Violations of applicable consumer protection laws can result in significant potential liability from litigation brought by customers, including actual damages, restitution and attorneys’ fees. Federal banking regulators, as well as state attorneys general and other state and local consumer protection agencies, also may seek to enforce consumer protection requirements and obtain these and other remedies, including civil money penalties and fines.

37
The CARD Act was enacted in 2009 and most of the requirements became effective in 2010. The CARD Act made numerous amendments to the Truth in Lending Act, requiring us to make significant changes to many of our business practices, including marketing, underwriting, pricing and billing. The CARD Act’s restrictions on our ability to increase interest rates on existing balances to respond to market conditions and credit risk ultimately limits our ability to extend credit to new customers and provide additional credit to current customers. Other CARD Act restrictions, such as limitations on late fees, have resulted and will continue to result in reduced interest income and loan fee income.
The FCRA regulates our use of credit reports and the reporting of information to credit reporting agencies, and also provides a standard for lenders to share information with affiliates and certain third parties and to provide firm offers of credit to consumers. The FCRA also places further restrictions on the use of information shared between affiliates for marketing purposes, requires the provision of disclosures to consumers when risk-based pricing is used in a credit decision, and requires safeguards to help protect consumers from identity theft.
Under HOLA, the Bank is prohibited from engaging in certain tying or reciprocity arrangements with its customers. In general, the Bank may not extend credit, lease or sell property, or furnish any services or fix or vary the consideration for these on the condition that: (i) the customer obtain or provide some additional credit, property, or services from or to the Bank or Synchrony or their subsidiaries or (ii) the customer may not obtain some other credit, property, or services from a competitor, except in each case to the extent reasonable conditions are imposed to assure the soundness of the credit extended. Certain arrangements are permissible. For example, the Bank may offer more favorable terms if a customer obtains two or more traditional bank products.
The Durbin Amendment in the Dodd-Frank Act requires the Federal Reserve Board to promulgate certain rules related to debit transaction interchange fees. The Federal Reserve Board has adopted a final rule that, among other things, establishes a regulatory cap for many types of debit interchange transactions that is no more than 21 cents plus five basis points of the value of the transaction. The Federal Reserve Board’s rule also allows a debit card issuer to recover 1% per transaction for fraud prevention purposes if the issuer complies with certain fraud-related requirements. In addition, the rule prohibits the imposition of restrictions on a merchant’s ability to direct the routing of electronic debit transactions over a network for which the issuer has enabled processing.
The Dodd-Frank Act established the CFPB, which regulates consumer financial products and services and certain financial services providers. The CFPB is authorized to prevent “unfair, deceptive or abusive acts or practices” and ensure consistent enforcement of laws so that all consumers have access to markets for consumer financial products and services that are fair, transparent and competitive. The CFPB has rulemaking and interpretive authority under the Dodd-Frank Act and other federal consumer financial services laws, as well as broad supervisory, examination and enforcement authority over large providers of consumer financial products and services, such as us. In addition, the CFPB has an online complaint system that allows consumers to log complaints with respect to various consumer finance products, including the products we offer. The system could inform future agency decisions with respect to regulatory, enforcement or examination focus. There continues to be uncertainty as to how the CFPB’s strategies and priorities will impact our business and our results of operations going forward. See “Item 1A. Risk Factors—Risks Relating to Regulation—There continues to be uncertainty as to how the Consumer Financial Protection Bureau’s actions will impact our business; the agency’s actions have had and may continue to have an adverse impact on our business.”
In March 2015, the CFPB issued a report scrutinizing pre-dispute arbitration clauses, and in May 2016, the CFPB published a proposed rule that would substantially curtail our ability to enter into voluntary pre-dispute arbitration clauses with consumers. The proposed rule would prevent us from including arbitration clauses in consumer contracts unless the clauses expressly permit class actions to proceed in court and require us to provide copies of consumer arbitration agreements, claims, and decisions to the CFPB for potential publication. If the CFPB’s proposals are adopted, we expect that our exposure to class action litigation could increase significantly. See “Item 1A. Risk Factors—Risks Relating to Our Business—Litigation, regulatory actions and compliance issues could subject us to significant fines, penalties, judgments, remediation costs and/or requirements resulting in increased expenses.”

38
Privacy
We are subject to various privacy, information security and data protection laws, including requirements concerning security breach notification. For example, in the United States, certain of our businesses are subject to the GLBA and implementing regulations and guidance. Among other things, the GLBA: (i) imposes certain limitations on the ability of financial institutions to share consumers’ nonpublic personal information with nonaffiliated third parties, (ii) requires that financial institutions provide certain disclosures to consumers about their information collection, sharing and security practices and affords customers the right to “opt out” of the institution’s disclosure of their personal financial information to nonaffiliated third parties (with certain exceptions) and (iii) requires financial institutions to develop, implement and maintain a written comprehensive information security program containing safeguards that are appropriate to the financial institution’s size and complexity, the nature and scope of the financial institution’s activities, the sensitivity of customer information processed by the financial institution as well as plans for responding to data security breaches. Federal and state laws also require us to respond appropriately to data security breaches. We have a program to comply with applicable privacy, information security, and data protection requirements imposed by federal, state, and foreign laws, including the GLBA. See also “Item 1A. Risk Factors—Risks Relating to Regulation—Regulations relating to privacy, information security and data protection could increase our costs, affect or limit how we collect and use personal information and adversely affect our business opportunities.”
Money Laundering and Terrorist Financing Prevention Program
We maintain an enterprise-wide program designed to enable us to comply with all applicable anti-money laundering and anti-terrorism financing laws and regulations, including the Bank Secrecy Act and the USA PATRIOT Act. This program includes policies, procedures, processes and other internal controls designed to identify, monitor, manage and mitigate the risk of money laundering or terrorist financing posed by our products, services, customers and geographic locale. These controls include procedures and processes to detect and report suspicious transactions, perform customer due diligence, respond to requests from law enforcement, and meet all recordkeeping and reporting requirements related to particular transactions involving currency or monetary instruments. The program is coordinated by a compliance officer, undergoes an annual independent audit to assess its effectiveness, and requires training of employees.
In May 2016, the Financial Crimes Enforcement Network (“FinCEN”) promulgated a final rule under the Bank Secrecy Act that requires the Bank to adopt due diligence procedures to identify and verify a legal entity customer’s beneficial owner(s) at the time a new account is opened and to understand the nature and purpose of the customer relationship. The Bank will be required to comply with the final rule by May 11, 2018, and is currently working on changes to its product and channel strategies, application and servicing processes and systems to ensure compliance. See “Item 1A. Risk Factors—Risks Relating to Regulation—Failure to comply with anti-money laundering and anti-terrorism financing laws could have significant adverse consequences for us.”
Sanctions Programs
We have a program designed to comply with applicable economic and trade sanctions programs, including those administered and enforced by OFAC. These sanctions are usually targeted against foreign countries, terrorists, international narcotics traffickers and those believed to be involved in the proliferation of weapons of mass destruction. These regulations generally require either the blocking of accounts or other property of specified entities or individuals, but they may also require the rejection of certain transactions involving specified entities or individuals. We maintain policies, procedures and other internal controls designed to comply with these sanctions programs.

39
ITEM 1A. RISK FACTORS The following discussion of risk factors contains “forward-looking statements,” as discussed in “Cautionary Note Regarding Forward-Looking Statements.” These risk factors may be important to understanding any statement in this Annual Report on Form 10-K or elsewhere. The following information should be read in conjunction with “Item 7. Management’s Discussion and Analysis of Financial Condition and Results of Operations” (MD&A), and the consolidated and combined financial statements and related notes in “Item 8. Financial Statements and Supplementary Data” of this Form 10-K Report.
Our business routinely encounters and address risks, some of which will cause our future results to be different - sometimes materially different - than we anticipate. Discussion about important operational risks that our business encounters can be found in the business descriptions in “Item 1. Business” and the MD&A section of this Form 10-K Report. Below, we describe certain important strategic, operational, financial, and legal and compliance risks. Our reactions to material future developments as well as our competitors’ reactions to those developments will affect our future results.
Risks Relating to Our Business____________________________________________________________________________________________
Macroeconomic conditions could have a material adverse effect on our business, results of operations and financial condition.
Key macroeconomic conditions historically have affected our business, results of operations and financial condition and are likely to affect them in the future. Consumer confidence, unemployment and housing indicators are among the factors that often impact consumer spending behavior. Poor economic conditions reduce the usage of our credit cards and other financing products and the average purchase amount of transactions on our credit cards and through our other products, which, in each case, reduces our interest and fee income. We rely primarily on interest and fees on our loan receivables to generate our net earnings. Our interest and fees on our loan receivables was $14.7 billion for the year ended December 31, 2016. Poor economic conditions also adversely affect the ability and willingness of customers to pay amounts owed to us, increasing delinquencies, bankruptcies, charge-offs and allowances for loan losses, and decreasing recoveries. For example, our over-30 day delinquency rate as a percentage of period-end loan receivables was 8.25% at December 31, 2009 during the financial crisis, compared to 4.32% at December 31, 2016, and our full-year net charge-off rate was 11.26% for the year ended December 31, 2009, compared to 4.57% for the year ended December 31, 2016. The assessment of our credit profile includes the evaluation of portfolio mix, account maturation, as well as broader consumer trends, such as payment behavior and overall indebtedness. During 2016, these factors contributed to increases in our delinquent accounts and our forecasted net charge-off rate over the next twelve months. We believe the delinquency rate and net charge-off rate in our portfolio will continue to increase modestly from the low credit trends we have experienced in the last two years, and are likely to increase materially if economic conditions deteriorate.
Economic growth in the United States since the recession has been slow and uneven as consumers continue to recover from previously high unemployment rates, lower housing values, concerns about the level of U.S. government debt and fiscal actions that may be taken to address this, as well as economic and political conditions in the U.S. and global markets. A prolonged period of slow economic growth or a significant deterioration in economic conditions would likely affect consumer spending levels and the ability and willingness of customers to pay amounts owed to us, and could have a material adverse effect on our business, results of operations and financial condition.
Macroeconomic conditions may also cause net earnings to fluctuate and diverge from expectations of securities analysts and investors, who may have differing assumptions regarding the impact of these conditions on our business, and this may adversely impact our stock price.

40
Our results of operations and growth depend on our ability to retain existing partners and attract new partners.
Substantially all of our revenue is generated from the credit products we provide to customers of our partners pursuant to program agreements we enter into with our partners. As a result, our results of operations and growth depend on our ability to retain existing partners and attract new partners. Historically, there has been turnover in our partners, and we expect this will continue in the future. For example, during the year ended December 31, 2015, we sold certain credit card portfolios associated with retail partners whose program agreements with us were not extended beyond their contractual expiration dates.
Program agreements with our Retail Card partners and national and regional retailer and manufacturer Payment Solutions partners typically are for multi-year terms. These program agreements generally permit our partner to terminate the agreement prior to its scheduled termination date for various reasons, including, in some cases, if we fail to meet certain service levels or change certain key cardholder terms or our credit criteria, we fail to achieve certain targets with respect to approvals of new customers as a result of the credit criteria we use, we elect not to increase the program size when the outstanding loan receivables under the program reach certain thresholds or we are not adequately capitalized, or certain force majeure events or changes in our ownership occur or a material adverse change in our financial condition occurs. A few Payment Solutions programs with national and regional retailer and manufacturer partners also may be terminated at will by the partner on specified notice to us (e.g., several months). In addition, programs with manufacturers, buying groups and industry associations generally are made available to Payment Solutions partners such as individual retail outlets, dealers and merchants under dealer agreements, which typically may be terminated at will by the partner on short notice to us (e.g., 15 days).
There is significant competition for our existing partners, and our failure to retain our existing larger partner relationships upon the expiration or our earlier loss of a relationship upon the exercise of a partner’s early termination rights, or the expiration or termination of a substantial number of smaller partner relationships, could have a material adverse effect on our results of operations (including growth rates) and financial condition to the extent we do not acquire new partners of similar size and profitability or otherwise grow our business. The competition for new partners is also significant, and our failure to attract new partners could adversely affect our ability to grow.
A significant percentage of our interest and fees on loans comes from relationships with a small number of Retail Card partners, and the loss of any of these Retail Card partners could adversely affect our business and results of operations.
Our five largest programs (Gap, JCPenney, Lowe’s, Sam’s Club and Walmart) accounted in aggregate for 54% of our total interest and fees on loans for the year ended December 31, 2016 and 50% of loan receivables at December 31, 2016. Our programs with JCPenney, Lowe's and Walmart each accounted for more than 10% of our total interest and fees on loans for the year ended December 31, 2016. Sam’s Club is a subsidiary of Walmart that is a separate contracting entity with its own program agreement with us, which we report separately from the Walmart program. We expect to have significant concentration in our largest relationships for the foreseeable future. See "Item 1. Business—Retail Card Partners."
The program agreements generally permit us or our partner to terminate the agreement prior to its scheduled termination date under various circumstances as described in the preceding risk factor. Some of our program agreements also provide that, upon expiration or termination, our partner may purchase or designate a third party to purchase the accounts and loans generated with respect to its program and all related customer data. The loss of any of our largest partners or a material reduction in the interest and fees we receive from their customers could have a material adverse effect on our results of operations and financial condition.

41
Our results depend, to a significant extent, on the active and effective promotion and support of our products by our partners.
Our partners generally accept most major credit cards and various other forms of payment, and therefore our success depends on their active and effective promotion of our products to their customers. We depend on our partners to integrate the use of our credit products into their store culture by training their sales associates about our products, having their sales associates encourage their customers to apply for, and use, our products and otherwise effectively marketing our products. In addition, although our Retail Card programs and our Payment Solutions programs with national and regional retailer partners typically are exclusive with respect to the credit products we offer at that partner, some Payment Solutions programs and most CareCredit provider relationships are not exclusive to us, and therefore a partner may choose to promote a competitor’s financing over ours, depending upon cost, availability or attractiveness to consumers or other factors. Typically, we do not have, or utilize, any recourse against these non-exclusive partners when they do not sufficiently promote our products. Partners may also implement or fail to implement changes in their systems and technologies that may disrupt the integration between their systems and technologies and ours, which could disrupt the use of our products. The failure by our partners to effectively promote and support our products as well as changes they may make in their business models that negatively impact card usage could have a material adverse effect on our business and results of operations. In addition, if our partners engage in improper business practices, do not adhere to the terms of our program agreements or other contractual arrangements or standards, or otherwise diminish the value of our brand, we may suffer reputational damage and customers may be less likely to use our products, which could have a material adverse effect on our business and results of operations.
Our results are impacted, to a significant extent, by the financial performance of our partners.
Our ability to generate new loans and the interest and fees and other income associated with them is dependent upon sales of merchandise and services by our partners. The retail and healthcare industries in which our partners operate are intensely competitive. Our partners compete with retailers and department stores in their own geographic areas, as well as catalog and internet sales businesses. Our partners in the healthcare industry compete with other healthcare providers. Our partners’ sales may decrease or may not increase as we anticipate for various reasons, some of which are in the partners’ control and some of which are not. For example, partner sales may be adversely affected by macroeconomic conditions having a national, regional or more local effect on consumer spending, business conditions affecting a particular partner or industry, or catastrophes affecting broad or more discrete geographic areas. If our partners’ sales decline for any reason, it generally results in lower credit sales, and therefore lower loan volume and associated interest and fees and other income for us from their customers. In addition, if a partner closes some or all of its stores or becomes subject to a voluntary or involuntary bankruptcy proceeding (or if there is a perception that it may become subject to a bankruptcy proceeding), its customers who have used our financing products may have less incentive to pay their outstanding balances to us, which could result in higher charge-off rates than anticipated and our costs for servicing its customers’ accounts may increase. This risk is particularly acute with respect to our largest partners that account for a significant amount of our interest and fees on loans. See “—A significant percentage of our interest and fees on loans comes from relationships with a small number of Retail Card partners, and the loss of any of these Retail Card partners could adversely affect our business and results of operations.” Moreover, if the financial condition of a partner deteriorates significantly or a partner becomes subject to a bankruptcy proceeding, we may not be able to recover for customer returns, customer payments made in partner stores or other amounts due to us from the partner. A decrease in sales by our partners for any reason or a bankruptcy proceeding involving any of them could have a material adverse impact on our business and results of operations.

42
Cyber-attacks or other security breaches could have a material adverse effect on our business.
In the normal course of business, we collect, process and retain sensitive and confidential information regarding our partners and our customers. We also have arrangements in place with our partners and other third parties through which we share and receive information about their customers who are or may become our customers. Although we devote significant resources and management focus to ensuring the integrity of our systems through information security and business continuity programs, our facilities and systems, and those of our partners and third-party service providers, are vulnerable to external or internal security breaches, acts of vandalism, computer viruses, misplaced or lost data, programming or human errors, or other similar events. We and our partners and third-party service providers have experienced all of these events in the past and expect to continue to experience them in the future. These events could interrupt our business or operations, result in significant legal and financial exposure, supervisory liability, damage to our reputation or a loss of confidence in the security of our systems, products and services. Although the impact to date from these events has not had a material adverse effect on us, we cannot be sure this will be the case in the future.
Information security risks for large financial institutions like us have increased recently in part because of new technologies, the use of the internet and telecommunications technologies (including mobile and other connected devices) to conduct financial and other business transactions and the increased sophistication and activities of organized crime, perpetrators of fraud, hackers, terrorists and others. In addition to cyber-attacks or other security breaches involving the theft of sensitive and confidential information, hackers recently have engaged in attacks against large financial institutions that are designed to disrupt key business services, such as consumer-facing web sites. Our successful business performance and marketing efforts may increase our profile and therefore our risk of being targeted for cyber-attacks and other security breaches, including attacks targeting our key business services and websites. We are not able to anticipate or implement effective preventive measures against all security breaches of these types, especially because the techniques used change frequently and because attacks can originate from a wide variety of sources. We employ detection and response mechanisms designed to contain and mitigate security incidents, but early detection may be thwarted by sophisticated attacks and malware designed to avoid detection.
We also face risks related to cyber-attacks and other security breaches in connection with credit card transactions that typically involve the transmission of sensitive information regarding our customers through various third-parties, including our partners, retailers that are not our partners where our Dual Cards and general purpose co-branded credit cards are used, merchant acquiring banks, payment processors, card networks (e.g., Visa and MasterCard) and our processors (e.g., First Data and Fiserv). Some of these parties have in the past been the target of security breaches and cyber-attacks, and because the transactions involve third parties and environments such as the point of sale that we do not control or secure, future security breaches or cyber-attacks affecting any of these third parties could impact us through no fault of our own, and in some cases, we may have exposure and suffer losses for breaches or attacks relating to them. We also rely on numerous other third-party service providers to conduct other aspects of our business operations and face similar risks relating to them. While we regularly conduct security assessments of significant third-party service providers, we cannot be sure that their information security protocols are sufficient to withstand a cyber-attack or other security breach.
The access by unauthorized persons to, or the improper disclosure by us of, confidential information regarding our customers or our own proprietary information, software, methodologies and business secrets could interrupt our business or operations, result in significant legal and financial exposure, supervisory liability, damage to our reputation or a loss of confidence in the security of our systems, products and services, all of which could have a material adverse impact on our business, financial condition and results of operations. In addition, there have been a number of well-publicized attacks or breaches directed at others in our industry that have heightened concern by consumers generally about the security of using credit cards, which have caused some consumers, including our customers, to use our credit cards less in favor of alternative methods of payment and has led to increased regulatory focus on, and potentially new regulations relating to, these matters. Further cyber-attacks or other breaches in the future, whether affecting us or others, could intensify consumer concern and regulatory focus and result in reduced use of our cards and increased costs, all of which could have a material adverse effect on our business.

43
Adverse financial market conditions or our inability to effectively manage our funding and liquidity risk could have a material adverse effect on our funding, liquidity and ability to meet our obligations.
We need to effectively manage our funding and liquidity in order to meet our cash requirements such as day-to-day operating expenses, extensions of credit to our customers, payments of principal and interest on our borrowings and payments on our other obligations. Our primary sources of funding and liquidity are collections from our customers, deposits, funds from securitized financings and proceeds from unsecured borrowings. If we do not have sufficient liquidity, we may not be able to meet our obligations, particularly during a liquidity stress event. If we maintain or are required to maintain too much liquidity, it could be costly and reduce our financial flexibility.
We will need additional financing in the future to refinance any existing debt and finance growth of our business. The availability of additional financing will depend on a variety of factors such as financial market conditions generally, including the availability of credit to the financial services industry, consumers’ willingness to place money on deposit in the Bank, our performance and credit ratings and the performance of our securitized portfolios. Disruptions, uncertainty or volatility in the capital, credit or deposit markets, such as the uncertainty and volatility experienced in the capital and credit markets during the financial crisis and more recently arising from the sovereign debt crisis in Europe and other economic and political conditions in the global markets and concerning the level of U.S. government debt and fiscal measures that may be taken over the longer term to address these matters, may limit our ability to obtain additional financing or refinance maturing liabilities on desired terms (including funding costs) in a timely manner or at all. As a result, we may be forced to delay obtaining funding or be forced to issue or raise funding on undesirable terms, which could significantly reduce our financial flexibility and cause us to contract or not grow our business, all of which could have a material adverse effect on our results of operations and financial conditions.
In addition, at December 31, 2016, we had an aggregate of $6.7 billion of undrawn credit facilities, subject to customary borrowing conditions, from private lenders under our existing securitization programs and an unsecured revolving credit facility. Our ability to draw on such commitments is subject to the satisfaction of certain conditions, including the applicable securitization trust having sufficient collateral to support the draw and the absence of an early amortization event. Moreover, there are regulatory reforms that have recently been proposed or adopted in the United States and internationally that are intended to address certain issues that affected banks in the recent financial crisis. These reforms, generally referred to as “Basel III,” subject banks to more stringent capital, liquidity and leverage requirements. To the extent that the Basel III requirements result in increased costs to the banks providing undrawn committed capacity under our securitization programs, these costs are likely to be passed on to us. In addition, in response to Basel III, some banks in the market (including certain of the private lenders in our securitization programs) have added provisions to their credit agreements permitting them to delay disbursement of funding requests for 30 days or more. If our bank lenders require delayed disbursements of funding and/or higher pricing for committing undrawn capacity to us, our cost of funding and access to liquidity could be adversely affected.
While financial market conditions have generally stabilized and improved since the financial crisis, there can be no assurance that significant disruptions, uncertainties and volatility will not occur in the future. If we are unable to continue to finance our business, access capital markets and attract deposits on favorable terms and in a timely manner, or if we experience an increase in our borrowing costs or otherwise fail to manage our liquidity effectively, our results of operations and financial condition may be materially adversely affected.

44
A reduction in our credit ratings could materially increase the cost of our funding from, and restrict our access to, the capital markets.
Our senior unsecured debt currently is rated BBB- (stable outlook) by Fitch Ratings, Inc. (“Fitch”) and BBB- (stable outlook) by Standard & Poor’s (“S&P”). Although we have not requested that Moody’s Investor Services, Inc. (“Moody’s”) provide a rating for our senior unsecured debt, we believe that if Moody’s were to issue a rating on our unsecured debt, its rating would be lower than the comparable ratings issued by Fitch and S&P. The ratings for our unsecured debt are based on a number of factors, including our financial strength, as well as factors that may not be within our control, such as macroeconomic conditions and the rating agencies’ perception of the industries in which we operate and the products we offer. The ratings of our asset-backed securities are, and will continue to be, based on a number of factors, including the quality of the underlying loans and the credit enhancement structure with respect to each series of asset-backed securities, as well as our credit rating as sponsor and servicer of our publicly registered securitization trust. These ratings also reflect the various methodologies and assumptions used by the rating agencies, which are subject to change and could adversely affect our ratings. The rating agencies regularly evaluate our credit ratings as well as the credit ratings of our asset-backed securities. A downgrade in our unsecured debt or asset-backed securities credit ratings (or investor concerns that a downgrade may occur) could materially increase the cost of our funding from, and restrict our access to, the capital markets.
If the ratings on our asset-backed securities are reduced, put on negative watch or withdrawn, it may have an adverse effect on the liquidity or the market price of our asset-backed securities and on the cost of, or our ability to continue using, securitized financings to the extent anticipated.
Our inability to securitize our loans would have a material adverse effect on our business, liquidity, cost of funds and financial condition.
We use the securitization of loans, which involves the transfer of loans to a trust and the issuance by the trust of asset-backed securities to third-party investors, as a significant source of funding. Our average level of securitized financings from third parties was $12.4 billion and $13.8 billion for the years ended December 31, 2016 and 2015, respectively. For a discussion of our securitization activities, see “Item 7. Management’s Discussion and Analysis of Financial Condition and Results of Operations—Funding, Liquidity and Capital Resources—Funding Sources—Securitized Financings” and Note 5. Variable Interest Entities to our consolidated and combined financial statements.
Although the securitization market for credit cards has been re-established since the financial crisis that began in 2008, there can be no assurance that the market will not experience future disruptions. The extent to which we securitize our loans in the future will depend in part upon the conditions in the securities markets in general and the credit card asset-backed securities market in particular, the overall credit quality of our loans and the conformity of the loans and our securitization program to rating agency requirements, the costs of securitizing our loans, and the legal, regulatory, accounting and tax requirements governing securitization transactions. In the event we are unable to refinance existing asset-backed securities from our publicly registered securitization trust with new securities from the same trust, there are structural and regulatory constraints on our ability to refinance these asset-backed securities with Bank deposits or other funding at the Bank, and therefore we would be required to rely on sources outside of the Bank, which may not be available or may be available only at higher cost. A prolonged inability to securitize our loans on favorable terms, or at all, or to refinance our asset-backed securities would have a material adverse effect on our business, liquidity, cost of funds and financial condition.
The occurrence of an early amortization of our securitization facilities would have a material adverse effect on our liquidity and cost of funds.
Our liquidity would be materially adversely affected by the occurrence of events resulting in the early amortization of our existing securitized financings. During an early amortization period, principal collections from the loans in our asset-backed securitization trusts would be applied to repay principal of the asset-backed securities rather than being available on a revolving basis to fund purchases of newly originated loans. This would negatively impact our liquidity, including our ability to originate new loans under existing accounts, and require us to rely on alternative funding sources, which might increase our funding costs or might not be available when needed.

45
Our loss of the right to service or subservice our securitized loans would have a material adverse effect on our liquidity and cost of funds.
Synchrony currently acts as servicer with respect to our publicly registered securitization trust and its related series of asset-backed securities, and the Bank acts as servicer with respect to our other securitization trust. If Synchrony or the Bank, as applicable, defaults in its servicing obligations, an early amortization event could occur with respect to the relevant asset-backed securities and/or Synchrony or the Bank, as applicable, could be replaced as servicer. Servicer defaults include, for example, the failure of the servicer to make any payment, transfer or deposit in accordance with the securitization documents, a breach of representations, warranties or agreements made by the servicer under the securitization documents, the delegation of the servicer’s duties contrary to the securitization documents and the occurrence of certain insolvency events with respect to the servicer. Such an amortization event would have the adverse consequences discussed in the immediately preceding risk factor.
If either Synchrony or the Bank defaults in its servicing obligations with respect to the applicable securitization trust, a third party could be appointed as servicer of such trust. If a third-party servicer is appointed, there is no assurance that the third party will engage us as sub-servicer, in which event we would no longer be able to control the manner in which the related trust’s assets are serviced, and the failure of a third party to appropriately service such assets could lead to an early amortization event in the affected securitization trust, which would have the adverse consequences discussed in the immediately preceding risk factor.
Lower payment rates on our securitized loans could materially adversely affect our liquidity and financial condition.
Certain collections from our securitized loans come back to us through our subsidiaries, and we use these collections to fund our purchase of newly originated loans to collateralize our securitized financings. If payment rates on our securitized loans are lower than they have historically been, fewer collections will be remitted to us on an ongoing basis. Further, certain series of our asset-backed securities include a requirement that we accumulate principal collections in a restricted account for a specified number of months prior to the applicable security’s maturity date. We are required under the program documents to lengthen this accumulation period to the extent we expect the payment rates to be low enough that the current length of the accumulation period is inadequate to fully fund the restricted account by the applicable security’s maturity date. Lower payment rates, and in particular, payment rates that are low enough that we are required to lengthen our accumulation periods, could materially adversely affect our liquidity and financial condition.
Our inability to grow our deposits in the future could materially adversely affect our liquidity and ability to grow our business.
We obtain deposits directly from retail and commercial customers or through brokerage firms that offer our deposit products to their customers. At December 31, 2016, we had $37.9 billion in direct deposits (which includes deposits from banks and financial institutions) and $14.2 billion in deposits originated through brokerage firms (including network deposit sweeps procured through a program arranger who channels brokerage account deposits to us). A key part of our liquidity plan and funding strategy is to continue to fund our growth through direct deposits.
The deposit business is highly competitive, with intense competition in attracting and retaining deposits. We compete on the basis of the rates we pay on deposits, features and benefits of our products, the quality of our customer service and the competitiveness of our digital banking capabilities. Our ability to originate and maintain retail deposits is also highly dependent on the strength of the Bank and the perceptions of consumers and others of our business practices and our financial health. Adverse perceptions regarding our reputation could lead to difficulties in attracting and retaining deposits accounts. Negative public opinion could result from actual or alleged conduct in a number of areas, including lending practices, regulatory compliance, inadequate protection of customer information or sales and marketing activities, and from actions taken by regulators or others in response to such conduct.

46
The demand for the deposit products we offer may also be reduced due to a variety of factors, such as demographic patterns, changes in customer preferences, reductions in consumers’ disposable income, regulatory actions that decrease customer access to particular products or the availability of competing products. Competition from other financial services firms and others that use deposit funding products may affect deposit renewal rates, costs or availability. Changes we make to the rates offered on our deposit products may affect our profitability and liquidity.
The FDIA prohibits an insured bank from accepting brokered deposits or offering interest rates on any deposits significantly higher than the prevailing rate in the bank’s normal market area or nationally (depending upon where the deposits are solicited), unless it is “well capitalized,” or it is “adequately capitalized” and receives a waiver from the FDIC. A bank that is “adequately capitalized” and accepts brokered deposits under a waiver from the FDIC may not pay an interest rate on any deposit in excess of 75 basis points over certain prevailing market rates. There are no such restrictions under the FDIA on a bank that is “well capitalized” and at December 31, 2016, the Bank met or exceeded all applicable requirements to be deemed “well capitalized” for purposes of the FDIA. However, there can be no assurance that the Bank will continue to meet those requirements. Limitations on the Bank’s ability to accept brokered deposits for any reason (including regulatory limitations on the amount of brokered deposits in total or as a percentage of total assets) in the future could materially adversely impact our funding costs and liquidity. Any limitation on the interest rates the Bank can pay on deposits could competitively disadvantage us in attracting and retaining deposits and have a material adverse effect on our business.
Changes in market interest rates could have a material adverse effect on our net earnings, funding and liquidity.
Changes in market interest rates cause our net interest income to increase or decrease, as certain of our assets and liabilities carry interest rates that fluctuate with market benchmarks. At December 31, 2016, 55.6% of our loan receivables were priced at a fixed interest rate to the customer, with the remaining 44.4% at a floating interest rate. We fund our assets with a combination of fixed rate and floating rate funding sources that include deposits, asset-backed securities and unsecured debt. The interest rate benchmark for our floating rate assets is the prime rate, and the interest rate benchmark for our floating rate liabilities is generally either the London Interbank Offered Rate (“LIBOR”) or the federal funds rate. The prime rate and LIBOR or the federal funds rate could reset at different times or could diverge, leading to mismatches in the interest rates on our floating rate assets and floating rate liabilities. To the extent we are unable to position the balance sheet (naturally or using derivatives) to effectively match the interest rates on our assets and liabilities, our net earnings could be materially adversely affected.
Competitive and regulatory factors may limit our ability to raise interest rates on our loans. In addition, some of our program agreements limit the rate of interest we can charge to customers. If interest rates were to rise materially over a sustained period of time, and we are unable to sufficiently raise our interest rates in a timely manner, or at all, our net interest margin could be adversely impacted, which could have a material adverse effect on our net earnings.
Interest rates may also adversely impact our customers’ spending levels and ability and willingness to pay amounts owed to us. Our floating rate credit products bear interest rates that fluctuate with the prime rate. Higher interest rates often lead to higher payment obligations by customers to us and other lenders under mortgage, credit card and other consumer loans, which may reduce our customers’ ability to remain current on their obligations to us and therefore lead to increased delinquencies, bankruptcies, charge-offs, allowances for loan losses, and decreasing recoveries, all of which could have a material adverse effect on our net earnings.
Changes in interest rates and competitor responses to these changes may also impact customer decisions to maintain deposits with us, and reductions in deposits could materially adversely affect our funding costs and liquidity.
We assess our interest rate risk by estimating the net interest income impact of various interest rate scenarios. We take risk mitigation actions based on those assessments. Changes in interest rates could materially reduce our net interest income and our net earnings, and could also increase our funding costs and reduce our liquidity, especially if actual conditions turn out to be materially different from our assumptions. For a discussion of interest rate risk sensitivities, see “Item 7A. Quantitative and Qualitative Disclosures About Market Risk—Interest Rate Risk.”

47
Our risk management processes and procedures may not be effective in mitigating our risks.
Our risk management processes and procedures seek to appropriately balance risk and return and mitigate risks. We have established processes and procedures intended to identify, measure, monitor and control the types of risk to which we are subject, including credit risk, market risk, liquidity risk, operational risk (including compliance risk) and strategic risk. Credit risk is the risk of loss that arises when an obligor fails to meet the terms of an obligation. We are exposed to both consumer credit risk, from our customer loans, and institutional credit risk, principally from our partners. Market risk refers to the risk that a change in the level of one or more market prices, rates, indices, correlations or other market factors will result in losses for a position or portfolio. Liquidity risk is the risk that financial condition or overall safety and soundness are adversely affected by an inability, or perceived inability, to meet obligations and support business growth. Operational risk is the risk of loss arising from inadequate or failed processes, people or systems, external events (i.e., natural disasters) or compliance, reputational or legal matters and includes those risks as they relate directly to us as well as to third parties with whom we contract or otherwise do business. Strategic risk is the risk from changes in the business environment, improper implementation of decisions or inadequate responsiveness to changes in the business environment. See “Item 1. Business—Credit Risk Management” and “Risk Management” for additional information on the types of risks affecting our business.
We seek to monitor and control our risk exposure through a framework that includes our risk appetite statement, ERA process, risk policies, procedures and controls, reporting requirements, and corporate culture and values in conjunction with the risk management accountability incorporated into our integrated Risk Management Framework, which includes our governance structure and three distinct Lines of Defense. Management of our risks in some cases depends upon the use of analytical and/or forecasting models. If the models that we use to manage these risks are ineffective at predicting future losses or are otherwise inadequate, we may incur unexpected losses or otherwise be adversely affected. In addition, the information we use in managing our credit and other risk may be inaccurate or incomplete as a result of error or fraud, both of which may be difficult to detect and avoid. There may also be risks that exist, or that develop in the future, that we have not appropriately anticipated, identified or mitigated including when processes are changed or new products and services are introduced. If our risk management framework does not effectively identify and control our risks, we could suffer unexpected losses or be adversely affected, and that could have a material adverse effect on our business, results of operations and financial condition.
We rely extensively on models in managing many aspects of our business, and if they are not accurate or are misinterpreted, it could have a material adverse effect on our business and results of operations.
We rely extensively on models in managing many aspects of our business, including liquidity and capital planning (including stress testing), customer selection, credit and other risk management, pricing, reserving and collections management. The models may prove in practice to be less predictive than we expect for a variety of reasons, including as a result of errors in constructing, interpreting or using the models or the use of inaccurate assumptions (including failures to update assumptions appropriately or in a timely manner). Our assumptions may be inaccurate for many reasons including that they often involve matters that are inherently difficult to predict and beyond our control (e.g., macroeconomic conditions and their impact on partner and customer behaviors) and they often involve complex interactions between a number of dependent and independent variables, factors and other assumptions. The errors or inaccuracies in our models may be material, and could lead us to make wrong or sub-optimal decisions in managing our business, and this could have a material adverse effect on our business, results of operations and financial condition.
Our business depends on our ability to successfully manage our credit risk, and failing to do so may result in high charge-off rates.
Our success depends on our ability to manage our credit risk while attracting new customers with profitable usage patterns. We select our customers, manage their accounts and establish terms and credit limits using proprietary scoring models and other analytical techniques that are designed to set terms and credit limits to appropriately compensate us for the credit risk we accept, while encouraging customers to use their available credit. The models and approaches we use to manage our credit risk may not accurately predict future charge-offs for various reasons discussed in the preceding risk factor.

48
Our ability to manage credit risk and avoid high charge-off rates also may be adversely affected by economic conditions that may be difficult to predict, such as the recent financial crisis. The assessment of our credit profile includes the evaluation of portfolio mix, account maturation, as well as broader consumer trends, such as payment behavior and overall indebtedness. During 2016, these factors have contributed to an increase in our delinquent accounts and our forecasted net charge-off rate over the next twelve months. We believe the delinquency rate and net charge-off rate in our portfolio will continue to increase modestly from the low credit trends we have experienced in the last two years, and are likely to increase materially if economic conditions deteriorate. In addition, we remain subject to conditions in the consumer credit environment. There can be no assurance that our credit underwriting and risk management strategies will enable us to avoid high charge-off levels or delinquencies, or that our allowance for loan losses will be sufficient to cover actual losses.
A customer’s ability to repay us can be negatively impacted by increases in their payment obligations to other lenders under mortgage, credit card and other loans (including student loans). These changes can result from increases in base lending rates or structured increases in payment obligations, and could reduce the ability of our customers to meet their payment obligations to other lenders and to us. In addition, a customer’s ability to repay us can be negatively impacted by the restricted availability of credit to consumers generally, including reduced and closed lines of credit. Customers with insufficient cash flow to fund daily living expenses and lack of access to other sources of credit may be more likely to increase their card usage and ultimately default on their payment obligations to us, resulting in higher credit losses in our portfolio. Our collection operations may not compete effectively to secure more of customers’ diminished cash flow than our competitors. We may not identify customers who are likely to default on their payment obligations to us and reduce our exposure by closing credit lines and restricting authorizations quickly enough, which could have a material adverse effect on our business, results of operations and financial condition. In addition, our collection strategy depends in part on the sale of debt to third-party buyers. Regulatory or other factors may adversely affect the pricing of our debt sales or the performance of our third-party buyers, which may result in higher credit losses in our portfolio. At December 31, 2016, 27.0% of our portfolio’s loan receivables were from customers with a FICO score of 660 or less (excluding unrated accounts), who typically have higher delinquency and credits losses than consumers with higher FICO scores.
Our ability to manage credit risk also may be adversely affected by legal or regulatory changes (such as bankruptcy laws and minimum payment regulations) and collection regulations, competitors’ actions and consumer behavior, as well as inadequate collections staffing, techniques, models and performance of vendors such as collection agencies.
Our allowance for loan losses may prove to be insufficient to cover losses on our loans.
We maintain an allowance for loan losses (a reserve established through a provision for losses charged to expense) that we believe is appropriate to provide for incurred losses in our loan portfolio. In addition, for portfolios we may acquire when we enter into new partner program agreements, any deterioration in the performance of the purchased portfolios after acquisition results in incremental loss reserves. Growth in our loan portfolio generally would lead to an increase in the allowance for loan losses.
The process for establishing an allowance for loan losses is critical to our results of operations and financial condition, and requires complex models and judgments, including forecasts of economic conditions. Changes in economic conditions affecting borrowers, new information regarding our loans and other factors, both within and outside of our control, may require an increase in the allowance for loan losses. We may underestimate our incurred losses and fail to maintain an allowance for loan losses sufficient to account for these losses. In cases where we modify a loan, if the modified loans do not perform as anticipated, we may be required to establish additional allowances on these loans.

49
We periodically review and update our methodology, models and the underlying assumptions, estimates and assessments we use to establish our allowance for loan losses to reflect our view of current conditions. Moreover, our regulators, as part of their supervisory function, periodically review the methodology, models and the underlying assumptions, estimates and assessments we use for calculating, and the adequacy of, our allowance for loan losses. Our regulators, based on their judgment, may conclude that we should modify our methodology, models or the underlying assumptions, estimates and assessments, increase our allowance for loan losses and/or recognize further losses. We continue to review and evaluate our methodology, models and the underlying assumptions, estimates and assessments we use and we will implement further enhancements or changes to them, as needed. We cannot assure you that our loan loss reserves will be sufficient to cover actual losses. Future increases in the allowance for loan losses or recognized losses (as a result of any review, update, regulatory guidance or otherwise) will result in a decrease in net earnings and capital and could have a material adverse effect on our business, results of operations and financial condition.
If assumptions or estimates we use in preparing our financial statements are incorrect or are required to change, our reported results of operations and financial condition may be adversely affected.
We are required to make various assumptions and estimates in preparing our financial statements under GAAP, including for purposes of determining allowances for loan losses, asset impairment, reserves related to litigation and other legal matters, valuation of income and other taxes and regulatory exposures and the amounts recorded for certain contractual payments to be paid to or received from partners and others under contractual arrangements. In addition, significant assumptions and estimates are involved in determining certain disclosures required under GAAP, including those involving the fair value of our financial instruments. If the assumptions or estimates underlying our financial statements are incorrect, the actual amounts realized on transactions and balances subject to those estimates will be different, and this could have a material adverse effect on our results of operations and financial condition.
In addition, the Financial Accounting Standards Board (“FASB”) is currently reviewing or proposing changes to several financial accounting and reporting standards that govern key aspects of our financial statements and other areas where assumptions or estimates are required, and has recently issued ASU 2016-13, the standard on accounting for credit losses. As a result of changes to financial accounting or reporting standards, whether promulgated or required by the FASB or other regulators, we could be required to change certain of the assumptions or estimates we previously used in preparing our financial statements, which could materially impact how we record and report our results of operations and financial condition generally. For additional information on the key areas for which assumptions and estimates are used in preparing our financial statements, see “Item 7. Management’s Discussion and Analysis of Financial Condition and Results of Operations—Critical Accounting Estimates” and Note 2. Basis of Presentation and Summary of Significant Accounting Policies to our consolidated and combined financial statements.
We may not be able to offset increases in our costs with decreased payments under our retailer share arrangements, which could reduce our profitability.
Most of our Retail Card program agreements and certain other program agreements contain retailer share arrangements that provide for payments to our partners if the economic performance of the relevant program exceeds a contractually defined threshold. Although the share arrangements vary by partner, these arrangements are generally structured to measure the economic performance of the program, based typically on agreed upon program revenues (including interest income and certain other income) less agreed upon program expenses (including interest expense, provision for loan losses, retailer payments and operating expenses), and share portions of this amount above a negotiated threshold. These arrangements are typically designed to permit us to achieve an economic return before we are required to make payments to our partners based on the agreed contractually defined threshold. However, because the threshold and the economic performance of a program that are used to calculate payments to our partners may be based on, among other things, agreed upon measures of program expenses rather than our actual expenses, we may not be able to pass on increases in our actual expenses (such as funding costs or operating expenses) in the form of reduced payments under our retailer share arrangements, and our economic return on a program could be adversely affected. While most of our agreements contain retailer share arrangements, in some cases, where we instead provide other economic benefits to our partners such as royalties on purchase volume or payments for new accounts (for example, on our co-branded credit cards), our ability to offset increases in our costs is limited.

50
Competition in the consumer finance industry is intense.
The success of our business depends on our ability to retain existing partners and attract new partners. The competition for partners is intense and becoming more competitive. Our primary competitors for partners include major financial institutions, such as Alliance Data Systems, American Express, Capital One, JPMorgan Chase, Citibank, TD Bank and Wells Fargo, and to a lesser extent, potential partners’ own in-house financing capabilities. Some of our competitors are substantially larger, have substantially greater resources and may offer a broader range of products and services. We compete for partners on the basis of a number of factors, including program financial and other terms, underwriting standards, marketing expertise, service levels, product and service offerings (including incentive and loyalty programs), technological capabilities and integration, brand and reputation. In addition, some of our competitors for partners have a business model that allows for their partners to manage underwriting (e.g., new account approval), customer service and collections, and other core banking responsibilities that we retain but some partners may prefer to handle. As a result of competition, we may be unable to acquire new partners, lose existing relationships to competing companies or find it more costly to maintain our existing relationships.
Our success also depends on our ability to attract and retain customers and generate usage of our products by them. The consumer credit and payments industry is highly competitive and we face an increasingly dynamic industry as emerging technologies enter the marketplace. As a form of payment, our products compete with cash, checks, debit cards, general purpose credit cards (including Visa and MasterCard, American Express and Discover Card), other private label card brands and, to a certain extent, prepaid cards. We also compete with non-traditional providers such as PayPal. In the future, we expect our products may face increased competition from new emerging payment technologies, such as Apple Pay, Android Pay, Chase Pay, Samsung Pay and Square, to the extent that our products are not accepted in, or compatible with, such technologies. We may also face increased competition from current competitors or others who introduce or embrace disruptive technology that significantly changes the consumer credit and payment industry. We compete for customers and their usage of our products, and to minimize transfers to competitors of our customers’ outstanding balances, based on a number of factors, including pricing (interest rates and fees), product offerings, credit limits, incentives (including loyalty programs) and customer service. Although we offer a variety of consumer credit products, some of our competitors provide a broader selection of services, including home and automobile loans, debit cards and bank branch ATM access, which may position them better among customers who prefer to use a single financial institution to meet all of their financial needs. Some of our competitors are substantially larger than we are, which may give those competitors advantages, including a more diversified product and customer base, the ability to reach out to more customers and potential customers, operational efficiencies, more versatile technology platforms, broad-based local distribution capabilities and lower-cost funding. In addition, some of our competitors, including new and emerging competitors in the digital and mobile payments space, are not subject to the same regulatory requirements or legislative scrutiny to which we are subject, which also could place us at a competitive disadvantage. Customer attrition from any or all of our credit products or any lowering of the pricing of our products by reducing interest rates or fees in order to retain customers could reduce our revenues and therefore our earnings.
In our retail deposits business, we have acquisition and servicing capabilities similar to other direct banking competitors. We compete for deposits with traditional banks and, in seeking to grow our direct banking business, we compete with other banks that have direct banking models similar to ours, such as Ally Financial, American Express, Capital One 360 (ING), Discover, Goldman Sachs, Nationwide, Sallie Mae and USAA. Competition among direct banks is intense because online banking provides customers the ability to rapidly deposit and withdraw funds and open and close accounts in favor of products and services offered by competitors.
If we are unable to compete effectively for partners, customer usage or deposits, our business and results of operations could be materially adversely affected.

51
Our business is heavily concentrated in U.S. consumer credit, and therefore our results are more susceptible to fluctuations in that market than a more diversified company.
Our business is heavily concentrated in U.S. consumer credit. As a result, we are more susceptible to fluctuations and risks particular to U.S. consumer credit than a more diversified company. For example, our business is particularly sensitive to macroeconomic conditions that affect the U.S. economy, consumer spending and consumer credit. We are also more susceptible to the risks of increased regulations and legal and other regulatory actions that are targeted at consumer credit or the specific consumer credit products that we offer (including promotional financing). Due to our CareCredit platform, we are also more susceptible to increased regulations and legal and other regulatory actions targeted at healthcare related procedures or services, in contrast to other industries. Our business concentration could have an adverse effect on our results of operations.
We may be unable to successfully develop and commercialize new or enhanced products and services.
Our industry is subject to rapid and significant changes in technologies, products, services and consumer preferences. A key part of our financial success depends on our ability to develop and commercialize new products and services or enhancements to existing products and services, including with respect to loyalty programs, mobile and point of sale technologies, and new Synchrony-branded bank deposit and credit products. Realizing the benefits of those products and services is uncertain. We may not assign the appropriate level of resources, priority or expertise to the development and commercialization of these new products, services or enhancements. Our ability to develop, acquire or commercialize competitive technologies, products or services on acceptable terms or at all may be limited by intellectual property rights that third parties, including competitors and potential competitors, may assert. In addition, success is dependent on factors such as partner and customer acceptance, adoption and usage, competition, the effectiveness of marketing programs, the availability of appropriate technologies and business processes and regulatory approvals. Success of a new product, service or enhancement also may depend upon our ability to deliver it on a large scale, which may require a significant investment.
We also may select, utilize and invest in technologies, products and services that ultimately do not achieve widespread adoption and therefore are not as attractive or useful to our partners, customers and service partners as we anticipate, or partners may not recognize the value of our new products and services or believe they justify any potential costs or disruptions associated with implementing them. In addition, because our products and services typically are marketed through our partners, if our partners are unwilling or unable to effectively implement our new technologies, products, services or enhancements, we may be unable to grow our business. Competitors may also develop or adopt technologies or introduce innovations that change the markets we operate in and make our products less competitive and attractive to our partners and customers.
In any event, we may not realize the benefit of new technologies, products, services or enhancements for many years or competitors may introduce more compelling products, services or enhancements. Our failure to successfully develop and commercialize new or enhanced products, services or enhancements could have a material adverse effect on our business and results of operations.
We may not realize the value of strategic investments that we pursue and such investments could divert resources or introduce unforeseen risks to our business.
We may execute strategic acquisitions or partnerships or make other strategic investments in businesses, products, technologies or platforms to enhance or grow our business. These strategic investments may introduce new costs or liabilities which could impact our ability to grow or maintain acceptable performance.
We may be unable to integrate systems, personnel or technologies from our strategic investments. These strategic investments may also present unforeseen legal, regulatory or other challenges that we may not be able to manage effectively. The planning and integration of an acquisition, partnership or investment may shift employee time and other resources which could impair our ability to focus on our core business.
Strategic investments may not perform as expected due to lack of acceptance by partners, customers or employees, higher than forecasted costs, lengthy transition periods, synergies or savings not being realized and a variety of other factors. This may result in a delay or unrealized benefit, or in some cases, increased costs or other unforeseen risks to our business.

52
Reductions in interchange fees may reduce the competitive advantages our private label credit card products currently have by virtue of not charging interchange fees and would reduce our income from those fees.
Interchange is a fee merchants pay to the interchange network in exchange for the use of the network’s infrastructure and payment facilitation, and which are paid to credit card issuers to compensate them for the risk they bear in lending money to customers. We earn interchange fees on Dual Card and general purpose co-branded credit card transactions but we do not charge or earn interchange fees from our partners or customers on our private label credit card products.
Merchants, trying to decrease their operating expenses, have sought to, and have had some success at, lowering interchange rates. Several recent events and actions indicate a continuing increase in focus on interchange by both regulators and merchants. Beyond pursuing litigation, legislation and regulation, merchants are also pursuing alternate payment platforms as a means to lower payment processing costs. To the extent interchange fees are reduced, one of our current competitive advantages with our partners—that we typically do not charge interchange fees when our private label credit card products are used to purchase our partners’ goods and services—may be reduced. Moreover, to the extent interchange fees are reduced, our income from those fees will be lower. We received approximately $602 million of interchange fees for the year ended December 31, 2016. As a result, a reduction in interchange fees could have a material adverse effect on our business and results of operations. In addition, for our Dual Cards and general purpose co-branded credit cards, we are subject to the operating regulations and procedures set forth by the interchange network, and our failure to comply with these operating regulations, which may change from time to time, could subject us to various penalties or fees, or the termination of our license to use the interchange network, all of which could have a material adverse effect on our business and results of operations.
Fraudulent activity associated with our products and services could negatively impact our operating results, brand and reputation and cause the use of our products and services to decrease and our fraud losses to increase.
We are subject to the risk of fraudulent activity associated with partners, customers and third parties handling customer information. While our fraud-related losses stabilized in 2016, they have increased significantly in recent years and were $203 million, $219 million and $154 million for the years ended December 31, 2016, 2015 and 2014, respectively. Our fraud-related losses have shifted away from counterfeit fraud losses with the implementation of the EMV chip in Dual Cards and general purpose co-branded credit cards and towards application fraud and mail/phone fraud (including as a result of well-publicized security breaches at retailers unrelated to us). Our products are susceptible to application fraud, because among other things, we provide immediate access to the credit line at the time of approval. In addition, sales on the internet and through mobile channels are becoming a larger part of our business and fraudulent activity is higher as a percentage of sales in those channels than in stores. Dual Cards, general purpose co-branded credit cards and private label credit cards are susceptible to different types of fraud, and, depending on our product channel mix (including as a result of the introduction, if any, of a Synchrony-branded general purpose credit card), we may continue to experience variations in, or levels of, fraud-related expense that are different from or higher than that experienced by some of our competitors or the industry generally.
The risk of fraud continues to increase for the financial services industry in general, and credit card fraud, identity theft and related crimes are likely to continue to be prevalent, and perpetrators are growing more sophisticated. Our resources, technologies and fraud prevention tools may be insufficient to accurately detect and prevent fraud. High profile fraudulent activity also could negatively impact our brand and reputation, which could negatively impact the use of our cards and thereby have a material adverse effect on our results of operations. In addition, significant increases in fraudulent activity could lead to regulatory intervention (such as increased customer notification requirements), which could increase our costs and also negatively impact our operating results, brand and reputation and could lead us to take steps to reduce fraud risk, which could increase our costs.

53
The failure of third parties to provide various services that are important to our operations could have a material adverse effect on our business and results of operations.
Some services important to our business are outsourced to third-party vendors. For example, our credit card transaction processing, production and related services (including the printing and mailing of customer statements) are handled by First Data, and the technology platform for our online retail deposits is managed by Fiserv. First Data, Fiserv, and, in some cases, other third-party vendors, are the sole source or one of a limited number of sources of the services they provide for us. It would be difficult and disruptive for us to replace some of our third-party vendors, particularly First Data and Fiserv, in a timely manner if they were unwilling or unable to provide us with these services in the future (as a result of their financial or business conditions or otherwise), and our business and operations likely would be materially adversely affected. First Data has publicly disclosed that it is highly leveraged and that it has incurred net losses of $1.5 billion and $458 million for the years ended December 31, 2015 and 2014, respectively. Our principal agreement with First Data expires in November 2026, unless it is terminated earlier or is extended pursuant to the terms thereof. Our principal agreement with Fiserv expires in March 26, 2020, unless it is terminated earlier or is extended pursuant to the terms thereof. In addition, if a third-party provider fails to provide the services we require, fails to meet contractual requirements, such as compliance with applicable laws and regulations, or suffers a cyber-attack or other security breach, our business could suffer economic and reputational harm that could have a material adverse effect on our business and results of operations.
Disruptions in the operation of our computer systems and data centers could have a material adverse effect on our business.
Our ability to deliver products and services to our partners and our customers, service our loans and otherwise operate our business and comply with applicable laws depends on the efficient and uninterrupted operation of our computer systems and data centers, as well as those of our partners and third-party service providers. These computer systems and data centers may encounter service interruptions at any time due to system or software failure, natural disaster or other reasons. In addition, the implementation of technology changes and upgrades to maintain current and integrate new systems may also cause service interruptions, transaction processing errors and system conversion delays and may cause our failure to comply with applicable laws, all of which could have a material adverse effect on our business.
We expect that new technologies and business processes applicable to the consumer credit industry will continue to emerge, and these new technologies and business processes may be better than those we currently use. The pace of technology change is high and our industry is intensely competitive, and we cannot assure you that we will be able to sustain our investment in new technology as critical systems and applications become obsolete and better ones become available. A failure to maintain current technology and business processes could cause disruptions in our operations or cause our products and services to be less competitive, all of which could have a material adverse effect on our business, financial condition and results of operations.
We have international operations that subject us to various international risks as well as increased compliance and regulatory risks and costs.
We have international operations, primarily in India, the Philippines and Canada, and some of our third-party service providers provide services to us from other countries, all of which subject us to a number of international risks, including, among other things, sovereign volatility and socio-political instability. For example, the Philippines has in the past experienced severe political and social instability. Any future political or social instability in the countries in which we operate could have a material adverse effect on our business operations.
U.S. regulations also govern various aspects of the international activities of domestic corporations and increase our compliance and regulatory risks and costs. Any failure on our part or the part of our service providers to comply with applicable U.S. regulations, as well as the regulations in the countries and markets in which we or they operate, could result in fines, penalties, injunctions or other similar restrictions, any of which could have a material adverse effect on our business, results of operations and financial condition.

54
If we are alleged to have infringed upon the intellectual property rights owned by others or are not able to protect our intellectual property, our business and results of operations could be adversely affected.
Competitors or other third parties may allege that we, or consultants or other third parties retained or indemnified by us, infringe on their intellectual property rights. We also may face allegations that our employees have misappropriated intellectual property of their former employers or other third parties. Given the complex, rapidly changing and competitive technological and business environment in which we operate, and the potential risks and uncertainties of intellectual property-related litigation, an assertion of an infringement claim against us may cause us to spend significant amounts to defend the claim (even if we ultimately prevail), pay significant money damages, lose significant revenues, be prohibited from using the relevant systems, processes, technologies or other intellectual property, cease offering certain products or services, or incur significant license, royalty or technology development expenses. Moreover, it has become common in recent years for individuals and groups to purchase intellectual property assets for the sole purpose of making claims of infringement and attempting to extract settlements from companies like ours. Even in instances where we believe that claims and allegations of intellectual property infringement against us are without merit, defending against such claims is time consuming and expensive and could result in the diversion of time and attention of our management and employees. In addition, although in some cases a third party may have agreed to indemnify us for such costs, such indemnifying party may refuse or be unable to uphold its contractual obligations.
Moreover, we rely on a variety of measures to protect our intellectual property and proprietary information, including copyrights, trademarks, patents, trade secrets and controls on access and distribution. These measures may not prevent misappropriation or infringement of our intellectual property or proprietary information and a resulting loss of competitive advantage, and in any event, we may be required to litigate to protect our intellectual property and proprietary information from misappropriation or infringement by others, which is expensive, could cause a diversion of resources and may not be successful. Third parties may challenge, invalidate or circumvent our intellectual property, or our intellectual property may not be sufficient to provide us with competitive advantages. Our competitors or other third parties may independently design around or develop similar technology, or otherwise duplicate our services or products such that we could not assert our intellectual property rights against them. In addition, our contractual arrangements may not effectively prevent disclosure of our intellectual property or confidential and proprietary information or provide an adequate remedy in the event of an unauthorized disclosure.
We have launched our new brand, “Synchrony,” and expect to spend significant amounts over the next few years promoting the new brand. We recently filed trademark applications to protect our new name in the United States and certain other countries, but the registrations of many of these trademarks are not complete and they may ultimately not become registered. Our use of our new name (for our existing or any new products in the United States or other countries) may be challenged by third parties, and we may become involved in legal proceedings to protect or defend our rights with respect to our new name, all of which could have a material adverse effect on our business and results of operations.
Litigation, regulatory actions and compliance issues could subject us to significant fines, penalties, judgments, remediation costs and/or requirements resulting in increased expenses.
Our business is subject to increased risks of litigation and regulatory actions as a result of a number of factors and from various sources, including the highly regulated nature of the financial services industry, the focus of state and federal prosecutors on banks and the financial services industry and the structure of the credit card industry.

55
In the normal course of business, from time to time, we have been named as a defendant in various legal actions, including arbitrations, class actions and other litigation, arising in connection with our business activities. Certain of the legal actions include claims for substantial compensatory and/or punitive damages, or claims for indeterminate amounts of damages. In addition, while historically the arbitration provision in our customer agreements generally has limited our exposure to consumer class action litigation, there can be no assurance that we will be successful in enforcing our arbitration clause in the future. There may also be legislative, administrative or regulatory efforts to directly or indirectly prohibit the use of pre-dispute arbitration clauses, or we may be compelled as a result of competitive pressure or reputational concerns to voluntarily eliminate pre-dispute arbitration clauses. In March 2015, the CFPB issued a report scrutinizing pre-dispute arbitration clauses, and in May 2016, the CFPB published a proposed rule that would substantially curtail our ability to enter into voluntary pre-dispute arbitration clauses with consumers. The proposed rule would prevent us from including arbitration clauses in consumer contracts unless the clauses expressly permit class actions to proceed in court and require us to provide copies of consumer arbitration agreements, claims, and decisions to the CFPB for potential publication. If the CFPB proposals are adopted, our exposure to class action litigation could increase significantly.
We are also involved, from time to time, in reviews, investigations and proceedings (both formal and informal) by governmental agencies regarding our business (collectively, “regulatory matters”), which could subject us to significant fines, penalties, obligations to change our business practices or other requirements resulting in increased expenses, diminished earnings and damage to our reputation. The current environment of additional regulation, increased regulatory compliance efforts and enhanced regulatory enforcement has resulted in significant operational and compliance costs and may prevent or make it less attractive for us to continue providing certain products and services. There is no assurance that these regulatory matters or other factors will not, in the future, affect how we conduct our business and in turn have a material adverse effect on our business, results of operations and financial condition.
We contest liability and/or the amount of damages as appropriate in each pending matter. The outcome of pending and future matters could be material to our results of operations, financial condition and cash flows depending on, among other factors, the level of our earnings for that period, and could adversely affect our business and reputation. For a discussion of certain legal proceedings, see “Item 1. Business—Regulation—Consumer Financial Services Regulation,” Note 17. Legal Proceedings and Regulatory Matters to our consolidated and combined financial statements, and “Item 3. Legal Proceedings.”
In addition to litigation and regulatory matters, from time to time, through our operational and compliance controls, we identify compliance issues that require us to make operational changes and, depending on the nature of the issue, result in financial remediation to impacted cardholders. These self-identified issues and voluntary remediation payments could be significant depending on the issue and the number of cardholders impacted. They also could generate litigation or regulatory investigations that subject us to additional adverse effects on our business, results of operations and financial condition.
Damage to our reputation could negatively impact our business.
Recently, financial services companies have been experiencing increased reputational risk as consumers take issue with certain of their practices or judgments. Maintaining a positive reputation is critical to our attracting and retaining customers, partners, investors and employees. In particular, adverse perceptions regarding our reputation could also make it more difficult for us to execute on our strategy of increasing retail deposits at the Bank and may lead to decreases in deposits. Harm to our reputation can arise from many sources, including employee misconduct, misconduct by our partners, outsourced service providers or other counterparties, litigation or regulatory actions, failure by us or our partners to meet minimum standards of service and quality, inadequate protection of customer information and compliance failures. Negative publicity regarding us (or others engaged in a similar business or activities), whether or not accurate, may damage our reputation, which could have a material adverse effect on our business, results of operations and financial condition.

56
Our business could be adversely affected if we are unable to attract, retain and motivate key officers and employees.
Our success depends, in large part, on our ability to retain, recruit and motivate key officers and employees. Our senior management team has significant industry experience and would be difficult to replace. Competition for senior executives in the financial services and payment industry is intense. We may not be able to attract and retain qualified personnel to replace or succeed members of our senior management team or other key personnel. Guidelines issued by the federal banking regulators prohibits our payment of "excessive" compensation, or compensation that could lead to our material financial loss, to our executives, employees, and directors. In addition, proposed rules implementing the executive compensation provisions of the Dodd-Frank Act would limit the type and structure of compensation arrangements that we may enter into with our senior executives and persons deemed "significant risk-takers." These restrictions could negatively impact our ability to compete with other companies in recruiting, retaining and motivating key personnel. Failure to retain talented senior leadership could have a material adverse effect on our business, results of operations and financial condition.
Tax legislation initiatives or challenges to our tax positions could adversely affect our results of operations and financial condition.
We operate in multiple jurisdictions and we are subject to tax laws and regulations of the U.S. federal, state and local governments, and of various foreign jurisdictions. From time to time, legislative initiatives may be proposed, such as proposals for fundamental tax reform in the United States and lowering the corporate tax rate, which may impact our effective tax rate and could adversely affect our deferred tax assets, tax positions and/or our tax liabilities. In addition, U.S. federal, state and local, as well as foreign, tax laws and regulations are extremely complex and subject to varying interpretations. There can be no assurance that our historical tax positions will not be challenged by relevant tax authorities or that we would be successful in defending our position in connection with any such challenge.
State sales tax rules and regulations, and their application and interpretation by the respective states, could change and adversely affect our results of operations.
State sales tax rules and regulations, and their application and interpretation by the respective states, could adversely affect our results of operations. Retailers collect sales tax from retail customers and remit those collections to the applicable states. When customers fail to repay their loans, including the amount of sales tax advanced by us to the merchant on their behalf, we are entitled, in some cases, to seek a refund of the amount of sales tax from the applicable state. Sales tax laws and regulations enacted by the various states are subject to interpretation, and our compliance with such laws is routinely subject to audit and review by the states. Audit risk is concentrated in several states, and these states are conducting ongoing audits. The outcomes of ongoing and any future audits and changes in the states’ interpretation of the sales tax laws and regulations involving the recovery of tax on bad debts could materially adversely impact our results of operations.

57
We could have a material indemnification obligation to GE under the TSSA if we cause the split-off from GE or certain preliminary transactions to fail to qualify for tax-free treatment or in the case of certain significant transfers of our stock following the split-off from GE.
GE completed its exit from its investment in us in an exchange offer that concluded in November 2015, resulting in our split-off from GE. The split-off was designed to qualify for tax-free treatment to GE and its shareholders under Section 355 of the Internal Revenue Code of 1986, as amended (the “Code”). GE obtained a private letter ruling from the IRS regarding certain issues relating to the tax-free treatment of the split-off and a series of preliminary transactions that occurred prior to implementing the exchange offer. Although the IRS private letter ruling is generally binding on the IRS, the continuing validity of such ruling is subject to the accuracy of factual representations and assumptions made in the IRS private letter ruling. The IRS private letter ruling addresses only certain aspects of the transaction. As a result, GE obtained an opinion from tax counsel confirming the tax-free treatment of the split-off. The opinion is based upon various factual representations and assumptions, as well as certain undertakings made by us and GE. If any of those factual representations or assumptions in the IRS private letter ruling or tax opinion are untrue or incomplete in any material respect, any undertaking is not complied with, or the facts upon which the IRS private letter ruling or tax opinion was based are materially different from the facts at the time of the distribution, the split-off may not qualify for tax-free treatment. Opinions of counsel are not binding on the IRS. As a result, the conclusions expressed in the opinion of counsel could be challenged by the IRS, and if the IRS prevails in such challenge, the tax consequences of the split-off could be materially less favorable. If the split-off (or any of the preliminary transactions) is determined to be taxable, GE and its shareholders could incur significant tax liabilities, and under the TSSA we entered into with GE, we may be required to indemnify GE for any liabilities incurred by GE if the liabilities are caused by any action or inaction undertaken by us following the IPO or as a result of any direct or indirect transfers of our stock following the exchange offer.
In order to preserve the tax-free status of the split-off and the preliminary transactions to GE, the TSSA includes a provision generally prohibiting us from taking any action or inaction that is within our control (other than actions or inactions that implemented the split-off or certain preliminary transactions or actions or inactions that are consented to by GE or are at the direction of GE) that would cause the split-off (or the preliminary transactions) to become taxable, and providing for an indemnity obligation from us to GE for tax liabilities incurred by GE as a result of a breach of these provisions by us or as a result of any direct or indirect transfers of our stock following the exchange offer. As a result, we may not, as part of a plan that includes the exchange offer, enter into certain mergers or other change of control transactions.

58
Risks Relating to Regulation____________________________________________________________________________________________
Our business is subject to government regulation, supervision, examination and enforcement, which could adversely affect our business, results of operations and financial condition.
Our business, including our relationships with our customers, is subject to regulation, supervision and examination under U.S. federal, state and foreign laws and regulations. These laws and regulations cover all aspects of our business, including lending and collection practices, treatment of our customers, safeguarding deposits, customer privacy and information security, capital structure, liquidity, dividends and other capital distributions, transactions with affiliates and conduct and qualifications of personnel. As a savings and loan holding company, Synchrony is subject to regulation, supervision and examination by the Federal Reserve Board. As a large provider of consumer financial services, we are also subject to regulation, supervision and examination by the CFPB. The Bank is a federally chartered savings association. As such, the Bank is subject to regulation, supervision and examination by the OCC, which is its primary regulator, and by the CFPB. In addition, the Bank, as an insured depository institution, is supervised by the FDIC. We, including the Bank, are regularly reviewed and examined by our respective regulators, which results in supervisory comments and directions relating to many aspects of our business that require response and attention. See “Item 1. Business—Regulation” for more information about the regulations applicable to us.
Banking laws and regulations are primarily intended to protect federally insured deposits, the DIF and the banking system as a whole, and not intended to protect our stockholders, noteholders or creditors. If we fail to satisfy applicable laws and regulations, our respective regulators have broad discretion to enforce those laws and regulations, including with respect to the operation of our business, required capital levels, payment of dividends and other capital distributions, engaging in certain activities and making acquisitions and investments. Our regulators also have broad discretion with respect to the enforcement of applicable laws and regulations, including through enforcement actions that could subject us to civil money penalties, customer remediation programs, increased compliance costs, and limits or prohibitions on our ability to offer certain products and services or to engage in certain activities. In addition, to the extent we undertake actions requiring regulatory approval or non-objection, our regulators may make their approval or non-objection subject to conditions or restrictions that could have a material adverse effect on our business, results of operations and financial condition. Any other actions taken by our regulators could also have a material adverse impact on our business, reputation and brand, results of operations and financial condition. Moreover, some of our competitors are subject to different, and in some cases less restrictive, legislative and regulatory regimes, which may have the effect of providing them with a competitive advantage over us.
New laws or regulations or policy, or practical changes in enforcement of existing laws or regulations applicable to our business, or our own reexamination of our current practices, could adversely impact our profitability, limit our ability to continue existing or pursue new business activities, require us to change certain of our business practices or alter our relationships with customers, affect retention of our key personnel, or expose us to additional costs (including increased compliance costs and/or customer remediation). These changes may also require us to invest significant management attention and resources to make any necessary changes and could adversely affect our business, results of operations and financial condition. For example, the CFPB has broad authority over our business. See “—There continues to be uncertainty as to how the Consumer Financial Protection Bureau’s actions will impact our business; the agency’s actions have had and may continue to have an adverse impact on our business.”
We are also subject to potential enforcement and other actions that may be brought by state attorneys general or other state enforcement authorities and other governmental agencies. Any such actions could subject us to civil money penalties and fines, customer remediation programs and increased compliance costs, as well as damage our reputation and brand and limit or prohibit our ability to offer certain products and services or engage in certain business practices. For a discussion of risks related to actions or proceedings brought by regulatory agencies, see “—Risks Relating to Our Business—Litigation, regulatory actions and compliance issues could subject us to significant fines, penalties, judgments, remediation costs and/or requirements resulting in increased expenses.”

59
The Dodd-Frank Act has had, and may continue to have, a significant impact on our business, financial condition and results of operations.
The Dodd-Frank Act was enacted on July 21, 2010. While certain provisions in the Act were effective immediately, many of the provisions require implementing regulations to be effective. The Dodd-Frank Act and regulations promulgated thereunder have had, and may continue to have, a significant adverse impact on our business, results of operations and financial condition. For example, the Dodd-Frank Act and related regulations restrict certain business practices, impose more stringent capital, liquidity and leverage ratio requirements, as well as additional costs (including increased compliance costs and increased costs of funding raised through the issuance of asset-backed securities), on us, limit the fees we can charge for services and impact the value of our assets. In addition, the Dodd-Frank Act requires us to serve as a source of financial strength for any insured depository institution we control, such as the Bank. Such support may be required by the Federal Reserve Board at times when we might otherwise determine not to provide it or when doing so is not otherwise in the interest of Synchrony or its stockholders, noteholders or creditors. We describe certain provisions of the Dodd-Frank Act and other legislative and regulatory developments in “Item 1. Business—Regulation.” Federal agencies continue to promulgate regulations to implement the Dodd-Frank Act, and these regulations may continue to have a significant adverse impact on our business, financial condition and results of operations.
Many provisions of the Dodd-Frank Act require the adoption of additional rules to implement. In addition, the Dodd-Frank Act mandates multiple studies, which could result in additional legislative or regulatory action. As a result, the ultimate impact of the Dodd-Frank Act and its implementing regulations remains unclear and could have a material adverse effect on our business, results of operations and financial condition.
There continues to be uncertainty as to how the Consumer Financial Protection Bureau’s actions will impact our business; the agency’s actions have had and may continue to have an adverse impact on our business.
The CFPB, which commenced operations in July 2011, has broad authority over our business. This includes authority to write regulations under federal consumer financial protection laws and to enforce those laws against and examine large financial institutions, such as us, for compliance. The CFPB is authorized to prevent “unfair, deceptive or abusive acts or practices” through its regulatory, supervisory and enforcement authority. The Federal Reserve Board and the OCC and state government agencies may also invoke their supervisory and enforcement authorities to prevent unfair and deceptive acts or practices. These federal and state agencies are authorized to remediate violations of consumer protection laws in a number of ways, including collecting civil money penalties and fines and providing for customer restitution. The CFPB also engages in consumer financial education, requests data and promotes the availability of financial services to underserved consumers and communities. In addition, the CFPB maintains an online complaint system that allows consumers to log complaints with respect to various consumer finance products, including the products we offer. This system could inform future CFPB decisions with respect to its regulatory, enforcement or examination focus. There continues to be uncertainty as to how the CFPB’s strategies and priorities, including in both its examination and enforcement processes, will impact our business and our results of operations going forward. Actions by the CFPB could result in requirements to alter or cease offering affected products and services, including deferred interest products, making them less attractive to consumers, less profitable to us, and restricting our ability to offer them. For example, since 2013, the Bank has entered into two consent orders with the CFPB - one in 2013 (the "2013 CFPB Consent Order), which required us to provide remediation to certain customers and to make a number of changes to our CareCredit training, sales, marketing and servicing practices; and another in 2014 (the "2014 CFPB Consent Order" and together with the 2013 Consent Order, the "Consent Orders") with respect to a debt cancellation product and sales practices and an unrelated issue that arose from the Bank’s self-identified omission of certain Spanish-speaking customers and customers residing in Puerto Rico from two offers that were made to certain delinquent customers. Some of the business practice changes required by the 2013 Consent Order are similar to requirements in an Assurance of Discontinuance that the Bank entered into with the Attorney General for the State of New York in 2013. The Bank’s resolutions with the CFPB and the New York Attorney General do not preclude other regulators or state attorneys general from seeking additional monetary or injunctive relief with respect to CareCredit, and any such relief could have a material adverse effect on our business, results of operations or financial condition.

60
Although we have committed significant resources to enhancing our compliance programs, changes by the CFPB in regulatory expectations, interpretations or practices or interpretations that are different or stricter than ours or those adopted in the past by other regulators could increase the risk of additional enforcement actions, fines and penalties. For example, in December 2015, the CFPB published its second biennial report reviewing the consumer credit card market. In the report, the CFPB identified areas of concern for consumers, including deferred interest products, subprime specialist credit card issuers, and unexpected rate increases with respect to variable interest rate products. In addition, the report analyzed issues regarding debt sales and debt collection practices, the adequacy and availability of online disclosures, as well as of the disclosures associated with rewards products and grace periods. Actions by the CFPB with respect to any of these areas could result in requirements to alter our products and services that may make them less attractive to consumers or less profitable to us.
Future actions by the CFPB (or other regulators) against us or our competitors that discourage the use of products we offer or suggest to consumers the desirability of other products or services could result in reputational harm and a loss of customers. If the CFPB changes regulations which were adopted in the past by other regulators and transferred to the CFPB by the Dodd-Frank Act, or modifies, through supervision or enforcement, past related regulatory guidance or interprets existing regulations in a different or stricter manner than they have been interpreted in the past by us, the industry or other regulators, our compliance costs and litigation exposure could increase materially. If future regulatory or legislative restrictions or prohibitions are imposed that affect our ability to offer promotional financing, including deferred interest, for certain of our products or require us to make significant changes to our business practices, and we are unable to develop compliant alternatives with acceptable returns, these restrictions or prohibitions could have a material adverse impact on our business, results of operations and financial condition.
The Dodd-Frank Act authorizes state officials to enforce regulations issued by the CFPB and to enforce the Act’s general prohibition against unfair, deceptive or abusive practices. This could make it more difficult than in the past for federal financial regulators to declare state laws that differ from federal standards to be preempted. To the extent that states enact requirements that differ from federal standards or state officials and courts adopt interpretations of federal consumer laws that differ from those adopted by the CFPB, we may be required to alter or cease offering products or services in some jurisdictions, which would increase compliance costs and reduce our ability to offer the same products and services to consumers nationwide, and we may be subject to a higher risk of state enforcement actions.
Failure by Synchrony and the Bank to meet applicable capital adequacy and liquidity requirements could have a material adverse effect on us.
Synchrony and the Bank must meet rules for capital adequacy as discussed in “Item 1. Business—Regulation.” As a stand-alone savings and loan holding company, Synchrony is subject to capital requirements similar to those that apply to the Bank. We cannot predict the effects of these capital requirements on Synchrony. In addition, Synchrony and the Bank may be subject to increasingly stringent capital adequacy standards in the future.
Synchrony and the Bank must also comply with regulatory requirements related to the maintenance, management, monitoring and reporting of liquidity as discussed in “Item 1. Business—Regulation.” These liquidity requirements are new, and Synchrony and the Bank may become subject to additional liquidity requirements in the future. We cannot predict the effects of such liquidity requirements on Synchrony. The Bank is required to conduct stress tests on an annual basis, and as of January 1, 2017, Synchrony is required to conduct stress tests on an annual basis. Under the OCC’s and the Federal Reserve Board’s stress test regulations, the Bank and Synchrony are required to use stress-testing methodologies providing for results under various scenarios of economic and financial market stress. In addition, although as a savings and loan holding company Synchrony currently is not subject to the Federal Reserve Board’s CCAR rule, the Federal Reserve Board may in the future require Synchrony to comply with the CCAR process or some modified version of the CCAR process. Under such process, the Federal Reserve Board would measure Synchrony's regulatory capital levels under various stress scenarios. Further, while as a savings and loan holding company Synchrony currently is not subject to the Federal Reserve Board’s capital planning rule, Synchrony prepares and submits a form of capital plan to the Federal Reserve Board for its review, and Synchrony may in the future be required to seek the Federal Reserve Board’s review and approval of its capital plan consistent with the capital planning rule. To the extent Synchrony is made subject to the CCAR process or the capital planning rule, Synchrony's ability to return capital to shareholders or to reinvest capital in its business may be curtailed.

61
If Synchrony or the Bank fails to meet current or future minimum capital, leverage or other financial requirements, its operations, results of operations and financial condition could be materially adversely affected. Among other things, failure by Synchrony or the Bank to maintain its status as “well capitalized” (or otherwise meet current or future minimum capital, leverage or other financial requirements) could compromise our competitive position and result in restrictions imposed by the Federal Reserve Board or the OCC, including, potentially, on the Bank’s ability to engage in certain activities. These could include restrictions on the Bank’s ability to enter into transactions with affiliates, accept brokered deposits, grow its assets, engage in material transactions, extend credit in certain highly leveraged transactions, amend or change its charter, bylaws or accounting methods, pay interest on its liabilities without regard to regulatory caps on the rates that may be paid on deposits, and pay dividends or repurchase stock. In addition, failure to maintain the well capitalized status of the Bank could result in our having to invest additional capital in the Bank, which could in turn require us to raise additional capital. The market and demand for, and cost of, our asset-backed securities also could be adversely affected by failure to meet current or future capital requirements.
We are subject to restrictions that limit our ability to pay dividends and repurchase our common stock; the Bank is subject to restrictions that limit its ability to pay dividends to us, which could limit our ability to pay dividends, repurchase our common stock or make payments on our indebtedness.
We are limited in our ability to pay dividends and repurchase our common stock by the Federal Reserve Board, which has broad authority to review our capital planning and risk management processes, and our current, projected and stressed capital levels, and to object to any capital action that the Federal Reserve Board considers to be unsafe or unsound. In addition, the declaration and amount of any future dividends to holders of our common stock or stock repurchases will be at the discretion of our Board of Directors and will depend on many factors, including the financial condition, earnings, capital and liquidity requirements of us and the Bank, applicable regulatory requirements, corporate law and contractual restrictions and other factors that our Board of Directors deems relevant. If we are unable to pay dividends or repurchase our common stock, it could adversely affect the market price of our common stock and market perceptions of Synchrony Financial. See “Item 1. Business-Regulation—Savings and Loan Holding Company Regulation-Dividends and Stock Repurchases.”
We rely significantly on dividends and other distributions and payments from the Bank for liquidity, including to pay our obligations under our indebtedness and other indebtedness as they become due, and federal law limits the amount of dividends and other distributions and payments that the Bank may pay to us. For example, OCC regulations limit the ability of savings associations to make distributions of capital, including payment of dividends, stock redemptions and repurchases, cash-out mergers and other transactions charged to the capital account. The Bank must obtain the OCC’s approval prior to making a capital distribution in certain circumstances, including if the Bank proposes to make a capital distribution when it does not meet certain capital requirements (or will not do so as a result of the proposed capital distribution) or certain net income requirements. In addition, the Bank must file a prior written notice of a planned or declared dividend or other distribution with the Federal Reserve Board. The Federal Reserve Board or the OCC may object to a capital distribution if, among other things, the Bank is, or as a result of such dividend or distribution would be, undercapitalized or the Federal Reserve Board or OCC has safety and soundness concerns. Additional restrictions on bank dividends may apply if the Bank fails the QTL test. The application of these restrictions on the Bank’s ability to pay dividends involves broad discretion on the part of our regulators. Limitations on the Bank’s payments of dividends and other distributions and payments that we receive from the Bank could reduce our liquidity and limit our ability to pay dividends or our obligations under our indebtedness. See “Item 1. Business—Regulation—Savings Association Regulation—Dividends and Stock Repurchases” and “—Activities.”

62
Regulations relating to privacy, information security and data protection could increase our costs, affect or limit how we collect and use personal information and adversely affect our business opportunities.
We are subject to various privacy, information security and data protection laws, including requirements concerning security breach notification, and we could be negatively impacted by them. For example, in the United States, certain of our businesses are subject to the GLBA and implementing regulations and guidance. Among other things, the GLBA: (i) imposes certain limitations on the ability of financial institutions to share consumers’ nonpublic personal information with nonaffiliated third parties, (ii) requires that financial institutions provide certain disclosures to consumers about their information collection, sharing and security practices and affords customers the right to “opt out” of the institution’s disclosure of their personal financial information to nonaffiliated third parties (with certain exceptions) and (iii) requires financial institutions to develop, implement and maintain a written comprehensive information security program containing safeguards that are appropriate to the financial institution’s size and complexity, the nature and scope of the financial institution’s activities, and the sensitivity of customer information processed by the financial institution as well as plans for responding to data security breaches.
Moreover, various United States federal banking regulatory agencies, states and foreign jurisdictions have enacted data security breach notification requirements with varying levels of individual, consumer, regulatory and/or law enforcement notification in certain circumstances in the event of a security breach. Many of these requirements also apply broadly to our partners that accept our cards. In many countries that have yet to impose data security breach notification requirements, regulators have increasingly used the threat of significant sanctions and penalties by data protection authorities to encourage voluntary notification and discourage data security breaches.
Furthermore, legislators and/or regulators in the United States and other countries in which we operate are increasingly adopting or revising privacy, information security and data protection laws that potentially could have a significant impact on our current and planned privacy, data protection and information security-related practices, our collection, use, sharing, retention and safeguarding of consumer and/or employee information, and some of our current or planned business activities. This could also increase our costs of compliance and business operations and could reduce income from certain business initiatives. In the United States, this includes increased privacy-related enforcement activity at the Federal level, by the Federal Trade Commission, as well as at the state level, such as with regard to mobile applications.
Compliance with current or future privacy, data protection and information security laws (including those regarding security breach notification) affecting customer and/or employee data to which we are subject could result in higher compliance and technology costs and could restrict our ability to provide certain products and services (such as products or services that involve us sharing information with third parties or storing sensitive credit card information), which could materially and adversely affect our profitability. Our failure to comply with privacy, data protection and information security laws could result in potentially significant regulatory investigations and government actions, litigation, fines or sanctions, consumer or partner actions and damage to our reputation and our brand, all of which could have a material adverse effect on our business and results of operations.

63
Our use of third-party vendors and our other ongoing third-party business relationships are subject to increasing regulatory requirements and attention.
We regularly use third-party vendors and subcontractors as part of our business. We also have substantial ongoing business relationships with our partners and other third parties. These types of third-party relationships are subject to increasingly demanding regulatory requirements and attention by our federal bank regulators (the Federal Reserve Board, the OCC and the FDIC) and our consumer financial services regulator (the CFPB). Regulatory guidance requires us to enhance our due diligence, ongoing monitoring and control over our third-party vendors and subcontractors and other ongoing third-party business relationships, including with our partners. In certain cases, we may be required to renegotiate our agreements with these vendors and/or their subcontractors to meet these enhanced requirements, which could increase our costs. We expect that our regulators will hold us responsible for deficiencies in our oversight and control of our third-party relationships and in the performance of the parties with which we have these relationships. As a result, if our regulators conclude that we have not exercised adequate oversight and control over our third-party vendors and subcontractors or other ongoing third-party business relationships or that such third parties have not performed appropriately, we could be subject to enforcement actions, including the imposition of civil money penalties or other administrative or judicial penalties or fines as well as requirements for customer remediation.
Failure to comply with anti-money laundering and anti-terrorism financing laws could have significant adverse consequences for us.
We maintain an enterprise-wide program designed to enable us to comply with all applicable anti-money laundering and anti-terrorism financing laws and regulations, including the Bank Secrecy Act and the USA PATRIOT Act. This program includes policies, procedures, processes and other internal controls designed to identify, monitor, manage and mitigate the risk of money laundering or terrorist financing posed by our products, services, customers and geographic locale. These controls include procedures and processes to detect and report suspicious transactions, perform customer due diligence, respond to requests from law enforcement, and meet all recordkeeping and reporting requirements related to particular transactions involving currency or monetary instruments. We cannot be sure our programs and controls will be effective to ensure our compliance with all applicable anti-money laundering and anti-terrorism financing laws and regulations, and our failure to comply could subject us to significant sanctions, fines, penalties and reputational harm, all of which could have a material adverse effect on our business, results of operations and financial condition. In May 2016, the Financial Crimes Enforcement Network (“FinCEN”) promulgated a final rule under the Bank Secrecy Act that requires the Bank to adopt due diligence procedures to identify and verify a legal entity customer’s beneficial owner(s) at the time a new account is opened and to understand the nature and purpose of the customer relationship. The Bank will be required to comply with the final rule by May 11, 2018, and is currently working on changes to its product and channel strategies, application and servicing processes and systems to ensure compliance.
ITEM 1B. UNRESOLVED STAFF COMMENTSNot applicable.

64
ITEM 2. PROPERTIES
Facilities____________________________________________________________________________________________
Our corporate headquarters are located on a site in Stamford, Connecticut that we lease from a third party.
In addition to those set forth below, we maintain small offices at a few of our U.S. partner locations pursuant to servicing, lease or license agreements.
We believe our space is adequate for our current needs and that suitable additional or substitute space will be available to accommodate the foreseeable expansion of our operations.
The table below sets out selected information on our principal facilities.
Location Owned/Leased(1)
Corporate Headquarters:Stamford, CT Leased
Bank Headquarters:Draper, UT Leased
Payment Processing Centers:Atlanta, GA LeasedLongwood, FL Leased
Customer Service Centers:Altamonte Springs, FL LeasedCanton, OH LeasedCharlotte, NC LeasedHyderabad, India LeasedKettering, OH LeasedManila, Philippines LeasedManila, Philippines (Alabang) LeasedMerriam, KS OwnedPhoenix, AZ LeasedRapid City, SD LeasedSan Juan, PR Leased
Other Support Centers:Alpharetta, GA (2) LeasedBellevue, WA LeasedBentonville, AR LeasedChicago, IL LeasedCosta Mesa, CA LeasedFrisco, TX LeasedSan Francisco, CA LeasedSt. Paul, MN LeasedVan Buren, MI LeasedWalnut Creek, CA Leased
Bank Retail Branch Location:Bridgewater, NJ Leased
_______________________
(1) In connection with the IPO, certain of these leased properties were assigned to us by GECC. There are two properties (Kettering, OH and Alpharetta, GA) where GECC continues to have liability for obligations under the leases, and we have agreed to indemnify GECC for any costs or expenses related to those obligations.

65
ITEM 3. LEGAL PROCEEDINGSFor a discussion concerning our legal proceedings, see Note 17. Legal Proceedings and Regulatory Matters to our consolidated and combined financial statements.
ITEM 4. MINE SAFETY DISCLOSURESNot applicable.

66
PART II.
ITEM 5. MARKET FOR REGISTRANT’S COMMON EQUITY, RELATED STOCKHOLDER MATTERS AND ISSUER PURCHASES OF EQUITY SECURITIESMarket Information
Our common stock trades on the New York Stock Exchange under the symbol “SYF.”
The following table reflects the range of the high and low closing prices per share of our common stock, as reported on The New York Stock Exchange and the cash dividends we declared for the periods indicated.
Common stock market price Cashdividendsdeclared($ in dollars) High Low
2016Fourth quarter $ 37.26 $ 26.37 $ 0.13Third quarter $ 28.40 $ 25.12 $ 0.13Second quarter $ 31.95 $ 23.36 N/AFirst quarter $ 30.11 $ 24.48 N/A
2015Fourth quarter $ 33.98 $ 29.51 N/AThird quarter $ 35.99 $ 30.56 N/ASecond quarter $ 33.30 $ 29.76 N/AFirst quarter $ 33.61 $ 28.52 N/A
Holders
At February 16, 2017, the approximate number of holders of record of common stock was 3,188.
Dividends
Dividend Policy. The declaration and payment of any future dividends to holders of our common stock or stock repurchases will be at the discretion of Synchrony's Board of Directors and will depend on many factors, including the financial condition, earnings, capital and liquidity requirements of us and the Bank, applicable regulatory restrictions, corporate law and contractual restrictions and other factors that the Board of Directors deems relevant.
As a savings and loan holding company, our ability to pay dividends to our stockholders or to repurchase our stock is subject to regulation by the Federal Reserve Board. In addition, as a holding company, we rely significantly on dividends, distributions and other payments from the Bank to fund dividends to our stockholders. The ability of the Bank to make dividends and other distributions and payments to us is subject to regulation by the OCC and the Federal Reserve Board. See “Item 1A. Risk Factors—Risks Relating to Regulation—Failure by Synchrony and the Bank to meet applicable capital adequacy and liquidity requirements could have a material adverse effect on us” and “—We are subject to restrictions that limit our ability to pay dividends and repurchase our common stock; the Bank is subject to restrictions that limit its ability to pay dividends to us, which could limit our ability to pay dividends, repurchase our common stock or make payments on our indebtedness.”

67
Performance Graph
The following graph compares the cumulative total stockholders return (rounded to the nearest whole dollar) of the Company's common stock, the S&P 500 Stock Index and the S&P 500 Financials Index for the period from July 31, 2014 through December 31, 2016. The graph assumes an initial investment of $100 on July 31, 2014, the date the Company began trading on the NYSE following the IPO. The cumulative returns include stock price appreciation and assume full reinvestment of dividends. This graph does not forecast future performance of the Company's common stock.
July 31, 2014 December 31, 2014 December 31, 2015 December 31, 2016Synchrony Financial $ 100.00 $ 129.35 $ 132.22 $ 159.07S&P 500 $ 100.00 $ 106.64 $ 105.87 $ 115.96S&P 500 Financials $ 100.00 $ 110.42 $ 106.58 $ 128.05

68
Issuer Purchases of Equity Securities
The table below sets forth information regarding purchases of our common stock primarily related to our share repurchase program that were made by us or on our behalf during the three months ended December 31, 2016.
($ in millions, except per share data)
Total Number of Shares
Purchased(a)Average Price
Paid Per Share(b)
Total Number of Shares
Purchased as Part of Publicly
Announced Program(c)
Maximum Dollar Value of Shares That May Yet Be
Purchased Under the Program(b)
October 1 - 31, 2016 3,615,333 $ 28.91 3,615,333 $ 609.5November 1 - 30, 2016 4,534,485 $ 29.44 4,534,485 $ 476.0December 1 - 31, 2016 190 $ 36.28 — $ 476.0Total 8,150,008 $ 29.20 8,149,818 $ 476.0
_______________________
(a) Primarily represents repurchases of shares of common stock under our publicly announced share repurchase program of up to $952 million of our outstanding shares of common stock for the four quarters ending June 30, 2017. Also includes zero shares, zero shares and 190 shares withheld in October, November and December, respectively, to offset tax withholding obligations that occur upon the delivery of outstanding shares underlying restricted stock awards or upon the exercise of stock options.
(b) Amounts exclude commission costs.(c) On July 7, 2016, our Board of Directors approved a share repurchase program of up to $952 million of our outstanding
shares of common stock for the four quarters ending June 30, 2017.

69
ITEM 6. SELECTED FINANCIAL DATA
Consolidated and Combined Statements of Earnings Information
Years Ended December 31,($ in millions, except per share data) 2016 2015 2014 2013 2012Interest income $ 14,778 $ 13,228 $ 12,242 $ 11,313 $ 10,309
Interest expense 1,248 1,135 922 742 745
Net interest income 13,530 12,093 11,320 10,571 9,564Retailer share arrangements (2,902) (2,738) (2,575) (2,373) (1,984)Net interest income, after retailer share arrangements 10,628 9,355 8,745 8,198 7,580Provision for loan losses 3,986 2,952 2,917 3,072 2,565Net interest income, after retailer share arrangements andprovision for loan losses 6,642 6,403 5,828 5,126 5,015
Other income 344 392 485 500 484
Other expense 3,416 3,264 2,927 2,484 2,123Earnings before provision for income taxes 3,570 3,531 3,386 3,142 3,376Provision for income taxes 1,319 1,317 1,277 1,163 1,257
Net earnings $ 2,251 $ 2,214 $ 2,109 $ 1,979 $ 2,119Weighted average shares outstanding (in millions)
Basic 829.2 833.8 757.4 705.3 705.3Diluted 831.5 835.5 757.6 705.3 705.3
Earnings per shareBasic $ 2.71 $ 2.66 $ 2.78 $ 2.81 $ 3.00Diluted $ 2.71 $ 2.65 $ 2.78 $ 2.81 $ 3.00
Dividends declared per common share $ 0.26 $ — $ — $ — $ —
Consolidated and Combined Statements of Financial Position Information
($ in millions)At December 31,
2016 2015 2014 2013 2012Assets:Cash and equivalents $ 9,321 $ 12,325 $ 11,828 $ 2,319 $ 1,334Investment securities 5,110 3,142 1,598 236 193Loan receivables 76,337 68,290 61,286 57,254 52,313Allowance for loan losses (4,344) (3,497) (3,236) (2,892) (2,274)Loan receivables held for sale — — 332 — —Goodwill 949 949 949 949 936Intangible assets, net 712 701 519 300 255Other assets 2,122 2,080 2,258 822 592
Total assets $ 90,207 $ 83,990 $ 75,534 $ 58,988 $ 53,349Liabilities and Equity:Total deposits $ 52,055 $ 43,367 $ 34,859 $ 25,641 $ 18,717Total borrowings 20,147 24,279 27,383 24,302 27,789Accrued expenses and other liabilities 3,809 3,740 2,814 3,085 2,261
Total liabilities 76,011 71,386 65,056 53,028 48,767Total equity 14,196 12,604 10,478 5,960 4,582
Total liabilities and equity $ 90,207 $ 83,990 $ 75,534 $ 58,988 $ 53,349

70
ITEM 7. MANAGEMENT’S DISCUSSION AND ANALYSIS OF FINANCIAL CONDITION AND RESULTS OF OPERATIONSThe following discussion and analysis of our financial condition and results of operations should be read in conjunction with our consolidated and combined financial statements and related notes included elsewhere in this report. The discussion below contains forward-looking statements that are based upon current expectations and are subject to uncertainty and changes in circumstances. Actual results may differ materially from these expectations. See “Cautionary Note Regarding Forward-Looking Statements.”
Introduction and Business Overview____________________________________________________________________________________________
We are one of the premier consumer financial services companies in the United States. We provide a range of credit products through programs we have established with a diverse group of national and regional retailers, local merchants, manufacturers, buying groups, industry associations and healthcare service providers, which we refer to as our “partners.” During 2016, we financed $125.5 billion of purchase volume, and at December 31, 2016, we had $76.3 billion of loan receivables and 71.9 million active accounts. For the year ended December 31, 2016, we had net earnings of $2.3 billion, representing a return on assets of 2.7%.
We offer our credit products primarily through our wholly-owned subsidiary, Synchrony Bank (the "Bank"). Through the Bank, we offer, directly to retail and commercial customers, a range of deposit products insured by the Federal Deposit Insurance Corporation (“FDIC”). We have significantly expanded our online direct banking operations in recent years and our deposit base serves as a source of stable and diversified low cost funding for our credit activities. At December 31, 2016, we had $52.1 billion in deposits which represented 72% of our total funding sources.
Our Separation from GE
In November 2015, Synchrony Financial became a stand-alone savings and loan holding company following the completion of GE's exchange offer, in which GE exchanged shares of GE common stock for all of the shares of our common stock it owned (the “Separation”).

71
Our Sales Platforms___________________________________________________________________________________________
We conduct our operations through a single business segment. Profitability and expenses, including funding costs, loan losses and operating expenses, are managed for the business as a whole. Substantially all of our operations are within the United States. We offer our credit products through three sales platforms (Retail Card, Payment Solutions and CareCredit). Those platforms are organized by the types of products we offer and the partners we work with, and are measured on interest and fees on loans, loan receivables, new accounts and other sales metrics. See “Item 1. Business—Our Sales Platforms.”
Retail Card
Retail Card is a leading provider of private label credit cards, and also provides Dual Cards, general purpose co-branded credit cards and small- and medium-sized business credit products. We offer one or more of these products primarily through 26 national and regional retailers with which we have ongoing program agreements. The average length of our relationship with these Retail Card partners is 19 years. Retail Card’s revenue consists of interest and fees on our loan receivables. Other income primarily consists of interchange fees earned when our Dual Card or general purpose co-branded credit cards are used outside our partners' sales channels and fees paid to us by customers who purchase our debt cancellation products, less loyalty program payments. Substantially all of the credit extended in this platform is on standard terms.
Payment Solutions
Payment Solutions is a leading provider of promotional financing for major consumer purchases, offering primarily private label credit cards and installment loans. At December 31, 2016, Payment Solutions offered these products through participating partners consisting of national and regional retailers, local merchants, manufacturers, buying groups and industry associations. Substantially all of the credit extended in this platform is promotional financing. Payment Solutions’ revenue primarily consists of interest and fees on our loan receivables, including “merchant discounts,” which are fees paid to us by our partners in almost all cases to compensate us for all or part of foregone interest income associated with promotional financing.
CareCredit
CareCredit is a leading provider of promotional financing to consumers for health and personal care procedures, products or services. At December 31, 2016, we had a network of CareCredit providers and health-focused retailers that collectively have approximately 200,000 locations, the vast majority of which are individual or small groups of independent healthcare providers, through which we offer a CareCredit branded private label credit card. Substantially all of the credit extended in this platform is promotional financing. CareCredit’s revenue primarily consists of interest and fees on our loan receivables, including merchant discounts.

72
Our Credit Products____________________________________________________________________________________________
Through our platforms, we offer three principal types of credit products: credit cards, commercial credit products and consumer installment loans. See “Item 1. Business - Our Credit Products.”
Credit Cards
We offer the following principal types of credit cards:
• Private label credit cards. Private label credit cards are partner-branded credit cards (e.g., Lowe’s or Amazon) or program-branded credit cards (e.g., Synchrony Car Care or CareCredit) that are used primarily for the purchase of goods and services from the partner or within the program network. In addition, in some cases, cardholders may be permitted to access their credit card accounts for cash advances. In Retail Card, credit under our private label credit cards typically is extended on standard terms only, and in Payment Solutions and CareCredit, credit under our private label credit cards typically is extended pursuant to a promotional financing offer.
• Dual Cards and General Purpose Co-Brand Cards. Our patented Dual Cards are credit cards that function as private label credit cards when used to purchase goods and services from our partners and as general purpose credit cards when used elsewhere. We also offer general purpose co-branded credit cards that do not also function as private label cards. Credit extended under our Dual Cards and general purpose co-branded credit cards typically is extended under standard terms only. Currently, only our Retail Card platform offers Dual Cards and general purpose co-branded credit cards. At December 31, 2016, we offered these credit cards through 18 of our 26 ongoing Retail Card programs, of which the majority are Dual Cards.
Commercial Credit Products
We offer private label cards and Dual Cards for commercial customers that are similar to our consumer offerings. We also offer a commercial pay-in-full accounts receivable product to a wide range of business customers. We offer our commercial credit products primarily through our Retail Card platform to the commercial customers of our Retail Card partners.
Installment Loans
In Payment Solutions, we originate installment loans to consumers (and a limited number of commercial customers) in the United States, primarily in the power products market (motorcycles, ATVs and lawn and garden). Installment loans are closed-end credit accounts where the customer pays down the outstanding balance in installments. Installment loans are assessed periodic finance charges using fixed interest rates.

73
Business Trends and Conditions____________________________________________________________________________________________
We believe our business and results of operations will be impacted in the future by various trends and conditions, including the following:
• Growth in loan receivables and interest income. We believe continuing improvement in the U.S. economy and employment rates will contribute to an increase in consumer credit spending. In addition, we expect the use of credit cards to continue to increase versus other forms of payment such as cash and checks. We anticipate that these trends, combined with our marketing and partner engagement strategies, will contribute to growth in our loan receivables. In the near-to-medium term, we expect our total interest income to continue to grow, driven by the expected growth in average loan receivables. Our historical growth rates in loan receivables and interest income have benefited from new partner acquisitions, and therefore, if we do not continue to acquire new partners, replace the programs that are not extended or otherwise grow our business, our growth rates in loan receivables and interest income in the future will be lower than in recent periods. In addition, we do not expect to make any significant changes to customer pricing or merchant discount pricing in the near term other than those associated with changes in the prime rate and LIBOR, and therefore we expect yields generated from interest and fees on interest-earning assets will remain relatively stable.
• Extended duration of our Retail Card program agreements. Our Retail Card program agreements typically have contract terms ranging from approximately five to ten years, and the average length of our relationship with our ongoing Retail Card partners is 19 years. We expect to continue to benefit from these programs on a long-term basis as indicated by the expiration schedule included in “Item 1. Business—Our Sales Platforms—Retail Card”, which indicates for each period the number of programs scheduled to expire and the proportion of interest and fees on loans that these programs comprised for the year ended December 31, 2016.
A total of 23 of our 26 Retail Card program agreements now have an expiration date in 2019 or beyond. These 23 program agreements represented in the aggregate 99% of our Retail Card interest and fees on loans for the year ended December 31, 2016 and 99% of our Retail Card loan receivables at December 31, 2016.
• Increases in retailer share arrangement payments under extended program agreements. We believe that as a result of both the overall growth of our programs, as well as amendments we have made to the terms of certain program agreements that we extended in recent years, the payments we make to our partners under these extended retailer share arrangements, in the aggregate, are likely to increase both in absolute terms and as a percentage of our net earnings.
• Stable asset quality. The credit environment remained favorable during 2016. Our actual net charge-off rates have remained relatively stable, increasing by 21 basis points to 4.57% for the year ended December 31, 2016 compared to 4.36% for the year ended December 31, 2015, which represents a modest increase from the low credit trends we have experienced in the last two years. The assessment of our credit profile includes the evaluation of portfolio mix, account maturation, as well as broader consumer trends, such as payment behavior and overall indebtedness. During 2016, these factors contributed to increases in our delinquent accounts and our forecasted net charge-off rate over the next twelve months. Accordingly, we also experienced a corresponding increase in our allowance coverage ratio, as we reserved for these forecasted losses inherent in our loan portfolio. In the near term, we expect U.S. unemployment rates to continue to stabilize and we do not anticipate making significant changes to our underwriting standards. In this credit environment, we expect the trend of modest increases in our net charge-off rates, delinquencies and allowance coverage to continue in 2017.

74
• Growth in interchange revenues and loyalty program costs. We believe that as a result of the overall growth in Dual Card and general purpose co-branded credit card transactions occurring outside of our Retail Card partners’ locations, interchange revenues will continue to increase. The expected growth in these transactions is driven, in part, by both existing and new loyalty programs with our Retail Card partners. In addition, we continue to offer and add new loyalty programs for our private label credit cards, for which we do not receive interchange fees. The growth in these existing and new loyalty programs will result in an increase in costs associated with these programs. Overall, we expect both our interchange revenues and loyalty program costs to grow in excess of the growth of our Retail Card loan receivables, and expect the increase in loyalty program costs to be higher than that expected for interchange revenues due to the additional loyalty programs for our private label credit cards where we do not charge interchange fees. These increases have been contemplated in our program agreements with our Retail Card partners and are a component of the calculation of our payments due under our retailer share arrangements.
• Capital and liquidity levels. We continue to expect to maintain sufficient capital and liquidity resources to support our daily operations, our business growth, and our credit ratings as well as regulatory and compliance requirements in a cost effective and prudent manner through expected and unexpected market environments. In July 2016, we established both dividend and share repurchase programs, and accordingly, during the year ended December 31, 2016, we declared and paid dividends of $214 million and repurchased $476 million of our outstanding common stock. While these programs have now been established, and we expect to continue to deploy capital through both dividends and share repurchases, subject to regulatory approval, we also continue to expect to maintain capital ratios well in excess of minimum regulatory requirements. At December 31, 2016, the Company had a Basel III common equity Tier 1 ratio under transitional guidelines of 17.2%. We also expect that our liquidity portfolio will continue to be sufficient to support all of our business objectives and to meet all regulatory requirements.
Seasonality____________________________________________________________________________________________
In our Retail Card and Payment Solutions platforms, we experience fluctuations in transaction volumes and the level of loan receivables as a result of higher seasonal consumer spending and payment patterns that typically result in an increase of loan receivables from August through a peak in late December, with reductions in loan receivables occurring over the first and second quarters of the following year as customers pay their balances down.
The seasonal impact to transaction volumes and the loan receivables balance typically results in fluctuations in our results of operations, delinquency metrics and the allowance for loan losses as a percentage of total loan receivables between quarterly periods. These fluctuations are generally most evident between the fourth quarter and the first quarter of the following year.
In addition to the seasonal variance in loan receivables discussed above, we also experience a seasonal increase in delinquency rates and delinquent loan receivables balances during the third and fourth quarters of each year due to lower customer payment rates resulting in higher net charge-off rates in the first and second quarters. Our delinquency rates and delinquent loan receivables balances typically decrease during the subsequent first and second quarters as customers begin to pay down their loan balances and return to current status resulting in lower net charge-off rates in the third and fourth quarters. Because customers who were delinquent during the fourth quarter of a calendar year have a higher probability of returning to current status when compared to customers who are delinquent at the end of each of our interim reporting periods, we expect that a higher proportion of delinquent accounts outstanding at an interim period end will result in charge-offs, as compared to delinquent accounts outstanding at a year end. Consistent with this historical experience, we generally experience a higher allowance for loan losses as a percentage of total loan receivables at the end of an interim period, as compared to the end of a calendar year. In addition, despite improving credit metrics such as declining past due amounts, we may experience an increase in our allowance for loan losses at an interim period end compared to the prior year end, reflecting these same seasonal trends.

75
Results of Operations____________________________________________________________________________________________Key Earnings Metrics
Growth Metrics

76
Asset Quality Metrics
Capital and Liquidity
______________________
(a) Calculated under Basel III regulatory capital standards, subject to transition provisions.

77
Highlights for Year Ended December 31, 2016
Below are highlights of our performance for the year ended December 31, 2016 compared to the year ended December 31, 2015, as applicable, except as otherwise noted.
• Net earnings increased 1.7% to $2,251 million for the year ended December 31, 2016, driven by higher net interest income, partially offset by increases in provision for loan losses and other expense and a decrease in other income.
• Loan receivables increased 11.8% to $76,337 million at December 31, 2016 compared to December 31, 2015, primarily driven by higher purchase volume and average active account growth.
• Net interest income increased 11.9% to $13,530 million for the year ended December 31, 2016, primarily due to higher average loan receivables.
• Retailer share arrangements increased 6.0% to $2,902 million for the year ended December 31, 2016, primarily as a result of growth and improved performance of the programs in which we have retailer share arrangements, partially offset by higher provision for loan losses and loyalty costs associated with these programs.
• Over-30 day loan delinquencies as a percentage of period-end loan receivables increased 26 basis points to 4.32% at December 31, 2016, and net charge-off rate increased 21 basis points to 4.57% for the year ended December 31, 2016.
• Provision for loan losses increased by $1,034 million, or 35.0%, for the year ended December 31, 2016, due to a higher loan loss reserve and receivables growth. Our allowance coverage ratio (allowance for loan losses as a percent of end of period loan receivables) increased to 5.69% at December 31, 2016, as compared to 5.12% at December 31, 2015.
• Other expense increased by $152 million, or 4.7%, for the year ended December 31, 2016, primarily driven by business growth, partially offset by lower marketing and other expenses, as well as EMV re-issue costs in the prior year that did not repeat.
• We continue to invest in our direct banking activities to grow our deposit base. Total deposits increased 20.0% to $52.1 billion at December 31, 2016, compared to December 31, 2015, driven primarily by growth in our direct deposits of 27.6% to $37.9 billion, partially offset by a reduction in our brokered deposits.
• During the year ended December 31, 2016, we repurchased $476 million of our outstanding common stock, and also declared and paid cash dividends of $0.26 per share, or $214 million.
New and Extended Partner Agreements
• We extended our Retail Card program agreements with TJX Companies and Stein Mart, launched our new programs with Citgo, Marvel, Google Store and Fareportal and announced our new partnerships with Cathay Pacific, Nissan and At Home, and in January 2017, renewed our program with Belk.
• We extended our Payment Solutions program agreements with Ashley Furniture HomeStore, hhgregg, La-Z-Boy, Nationwide Marketing Group and Suzuki and launched our new programs with Mattress Firm and The Container Store.
• In our CareCredit sales platform, we renewed VCA Animal Hospitals in our network of providers and renewed our endorsements with the American Dental Association and American Society of Plastic Surgeons.

78
Highlights for Year Ended December 31, 2015
Below are highlights of our performance for the year ended December 31, 2015 compared to the year ended December 31, 2014, as applicable, except as otherwise noted.
• Net earnings increased 5.0% to $2,214 million for the year ended December 31, 2015, driven by higher net interest income, partially offset by increases in retailer share arrangements, provision for loan losses and other expense.
• Loan receivables increased 11.4% to $68,290 million at December 31, 2015 compared to December 31, 2014, primarily driven by higher purchase volume and average active account growth, and included growth associated with the BP portfolio acquired in the second quarter of 2015.
• Net interest income increased 6.8% to $12,093 million for the year ended December 31, 2015, primarily due to higher average loan receivables, partially offset by higher interest expense driven by increased liquidity, funding mix and growth.
• Retailer share arrangements increased 6.3% to $2,738 million for the year ended December 31, 2015, primarily as a result of growth and improved performance of the programs in which we have retailer share arrangements, partially offset with increased other expense and loyalty costs associated with these programs.
• Loan delinquencies as a percentage of period-end loan receivables decreased with the over-30 day delinquency rate decreasing to 4.06% at December 31, 2015 from 4.14% at December 31, 2014, primarily driven by improving asset quality trends and general improvement in the U.S. economy. Net charge-off rates decreased 15 basis points to 4.36% for the year ended December 31, 2015, from 4.51% for the year ended December 31, 2014 reflecting these same trends.
• Provision for loan losses increased by $35 million, or 1.2%, to $2,952 million for the year ended December 31, 2015, primarily due to portfolio growth, partially offset by improving asset quality trends. Our allowance coverage ratio (allowance for loan losses as a percent of end of period loan receivables) decreased to 5.12% at December 31, 2015, as compared to 5.28% at December 31, 2014, reflecting the recent improvements in our asset quality trends.
• Other expense increased by $337 million, or 11.5%, for the year ended December 31, 2015, driven by investments in growth and infrastructure build in preparation for separation from GE and also included expenses for the completion of the EMV card rollout for active Dual Card accounts.
• We continue to invest in our direct banking activities to grow our deposit base. Total deposits increased 24.4% to $43.4 billion at December 31, 2015, compared to December 31, 2014, driven primarily by growth in our direct deposits of 50.8% to $29.7 billion, partially offset by a reduction in our brokered deposits.
New and Extended Partner Agreements
• During the year ended December 31, 2015, we extended our Retail Card program agreements with Amazon, Chevron, Dick's Sporting Goods and PayPal, launched our new program with BP, and announced our new partnerships with Citgo and Stash Hotel Rewards.
• During the year ended December 31, 2015, we entered into new program agreements in our Payment Solutions sales platform with Guitar Center, Mattress Firm, The Container Store and Newegg and extended our program agreements with Discount Tire, Sleepy's, P.C. Richard & Son, Conn's, Polaris Industries, Mohawk Flooring, Art Van Furniture and MEGA Group USA, a national home furnishings buying group of independent retailers.
• During the year ended December 31, 2015, in our CareCredit sales platform, we added Rite Aid to our network of providers, added a new endorsement with VSP, the nation’s largest vision insurance provider, and renewed our endorsement with the American Society of Plastic Surgeons.

79
Summary Earnings
The following table sets forth our results of operations for the periods indicated.
Years ended December 31 ($ in millions) 2016 2015 2014Interest income $ 14,778 $ 13,228 $ 12,242
Interest expense 1,248 1,135 922
Net interest income 13,530 12,093 11,320
Retailer share arrangements (2,902) (2,738) (2,575)
Net interest income, after retailer share arrangements 10,628 9,355 8,745
Provision for loan losses 3,986 2,952 2,917
Net interest income, after retailer share arrangements and provision forloan losses 6,642 6,403 5,828
Other income 344 392 485
Other expense 3,416 3,264 2,927
Earnings before provision for income taxes 3,570 3,531 3,386
Provision for income taxes 1,319 1,317 1,277
Net earnings $ 2,251 $ 2,214 $ 2,109

80
Other Financial and Statistical Data(1)(2)
The following table sets forth certain other financial and statistical data for the periods indicated.
At and for the years ended December 31 ($ in millions) 2016 2015 2014Financial Position Data (Average):Loan receivables, including held for sale $ 68,649 $ 61,655 $ 57,101Total assets $ 84,400 $ 76,828 $ 66,019Deposits $ 47,399 $ 38,262 $ 30,257Borrowings $ 20,142 $ 24,006 $ 24,568Total equity $ 13,620 $ 11,683 $ 7,888Selected Performance Metrics:Purchase volume(3) $ 125,468 $ 113,615 $ 103,149
Retail Card $ 101,242 $ 92,190 $ 83,591Payment Solutions $ 15,641 $ 13,668 $ 12,447CareCredit $ 8,585 $ 7,757 $ 7,111
Average active accounts (in thousands)(4) 66,928 62,643 60,009Net interest margin(5) 16.10% 15.85% 17.20%Net charge-offs $ 3,139 $ 2,691 $ 2,573Net charge-offs as a % of average loan receivables, including held for sale 4.57% 4.36% 4.51%Allowance coverage ratio(6) 5.69% 5.12% 5.28%Return on assets(7) 2.7% 2.9% 3.2%Return on equity(8) 16.5% 19.0% 26.7%Equity to assets(9) 16.14% 15.21% 11.95%Other expense as a % of average loan receivables, including held for sale 4.98% 5.29% 5.13%Efficiency ratio(10) 31.1% 33.5% 31.7%Effective income tax rate 36.9% 37.3% 37.7%Selected Period End Data:Loan receivables $ 76,337 $ 68,290 $ 61,286Allowance for loan losses $ 4,344 $ 3,497 $ 3,23630+ days past due as a % of period-end loan receivables(11) 4.32% 4.06% 4.14%90+ days past due as a % of period-end loan receivables(11) 2.03% 1.86% 1.90%Total active accounts (in thousands)(4) 71,890 68,314 64,286
__________________
(1) Average balances and related selected metrics for the years ended December 31, 2016 and 2015 are now presented in the table above based upon daily balances. Average balances and related selected metrics for the year ended December 31, 2014 are based on monthly balances, including beginning of period balances, except where monthly balances are unavailable and quarterly balances are used. See “—Average Balance Sheet” for additional information.
(2) Certain balance sheet amounts and related metrics have been updated to reflect the adoption of ASU 2015-03. See Note 2. Basis of Presentation and Summary of Significant Accounting Policies to our consolidated and combined financial statements for a more detailed discussion.
(3) Purchase volume, or net credit sales, represents the aggregate amount of charges incurred on credit cards or other credit product accounts less returns during the period. Purchase volume includes activity related to our portfolios classified as held for sale.
(4) Active accounts represent credit card or installment loan accounts on which there has been a purchase, payment or outstanding balance in the current month.
(5) Net interest margin represents net interest income divided by average interest-earning assets.(6) Allowance coverage ratio represents allowance for loan losses divided by total period-end loan receivables.(7) Return on assets represents net earnings as a percentage of average total assets.(8) Return on equity represents net earnings as a percentage of average total equity.(9) Equity to assets represents average equity as a percentage of average total assets.(10) Efficiency ratio represents (i) other expense, divided by (ii) net interest income, after retailer share arrangements, plus other
income.(11) Based on customer statement-end balances extrapolated to the respective period-end date.

81
Average Balance Sheet
The following table sets forth information for the periods indicated regarding average balance sheet data, which are used in the discussion of interest income, interest expense and net interest income that follows.
2016 2015 2014
Years ended December 31 ($ in millions)
AverageBalance(1)
InterestIncome /Expense
AverageYield /Rate(3)
AverageBalance(1)
InterestIncome/Expense
AverageYield /Rate(3)
AverageBalance(2)
InterestIncome/Expense
AverageYield /Rate(3)
AssetsInterest-earning assets:Interest-earning cash and equivalents(4) $ 12,152 $ 63 0.52% $ 11,409 $ 28 0.25% $ 8,230 $ 16 0.19%
Securities available for sale 3,220 33 1.02% 3,240 21 0.65% 487 10 2.05%
Loan receivables(5):Credit cards, including held forsale 65,947 14,424 21.87% 59,118 12,932 21.87% 54,686 11,967 21.88%
Consumer installment loans 1,274 117 9.18% 1,119 104 9.29% 1,025 99 9.66%
Commercial credit products 1,372 139 10.13% 1,373 142 10.34% 1,373 149 10.85%
Other 56 2 3.57% 45 1 2.22% 17 1 5.88%
Total loan receivables 68,649 14,682 21.39% 61,655 13,179 21.38% 57,101 12,216 21.39%
Total interest-earning assets 84,021 14,778 17.59% 76,304 13,228 17.34% 65,818 12,242 18.60%
Non-interest-earning assets:Cash and due from banks 965 1,086 881
Allowance for loan losses (3,872) (3,341) (3,039)
Other assets 3,286 2,779 2,359
Total non-interest-earningassets 379 524 201
Total assets $ 84,400 $ 76,828 $ 66,019
LiabilitiesInterest-bearing liabilities:Interest-bearing depositaccounts $ 47,194 $ 727 1.54% $ 38,060 $ 607 1.59% $ 30,017 $ 470 1.57%
Borrowings of consolidatedsecuritization entities 12,428 244 1.96% 13,760 215 1.56% 14,820 215 1.45%
Bank term loan(6) 556 31 5.58% 5,164 136 2.63% 3,039 74 2.44%
Senior unsecured notes 7,158 246 3.44% 4,996 173 3.46% 1,374 50 3.64%
Related party debt — — —% 86 4 4.65% 5,335 113 2.12%
Total interest-bearingliabilities 67,336 1,248 1.85% 62,066 1,135 1.83% 54,585 922 1.69%
Non-interest-bearingliabilities:Non-interest-bearing depositaccounts 205 202 240
Other liabilities 3,239 2,877 3,306
Total non-interest-bearingliabilities 3,444 3,079 3,546
Total liabilities 70,780 65,145 58,131
EquityTotal equity 13,620 11,683 7,888
Total liabilities and equity $ 84,400 $ 76,828 $ 66,019
Interest rate spread(7) 15.74% 15.51% 16.91%
Net interest income $ 13,530 $ 12,093 $ 11,320
Net interest margin(8) 16.10% 15.85% 17.20%
____________________
(1) Average balances for the year ended December 31, 2016 are now presented in the table above, and throughout Management's Discussion and Analysis of Financial Condition and Results of Operations where applicable, based upon daily balances. Average balances for the year ended December 31, 2015 have been revised to conform to the current year presentation.

82
(2) Average balances for the year ended December 31, 2014 are based on monthly balances, including beginning of period balances, except where monthly balances are unavailable and quarterly balances are used. Collection of daily averages for this period involves undue burden and expense. We believe our average balance sheet data appropriately incorporates the seasonality in the level of our loan receivables and is representative of our operations.
(3) Average yields/rates are based on total interest income/expense over average balances.(4) Includes average restricted cash balances of $436 million, $527 million and $331 million for the years ended December 31,
2016, 2015 and 2014, respectively.(5) Interest income on loan receivables includes fees on loans of $2,458 million, $2,235 million and $2,129 million for the years
ended December 31, 2016, 2015 and 2014, respectively.(6) The effective interest rates for the Bank term loan for the years ended December 31, 2016 and 2015 were 2.48% and
2.23%, respectively. The Bank term loan effective rate excludes the impact of charges incurred in connection with prepayments of the loan.
(7) Interest rate spread represents the difference between the yield on total interest-earning assets and the rate on total interest-bearing liabilities.
(8) Net interest margin represents net interest income divided by average total interest-earning assets.
The following table sets forth the amount of changes in interest income and interest expense due to changes in average volume and average yield/rate. Variances due to changes in both average volume and average yield/rate have been allocated between the average volume and average yield/rate variances on a consistent basis based upon the respective percentage changes in average volume and average yield/rate.
2016 vs. 2015 2015 vs. 2014Increase (decrease) due to change in: Increase (decrease) due to change in:
($ in millions)AverageVolume
AverageYield / Rate
NetChange
AverageVolume
AverageYield / Rate
NetChange
Interest-earning assets:Interest-earning cash and equivalents $ 2 $ 33 $ 35 $ 7 $ 5 $ 12
Securities available for sale — 12 12 22 (11) 11Loan receivables:Credit cards, including held for sale 1,492 — 1,492 970 (5) 965
Consumer installment loans 14 (1) 13 9 (4) 5
Commercial credit products — (3) (3) — (7) (7)
Other — 1 1 1 (1) —
Total loan receivables 1,506 (3) 1,503 980 (17) 963Change in interest income fromtotal interest-earning assets $ 1,508 $ 42 $ 1,550 $ 1,009 $ (23) $ 986
Interest-bearing liabilities:Interest-bearing deposit accounts $ 140 $ (20) $ 120 $ 131 $ 6 $ 137Borrowings of consolidatedsecuritization entities (22) 51 29 (15) 15 —Bank term loan (129) 24 (105) 56 6 62Senior unsecured notes 74 (1) 73 125 (2) 123Related party debt (4) — (4) (171) 62 (109)Change in interest expense fromtotal interest-bearing liabilities 59 54 113 126 87 213Total change in net interest income $ 1,449 $ (12) $ 1,437 $ 883 $ (110) $ 773
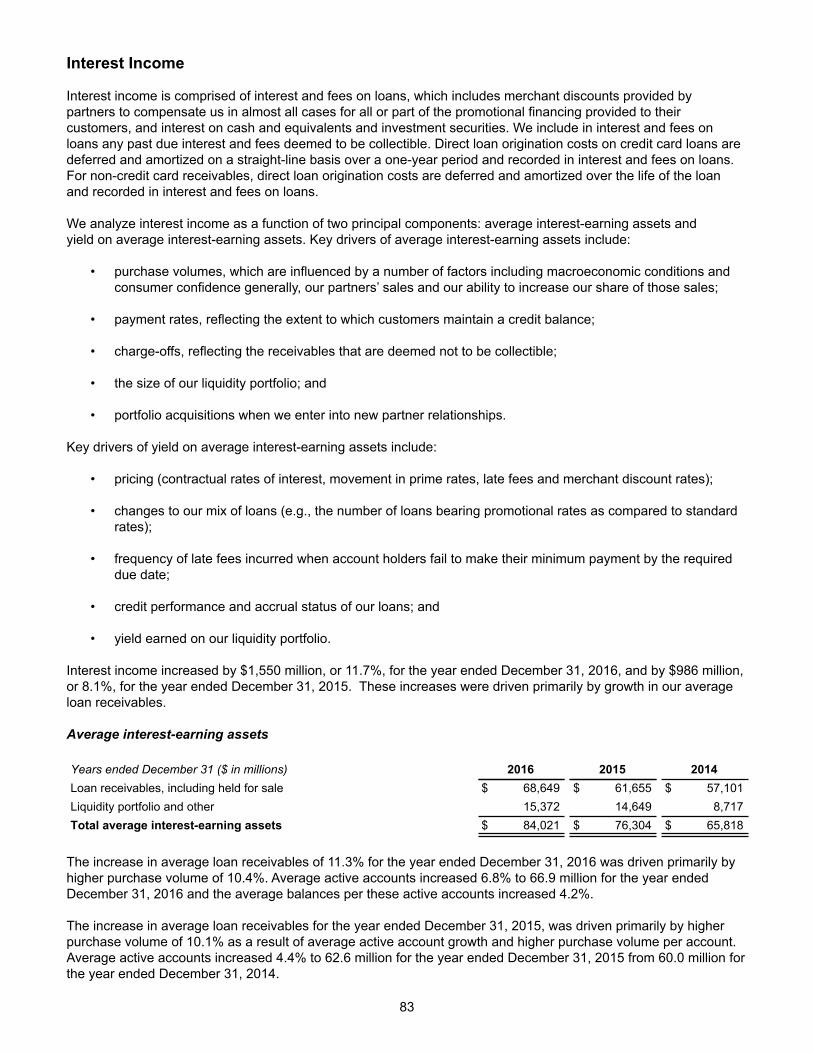
83
Interest Income
Interest income is comprised of interest and fees on loans, which includes merchant discounts provided by partners to compensate us in almost all cases for all or part of the promotional financing provided to their customers, and interest on cash and equivalents and investment securities. We include in interest and fees on loans any past due interest and fees deemed to be collectible. Direct loan origination costs on credit card loans are deferred and amortized on a straight-line basis over a one-year period and recorded in interest and fees on loans. For non-credit card receivables, direct loan origination costs are deferred and amortized over the life of the loan and recorded in interest and fees on loans.
We analyze interest income as a function of two principal components: average interest-earning assets and yield on average interest-earning assets. Key drivers of average interest-earning assets include:
• purchase volumes, which are influenced by a number of factors including macroeconomic conditions and consumer confidence generally, our partners’ sales and our ability to increase our share of those sales;
• payment rates, reflecting the extent to which customers maintain a credit balance;
• charge-offs, reflecting the receivables that are deemed not to be collectible;
• the size of our liquidity portfolio; and
• portfolio acquisitions when we enter into new partner relationships.
Key drivers of yield on average interest-earning assets include:
• pricing (contractual rates of interest, movement in prime rates, late fees and merchant discount rates);
• changes to our mix of loans (e.g., the number of loans bearing promotional rates as compared to standard rates);
• frequency of late fees incurred when account holders fail to make their minimum payment by the required due date;
• credit performance and accrual status of our loans; and
• yield earned on our liquidity portfolio.
Interest income increased by $1,550 million, or 11.7%, for the year ended December 31, 2016, and by $986 million, or 8.1%, for the year ended December 31, 2015. These increases were driven primarily by growth in our average loan receivables.
Average interest-earning assets
Years ended December 31 ($ in millions) 2016 2015 2014Loan receivables, including held for sale $ 68,649 $ 61,655 $ 57,101Liquidity portfolio and other 15,372 14,649 8,717Total average interest-earning assets $ 84,021 $ 76,304 $ 65,818
The increase in average loan receivables of 11.3% for the year ended December 31, 2016 was driven primarily by higher purchase volume of 10.4%. Average active accounts increased 6.8% to 66.9 million for the year ended December 31, 2016 and the average balances per these active accounts increased 4.2%.
The increase in average loan receivables for the year ended December 31, 2015, was driven primarily by higher purchase volume of 10.1% as a result of average active account growth and higher purchase volume per account. Average active accounts increased 4.4% to 62.6 million for the year ended December 31, 2015 from 60.0 million for the year ended December 31, 2014.

84
Yield on average interest-earning assets
The yield on interest-earning assets increased for the year ended December 31, 2016 primarily due to an increase in the percentage of interest-earning assets attributable to loan receivables. The yield on our average loan receivables remained relatively flat at 21.39% for the year ended December 31, 2016, as slightly lower payment rates were offset by growth in promotional balances.
The decrease in yield on interest-earning assets for the year ended December 31, 2015 was driven primarily by growth in our liquidity portfolio, which is comprised primarily of cash and equivalents and obligations of the U.S. Treasury that mature in less than twelve months, which results in a significantly lower yield than our loan receivables. The yield on our average loan receivables decreased to 21.38% for the year ended December 31, 2015 from 21.39% for the year ended December 31, 2014, reflecting the impact of slightly higher payment rates from our customers and growth in promotional balances.
Interest Expense
Interest expense is incurred on our interest-bearing liabilities, which consisted of interest-bearing deposit accounts, borrowings of consolidated securitization entities, senior unsecured notes and the Bank Term Loan.
Key drivers of interest expense include:
• the amounts outstanding of our deposits and borrowings;
• the interest rate environment and its effect on interest rates paid on our funding sources; and
• the changing mix in our funding sources.
Interest expense increased by $113 million, or 10.0%, for the year ended December 31, 2016, driven primarily by the growth in our deposit liabilities. Our cost of funds increased to 1.85% for the year ended December 31, 2016 compared to 1.83% for the year ended December 31, 2015, primarily due to higher short-term benchmark rates.
Interest expense increased by $213 million, or 23.1%, for the year ended December 31, 2015, driven primarily by increases in average interest-bearing liabilities of $7,481 million, or 13.7% and an increase of 14 basis points in our cost of funds arising from the changes in our funding mix. Our cost of funds increased to 1.83% for the year ended December 31, 2015 from 1.69% for the year ended December 31, 2014.
Average interest-bearing liabilities
Years ended December 31 ($ in millions) 2016 2015 2014Interest-bearing deposit accounts $ 47,194 $ 38,060 $ 30,017Borrowings of consolidated securitization entities 12,428 13,760 14,820Third-party debt 7,714 10,160 4,413Related party debt — 86 5,335Total average interest-bearing liabilities $ 67,336 $ 62,066 $ 54,585
The increase in average interest-bearing liabilities for the year ended December 31, 2016 was driven primarily by growth in our direct deposits partially offset by the repayment of third-party debt and lower securitized financings.
The increase in average interest-bearing liabilities for the year ended December 31, 2015 was driven primarily by growth in our direct deposits and the issuance of third-party debt to replace our related party funding from GECC.
Net Interest Income
Net interest income represents the difference between interest income and interest expense.
Net interest income increased by $1,437 million, or 11.9%, for the year ended December 31, 2016, primarily driven by higher average loan receivables.

85
Net interest income increased by $773 million, or 6.8%, for the year ended December 31, 2015, driven by higher average loan receivables, partially offset by increased interest expense driven by higher liquidity, funding mix and growth.
Retailer Share Arrangements
Most of our Retail Card program agreements and certain other program agreements contain retailer share arrangements that provide for payments to our partners if the economic performance of the program exceeds a contractually defined threshold. We also provide other economic benefits to our partners such as royalties on purchase volume or payments for new accounts, in some cases instead of retailer share arrangements (for example, on our co-branded credit cards). All of these arrangements are designed to align our interests and provide an additional incentive to our partners to promote our credit products. Although the retailer share arrangements vary by partner, these arrangements are generally structured to measure the economic performance of the program, based typically on agreed upon program revenues (including interest income and certain other income) less agreed upon program expenses (including interest expense, provision for loan losses, retailer payments and operating expenses), and share portions of this amount above a negotiated threshold. The threshold and economic performance of a program that are used to calculate payments to our partners may be based on, among other things, agreed upon measures of program expenses rather than our actual expenses, and therefore increases in our actual expenses (such as funding costs or operating expenses) may not necessarily result in reduced payments under our retailer share arrangements. These arrangements are typically designed to permit us to achieve an economic return before we are required to make payments to our partners based on the agreed contractually defined threshold. Our payments to partners pursuant to these retailer share arrangements have increased in recent years (both in absolute terms and as a proportion of interest income), partially as a result of the growth of our receivables related to programs with retailer share arrangements and improvements in the credit performance of these receivables. In addition, we have made changes to the terms of certain program agreements that have been renegotiated in the past few years that have contributed to the increase in payments to partners pursuant to retailer share arrangements.
We believe that our retailer share arrangements have been effective in helping us to grow our business by aligning our partners’ interests with ours. We also believe that changes to the terms of certain program agreements that have contributed to the increase in our retailer share arrangement payments will help us to grow our business by providing an additional incentive to the relevant partners to promote our credit products going forward. Payments to partners pursuant to these retailer share arrangements would generally decrease, and mitigate the impact on our profitability, in the event of declines in the performance of the programs or the occurrence of other unfavorable developments that impact the calculation of payments to our partners pursuant to our retailer share arrangements.
Retailer share arrangements increased by $164 million, or 6.0%, for the year ended December 31, 2016, driven primarily by the growth and improved performance of the programs in which we have retailer share arrangements, partially offset by higher provision for loan losses and loyalty costs associated with these programs.
Retailer share arrangements increased by $163 million, or 6.3%, for the year ended December 31, 2015, driven primarily by the growth and improved performance of the programs in which we have retailer share arrangements, partially offset with increased other expense and loyalty costs associated with these programs.
Provision for Loan Losses
Provision for loan losses is the expense related to maintaining the allowance for loan losses at an appropriate level to absorb the estimated probable losses inherent in the loan portfolio at each period end date. Provision for loan losses in each period is a function of net charge-offs (gross charge-offs net of recoveries) and the required level of the allowance for loan losses. Our process to determine our allowance for loan losses is based upon our estimate of the incurred loss period for each type of loss (i.e., aged, fraud, deceased, settlement, other non-aged and bankruptcy). See “Critical Accounting Estimates - Allowance for Loan Losses” and Note 2. Basis of Presentation and Summary of Significant Accounting Policies to our consolidated and combined financial statements for additional information on our allowance for loan loss methodology.

86
Provision for loan losses increased by $1,034 million, or 35.0%, for the year ended December 31, 2016 primarily due to a higher loan loss reserve build and receivables growth. The reserve build resulted from increases in our future expected losses in the next twelve months which were primarily driven by the factors discussed in "Business Trends and Conditions - Stable Asset Quality" above.
Our allowance coverage ratio increased to 5.69% at December 31, 2016, as compared to 5.12% at December 31, 2015, reflecting the increase in forecasted losses inherent in our loan portfolio.
Provision for loan losses increased by $35 million, or 1.2%, for the year ended December 31, 2015 primarily due to portfolio growth, partially offset by improving asset quality trends. Our allowance coverage ratio decreased to 5.12% at December 31, 2015, as compared to 5.28% at December 31, 2014, reflecting improvements in our asset quality trends.
Other Income
Years ended December 31 ($ in millions) 2016 2015 2014Interchange revenue $ 602 $ 505 $ 389Debt cancellation fees 262 249 275Loyalty programs (547) (419) (281)Other 27 57 102Total other income $ 344 $ 392 $ 485
Interchange revenue
We earn interchange fees on Dual Card and other co-branded credit card transactions outside of our partners’ sales channels, based on a flat fee plus a percent of the purchase amount. We also process general purpose card transactions for some Payment Solutions and CareCredit partners as their acquiring bank, for which we obtain an interchange fee. Growth in interchange revenue has been, and is expected to continue to be, driven primarily by growth in our Dual Card and general purpose co-branded credit card products.
Interchange revenue increased by $97 million, or 19.2%, for the year ended December 31, 2016, and by $116 million, or 29.8%, for the year ended December 31, 2015, driven by increases in purchase volume outside of our retail partners' sales channels.
Debt cancellation fees
Debt cancellation fees relate to payment protection products purchased by our credit card customers. Customers who choose to purchase these products are charged a monthly fee based on their account balance. In return, we will cancel all or a portion of a customer’s credit card balance in the event of certain qualifying life events. We offer our debt cancellation product to our credit card customers online and, on a limited basis, by direct mail. We no longer offer this product via phone calls to our customer service department.
Debt cancellation fees increased by $13 million, or 5.2%, for the year ended December 31, 2016, primarily as a result of changes in marketing to our CareCredit customers, driving an increase in enrollment and billed balances. Debt cancellation fees decreased by $26 million, or 9.5%, for the year ended December 31, 2015, due to the fact that we now only offer the product through our on-line channel, resulting in fewer customers being enrolled in the product.
Loyalty programs
We operate a number of loyalty programs in our Retail Card platform that are designed to generate incremental purchase volume per customer, while reinforcing the value of the card and strengthening cardholder loyalty. These programs typically provide cardholders with rewards in the form of merchandise discounts that are earned by achieving a pre-set spending level on their private label credit card, Dual Card or general purpose co-branded credit card. Other programs provide cash back or rewards points, which are redeemable for a variety of products or awards. Growth in loyalty program payments has been, and is expected to continue to be, driven by growth in purchase volume related to existing loyalty programs and the rollout of new loyalty programs.

87
Loyalty programs cost increased by $128 million, or 30.5%, for the year ended December 31, 2016, and by $138 million, or 49.1%, for the year ended December 31, 2015, arising from the launch of new rewards programs with our partners and growth in purchase volume associated with existing loyalty programs.
Other
Other includes a variety of items including ancillary fees and investment gains/losses.
Other decreased by $30 million, or 52.6%, for the year ended December 31, 2016, and decreased by $45 million, or 44.1%, for the year ended December 31, 2015. The decrease in both years was primarily due to a pre-tax gain of $20 million associated with the sale of certain loan portfolios in 2015 and a larger gain recorded in connection with portfolio sales in 2014.
Other Expense
Years ended December 31 ($ in millions) 2016 2015 2014Employee costs $ 1,207 $ 1,042 $ 866Professional fees 638 645 563Marketing and business development 423 433 460Information processing 338 297 212Other 810 847 826Total other expense $ 3,416 $ 3,264 $ 2,927
Employee costs
Employee costs primarily consist of employee compensation and benefit costs.
Employee costs increased by $165 million, or 15.8%, for the year ended December 31, 2016, and by $176 million, or 20.3%, for the year ended December 31, 2015, primarily due to new employees added to support the continued growth of the business and replacement of certain services provided by GE and third parties.
Professional fees
Professional fees consist primarily of outsourced provider fees (e.g., collection agencies and call centers), legal, accounting, consulting, and recruiting expenses.
Professional fees decreased by $7 million, or 1.1%, for the year ended December 31, 2016 primarily due to a reduction in costs associated with the Separation, partially offset by business growth.
Professional fees increased by $82 million, or 14.6%, for the year ended December 31, 2015. These expense increases were due to business growth, the Separation and higher third-party costs related to the EMV card rollout for active Dual Card accounts.
Marketing and business development
Marketing and business development costs consist primarily of our contractual and discretionary marketing and business development spend, as well as amortization expense associated with retail partner contract acquisitions and extensions.
Marketing and business development costs decreased by $10 million, or 2.3%, for the year ended December 31, 2016, primarily by redirecting marketing funds into our partners' loyalty programs and reduced marketing on retail deposits.
Marketing and business development costs decreased by $27 million, or 5.9%, for the year ended December 31, 2015, primarily due to lower portfolio marketing investments and lower brand advertising.

88
Information processing
Information processing costs primarily consist of fees related to outsourced information processing providers, credit card associations and software licensing agreements.
Information processing costs increased by $41 million, or 13.8%, for the year ended December 31, 2016 and by $85 million, or 40.1%, for the year ended December 31, 2015, primarily due to higher information technology investment and higher transaction volume.
Other
Other primarily consists of postage, fraud expense, litigation and regulatory matters expense and various other corporate overhead items such as facilities leases and maintenance, leased equipment and telephone charges. Postage is driven primarily by the number of our active accounts and the percentage of customers that utilize our electronic billing option. Fraud is driven primarily by the number of our active Dual Card and general purpose co-branded credit card accounts.
The “other” component decreased for the year ended December 31, 2016 primarily driven by lower payments to GE due to the replacement of certain services that were previously provided to us under the Transition Services Agreement, as well as benefits from the rollout of EMV cards.
The “other” component increased for the year ended December 31, 2015 primarily due to investments in growth, infrastructure build in preparation for separation from GE, higher fraud expense, and also included expenses related to the completion of the EMV card rollout for active Dual Card accounts. These increases were largely offset by the impact of corporate overhead allocations no longer being billed to us by GE following our IPO.
Provision for Income Taxes
Years ended December 31 ($ in millions) 2016 2015 2014Effective tax rate 36.9% 37.3% 37.7%Provision for income taxes $ 1,319 $ 1,317 $ 1,277
We now file consolidated U.S. federal and state income tax returns separate and apart from GE. For periods up to and including the date of Separation, we were included in the consolidated U.S. federal and state income tax returns of GE, where applicable, but also filed certain separate state and foreign income tax returns. The tax provision is presented on a separate company basis as if we were a separate filer for tax purposes for all periods presented. The effects of tax adjustments and settlements from taxing authorities are presented in our consolidated and combined financial statements in the period in which they occur. Our current obligations for taxes are settled with the relevant tax authority, or GE, as applicable, on an estimated basis and adjusted in later periods as appropriate and are reflected in our consolidated and combined financial statements in the periods in which those settlements occur. We recognize the current and deferred tax consequences of all transactions that have been recognized in the financial statements using the provisions of the enacted tax laws. See “Critical Accounting Estimates—Income Taxes” for a discussion of the significant judgments and estimates related to income taxes.
The effective tax rates for each of the years ended December 31, 2016 and 2015 decreased slightly compared to the corresponding prior year period. The decrease in 2016 was primarily due to the discrete impact of a change in the effective state tax rate, research and development credits and an additional tax benefit that is reimbursed to GE under the terms of the TSSA. The decrease in 2015 was primarily due to a reduction in certain non-deductible expenses and tax reserves for uncertain income tax positions, partially offset by increases in current state tax rates, and a non-recurring tax expense incurred in the prior year related to an internal corporate reorganization. In each year, the effective tax rate differs from the U.S. federal statutory tax rate of 35.0%, primarily due to state income taxes.

89
Platform Analysis
As discussed above under “—Our Sales Platforms,” we offer our products through three sales platforms (Retail Card, Payment Solutions and CareCredit), which management measures based on their revenue-generating activities. The following is a discussion of certain supplemental information for the year ended December 31, 2016, for each of our sales platforms.
Retail Card
Years ended December 31 ($ in millions) 2016 2015 2014Purchase volume $ 101,242 $ 92,190 $ 83,591
Period-end loan receivables $ 52,701 $ 47,412 $ 42,308
Average loan receivables, including held for sale $ 46,963 $ 42,327 $ 39,278
Average active accounts (in thousands) 53,344 50,358 48,599
Interest and fees on loans $ 10,898 $ 9,774 $ 9,040
Retailer share arrangements $ (2,870) $ (2,688) $ (2,530)
Other income $ 288 $ 339 $ 407
Retail Card interest and fees on loans increased by $1,124 million, or 11.5%, for the year ended December 31, 2016 and by $734 million, or 8.1%, for the year ended December 31, 2015. These increases were primarily the result of increases in average loan receivables.
Retailer share arrangements increased by $182 million, or 6.8%, for the year ended December 31, 2016 and by $158 million, or 6.2%, for the year ended December 31, 2015, primarily as a result of the factors discussed under the heading “Retailer Share Arrangements” above.
Other income decreased by $51 million, or 15.0%, for the year ended December 31, 2016 and decreased by $68 million, or 16.7%, for the year ended December 31, 2015. The decreases were primarily a result of the factors discussed under the heading “Other Income” above.
Payment Solutions
Years ended December 31 ($ in millions) 2016 2015 2014Purchase volume $ 15,641 $ 13,668 $ 12,447
Period-end loan receivables $ 15,567 $ 13,543 $ 12,095
Average loan receivables $ 14,110 $ 12,364 $ 11,171
Average active accounts (in thousands) 8,410 7,478 6,869
Interest and fees on loans $ 1,952 $ 1,719 $ 1,582
Retailer share arrangements $ (26) $ (45) $ (41)
Other income $ 13 $ 17 $ 32
Payment Solutions interest and fees on loans increased by $233 million, or 13.6%, for the year ended December 31, 2016. The increase was primarily driven by increases in average loan receivables.
Payment Solutions interest and fees on loans increased by $137 million, or 8.7%, for the year ended December 31, 2015. The increase was driven primarily by an increase in average loan receivables, partially offset with a reduction in receivable yield.

90
CareCredit
Years ended December 31 ($ in millions) 2016 2015 2014Purchase volume $ 8,585 $ 7,757 $ 7,111Period-end loan receivables $ 8,069 $ 7,335 $ 6,883Average loan receivables $ 7,576 $ 6,964 $ 6,652Average active accounts (in thousands) 5,174 4,807 4,541
Interest and fees on loans $ 1,832 $ 1,686 $ 1,594Retailer share arrangements $ (6) $ (5) $ (4)Other income $ 43 $ 36 $ 46
CareCredit interest and fees on loans increased by $146 million, or 8.7%, for the year ended December 31, 2016 and by $92 million, or 5.8%, for the year ended December 31, 2015. The increases were primarily driven by increases in average loan receivables.
Investment Securities____________________________________________________________________________________________
The following discussion provides supplemental information regarding our investment securities portfolio. All of our investment securities are classified as available-for-sale at December 31, 2016, 2015 and 2014, and held to meet our liquidity objectives and to comply with the Community Reinvestment Act. Investment securities classified as available-for-sale are reported in our Consolidated Statements of Financial Position at fair value.
The following table sets forth the amortized cost and fair value of our portfolio of investment securities at the dates indicated:
2016 2015 2014
At December 31 ($ in millions)Amortized
CostEstimatedFair Value
AmortizedCost
EstimatedFair Value
AmortizedCost
EstimatedFair Value
Debt:
U.S. government and federal agency $ 3,676 $ 3,676 $ 2,768 $ 2,761 $ 1,252 $ 1,252
State and municipal 47 46 51 49 57 57
Residential mortgage-backed 1,400 1,373 323 317 271 271
U.S. corporate debt — — — — 3 3Equity 15 15 15 15 15 15Total $ 5,138 $ 5,110 $ 3,157 $ 3,142 $ 1,598 $ 1,598
Unrealized gains and losses, net of the related tax effect, on available-for-sale securities that are not other-than-temporarily impaired are excluded from earnings and are reported as a separate component of comprehensive income (loss) until realized. At December 31, 2016, 2015 and 2014, our investment securities had gross unrealized gains of $3 million, $2 million and $4 million, respectively, and gross unrealized losses of $31 million, $17 million and $4 million, respectively.

91
Our investment securities portfolio had the following maturity distribution at December 31, 2016. Equity securities have been excluded from the table because they do not have a maturity.
($ in millions)Due in 1 Year
or Less
Due After 1through5 Years
Due After 5through10 Years
Due After10 years Total
Debt:
U.S. government and federal agency $ 3,476 $ 200 $ — $ — $ 3,676
State and municipal — 1 1 44 46
Residential mortgage-backed — — — 1,373 1,373
Total(1) $ 3,476 $ 201 $ 1 $ 1,417 $ 5,095
Weighted average yield(2) 0.8% 2.0% 4.4% 2.7% 1.4%
______________________
(1) Amounts stated represent estimated fair value.(2) Weighted average yield is calculated based on the amortized cost of each security. In calculating yield, no adjustment has
been made with respect to any tax exempt obligations.
At December 31, 2016, we did not hold investments in any single issuer with an aggregate book value that exceeded 10% of equity, excluding obligations of the U.S. government.
Loan Receivables____________________________________________________________________________________________
The following discussion provides supplemental information regarding our loan receivables portfolio.
Loan receivables are our largest category of assets and represent our primary source of revenues. The following table sets forth the composition of our loan receivables portfolio by product type at the dates indicated.
At December 31 ($ in millions) 2016 (%) 2015 (%) 2014 (%) 2013 (%) 2012 (%)LoansCredit cards $73,580 96.4% $65,773 96.3% $58,880 96.1% $54,958 96.0% $49,572 94.8%Consumer installment loans 1,384 1.8 1,154 1.7 1,063 1.7 965 1.7 1,424 2.7Commercial credit products 1,333 1.7 1,323 1.9 1,320 2.2 1,317 2.3 1,307 2.5Other 40 0.1 40 0.1 23 — 14 — 10 —Total loans $76,337 100.0% $68,290 100.0% $61,286 100.0% $57,254 100.0% $52,313 100.0%
Loan receivables increased by $8,047 million, or 11.8%, at December 31, 2016 and by $7,004 million, or 11.4%, at December 31, 2015, primarily driven by higher purchase volume and average active account growth.

92
Our loan receivables portfolio had the following maturity distribution at December 31, 2016.
($ in millions)Within 1Year(1) 1-5 Years(2) After
5 Years TotalLoansCredit cards $ 73,005 $ 575 $ — $ 73,580
Consumer installment loans 16 681 687 1,384
Commercial credit products 1,330 3 — 1,333
Other 18 6 16 40
Total loans $ 74,369 $ 1,265 $ 703 $ 76,337
Loans due after one year at fixed interest rates N/A $ 1,265 $ 703 $ 1,968
Loans due after one year at variable interest rates N/A — — —
Total loans due after one year N/A $ 1,265 $ 703 $ 1,968
______________________
(1) Credit card loans have minimum payment requirements but no stated maturity and therefore are included in the due within one year category. However, many of our credit card holders will revolve their balances, which may extend their repayment period beyond one year for balances at December 31, 2016.
(2) Credit card and commercial loans due after one year relate to Troubled Debt Restructuring ("TDR") assets
Our loan receivables portfolio had the following geographic concentration at December 31, 2016.
($ in millions) Loan ReceivablesOutstanding
% of Total LoanReceivablesOutstandingState
Texas $ 7,658 10.0%California $ 7,523 9.9%Florida $ 6,153 8.1%New York $ 4,252 5.6%Pennsylvania $ 3,282 4.3%
Impaired Loans and Troubled Debt Restructurings
Our loss mitigation strategy is intended to minimize economic loss and at times can result in rate reductions, principal forgiveness, extensions or other actions, which may cause the related loan to be classified as a Troubled Debt Restructuring (“TDR”) and also be impaired. We primarily use long-term (12 to 60 months) modification programs for borrowers experiencing financial difficulty as a loss mitigation strategy to improve long-term collectability of the loans that are classified as TDRs. The long-term program involves changing the structure of the loan to a fixed payment loan with a maturity no longer than 60 months and reducing the interest rate on the loan. The long-term program does not normally provide for the forgiveness of unpaid principal, but may allow for the reversal of certain unpaid interest or fee assessments. We also make loan modifications for some customers who request financial assistance through external sources, such as a consumer credit counseling agency program. The loans that are modified typically receive a reduced interest rate but continue to be subject to the original minimum payment terms and do not normally include waiver of unpaid principal, interest or fees. The determination of whether these changes to the terms and conditions meet the TDR criteria includes our consideration of all relevant facts and circumstances.
Loans classified as TDRs are recorded at their present value with impairment measured as the difference between the loan balance and the discounted present value of cash flows expected to be collected, discounted at the original effective interest rate of the loan. Our allowance for loan losses on TDRs is generally measured based on the difference between the recorded loan receivable and the present value of the expected future cash flows.
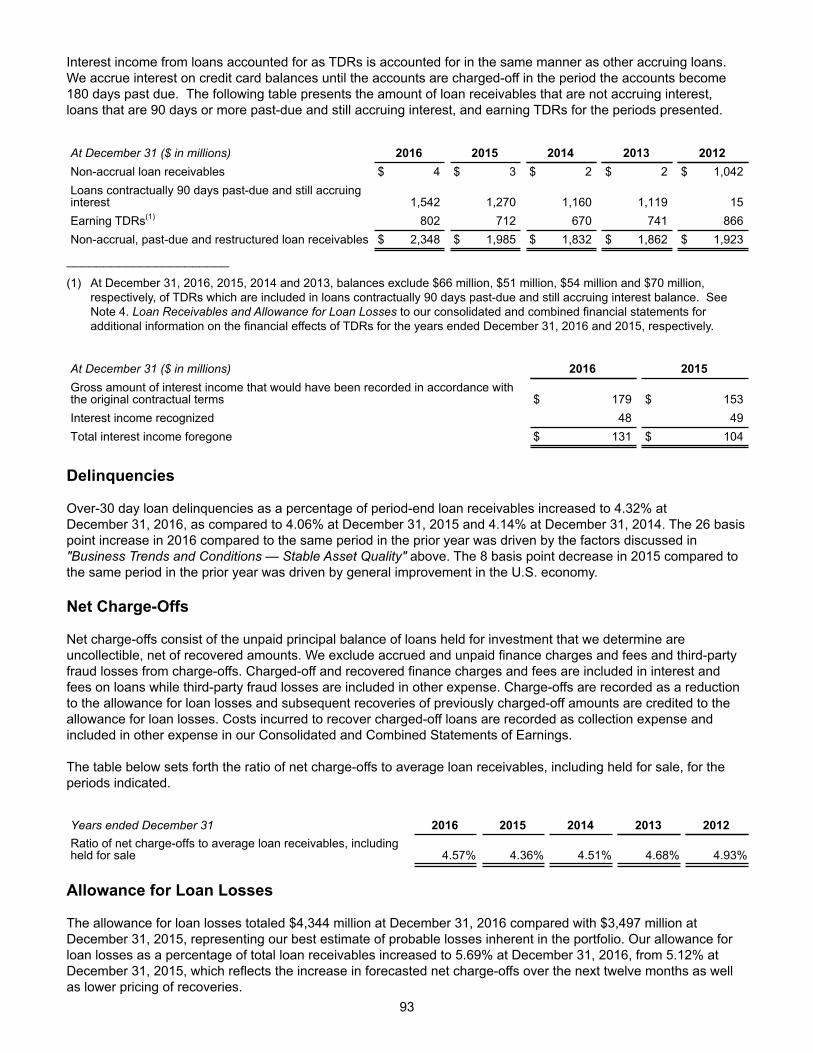
93
Interest income from loans accounted for as TDRs is accounted for in the same manner as other accruing loans. We accrue interest on credit card balances until the accounts are charged-off in the period the accounts become 180 days past due. The following table presents the amount of loan receivables that are not accruing interest, loans that are 90 days or more past-due and still accruing interest, and earning TDRs for the periods presented.
At December 31 ($ in millions) 2016 2015 2014 2013 2012Non-accrual loan receivables $ 4 $ 3 $ 2 $ 2 $ 1,042Loans contractually 90 days past-due and still accruinginterest 1,542 1,270 1,160 1,119 15Earning TDRs(1) 802 712 670 741 866Non-accrual, past-due and restructured loan receivables $ 2,348 $ 1,985 $ 1,832 $ 1,862 $ 1,923
______________________
(1) At December 31, 2016, 2015, 2014 and 2013, balances exclude $66 million, $51 million, $54 million and $70 million, respectively, of TDRs which are included in loans contractually 90 days past-due and still accruing interest balance. See Note 4. Loan Receivables and Allowance for Loan Losses to our consolidated and combined financial statements for additional information on the financial effects of TDRs for the years ended December 31, 2016 and 2015, respectively.
At December 31 ($ in millions) 2016 2015Gross amount of interest income that would have been recorded in accordance withthe original contractual terms $ 179 $ 153Interest income recognized 48 49Total interest income foregone $ 131 $ 104
Delinquencies
Over-30 day loan delinquencies as a percentage of period-end loan receivables increased to 4.32% at December 31, 2016, as compared to 4.06% at December 31, 2015 and 4.14% at December 31, 2014. The 26 basis point increase in 2016 compared to the same period in the prior year was driven by the factors discussed in "Business Trends and Conditions — Stable Asset Quality" above. The 8 basis point decrease in 2015 compared to the same period in the prior year was driven by general improvement in the U.S. economy.
Net Charge-Offs
Net charge-offs consist of the unpaid principal balance of loans held for investment that we determine are uncollectible, net of recovered amounts. We exclude accrued and unpaid finance charges and fees and third-party fraud losses from charge-offs. Charged-off and recovered finance charges and fees are included in interest and fees on loans while third-party fraud losses are included in other expense. Charge-offs are recorded as a reduction to the allowance for loan losses and subsequent recoveries of previously charged-off amounts are credited to the allowance for loan losses. Costs incurred to recover charged-off loans are recorded as collection expense and included in other expense in our Consolidated and Combined Statements of Earnings.
The table below sets forth the ratio of net charge-offs to average loan receivables, including held for sale, for the periods indicated.
Years ended December 31 2016 2015 2014 2013 2012Ratio of net charge-offs to average loan receivables, includingheld for sale 4.57% 4.36% 4.51% 4.68% 4.93%
Allowance for Loan Losses
The allowance for loan losses totaled $4,344 million at December 31, 2016 compared with $3,497 million at December 31, 2015, representing our best estimate of probable losses inherent in the portfolio. Our allowance for loan losses as a percentage of total loan receivables increased to 5.69% at December 31, 2016, from 5.12% at December 31, 2015, which reflects the increase in forecasted net charge-offs over the next twelve months as well as lower pricing of recoveries.

94
The following tables provide changes in our allowance for loan losses for the periods presented:
Balance atJanuary 1,
2016
Provisioncharged tooperations
Gross charge-offs(1) Recoveries(1)
Balance atDecember 31, 2016
($ in millions)
Credit cards $ 3,420 $ 3,898 $ (3,873) $ 809 $ 4,254
Consumer installment loans 26 43 (45) 13 37
Commercial credit products 50 45 (51) 8 52Other 1 — — — 1
Total $ 3,497 $ 3,986 $ (3,969) $ 830 $ 4,344
Balance atJanuary 1,
2015
Provisioncharged tooperations
Gross charge-offs(1) Recoveries(1)
Balance atDecember 31,
2015($ in millions)
Credit cards $ 3,169 $ 2,880 $ (3,289) $ 660 $ 3,420
Consumer installment loans 22 25 (35) 14 26
Commercial credit products 45 46 (47) 6 50Other — 1 — — 1
Total $ 3,236 $ 2,952 $ (3,371) $ 680 $ 3,497
Balance atJanuary 1,
2014
Provisioncharged tooperations
Gross charge-offs(1) Recoveries(1)
Balance atDecember 31,
2014($ in millions)
Credit cards $ 2,827 $ 2,858 $ (3,111) $ 595 $ 3,169
Consumer installment loans 19 20 (30) 13 22
Commercial credit products 46 39 (48) 8 45
Total $ 2,892 $ 2,917 $ (3,189) $ 616 $ 3,236
Balance atJanuary 1,
2013
Provisioncharged tooperations
Gross charge-offs(1) Recoveries(1)
Balance atDecember 31,
2013($ in millions)
Credit cards $ 2,174 $ 2,970 $ (2,847) $ 530 $ 2,827
Consumer installment loans 62 49 (111) 19 19
Commercial credit products 38 53 (53) 8 46
Total $ 2,274 $ 3,072 $ (3,011) $ 557 $ 2,892
Balance atJanuary 1,
2012
Provisioncharged tooperations
Gross charge-offs(1) Recoveries(1)
Balance atDecember 31,
2012($ in millions)
Credit cards $ 1,902 $ 2,438 $ (2,680) $ 514 $ 2,174
Consumer installment loans 113 54 (130) 25 62
Commercial credit products 37 69 (76) 8 38Other — 4 (4) — —
Total $ 2,052 $ 2,565 $ (2,890) $ 547 $ 2,274
______________________

95
(1) Net charge-offs (gross charge-offs less recoveries) in certain portfolios may exceed the beginning allowance for loan losses as our revolving credit portfolios turn over more than once per year or, in all portfolios, can reflect losses that are incurred subsequent to the beginning of the period due to information becoming available during the period, which may identify further deterioration of existing loan receivables.
Funding, Liquidity and Capital Resources____________________________________________________________________________________________
We maintain a strong focus on liquidity and capital. Our funding, liquidity and capital policies are designed to ensure that our business has the liquidity and capital resources to support our daily operations, our business growth, our credit ratings and our regulatory and policy requirements, in a cost effective and prudent manner through expected and unexpected market environments.
Funding Sources
Our primary funding sources include cash from operations, deposits (direct and brokered deposits), securitized financings and third-party debt.
The following table summarizes information concerning our funding sources during the periods indicated:
2016 2015 2014Years ended December 31($ in millions)
AverageBalance %
AverageRate
AverageBalance %
AverageRate
AverageBalance %
AverageRate
Deposits(1) $ 47,194 70.1% 1.5% $ 38,060 61.3% 1.6% $ 30,017 55.0% 1.6%Securitized financings 12,428 18.5 2.0 13,760 22.2 1.6 14,820 27.1 1.5
Senior unsecured notes 7,158 10.6 3.4 4,996 8.1 3.5 1,374 2.5 3.6
Bank term loan 556 0.8 5.6 5,164 8.3 2.6 3,039 5.6 2.4
Related party debt(2) — — — 86 0.1 4.7 5,335 9.8 2.1
Total $ 67,336 100.0% 1.9% $ 62,066 100.0% 1.8% $ 54,585 100.0% 1.7%
______________________
(1) Excludes $205 million, $202 million and $240 million average balance of non-interest-bearing deposits for the years ended December 31, 2016, 2015 and 2014, respectively. Non-interest-bearing deposits comprise less than 10% of total deposits for the years ended December 31, 2016, 2015 and 2014.
(2) Represents borrowings from GECC, which were fully repaid in March 2015.
Deposits
We obtain deposits directly from retail and commercial customers (“direct deposits”) or through third-party brokerage firms that offer our deposits to their customers (“brokered deposits”). At December 31, 2016, we had $37.9 billion in direct deposits (which includes deposits from banks and financial institutions) and $14.2 billion in deposits originated through brokerage firms (including network deposit sweeps procured through a program arranger that channels brokerage account deposits to us). A key part of our liquidity plan and funding strategy is to continue to expand our direct deposits base as a source of stable and diversified low cost funding.
Our direct deposits include a range of FDIC-insured deposit products, including certificates of deposit, IRAs, money market accounts and savings accounts.
Brokered deposits are primarily from retail customers of large brokerage firms. We have relationships with 10 brokers that offer our deposits through their networks. Our brokered deposits consist primarily of certificates of deposit that bear interest at a fixed rate and at December 31, 2016, had a weighted average remaining life of 2.8 years. These deposits generally are not subject to early withdrawal.

96
Our ability to attract deposits is sensitive to, among other things, the interest rates we pay, and therefore, we bear funding risk if we fail to pay higher rates, or interest rate risk if we are required to pay higher rates, to retain existing deposits or attract new deposits. To mitigate these risks, our funding strategy includes a range of deposit products, and we seek to maintain access to multiple other funding sources, including securitized financings (including our undrawn committed capacity) and unsecured debt.
The following table summarizes certain information regarding our interest-bearing deposits by type (all of which constitute U.S. deposits) for the periods indicated.
Years ended December 31($ in millions)
2016 2015 2014AverageBalance
% ofTotal
AverageRate
AverageBalance
% ofTotal
AverageRate
AverageBalance
% ofTotal
AverageRate
Direct deposits:Certificates of deposit(including IRA certificates ofdeposit) $ 19,736 41.8% 1.5% $ 15,563 40.9% 1.4% $ 10,993 36.6% 1.3%Savings accounts (includingmoney market accounts) 14,244 30.2% 1.0 8,781 23.1 1.0 4,365 14.5 0.9Brokered deposits 13,214 28.0% 2.1 13,716 36.0 2.2 14,659 48.9 2.0Total interest-bearingdeposits $ 47,194 100.0% 1.5% $ 38,060 100.0% 1.6% $ 30,017 100.0% 1.6%
Our deposit liabilities provide funding with maturities ranging from one day to ten years. At December 31, 2016, the weighted average maturity of our interest-bearing time deposits was 1.9 years.
The following table summarizes deposits by contractual maturity at December 31, 2016.
($ in millions)3 Months or
Less
Over3 Monthsbut within6 Months
Over6 Monthsbut within12 Months
Over12 Months Total
U.S. deposits (less than $100,000)(1) $ 8,001 $ 1,737 $ 2,976 $ 10,185 $ 22,899U.S. deposits ($100,000 or more)Direct deposits:
Certificates of deposit (including IRAcertificates of deposit) 2,059 2,207 4,112 5,844 14,222Savings accounts (including money marketaccounts) 13,163 — — — 13,163
Brokered deposits:Sweep accounts 1,771 — — — 1,771
Total $ 24,994 $ 3,944 $ 7,088 $ 16,029 $ 52,055
______________________
(1) Includes brokered certificates of deposit for which underlying individual deposit balances are assumed to be less than $100,000.
Securitized Financings
We have been engaged in the securitization of our credit card receivables since 1997. We access the asset-backed securitization market using the Synchrony Credit Card Master Note Trust (“SYNCT”) through which we issue asset-backed securities through both public transactions and private transactions funded by financial institutions and commercial paper conduits. In addition, we issue asset-backed securities in private transactions through the Synchrony Sales Finance Master Trust (“SFT”). During the second quarter of 2016 we repaid all of the remaining outstanding third party indebtedness issued by the Synchrony Receivables Trust (“SRT”), and during the fourth quarter of 2016 we terminated SRT.
At December 31, 2016, we had $3.2 billion of outstanding private asset-backed securities and $9.2 billion of outstanding public asset-backed securities, in each case held by unrelated third parties.

97
The following table summarizes expected contractual maturities of the investors’ interests in securitized financings, excluding debt premiums, discounts and issuance costs at December 31, 2016.
($ in millions)Less ThanOne Year
One YearThrough
ThreeYears
FourYears
ThroughFive
YearsAfter Five
Years TotalScheduled maturities of long-term borrowings—owed to securitization investors:SYNCT(1) $ 2,660 $ 5,059 $ 1,782 $ — $ 9,501SFT 117 2,783 — — 2,900Total long-term borrowings—owed tosecuritization investors $ 2,777 $ 7,842 $ 1,782 $ — $ 12,401
______________________
(1) Excludes subordinated classes of SYNCT notes that we own.
We retain exposure to the performance of trust assets through: (i) in the case of SYNCT and SFT, subordinated retained interests in the receivables transferred to the trust in excess of the principal amount of the notes for a given series to provide credit enhancement for a particular series, as well as a pari passu seller’s interest in each trust and (ii) subordinated classes of SYNCT notes that we own.
All of our securitized financings include early repayment triggers, referred to as early amortization events, including events related to material breaches of representations, warranties or covenants, inability or failure of the Bank to transfer loans to the trusts as required under the securitization documents, failure to make required payments or deposits pursuant to the securitization documents, and certain insolvency-related events with respect to the related securitization depositor, Synchrony (solely with respect to SYNCT) or the Bank. In addition, an early amortization event will occur with respect to a series if the excess spread as it relates to a particular series falls below zero. Following an early amortization event, principal collections on the loans in our trusts are applied to repay principal of the asset-backed securities rather than being available on a revolving basis to fund the origination activities of our business. The occurrence of an early amortization event also would limit or terminate our ability to issue future series out of the trust in which the early amortization event occurred. No early amortization event has occurred with respect to any of the securitized financings in SYNCT or SFT.
The following table summarizes for each of our trusts the three-month rolling average excess spread at December 31, 2016.
Note Principal Balance($ in millions)
# of SeriesOutstanding
Three-Month RollingAverage Excess
Spread(1)
SYNCT(2) $ 10,988 20 ~13.8% to 17.0%
SFT $ 2,900 10 12.4%
______________________
(1) Represents the excess spread (generally calculated as interest income collected from the applicable pool of loan receivables less applicable net charge-offs, interest expense and servicing costs, divided by the aggregate principal amount of loan receivables in the applicable pool) for each trust (or, in the case of SYNCT, represents a range of the excess spreads relating to the particular series issued within the trust), in each case calculated in accordance with the applicable trust or series documentation, for the three securitization monthly periods ending prior to December 31, 2016.
(2) Includes subordinated classes of SYNCT notes that we own.

98
Third-Party Debt
Senior Unsecured Notes
The following table provides a summary of our outstanding senior unsecured notes at December 31, 2016.
($ in millions) MaturityPrincipal Amount
Outstanding(1)
Fixed rate senior unsecured notes:1.875% senior unsecured notes August, 2017 $ 500
2.600% senior unsecured notes January, 2019 1,000
3.000% senior unsecured notes August, 2019 1,100
2.700% senior unsecured notes February, 2020 750
3.750% senior unsecured notes August, 2021 750
4.250% senior unsecured notes August, 2024 1,250
4.500% senior unsecured notes July, 2025 1,0003.700% senior unsecured notes August, 2026 500
Total fixed rate senior unsecured notes $ 6,850
Floating rate senior unsecured notes:Three-month LIBOR plus 1.40% senior unsecured notes November, 2017 $ 700
Three-month LIBOR plus 1.23% senior unsecured notes February, 2020 250
Total floating rate senior unsecured notes $ 950
______________________
(1) The amounts shown exclude unamortized debt discounts, premiums and issuance costs.
At December 31, 2016, the aggregate amount of outstanding senior unsecured notes was $7.8 billion and the weighted average interest rate was 3.26%.
Bank Term Loan
During the year ended December 31, 2016, we prepaid $4.1 billion representing all the remaining outstanding indebtedness under the Bank Term Loan, which had an initial maturity date of August 2019.
Short-Term Borrowings
Except as described above, there were no material short-term borrowings for the periods presented.
Undrawn Credit Facilities
At December 31, 2016, we had an aggregate of $6.2 billion of undrawn committed capacity on our securitized financings, subject to customary borrowing conditions, from private lenders under our two existing securitization programs.
In July 2016, we entered into a three-year unsecured revolving credit facility with private lenders, which provides $0.5 billion of committed capacity. At December 31, 2016, all of the committed capacity under this facility was undrawn, subject to customary borrowing conditions.

99
Other
At December 31, 2016, we had more than $25.0 billion of unencumbered assets in the Bank available to be used to generate additional liquidity through secured borrowings or asset sales or to be pledged to the Federal Reserve Board for credit at the discount window.
Covenants
The indenture pursuant to which our senior unsecured notes have been issued includes various covenants, including covenants that restrict (subject to certain exceptions) Synchrony’s ability to dispose of, or incur liens on, any of the voting stock of the Bank or otherwise permit the Bank to be merged, consolidated, leased or sold in a manner that results in the Bank being less than 80% controlled by us.
If we do not satisfy any of these covenants discussed above, the maturity of amounts outstanding thereunder may be accelerated and become payable. We were in compliance with all of these covenants at December 31, 2016.
Our real estate leases also include various covenants, but typically do not include financial covenants. If we do not satisfy the covenants in the real estate leases, the leases may be terminated and we may be liable for damage claims. At December 31, 2016, we were not in default under any of our credit facilities and had not received any notices of default under any of our real estate leases.
Credit Ratings
Our borrowing costs and capacity in certain funding markets, including securitizations and senior and subordinated debt, may be affected by the credit ratings of the Company, the Bank and the ratings of our asset-backed securities.
Our senior unsecured debt is rated BBB- (stable outlook) by Fitch and BBB- (stable outlook) by S&P. In addition, certain of the asset-backed securities issued by SYNCT are rated by Fitch, S&P and/or Moody’s. A credit rating is not a recommendation to buy, sell or hold securities, may be subject to revision or withdrawal at any time by the assigning rating organization, and each rating should be evaluated independently of any other rating. Downgrades in these credit ratings could materially increase the cost of our funding from, and restrict our access to, the capital markets.
Liquidity____________________________________________________________________________________________
We seek to ensure that we have adequate liquidity to sustain business operations, fund asset growth, satisfy debt obligations and to meet regulatory expectations under normal and stress conditions.
We maintain policies outlining the overall framework and general principles for managing liquidity risk across our business, which is the responsibility of our Asset and Liability Management Committee, a subcommittee of our Risk Committee. We employ a variety of metrics to monitor and manage liquidity. We perform regular liquidity stress testing and contingency planning as part of our liquidity management process. We evaluate a range of stress scenarios including Company specific and systemic events that could impact funding sources and our ability to meet liquidity needs.
We maintain a liquidity portfolio, which at December 31, 2016 had $13.6 billion of liquid assets, primarily consisting of cash and equivalents and short-term obligations of the U.S. Treasury, less cash in transit which is not considered to be liquid, compared to a $14.8 billion of liquid assets at December 31, 2015. The decrease in liquid assets was primarily due to the prepayment of the Bank Term Loan, partially offset by the increase in deposits.
As additional sources of liquidity, at December 31, 2016, we had an aggregate of $6.7 billion of undrawn credit facilities, subject to customary borrowing conditions, from private lenders under our existing securitization programs and an unsecured revolving credit facility, and we had more than $25.0 billion of unencumbered assets in the Bank available to be used to generate additional liquidity through secured borrowings or asset sales or to be pledged to the Federal Reserve Board for credit at the discount window.

100
As a general matter, investments included in our liquidity portfolio are expected to be highly liquid, giving us the ability to readily convert them to cash. The level and composition of our liquidity portfolio may fluctuate based upon the level of expected maturities of our funding sources as well as operational requirements and market conditions.
We rely significantly on dividends and other distributions and payments from the Bank for liquidity; however, bank regulations, contractual restrictions and other factors limit the amount of dividends and other distributions and payments that the Bank may pay to us. For a discussion of regulatory restrictions on the Bank’s ability to pay dividends, see “Item 1A. Risk Factors—Risks Relating to Regulation—We are subject to restrictions that limit our ability to pay dividends and repurchase our common stock; the Bank is subject to restrictions that limit its ability to pay dividends to us, which could limit our ability to pay dividends, repurchase our common stock or make payments on our indebtedness.” and “Regulation—Savings Association Regulation—Dividends and Stock Repurchases.”
Capital____________________________________________________________________________________________
Our primary sources of capital have been earnings generated by our business and existing equity capital. We seek to manage capital to a level and composition sufficient to support the risks of our business, meet regulatory requirements, adhere to rating agency targets and support future business growth. The level, composition and utilization of capital are influenced by changes in the economic environment, strategic initiatives and legislative and regulatory developments. Within these constraints, we are focused on deploying capital in a manner that will provide attractive returns to our stockholders.
Our capital adequacy assessment also includes tax and accounting considerations in accordance with regulatory guidance. We maintain a net deferred tax asset on our balance sheet, and we include this asset when calculating our regulatory capital levels. However, for regulatory capital purposes, deferred tax assets (i) are limited to the amount of taxes previously paid that a company could recover through loss carrybacks; and (ii) 10% of the amount of our Tier 1 capital. At December 31, 2016, no portion of our deferred tax asset was disallowed for regulatory capital purposes.
The Bank is required to conduct stress tests on an annual basis, and as of January 1, 2017, Synchrony is also required to conduct stress tests on an annual basis. Under the OCC's and the Federal Reserve Board's stress test regulations, the Bank and Synchrony are required to use stress-testing methodologies providing for results under various scenarios of economic and financial market stress. In addition, while as a savings and loan holding company we currently are not subject to the Federal Reserve Board's capital planning rule, we prepared and submitted a capital plan to the Federal Reserve Board in April 2016 and commenced such plan in the third quarter of 2016.
Dividend and Share Repurchases
During the year ended December 31, 2016 we declared and paid cash dividends of $0.26 per share of common stock, or $214 million. The declaration and payment of future dividends to holders of our common stock will be at the discretion of the Board and will depend on many factors, including the financial condition, earnings, capital and liquidity requirements of us and the Bank, regulatory restrictions, corporate law and contractual restrictions and other factors that our Board of Directors deems relevant. In addition, banking laws and regulations and our banking regulators may limit our ability to pay dividends and make repurchases of our stock. For a discussion of regulatory restrictions on our and the Bank’s ability to pay dividends and repurchase stock, see “Risk Factors—Risks Relating to Regulation—Synchrony is subject to restrictions that limit its ability to pay dividends and repurchase its common stock; the Bank is subject to restrictions that limit its ability to pay dividends to Synchrony, which could limit Synchrony's ability to pay dividends, repurchase its common stock or make payments on its indebtedness”.
On July 7, 2016, the Company also approved a share repurchase program of up to $952 million for the four quarters ending June 30, 2017. The Company repurchased approximately 16.7 million shares of our common stock for $476 million, at an average price of $28.55. We made and expect to continue to make share repurchases subject to market conditions and other factors, including legal and regulatory restrictions and required approvals.

101
Regulatory Capital Requirements - Synchrony Financial
As a savings and loan holding company, we are required to maintain minimum capital ratios, under the applicable U.S. Basel III capital rules. For more information, see “Regulation—Savings and Loan Holding Company Regulation.”
For Synchrony Financial to be a well-capitalized savings and loan holding company, Synchrony Bank must be well-capitalized and Synchrony Financial must not be subject to any written agreement, order, capital directive, or prompt corrective action directive issued by the Federal Reserve Board to meet and maintain a specific capital level for any capital measure. As of December 31, 2016 and 2015, Synchrony Financial met all the requirements to be deemed well-capitalized.
The following table sets forth at December 31, 2016 and 2015, the composition of our capital ratios for the Company calculated under the Basel III regulatory capital standards, respectively.
Basel III Transition(unless otherwise stated)
At December 31, 2016 At December 31, 2015($ in millions) Amount Ratio(1) Amount RatioTotal risk-based capital $ 14,129 18.5% $ 12,531 18.1%
Tier 1 risk-based capital $ 13,135 17.2% $ 11,633 16.8%
Tier 1 leverage $ 13,135 15.0% $ 11,633 14.4%
Common equity Tier 1 capital $ 13,135 17.2% $ 11,633 16.8%
Common equity Tier 1 capital - fully phased-in (estimated) $ 12,872 17.0% $ 11,234 15.9%
______________________
(1) Tier 1 leverage ratio represents total tier 1 capital as a percentage of total average assets, after certain adjustments. All other ratios presented above represent the applicable capital measure as a percentage of risk-weighted assets.
The increase in our Common equity Tier 1 capital ratio was primarily due to the retention of a majority of our net earnings for the year ended December 31, 2016, partially offset by an increase in risk-weighted assets, as well as dividends and repurchases of our outstanding common stock that were made in 2016. The increase in risk-weighted assets was primarily due to growth in loan receivables.
Non-GAAP Measures
The capital ratios presented above include Common equity Tier 1 capital ("CET1") as calculated under the U.S. Basel III capital rules on a fully phased-in basis, which is not currently required by our regulators to be disclosed and, as such, is considered to be a non-GAAP measure. We believe that this capital ratio is a useful measure to investors because it is widely used by analysts and regulators to assess the capital position of financial services companies, although this ratio may not be comparable to similarly titled measures reported by other companies. The following table sets forth a reconciliation of the components of our CET1 capital ratio as calculated on a fully phased-in basis set forth above, to the comparable GAAP components at December 31, 2016 and 2015.
($ in millions) At December 31, 2016 At December 31, 2015Basel III - Common equity Tier 1 (transition) $ 13,135 $ 11,633
Adjustments related to capital components during transition(1) (263) (399)
Basel III - Common equity Tier 1 (fully phased-in) $ 12,872 $ 11,234
Risk-weighted assets - Basel III (transition) $ 76,179 $ 69,224Adjustments related to risk weighted assets during transition(2) (238) 1,269
Risk-weighted assets - Basel III (fully phased-in) $ 75,941 $ 70,493
______________________

102
(1) Adjustments related to capital components to determine CET1 (fully phased-in) include the phase-in of the intangible asset exclusion.
(2) Key differences between Basel III transition rules and fully phased-in Basel III rules relate to the calculation of risk-weighted assets including, but not limited to, adjustments for certain intangible assets and risk weighting of deferred tax assets.
Regulatory Capital Requirements - Synchrony Bank
At December 31, 2016 and 2015, the Bank met all applicable requirements to be deemed well-capitalized pursuant to OCC regulations and for purposes of the Federal Deposit Insurance Act. The following table sets forth the composition of the Bank’s capital ratios calculated under the Basel III rules at December 31, 2016 and December 31, 2015.
At December 31, 2016 At December 31, 2015
Minimum to be Well-Capitalized under
Prompt Corrective ActionProvisions - Basel III
($ in millions) Amount Ratio Amount Ratio Amount RatioTotal risk-based capital $ 10,101 16.7% $ 8,442 16.6% $ 6,031 10.0%Tier 1 risk-based capital $ 9,312 15.4% $ 7,781 15.3% $ 4,825 8.0%Tier 1 leverage $ 9,312 13.2% $ 7,781 13.1% $ 3,520 5.0%Common equity Tier 1 capital $ 9,312 15.4% $ 7,781 15.3% $ 3,920 6.5%
Failure to meet minimum capital requirements can result in the initiation of certain mandatory and possibly additional discretionary actions by regulators that, if undertaken, could limit our business activities and have a material adverse effect on our business, results of operations and financial condition. See “Risk Factors—Risks Relating to Regulation—Failure by Synchrony and the Bank to meet applicable capital adequacy and liquidity requirements could have a material adverse effect on us.”
Off-Balance Sheet Arrangements and Unfunded Lending Commitments____________________________________________________________________________________________
We do not have any significant off-balance sheet arrangements, including guarantees of third-party obligations. Guarantees are contracts or indemnification agreements that contingently require us to make a guaranteed payment or perform an obligation to a third-party based on certain trigger events. At December 31, 2016, we had not recorded any contingent liabilities in our Consolidated Statements of Financial Position related to any guarantees.
We extend credit, primarily arising from agreements with customers for unused lines of credit on our credit cards, in the ordinary course of business. See Note 4 - Loan Receivables and Allowance for Loan Losses to our consolidated and combined financial statements for more information on our unfunded lending commitments.

103
Contractual Obligations____________________________________________________________________________________________
In the normal course of business, we enter into various contractual obligations that require future cash payments. Our future cash payments associated with our contractual obligations at December 31, 2016 are summarized below.
Payments Due by Period
($ in millions) Total 2017 2018 - 2019 2020 - 20212022 and
ThereafterDeposits(1)(2) $ 52,121 $ 36,028 $ 8,894 $ 5,063 $ 2,136Securitized financings(3) 12,754 2,928 8,013 1,813 —Senior unsecured notes(4) 9,200 1,433 2,535 2,050 3,182Operating leases 235 37 66 54 78Purchase obligations(5) 732 278 253 101 100Total contractual obligations(6)(7) $ 75,042 $ 40,704 $ 19,761 $ 9,081 $ 5,496
______________________
(1) Savings accounts (including money market accounts), brokered network deposits sweeps, and non-interest-bearing deposits are assumed for purposes of this table to be due in 2017 because they may be withdrawn at any time without payment of any penalty.
(2) Deposits do not include interest payments because the amount and timing of these payments cannot be reasonably estimated as certain deposits have early withdrawal rights and also the option to roll interest payments into the balance. The average interest rate on our interest-bearing deposits for the year ended December 31, 2016 was 1.5%. See Note 7. Deposits to our consolidated and combined financial statements.
(3) These amounts shown exclude interest on floating rate securitized borrowings. The weighted average interest rate at December 31, 2016 was 1.79%. See Note 8. Borrowings to our consolidated and combined financial statements.
(4) The amounts shown exclude interest for the floating rate senior unsecured debt as payments of interest on these senior unsecured notes are based on floating rates.
(5) Purchase obligations at December 31, 2016 reflect the minimum purchase obligation under legally binding contracts with contract terms that are both fixed and determinable. These amounts exclude obligations for goods and services that already have been incurred and are reflected on our Consolidated Statement of Financial Position.
(6) The table above does not include estimated payments of liabilities associated with uncertain income tax positions. The inherent complexity and uncertainty around the timing and amount of future outflows for uncertain tax positions do not permit a reasonably reliable estimate of payments, if any, to be made in connection with these liabilities. At December 31, 2016, we had gross unrecognized tax benefits of $150 million, excluding related interest and penalties. See Note 14. Income Taxes to the consolidated and combined financial statements.
(7) The table above excludes our reimbursement obligations to GE for certain retiree benefits obligations of $175 million at December 31, 2016. See Note 11. Employee Benefit Plans to the consolidated and combined financial statements for additional information.
Critical Accounting Estimates____________________________________________________________________________________________
In preparing our consolidated and combined financial statements, we have identified certain accounting estimates and assumptions that we consider to be the most critical to an understanding of our financial statements because they involve significant judgments and uncertainties. The critical accounting estimates we have identified relate to allowance for loan losses, asset impairment, income taxes and fair value measurements. All of these estimates reflect our best judgment about current, and for some estimates future, economic and market conditions and their effects based on information available as of the date of these financial statements. If these conditions change from those expected, it is reasonably possible that these judgments and estimates could change, which may result in incremental losses on loan receivables, future impairments of investment securities, goodwill and intangible assets, and the establishment of valuation allowances on deferred tax assets and increases in our tax liabilities, among other effects. See Note 2. Basis of Presentation and Summary of Significant Accounting Policies to our consolidated and combined financial statements, which discusses the significant accounting policies related to these estimates.

104
Allowance for Loan Losses
Losses on loan receivables are recognized when they are incurred, which requires us to make our best estimate of probable losses inherent in the portfolio. The method for calculating the best estimate of probable losses takes into account our historical experience, adjusted for current conditions with each product and customer type, and our judgment concerning the probable effects of relevant observable data, trends and market factors.
We evaluate each portfolio quarterly. For credit card receivables, our estimation process includes analysis of historical data, and there is a significant amount of judgment applied in selecting inputs and analyzing the results produced by the models to determine the allowance. Our risk process includes standards and policies for reviewing major risk exposures and concentrations, and evaluates relevant data either for individual loans or on a portfolio basis, as appropriate. More specifically, we use a migration analysis to estimate the likelihood that a loan will progress through the various stages of delinquency. The migration analysis considers uncollectible principal, interest and fees reflected in the loan receivables. We use other analyses to estimate losses incurred on non-delinquent accounts. The considerations in these analyses include past performance, risk management techniques applied to various accounts, historical behavior of different account vintages, current economic conditions, recent trends in delinquencies, bankruptcy filings, account collection management, policy changes, account seasoning, loan volume and amounts, payment rates, forecasting uncertainties and a qualitative assessment of the adequacy of the allowance for losses, which compares this allowance for losses to projected net charge-offs over the next 12 months, in a manner consistent with regulatory guidance. We do not evaluate credit card loans for impairment on an individual basis, but instead estimate its allowance for credit card loan losses on a portfolio basis. Further, experience is not available for new portfolios; therefore, while we are developing that experience, we set loss allowances based on our experience with the most closely analogous products in our portfolio. The underlying assumptions, estimates and assessments we use to provide for losses are updated periodically to reflect our view of current conditions and are subject to the regulatory examination process, which can result in changes to our assumptions. Changes in such estimates can significantly affect the allowance and provision for losses. It is possible that we will experience credit losses that are different from our current estimates.
Asset Impairment
Investments
We regularly review investment securities for impairment, using both quantitative and qualitative criteria. For debt securities, if we do not intend to sell the security, and it is not more likely than not that we will be required to sell the security before recovery of our amortized cost, we evaluate other qualitative criteria to determine whether a credit loss exists, such as the financial health of and specific prospects for the issuer, including whether the issuer is in compliance with the terms and covenants of the security. Quantitative criteria include determining whether there has been an adverse change in expected future cash flows. For equity securities, our criteria include the length of time and magnitude of the amount that each security is in an unrealized loss position.
Goodwill and Intangible Assets
We do not amortize goodwill but test it at least annually for impairment at the reporting unit level. A reporting unit is defined under GAAP as the operating segment, or one level below that operating segment (the component level) if discrete financial information is prepared and regularly reviewed by segment management. Our operating segment consists of a single reporting unit, based on the level at which management regularly reviews and measures the business operating results.
Goodwill impairment risk is first assessed under FASB Accounting Standards Update (“ASU”) 2011-08, Intangibles-Goodwill and Other (Topic 350): Testing Goodwill for Impairment by performing a qualitative review of entity-specific, industry, market and general economic factors for our reporting unit. If potential goodwill impairment risk exists that indicates that it is more likely than not that the carrying value of our reporting unit exceeds its fair value, we apply a two-step quantitative test. The first step compares the reporting unit’s estimated fair value with its carrying value. If the carrying value of our reporting unit’s net assets exceeds its fair value, the second step is applied to measure the difference between the carrying value and implied fair value of goodwill. If the carrying value of goodwill exceeds its implied fair value, the goodwill is considered impaired and reduced to its implied fair value. The qualitative assessment for each period presented in the consolidated and combined financial statements was performed without hindsight, assuming only factors and market conditions existing as of those dates, and resulted in no potential goodwill impairment risk for our reporting unit. Consequently, goodwill was not deemed to be impaired for any of the periods presented.

105
Definite-lived intangible assets principally consist of customer-related assets, including contract acquisitions and purchased credit card relationships. These assets are amortized over their estimated useful lives and evaluated for impairment annually or whenever events or changes in circumstances indicate that the carrying amount of these assets may not be recoverable. The evaluation compares the cash inflows expected to be generated from each intangible asset to its carrying value. If cash flows attributable to the intangible asset are less than the carrying value, the asset is considered impaired and written down to its estimated fair value. No impairments of definite-lived intangible assets have been recognized in the periods presented.
Income Taxes
We are subject to income tax in the United States (federal, state and local) as well as other jurisdictions in which we operate. Our provision for income tax expense is based on our income, the statutory tax rates and other provisions of the tax laws applicable to us in each of these various jurisdictions. These laws are complex and their application to our facts is at times open to interpretation. The process of determining our consolidated income tax expense includes significant judgments and estimates, including judgments regarding the interpretation of those laws. Our provision for income taxes and our deferred tax assets and liabilities incorporate those judgments and estimates and reflect management’s best estimate of current and future income taxes to be paid. We review our tax positions quarterly and adjust the balances as new information becomes available.
Deferred tax assets and liabilities relate to temporary differences between the financial reporting and income tax bases of our assets and liabilities, as well as the impact of tax loss carryforwards or carrybacks, and are measured using the enacted income tax laws and rates that will be in effect when such differences are expected to reverse. Deferred tax assets are specific to the jurisdiction in which they arise and are recognized subject to management’s judgment that realization of those assets is more likely than not. In making decisions regarding our ability to realize tax assets, we evaluate all positive and negative evidence, including projected future taxable income, taxable income in carryback periods, expected reversal of deferred tax liabilities and the implementation of available tax planning strategies. These decisions rely heavily on estimates. We use our historical experience and our short and long-range business forecasts to provide insight.
ASC 740, Income Taxes, establishes the framework by which we determine the appropriate level of tax reserves to be maintained for uncertain income tax positions. Applying this framework, we recognize the financial statement impact of uncertain income tax positions when we conclude that it is more likely than not, based on the technical merits of a position, that the position will be sustained upon examination. In certain situations, we establish a liability that represents the difference between a tax position taken (or expected to be taken) on an income tax return and the amount of taxes recognized in our financial statements.
Fair Value Measurements
Assets and liabilities measured at fair value every reporting period include investments in debt and equity securities. Assets that are not measured at fair value every reporting period, but that are subject to fair value measurements in certain circumstances primarily include loans that have been reduced to fair value when they are held for sale, impaired loans that have been reduced based on the fair value of the underlying collateral, cost method and equity method investments that are written down to fair value when they are impaired.
Assets that are written down to fair value when impaired are not subsequently adjusted to fair value unless further impairment occurs. A fair value measurement is determined as the price that we would receive to sell an asset or pay to transfer a liability in an orderly transaction between market participants at the measurement date. In the absence of active markets for the identical assets or liabilities, such measurements involve developing assumptions based on market observable data and, in the absence of such data, internal information that is consistent with what market participants would use in a hypothetical transaction that occurs at the measurement date. The determination of fair value often involves significant judgments about assumptions such as determining an appropriate discount rate that factors in both risk and liquidity premiums, identifying the similarities and differences in market transactions, weighting those differences accordingly and then making the appropriate adjustments to those market transactions to reflect the risks specific to our asset being valued.

106
New Accounting Standards____________________________________________________________________________________________
In May 2014, the Financial Accounting Standards Board (“FASB”) issued Accounting Standards Update (“ASU”) 2014-09, Revenue from Contracts with Customers, which requires an entity to recognize the amount of revenue to which it expects to be entitled for the transfer of promised goods or services to customers. The ASU will replace most existing revenue recognition guidance in U.S. GAAP when it becomes effective. In July 2015, the FASB approved a one-year deferral of this standard, with a revised effective date for fiscal years beginning after December 15, 2017. The scope of ASU 2014-09 excludes interest and fee income on loans and as a result, the majority of the Company's revenue will not be affected by the ASU. We are still evaluating the impact that ASU 2014-09 will have on our consolidated and combined financial statements and related disclosures. The standard permits the use of either the retrospective or modified retrospective (cumulative effect) transition method. We have not yet selected a transition method.
In June 2016, the FASB issued ASU 2016-13, Financial Instruments-Credit Losses: Measurement of Credit Losses on Financial Instruments. This ASU replaces the existing incurred loss impairment guidance with a new impairment model known as the Current Expected Credit Loss ("CECL") model, which is based on expected credit losses. The CECL model requires, upon origination of a loan, the recognition of all expected credit losses over the life of the loan based on historical experience, current conditions and reasonable and supportable forecasts. This standard is effective for annual and interim reporting periods for fiscal years beginning after December 15, 2019, with early adoption permitted for annual and interim periods for fiscal years beginning after December 15, 2018. The amendments in this standard will be recognized through a cumulative-effect adjustment to retained earnings as of the beginning of the first reporting period in which the guidance is effective. While we are evaluating the effect that ASU 2016-13 will have on our consolidated and combined financial statements and related disclosures, this standard is expected to result in an increase to the Company’s allowance for loan losses given the change to expected losses for the estimated life of the financial asset. The extent of the increase will depend on the asset quality of the portfolio, and economic conditions and forecasts at adoption.

107
ITEM 7A. QUANTITATIVE AND QUALITATIVE DISCLOSURES ABOUT MARKET RISK
Quantitative and Qualitative Disclosures About Market Risk____________________________________________________________________________________________
Market risk refers to the risk that a change in the level of one or more market prices, rates, indices, correlations or other market factors will result in losses for a position or portfolio. We are exposed to market risk primarily from changes in interest rates. See “Item 1A. Risk Factors—Risks Relating to Our Business—Changes in market interest rates could have a material adverse effect on our net earnings, funding and liquidity” and “—A reduction in our credit ratings could materially increase the cost of our funding from, and restrict our access to, the capital markets.”
Interest Rate Risk
We borrow money from a variety of depositors and institutions in order to provide loans to our customers. Changes in market interest rates cause our net interest income to increase or decrease, as some of our assets and liabilities carry interest rates that fluctuate with market benchmarks. The interest rate benchmark for our floating rate assets is generally the prime rate, and the interest rate benchmark for our floating rate liabilities is generally either LIBOR or the federal funds rate. The prime rate and the LIBOR or federal funds rate could reset at different times or could diverge, leading to mismatches in the interest rates on our floating rate assets and floating rate liabilities.
Competitive factors and future regulatory reform may limit or restrict our ability to raise interest rates on our loans. In addition, some of our program agreements limit the rate of interest we can charge to customers. If interest rates were to rise materially over a sustained period of time, and we are unable to sufficiently raise our interest rates in a timely manner, our net interest income and margin could be adversely impacted, which could have a material adverse effect on our net earnings.
Interest rates may also adversely impact our customers’ spending levels and ability and willingness to pay outstanding amounts owed to us. Our floating rate products bear interest rates that fluctuate with the prime rate. Higher interest rates often lead to higher payment obligations by customers to us and other lenders under mortgage, credit card and other consumer loans, which may reduce our customers’ ability to remain current on their obligations to us and therefore lead to increased delinquencies, charge-offs and allowances for loan losses, which could have a material adverse effect on our net earnings.
Changes in interest rates and competitor responses to these changes may also impact customer decisions to maintain deposits with us, and reductions in deposits could materially adversely affect our funding costs and liquidity.
At December 31, 2016, 55.6% of our loan receivables were priced at a fixed interest rate to the customer, with the remaining 44.4% at a floating interest rate. We fund our assets with a combination of fixed rate and floating rate funding sources that include deposits, asset-backed securities and unsecured debt. To manage interest rate risk, we seek to match the interest rate repricing characteristics of our assets and liabilities. Historically, we have not used interest rate derivative contracts to manage interest rate risk; however, we may choose to do so in the future. To the extent we are unable to effectively match the interest rate sensitivity of our assets and liabilities, our net earnings could be materially adversely affected.
We assess our interest rate risk by estimating the effect of various interest rate scenarios on our net interest income.
For purposes of presenting the possible earnings effect of a hypothetical, adverse change in interest rates over the 12-month period from our reporting date, we assume that all interest rate sensitive assets and liabilities will be impacted by a hypothetical, immediate 100 basis point increase in interest rates as of the beginning of the period. The sensitivity is based upon the hypothetical assumption that all relevant types of interest rates that affect our results would increase instantaneously, simultaneously and to the same degree.

108
Our interest rate sensitive assets include our variable rate loan receivables and the assets that make up our liquidity portfolio. At December 31, 2016, 44.4% of our receivables were priced at a floating interest rate. Assets with rates that are fixed at period end but which will mature, or otherwise contractually reset to a market-based indexed rate or other fixed rate prior to the end of the 12-month period, are considered to be rate sensitive. The latter category includes certain loans that may be offered at below-market rates for an introductory period, such as balance transfers and special promotional programs, after which the loans will contractually reprice under standard terms in accordance with our normal market-based pricing structure. For purposes of measuring rate sensitivity for such loans, only the effect of the hypothetical 100 basis point change in the underlying market-based indexed rate or other fixed rate has been considered rather than the full change in the rate to which the loan would contractually reprice (i.e. assets are categorized as fixed or floating according to their underlying contractual terms). For assets that have a fixed interest rate at the period end but which contractually will, or are assumed to, reset to a market-based indexed rate or other fixed rate during the next 12 months, net interest income sensitivity is measured from the expected repricing date.
Interest rate sensitive liabilities are assumed to be those for which the stated interest rate is not contractually fixed for the next 12-month period. Thus, liabilities that vary with changes in a market-based index, such as the federal funds rate or LIBOR, which will reset before the end of the 12-month period, or liabilities whose rates are fixed at the period end but which will mature and are assumed to be replaced with a market-based indexed rate prior to the end of the 12-month period, also are considered to be rate sensitive. For these fixed rate liabilities, net interest income sensitivity is measured from the expected repricing date.
Assuming an immediate 100 basis point increase in the interest rates affecting all interest rate sensitive assets and liabilities at December 31, 2016, we estimate that net interest income over the following 12-month period would increase by approximately $113 million.
Limitations of Market Risk Measures
The interest rate risk models that we use in deriving these measures incorporate contractual information, internally-developed assumptions and proprietary modeling methodologies, which project borrower and deposit behavior patterns in certain interest rate environments. Other market inputs, such as interest rates, market prices and interest rate volatility, are also critical components of our interest rate risk measures. We regularly evaluate, update and enhance these assumptions, models and analytical tools as we believe appropriate to reflect our best assessment of the market environment and the expected behavior patterns of our existing assets and liabilities.
There are inherent limitations in any methodology used to estimate the exposure to changes in market interest rates. The sensitivity analysis provided above contemplates only certain movements in interest rates at a particular point in time based on the existing balance sheet. It does not attempt to estimate the effect of a more significant interest rate increase over a sustained period of time, which as described in “—Interest Rate Risk” above, could adversely affect our net interest income. In addition, the strategic actions that management may take to manage our balance sheet may differ from our projections, which could cause our actual net interest income to differ from the above sensitivity analysis.

109
ITEM 8. FINANCIAL STATEMENTS AND SUPPLEMENTARY DATA
Report of Independent Registered Public Accounting Firm____________________________________________________________________________________________
The Board of Directors and StockholdersSynchrony Financial:
We have audited Synchrony Financial’s (the Company) internal control over financial reporting as of December 31, 2016, based on criteria established in Internal Control - Integrated Framework (2013) issued by the Committee of Sponsoring Organizations of the Treadway Commission (COSO). Synchrony Financial’s management is responsible for maintaining effective internal control over financial reporting and for its assessment of the effectiveness of internal control over financial reporting, included in the accompanying Report on Management’s Assessment of Internal Control over Financial Reporting (Item 9A). Our responsibility is to express an opinion on the Company’s internal control over financial reporting based on our audit.
We conducted our audit in accordance with the standards of the Public Company Accounting Oversight Board (United States). Those standards require that we plan and perform the audit to obtain reasonable assurance about whether effective internal control over financial reporting was maintained in all material respects. Our audit included obtaining an understanding of internal control over financial reporting, assessing the risk that a material weakness exists, and testing and evaluating the design and operating effectiveness of internal control based on the assessed risk. Our audit also included performing such other procedures as we considered necessary in the circumstances. We believe that our audit provides a reasonable basis for our opinion.
A company’s internal control over financial reporting is a process designed to provide reasonable assurance regarding the reliability of financial reporting and the preparation of financial statements for external purposes in accordance with generally accepted accounting principles. A company’s internal control over financial reporting includes those policies and procedures that (1) pertain to the maintenance of records that, in reasonable detail, accurately and fairly reflect the transactions and dispositions of the assets of the company; (2) provide reasonable assurance that transactions are recorded as necessary to permit preparation of financial statements in accordance with generally accepted accounting principles, and that receipts and expenditures of the company are being made only in accordance with authorizations of management and directors of the company; and (3) provide reasonable assurance regarding prevention or timely detection of unauthorized acquisition, use, or disposition of the company’s assets that could have a material effect on the financial statements.
Because of its inherent limitations, internal control over financial reporting may not prevent or detect misstatements. Also, projections of any evaluation of effectiveness to future periods are subject to the risk that controls may become inadequate because of changes in conditions, or that the degree of compliance with the policies or procedures may deteriorate.
In our opinion, Synchrony Financial maintained, in all material respects, effective internal control over financial reporting as of December 31, 2016, based on criteria established in Internal Control - Integrated Framework (2013) issued by the Committee of Sponsoring Organizations of the Treadway Commission (COSO).
We also have audited, in accordance with the standards of the Public Company Accounting Oversight Board (United States), the Consolidated Statements of Financial Position of Synchrony Financial and Subsidiaries as of December 31, 2016 and 2015, and the related Consolidated and Combined Statements of Earnings, Comprehensive Income, Changes in Equity, and Cash Flows for each of the years in the three-year period ended December 31, 2016, and our report dated February 23, 2017 expressed an unqualified opinion on those consolidated and combined financial statements.
/s/ KPMG LLP
New York, New YorkFebruary 23, 2017

110
Report of Independent Registered Public Accounting Firm____________________________________________________________________________________________
The Board of Directors and StockholdersSynchrony Financial:
We have audited the accompanying Consolidated Statements of Financial Position of Synchrony Financial and Subsidiaries as of December 31, 2016 and 2015, and the related Consolidated and Combined Statements of Earnings, Comprehensive Income, Changes in Equity, and Cash Flows for each of the years in the period ended December 31, 2016. These consolidated and combined financial statements are the responsibility of the Company’s management. Our responsibility is to express an opinion on these consolidated and combined financial statements based on our audits.
We conducted our audits in accordance with the standards of the Public Company Accounting Oversight Board (United States). Those standards require that we plan and perform the audit to obtain reasonable assurance about whether the financial statements are free of material misstatement. An audit includes examining, on a test basis, evidence supporting the amounts and disclosures in the financial statements. An audit also includes assessing the accounting principles used and significant estimates made by management, as well as evaluating the overall financial statement presentation. We believe that our audits provide a reasonable basis for our opinion.
In our opinion, the consolidated and combined financial statements referred to above present fairly, in all material respects, the financial position of Synchrony Financial and Subsidiaries as of December 31, 2016 and 2015, and the results of its operations and its cash flows for each of the years in the period ended December 31, 2016, in conformity with U.S. generally accepted accounting principles.
We also have audited, in accordance with the standards of the Public Company Accounting Oversight Board (United States), Synchrony Financial’s internal control over financial reporting as of December 31, 2016, based on criteria established in Internal Control - Integrated Framework (2013) issued by the Committee of Sponsoring Organizations of the Treadway Commission (COSO), and our report dated February 23, 2017 expressed an unqualified opinion on the effectiveness of the Company’s internal control over financial reporting.
/s/ KPMG LLP
New York, New York February 23, 2017

111
Synchrony Financial and subsidiariesConsolidated and Combined Statements of Earnings ____________________________________________________________________________________
For the years ended December 31($ in millions, except per share data) 2016 2015 2014Interest income:
Interest and fees on loans (Note 4) $ 14,682 $ 13,179 $ 12,216Interest on investment securities 96 49 26
Total interest income 14,778 13,228 12,242Interest expense:
Interest on deposits 727 607 470Interest on borrowings of consolidated securitization entities 244 215 215Interest on third-party debt 277 309 124Interest on related party debt (Note 15) — 4 113
Total interest expense 1,248 1,135 922Net interest income 13,530 12,093 11,320
Retailer share arrangements (2,902) (2,738) (2,575)Net interest income, after retailer share arrangements 10,628 9,355 8,745
Provision for loan losses (Note 4) 3,986 2,952 2,917Net interest income, after retailer share arrangements andprovision for loan losses 6,642 6,403 5,828
Other income:Interchange revenue 602 505 389Debt cancellation fees 262 249 275Loyalty programs (547) (419) (281)Other 27 57 102
Total other income 344 392 485Other expense:
Employee costs 1,207 1,042 866Professional fees 638 645 563Marketing and business development 423 433 460Information processing 338 297 212Other 810 847 826
Total other expense 3,416 3,264 2,927Earnings before provision for income taxes 3,570 3,531 3,386Provision for income taxes (Note 14) 1,319 1,317 1,277Net earnings $ 2,251 $ 2,214 $ 2,109
Earnings per shareBasic $ 2.71 $ 2.66 $ 2.78Diluted $ 2.71 $ 2.65 $ 2.78
Dividends declared per common share $ 0.26 $ — $ —
See accompanying notes to consolidated and combined financial statements.

112
Synchrony Financial and subsidiariesConsolidated and Combined Statements of Comprehensive Income ____________________________________________________________________________________________
For the years ended December 31 ($ in millions) 2016 2015 2014
Net earnings $ 2,251 $ 2,214 $ 2,109
Other comprehensive income (loss)Investment securities (8) (10) 9Currency translation adjustments (1) (11) (5)Employee benefit plans (3) (10) (1)
Other comprehensive income (loss) (12) (31) 3
Comprehensive income $ 2,239 $ 2,183 $ 2,112
Amounts presented net of taxes.
See accompanying notes to consolidated and combined financial statements.
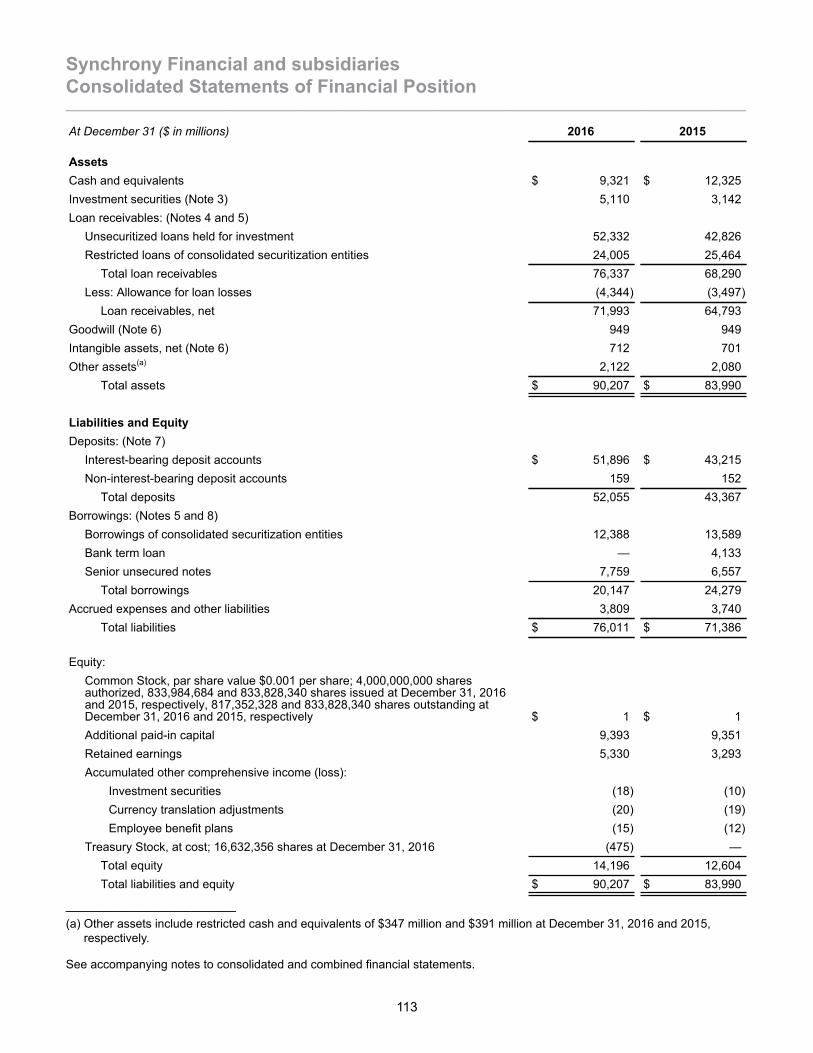
113
Synchrony Financial and subsidiariesConsolidated Statements of Financial Position ____________________________________________________________________________________________
At December 31 ($ in millions) 2016 2015
AssetsCash and equivalents $ 9,321 $ 12,325Investment securities (Note 3) 5,110 3,142Loan receivables: (Notes 4 and 5)
Unsecuritized loans held for investment 52,332 42,826Restricted loans of consolidated securitization entities 24,005 25,464
Total loan receivables 76,337 68,290Less: Allowance for loan losses (4,344) (3,497)
Loan receivables, net 71,993 64,793Goodwill (Note 6) 949 949Intangible assets, net (Note 6) 712 701Other assets(a) 2,122 2,080
Total assets $ 90,207 $ 83,990
Liabilities and EquityDeposits: (Note 7)
Interest-bearing deposit accounts $ 51,896 $ 43,215Non-interest-bearing deposit accounts 159 152
Total deposits 52,055 43,367Borrowings: (Notes 5 and 8)
Borrowings of consolidated securitization entities 12,388 13,589Bank term loan — 4,133Senior unsecured notes 7,759 6,557
Total borrowings 20,147 24,279Accrued expenses and other liabilities 3,809 3,740
Total liabilities $ 76,011 $ 71,386
Equity:Common Stock, par share value $0.001 per share; 4,000,000,000 sharesauthorized, 833,984,684 and 833,828,340 shares issued at December 31, 2016and 2015, respectively, 817,352,328 and 833,828,340 shares outstanding atDecember 31, 2016 and 2015, respectively $ 1 $ 1Additional paid-in capital 9,393 9,351Retained earnings 5,330 3,293Accumulated other comprehensive income (loss):
Investment securities (18) (10)Currency translation adjustments (20) (19)Employee benefit plans (15) (12)
Treasury Stock, at cost; 16,632,356 shares at December 31, 2016 (475) —Total equity 14,196 12,604Total liabilities and equity $ 90,207 $ 83,990
_______________________(a) Other assets include restricted cash and equivalents of $347 million and $391 million at December 31, 2016 and 2015,
respectively.
See accompanying notes to consolidated and combined financial statements.
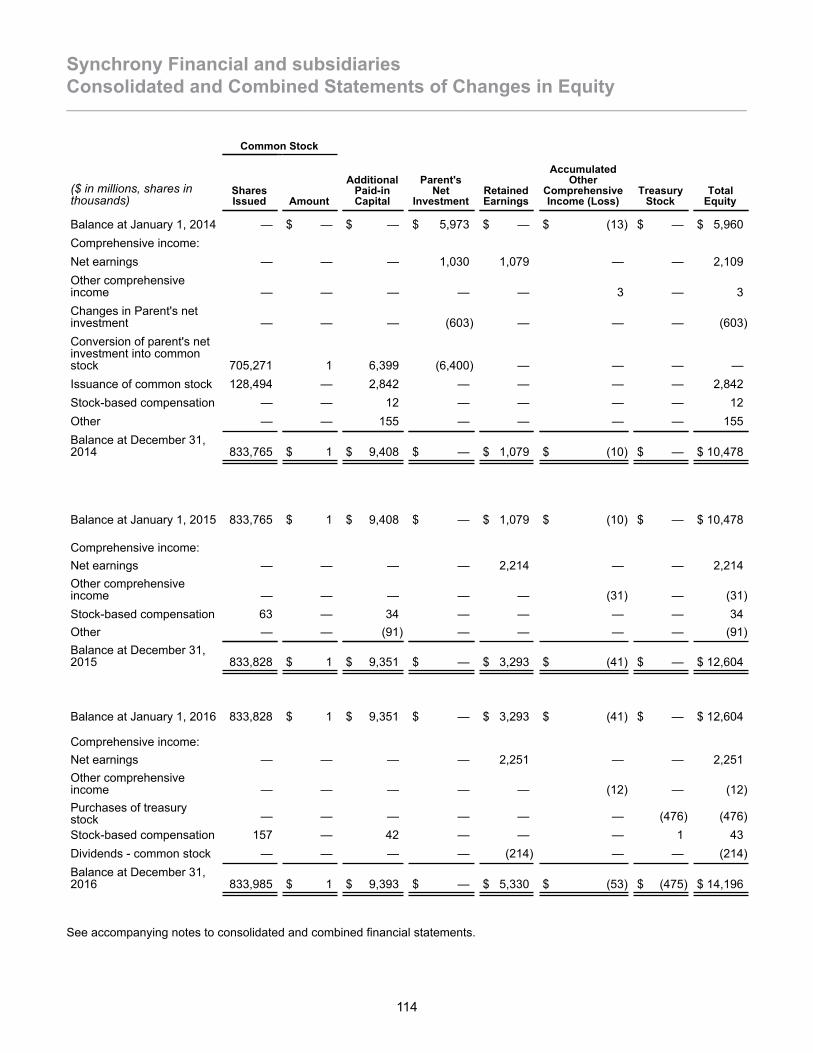
114
Synchrony Financial and subsidiariesConsolidated and Combined Statements of Changes in Equity ____________________________________________________________________________________________
Common Stock
($ in millions, shares inthousands)
SharesIssued Amount
AdditionalPaid-inCapital
Parent'sNet
InvestmentRetainedEarnings
AccumulatedOther
ComprehensiveIncome (Loss)
TreasuryStock
TotalEquity
Balance at January 1, 2014 — $ — $ — $ 5,973 $ — $ (13) $ — $ 5,960Comprehensive income:Net earnings — — — 1,030 1,079 — — 2,109Other comprehensiveincome — — — — — 3 — 3Changes in Parent's netinvestment — — — (603) — — — (603)Conversion of parent's netinvestment into commonstock 705,271 1 6,399 (6,400) — — — —Issuance of common stock 128,494 — 2,842 — — — — 2,842Stock-based compensation — — 12 — — — — 12Other — — 155 — — — — 155Balance at December 31,2014 833,765 $ 1 $ 9,408 $ — $ 1,079 $ (10) $ — $ 10,478
Balance at January 1, 2015 833,765 $ 1 $ 9,408 $ — $ 1,079 $ (10) $ — $ 10,478
Comprehensive income:Net earnings — — — — 2,214 — — 2,214Other comprehensiveincome — — — — — (31) — (31)Stock-based compensation 63 — 34 — — — — 34Other — — (91) — — — — (91)Balance at December 31,2015 833,828 $ 1 $ 9,351 $ — $ 3,293 $ (41) $ — $ 12,604
Balance at January 1, 2016 833,828 $ 1 $ 9,351 $ — $ 3,293 $ (41) $ — $ 12,604
Comprehensive income:Net earnings — — — — 2,251 — — 2,251Other comprehensiveincome — — — — — (12) — (12)Purchases of treasurystock — — — — — — (476) (476)Stock-based compensation 157 — 42 — — — 1 43Dividends - common stock — — — — (214) — — (214)Balance at December 31,2016 833,985 $ 1 $ 9,393 $ — $ 5,330 $ (53) $ (475) $ 14,196
See accompanying notes to consolidated and combined financial statements.

115
Synchrony Financial and subsidiariesConsolidated and Combined Statements of Cash Flows____________________________________________________________________________________________
For the years ended December 31 ($ in millions) 2016 2015 2014Cash flows - operating activitiesNet earnings $ 2,251 $ 2,214 $ 2,109Adjustments to reconcile net earnings to cash provided from operating activities
Provision for loan losses 3,986 2,952 2,917Deferred income taxes 389 (295) (203)Depreciation and amortization 219 174 131(Increase) decrease in interest and fees receivable (429) (163) 68(Increase) decrease in other assets (398) 70 196Increase (decrease) in accrued expenses and other liabilities 280 803 (172)All other operating activities 525 429 294
Cash from operating activities 6,823 6,184 5,340
Cash flows - investing activitiesMaturity and redemption of investment securities 1,380 3,538 27Purchases of investment securities (3,380) (5,102) (1,376)Acquisition of loan receivables (54) (1,051) —Net (increase) decrease in restricted cash and equivalents 44 713 (1,028)Proceeds from sale of loan receivables — 392 1,510Net (increase) decrease in loan receivables (11,092) (8,852) (8,755)All other investing activities (218) (441) (446)Cash (used for) from investing activities (13,320) (10,803) (10,068)
Cash flows - financing activitiesBorrowings of consolidated securitization entities
Proceeds from issuance of securitized debt 3,791 3,868 5,170Maturities and repayment of securitized debt (4,999) (5,244) (5,569)
Third-party debtProceeds from issuance of third-party debt 1,193 2,978 12,276Maturities and repayment of third-party debt (4,151) (4,094) (505)
Related party debtProceeds from borrowings of related party debt — — 1,615Maturities and repayment of related party debt — (655) (10,015)
Net increase (decrease) in deposits 8,354 8,261 9,044Purchases of treasury stock (476) — —Dividends paid on common stock (214) — —Proceeds from initial public offering — — 2,842Net transfers (to) from Parent — — (603)All other financing activities (5) 2 (18)Cash from (used for) financing activities 3,493 5,116 14,237
Increase (decrease) in cash and equivalents (3,004) 497 9,509Cash and equivalents at beginning of year 12,325 11,828 2,319Cash and equivalents at end of year $ 9,321 $ 12,325 $ 11,828
Supplemental disclosure of cash flow informationCash paid during the year for interest $ (1,160) $ (1,040) $ (839)Cash paid during the year for income taxes $ (1,771) $ (1,219) $ (1,787)
See accompanying notes to consolidated and combined financial statements.

116
Synchrony Financial and subsidiariesNotes to Consolidated and Combined Financial Statements ____________________________________________________________________________________________
NOTE 1. BUSINESS DESCRIPTION
Synchrony Financial (the “Company”) provides a range of credit products through programs it has established with a diverse group of national and regional retailers, local merchants, manufacturers, buying groups, industry associations and healthcare service providers. We primarily offer private label, Dual Card and general purpose co-branded credit cards, promotional financing and installment lending, loyalty programs and FDIC-insured savings products through Synchrony Bank (the “Bank”).
References to the “Company,” “we,” “us” and “our” are to Synchrony Financial and its consolidated subsidiaries unless the context otherwise requires.
GE Ownership and Separation
The Company was previously an indirectly wholly-owned subsidiary of General Electric Capital Corporation (“GECC”) until the closing of the initial public offering of our common stock (“IPO”) in 2014, which reduced GECC’s ownership in the Company to approximately 84.6% of our common stock. In November 2015, Synchrony Financial became a stand-alone savings and loan holding company following the completion of GE's exchange offer, in which GE exchanged shares of GE common stock for all of the remaining shares of our common stock it owned (the “Separation”).
NOTE 2. BASIS OF PRESENTATION AND SUMMARY OF SIGNIFICANT ACCOUNTING POLICIES
Basis of Presentation
The accompanying consolidated and combined financial statements were prepared in conformity with U.S. generally accepted accounting principles (“GAAP”).
Preparing financial statements in conformity with U.S. GAAP requires us to make estimates based on assumptions about current, and for some estimates, future, economic and market conditions (for example, unemployment, housing, interest rates and market liquidity) which affect reported amounts and related disclosures in our consolidated and combined financial statements. Although our current estimates contemplate current conditions and how we expect them to change in the future, as appropriate, it is reasonably possible that actual conditions could be different than anticipated in those estimates, which could materially affect our results of operations and financial position. Among other effects, such changes could result in incremental losses on loan receivables, future impairments of investment securities, goodwill and intangible assets, increases in reserves for contingencies, establishment of valuation allowances on deferred tax assets and increases in our tax liabilities.
We conduct our operations within the United States and Canada. Substantially all of our revenues are from U.S. customers. The operating activities conducted by our non-U.S. affiliates use the local currency as their functional currency. The effects of translating the financial statements of these non-U.S. affiliates to U.S. dollars are included in equity. Asset and liability accounts are translated at year-end exchange rates, while revenues and expenses are translated at average rates for the respective periods.
Consolidated Basis of Presentation
The Company’s financial statements have been prepared on a consolidated basis. Under this basis of presentation, our financial statements consolidate all of our subsidiaries – i.e., entities in which we have a controlling financial interest, most often because we hold a majority voting interest.

117
To determine if we hold a controlling financial interest in an entity, we first evaluate if we are required to apply the variable interest entity (“VIE”) model to the entity, otherwise the entity is evaluated under the voting interest model. Where we hold current or potential rights that give us the power to direct the activities of a VIE that most significantly impact the VIE’s economic performance (“power”) combined with a variable interest that gives us the right to receive potentially significant benefits or the obligation to absorb potentially significant losses (“significant economics”), we have a controlling financial interest in that VIE. Rights held by others to remove the party with power over the VIE are not considered unless one party can exercise those rights unilaterally. We consolidate certain securitization entities under the VIE model because we have both power and significant economics. See Note 5. Variable Interest Entities.
Combined Basis of Presentation
For the period prior to June 30, 2014, the Company's financial statements were prepared on a combined basis. The combined financial statements combine all of our subsidiaries and certain accounts of GECC and its subsidiaries that were historically managed as part of our business.
New Accounting Pronouncements
In January 2016, we adopted ASU 2015-03, Interest-Imputation of Interest (Subtopic 835-30): Simplifying the Presentation of Debt Issuance Costs, which requires the presentation of deferred issuance costs related to a recognized debt liability as a direct deduction from the carrying amount of the debt liability. Accordingly, for issuance costs associated with our borrowings and certain brokered deposits, we have revised our presentation of other assets, borrowings and interest-bearing deposit accounts for each period presented to conform to the current period presentation.
In May 2014, the Financial Accounting Standards Board (“FASB”) issued Accounting Standards Update (“ASU”) 2014-09, Revenue from Contracts with Customers, which requires an entity to recognize the amount of revenue to which it expects to be entitled for the transfer of promised goods or services to customers. The ASU will replace most existing revenue recognition guidance in U.S. GAAP when it becomes effective. In July 2015, the FASB approved a one-year deferral of this standard, with a revised effective date for fiscal years beginning after December 15, 2017. The scope of ASU 2014-09 excludes interest and fee income on loans and as a result, the majority of our revenue will not be affected by the ASU. We are still evaluating the impact that ASU 2014-09 will have on our consolidated and combined financial statements and related disclosures. The standard permits the use of either the retrospective or modified retrospective (cumulative effect) transition method. We have not yet selected a transition method.
In June 2016, the FASB issued ASU 2016-13, Financial Instruments-Credit Losses: Measurement of Credit Losses on Financial Instruments. This ASU replaces the existing incurred loss impairment guidance with a new impairment model known as the Current Expected Credit Loss ("CECL") model, which is based on expected credit losses. The CECL model requires, upon origination of a loan, the recognition of all expected credit losses over the life of the loan based on historical experience, current conditions and reasonable and supportable forecasts. This standard is effective for annual and interim reporting periods for fiscal years beginning after December 15, 2019, with early adoption permitted for annual and interim periods for fiscal years beginning after December 15, 2018. The amendments in this standard will be recognized through a cumulative-effect adjustment to retained earnings as of the beginning of the first reporting period in which the guidance is effective. While we are evaluating the effect that ASU 2016-13 will have on our consolidated and combined financial statements and related disclosures, this standard is expected to result in an increase to our allowance for loan losses given the change to expected losses for the estimated life of the financial asset. The extent of the increase will depend on the asset quality of the portfolio, and economic conditions and forecasts at adoption.

118
Segment Reporting
We conduct our operations through a single business segment. Substantially all of our interest and fees on loans and long-lived assets relate to our operations within the United States. Pursuant to Financial Accounting Standards Board (“FASB”) Accounting Standards Codification (“ASC”) 280, Segment Reporting, operating segments represent components of an enterprise for which separate financial information is available that is regularly evaluated by the chief operating decision maker in determining how to allocate resources and in assessing performance. The chief operating decision maker uses a variety of measures to assess the performance of the business as a whole, depending on the nature of the activity. Revenue activities are managed through three sales platforms (Retail Card, Payment Solutions and CareCredit). Those platforms are organized by the types of partners we work with to reach our customers, with success principally measured based on revenues, new accounts and other cardholder sales metrics. Detailed profitability information of the nature that could be used to allocate resources and assess the performance and operations for each sales platform individually, however, is not used by our chief operating decision maker. Expense activities, including funding costs, loan losses and operating expenses, are not measured for each platform but instead are managed for the Company as a whole.
Cash and Equivalents
Debt securities, money market instruments and bank deposits with original maturities of three months or less are included in cash equivalents unless designated as available-for-sale and classified as investment securities. Cash and equivalents at December 31, 2016 included cash and due from banks of $832 million, interest-bearing deposits in other banks of $8.4 billion and other short-term investments of $40 million. Cash and equivalents at December 31, 2015 included cash and due from banks of $1.1 billion, interest-bearing deposits in other banks of $10.7 billion and other short-term investments of $548 million.
Restricted Cash and Equivalents
Restricted cash and equivalents represent cash and equivalents that are not available to us due to restrictions related to its use. For example, the Bank is required to maintain reserves against its deposit liabilities in the form of vault cash and/or balances with the Federal Reserve Bank. In addition, our securitization entities are required to fund segregated accounts that may only be used for certain purposes, including payment of interest and servicing fees and repayment of maturing debt. We include our restricted cash and equivalents in other assets in our Consolidated Statements of Financial Position.
Investment Securities
We report investments in debt and marketable equity securities at fair value. See Note 9. Fair Value Measurements for further information on fair value. Unrealized gains and losses on these investment securities, which are classified as available-for-sale, are included in equity, net of applicable taxes. We regularly review investment securities for impairment using both quantitative and qualitative criteria.
For debt securities, if we do not intend to sell the security, or it is not more likely than not, that we will be required to sell the security before recovery of our amortized cost, we evaluate other qualitative criteria to determine whether we do not expect to recover the amortized cost basis of the security, such as the financial health of, and specific prospects for the issuer, including whether the issuer is in compliance with the terms and covenants of the security. We also evaluate quantitative criteria including determining whether there has been an adverse change in expected future cash flows. If we do not expect to recover the entire amortized cost basis of the security, we consider the security to be other-than-temporarily impaired, and we record the difference between the security’s amortized cost basis and its recoverable amount in earnings and the difference between the security’s recoverable amount and fair value in other comprehensive income. If we intend to sell the security or it is more likely than not we will be required to sell the security before recovery of its amortized cost basis, the security is also considered other-than-temporarily impaired and we recognize the entire difference between the security’s amortized cost basis and its fair value in earnings. For equity securities, we consider the length of time and magnitude of the amount that each security is in an unrealized loss position when assessing whether a decline in fair value below cost is other-than-temporary. If we do not expect to recover the entire amortized cost basis of the security, we consider the security to be other-than-temporarily impaired, and we record the difference between the security’s amortized cost basis and its fair value in earnings.
Realized gains and losses are accounted for on the specific identification method.

119
Loan Receivables
Loan receivables primarily consist of open-end consumer revolving credit card accounts, closed-end consumer installment loans and open-end commercial revolving credit card accounts. Loan receivables are reported at the amounts due from customers, including unpaid interest and fees, deferred income and costs.
Loan Receivables Held for Sale
Loans purchased or originated with the intent to sell or as to which we do not have the ability and intent to hold for the foreseeable future are classified as loan receivables held for sale and recorded at the lower of amortized cost or fair value. We continue to recognize interest and fees on these loans on the accrual basis. The fair value of loan receivables held for sale is determined on an aggregate homogeneous portfolio basis.
If a loan is transferred from held for investment to held for sale, declines in fair value related to credit are recorded as a charge-off, which establishes a new cost basis for the loan. Further declines in fair value and recoveries up to the amortized cost and realized gains or losses are recorded as a component of other income in our Consolidated and Combined Statements of Earnings.
Allowance for Loan Losses
Losses on loan receivables are recognized when they are incurred, which requires us to make our best estimate of probable losses inherent in the portfolio. The method for calculating the best estimate of probable losses takes into account our historical experience, adjusted for current conditions with each product and customer type, and our judgment concerning the probable effects of relevant observable data, trends and market factors.
We evaluate each portfolio for impairment quarterly. For credit card receivables, our estimation process includes analysis of historical data, and there is a significant amount of judgment applied in selecting inputs and analyzing the results produced by the models to determine the allowance. We use a migration analysis to estimate the likelihood that a loan will progress through the various stages of delinquency. The migration analysis considers uncollectible principal, interest and fees reflected in the loan receivables. We use other analyses to estimate losses incurred on non-delinquent accounts. The considerations in these analyses include past performance, risk management techniques applied to various accounts, historical behavior of different account vintages, current economic conditions, recent trends in delinquencies, bankruptcy filings, account collection management, policy changes, account seasoning, loan volume and amounts, payment rates, forecasting uncertainties, and a qualitative assessment of the adequacy of the allowance for losses, which compares this allowance for losses to projected net charge-offs over the next twelve months, in a manner consistent with regulatory guidance. We regularly review our collection experience (including delinquencies and net charge-offs) in determining our allowance for loan losses. We also consider our historical loss experience to date based on actual defaulted loans and overall portfolio indicators including delinquent and non-accrual loans, trends in loan volume and lending terms, credit policies and other observable environmental factors such as unemployment and home price indices.
The underlying assumptions, estimates and assessments we use to provide for losses are updated periodically to reflect our view of current conditions and are subject to the regulatory examination process, which can result in changes to our assumptions. Changes in such estimates can significantly affect the allowance and provision for losses. It is possible that we will experience credit losses that are different from our current estimates. Charge-offs are deducted from the allowance for losses when we judge the principal to be uncollectible, and subsequent recoveries are added to the allowance, generally at the time cash is received on a charged-off account.
Delinquent receivables are those that are 30 days or more past due based on their contractual payments. Non-accrual loan receivables are those on which we have stopped accruing interest. We continue to accrue interest until the earlier of the time at which collection of an account becomes doubtful, or the account becomes 180 days past due, with the exception of non-credit card accounts, for which we stop accruing interest in the period that the account becomes 90 days past due.
Impaired loans represent loans for which it is probable that we will be unable to collect all amounts due, according to the original contractual terms of the loan agreement, and loans meeting the definition of a troubled debt restructuring (“TDR”). TDRs are those loans for which we have granted a concession to a borrower experiencing financial difficulties where we do not receive adequate compensation.

120
The same loan receivable may meet more than one of the definitions above. Accordingly, these categories are not mutually exclusive, and it is possible for a particular loan to meet the definitions of a TDR, impaired loan and non-accrual loan, and be included in each of these categories. The categorization of a particular loan also may not be indicative of the potential for loss.
Loan Modifications and Restructurings
Our loss mitigation strategy is intended to minimize economic loss and, at times, can result in rate reductions, principal forgiveness, extensions or other actions, which may cause the related loan to be classified as a TDR, and also as impaired. We primarily use a long-term (12 to 60 months) modification program for borrowers experiencing financial difficulty as a loss mitigation strategy to improve long-term collectability of the loans that are classified as TDRs. The long-term program involves changing the structure of the loan to a fixed payment loan with a maturity no longer than 60 months, and reducing the interest rate on the loan. The long-term program does not normally provide for the forgiveness of unpaid principal, but may allow for the reversal of certain unpaid interest or fee assessments. We also make loan modifications for customers who request financial assistance through external sources, such as a consumer credit counseling agency program. The loans that are modified typically receive a reduced interest rate, but continue to be subject to the original minimum payment terms, and do not normally include waiver of unpaid principal, interest or fees. The determination of whether these changes to the terms and conditions meet the TDR criteria includes our consideration of all relevant facts and circumstances. See Note 4. Loan Receivables and Allowance for Loan Losses for additional information on our loan modifications and restructurings.
Our allowance for loan losses on TDRs is generally measured based on the difference between the recorded loan receivable and the present value of the expected future cash flows, discounted at the original effective interest rate of the loan. If the loan is collateral dependent, we measure impairment based upon the fair value of the underlying collateral less estimated selling costs.
Data related to redefault experience is also considered in our overall reserve adequacy review. Once the loan has been modified, it returns to current status (re-aged), only after three consecutive minimum monthly payments are received post modification date, subject to a re-aging limitation of once a year, or twice in a five-year period in accordance with the Federal Financial Institutions Examination Council (“FFIEC”) guidelines on Uniform Retail Credit Classification and Account Management policy issued in June 2000. We believe that the allowance for loan losses would not be materially different had we not re-aged these accounts.
Charge-Offs
Net charge-offs consist of the unpaid principal balance of loans held for investment that we determine are uncollectible, net of recovered amounts. We exclude accrued and unpaid finance charges, fees and third-party fraud losses from charge-offs. Charged-off and recovered accrued and unpaid finance charges and fees are included in interest and fees on loans while fraud losses are included in other expense. Charge-offs are recorded as a reduction to the allowance for loan losses, and subsequent recoveries of previously charged-off amounts are credited to the allowance for loan losses. Costs incurred to recover charged-off loans are recorded as collection expense and are included in other expense in our Consolidated and Combined Statements of Earnings.
We charge-off unsecured closed-end consumer installment loans and loans secured by collateral when they are 120 days contractually past due, and unsecured open-ended revolving loans when they are 180 days contractually past due. Unsecured consumer loans in bankruptcy are charged-off within 60 days of notification of filing by the bankruptcy court or within contractual charge-off periods, whichever occurs earlier. Credit card loans of deceased account holders are charged-off within 60 days of receipt of notification.
Goodwill and Intangible Assets
We do not amortize goodwill but test it at least annually for impairment at the reporting unit level pursuant to ASC 350, Intangibles—Goodwill and Other. A reporting unit is defined under GAAP as the operating segment, or one level below that operating segment (the component level) if discrete financial information is prepared and regularly reviewed by segment management. Our single operating segment comprises a single reporting unit, based on the level at which segment management regularly reviews and measures the business operating results.

121
Goodwill impairment risk is first assessed by performing a qualitative review of entity-specific, industry, market and general economic factors for our reporting unit. If potential goodwill impairment risk exists that indicates that it is more likely than not that the carrying value of our reporting unit exceeds its fair value, we apply a two-step quantitative test. The first step compares the reporting unit’s estimated fair value with its carrying value. If the carrying value of our reporting unit’s net assets exceeds its fair value, the second step is applied to measure the difference between the carrying value and implied fair value of goodwill. If the carrying value of goodwill exceeds its implied fair value, the goodwill is considered impaired and reduced to its implied fair value. The qualitative assessment for each period presented in the consolidated and combined financial statements was performed without hindsight, assuming only factors and market conditions existing as of those dates, and resulted in no potential goodwill impairment risk for our reporting unit. Consequently, goodwill was not deemed to be impaired for any of the periods presented.
Definite-lived intangible assets principally consist of customer-related assets including contract acquisition costs and purchased credit card relationships. These assets are amortized over their estimated useful lives and evaluated for impairment annually or whenever events or changes in circumstances indicate that the carrying amount of these assets may not be recoverable. The evaluation compares the cash inflows expected to be generated from each intangible asset to its carrying value. If cash flows attributable to the intangible asset are less than the carrying value, the asset is considered impaired and written down to its estimated fair value. No impairments of definite-lived intangible assets have been recognized in the periods presented in the consolidated and combined financial statements.
Revenue Recognition
Interest and Fees on Loans
We use the effective interest method to recognize income on loans. Interest on loans is comprised largely of interest and late fees on credit card and other loans. Interest income is recognized based upon the amount of loans outstanding and their contractual interest rate. Late fees are recognized when billable to the customer. We continue to accrue interest and fees on credit cards until the accounts are charged-off in the period the account becomes 180 days past due. For non-credit card loans, we stop accruing interest and fees when the account becomes 90 days past due. Previously recognized interest income that was accrued but not collected from the customer is reversed. Although we stop accruing interest in advance of payments, we recognize interest income as cash is collected when appropriate, provided the amount does not exceed that which would have been earned at the historical effective interest rate; otherwise, payments received are applied to reduce the principal balance of the loan.
We resume accruing interest on non-credit card loans when the customer’s account is less than 90 days past due and collection of such amounts is probable. Interest accruals on modified loans that are not considered to be TDRs may return to current status (re-aged) only after receipt of at least three consecutive minimum monthly payments subject to a re-aging limitation of once a year, or twice in a five-year period.
Direct loan origination costs on credit card loans are deferred and amortized on a straight-line basis over a one-year period, or the life of the loan for other loan receivables, and are included in interest and fees on loans in our Consolidated and Combined Statements of Earnings. See Note 4. Loan Receivables and Allowance for Loan Losses for further detail.
Other loan fees including miscellaneous fees charged to borrowers are recognized net of waivers and charge-offs when the related transaction or service is provided, and are included in other income in our Consolidated and Combined Statements of Earnings.

122
Promotional Financing
Loans originated with promotional financing may include deferred interest financing (interest accrues during a promotional period and becomes payable if the full purchase amount is not paid off during the promotional period), no interest financing (no interest accrues during a promotional period but begins to accrue thereafter on any outstanding amounts at the end of the promotional period) and reduced interest financing (interest accrues monthly at a promotional interest rate during the promotional period). For deferred interest financing, we bill interest to the borrower, retroactive to the inception of the loan, if the loan is not repaid prior to the specified date. Income is recognized on such loans when it is billable. In almost all cases, our retail partner will pay an upfront fee or reimburse us to compensate us for all or part of the costs associated with providing the promotional financing. Upfront fees are deferred and accreted to income over the promotional period. Reimbursements are estimated and accrued as income over the promotional period.
Purchased Loans
Loans acquired by purchase are recorded at fair value, which incorporates our estimate at the acquisition date of the credit losses over the remaining life of the acquired loans. As a result, the allowance for losses is not carried over at acquisition. For loans acquired with evidence of credit deterioration, the excess of cash flows expected at acquisition over the initial acquisition cost is recognized into interest income over their estimated remaining lives using the effective interest method. Subsequent decreases to the expected cash flows for these loans require us to evaluate the need for an allowance for credit losses. Subsequent improvements in expected cash flows are recognized into interest income prospectively. For other acquired loans, the excess of contractually required cash flows over the initial acquisition cost is recognized into interest income over the remaining lives using the effective interest method. Subsequent increases in incurred losses for these loans require us to evaluate the need for an allowance for credit losses. Our evaluation of the amount of future cash flows expected to be collected is performed in a similar manner as that used to determine our allowance for loan losses.
Retailer Share Arrangements
Most of our Retail Card program agreements and certain other program agreements contain retailer share arrangements that provide for payments to our partners if the economic performance of the program exceeds a contractually defined threshold. We also provide other economic benefits to our partners such as royalties on purchase volume or payments for new accounts, in some cases instead of retailer share arrangements (for example, on our co-branded credit cards). Although the share arrangements vary by partner, these arrangements are generally structured to measure the economic performance of the program, based typically on agreed upon program revenues (including interest income and certain other income) less agreed upon program expenses (including interest expense, provision for credit losses, retailer payments and operating expenses), and share portions of this amount above a negotiated threshold. These thresholds and the economic performance of a program are based on, among other things, agreed upon measures of program expenses. On a quarterly basis, we make a judgment as to whether it is probable that the performance threshold will be met under a particular retail partner’s retailer share arrangement. The current period’s estimated contribution to that ultimate expected payment is recorded as a liability. To the extent facts and circumstances change and the cumulative probable payment for prior months has changed, a cumulative adjustment is made to align the retailer share arrangement liability balance with the amount considered probable of being paid relating to past periods.
Loyalty Programs
Our loyalty programs are designed to generate increased purchase volume per customer while reinforcing the value of our credit cards and strengthening cardholder loyalty. These programs typically provide cardholders with rewards in the form of merchandise discounts that are earned by achieving a pre-set spending level on their private label credit card, Dual Card or general purpose co-branded credit card. Other programs provide cash back or reward points, which are redeemable for a variety of products or awards. These programs are primarily in our Retail Card platform. We establish a rewards liability based on points and merchandise discounts earned that are ultimately expected to be redeemed and the average cost per point at redemption. The rewards liability is included in accrued expenses and other liabilities in our Consolidated Statements of Financial Position. Cash rebates are earned based on a tiered percentage of purchase volume. As points and discounts are redeemed or cash rebates are issued, the rewards liability is relieved. The estimated cost of loyalty programs is classified as a reduction to other income in our Consolidated and Combined Statements of Earnings.

123
Fraud Losses
We experience third-party fraud losses from the unauthorized use of credit cards and when loans are obtained through fraudulent means. Fraud losses are included as a charge within other expense in our Consolidated and Combined Statements of Earnings, net of recoveries, when such losses are probable. Loans are charged off, as applicable, after the investigation period has completed.
Income Taxes
We now file consolidated U.S. federal and state income tax returns separate and apart from GE. For periods up to and including the date of Separation, we were included in the consolidated U.S. federal and state income tax returns of GE, where applicable, but also filed certain separate state and foreign income tax returns. The tax provision is presented on a separate company basis as if we were a separate filer for tax purposes for all periods presented. The effects of tax adjustments and settlements from taxing authorities are presented in our consolidated and combined financial statements in the period in which they occur. Our current obligations for taxes are settled with the relevant tax authority, or GE, as applicable, on an estimated basis and adjusted in later periods as appropriate and are reflected in our consolidated and combined financial statements in the periods in which those settlements occur. We recognize the current and deferred tax consequences of all transactions that have been recognized in the financial statements using the provisions of the enacted tax laws. Deferred tax assets and liabilities are determined based on differences between the financial reporting and tax basis of assets and liabilities and are measured using the enacted tax laws and rates that will be in effect when the differences are expected to reverse. We record valuation allowances to reduce deferred tax assets to the amount that is more likely than not to be realized. We recognize accrued interest and penalties related to unrecognized tax benefits as interest expense and provision for income taxes, respectively.
Fair Value Measurements
Fair value is the price we would receive to sell an asset or pay to transfer a liability in an orderly transaction with a market participant at the measurement date. In the absence of active markets for the identical assets or liabilities, such measurements involve developing assumptions based on market observable data and, in the absence of such data, internal information that is consistent with what market participants would use in a hypothetical transaction that occurs at the measurement date.
Observable inputs reflect market data obtained from independent sources, while unobservable inputs reflect our market assumptions. Preference is given to observable inputs. These two types of inputs create the following fair value hierarchy:
Level 1— Quoted prices for identical instruments in active markets.
Level 2— Quoted prices for similar instruments in active markets; quoted prices for identical or similar instruments in markets that are not active; and model-derived valuations whose inputs are observable or whose significant value drivers are observable.
Level 3— Significant inputs to the valuation are unobservable.
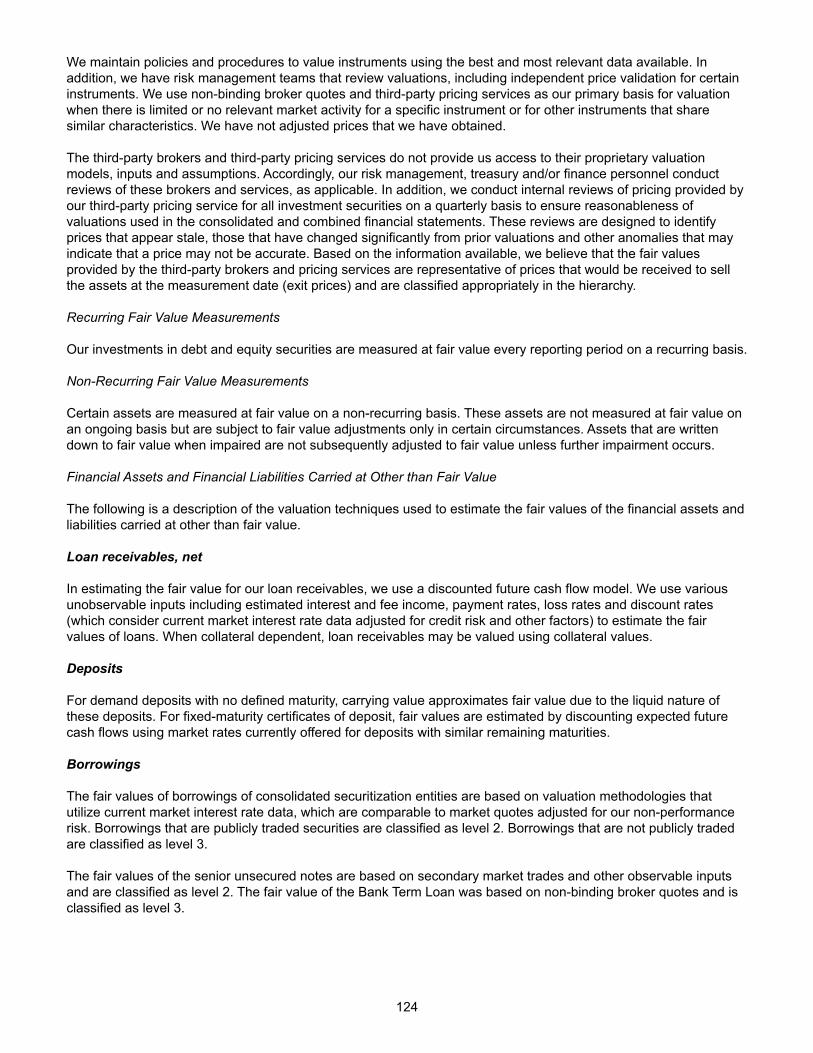
124
We maintain policies and procedures to value instruments using the best and most relevant data available. In addition, we have risk management teams that review valuations, including independent price validation for certain instruments. We use non-binding broker quotes and third-party pricing services as our primary basis for valuation when there is limited or no relevant market activity for a specific instrument or for other instruments that share similar characteristics. We have not adjusted prices that we have obtained.
The third-party brokers and third-party pricing services do not provide us access to their proprietary valuation models, inputs and assumptions. Accordingly, our risk management, treasury and/or finance personnel conduct reviews of these brokers and services, as applicable. In addition, we conduct internal reviews of pricing provided by our third-party pricing service for all investment securities on a quarterly basis to ensure reasonableness of valuations used in the consolidated and combined financial statements. These reviews are designed to identify prices that appear stale, those that have changed significantly from prior valuations and other anomalies that may indicate that a price may not be accurate. Based on the information available, we believe that the fair values provided by the third-party brokers and pricing services are representative of prices that would be received to sell the assets at the measurement date (exit prices) and are classified appropriately in the hierarchy.
Recurring Fair Value Measurements
Our investments in debt and equity securities are measured at fair value every reporting period on a recurring basis.
Non-Recurring Fair Value Measurements
Certain assets are measured at fair value on a non-recurring basis. These assets are not measured at fair value on an ongoing basis but are subject to fair value adjustments only in certain circumstances. Assets that are written down to fair value when impaired are not subsequently adjusted to fair value unless further impairment occurs.
Financial Assets and Financial Liabilities Carried at Other than Fair Value
The following is a description of the valuation techniques used to estimate the fair values of the financial assets and liabilities carried at other than fair value.
Loan receivables, net
In estimating the fair value for our loan receivables, we use a discounted future cash flow model. We use various unobservable inputs including estimated interest and fee income, payment rates, loss rates and discount rates (which consider current market interest rate data adjusted for credit risk and other factors) to estimate the fair values of loans. When collateral dependent, loan receivables may be valued using collateral values.
Deposits
For demand deposits with no defined maturity, carrying value approximates fair value due to the liquid nature of these deposits. For fixed-maturity certificates of deposit, fair values are estimated by discounting expected future cash flows using market rates currently offered for deposits with similar remaining maturities.
Borrowings
The fair values of borrowings of consolidated securitization entities are based on valuation methodologies that utilize current market interest rate data, which are comparable to market quotes adjusted for our non-performance risk. Borrowings that are publicly traded securities are classified as level 2. Borrowings that are not publicly traded are classified as level 3.
The fair values of the senior unsecured notes are based on secondary market trades and other observable inputs and are classified as level 2. The fair value of the Bank Term Loan was based on non-binding broker quotes and is classified as level 3.

125
NOTE 3. INVESTMENT SECURITIES All of our debt investment securities are classified as available-for-sale and are held to meet our liquidity objectives or to comply with the Community Reinvestment Act. Our investment securities consist of the following:
December 31, 2016 December 31, 2015Gross Gross Gross Gross
Amortized unrealized unrealized Estimated Amortized unrealized unrealized Estimated ($ in millions) cost gains losses fair value cost gains losses fair valueDebt
U.S. government andfederal agency $ 3,676 $ 1 $ (1) $ 3,676 $ 2,768 $ — $ (7) $ 2,761State and municipal 47 — (1) 46 51 1 (3) 49Residential mortgage-backed(a) 1,400 2 (29) 1,373 323 1 (7) 317
Equity 15 — — 15 15 — — 15Total $ 5,138 $ 3 $ (31) $ 5,110 $ 3,157 $ 2 $ (17) $ 3,142
_______________________
(a) All of our residential mortgage-backed securities have been issued by government-sponsored entities and are collateralized by U.S. mortgages. At December 31, 2016 and 2015, $363 million and $317 million, respectively, are pledged by the Bank as collateral to the Federal Reserve to secure Federal Reserve Discount Window advances.
The following table presents the estimated fair values and gross unrealized losses of our investment securities:
In loss position forLess than 12 months 12 months or more
Gross GrossEstimated unrealized Estimated unrealized
($ in millions) fair value losses fair value losses
At December 31, 2016Debt
U.S. government and federal agency $ 1,701 $ (1) $ — $ —State and municipal 35 (1) 4 —Residential mortgage-backed 1,235 (28) 35 (1)
Equity 14 — 1 —Total $ 2,985 $ (30) $ 40 $ (1)
At December 31, 2015Debt
U.S. government and federal agency $ 2,611 $ (7) $ — $ —State and municipal 40 (3) — —Residential mortgage-backed 175 (3) 91 (4)
Equity 1 — — —Total $ 2,827 $ (13) $ 91 $ (4)
We regularly review investment securities for impairment using both qualitative and quantitative criteria. We presently do not intend to sell our debt securities that are in an unrealized loss position and believe that it is not more likely than not that we will be required to sell these securities before recovery of our amortized cost. There were no other-than-temporary impairments recognized for the years ended December 31, 2016, 2015 and 2014.
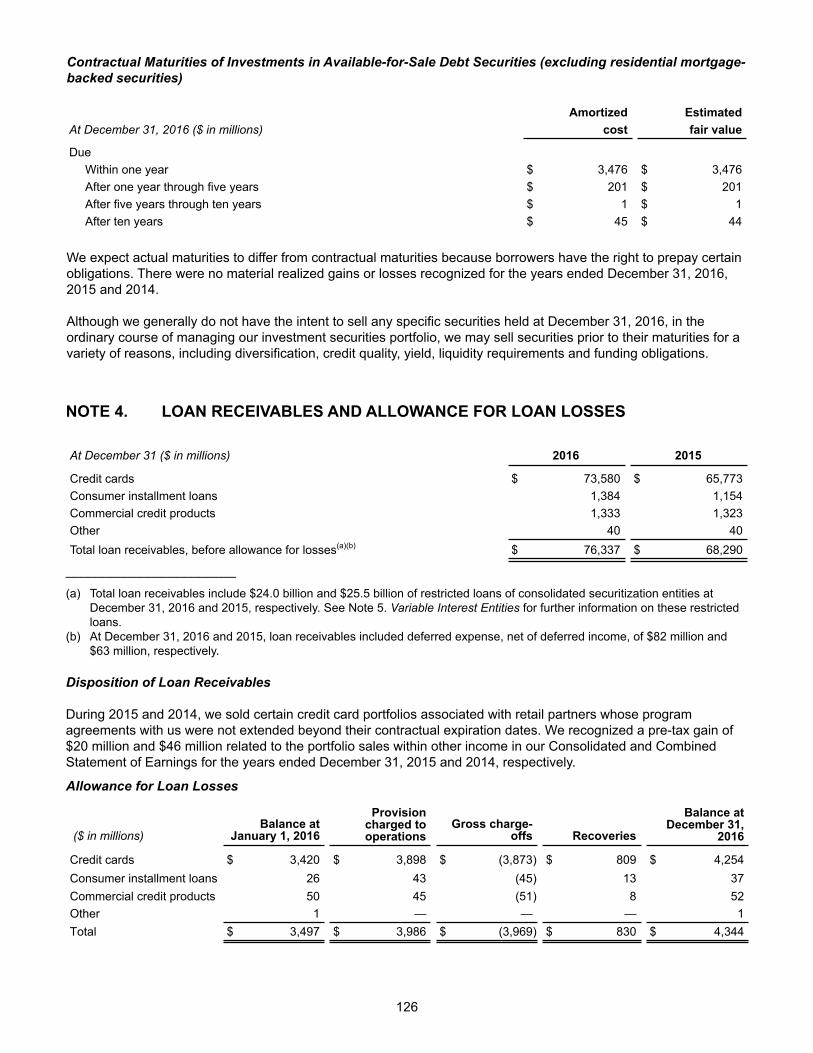
126
Contractual Maturities of Investments in Available-for-Sale Debt Securities (excluding residential mortgage-backed securities)
Amortized EstimatedAt December 31, 2016 ($ in millions) cost fair value
DueWithin one year $ 3,476 $ 3,476After one year through five years $ 201 $ 201After five years through ten years $ 1 $ 1After ten years $ 45 $ 44
We expect actual maturities to differ from contractual maturities because borrowers have the right to prepay certain obligations. There were no material realized gains or losses recognized for the years ended December 31, 2016, 2015 and 2014.
Although we generally do not have the intent to sell any specific securities held at December 31, 2016, in the ordinary course of managing our investment securities portfolio, we may sell securities prior to their maturities for a variety of reasons, including diversification, credit quality, yield, liquidity requirements and funding obligations.
NOTE 4. LOAN RECEIVABLES AND ALLOWANCE FOR LOAN LOSSES
At December 31 ($ in millions) 2016 2015
Credit cards $ 73,580 $ 65,773Consumer installment loans 1,384 1,154Commercial credit products 1,333 1,323Other 40 40Total loan receivables, before allowance for losses(a)(b) $ 76,337 $ 68,290
_______________________
(a) Total loan receivables include $24.0 billion and $25.5 billion of restricted loans of consolidated securitization entities at December 31, 2016 and 2015, respectively. See Note 5. Variable Interest Entities for further information on these restricted loans.
(b) At December 31, 2016 and 2015, loan receivables included deferred expense, net of deferred income, of $82 million and $63 million, respectively.
Disposition of Loan Receivables
During 2015 and 2014, we sold certain credit card portfolios associated with retail partners whose program agreements with us were not extended beyond their contractual expiration dates. We recognized a pre-tax gain of $20 million and $46 million related to the portfolio sales within other income in our Consolidated and Combined Statement of Earnings for the years ended December 31, 2015 and 2014, respectively.
Allowance for Loan Losses
($ in millions)Balance at
January 1, 2016
Provision charged to operations
Gross charge-offs Recoveries
Balance at December 31,
2016
Credit cards $ 3,420 $ 3,898 $ (3,873) $ 809 $ 4,254Consumer installment loans 26 43 (45) 13 37Commercial credit products 50 45 (51) 8 52Other 1 — — — 1Total $ 3,497 $ 3,986 $ (3,969) $ 830 $ 4,344
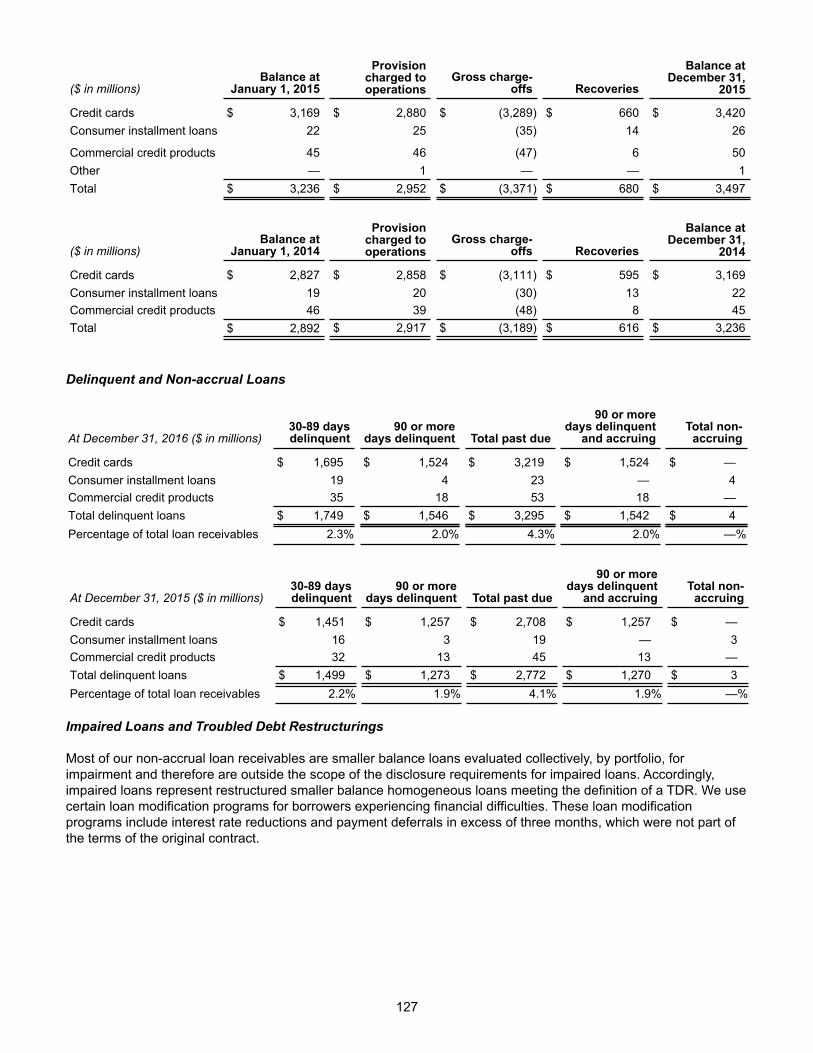
127
($ in millions)Balance at
January 1, 2015
Provision charged to operations
Gross charge-offs Recoveries
Balance at December 31,
2015
Credit cards $ 3,169 $ 2,880 $ (3,289) $ 660 $ 3,420Consumer installment loans 22 25 (35) 14 26
Commercial credit products 45 46 (47) 6 50Other — 1 — — 1Total $ 3,236 $ 2,952 $ (3,371) $ 680 $ 3,497
($ in millions)Balance at
January 1, 2014
Provision charged to operations
Gross charge-offs Recoveries
Balance at December 31,
2014
Credit cards $ 2,827 $ 2,858 $ (3,111) $ 595 $ 3,169Consumer installment loans 19 20 (30) 13 22Commercial credit products 46 39 (48) 8 45Total $ 2,892 $ 2,917 $ (3,189) $ 616 $ 3,236
Delinquent and Non-accrual Loans
At December 31, 2016 ($ in millions)30-89 days delinquent
90 or more days delinquent Total past due
90 or more days delinquent
and accruingTotal non-
accruing
Credit cards $ 1,695 $ 1,524 $ 3,219 $ 1,524 $ —Consumer installment loans 19 4 23 — 4Commercial credit products 35 18 53 18 —Total delinquent loans $ 1,749 $ 1,546 $ 3,295 $ 1,542 $ 4Percentage of total loan receivables 2.3% 2.0% 4.3% 2.0% —%
At December 31, 2015 ($ in millions)30-89 days delinquent
90 or more days delinquent Total past due
90 or more days delinquent
and accruingTotal non-
accruing
Credit cards $ 1,451 $ 1,257 $ 2,708 $ 1,257 $ —Consumer installment loans 16 3 19 — 3Commercial credit products 32 13 45 13 —Total delinquent loans $ 1,499 $ 1,273 $ 2,772 $ 1,270 $ 3Percentage of total loan receivables 2.2% 1.9% 4.1% 1.9% —%
Impaired Loans and Troubled Debt Restructurings
Most of our non-accrual loan receivables are smaller balance loans evaluated collectively, by portfolio, for impairment and therefore are outside the scope of the disclosure requirements for impaired loans. Accordingly, impaired loans represent restructured smaller balance homogeneous loans meeting the definition of a TDR. We use certain loan modification programs for borrowers experiencing financial difficulties. These loan modification programs include interest rate reductions and payment deferrals in excess of three months, which were not part of the terms of the original contract.
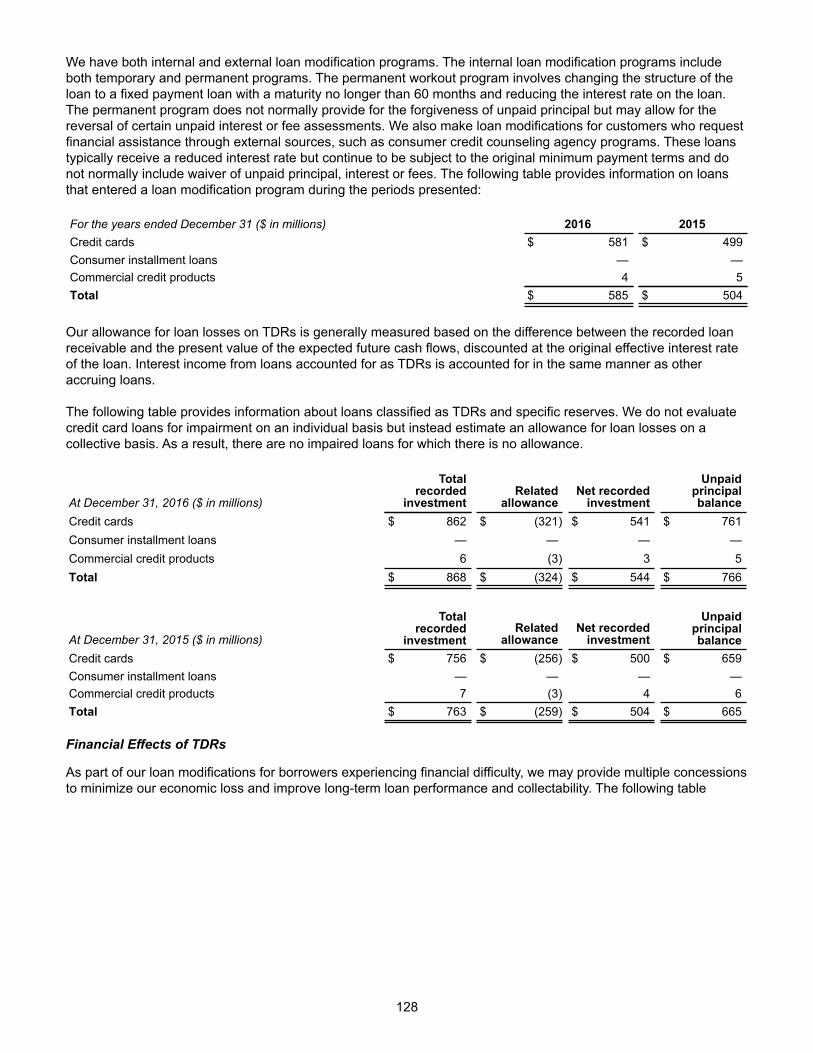
128
We have both internal and external loan modification programs. The internal loan modification programs include both temporary and permanent programs. The permanent workout program involves changing the structure of the loan to a fixed payment loan with a maturity no longer than 60 months and reducing the interest rate on the loan. The permanent program does not normally provide for the forgiveness of unpaid principal but may allow for the reversal of certain unpaid interest or fee assessments. We also make loan modifications for customers who request financial assistance through external sources, such as consumer credit counseling agency programs. These loans typically receive a reduced interest rate but continue to be subject to the original minimum payment terms and do not normally include waiver of unpaid principal, interest or fees. The following table provides information on loans that entered a loan modification program during the periods presented:
For the years ended December 31 ($ in millions) 2016 2015Credit cards $ 581 $ 499Consumer installment loans — —Commercial credit products 4 5Total $ 585 $ 504
Our allowance for loan losses on TDRs is generally measured based on the difference between the recorded loan receivable and the present value of the expected future cash flows, discounted at the original effective interest rate of the loan. Interest income from loans accounted for as TDRs is accounted for in the same manner as other accruing loans.
The following table provides information about loans classified as TDRs and specific reserves. We do not evaluate credit card loans for impairment on an individual basis but instead estimate an allowance for loan losses on a collective basis. As a result, there are no impaired loans for which there is no allowance.
At December 31, 2016 ($ in millions)
Total recorded
investmentRelated
allowanceNet recorded
investment
Unpaidprincipalbalance
Credit cards $ 862 $ (321) $ 541 $ 761Consumer installment loans — — — —Commercial credit products 6 (3) 3 5Total $ 868 $ (324) $ 544 $ 766
At December 31, 2015 ($ in millions)
Total recorded
investmentRelated
allowanceNet recorded
investment
Unpaidprincipalbalance
Credit cards $ 756 $ (256) $ 500 $ 659Consumer installment loans — — — —Commercial credit products 7 (3) 4 6Total $ 763 $ (259) $ 504 $ 665
Financial Effects of TDRs
As part of our loan modifications for borrowers experiencing financial difficulty, we may provide multiple concessions to minimize our economic loss and improve long-term loan performance and collectability. The following table

129
presents the types and financial effects of loans modified and accounted for as TDRs during the periods presented:
Years ended December 31, 2016 2015 2014
($ in millions)
Interestincome
recognizedduringperiodwhen
loans wereimpaired
Interestincome
that wouldhave been
recordedwith
originalterms
Averagerecorded
investment
Interestincome
recognizedduringperiodwhen
loans wereimpaired
Interestincome
that wouldhave been
recordedwith
originalterms
Averagerecorded
investment
Interestincome
recognizedduringperiodwhen
loans wereimpaired
Interestincome
that wouldhave been
recordedwith
originalterms
Averagerecorded
investment
Credit cards $ 48 $ 178 $ 805 $ 49 $ 151 $ 727 $ 56 $ 140 $ 745Consumer installment loans — — — — — — — — —Commercial credit products — 1 6 — 2 7 — 2 10Total $ 48 $ 179 $ 811 $ 49 $ 153 $ 734 $ 56 $ 142 $ 755
Payment Defaults
The following table presents the type, number and amount of loans accounted for as TDRs that enrolled in a modification plan within the previous 12 months from the applicable balance sheet date and experienced a payment default during the periods presented. A customer defaults from a modification program after two consecutive missed payments.
Years ended December 31, 2016 2015 2014
($ in millions)Accountsdefaulted
Loansdefaulted
Accountsdefaulted
Loansdefaulted
Accountsdefaulted
Loansdefaulted
Credit cards 35,648 $ 72 28,126 $ 56 29,313 $ 60Consumer installment loans — — — — — —Commercial credit products 84 1 95 1 159 1Total 35,732 $ 73 28,221 $ 57 29,472 $ 61
Credit Quality Indicators
Our loan receivables portfolio includes both secured and unsecured loans. Secured loan receivables are largely comprised of consumer installment loans secured by equipment. Unsecured loan receivables are largely comprised of our open-ended consumer and commercial revolving credit card loans. As part of our credit risk management activities, on an ongoing basis, we assess overall credit quality by reviewing information related to the performance of a customer’s account with us, as well as information from credit bureaus, such as a Fair Isaac Corporation (“FICO”) or other credit scores, relating to the customer’s broader credit performance. FICO scores are generally obtained at origination of the account and are refreshed, at a minimum quarterly, but could be as often as weekly, to assist in predicting customer behavior. We categorize these credit scores into the following three credit score categories: (i) 661 or higher, which are considered the strongest credits; (ii) 601 to 660, considered moderate credit risk; and (iii) 600 or less, which are considered weaker credits. There are certain customer accounts for which a FICO score is not available where we use alternative sources to assess their credit and predict behavior. The following table provides the most recent FICO scores available for our customers at December 31, 2016 and 2015, respectively, as a percentage of each class of loan receivable. The table below excludes 0.7% and 0.9% of our total loan receivables balance at December 31, 2016 and 2015, respectively, which represents those customer accounts for which a FICO score is not available.
At December 31 2016 2015661 or 601 to 600 or 661 or 601 to 600 orhigher 660 less higher 660 less
Credit cards 72.6% 19.7% 7.7% 73.0% 19.8% 7.2%Consumer installment loans 77.9% 16.3% 5.8% 77.7% 16.6% 5.7%Commercial credit products 87.1% 8.5% 4.4% 86.8% 8.7% 4.5%

130
Unfunded Lending Commitments
We manage the potential risk in credit commitments by limiting the total amount of credit, both by individual customer and in total, by monitoring the size and maturity of our portfolios and by applying the same credit standards for all of our credit products. Unused credit card lines available to our customers totaled approximately $348 billion and $322 billion at December 31, 2016 and 2015, respectively. While these amounts represented the total available unused credit card lines, we have not experienced and do not anticipate that all of our customers will access their entire available line at any given point in time.
Interest Income by Product
The following table provides additional information about our interest and fees on loans from our loan receivables, including held for sale:
For the years ended December 31 ($ in millions) 2016 2015 2014Credit cards 14,424 $ 12,932 $ 11,967Consumer installment loans 117 104 99Commercial credit products 139 142 149Other 2 1 1Total $ 14,682 $ 13,179 $ 12,216

131
NOTE 5. VARIABLE INTEREST ENTITIES
We use VIEs to securitize loans and arrange asset-backed financing in the ordinary course of business. Investors in these entities only have recourse to the assets owned by the entity and not to our general credit. We do not have implicit support arrangements with any VIE and we did not provide non-contractual support for previously transferred loan receivables to any VIE in the years ended December 31, 2016 and 2015. Our VIEs are able to accept new loan receivables and arrange new asset-backed financings, consistent with the requirements and limitations on such activities placed on the VIE by existing investors. Once an account has been designated to a VIE, the contractual arrangements we have require all existing and future loans originated under such account to be transferred to the VIE. The amount of loan receivables held by our VIEs in excess of the minimum amount required under the asset-backed financing arrangements with investors may be removed by us under random removal of accounts provisions. All loan receivables held by a VIE are subject to claims of third-party investors.
In evaluating whether we have the power to direct the activities of a VIE that most significantly impact its economic performance, we consider the purpose for which the VIE was created, the importance of each of the activities in which it is engaged and our decision-making role, if any, in those activities that significantly determine the entity’s economic performance as compared to other economic interest holders. This evaluation requires consideration of all facts and circumstances relevant to decision-making that affects the entity’s future performance and the exercise of professional judgment in deciding which decision-making rights are most important.
In determining whether we have the right to receive benefits or the obligation to absorb losses that could potentially be significant to a VIE, we evaluate all of our economic interests in the entity, regardless of form (debt, equity, management and servicing fees, and other contractual arrangements). This evaluation considers all relevant factors of the entity’s design, including: the entity’s capital structure, contractual rights to earnings or losses, subordination of our interests relative to those of other investors, as well as any other contractual arrangements that might exist that could have the potential to be economically significant. The evaluation of each of these factors in reaching a conclusion about the potential significance of our economic interests is a matter that requires the exercise of professional judgment.
We consolidate VIEs where we have the power to direct the activities that significantly affect the VIEs' economic performance, typically because of our role as either servicer or administrator for the VIEs. The power to direct exists because of our role in the design and conduct of the servicing of the VIEs’ assets as well as directing certain affairs of the VIEs, including determining whether and on what terms debt of the VIEs will be issued.
The loan receivables in these entities have risks and characteristics similar to our other financing receivables and were underwritten to the same standard. Accordingly, the performance of these assets has been similar to our other comparable loan receivables, and the blended performance of the pools of receivables in these entities reflects the eligibility criteria that we apply to determine which receivables are selected for transfer. Contractually, the cash flows from these financing receivables must first be used to pay third-party debt holders, as well as other expenses of the entity. Excess cash flows, if any, are available to us. The creditors of these entities have no claim on our other assets.

132
The table below summarizes the assets and liabilities of our consolidated securitization VIEs described above.
At December 31 ($ in millions) 2016 2015Assets Loan receivables, net(a) $ 22,892 $ 24,338Other assets(b) 107 127Total $ 22,999 $ 24,465 Liabilities Borrowings $ 12,388 $ 13,589Other liabilities 21 30Total $ 12,409 $ 13,619
_______________________
(a) Includes $1.1 billion of related allowance for loan losses resulting in gross restricted loans of $24.0 billion and $25.5 billion at December 31, 2016 and 2015, respectively.
(b) Includes $100 million and $118 million of segregated funds held by the VIEs at December 31, 2016 and 2015, respectively, which are classified as restricted cash and equivalents and included as a component of other assets in our Consolidated Statements of Financial Position.
The balances presented above are net of intercompany balances and transactions that are eliminated in our consolidated and combined financial statements.
We provide servicing for all of our consolidated VIEs. Collections are required to be placed into segregated accounts owned by each VIE in amounts that meet contractually specified minimum levels. These segregated funds are invested in cash and equivalents and are restricted as to their use, principally to pay maturing principal and interest on debt and the related servicing fees. Collections above these minimum levels are remitted to us on a daily basis.
Income (principally, interest and fees on loans) earned by our consolidated VIEs was $4.5 billion, $5.5 billion and $5.2 billion for the years ended December 31, 2016, 2015 and 2014, respectively. Related expenses consisted primarily of provision for loan losses of $1.0 billion, $940 million and $1.1 billion for the years ended December 31, 2016, 2015 and 2014, respectively, and interest expense of $244 million, $215 million and $215 million for the years ended December 31, 2016, 2015 and 2014, respectively. These amounts do not include intercompany transactions, principally fees and interest, which are eliminated in our consolidated and combined financial statements.
NOTE 6. GOODWILL AND OTHER INTANGIBLE ASSETS
Goodwill
($ in millions) 2016 2015Balance at January 1 $ 949 $ 949
Acquisitions — —
Balance at December 31 $ 949 $ 949
Intangible Assets Subject to Amortization
2016 2015
At December 31 ($ in millions)
Grosscarryingamount
Accumulatedamortization Net
Grosscarryingamount
Accumulatedamortization Net
Customer-related $ 1,069 $ (560) $ 509 $ 1,045 $ (505) $ 540Capitalized software 318 (115) 203 253 (92) 161Total $ 1,387 $ (675) $ 712 $ 1,298 $ (597) $ 701

133
During the year ended December 31, 2016, we recorded additions to intangible assets subject to amortization of $185 million, attributable to capitalized software expenditures related to the build of our stand-alone information technology infrastructure, and customer-related intangible assets.
Customer-related intangible assets primarily relate to retail partner contract acquisitions and extensions, as well as purchased credit card relationships. During the years ended December 31, 2016 and 2015, we recorded additions to customer-related intangible assets subject to amortization of $82 million and $196 million, respectively, primarily related to payments made to acquire and extend certain retail partner relationships. These additions for both periods had a weighted average amortizable life of 7 years.
Amortization expense related to retail partner contracts was $100 million, $84 million and $81 million for the years ended December 31, 2016, 2015 and 2014, respectively, and is included as a component of marketing and business development expense in our Consolidated and Combined Statements of Earnings. All other amortization expense was $74 million, $63 million and $28 million for the years ended December 31, 2016, 2015 and 2014, respectively, and is included as a component of other expense in our Consolidated and Combined Statements of Earnings.
We estimate annual amortization expense for existing intangible assets over the next five calendar years to be as follows:
($ in millions) 2017 2018 2019 2020 2021Amortization expense $ 164 $ 152 $ 142 $ 120 $ 68
NOTE 7. DEPOSITS
Deposits
2016 2015At December 31 ($ in millions) Amount Average rate (a) Amount Average rate (a)
Interest-bearing deposits $ 51,896 1.5% $ 43,215 1.6%
Non-interest-bearing deposits 159 — 152 —
Total deposits $ 52,055 $ 43,367
___________________
(a) Based on interest expense for the years ended December 31, 2016 and 2015 and average deposits balances.
At December 31, 2016 and 2015, interest-bearing deposits included $14.2 billion and $11.9 billion, respectively, of certificates of deposit of $100,000 or more. Of the total certificates of deposit of $100,000 or more, $4.4 billion and $3.6 billion were certificates of deposit of $250,000 or more at December 31, 2016 and 2015, respectively.
At December 31, 2016, our interest-bearing time deposits maturing over the next five years and thereafter were as follows:
($ in millions) 2017 2018 2019 2020 2021 ThereafterDeposits $ 15,782 $ 4,672 $ 4,208 $ 2,864 $ 2,182 $ 2,105
The above maturity table excludes $16.6 billion of demand deposits with no defined maturity, of which $14.6 billion are savings accounts. In addition, at December 31, 2016, we had $3.5 billion of broker network deposit sweeps procured through a program arranger who channels brokerage account deposits to us. Unless extended, the contracts associated with these broker network deposit sweeps will terminate between 2019 and 2021.

134
NOTE 8. BORROWINGS
2016 2015
At December 31 ($ in millions)Maturity
date Interest Rate
Weightedaverageinterest
rateOutstanding
Amount(a)Outstanding
Amount(a)
Borrowings of consolidated securitizationentities:
Fixed securitized borrowings 2017 - 2021 1.35% - 4.47% 1.90 % $ 8,731 $ 6,383Floating securitized borrowings 2017 - 2019 1.22% - 1.84% 1.53 % 3,657 7,206
Total borrowings of consolidated securitizationentities 1.79 % 12,388 13,589
Senior unsecured notes:Fixed senior unsecured notes 2017 - 2026 1.87% - 4.50% 3.41 % 6,811 6,308Floating senior unsecured notes 2017 - 2020 2.11% - 2.29% 2.24 % 948 249
Total senior unsecured notes 3.26 % 7,759 6,557
Bank term loan — 4,133
Total borrowings $ 20,147 $ 24,279
___________________
(a) The amounts presented above for outstanding borrowings include unamortized debt premiums, discounts and issuance costs.
Debt Maturities
The following table summarizes the maturities of the principal amount of our borrowings of consolidated securitization entities and senior unsecured notes over the next five years and thereafter:
($ in millions) 2017 2018 2019 2020 2021 ThereafterBorrowings $ 3,977 $ 3,207 $ 6,735 $ 2,124 $ 1,408 $ 2,750
Senior Unsecured Notes
2016 Issuances ($ in millions):
Issuance Date Principal Amount Maturity Interest Rate
May 9, 2016 $ 500 2017Floating rate (three-month
LIBOR plus 1.40%)
August 4, 2016 $ 500 2026 3.700%
August 29, 2016 $ 200 2017Floating rate (three-month
LIBOR plus 1.40%)

135
Bank Term Loan
During the year ended December 31, 2016, we prepaid $4.1 billion representing all of the remaining outstanding indebtedness under the Bank Term Loan.
Credit Facilities
As additional sources of liquidity, we have undrawn committed capacity under certain credit facilities, primarily related to our securitization programs.
At December 31, 2016, we had an aggregate of $6.2 billion of undrawn committed capacity on our securitization financings, subject to customary borrowing conditions, from private lenders under our two existing securitization programs.
In July 2016, we entered into a three-year unsecured revolving credit facility with private lenders, which provides $0.5 billion of committed capacity. At December 31, 2016, all of the committed capacity under this facility was undrawn, subject to customary borrowing conditions.
NOTE 9. FAIR VALUE MEASUREMENTS
For a description of how we estimate fair value, see Note 2. Basis of Presentation and Summary of Significant Accounting Policies.
The following tables present our assets and liabilities measured at fair value on a recurring basis.
Recurring Fair Value Measurements
The following tables present our assets measured at fair value on a recurring basis.
At December 31, 2016 ($ in millions) Level 1 Level 2 Level 3 Total
AssetsInvestment securities
DebtU.S. Government and Federal Agency $ — $ 3,676 $ — $ 3,676State and municipal — — 46 46Residential mortgage-backed — 1,373 — 1,373
Equity 15 — — 15Total $ 15 $ 5,049 $ 46 $ 5,110
At December 31, 2015 ($ in millions)
AssetsInvestment securities
DebtU.S. Government and Federal Agency $ — $ 2,761 $ — $ 2,761State and municipal — — 49 49Residential mortgage-backed — 317 — 317
Equity 15 — — 15Total $ 15 $ 3,078 $ 49 $ 3,142
For the years ended December 31, 2016 and 2015, there were no securities transferred between Level 1 and Level 2 or between Level 2 and Level 3. At December 31, 2016 and 2015, we did not have any significant liabilities measured at fair value on a recurring basis.

136
Our Level 3 recurring fair value measurements primarily relate to state and municipal debt instruments of $46 million and $49 million at December 31, 2016 and 2015, respectively, which are valued using non-binding broker quotes or other third-party sources. For a description of our process to evaluate third-party pricing servicers, see Note 2. Basis of Presentation and Summary of Significant Accounting Policies. Our state and municipal debt securities are classified as available-for-sale with changes in fair value included in accumulated other comprehensive income.
The following table presents the changes in our Level 3 debt instruments that are measured on a recurring basis for the years ended December 31, 2016 and 2015.
Changes in Level 3 Instruments
Years ended December 31, ($ in millions) 2016 2015
Balance at beginning of period $ 49 $ 60Net realized/unrealized gains (losses) 1 1Purchases — —Sales — (6)Settlements (4) (6)
Balance at end of period $ 46 $ 49
Net change in unrealized gains (losses) relating to instruments still held at December 31 $ 1 $ 1
Non-Recurring Fair Value Measurements
We hold certain assets that have been measured at fair value on a non-recurring basis at December 31, 2016 and 2015. These assets can include repossessed assets and cost method investments that are written down to fair value when they are impaired, as well as loan receivables held for sale. Assets that are written down to fair value when impaired are not subsequently adjusted to fair value unless further impairment occurs. The assets held by us that were measured at fair value on a non-recurring basis and the effects of the remeasurement to fair value were not material for all periods presented.
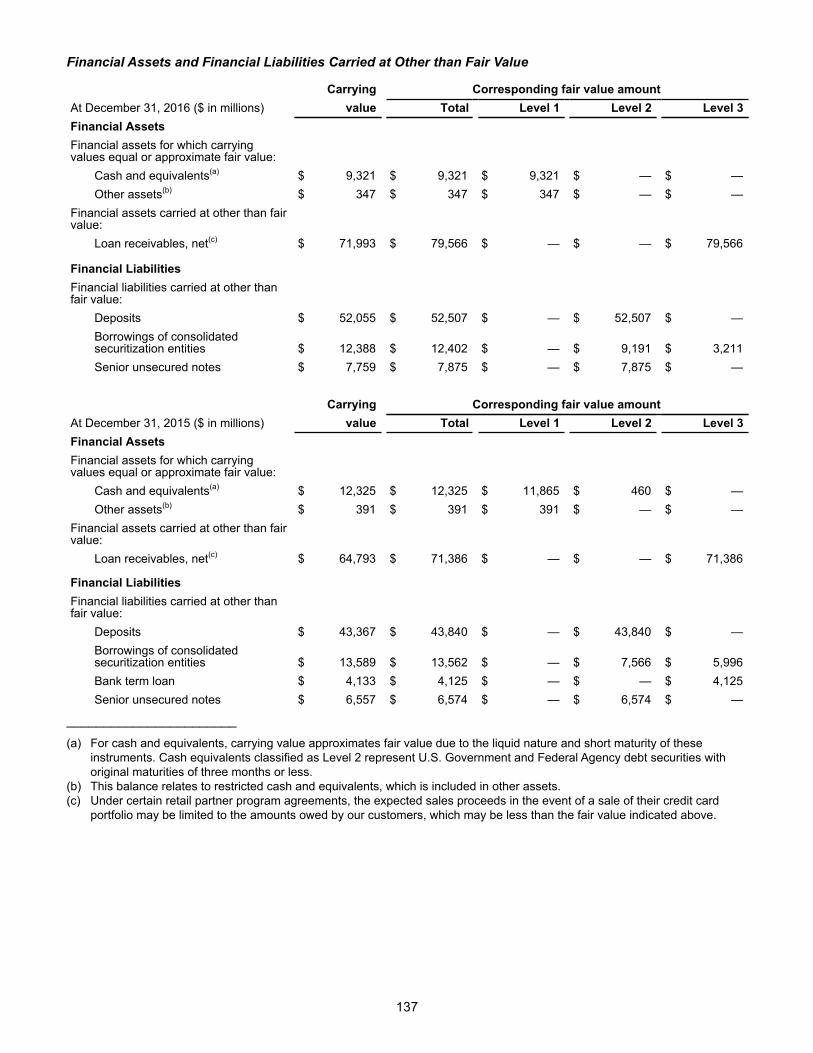
137
Financial Assets and Financial Liabilities Carried at Other than Fair Value
Carrying Corresponding fair value amountAt December 31, 2016 ($ in millions) value Total Level 1 Level 2 Level 3Financial AssetsFinancial assets for which carryingvalues equal or approximate fair value:
Cash and equivalents(a) $ 9,321 $ 9,321 $ 9,321 $ — $ —Other assets(b) $ 347 $ 347 $ 347 $ — $ —
Financial assets carried at other than fairvalue:
Loan receivables, net(c) $ 71,993 $ 79,566 $ — $ — $ 79,566
Financial LiabilitiesFinancial liabilities carried at other thanfair value:
Deposits $ 52,055 $ 52,507 $ — $ 52,507 $ —Borrowings of consolidatedsecuritization entities $ 12,388 $ 12,402 $ — $ 9,191 $ 3,211Senior unsecured notes $ 7,759 $ 7,875 $ — $ 7,875 $ —
Carrying Corresponding fair value amountAt December 31, 2015 ($ in millions) value Total Level 1 Level 2 Level 3Financial AssetsFinancial assets for which carryingvalues equal or approximate fair value:
Cash and equivalents(a) $ 12,325 $ 12,325 $ 11,865 $ 460 $ —Other assets(b) $ 391 $ 391 $ 391 $ — $ —
Financial assets carried at other than fairvalue:
Loan receivables, net(c) $ 64,793 $ 71,386 $ — $ — $ 71,386
Financial LiabilitiesFinancial liabilities carried at other thanfair value:
Deposits $ 43,367 $ 43,840 $ — $ 43,840 $ —Borrowings of consolidatedsecuritization entities $ 13,589 $ 13,562 $ — $ 7,566 $ 5,996Bank term loan $ 4,133 $ 4,125 $ — $ — $ 4,125Senior unsecured notes $ 6,557 $ 6,574 $ — $ 6,574 $ —
_______________________
(a) For cash and equivalents, carrying value approximates fair value due to the liquid nature and short maturity of these instruments. Cash equivalents classified as Level 2 represent U.S. Government and Federal Agency debt securities with original maturities of three months or less.
(b) This balance relates to restricted cash and equivalents, which is included in other assets. (c) Under certain retail partner program agreements, the expected sales proceeds in the event of a sale of their credit card
portfolio may be limited to the amounts owed by our customers, which may be less than the fair value indicated above.

138
NOTE 10. REGULATORY AND CAPITAL ADEQUACY
As a savings and loan holding company, we are subject to regulation, supervision and examination by the Federal Reserve Board and subject to the capital requirements as prescribed by Basel III capital rules and the requirements of the Dodd-Frank Act. The Bank is a federally chartered savings association. As such, the Bank is subject to regulation, supervision and examination by the OCC, which is its primary regulator, and by the Consumer Financial Protection Bureau (“CFPB”). In addition, the Bank, as an insured depository institution, is supervised by the Federal Deposit Insurance Corporation.
Failure to meet minimum capital requirements can initiate certain mandatory and, possibly, additional discretionary actions by regulators that, if undertaken, could limit our business activities and have a material adverse effect on our consolidated and combined financial statements. Under capital adequacy guidelines, we must meet specific capital guidelines that involve quantitative measures of our assets, liabilities and certain off-balance-sheet items as calculated under regulatory accounting practices. The capital amounts and classifications are also subject to qualitative judgments by the regulators about components, risk weightings and other factors.
Quantitative measures established by regulation to ensure capital adequacy require us and the Bank to maintain minimum amounts and ratios (set forth in the table below) of Total, Tier 1 and common equity Tier 1 capital (as defined in the regulations) to risk-weighted assets (as defined), and of Tier 1 capital to average assets (as defined).
For Synchrony Financial to be a well-capitalized savings and loan holding company, the Bank must be well-capitalized and Synchrony Financial must not be subject to any written agreement, order, capital directive, or prompt corrective action directive issued by the Federal Reserve Board to meet and maintain a specific capital level for any capital measure.
At December 31, 2016 and 2015, Synchrony Financial met all applicable requirements to be deemed well-capitalized pursuant to Federal Reserve Board regulations. At December 31, 2016 and 2015, the Bank also met all applicable requirements to be deemed well-capitalized pursuant to OCC regulations and for purposes of the Federal Deposit Insurance Act. There are no conditions or events subsequent to December 31, 2016 that management believes have changed the Company’s or the Bank’s capital category.
The actual capital amounts, ratios and the applicable required minimums of the Company and the Bank are as follows:
Synchrony Financial
At December 31, 2016 ($ in millions) ActualMinimum for capital adequacy purposes
Amount Ratio(a) Amount Ratio
Total risk-based capital $ 14,129 18.5% $ 6,094 8.0%Tier 1 risk-based capital $ 13,135 17.2% $ 4,571 6.0%Tier 1 leverage $ 13,135 15.0% $ 3,508 4.0%Common equity Tier 1 Capital $ 13,135 17.2% $ 3,428 4.5%
At December 31, 2015 ($ in millions) ActualMinimum for capital adequacy purposes
Amount Ratio(a) Amount Ratio
Total risk-based capital $ 12,531 18.1% $ 5,538 8.0%Tier 1 risk-based capital $ 11,633 16.8% $ 4,153 6.0%Tier 1 leverage $ 11,633 14.4% $ 3,236 4.0%Common equity Tier 1 Capital $ 11,633 16.8% $ 3,115 4.5%

139
Synchrony Bank
At December 31, 2016 ($ in millions) ActualMinimum for capital adequacy purposes
Minimum to be well-capitalized underprompt correctiveaction provisions
Amount Ratio(a) Amount Ratio(b) Amount Ratio
Total risk-based capital $ 10,101 16.7% $ 4,825 8.0% $ 6,031 10.0%Tier 1 risk-based capital $ 9,312 15.4% $ 3,619 6.0% $ 4,825 8.0%Tier 1 leverage $ 9,312 13.2% $ 2,816 4.0% $ 3,520 5.0%Common equity Tier 1 Capital $ 9,312 15.4% $ 2,714 4.5% $ 3,920 6.5%
At December 31, 2015 ($ in millions) ActualMinimum for capital adequacy purposes
Minimum to be well-capitalized underprompt correctiveaction provisions
Amount Ratio(a) Amount Ratio Amount Ratio
Total risk-based capital $ 8,442 16.6% $ 4,064 8.0% $ 5,080 10.0%Tier 1 risk-based capital $ 7,781 15.3% $ 3,048 6.0% $ 4,064 8.0%Tier 1 leverage $ 7,781 13.1% $ 2,384 4.0% $ 2,980 5.0%Common equity Tier 1 Capital $ 7,781 15.3% $ 2,286 4.5% $ 3,302 6.5%
_______________________
(a) Capital ratios are calculated based on the Basel III Standardized Approach rules, subject to applicable transition provisions, at December 31, 2016 and 2015.
(b) At December 31, 2016, Synchrony Financial and the Bank also must maintain a capital conservation buffer of common equity Tier 1 capital in excess of minimum risk-based capital ratios by at least 0.625 percentage points to avoid limits on capital distributions and certain discretionary bonus payments to executive officers and similar employees.
The Bank may pay dividends on its stock, with consent or non-objection from the OCC and the Federal Reserve Board, among other things, if its regulatory capital would not thereby be reduced below the applicable regulatory capital requirements.
NOTE 11. EMPLOYEE BENEFIT PLANS
Following the Separation, our employees ceased participating in GE benefit plans and began participating in employee benefit plans established and maintained by us. The following summarizes information related to the Synchrony benefit plans and our remaining obligations to GE related to certain of their plans.
Savings Plan
Our U.S. employees are eligible to participate in a qualified defined contribution savings plan that allows them to contribute a portion of their pay to the plan on a pre-tax basis. We make employer contributions to the plan equal to 3% of eligible compensation and make matching contributions of up to 4% of eligible compensation. We also provide certain additional contributions to the plan for employees who were participants in GE's pension plan at Separation. The expense incurred associated with this plan was $77 million for the year ended December 31, 2016. The expense incurred associated with this plan for prior periods was not material.
Health and Welfare Benefits
We provide health and welfare benefits to our employees, including health, dental, prescription drug and vision for which we are self-insured. The expense incurred associated with these benefits was $99 million for the year ended December 31, 2016. The expense incurred associated with these benefits for prior periods was not material.

140
GE Benefit Plans and Reimbursement Obligations
Prior to Separation, our employees participated in various GE retirement and retiree health and life insurance benefit plans. Certain of these retirement benefits vested as a result of Separation. Under the terms of the Employee Matters Agreement between us and GE, GE will continue to pay for these benefits and we are obligated to reimburse them. The principal retirement benefits subject to this arrangement are fixed, life-time annuity payments. The estimated liability for our reimbursement obligations to GE for retiree benefits was $175 million at December 31, 2016 and is included in other liabilities in our Consolidated Statement of Financial Position.
Expenses associated with our employees’ participation in these GE benefit plans prior to Separation were $157 million and $164 million for the years ended December 31, 2015 and 2014, respectively.
NOTE 12. EARNINGS PER SHARE
Basic earnings per share is computed by dividing earnings available to common stockholders by the weighted average number of common shares outstanding for the period. Diluted earnings per share reflects the assumed conversion of all dilutive securities.
The following table presents the calculation of basic and diluted earnings per share:
Years ended December 31,(in millions, except per share data) 2016 2015 2014Net earnings $ 2,251 $ 2,214 $ 2,109
Weighted average common shares outstanding, basic 829.2 833.8 757.4Effect of dilutive securities 2.3 1.7 0.2Weighted average common shares outstanding, dilutive 831.5 835.5 757.6
Earnings per basic common share $ 2.71 $ 2.66 $ 2.78Earnings per diluted common share $ 2.71 $ 2.65 $ 2.78
We have issued certain stock based awards under the Synchrony Financial 2015 Long-Term Incentive Plan. A total of approximately 2 million, 1 million and 6 million shares related to these awards were considered anti-dilutive and therefore were excluded from the computation of diluted earnings per share for the years ended December 31, 2016, 2015 and 2014, respectively.
NOTE 13. EQUITY AND OTHER STOCK RELATED INFORMATION
The IPO and Exchange Offer
In July 2014, in preparation for the IPO, we completed a stock split pursuant to which each share held by the holder of our common stock was reclassified into 5,262.3512 shares. Following this stock split, we had approximately 705 million shares of common stock outstanding. The effects of the stock split have been reflected for all periods presented.
On August 5, 2014, we closed the initial public offering of 125 million shares of our common stock at a price to the public of $23.00 per share and on September 3, 2014 we issued an additional 3.5 million shares of our common stock pursuant to an option granted to the underwriters in the IPO (the “Underwriters' Option”). We received net proceeds from the initial public offering and the Underwriters' Option of approximately $2.8 billion. Following the initial public offering and the Underwriters' Option, GE owned approximately 84.6% of our common stock.
On November 17, 2015, GE completed its offer to exchange shares of GE common stock for all of the remaining shares of our common stock that were owned by GE. Following the Separation, GE no longer owns any of our outstanding common stock.

141
Dividend and Share Repurchases
During the year ended December 31, 2016 we declared and paid cash dividends of $0.26 per share of common stock, or $214 million.
On July 7, 2016, the Company also approved a share repurchase program of up to $952 million for the four quarters ending June 30, 2017. The Company repurchased approximately 16.7 million shares of our common stock for $476 million, at an average price of $28.55. We made and expect to continue to make share repurchases subject to market conditions and other factors, including legal and regulatory restrictions and required approvals.
Synchrony Financial Incentive Programs
We have established the Synchrony Financial 2014 Long-Term Incentive Plan, which we refer to as the “Incentive Plan.” The Incentive Plan permits us to issue stock-based, stock-denominated and other awards to officers, employees, consultants and non-employee directors providing services to the Company and our participating affiliates. Available awards under the Incentive Plan include stock options and stock appreciation rights (“SARs”), restricted stock and restricted stock units (“RSUs”), performance awards and other awards valued in whole or in part by reference to or otherwise based on our common stock (other stock-based awards), and dividend equivalents. A total of 16,605,417 shares of our common stock (including authorized and unissued shares) are available for granting awards under the Incentive Plan.
In connection with the IPO, we issued a total of 3.3 million RSUs and 4.9 million stock options to certain employees. These RSUs and stock options will generally cliff vest four years from the award date provided that the employee has remained continuously employed by the Company through such vesting date.
Subsequent to the IPO we have issued additional RSUs and stock options in connection with annual grants. The RSUs and stock options issued in connection with the annual grants will generally vest 20% annually, starting with the first anniversary of the award date, provided that the employee has remained continuously employed by the Company through such vesting date. Each RSU is convertible into one share of Synchrony Financial common stock.
The total compensation expense recorded for these awards was not material for all periods presented. At December 31, 2016, there were 5.5 million RSUs and 7.5 million stock options issued and outstanding and $112 million of total unrecognized compensation cost related to these awards, which is expected to be amortized over a weighted average period of 2.6 years.
NOTE 14. INCOME TAXES
Earnings before Provision for Income Taxes
For the years ended December 31 ($ in millions) 2016 2015 2014U.S. $ 3,545 $ 3,513 $ 3,377Non-U.S. 25 18 9Earnings before provision for income taxes $ 3,570 $ 3,531 $ 3,386

142
Provision for Income Taxes
For the years ended December 31 ($ in millions) 2016 2015 2014Current provision for income taxesU.S. Federal $ 829 $ 1,443 $ 1,320U.S. state and local 86 158 153Non-U.S. 15 11 7Total current provision for income taxes 930 1,612 1,480
Deferred (benefit) provision for income taxesU.S. Federal 357 (263) (181)U.S. state and local 33 (32) (23)Non-U.S. (1) — 1Deferred (benefit) provision for income taxes 389 (295) (203)Total provision for income taxes $ 1,319 $ 1,317 $ 1,277
U.S. income taxes have not been provided on temporary differences related to investments in certain non-U.S. subsidiaries. These temporary differences are due to earnings that have been reinvested abroad for an indefinite period of time and other differences between the book basis and tax basis in the equity in our non-U.S. subsidiaries. Any U.S. tax liability associated with these temporary differences would not be material to the consolidated and combined financial statements.
Reconciliation of Our Effective Tax Rate to the U.S. Federal Statutory Income Tax Rate
For the years ended December 31 2016 2015 2014U.S. federal statutory income tax rate 35.0 % 35.0% 35.0%U.S. state and local income taxes, net of federal benefit 2.2 % 2.3% 2.5%All other, net (0.3)% —% 0.2%Effective tax rate 36.9 % 37.3% 37.7%
Deferred Taxes
Deferred income taxes reflect the net tax effects of temporary differences between the financial reporting and tax bases of assets and liabilities and are measured using the enacted tax laws and rates that will be in effect when such differences are expected to reverse.
Significant Components of Our Net Deferred Income Taxes
At December 31 ($ in millions) 2016 2015AssetsAllowance for loan losses $ 1,662 $ 1,329Reward programs 121 106Compensation and employee benefits 154 135Net operating losses 7 12Other assets 37 38Total deferred income tax assets before valuation allowance 1,981 1,620Valuation allowance (5) (9)Total deferred income tax assets $ 1,976 $ 1,611
LiabilitiesOriginal issue discount(a) $ (989) $ (332)Goodwill and identifiable intangibles (222) (246)Other liabilities (132) (18)Total deferred income tax liabilities (1,343) (596)Net deferred income tax assets $ 633 $ 1,015

143
_______________________
(a) Balance at December 31, 2016 includes the impact of certain tax accounting method changes filed with the Internal Reveue Service ("IRS") in 2016, and the balance at December 31, 2015 includes the deferred tax impact of an unrecognized tax benefit of $200 million.
Tax Sharing and Separation Agreement
In connection with our initial public offering in August 2014 (“IPO”), we entered into a Tax Sharing and Separation Agreement (“TSSA”), which governs certain Separation-related tax matters between the Company and GE following the IPO. The TSSA governs the allocation of the responsibilities for the taxes of the GE group between GE and the Company. The TSSA also allocates rights, obligations and responsibilities in connection with certain administrative matters relating to the preparation of tax returns and control of tax audits and other proceedings relating to taxes.
Under the TSSA, we generally are responsible for all taxes attributable to us or our operations for taxable periods following December 31, 2013. To the extent we filed tax returns on a consolidated basis with GE, we are required to make tax sharing payments to GE in amounts equal to our separate company tax liability. Our separate company tax liability is generally equal to the amount of tax we would have paid had we been filing tax returns separately from GE, subject to certain adjustments, whether or not GE is actually required to pay such amounts to the taxing authorities. For taxable periods prior to January 1, 2014, GE is responsible for all income taxes imposed by the United States, Canada and Puerto Rico. Liabilities related to taxable periods prior to January 1, 2014 were settled with GE during the year ended December 31, 2014. We are responsible for all other taxes attributable to our business. Where required for certain tax items, we have retained the liability and recorded an indemnity receivable from GE in our Consolidated Statement of Financial Position.
Unrecognized Tax Benefits
Reconciliation of Unrecognized Tax Benefits
($ in millions) 2016 2015Balance at January 1 $ 327 $ 102Additions:Tax positions of the current year(a) 21 236Tax positions of prior years 16 6Reductions:Prior year tax positions(a) (208) (8)Settlements with tax authorities — (1)Expiration of the statute of limitation (6) (8)Balance at December 31 $ 150 $ 327Portion of balance that, if recognized, would impact the effective income tax rate $ 99 $ 79
_______________________
(a) Included in the prior year tax positions for the year ended December 31, 2016 is a reversal of an unrecognized tax benefit of $207 million related to temporary items that had been recorded in 2015.
We compute our unrecognized tax benefits on a separate return basis. For unrecognized tax benefits associated with periods prior to 2014, we will settle our liabilities, as required, in accordance with the TSSA. The amount of unrecognized tax benefits that may be resolved in the next twelve months is not expected to be material to our results of operations.
Additionally, there are unrecognized tax benefits of $30 million and $22 million for the years ended December 31, 2016 and 2015, respectively, that are included in the tabular reconciliation above but recorded in the Consolidated Statement of Financial Position as a reduction of the related deferred tax asset for net operating losses.
Interest expense and penalties related to income tax liabilities recognized in our Consolidated and Combined Statements of Earnings were not material for all periods presented.

144
For periods prior to Separation, we are under continuous examination by the IRS and the tax authorities of various states as part of their audit of GE’s tax returns. The IRS is currently auditing GE's consolidated U.S. income tax returns for 2012 and 2013. We are under examination in various states going back to 2008 as part of their audit of GE’s tax returns. We are not currently under audit with respect to any post-Separation periods. We believe that there are no issues or claims that are likely to significantly impact our results of operations, financial position or cash flows. We further believe that we have made adequate provision for all income tax uncertainties that could result from such examinations.
NOTE 15. RELATED PARTY TRANSACTIONS
Following the Separation, GE no longer owns any of our outstanding common stock and is no longer a related party to us, and we no longer consider our transactions with GE and GECC as related party transactions. The following table sets forth the direct costs, indirect costs and interest expenses related to services and funding provided by GE for only the periods presented prior to the Separation, as indicated.
($ in millions) Years ended December 31,2015(c) 2014
Direct costs(a) $ 261 $ 294Indirect costs(a) — 134Interest expense(b) 4 113Total expenses for services and funding provided by GECC $ 265 $ 541
_______________________
(a) Direct and indirect costs are included in the other expense line items in our Consolidated and Combined Statements of Earnings. Represents various operating costs including employee benefits, information technology, telecommunications, corporate overhead and other.
(b) Represents costs related to funding previously provided to us by GECC. Included in interest expense in our Consolidated and Combined Statements of Earnings.
(c) Represents expenses incurred through November 17, 2015, the date of Separation.
NOTE 16. PARENT COMPANY FINANCIAL INFORMATION
The following parent company financial statements for Synchrony Financial are provided in accordance with SEC rules, which requires such disclosure when restricted net assets of consolidated subsidiaries exceed 25% of consolidated net assets. At December 31, 2016, restricted net assets of our subsidiaries were approximately $10.5 billion.

145
Condensed Statements of Earnings
For the years ended December 31 ($ in millions) 2016 2015 2014Interest income:
Interest income from subsidiaries $ 65 $ 52 $ 85Interest on investment securities 13 7 1
Total interest income 78 59 86Interest expense:
Interest on third-party debt 277 309 124Interest on related party debt — 4 109
Total interest expense 277 313 233Net interest income (199) (254) (147)
Dividends from bank subsidiaries 320 708 885Dividends from nonbank subsidiaries 2,290 — 1,206Other income 90 45 6Other expense(a) 141 74 417Earnings before benefit from income taxes 2,360 425 1,533Benefit from income taxes 77 95 215Equity in undistributed net earnings of subsidiaries (186) 1,694 361Net earnings $ 2,251 $ 2,214 $ 2,109
Comprehensive income $ 2,239 $ 2,183 $ 2,112
_____________(a) Other expense for the year ended December 31, 2014, primarily included various intercompany charges that were
eliminated in consolidation.
Condensed Statements of Financial Position
At December 31 ($ in millions) 2016 2015AssetsCash and equivalents $ 2,474 $ 5,301Investment securities 2,205 2,014Investments in and amounts due from subsidiaries(a) 17,809 16,329Goodwill 17 17Other assets 192 283
Total assets $ 22,697 $ 23,944
Liabilities and EquityAmounts due to subsidiaries $ 272 $ 211Bank term loan — 4,133Senior unsecured notes 7,759 6,557Accrued expenses and other liabilities 470 439
Total liabilities 8,501 11,340Equity:
Total equity 14,196 12,604Total liabilities and equity $ 22,697 $ 23,944
_____________(a) Includes investments in and amounts due from bank subsidiaries of $11.0 billion and $9.4 billion at December 31, 2016 and
2015, respectively.

146
Condensed Statements of Cash Flows
For the years ended December 31 ($ in millions) 2016 2015 2014Cash flows - operating activitiesNet earnings $ 2,251 $ 2,214 $ 2,109Adjustments to reconcile net earnings to cash provided from operating activities
Deferred income taxes 9 19 (36)(Increase) decrease in other assets 95 (133) 47Increase (decrease) in accrued expenses and other liabilities 34 (257) 489Equity in undistributed net earnings of subsidiaries 186 (1,694) (361)All other operating activities 72 181 (223)
Cash from operating activities 2,647 330 2,025
Cash flows - investing activitiesNet (increase) decrease in investments in and amounts due from subsidiaries (1,641) 1,928 (1,030)Maturity and redemption of investment securities 1,249 3,480 —Purchases of investment securities (1,452) (4,246) (1,256)All other investing activities (3) (6) (2)Cash (used for) from investing activities (1,847) 1,156 (2,288)
Cash flows - financing activitiesThird-party debt
Proceeds from issuance of third-party debt 1,193 2,978 12,276Maturities and repayment of third-party debt (4,151) (4,094) (505)
Related party debtProceeds from issuance of related party debt — — 1,615Maturities and repayment of related party debt — (655) (9,820)
Proceeds from initial public offering — — 2,842Net transfers to Parent — — (603)Dividends paid on common stock (214) — —Purchases of treasury stock (476) — —Increase (decrease) in amounts due to subsidiaries 21 (56) 98All other financing activities — (1) 3Cash (used for) from financing activities (3,627) (1,828) 5,906
Increase (decrease) in cash and equivalents (2,827) (342) 5,643Cash and equivalents at beginning of year 5,301 5,643 —Cash and equivalents at end of year $ 2,474 $ 5,301 $ 5,643
NOTE 17. LEGAL PROCEEDINGS AND REGULATORY MATTERS
In the normal course of business, from time to time, we have been named as a defendant in various legal proceedings, including arbitrations, class actions and other litigation, arising in connection with our business activities. Certain of the legal actions include claims for substantial compensatory and/or punitive damages, or claims for indeterminate amounts of damages. We are also involved, from time to time, in reviews, investigations and proceedings (both formal and informal) by governmental agencies regarding our business (collectively, “regulatory matters”), which could subject us to significant fines, penalties, obligations to change our business practices or other requirements resulting in increased expenses, diminished income and damage to our reputation. We contest liability and/or the amount of damages as appropriate in each pending matter. In accordance with applicable accounting guidance, we establish an accrued liability for legal and regulatory matters when those matters present loss contingencies which are both probable and reasonably estimable.

147
Legal proceedings and regulatory matters are subject to many uncertain factors that generally cannot be predicted with assurance, and we may be exposed to losses in excess of any amounts accrued.
For some matters, we are able to determine that an estimated loss, while not probable, is reasonably possible. For other matters, including those that have not yet progressed through discovery and/or where important factual information and legal issues are unresolved, we are unable to make such an estimate. We currently estimate that the reasonably possible losses for legal proceedings and regulatory matters, whether in excess of a related accrued liability or where there is no accrued liability, and for which we are able to estimate a possible loss, are immaterial. This represents management’s estimate of possible loss with respect to these matters and is based on currently available information. This estimate of possible loss does not represent our maximum loss exposure. The legal proceedings and regulatory matters underlying the estimate will change from time to time and actual results may vary significantly from current estimates.
Our estimate of reasonably possible losses involves significant judgment, given the varying stages of the proceedings, the existence of numerous yet to be resolved issues, the breadth of the claims (often spanning multiple years), unspecified damages and/or the novelty of the legal issues presented. Based on our current knowledge, we do not believe that we are a party to any pending legal proceeding or regulatory matters that would have a material adverse effect on our consolidated and combined financial condition or liquidity. However, in light of the uncertainties involved in such matters, the ultimate outcome of a particular matter could be material to our operating results for a particular period depending on, among other factors, the size of the loss or liability imposed and the level of our earnings for that period, and could adversely affect our business and reputation.
Below is a description of certain of our regulatory matters and legal proceedings.
Regulatory Matters
On October 30, 2014, the United States Trustee, which is part of the Department of Justice, filed an application in In re Nyree Belton, a Chapter 7 bankruptcy case pending in the U.S. Bankruptcy Court for the Southern District of New York for orders authorizing discovery of the Bank pursuant to Rule 2004 of the Federal Rules of Bankruptcy Procedure, related to an investigation of the Bank’s credit reporting. The discovery, which is ongoing, concerns allegations made in Belton et al. v. GE Capital Consumer Lending, a putative class action adversary proceeding pending in the same Bankruptcy Court. In the Belton adversary proceeding, which was filed on April 30, 2014, plaintiff alleges that the Bank violates the discharge injunction under Section 524(a)(2) of the Bankruptcy Code by attempting to collect discharged debts and by failing to update and correct credit information to credit reporting agencies to show that such debts are no longer due and owing because they have been discharged in bankruptcy. Plaintiff seeks declaratory judgment, injunctive relief and an unspecified amount of damages. On December 15, 2014, the Bankruptcy Court entered an order staying the adversary proceeding pending an appeal to the District Court of the Bankruptcy Court’s order denying the Bank’s motion to compel arbitration. On October 14, 2015, the District Court reversed the Bankruptcy Court and on November 4, 2015, the Bankruptcy Court granted the Bank’s motion to compel arbitration.
On October 15, 2015, the Bank received a Civil Investigative Demand from the CFPB seeking information related to the Bank’s credit bureau reporting with respect to sold accounts. The information sought by the CFPB generally relates to the allegations made in Belton et al. v. GE Capital Consumer Lending. On May 9, 2016, the Bank received a NORA (Notice of Opportunity to Respond and Advise) letter from the CFPB indicating that the CFPB Office of Enforcement is considering whether to recommend that the CFPB take legal action relating to this matter.

148
Other Matters
The Bank or the Company is or has been defending a number of putative class actions alleging claims under the federal Telephone Consumer Protection Act (“TCPA”) as a result of phone calls made by the Bank. The complaints generally have alleged that the Bank or the Company placed calls to consumers by an automated telephone dialing system or using a pre-recorded message or automated voice without their consent and seek up to $1,500 for each violation, without specifying an aggregate amount. Campbell et al. v. Gap Inc., for which the Bank is indemnifying the defendant, was filed on January 25, 2017 in the U.S. District Court for the Northern District of New York. Campbell et al. v. J.C. Penney Company, Inc.; and J.C. Penney Corporation, Inc., for which the Bank is indemnifying the defendants, was filed on January 25, 2017 in the U.S. District Court for the Northern District of New York. Neal et al. v. Wal-Mart Stores, Inc., for which the Bank is indemnifying the defendant, was filed on January 17, 2017 in the U.S. District Court for the Western District of North Carolina. Abdeljalil et al. v. GE Capital Retail Bank, which was filed on August 22, 2012 in the U.S. District Court for the Southern District of California, was dismissed on December 22, 2016 after receiving the court’s final approval of an agreement to settle the case on a class basis. Pursuant to the agreement, a related case (Hofer et al. v. Synchrony Bank, which was filed on November 4, 2014 in the U.S. District Court for the Eastern District of Missouri), was dismissed on February 11, 2016. In addition to the Campbell, Campbell, Neal, Abdeljalil and Hofer matters discussed above, the Bank has resolved ten other putative class actions that made similar claims under the TCPA on an individual basis with the class representative. Travaglio et al. v. GE Capital Retail Bank and Allied Interstate LLC was filed on January 17, 2014 in the U.S. District Court for the Middle District of Florida and dismissed on October 9, 2014. Fitzhenry v. Lowe’s Companies Inc. and GE Capital Retail Bank was filed on May 29, 2014 in the U.S. District Court for the District of South Carolina and dismissed on October 20, 2014. Cowan v. GE Capital Retail Bank was filed on May 14, 2014 in the U.S. District Court for the District of Connecticut and dismissed on July 8, 2015. Pittman et al. v. GE Capital d/b/a GE Capital Retail Bank was filed on July 29, 2014 in the U.S. District Court for the Northern District of Alabama and dismissed on August 20, 2015. Dubanoski et al. v. Wal-Mart Stores, Inc., for which the Bank indemnified the defendant, was filed on February 27, 2015 in the United States District Court for the Northern District of Illinois and dismissed on September 1, 2015. Mintz et al v. Synchrony Bank was filed on December 28, 2015 in the U.S. District Court for the Eastern District of New York and dismissed on May 11, 2016. Deutsche et al. v. Synchrony Bank et al. was filed on March 27, 2016 in the U.S. District Court for the District of New Jersey and dismissed on June 27, 2016. Ciotti et al. v. Synchrony Financial et al. was filed on April 27, 2016 in the U.S. District Court for the Southern District of California and dismissed on June 2, 2016. Johnson et al. v. Wal-Mart Stores, Inc. and Synchrony Financial was filed on April 22, 2016 in the U.S. District Court for the Eastern District of California and dismissed on September 8, 2016. Anand v. Synchrony Bank and Synchrony Financial was filed on June 22, 2016 in the United States District Court for the Northern District of Illinois and dismissed on September 15, 2016.
In addition to the TCPA class action lawsuits related to phone calls, the Company is a defendant in a putative class action lawsuit alleging claims under the TCPA relating to facsimiles. In Michael W. Kincaid, DDS et al. v. Synchrony Financial, plaintiff alleges that the Company violated the TCPA by sending fax advertisements without consent and without required notices, and seeks up to $1,500 for each violation. The amount of damages sought in the aggregate is unspecified. The original complaint was filed in U.S. District Court for the Northern District of Illinois on January 20, 2016. On August 11, 2016, the Court granted the Company’s motion to dismiss based on the lack of personal jurisdiction. On August 15, 2016, the plaintiff re-filed the case in the Southern District of Ohio.

149
NOTE 18. SELECTED QUARTERLY FINANCIAL INFORMATION (UNAUDITED)
Quarterly Periods Ended
($ in millions)December 31,
2016September 30,
2016June 30,
2016March 31,
2016December 31,
2015September 30,
2015June 30,
2015March 31,
2015Interest income $ 3,947 $ 3,796 $ 3,515 $ 3,520 $ 3,509 $ 3,392 $ 3,177 $ 3,150Interest expense 319 315 303 311 301 289 270 275Net interest income 3,628 3,481 3,212 3,209 3,208 3,103 2,907 2,875Earnings beforeprovision for incometaxes 908 963 771 928 868 919 861 883Provision for income taxes 332 359 282 346 321 345 320 331Net earnings $ 576 $ 604 $ 489 $ 582 $ 547 $ 574 $ 541 $ 552Earnings per share
Basic $ 0.70 $ 0.73 $ 0.59 $ 0.70 $ 0.66 $ 0.69 $ 0.65 $ 0.66Diluted $ 0.70 $ 0.73 $ 0.58 $ 0.70 $ 0.65 $ 0.69 $ 0.65 $ 0.66

150
ITEM 9. CHANGES IN AND DISAGREEMENTS WITH ACCOUNTANTS ON ACCOUNTING AND FINANCIAL DISCLOSURENone.
ITEM 9A. CONTROLS AND PROCEDURES
Evaluation of Disclosure Controls and Procedures____________________________________________________________________________________________
Under the direction of our Chief Executive Officer and Chief Financial Officer, we evaluated the effectiveness of our disclosure controls and procedures (as defined in Rules 13a-15(e) and 15d-15(e) under the Exchange Act), and based on such evaluation, our Chief Executive Officer and Chief Financial Officer concluded that our disclosure controls and procedures were effective as of December 31, 2016.
Changes in Internal Control Over Financial Reporting____________________________________________________________________________________________
No change in internal control over financial reporting occurred during the fiscal quarter ended December 31, 2016 that has materially affected, or is reasonably likely to materially affect, our internal control over financial reporting.
Report on Management's Assessment of Internal Control Over Financial Reporting____________________________________________________________________________________________
The management of Synchrony Financial (“the Company”) is responsible for establishing and maintaining adequate internal control over financial reporting for the Company as defined by Exchange Act Rules 13a-15 and 15d-15. The Company's internal control over financial reporting is designed to provide reasonable assurance regarding the reliability of financial reporting and the preparation of financial statements for external reporting purposes in accordance with U.S. generally accepted accounting principles. The Company's internal control over financial reporting includes those policies and procedures that (i) pertain to the maintenance of records that in reasonable detail accurately and fairly reflect the transactions and dispositions of the Company's assets; (ii) provide reasonable assurance that transactions are recorded as necessary to permit preparation of financial statements in accordance with generally accepted accounting principles, and that the Company's receipts and expenditures are made only in accordance with authorizations of the Company's management and directors; and (iii) provide reasonable assurance regarding prevention or timely detection of unauthorized acquisition, use or disposition of the Company's assets that could have a material effect on its financial statements.
Because of its inherent limitations, internal control over financial reporting may not prevent or detect misstatements. Also, projections of any evaluation of effectiveness to future periods are subject to the risk that controls may become inadequate because of changes in conditions, or that the degree of compliance with the policies or procedures may deteriorate. Although any system of internal control can be compromised by human error or intentional circumvention of required procedures, we believe our system provides reasonable assurance that financial transactions are recorded and reported properly, providing an adequate basis for reliable financial statements.
The Company’s management has used the criteria established in Internal Control - Integrated Framework (2013 framework) issued by the Committee of Sponsoring Organizations of the Treadway Commission (“COSO”) to evaluate the effectiveness of the Company’s internal control over financial reporting.
The Company’s management has assessed the effectiveness of the Company’s internal control over financial reporting as of December 31, 2016 and has concluded that such internal control over financial reporting is effective. There are no material weaknesses in the Company’s internal control over financial reporting that have been identified by the Company’s management.

151
KPMG LLP, an independent registered public accounting firm, has audited the consolidated and combined financial statements of the Company for the year ended December 31, 2016 and has also issued an audit report, which is included in Part II, "Item 8. Financial Statements and Supplementary Data” of this Form 10-K Report, on internal control over financial reporting as of December 31, 2016 under Auditing Standard No. 5 of the Public Company Accounting Oversight Board (“PCAOB”).
ITEM 9B. OTHER INFORMATIONNot applicable.

152
PART III.
ITEM 10. DIRECTORS, EXECUTIVE OFFICERS AND CORPORATE GOVERNANCEIncorporated by reference to “Management,” “Election of Directors,” “Section 16(a) Beneficial Ownership Reporting Compliance,” “Governance Principles,” “Code of Conduct” and “Committees of the Board of Directors” in our definitive proxy statement for our 2017 Annual Meeting of Stockholders to be held on May 18, 2017, which will be filed within 120 days of the end of our fiscal year ended December 31, 2016 (the “2017 Proxy Statement”).
ITEM 11. EXECUTIVE COMPENSATIONIncorporated by reference to “Compensation Discussion and Analysis,” “2016 Executive Compensation,” “Management Development and Compensation Committee Report” and “Management Development and Compensation Committee Interlocks and Insider Participation” in the 2017 Proxy Statement.
ITEM 12. SECURITY OWNERSHIP OF CERTAIN BENEFICIAL OWNERS AND MANAGEMENT AND RELATED STOCKHOLDER MATTERSIncorporated by reference to “Beneficial Ownership” and “Equity Compensation Plan Information” in the 2017 Proxy Statement.
ITEM 13. CERTAIN RELATIONSHIPS AND RELATED TRANSACTIONS, AND DIRECTOR INDEPENDENCEIncorporated by reference to “Related Person Transactions,” “Election of Directors” and “Committees of the Board of Directors” in the 2017 Proxy Statement.
ITEM 14. PRINCIPAL ACCOUNTING FEES AND SERVICESIncorporated by reference to “Independent Auditor” in the 2017 Proxy Statement.

153
PART IV.
ITEM 15. EXHIBITS AND FINANCIAL STATEMENT SCHEDULES(a) Documents filed as part of this Form 10-K:
1. Consolidated and Combined Financial Statements
The consolidated and combined financial statements required to be filed in this annual report on Form 10-K are listed below and appear herein on the pages indicated.
INDEX TO CONSOLIDATED AND COMBINED FINANCIAL STATEMENTS
Reports of Independent Registered Public Accounting FirmConsolidated and Combined Statements of Earnings for the years ended December 31, 2016, 2015 and2014Consolidated and Combined Statements of Comprehensive Income for the years ended December 31,2016, 2015 and 2014Consolidated Statements of Financial Position as of December 31, 2016 and 2015Consolidated and Combined Statements of Changes in Equity for the years ended December 31, 2016,2015 and 2014Consolidated and Combined Statements of Cash Flows for the years ended December 31, 2016, 2015 and2014Notes to the Consolidated and Combined Financial Statements
2. Financial Statement Schedules
Separate financial statement schedules have been omitted either because they are not applicable or because the required information is included in the consolidated and combined financial statements.
3. Exhibits
See the Exhibit Index following the signature pages for a list of the exhibits being filed or furnished with or incorporated by reference into this annual report on Form 10-K.
109
111
112113114
115
116

154
ITEM 16. FORM 10-K SUMMARYNone.

155
Signatures
Pursuant to the requirements of Section 13 or 15(d) of the Securities Exchange Act of 1934, the registrant has duly caused this annual report on Form 10-K for the fiscal year ended December 31, 2016, to be signed on its behalf by the undersigned, and in the capacity indicated, thereunto duly authorized in the City of Stamford and State of Connecticut on the 23rd day of February 2017.
Synchrony Financial(Registrant)
/s/ Brian D. DoublesBrian D. DoublesExecutive Vice President and Chief Financial Officer(Duly Authorized Officer and Principal Financial Officer)

156
Power of Attorney
Each person whose signature appears below hereby constitutes and appoints Margaret M. Keane, Brian D. Doubles and Jonathan S. Mothner, and each of them acting individually, as his or her true and lawful attorneys-in-fact and agents, with full power of substitution and resubstitution, to execute for him or her and in his or her name, place and stead, in any and all capacities, any and all amendments to this annual report on Form 10-K, and to file the same, with all exhibits thereto and any other documents required in connection therewith with the Securities and Exchange Commission, granting unto said attorneys-in-fact and agents and their substitutes, and each of them, full power and authority to do and perform each and every act and thing requisite and necessary to be done in connection therewith, as fully as he or she might or could do in person, hereby ratifying and confirming all that said attorneys-in-fact and agents, or any of them, or their or his or her substitutes, may lawfully do or cause to be done by virtue hereof.
Pursuant to the requirements of the Securities Exchange Act of 1934, this report has been signed below by the following persons on behalf of the registrant and in the capacities and on the dates indicated.

157
Signature Title Date
/s/ Margaret M. KeanePrincipal Executive OfficerDirector February 23, 2017
Margaret M. KeaneDirector, President and Chief ExecutiveOfficer
/s/ Brian D. Doubles Principal Financial Officer February 23, 2017Brian D. DoublesExecutive Vice President and ChiefFinancial Officer(Duly Authorized Officer and PrincipalFinancial Officer)
/s/ David P. Melito Principal Accounting Officer February 23, 2017David P. MelitoSenior Vice President and Controller
/s/ Paget L. Alves Director February 23, 2017Paget L. Alves
/s/ Arthur W. Coviello, Jr. Director February 23, 2017Arthur W. Coviello, Jr.
/s/ William W. Graylin Director February 23, 2017William W. Graylin
/s/ Roy A. Guthrie Director February 23, 2017Roy A. Guthrie
/s/ Richard C. Hartnack Director February 23, 2017Richard C. Hartnack
/s/ Jeffrey G. Naylor Director February 23, 2017Jeffrey G. Naylor
/s/ Laurel J. Richie Director February 23, 2017Laurel J. Richie
/s/ Olympia J. Snowe Director February 23, 2017Olympia J. Snowe

158
EXHIBIT INDEX
Exhibit Number Description
3.1
Amended and Restated Certificate of Incorporation of Synchrony Financial (incorporated byreference to Exhibit 3.2 of Amendment No. 5 to Form S-1 Registration Statement filed bySynchrony Financial on July 18, 2014 (No. 333-194528))
3.2Amended and Restated Bylaws of Synchrony Financial (incorporated by reference to Exhibit3.1 of Form 8-K filed by Synchrony Financial on November 1, 2016)
4.1
Indenture, dated as of August 11, 2014, between Synchrony Financial and The Bank of NewYork Mellon, as Trustee (incorporated by reference to Exhibit 4.1 of Form 8-K filed bySynchrony Financial on August 13, 2014)
4.2
First Supplemental Indenture, dated as of August 11, 2014, between Synchrony Financial andThe Bank of New York Mellon, as Trustee (incorporated by reference to Exhibit 4.2 of Form 8-Kfiled by Synchrony Financial on August 13, 2014)
4.3 Second Supplemental Indenture, dated as of February 2, 2015, between Synchrony Financialand The Bank of New York Mellon, as Trustee (incorporated by reference to Exhibit 4.1 of Form8-K filed by Synchrony Financial on February 2, 2015)
4.4 Third Supplemental Indenture, dated as of July 23, 2015, between Synchrony Financial andThe Bank of New York Mellon, as Trustee (incorporated by reference to Exhibit 4.1 of Form 8-Kfiled by Synchrony Financial on July 23, 2015)
4.5 Fourth Supplemental Indenture, dated as of December 4, 2015, between Synchrony Financialand The Bank of New York Mellon, as Trustee (incorporated by reference to Exhibit 4.1 of Form8-K filed by Synchrony Financial on December 4, 2015)
4.6 Form of 2.700% Senior Notes due 2020 (incorporated by reference to Exhibit 4.2 of Form 8-Kfiled by Synchrony Financial on February 2, 2015)
4.7 Form of Floating Rate Senior Notes due 2020 (incorporated by reference to Exhibit 4.3 of Form8-K filed by Synchrony Financial on February 2, 2015)
4.8 Form of 4.500% Senior Notes due 2025 (incorporated by reference to Exhibit 4.2 of Form 8-Kfiled by Synchrony Financial on July 23, 2015)
4.9 Form of 2.600% Senior Notes due 2019 (incorporated by reference to Exhibit 4.2 of Form 8-Kfiled by Synchrony Financial on December 4, 2015)
4.10 Specimen Common Stock Certificate (incorporated by reference to Exhibit 4.1 of AmendmentNo. 5 to Form S-1 Registration Statement filed by Synchrony Financial on July 18, 2014 (No.333-194528))
10.1 Master Agreement, dated as of July 30, 2014, among General Electric Capital Corporation,Synchrony Financial, and, solely for purposes of certain sections and articles set forth therein,General Electric Company (incorporated by reference to Exhibit 10.1 of Amendment No. 1 toForm S-1 Registration Statement filed by Synchrony Financial on August 1, 2014(333-197244))
10.2 Transitional Services Agreement, dated August 5, 2014, by and among General Electric CapitalCorporation, Synchrony Financial and Retail Finance International Holdings, Inc. (incorporatedby reference to Exhibit 10.1 of Form 8-K filed by Synchrony Financial on August 11, 2014)
10.3 Registration Rights Agreement, dated as of August 5, 2014, by and between SynchronyFinancial and General Electric Capital Corporation (incorporated by reference to Exhibit 10.2 ofForm 8-K filed by Synchrony Financial on August 11, 2014)
10.4 Tax Sharing and Separation Agreement, dated as of August 5, 2014, by and between GeneralElectric Company and Synchrony Financial (incorporated by reference to Exhibit 10.3 of Form8-K filed by Synchrony Financial on August 11, 2014)
10.5 Employee Matters Agreement, dated as of August 5, 2014, by and among General ElectricCompany, General Electric Capital Corporation and Synchrony Financial (incorporated byreference to Exhibit 10.4 of Form 8-K filed by Synchrony Financial on August 11, 2014)
10.6 Transitional Trademark License Agreement, dated as of August 5, 2014, by and between GECapital Registry, Inc. and Synchrony Financial (incorporated by reference to Exhibit 10.5 ofForm 8-K filed by Synchrony Financial on August 11, 2014)
10.7 Intellectual Property Cross License Agreement, dated as of August 5, 2014, by and betweenGeneral Electric Company and General Electric Capital Corporation, on the one hand, andSynchrony Financial, on the other hand (incorporated by reference to Exhibit 10.6 of Form 8-Kfiled by Synchrony Financial on August 11, 2014)
10.8 Credit Agreement, dated as of July 30, 2014, among Synchrony Financial, as borrower,JPMorgan Chase Bank, N.A., as administrative agent, and the other Lenders party thereto(incorporated by reference to Exhibit 1.1 of Amendment No. 8 to Form S-1 RegistrationStatement filed by Synchrony Financial on August 1, 2014 (333-197244))
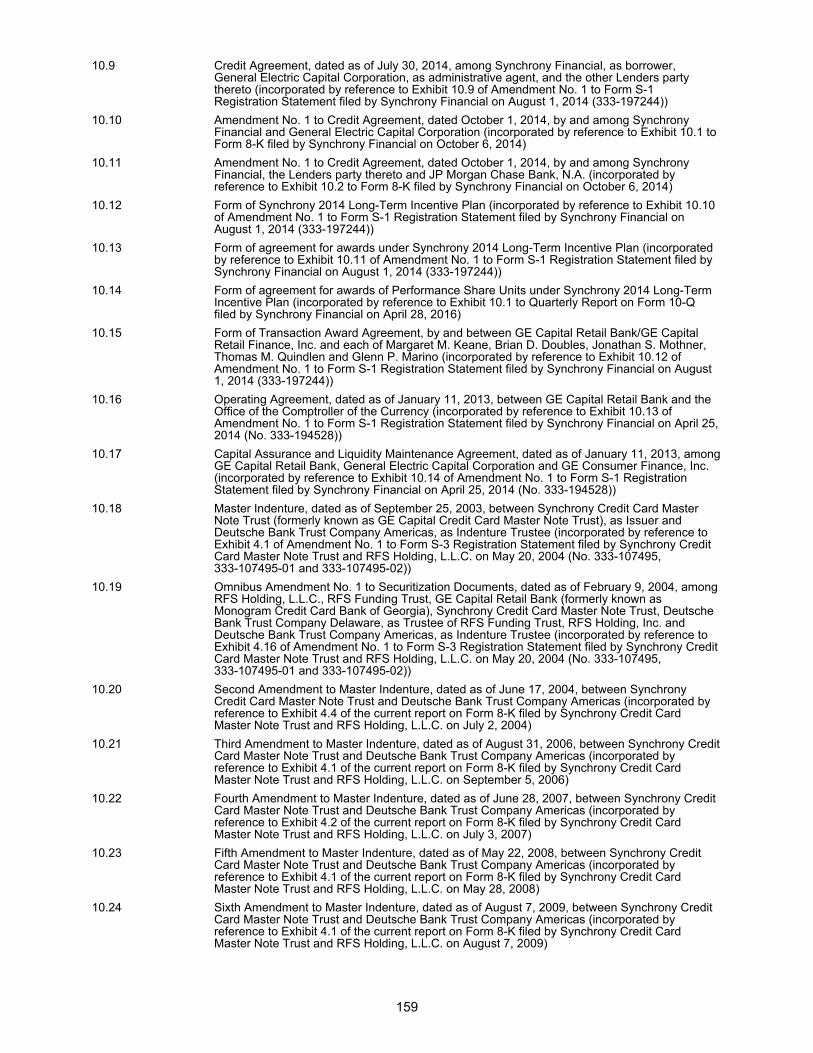
159
10.9 Credit Agreement, dated as of July 30, 2014, among Synchrony Financial, as borrower,General Electric Capital Corporation, as administrative agent, and the other Lenders partythereto (incorporated by reference to Exhibit 10.9 of Amendment No. 1 to Form S-1Registration Statement filed by Synchrony Financial on August 1, 2014 (333-197244))
10.10 Amendment No. 1 to Credit Agreement, dated October 1, 2014, by and among SynchronyFinancial and General Electric Capital Corporation (incorporated by reference to Exhibit 10.1 toForm 8-K filed by Synchrony Financial on October 6, 2014)
10.11 Amendment No. 1 to Credit Agreement, dated October 1, 2014, by and among SynchronyFinancial, the Lenders party thereto and JP Morgan Chase Bank, N.A. (incorporated byreference to Exhibit 10.2 to Form 8-K filed by Synchrony Financial on October 6, 2014)
10.12 Form of Synchrony 2014 Long-Term Incentive Plan (incorporated by reference to Exhibit 10.10of Amendment No. 1 to Form S-1 Registration Statement filed by Synchrony Financial onAugust 1, 2014 (333-197244))
10.13 Form of agreement for awards under Synchrony 2014 Long-Term Incentive Plan (incorporatedby reference to Exhibit 10.11 of Amendment No. 1 to Form S-1 Registration Statement filed bySynchrony Financial on August 1, 2014 (333-197244))
10.14 Form of agreement for awards of Performance Share Units under Synchrony 2014 Long-TermIncentive Plan (incorporated by reference to Exhibit 10.1 to Quarterly Report on Form 10-Qfiled by Synchrony Financial on April 28, 2016)
10.15 Form of Transaction Award Agreement, by and between GE Capital Retail Bank/GE CapitalRetail Finance, Inc. and each of Margaret M. Keane, Brian D. Doubles, Jonathan S. Mothner,Thomas M. Quindlen and Glenn P. Marino (incorporated by reference to Exhibit 10.12 ofAmendment No. 1 to Form S-1 Registration Statement filed by Synchrony Financial on August1, 2014 (333-197244))
10.16 Operating Agreement, dated as of January 11, 2013, between GE Capital Retail Bank and theOffice of the Comptroller of the Currency (incorporated by reference to Exhibit 10.13 ofAmendment No. 1 to Form S-1 Registration Statement filed by Synchrony Financial on April 25,2014 (No. 333-194528))
10.17 Capital Assurance and Liquidity Maintenance Agreement, dated as of January 11, 2013, amongGE Capital Retail Bank, General Electric Capital Corporation and GE Consumer Finance, Inc.(incorporated by reference to Exhibit 10.14 of Amendment No. 1 to Form S-1 RegistrationStatement filed by Synchrony Financial on April 25, 2014 (No. 333-194528))
10.18 Master Indenture, dated as of September 25, 2003, between Synchrony Credit Card MasterNote Trust (formerly known as GE Capital Credit Card Master Note Trust), as Issuer andDeutsche Bank Trust Company Americas, as Indenture Trustee (incorporated by reference toExhibit 4.1 of Amendment No. 1 to Form S-3 Registration Statement filed by Synchrony CreditCard Master Note Trust and RFS Holding, L.L.C. on May 20, 2004 (No. 333-107495,333-107495-01 and 333-107495-02))
10.19 Omnibus Amendment No. 1 to Securitization Documents, dated as of February 9, 2004, amongRFS Holding, L.L.C., RFS Funding Trust, GE Capital Retail Bank (formerly known asMonogram Credit Card Bank of Georgia), Synchrony Credit Card Master Note Trust, DeutscheBank Trust Company Delaware, as Trustee of RFS Funding Trust, RFS Holding, Inc. andDeutsche Bank Trust Company Americas, as Indenture Trustee (incorporated by reference toExhibit 4.16 of Amendment No. 1 to Form S-3 Registration Statement filed by Synchrony CreditCard Master Note Trust and RFS Holding, L.L.C. on May 20, 2004 (No. 333-107495,333-107495-01 and 333-107495-02))
10.20 Second Amendment to Master Indenture, dated as of June 17, 2004, between SynchronyCredit Card Master Note Trust and Deutsche Bank Trust Company Americas (incorporated byreference to Exhibit 4.4 of the current report on Form 8-K filed by Synchrony Credit CardMaster Note Trust and RFS Holding, L.L.C. on July 2, 2004)
10.21 Third Amendment to Master Indenture, dated as of August 31, 2006, between Synchrony CreditCard Master Note Trust and Deutsche Bank Trust Company Americas (incorporated byreference to Exhibit 4.1 of the current report on Form 8-K filed by Synchrony Credit CardMaster Note Trust and RFS Holding, L.L.C. on September 5, 2006)
10.22 Fourth Amendment to Master Indenture, dated as of June 28, 2007, between Synchrony CreditCard Master Note Trust and Deutsche Bank Trust Company Americas (incorporated byreference to Exhibit 4.2 of the current report on Form 8-K filed by Synchrony Credit CardMaster Note Trust and RFS Holding, L.L.C. on July 3, 2007)
10.23 Fifth Amendment to Master Indenture, dated as of May 22, 2008, between Synchrony CreditCard Master Note Trust and Deutsche Bank Trust Company Americas (incorporated byreference to Exhibit 4.1 of the current report on Form 8-K filed by Synchrony Credit CardMaster Note Trust and RFS Holding, L.L.C. on May 28, 2008)
10.24 Sixth Amendment to Master Indenture, dated as of August 7, 2009, between Synchrony CreditCard Master Note Trust and Deutsche Bank Trust Company Americas (incorporated byreference to Exhibit 4.1 of the current report on Form 8-K filed by Synchrony Credit CardMaster Note Trust and RFS Holding, L.L.C. on August 7, 2009)

160
10.25 Seventh Amendment to Master Indenture, dated as of January 21, 2014, between SynchronyCredit Card Master Note Trust and Deutsche Bank Trust Company Americas (incorporated byreference to Exhibit 4.1 of the current report on Form 8-K filed by Synchrony Credit CardMaster Note Trust and RFS Holding, L.L.C. on January 21, 2014)
10.26 Eighth Amendment to Master Indenture and Omnibus Supplement to Specified IndentureSupplements, dated as of March 11, 2014, between Synchrony Credit Card Master Note Trustand Deutsche Bank Trust Company Americas (incorporated by reference to Exhibit 4.1 of thecurrent report on Form 8-K filed by Synchrony Credit Card Master Note Trust and RFS Holding,L.L.C. on March 14, 2014)
10.27 Ninth Amendment to Master Indenture, dated as of November 24, 2015, between SynchronyCredit Card Master Note Trust and Deutsche Bank Trust Company Americas (incorporated byreference to Exhibit 4.1 of the current report on Form 8-K filed by Synchrony Credit CardMaster Note Trust and RFS Holding, L.L.C. on November 25, 2015)
10.28 Ninth Amendment to Master Indenture, dated as of November 24, 2015, between SynchronyCredit Card Master Note Trust and Deutsche Bank Trust Company Americas (incorporated byreference to Exhibit 4.1 of the current report on Form 8-K filed by Synchrony Credit CardMaster Note Trust and RFS Holding, L.L.C. on November 25, 2015)
10.29 Form of Indenture Supplement, between Synchrony Credit Card Master Note Trust andDeutsche Bank Trust Company Americas (incorporated by reference to Exhibit 4.8 of Form S-3Registration Statement filed by Synchrony Credit Card Master Note Trust and RFS Holding,L.L.C. on May 16, 2012 (333-181466))
10.30 Form of Indenture Supplement, between Synchrony Credit Card Master Note Trust andDeutsche Bank Trust Company Americas (incorporated by reference to Exhibit 4.12 of FormSF-3 Registration Statement filed by Synchrony Credit Card Master Note Trust and RFSHolding, L.L.C. on February 19, 2016 (333-206176))
10.31 Form of VFN Indenture Supplement, between Synchrony Credit Card Master Note Trust andDeutsche Bank Trust Company Americas (incorporated by reference to Exhibit 10.24 ofAmendment No. 1 to Form S-1 Registration Statement filed by Synchrony Financial on August1, 2014 (333-197244))
10.32 Form of Loan Agreement (VFN Series, Class A), among Synchrony Credit Card Master NoteTrust, the Lenders party thereto from time to time, and the Managing Agents party thereto fromtime to time (incorporated by reference to Exhibit 10.25 of Amendment No. 1 to Form S-1Registration Statement filed by Synchrony Financial on August 1, 2014 (333-197244))
10.33 Trust Agreement, dated as of September 25, 2003, between RFS Holding, L.L.C. and The Bankof New York (Delaware) (incorporated by reference to Exhibit 4.3 of Amendment No. 1 to FormS-3 Registration Statement filed by Synchrony Credit Card Master Note Trust and RFSHolding, L.L.C. on May 20, 2004 (No. 333-107495, 333-107495-01 and 333-107495-02))
10.34 First Amendment to Trust Agreement, dated as of January 21, 2014, between RFS Holding,L.L.C. and BNY Mellon Trust of Delaware (incorporated by reference to Exhibit 4.2 of thecurrent report on Form 8-K filed by Synchrony Credit Master Note Trust and RFS Holding,L.L.C. on January 21, 2014)
10.35 Second Amendment to Trust Agreement, dated as of September 8, 2014, between RFSHolding, L.L.C. and BNY Mellon Trust of Delaware (incorporated by reference to Exhibit 4.1 ofthe current report on Form 8-K filed by Synchrony Credit Master Note Trust and RFS Holding,L.L.C. on September 11, 2014)
10.36 Custody and Control Agreement, dated as of September 25, 2003 by and among DeutscheBank Trust Company of Americas, in its capacity as Custodian and in its capacity as IndentureTrustee, and Synchrony Credit Card Master Note Trust (incorporated by reference to Exhibit4.8 of Amendment No. 1 to Form S-3 Registration Statement filed by Synchrony Credit CardMaster Note Trust and RFS Holding, L.L.C. on May 20, 2004 (No. 333-107495, 333-107495-01and 333-107495-02))
10.37 Receivables Sale Agreement, dated as of June 27, 2003, between GE Capital Retail Bank(formerly known as Monogram Credit Card Bank of Georgia) and RFS Holding, L.L.C.(incorporated by reference to Exhibit 4.9 of Amendment No. 1 to Form S-3 RegistrationStatement filed by Synchrony Credit Card Master Note Trust and RFS Holding, L.L.C. on May20, 2004 (No. 333-107495, 333-107495-01 and 333-107495-02))
10.38 RSA Assumption Agreement and Second Amendment to Receivables Sale Agreement, datedas of February 7, 2005, between GE Capital Retail Bank (formerly known as GE Money Bank)and RFS Holding, L.L.C. (incorporated by reference to Exhibit 4.2 of the current report on Form8-K filed by Synchrony Credit Card Master Note Trust and RFS Holding, L.L.C. on February 11,2005)
10.39 Third Amendment to Receivables Sale Agreement, dated as of December 21, 2006, betweenGE Capital Retail Bank (formerly known as GE Money Bank) and RFS Holding, L.L.C.(incorporated by reference to Exhibit 4.1 of the current report on Form 8-K filed by SynchronyCredit Card Master Note Trust and RFS Holding, L.L.C. on December 21, 2006)
10.40 Fourth Amendment to Receivables Sale Agreement, dated as of May 21, 2008, between GECapital Retail Bank (formerly known as GE Money Bank) and RFS Holding, L.L.C.(incorporated by reference to Exhibit 4.2 of the current report on Form 8-K filed by SynchronyCredit Card Master Note Trust and RFS Holding, L.L.C. on May 28, 2008)

161
10.41 Designation of Removed Accounts and Fifth Amendment to Receivables Sale Agreement,dated as of December 29, 2008, between GE Capital Retail Bank (formerly known as GEMoney Bank) and RFS Holding, L.L.C. (incorporated by reference to Exhibit 4.1 of the currentreport on Form 8-K filed by Synchrony Credit Card Master Note Trust and RFS Holding, L.L.C.on December 30, 2008)
10.42 Designation of Removed Accounts and Sixth Amendment to Receivables Sale Agreement,dated as of February 26, 2009, between GE Capital Retail Bank (formerly known as GE MoneyBank) and RFS Holding, L.L.C. (incorporated by reference to Exhibit 4.1 of the current reporton Form 8-K filed by Synchrony Credit Card Master Note Trust and RFS Holding, L.L.C. onFebruary 26, 2009)
10.43 Seventh Amendment to Receivables Sale Agreement, dated as of November 23, 2010,between GE Capital Retail Bank (formerly known as GE Money Bank), and RFS Holding,L.L.C. (incorporated by reference to Exhibit 4.1 of the current report on Form 8-K filed bySynchrony Credit Card Master Note Trust and RFS Holding, L.L.C. on November 24, 2010)
10.44 Eighth Amendment to Receivables Sale Agreement, dated as of March 20, 2012, among GECapital Retail Bank, RFS Holding, Inc., PLT Holding, L.L.C. and RFS Holding, L.L.C.(incorporated by reference to Exhibit 4.1 of the current report on Form 8-K filed by SynchronyCredit Card Master Note Trust and RFS Holding, L.L.C. on March 21, 2012)
10.45 Ninth Amendment to Receivables Sale Agreement, dated as of March 11, 2014, among GECapital Retail Bank, RFS Holding, Inc., PLT Holding, L.L.C. and RFS Holding, L.L.C.(incorporated by reference to Exhibit 4.2 of the current report on Form 8-K filed by SynchronyCredit Card Master Note Trust and RFS Holding, L.L.C. on March 14, 2014)
10.46 Designation of Removed Accounts and Tenth Amendment to Receivables Sale Agreement,dated as of November 7, 2014, among Synchrony Bank (formerly known as GE Capital RetailBank), RFS Holding Inc., PLT Holding, L.L.C. and RFS Holding, L.L.C. (incorporated byreference to Exhibit 4.1 of the current report on Form 8-K filed by Synchrony Credit CardMaster Note Trust and RFS Holding, L.L.C. on November 14, 2014)
10.47 Eleventh Amendment to Receivables Sale Agreement, dated as of March 3, 2016 amongSynchrony Bank (formerly known as GE Capital Retail Bank), RFS Holding Inc., PLT Holding,L.L.C. and RFS Holding, L.L.C. (incorporated by reference to Exhibit 4.3 of the current reporton Form 8-K filed by Synchrony Credit Card Master Note Trust and RFS Holding, L.L.C. onMarch 7, 2016)
10.48 Transfer Agreement, dated as of September 25, 2003, between RFS Holding, L.L.C. andSynchrony Credit Card Master Note Trust (incorporated by reference to Exhibit 4.12 ofAmendment No. 1 to Form S-3 Registration Statement filed by Synchrony Credit Card MasterNote Trust and RFS Holding, L.L.C. on May 20, 2004 (No. 333-107495, 333-107495-01 and333-107495-02))
10.49 Second Amendment to Transfer Agreement, dated as of June 17, 2004, between RFS Holding,L.L.C. and Synchrony Credit Card Master Note Trust (incorporated by reference to Exhibit 4.3of the current report on Form 8-K filed by Synchrony Credit Card Master Note Trust and RFSHolding, L.L.C. on July 2, 2004)
10.50 Third Amendment to Transfer Agreement, dated as of November 21, 2004, between RFSHolding, L.L.C. and Synchrony Credit Card Master Note Trust (incorporated by reference toExhibit 4.1 of the current report on Form 8-K filed by Synchrony Credit Card Master Note Trustand RFS Holding, L.L.C. on November 24, 2004)
10.51 Fourth Amendment to Transfer Agreement, dated as of August 31, 2006, between RFSHolding, L.L.C. and Synchrony Credit Card Master Note Trust (incorporated by reference toExhibit 4.2 of the current report on Form 8-K filed by Synchrony Credit Card Master Note Trustand RFS Holding, L.L.C. on September 5, 2006)
10.52 Fifth Amendment to Transfer Agreement, dated as of December 21, 2006, between RFSHolding, L.L.C. and Synchrony Credit Card Master Note Trust (incorporated by reference toExhibit 4.2 of the current report on Form 8-K filed by Synchrony Credit Card Master Note Trustand RFS Holding, L.L.C. on December 21, 2006)
10.53 Sixth Amendment to Transfer Agreement, dated as of May 21, 2008, between RFS Holding,L.L.C. and Synchrony Credit Card Master Note Trust (incorporated by reference to Exhibit 4.4of the current report on Form 8-K filed by Synchrony Credit Card Master Note Trust and RFSHolding, L.L.C. on May 28, 2008)
10.54 Reassignment of Receivables in Removed Accounts and Seventh Amendment to TransferAgreement, dated as of December 29, 2008, between RFS Holding, L.L.C. and SynchronyCredit Card Master Note Trust (incorporated by reference to Exhibit 4.2 of the current report onForm 8-K filed by Synchrony Credit Card Master Note Trust and RFS Holding, L.L.C. onDecember 30, 2008)
10.55 Reassignment No. 4 of Receivables in Removed Accounts and Eighth Amendment to TransferAgreement, dated as of February 26, 2009, between RFS Holding, L.L.C. and SynchronyCredit Card Master Note Trust (incorporated by reference to Exhibit 4.2 of the current report onForm 8-K filed by Synchrony Credit Card Master Note Trust and RFS Holding, L.L.C. onFebruary 26, 2009)

162
10.56 Ninth Amendment to Transfer Agreement, dated as of March 31, 2010, between RFS Holding,L.L.C. and Synchrony Credit Card Master Note Trust (incorporated by reference to Exhibit 4.2of the current report on Form 8-K filed by Synchrony Credit Card Master Note Trust and RFSHolding, L.L.C. on March 31, 2010)
10.57 Tenth Amendment to Transfer Agreement, dated as of March 20, 2012, between RFS Holding,L.L.C. and Synchrony Credit Card Master Note Trust (incorporated by reference to Exhibit 4.2of the current report on Form 8-K filed by Synchrony Credit Card Master Note Trust and RFSHolding, L.L.C. on March 21, 2012)
10.58 Eleventh Amendment to Transfer Agreement, dated as of March 3, 2016, between RFSHolding, L.L.C. and Synchrony Credit Card Master Note Trust (incorporated by reference toExhibit 4.2 of the current report on Form 8-K filed by Synchrony Credit Card Master Note Trustand RFS Holding, L.L.C. on March 7, 2016)
10.59 Servicing Agreement, dated as of June 27, 2003, by and among RFS Funding Trust SynchronyCredit Card Master Note Trust and General Electric Capital Corporation, successor to GECapital Retail Bank (formerly known as Monogram Credit Card Bank of Georgia) (incorporatedby reference to Exhibit 4.13 of Amendment No. 1 to Form S-3 Registration Statement filed bySynchrony Credit Card Master Note Trust and RFS Holding, L.L.C. on May 20, 2004 (No.333-107495, 333-107495-01 and 333-107495-02))
10.60 Servicing Assumption Agreement, dated as of February 7, 2005, by GE Capital Retail Bank(formerly known as GE Money Bank) (incorporated by reference to Exhibit 4.1 of the currentreport on Form 8-K filed by Synchrony Credit Card Master Note Trust and RFS Holding, L.L.C.on February 11, 2005)
10.61 First Amendment to Servicing Agreement, dated as of May 22, 2006, between SynchronyCredit Card Master Note Trust and GE Capital Retail Bank (formerly known as GE MoneyBank) (incorporated by reference to Exhibit 4.1 of the current report on Form 8-K filed bySynchrony Credit Card Master Note Trust and RFS Holding, L.L.C. on May 25, 2006)
10.62 Second Amendment to Servicing Agreement, dated as of June 28, 2007, between SynchronyCredit Card Master Note Trust and GE Capital Retail Bank (formerly known as GE MoneyBank) (incorporated by reference to Exhibit 4.1 of the current report on Form 8-K filed bySynchrony Credit Card Master Note Trust and RFS Holding, L.L.C. on June 28, 2007)
10.63 Instrument of Resignation, Appointment and Acceptance and Third Amendment to ServicingAgreement, dated as of May 22, 2008, by and among Synchrony Credit Card Master NoteTrust, GE Capital Retail Bank (formerly known as GE Money Bank) and General ElectricCapital Corporation (incorporated by reference to Exhibit 4.3 of the current report on Form 8-Kfiled by Synchrony Credit Card Master Note Trust and RFS Holding, L.L.C. on May 28, 2008)
10.64 Fourth Amendment to Servicing Agreement, dated as of July 16, 2014, between SynchronyCredit Card Master Note Trust and General Electric Capital Corporation (incorporated byreference to Exhibit 4.14 of the current report on Form 8-K filed by Synchrony Credit CardMaster Note Trust and RFS Holding, L.L.C. on July 16, 2014)
10.65 Fifth Amendment to Servicing Agreement, dated as of November 24, 2015, between SynchronyCredit Card Master Note Trust and General Electric Capital Corporation (incorporated byreference to Exhibit 4.2 of the current report on Form 8-K filed by Synchrony Credit CardMaster Note Trust and RFS Holding, L.L.C. on November 25, 2015)
10.66 Instrument of Resignation, Appointment and Acceptance, dated as of December 2, 2015, byand among Synchrony Credit Card Master Note Trust, General Electric Capital LLC andSynchrony Financial (incorporated by reference to Exhibit 4.1 of the current report on Form 8-Kfiled by Synchrony Credit Card Master Note Trust and RFS Holding, L.L.C. on December 4,2015)
10.67 Servicer Performance Guaranty, dated as of December 2, 2015, between General ElectricCapital LLC and Synchrony Financial (incorporated by reference to Exhibit 4.2 of the currentreport on Form 8-K filed by Synchrony Credit Card Master Note Trust and RFS Holding, L.L.C.on December 4, 2015)
10.68 Administration Agreement, dated as of September 25, 2003, among Synchrony Credit CardMaster Note Trust, General Electric Capital Corporation, as Administrator, and The Bank ofNew York (Delaware), not in its individual capacity but solely as Trustee (incorporated byreference to Exhibit 4.14 of Amendment No. 1 to Form S-3 Registration Statement filed on May20, 2004 (No. 333-107495, 333-107495-01 and 333-107495-02))
10.69 Asset Representations Review Agreement, dated as of March 4, 2016, among SynchronyBank, RFS Holding, L.L.C., Synchrony Credit Card Master Note Trust, Synchrony Financial andClayton Fixed Income Services LLC (incorporated by reference to Exhibit 4.4 of the currentreport on Form 8-K filed by Synchrony Credit Card Master Note Trust and RFS Holding, L.L.C.on March 7, 2016)
10.70 First Amendment to Administration Agreement, dated as of May 4, 2009, between SynchronyCredit Card Master Note Trust and General Electric Capital Corporation (incorporated byreference to Exhibit 4.1 of the current report on Form 8-K filed by Synchrony Credit CardMaster Note Trust and RFS Holding, L.L.C. on May 6, 2009)

163
10.71 Master Indenture, dated as of February 29, 2012, between GE Sales Finance Master Trust andDeutsche Bank Trust Company Americas (incorporated by reference to Exhibit 10.55 ofAmendment No. 1 to Form S-1 Registration Statement filed by Synchrony Financial on April 25,2014 (No. 333-194528))
10.72 Supplement No. 1 to Master Indenture, dated as of September 19, 2012, between GE SalesFinance Master Trust and Deutsche Bank Trust Company Americas (incorporated by referenceto Exhibit 10.56 of Amendment No. 1 to Form S-1 Registration Statement filed by SynchronyFinancial on April 25, 2014 (No. 333-194528))
10.73 Supplement No. 2 to Master Indenture, dated as of March 21, 2014, between GE SalesFinance Master Trust and Deutsche Bank Trust Company Americas (incorporated by referenceto Exhibit 10.57 of Amendment No. 1 to Form S-1 Registration Statement filed by SynchronyFinancial on April 25, 2014 (No. 333-194528))
10.74 Form of Indenture Supplement, between GE Sales Finance Master Trust and Deutsche BankTrust Company Americas (incorporated by reference to Exhibit 10.58 of Amendment No. 1 toForm S-1 Registration Statement filed by Synchrony Financial on August 1, 2014(333-197244))
10.75 Form of Loan Agreement, among GE Sales Finance Master Trust, the Lenders party theretofrom time to time, and the Lender Group Agents for the Lender Groups party thereto from timeto time (incorporated by reference to Exhibit 10.59 of Amendment No. 1 to Form S-1Registration Statement filed by Synchrony Financial on August 1, 2014 (333-197244))
10.76 Amended and Restated Trust Agreement of GE Sales Finance Master Trust, dated as ofFebruary 29, 2012, between GE Sales Finance Holding, L.L.C. and BNY Mellon Trust ofDelaware (incorporated by reference to Exhibit 10.60 of Amendment No. 1 to Form S-1Registration Statement filed by Synchrony Financial on April 25, 2014 (No. 333-194528))
10.77 Amended and Restated Receivables Participation Agreement, dated as of February 29, 2012,between GE Capital Retail Bank and GEMB Lending Inc. (incorporated by reference to Exhibit10.61 of Amendment No. 1 to Form S-1 Registration Statement filed by Synchrony Financial onApril 25, 2014 (No. 333-194528))
10.78 First Amendment to Amended and Restated Receivables Participation Agreement, dated as ofAugust 17, 2012, between GE Capital Retail Bank and GEMB Lending Inc. (incorporated byreference to Exhibit 10.62 of Amendment No. 1 to Form S-1 Registration Statement filed bySynchrony Financial on April 25, 2014 (No. 333-194528))
10.79 Second Amendment to Amended and Restated Receivables Participation Agreement, dated asof August 5, 2013, between GE Capital Retail Bank and GEMB Lending Inc. (incorporated byreference to Exhibit 10.63 of Amendment No. 1 to Form S-1 Registration Statement filed bySynchrony Financial on April 25, 2014 (No. 333-194528))
10.80 Participation Interest Sale Agreement, dated as of February 29, 2012, between GEMB LendingInc. and GE Sales Finance Holding, L.L.C. (incorporated by reference to Exhibit 10.64 ofAmendment No. 1 to Form S-1 Registration Statement filed by Synchrony Financial on April 25,2014 (No. 333-194528))
10.81 First Amendment to Participation Interest Sale Agreement, dated as of September 19, 2012,between GEMB Lending Inc. and GE Sales Finance Holding, L.L.C. (incorporated by referenceto Exhibit 10.65 of Amendment No. 1 to Form S-1 Registration Statement filed by SynchronyFinancial on April 25, 2014 (No. 333-194528))
10.82 Second Amendment to Participation Interest Sale Agreement, dated as of March 21, 2014,between GEMB Lending Inc. and GE Sales Finance Holding, L.L.C. (incorporated by referenceto Exhibit 10.66 of Amendment No. 1 to Form S-1 Registration Statement filed by SynchronyFinancial on April 25, 2014 (No. 333-194528))
10.83 Transfer Agreement, dated as of February 29, 2012, between GE Sales Finance Holding,L.L.C. and GE Sales Finance Master Trust (incorporated by reference to Exhibit 10.67 ofAmendment No. 1 to Form S-1 Registration Statement filed by Synchrony Financial on April 25,2014 (No. 333-194528))
10.84 First Amendment to Transfer Agreement, dated as of September 19, 2012, between GE SalesFinance Holding, L.L.C. and GE Sales Finance Master Trust (incorporated by reference toExhibit 10.68 of Amendment No. 1 to Form S-1 Registration Statement filed by SynchronyFinancial on April 25, 2014 (No. 333-194528))
10.85† Second Amendment to Transfer Agreement, dated as of March 21, 2014, between GE SalesFinance Holding, L.L.C. and GE Sales Finance Master Trust (incorporated by reference toExhibit 10.69 of Amendment No. 1 to Form S-1 Registration Statement filed by SynchronyFinancial on April 25, 2014 (No. 333-194528))
10.86† Servicing Agreement, dated as of February 29, 2012, between GE Capital Retail Bank and GESales Finance Master Trust (incorporated by reference to Exhibit 10.70 of Amendment No. 1 toForm S-1 Registration Statement filed by Synchrony Financial on April 25, 2014 (No.333-194528))
10.87 Administration Agreement, dated as of February 29, 2012, between GE Sales Finance MasterTrust and GE Capital Retail Bank (incorporated by reference to Exhibit 10.71 of AmendmentNo. 1 to Form S-1 Registration Statement filed by Synchrony Financial on April 25, 2014 (No.333-194528))

164
10.88 First Amended and Restated Technology Sourcing Agreement, dated as of December 10, 1998,between Retailer Credit Services, Inc. and First Data Resources, Inc., as amended(incorporated by reference to Exhibit 10.72 of Amendment No. 4 to Form S-1 RegistrationStatement filed by Synchrony Financial on June 27, 2014 (No. 333-194528))
10.89 First Amended and Restated Production Services Agreement, dated as of December 1, 2009,by and between Retailer Credit Services, Inc. and First Data Resources, LLC, as amended(incorporated by reference to Exhibit 10.73 of Amendment No. 4 to Form S-1 RegistrationStatement filed by Synchrony Financial on June 27, 2014 (No. 333-194528))
10.90 Stock Contribution Agreement, dated as of April 1, 2013, between GE Capital Retail FinanceCorporation and GE Consumer Finance, Inc. (incorporated by reference to Exhibit 10.74 ofAmendment No. 3 to Form S-1 Registration Statement filed by Synchrony Financial on June 6,2014 (No. 333-194528))
10.91 Stock Contribution Agreement, dated as of August 5, 2013, between GE Capital Retail FinanceCorporation and General Electric Capital Corporation (incorporated by reference to Exhibit10.75 of Amendment No. 3 to Form S-1 Registration Statement filed by Synchrony Financial onJune 6, 2014 (No. 333-194528))
10.92 General Electric Company 2007 Long-Term Incentive Plan (as amended and restated April 25,2012) (incorporated by reference to Exhibit 99.1 of the Registration Statement on Form S-8filed by General Electric Company on May 4, 2012 (No. 333-181177))
10.93 Form of Agreement for Stock Option Grants to Executive Officers under the General ElectricCompany 2007 Long-term Incentive Plan, as amended January 1, 2009 (incorporated byreference to Exhibit 10(n) of the annual report on Form 10-K filed by General Electric Companyon February 18, 2009)
10.94 Form of Agreement for Periodic Restricted Stock Unit Grants to Executive Officers under theGeneral Electric Company 2007 Long-term Incentive Plan (incorporated by reference to Exhibit10.4 of the current report on Form 8-K filed by General Electric Company on April 27, 2007)
10.95 Form of Agreement for Long Term Performance Award Grants to Executive Officers under theGeneral Electric Company 2007 Long-term Incentive Plan (as amended and restated April 25,2012) (incorporated by reference to Exhibit 10(a) of the quarterly report on Form 10-Q filed byGeneral Electric Company on July 26, 2013)
10.96 General Electric Supplementary Pension Plan, as amended effective January 1, 2011(incorporated by reference to Exhibit 10(g) of the annual report on Form 10-K filed by GeneralElectric Company on February 25, 2011)
10.97 GE Excess Benefits Plan, effective January 1, 2009 (incorporated by reference to Exhibit 10(k)to the annual report on Form 10-K filed by General Electric Company on February 18, 2009)
10.98 General Electric Leadership Life Insurance Program, effective January 1, 1994 (incorporatedby reference to Exhibit 10(r) to the annual report on Form 10-K filed by General ElectricCompany on March 11, 1994)
10.99 General Electric Supplemental Life Insurance Program, as amended February 8, 1991(incorporated by reference to Exhibit 10(i) to the annual report on Form 10-K filed by GeneralElectric Company for the fiscal year ended December 31, 1990)
10.100 General Electric 2006 Executive Deferred Salary Plan, as amended January 1, 2009(incorporated by reference to Exhibit 10(l) to the annual report on Form 10-K filed by GeneralElectric Company on February 18, 2009)
10.101 Amendment to Nonqualified Deferred Compensation Plans, dated as of December 14, 2004(incorporated by reference to Exhibit 10(w) to the annual report on Form 10-K filed by GeneralElectric Company on March 1, 2005)
10.102 General Electric Financial Planning Program, as amended through September 1993(incorporated by reference to Exhibit 10(h) to the annual report on Form 10-K filed by GeneralElectric Company on March 11, 1994)
10.103 GE Capital Executive Incentive Compensation Plan (incorporated by reference to Exhibit 10.87of Amendment No. 4 to Form S-1 Registration Statement filed by Synchrony Financial on June27, 2014 (No. 333-194528))
10.104 Assumption Agreement, dated as of June 20, 2014, by and between General Electric CapitalCorporation and Synchrony Financial (incorporated by reference to Exhibit 10.88 ofAmendment No. 4 to Form S-1 Registration Statement filed by Synchrony Financial on June27, 2014 (No. 333-194528))
10.105 Form of Indemnification Agreement for directors, executive officers and key employees(incorporated by reference to Exhibit 10.89 of Amendment No. 1 to Form S-1 RegistrationStatement filed by Synchrony Financial on August 1, 2014 (333-197244))
10.106 Sub-Servicing Agreement, dated as of July 30, 2014, between Synchrony Financial andGeneral Electric Capital Corporation (incorporated by reference to Exhibit 10.90 of AmendmentNo. 1 to Form S-1 Registration Statement filed by Synchrony Financial on August 1, 2014(333-197244))
10.107 Synchrony Financial Non-Employee Director Deferred Compensation Plan (incorporated byreference to Exhibit 10.91 of Amendment No. 5 to Form S-1 Registration Statement filed bySynchrony Financial on July 18, 2014 (No. 33-194528))

165
10.108 Revolving Credit Agreement, dated as of March 29, 1996, between GE Capital Consumer CardCo. (Macy’s) and General Electric Capital Corporation (incorporated by reference to Exhibit10.93 of Amendment No. 5 to Form S-1 Registration Statement filed by Synchrony Financial onJuly 18, 2014 (No. 333-194528))
10.109 Revolving Credit Agreement, dated as of March 29, 1996, between GE Capital Consumer CardCo. and General Electric Capital Corporation (incorporated by reference to Exhibit 10.94 ofAmendment No. 5 to Form S-1 Registration Statement filed by Synchrony Financial on July 18,2014 (No. 333-194528))
10.110 Revolving Credit Agreement, dated as of March 29, 1996, between GE Capital Consumer CardCo. (Macy’s) and GECFS, Inc. (Macy’s) (incorporated by reference to Exhibit 10.95 ofAmendment No. 5 to Form S-1 Registration Statement filed by Synchrony Financial on July 18,2014 (No. 333-194528))
10.111 Revolving Credit Agreement, dated as of March 29, 1996, between GE Capital Consumer CardCo. and GECFS, Inc. (Card Services) (incorporated by reference to Exhibit 10.96 ofAmendment No. 5 to Form S-1 Registration Statement filed by Synchrony Financial on July 18,2014 (No. 333-194528))
10.112 Amendment No. 1 to Revolving Credit Agreement, dated as of October 6, 1997, between GECapital Consumer Card Co. and GECFS, Inc. (Card Services) (incorporated by reference toExhibit 10.97 of Amendment No. 5 to Form S-1 Registration Statement filed by SynchronyFinancial on July 18, 2014 (No. 333-194528))
10.113 Revolving Credit Agreement, dated as of May 1996, between Monogram Credit Card Bank ofGeorgia and General Electric Capital Corporation (incorporated by reference to Exhibit 10.98 ofAmendment No. 5 to Form S-1 Registration Statement filed by Synchrony Financial on July 18,2014 (No. 333-194528))
10.114 Amendment No. 1 to Revolving Credit Agreement, dated as of April 18, 2003, betweenMonogram Credit Card Bank of Georgia and General Electric Capital Corporation (incorporatedby reference to Exhibit 10.99 of Amendment No. 5 to Form S-1 Registration Statement filed bySynchrony Financial on July 18, 2014 (No. 333-194528))
10.115 Amendment to Revolving Credit Agreements, dated as of October 1, 2008, between GE MoneyBank and General Electric Capital Corporation (incorporated by reference to Exhibit 10.100 ofAmendment No. 5 to Form S-1 Registration Statement filed by Synchrony Financial on July 18,2014 (No. 333-194528))
10.116 Amendment to Revolving Credit Agreements, dated as of June 13, 2012, between GE CapitalRetail Bank and General Electric Capital Corporation (incorporated by reference to Exhibit10.101 of Amendment No. 5 to Form S-1 Registration Statement filed by Synchrony Financialon July 18, 2014 (No. 333-194528))
10.117 Letter, dated as of March 20, 2013, from General Electric Capital Corporation to GE CapitalRetail Bank relating to revolving credit agreements (incorporated by reference to Exhibit 10.102of Amendment No. 5 to Form S-1 Registration Statement filed by Synchrony Financial on July18, 2014 (No. 333-194528))
10.118 Form of Synchrony Financial Deferred Compensation Plan (incorporated by reference toExhibit 10.1 to Form 8-K filed by Synchrony Financial on September 22, 2014)
10.119 First Amendment to the Synchrony Financial Deferred Compensation Plan (incorporated byreference to Exhibit 10.109 to 2014 Annual Report on Form 10-K filed by Synchrony Financialon February 23, 2015)
10.120 Form of Restricted Stock Unit and Non-Qualified Stock Option Award (incorporated byreference to Exhibit 10.2 to Form 8-K filed by Synchrony Financial on September 22, 2014)
10.121 Form of Synchrony Financial Annual Incentive Plan (incorporated by reference to Exhibit 10.1to Form 8-K filed by Synchrony Financial on December 12, 2014)
10.122 Form of Synchrony Financial Restoration Plan (incorporated by reference to Exhibit 10.1 toForm 8-K filed by Synchrony Financial on May 27, 2015)
10.123 Synchrony Financial Executive Severance Plan (incorporated by reference to Exhibit 10.2 toForm 8-K filed by Synchrony Financial on May 27, 2015)
10.124 First Amendment to the Synchrony Financial Restoration Plan (incorporated by reference toExhibit 10.118 to 2015 Annual Report on Form 10-K filed by Synchrony Financial on February25, 2016)
10.125 Second Amendment to the Synchrony Financial Restoration Plan (incorporated by reference toExhibit 10.119 to 2015 Annual Report on Form 10-K filed by Synchrony Financial on February25, 2016)
10.126 Form of Synchrony Financial Change in Control Severance Plan (incorporated by reference toExhibit 10.3 to Form 8-K filed by Synchrony Financial on May 27, 2015)
10.127 Services Agreement, dated as of September 15, 2015, between Retail Finance Servicing, LLCand First Data Resources, LLC (incorporated by reference to Exhibit 10.1 to Form 8-K filed bySynchrony Financial on September 15, 2015)†

166
10.128 Letter, dated as of October 19, 2015, delivered by General Electric Capital Corporation andacknowledged and agreed to by General Electric Company and Synchrony Financial(incorporated by reference to Exhibit 10.116 of Form S-4 Registration Statement filed bySynchrony Financial on October 16, 2015 (No. 333-207479))
12.1* Statement of Ratio of Earnings to Fixed Charges
21.1* Subsidiaries of the Registrant (incorporated by reference to Exhibit 21.1 to 2014 Annual Reporton Form 10-K filed by Synchrony Financial on February 23, 2015)
23.1* Consent of KPMG LLP24.1* Powers of Attorney (included on the signature page)31(a)* Certification Pursuant to Rules 13a-14(a) or 15d-14(a) under the Securities Exchange Act of
1934, as amended31(b)* Certification Pursuant to Rules 13a-14(a) or 15d-14(a) under the Securities Exchange Act of
1934, as amended32* Certification Pursuant to 18 U.S.C. Section 1350101 The following materials from Synchrony Financial’s Annual Report on Form 10-K for the year
ended December 31, 2016, formatted in XBRL (eXtensible Business Reporting Language); (i)Consolidated and Combined Statements of Earnings for the years ended December 31, 2016,2015 and 2014, (ii) Consolidated and Combined Statements of Comprehensive Income for theyears ended December 31, 2016, 2015 and 2014, (iii) Consolidated Statements of FinancialPosition at December 31, 2016 and 2015, (iv) Consolidated and Combined Statements ofChanges in Equity for the years ended December 31, 2016, 2015 and 2014, (v) Consolidatedand Combined Statements of Cash Flows for the years ended December 31, 2016, 2015 and2014, and (vi) Notes to Consolidated and Combined Financial Statements
______________________
* Filed electronically herewith.
† Confidential treatment granted to certain portions, which portions have been provided separately to the Securities and Exchange Commission.

About Synchrony FinancialSynchrony Financial (NYSE: SYF) is one of the nation’s premier consumer financial services companies. As the largest provider of private label credit cards in the United States*, we provide a range of credit products through a diverse group of national and regional retailers, local merchants, manufacturers, buying groups, industry associations and health and wellness providers. We deliver innovative analytics, payments, loyalty and financing solutions to help generate growth for our partners and offer financial flexibility to our customers. Through our partners’ over 365,000 locations across the United States and Canada, and their websites and mobile applications, we offer our customers private label credit cards, Dual Card™, and general purpose co-branded credit cards, promotional financing and installment lending, and loyalty programs. Through Synchrony Bank, we offer FDIC-insured savings products. Engage with us at: www.synchronyfinancial.com
*Based on purchase volume and receivables. The Nilson Report (April 2015, Issue #1062) — based on 2014 data.
SYNCHRONY FINANCIAL(NYSE: SYF) 777 Long Ridge RoadStamford, CT 06902
GENERAL INQUIRIES866-419-4096
INVESTOR INQUIRIES855-818-3056

Annual Report2016
www.synchronyfinancial.com
Synch
ron
y Fina
ncia
l An
nua
l Rep
ort 20
16