annual report & accounts 2016 - igi - … general insurance holdings limited international...
TRANSCRIPT

INTERNATIONAL GENERAL INSURANCE HOLDINGS LIMITED
ANNUAL REPORT & ACCOUNTS 2016
INTERNATIONAL GENERAL INSURANCE HOLDINGS LIMITED ANNUAL REPORT & ACCOUNTS 20162
INTERNATIONAL GENERAL INSURANCE HOLDINGS LIMITED
ANNUAL REPORT & ACCOUNTS 2016

INTERNATIONAL GENERAL INSURANCE HOLDINGS LIMITED ANNUAL REPORT & ACCOUNTS 2016
5INTERNATIONAL GENERAL INSURANCE HOLDINGS LIMITED ANNUAL REPORT & ACCOUNTS 20164
About us 6
Board of Directors 8
Letter from the Board 9
Financial highlights 10
Financial statements & accounts 12
CONTENTS

INTERNATIONAL GENERAL INSURANCE HOLDINGS LIMITED ANNUAL REPORT & ACCOUNTS 2016
7INTERNATIONAL GENERAL INSURANCE HOLDINGS LIMITED ANNUAL REPORT & ACCOUNTS 20166
3
12
5
4
6
1 BERMUDA 44 Church Street Hamilton HM 12 Bermuda
2 CASABLANCA 32-42, Bd Abdelmoumen Residence Walili 25 4th Floor P.O. Box 20000 Casablanca Morocco
3 LONDON 15-18 Lime Street London EC3M 7AN England
4 AMMAN 74 Abdel Hamid Sharaf St. P.O. Box 941428 Amman 11194 Jordan
5 DUBAIOffice 606, Level 6, Tower 1 Al Fattan Currency House, Dubai International Financial Centre, P.O. Box 506646, Dubai United Arab Emirates
6 LABUANLevel 1, LOT 7, Block F Saguking Commercial Building Jalan Patau – Patau 87000 Labuan Malaysia
KUALA LUMPUR Marketing Office 29th Floor, Menara TA One Jalan P Ramlee 50250 Kuala Lumpur Malaysia
ABOUT US
ENERGYEnergy Upstream Energy Downstream
MARINE & AVIATIONPorts & Terminals Marine Liability General Aviation
PROPERTYProperty Forestry Construction & Engineering Political Violence
PROFESSIONAL & FINANCIAL LIABILITIESFinancial InstitutionsProfessional Indemnity Directors’ & Officers’ Casualty
REINSURANCETreaty Reinsurance
BUSINESS SECTORS
OFFICE LOCATIONS
WE ARE A LEADING INTERNATIONAL SPECIALIST COMMERCIAL INSURER AND REINSURER, UNDERWRITING A DIVERSIFIED PORTFOLIO OF SPECIALTY LINES.
Established in 2001, we are an entrepreneurial business with a worldwide portfolio. Registered in the Dubai International Financial Centre with operations in Bermuda, London, Amman, Kuala Lumpur and Casablanca, we are renowned for delivering outstanding levels of service to our clients and brokers.

INTERNATIONAL GENERAL INSURANCE HOLDINGS LIMITED ANNUAL REPORT & ACCOUNTS 2016
9
The Board of Directors is pleased to announce the achievement of a good result for the year 2016 despite the continued competitive trading environment and downward pressure on rates. IGI’s underwriting teams maintained their focus on quality business and bottom line profit throughout these challenging times enabling us to produce a 10.3% Return on Capital. Our diversified geographic footprint and expertise in specialty lines, together with our long-standing broker-client relationships, mean that we are well placed to weather these market conditions.
Gross written premiums of US$231.4 million were down from US$242.3 million in 2015. The net profits for 2016 amounted to US$32.1 million compared to US$35.0 million for 2015. We achieved an 87% combined ratio.
Overall, the Group reported a rise in total assets of 7.55% to US$818.5 million and saw growth in shareholders’ equity of 9.25% to US$311.20 million. Investments rose from US$468.7 million in 2015 to US$493.0 million, while net investment income was up marginally from US$12.5 million in 2015 to US$12.8 million.
In 2016, IGI continued to invest in broadening the scope of its underwriting capabilities by expanding its business lines to include Directors’ and Officers’ business. Casualty operations were enhanced by the addition of General Liability and Legal Expenses. We have also added Renewable Energy as we see this as a future growth area within the Energy portfolio.
Last year we rebranded IGI to give it a fresh image. We are however still the same company with the same values of transparency and integrity with a commitment to deliver excellence to our clients and brokers. The Group’s next step is to raise awareness of IGI as a provider of specialist insurance through leadership, knowledge and expertise.
Our office in Casablanca, which opened in 2015, has given us access to the emerging markets within the region. IGI has been working closely with the local market by offering a wide range of our product lines. We firmly believe that our commitment to developing the region will produce long-term profitable growth. Our Dubai office continues to grow due to our expanded local underwriting capabilities, the introduction of new lines of business and increased profile.
MOHAMMAD ABU GHAZALEHChairman (Chairman and CEO, Fresh Del Monte Produce Inc. – Miami)
WASEF JABSHEH CEO & Vice Chairman
KHALIFA AL MULHEM Director (Chairman, National Polypropylene Company Limited – Saudi Arabia)
DAVID KING Director (Non-executive Director of the Board of Directors of Forex Capital Markets Limited)
SOUMITRA BISWASDirector
HANI JABSHEH Director (Co-founder Albawaba.com)
ABDULAZIZ AL BALUSHI Director (Group CEO of Oman International Development and Investment Company SAOG ‘OMINVEST’)
IGI’s underwriting teams maintained their focus on quality business and bottom line profit throughout these challenging times enabling us to produce a 10.3% Return on Capital.
BOARD OF DIRECTORS LETTER FROM THE BOARD
IGI’s culture is continually evolving as the business develops. However, it is firmly based on honesty and an entrepreneurial spirit. The Group continues to invest heavily in providing our underwriters and support services with a combination of analytical pricing, modelling and technological support systems required in today’s marketplace.
During 2016, IGI supported a number of both charitable and research organisations, whose works we recognise as contributing in vital fields such as cancer. We at IGI are also proud to support and promote various local and international cultural initiatives, and sporting activities.
In July 2016, Standard & Poor’s and A.M. Best reaffirmed IGI’s financial strength ratings of ‘A-’ Stable Outlook.
The Board of Directors would like to thank all our staff for their dedication and tremendous performance, as well as our clients for their continued support which has helped IGI complete another successful year. As we look ahead, we view future prospects with optimism. There is still plenty to be achieved in IGI’s evolution, and we are committed to working with our brokers and clients to enter the next phase of growth in a manner consistent with our philosophy of prudent underwriting and continued profitability.
INTERNATIONAL GENERAL INSURANCE HOLDINGS LIMITED ANNUAL REPORT & ACCOUNTS 20168

FINANCIAL HIGHLIGHTS
NET UNDERWRITING PROFIT
$50.69m
INVESTMENT INCOME
$12.8m
SHAREHOLDERS’ EQUITY
$311.20m
GROSS WRITTEN PREMIUM
$231.4m
PROFIT FOR THE PERIOD/YEAR
$32.1m
STABLE OUTLOOK RATINGS
A- by S&PA- by A.M. Best
INTERNATIONAL GENERAL INSURANCE HOLDINGS LIMITED ANNUAL REPORT & ACCOUNTS 201610
INTERNATIONAL GENERAL INSURANCE HOLDINGS LIMITED ANNUAL REPORT & ACCOUNTS 2016
11
OPINION
We have audited the consolidated financial statements of International General Insurance Holdings Ltd (‘the Company’) and its subsidiaries (together ‘the Group’), which comprise the consolidated statement of financial position as at December 31, 2016, and the consolidated statements of income, consolidated statement of comprehensive income, consolidated statement of changes in equity and consolidated statement of cash flows for the year then ended, and notes to the consolidated financial statements. including a summary of significant accounting policies.
In our opinion, the accompanying consolidated financial statements present fairly, in all material respects, the financial position of the Group as at December 31, 2016, and its financial performance and its cash flows for the year then ended in accordance with International Financial Reporting Standards (IFRSs).
BASIS FOR OPINION
We conducted our audit in accordance with International Standards on Auditing (ISAs). Our responsibilities under those standards, are further described in the Auditor’s Responsibilities for the Audit of the consolidated Financial Statements section of our report. We are independent of the Group in accordance with the International Ethics Standards Board for Accountants’ Code of Ethics for Professional Accountants (IESBA Code) together with the ethical requirements that are relevant to our audit of the consolidated financial statements in United Arab Emirates, and we have fulfilled our other ethical responsibilities in accordance with these requirements and the IESBA Code. We believe that the audit evidence we have obtained is sufficient and appropriate to provide a basis for our opinion.
RESPONSIBILITIES OF MANAGEMENT AND THOSE CHARGED WITH GOVERNANCE FOR THE CONSOLIDATED FINANCIAL STATEMENTS
Management is responsible for the preparation and fair presentation of the consolidated financial statements in accordance with IFRSs, and for such internal control as management determines is necessary to enable the preparation of consolidated financial statements that are free from material misstatement, whether due to fraud or error.
In preparing the consolidated financial statements, management is responsible for assessing the Group’s ability to continue as a going concern, disclosing, as applicable, matters related to going concern and using the going concern basis of accounting unless management either intends to liquidate the Group or to cease operations, or has no realistic alternative but to do so.
Those charged with governance are responsible for overseeing the Group’s financial reporting process.
AUDITOR’S RESPONSIBILITIES FOR THE AUDIT OF THE CONSOLIDATED FINANCIAL STATEMENTS
Our objectives are to obtain reasonable assurance about whether the consolidated financial statements as a whole are free from material misstatement, whether due to fraud or error, and to issue an auditor’s report that includes our opinion.
Reasonable assurance is a high level of assurance, but is not a guarantee that an audit conducted in accordance with ISAs will always detect a material misstatement when it exists. Misstatements can arise from fraud or error and are considered material if, individually or in the aggregate, they could reasonably be expected
to influence the economic decisions of users taken on the basis of these consolidated financial statements.
As part of an audit in accordance with ISAs, we exercise professional judgement and maintain professional scepticism throughout the audit. We also:
• Identify and assess the risks of material misstatement of the consolidated financial statements, whether due to fraud or error, design and perform audit procedures responsive to those risks, and obtain audit evidence that is sufficient and appropriate to provide a basis for our opinion. The risk of not detecting a material misstatement resulting from fraud is higher than for one resulting from error, as fraud may involve collusion, forgery, intentional omissions, misrepresentations, or the override of internal control.
• Obtain an understanding of internal control relevant to the audit in order to design audit procedures that are appropriate in the circumstances, but not for the purpose of expressing an opinion on the effectiveness of the Group’s internal control.
• Evaluate the appropriateness of accounting policies used and the reasonableness of accounting estimates and related disclosures made by management.
• Conclude on the appropriateness of management’s use of the going concern basis of accounting and, based on the audit evidence obtained, whether a material uncertainty exists related to events or conditions that may cast significant doubt on the Group’s ability to continue as a going concern. If we conclude that a material uncertainty exists, we are required to draw attention in our auditor’s report to the related disclosures in the consolidated financial statements or, if such disclosures are inadequate, to modify
Ernst and Young Dubai P.O. Box 9267 Al Saqr Business Tower, 28th floor Sheikh Zayed Road Dubai, United Arab Emirates Tel:+971 (4) 3324000 [email protected] ey.com/mena
our opinion. Our conclusions are based on the audit evidence obtained up to the date of our auditor’s report. However future events or conditions may cause the Group to cease to continue as a going concern.
• Evaluate the overall presentation, structure and content of the consolidated financial statements, including the disclosures, and whether the consolidated financial statements represent the underlying transactions and events in a manner that achieves fair presentation.
• Obtain sufficient appropriate audit evidence regarding the financial information of the entities or business activities within the Group to express an opinion on the consolidated financial statements. We are responsible for the direction, supervision and performance of the group audit. We remain solely responsible for our audit opinion.
We communicate with those charged with governance regarding, among other matters, the planned scope and timing of the audit and significant audit findings, including any significant deficiencies in internal control that we identify during our audit.
For Ernst and Young James Potter Partner
9 March 2017 Dubai, United Arab Emirates
INTERNATIONAL GENERAL INSURANCE HOLDINGS LIMITED ANNUAL REPORT & ACCOUNTS 2016
13INTERNATIONAL GENERAL INSURANCE HOLDINGS LIMITED ANNUAL REPORT & ACCOUNTS 201612
INDEPENDENT AUDITOR’S REPORT TO THE SHAREHOLDERS OF INTERNATIONAL GENERAL INSURANCE HOLDINGS LTD.
FINANCIAL STATEMENTS & ACCOUNTS
INTERNATIONAL GENERAL INSURANCE HOLDINGS LIMITED ANNUAL REPORT & ACCOUNTS 201614
INTERNATIONAL GENERAL INSURANCE HOLDINGS LIMITED ANNUAL REPORT & ACCOUNTS 2016
15
Notes
2016USD
2015USD
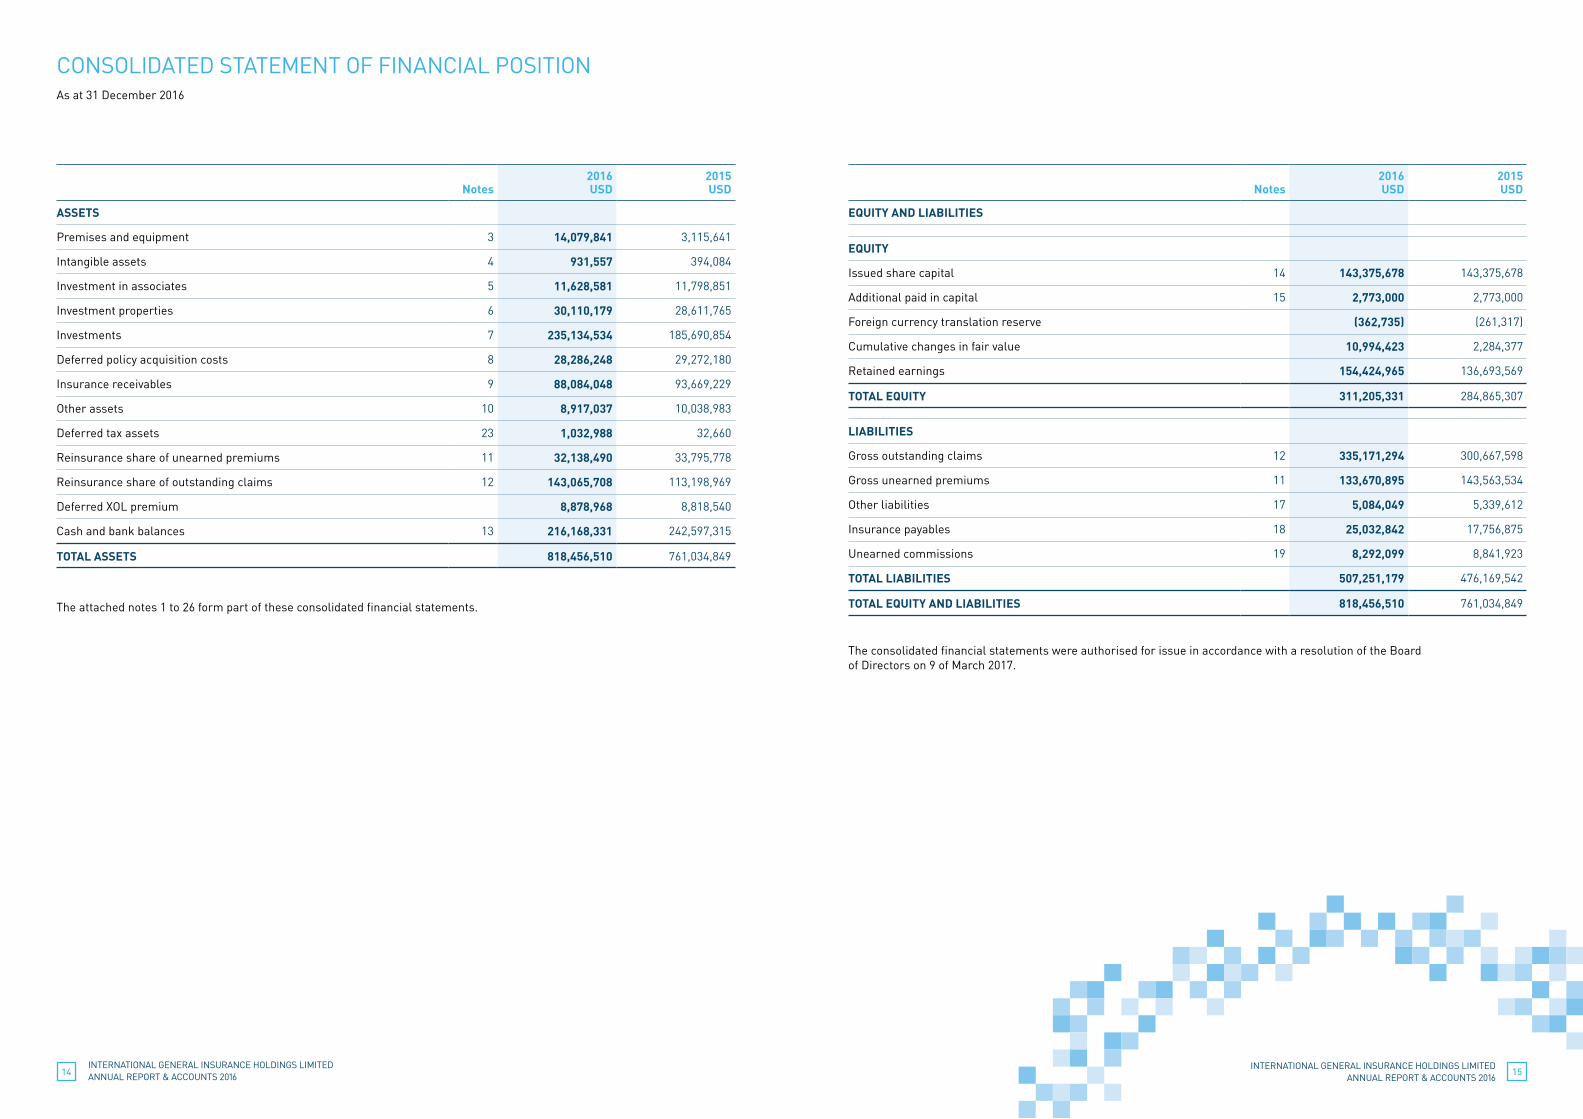
ASSETS
Premises and equipment 3 14,079,841 3,115,641
Intangible assets 4 931,557 394,084
Investment in associates 5 11,628,581 11,798,851
Investment properties 6 30,110,179 28,611,765
Investments 7 235,134,534 185,690,854
Deferred policy acquisition costs 8 28,286,248 29,272,180
Insurance receivables 9 88,084,048 93,669,229
Other assets 10 8,917,037 10,038,983
Deferred tax assets 23 1,032,988 32,660
Reinsurance share of unearned premiums 11 32,138,490 33,795,778
Reinsurance share of outstanding claims 12 143,065,708 113,198,969
Deferred XOL premium 8,878,968 8,818,540
Cash and bank balances 13 216,168,331 242,597,315
TOTAL ASSETS 818,456,510 761,034,849
The attached notes 1 to 26 form part of these consolidated financial statements.
CONSOLIDATED STATEMENT OF FINANCIAL POSITIONAs at 31 December 2016
Notes
2016USD
2015USD
EQUITY AND LIABILITIES
EQUITY
Issued share capital 14 143,375,678 143,375,678
Additional paid in capital 15 2,773,000 2,773,000
Foreign currency translation reserve (362,735) (261,317)
Cumulative changes in fair value 10,994,423 2,284,377
Retained earnings 154,424,965 136,693,569
TOTAL EQUITY 311,205,331 284,865,307
LIABILITIES
Gross outstanding claims 12 335,171,294 300,667,598
Gross unearned premiums 11 133,670,895 143,563,534
Other liabilities 17 5,084,049 5,339,612
Insurance payables 18 25,032,842 17,756,875
Unearned commissions 19 8,292,099 8,841,923
TOTAL LIABILITIES 507,251,179 476,169,542
TOTAL EQUITY AND LIABILITIES 818,456,510 761,034,849
The consolidated financial statements were authorised for issue in accordance with a resolution of the Board of Directors on 9 of March 2017.
INTERNATIONAL GENERAL INSURANCE HOLDINGS LIMITED ANNUAL REPORT & ACCOUNTS 201616
INTERNATIONAL GENERAL INSURANCE HOLDINGS LIMITED ANNUAL REPORT & ACCOUNTS 2016
17
Notes
2016USD
2015USD
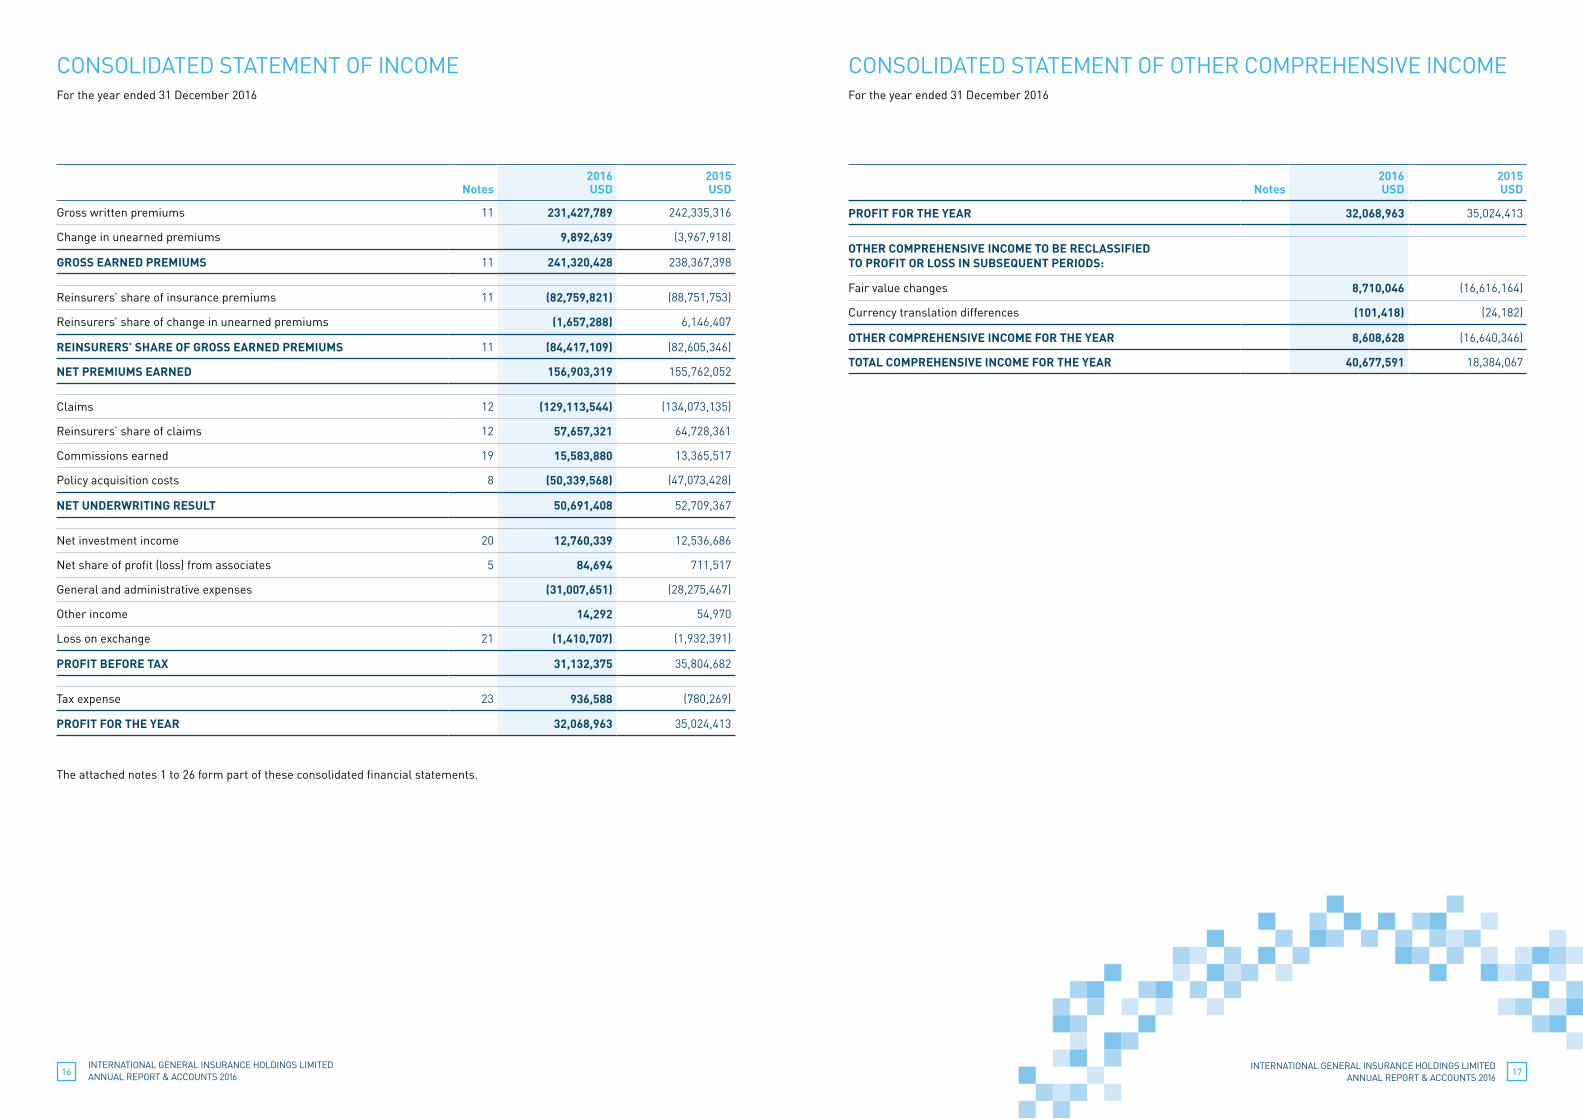
Gross written premiums 11 231,427,789 242,335,316
Change in unearned premiums 9,892,639 (3,967,918)
GROSS EARNED PREMIUMS 11 241,320,428 238,367,398
Reinsurers’ share of insurance premiums 11 (82,759,821) (88,751,753)
Reinsurers’ share of change in unearned premiums (1,657,288) 6,146,407
REINSURERS’ SHARE OF GROSS EARNED PREMIUMS 11 (84,417,109) (82,605,346)
NET PREMIUMS EARNED 156,903,319 155,762,052
Claims 12 (129,113,544) (134,073,135)
Reinsurers’ share of claims 12 57,657,321 64,728,361
Commissions earned 19 15,583,880 13,365,517
Policy acquisition costs 8 (50,339,568) (47,073,428)
NET UNDERWRITING RESULT 50,691,408 52,709,367
Net investment income 20 12,760,339 12,536,686
Net share of profit (loss) from associates 5 84,694 711,517
General and administrative expenses (31,007,651) (28,275,467)
Other income 14,292 54,970
Loss on exchange 21 (1,410,707) (1,932,391)
PROFIT BEFORE TAX 31,132,375 35,804,682
Tax expense 23 936,588 (780,269)
PROFIT FOR THE YEAR 32,068,963 35,024,413
The attached notes 1 to 26 form part of these consolidated financial statements.
Notes
2016USD
2015USD
PROFIT FOR THE YEAR 32,068,963 35,024,413
OTHER COMPREHENSIVE INCOME TO BE RECLASSIFIED TO PROFIT OR LOSS IN SUBSEQUENT PERIODS:
Fair value changes 8,710,046 (16,616,164)
Currency translation differences (101,418) (24,182)
OTHER COMPREHENSIVE INCOME FOR THE YEAR 8,608,628 (16,640,346)
TOTAL COMPREHENSIVE INCOME FOR THE YEAR 40,677,591 18,384,067
CONSOLIDATED STATEMENT OF INCOMEFor the year ended 31 December 2016
CONSOLIDATED STATEMENT OF OTHER COMPREHENSIVE INCOMEFor the year ended 31 December 2016
INTERNATIONAL GENERAL INSURANCE HOLDINGS LIMITED ANNUAL REPORT & ACCOUNTS 201618
INTERNATIONAL GENERAL INSURANCE HOLDINGS LIMITED ANNUAL REPORT & ACCOUNTS 2016
19
CONSOLIDATED STATEMENT OF CASH FLOWSFor the year ended 31 December 2016
Notes
2016USD
2015 USD
OPERATING ACTIVITIES
Profit before tax 31,132,375 35,804,682
ADJUSTMENTS FOR:
Depreciation and amortization 3,4 582,816 737,593
Gain on sale of available-for-sale investments 20 (2,692,435) (4,116,587)
Provision for doubtful debts 9 – –
Impairment (reversal of impairment) of investments 20 250,000 (32,377)
Gain on sale of premises and equipment (13,304) (54,970)
Fair value gain on investment property 20 (1,458,395) –
Loss on revaluation of held for trading investments 20 245,991 296,491
Dividends and interest income 20 (9,616,437) (9,080,791)
Net Share of (profit) loss from associates 5 (84,694) (711,517)
Net foreign exchange differences 1,410,707 1,932,391
CASH FROM OPERATIONS BEFORE WORKING CAPITAL CHANGES 19,756,624 24,774,915
WORKING CAPITAL ADJUSTMENTS
Reinsurance share of unearned premiums 1,657,288 (6,146,407)
Reinsurance share of outstanding claims (29,866,739) (32,126,033)
Deferred XOL premium (60,428) 1,947,241
Gross outstanding claims 34,503,696 24,200,147
Gross unearned premiums (9,892,639) 3,967,918
Deferred policy acquisition costs 985,932 (1,772,048)
Insurance receivables 5,585,181 1,680,770
Other assets 956,788 901,278
Unearned commission (549,824) 1,145,503
Insurance payables 7,275,967 (2,589,070)
Other liabilities (255,563) 440,214
NET CASH FLOWS FROM OPERATING ACTIVITIES BEFORE TAX 30,096,283 16,424,428
INCOME TAX PAID 23 – (421,498)
NET CASH FLOWS FROM OPERATING ACTIVITIES AFTER TAX 30,096,283 16,002,930
The attached notes 1 to 26 form part of these consolidated financial statements.
Notes
2016USD
2015USD
INVESTING ACTIVITIES
Purchase of premises and equipment 3 (11,465,562) (413,720)
Proceeds from sale of premises and equipment 13,304 60,028
Purchase of intangible assets 4 (618,927) (174,501)
Purchase of available-for-sale investments (75,984,676) (52,892,054)
Purchase of held to maturity investments – (3,000,000)
Proceeds from maturity of held to maturity investments – 118,644
Purchase of investment property 6 (40,019) –
Dividends from associated companies 5 254,964 –
Proceeds from sale of available-for-sale investments 37,434,405 40,269,280
Proceeds from redemption of trading securities 13,081 70,617
Dividends and interest income 20 9,616,437 9,080,791
NET CASH FLOWS (USED IN) FROM INVESTING ACTIVITIES (40,776,993) (6,880,915)
FINANCING ACTIVITIES
Dividends paid 16 (14,337,567) (11,470,052)
Proceeds from sale of treasury shares 15 – 14,773,000
Net cash flows (used in) from financing activities (14,337,567) 3,302,948
NET CHANGE IN CASH AND CASH EQUIVALENTS (25,018,277) 12,424,963
Net foreign exchange differences (1,410,707) (1,932,391)
Cash and cash equivalents at the beginning of the year 242,597,315 232,104,743
CASH AND CASH EQUIVALENTS AT THE END OF THE YEAR 13 216,168,331 242,597,315

INTERNATIONAL GENERAL INSURANCE HOLDINGS LIMITED ANNUAL REPORT & ACCOUNTS 201620
INTERNATIONAL GENERAL INSURANCE HOLDINGS LIMITED ANNUAL REPORT & ACCOUNTS 2016
21
CONSOLIDATED STATEMENTS OF CHANGES IN EQUITYFor the year ended 31 December 2016
NOTES TO THE CONSOLIDATED FINANCIAL STATEMENTSAt 31 December 2016
Issuedshare
capital USD
Additional paid in capital
USD
Treasury shares
USD
Foreign currency
translation reserve USD
Cumulative change in fair
value USD
Retained earnings
USD
Total USD
AT 1 JANUARY 2016 143,375,678 2,773,000 – (261,317) 2,284,377 136,693,569 284,865,307
Profit for the year – – – – – 32,068,963 32,068,963
Other comprehensive income – – – (101,418) 8,710,046 – 8,608,628
Total comprehensive income – – – (101,418) 8,710,046 32,068,963 40,677,591
Dividends paid during the year (note 16)
– – – – – (14,337,567) (14,337,567)
AT 31 DECEMBER 2016 143,375,678 2,773,000 – (362,735) 10,994,423 154,424,965 311,205,331
AT 1 JANUARY 2015 143,375,678 – (12,000,000) (237,135) 18,900,541 113,139,208 263,178,292
Profit for the year – – – – – 35,024,413 35,024,413
Other comprehensive income – – – (24,182) (16,616,164) – (16,640,346)
Total comprehensive income – – – (24,182) (16,616,164) 35,024,413 18,384,067
Sale of treasury shares (note 15)
2,773,000 12,000,000 – – – 14,773,000
Dividends paid during the year (note 16)
– – – – – (11,470,052) (11,470,052)
AT 31 DECEMBER 2015 143,375,678 2,773,000 – (261,317) 2,284,377 136,693,569 284,865,307
The attached notes 1 to 26 form part of these consolidated financial statements.
1. ACTIVITIES
International General Insurance Holdings Ltd (‘the Company’) is incorporated as a company limited by shares under the Companies Law, DIFC Law No. 2 of 2009 on 7 May 2006 and is engaged in the business of insurance and re-insurance. The Company’s registered office is at unit 1, Gate Village 01, P. O. Box 506646, Dubai International Financial Centre.
The Company and its subsidiaries (together ‘the Group’) operate in the United Arab Emirates, Bermuda, United Kingdom, Jordan, Morocco, Malaysia and Cayman Island.
2. BASIS OF PREPARATION
The consolidated financial statements have been prepared in accordance with International Financial Reporting Standards (IFRSs) as issued by the International Accounting Standards Board (IASB) and applicable requirements of UAE laws.
The consolidated financial statements have been presented in United States Dollars ‘USD’ which is the Group’s functional currency.
The consolidated financial statements are prepared under the historical cost convention modified to include the measurement at fair value of financial assets available-for-sale, financial assets held for trading and investment properties.
BASIS OF CONSOLIDATION
The financial statements of the subsidiaries are prepared for the same reporting year as the Group, using consistent accounting policies.
The consolidated financial statements comprise the financial statements of International General Insurance Holdings Ltd. and its subsidiaries as at 31 December. Control is achieved when the Group is exposed, or has rights, to variable returns from its involvement with the investee and has the ability to affect those returns through its power over the investee. Specifically, the Group controls an investee if and only if the Group has:
• Power over the investee (i.e. existing rights that give it the current ability to direct the relevant activities of the investee)
• Exposure, or rights, to variable returns from its involvement with the investee, and
• The ability to use its power over the investee to affect its returns
When the Group has less than a majority of the voting or similar rights of an investee, the Group considers all relevant facts and circumstances in assessing whether it has power over an investee, including:
• The contractual arrangement with the other vote holders of the investee
• Rights arising from other contractual arrangements
• The Group’s voting rights and potential voting rights
The Group reassesses whether or not it controls an investee if facts and circumstances indicate that there are changes to one or more of the three elements of control. Consolidation of a subsidiary begins when the Group obtains control over the subsidiary and ceases when the Group loses control of the subsidiary. Assets, liabilities, income and expenses of a subsidiary acquired or disposed of during the year are included in the consolidated statement of comprehensive income from the date the Group gains control until the date the Group ceases to control the subsidiary.
Profit or loss and each component of other comprehensive income (OCI) are attributed to the equity holders of the parent of the Group and to the non-controlling interests, even if this results in the non-controlling interests having a deficit balance. When necessary, adjustments are made to the financial statements of subsidiaries to bring their accounting policies into line with the Group’s accounting policies. All intra-group assets and liabilities, equity, income, expenses and cash flows relating to transactions between members of the Group are eliminated in full on consolidation.
INTERNATIONAL GENERAL INSURANCE HOLDINGS LIMITED ANNUAL REPORT & ACCOUNTS 201622
INTERNATIONAL GENERAL INSURANCE HOLDINGS LIMITED ANNUAL REPORT & ACCOUNTS 2016
23
A change in the ownership interest of a subsidiary, without a change of control, is accounted for as an equity transaction. If the Group loses control over a subsidiary, it:
• Derecognises the assets (including goodwill) and liabilities of the subsidiary;
• Derecognises the carrying amount of any non-controlling interest;
• Derecognises the cumulative translation differences, recorded in equity, if any;
• Recognises the fair value of the consideration received;
• Recognises the fair value of any investment retained;
• Recognises any surplus or deficit in profit or loss; and
• Reclassifies the parent’s share of components previously recognised in other comprehensive income to profit or loss or retained earnings, as appropriate.
Subsidiaries are fully consolidated from the date of acquisition, being the date on which the Group obtains control, and continue to be consolidated until the date that such control ceases.
All intra-group balances, transactions, income and expenses, and profits and losses, including dividends resulting from intra-group transactions, are eliminated in full.
The Group has the following subsidiaries:
Country of incorporation
Ownership
Activity 2016 2015
International General Insurance Underwriting Jordan Underwriting agency 100% 100%
North Star Underwriting Limited United Kingdom Underwriting agency 100% 100%
International General Insurance Co. Ltd. Bermuda Reinsurance and insurance 100% 100%
The following entities are wholly owned by the subsidiary International General Insurance Co. Ltd. Bermuda
International General Insurance Company Ltd. Labuan Branch
Malaysia Reinsurance and insurance 100% 100%
International General Insurance Company (UK) Limited
United Kingdom Reinsurance and insurance 100% 100%
International General Insurance Company Dubai Limited
United Arab Emirates Insurance intermediation and insurance management
100% 100%
Specialty Malls Investment Co. Jordan Real estate properties development and lease
100% 100%
IGI Services Limited * Cayman Island Owning and chartering aircraft
100% –
* During the year 2016, the Group has established a new subsidiary ‘IGI services limited’ in Cayman Islands with a principal business of owning and chartering aircraft.
CHANGES IN ACCOUNTING POLICIES
The following new and revised IFRSs have been applied in the current period in these consolidated financial statements. Their adoption had no significant impact on the amounts reported in these consolidated financial statements but may affect the accounting for future transactions or arrangements.
The nature and the impact of each new standard and amendment are described below:
Equity Method in Separate Financial Statements (Amendments to IAS 27 and IFRS 1)
In August 2014, the IASB amended IAS 27 Separate Financial Statements which restore the option for entities, in the separate financial statements, to account for investments in subsidiaries, associates and joint ventures using the equity method as described in IAS 28 Investments in Associates and Joint Ventures. A consequential amendment was also made to IFRS 1 First-time Adoption of International Financial Reporting Standards. The amendment to IFRS 1 allows a first-time adopter accounting for investments in the separate financial statements using the equity method, to apply the IFRS 1 exemption for past business combinations to the acquisition of the investment.
IAS 1 Presentation of Financial Statements – Amendments to IAS 1
The amendments to IAS 1 include narrow-focus improvements related to :
• Materiality
• Disaggregation and subtotals
• Notes structure
• Disclosure of accounting policies
• Presentation of items of other comprehensive income (OCI) arising from equity accounted investments
Investment entities (Amendments to IFRS 10 and IAS 28)
The amendments address the issues arising in practice in the application of the investment entities consolidation exception and clarify that:
• The exemption from presenting consolidated financial statements applies to a parent entity that is a subsidiary of an investment entity, when the investment entity measures all of its subsidiaries at fair value.
• Subsidiary that is not an investment entity itself and provides support services to the investment entity is consolidated. All other subsidiaries of an investment entity are measured at fair value.
• Application of the equity method by a non-investment entity that has an interest in an associate or joint venture that is an investment entity. The amendments to IAS 28 Investments in Associates and Joint Ventures allow the investor, when applying the equity method, to retain the fair value measurement applied by the investment entity associate or joint venture to its interests in subsidiaries.
Amendments to IAS 16 and IAS 38: Clarification of Acceptable Methods of Depreciation and Amortisation
The amendments clarify the principle in IAS 16 and IAS 38 that revenue reflects a pattern of economic benefits that are generated from operating a business (of which the asset is part) rather than the economic benefits that are consumed through use of the asset. As a result, a revenue-based method cannot be used to depreciate property, plant and equipment and may only be used in very limited circumstances to amortise intangible assets.
NOTES TO THE CONSOLIDATED FINANCIAL STATEMENTS (continued)
At 31 December 2016
INTERNATIONAL GENERAL INSURANCE HOLDINGS LIMITED ANNUAL REPORT & ACCOUNTS 201624
INTERNATIONAL GENERAL INSURANCE HOLDINGS LIMITED ANNUAL REPORT & ACCOUNTS 2016
25
Amendments to IFRS 11 Joint Arrangements: Accounting for Acquisitions of Interests
The amendments to IFRS 11 require that a joint operator accounting for the acquisition of an interest in a joint operation, in which the activity of the joint operation constitutes a business, must apply the relevant IFRS 3 principles for business combinations accounting. The amendments also clarify that a previously held interest in a joint operation is not remeasured on the acquisition of an additional interest in the same joint operation while joint control is retained. In addition, a scope exclusion has been added to IFRS 11 to specify that the amendments do not apply when the parties sharing joint control, including the reporting entity, are under common control of the same ultimate controlling party.
The amendments apply to both the acquisition of the initial interest in a joint operation and the acquisition of any additional interests in the same joint operation.
The implementation of the new amendments did not have impact on the Group’s financial position or performance and became effective for annual periods which started from 1 January 2016.
STANDARDS ISSUED BUT NOT YET EFFECTIVE
IFRS 9 Financial Instruments
During July 2014, the IASB issued IFRS 9 ‘Financial Instruments’ with all the three phases. IFRS 9 sets out the requirements for recognising and measuring financial assets, financial liabilities and some contracts to buy or sell non-financial items. IFRS 9 replaces IAS 39 ‘Financial Instruments: Recognition and Measurement’. IFRS 9 as issued in July 2014 will be implemented at the mandatory date on 1 January 2018, which will have an impact on the recognition and measurement of financial assets.
IFRS 16 Leases
During January 2016, the IASB issued IFRS 16 ‘Leases’ which sets out the principles for the recognition, measurement, presentation and disclosure of leases.
IFRS 16 substantially carries forward the lessor accounting requirements in IAS 17. Accordingly, a lessor continues to classify its leases as operating leases or finance leases, and to account for those two types of leases differently.
IFRS 16 introduced a single lessee accounting model and requires a lessee to recognise assets and liabilities for all leases with a term of more than 12 months, unless the underlying asset is of low value. A lessee is required to recognise a right-of-use asset representing its right to use the underlying leased asset and a lease liability representing its obligation to make lease payments.
The new standard will be effective for annual periods beginning on or after 1 January 2019. Early application is permitted.
IFRS 15 Revenue from Contracts with Customers
IFRS 15 specifies the accounting treatment for all revenue arising from contracts with customers. It applies to all entities that enter into contracts to provide goods or services to their customers, unless the contracts are in the scope of other IFRSs, such as IAS 17 Leases. IFRS 15 supersedes IAS 11 Construction Contracts, IAS 18 Revenue, IFRIC 13 Customer Loyalty Programmes, IFRIC 15 Agreements for the Construction of Real Estate, IFRIC 18 Transfers of Assets from Customers; and SIC-31 Revenue — Barter Transactions Involving Advertising Services. The standard is effective for annual periods beginning on or after 1 January 2018, and early adoption is permitted.
IAS 7 Disclosure Initiative – Amendments to IAS 7
The amendments to IAS 7 Statement of Cash Flows are part of the IASB’s Disclosure Initiative and require an entity to provide disclosures that enable users of financial statements to evaluate changes in liabilities arising from financing activities, including both changes arising from cash flows and non-cash changes. On initial application of the amendment, entities are not required to provide comparative information for preceding periods. The amendments will be effective for annual periods beginning on or after 1 January 2017, with early application permitted. The application of amendments will result in adding limited amount of disclosure information.
IFRS 2 Classification and Measurement of Share-based Payment Transactions — Amendments to IFRS 2
The IASB issued amendments to IFRS 2 Share-based Payment that address three main areas: the effects of vesting conditions on the measurement of a cash-settled share-based payment transaction; the classification of a share-based payment transaction with net settlement features for withholding tax obligations; and accounting where a modification to the terms and conditions of a share-based payment transaction changes its classification from cash settled to equity settled.
Entities may apply the amendments prospectively and are effective for annual periods beginning on or after 1 January 2018, with early application permitted.
Amendments to IFRS 4 Applying IFRS 9 Financial Instruments with IFRS 4 Insurance Contracts
In September 2016, the IASB issued amendments to IFRS 4 to address issues arising from the different effective dates of IFRS 9 and the upcoming new insurance contracts standard (IFRS 17). The amendments introduce two alternative options for entities issuing contracts within the scope of IFRS 4, a temporary exemption from implementing IFRS 9 to annual periods beginning before 1 January 2021 at latest and an overlay approach that allows an entity applying IFRS 9 to reclassify between profit or loss and other comprehensive income an amount that results in the profit or loss at the end of the reporting period for the designated financial assets being the same as if an entity had applied IAS 39 to these designated financial assets.
Transfers of Investment Property (Amendments to IAS 40)
The amendments clarify when an entity should transfer property, including property under construction or development into, or out of investment property. The amendments state that a change in use occurs when the property meets, or ceases to meet, the definition of investment property and there is evidence of the change in use. A mere change in management’s intentions for the use of a property does not provide evidence of a change in use.
Entities should apply the amendments prospectively and effective for annual periods beginning on or after 1 January 2018. Early application of the amendments is permitted and must be disclosed.
IFRIC Interpretation 22 Foreign Currency Transactions and Advance Consideration
The interpretation clarifies that in determining the spot exchange rate to use on initial recognition of the related asset, expense or income (or part of it) on the derecognition of a non-monetary asset or non-monetary liability relating to advance consideration, the date of the transaction is the date on which an entity initially recognises the non-monetary asset or non-monetary liability arising from the advance consideration. Entities may apply the amendments on a fully retrospective or prospective basis. The new interpretation will be effective for annual periods beginning on or after 1 January 2018. Early application of interpretation is permitted and must be disclosed.
SUMMARY OF SIGNIFICANT ACCOUNTING POLICIES
Revenue recognition
Gross written premiums
Gross written premiums comprise the total premiums receivable for the whole period of cover provided by contracts entered into during the accounting period. They are recognised on the date on which the policy commences. Premiums include any adjustments arising in the accounting period for premiums receivable in respect of business written in prior accounting periods. Rebates that form part of the premium rate, such as no-claim rebates, are deducted from the gross premium; others are recognised as an expense. Premiums also include estimates for pipeline premiums, representing amounts due on business written but not yet notified. The Group generally estimates the pipeline premium based on management’s judgement and prior experience.
Unearned premiums are those proportions of premiums written in a year that relate to periods of risk after the reporting date. Unearned premiums are calculated on a pro rata basis. The proportion attributable to subsequent periods is deferred as a provision for unearned premiums.
NOTES TO THE CONSOLIDATED FINANCIAL STATEMENTS (continued)
At 31 December 2016
INTERNATIONAL GENERAL INSURANCE HOLDINGS LIMITED ANNUAL REPORT & ACCOUNTS 201626
INTERNATIONAL GENERAL INSURANCE HOLDINGS LIMITED ANNUAL REPORT & ACCOUNTS 2016
27
Reinsurance premiums
Gross general reinsurance premiums written comprise the total premiums payable for the whole cover provided by contracts entered into the period and are recognised on the date on which the policy incepts.
Premiums include any adjustments arising in the accounting period in respect of reinsurance contracts incepting in prior accounting periods.
Unearned reinsurance premiums are those proportions of premiums written in a year that relate to periods of risk after the reporting date. Unearned reinsurance premiums are deferred over the term of the underlying direct insurance policies for risks-attaching contracts and over the term of the reinsurance contract for losses occurring contracts.
Commission income
Insurance and investment contract policyholders are charged for policy administration services, investment management services, surrenders and other contract fees. These fees are recognised as revenue over the period in which the related services are performed. If the fees are for services provided in future periods, then they are deferred and recognised over those future periods.
Claims
Claims, comprising amounts payable to contract holders and third parties and related loss adjustment expenses, net of salvage and other recoveries, are charged to income as incurred. Claims comprise the estimated amounts payable, in respect of claims reported to the Group and those not reported at the consolidated statement of financial position date.
The Group generally estimates its claims based on appointed loss adjusters or leading underwriters’ recommendations. In addition a provision based on management’s judgement and the Group’s prior experience is maintained for the cost of settling claims incurred but not reported at the consolidated statement of financial position date.
Policy acquisition costs
Policy acquisition costs represent commissions paid to intermediaries and other direct costs incurred in relation to the acquisition and renewal of insurance contracts which are deferred and expensed over the terms of the insurance contracts to which they relate as premiums are earned.
Liability adequacy test
At each statement of financial position date the Group assesses whether its recognised insurance liabilities are adequate using current estimates of future cash flows under its insurance contracts. If that assessment shows that the carrying amount of its unearned premiums (less related deferred policy acquisition costs) is inadequate in the light of estimated future cash flows, the entire deficiency is immediately recognised in income and an unexpired risk provision created.
The Group does not discount its liability for unpaid claims as substantially all claims are expected be paid within one year of the statement of financial position date.
Reinsurance
The Group cedes insurance risk in the normal course of business for all of its businesses. Reinsurance assets represent balances due from reinsurance companies. Amounts recoverable from reinsurers are estimated in a manner consistent with the outstanding claims provision or settled claims associated with the reinsurer’s policies and are in accordance with the related reinsurance contract.
Reinsurance assets are reviewed for impairment at each reporting date, or more frequently, when an indication of impairment arises during the reporting year. Impairment occurs when there is objective evidence as a result of an event that occurred after initial recognition of the reinsurance asset that the Group may not receive all outstanding amounts due under the terms of the contract and the event has a reliably measurable impact on the amounts that the Group will receive from the reinsurer. The impairment loss is recorded in the consolidated statement of income.
Gains or losses on buying reinsurance are recognised in the consolidated statement of income immediately at the date of purchase and are not amortised.
Ceded reinsurance arrangements do not relieve the Group from its obligations to policyholders.
The Group also assumes reinsurance risk in the normal course of business for life insurance and non-life insurance contracts where applicable. Premiums and claims on assumed reinsurance are recognised as revenue or expenses in the same manner as they would be if the reinsurance were considered direct business, taking into account the product classification of the reinsured business. Reinsurance liabilities represent balances due to reinsurance companies. Amounts payable are estimated in a manner consistent with the related reinsurance contract.
Premiums and claims are presented on a gross basis for both ceded and assumed reinsurance.
Reinsurance assets or liabilities are derecognised when the contractual rights are extinguished or expire or when the contract is transferred to another party.
Reinsurance contracts that do not transfer significant insurance risk are accounted for directly through the statement of financial position. These are deposit assets or financial liabilities that are recognised based on the consideration paid or received less any explicit identified premiums or fees to be retained by the reinsured.
Investment income on these contracts is accounted for using the effective interest rate method when accrued.
Interest income
Interest income included in investment income is recognised as the interest accrues using the effective interest method, under which the rate used exactly discounts estimated future cash receipts through the expected life of the financial asset to the net carrying amount of the financial asset.
Dividend income
Dividend revenue included in investment income is recognised when right to receive the payment is established.
Premises and equipment
Premises and equipment are stated at cost less accumulated depreciation and any impairment in value. Depreciation is calculated on a straight-line basis over the estimated useful lives using the following are the estimated useful lives:
Years
Office buildings 20
Office furniture 5
Computers 3
Equipment 4
Leasehold improvement 5
Vehicles 5
An item of property, plant and equipment and any significant part initially recognised is derecognised upon disposal or when no future economic benefits are expected from its use or disposal. Any gain or loss arising on derecognition of the asset (calculated as the difference between the net disposal proceeds and the carrying amount of the asset) is included in the consolidated income statement when the asset is derecognised.
The assets’ residual values, useful lives and method of depreciation are reviewed and adjusted if appropriate at each financial year end. Impairment reviews take place when events or changes in circumstances indicate that the carrying value may not be recoverable. Impairment losses are recognised in the consolidated statement of income as an expense.
NOTES TO THE CONSOLIDATED FINANCIAL STATEMENTS (continued)
At 31 December 2016
INTERNATIONAL GENERAL INSURANCE HOLDINGS LIMITED ANNUAL REPORT & ACCOUNTS 201628
INTERNATIONAL GENERAL INSURANCE HOLDINGS LIMITED ANNUAL REPORT & ACCOUNTS 2016
29
Intangible assets
Intangible assets acquired through business combinations are recorded at their fair value on that date. Other intangible assets are measured on initial recognition at cost.
Intangible assets with finite lives are amortised over the useful economic lives, while intangible assets with indefinite useful lives are assessed for impairment at each reporting date or when there is an indication that the intangible asset may be impaired.
Internally generated intangible assets are not capitalised and are expensed in the consolidated statement of income.
Indications of impairment of intangible assets are reviewed and their useful economic lives are reassessed at each reporting date. Adjustments are reflected in the current and subsequent periods.
Intangible assets include computer software and software licenses. These intangible assets are amortised on a straight line basis over their estimated economic useful lives of five years.
Impairment and uncollectibility of financial assets
An assessment is made at each consolidated statement of financial position date to determine whether there is objective evidence that a specific financial asset may be impaired. If such evidence exists, any impairment loss is recognised in the consolidated statement of income.
Impairment is determined as follows:
a) For assets carried at fair value, impairment is the difference between cost and fair value;
b) For assets carried at cost, impairment is the difference between cost and the present value of future cash flows discounted at the current market rate of return for a similar financial asset; and
c) For assets carried at amortised cost, impairment is based on estimated cash flows discounted at the original effective interest rates.
The group treats financial assets available-for-sale as impaired when there has been a significant or prolonged decline in the fair value below cost or where other objective evidence of impairment exists.
The determination of what is “significant” or “prolonged” requires considerable judgement. In addition, the Group evaluates other factors, including normal volatility in share prices for quoted equities and the future cash flows and discount factors for unquoted equities.
Impairment is recognised in the income statement. If, in a subsequent period, the amount of the impairment loss decreases, the carrying value of the asset is increased to its recoverable amount. The amount of the reversal is recognised in the income statement except for equity instruments classified as available for sale investments for which the reversal is recognized in the statement of other comprehensive income.
Derecognition of financial instruments
The derecognition of a financial instrument takes place when the Group no longer controls the contractual rights that comprise the financial instrument, which is normally the case when the instrument is sold, or all the cash flows attributable to the instrument are passed through to an independent third party.
Investment in associates
The Group’s investment in its associates is accounted for using the equity method of accounting. An associate is an entity in which the Group has significant influence and which is neither a subsidiary nor a joint venture.
Under the equity method, the investment in the associate is carried in the consolidated statement of financial position at cost plus post-acquisition changes in the Group’s share of net assets of the associate. Goodwill relating to an associate is included in the carrying amount of the investment and is neither amortised nor individually tested for impairment.
The consolidated statement of income reflects the share of the results of operations of the associate. Where there has been a change recognised directly in the equity of the associate, the Group recognises its share of any changes and discloses this, when applicable, in the consolidated statement of changes in equity. Profits or losses resulting from transactions between the Group and the associate are eliminated to the extent of the interest in the associate.
The share of profit of the associate is shown on the face of the consolidated statement of income. This is profit attributable to equity holders of the associate and, therefore, is profit after tax and non-controlling interests in the subsidiaries of the associates.
The financial statements of the associate are prepared for the same reporting period as the Group. Where necessary, adjustments are made to bring its accounting policies in line with the Group’s.
After application of the equity method, the Group determines whether it is necessary to recognise an additional impairment loss on the Group’s investment in associates. The Group determines at each reporting date, whether there is any objective evidence that the investment in the associate is impaired. If this is the case, the Group calculates the amount of impairment as the difference between the recoverable amount of the associate and its carrying value and recognises the amount in the ‘share of profit of an associate’ in the consolidated income statement.
Upon loss of significant influence over the associate, the Group measures and recognises any remaining investment at its fair value. Any difference between the carrying amount of the associate upon loss of significant influence and the fair value of the remaining investment and proceeds from disposal is recognised in profit or loss.
Investment properties
Investment properties are measured initially at cost, including transaction costs. The carrying amount includes the cost of replacing part of an existing investment property at the time that cost is incurred if the recognition criteria are met; and excludes the costs of day-to-day servicing of an investment property. Subsequent to initial recognition, investment properties are stated at fair value, which reflects market conditions at the reporting date. Gains or losses arising from changes in the fair values of investment properties are included in the consolidated statement of income in the period in which they arise.
Investment properties are derecognised when either they have been disposed of or when the investment property is permanently withdrawn from use and no future economic benefit is expected from its disposal.
The difference between the net disposal proceeds and the carrying amount of the asset is recognised in the consolidated statement of income in the period of derecognition.
Transfers are made to or from investment property only when there is a change in use. For a transfer from investment property to owner occupied property, the deemed cost for subsequent accounting is the fair value at the date of change in use. If owner occupied property becomes an investment property, the Group accounts for such property in accordance with the policy stated under property, plant and equipment up to the date of change in use.
Financial assets
Financial assets within the scope of IAS 39 are classified as financial assets at fair value through profit or loss, held-to-maturity investments or available-for-sale financial assets. The Group determines the classification of its financial assets at initial recognition. All financial assets are recognised initially at fair value plus, in the case of investments not at fair value through profit or loss, directly attributable transaction costs.
Purchases or sales of financial assets that require delivery of assets within a time frame established by regulation or convention in the marketplace (regular way trades) are recognised on the trade date, i.e., the date that the Group commits to purchase or sell the asset.
The subsequent measurement of financial assets depends on their classification as follows:
Insurance receivables
Insurance companies and intermediaries receivables are recognised when due and measured on initial recognition at the fair value of the consideration received or receivable. Subsequent to initial recognition, insurance receivables are measured at amortised cost, using the effective interest rate method. The carrying value of insurance receivables is reviewed for impairment whenever events or circumstances indicate that the carrying amount may not be recoverable, with the impairment loss recorded in the consolidated income statement.
NOTES TO THE CONSOLIDATED FINANCIAL STATEMENTS (continued)
At 31 December 2016
INTERNATIONAL GENERAL INSURANCE HOLDINGS LIMITED ANNUAL REPORT & ACCOUNTS 201630
INTERNATIONAL GENERAL INSURANCE HOLDINGS LIMITED ANNUAL REPORT & ACCOUNTS 2016
31
Financial assets at fair value through profit or loss
Financial assets at fair value through profit or loss include financial assets held for trading and financial assets designated upon initial recognition at fair value through profit or loss. Financial assets are classified as held for trading if they are acquired for the purpose of selling or repurchasing in the near term. Financial assets at fair value through profit and loss are carried in the consolidated statement of financial position at fair value with changes in fair value recognised in the consolidated statement of income. The Group has not designated any financial assets upon initial recognition as at fair value through consolidated income statement.
Held-to-maturity investments
Non-derivative financial assets with fixed or determinable payments and fixed maturities are classified as held-to-maturity when the Group has the positive intention and ability to hold it to maturity. After initial measurement held-to-maturity investments are measured at amortised cost using the effective interest rate method, less impairment. Impairment losses are recognised in the consolidated statement of income.
Available-for-sale financial investments
Available-for-sale financial investments include equity and debt securities. Equity investments classified as available-for-sale are those, which are neither classified as held for trading nor designated at fair value through profit or loss. Debt securities in this category are those which are intended to be held for an indefinite period of time and which may be sold in response to needs for liquidity or in response to changes in the market conditions. After initial measurement, available-for-sale financial investments are subsequently measured at fair value with unrealised gains or losses recognised as other comprehensive income in the available-for-sale reserve until the investment is derecognised, at which time the cumulative gain or loss is recognised in other operating income, or determined to be impaired, at which time the cumulative loss is recognised in the consolidated statement of income and removed from the available-for-sale reserve.
Cash and cash equivalents
For the purpose of the consolidated statement of cash flows, cash and cash equivalents consist of cash in hand, bank balances, and short-term deposits with an original maturity of three months or less.
Provisions
Provisions are recognised when the Group has an obligation (legal or constructive) as a result of a past event, and the costs to settle the obligation are both probable and able to be reliably measured.
Cash settled - Share based payment plan
A phantom share option plan linked to the value of an ordinary share of the Group as approved by the Board of directors has been declared during 2011. The scheme is applicable to senior executives with more than 12 months’ service. The amount of bonus is determined by reference to the increase in the book value of shares covered by the option. No shares are actually issued or transferred to the option holder on the exercise of the option.
The options vest equally over a span of five years from the grant date. The bonus due amounts to the excess of book value on vesting date over grant date plus an additional 20% on the value of the excess.
Treasury shares
Own equity instruments that are reacquired (treasury shares) are recognised at cost and deducted from equity. No gain or loss is recognised in profit or loss on the purchase, sale, issue or cancellation of the Group’s own equity instruments. Any difference between the carrying amount and the consideration, if reissued, is recognised in share premium.
Offsetting
Financial assets and financial liabilities are offset and the net amount reported in the consolidated statement of financial position only when there is a legally enforceable right to offset the recognised amounts and there is an intention to settle on a net basis, or to realise the assets and settle the liability simultaneously. Income and expense is not offset in the consolidated statement of income unless required or permitted by any accounting standard or interpretation.
Foreign currencies
The Group’s consolidated financial statements are presented in United States Dollars, which is also the functional currency of the Group. Each entity in the Group determines its own functional currency and items included in the financial statements of each entity are measured using that functional currency.
Transactions and balancesTransactions in foreign currencies are initially recorded by the Group entities at their respective functional currency rates prevailing at the date of the transaction. Monetary assets and liabilities denominated in foreign currencies are retranslated at the functional currency spot rate of exchange ruling at the reporting date. All differences are taken to the consolidated statement of income. Non-monetary items that are measured in terms of historical cost in a foreign currency are translated using the exchange rates as at the dates of the initial transactions. Non-monetary items measured at fair value in a foreign currency are translated using the exchange rates at the date when the fair value is determined.
Group companiesThe assets and liabilities of foreign operations are translated into United States Dollars at the rate of exchange prevailing at the reporting date and their statements of income are translated at exchange rates prevailing at the date of the transactions. The exchange differences arising on the translation are recognised in consolidated statement of comprehensive income. On disposal of a foreign operation, the component of other comprehensive income relating to that particular foreign operation is recognised in the consolidated statement of income.
Taxation
Current income taxCurrent income tax assets and liabilities for the current period are measured at the amount expected to be recovered from or paid to the taxation authorities. The tax rates and tax laws used to compute the amount are those that are enacted or substantively enacted, at the reporting date in the countries where the group operates and generates taxable income.
Deferred taxDeferred tax is provided using the liability method on temporary differences at the reporting date between the tax bases of assets and liabilities and their carrying amounts for financial reporting purposes.
Deferred tax assets are recognised for all deductible temporary differences, carry forward of unused tax credits and unused tax losses, to the extent that it is probable that taxable profit will be available against which the deductible temporary differences, and the carry forward of unused tax credit and unused tax losses can be utilised.
The carrying amount of deferred tax assets is reviewed at each reporting date and reduced to the extent that it is no longer probable that sufficient taxable profit will be available to allow all or part of the deferred tax asset to be utilised.
Deferred tax assets and liabilities are measured at the tax rates that are expected to apply in the year when the asset is realised or the liability is settled, based on tax rates (and tax laws) that have been enacted or substantively enacted at the reporting date.
Leasing
The Group has no finance lease arrangements.
The determination of whether an arrangement is a lease, or contains a lease, is based on the substance of the arrangement at the inception date and requires an assessment of whether the fulfilment of the arrangement is dependent on the use of a specific asset or assets and the arrangement conveys a right to use the asset, even if that right is not explicitly specified in an arrangement.
NOTES TO THE CONSOLIDATED FINANCIAL STATEMENTS (continued)
At 31 December 2016
INTERNATIONAL GENERAL INSURANCE HOLDINGS LIMITED ANNUAL REPORT & ACCOUNTS 201632
INTERNATIONAL GENERAL INSURANCE HOLDINGS LIMITED ANNUAL REPORT & ACCOUNTS 2016
33
Group as a lessee
Finance leases that transfer to the Group substantially all of the risks and benefits incidental to ownership of the leased item, are capitalised at the commencement of the lease at the fair value of the leased property or, if lower, at the present value of the minimum lease payments. Lease payments are apportioned between finance charges and reduction of the lease liability so as to achieve a constant rate of interest on the remaining balance of the liability. Finance charges are recognised in finance cost in the consolidated income statement.
Leased assets are depreciated over the useful life of the asset. However, if there is no reasonable certainty that the Group will obtain ownership by the end of the lease term, the asset is depreciated over the shorter of the estimated useful life of the asset and the lease term.
Leases that do not transfer to the Group substantially all the risks and benefits incidental to ownership of the leased items are operating leases. Operating lease payments are recognised as an expense in the income statement on a straight line basis over the lease term. Contingent rentals are recognised as an expense in the period in which they are incurred.
Group as a lessor
Leases in which the Group does not transfer substantially all of the risks and benefits of ownership of the asset are classified as operating leases. Initial direct costs incurred in negotiating an operating lease are added to the carrying amount of the leased asset and recognised over the lease term on the same bases as rental income. Rental income from operating leases is recognised on a straight-line basis over the term of lease.
Fair values
The fair value of financial instruments that are actively traded in organised financial markets is determined by reference to quoted market bid prices for assets and offer prices for liabilities, at the close of business on the consolidated statement of financial position date. If quoted market prices are not available, reference is also be made to broker or dealer price quotations.
For financial instruments where there is not an active market, the fair value is determined by using valuation techniques. Such techniques include using recent arm’s length transactions, reference to the current market value of another instrument which is substantially the same and/or discounted cash flow analysis. For discounted cash flow techniques, estimated future cash flows are based on management’s best estimates and the discount rate used is a market related rate for a similar instrument.
If the fair value cannot be measured reliably, these financial instruments are measured at cost, being the fair value of the consideration paid for the acquisition of the investment or the amount received on issuing the financial liability. All transaction costs directly attributable to the acquisition are also included in the cost of the investment.
Judgements
In the process of applying the Group’s accounting policies, management has made the following judgements, apart from those involving estimations, which have the most significant effect in the amounts recognised in the financial statements:
Operating lease commitments-group as lessorThe Group has entered into commercial property leases on its premises and equipment. The Group, as a lessor, has determined, based on an evaluation of the terms and conditions of the arrangements, that it retains all the significant risks and rewards of ownership of its property and so accounts for them as operating leases.
Going concernThe Group’s management has made an assessment of the Group’s ability to continue as a going concern and is satisfied that the Group has the resources to continue in business for the foreseeable future. Furthermore, the management is not aware of any material uncertainties that may cast significant doubt upon the Group’s ability to continue as a going concern. Therefore, the financial statements continue to be prepared on the going concern basis.
Classification of investments
Management decides on acquisition of an investment whether it should be classified as held for trading or available for sale or held to maturity.
The group classifies investments as trading if they are acquired primarily for the purpose of making a short-term profit by the dealers.
Financial assets are classified as held to maturity if the Group has the positive intention and ability to hold up till maturity.
All other investments are classified as financial assets available-for-sale.
Estimation uncertainty
The key assumptions concerning the future and other key sources of estimation uncertainty at the consolidated statement of financial position date, that have a significant risk of causing a material adjustment to the carrying amounts of assets and liabilities within the next financial year are discussed below:
Valuation of outstanding claims, whether reported or notConsiderable judgement by management is required in the estimation of amounts due to contract holders arising from claims made under insurance contracts. Such estimates are necessarily based on assumptions about several factors involving varying, and possibly significant, degrees of judgement and uncertainty and actual results may differ from management’s estimates resulting in future changes in estimated liabilities.
In particular, estimates have to be made both for the expected ultimate cost of claims reported at the consolidated statement of financial position date and for the expected ultimate cost of claims incurred but not yet reported (IBNR) at the consolidated statement of financial position date. The primary technique adopted by management in estimating the cost of notified and IBNR claims, is that of using past claim settlement trends to predict future claims settlement trends.
Claims requiring court or arbitration decisions are estimated individually. Independent loss adjustors normally estimate property claims. Management reviews its provisions for claims incurred, and claims incurred but not reported, on a quarterly basis.
Investment propertiesInvestment properties are stated at fair value which is determined based on valuations performed by professional independent valuers.
Impairment losses on available for sale investmentsThe Group treats available-for-sale equity investments as impaired when there has been a significant or prolonged decline in the fair value below its cost or where other objective evidence of impairment exists. The determination of what is ‘significant’ or ‘prolonged’ requires considerable judgement. Where fair values are not available, the recoverable amount of such investment is estimated to test for impairment. In addition, the Group evaluates other factors, including normal volatility in share price for quoted equities and the future cash flows and discount factors for unquoted equities.
Impairment losses on held-to-maturity investmentsThe Group reviews its individually significant held-to-maturity investments at each statement of financial position date to assess whether an impairment loss should be recorded in the consolidated statement of income. In particular, management judgement is required in the estimation of the amount and timing of future cash flows when determining the impairment loss. These estimates are based on assumptions about a number of factors and actual results may differ, resulting in future changes to the allowance.
Impairment losses on receivablesReceivables that are individually assessed for impairment and for which an impairment loss is or continues to be recognised are not included in a collective assessment of impairment. This assessment of impairment requires judgement. In making this judgement, the Company evaluates credit risk characteristics that consider past-due status being indicative of the inability to pay all amounts due as per contractual terms.
NOTES TO THE CONSOLIDATED FINANCIAL STATEMENTS (continued)
At 31 December 2016
INTERNATIONAL GENERAL INSURANCE HOLDINGS LIMITED ANNUAL REPORT & ACCOUNTS 201634
INTERNATIONAL GENERAL INSURANCE HOLDINGS LIMITED ANNUAL REPORT & ACCOUNTS 2016
35
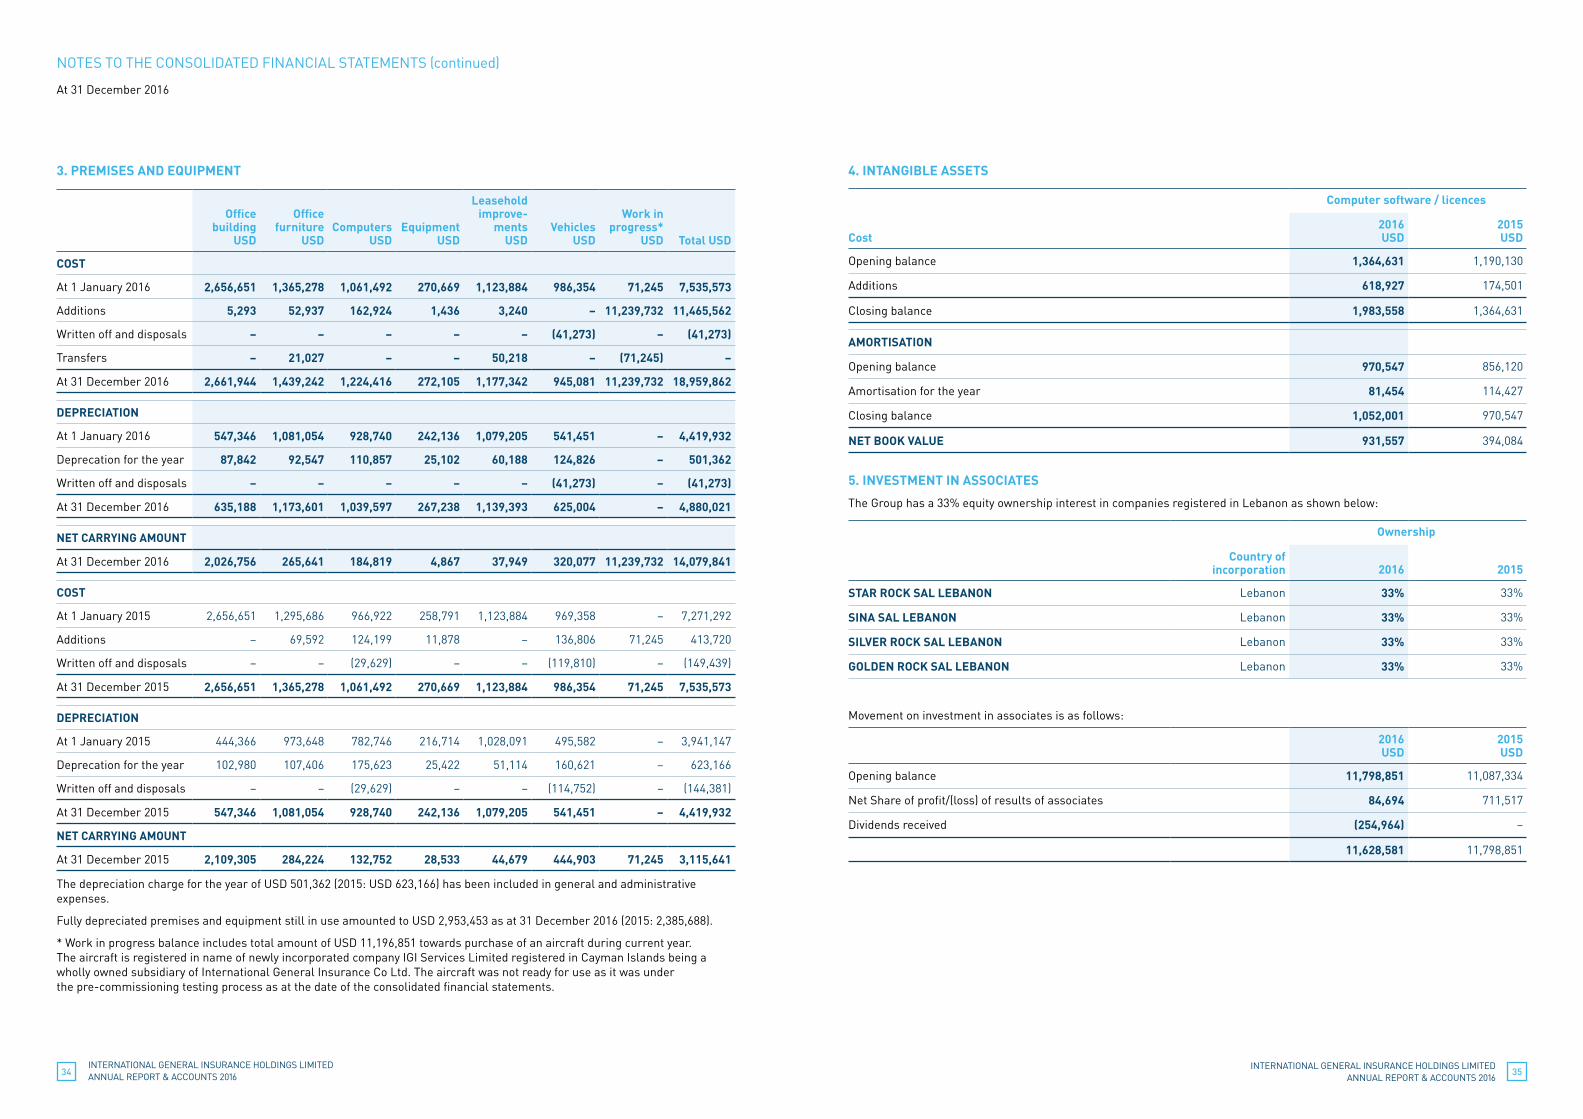
3. PREMISES AND EQUIPMENT 4. INTANGIBLE ASSETS
Computer software / licences
Cost
2016USD
2015USD
Opening balance 1,364,631 1,190,130
Additions 618,927 174,501
Closing balance 1,983,558 1,364,631
AMORTISATION
Opening balance 970,547 856,120
Amortisation for the year 81,454 114,427
Closing balance 1,052,001 970,547
NET BOOK VALUE 931,557 394,084
5. INVESTMENT IN ASSOCIATES
The Group has a 33% equity ownership interest in companies registered in Lebanon as shown below:
Country of incorporation
Ownership
2016 2015
STAR ROCK SAL LEBANON Lebanon 33% 33%
SINA SAL LEBANON Lebanon 33% 33%
SILVER ROCK SAL LEBANON Lebanon 33% 33%
GOLDEN ROCK SAL LEBANON Lebanon 33% 33%
Movement on investment in associates is as follows:
2016USD
2015USD
Opening balance 11,798,851 11,087,334
Net Share of profit/(loss) of results of associates 84,694 711,517
Dividends received (254,964) –
11,628,581 11,798,851
Office
building USD
Office
furniture USD
ComputersUSD
Equipment USD
Leasehold improve-
ments USD
Vehicles USD
Work in
progress* USD
Total USD
COST
At 1 January 2016 2,656,651 1,365,278 1,061,492 270,669 1,123,884 986,354 71,245 7,535,573
Additions 5,293 52,937 162,924 1,436 3,240 – 11,239,732 11,465,562
Written off and disposals – – – – – (41,273) – (41,273)
Transfers – 21,027 – – 50,218 – (71,245) –
At 31 December 2016 2,661,944 1,439,242 1,224,416 272,105 1,177,342 945,081 11,239,732 18,959,862
DEPRECIATION
At 1 January 2016 547,346 1,081,054 928,740 242,136 1,079,205 541,451 – 4,419,932
Deprecation for the year 87,842 92,547 110,857 25,102 60,188 124,826 – 501,362
Written off and disposals – – – – – (41,273) – (41,273)
At 31 December 2016 635,188 1,173,601 1,039,597 267,238 1,139,393 625,004 – 4,880,021
NET CARRYING AMOUNT
At 31 December 2016 2,026,756 265,641 184,819 4,867 37,949 320,077 11,239,732 14,079,841
COST
At 1 January 2015 2,656,651 1,295,686 966,922 258,791 1,123,884 969,358 – 7,271,292
Additions – 69,592 124,199 11,878 – 136,806 71,245 413,720
Written off and disposals – – (29,629) – – (119,810) – (149,439)
At 31 December 2015 2,656,651 1,365,278 1,061,492 270,669 1,123,884 986,354 71,245 7,535,573
DEPRECIATION
At 1 January 2015 444,366 973,648 782,746 216,714 1,028,091 495,582 – 3,941,147
Deprecation for the year 102,980 107,406 175,623 25,422 51,114 160,621 – 623,166
Written off and disposals – – (29,629) – – (114,752) – (144,381)
At 31 December 2015 547,346 1,081,054 928,740 242,136 1,079,205 541,451 – 4,419,932
NET CARRYING AMOUNT
At 31 December 2015 2,109,305 284,224 132,752 28,533 44,679 444,903 71,245 3,115,641
The depreciation charge for the year of USD 501,362 (2015: USD 623,166) has been included in general and administrative expenses.
Fully depreciated premises and equipment still in use amounted to USD 2,953,453 as at 31 December 2016 (2015: 2,385,688).
* Work in progress balance includes total amount of USD 11,196,851 towards purchase of an aircraft during current year. The aircraft is registered in name of newly incorporated company IGI Services Limited registered in Cayman Islands being a wholly owned subsidiary of International General Insurance Co Ltd. The aircraft was not ready for use as it was under the pre-commissioning testing process as at the date of the consolidated financial statements.
NOTES TO THE CONSOLIDATED FINANCIAL STATEMENTS (continued)
At 31 December 2016
INTERNATIONAL GENERAL INSURANCE HOLDINGS LIMITED ANNUAL REPORT & ACCOUNTS 201636
INTERNATIONAL GENERAL INSURANCE HOLDINGS LIMITED ANNUAL REPORT & ACCOUNTS 2016
37
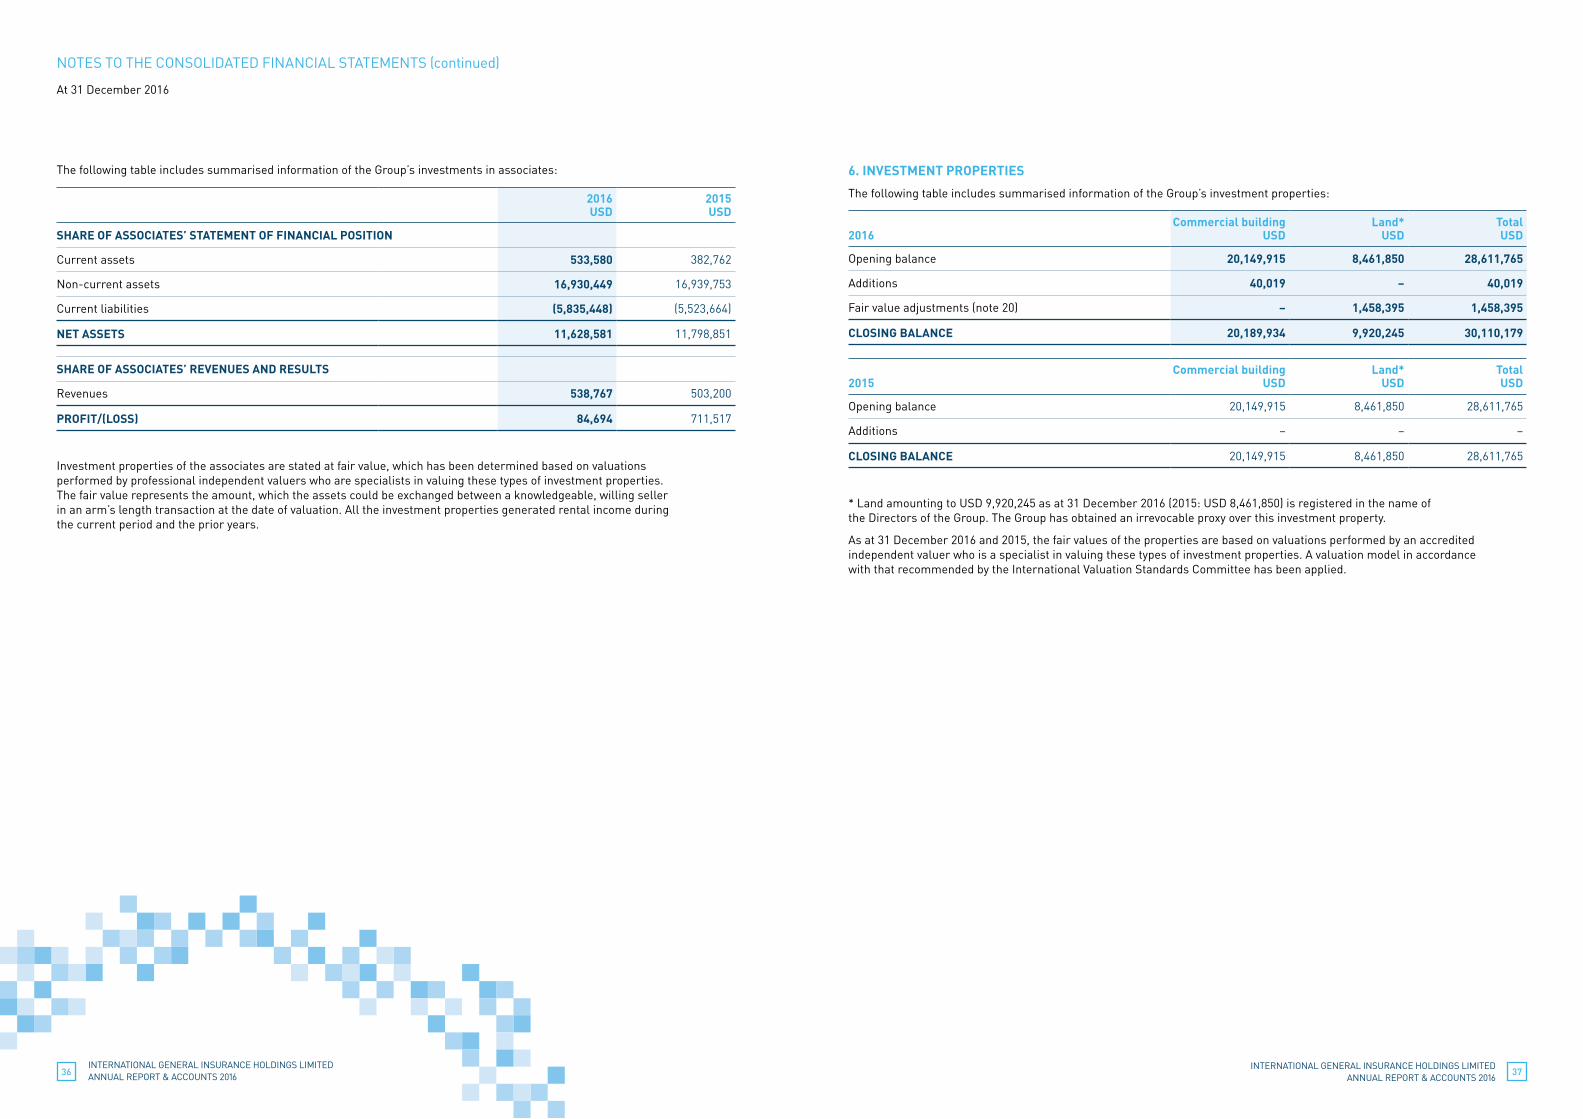
The following table includes summarised information of the Group’s investments in associates:
2016USD
2015USD
SHARE OF ASSOCIATES’ STATEMENT OF FINANCIAL POSITION
Current assets 533,580 382,762
Non-current assets 16,930,449 16,939,753
Current liabilities (5,835,448) (5,523,664)
NET ASSETS 11,628,581 11,798,851
SHARE OF ASSOCIATES’ REVENUES AND RESULTS
Revenues 538,767 503,200
PROFIT/(LOSS) 84,694 711,517
Investment properties of the associates are stated at fair value, which has been determined based on valuations performed by professional independent valuers who are specialists in valuing these types of investment properties. The fair value represents the amount, which the assets could be exchanged between a knowledgeable, willing seller in an arm’s length transaction at the date of valuation. All the investment properties generated rental income during the current period and the prior years.
6. INVESTMENT PROPERTIES
The following table includes summarised information of the Group’s investment properties:
2016
Commercial building USD
Land* USD
TotalUSD
Opening balance 20,149,915 8,461,850 28,611,765
Additions 40,019 – 40,019
Fair value adjustments (note 20) – 1,458,395 1,458,395
CLOSING BALANCE 20,189,934 9,920,245 30,110,179
2015
Commercial building USD
Land* USD
TotalUSD
Opening balance 20,149,915 8,461,850 28,611,765
Additions – – –
CLOSING BALANCE 20,149,915 8,461,850 28,611,765
* Land amounting to USD 9,920,245 as at 31 December 2016 (2015: USD 8,461,850) is registered in the name of the Directors of the Group. The Group has obtained an irrevocable proxy over this investment property.
As at 31 December 2016 and 2015, the fair values of the properties are based on valuations performed by an accredited independent valuer who is a specialist in valuing these types of investment properties. A valuation model in accordance with that recommended by the International Valuation Standards Committee has been applied.
NOTES TO THE CONSOLIDATED FINANCIAL STATEMENTS (continued)
At 31 December 2016
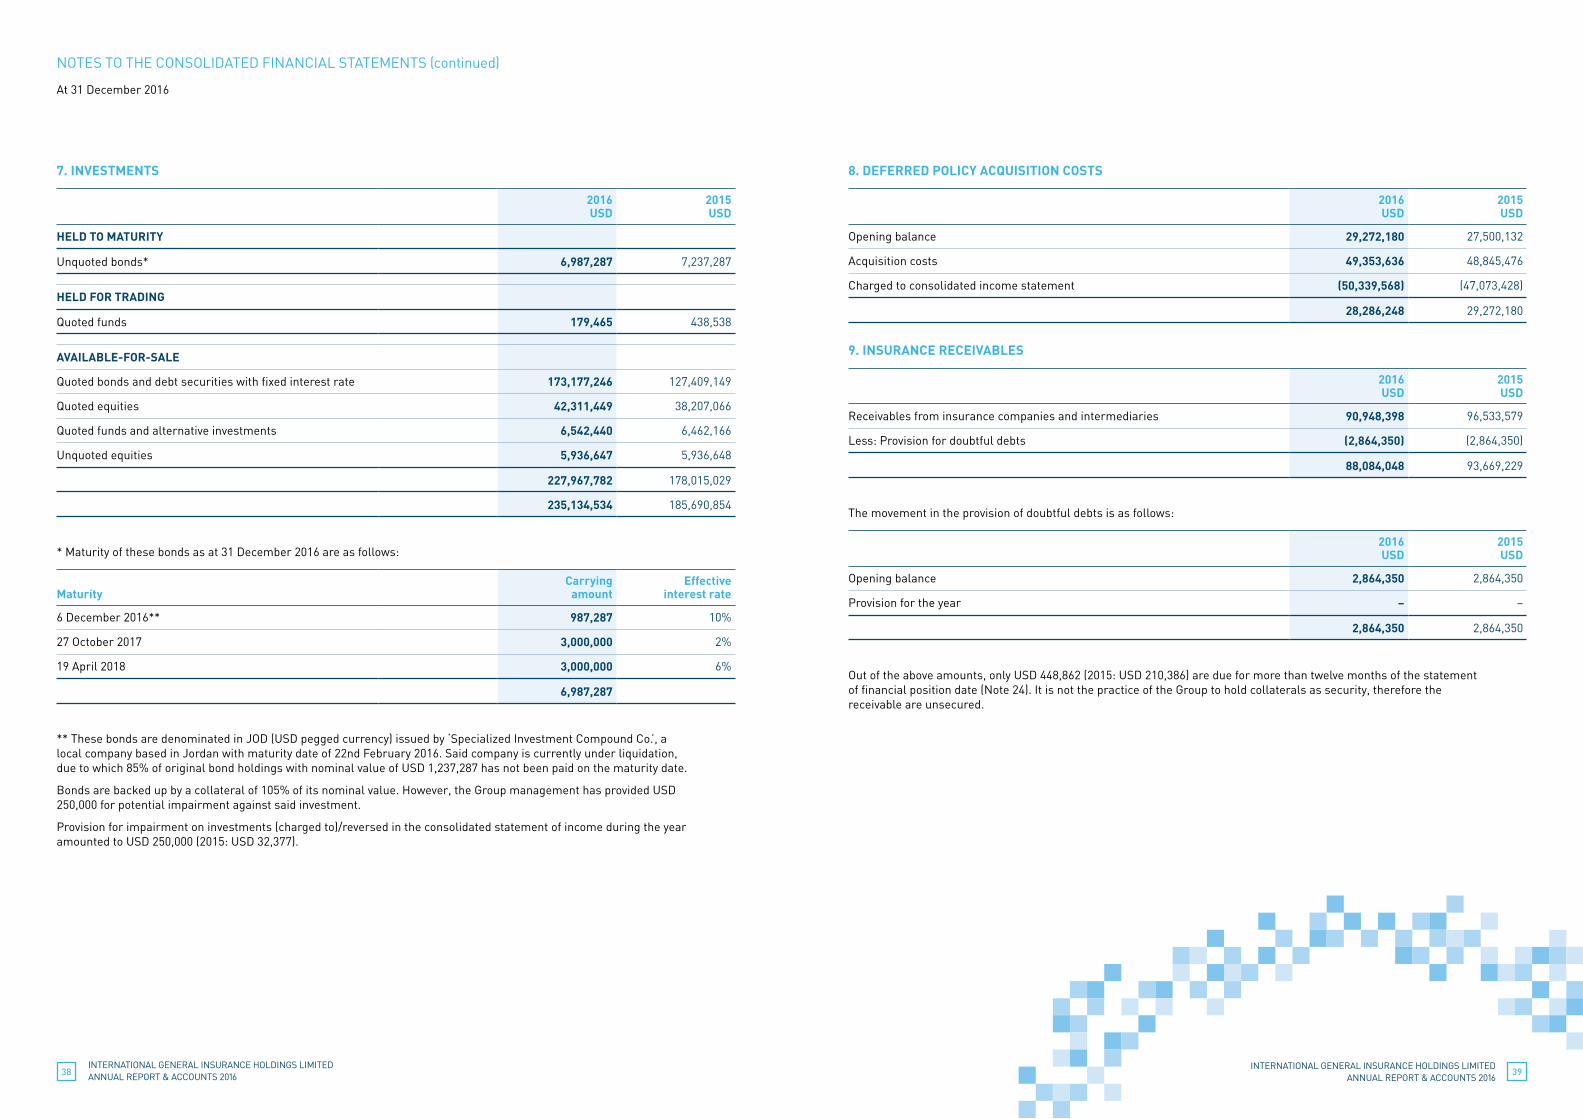
INTERNATIONAL GENERAL INSURANCE HOLDINGS LIMITED ANNUAL REPORT & ACCOUNTS 201638
INTERNATIONAL GENERAL INSURANCE HOLDINGS LIMITED ANNUAL REPORT & ACCOUNTS 2016
39
7. INVESTMENTS
2016USD
2015USD
HELD TO MATURITY
Unquoted bonds* 6,987,287 7,237,287
HELD FOR TRADING
Quoted funds 179,465 438,538
AVAILABLE-FOR-SALE
Quoted bonds and debt securities with fixed interest rate 173,177,246 127,409,149
Quoted equities 42,311,449 38,207,066
Quoted funds and alternative investments 6,542,440 6,462,166
Unquoted equities 5,936,647 5,936,648
227,967,782 178,015,029
235,134,534 185,690,854
* Maturity of these bonds as at 31 December 2016 are as follows:
Maturity
Carrying amount
Effective interest rate
6 December 2016** 987,287 10%
27 October 2017 3,000,000 2%
19 April 2018 3,000,000 6%
6,987,287
** These bonds are denominated in JOD (USD pegged currency) issued by ‘Specialized Investment Compound Co.’, a local company based in Jordan with maturity date of 22nd February 2016. Said company is currently under liquidation, due to which 85% of original bond holdings with nominal value of USD 1,237,287 has not been paid on the maturity date.
Bonds are backed up by a collateral of 105% of its nominal value. However, the Group management has provided USD 250,000 for potential impairment against said investment.
Provision for impairment on investments (charged to)/reversed in the consolidated statement of income during the year amounted to USD 250,000 (2015: USD 32,377).
8. DEFERRED POLICY ACQUISITION COSTS
2016USD
2015USD
Opening balance 29,272,180 27,500,132
Acquisition costs 49,353,636 48,845,476
Charged to consolidated income statement (50,339,568) (47,073,428)
28,286,248 29,272,180
9. INSURANCE RECEIVABLES
2016USD
2015USD
Receivables from insurance companies and intermediaries 90,948,398 96,533,579
Less: Provision for doubtful debts (2,864,350) (2,864,350)
88,084,048 93,669,229
The movement in the provision of doubtful debts is as follows:
2016USD
2015USD
Opening balance 2,864,350 2,864,350
Provision for the year – –
2,864,350 2,864,350
Out of the above amounts, only USD 448,862 (2015: USD 210,386) are due for more than twelve months of the statement of financial position date (Note 24). It is not the practice of the Group to hold collaterals as security, therefore the receivable are unsecured.
NOTES TO THE CONSOLIDATED FINANCIAL STATEMENTS (continued)
At 31 December 2016
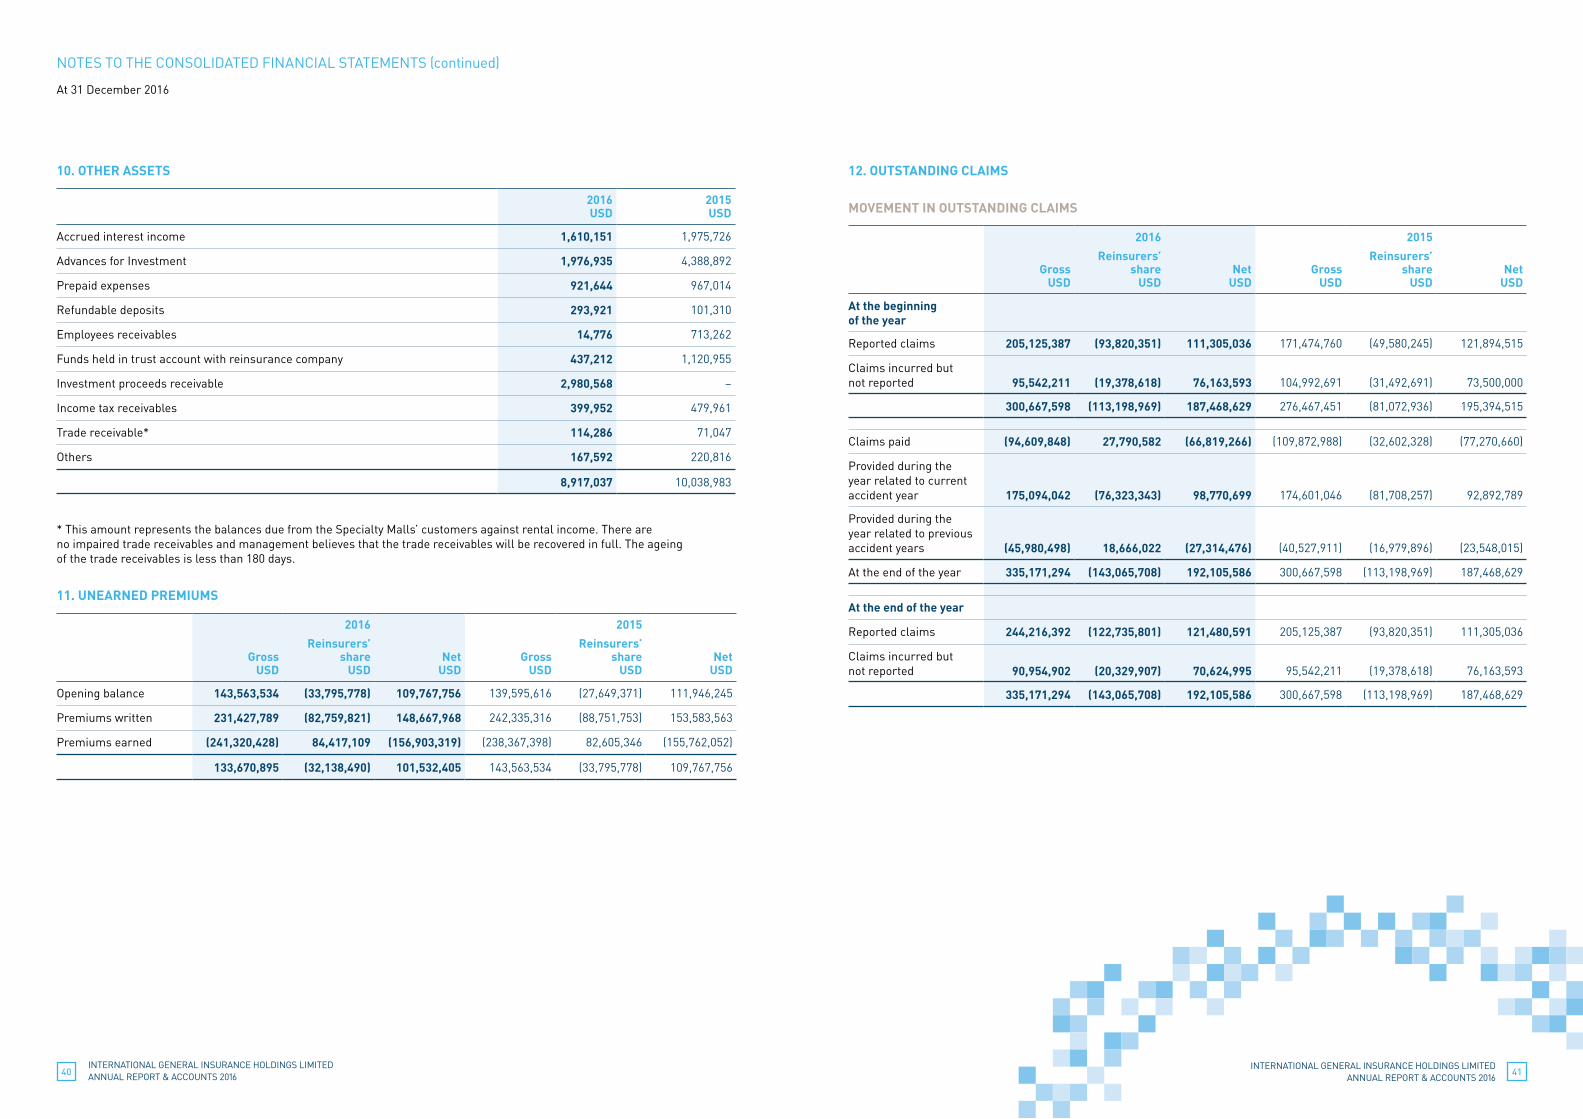
INTERNATIONAL GENERAL INSURANCE HOLDINGS LIMITED ANNUAL REPORT & ACCOUNTS 201640
INTERNATIONAL GENERAL INSURANCE HOLDINGS LIMITED ANNUAL REPORT & ACCOUNTS 2016
41
10. OTHER ASSETS
2016USD
2015USD
Accrued interest income 1,610,151 1,975,726
Advances for Investment 1,976,935 4,388,892
Prepaid expenses 921,644 967,014
Refundable deposits 293,921 101,310
Employees receivables 14,776 713,262
Funds held in trust account with reinsurance company 437,212 1,120,955
Investment proceeds receivable 2,980,568 –
Income tax receivables 399,952 479,961
Trade receivable* 114,286 71,047
Others 167,592 220,816
8,917,037 10,038,983
* This amount represents the balances due from the Specialty Malls’ customers against rental income. There are no impaired trade receivables and management believes that the trade receivables will be recovered in full. The ageing of the trade receivables is less than 180 days.
11. UNEARNED PREMIUMS
2016 2015
Gross
USD
Reinsurers’share
USD
Net
USD
Gross
USD
Reinsurers’share
USD
Net
USD
Opening balance 143,563,534 (33,795,778) 109,767,756 139,595,616 (27,649,371) 111,946,245
Premiums written 231,427,789 (82,759,821) 148,667,968 242,335,316 (88,751,753) 153,583,563
Premiums earned (241,320,428) 84,417,109 (156,903,319) (238,367,398) 82,605,346 (155,762,052)
133,670,895 (32,138,490) 101,532,405 143,563,534 (33,795,778) 109,767,756
12. OUTSTANDING CLAIMS
MOVEMENT IN OUTSTANDING CLAIMS
2016 2015
Gross
USD
Reinsurers’share
USD
Net
USD
Gross
USD
Reinsurers’share
USD
Net
USD
At the beginning of the year
Reported claims 205,125,387 (93,820,351) 111,305,036 171,474,760 (49,580,245) 121,894,515
Claims incurred but not reported
95,542,211
(19,378,618)
76,163,593
104,992,691
(31,492,691)
73,500,000
300,667,598 (113,198,969) 187,468,629 276,467,451 (81,072,936) 195,394,515
Claims paid (94,609,848) 27,790,582 (66,819,266) (109,872,988) (32,602,328) (77,270,660)
Provided during the year related to current accident year
175,094,042
(76,323,343)
98,770,699
174,601,046
(81,708,257)
92,892,789
Provided during the year related to previous accident years
(45,980,498)
18,666,022
(27,314,476)
(40,527,911)
(16,979,896)
(23,548,015)
At the end of the year 335,171,294 (143,065,708) 192,105,586 300,667,598 (113,198,969) 187,468,629
At the end of the year
Reported claims 244,216,392 (122,735,801) 121,480,591 205,125,387 (93,820,351) 111,305,036
Claims incurred but not reported
90,954,902
(20,329,907)
70,624,995
95,542,211
(19,378,618)
76,163,593
335,171,294 (143,065,708) 192,105,586 300,667,598 (113,198,969) 187,468,629
NOTES TO THE CONSOLIDATED FINANCIAL STATEMENTS (continued)
At 31 December 2016
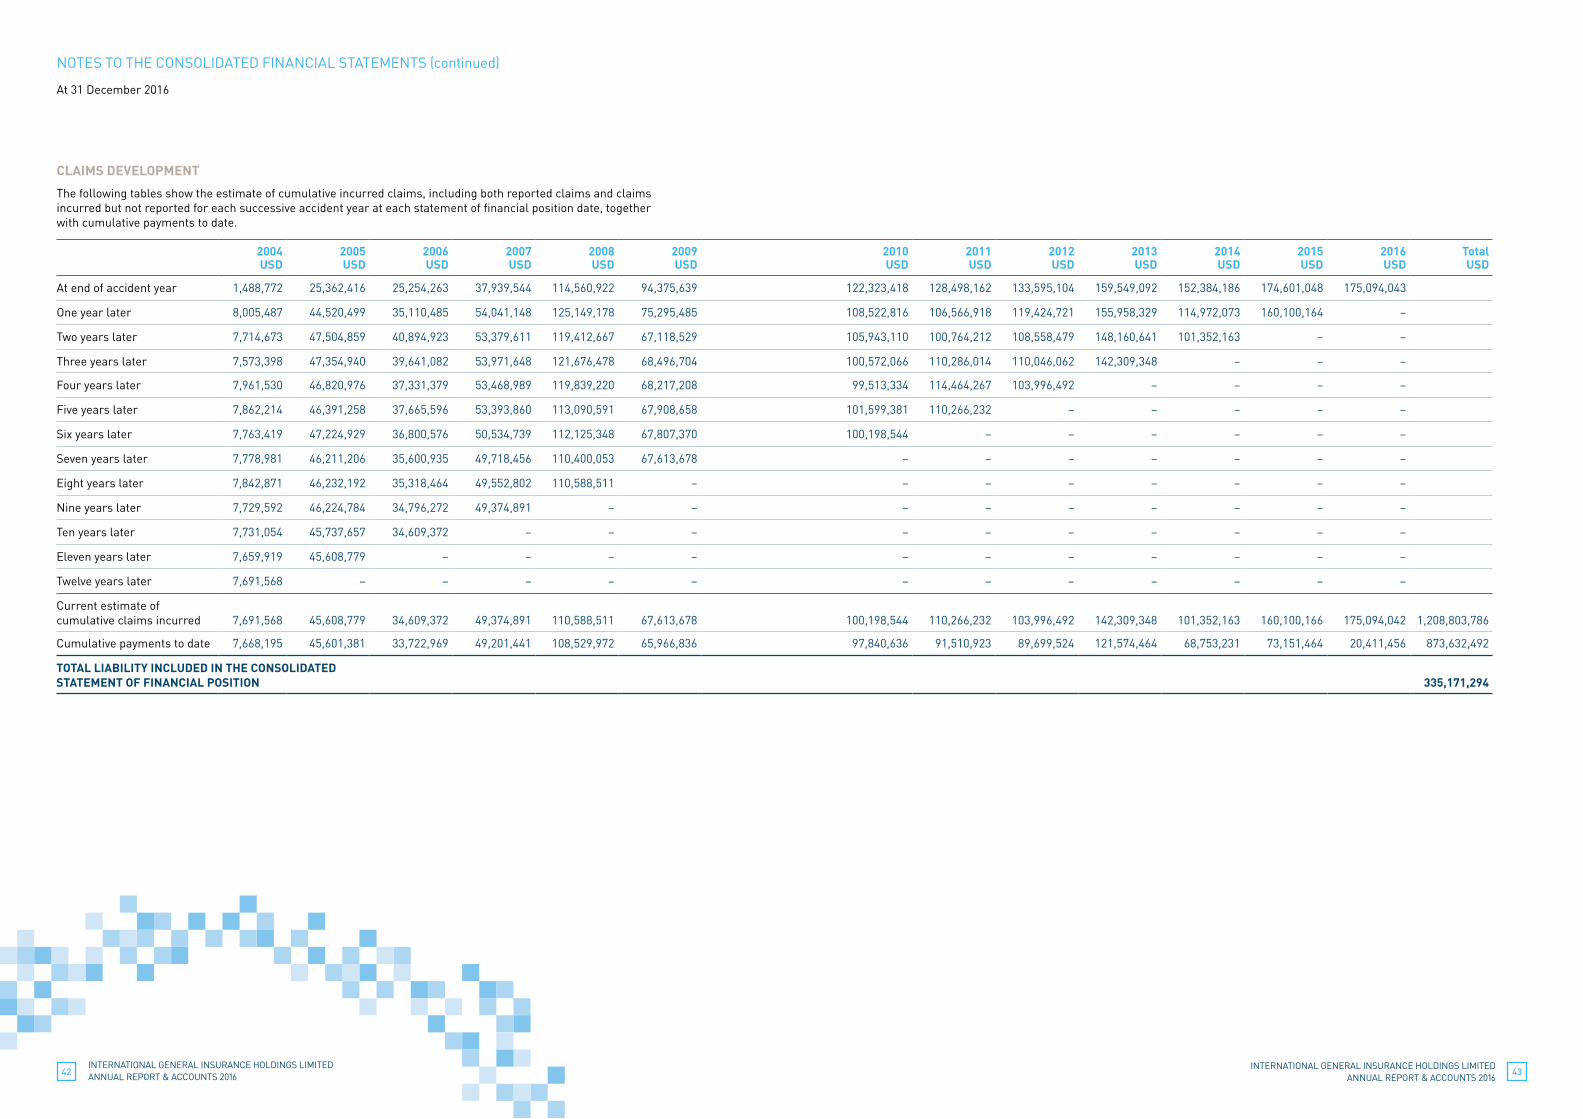
INTERNATIONAL GENERAL INSURANCE HOLDINGS LIMITED ANNUAL REPORT & ACCOUNTS 201642
INTERNATIONAL GENERAL INSURANCE HOLDINGS LIMITED ANNUAL REPORT & ACCOUNTS 2016
43
CLAIMS DEVELOPMENT
The following tables show the estimate of cumulative incurred claims, including both reported claims and claims incurred but not reported for each successive accident year at each statement of financial position date, together with cumulative payments to date.
2004USD
2005USD
2006 USD
2007USD
2008USD
2009 USD
2010 USD
2011 USD
2012 USD
2013 USD
2014 USD
2015 USD
2016 USD
Total USD
At end of accident year 1,488,772 25,362,416 25,254,263 37,939,544 114,560,922 94,375,639 122,323,418 128,498,162 133,595,104 159,549,092 152,384,186 174,601,048 175,094,043
One year later 8,005,487 44,520,499 35,110,485 54,041,148 125,149,178 75,295,485 108,522,816 106,566,918 119,424,721 155,958,329 114,972,073 160,100,164 –
Two years later 7,714,673 47,504,859 40,894,923 53,379,611 119,412,667 67,118,529 105,943,110 100,764,212 108,558,479 148,160,641 101,352,163 – –
Three years later 7,573,398 47,354,940 39,641,082 53,971,648 121,676,478 68,496,704 100,572,066 110,286,014 110,046,062 142,309,348 – – –
Four years later 7,961,530 46,820,976 37,331,379 53,468,989 119,839,220 68,217,208 99,513,334 114,464,267 103,996,492 – – – –
Five years later 7,862,214 46,391,258 37,665,596 53,393,860 113,090,591 67,908,658 101,599,381 110,266,232 – – – – –
Six years later 7,763,419 47,224,929 36,800,576 50,534,739 112,125,348 67,807,370 100,198,544 – – – – – –
Seven years later 7,778,981 46,211,206 35,600,935 49,718,456 110,400,053 67,613,678 – – – – – – –
Eight years later 7,842,871 46,232,192 35,318,464 49,552,802 110,588,511 – – – – – – – –
Nine years later 7,729,592 46,224,784 34,796,272 49,374,891 – – – – – – – – –
Ten years later 7,731,054 45,737,657 34,609,372 – – – – – – – – – –
Eleven years later 7,659,919 45,608,779 – – – – – – – – – – –
Twelve years later 7,691,568 – – – – – – – – – – – –
Current estimate of cumulative claims incurred
7,691,568
45,608,779
34,609,372
49,374,891
110,588,511
67,613,678
100,198,544
110,266,232
103,996,492
142,309,348
101,352,163
160,100,166
175,094,042
1,208,803,786
Cumulative payments to date 7,668,195 45,601,381 33,722,969 49,201,441 108,529,972 65,966,836 97,840,636 91,510,923 89,699,524 121,574,464 68,753,231 73,151,464 20,411,456 873,632,492
TOTAL LIABILITY INCLUDED IN THE CONSOLIDATED STATEMENT OF FINANCIAL POSITION
335,171,294
NOTES TO THE CONSOLIDATED FINANCIAL STATEMENTS (continued)
At 31 December 2016
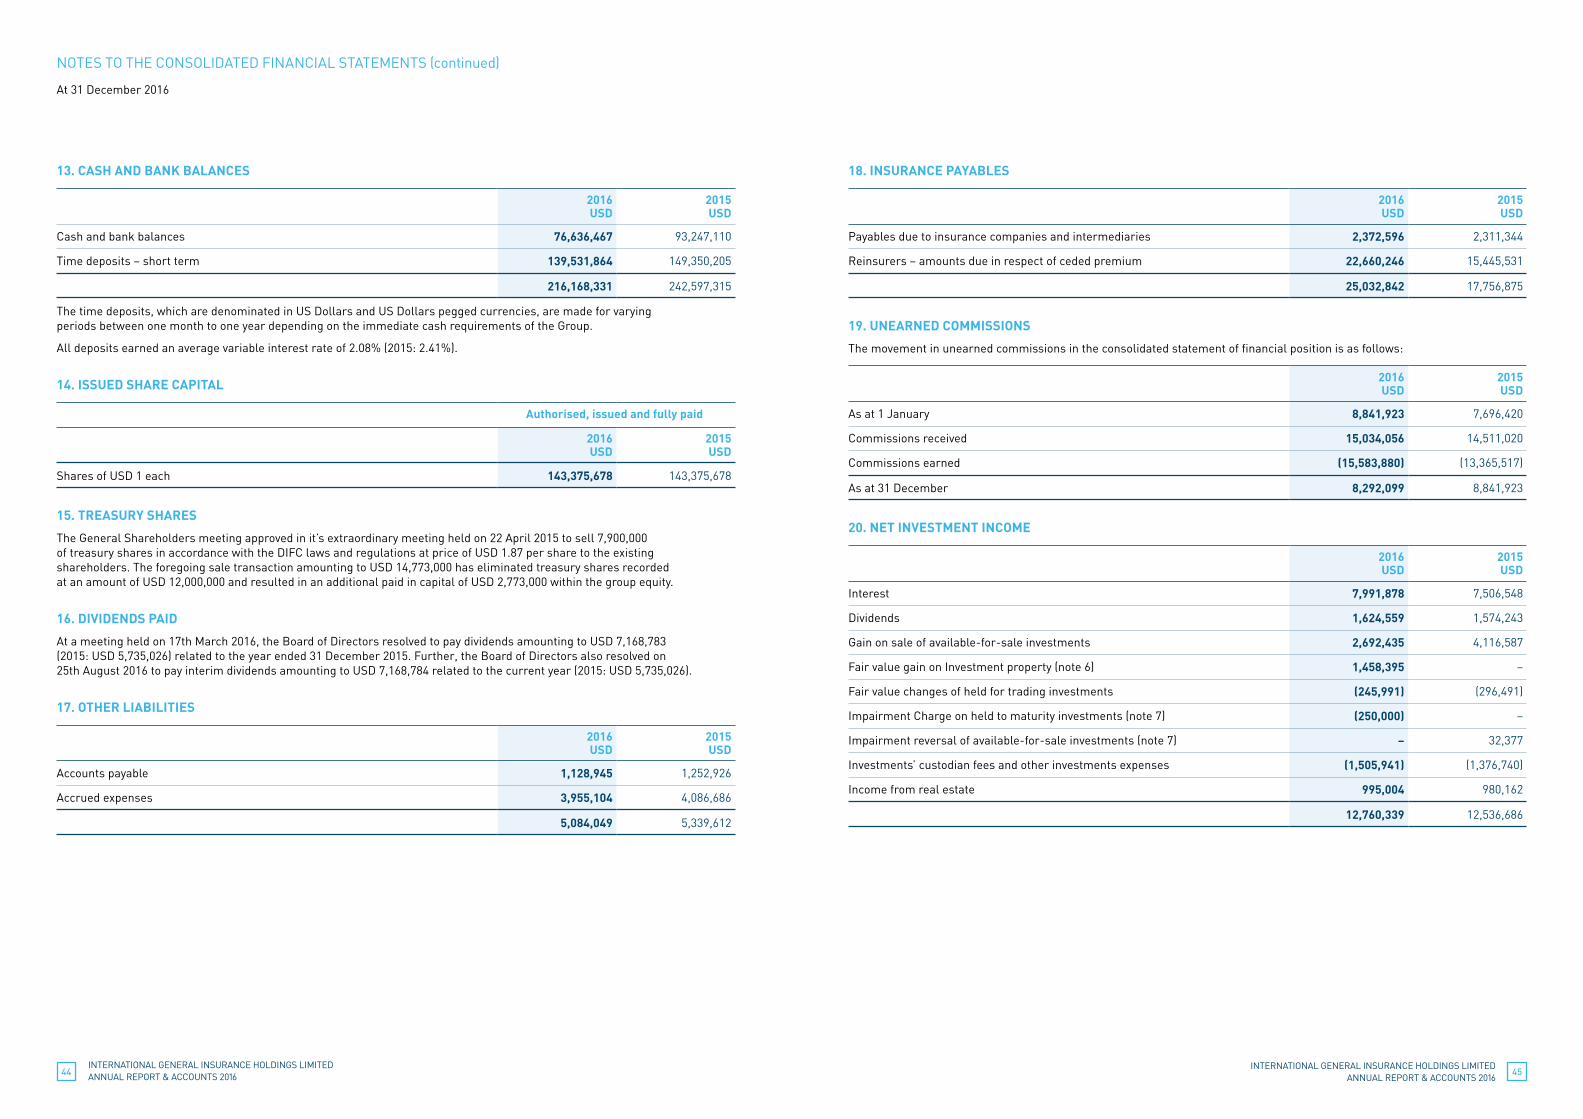
INTERNATIONAL GENERAL INSURANCE HOLDINGS LIMITED ANNUAL REPORT & ACCOUNTS 201644
INTERNATIONAL GENERAL INSURANCE HOLDINGS LIMITED ANNUAL REPORT & ACCOUNTS 2016
45
13. CASH AND BANK BALANCES
2016USD
2015USD
Cash and bank balances 76,636,467 93,247,110
Time deposits – short term 139,531,864 149,350,205
216,168,331 242,597,315
The time deposits, which are denominated in US Dollars and US Dollars pegged currencies, are made for varying periods between one month to one year depending on the immediate cash requirements of the Group.
All deposits earned an average variable interest rate of 2.08% (2015: 2.41%).
14. ISSUED SHARE CAPITAL
Authorised, issued and fully paid
2016USD
2015USD
Shares of USD 1 each 143,375,678 143,375,678
15. TREASURY SHARES
The General Shareholders meeting approved in it’s extraordinary meeting held on 22 April 2015 to sell 7,900,000 of treasury shares in accordance with the DIFC laws and regulations at price of USD 1.87 per share to the existing shareholders. The foregoing sale transaction amounting to USD 14,773,000 has eliminated treasury shares recorded at an amount of USD 12,000,000 and resulted in an additional paid in capital of USD 2,773,000 within the group equity.
16. DIVIDENDS PAID
At a meeting held on 17th March 2016, the Board of Directors resolved to pay dividends amounting to USD 7,168,783 (2015: USD 5,735,026) related to the year ended 31 December 2015. Further, the Board of Directors also resolved on 25th August 2016 to pay interim dividends amounting to USD 7,168,784 related to the current year (2015: USD 5,735,026).
17. OTHER LIABILITIES
2016USD
2015USD
Accounts payable 1,128,945 1,252,926
Accrued expenses 3,955,104 4,086,686
5,084,049 5,339,612
18. INSURANCE PAYABLES
2016USD
2015USD
Payables due to insurance companies and intermediaries 2,372,596 2,311,344
Reinsurers – amounts due in respect of ceded premium 22,660,246 15,445,531
25,032,842 17,756,875
19. UNEARNED COMMISSIONS
The movement in unearned commissions in the consolidated statement of financial position is as follows:
2016USD
2015USD
As at 1 January 8,841,923 7,696,420
Commissions received 15,034,056 14,511,020
Commissions earned (15,583,880) (13,365,517)
As at 31 December 8,292,099 8,841,923
20. NET INVESTMENT INCOME
2016USD
2015USD
Interest 7,991,878 7,506,548
Dividends 1,624,559 1,574,243
Gain on sale of available-for-sale investments 2,692,435 4,116,587
Fair value gain on Investment property (note 6) 1,458,395 –
Fair value changes of held for trading investments (245,991) (296,491)
Impairment Charge on held to maturity investments (note 7) (250,000) –
Impairment reversal of available-for-sale investments (note 7) – 32,377
Investments’ custodian fees and other investments expenses (1,505,941) (1,376,740)
Income from real estate 995,004 980,162
12,760,339 12,536,686
NOTES TO THE CONSOLIDATED FINANCIAL STATEMENTS (continued)
At 31 December 2016
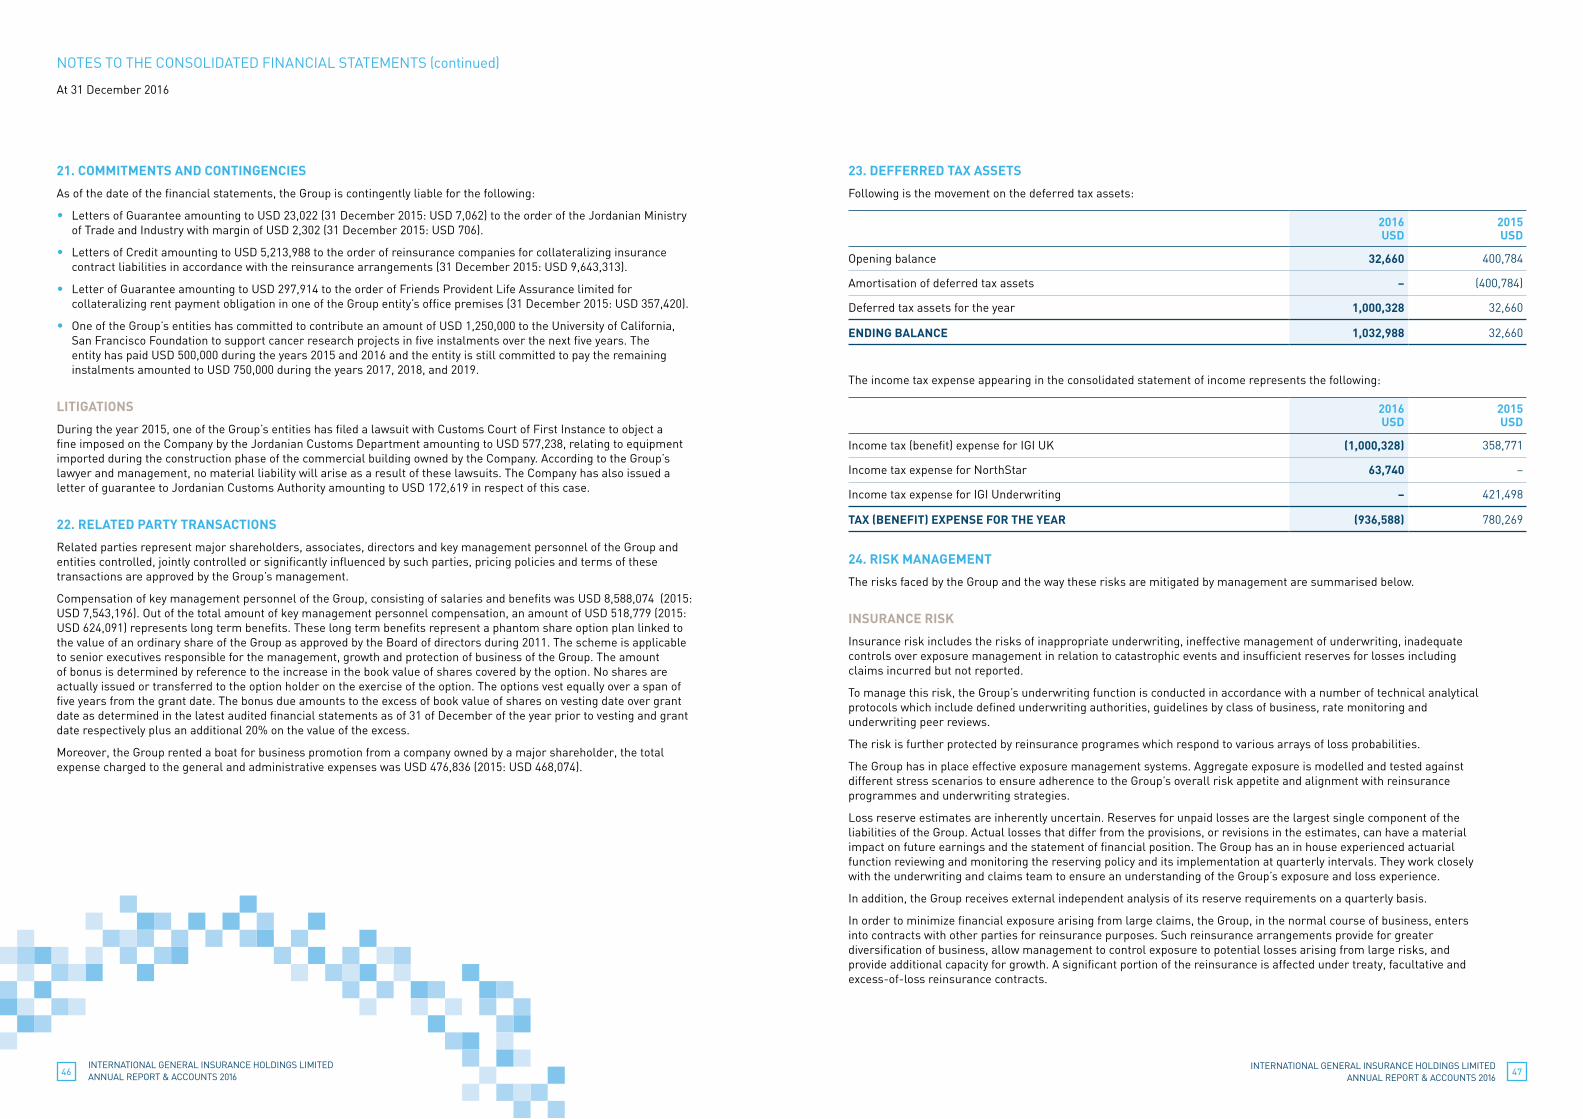
INTERNATIONAL GENERAL INSURANCE HOLDINGS LIMITED ANNUAL REPORT & ACCOUNTS 201646
INTERNATIONAL GENERAL INSURANCE HOLDINGS LIMITED ANNUAL REPORT & ACCOUNTS 2016
47
21. COMMITMENTS AND CONTINGENCIES
As of the date of the financial statements, the Group is contingently liable for the following:
• Letters of Guarantee amounting to USD 23,022 (31 December 2015: USD 7,062) to the order of the Jordanian Ministry of Trade and Industry with margin of USD 2,302 (31 December 2015: USD 706).
• Letters of Credit amounting to USD 5,213,988 to the order of reinsurance companies for collateralizing insurance contract liabilities in accordance with the reinsurance arrangements (31 December 2015: USD 9,643,313).
• Letter of Guarantee amounting to USD 297,914 to the order of Friends Provident Life Assurance limited for collateralizing rent payment obligation in one of the Group entity’s office premises (31 December 2015: USD 357,420).
• One of the Group’s entities has committed to contribute an amount of USD 1,250,000 to the University of California, San Francisco Foundation to support cancer research projects in five instalments over the next five years. The entity has paid USD 500,000 during the years 2015 and 2016 and the entity is still committed to pay the remaining instalments amounted to USD 750,000 during the years 2017, 2018, and 2019.
LITIGATIONS
During the year 2015, one of the Group’s entities has filed a lawsuit with Customs Court of First Instance to object a fine imposed on the Company by the Jordanian Customs Department amounting to USD 577,238, relating to equipment imported during the construction phase of the commercial building owned by the Company. According to the Group’s lawyer and management, no material liability will arise as a result of these lawsuits. The Company has also issued a letter of guarantee to Jordanian Customs Authority amounting to USD 172,619 in respect of this case.
22. RELATED PARTY TRANSACTIONS
Related parties represent major shareholders, associates, directors and key management personnel of the Group and entities controlled, jointly controlled or significantly influenced by such parties, pricing policies and terms of these transactions are approved by the Group’s management.
Compensation of key management personnel of the Group, consisting of salaries and benefits was USD 8,588,074 (2015: USD 7,543,196). Out of the total amount of key management personnel compensation, an amount of USD 518,779 (2015: USD 624,091) represents long term benefits. These long term benefits represent a phantom share option plan linked to the value of an ordinary share of the Group as approved by the Board of directors during 2011. The scheme is applicable to senior executives responsible for the management, growth and protection of business of the Group. The amount of bonus is determined by reference to the increase in the book value of shares covered by the option. No shares are actually issued or transferred to the option holder on the exercise of the option. The options vest equally over a span of five years from the grant date. The bonus due amounts to the excess of book value of shares on vesting date over grant date as determined in the latest audited financial statements as of 31 of December of the year prior to vesting and grant date respectively plus an additional 20% on the value of the excess.
Moreover, the Group rented a boat for business promotion from a company owned by a major shareholder, the total expense charged to the general and administrative expenses was USD 476,836 (2015: USD 468,074).
23. DEFFERRED TAX ASSETS
Following is the movement on the deferred tax assets:
2016USD
2015USD
Opening balance 32,660 400,784
Amortisation of deferred tax assets – (400,784)
Deferred tax assets for the year 1,000,328 32,660
ENDING BALANCE 1,032,988 32,660
The income tax expense appearing in the consolidated statement of income represents the following:
2016USD
2015USD
Income tax (benefit) expense for IGI UK (1,000,328) 358,771
Income tax expense for NorthStar 63,740 –
Income tax expense for IGI Underwriting – 421,498
TAX (BENEFIT) EXPENSE FOR THE YEAR (936,588) 780,269
24. RISK MANAGEMENT
The risks faced by the Group and the way these risks are mitigated by management are summarised below.
INSURANCE RISK
Insurance risk includes the risks of inappropriate underwriting, ineffective management of underwriting, inadequate controls over exposure management in relation to catastrophic events and insufficient reserves for losses including claims incurred but not reported.
To manage this risk, the Group’s underwriting function is conducted in accordance with a number of technical analytical protocols which include defined underwriting authorities, guidelines by class of business, rate monitoring and underwriting peer reviews.
The risk is further protected by reinsurance programes which respond to various arrays of loss probabilities.
The Group has in place effective exposure management systems. Aggregate exposure is modelled and tested against different stress scenarios to ensure adherence to the Group’s overall risk appetite and alignment with reinsurance programmes and underwriting strategies.
Loss reserve estimates are inherently uncertain. Reserves for unpaid losses are the largest single component of the liabilities of the Group. Actual losses that differ from the provisions, or revisions in the estimates, can have a material impact on future earnings and the statement of financial position. The Group has an in house experienced actuarial function reviewing and monitoring the reserving policy and its implementation at quarterly intervals. They work closely with the underwriting and claims team to ensure an understanding of the Group’s exposure and loss experience.
In addition, the Group receives external independent analysis of its reserve requirements on a quarterly basis.
In order to minimize financial exposure arising from large claims, the Group, in the normal course of business, enters into contracts with other parties for reinsurance purposes. Such reinsurance arrangements provide for greater diversification of business, allow management to control exposure to potential losses arising from large risks, and provide additional capacity for growth. A significant portion of the reinsurance is affected under treaty, facultative and excess-of-loss reinsurance contracts.
NOTES TO THE CONSOLIDATED FINANCIAL STATEMENTS (continued)
At 31 December 2016
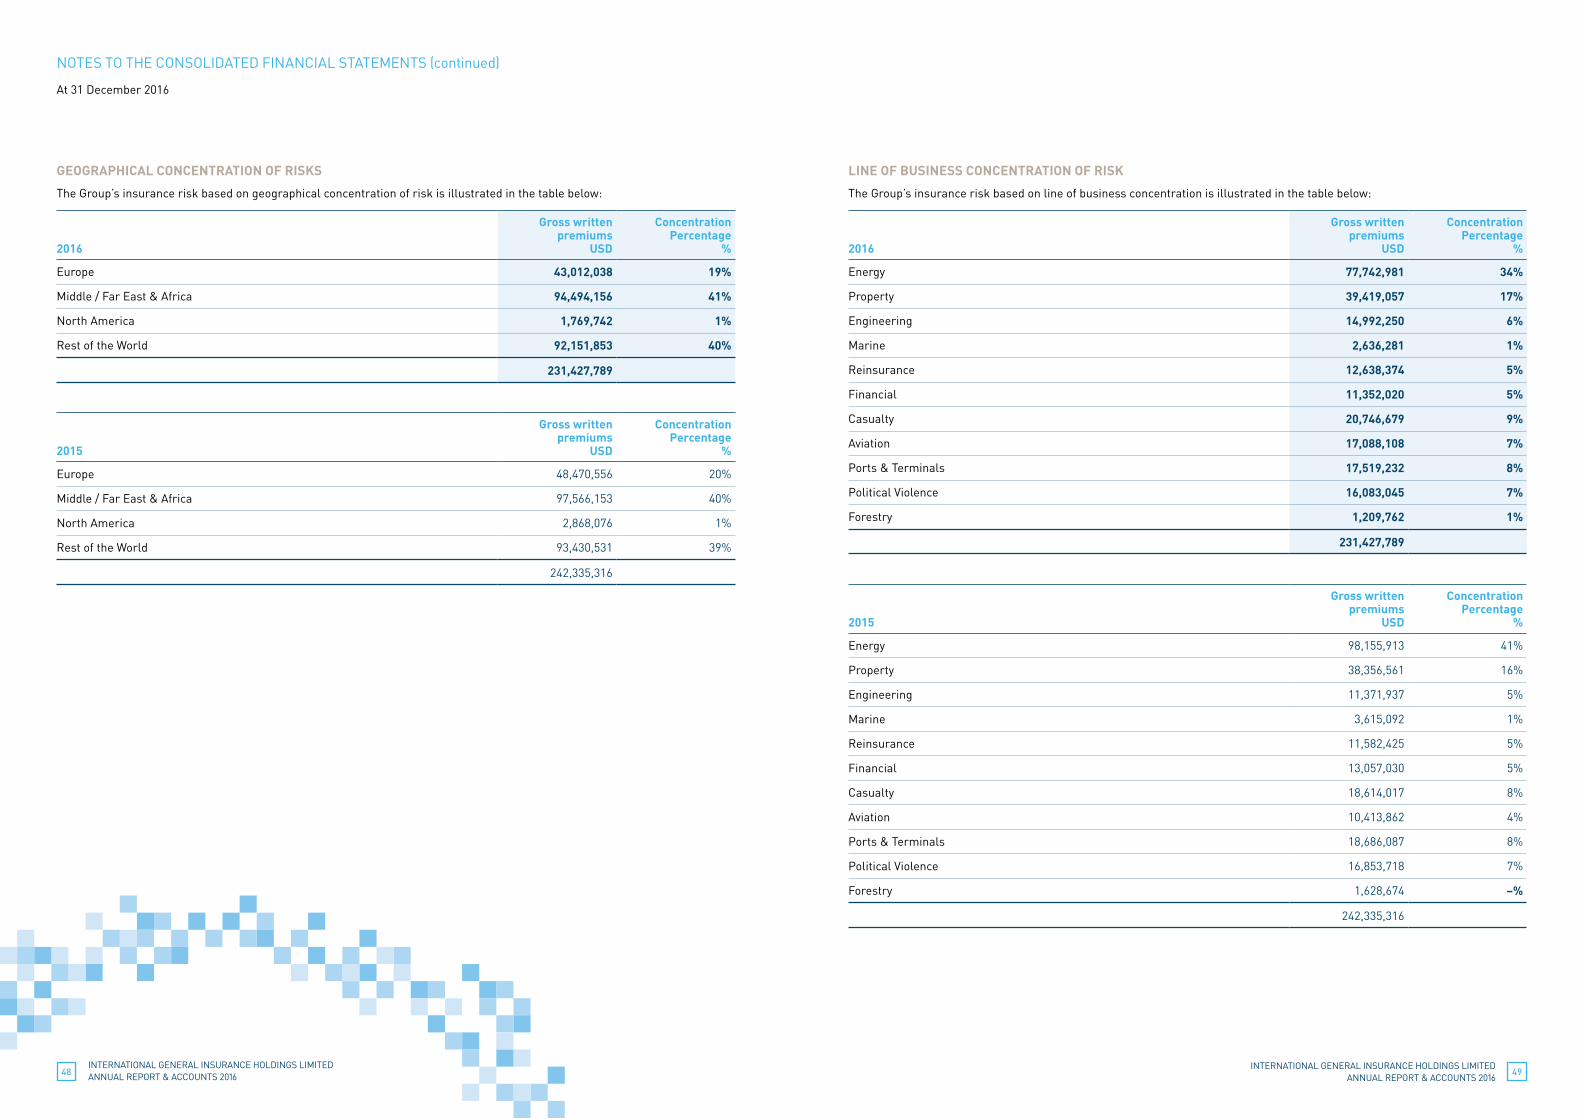
INTERNATIONAL GENERAL INSURANCE HOLDINGS LIMITED ANNUAL REPORT & ACCOUNTS 201648
INTERNATIONAL GENERAL INSURANCE HOLDINGS LIMITED ANNUAL REPORT & ACCOUNTS 2016
49
GEOGRAPHICAL CONCENTRATION OF RISKS
The Group’s insurance risk based on geographical concentration of risk is illustrated in the table below:
2016
Gross written premiums
USD
ConcentrationPercentage
%
Europe 43,012,038 19%
Middle / Far East & Africa 94,494,156 41%
North America 1,769,742 1%
Rest of the World 92,151,853 40%
231,427,789
2015
Gross written premiums
USD
ConcentrationPercentage
%
Europe 48,470,556 20%
Middle / Far East & Africa 97,566,153 40%
North America 2,868,076 1%
Rest of the World 93,430,531 39%
242,335,316
LINE OF BUSINESS CONCENTRATION OF RISK
The Group’s insurance risk based on line of business concentration is illustrated in the table below:
2016
Gross written premiums
USD
ConcentrationPercentage
%
Energy 77,742,981 34%
Property 39,419,057 17%
Engineering 14,992,250 6%
Marine 2,636,281 1%
Reinsurance 12,638,374 5%
Financial 11,352,020 5%
Casualty 20,746,679 9%
Aviation 17,088,108 7%
Ports & Terminals 17,519,232 8%
Political Violence 16,083,045 7%
Forestry 1,209,762 1%
231,427,789
2015
Gross written premiums
USD
ConcentrationPercentage
%
Energy 98,155,913 41%
Property 38,356,561 16%
Engineering 11,371,937 5%
Marine 3,615,092 1%
Reinsurance 11,582,425 5%
Financial 13,057,030 5%
Casualty 18,614,017 8%
Aviation 10,413,862 4%
Ports & Terminals 18,686,087 8%
Political Violence 16,853,718 7%
Forestry 1,628,674 –%
242,335,316
NOTES TO THE CONSOLIDATED FINANCIAL STATEMENTS (continued)
At 31 December 2016
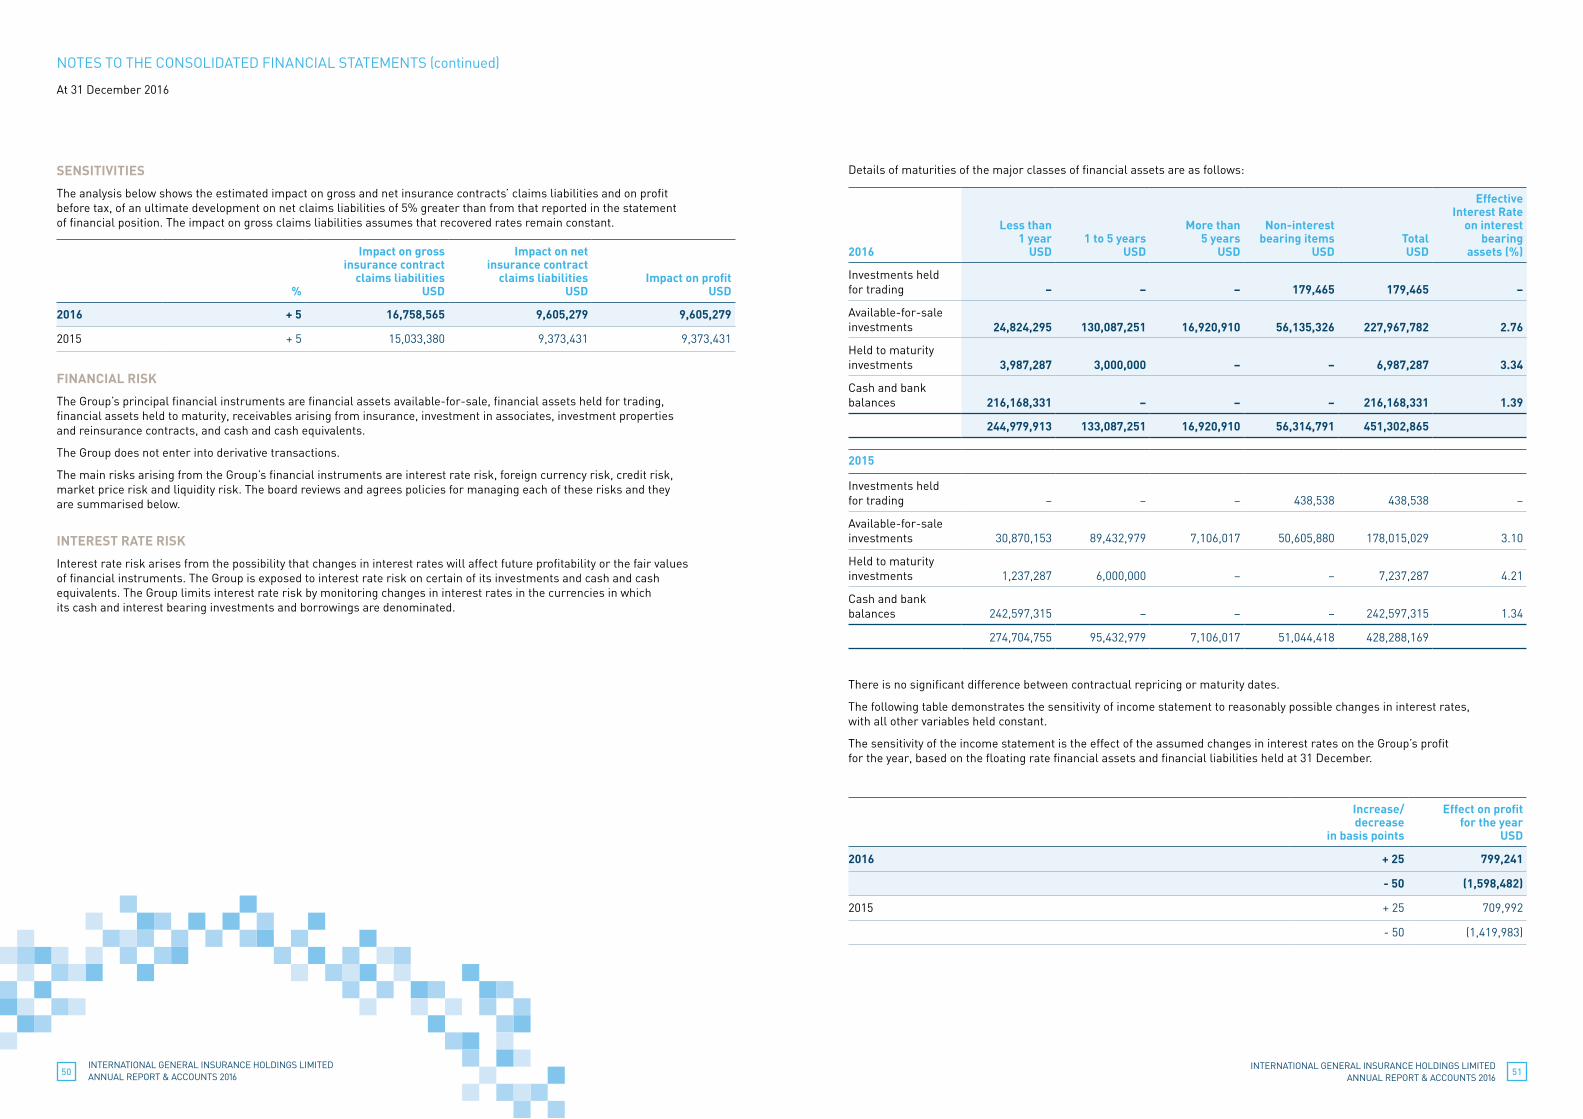
INTERNATIONAL GENERAL INSURANCE HOLDINGS LIMITED ANNUAL REPORT & ACCOUNTS 201650
INTERNATIONAL GENERAL INSURANCE HOLDINGS LIMITED ANNUAL REPORT & ACCOUNTS 2016
51
SENSITIVITIES
The analysis below shows the estimated impact on gross and net insurance contracts’ claims liabilities and on profit before tax, of an ultimate development on net claims liabilities of 5% greater than from that reported in the statement of financial position. The impact on gross claims liabilities assumes that recovered rates remain constant.
%
Impact on gross insurance contract
claims liabilities USD
Impact on net insurance contract
claims liabilities USD
Impact on profit
USD
2016 + 5 16,758,565 9,605,279 9,605,279
2015 + 5 15,033,380 9,373,431 9,373,431
FINANCIAL RISK
The Group’s principal financial instruments are financial assets available-for-sale, financial assets held for trading, financial assets held to maturity, receivables arising from insurance, investment in associates, investment properties and reinsurance contracts, and cash and cash equivalents.
The Group does not enter into derivative transactions.
The main risks arising from the Group’s financial instruments are interest rate risk, foreign currency risk, credit risk, market price risk and liquidity risk. The board reviews and agrees policies for managing each of these risks and they are summarised below.
INTEREST RATE RISK
Interest rate risk arises from the possibility that changes in interest rates will affect future profitability or the fair values of financial instruments. The Group is exposed to interest rate risk on certain of its investments and cash and cash equivalents. The Group limits interest rate risk by monitoring changes in interest rates in the currencies in which its cash and interest bearing investments and borrowings are denominated.
Details of maturities of the major classes of financial assets are as follows:
2016
Less than 1 year
USD
1 to 5 years USD
More than 5 years
USD
Non-interest bearing items
USD
Total USD
Effective Interest Rate
on interest bearing
assets (%)
Investments held for trading
–
–
–
179,465
179,465
–
Available-for-sale investments
24,824,295
130,087,251
16,920,910
56,135,326
227,967,782
2.76
Held to maturity investments
3,987,287
3,000,000
–
–
6,987,287
3.34
Cash and bank balances
216,168,331
–
–
–
216,168,331
1.39
244,979,913 133,087,251 16,920,910 56,314,791 451,302,865
2015
Investments held for trading
–
–
–
438,538
438,538
–
Available-for-sale investments
30,870,153
89,432,979
7,106,017
50,605,880
178,015,029
3.10
Held to maturity investments
1,237,287
6,000,000
–
–
7,237,287
4.21
Cash and bank balances
242,597,315
–
–
–
242,597,315
1.34
274,704,755 95,432,979 7,106,017 51,044,418 428,288,169
There is no significant difference between contractual repricing or maturity dates.
The following table demonstrates the sensitivity of income statement to reasonably possible changes in interest rates, with all other variables held constant.
The sensitivity of the income statement is the effect of the assumed changes in interest rates on the Group’s profit for the year, based on the floating rate financial assets and financial liabilities held at 31 December.
Increase/decrease
in basis points
Effect on profitfor the year
USD
2016 + 25 799,241
- 50 (1,598,482)
2015 + 25 709,992
- 50 (1,419,983)
NOTES TO THE CONSOLIDATED FINANCIAL STATEMENTS (continued)
At 31 December 2016
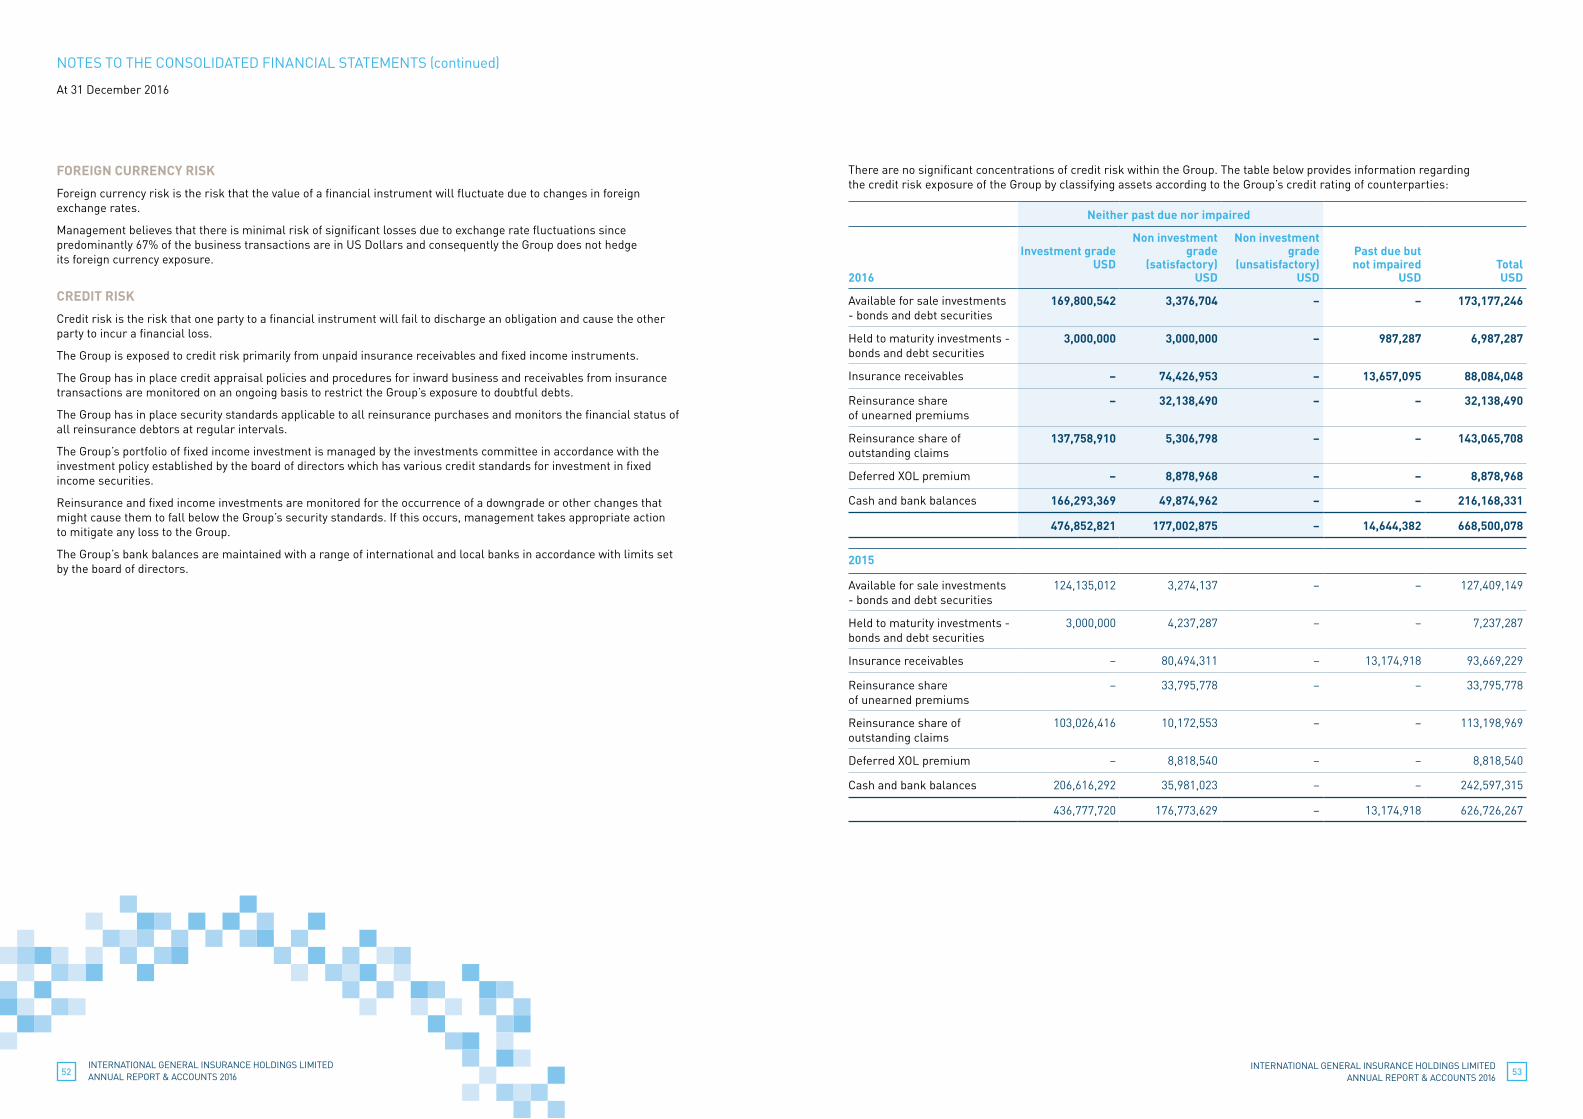
INTERNATIONAL GENERAL INSURANCE HOLDINGS LIMITED ANNUAL REPORT & ACCOUNTS 201652
INTERNATIONAL GENERAL INSURANCE HOLDINGS LIMITED ANNUAL REPORT & ACCOUNTS 2016
53
Neither past due nor impaired
FOREIGN CURRENCY RISK
Foreign currency risk is the risk that the value of a financial instrument will fluctuate due to changes in foreign exchange rates.
Management believes that there is minimal risk of significant losses due to exchange rate fluctuations since predominantly 67% of the business transactions are in US Dollars and consequently the Group does not hedge its foreign currency exposure.
CREDIT RISK
Credit risk is the risk that one party to a financial instrument will fail to discharge an obligation and cause the other party to incur a financial loss.
The Group is exposed to credit risk primarily from unpaid insurance receivables and fixed income instruments.
The Group has in place credit appraisal policies and procedures for inward business and receivables from insurance transactions are monitored on an ongoing basis to restrict the Group’s exposure to doubtful debts.
The Group has in place security standards applicable to all reinsurance purchases and monitors the financial status of all reinsurance debtors at regular intervals.
The Group’s portfolio of fixed income investment is managed by the investments committee in accordance with the investment policy established by the board of directors which has various credit standards for investment in fixed income securities.
Reinsurance and fixed income investments are monitored for the occurrence of a downgrade or other changes that might cause them to fall below the Group’s security standards. If this occurs, management takes appropriate action to mitigate any loss to the Group.
The Group’s bank balances are maintained with a range of international and local banks in accordance with limits set by the board of directors.
There are no significant concentrations of credit risk within the Group. The table below provides information regarding the credit risk exposure of the Group by classifying assets according to the Group’s credit rating of counterparties:
2016
Investment grade
USD
Non investment grade
(satisfactory) USD
Non investment grade
(unsatisfactory) USD
Past due but not impaired
USD
Total USD
Available for sale investments - bonds and debt securities
169,800,542 3,376,704 – – 173,177,246
Held to maturity investments - bonds and debt securities
3,000,000 3,000,000 – 987,287 6,987,287
Insurance receivables – 74,426,953 – 13,657,095 88,084,048
Reinsurance share of unearned premiums
– 32,138,490 – – 32,138,490
Reinsurance share of outstanding claims
137,758,910 5,306,798 – – 143,065,708
Deferred XOL premium – 8,878,968 – – 8,878,968
Cash and bank balances 166,293,369 49,874,962 – – 216,168,331
476,852,821 177,002,875 – 14,644,382 668,500,078
2015
Available for sale investments - bonds and debt securities
124,135,012 3,274,137 – – 127,409,149
Held to maturity investments - bonds and debt securities
3,000,000 4,237,287 – – 7,237,287
Insurance receivables – 80,494,311 – 13,174,918 93,669,229
Reinsurance share of unearned premiums
– 33,795,778 – – 33,795,778
Reinsurance share of outstanding claims
103,026,416 10,172,553 – – 113,198,969
Deferred XOL premium – 8,818,540 – – 8,818,540
Cash and bank balances 206,616,292 35,981,023 – – 242,597,315
436,777,720 176,773,629 – 13,174,918 626,726,267
NOTES TO THE CONSOLIDATED FINANCIAL STATEMENTS (continued)
At 31 December 2016
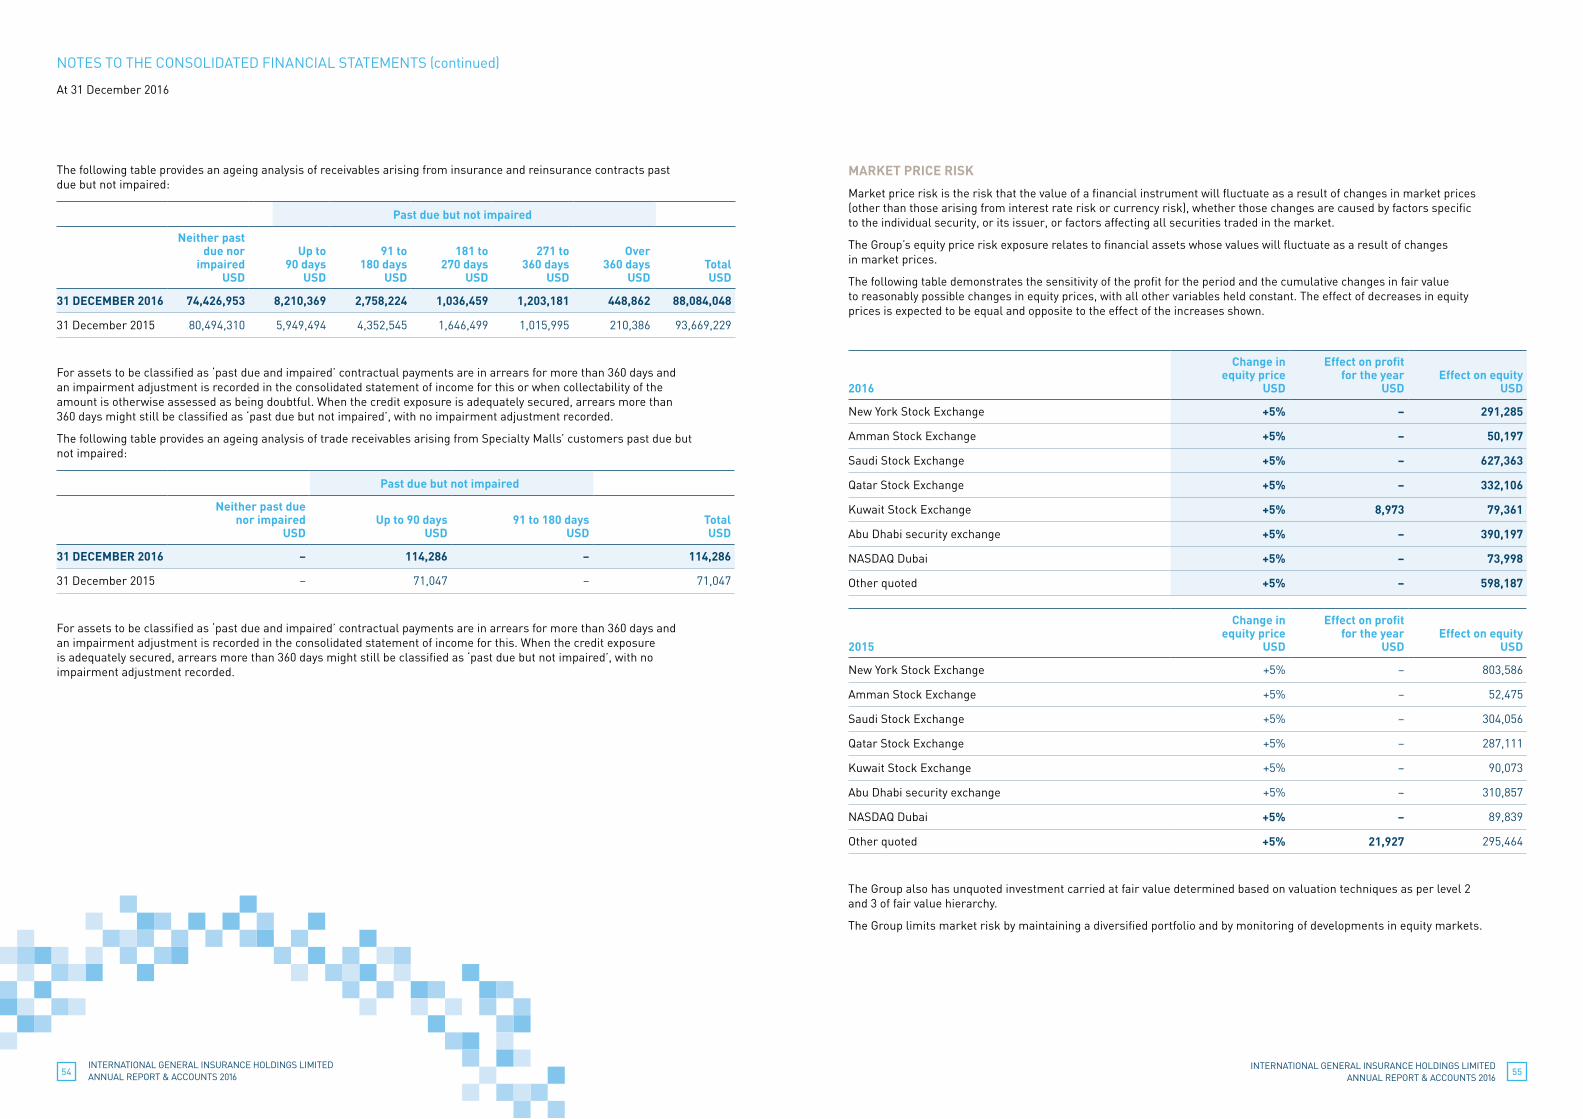
INTERNATIONAL GENERAL INSURANCE HOLDINGS LIMITED ANNUAL REPORT & ACCOUNTS 201654
INTERNATIONAL GENERAL INSURANCE HOLDINGS LIMITED ANNUAL REPORT & ACCOUNTS 2016
55
Past due but not impaired
Past due but not impaired
The following table provides an ageing analysis of receivables arising from insurance and reinsurance contracts past due but not impaired:
Neither past due nor
impaired USD
Up to
90 days USD
91 to
180 days USD
181 to
270 days USD
271 to
360 days USD
Over
360 days USD
Total USD
31 DECEMBER 2016 74,426,953 8,210,369 2,758,224 1,036,459 1,203,181 448,862 88,084,048
31 December 2015 80,494,310 5,949,494 4,352,545 1,646,499 1,015,995 210,386 93,669,229
For assets to be classified as ‘past due and impaired’ contractual payments are in arrears for more than 360 days and an impairment adjustment is recorded in the consolidated statement of income for this or when collectability of the amount is otherwise assessed as being doubtful. When the credit exposure is adequately secured, arrears more than 360 days might still be classified as ‘past due but not impaired’, with no impairment adjustment recorded.
The following table provides an ageing analysis of trade receivables arising from Specialty Malls’ customers past due but not impaired:
Neither past due nor impaired
USD
Up to 90 days
USD
91 to 180 days
USD
Total USD
31 DECEMBER 2016 – 114,286 – 114,286
31 December 2015 – 71,047 – 71,047
For assets to be classified as ‘past due and impaired’ contractual payments are in arrears for more than 360 days and an impairment adjustment is recorded in the consolidated statement of income for this. When the credit exposure is adequately secured, arrears more than 360 days might still be classified as ‘past due but not impaired’, with no impairment adjustment recorded.
MARKET PRICE RISK
Market price risk is the risk that the value of a financial instrument will fluctuate as a result of changes in market prices (other than those arising from interest rate risk or currency risk), whether those changes are caused by factors specific to the individual security, or its issuer, or factors affecting all securities traded in the market.
The Group’s equity price risk exposure relates to financial assets whose values will fluctuate as a result of changes in market prices.
The following table demonstrates the sensitivity of the profit for the period and the cumulative changes in fair value to reasonably possible changes in equity prices, with all other variables held constant. The effect of decreases in equity prices is expected to be equal and opposite to the effect of the increases shown.
2016
Change in equity price
USD
Effect on profit for the year
USD
Effect on equity
USD
New York Stock Exchange +5% – 291,285
Amman Stock Exchange +5% – 50,197
Saudi Stock Exchange +5% – 627,363
Qatar Stock Exchange +5% – 332,106
Kuwait Stock Exchange +5% 8,973 79,361
Abu Dhabi security exchange +5% – 390,197
NASDAQ Dubai +5% – 73,998
Other quoted +5% – 598,187
2015
Change in equity price
USD
Effect on profit for the year
USD
Effect on equity
USD
New York Stock Exchange +5% – 803,586
Amman Stock Exchange +5% – 52,475
Saudi Stock Exchange +5% – 304,056
Qatar Stock Exchange +5% – 287,111
Kuwait Stock Exchange +5% – 90,073
Abu Dhabi security exchange +5% – 310,857
NASDAQ Dubai +5% – 89,839
Other quoted +5% 21,927 295,464
The Group also has unquoted investment carried at fair value determined based on valuation techniques as per level 2 and 3 of fair value hierarchy.
The Group limits market risk by maintaining a diversified portfolio and by monitoring of developments in equity markets.
NOTES TO THE CONSOLIDATED FINANCIAL STATEMENTS (continued)
At 31 December 2016
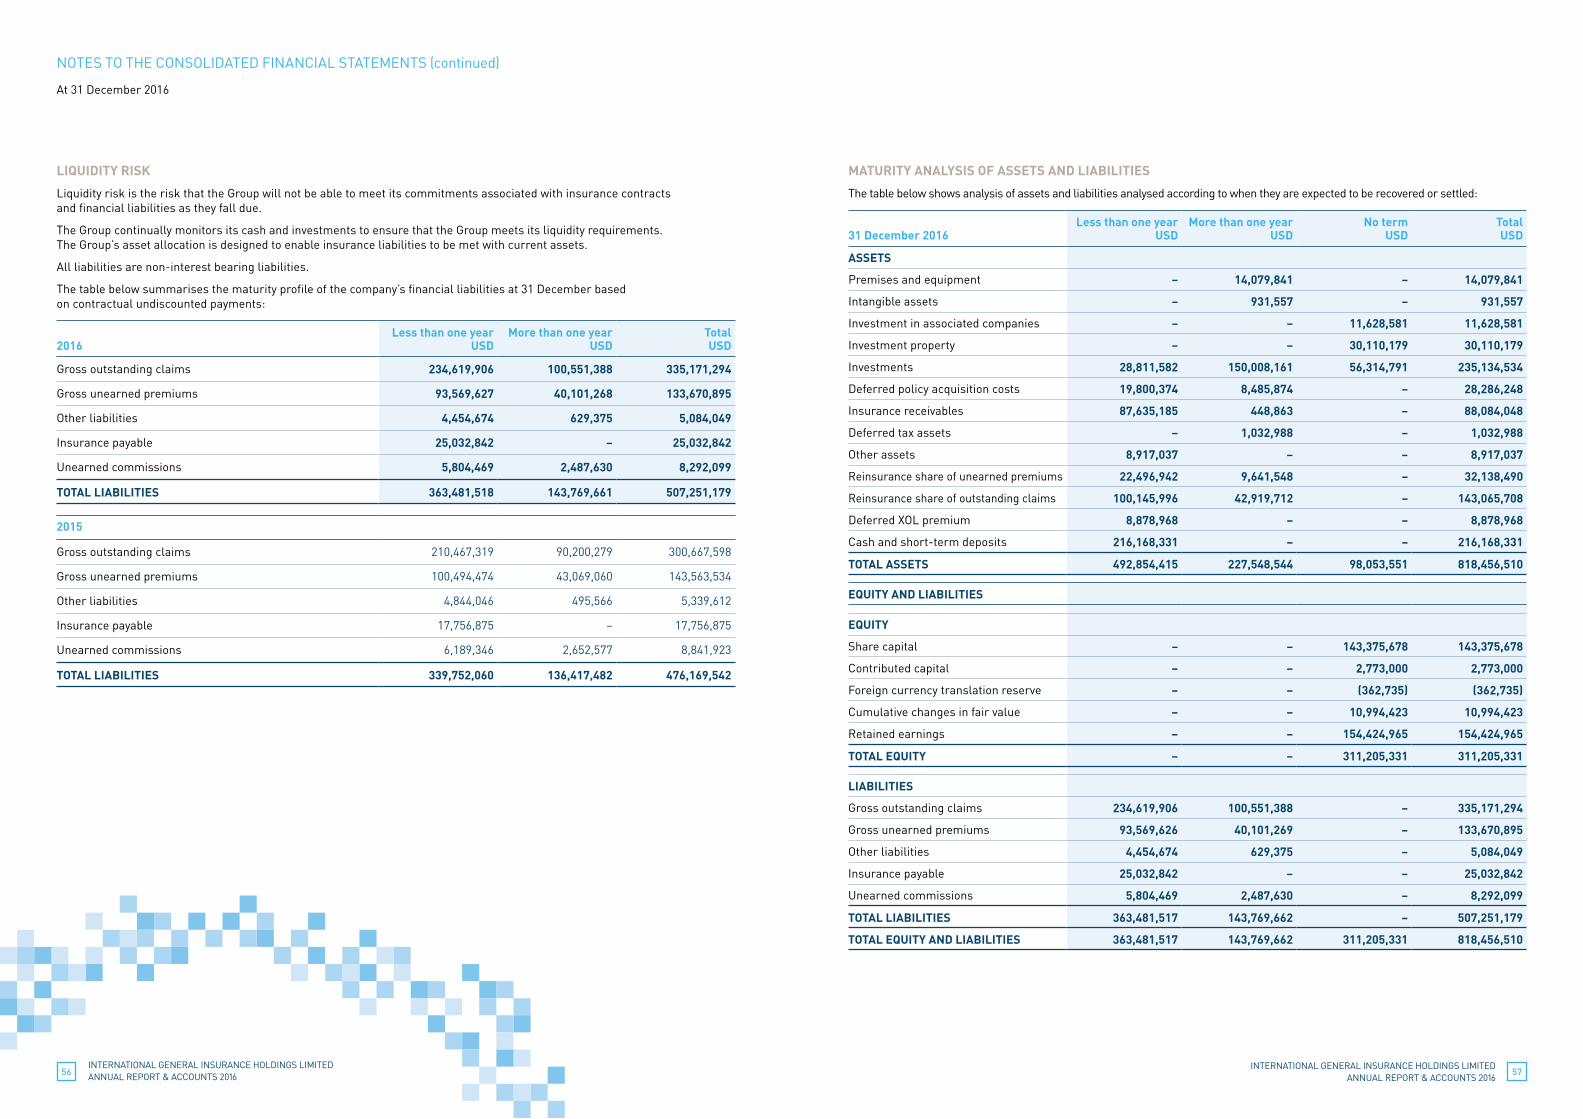
INTERNATIONAL GENERAL INSURANCE HOLDINGS LIMITED ANNUAL REPORT & ACCOUNTS 201656
INTERNATIONAL GENERAL INSURANCE HOLDINGS LIMITED ANNUAL REPORT & ACCOUNTS 2016
57
LIQUIDITY RISK
Liquidity risk is the risk that the Group will not be able to meet its commitments associated with insurance contracts and financial liabilities as they fall due.
The Group continually monitors its cash and investments to ensure that the Group meets its liquidity requirements. The Group’s asset allocation is designed to enable insurance liabilities to be met with current assets.
All liabilities are non-interest bearing liabilities.
The table below summarises the maturity profile of the company’s financial liabilities at 31 December based on contractual undiscounted payments:
2016
Less than one year USD
More than one year USD
Total USD
Gross outstanding claims 234,619,906 100,551,388 335,171,294
Gross unearned premiums 93,569,627 40,101,268 133,670,895
Other liabilities 4,454,674 629,375 5,084,049
Insurance payable 25,032,842 – 25,032,842
Unearned commissions 5,804,469 2,487,630 8,292,099
TOTAL LIABILITIES 363,481,518 143,769,661 507,251,179
2015
Gross outstanding claims 210,467,319 90,200,279 300,667,598
Gross unearned premiums 100,494,474 43,069,060 143,563,534
Other liabilities 4,844,046 495,566 5,339,612
Insurance payable 17,756,875 – 17,756,875
Unearned commissions 6,189,346 2,652,577 8,841,923
TOTAL LIABILITIES 339,752,060 136,417,482 476,169,542
MATURITY ANALYSIS OF ASSETS AND LIABILITIES
The table below shows analysis of assets and liabilities analysed according to when they are expected to be recovered or settled:
31 December 2016
Less than one year USD
More than one year USD
No term USD
Total USD
ASSETS
Premises and equipment – 14,079,841 – 14,079,841
Intangible assets – 931,557 – 931,557
Investment in associated companies – – 11,628,581 11,628,581
Investment property – – 30,110,179 30,110,179
Investments 28,811,582 150,008,161 56,314,791 235,134,534
Deferred policy acquisition costs 19,800,374 8,485,874 – 28,286,248
Insurance receivables 87,635,185 448,863 – 88,084,048
Deferred tax assets – 1,032,988 – 1,032,988
Other assets 8,917,037 – – 8,917,037
Reinsurance share of unearned premiums 22,496,942 9,641,548 – 32,138,490
Reinsurance share of outstanding claims 100,145,996 42,919,712 – 143,065,708
Deferred XOL premium 8,878,968 – – 8,878,968
Cash and short-term deposits 216,168,331 – – 216,168,331
TOTAL ASSETS 492,854,415 227,548,544 98,053,551 818,456,510
EQUITY AND LIABILITIES
EQUITY
Share capital – – 143,375,678 143,375,678
Contributed capital – – 2,773,000 2,773,000
Foreign currency translation reserve – – (362,735) (362,735)
Cumulative changes in fair value – – 10,994,423 10,994,423
Retained earnings – – 154,424,965 154,424,965
TOTAL EQUITY – – 311,205,331 311,205,331
LIABILITIES
Gross outstanding claims 234,619,906 100,551,388 – 335,171,294
Gross unearned premiums 93,569,626 40,101,269 – 133,670,895
Other liabilities 4,454,674 629,375 – 5,084,049
Insurance payable 25,032,842 – – 25,032,842
Unearned commissions 5,804,469 2,487,630 – 8,292,099
TOTAL LIABILITIES 363,481,517 143,769,662 – 507,251,179
TOTAL EQUITY AND LIABILITIES 363,481,517 143,769,662 311,205,331 818,456,510
NOTES TO THE CONSOLIDATED FINANCIAL STATEMENTS (continued)
At 31 December 2016
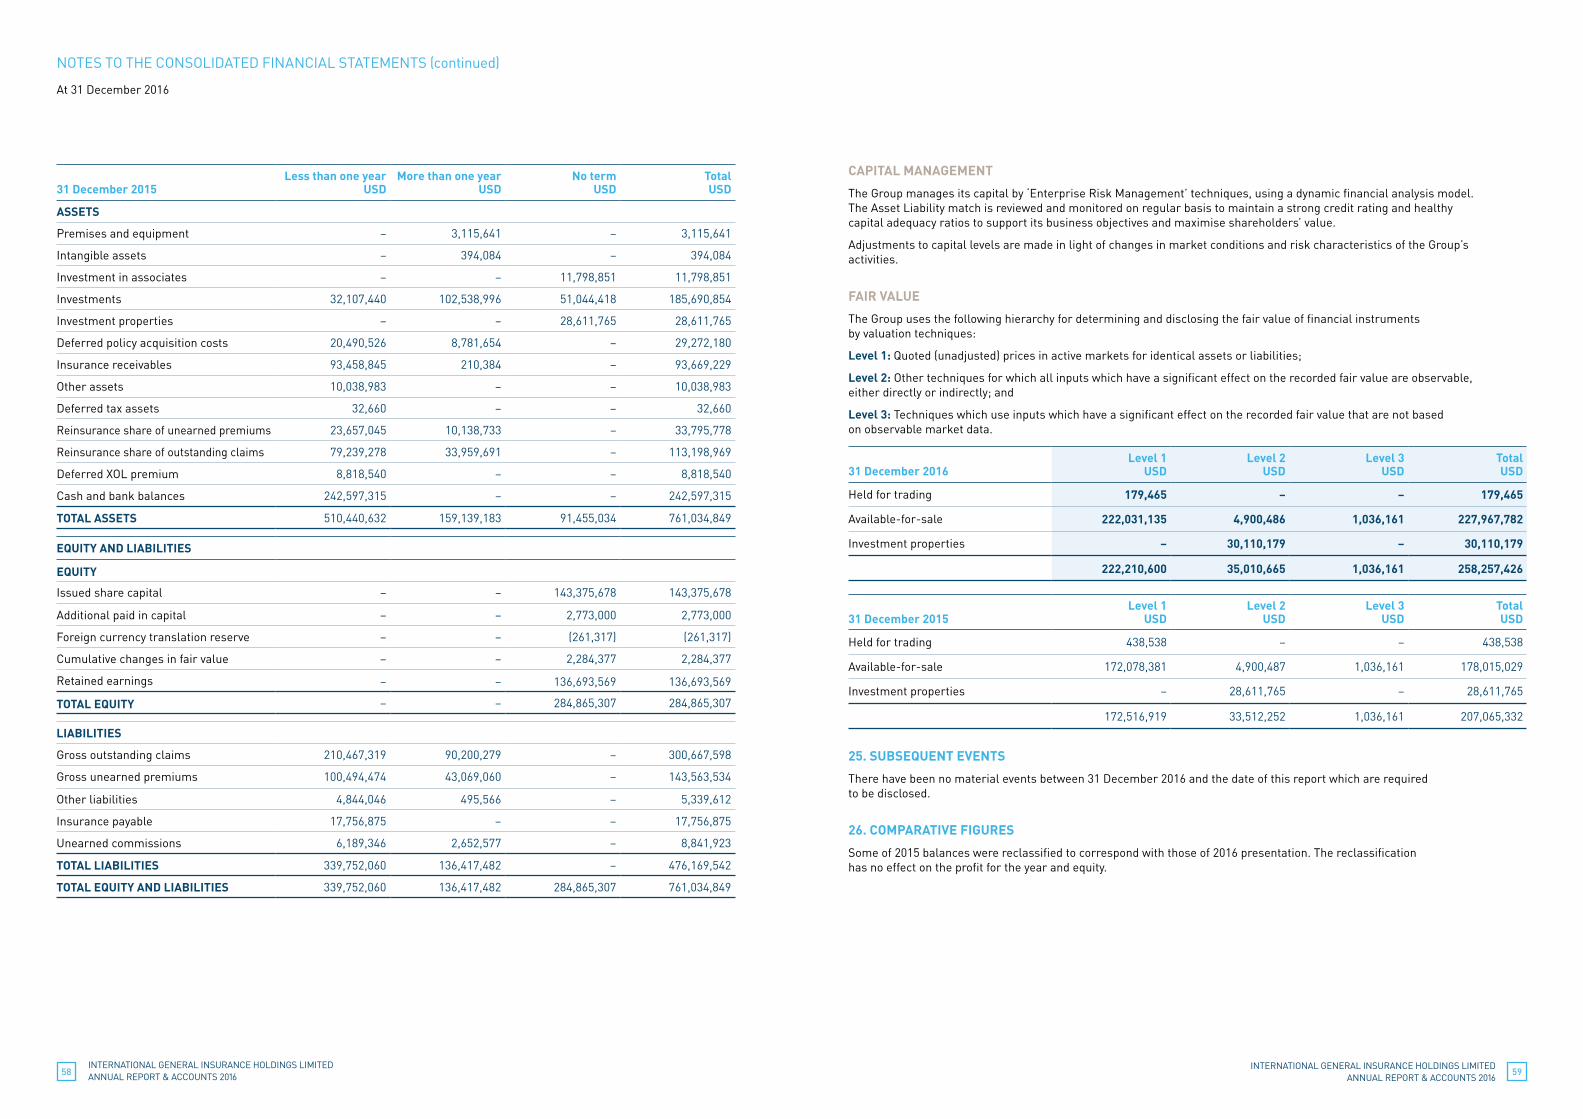
INTERNATIONAL GENERAL INSURANCE HOLDINGS LIMITED ANNUAL REPORT & ACCOUNTS 201658
INTERNATIONAL GENERAL INSURANCE HOLDINGS LIMITED ANNUAL REPORT & ACCOUNTS 2016
59
31 December 2015
Less than one year USD
More than one year USD
No term USD
Total USD
ASSETS
Premises and equipment – 3,115,641 – 3,115,641
Intangible assets – 394,084 – 394,084
Investment in associates – – 11,798,851 11,798,851
Investments 32,107,440 102,538,996 51,044,418 185,690,854
Investment properties – – 28,611,765 28,611,765
Deferred policy acquisition costs 20,490,526 8,781,654 – 29,272,180
Insurance receivables 93,458,845 210,384 – 93,669,229
Other assets 10,038,983 – – 10,038,983
Deferred tax assets 32,660 – – 32,660
Reinsurance share of unearned premiums 23,657,045 10,138,733 – 33,795,778
Reinsurance share of outstanding claims 79,239,278 33,959,691 – 113,198,969
Deferred XOL premium 8,818,540 – – 8,818,540
Cash and bank balances 242,597,315 – – 242,597,315
TOTAL ASSETS 510,440,632 159,139,183 91,455,034 761,034,849
EQUITY AND LIABILITIES
EQUITY
Issued share capital – – 143,375,678 143,375,678
Additional paid in capital – – 2,773,000 2,773,000
Foreign currency translation reserve – – (261,317) (261,317)
Cumulative changes in fair value – – 2,284,377 2,284,377
Retained earnings – – 136,693,569 136,693,569
TOTAL EQUITY – – 284,865,307 284,865,307
LIABILITIES
Gross outstanding claims 210,467,319 90,200,279 – 300,667,598
Gross unearned premiums 100,494,474 43,069,060 – 143,563,534
Other liabilities 4,844,046 495,566 – 5,339,612
Insurance payable 17,756,875 – – 17,756,875
Unearned commissions 6,189,346 2,652,577 – 8,841,923
TOTAL LIABILITIES 339,752,060 136,417,482 – 476,169,542
TOTAL EQUITY AND LIABILITIES 339,752,060 136,417,482 284,865,307 761,034,849
CAPITAL MANAGEMENT
The Group manages its capital by ‘Enterprise Risk Management’ techniques, using a dynamic financial analysis model. The Asset Liability match is reviewed and monitored on regular basis to maintain a strong credit rating and healthy capital adequacy ratios to support its business objectives and maximise shareholders’ value.
Adjustments to capital levels are made in light of changes in market conditions and risk characteristics of the Group’s activities.
FAIR VALUE
The Group uses the following hierarchy for determining and disclosing the fair value of financial instruments by valuation techniques:
Level 1: Quoted (unadjusted) prices in active markets for identical assets or liabilities;
Level 2: Other techniques for which all inputs which have a significant effect on the recorded fair value are observable, either directly or indirectly; and
Level 3: Techniques which use inputs which have a significant effect on the recorded fair value that are not based on observable market data.
31 December 2016
Level 1 USD
Level 2 USD
Level 3 USD
Total USD
Held for trading 179,465 – – 179,465
Available-for-sale 222,031,135 4,900,486 1,036,161 227,967,782
Investment properties – 30,110,179 – 30,110,179
222,210,600 35,010,665 1,036,161 258,257,426
31 December 2015
Level 1 USD
Level 2 USD
Level 3 USD
Total USD
Held for trading 438,538 – – 438,538
Available-for-sale 172,078,381 4,900,487 1,036,161 178,015,029
Investment properties – 28,611,765 – 28,611,765
172,516,919 33,512,252 1,036,161 207,065,332
25. SUBSEQUENT EVENTS
There have been no material events between 31 December 2016 and the date of this report which are required to be disclosed.
26. COMPARATIVE FIGURES
Some of 2015 balances were reclassified to correspond with those of 2016 presentation. The reclassification has no effect on the profit for the year and equity.
NOTES TO THE CONSOLIDATED FINANCIAL STATEMENTS (continued)
At 31 December 2016