annual report 2011-12 - nrsp
TRANSCRIPT
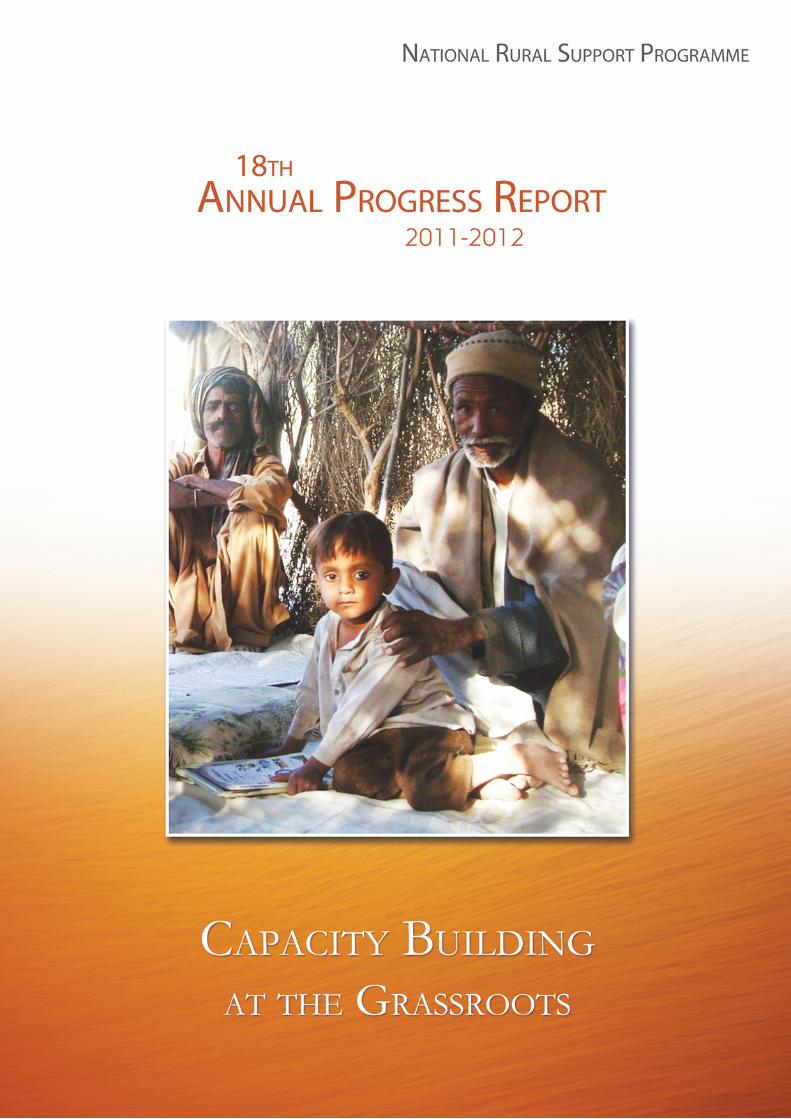

18th AnnualProgress Report
2011-2012
Capacity Building at the Grassroots
National Rural Support ProgrammeIslamabad, Pakistan
© Copyright NRSP 2012
Established in 1991, NRSP is the largest Rural Support Programme in the country in terms of outreach, staff and development activities. It is a not for profit organisation registered under Section 42 of Companies Ordinance 1984. NRSP’s mandate is to alleviate poverty by harnessing people’s potential and undertaking development activities in Pakistan. It has a presence in 58 districts in four provinces and Azad Jammu and Kashmir through regional and field offices. NRSP is currently working with over two million poor households organised into a network of more than 139,000 Community Organisations. With sustained incremental growth, it is emerging as Pakistan’s leading engine for poverty reduction and rural development.
Parts of this report may be reproduced for professional purposes, provided that the source is acknowledged and the material is not sold.
Authored by: Rachel AbbeyWith thanks to contributions in the way of case studies to: Dr. Nabeela Shahid, Saira Abid, Hamza Hassan, Wasif Gardesi, Ghulam Rasool, Faisal Raza, Adnan Hussain, Tazeem Khan, Jamil ur Rehman, Muhammad Azhar
Statistical Abstract: Sharafat Hussain
Report Designed by: Mansoor AbidPrinted by: PanGraphics (Pvt.) Ltd. Islamabad
Published by National Rural Support Programme (NRSP), Islamabad, Pakistan.
ContentsAcronyms ii
Foreword iii
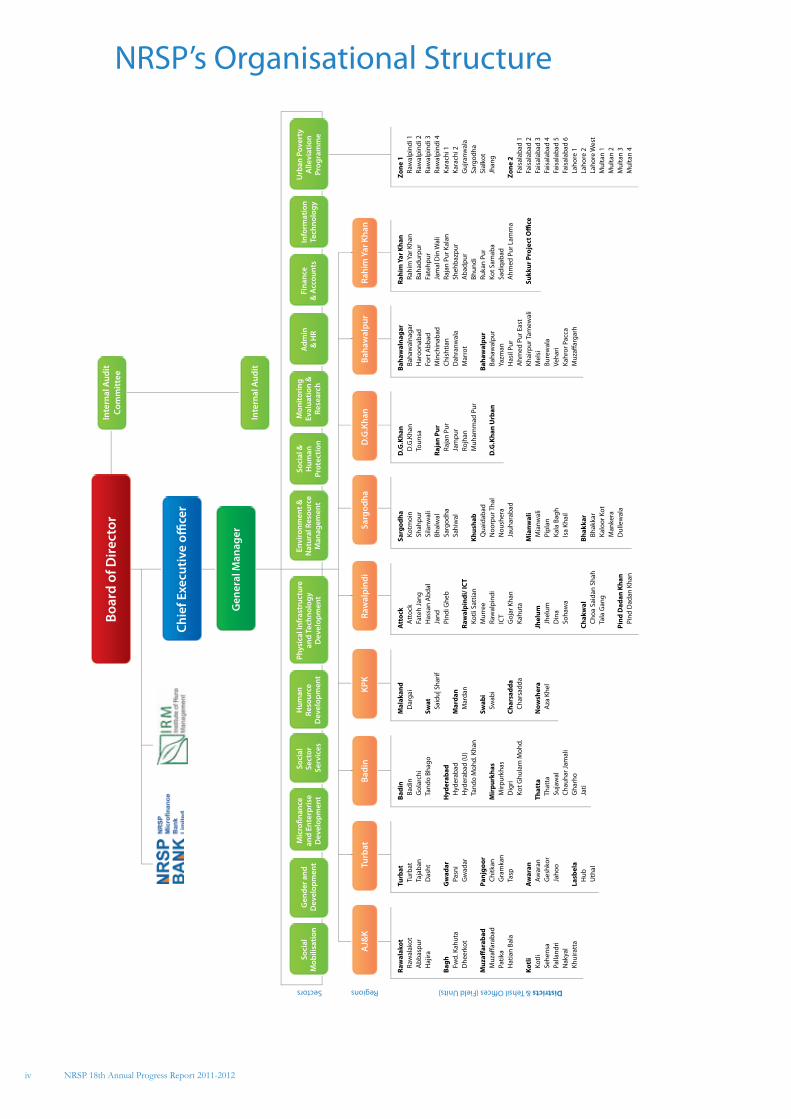
NRSP’s Organisational Structure iv
NRSP Outreach v
Social Mobilisation 1
Gender and Development 4
Microfinance and Enterprise Development 6
Human Resource Development 10
Physical Infrastructure and Technology Development 14
Environment and Natural Resource Management 18
Social & Human Protection Programme 22
Education and School Management 26
Health and Sanitation 30
Disaster Management and Rehabilitation 34
Monitoring, Evaluation and Research 36
Finance and Accounts 40
NRSP - USAID: Working to build capacity at the grassroots level 42
Specialisation: microfinance and capacity building 46
Statistical Abstract 49
Programme Coverage by Offices 80
Statement of Audited Accounts of NRSP 83
ADB Asian Development BankAFP Ambassador Fund ProgramAJK Azad Jammu & KashmirALP Accelerated Learning ProgrammeASP Assessment and Strengthening ProgramASPBAE Asia South Pacific Association for Basic and Adult EducationBEF Balochistan Education FoundationCACL Combating Abusive Child LabourCARD Coastal Association of Research and Development CBDRM Community Based Disaster Risk ManagementCEO Chief Executive OfficerCIF Community Investment FundCMAM Community Based Management of Acute MalnutritionCO Community OrganisationCP&WB Child Protection & Welfare BureauCPIs Community Physycial InfrastructuresDAI Development Alternatives Inc.DfID Department for International DevelopmentENRM Environment and Natural Resource ManagementESM Education and School ManagementFAO Food and Agriculture OrganisationFATA Federally Administered Tribal AreasFHPs Force Hand PumpsGAD Gender and DevelopmentGAVI Global Alliance for Vaccines and ImmunisationGDP Gross Domestic ProductGEP Gender Equity ProgrammeGM General ManagerGPP Girl Power ProgrammeH&E Health & EducationH&N Health & NutritionHAP Humanitarian Accountability PartnershipHBL Habib Bank LimitedHR Human ResourceHRD Human Resource DevelopmentHRDN Human Resource Development NetworkICMC International Catholic Migration CommissionIDPs Internally Displaced PersonsIFC International Finance CorporationILO International Labour OrganisationIPCs Insulated Plastic Containers IRM Institute of Rural ManagementJDW Jamal Din WaliKfW Kreditanstalt für WiederaufbauKPK Khyber PakhtunkhwaLEP Livelihood Enhancement ProgrammeLHV Lady Health VisitorLHW Lady Health WorkersLSO Local Support OrganisationMAP Medicinal and Aromatic PlantsM-CRIL Micro Credit Rating InternationalMEDA Mennonite Economic Development AssociatesMEDP Microfinance and Enterprise Development ProgrammeMER Monitoring, Evaluation and ResearchMfB Microfinance BankMfDW Microfinance for Decent WorkMI Micronutrient InitiativeMIS Management Information SystemMMNPs Multiple Micro-nutrient Powders
MoH Ministry of HealthMORE Microfinance Operational Research and Evaluation ProjectNARC National Agriculture Research CouncilNGO Non-Government OrganisationNIH National Instititue of HealthNRSP National Rural Support ProgrammeOTW Orientation Training WorkshopPCMS Project Compliance and Monitoring SystemPESRP Punjab Education Sector Reform ProgramPIPOS Pakistan Institute of Prosthetic and Orthotic SciencesPITD Physical Infrastructure and Technology DevelopmentPMN Pakistan Microfinance Network PPAF Pakistan Poverty Alleviation FundPSDF Punjab Skills Development FundPWFLs People with Functional LimitationsRSPs Rural Support ProgrammesRSPN Rural Support Programmes NetworkSBAP School Based Action PlanSCCBP School Council Capacity Building Programme SCCDP Sindh Coastal Community Development ProjectSCs School CouncilsSDC Skill Development Council
SDDNCF Socio-economic Development of Destitute and Neglected Children’s Families
SEWA Self Employed Women’s AssociationSGAFP Small Grant and Ambassador’s Fund ProgramSGP Small Grant ProgramSHcG Small House cum GardenSHP Social & Human ProtectionSM Social MobilisationTEVTA Technical Education & Vocational Training AuthorityTOT Training of TrainersUC Union CouncilUCBPRP Union Council Based Poverty Reduction ProgrammeUK United KingdomUNHCR United Nations High Commission for RefugeesUNICEF The United Nations Children’s FundUPAP Urban Poverty Alleviation ProgrammeUSAID United States Agency for International DevelopmentUSD United States DollarVO Village OrganisationWASH Water, Sanitation and HygieneWFP World Food Programme
Acronyms
NRSP 18th Annual Progress Report 2011-2012ii
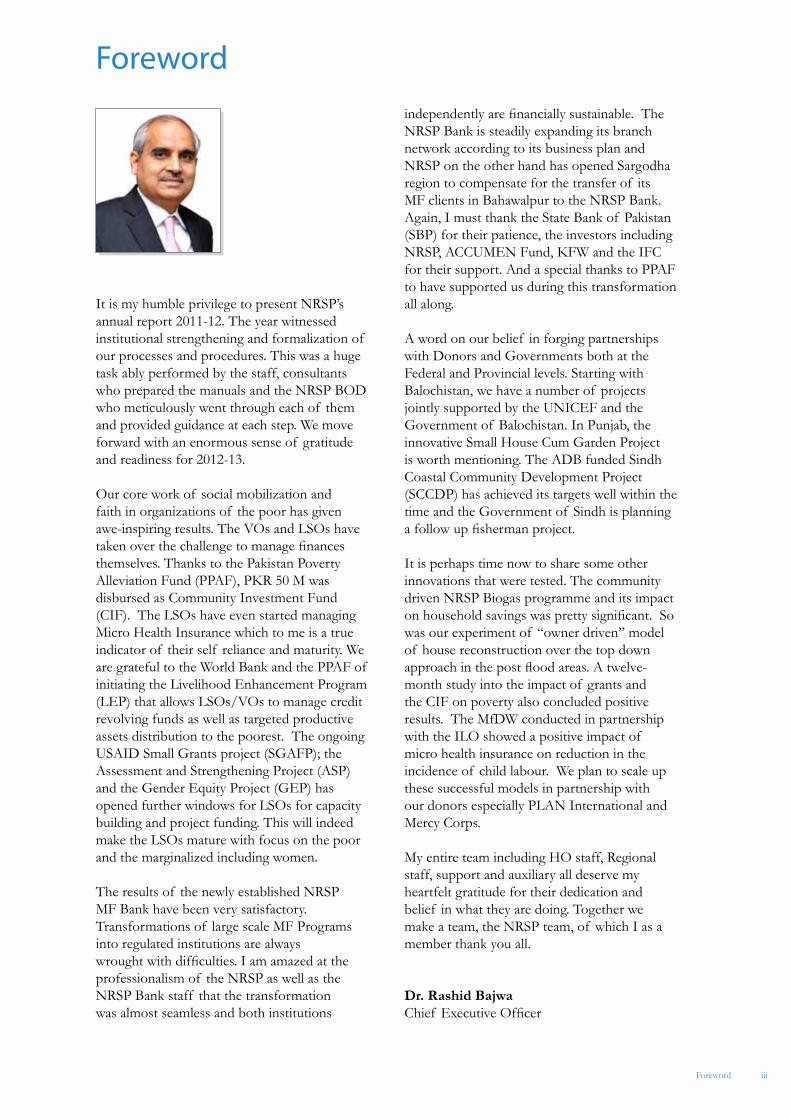
It is my humble privilege to present NRSP’s annual report 2011-12. The year witnessed institutional strengthening and formalization of our processes and procedures. This was a huge task ably performed by the staff, consultants who prepared the manuals and the NRSP BOD who meticulously went through each of them and provided guidance at each step. We move forward with an enormous sense of gratitude and readiness for 2012-13.
Our core work of social mobilization and faith in organizations of the poor has given awe-inspiring results. The VOs and LSOs have taken over the challenge to manage finances themselves. Thanks to the Pakistan Poverty Alleviation Fund (PPAF), PKR 50 M was disbursed as Community Investment Fund (CIF). The LSOs have even started managing Micro Health Insurance which to me is a true indicator of their self reliance and maturity. We are grateful to the World Bank and the PPAF of initiating the Livelihood Enhancement Program (LEP) that allows LSOs/VOs to manage credit revolving funds as well as targeted productive assets distribution to the poorest. The ongoing USAID Small Grants project (SGAFP); the Assessment and Strengthening Project (ASP) and the Gender Equity Project (GEP) has opened further windows for LSOs for capacity building and project funding. This will indeed make the LSOs mature with focus on the poor and the marginalized including women.
The results of the newly established NRSP MF Bank have been very satisfactory. Transformations of large scale MF Programs into regulated institutions are always wrought with difficulties. I am amazed at the professionalism of the NRSP as well as the NRSP Bank staff that the transformation was almost seamless and both institutions
independently are financially sustainable. The NRSP Bank is steadily expanding its branch network according to its business plan and NRSP on the other hand has opened Sargodha region to compensate for the transfer of its MF clients in Bahawalpur to the NRSP Bank. Again, I must thank the State Bank of Pakistan (SBP) for their patience, the investors including NRSP, ACCUMEN Fund, KFW and the IFC for their support. And a special thanks to PPAF to have supported us during this transformation all along.
A word on our belief in forging partnerships with Donors and Governments both at the Federal and Provincial levels. Starting with Balochistan, we have a number of projects jointly supported by the UNICEF and the Government of Balochistan. In Punjab, the innovative Small House Cum Garden Project is worth mentioning. The ADB funded Sindh Coastal Community Development Project (SCCDP) has achieved its targets well within the time and the Government of Sindh is planning a follow up fisherman project.
It is perhaps time now to share some other innovations that were tested. The community driven NRSP Biogas programme and its impact on household savings was pretty significant. So was our experiment of “owner driven” model of house reconstruction over the top down approach in the post flood areas. A twelve-month study into the impact of grants and the CIF on poverty also concluded positive results. The MfDW conducted in partnership with the ILO showed a positive impact of micro health insurance on reduction in the incidence of child labour. We plan to scale up these successful models in partnership with our donors especially PLAN International and Mercy Corps.
My entire team including HO staff, Regional staff, support and auxiliary all deserve my heartfelt gratitude for their dedication and belief in what they are doing. Together we make a team, the NRSP team, of which I as a member thank you all.
Dr. Rashid BajwaChief Executive Officer
Foreword
Foreword iii
Sectors Regions Districts
Raw
alak
ot
Raw
alak
ot
Abb
aspu
r
Haj
ira
Bagh
Fw
d. K
ahut
a
Dhe
erko
t
Pa
tika
H
atia
n Ba
la
Kotl
i
Kotli
Se
hens
a
Palla
ndri
N
akya
l
Khui
ratt
a
Turb
at T
urba
t T
ajab
an
Das
ht
Gw
adar
Pa
sni
G
wad
ar
Panj
goor
Ch
itkan
G
ram
kan
Tas
p
Aw
aran
Aw
aran
G
eshk
or
Jaho
o
Lasb
ela
H
ub
Uth
al
Badi
n
Badi
n
Gol
arch
i T
ando
Bha
go
Hyd
erab
ad
Hyd
erab
ad
Hyd
erab
ad (U
) T
ando
Moh
d. K
han
Mir
purk
has
M
irpur
khas
D
igri
Ko
t Ghu
lam
Moh
d.
That
ta T
hatt
a
Suja
wal
Ch
auha
r Jam
ali
G
harh
o
Jati
Mal
akan
d
Dar
gai
Swat
Sa
idu|
Sha
rif
Mar
dan
M
arda
n
Swab
i
Swab
i
Char
sadd
a
Char
sadd
a
Now
sher
a
Aza
Khe
l
Att
ock
A
ttoc
k
Fate
h Ja
ng
Has
san
Abd
al
Jand
Pi
ndi G
heb
Raw
alpi
ndi/
ICT
Ko
tli S
attia
n
Mur
ree
Ra
wal
pind
i
ICT
G
ojar
Kha
n
Kahu
ta
Jhel
um
Jhel
um
Din
a
Soha
wa
Chak
wal
Ch
oa S
aida
n Sh
ah T
ala
Gan
g
Pind
Dad
an K
han
Pi
nd D
adan
Kha
n
Sarg
odha
Ko
tmoi
n
Shah
pur
Si
lanw
ali
Bh
alw
al
Sarg
odha
Sa
hiw
al
Khus
hab
Q
uaid
abad
N
oorp
ur T
hal
N
oush
era
Ja
uhar
abad
Mia
nwal
i
Mia
nwal
i
Pipl
an
Kala
Bag
h
Isa
Khai
l
Bhak
kar
Bh
akka
r
Kalo
or K
ot
Man
kera
D
ulle
wal
a
D.G
.Kha
n
D.G
.Kha
n T
ouns
a
Raja
n Pu
r
Raja
n Pu
r
Jam
pur
Ro
jhan
M
uham
mad
Pur
D.G
.Kha
n U
rban
Baha
wal
naga
r
Baha
wal
naga
r
Har
oona
bad
Fo
rt A
bbad
M
inch
inab
ad
Chis
htia
n
Dah
ranw
ala
M
arro
t
Baha
wal
pur
Ba
haw
alpu
r Y
azm
an
Has
il Pu
r
Ahm
ed P
ur E
ast
Kh
airp
ur T
amew
ali
M
elsi
Bu
rew
ala
Ve
hari
Ka
hror
Pac
ca
Rahi
m Y
ar K
han
Ra
him
Yar
Kha
n
Baha
durp
ur
Fate
hpur
Ja
mal
Din
Wal
i
Raja
n Pu
r Kal
an
Sheh
bazp
ur
Aba
dpur
Bh
undi
Ru
kan
Pur
Ko
t Sam
aba
Sa
diqa
bad
A
hmed
Pur
Lam
ma
Zone
1
Raw
alpi
ndi 1
Ra
wal
pind
i 2
Raw
alpi
ndi 3
Ra
wal
pind
i 4
Kara
chi 1
Kara
chi 2
G
ujra
nwal
a
Sarg
odha
Si
alko
t
Jhan
g
Zone
2
Fais
alab
ad 1
Fa
isal
abad
2
Fais
alab
ad 3
Fa
isal
abad
4
Fais
alab
ad 5
Fa
isal
abad
6
Laho
re 1
La
hore
2
Laho
re W
est
M
ulta
n 1
M
ulta
n 2
M
ulta
n 3
M
ulta
n 4
Boar
d of
Dire
ctor
Gen
eral
Man
ager
Inte
rnal
Aud
itCo
mm
ittee
Inte
rnal
Aud
it
Urb
an P
over
tyA
llevi
atio
nPr
ogra
mm
e
Info
rmat
ion
Tech
nolo
gyFi
nanc
e&
Acc
ount
sA
dmin
& H
R
Mon
itori
ngEv
alua
tion
&Re
sear
ch
Soci
al &
Hum
anPr
otec
tion
Envi
ronm
ent &
Nat
ural
Res
ourc
eM
anag
emen
t
Phys
ical
Infr
astr
uctu
rean
d Te
chno
logy
Dev
elop
men
t
Hum
anRe
sour
ceD
evel
opm
ent
Soci
al
Sect
or
Serv
ices
and
Ente
rpris
eD
evel
opm
ent
Gen
der a
ndD
evel
opm
ent
Soci
alM
obili
satio
n
AJ&
KTu
rbat
Badi
nKP
KRa
wal
pind
iSa
rgod
haD
.G.K
han
Baha
wal
pur
Rahi
m Y
ar K
han
NRSP’s Organisational Structure
NRSP 18th Annual Progress Report 2011-2012iv
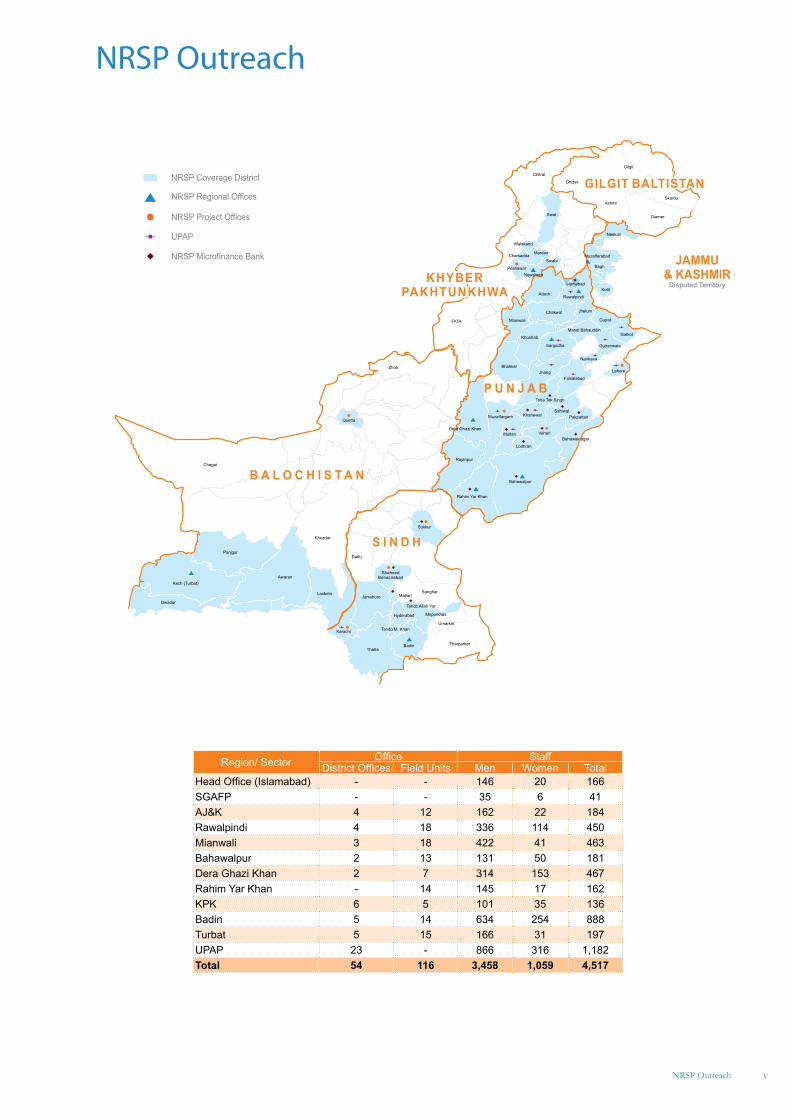
NRSP Outreach
Region/ Sector Office StaffDistrict Offices Field Units Men Women Total
Head Office (Islamabad) - - 146 20 166SGAFP - - 35 6 41AJ&K 4 12 162 22 184Rawalpindi 4 18 336 114 450Mianwali 3 18 422 41 463Bahawalpur 2 13 131 50 181Dera Ghazi Khan 2 7 314 153 467Rahim Yar Khan - 14 145 17 162KPK 6 5 101 35 136Badin 5 14 634 254 888Turbat 5 15 166 31 197UPAP 23 - 866 316 1,182Total 54 116 3,458 1,059 4,517
NRSP Outreach v
Social Mobilisation
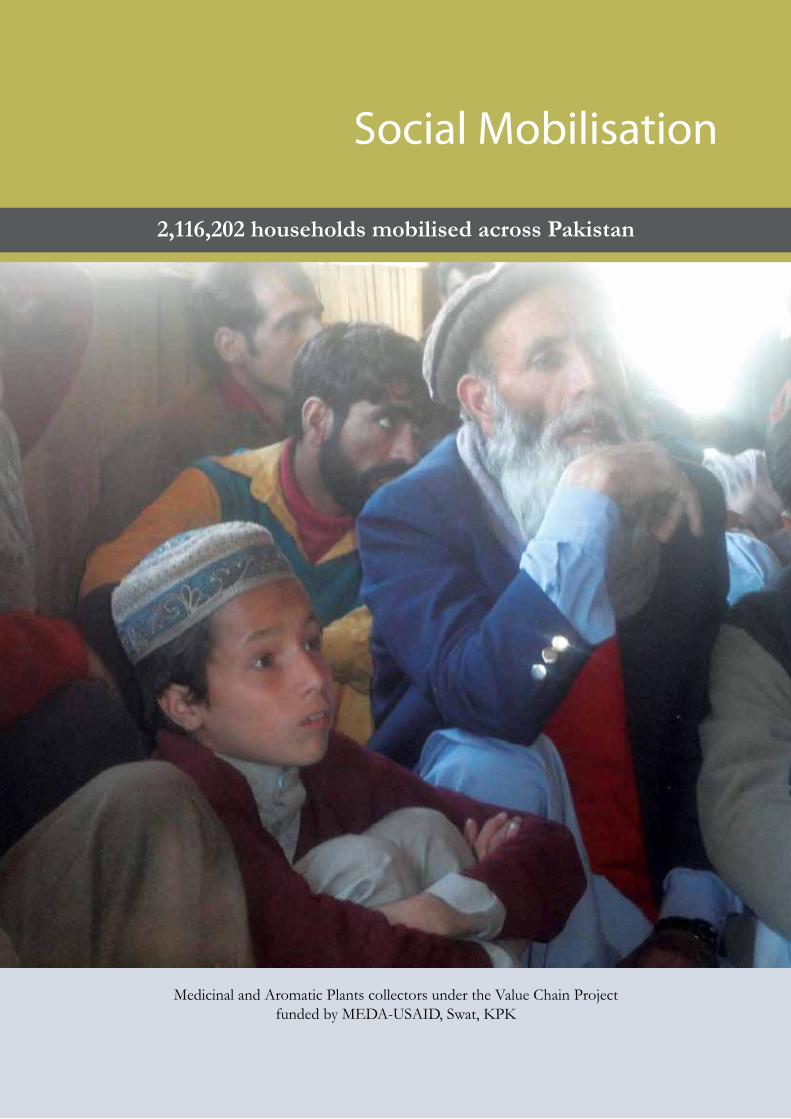
Medicinal and Aromatic Plants collectors under the Value Chain Projectfunded by MEDA-USAID, Swat, KPK
2,116,202 households mobilised across Pakistan
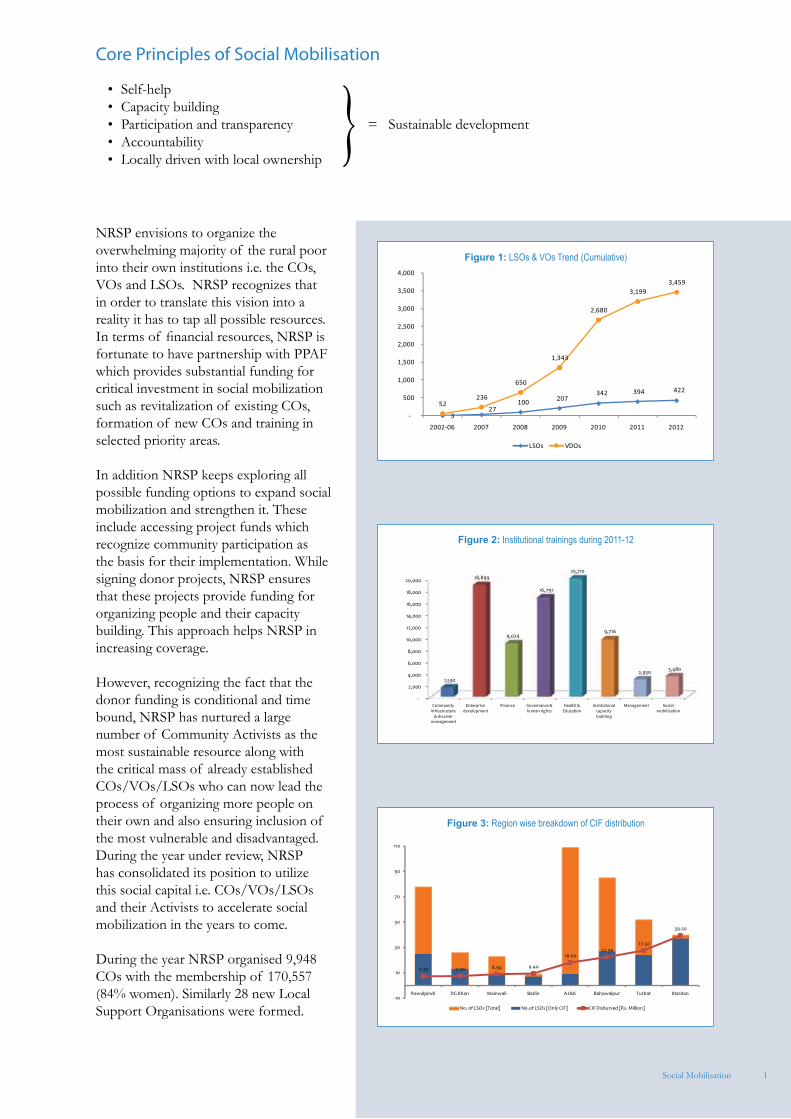
NRSP envisions to organize the overwhelming majority of the rural poor into their own institutions i.e. the COs, VOs and LSOs. NRSP recognizes that in order to translate this vision into a reality it has to tap all possible resources. In terms of financial resources, NRSP is fortunate to have partnership with PPAF which provides substantial funding for critical investment in social mobilization such as revitalization of existing COs, formation of new COs and training in selected priority areas.
In addition NRSP keeps exploring all possible funding options to expand social mobilization and strengthen it. These include accessing project funds which recognize community participation as the basis for their implementation. While signing donor projects, NRSP ensures that these projects provide funding for organizing people and their capacity building. This approach helps NRSP in increasing coverage.
However, recognizing the fact that the donor funding is conditional and time bound, NRSP has nurtured a large number of Community Activists as the most sustainable resource along with the critical mass of already established COs/VOs/LSOs who can now lead the process of organizing more people on their own and also ensuring inclusion of the most vulnerable and disadvantaged. During the year under review, NRSP has consolidated its position to utilize this social capital i.e. COs/VOs/LSOs and their Activists to accelerate social mobilization in the years to come.
During the year NRSP organised 9,948 COs with the membership of 170,557 (84% women). Similarly 28 new Local Support Organisations were formed.
• Self-help• Capacity building• Participation and transparency• Accountability• Locally driven with local ownership
= Sustainable development
Core Principles of Social Mobilisation
Social Mobilisation 1
Figure 3: Region wise breakdown of CIF distribution
Figure 1: LSOs & VOs Trend (Cumulative)
Figure 2: Institutional trainings during 2011-12
2
Revitalization of COs
CO formation is a continuous process so is the process of some COs becoming dormant or not so active. This dormancy occurs due to various factors of which the most important one is the insufficient nurturing during the CO formation process. This suggests special measures for revitalizing the dormant COs. During the year, 1,278 COs were revitalized for their active participation in the development process.
Social mobilization through developmental and disaster management projects
NRSP implemented a large number of developmental and disaster management projects which also helped strengthen the existing COs/VOs/LSOs as most of the project activities were carried out through the network of these institutions. They were engaged in selection of beneficiaries, procurement of goods and services, monitoring, book keeping and physical implementation in addition to cash contributions in some cases. Many LSOs accessed donor funds directly which built their managerial capacity while implementing a diverse nature of activities i.e., value chain, renewable energy and addressing environmental issues.
Role of COs/VOs/LSOs
The COs/VOs/LSOs take a lead role in the implementation of various developmental activities directly as well as through NRSP. The COs implement the activities for livelihoods and social protection including identification of micro credit beneficiaries, participants of skills training and micro grants. The VOs generally take care of community physical infrastructure while the LSOs act as apex institutions at the Union Council level which in some cases directly implement various activities and in many cases provide guidance and monitoring support to the VOs and COs. In all cases, they represent the foundation of the community institutions ie the COs and their members.
LSOs working as independent institutions
The ongoing USAID Small Grants project (SGAFP); the Assessment and Strengthening Program (ASP) and the Gender Equity Project (GEP) have opened further windows for LSOs for capacity building and project funding. The training program launched by the USAID - ASP was particularly useful in capacity building of the LSOs and has enabled them to manage donor funded projects independently. During the year more than 56 LSOs submitted their proposals to the SGAFP, 15 projects have been approved worth USD 1,071,327 by the USAID and the remaining applications are in process.
How social mobilisation is used for capacity building
Conducting programmes and projects in partnership with communities requires participants to have a strong understanding of planned activities. Since the shift to the three tier structure of social mobilisation in 2005, the NRSP has been conducting an extensive
NRSP 18th Annual Progress Report 2011-2012
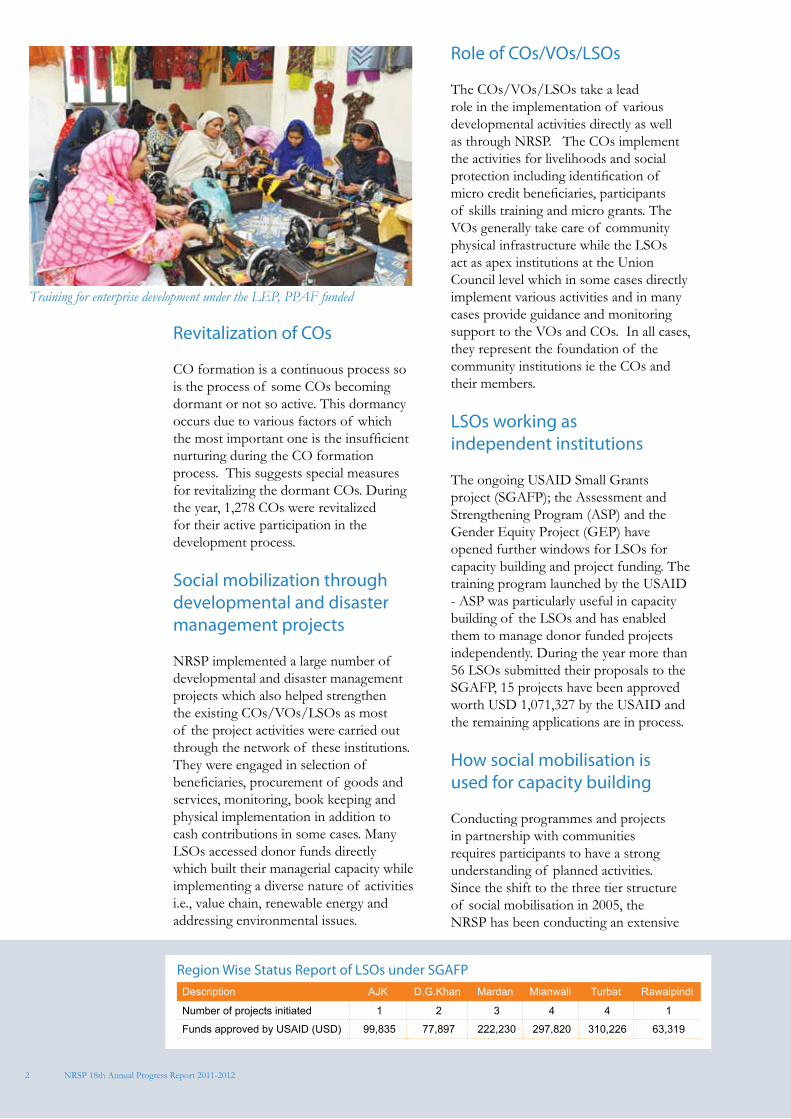
Training for enterprise development under the LEP, PPAF funded
Region Wise Status Report of LSOs under SGAFPDescription AJK D.G.Khan Mardan Mianwali Turbat Rawalpindi
Number of projects initiated 1 2 3 4 4 1
Funds approved by USAID (USD) 99,835 77,897 222,230 297,820 310,226 63,319
3
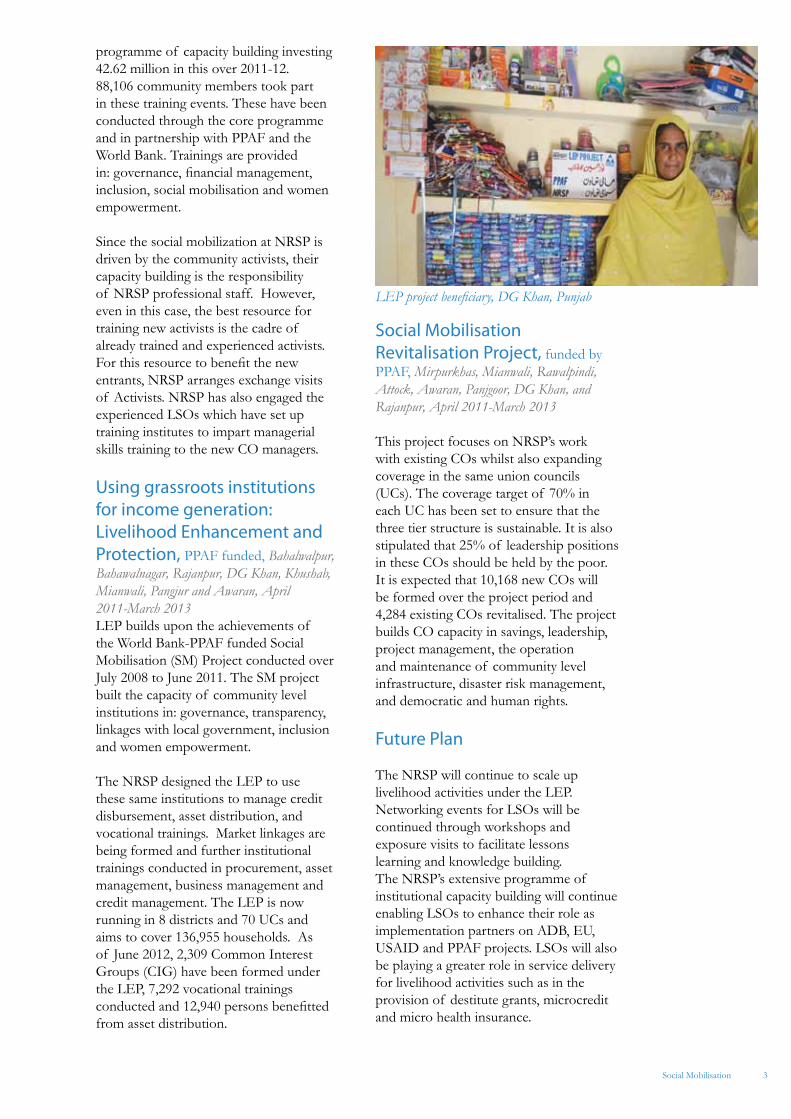
programme of capacity building investing 42.62 million in this over 2011-12. 88,106 community members took part in these training events. These have been conducted through the core programme and in partnership with PPAF and the World Bank. Trainings are provided in: governance, financial management, inclusion, social mobilisation and women empowerment.
Since the social mobilization at NRSP is driven by the community activists, their capacity building is the responsibility of NRSP professional staff. However, even in this case, the best resource for training new activists is the cadre of already trained and experienced activists. For this resource to benefit the new entrants, NRSP arranges exchange visits of Activists. NRSP has also engaged the experienced LSOs which have set up training institutes to impart managerial skills training to the new CO managers.
Using grassroots institutions for income generation: Livelihood Enhancement and Protection, PPAF funded, Bahalwalpur, Bahawalnagar, Rajanpur, DG Khan, Khushab, Mianwali, Pangjur and Awaran, April 2011-March 2013LEP builds upon the achievements of the World Bank-PPAF funded Social Mobilisation (SM) Project conducted over July 2008 to June 2011. The SM project built the capacity of community level institutions in: governance, transparency, linkages with local government, inclusion and women empowerment.
The NRSP designed the LEP to use these same institutions to manage credit disbursement, asset distribution, and vocational trainings. Market linkages are being formed and further institutional trainings conducted in procurement, asset management, business management and credit management. The LEP is now running in 8 districts and 70 UCs and aims to cover 136,955 households. As of June 2012, 2,309 Common Interest Groups (CIG) have been formed under the LEP, 7,292 vocational trainings conducted and 12,940 persons benefitted from asset distribution.
Social Mobilisation Revitalisation Project, funded by PPAF, Mirpurkhas, Mianwali, Rawalpindi, Attock, Awaran, Panjgoor, DG Khan, and Rajanpur, April 2011-March 2013
This project focuses on NRSP’s work with existing COs whilst also expanding coverage in the same union councils (UCs). The coverage target of 70% in each UC has been set to ensure that the three tier structure is sustainable. It is also stipulated that 25% of leadership positions in these COs should be held by the poor. It is expected that 10,168 new COs will be formed over the project period and 4,284 existing COs revitalised. The project builds CO capacity in savings, leadership, project management, the operation and maintenance of community level infrastructure, disaster risk management, and democratic and human rights.
Future Plan
The NRSP will continue to scale up livelihood activities under the LEP. Networking events for LSOs will be continued through workshops and exposure visits to facilitate lessons learning and knowledge building. The NRSP’s extensive programme of institutional capacity building will continue enabling LSOs to enhance their role as implementation partners on ADB, EU, USAID and PPAF projects. LSOs will also be playing a greater role in service delivery for livelihood activities such as in the provision of destitute grants, microcredit and micro health insurance.
Social Mobilisation
LEP project beneficiary, DG Khan, Punjab
4
Gender and Development
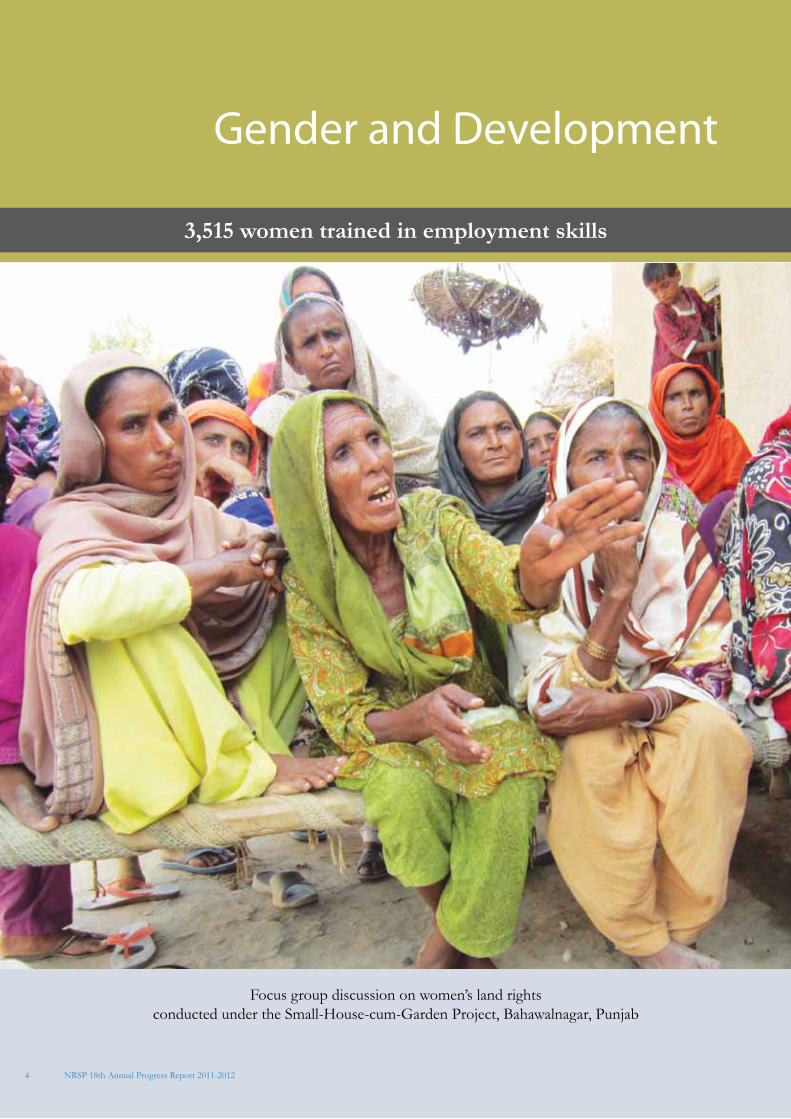
3,515 women trained in employment skills
Focus group discussion on women’s land rightsconducted under the Small-House-cum-Garden Project, Bahawalnagar, Punjab
NRSP 18th Annual Progress Report 2011-2012
5
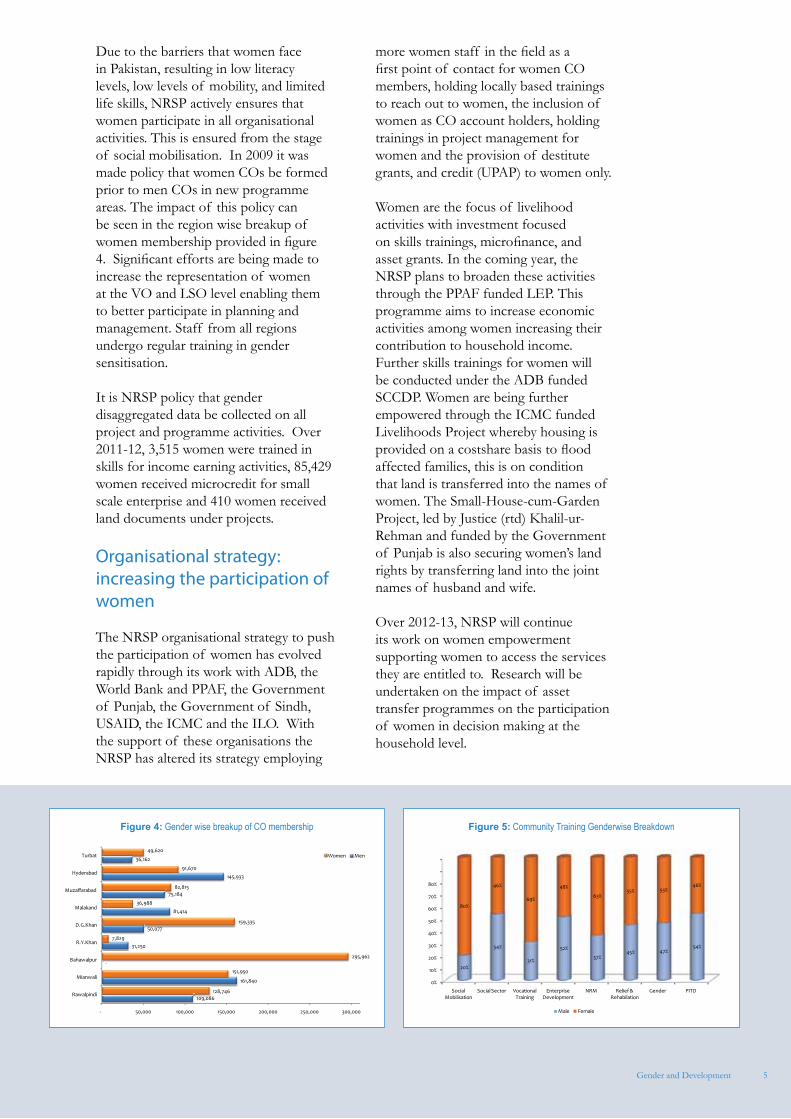
Figure 4: Gender wise breakup of CO membership Figure 5: Community Training Genderwise Breakdown
Due to the barriers that women face in Pakistan, resulting in low literacy levels, low levels of mobility, and limited life skills, NRSP actively ensures that women participate in all organisational activities. This is ensured from the stage of social mobilisation. In 2009 it was made policy that women COs be formed prior to men COs in new programme areas. The impact of this policy can be seen in the region wise breakup of women membership provided in figure 4. Significant efforts are being made to increase the representation of women at the VO and LSO level enabling them to better participate in planning and management. Staff from all regions undergo regular training in gender sensitisation.
It is NRSP policy that gender disaggregated data be collected on all project and programme activities. Over 2011-12, 3,515 women were trained in skills for income earning activities, 85,429 women received microcredit for small scale enterprise and 410 women received land documents under projects.
Organisational strategy: increasing the participation of women
The NRSP organisational strategy to push the participation of women has evolved rapidly through its work with ADB, the World Bank and PPAF, the Government of Punjab, the Government of Sindh, USAID, the ICMC and the ILO. With the support of these organisations the NRSP has altered its strategy employing
more women staff in the field as a first point of contact for women CO members, holding locally based trainings to reach out to women, the inclusion of women as CO account holders, holding trainings in project management for women and the provision of destitute grants, and credit (UPAP) to women only.
Women are the focus of livelihood activities with investment focused on skills trainings, microfinance, and asset grants. In the coming year, the NRSP plans to broaden these activities through the PPAF funded LEP. This programme aims to increase economic activities among women increasing their contribution to household income. Further skills trainings for women will be conducted under the ADB funded SCCDP. Women are being further empowered through the ICMC funded Livelihoods Project whereby housing is provided on a costshare basis to flood affected families, this is on condition that land is transferred into the names of women. The Small-House-cum-Garden Project, led by Justice (rtd) Khalil-ur-Rehman and funded by the Government of Punjab is also securing women’s land rights by transferring land into the joint names of husband and wife.
Over 2012-13, NRSP will continue its work on women empowerment supporting women to access the services they are entitled to. Research will be undertaken on the impact of asset transfer programmes on the participation of women in decision making at the household level.
Gender and Development
6
Microfinance and Enterprise Development
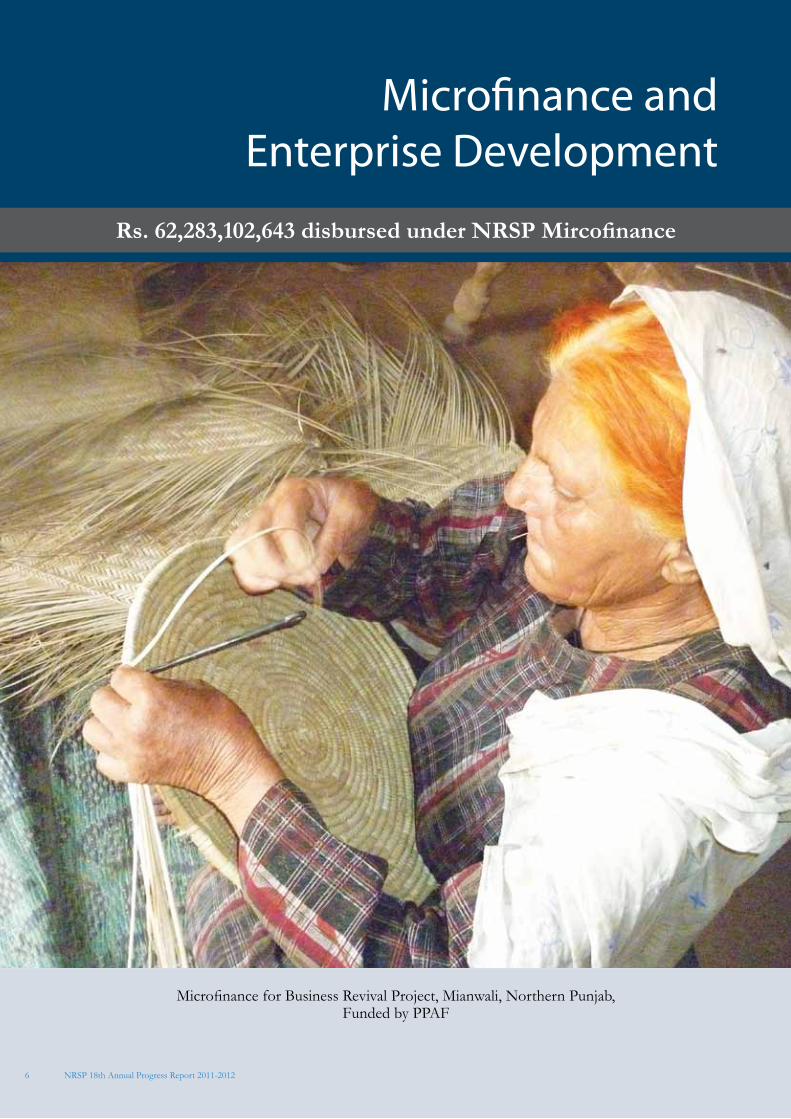
Rs. 62,283,102,643 disbursed under NRSP Mircofinance
Microfinance for Business Revival Project, Mianwali, Northern Punjab, Funded by PPAF
NRSP 18th Annual Progress Report 2011-2012
7
The NRSP runs two programmesfor microcredit: the MEDP andUPAP. MEDP operates in rural areasand the UPAP in urban areas. Bothprogrammes promote small enterprisedevelopment through the provisionof microcredit. The NRSP is an activemember of the Pakistan MicrofinanceNetwork (PMN). The organisation alsoreports its data to Mix Market for onlinepublishing. To ensure transparency, NRSPmicrofinance is audited separately from itsother operations.
MEDP and UPAP Products
Credit: is used for the development of small enterprise, agriculture and livestock.
Savings: clients are organised into groups mobilising members to save an amount equal to one quarter of their monthly instalment.
Micro Insurance: is provided to protect clients and their families in the case of the death of a client or spouse.
Now Operating the MEDP, UPAP and NRSP MfB, the NRSP is the largest provider of microcredit in Pakistan. NRSP is also the largest provider of micro health insurance and the largest holder of savings.
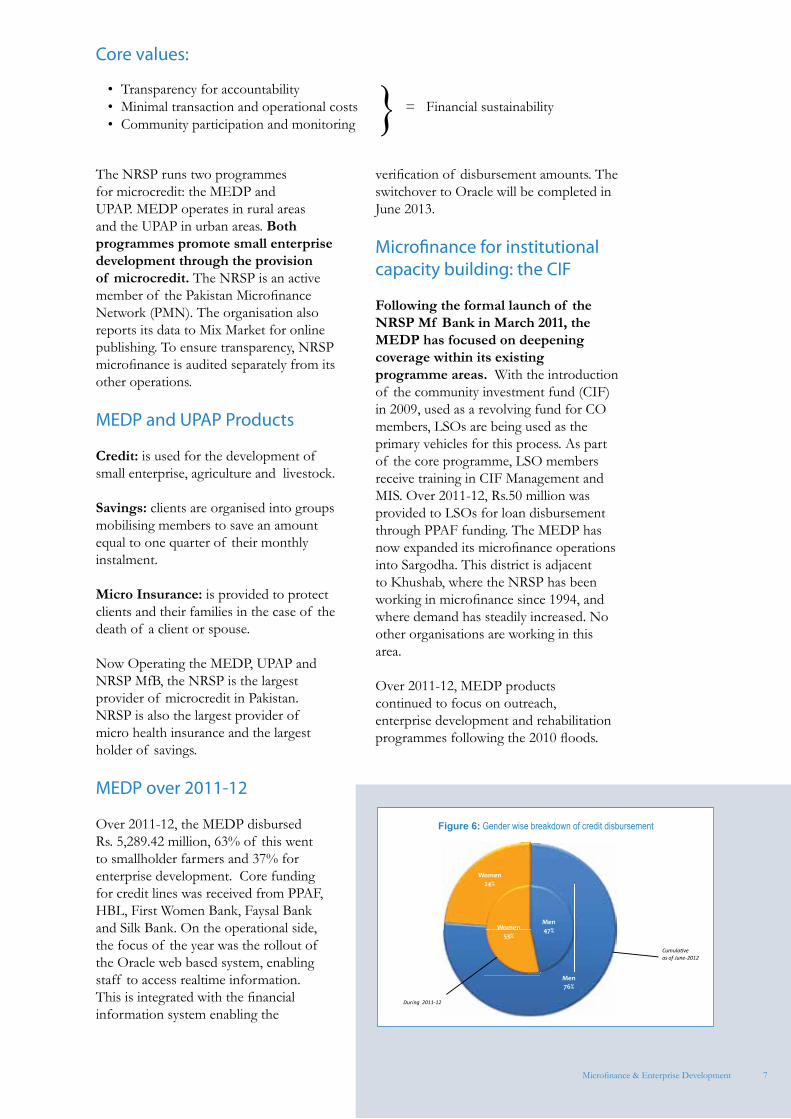
MEDP over 2011-12
Over 2011-12, the MEDP disbursed Rs. 5,289.42 million, 63% of this went to smallholder farmers and 37% for enterprise development. Core funding for credit lines was received from PPAF, HBL, First Women Bank, Faysal Bank and Silk Bank. On the operational side, the focus of the year was the rollout of the Oracle web based system, enabling staff to access realtime information. This is integrated with the financial information system enabling the
verification of disbursement amounts. The switchover to Oracle will be completed in June 2013.
Microfinance for institutional capacity building: the CIF
Following the formal launch of the NRSP Mf Bank in March 2011, the MEDP has focused on deepening coverage within its existing programme areas. With the introduction of the community investment fund (CIF) in 2009, used as a revolving fund for CO members, LSOs are being used as the primary vehicles for this process. As part of the core programme, LSO members receive training in CIF Management and MIS. Over 2011-12, Rs.50 million was provided to LSOs for loan disbursement through PPAF funding. The MEDP has now expanded its microfinance operations into Sargodha. This district is adjacent to Khushab, where the NRSP has been working in microfinance since 1994, and where demand has steadily increased. No other organisations are working in this area.
Over 2011-12, MEDP products continued to focus on outreach, enterprise development and rehabilitation programmes following the 2010 floods.
Microfinance & Enterprise Development
• Transparency for accountability• Minimal transaction and operational costs• Community participation and monitoring
= Financial sustainability
Core values:
Figure 6: Gender wise breakdown of credit disbursement
8
• Village Banking Programme, Rawalakot, AJK, PPAF funded
This programme functions through the wholesale disbursement of funds through VOs. VOs received loans on wholesale rates varying from Rs. 500,000 to Rs. 1,000,000, to disburse credit to CO members. This provides VOs a means to become more sustainable whilst the NRSP saves on HR and other operating costs.
• Rural Development through Livestock and Dairy Management, PPAF funded
This initiative provides loans of up to Rs.60,000 to farmers in Rahim Yar Khan. These funds were used to purchase livestock bred to produce better quality milk. The project increased farmers’ incomes through the provision of better quality milk, improved information sharing through Farmers’ Associations and the strengthening of market linkages. Milk chillers and generators were provided to
improve milk quality and animals vaccinated.
• Micro Grants (Mianwali) were provided to community members to start hand fan businesses using funding from PPAF, Rs. 30,000,000 was disbursed. A wheat/ rice stalk product market has now developed in the area with 500 to 600 people operating in this.
• Rehabilitation: Housing loans (Mianwali) provide loans up to Rs. 60,000. The amount disbursed is enough for a one unit construction which can later be extended.
A collective investment of microfinance, CO Dera Jewan Abad, Khushab
CO Dera Jewan Abad was formed in January 2008 with eleven members. The average education level in the area is illiterate to primary. Income levels range from Rs.10,000 to 18,000 per month, derived predominantly from farming and livestock rearing. The NRSP credit line was extended to the CO three months after its formation e.g. when deemed to be mature. In the first year of the CO, the members used this to purchase maize seed. The following year, the CO decided to use its member loans collectively to purchase a second hand thresher machine. This was first discussed and then formally raised in the monthly meeting where it was approved. Each member applied for a loan of Rs.10,000 with a total of Rs.110,000 being collected.
This loan is repaid by each member individually. Rs.85,000 was used to purchase the machine and Rs.25,000 for fuel expenses. Each member pays a share for maintenance constituting a percentage of their yield. They also loan it to non CO members on a commercial basis. At the end of the season each member receives a 20th of the maize crop and a 14th of the wheat crop threshed by the group. This initiative proved to be a highly successful raising productivity levels and enabling a greater margin of profit. Following this, the CO took further initiatives together leasing 50 kanal of land whereby inputs, labour requirements and profit were
NRSP 18th Annual Progress Report 2011-2012
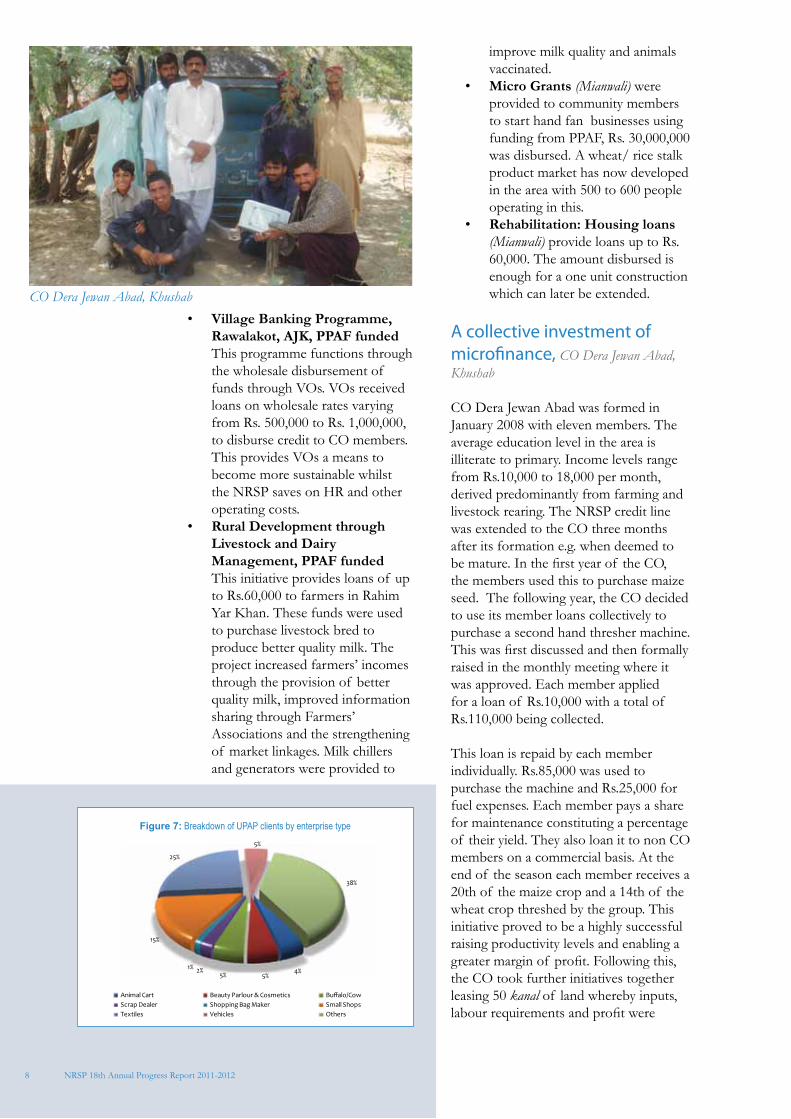
CO Dera Jewan Abad, Khushab
Figure 7: Breakdown of UPAP clients by enterprise type
9
contributed to and taken collectively by the CO members. In future they also plan to purchase a tractor on a collective basis.
Access to finance for women: Urban Poverty Alleviation Programme (UPAP)
The UPAP provides access to credit, savings schemes and insurance products for women living in urban areas. The UPAP combines a credit, client support, and trainings encouraging enterprise and income generation. The UPAP, now operating in 14 districts, was the first microfinance institution rated by Micro Credit Rating International. M-CRIL measures credit systems, programme performance and sustainability. Over 2011-12, the UPAP disbursed 141,804 loans to clients for the development of small scale enterprises.
UPAP Insurance product
Credit life: the outstanding loan balance and interest will be paidAdditional benefit: 50% of the loan amount disbursed will be paid to the heir/ family of the borrower in case of death to cover funeral expenses.Additional life: 50% of the loan amount disbursed will be given to the borrower on the death of the insured family member for funeral expenses.
As of June 2012, 1,010,742 clients were covered under the UPAP insurance programme with 4,200 claims approved for payment. UPAP issues payment on insurance within one month of an incident being reported.
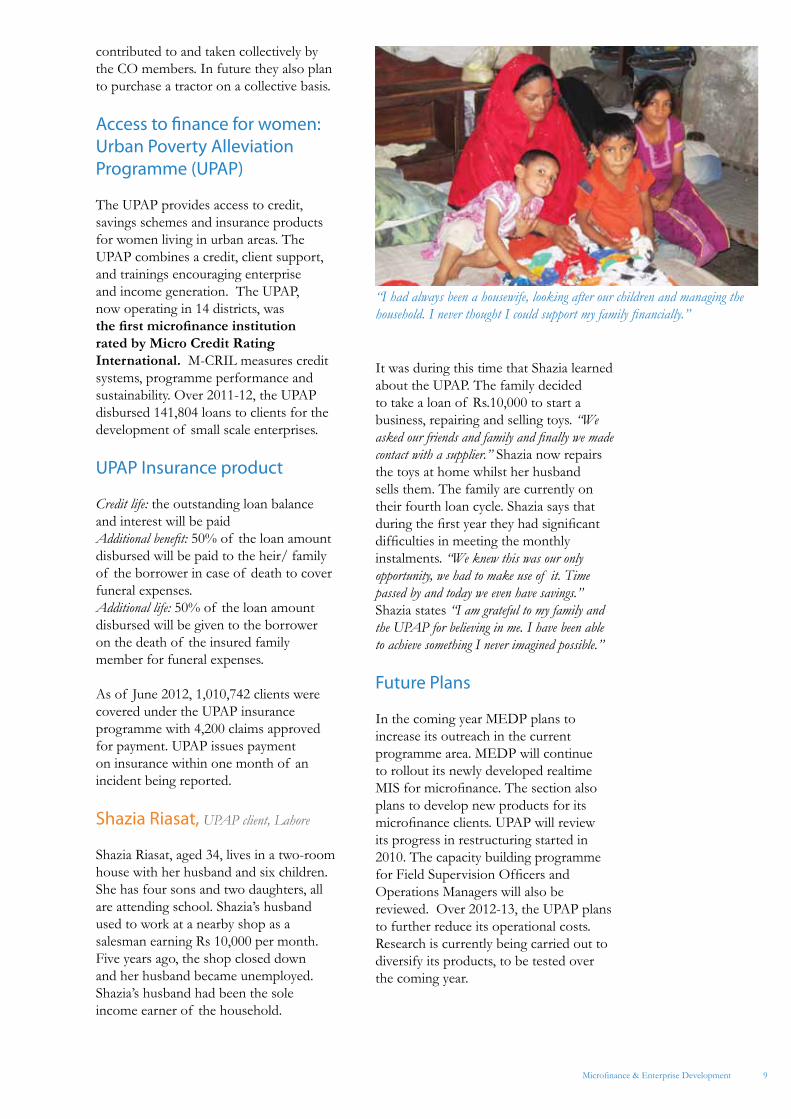
Shazia Riasat, UPAP client, Lahore
Shazia Riasat, aged 34, lives in a two-room house with her husband and six children. She has four sons and two daughters, all are attending school. Shazia’s husband used to work at a nearby shop as a salesman earning Rs 10,000 per month. Five years ago, the shop closed down and her husband became unemployed. Shazia’s husband had been the sole income earner of the household.
It was during this time that Shazia learned about the UPAP. The family decided to take a loan of Rs.10,000 to start a business, repairing and selling toys. “We asked our friends and family and finally we made contact with a supplier.” Shazia now repairs the toys at home whilst her husband sells them. The family are currently on their fourth loan cycle. Shazia says that during the first year they had significant difficulties in meeting the monthly instalments. “We knew this was our only opportunity, we had to make use of it. Time passed by and today we even have savings.” Shazia states “I am grateful to my family and the UPAP for believing in me. I have been able to achieve something I never imagined possible.”
Future Plans
In the coming year MEDP plans to increase its outreach in the current programme area. MEDP will continue to rollout its newly developed realtime MIS for microfinance. The section also plans to develop new products for its microfinance clients. UPAP will review its progress in restructuring started in 2010. The capacity building programme for Field Supervision Officers and Operations Managers will also be reviewed. Over 2012-13, the UPAP plans to further reduce its operational costs. Research is currently being carried out to diversify its products, to be tested over the coming year.
Microfinance & Enterprise Development
“I had always been a housewife, looking after our children and managing the household. I never thought I could support my family financially.”
10
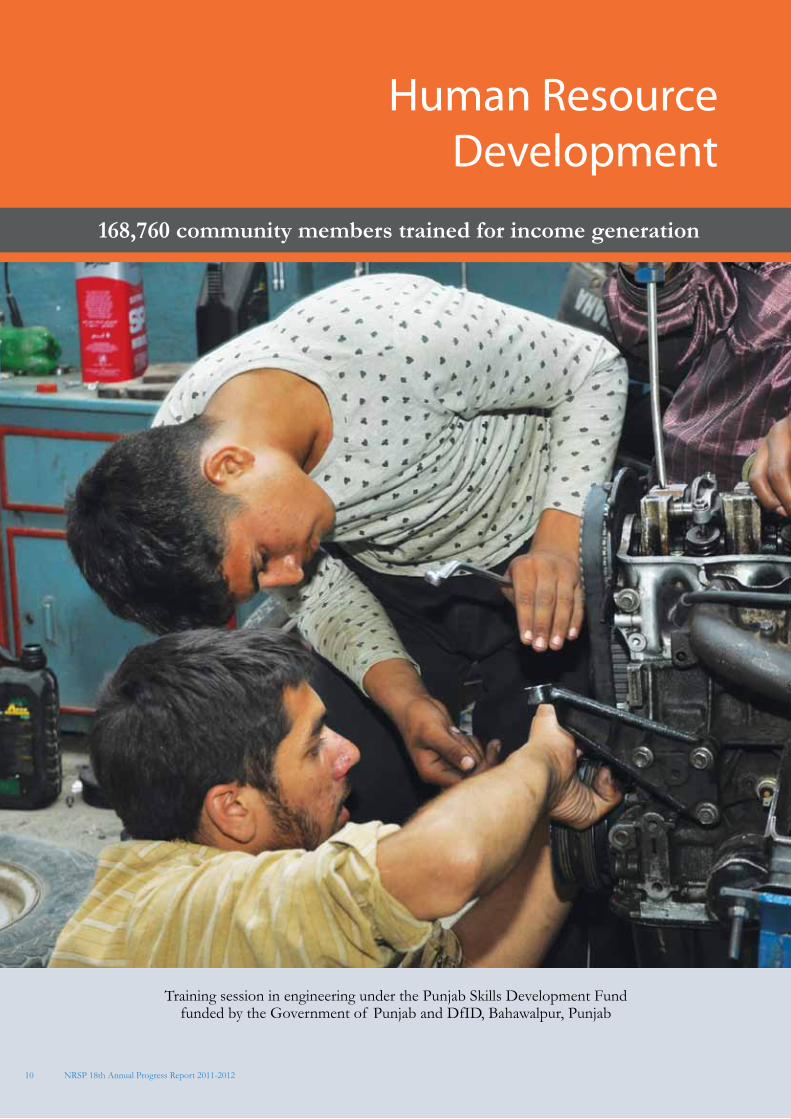
Human ResourceDevelopment
168,760 community members trained for income generation
Training session in engineering under the Punjab Skills Development Fundfunded by the Government of Punjab and DfID, Bahawalpur, Punjab
NRSP 18th Annual Progress Report 2011-2012
11
The second important principle in RSPs’ approach is skills enhancement. NRSP believes that once people are organized their capacity must be built to enable them to plan and implement various activities on their own. NRSP envisions building the managerial capacity of all managers of community institutions and their leaders for empowering them to take decisions according to the changing environment. The members of the COs also identify a variety of skills training as a means to reduce their vulnerability and improve their incomes and quality of life. NRSP explores funding for this basic need of all communities.
Specialized and highly technical training are imparted by specialists in their respective fields. Where relevant and appropriate NRSP also utilizes the services of Community Resource Persons (CRPs) for managerial as well as technical training. This helps scale up HRD activities with lesser cost and greater impacts. The Institute of Rural Management of NRSP shoulders the responsibility of managing the NRSP’s HRD component with the NRSP HRD unit. Over 2011-12, the HRD section trained 52,979 activists in institutional trainings for NRSP’s COs, VOs and LSOs. 5,126 community members were trained in employment skills.
Community Training Program
The training of office bearers of COs/VOs/LSOs in managerial skills and book keeping is mandatory. This training programme with various nomenclatures such as CMST, LMST, and Exchange visits runs throughout the year to build the capacity of new managers in the community institutions or refresh the experienced ones. Over 2011-12, 58 LSOs received training in the update and management of the MIS to record and track data on CIF distribution. Under the PPAF funded Livelihood Enhancement Project 2,072 VOs received managerial training and 1,297 undertook training on procurement processes. A large number of LSOs also benefitted from the managerial training imparted by the Assessment and Strengthening Program of USAID for their grantees. This
training was about procurement, HR, financial management and reporting and other aspects of management.
NRSP also arranges a large number of technical and vocational skills training for the members of COs and their youth. During the year, NRSP received funding from PPAF, SCCDP, PSDF and other donors for such training. As the number of poor persons to be provided skills training was large and considering their mobility issues, NRSP used various methods to impart skills training, these included:
a. Formal long term courses through formal training institutes for the participants who could afford to leave their homes
b. Local level apprenticeship for the ones who could not afford to leave their home places
c. Training organized by LSOs and trained resource persons
NRSP also arranged behaviuor change training in education and health under various projects. In this case also, NRSP utilized the forum of specialized institutions as well as the Community Resource Persons where applicable.
Punjab Skills Development Fund (PSDF), funded by the Government of Punjab and UKAID Bahawalnagar, Bahawalpur, Lodhran and Muzaffargarh, December 2011-March 2012
The PSDF is designed to develop skills for income generation. Training areas
Human Resource Development
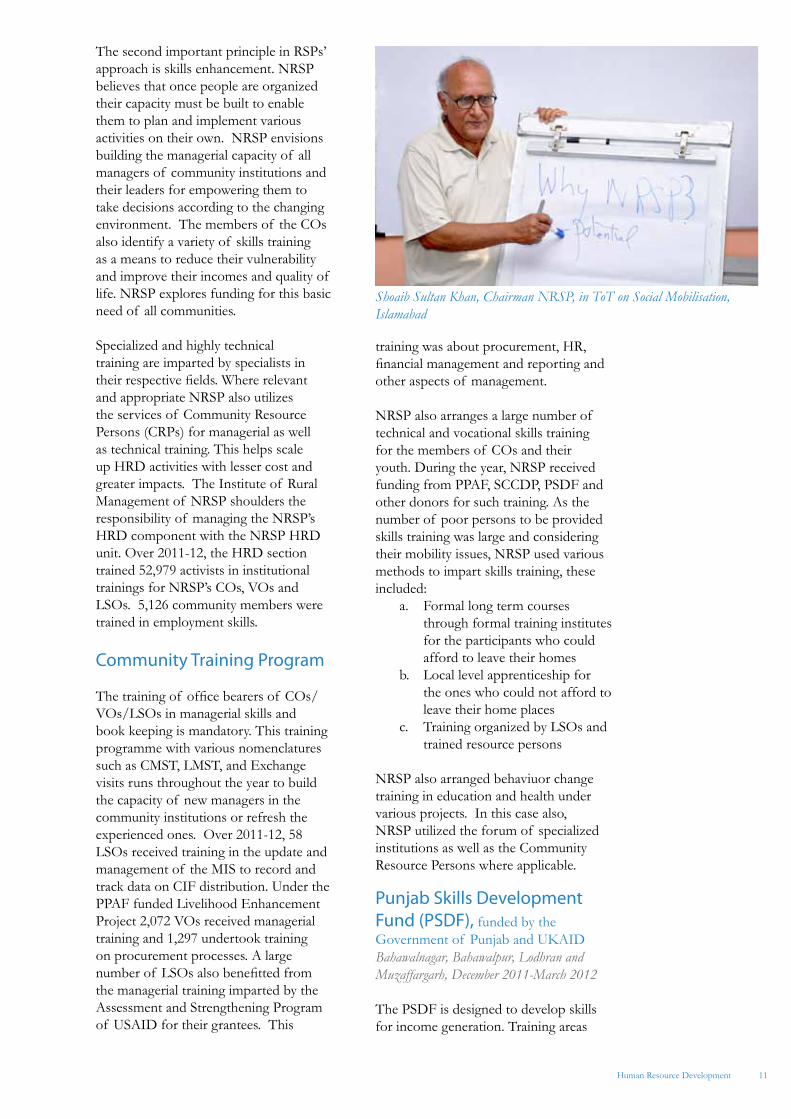
Shoaib Sultan Khan, Chairman NRSP, in ToT on Social Mobilisation, Islamabad
12
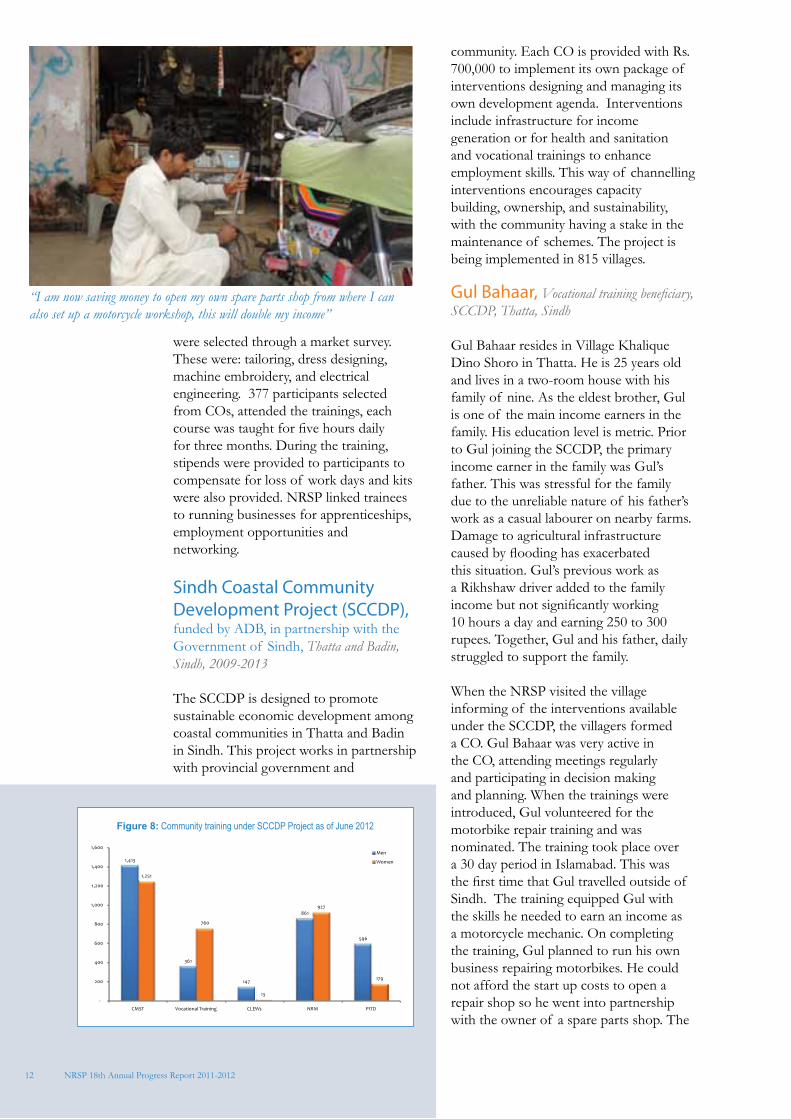
Figure 8: Community training under SCCDP Project as of June 2012
were selected through a market survey. These were: tailoring, dress designing, machine embroidery, and electrical engineering. 377 participants selected from COs, attended the trainings, each course was taught for five hours daily for three months. During the training, stipends were provided to participants to compensate for loss of work days and kits were also provided. NRSP linked trainees to running businesses for apprenticeships, employment opportunities and networking.
Sindh Coastal Community Development Project (SCCDP), funded by ADB, in partnership with the Government of Sindh, Thatta and Badin, Sindh, 2009-2013
The SCCDP is designed to promote sustainable economic development among coastal communities in Thatta and Badin in Sindh. This project works in partnership with provincial government and
community. Each CO is provided with Rs. 700,000 to implement its own package of interventions designing and managing its own development agenda. Interventions include infrastructure for income generation or for health and sanitation and vocational trainings to enhance employment skills. This way of channelling interventions encourages capacity building, ownership, and sustainability, with the community having a stake in the maintenance of schemes. The project is being implemented in 815 villages. Gul Bahaar, Vocational training beneficiary, SCCDP, Thatta, Sindh
Gul Bahaar resides in Village Khalique Dino Shoro in Thatta. He is 25 years old and lives in a two-room house with his family of nine. As the eldest brother, Gul is one of the main income earners in the family. His education level is metric. Prior to Gul joining the SCCDP, the primary income earner in the family was Gul’s father. This was stressful for the family due to the unreliable nature of his father’s work as a casual labourer on nearby farms. Damage to agricultural infrastructure caused by flooding has exacerbated this situation. Gul’s previous work as a Rikhshaw driver added to the family income but not significantly working 10 hours a day and earning 250 to 300 rupees. Together, Gul and his father, daily struggled to support the family.
When the NRSP visited the village informing of the interventions available under the SCCDP, the villagers formed a CO. Gul Bahaar was very active in the CO, attending meetings regularly and participating in decision making and planning. When the trainings were introduced, Gul volunteered for the motorbike repair training and was nominated. The training took place over a 30 day period in Islamabad. This was the first time that Gul travelled outside of Sindh. The training equipped Gul with the skills he needed to earn an income as a motorcycle mechanic. On completing the training, Gul planned to run his own business repairing motorbikes. He could not afford the start up costs to open a repair shop so he went into partnership with the owner of a spare parts shop. The
NRSP 18th Annual Progress Report 2011-2012
“I am now saving money to open my own spare parts shop from where I can also set up a motorcycle workshop, this will double my income”
13
owner agreed for Gul to run his business within his shop on a 50% profit share basis. Gul is now running his business earning Rs.18,000 to Rs. 22,000 per month.
Staff Training Program
The NRSP runs an ongoing programme for the capacity building of staff. This includes mandatory training program for all professional staff and need based training for which regular performance reviews are conducted and staff needs assessed. The need based training programme is planned or modified according to TNA. Whereas, the mandatory training program include;
Orientation Training Workshops for all professional staff to orient them about the Social Mobilization process, NRSP’s philosophy, sectoral introduction and implementation strategy.
Gender Mainstreaming Training for all professional staff to sensitize them on gender issues, inclusion and empowerment of women at all levels.
Training of Trainers for field staff to equip them with basic skills and knowledge necessary for imparting effective training at the community level.
NRSP also strives to build capacity of its staff to meet international standards of core competencies particularly in microfinance, M&E, financial management and Leadership skills. For this NRSP staff regularly participates in training courses organized by the ILO’s International Training Centre, the Boulder Microfinance Training Program, other international Institutes and Universities.
Assessment and Strengthening Programme (ASP), funded by USAID, in partnership with RSPN
Staff receive additional training under the USAID funded ASP programme. The goal of the ASP is to strengthen the management, accountability and transparency of the Government of Pakistan and Pakistani civil society
organisations. This is to strengthen systems for compliance with donor requirements, improving opportunities for investment. To date 34 members of staff have received training in: Monitoring and Evaluation, Disaster Management, Gender and USAID regulations.
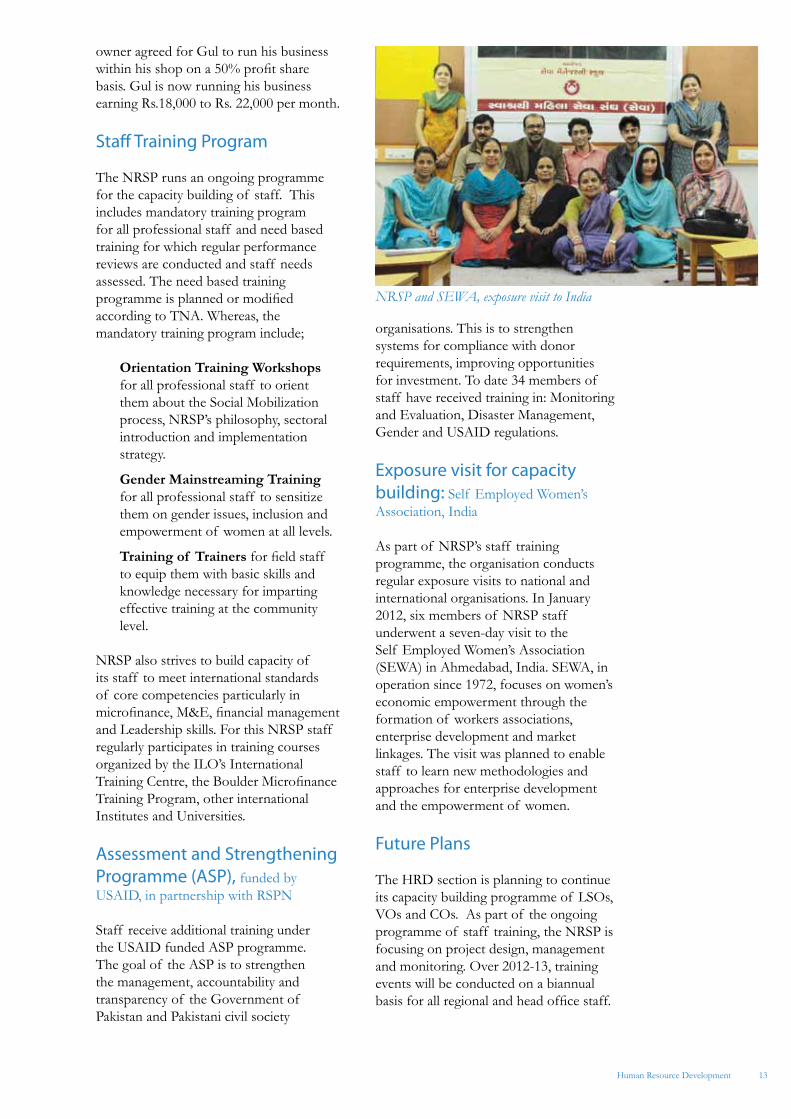
Exposure visit for capacity building: Self Employed Women’s Association, India
As part of NRSP’s staff training programme, the organisation conducts regular exposure visits to national and international organisations. In January 2012, six members of NRSP staff underwent a seven-day visit to the Self Employed Women’s Association (SEWA) in Ahmedabad, India. SEWA, in operation since 1972, focuses on women’s economic empowerment through the formation of workers associations, enterprise development and market linkages. The visit was planned to enable staff to learn new methodologies and approaches for enterprise development and the empowerment of women.
Future Plans
The HRD section is planning to continue its capacity building programme of LSOs, VOs and COs. As part of the ongoing programme of staff training, the NRSP is focusing on project design, management and monitoring. Over 2012-13, training events will be conducted on a biannual basis for all regional and head office staff.
Human Resource Development
NRSP and SEWA, exposure visit to India
14
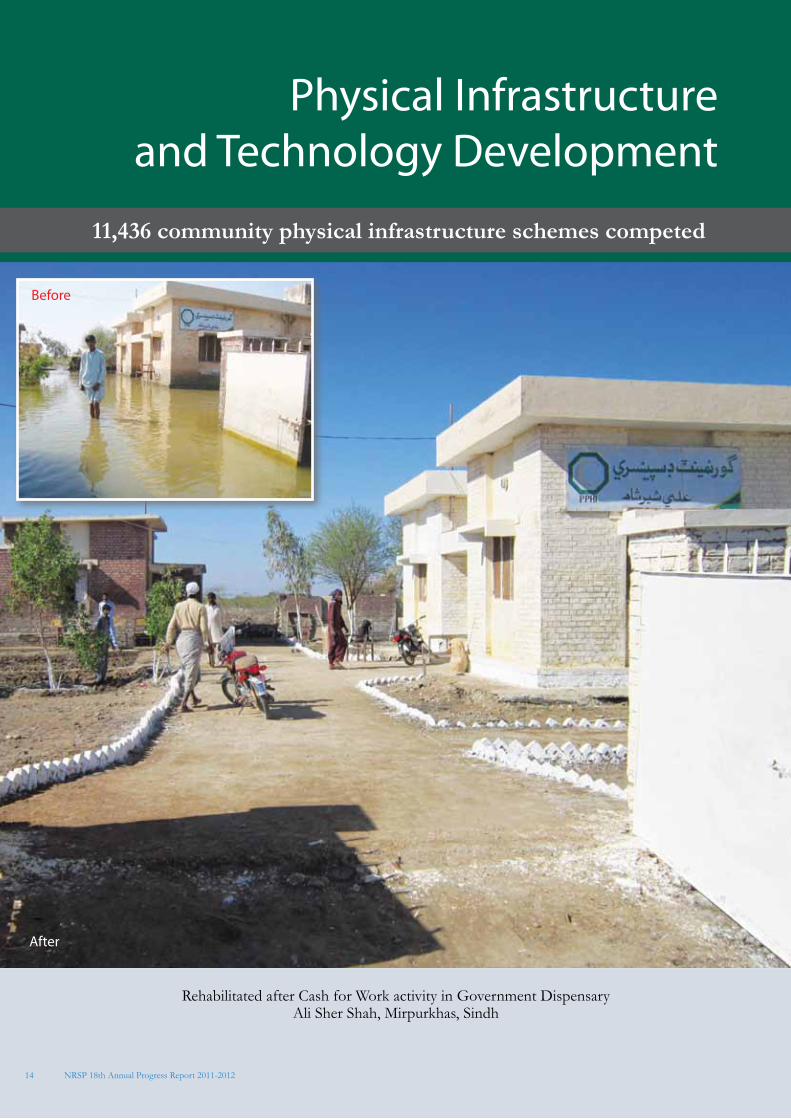
Physical Infrastructureand Technology Development
11,436 community physical infrastructure schemes competed
Rehabilitated after Cash for Work activity in Government DispensaryAli Sher Shah, Mirpurkhas, Sindh
NRSP 18th Annual Progress Report 2011-2012
Before
After
15Physical Infrastructure and Technology Development
Small scale infrastructural schemes are used as a means for community development. Link roads and bridges connect villages to markets for income generation and improve access to government services. Irrigation channels and turbines are used to enhance productivity levels and improve food security.
Over 2011-12, 1,640 community physical infrastructure schemes (CPIs) were constructed by PITD. The majority of these were funded by PPAF (phase XVI and XVII), ADB through the Sindh Coastal Community Development Project (SCCDP), and UNDP for the rehabilitation of infrastructure destroyed by the floods.
PPAF Phase XVI and XVII Punjab, Sindh, Balochistan and AJKJuly 2010- June 2012
PPAF continued its funding for CPIs under phases XVI and XVII. Schemes under phase XVI included: bridges, link roads, culverts, irrigation channels, biogas plants, water pumps, latrines, drainage,
• Benefit a wide range of recipients• Not have any adverse environmental impacts• Be cost effective, manageable and sustainable• Be community owned and driven
= Sustainable and demand driven infrastructure
Core requirements for scheme initiation- the scheme must:
and flood protection bunds. 80% of the cost of each scheme was funded by PPAF and 20% by communities in the way of costshare. A total of 510 schemes were constructed benefitting 22,984 households. CPIs under phase XVII focused on only water supply and irrigation, with the construction of reservoirs, sprinkler irrigation, lift irrigation schemes, and rain water harvesting ponds. Under this phase a further 92 CPIs have been constructed benefitting 2,431 households.
Livelihood Improvement for Empowerment, funded by UNDPRajanpur, DG Khan, Mianwali, ThattaApril 2011 – February 2012
During the 2010 floods affecting all Pakistan and 2011 floods over Sindh, extensive damage was caused to community based infrastructure. This destroyed link roads, bridges, irrigation channels, and government buildings, cutting communities off from markets, supply routes and basic services. This halted livelihood activities and caused gaps in critical services.
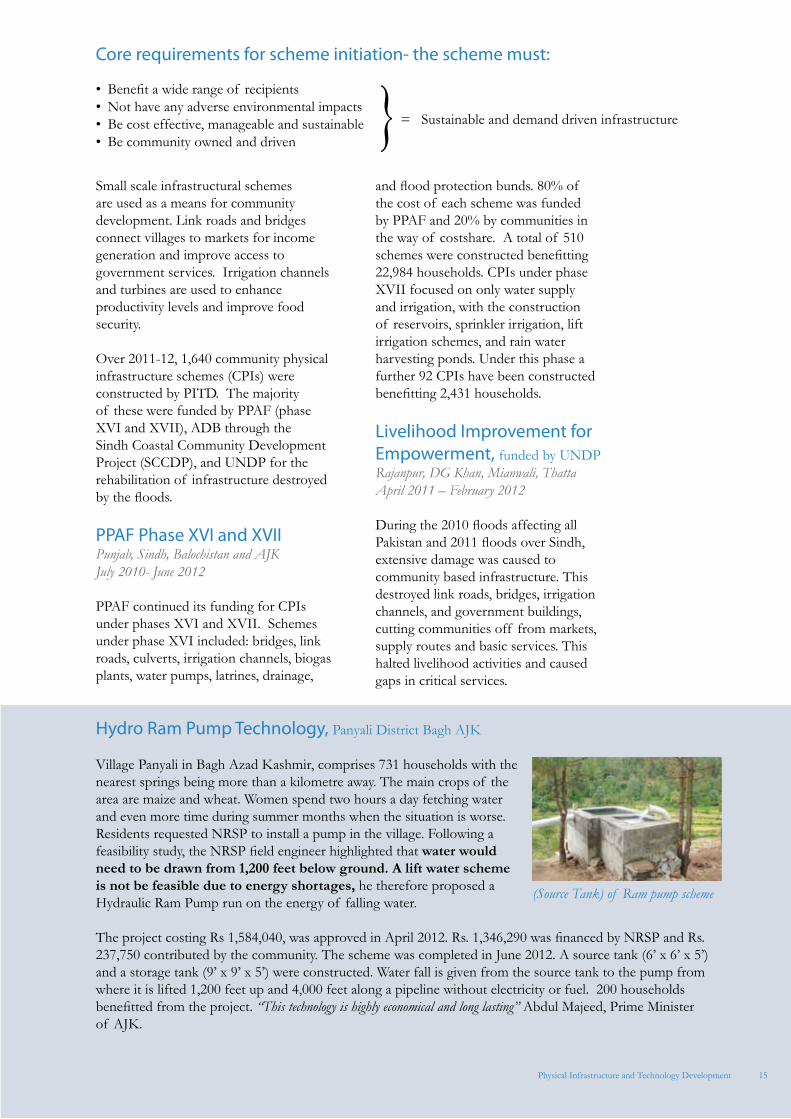
Hydro Ram Pump Technology, Panyali District Bagh AJK
Village Panyali in Bagh Azad Kashmir, comprises 731 households with the nearest springs being more than a kilometre away. The main crops of the area are maize and wheat. Women spend two hours a day fetching water and even more time during summer months when the situation is worse. Residents requested NRSP to install a pump in the village. Following a feasibility study, the NRSP field engineer highlighted that water would need to be drawn from 1,200 feet below ground. A lift water scheme is not be feasible due to energy shortages, he therefore proposed a Hydraulic Ram Pump run on the energy of falling water.
The project costing Rs 1,584,040, was approved in April 2012. Rs. 1,346,290 was financed by NRSP and Rs. 237,750 contributed by the community. The scheme was completed in June 2012. A source tank (6’ x 6’ x 5’) and a storage tank (9’ x 9’ x 5’) were constructed. Water fall is given from the source tank to the pump from where it is lifted 1,200 feet up and 4,000 feet along a pipeline without electricity or fuel. 200 households benefitted from the project. “This technology is highly economical and long lasting” Abdul Majeed, Prime Minister of AJK.
(Source Tank) of Ram pump scheme
16
Figure 9: Donorwise Schemes during 2011-12
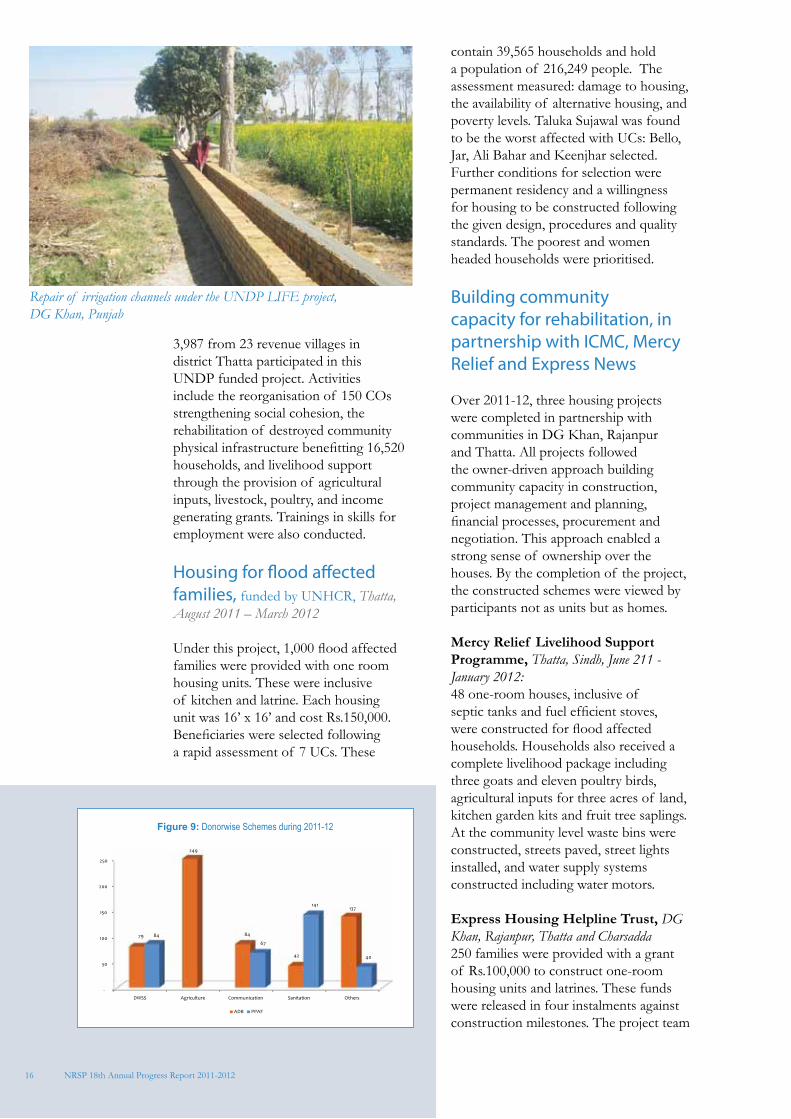
3,987 from 23 revenue villages in district Thatta participated in this UNDP funded project. Activities include the reorganisation of 150 COs strengthening social cohesion, the rehabilitation of destroyed community physical infrastructure benefitting 16,520 households, and livelihood support through the provision of agricultural inputs, livestock, poultry, and income generating grants. Trainings in skills for employment were also conducted.
Housing for flood affected families, funded by UNHCR, Thatta, August 2011 – March 2012
Under this project, 1,000 flood affected families were provided with one room housing units. These were inclusive of kitchen and latrine. Each housing unit was 16’ x 16’ and cost Rs.150,000. Beneficiaries were selected following a rapid assessment of 7 UCs. These
contain 39,565 households and hold a population of 216,249 people. The assessment measured: damage to housing, the availability of alternative housing, and poverty levels. Taluka Sujawal was found to be the worst affected with UCs: Bello, Jar, Ali Bahar and Keenjhar selected. Further conditions for selection were permanent residency and a willingness for housing to be constructed following the given design, procedures and quality standards. The poorest and women headed households were prioritised.
Building community capacity for rehabilitation, in partnership with ICMC, Mercy Relief and Express News
Over 2011-12, three housing projects were completed in partnership with communities in DG Khan, Rajanpur and Thatta. All projects followed the owner-driven approach building community capacity in construction, project management and planning, financial processes, procurement and negotiation. This approach enabled a strong sense of ownership over the houses. By the completion of the project, the constructed schemes were viewed by participants not as units but as homes.
Mercy Relief Livelihood Support Programme, Thatta, Sindh, June 211 - January 2012: 48 one-room houses, inclusive of septic tanks and fuel efficient stoves, were constructed for flood affected households. Households also received a complete livelihood package including three goats and eleven poultry birds, agricultural inputs for three acres of land, kitchen garden kits and fruit tree saplings. At the community level waste bins were constructed, streets paved, street lights installed, and water supply systems constructed including water motors.
Express Housing Helpline Trust, DG Khan, Rajanpur, Thatta and Charsadda250 families were provided with a grant of Rs.100,000 to construct one-room housing units and latrines. These funds were released in four instalments against construction milestones. The project team
NRSP 18th Annual Progress Report 2011-2012
Repair of irrigation channels under the UNDP LIFE project, DG Khan, Punjab
17
provided the design for participants and technical support; participants were able to further build upon the design as per their preferences.
International Charity for Catholic Migration (ICMC), Rajanpur , July 2011 – November 2011250 flood affected families were provided with Rs.100,000 to construct a one-room housing unit and latrine. They were also provided with multipurpose hand pumps and tree saplings. Participants built upon these constructions adding designs, shelving and more ventilation.
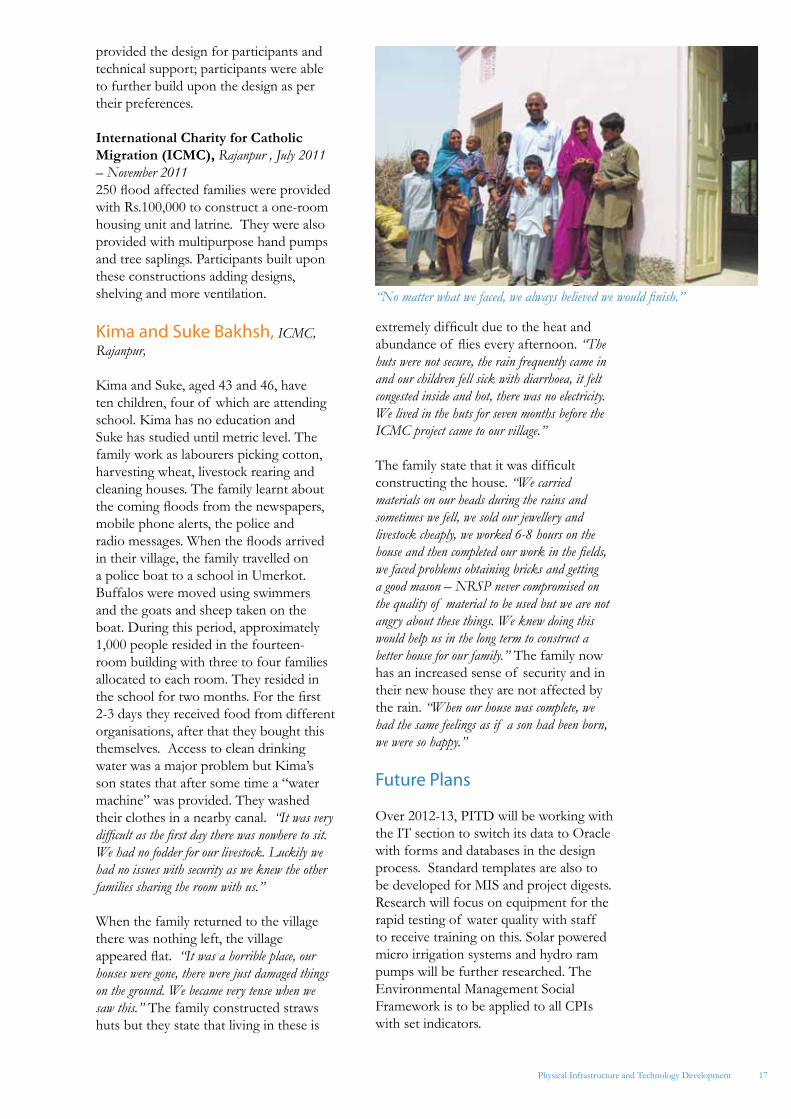
Kima and Suke Bakhsh, ICMC, Rajanpur,
Kima and Suke, aged 43 and 46, have ten children, four of which are attending school. Kima has no education and Suke has studied until metric level. The family work as labourers picking cotton, harvesting wheat, livestock rearing and cleaning houses. The family learnt about the coming floods from the newspapers, mobile phone alerts, the police and radio messages. When the floods arrived in their village, the family travelled on a police boat to a school in Umerkot. Buffalos were moved using swimmers and the goats and sheep taken on the boat. During this period, approximately 1,000 people resided in the fourteen-room building with three to four families allocated to each room. They resided in the school for two months. For the first 2-3 days they received food from different organisations, after that they bought this themselves. Access to clean drinking water was a major problem but Kima’s son states that after some time a “water machine” was provided. They washed their clothes in a nearby canal. “It was very difficult as the first day there was nowhere to sit. We had no fodder for our livestock. Luckily we had no issues with security as we knew the other families sharing the room with us.”
When the family returned to the village there was nothing left, the village appeared flat. “It was a horrible place, our houses were gone, there were just damaged things on the ground. We became very tense when we saw this.” The family constructed straws huts but they state that living in these is
extremely difficult due to the heat and abundance of flies every afternoon. “The huts were not secure, the rain frequently came in and our children fell sick with diarrhoea, it felt congested inside and hot, there was no electricity. We lived in the huts for seven months before the ICMC project came to our village.”
The family state that it was difficult constructing the house. “We carried materials on our heads during the rains and sometimes we fell, we sold our jewellery and livestock cheaply, we worked 6-8 hours on the house and then completed our work in the fields, we faced problems obtaining bricks and getting a good mason – NRSP never compromised on the quality of material to be used but we are not angry about these things. We knew doing this would help us in the long term to construct a better house for our family.” The family now has an increased sense of security and in their new house they are not affected by the rain. “When our house was complete, we had the same feelings as if a son had been born, we were so happy.”
Future Plans
Over 2012-13, PITD will be working with the IT section to switch its data to Oracle with forms and databases in the design process. Standard templates are also to be developed for MIS and project digests. Research will focus on equipment for the rapid testing of water quality with staff to receive training on this. Solar powered micro irrigation systems and hydro ram pumps will be further researched. The Environmental Management Social Framework is to be applied to all CPIs with set indicators.
Physical Infrastructure and Technology Development
“No matter what we faced, we always believed we would finish.”
18
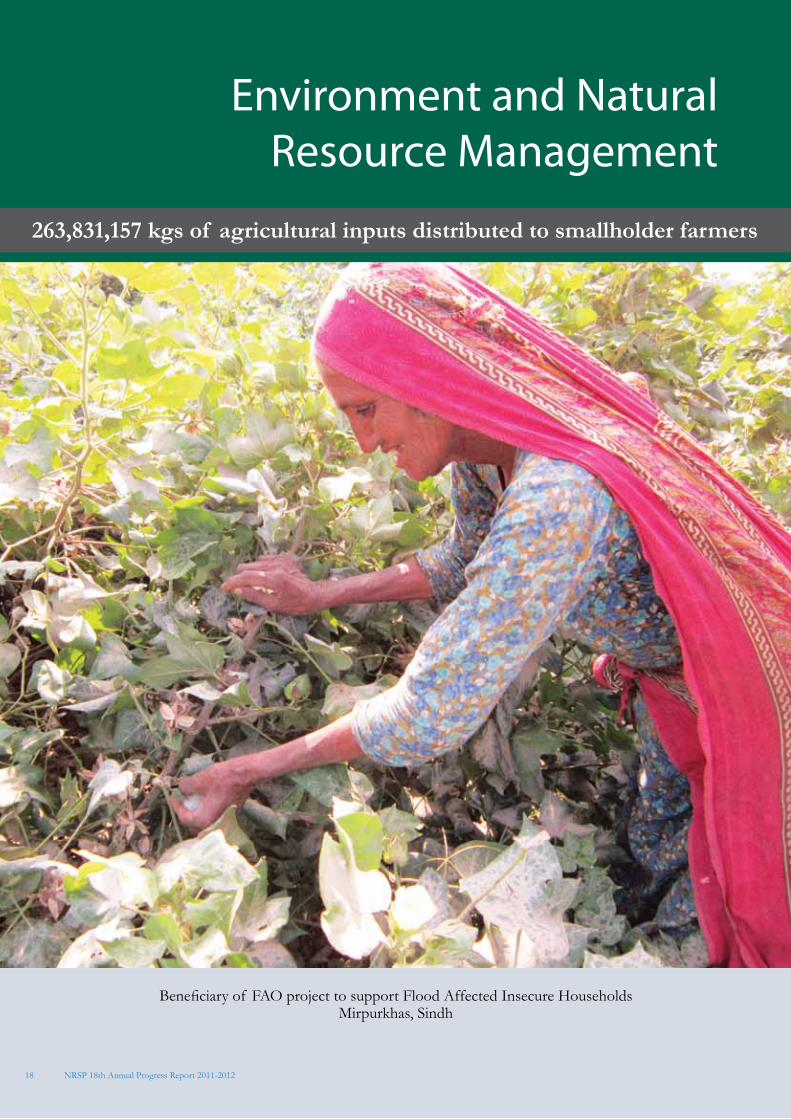
Environment and Natural Resource Management
263,831,157 kgs of agricultural inputs distributed to smallholder farmers
Beneficiary of FAO project to support Flood Affected Insecure HouseholdsMirpurkhas, Sindh
NRSP 18th Annual Progress Report 2011-2012
19Environment and Natural Resource Management
Biogas: Research Study
In August 2011, the NRSP MER conducted a research study into the design, functioning and usage of its biogas plants. These 197 plants have been installed for up to 8 years in Rawalpindi, Rahim Yar Khan and Khushab. A sample of 51% was taken. The objectives of the NRSP program are to reduce: dependency on wood for cooking, household expenditure on fuel, the workload of women and the incidence of respiratory conditions.
The study found that 51% of plants are still functioning (including 100% of those owned by women). The plants are meeting 61-100% of energy requirements of 61% of plant owners, 85% of these reported a daily production of 2-6 hours of biogas in summertime. Almost all beneficiaries reported biogas as an environmentally friendly technology and to have reduced the time spent on cooking and wood collection for women.
The ENRM focuses on research and capacity building. Research is carried out into new technologies for irrigation, farming practices, pest control and renewable energy. In recent years, research has expanded into the field of climate change. Capacity building activities are conducted in partnership with government to disseminate information, best practices and research findings at the community level. Capacity is also built in accessing local markets to strengthen the bargaining power of micro entrepreneurs.
Research into Pest control and Renewable Energy
The Biological Control of Sugarcane Insect Pests, Bhakkar, Northern Punjab, August 2009 onwards: For the past three years the ENRM has been testing biological control on sugarcane crops as an alternative to pesticides. These tests are being carried out through a laboratory in Bhakkar following outbreaks of pyrilla, stem borer, root borer, and whitefly in this district. In this laboratory, predators and parasitoids are being bred to naturally control pests.
The ENRM is also raising awareness among producers of integrated pest control practices, and promoting sugarcane trash conservation for use as biological fertilisers. In 2011-12, the IPM laboratory released 20,000 coccinellid predators to control whitefly. 20,000 trichograma cards were also released covering 5,000 acres of sugarcane crops.
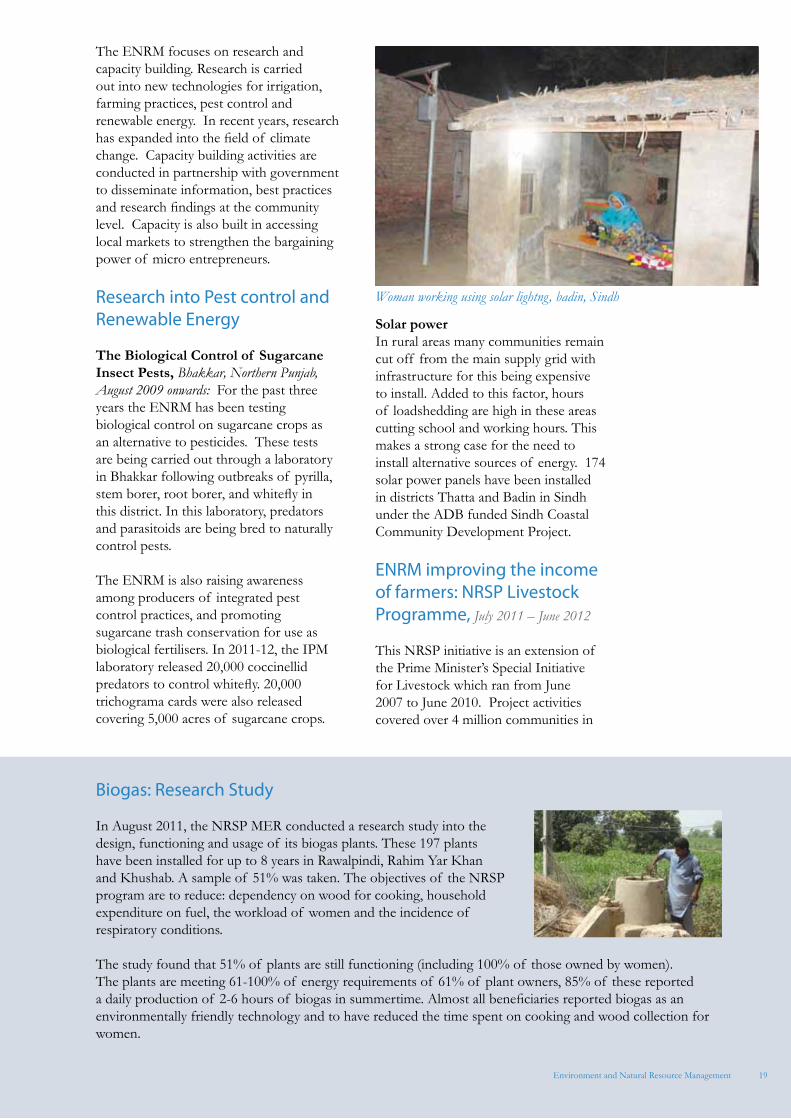
Solar powerIn rural areas many communities remain cut off from the main supply grid with infrastructure for this being expensive to install. Added to this factor, hours of loadshedding are high in these areas cutting school and working hours. This makes a strong case for the need to install alternative sources of energy. 174 solar power panels have been installed in districts Thatta and Badin in Sindh under the ADB funded Sindh Coastal Community Development Project.
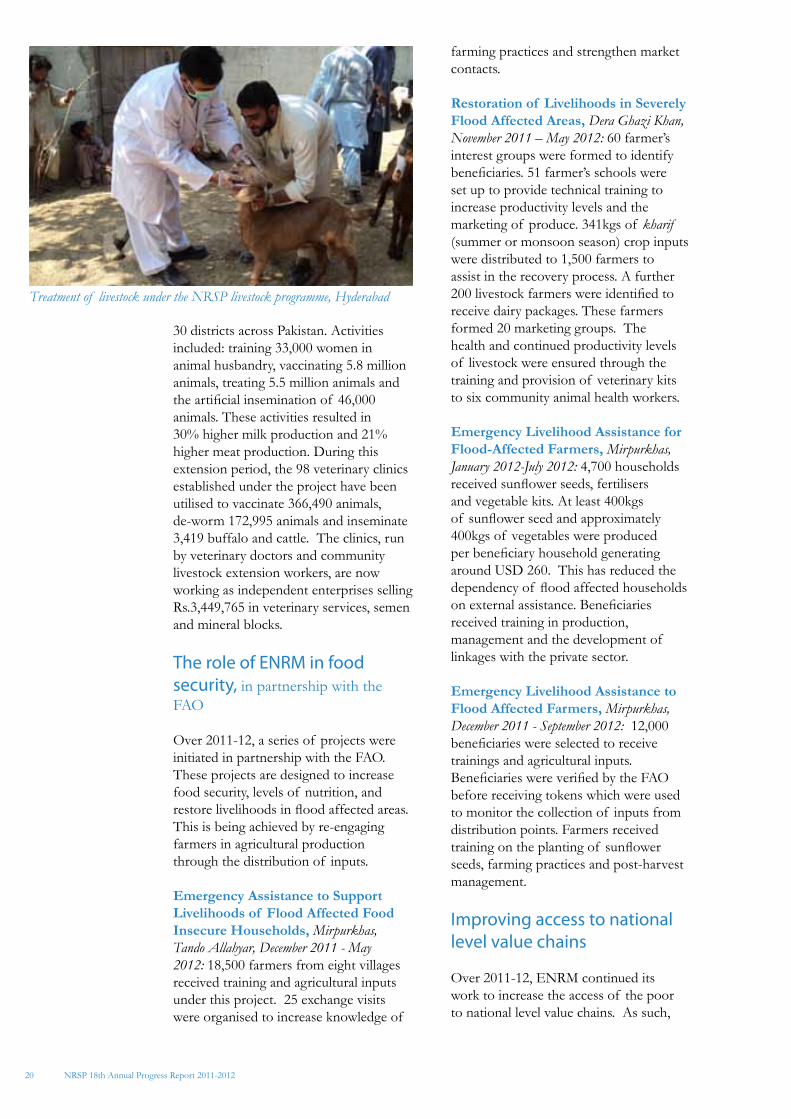
ENRM improving the income of farmers: NRSP Livestock Programme, July 2011 – June 2012
This NRSP initiative is an extension of the Prime Minister’s Special Initiative for Livestock which ran from June 2007 to June 2010. Project activities covered over 4 million communities in
Woman working using solar lightng, badin, Sindh
20
30 districts across Pakistan. Activities included: training 33,000 women in animal husbandry, vaccinating 5.8 million animals, treating 5.5 million animals and the artificial insemination of 46,000 animals. These activities resulted in 30% higher milk production and 21% higher meat production. During this extension period, the 98 veterinary clinics established under the project have been utilised to vaccinate 366,490 animals, de-worm 172,995 animals and inseminate 3,419 buffalo and cattle. The clinics, run by veterinary doctors and community livestock extension workers, are now working as independent enterprises selling Rs.3,449,765 in veterinary services, semen and mineral blocks.
The role of ENRM in food security, in partnership with the FAO
Over 2011-12, a series of projects were initiated in partnership with the FAO. These projects are designed to increase food security, levels of nutrition, and restore livelihoods in flood affected areas. This is being achieved by re-engaging farmers in agricultural production through the distribution of inputs.
Emergency Assistance to Support Livelihoods of Flood Affected Food Insecure Households, Mirpurkhas, Tando Allahyar, December 2011 - May 2012: 18,500 farmers from eight villages received training and agricultural inputs under this project. 25 exchange visits were organised to increase knowledge of
farming practices and strengthen market contacts.
Restoration of Livelihoods in Severely Flood Affected Areas, Dera Ghazi Khan, November 2011 – May 2012: 60 farmer’s interest groups were formed to identify beneficiaries. 51 farmer’s schools were set up to provide technical training to increase productivity levels and the marketing of produce. 341kgs of kharif (summer or monsoon season) crop inputs were distributed to 1,500 farmers to assist in the recovery process. A further 200 livestock farmers were identified to receive dairy packages. These farmers formed 20 marketing groups. The health and continued productivity levels of livestock were ensured through the training and provision of veterinary kits to six community animal health workers.
Emergency Livelihood Assistance for Flood-Affected Farmers, Mirpurkhas, January 2012-July 2012: 4,700 households received sunflower seeds, fertilisers and vegetable kits. At least 400kgs of sunflower seed and approximately 400kgs of vegetables were produced per beneficiary household generating around USD 260. This has reduced the dependency of flood affected households on external assistance. Beneficiaries received training in production, management and the development of linkages with the private sector.
Emergency Livelihood Assistance to Flood Affected Farmers, Mirpurkhas, December 2011 - September 2012: 12,000 beneficiaries were selected to receive trainings and agricultural inputs. Beneficiaries were verified by the FAO before receiving tokens which were used to monitor the collection of inputs from distribution points. Farmers received training on the planting of sunflower seeds, farming practices and post-harvest management.
Improving access to national level value chains
Over 2011-12, ENRM continued its work to increase the access of the poor to national level value chains. As such,
NRSP 18th Annual Progress Report 2011-2012
Treatment of livestock under the NRSP livestock programme, Hyderabad
21
a number of projects have focused on strengthening market linkages through stakeholder workshops and exposure visits, improving price awareness and product quality.
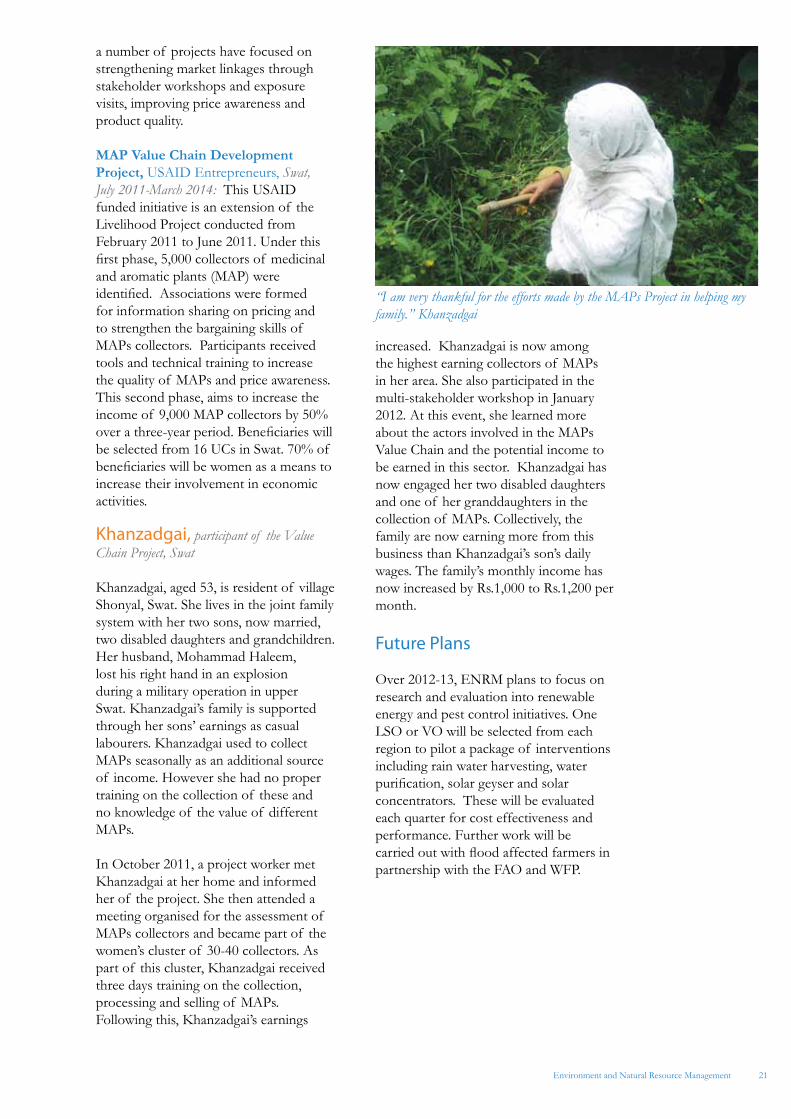
MAP Value Chain Development Project, USAID Entrepreneurs, Swat, July 2011-March 2014: This USAID funded initiative is an extension of the Livelihood Project conducted from February 2011 to June 2011. Under this first phase, 5,000 collectors of medicinal and aromatic plants (MAP) were identified. Associations were formed for information sharing on pricing and to strengthen the bargaining skills of MAPs collectors. Participants received tools and technical training to increase the quality of MAPs and price awareness. This second phase, aims to increase the income of 9,000 MAP collectors by 50% over a three-year period. Beneficiaries will be selected from 16 UCs in Swat. 70% of beneficiaries will be women as a means to increase their involvement in economic activities.
Khanzadgai, participant of the Value Chain Project, Swat
Khanzadgai, aged 53, is resident of village Shonyal, Swat. She lives in the joint family system with her two sons, now married, two disabled daughters and grandchildren. Her husband, Mohammad Haleem, lost his right hand in an explosion during a military operation in upper Swat. Khanzadgai’s family is supported through her sons’ earnings as casual labourers. Khanzadgai used to collect MAPs seasonally as an additional source of income. However she had no proper training on the collection of these and no knowledge of the value of different MAPs.
In October 2011, a project worker met Khanzadgai at her home and informed her of the project. She then attended a meeting organised for the assessment of MAPs collectors and became part of the women’s cluster of 30-40 collectors. As part of this cluster, Khanzadgai received three days training on the collection, processing and selling of MAPs. Following this, Khanzadgai’s earnings
increased. Khanzadgai is now among the highest earning collectors of MAPs in her area. She also participated in the multi-stakeholder workshop in January 2012. At this event, she learned more about the actors involved in the MAPs Value Chain and the potential income to be earned in this sector. Khanzadgai has now engaged her two disabled daughters and one of her granddaughters in the collection of MAPs. Collectively, the family are now earning more from this business than Khanzadgai’s son’s daily wages. The family’s monthly income has now increased by Rs.1,000 to Rs.1,200 per month. Future Plans
Over 2012-13, ENRM plans to focus on research and evaluation into renewable energy and pest control initiatives. One LSO or VO will be selected from each region to pilot a package of interventions including rain water harvesting, water purification, solar geyser and solar concentrators. These will be evaluated each quarter for cost effectiveness and performance. Further work will be carried out with flood affected farmers in partnership with the FAO and WFP.
Environment and Natural Resource Management
“I am very thankful for the efforts made by the MAPs Project in helping my family.” Khanzadgai
22
Social & HumanProtection Programme
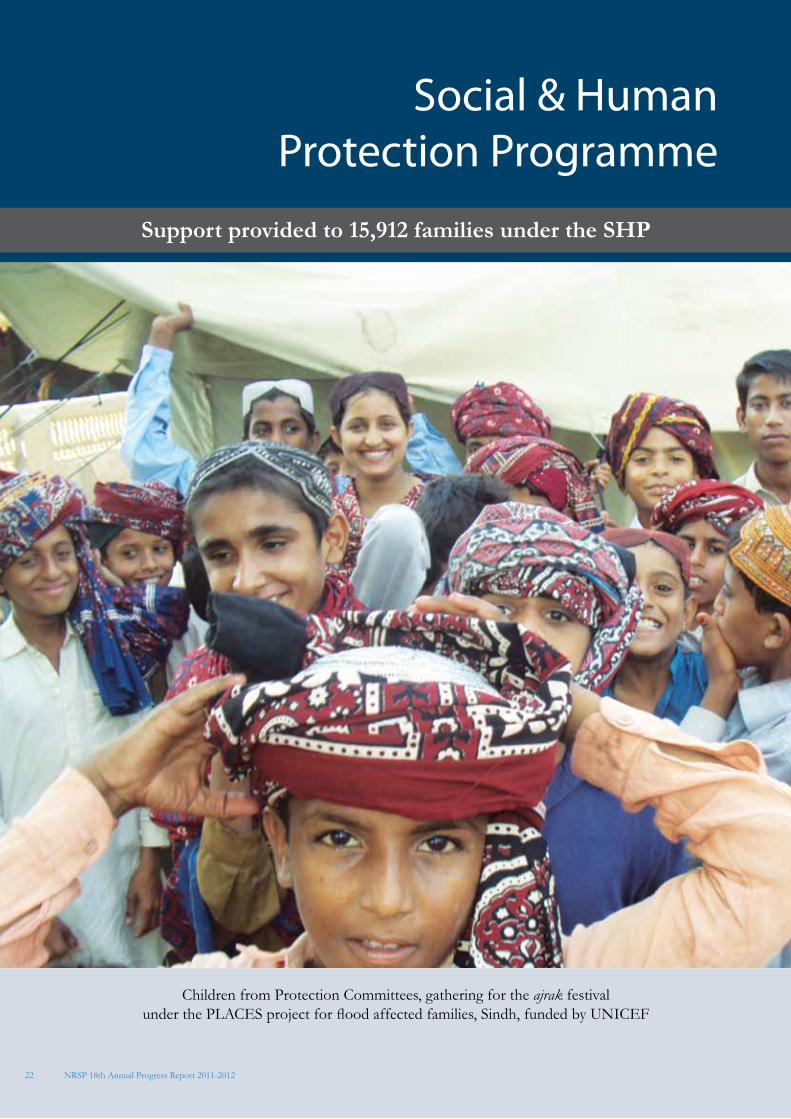
Support provided to 15,912 families under the SHP
Children from Protection Committees, gathering for the ajrak festival under the PLACES project for flood affected families, Sindh, funded by UNICEF
NRSP 18th Annual Progress Report 2011-2012
23
Micronutrient Initiative - Micronutrient International (MI) and NRSP, Khushab, Rawalakot, January 2012-March 2013
66% of children under five are suffering from an iron deficiency in Pakistan; this is concentrated among children aged 6-23 months. This significantly affects a child’s physical, psychological and cognitive development. Recent research conducted by MI has shown levels of nutrition to have worsened over the past two decades. Following a pilot with Micronutrient International, the Ministry of Health (MoH) is now integrating the provision of micronutrients with its Lady Health Worker (LHW) Programme covering 60% of the population. This initiative provides support to those that remain outside of this programme. Under this pilot project, 25,000 children aged 6-24 months will receive micronutrients (MMNPs) on an annual basis. These have been identified following a baseline survey conducted in early 2012. NRSP and MI are now seeking funding to further scale up this initiative.
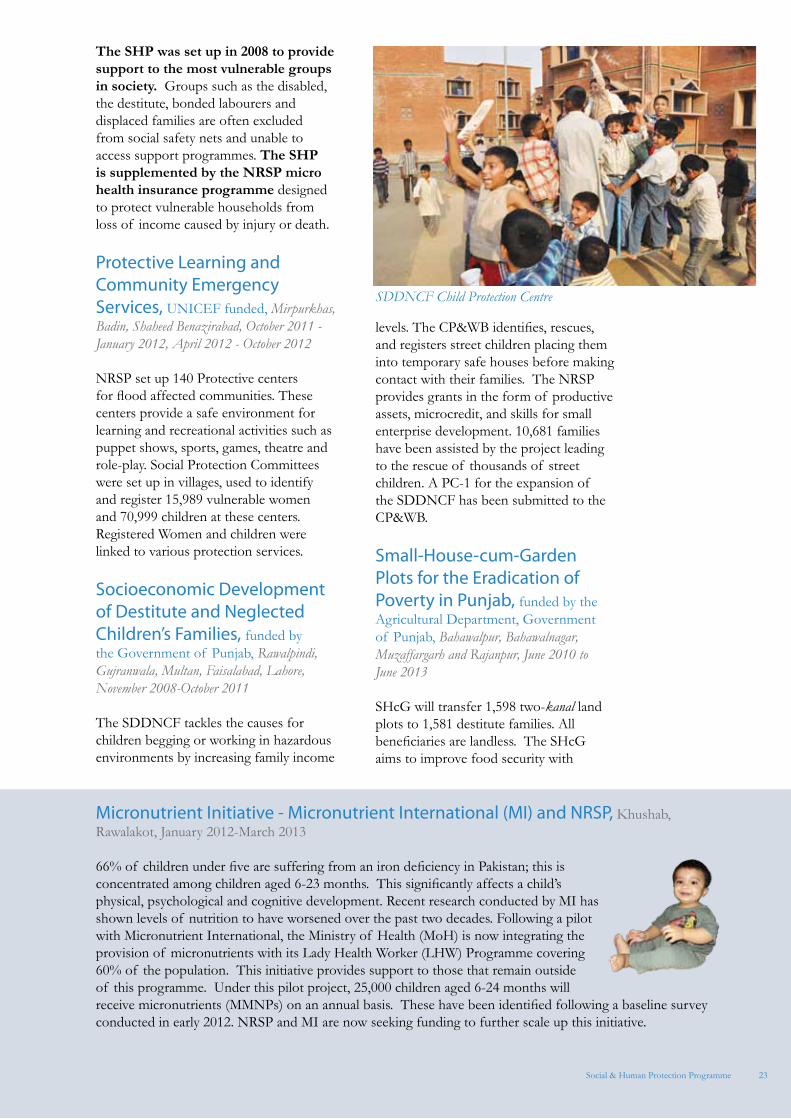
The SHP was set up in 2008 to provide support to the most vulnerable groups in society. Groups such as the disabled, the destitute, bonded labourers and displaced families are often excluded from social safety nets and unable to access support programmes. The SHP is supplemented by the NRSP micro health insurance programme designed to protect vulnerable households from loss of income caused by injury or death.
Protective Learning and Community Emergency Services, UNICEF funded, Mirpurkhas, Badin, Shaheed Benazirabad, October 2011 - January 2012, April 2012 - October 2012
NRSP set up 140 Protective centers for flood affected communities. These centers provide a safe environment for learning and recreational activities such as puppet shows, sports, games, theatre and role-play. Social Protection Committees were set up in villages, used to identify and register 15,989 vulnerable women and 70,999 children at these centers. Registered Women and children were linked to various protection services.
Socioeconomic Development of Destitute and Neglected Children’s Families, funded by the Government of Punjab, Rawalpindi, Gujranwala, Multan, Faisalabad, Lahore, November 2008-October 2011
The SDDNCF tackles the causes for children begging or working in hazardous environments by increasing family income
levels. The CP&WB identifies, rescues, and registers street children placing them into temporary safe houses before making contact with their families. The NRSP provides grants in the form of productive assets, microcredit, and skills for small enterprise development. 10,681 families have been assisted by the project leading to the rescue of thousands of street children. A PC-1 for the expansion of the SDDNCF has been submitted to the CP&WB.
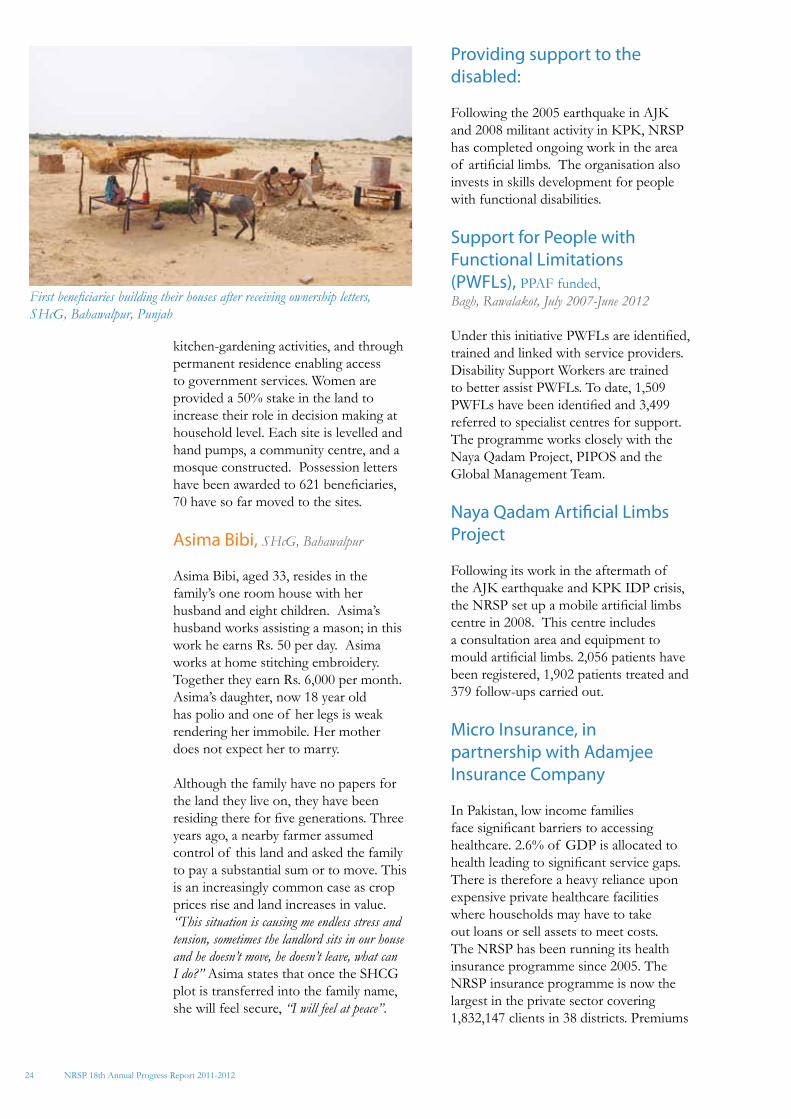
Small-House-cum-Garden Plots for the Eradication of Poverty in Punjab, funded by the Agricultural Department, Government of Punjab, Bahawalpur, Bahawalnagar, Muzaffargarh and Rajanpur, June 2010 to June 2013
SHcG will transfer 1,598 two-kanal land plots to 1,581 destitute families. All beneficiaries are landless. The SHcG aims to improve food security with
Social & Human Protection Programme
SDDNCF Child Protection Centre
24
kitchen-gardening activities, and through permanent residence enabling access to government services. Women are provided a 50% stake in the land to increase their role in decision making at household level. Each site is levelled and hand pumps, a community centre, and a mosque constructed. Possession letters have been awarded to 621 beneficiaries, 70 have so far moved to the sites.
Asima Bibi, SHcG, Bahawalpur
Asima Bibi, aged 33, resides in the family’s one room house with her husband and eight children. Asima’s husband works assisting a mason; in this work he earns Rs. 50 per day. Asima works at home stitching embroidery. Together they earn Rs. 6,000 per month. Asima’s daughter, now 18 year old has polio and one of her legs is weak rendering her immobile. Her mother does not expect her to marry.
Although the family have no papers for the land they live on, they have been residing there for five generations. Three years ago, a nearby farmer assumed control of this land and asked the family to pay a substantial sum or to move. This is an increasingly common case as crop prices rise and land increases in value. “This situation is causing me endless stress and tension, sometimes the landlord sits in our house and he doesn’t move, he doesn’t leave, what can I do?” Asima states that once the SHCG plot is transferred into the family name, she will feel secure, “I will feel at peace”.
Providing support to the disabled:
Following the 2005 earthquake in AJK and 2008 militant activity in KPK, NRSP has completed ongoing work in the area of artificial limbs. The organisation also invests in skills development for people with functional disabilities.
Support for People with Functional Limitations (PWFLs), PPAF funded, Bagh, Rawalakot, July 2007-June 2012
Under this initiative PWFLs are identified, trained and linked with service providers. Disability Support Workers are trained to better assist PWFLs. To date, 1,509 PWFLs have been identified and 3,499 referred to specialist centres for support. The programme works closely with the Naya Qadam Project, PIPOS and the Global Management Team.
Naya Qadam Artificial Limbs Project
Following its work in the aftermath of the AJK earthquake and KPK IDP crisis, the NRSP set up a mobile artificial limbs centre in 2008. This centre includes a consultation area and equipment to mould artificial limbs. 2,056 patients have been registered, 1,902 patients treated and 379 follow-ups carried out.
Micro Insurance, in partnership with Adamjee Insurance Company
In Pakistan, low income families face significant barriers to accessing healthcare. 2.6% of GDP is allocated to health leading to significant service gaps. There is therefore a heavy reliance upon expensive private healthcare facilities where households may have to take out loans or sell assets to meet costs. The NRSP has been running its health insurance programme since 2005. The NRSP insurance programme is now the largest in the private sector covering 1,832,147 clients in 38 districts. Premiums
NRSP 18th Annual Progress Report 2011-2012
First beneficiaries building their houses after receiving ownership letters,SHcG, Bahawalpur, Punjab
25
Figure 10: Breakdown of claims by category
of Rs.100 per annum are collected from clients covering claims of up to Rs.15,000. All claims are processed and managed by Adamjee Insurance Company.
Coverage is at present for client and spouse. Product options include:
• Hospitalisation cover: inpatient hospitalisation/ day care expenses due to childbirth, illness or accidental injury.
• Maternal cover: Pregnancy/ childbirth
• Life and credit cover: funeral expenses are paid, compensation is provided on accidental death or for permanent injury and the outstanding loan amount is paid.
Micro Health Insurance and Maternal Health
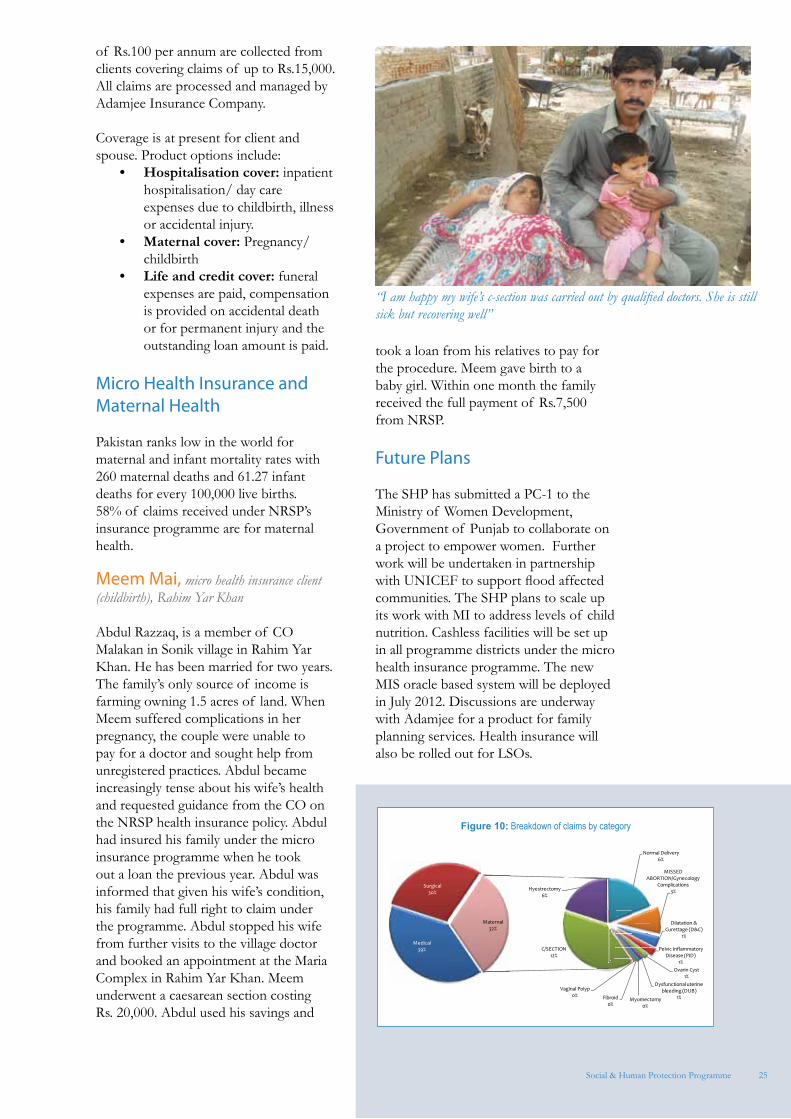
Pakistan ranks low in the world for maternal and infant mortality rates with 260 maternal deaths and 61.27 infant deaths for every 100,000 live births. 58% of claims received under NRSP’s insurance programme are for maternal health. Meem Mai, micro health insurance client (childbirth), Rahim Yar Khan
Abdul Razzaq, is a member of CO Malakan in Sonik village in Rahim Yar Khan. He has been married for two years. The family’s only source of income is farming owning 1.5 acres of land. When Meem suffered complications in her pregnancy, the couple were unable to pay for a doctor and sought help from unregistered practices. Abdul became increasingly tense about his wife’s health and requested guidance from the CO on the NRSP health insurance policy. Abdul had insured his family under the micro insurance programme when he took out a loan the previous year. Abdul was informed that given his wife’s condition, his family had full right to claim under the programme. Abdul stopped his wife from further visits to the village doctor and booked an appointment at the Maria Complex in Rahim Yar Khan. Meem underwent a caesarean section costing Rs. 20,000. Abdul used his savings and
took a loan from his relatives to pay for the procedure. Meem gave birth to a baby girl. Within one month the family received the full payment of Rs.7,500 from NRSP.
Future Plans
The SHP has submitted a PC-1 to the Ministry of Women Development, Government of Punjab to collaborate on a project to empower women. Further work will be undertaken in partnership with UNICEF to support flood affected communities. The SHP plans to scale up its work with MI to address levels of child nutrition. Cashless facilities will be set up in all programme districts under the micro health insurance programme. The new MIS oracle based system will be deployed in July 2012. Discussions are underway with Adamjee for a product for family planning services. Health insurance will also be rolled out for LSOs.
Social & Human Protection Programme
“I am happy my wife’s c-section was carried out by qualified doctors. She is still sick but recovering well”
26
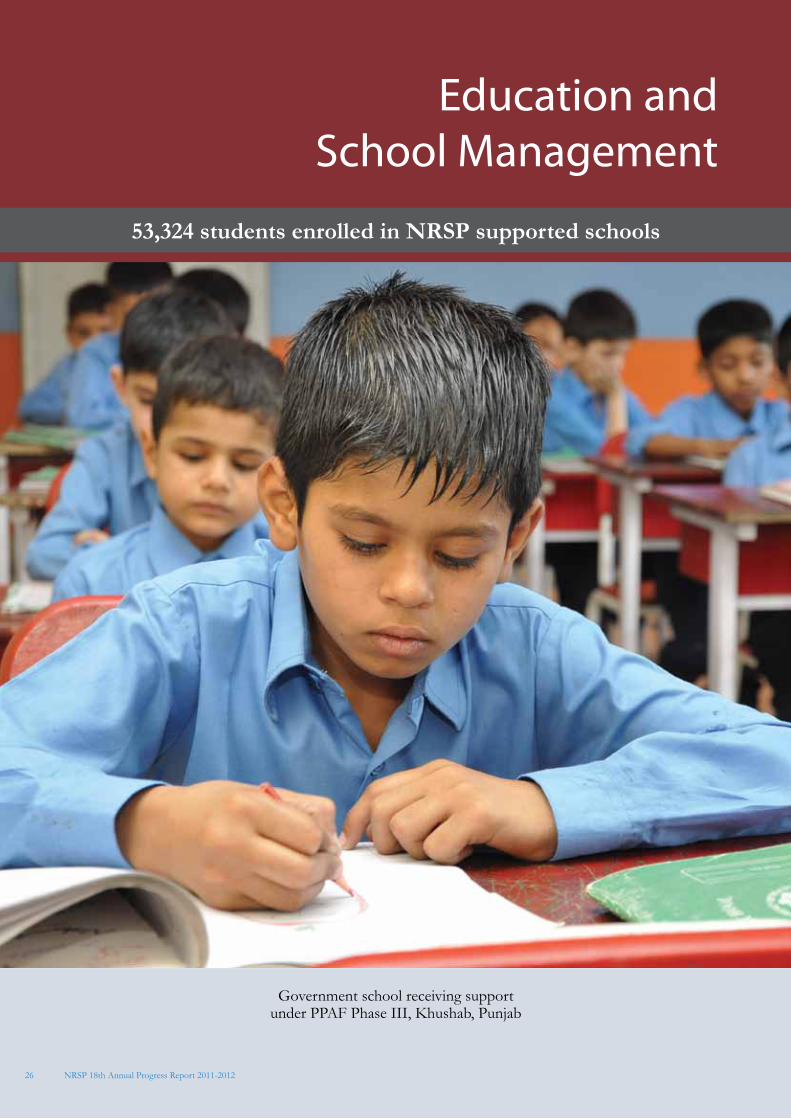
Education and School Management
53,324 students enrolled in NRSP supported schools
Government school receiving supportunder PPAF Phase III, Khushab, Punjab
NRSP 18th Annual Progress Report 2011-2012
27Education and School Management
ESM works to increase access to quality education in rural areas of Pakistan. ESM achieves this through the provision of support to government and community schools in the way of materials, infrastructural improvements or teacher training. School Councils and Parent Committees are also set up to better manage educational resources and as a means to increase levels of enrolment. ESM actively seeks to increase the enrolment of girls in schools.
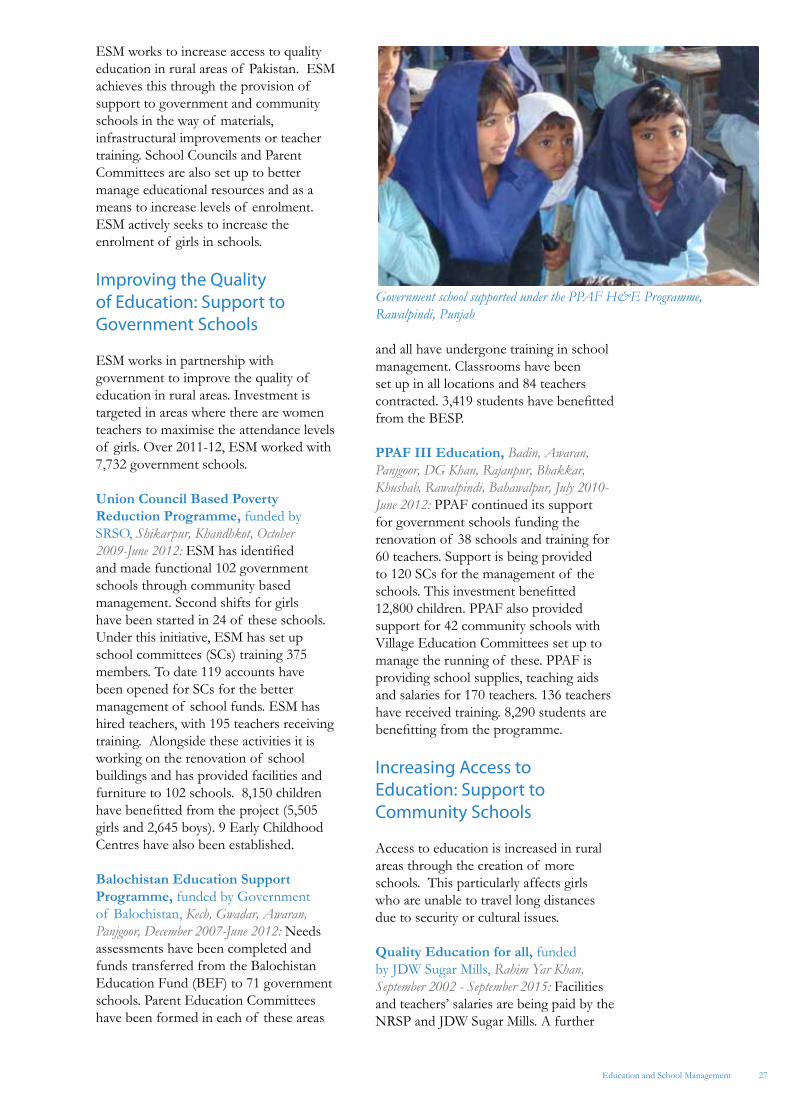
Improving the Quality of Education: Support to Government Schools
ESM works in partnership with government to improve the quality of education in rural areas. Investment is targeted in areas where there are women teachers to maximise the attendance levels of girls. Over 2011-12, ESM worked with 7,732 government schools.
Union Council Based Poverty Reduction Programme, funded by SRSO, Shikarpur, Khandhkot, October 2009-June 2012: ESM has identified and made functional 102 government schools through community based management. Second shifts for girls have been started in 24 of these schools. Under this initiative, ESM has set up school committees (SCs) training 375 members. To date 119 accounts have been opened for SCs for the better management of school funds. ESM has hired teachers, with 195 teachers receiving training. Alongside these activities it is working on the renovation of school buildings and has provided facilities and furniture to 102 schools. 8,150 children have benefitted from the project (5,505 girls and 2,645 boys). 9 Early Childhood Centres have also been established.
Balochistan Education Support Programme, funded by Government of Balochistan, Kech, Gwadar, Awaran, Panjgoor, December 2007-June 2012: Needs assessments have been completed and funds transferred from the Balochistan Education Fund (BEF) to 71 government schools. Parent Education Committees have been formed in each of these areas
and all have undergone training in school management. Classrooms have been set up in all locations and 84 teachers contracted. 3,419 students have benefitted from the BESP.
PPAF III Education, Badin, Awaran, Panjgoor, DG Khan, Rajanpur, Bhakkar, Khushab, Rawalpindi, Bahawalpur, July 2010-June 2012: PPAF continued its support for government schools funding the renovation of 38 schools and training for 60 teachers. Support is being provided to 120 SCs for the management of the schools. This investment benefitted 12,800 children. PPAF also provided support for 42 community schools with Village Education Committees set up to manage the running of these. PPAF is providing school supplies, teaching aids and salaries for 170 teachers. 136 teachers have received training. 8,290 students are benefitting from the programme.
Increasing Access to Education: Support to Community Schools
Access to education is increased in rural areas through the creation of more schools. This particularly affects girls who are unable to travel long distances due to security or cultural issues.
Quality Education for all, funded by JDW Sugar Mills, Rahim Yar Khan, September 2002 - September 2015: Facilities and teachers’ salaries are being paid by the NRSP and JDW Sugar Mills. A further
Government school supported under the PPAF H&E Programme, Rawalpindi, Punjab
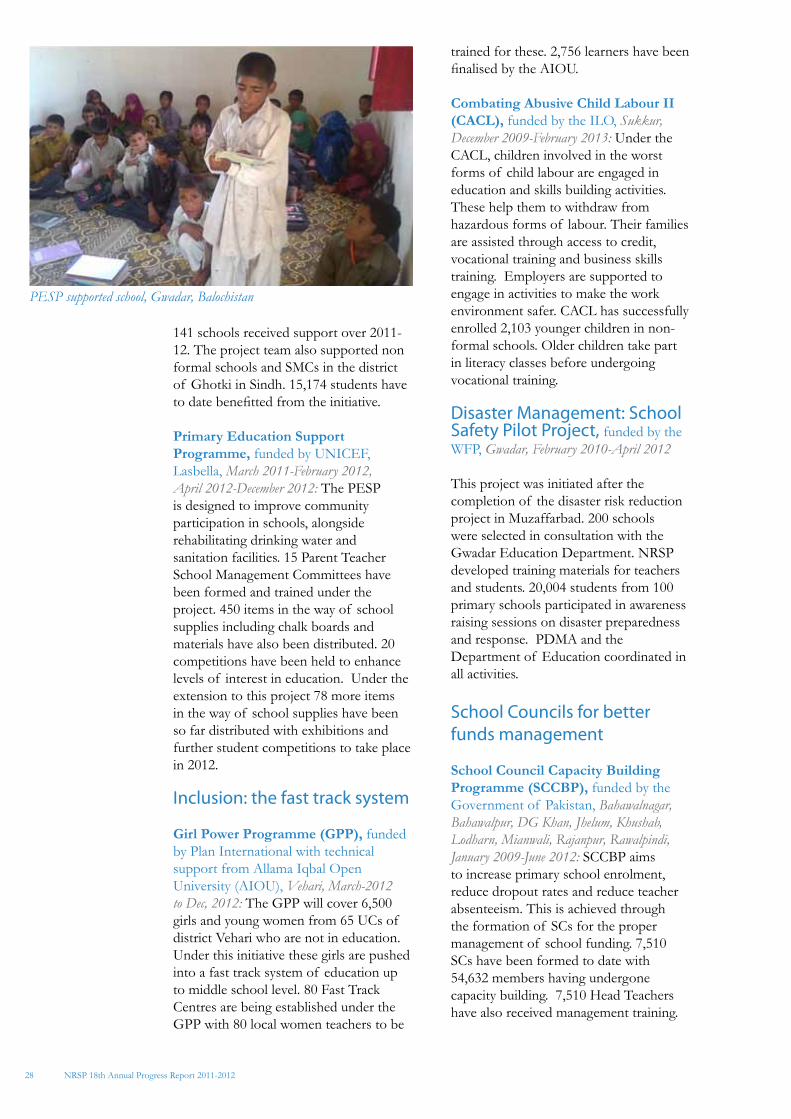
28
141 schools received support over 2011-12. The project team also supported non formal schools and SMCs in the district of Ghotki in Sindh. 15,174 students have to date benefitted from the initiative.
Primary Education Support Programme, funded by UNICEF, Lasbella, March 2011-February 2012, April 2012-December 2012: The PESP is designed to improve community participation in schools, alongside rehabilitating drinking water and sanitation facilities. 15 Parent Teacher School Management Committees have been formed and trained under the project. 450 items in the way of school supplies including chalk boards and materials have also been distributed. 20 competitions have been held to enhance levels of interest in education. Under the extension to this project 78 more items in the way of school supplies have been so far distributed with exhibitions and further student competitions to take place in 2012.
Inclusion: the fast track system
Girl Power Programme (GPP), funded by Plan International with technical support from Allama Iqbal Open University (AIOU), Vehari, March-2012 to Dec, 2012: The GPP will cover 6,500 girls and young women from 65 UCs of district Vehari who are not in education. Under this initiative these girls are pushed into a fast track system of education up to middle school level. 80 Fast Track Centres are being established under the GPP with 80 local women teachers to be
trained for these. 2,756 learners have been finalised by the AIOU.
Combating Abusive Child Labour II (CACL), funded by the ILO, Sukkur, December 2009-February 2013: Under the CACL, children involved in the worst forms of child labour are engaged in education and skills building activities. These help them to withdraw from hazardous forms of labour. Their families are assisted through access to credit, vocational training and business skills training. Employers are supported to engage in activities to make the work environment safer. CACL has successfully enrolled 2,103 younger children in non-formal schools. Older children take part in literacy classes before undergoing vocational training.
Disaster Management: School Safety Pilot Project, funded by the WFP, Gwadar, February 2010-April 2012
This project was initiated after the completion of the disaster risk reduction project in Muzaffarbad. 200 schools were selected in consultation with the Gwadar Education Department. NRSP developed training materials for teachers and students. 20,004 students from 100 primary schools participated in awareness raising sessions on disaster preparedness and response. PDMA and the Department of Education coordinated in all activities.
School Councils for better funds management
School Council Capacity Building Programme (SCCBP), funded by the Government of Pakistan, Bahawalnagar, Bahawalpur, DG Khan, Jhelum, Khushab, Lodharn, Mianwali, Rajanpur, Rawalpindi, January 2009-June 2012: SCCBP aims to increase primary school enrolment, reduce dropout rates and reduce teacher absenteeism. This is achieved through the formation of SCs for the proper management of school funding. 7,510 SCs have been formed to date with 54,632 members having undergone capacity building. 7,510 Head Teachers have also received management training.
NRSP 18th Annual Progress Report 2011-2012
PESP supported school, Gwadar, Balochistan
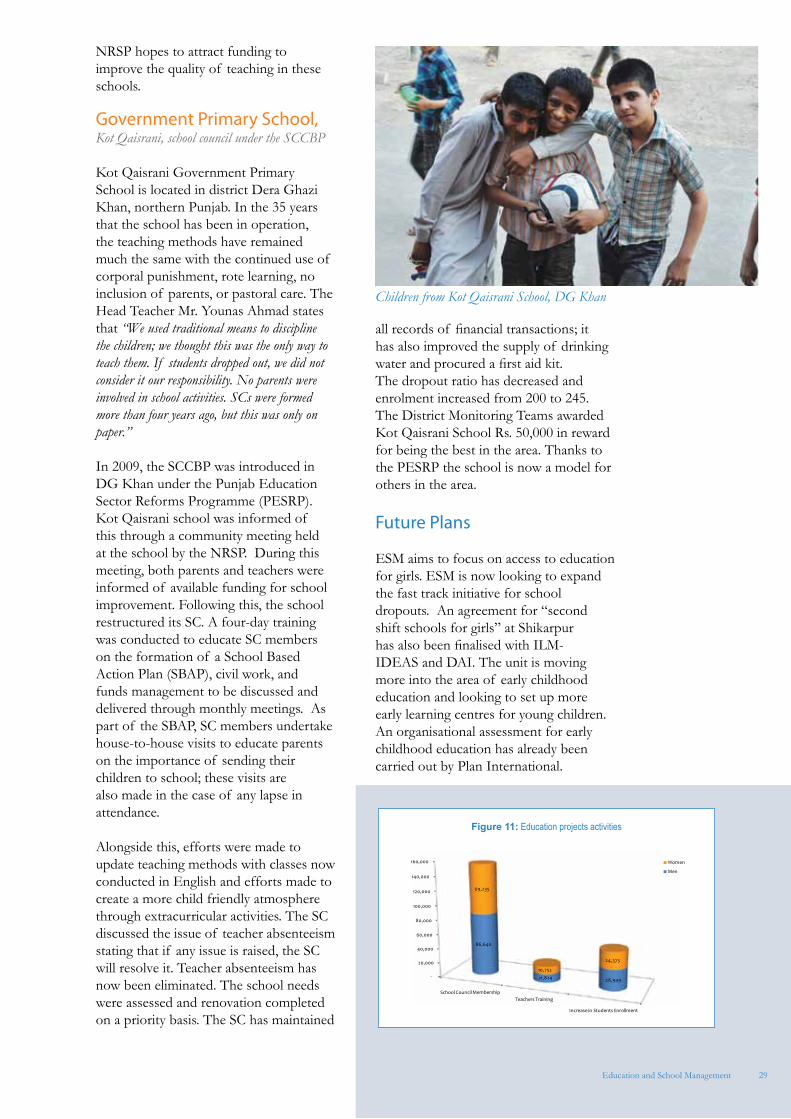
29
NRSP hopes to attract funding to improve the quality of teaching in these schools.
Government Primary School, Kot Qaisrani, school council under the SCCBP
Kot Qaisrani Government Primary School is located in district Dera Ghazi Khan, northern Punjab. In the 35 years that the school has been in operation, the teaching methods have remained much the same with the continued use of corporal punishment, rote learning, no inclusion of parents, or pastoral care. The Head Teacher Mr. Younas Ahmad states that “We used traditional means to discipline the children; we thought this was the only way to teach them. If students dropped out, we did not consider it our responsibility. No parents were involved in school activities. SCs were formed more than four years ago, but this was only on paper.”
In 2009, the SCCBP was introduced in DG Khan under the Punjab Education Sector Reforms Programme (PESRP). Kot Qaisrani school was informed of this through a community meeting held at the school by the NRSP. During this meeting, both parents and teachers were informed of available funding for school improvement. Following this, the school restructured its SC. A four-day training was conducted to educate SC members on the formation of a School Based Action Plan (SBAP), civil work, and funds management to be discussed and delivered through monthly meetings. As part of the SBAP, SC members undertake house-to-house visits to educate parents on the importance of sending their children to school; these visits are also made in the case of any lapse in attendance.
Alongside this, efforts were made to update teaching methods with classes now conducted in English and efforts made to create a more child friendly atmosphere through extracurricular activities. The SC discussed the issue of teacher absenteeism stating that if any issue is raised, the SC will resolve it. Teacher absenteeism has now been eliminated. The school needs were assessed and renovation completed on a priority basis. The SC has maintained
all records of financial transactions; it has also improved the supply of drinking water and procured a first aid kit.The dropout ratio has decreased and enrolment increased from 200 to 245. The District Monitoring Teams awarded Kot Qaisrani School Rs. 50,000 in reward for being the best in the area. Thanks to the PESRP the school is now a model for others in the area.
Future Plans
ESM aims to focus on access to education for girls. ESM is now looking to expand the fast track initiative for school dropouts. An agreement for “second shift schools for girls” at Shikarpur has also been finalised with ILM-IDEAS and DAI. The unit is moving more into the area of early childhood education and looking to set up more early learning centres for young children. An organisational assessment for early childhood education has already been carried out by Plan International.
Education and School Management
Children from Kot Qaisrani School, DG Khan
Figure 11: Education projects activities
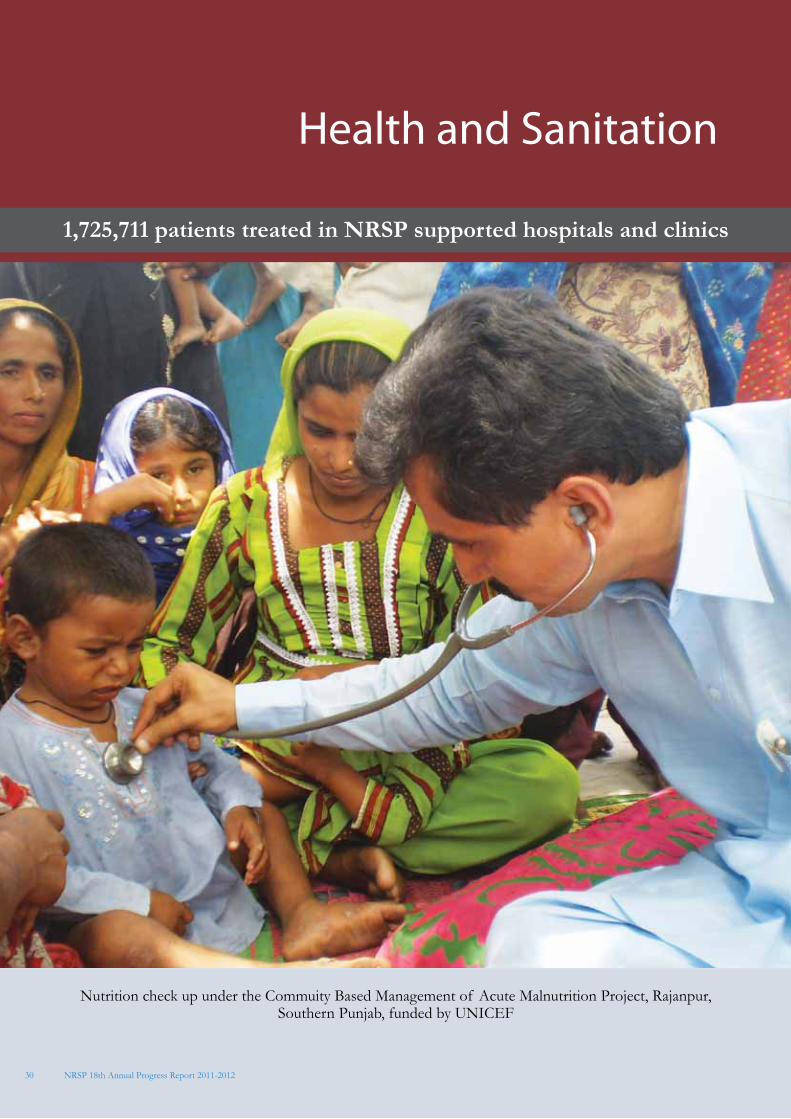
30
1,725,711 patients treated in NRSP supported hospitals and clinics
Nutrition check up under the Commuity Based Management of Acute Malnutrition Project, Rajanpur, Southern Punjab, funded by UNICEF
Health and Sanitation
NRSP 18th Annual Progress Report 2011-2012
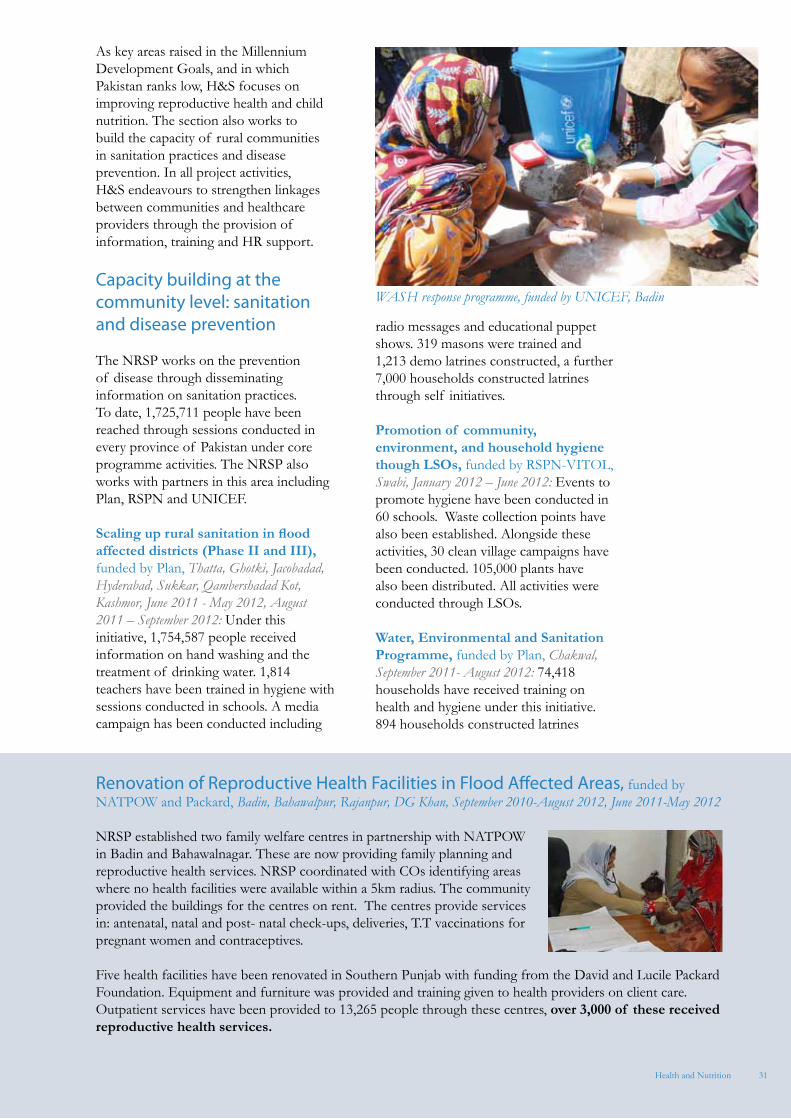
31
Renovation of Reproductive Health Facilities in Flood Affected Areas, funded by NATPOW and Packard, Badin, Bahawalpur, Rajanpur, DG Khan, September 2010-August 2012, June 2011-May 2012
NRSP established two family welfare centres in partnership with NATPOW in Badin and Bahawalnagar. These are now providing family planning and reproductive health services. NRSP coordinated with COs identifying areas where no health facilities were available within a 5km radius. The community provided the buildings for the centres on rent. The centres provide services in: antenatal, natal and post- natal check-ups, deliveries, T.T vaccinations for pregnant women and contraceptives.
Five health facilities have been renovated in Southern Punjab with funding from the David and Lucile Packard Foundation. Equipment and furniture was provided and training given to health providers on client care. Outpatient services have been provided to 13,265 people through these centres, over 3,000 of these received reproductive health services.
Health and Nutrition
As key areas raised in the Millennium Development Goals, and in which Pakistan ranks low, H&S focuses on improving reproductive health and child nutrition. The section also works to build the capacity of rural communities in sanitation practices and disease prevention. In all project activities, H&S endeavours to strengthen linkages between communities and healthcare providers through the provision of information, training and HR support.
Capacity building at the community level: sanitation and disease prevention
The NRSP works on the prevention of disease through disseminating information on sanitation practices. To date, 1,725,711 people have been reached through sessions conducted in every province of Pakistan under core programme activities. The NRSP also works with partners in this area including Plan, RSPN and UNICEF.
Scaling up rural sanitation in flood affected districts (Phase II and III), funded by Plan, Thatta, Ghotki, Jacobadad, Hyderabad, Sukkar, Qambershadad Kot, Kashmor, June 2011 - May 2012, August 2011 – September 2012: Under this initiative, 1,754,587 people received information on hand washing and the treatment of drinking water. 1,814 teachers have been trained in hygiene with sessions conducted in schools. A media campaign has been conducted including
radio messages and educational puppet shows. 319 masons were trained and 1,213 demo latrines constructed, a further 7,000 households constructed latrines through self initiatives.
Promotion of community, environment, and household hygiene though LSOs, funded by RSPN-VITOL, Swabi, January 2012 – June 2012: Events to promote hygiene have been conducted in 60 schools. Waste collection points have also been established. Alongside these activities, 30 clean village campaigns have been conducted. 105,000 plants have also been distributed. All activities were conducted through LSOs.
Water, Environmental and Sanitation Programme, funded by Plan, Chakwal, September 2011- August 2012: 74,418 households have received training on health and hygiene under this initiative. 894 households constructed latrines
WASH response programme, funded by UNICEF, Badin
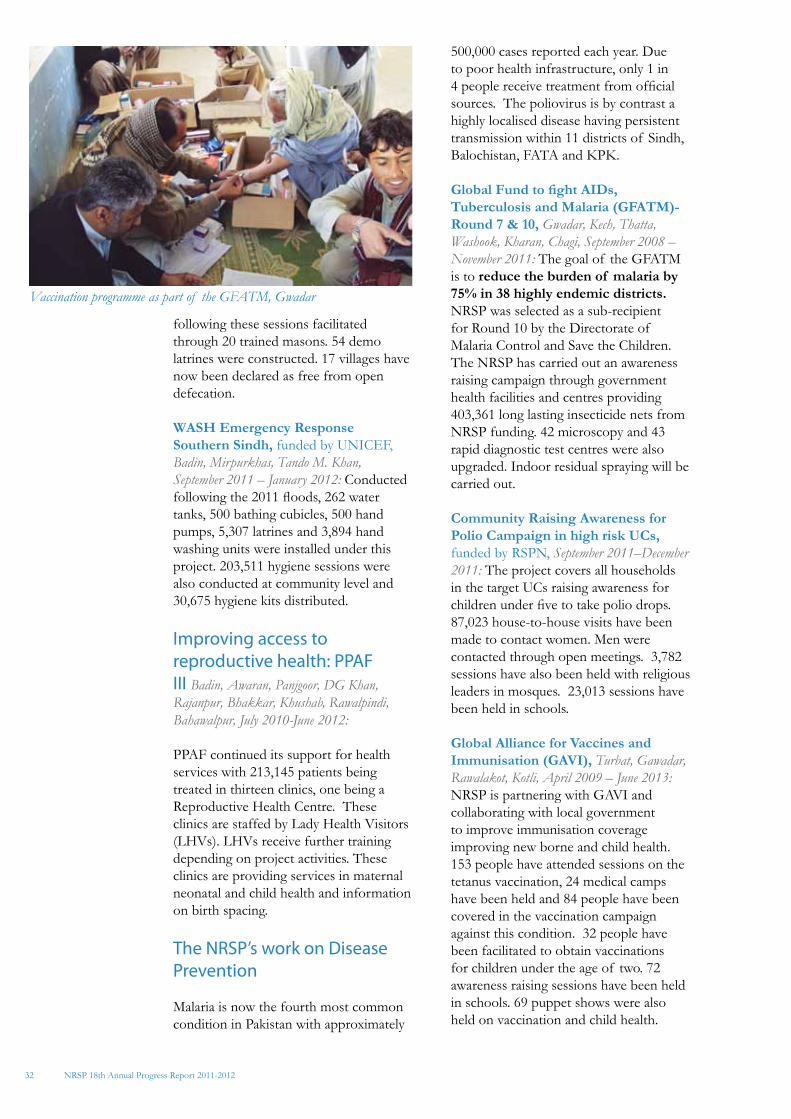
32
following these sessions facilitated through 20 trained masons. 54 demo latrines were constructed. 17 villages have now been declared as free from open defecation.
WASH Emergency Response Southern Sindh, funded by UNICEF, Badin, Mirpurkhas, Tando M. Khan, September 2011 – January 2012: Conducted following the 2011 floods, 262 water tanks, 500 bathing cubicles, 500 hand pumps, 5,307 latrines and 3,894 hand washing units were installed under this project. 203,511 hygiene sessions were also conducted at community level and 30,675 hygiene kits distributed.
Improving access to reproductive health: PPAF III Badin, Awaran, Panjgoor, DG Khan, Rajanpur, Bhakkar, Khushab, Rawalpindi, Bahawalpur, July 2010-June 2012:
PPAF continued its support for health services with 213,145 patients being treated in thirteen clinics, one being a Reproductive Health Centre. These clinics are staffed by Lady Health Visitors (LHVs). LHVs receive further training depending on project activities. These clinics are providing services in maternal neonatal and child health and information on birth spacing.
The NRSP’s work on Disease Prevention
Malaria is now the fourth most common condition in Pakistan with approximately
500,000 cases reported each year. Due to poor health infrastructure, only 1 in 4 people receive treatment from official sources. The poliovirus is by contrast a highly localised disease having persistent transmission within 11 districts of Sindh, Balochistan, FATA and KPK.
Global Fund to fight AIDs, Tuberculosis and Malaria (GFATM)- Round 7 & 10, Gwadar, Kech, Thatta, Washook, Kharan, Chagi, September 2008 – November 2011: The goal of the GFATM is to reduce the burden of malaria by 75% in 38 highly endemic districts. NRSP was selected as a sub-recipient for Round 10 by the Directorate of Malaria Control and Save the Children. The NRSP has carried out an awareness raising campaign through government health facilities and centres providing 403,361 long lasting insecticide nets from NRSP funding. 42 microscopy and 43 rapid diagnostic test centres were also upgraded. Indoor residual spraying will be carried out.
Community Raising Awareness for Polio Campaign in high risk UCs, funded by RSPN, September 2011–December 2011: The project covers all households in the target UCs raising awareness for children under five to take polio drops. 87,023 house-to-house visits have been made to contact women. Men were contacted through open meetings. 3,782 sessions have also been held with religious leaders in mosques. 23,013 sessions have been held in schools.
Global Alliance for Vaccines and Immunisation (GAVI), Turbat, Gawadar, Rawalakot, Kotli, April 2009 – June 2013: NRSP is partnering with GAVI and collaborating with local government to improve immunisation coverage improving new borne and child health. 153 people have attended sessions on the tetanus vaccination, 24 medical camps have been held and 84 people have been covered in the vaccination campaign against this condition. 32 people have been facilitated to obtain vaccinations for children under the age of two. 72 awareness raising sessions have been held in schools. 69 puppet shows were also held on vaccination and child health.
NRSP 18th Annual Progress Report 2011-2012
Vaccination programme as part of the GFATM, Gwadar
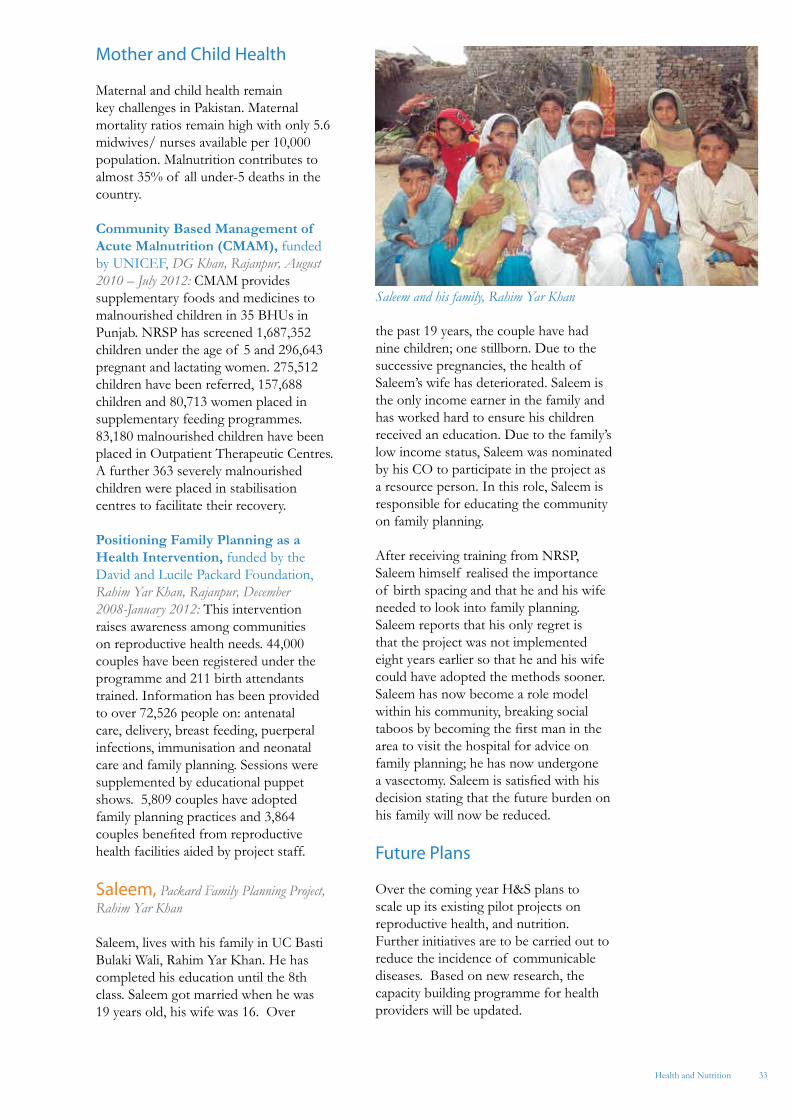
33
Mother and Child Health
Maternal and child health remain key challenges in Pakistan. Maternal mortality ratios remain high with only 5.6 midwives/ nurses available per 10,000 population. Malnutrition contributes to almost 35% of all under-5 deaths in the country.
Community Based Management of Acute Malnutrition (CMAM), funded by UNICEF, DG Khan, Rajanpur, August 2010 – July 2012: CMAM provides supplementary foods and medicines to malnourished children in 35 BHUs in Punjab. NRSP has screened 1,687,352 children under the age of 5 and 296,643 pregnant and lactating women. 275,512 children have been referred, 157,688 children and 80,713 women placed in supplementary feeding programmes. 83,180 malnourished children have been placed in Outpatient Therapeutic Centres. A further 363 severely malnourished children were placed in stabilisation centres to facilitate their recovery.
Positioning Family Planning as a Health Intervention, funded by the David and Lucile Packard Foundation, Rahim Yar Khan, Rajanpur, December 2008-January 2012: This intervention raises awareness among communities on reproductive health needs. 44,000 couples have been registered under the programme and 211 birth attendants trained. Information has been provided to over 72,526 people on: antenatal care, delivery, breast feeding, puerperal infections, immunisation and neonatal care and family planning. Sessions were supplemented by educational puppet shows. 5,809 couples have adopted family planning practices and 3,864 couples benefited from reproductive health facilities aided by project staff.
Saleem, Packard Family Planning Project, Rahim Yar Khan
Saleem, lives with his family in UC Basti Bulaki Wali, Rahim Yar Khan. He has completed his education until the 8th class. Saleem got married when he was 19 years old, his wife was 16. Over
the past 19 years, the couple have had nine children; one stillborn. Due to the successive pregnancies, the health of Saleem’s wife has deteriorated. Saleem is the only income earner in the family and has worked hard to ensure his children received an education. Due to the family’s low income status, Saleem was nominated by his CO to participate in the project as a resource person. In this role, Saleem is responsible for educating the community on family planning.
After receiving training from NRSP, Saleem himself realised the importance of birth spacing and that he and his wife needed to look into family planning. Saleem reports that his only regret is that the project was not implemented eight years earlier so that he and his wife could have adopted the methods sooner. Saleem has now become a role model within his community, breaking social taboos by becoming the first man in the area to visit the hospital for advice on family planning; he has now undergone a vasectomy. Saleem is satisfied with his decision stating that the future burden on his family will now be reduced.
Future Plans
Over the coming year H&S plans to scale up its existing pilot projects on reproductive health, and nutrition. Further initiatives are to be carried out to reduce the incidence of communicable diseases. Based on new research, the capacity building programme for health providers will be updated.
Health and Nutrition
Saleem and his family, Rahim Yar Khan
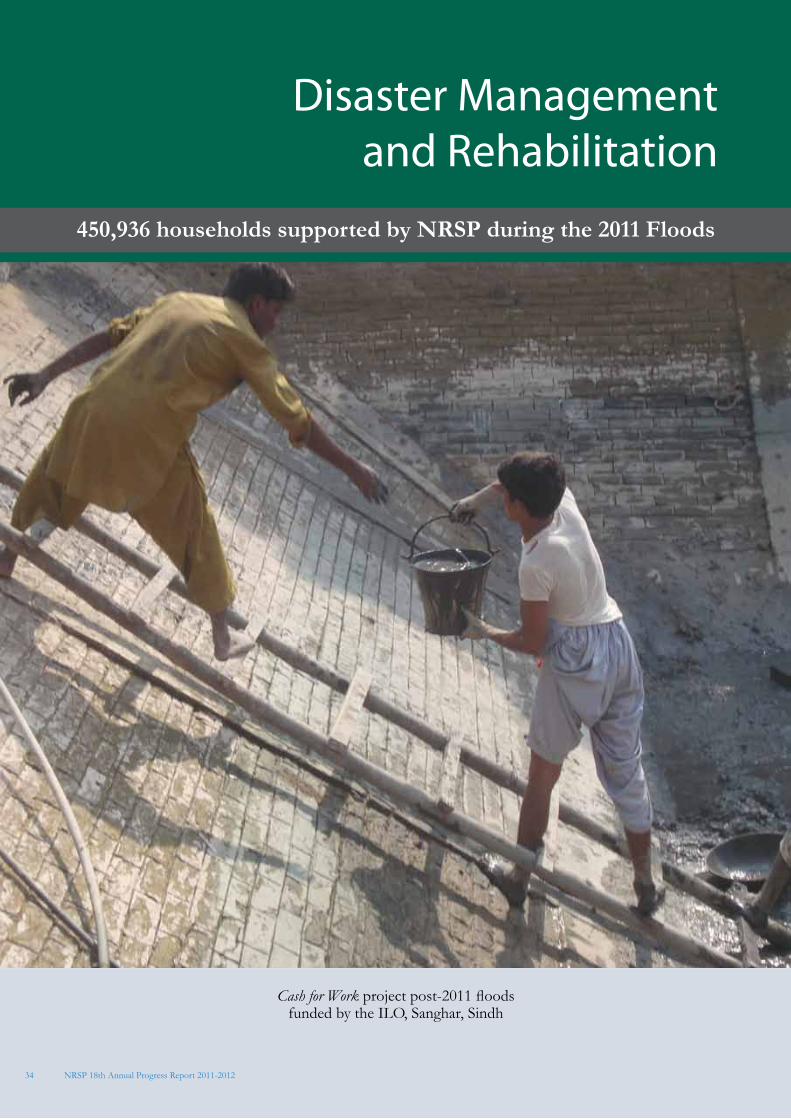
34
450,936 households supported by NRSP during the 2011 Floods
Cash for Work project post-2011 floodsfunded by the ILO, Sanghar, Sindh
Disaster Managementand Rehabilitation
NRSP 18th Annual Progress Report 2011-2012
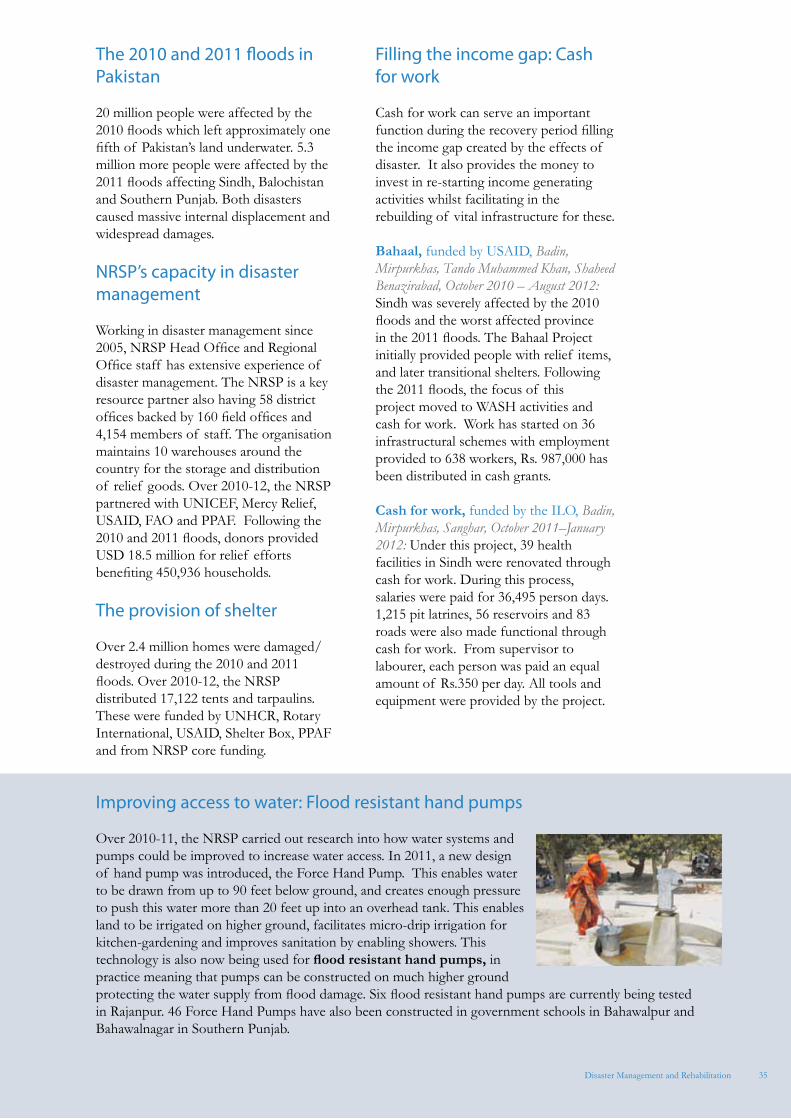
35
Improving access to water: Flood resistant hand pumps
Over 2010-11, the NRSP carried out research into how water systems and pumps could be improved to increase water access. In 2011, a new design of hand pump was introduced, the Force Hand Pump. This enables water to be drawn from up to 90 feet below ground, and creates enough pressure to push this water more than 20 feet up into an overhead tank. This enables land to be irrigated on higher ground, facilitates micro-drip irrigation for kitchen-gardening and improves sanitation by enabling showers. This technology is also now being used for flood resistant hand pumps, in practice meaning that pumps can be constructed on much higher ground protecting the water supply from flood damage. Six flood resistant hand pumps are currently being tested in Rajanpur. 46 Force Hand Pumps have also been constructed in government schools in Bahawalpur and Bahawalnagar in Southern Punjab.
Disaster Management and Rehabilitation
The 2010 and 2011 floods in Pakistan
20 million people were affected by the 2010 floods which left approximately one fifth of Pakistan’s land underwater. 5.3 million more people were affected by the 2011 floods affecting Sindh, Balochistan and Southern Punjab. Both disasters caused massive internal displacement and widespread damages.
NRSP’s capacity in disaster management
Working in disaster management since 2005, NRSP Head Office and Regional Office staff has extensive experience of disaster management. The NRSP is a key resource partner also having 58 district offices backed by 160 field offices and 4,154 members of staff. The organisation maintains 10 warehouses around the country for the storage and distribution of relief goods. Over 2010-12, the NRSP partnered with UNICEF, Mercy Relief, USAID, FAO and PPAF. Following the 2010 and 2011 floods, donors provided USD 18.5 million for relief efforts benefiting 450,936 households.
The provision of shelter
Over 2.4 million homes were damaged/ destroyed during the 2010 and 2011 floods. Over 2010-12, the NRSP distributed 17,122 tents and tarpaulins. These were funded by UNHCR, Rotary International, USAID, Shelter Box, PPAF and from NRSP core funding.
Filling the income gap: Cash for work
Cash for work can serve an important function during the recovery period filling the income gap created by the effects of disaster. It also provides the money to invest in re-starting income generating activities whilst facilitating in the rebuilding of vital infrastructure for these.
Bahaal, funded by USAID, Badin, Mirpurkhas, Tando Muhammed Khan, Shaheed Benazirabad, October 2010 – August 2012: Sindh was severely affected by the 2010 floods and the worst affected province in the 2011 floods. The Bahaal Project initially provided people with relief items, and later transitional shelters. Following the 2011 floods, the focus of this project moved to WASH activities and cash for work. Work has started on 36 infrastructural schemes with employment provided to 638 workers, Rs. 987,000 has been distributed in cash grants.
Cash for work, funded by the ILO, Badin, Mirpurkhas, Sanghar, October 2011–January 2012: Under this project, 39 health facilities in Sindh were renovated through cash for work. During this process, salaries were paid for 36,495 person days. 1,215 pit latrines, 56 reservoirs and 83 roads were also made functional through cash for work. From supervisor to labourer, each person was paid an equal amount of Rs.350 per day. All tools and equipment were provided by the project.
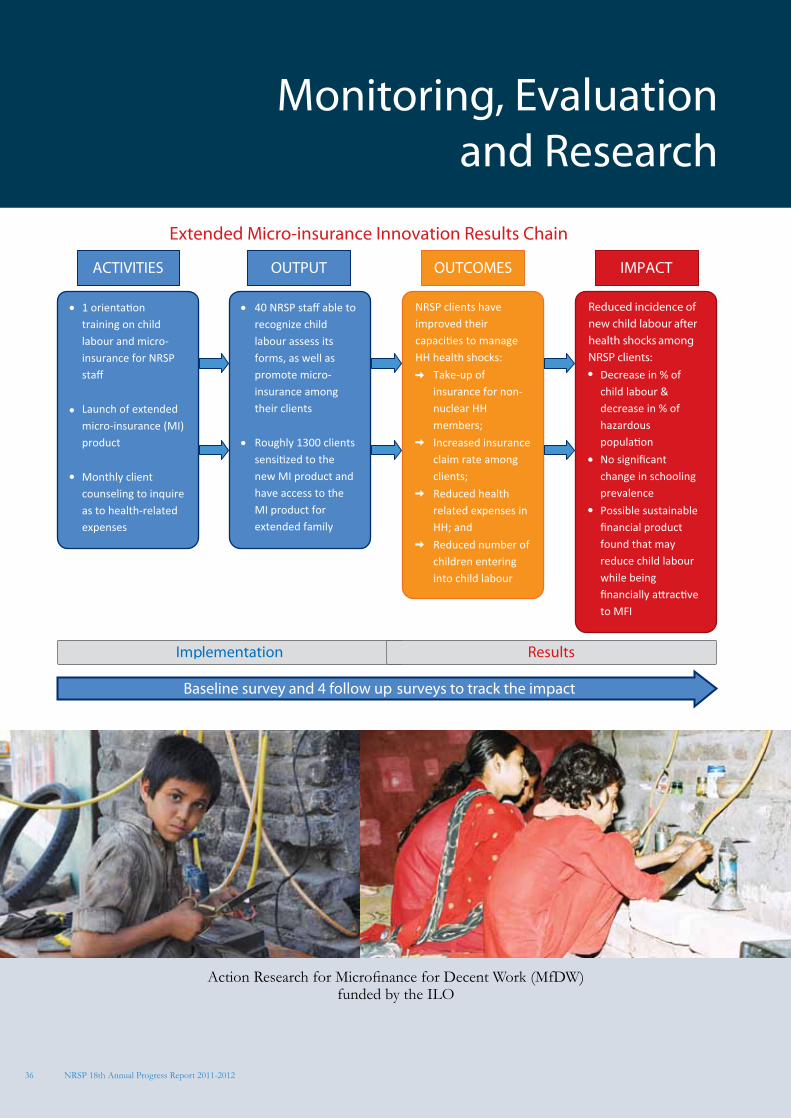
36
Action Research for Microfinance for Decent Work (MfDW)funded by the ILO
Monitoring, Evaluationand Research
NRSP 18th Annual Progress Report 2011-2012
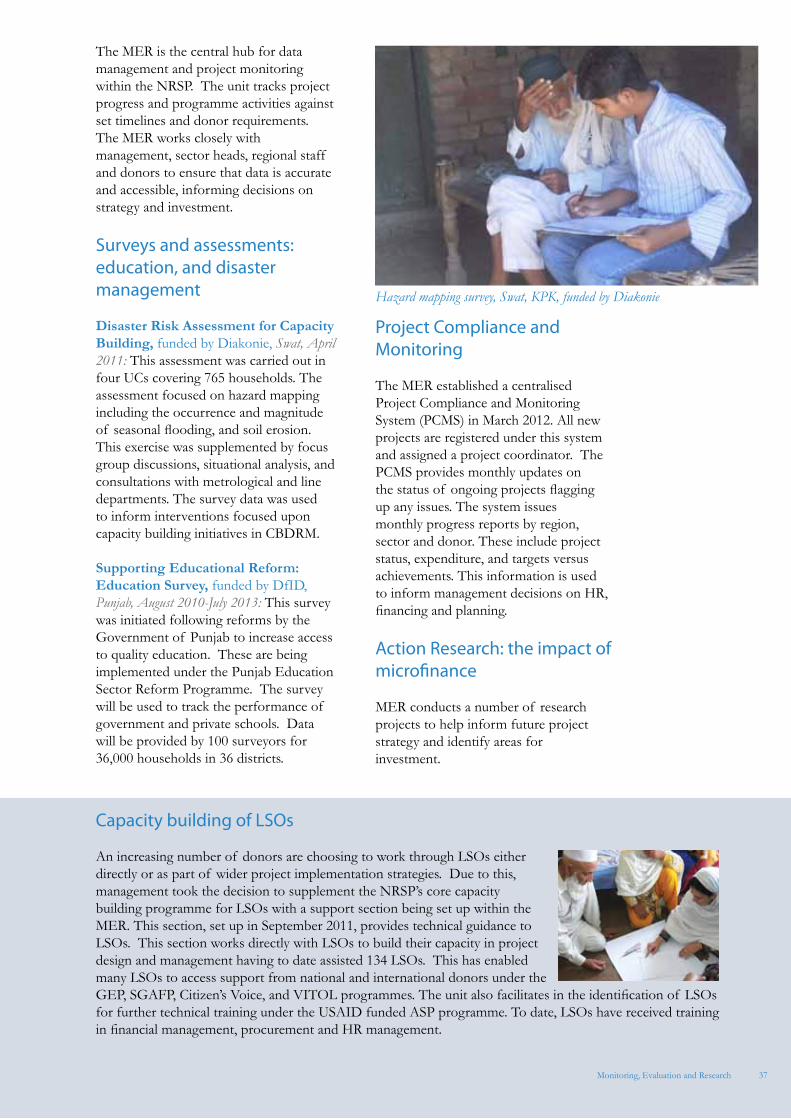
37
Capacity building of LSOs
An increasing number of donors are choosing to work through LSOs either directly or as part of wider project implementation strategies. Due to this, management took the decision to supplement the NRSP’s core capacity building programme for LSOs with a support section being set up within the MER. This section, set up in September 2011, provides technical guidance to LSOs. This section works directly with LSOs to build their capacity in project design and management having to date assisted 134 LSOs. This has enabled many LSOs to access support from national and international donors under the GEP, SGAFP, Citizen’s Voice, and VITOL programmes. The unit also facilitates in the identification of LSOs for further technical training under the USAID funded ASP programme. To date, LSOs have received training in financial management, procurement and HR management.
Monitoring, Evaluation and Research
The MER is the central hub for data management and project monitoring within the NRSP. The unit tracks project progress and programme activities against set timelines and donor requirements. The MER works closely with management, sector heads, regional staff and donors to ensure that data is accurate and accessible, informing decisions on strategy and investment.
Surveys and assessments: education, and disaster management
Disaster Risk Assessment for Capacity Building, funded by Diakonie, Swat, April 2011: This assessment was carried out in four UCs covering 765 households. The assessment focused on hazard mapping including the occurrence and magnitude of seasonal flooding, and soil erosion. This exercise was supplemented by focus group discussions, situational analysis, and consultations with metrological and line departments. The survey data was used to inform interventions focused upon capacity building initiatives in CBDRM.
Supporting Educational Reform: Education Survey, funded by DfID, Punjab, August 2010-July 2013: This survey was initiated following reforms by the Government of Punjab to increase access to quality education. These are being implemented under the Punjab Education Sector Reform Programme. The survey will be used to track the performance of government and private schools. Data will be provided by 100 surveyors for 36,000 households in 36 districts.
Project Compliance and Monitoring
The MER established a centralised Project Compliance and Monitoring System (PCMS) in March 2012. All new projects are registered under this system and assigned a project coordinator. The PCMS provides monthly updates on the status of ongoing projects flagging up any issues. The system issues monthly progress reports by region, sector and donor. These include project status, expenditure, and targets versus achievements. This information is used to inform management decisions on HR, financing and planning.
Action Research: the impact of microfinance
MER conducts a number of research projects to help inform future project strategy and identify areas for investment.
Hazard mapping survey, Swat, KPK, funded by Diakonie
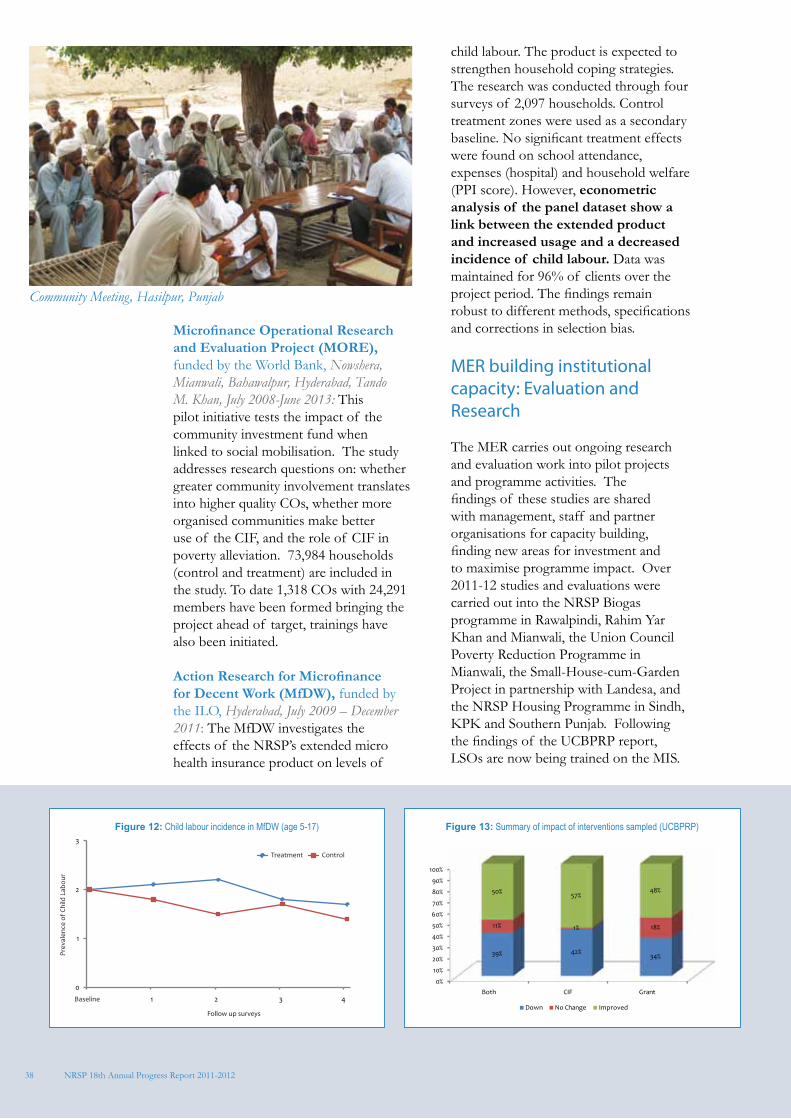
38
Figure 12: Child labour incidence in MfDW (age 5-17) Figure 13: Summary of impact of interventions sampled (UCBPRP)
Microfinance Operational Research and Evaluation Project (MORE), funded by the World Bank, Nowshera, Mianwali, Bahawalpur, Hyderabad, Tando M. Khan, July 2008-June 2013: This pilot initiative tests the impact of the community investment fund when linked to social mobilisation. The study addresses research questions on: whether greater community involvement translates into higher quality COs, whether more organised communities make better use of the CIF, and the role of CIF in poverty alleviation. 73,984 households (control and treatment) are included in the study. To date 1,318 COs with 24,291 members have been formed bringing the project ahead of target, trainings have also been initiated.
Action Research for Microfinance for Decent Work (MfDW), funded by the ILO, Hyderabad, July 2009 – December 2011: The MfDW investigates the effects of the NRSP’s extended micro health insurance product on levels of
child labour. The product is expected to strengthen household coping strategies. The research was conducted through four surveys of 2,097 households. Control treatment zones were used as a secondary baseline. No significant treatment effects were found on school attendance, expenses (hospital) and household welfare (PPI score). However, econometric analysis of the panel dataset show a link between the extended product and increased usage and a decreased incidence of child labour. Data was maintained for 96% of clients over the project period. The findings remain robust to different methods, specifications and corrections in selection bias.
MER building institutional capacity: Evaluation and Research
The MER carries out ongoing research and evaluation work into pilot projects and programme activities. The findings of these studies are shared with management, staff and partner organisations for capacity building, finding new areas for investment and to maximise programme impact. Over 2011-12 studies and evaluations were carried out into the NRSP Biogas programme in Rawalpindi, Rahim Yar Khan and Mianwali, the Union Council Poverty Reduction Programme in Mianwali, the Small-House-cum-Garden Project in partnership with Landesa, and the NRSP Housing Programme in Sindh, KPK and Southern Punjab. Following the findings of the UCBPRP report, LSOs are now being trained on the MIS.
NRSP 18th Annual Progress Report 2011-2012
Community Meeting, Hasilpur, Punjab
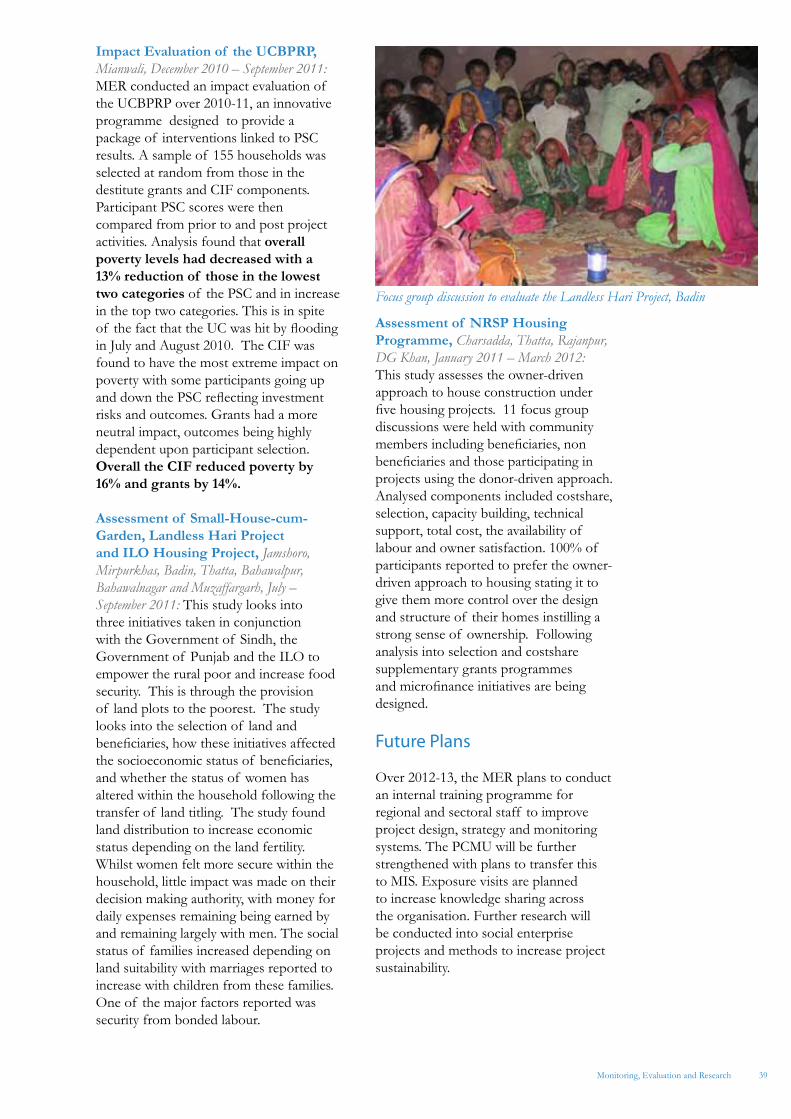
39
Impact Evaluation of the UCBPRP, Mianwali, December 2010 – September 2011: MER conducted an impact evaluation of the UCBPRP over 2010-11, an innovative programme designed to provide a package of interventions linked to PSC results. A sample of 155 households was selected at random from those in the destitute grants and CIF components. Participant PSC scores were then compared from prior to and post project activities. Analysis found that overall poverty levels had decreased with a 13% reduction of those in the lowest two categories of the PSC and in increase in the top two categories. This is in spite of the fact that the UC was hit by flooding in July and August 2010. The CIF was found to have the most extreme impact on poverty with some participants going up and down the PSC reflecting investment risks and outcomes. Grants had a more neutral impact, outcomes being highly dependent upon participant selection. Overall the CIF reduced poverty by 16% and grants by 14%.
Assessment of Small-House-cum-Garden, Landless Hari Project and ILO Housing Project, Jamshoro, Mirpurkhas, Badin, Thatta, Bahawalpur, Bahawalnagar and Muzaffargarh, July – September 2011: This study looks into three initiatives taken in conjunction with the Government of Sindh, the Government of Punjab and the ILO to empower the rural poor and increase food security. This is through the provision of land plots to the poorest. The study looks into the selection of land and beneficiaries, how these initiatives affected the socioeconomic status of beneficiaries, and whether the status of women has altered within the household following the transfer of land titling. The study found land distribution to increase economic status depending on the land fertility. Whilst women felt more secure within the household, little impact was made on their decision making authority, with money for daily expenses remaining being earned by and remaining largely with men. The social status of families increased depending on land suitability with marriages reported to increase with children from these families. One of the major factors reported was security from bonded labour.
Assessment of NRSP Housing Programme, Charsadda, Thatta, Rajanpur, DG Khan, January 2011 – March 2012: This study assesses the owner-driven approach to house construction under five housing projects. 11 focus group discussions were held with community members including beneficiaries, non beneficiaries and those participating in projects using the donor-driven approach. Analysed components included costshare, selection, capacity building, technical support, total cost, the availability of labour and owner satisfaction. 100% of participants reported to prefer the owner-driven approach to housing stating it to give them more control over the design and structure of their homes instilling a strong sense of ownership. Following analysis into selection and costshare supplementary grants programmes and microfinance initiatives are being designed.
Future Plans
Over 2012-13, the MER plans to conduct an internal training programme for regional and sectoral staff to improve project design, strategy and monitoring systems. The PCMU will be further strengthened with plans to transfer this to MIS. Exposure visits are planned to increase knowledge sharing across the organisation. Further research will be conducted into social enterprise projects and methods to increase project sustainability.
Monitoring, Evaluation and Research
Focus group discussion to evaluate the Landless Hari Project, Badin
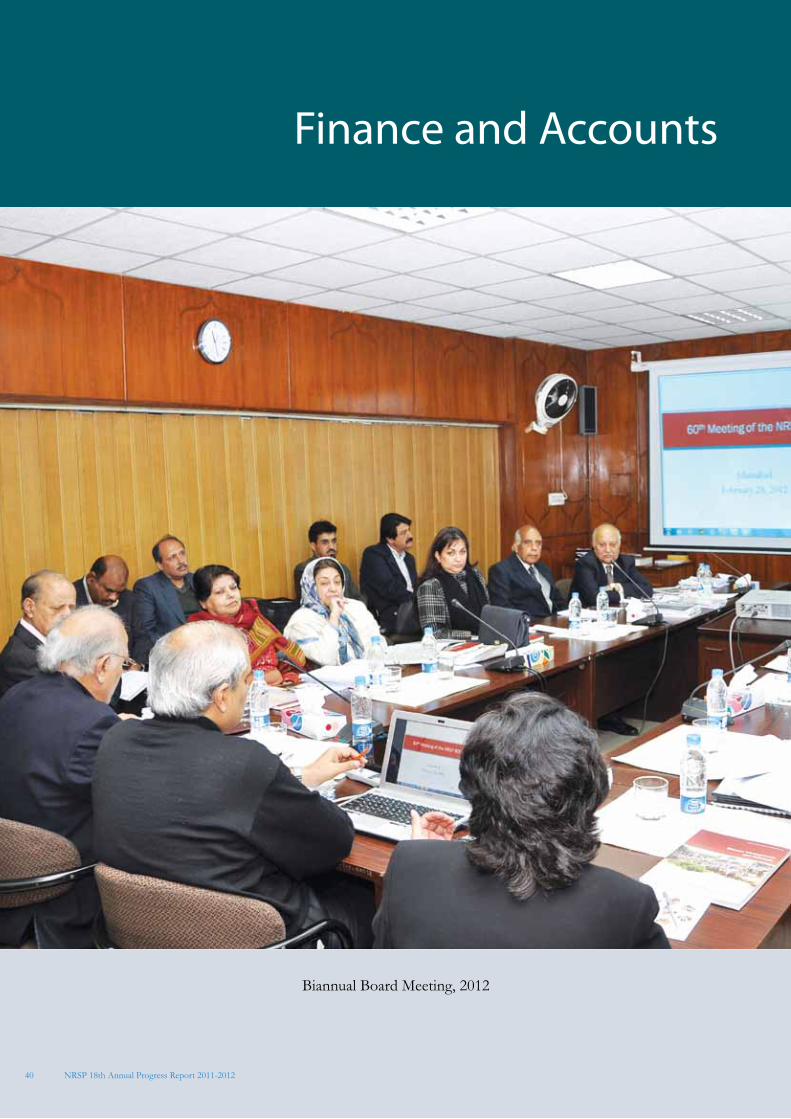
40
Biannual Board Meeting, 2012
Finance and Accounts
NRSP 18th Annual Progress Report 2011-2012
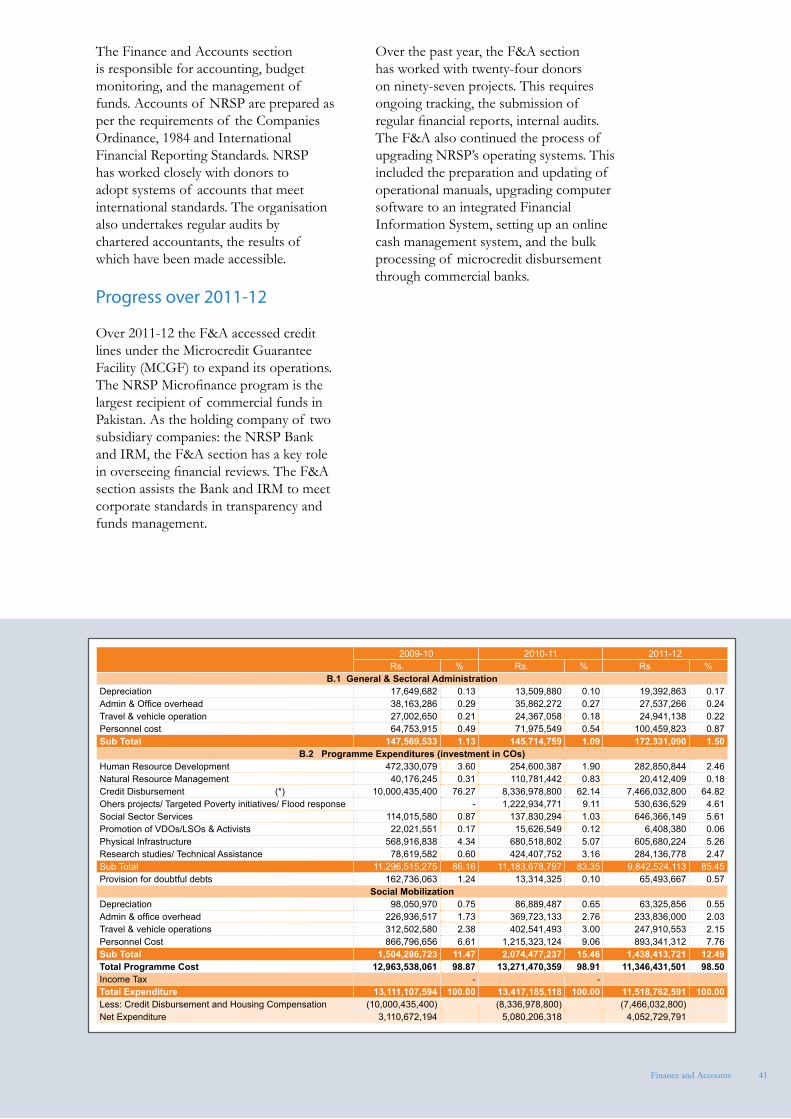
41Finance and Accounts
The Finance and Accounts section is responsible for accounting, budget monitoring, and the management of funds. Accounts of NRSP are prepared as per the requirements of the Companies Ordinance, 1984 and International Financial Reporting Standards. NRSP has worked closely with donors to adopt systems of accounts that meet international standards. The organisation also undertakes regular audits by chartered accountants, the results of which have been made accessible.
Progress over 2011-12
Over 2011-12 the F&A accessed credit lines under the Microcredit Guarantee Facility (MCGF) to expand its operations. The NRSP Microfinance program is the largest recipient of commercial funds in Pakistan. As the holding company of two subsidiary companies: the NRSP Bank and IRM, the F&A section has a key role in overseeing financial reviews. The F&A section assists the Bank and IRM to meet corporate standards in transparency and funds management.
Over the past year, the F&A section has worked with twenty-four donors on ninety-seven projects. This requires ongoing tracking, the submission of regular financial reports, internal audits. The F&A also continued the process of upgrading NRSP’s operating systems. This included the preparation and updating of operational manuals, upgrading computer software to an integrated Financial Information System, setting up an online cash management system, and the bulk processing of microcredit disbursement through commercial banks.
2009-10 2010-11 2011-12Rs. % Rs. % Rs. %
B.1 General & Sectoral AdministrationDepreciation 17,649,682 0.13 13,509,880 0.10 19,392,863 0.17Admin & Office overhead 38,163,286 0.29 35,862,272 0.27 27,537,266 0.24Travel & vehicle operation 27,002,650 0.21 24,367,058 0.18 24,941,138 0.22Personnel cost 64,753,915 0.49 71,975,549 0.54 100,459,823 0.87Sub Total 147,569,533 1.13 145,714,759 1.09 172,331,090 1.50
B.2 Programme Expenditures (investment in COs)Human Resource Development 472,330,079 3.60 254,600,387 1.90 282,850,844 2.46Natural Resource Management 40,176,245 0.31 110,781,442 0.83 20,412,409 0.18Credit Disbursement (*) 10,000,435,400 76.27 8,336,978,800 62.14 7,466,032,800 64.82Ohers projects/ Targeted Poverty initiatives/ Flood response - 1,222,934,771 9.11 530,636,529 4.61Social Sector Services 114,015,580 0.87 137,830,294 1.03 646,366,149 5.61Promotion of VDOs/LSOs & Activists 22,021,551 0.17 15,626,549 0.12 6,408,380 0.06Physical Infrastructure 568,916,838 4.34 680,518,802 5.07 605,680,224 5.26Research studies/ Technical Assistance 78,619,582 0.60 424,407,752 3.16 284,136,778 2.47Sub Total 11,296,515,275 86.16 11,183,678,797 83.35 9,842,524,113 85.45Provision for doubtful debts 162,736,063 1.24 13,314,325 0.10 65,493,667 0.57
Social MobilizationDepreciation 98,050,970 0.75 86,889,487 0.65 63,325,856 0.55Admin & office overhead 226,936,517 1.73 369,723,133 2.76 233,836,000 2.03Travel & vehicle operations 312,502,580 2.38 402,541,493 3.00 247,910,553 2.15Personnel Cost 866,796,656 6.61 1,215,323,124 9.06 893,341,312 7.76Sub Total 1,504,286,723 11.47 2,074,477,237 15.46 1,438,413,721 12.49Total Programme Cost 12,963,538,061 98.87 13,271,470,359 98.91 11,346,431,501 98.50Income Tax - - Total Expenditure 13,111,107,594 100.00 13,417,185,118 100.00 11,518,762,591 100.00Less: Credit Disbursement and Housing Compensation (10,000,435,400) (8,336,978,800) (7,466,032,800) Net Expenditure 3,110,672,194 5,080,206,318 4,052,729,791
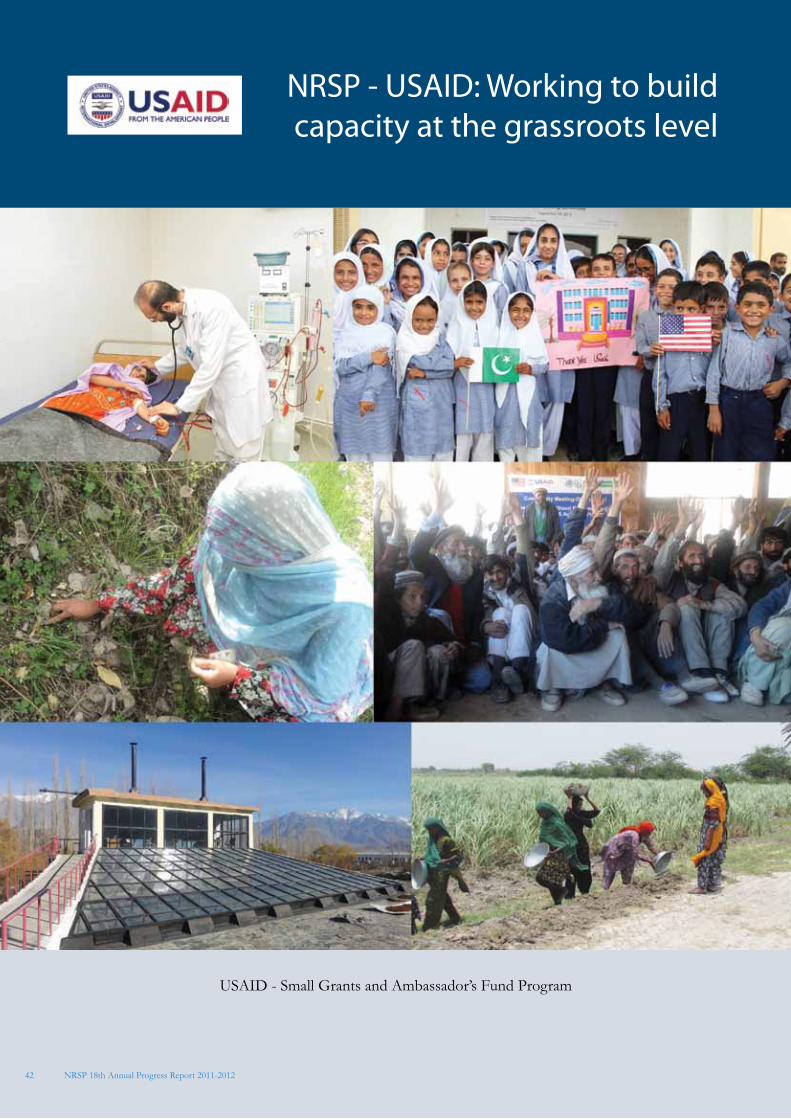
42
USAID - Small Grants and Ambassador’s Fund Program
NRSP - USAID: Working to buildcapacity at the grassroots level
NRSP 18th Annual Progress Report 2011-2012
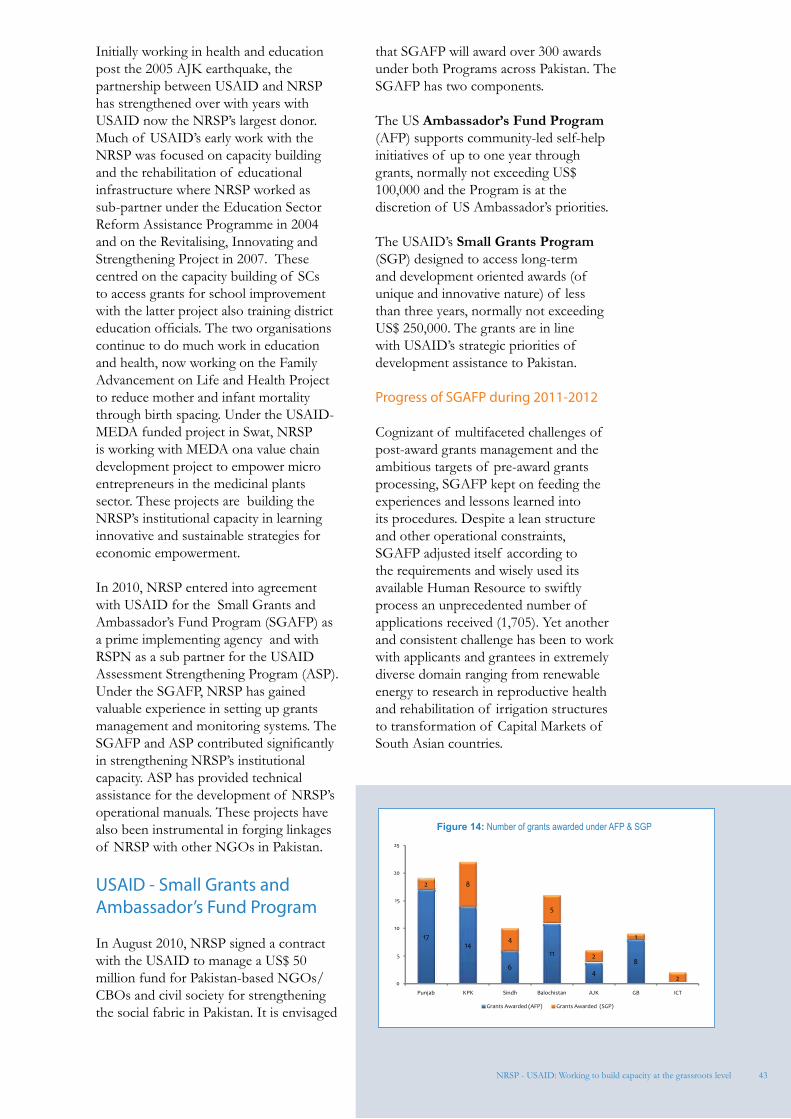
Figure 14: Number of grants awarded under AFP & SGP
43NRSP - USAID: Working to build capacity at the grassroots level
Initially working in health and education post the 2005 AJK earthquake, the partnership between USAID and NRSP has strengthened over with years with USAID now the NRSP’s largest donor. Much of USAID’s early work with the NRSP was focused on capacity building and the rehabilitation of educational infrastructure where NRSP worked as sub-partner under the Education Sector Reform Assistance Programme in 2004 and on the Revitalising, Innovating and Strengthening Project in 2007. These centred on the capacity building of SCs to access grants for school improvement with the latter project also training district education officials. The two organisations continue to do much work in education and health, now working on the Family Advancement on Life and Health Project to reduce mother and infant mortality through birth spacing. Under the USAID-MEDA funded project in Swat, NRSP is working with MEDA ona value chain development project to empower micro entrepreneurs in the medicinal plants sector. These projects are building the NRSP’s institutional capacity in learning innovative and sustainable strategies for economic empowerment.
In 2010, NRSP entered into agreement with USAID for the Small Grants and Ambassador’s Fund Program (SGAFP) as a prime implementing agency and with RSPN as a sub partner for the USAID Assessment Strengthening Program (ASP). Under the SGAFP, NRSP has gained valuable experience in setting up grants management and monitoring systems. The SGAFP and ASP contributed significantly in strengthening NRSP’s institutional capacity. ASP has provided technical assistance for the development of NRSP’s operational manuals. These projects have also been instrumental in forging linkages of NRSP with other NGOs in Pakistan.
USAID - Small Grants and Ambassador’s Fund Program
In August 2010, NRSP signed a contract with the USAID to manage a US$ 50 million fund for Pakistan-based NGOs/CBOs and civil society for strengthening the social fabric in Pakistan. It is envisaged
that SGAFP will award over 300 awards under both Programs across Pakistan. The SGAFP has two components.
The US Ambassador’s Fund Program (AFP) supports community-led self-help initiatives of up to one year through grants, normally not exceeding US$ 100,000 and the Program is at the discretion of US Ambassador’s priorities.
The USAID’s Small Grants Program (SGP) designed to access long-term and development oriented awards (of unique and innovative nature) of less than three years, normally not exceeding US$ 250,000. The grants are in line with USAID’s strategic priorities of development assistance to Pakistan.
Progress of SGAFP during 2011-2012
Cognizant of multifaceted challenges of post-award grants management and the ambitious targets of pre-award grants processing, SGAFP kept on feeding the experiences and lessons learned into its procedures. Despite a lean structure and other operational constraints, SGAFP adjusted itself according to the requirements and wisely used its available Human Resource to swiftly process an unprecedented number of applications received (1,705). Yet another and consistent challenge has been to work with applicants and grantees in extremely diverse domain ranging from renewable energy to research in reproductive health and rehabilitation of irrigation structures to transformation of Capital Markets of South Asian countries.
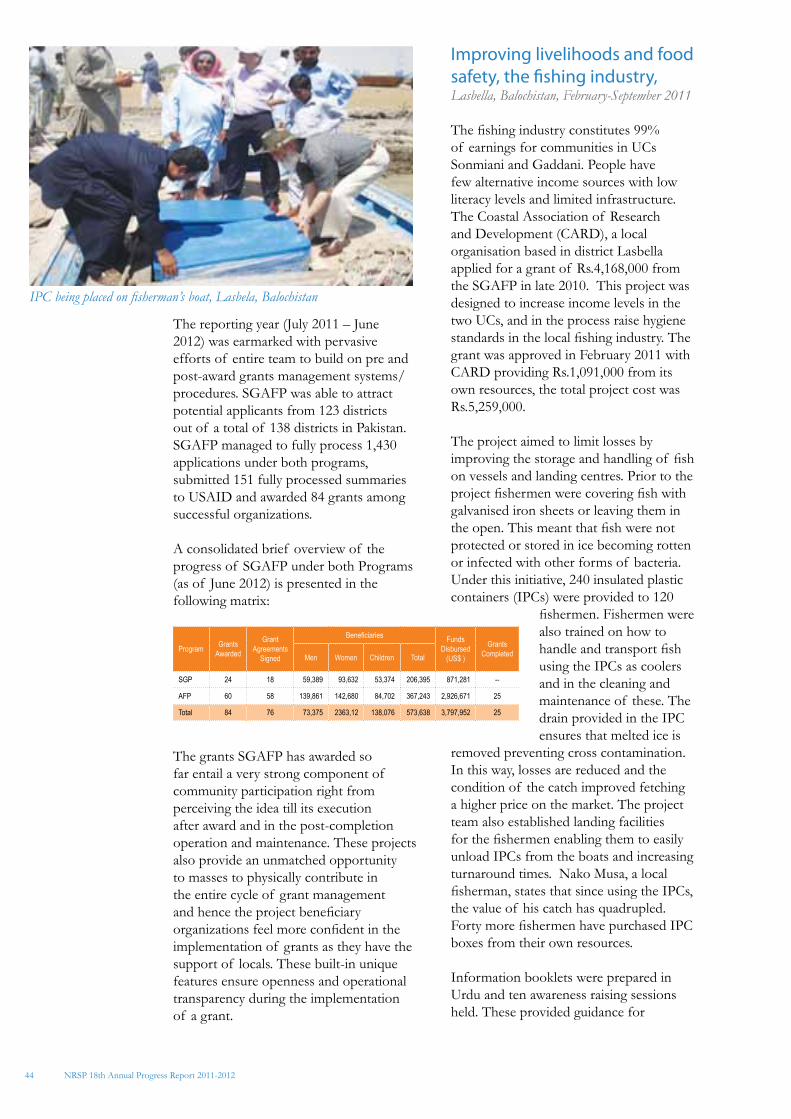
44
IPC being placed on fisherman’s boat, Lasbela, Balochistan
The reporting year (July 2011 – June 2012) was earmarked with pervasive efforts of entire team to build on pre and post-award grants management systems/procedures. SGAFP was able to attract potential applicants from 123 districts out of a total of 138 districts in Pakistan. SGAFP managed to fully process 1,430 applications under both programs, submitted 151 fully processed summaries to USAID and awarded 84 grants among successful organizations.
A consolidated brief overview of the progress of SGAFP under both Programs (as of June 2012) is presented in the following matrix:
The grants SGAFP has awarded so far entail a very strong component of community participation right from perceiving the idea till its execution after award and in the post-completion operation and maintenance. These projects also provide an unmatched opportunity to masses to physically contribute in the entire cycle of grant management and hence the project beneficiary organizations feel more confident in the implementation of grants as they have the support of locals. These built-in unique features ensure openness and operational transparency during the implementation of a grant.
Improving livelihoods and food safety, the fishing industry, Lasbella, Balochistan, February-September 2011
The fishing industry constitutes 99% of earnings for communities in UCs Sonmiani and Gaddani. People have few alternative income sources with low literacy levels and limited infrastructure. The Coastal Association of Research and Development (CARD), a local organisation based in district Lasbella applied for a grant of Rs.4,168,000 from the SGAFP in late 2010. This project was designed to increase income levels in the two UCs, and in the process raise hygiene standards in the local fishing industry. The grant was approved in February 2011 with CARD providing Rs.1,091,000 from its own resources, the total project cost was Rs.5,259,000.
The project aimed to limit losses by improving the storage and handling of fish on vessels and landing centres. Prior to the project fishermen were covering fish with galvanised iron sheets or leaving them in the open. This meant that fish were not protected or stored in ice becoming rotten or infected with other forms of bacteria. Under this initiative, 240 insulated plastic containers (IPCs) were provided to 120
fishermen. Fishermen were also trained on how to handle and transport fish using the IPCs as coolers and in the cleaning and maintenance of these. The drain provided in the IPC ensures that melted ice is
removed preventing cross contamination. In this way, losses are reduced and the condition of the catch improved fetching a higher price on the market. The project team also established landing facilities for the fishermen enabling them to easily unload IPCs from the boats and increasing turnaround times. Nako Musa, a local fisherman, states that since using the IPCs, the value of his catch has quadrupled. Forty more fishermen have purchased IPC boxes from their own resources. Information booklets were prepared in Urdu and ten awareness raising sessions held. These provided guidance for
NRSP 18th Annual Progress Report 2011-2012
Program Grants Awarded
Grant Agreements
Signed
Beneficiaries Funds Disbursed
(US$ )
Grants Completed Men Women Children Total
SGP 24 18 59,389 93,632 53,374 206,395 871,281 --
AFP 60 58 139,861 142,680 84,702 367,243 2,926,671 25
Total 84 76 73,375 2363,12 138,076 573,638 3,797,952 25
45
fishermen on the safe handling of fish, and discouraged them from using gujjo (harmful nets). Further training was provided on price awareness and expected standards in the market. Some fishermen have also now committees have to save threatened species of fish. All boats were registered with the Balochistan Fisheries Department enabling them to receive compensation in case of cyclones and tsunami.
USAID – Assessment and Strengthening Program
The Assessment and Strengthening Program (ASP) for Government of Pakistan & Civil Society Organizations, is a five years USAID funded initiative, aims to establish a mechanism enabling USAID to work with local implementing partners and government institutions. The ASP Program aims to strengthen the capacity building of organizations through a pragmatic hands-on-approach by designing organization specific capacity building plans. The Program has five (5) major components: which include (i) Assessment, (ii) Capacity Building, (iii) Annual Validation, (iv) Research and (v) Awardees Capacity Building.
Under ASP, NRSP is working as a sub-partner of the RSPN. Its role is to establish Provincial Project Offices (PPOs) in Peshawar, Quetta, Karachi and Lahore to assist and facilitate the Central Project Office in implementation of the project activities. Whereas, ASP Central Program Office (CPO) established by RSPN in Islamabad provides technical guidance to the PPOs. NRSP established the PPOs during the first quarter of the project period. These PPOs are responsible to manage, implement and monitor all project activities at provincial level.
Progress during 2011-12
Under the Pre Award Assessment, the project has completed 81 Pre Award Assessments in all four provinces including GB and AJK under CDCP. Pre Award assessments of 06 other organizations i.e., NESPAK, National Development Consultants, Abacus Consulting, Halcrow
and A.A. Associates have also been completed in reporting period.
Under the Capacity Building component, CPO and PPOs collaborated with different Government departments to enhance their capacities through improving/developing their systems, procedures, and providing handholding trainings in the field of financial management, HR management, procurement, M&E and internal audit. ASP is providing technical assistance to different Government departments in the field of education, health, municipal services, disaster management, agriculture, audit, enterprise development and establishing Public procurement regulatory authorities at provincial level to ensure transparency and accountability. As of reporting period the project is working with 11 different departments/institutes both at federal and provincial levels.
Under the ASP, the NRSP has also received technical assistance in the development of manuals for: HR systems, financial systems, internal audits, procurement procedures, and IT. This has also improved levels of transparency within the organisation. Staff continue to receive training under the USAID ASP in areas covering finance, reporting, HR systems and monitoring.
Future vision and strategy
Recognising the importance of the USAID support in Pakistan, NRSP is making all possible efforts to comply with the contractual requirements of USAID. NRSP since inception has demonstrated its willingness to learn from the communities that it serves and from the governments and donors that provide financial assistance for the community driven projects. Over the last three years, NRSP has further refined its governance and operational systems for a highly reliable and transparent system for ensuring disbursement of donors’ funds in an efficient and effective manner. This approach will help expand NRSP’s partnership with USAID for more diverse projects in all USAID sectors. NRSP is fully prepared to participate in the USAID development strategy for Pakistan.
NRSP - USAID: Working to build capacity at the grassroots level
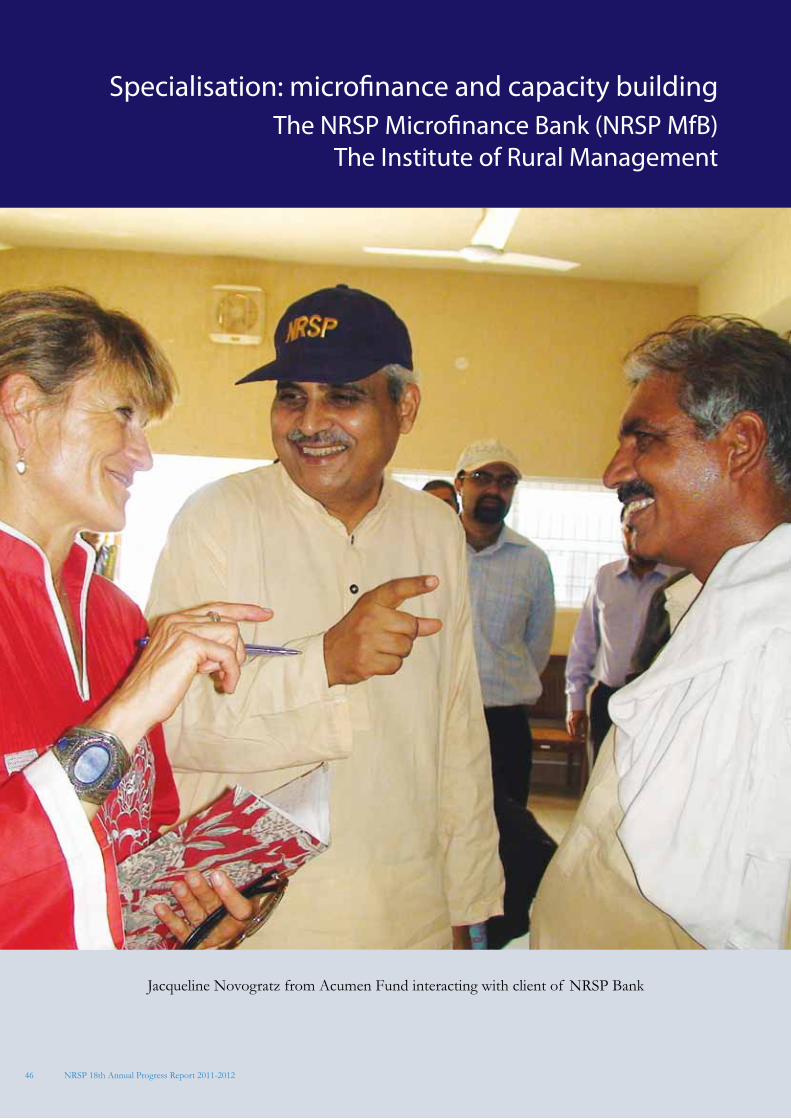
46
Jacqueline Novogratz from Acumen Fund interacting with client of NRSP Bank
The NRSP Microfinance Bank (NRSP MfB)The Institute of Rural Management
Specialisation: microfinance and capacity building
NRSP 18th Annual Progress Report 2011-2012
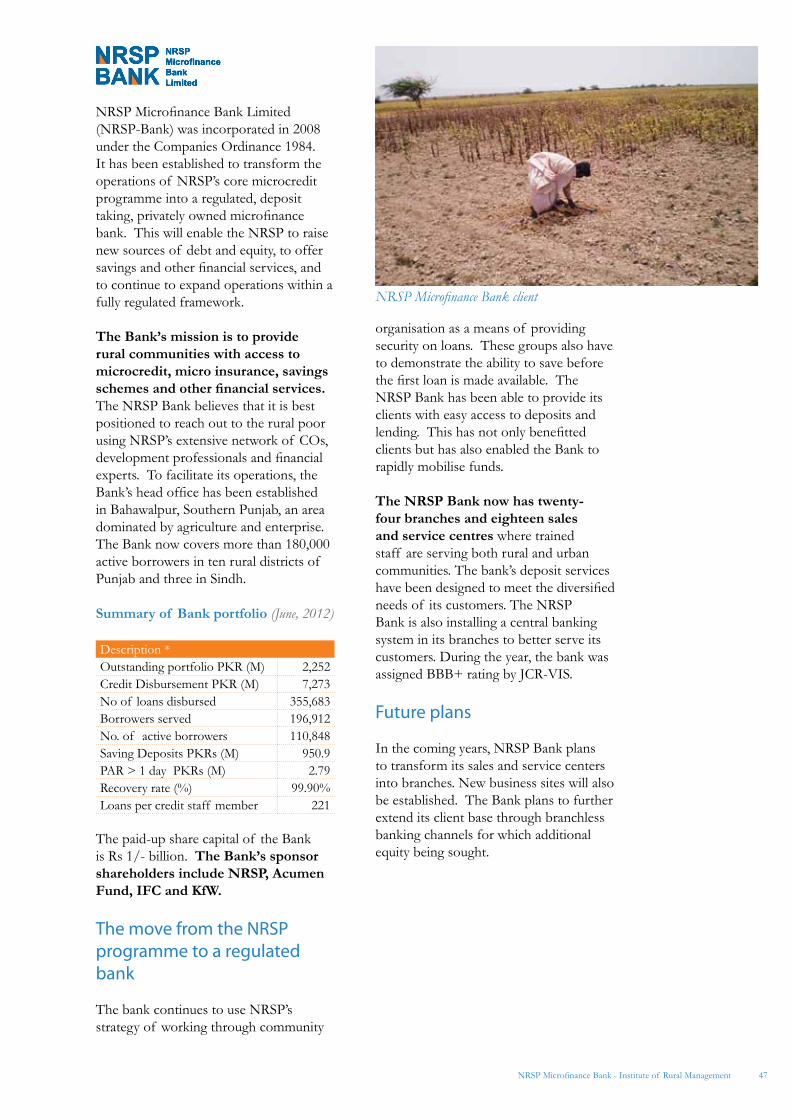
47NRSP Microfinance Bank - Institute of Rural Management
NRSP Microfinance Bank Limited (NRSP-Bank) was incorporated in 2008 under the Companies Ordinance 1984. It has been established to transform the operations of NRSP’s core microcredit programme into a regulated, deposit taking, privately owned microfinance bank. This will enable the NRSP to raise new sources of debt and equity, to offer savings and other financial services, and to continue to expand operations within a fully regulated framework.
The Bank’s mission is to provide rural communities with access to microcredit, micro insurance, savings schemes and other financial services. The NRSP Bank believes that it is best positioned to reach out to the rural poor using NRSP’s extensive network of COs, development professionals and financial experts. To facilitate its operations, the Bank’s head office has been established in Bahawalpur, Southern Punjab, an area dominated by agriculture and enterprise. The Bank now covers more than 180,000 active borrowers in ten rural districts of Punjab and three in Sindh.
Summary of Bank portfolio (June, 2012)
Description *Outstanding portfolio PKR (M) 2,252Credit Disbursement PKR (M) 7,273No of loans disbursed 355,683Borrowers served 196,912No. of active borrowers 110,848Saving Deposits PKRs (M) 950.9PAR > 1 day PKRs (M) 2.79Recovery rate (%) 99.90%Loans per credit staff member 221
The paid-up share capital of the Bank is Rs 1/- billion. The Bank’s sponsor shareholders include NRSP, Acumen Fund, IFC and KfW.
The move from the NRSP programme to a regulated bank
The bank continues to use NRSP’s strategy of working through community
organisation as a means of providing security on loans. These groups also have to demonstrate the ability to save before the first loan is made available. The NRSP Bank has been able to provide its clients with easy access to deposits and lending. This has not only benefitted clients but has also enabled the Bank to rapidly mobilise funds.
The NRSP Bank now has twenty-four branches and eighteen sales and service centres where trained staff are serving both rural and urban communities. The bank’s deposit services have been designed to meet the diversified needs of its customers. The NRSP Bank is also installing a central banking system in its branches to better serve its customers. During the year, the bank was assigned BBB+ rating by JCR-VIS.
Future plans
In the coming years, NRSP Bank plans to transform its sales and service centers into branches. New business sites will also be established. The Bank plans to further extend its client base through branchless banking channels for which additional equity being sought.
NRSP Microfinance Bank client
48
The IRM was registered as a separate institution in 2010 under Section 42 of the Companies Ordinance 1984. Starting as the HRD wing of NRSP, the IRM has developed into one of the leading training institutes in the not-for-profit sector in Pakistan. The IRM has signed agreements with major public sector bodies including NIH, SDC, TEVTAs, and ILO’s International Training Centre, Italy. IRM is a country voting representative of ASPBAE and a member of HAP International and IUCN.
Core achievements
As of June 2012, the IRM has trained 20,751 people in vocational training, 7,426 in natural resource management practices, 590 in health related activities and 1,603 in community management skills. Over 2011-12, 43% of training participants were men and 57% were women. Alongside these core community training programmes, the IRM runs a comprehensive programme of staff training. This includes the Orientation Training Workshop (OTW) for NRSP staff, TOT for Social Mobilisers and a Management Development Programme. The IRM also offers post-graduate diploma courses in affiliation with Iqra University, Islamabad. The IRM also runs a summer internship programmes in collaboration with HRDN. To date, 65 students have been placed with development sector organisations across the country.
Skills training for employment
Over 2011-12, the IRM worked on a number of donor funded projects providing skills for employment.
Accelerated Learning Programme (ALP), funded by UNICEF, South Waziristan, Orakzai, Bajaur and Mohmand Agency, September, 2011 to December, 2012: The ALP aims to bring 1,000 out of school children back to education in conflict stricken areas of FATA. Due
to prolonged conflict, poverty and a lack of opportunities, a substantial number of children not received an education. This project aims to create 25 accelerated learning centres, train 50 teachers and provide primary education to 1,000 children.
Union Council Based Poverty Reduction Programme (UCBPRP), Government of Sindh through SRSO, Kashmore, Shikarpur, Jacobabad, April 2009 - June 2012: The UCBPRP built the capacity of 8,400 VO members and 31,002 unemployed young people. Trainings were provided in the sectors of skills development, agriculture, environment and natural resource management and health.
Punjab Skills Development Fund, Government of Punjab, Bahawalpur, Bahawalnagar, Lodhran and Muzaffarabad, December 2011-March 2012: This project aims to improve opportunities for income generation through skills enhancement. IRM trained 400 people in 4 different trades under this iniative. These are: Building Electrician, Basic Tailoring, Advance Tailoring/ Dress Designing and Machine Embroidery.
Gender Equality for Decent Employment, funded by the ILO, Bahawalpur, June 2011-February 2012: 207 women were trained on market oriented and locally demanded trades, such as clothing and home textile. Trainees were linked with employers in the textile sector. Business Development Groups were also formed for enterprise development.
Future plans
Having already a strong presence at the national level, the IRM plans to establish itself internationally now setting up offices in the UK. In the coming years, the IRM plans to consolidate its position as the largest specialised capacity building institution within and outside of Pakistan.
NRSP 18th Annual Progress Report 2011-2012
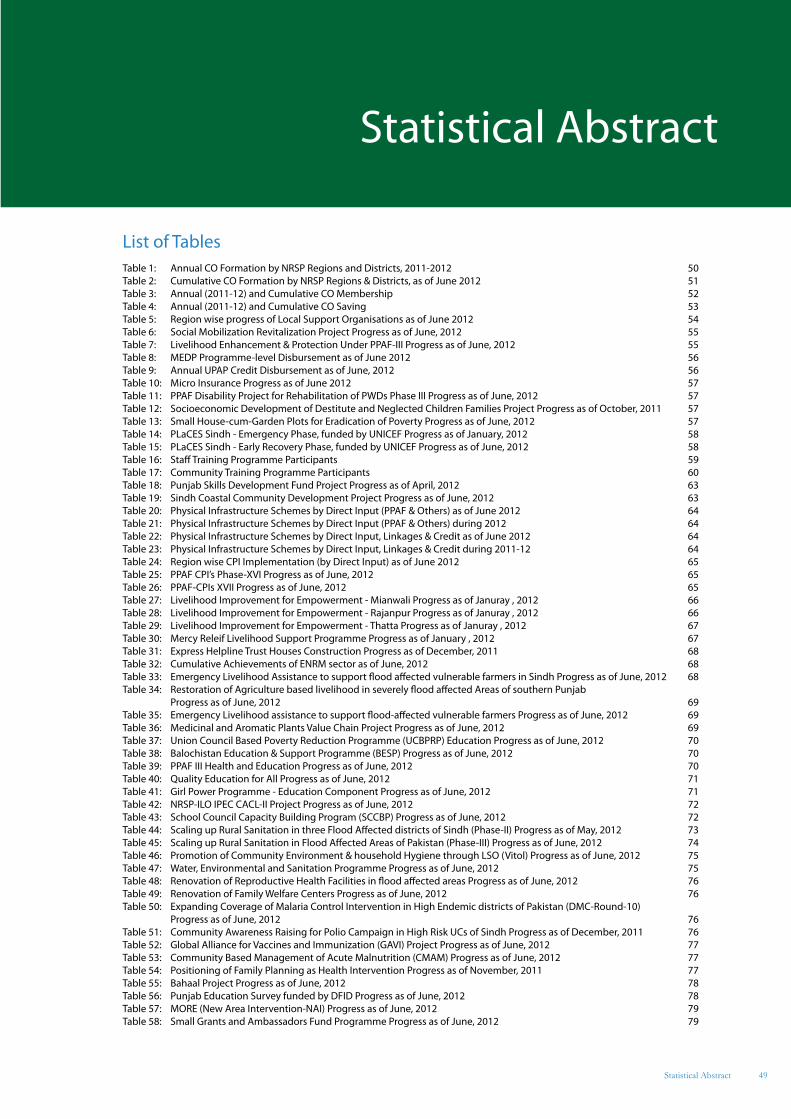
49
Statistical Abstract
List of TablesTable 1: Annual CO Formation by NRSP Regions and Districts, 2011-2012 50Table 2: Cumulative CO Formation by NRSP Regions & Districts, as of June 2012 51Table 3: Annual (2011-12) and Cumulative CO Membership 52Table 4: Annual (2011-12) and Cumulative CO Saving 53Table 5: Region wise progress of Local Support Organisations as of June 2012 54Table 6: Social Mobilization Revitalization Project Progress as of June, 2012 55Table 7: Livelihood Enhancement & Protection Under PPAF-III Progress as of June, 2012 55Table 8: MEDP Programme-level Disbursement as of June 2012 56Table 9: Annual UPAP Credit Disbursement as of June, 2012 56Table 10: Micro Insurance Progress as of June 2012 57Table 11: PPAF Disability Project for Rehabilitation of PWDs Phase III Progress as of June, 2012 57Table 12: Socioeconomic Development of Destitute and Neglected Children Families Project Progress as of October, 2011 57Table 13: Small House-cum-Garden Plots for Eradication of Poverty Progress as of June, 2012 57Table 14: PLaCES Sindh - Emergency Phase, funded by UNICEF Progress as of January, 2012 58Table 15: PLaCES Sindh - Early Recovery Phase, funded by UNICEF Progress as of June, 2012 58Table 16: Staff Training Programme Participants 59Table 17: Community Training Programme Participants 60Table 18: Punjab Skills Development Fund Project Progress as of April, 2012 63Table 19: Sindh Coastal Community Development Project Progress as of June, 2012 63Table 20: Physical Infrastructure Schemes by Direct Input (PPAF & Others) as of June 2012 64Table 21: Physical Infrastructure Schemes by Direct Input (PPAF & Others) during 2012 64Table 22: Physical Infrastructure Schemes by Direct Input, Linkages & Credit as of June 2012 64Table 23: Physical Infrastructure Schemes by Direct Input, Linkages & Credit during 2011-12 64Table 24: Region wise CPI Implementation (by Direct Input) as of June 2012 65Table 25: PPAF CPI’s Phase-XVI Progress as of June, 2012 65Table 26: PPAF-CPIs XVII Progress as of June, 2012 65Table 27: Livelihood Improvement for Empowerment - Mianwali Progress as of Januray , 2012 66Table 28: Livelihood Improvement for Empowerment - Rajanpur Progress as of Januray , 2012 66Table 29: Livelihood Improvement for Empowerment - Thatta Progress as of Januray , 2012 67Table 30: Mercy Releif Livelihood Support Programme Progress as of January , 2012 67Table 31: Express Helpline Trust Houses Construction Progress as of December, 2011 68Table 32: Cumulative Achievements of ENRM sector as of June, 2012 68Table 33: Emergency Livelihood Assistance to support flood affected vulnerable farmers in Sindh Progress as of June, 2012 68Table 34: Restoration of Agriculture based livelihood in severely flood affected Areas of southern Punjab Progress as of June, 2012 69Table 35: Emergency Livelihood assistance to support flood-affected vulnerable farmers Progress as of June, 2012 69Table 36: Medicinal and Aromatic Plants Value Chain Project Progress as of June, 2012 69Table 37: Union Council Based Poverty Reduction Programme (UCBPRP) Education Progress as of June, 2012 70Table 38: Balochistan Education & Support Programme (BESP) Progress as of June, 2012 70Table 39: PPAF III Health and Education Progress as of June, 2012 70Table 40: Quality Education for All Progress as of June, 2012 71Table 41: Girl Power Programme - Education Component Progress as of June, 2012 71Table 42: NRSP-ILO IPEC CACL-II Project Progress as of June, 2012 72Table 43: School Council Capacity Building Program (SCCBP) Progress as of June, 2012 72Table 44: Scaling up Rural Sanitation in three Flood Affected districts of Sindh (Phase-II) Progress as of May, 2012 73Table 45: Scaling up Rural Sanitation in Flood Affected Areas of Pakistan (Phase-III) Progress as of June, 2012 74Table 46: Promotion of Community Environment & household Hygiene through LSO (Vitol) Progress as of June, 2012 75Table 47: Water, Environmental and Sanitation Programme Progress as of June, 2012 75Table 48: Renovation of Reproductive Health Facilities in flood affected areas Progress as of June, 2012 76Table 49: Renovation of Family Welfare Centers Progress as of June, 2012 76Table 50: Expanding Coverage of Malaria Control Intervention in High Endemic districts of Pakistan (DMC-Round-10) Progress as of June, 2012 76Table 51: Community Awareness Raising for Polio Campaign in High Risk UCs of Sindh Progress as of December, 2011 76Table 52: Global Alliance for Vaccines and Immunization (GAVI) Project Progress as of June, 2012 77Table 53: Community Based Management of Acute Malnutrition (CMAM) Progress as of June, 2012 77Table 54: Positioning of Family Planning as Health Intervention Progress as of November, 2011 77Table 55: Bahaal Project Progress as of June, 2012 78Table 56: Punjab Education Survey funded by DFID Progress as of June, 2012 78Table 57: MORE (New Area Intervention-NAI) Progress as of June, 2012 79Table 58: Small Grants and Ambassadors Fund Programme Progress as of June, 2012 79
Statistical Abstract
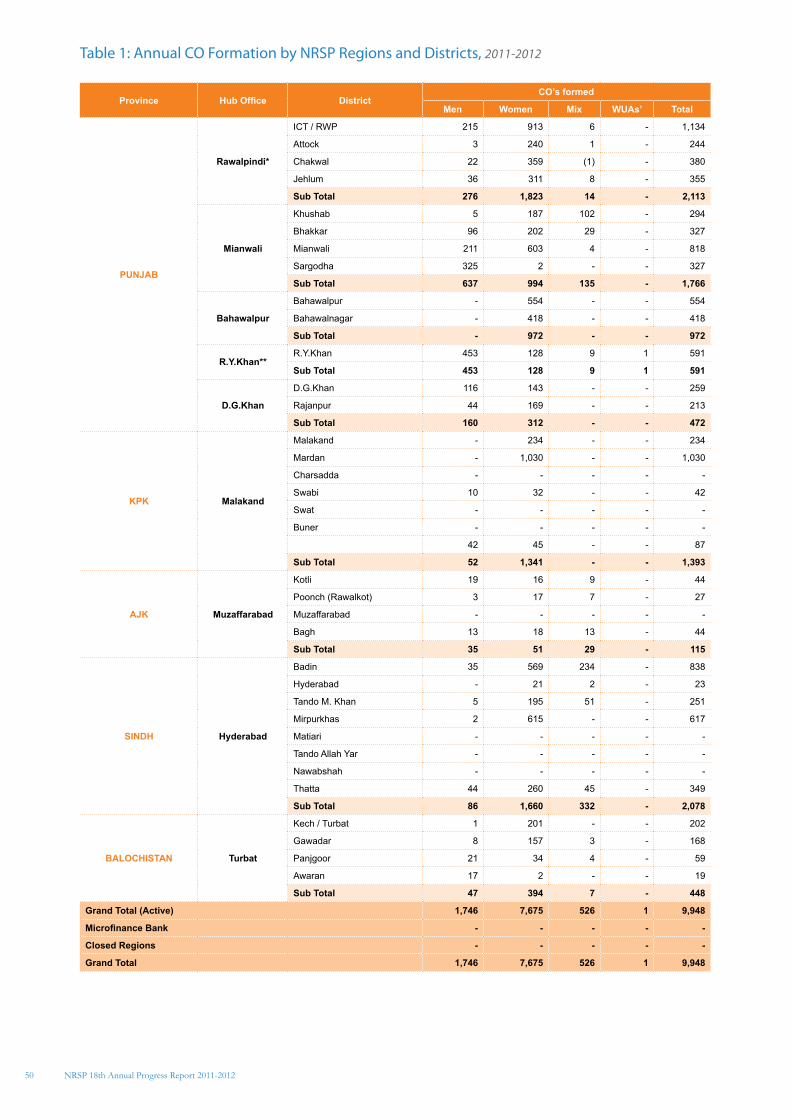
50
Table 1: Annual CO Formation by NRSP Regions and Districts, 2011-2012
Province Hub Office DistrictCO’s formed
Men Women Mix WUAs’ Total
PUNJAB
Rawalpindi*
ICT / RWP 215 913 6 - 1,134
Attock 3 240 1 - 244
Chakwal 22 359 (1) - 380
Jehlum 36 311 8 - 355
Sub Total 276 1,823 14 - 2,113
Mianwali
Khushab 5 187 102 - 294
Bhakkar 96 202 29 - 327
Mianwali 211 603 4 - 818
Sargodha 325 2 - - 327
Sub Total 637 994 135 - 1,766
Bahawalpur
Bahawalpur - 554 - - 554
Bahawalnagar - 418 - - 418
Sub Total - 972 - - 972
R.Y.Khan** R.Y.Khan 453 128 9 1 591
Sub Total 453 128 9 1 591
D.G.Khan
D.G.Khan 116 143 - - 259
Rajanpur 44 169 - - 213
Sub Total 160 312 - - 472
KPK Malakand
Malakand - 234 - - 234
Mardan - 1,030 - - 1,030
Charsadda - - - - -
Swabi 10 32 - - 42
Swat - - - - -
Buner - - - - -
42 45 - - 87
Sub Total 52 1,341 - - 1,393
AJK Muzaffarabad
Kotli 19 16 9 - 44
Poonch (Rawalkot) 3 17 7 - 27
Muzaffarabad - - - - -
Bagh 13 18 13 - 44
Sub Total 35 51 29 - 115
SINDH Hyderabad
Badin 35 569 234 - 838
Hyderabad - 21 2 - 23
Tando M. Khan 5 195 51 - 251
Mirpurkhas 2 615 - - 617
Matiari - - - - -
Tando Allah Yar - - - - -
Nawabshah - - - - -
Thatta 44 260 45 - 349
Sub Total 86 1,660 332 - 2,078
BALOCHISTAN Turbat
Kech / Turbat 1 201 - - 202
Gawadar 8 157 3 - 168
Panjgoor 21 34 4 - 59
Awaran 17 2 - - 19
Sub Total 47 394 7 - 448
Grand Total (Active) 1,746 7,675 526 1 9,948
Microfinance Bank - - - - -
Closed Regions - - - - -
Grand Total 1,746 7,675 526 1 9,948
NRSP 18th Annual Progress Report 2011-2012
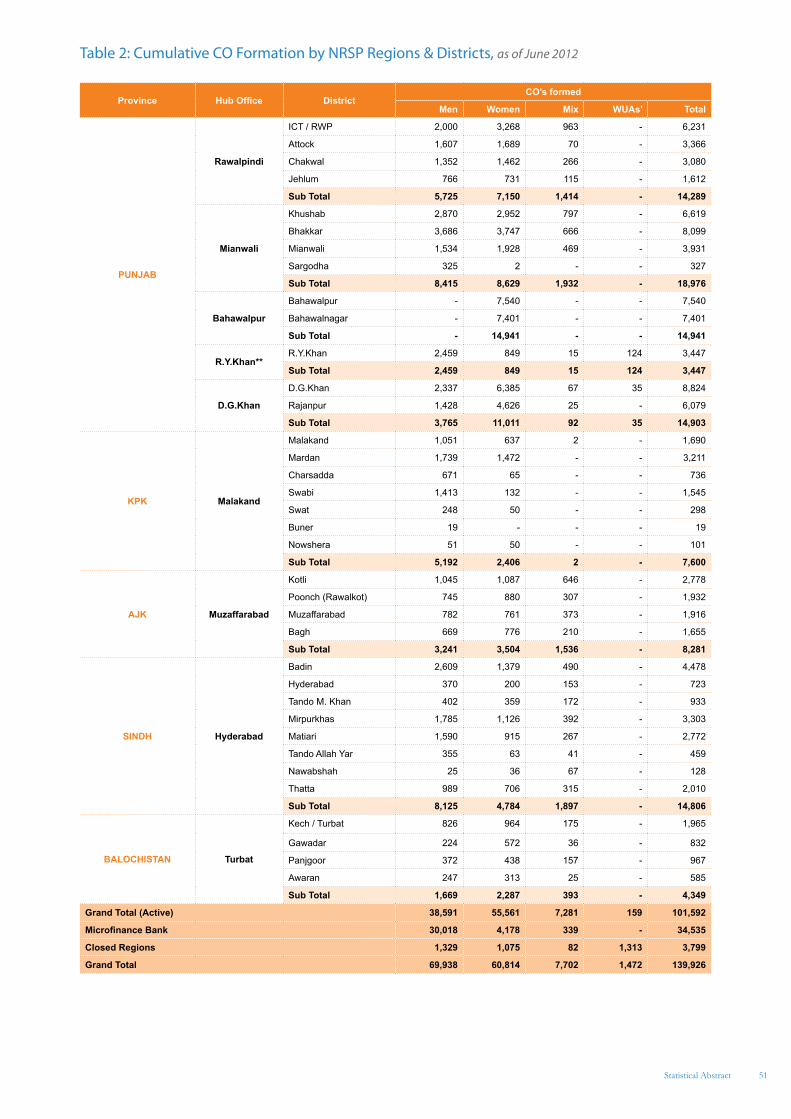
51
Table 2: Cumulative CO Formation by NRSP Regions & Districts, as of June 2012
Province Hub Office DistrictCO’s formed
Men Women Mix WUAs’ Total
PUNJAB
Rawalpindi
ICT / RWP 2,000 3,268 963 - 6,231
Attock 1,607 1,689 70 - 3,366
Chakwal 1,352 1,462 266 - 3,080
Jehlum 766 731 115 - 1,612
Sub Total 5,725 7,150 1,414 - 14,289
Mianwali
Khushab 2,870 2,952 797 - 6,619
Bhakkar 3,686 3,747 666 - 8,099
Mianwali 1,534 1,928 469 - 3,931
Sargodha 325 2 - - 327
Sub Total 8,415 8,629 1,932 - 18,976
Bahawalpur
Bahawalpur - 7,540 - - 7,540
Bahawalnagar - 7,401 - - 7,401
Sub Total - 14,941 - - 14,941
R.Y.Khan** R.Y.Khan 2,459 849 15 124 3,447
Sub Total 2,459 849 15 124 3,447
D.G.Khan
D.G.Khan 2,337 6,385 67 35 8,824
Rajanpur 1,428 4,626 25 - 6,079
Sub Total 3,765 11,011 92 35 14,903
KPK Malakand
Malakand 1,051 637 2 - 1,690
Mardan 1,739 1,472 - - 3,211
Charsadda 671 65 - - 736
Swabi 1,413 132 - - 1,545
Swat 248 50 - - 298
Buner 19 - - - 19
Nowshera 51 50 - - 101
Sub Total 5,192 2,406 2 - 7,600
AJK Muzaffarabad
Kotli 1,045 1,087 646 - 2,778
Poonch (Rawalkot) 745 880 307 - 1,932
Muzaffarabad 782 761 373 - 1,916
Bagh 669 776 210 - 1,655
Sub Total 3,241 3,504 1,536 - 8,281
SINDH Hyderabad
Badin 2,609 1,379 490 - 4,478
Hyderabad 370 200 153 - 723
Tando M. Khan 402 359 172 - 933
Mirpurkhas 1,785 1,126 392 - 3,303
Matiari 1,590 915 267 - 2,772
Tando Allah Yar 355 63 41 - 459
Nawabshah 25 36 67 - 128
Thatta 989 706 315 - 2,010
Sub Total 8,125 4,784 1,897 - 14,806
BALOCHISTAN Turbat
Kech / Turbat 826 964 175 - 1,965
Gawadar 224 572 36 - 832
Panjgoor 372 438 157 - 967
Awaran 247 313 25 - 585
Sub Total 1,669 2,287 393 - 4,349
Grand Total (Active) 38,591 55,561 7,281 159 101,592
Microfinance Bank 30,018 4,178 339 - 34,535
Closed Regions 1,329 1,075 82 1,313 3,799
Grand Total 69,938 60,814 7,702 1,472 139,926
Statistical Abstract
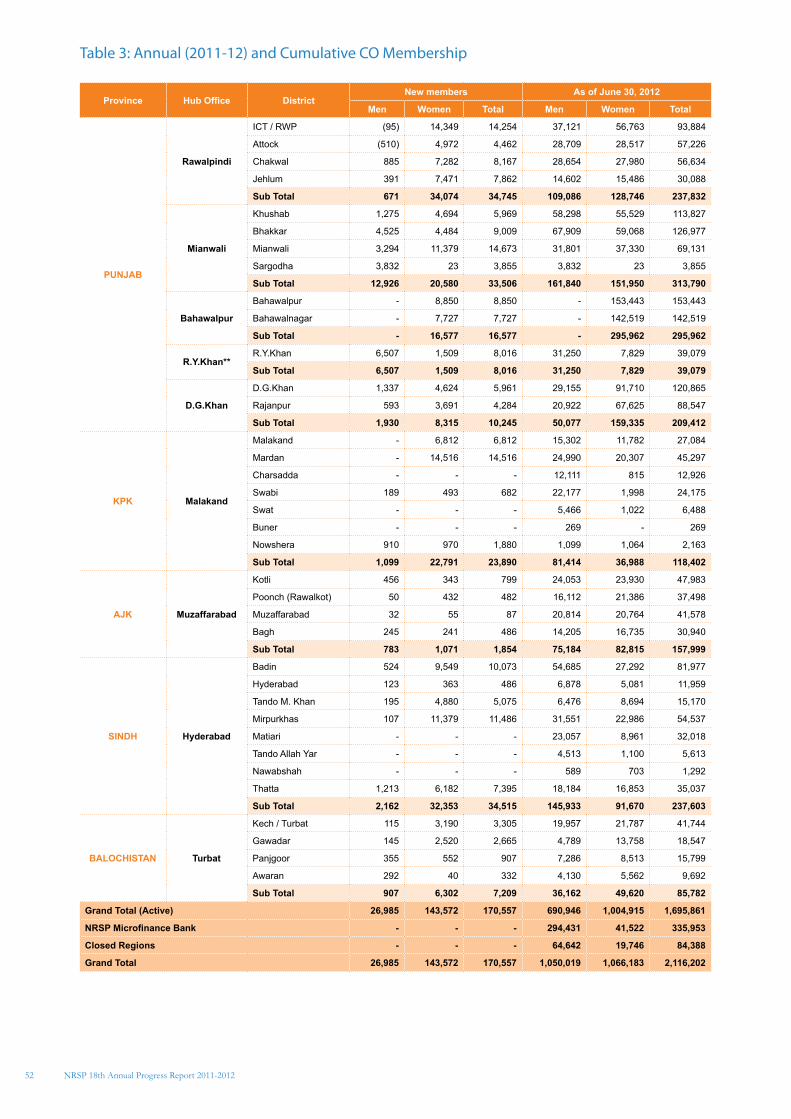
52
Table 3: Annual (2011-12) and Cumulative CO Membership
Province Hub Office DistrictNew members As of June 30, 2012
Men Women Total Men Women Total
PUNJAB
Rawalpindi
ICT / RWP (95) 14,349 14,254 37,121 56,763 93,884
Attock (510) 4,972 4,462 28,709 28,517 57,226
Chakwal 885 7,282 8,167 28,654 27,980 56,634
Jehlum 391 7,471 7,862 14,602 15,486 30,088
Sub Total 671 34,074 34,745 109,086 128,746 237,832
Mianwali
Khushab 1,275 4,694 5,969 58,298 55,529 113,827
Bhakkar 4,525 4,484 9,009 67,909 59,068 126,977
Mianwali 3,294 11,379 14,673 31,801 37,330 69,131
Sargodha 3,832 23 3,855 3,832 23 3,855
Sub Total 12,926 20,580 33,506 161,840 151,950 313,790
Bahawalpur
Bahawalpur - 8,850 8,850 - 153,443 153,443
Bahawalnagar - 7,727 7,727 - 142,519 142,519
Sub Total - 16,577 16,577 - 295,962 295,962
R.Y.Khan** R.Y.Khan 6,507 1,509 8,016 31,250 7,829 39,079
Sub Total 6,507 1,509 8,016 31,250 7,829 39,079
D.G.Khan
D.G.Khan 1,337 4,624 5,961 29,155 91,710 120,865
Rajanpur 593 3,691 4,284 20,922 67,625 88,547
Sub Total 1,930 8,315 10,245 50,077 159,335 209,412
KPK Malakand
Malakand - 6,812 6,812 15,302 11,782 27,084
Mardan - 14,516 14,516 24,990 20,307 45,297
Charsadda - - - 12,111 815 12,926
Swabi 189 493 682 22,177 1,998 24,175
Swat - - - 5,466 1,022 6,488
Buner - - - 269 - 269
Nowshera 910 970 1,880 1,099 1,064 2,163
Sub Total 1,099 22,791 23,890 81,414 36,988 118,402
AJK Muzaffarabad
Kotli 456 343 799 24,053 23,930 47,983
Poonch (Rawalkot) 50 432 482 16,112 21,386 37,498
Muzaffarabad 32 55 87 20,814 20,764 41,578
Bagh 245 241 486 14,205 16,735 30,940
Sub Total 783 1,071 1,854 75,184 82,815 157,999
SINDH Hyderabad
Badin 524 9,549 10,073 54,685 27,292 81,977
Hyderabad 123 363 486 6,878 5,081 11,959
Tando M. Khan 195 4,880 5,075 6,476 8,694 15,170
Mirpurkhas 107 11,379 11,486 31,551 22,986 54,537
Matiari - - - 23,057 8,961 32,018
Tando Allah Yar - - - 4,513 1,100 5,613
Nawabshah - - - 589 703 1,292
Thatta 1,213 6,182 7,395 18,184 16,853 35,037
Sub Total 2,162 32,353 34,515 145,933 91,670 237,603
BALOCHISTAN Turbat
Kech / Turbat 115 3,190 3,305 19,957 21,787 41,744
Gawadar 145 2,520 2,665 4,789 13,758 18,547
Panjgoor 355 552 907 7,286 8,513 15,799
Awaran 292 40 332 4,130 5,562 9,692
Sub Total 907 6,302 7,209 36,162 49,620 85,782
Grand Total (Active) 26,985 143,572 170,557 690,946 1,004,915 1,695,861
NRSP Microfinance Bank - - - 294,431 41,522 335,953
Closed Regions - - - 64,642 19,746 84,388
Grand Total 26,985 143,572 170,557 1,050,019 1,066,183 2,116,202
NRSP 18th Annual Progress Report 2011-2012
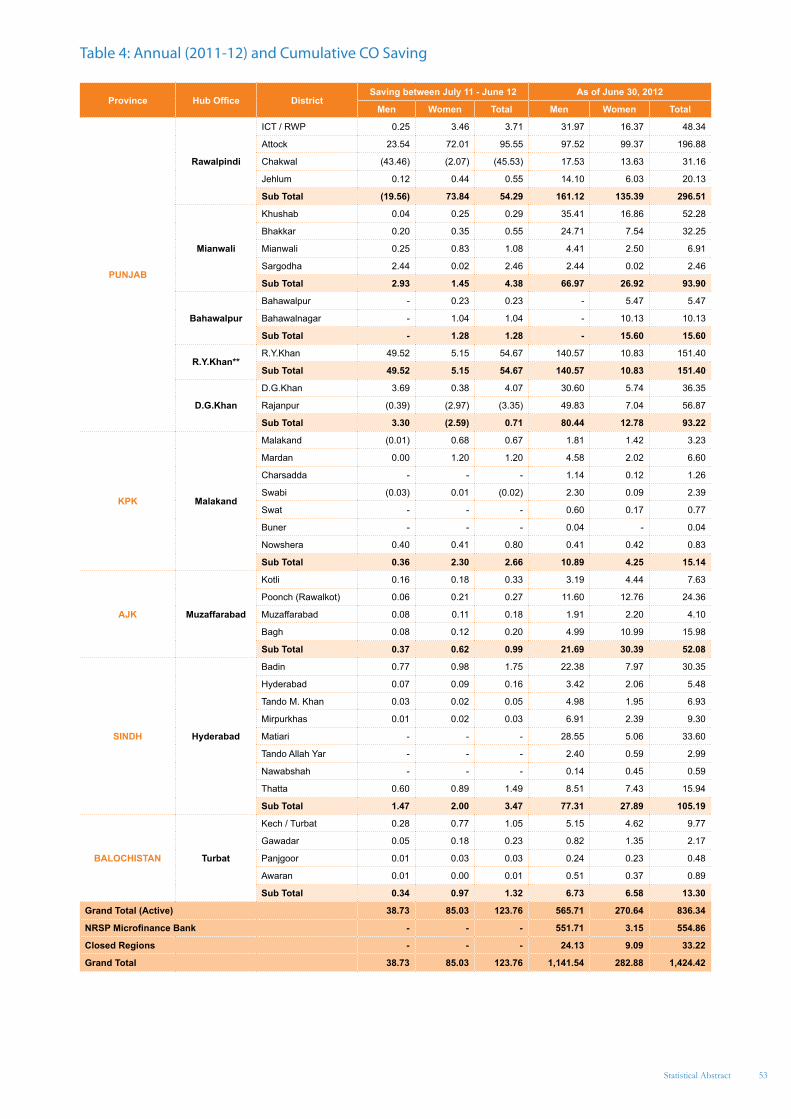
53
Table 4: Annual (2011-12) and Cumulative CO Saving
Province Hub Office DistrictSaving between July 11 - June 12 As of June 30, 2012
Men Women Total Men Women Total
PUNJAB
Rawalpindi
ICT / RWP 0.25 3.46 3.71 31.97 16.37 48.34
Attock 23.54 72.01 95.55 97.52 99.37 196.88
Chakwal (43.46) (2.07) (45.53) 17.53 13.63 31.16
Jehlum 0.12 0.44 0.55 14.10 6.03 20.13
Sub Total (19.56) 73.84 54.29 161.12 135.39 296.51
Mianwali
Khushab 0.04 0.25 0.29 35.41 16.86 52.28
Bhakkar 0.20 0.35 0.55 24.71 7.54 32.25
Mianwali 0.25 0.83 1.08 4.41 2.50 6.91
Sargodha 2.44 0.02 2.46 2.44 0.02 2.46
Sub Total 2.93 1.45 4.38 66.97 26.92 93.90
Bahawalpur
Bahawalpur - 0.23 0.23 - 5.47 5.47
Bahawalnagar - 1.04 1.04 - 10.13 10.13
Sub Total - 1.28 1.28 - 15.60 15.60
R.Y.Khan** R.Y.Khan 49.52 5.15 54.67 140.57 10.83 151.40
Sub Total 49.52 5.15 54.67 140.57 10.83 151.40
D.G.Khan
D.G.Khan 3.69 0.38 4.07 30.60 5.74 36.35
Rajanpur (0.39) (2.97) (3.35) 49.83 7.04 56.87
Sub Total 3.30 (2.59) 0.71 80.44 12.78 93.22
KPK Malakand
Malakand (0.01) 0.68 0.67 1.81 1.42 3.23
Mardan 0.00 1.20 1.20 4.58 2.02 6.60
Charsadda - - - 1.14 0.12 1.26
Swabi (0.03) 0.01 (0.02) 2.30 0.09 2.39
Swat - - - 0.60 0.17 0.77
Buner - - - 0.04 - 0.04
Nowshera 0.40 0.41 0.80 0.41 0.42 0.83
Sub Total 0.36 2.30 2.66 10.89 4.25 15.14
AJK Muzaffarabad
Kotli 0.16 0.18 0.33 3.19 4.44 7.63
Poonch (Rawalkot) 0.06 0.21 0.27 11.60 12.76 24.36
Muzaffarabad 0.08 0.11 0.18 1.91 2.20 4.10
Bagh 0.08 0.12 0.20 4.99 10.99 15.98
Sub Total 0.37 0.62 0.99 21.69 30.39 52.08
SINDH Hyderabad
Badin 0.77 0.98 1.75 22.38 7.97 30.35
Hyderabad 0.07 0.09 0.16 3.42 2.06 5.48
Tando M. Khan 0.03 0.02 0.05 4.98 1.95 6.93
Mirpurkhas 0.01 0.02 0.03 6.91 2.39 9.30
Matiari - - - 28.55 5.06 33.60
Tando Allah Yar - - - 2.40 0.59 2.99
Nawabshah - - - 0.14 0.45 0.59
Thatta 0.60 0.89 1.49 8.51 7.43 15.94
Sub Total 1.47 2.00 3.47 77.31 27.89 105.19
BALOCHISTAN Turbat
Kech / Turbat 0.28 0.77 1.05 5.15 4.62 9.77
Gawadar 0.05 0.18 0.23 0.82 1.35 2.17
Panjgoor 0.01 0.03 0.03 0.24 0.23 0.48
Awaran 0.01 0.00 0.01 0.51 0.37 0.89
Sub Total 0.34 0.97 1.32 6.73 6.58 13.30
Grand Total (Active) 38.73 85.03 123.76 565.71 270.64 836.34
NRSP Microfinance Bank - - - 551.71 3.15 554.86
Closed Regions - - - 24.13 9.09 33.22
Grand Total 38.73 85.03 123.76 1,141.54 282.88 1,424.42
Statistical Abstract
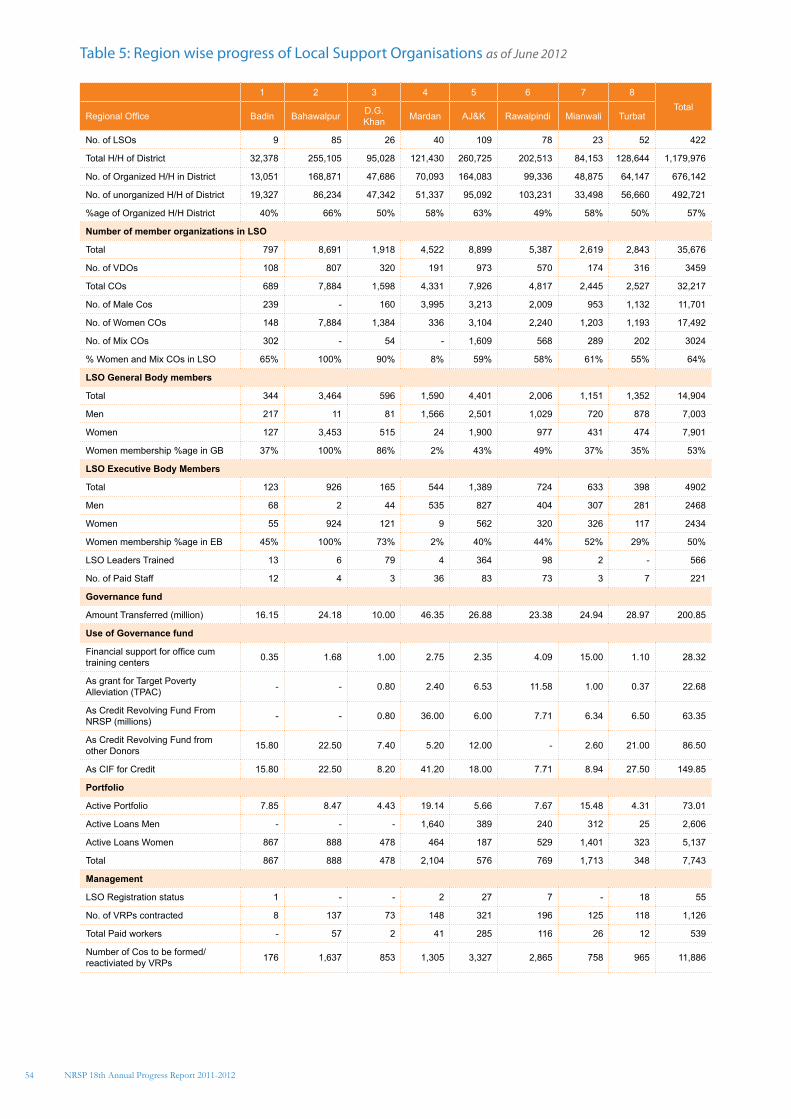
54
Table 5: Region wise progress of Local Support Organisations as of June 2012
1 2 3 4 5 6 7 8Total
Regional Office Badin Bahawalpur D.G. Khan Mardan AJ&K Rawalpindi Mianwali Turbat
No. of LSOs 9 85 26 40 109 78 23 52 422
Total H/H of District 32,378 255,105 95,028 121,430 260,725 202,513 84,153 128,644 1,179,976
No. of Organized H/H in District 13,051 168,871 47,686 70,093 164,083 99,336 48,875 64,147 676,142
No. of unorganized H/H of District 19,327 86,234 47,342 51,337 95,092 103,231 33,498 56,660 492,721
%age of Organized H/H District 40% 66% 50% 58% 63% 49% 58% 50% 57%
Number of member organizations in LSO
Total 797 8,691 1,918 4,522 8,899 5,387 2,619 2,843 35,676
No. of VDOs 108 807 320 191 973 570 174 316 3459
Total COs 689 7,884 1,598 4,331 7,926 4,817 2,445 2,527 32,217
No. of Male Cos 239 - 160 3,995 3,213 2,009 953 1,132 11,701
No. of Women COs 148 7,884 1,384 336 3,104 2,240 1,203 1,193 17,492
No. of Mix COs 302 - 54 - 1,609 568 289 202 3024
% Women and Mix COs in LSO 65% 100% 90% 8% 59% 58% 61% 55% 64%
LSO General Body members
Total 344 3,464 596 1,590 4,401 2,006 1,151 1,352 14,904
Men 217 11 81 1,566 2,501 1,029 720 878 7,003
Women 127 3,453 515 24 1,900 977 431 474 7,901
Women membership %age in GB 37% 100% 86% 2% 43% 49% 37% 35% 53%
LSO Executive Body Members
Total 123 926 165 544 1,389 724 633 398 4902
Men 68 2 44 535 827 404 307 281 2468
Women 55 924 121 9 562 320 326 117 2434
Women membership %age in EB 45% 100% 73% 2% 40% 44% 52% 29% 50%
LSO Leaders Trained 13 6 79 4 364 98 2 - 566
No. of Paid Staff 12 4 3 36 83 73 3 7 221
Governance fund
Amount Transferred (million) 16.15 24.18 10.00 46.35 26.88 23.38 24.94 28.97 200.85
Use of Governance fund
Financial support for office cum training centers 0.35 1.68 1.00 2.75 2.35 4.09 15.00 1.10 28.32
As grant for Target Poverty Alleviation (TPAC) - - 0.80 2.40 6.53 11.58 1.00 0.37 22.68
As Credit Revolving Fund From NRSP (millions) - - 0.80 36.00 6.00 7.71 6.34 6.50 63.35
As Credit Revolving Fund from other Donors 15.80 22.50 7.40 5.20 12.00 - 2.60 21.00 86.50
As CIF for Credit 15.80 22.50 8.20 41.20 18.00 7.71 8.94 27.50 149.85
Portfolio
Active Portfolio 7.85 8.47 4.43 19.14 5.66 7.67 15.48 4.31 73.01
Active Loans Men - - - 1,640 389 240 312 25 2,606
Active Loans Women 867 888 478 464 187 529 1,401 323 5,137
Total 867 888 478 2,104 576 769 1,713 348 7,743
Management
LSO Registration status 1 - - 2 27 7 - 18 55
No. of VRPs contracted 8 137 73 148 321 196 125 118 1,126
Total Paid workers - 57 2 41 285 116 26 12 539
Number of Cos to be formed/reactiviated by VRPs 176 1,637 853 1,305 3,327 2,865 758 965 11,886
NRSP 18th Annual Progress Report 2011-2012
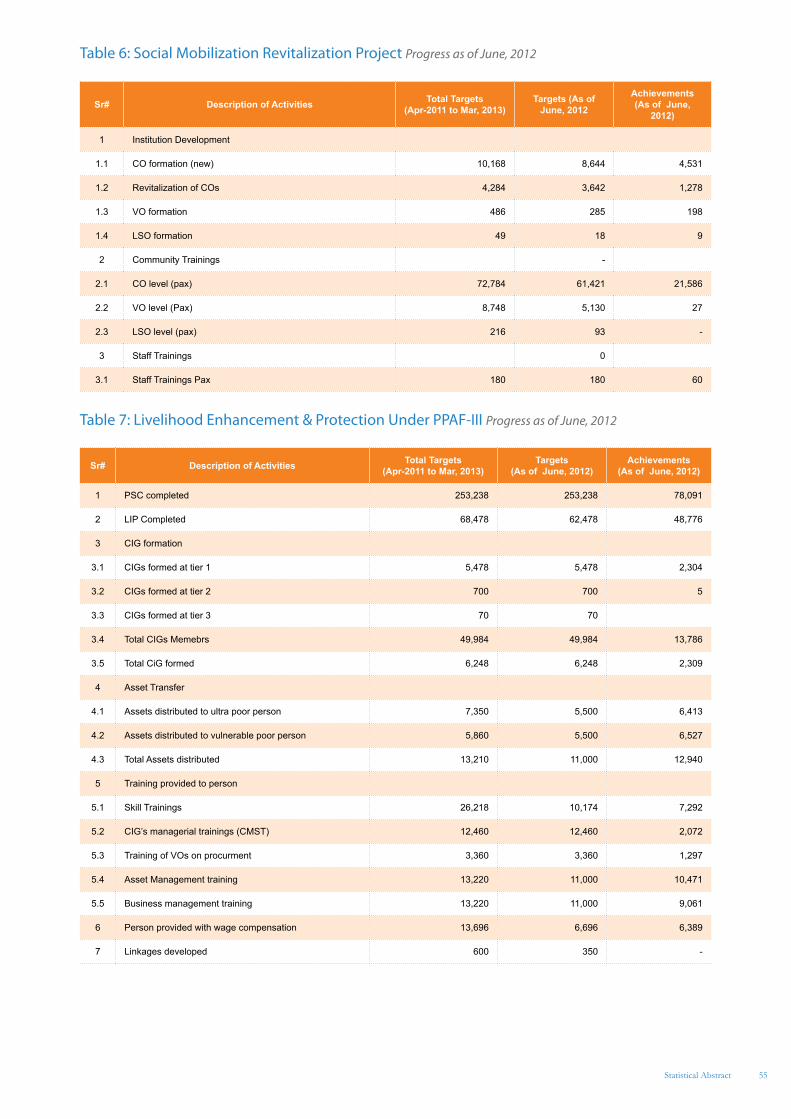
55
Table 6: Social Mobilization Revitalization Project Progress as of June, 2012
Sr# Description of Activities Total Targets (Apr-2011 to Mar, 2013)
Targets (As of June, 2012
Achievements (As of June,
2012)
1 Institution Development
1.1 CO formation (new) 10,168 8,644 4,531
1.2 Revitalization of COs 4,284 3,642 1,278
1.3 VO formation 486 285 198
1.4 LSO formation 49 18 9
2 Community Trainings -
2.1 CO level (pax) 72,784 61,421 21,586
2.2 VO level (Pax) 8,748 5,130 27
2.3 LSO level (pax) 216 93 -
3 Staff Trainings 0
3.1 Staff Trainings Pax 180 180 60
Table 7: Livelihood Enhancement & Protection Under PPAF-III Progress as of June, 2012
Sr# Description of Activities Total Targets (Apr-2011 to Mar, 2013)
Targets (As of June, 2012)
Achievements (As of June, 2012)
1 PSC completed 253,238 253,238 78,091
2 LIP Completed 68,478 62,478 48,776
3 CIG formation
3.1 CIGs formed at tier 1 5,478 5,478 2,304
3.2 CIGs formed at tier 2 700 700 5
3.3 CIGs formed at tier 3 70 70
3.4 Total CIGs Memebrs 49,984 49,984 13,786
3.5 Total CiG formed 6,248 6,248 2,309
4 Asset Transfer
4.1 Assets distributed to ultra poor person 7,350 5,500 6,413
4.2 Assets distributed to vulnerable poor person 5,860 5,500 6,527
4.3 Total Assets distributed 13,210 11,000 12,940
5 Training provided to person
5.1 Skill Trainings 26,218 10,174 7,292
5.2 CIG’s managerial trainings (CMST) 12,460 12,460 2,072
5.3 Training of VOs on procurment 3,360 3,360 1,297
5.4 Asset Management training 13,220 11,000 10,471
5.5 Business management training 13,220 11,000 9,061
6 Person provided with wage compensation 13,696 6,696 6,389
7 Linkages developed 600 350 -
Statistical Abstract
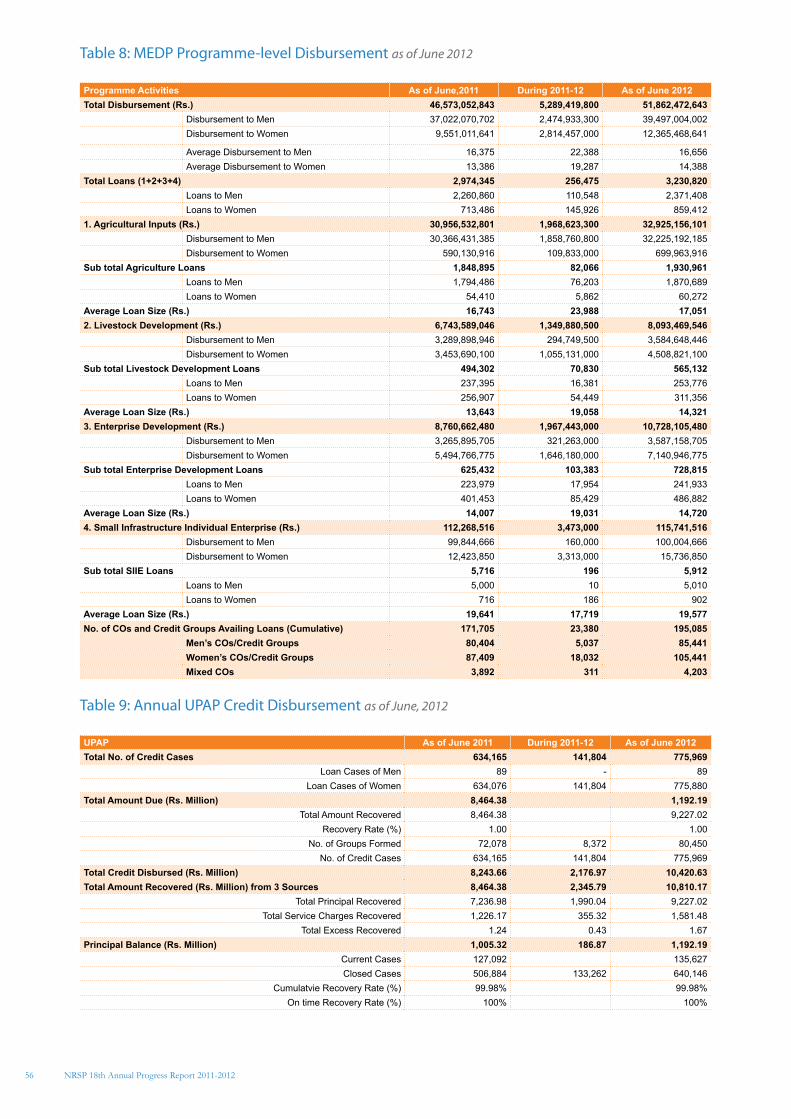
56
Table 8: MEDP Programme-level Disbursement as of June 2012
Programme Activities As of June,2011 During 2011-12 As of June 2012Total Disbursement (Rs.) 46,573,052,843 5,289,419,800 51,862,472,643
Disbursement to Men 37,022,070,702 2,474,933,300 39,497,004,002 Disbursement to Women 9,551,011,641 2,814,457,000 12,365,468,641
Average Disbursement to Men 16,375 22,388 16,656 Average Disbursement to Women 13,386 19,287 14,388
Total Loans (1+2+3+4) 2,974,345 256,475 3,230,820 Loans to Men 2,260,860 110,548 2,371,408 Loans to Women 713,486 145,926 859,412
1. Agricultural Inputs (Rs.) 30,956,532,801 1,968,623,300 32,925,156,101 Disbursement to Men 30,366,431,385 1,858,760,800 32,225,192,185 Disbursement to Women 590,130,916 109,833,000 699,963,916
Sub total Agriculture Loans 1,848,895 82,066 1,930,961 Loans to Men 1,794,486 76,203 1,870,689 Loans to Women 54,410 5,862 60,272
Average Loan Size (Rs.) 16,743 23,988 17,051 2. Livestock Development (Rs.) 6,743,589,046 1,349,880,500 8,093,469,546
Disbursement to Men 3,289,898,946 294,749,500 3,584,648,446 Disbursement to Women 3,453,690,100 1,055,131,000 4,508,821,100
Sub total Livestock Development Loans 494,302 70,830 565,132 Loans to Men 237,395 16,381 253,776 Loans to Women 256,907 54,449 311,356
Average Loan Size (Rs.) 13,643 19,058 14,321 3. Enterprise Development (Rs.) 8,760,662,480 1,967,443,000 10,728,105,480
Disbursement to Men 3,265,895,705 321,263,000 3,587,158,705 Disbursement to Women 5,494,766,775 1,646,180,000 7,140,946,775
Sub total Enterprise Development Loans 625,432 103,383 728,815 Loans to Men 223,979 17,954 241,933 Loans to Women 401,453 85,429 486,882
Average Loan Size (Rs.) 14,007 19,031 14,720 4. Small Infrastructure Individual Enterprise (Rs.) 112,268,516 3,473,000 115,741,516
Disbursement to Men 99,844,666 160,000 100,004,666 Disbursement to Women 12,423,850 3,313,000 15,736,850
Sub total SIIE Loans 5,716 196 5,912 Loans to Men 5,000 10 5,010 Loans to Women 716 186 902
Average Loan Size (Rs.) 19,641 17,719 19,577 No. of COs and Credit Groups Availing Loans (Cumulative) 171,705 23,380 195,085
Men’s COs/Credit Groups 80,404 5,037 85,441 Women’s COs/Credit Groups 87,409 18,032 105,441 Mixed COs 3,892 311 4,203
Table 9: Annual UPAP Credit Disbursement as of June, 2012
UPAP As of June 2011 During 2011-12 As of June 2012Total No. of Credit Cases 634,165 141,804 775,969
Loan Cases of Men 89 - 89 Loan Cases of Women 634,076 141,804 775,880
Total Amount Due (Rs. Million) 8,464.38 1,192.19 Total Amount Recovered 8,464.38 9,227.02
Recovery Rate (%) 1.00 1.00 No. of Groups Formed 72,078 8,372 80,450
No. of Credit Cases 634,165 141,804 775,969 Total Credit Disbursed (Rs. Million) 8,243.66 2,176.97 10,420.63 Total Amount Recovered (Rs. Million) from 3 Sources 8,464.38 2,345.79 10,810.17
Total Principal Recovered 7,236.98 1,990.04 9,227.02 Total Service Charges Recovered 1,226.17 355.32 1,581.48
Total Excess Recovered 1.24 0.43 1.67 Principal Balance (Rs. Million) 1,005.32 186.87 1,192.19
Current Cases 127,092 135,627 Closed Cases 506,884 133,262 640,146
Cumulatvie Recovery Rate (%) 99.98% 99.98%On time Recovery Rate (%) 100% 100%
NRSP 18th Annual Progress Report 2011-2012
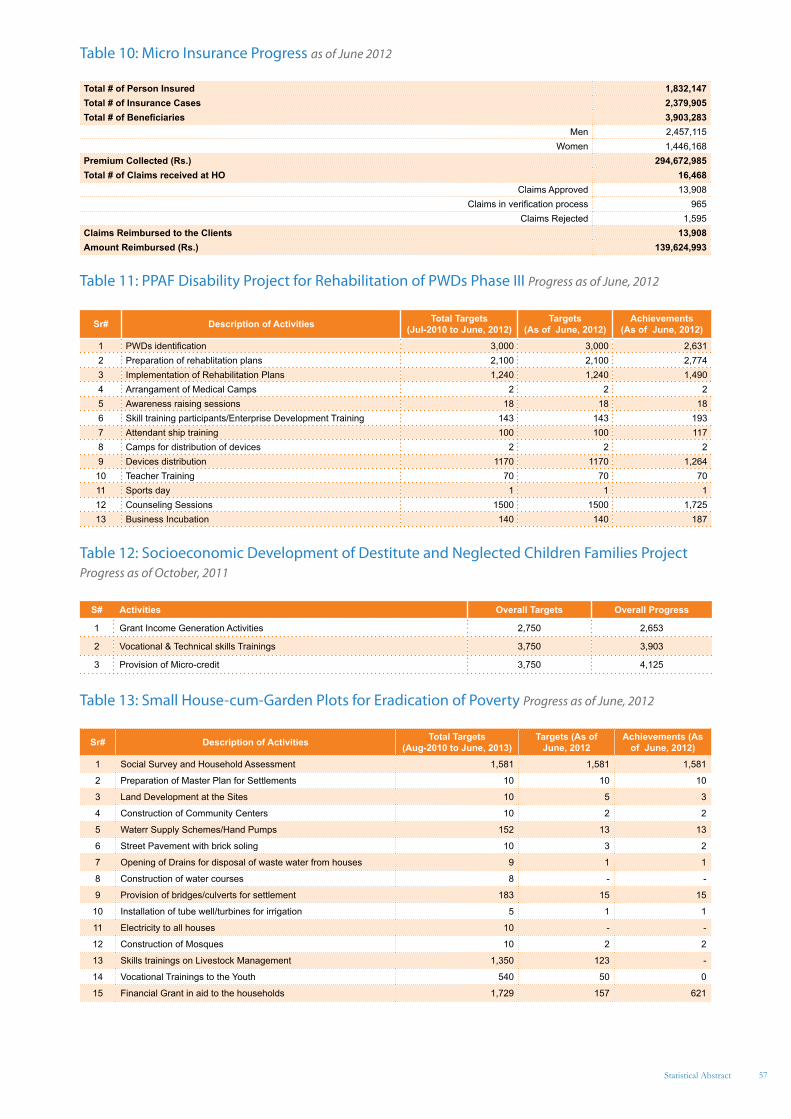
57
Table 10: Micro Insurance Progress as of June 2012
Total # of Person Insured 1,832,147 Total # of Insurance Cases 2,379,905 Total # of Beneficiaries 3,903,283
Men 2,457,115 Women 1,446,168
Premium Collected (Rs.) 294,672,985Total # of Claims received at HO 16,468
Claims Approved 13,908 Claims in verification process 965
Claims Rejected 1,595 Claims Reimbursed to the Clients 13,908 Amount Reimbursed (Rs.) 139,624,993
Table 11: PPAF Disability Project for Rehabilitation of PWDs Phase III Progress as of June, 2012
Sr# Description of Activities Total Targets (Jul-2010 to June, 2012)
Targets (As of June, 2012)
Achievements (As of June, 2012)
1 PWDs identification 3,000 3,000 2,631 2 Preparation of rehablitation plans 2,100 2,100 2,774 3 Implementation of Rehabilitation Plans 1,240 1,240 1,490 4 Arrangament of Medical Camps 2 2 2 5 Awareness raising sessions 18 18 18 6 Skill training participants/Enterprise Development Training 143 143 193 7 Attendant ship training 100 100 117 8 Camps for distribution of devices 2 2 2 9 Devices distribution 1170 1170 1,264
10 Teacher Training 70 70 70 11 Sports day 1 1 1 12 Counseling Sessions 1500 1500 1,725 13 Business Incubation 140 140 187
Table 12: Socioeconomic Development of Destitute and Neglected Children Families Project Progress as of October, 2011
S# Activities Overall Targets Overall Progress
1 Grant Income Generation Activities 2,750 2,653
2 Vocational & Technical skills Trainings 3,750 3,903
3 Provision of Micro-credit 3,750 4,125
Table 13: Small House-cum-Garden Plots for Eradication of Poverty Progress as of June, 2012
Sr# Description of Activities Total Targets (Aug-2010 to June, 2013)
Targets (As of June, 2012
Achievements (As of June, 2012)
1 Social Survey and Household Assessment 1,581 1,581 1,581
2 Preparation of Master Plan for Settlements 10 10 10
3 Land Development at the Sites 10 5 3
4 Construction of Community Centers 10 2 2
5 Waterr Supply Schemes/Hand Pumps 152 13 13
6 Street Pavement with brick soling 10 3 2
7 Opening of Drains for disposal of waste water from houses 9 1 1
8 Construction of water courses 8 - -
9 Provision of bridges/culverts for settlement 183 15 15
10 Installation of tube well/turbines for irrigation 5 1 1
11 Electricity to all houses 10 - -
12 Construction of Mosques 10 2 2
13 Skills trainings on Livestock Management 1,350 123 -
14 Vocational Trainings to the Youth 540 50 0
15 Financial Grant in aid to the households 1,729 157 621
Statistical Abstract
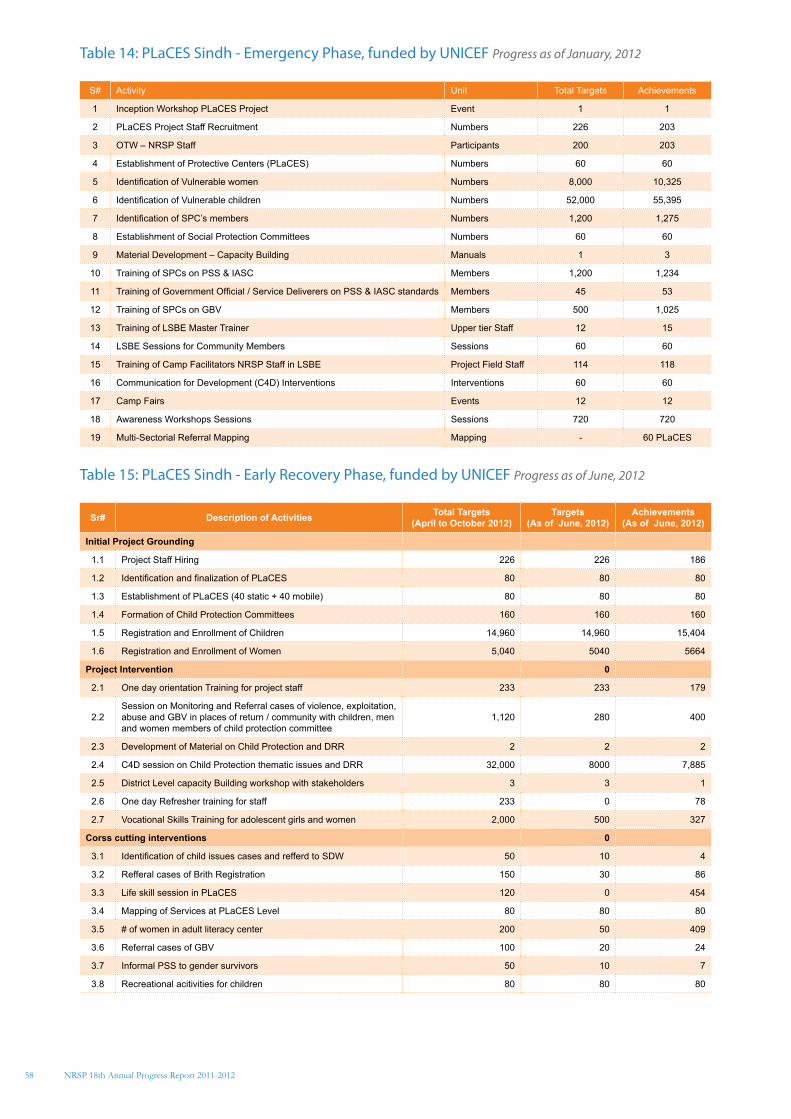
58 NRSP 18th Annual Progress Report 2011-2012
Table 14: PLaCES Sindh - Emergency Phase, funded by UNICEF Progress as of January, 2012
S# Activity Unit Total Targets Achievements
1 Inception Workshop PLaCES Project Event 1 1
2 PLaCES Project Staff Recruitment Numbers 226 203
3 OTW – NRSP Staff Participants 200 203
4 Establishment of Protective Centers (PLaCES) Numbers 60 60
5 Identification of Vulnerable women Numbers 8,000 10,325
6 Identification of Vulnerable children Numbers 52,000 55,395
7 Identification of SPC’s members Numbers 1,200 1,275
8 Establishment of Social Protection Committees Numbers 60 60
9 Material Development – Capacity Building Manuals 1 3
10 Training of SPCs on PSS & IASC Members 1,200 1,234
11 Training of Government Official / Service Deliverers on PSS & IASC standards Members 45 53
12 Training of SPCs on GBV Members 500 1,025
13 Training of LSBE Master Trainer Upper tier Staff 12 15
14 LSBE Sessions for Community Members Sessions 60 60
15 Training of Camp Facilitators NRSP Staff in LSBE Project Field Staff 114 118
16 Communication for Development (C4D) Interventions Interventions 60 60
17 Camp Fairs Events 12 12
18 Awareness Workshops Sessions Sessions 720 720
19 Multi-Sectorial Referral Mapping Mapping - 60 PLaCES
Table 15: PLaCES Sindh - Early Recovery Phase, funded by UNICEF Progress as of June, 2012
Sr# Description of Activities Total Targets (April to October 2012)
Targets (As of June, 2012)
Achievements (As of June, 2012)
Initial Project Grounding
1.1 Project Staff Hiring 226 226 186
1.2 Identification and finalization of PLaCES 80 80 80
1.3 Establishment of PLaCES (40 static + 40 mobile) 80 80 80
1.4 Formation of Child Protection Committees 160 160 160
1.5 Registration and Enrollment of Children 14,960 14,960 15,404
1.6 Registration and Enrollment of Women 5,040 5040 5664
Project Intervention 0
2.1 One day orientation Training for project staff 233 233 179
2.2Session on Monitoring and Referral cases of violence, exploitation, abuse and GBV in places of return / community with children, men and women members of child protection committee
1,120 280 400
2.3 Development of Material on Child Protection and DRR 2 2 2
2.4 C4D session on Child Protection thematic issues and DRR 32,000 8000 7,885
2.5 District Level capacity Building workshop with stakeholders 3 3 1
2.6 One day Refresher training for staff 233 0 78
2.7 Vocational Skills Training for adolescent girls and women 2,000 500 327
Corss cutting interventions 0
3.1 Identification of child issues cases and refferd to SDW 50 10 4
3.2 Refferal cases of Brith Registration 150 30 86
3.3 Life skill session in PLaCES 120 0 454
3.4 Mapping of Services at PLaCES Level 80 80 80
3.5 # of women in adult literacy center 200 50 409
3.6 Referral cases of GBV 100 20 24
3.7 Informal PSS to gender survivors 50 10 7
3.8 Recreational acitivities for children 80 80 80
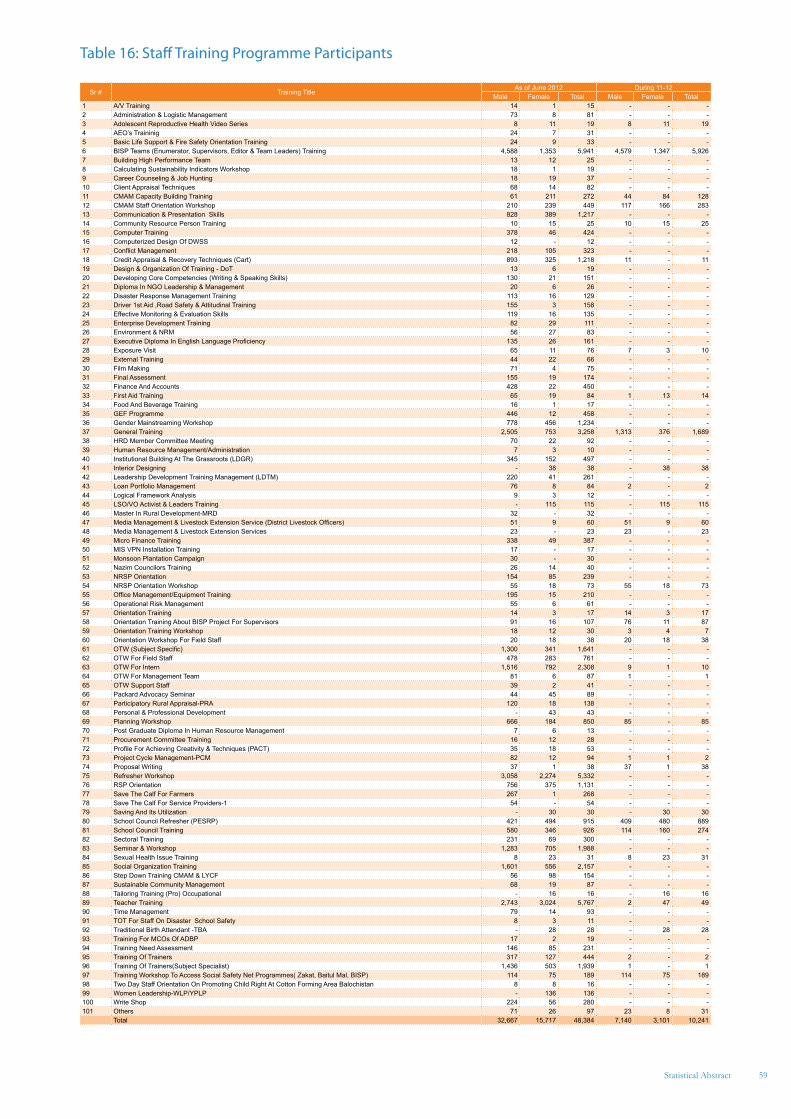
59Statistical Abstract
Table 16: Staff Training Programme Participants
Sr # Training TitleAs of June 2012 During 11-12
Male Female Total Male Female Total1 A/V Training 14 1 15 - - - 2 Administration & Logistic Management 73 8 81 - - - 3 Adolescent Reproductive Health Video Series 8 11 19 8 11 19 4 AEO’s Traininig 24 7 31 - - - 5 Basic Life Support & Fire Safety Orientation Training 24 9 33 - - - 6 BISP Teams (Enumerator, Supervisors, Editor & Team Leaders) Training 4,588 1,353 5,941 4,579 1,347 5,926 7 Building High Performance Team 13 12 25 - - - 8 Calculating Sustainability Indicators Workshop 18 1 19 - - - 9 Career Counseling & Job Hunting 18 19 37 - - - 10 Client Appraisal Techniques 68 14 82 - - - 11 CMAM Capacity Building Training 61 211 272 44 84 128 12 CMAM Staff Orientation Workshop 210 239 449 117 166 283 13 Communication & Presentation Skills 828 389 1,217 - - - 14 Community Resource Person Training 10 15 25 10 15 25 15 Computer Training 378 46 424 - - - 16 Computerized Design Of DWSS 12 - 12 - - - 17 Conflict Management 218 105 323 - - - 18 Credit Appraisal & Recovery Techniques (Cart) 893 325 1,218 11 - 11 19 Design & Organization Of Training - DoT 13 6 19 - - - 20 Developing Core Competencies (Writing & Speaking Skills) 130 21 151 - - - 21 Diploma In NGO Leadership & Management 20 6 26 - - - 22 Disaster Response Management Training 113 16 129 - - - 23 Driver 1st Aid ,Road Safety & Attitudinal Training 155 3 158 - - - 24 Effective Monitoring & Evaluation Skills 119 16 135 - - - 25 Enterprise Development Training 82 29 111 - - - 26 Environment & NRM 56 27 83 - - - 27 Executive Diploma In English Language Proficiency 135 26 161 - - - 28 Exposure Visit 65 11 76 7 3 10 29 External Training 44 22 66 - - - 30 Film Making 71 4 75 - - - 31 Final Assessment 155 19 174 - - - 32 Finance And Accounts 428 22 450 - - - 33 First Aid Training 65 19 84 1 13 14 34 Food And Beverage Training 16 1 17 - - - 35 GEF Programme 446 12 458 - - - 36 Gender Mainstreaming Workshop 778 456 1,234 - - - 37 General Training 2,505 753 3,258 1,313 376 1,689 38 HRD Member Committee Meeting 70 22 92 - - - 39 Human Resource Management/Administration 7 3 10 - - - 40 Institutional Building At The Grassroots (LDGR) 345 152 497 - - - 41 Interior Designing - 38 38 - 38 38 42 Leadership Development Training Management (LDTM) 220 41 261 - - - 43 Loan Portfolio Management 76 8 84 2 - 2 44 Logical Framework Analysis 9 3 12 - - - 45 LSO/VO Activist & Leaders Training - 115 115 - 115 115 46 Master In Rural Development-MRD 32 - 32 - - - 47 Media Management & Livestock Extension Service (District Livestock Officers) 51 9 60 51 9 60 48 Media Management & Livestock Extension Services 23 - 23 23 - 23 49 Micro Finance Training 338 49 387 - - - 50 MIS VPN Installation Training 17 - 17 - - - 51 Monsoon Plantation Campaign 30 - 30 - - - 52 Nazim Councilors Training 26 14 40 - - - 53 NRSP Orientation 154 85 239 - - - 54 NRSP Orientation Workshop 55 18 73 55 18 73 55 Office Management/Equipment Training 195 15 210 - - - 56 Operational Risk Management 55 6 61 - - - 57 Orientation Training 14 3 17 14 3 17 58 Orientation Training About BISP Project For Supervisors 91 16 107 76 11 87 59 Orientation Training Workshop 18 12 30 3 4 7 60 Orientation Workshop For Field Staff 20 18 38 20 18 38 61 OTW (Subject Specific) 1,300 341 1,641 - - - 62 OTW For Field Staff 478 283 761 - - - 63 OTW For Intern 1,516 792 2,308 9 1 10 64 OTW For Management Team 81 6 87 1 - 1 65 OTW Support Staff 39 2 41 - - - 66 Packard Advocacy Seminar 44 45 89 - - - 67 Participatory Rural Appraisal-PRA 120 18 138 - - - 68 Personal & Professional Development - 43 43 - - - 69 Planning Workshop 666 184 850 85 - 85 70 Post Graduate Diploma In Human Resource Management 7 6 13 - - - 71 Procurement Committee Training 16 12 28 - - - 72 Profile For Achieving Creativity & Techniques (PACT) 35 18 53 - - - 73 Project Cycle Management-PCM 82 12 94 1 1 2 74 Proposal Writing 37 1 38 37 1 38 75 Refresher Workshop 3,058 2,274 5,332 - - - 76 RSP Orientation 756 375 1,131 - - - 77 Save The Calf For Farmers 267 1 268 - - - 78 Save The Calf For Service Providers-1 54 - 54 - - - 79 Saving And Its Utilization - 30 30 - 30 30 80 School Council Refresher (PESRP) 421 494 915 409 480 889 81 School Council Training 580 346 926 114 160 274 82 Sectoral Training 231 69 300 - - - 83 Seminar & Workshop 1,283 705 1,988 - - - 84 Sexual Health Issue Training 8 23 31 8 23 31 85 Social Organization Training 1,601 556 2,157 - - - 86 Step Down Training CMAM & LYCF 56 98 154 - - - 87 Sustainable Community Management 68 19 87 - - - 88 Tailoring Training (Pro) Occupational - 16 16 - 16 16 89 Teacher Training 2,743 3,024 5,767 2 47 49 90 Time Management 79 14 93 - - - 91 TOT For Staff On Disaster School Safety 8 3 11 - - - 92 Traditional Birth Attendant -TBA - 28 28 - 28 28 93 Training For MCOs Of ADBP 17 2 19 - - - 94 Training Need Assessment 146 85 231 - - - 95 Training Of Trainers 317 127 444 2 - 2 96 Training Of Trainers(Subject Specialist) 1,436 503 1,939 1 - 1 97 Training Workshop To Access Social Safety Net Programmes( Zakat, Baitul Mal, BISP) 114 75 189 114 75 189 98 Two Day Staff Orientation On Promoting Child Right At Cotton Forming Area Balochistan 8 8 16 - - - 99 Women Leadership-WLP/YPLP - 136 136 - - - 100 Write Shop 224 56 280 - - - 101 Others 71 26 97 23 8 31
Total 32,667 15,717 48,384 7,140 3,101 10,241
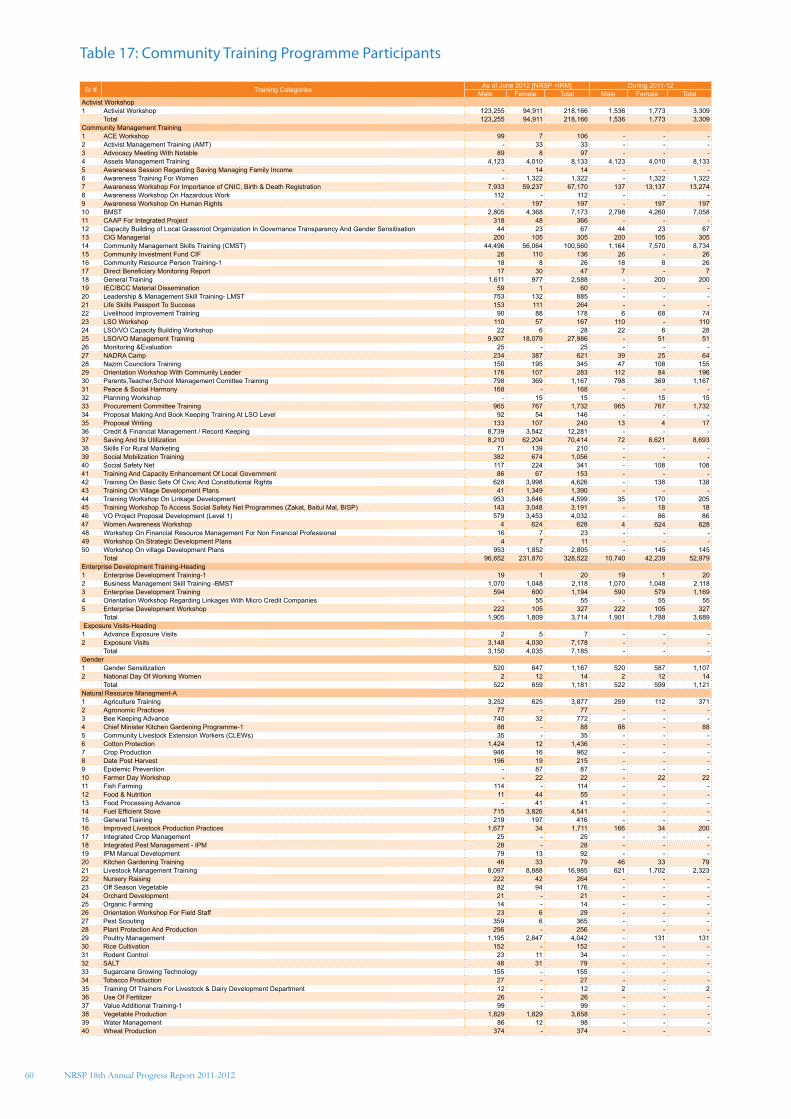
60
Table 17: Community Training Programme Participants
Sr # Training Categories As of June 2012 [NRSP +IRM] During 2011-12Male Female Total Male Female Total
Activist Workshop1 Activist Workshop 123,255 94,911 218,166 1,536 1,773 3,309
Total 123,255 94,911 218,166 1,536 1,773 3,309 Community Management Training1 ACE Workshop 99 7 106 - - - 2 Activist Management Training (AMT) - 33 33 - - - 3 Advocacy Meeting With Notable 89 8 97 - - - 4 Assets Management Training 4,123 4,010 8,133 4,123 4,010 8,133 5 Awareness Session Regarding Saving Managing Family Income - 14 14 - - - 6 Awareness Training For Women - 1,322 1,322 - 1,322 1,322 7 Awareness Workshop For Importance of CNIC, Birth & Death Registration 7,933 59,237 67,170 137 13,137 13,274 8 Awareness Workshop On Hazardous Work 112 - 112 - - - 9 Awareness Workshop On Human Rights - 197 197 - 197 197 10 BMST 2,805 4,368 7,173 2,798 4,260 7,058 11 CAAP For Integrated Project 318 48 366 - - - 12 Capacity Building of Local Grassroot Organization In Governance Transparency And Gender Sensitisation 44 23 67 44 23 67 13 CIG Managerial 200 105 305 200 105 305 14 Community Management Skills Training (CMST) 44,496 56,064 100,560 1,164 7,570 8,734 15 Community Investment Fund CIF 26 110 136 26 - 26 16 Community Resource Person Training-1 18 8 26 18 8 26 17 Direct Beneficiary Monitoring Report 17 30 47 7 - 7 18 General Training 1,611 977 2,588 - 200 200 19 IEC/BCC Material Dissemination 59 1 60 - - - 20 Leadership & Management Skill Training- LMST 753 132 885 - - - 21 Life Skills Passport To Success 153 111 264 - - - 22 Livelihood Improvement Training 90 88 178 6 68 74 23 LSO Workshop 110 57 167 110 - 110 24 LSO/VO Capacity Building Workshop 22 6 28 22 6 28 25 LSO/VO Management Training 9,907 18,079 27,986 - 51 51 26 Monitoring &Evaluation 25 - 25 - - - 27 NADRA Camp 234 387 621 39 25 64 28 Nazim Councilors Training 150 195 345 47 108 155 29 Orientation Workshop With Community Leader 176 107 283 112 84 196 30 Parents,Teacher,School Management Comittee Training 798 369 1,167 798 369 1,167 31 Peace & Social Harmony 168 - 168 - - - 32 Planning Workshop - 15 15 - 15 15 33 Procurement Committee Training 965 767 1,732 965 767 1,732 34 Proposal Making And Book Keeping Training At LSO Level 92 54 146 - - - 35 Proposal Writing 133 107 240 13 4 17 36 Credit & Financial Management / Record Keeping 8,739 3,542 12,281 - - - 37 Saving And Its Utilization 8,210 62,204 70,414 72 8,621 8,693 38 Skills For Rural Marketing 71 139 210 - - - 39 Social Mobilization Training 382 674 1,056 - - - 40 Social Safety Net 117 224 341 - 108 108 41 Training And Capacity Enhancement Of Local Government 86 67 153 - - - 42 Training On Basic Sets Of Civic And Constitutional Rights 628 3,998 4,626 - 138 138 43 Training On Village Development Plans 41 1,349 1,390 - - - 44 Training Workshop On Linkage Development 953 3,646 4,599 35 170 205 45 Training Workshop To Access Social Safety Net Programmes (Zakat, Baitul Mal, BISP) 143 3,048 3,191 - 18 18 46 VO Project Proposal Development (Level 1) 579 3,453 4,032 - 86 86 47 Women Awareness Workshop 4 624 628 4 624 628 48 Workshop On Financial Resource Management For Non Financial Professional 16 7 23 - - - 49 Workshop On Strategic Development Plans 4 7 11 - - - 50 Workshop On village Development Plans 953 1,852 2,805 - 145 145
Total 96,652 231,870 328,522 10,740 42,239 52,979 Enterprise Development Training-Heading1 Enterprise Development Training-1 19 1 20 19 1 20 2 Business Management Skill Training -BMST 1,070 1,048 2,118 1,070 1,048 2,118 3 Enterprise Development Training 594 600 1,194 590 579 1,169 4 Orientation Workshop Regarding Linkages With Micro Credit Companies - 55 55 - 55 55 5 Enterprise Development Workshop 222 105 327 222 105 327
Total 1,905 1,809 3,714 1,901 1,788 3,689 Exposure Visits-Heading1 Advance Exposure Visits 2 5 7 - - - 2 Exposure Visits 3,148 4,030 7,178 - - -
Total 3,150 4,035 7,185 - - - Gender1 Gender Sensitization 520 647 1,167 520 587 1,107 2 National Day Of Working Women 2 12 14 2 12 14
Total 522 659 1,181 522 599 1,121 Natural Resource Managment-A1 Agriculture Training 3,252 625 3,877 259 112 371 2 Agronomic Practices 77 - 77 - - - 3 Bee Keeping Advance 740 32 772 - - - 4 Chief Minister Kitchen Gardening Programme-1 88 - 88 88 - 88 5 Community Livestock Extension Workers (CLEWs) 35 - 35 - - - 6 Cotton Protection 1,424 12 1,436 - - - 7 Crop Production 946 16 962 - - - 8 Date Post Harvest 196 19 215 - - - 9 Epidemic Prevention - 87 87 - - - 10 Farmer Day Workshop - 22 22 - 22 22 11 Fish Farming 114 - 114 - - - 12 Food & Nutrition 11 44 55 - - - 13 Food Processing Advance - 41 41 - - - 14 Fuel Efficient Stove 715 3,826 4,541 - - - 15 General Training 219 197 416 - - - 16 Improved Livestock Production Practices 1,677 34 1,711 166 34 200 17 Integrated Crop Management 25 - 25 - - - 18 Integrated Pest Management - IPM 28 - 28 - - - 19 IPM Manual Development 79 13 92 - - - 20 Kitchen Gardening Training 46 33 79 46 33 79 21 Livestock Management Training 8,097 8,888 16,985 621 1,702 2,323 22 Nursery Raising 222 42 264 - - - 23 Off Season Vegetable 82 94 176 - - - 24 Orchard Development 21 - 21 - - - 25 Organic Farming 14 - 14 - - - 26 Orientation Workshop For Field Staff 23 6 29 - - - 27 Pest Scouting 359 6 365 - - - 28 Plant Protection And Production 256 - 256 - - - 29 Poultry Management 1,195 2,847 4,042 - 131 131 30 Rice Cultivation 152 - 152 - - - 31 Rodent Control 23 11 34 - - - 32 SALT 48 31 79 - - - 33 Sugarcane Growing Technology 155 - 155 - - - 34 Tobacco Production 27 - 27 - - - 35 Training Of Trainers For Livestock & Dairy Development Department 12 - 12 2 - 2 36 Use Of Fertilizer 26 - 26 - - - 37 Value Additional Training-1 99 - 99 - - - 38 Vegetable Production 1,829 1,829 3,658 - - - 39 Water Management 86 12 98 - - - 40 Wheat Production 374 - 374 - - -
NRSP 18th Annual Progress Report 2011-2012
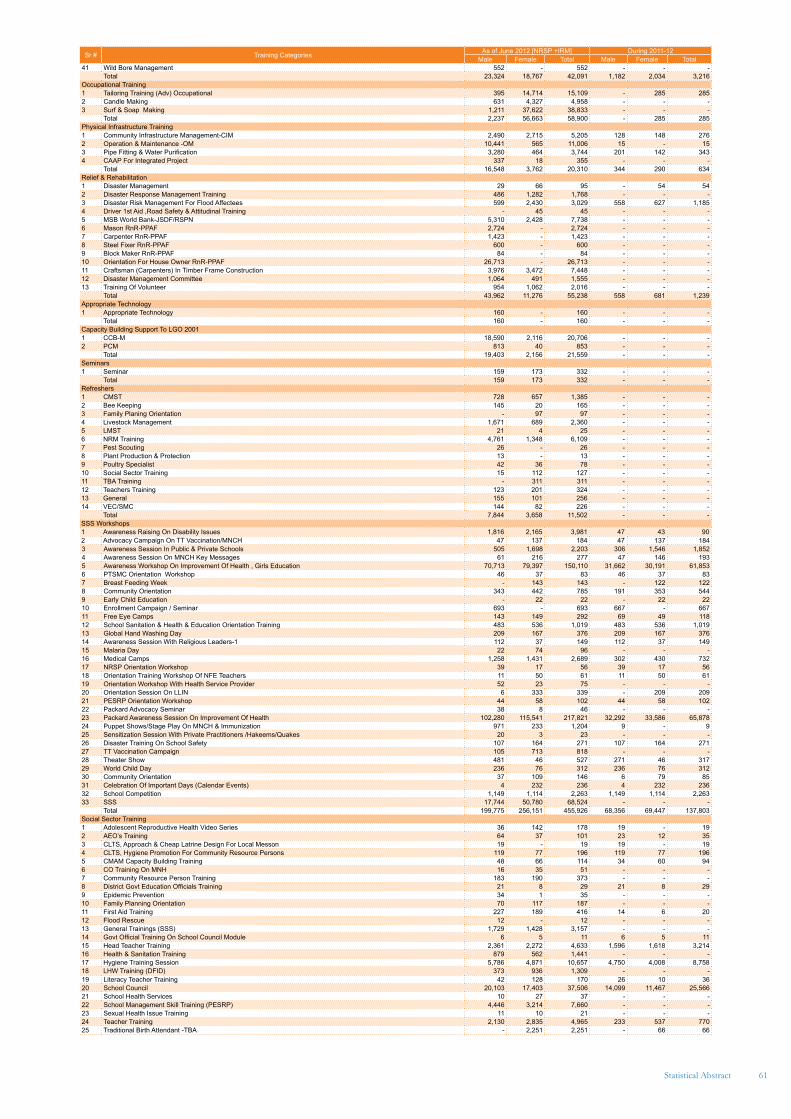
61Statistical Abstract
Sr # Training Categories As of June 2012 [NRSP +IRM] During 2011-12Male Female Total Male Female Total
41 Wild Bore Management 552 - 552 - - - Total 23,324 18,767 42,091 1,182 2,034 3,216
Occupational Training1 Tailoring Training (Adv) Occupational 395 14,714 15,109 - 285 285 2 Candle Making 631 4,327 4,958 - - - 3 Surf & Soap Making 1,211 37,622 38,833 - - -
Total 2,237 56,663 58,900 - 285 285 Physical Infrastructure Training1 Community Infrastructure Management-CIM 2,490 2,715 5,205 128 148 276 2 Operation & Maintenance -OM 10,441 565 11,006 15 - 15 3 Pipe Fitting & Water Purification 3,280 464 3,744 201 142 343 4 CAAP For Integrated Project 337 18 355 - - -
Total 16,548 3,762 20,310 344 290 634 Relief & Rehabilitation1 Disaster Management 29 66 95 - 54 54 2 Disaster Response Management Training 486 1,282 1,768 - - - 3 Disaster Risk Management For Flood Affectees 599 2,430 3,029 558 627 1,185 4 Driver 1st Aid ,Road Safety & Attitudinal Training - 45 45 - - - 5 MSB World Bank-JSDF/RSPN 5,310 2,428 7,738 - - - 6 Mason RnR-PPAF 2,724 - 2,724 - - - 7 Carpenter RnR-PPAF 1,423 - 1,423 - - - 8 Steel Fixer RnR-PPAF 600 - 600 - - - 9 Block Maker RnR-PPAF 84 - 84 - - - 10 Orientation For House Owner RnR-PPAF 26,713 - 26,713 - - - 11 Craftsman (Carpenters) In Timber Frame Construction 3,976 3,472 7,448 - - - 12 Disaster Management Committee 1,064 491 1,555 - - - 13 Training Of Volunteer 954 1,062 2,016 - - -
Total 43,962 11,276 55,238 558 681 1,239 Appropriate Technology1 Appropriate Technology 160 - 160 - - -
Total 160 - 160 - - - Capacity Building Support To LGO 20011 CCB-M 18,590 2,116 20,706 - - - 2 PCM 813 40 853 - - -
Total 19,403 2,156 21,559 - - - Seminars1 Seminar 159 173 332 - - -
Total 159 173 332 - - - Refreshers1 CMST 728 657 1,385 - - - 2 Bee Keeping 145 20 165 - - - 3 Family Planing Orientation - 97 97 - - - 4 Livestock Management 1,671 689 2,360 - - - 5 LMST 21 4 25 - - - 6 NRM Training 4,761 1,348 6,109 - - - 7 Pest Scouting 26 - 26 - - - 8 Plant Production & Protection 13 - 13 - - - 9 Poultry Specialist 42 36 78 - - - 10 Social Sector Training 15 112 127 - - - 11 TBA Training - 311 311 - - - 12 Teachers Training 123 201 324 - - - 13 General 155 101 256 - - - 14 VEC/SMC 144 82 226 - - -
Total 7,844 3,658 11,502 - - - SSS Workshops1 Awareness Raising On Disability Issues 1,816 2,165 3,981 47 43 90 2 Advocacy Campaign On TT Vaccination/MNCH 47 137 184 47 137 184 3 Awareness Session In Public & Private Schools 505 1,698 2,203 306 1,546 1,852 4 Awareness Session On MNCH Key Messages 61 216 277 47 146 193 5 Awareness Workshop On Improvement Of Health , Girls Education 70,713 79,397 150,110 31,662 30,191 61,853 6 PTSMC Orientation Workshop 46 37 83 46 37 83 7 Breast Feeding Week - 143 143 - 122 122 8 Community Orientation 343 442 785 191 353 544 9 Early Child Education - 22 22 - 22 22 10 Enrollment Campaign / Seminar 693 - 693 667 - 667 11 Free Eye Camps 143 149 292 69 49 118 12 School Sanitation & Health & Education Orientation Training 483 536 1,019 483 536 1,019 13 Global Hand Washing Day 209 167 376 209 167 376 14 Awareness Session With Religious Leaders-1 112 37 149 112 37 149 15 Malaria Day 22 74 96 - - - 16 Medical Camps 1,258 1,431 2,689 302 430 732 17 NRSP Orientation Workshop 39 17 56 39 17 56 18 Orientation Training Workshop Of NFE Teachers 11 50 61 11 50 61 19 Orientation Workshop With Health Service Provider 52 23 75 - - - 20 Orientation Session On LLIN 6 333 339 - 209 209 21 PESRP Orientation Workshop 44 58 102 44 58 102 22 Packard Advocacy Seminar 38 8 46 - - - 23 Packard Awareness Session On Improvement Of Health 102,280 115,541 217,821 32,292 33,586 65,878 24 Puppet Shows/Stage Play On MNCH & Immunization 971 233 1,204 9 - 9 25 Sensitization Session With Private Practitioners /Hakeems/Quakes 20 3 23 - - - 26 Disaster Training On School Safety 107 164 271 107 164 271 27 TT Vaccination Campaign 105 713 818 - - - 28 Theater Show 481 46 527 271 46 317 29 World Child Day 236 76 312 236 76 312 30 Community Orientation 37 109 146 6 79 85 31 Celebration Of Important Days (Calendar Events) 4 232 236 4 232 236 32 School Competition 1,149 1,114 2,263 1,149 1,114 2,263 33 SSS 17,744 50,780 68,524 - - -
Total 199,775 256,151 455,926 68,356 69,447 137,803 Social Sector Training1 Adolescent Reproductive Health Video Series 36 142 178 19 - 19 2 AEO’s Training 64 37 101 23 12 35 3 CLTS, Approach & Cheap Latrine Design For Local Messon 19 - 19 19 - 19 4 CLTS, Hygiene Promotion For Community Resource Persons 119 77 196 119 77 196 5 CMAM Capacity Building Training 48 66 114 34 60 94 6 CO Training On MNH 16 35 51 - - - 7 Community Resource Person Training 183 190 373 - - - 8 District Govt Education Officials Training 21 8 29 21 8 29 9 Epidemic Prevention 34 1 35 - - - 10 Family Planning Orientation 70 117 187 - - - 11 First Aid Training 227 189 416 14 6 20 12 Flood Rescue 12 - 12 - - - 13 General Trainings (SSS) 1,729 1,428 3,157 - - - 14 Govt Official Training On School Council Module 6 5 11 6 5 11 15 Head Teacher Training 2,361 2,272 4,633 1,596 1,618 3,214 16 Health & Sanitation Training 879 562 1,441 - - - 17 Hygiene Training Session 5,786 4,871 10,657 4,750 4,008 8,758 18 LHW Training (DFID) 373 936 1,309 - - - 19 Literacy Teacher Training 42 128 170 26 10 36 20 School Council 20,103 17,403 37,506 14,099 11,467 25,566 21 School Health Services 10 27 37 - - - 22 School Management Skill Training (PESRP) 4,446 3,214 7,660 - - - 23 Sexual Health Issue Training 11 10 21 - - - 24 Teacher Training 2,130 2,835 4,965 233 537 770 25 Traditional Birth Attendant -TBA - 2,251 2,251 - 66 66
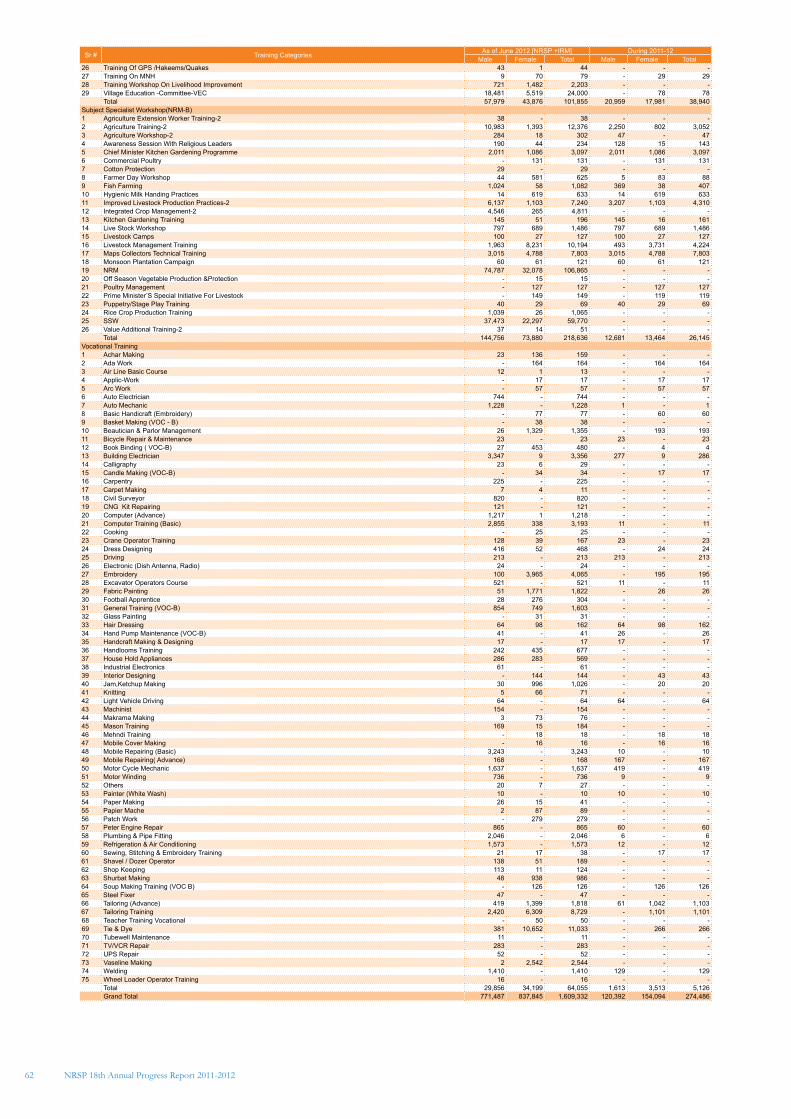
62
Sr # Training Categories As of June 2012 [NRSP +IRM] During 2011-12Male Female Total Male Female Total
26 Training Of GPS /Hakeems/Quakes 43 1 44 - - - 27 Training On MNH 9 70 79 - 29 29 28 Training Workshop On Livelihood Improvement 721 1,482 2,203 - - - 29 Village Education -Committee-VEC 18,481 5,519 24,000 - 78 78
Total 57,979 43,876 101,855 20,959 17,981 38,940 Subject Specialist Workshop(NRM-B)1 Agriculture Extension Worker Training-2 38 - 38 - - - 2 Agriculture Training-2 10,983 1,393 12,376 2,250 802 3,052 3 Agriculture Workshop-2 284 18 302 47 - 47 4 Awareness Session With Religious Leaders 190 44 234 128 15 143 5 Chief Minister Kitchen Gardening Programme 2,011 1,086 3,097 2,011 1,086 3,097 6 Commercial Poultry - 131 131 - 131 131 7 Cotton Protection 29 - 29 - - - 8 Farmer Day Workshop 44 581 625 5 83 88 9 Fish Farming 1,024 58 1,082 369 38 407 10 Hygienic Milk Handing Practices 14 619 633 14 619 633 11 Improved Livestock Production Practices-2 6,137 1,103 7,240 3,207 1,103 4,310 12 Integrated Crop Management-2 4,546 265 4,811 - - - 13 Kitchen Gardening Training 145 51 196 145 16 161 14 Live Stock Workshop 797 689 1,486 797 689 1,486 15 Livestock Camps 100 27 127 100 27 127 16 Livestock Management Training 1,963 8,231 10,194 493 3,731 4,224 17 Maps Collectors Technical Training 3,015 4,788 7,803 3,015 4,788 7,803 18 Monsoon Plantation Campaign 60 61 121 60 61 121 19 NRM 74,787 32,078 106,865 - - - 20 Off Season Vegetable Production &Protection - 15 15 - - - 21 Poultry Management - 127 127 - 127 127 22 Prime Minister’S Special Initiative For Livestock - 149 149 - 119 119 23 Puppetry/Stage Play Training 40 29 69 40 29 69 24 Rice Crop Production Training 1,039 26 1,065 - - - 25 SSW 37,473 22,297 59,770 - - - 26 Value Additional Training-2 37 14 51 - - -
Total 144,756 73,880 218,636 12,681 13,464 26,145 Vocational Training1 Achar Making 23 136 159 - - - 2 Ada Work - 164 164 - 164 164 3 Air Line Basic Course 12 1 13 - - - 4 Applic-Work - 17 17 - 17 17 5 Arc Work - 57 57 - 57 57 6 Auto Electrician 744 - 744 - - - 7 Auto Mechanic 1,228 - 1,228 1 - 1 8 Basic Handicraft (Embroidery) - 77 77 - 60 60 9 Basket Making (VOC - B) - 38 38 - - - 10 Beautician & Parlor Management 26 1,329 1,355 - 193 193 11 Bicycle Repair & Maintenance 23 - 23 23 - 23 12 Book Binding ( VOC-B) 27 453 480 - 4 4 13 Building Electrician 3,347 9 3,356 277 9 286 14 Calligraphy 23 6 29 - - - 15 Candle Making (VOC-B) - 34 34 - 17 17 16 Carpentry 225 - 225 - - - 17 Carpet Making 7 4 11 - - - 18 Civil Surveyor 820 - 820 - - - 19 CNG Kit Repairing 121 - 121 - - - 20 Computer (Advance) 1,217 1 1,218 - - - 21 Computer Training (Basic) 2,855 338 3,193 11 - 11 22 Cooking - 25 25 - - - 23 Crane Operator Training 128 39 167 23 - 23 24 Dress Designing 416 52 468 - 24 24 25 Driving 213 - 213 213 - 213 26 Electronic (Dish Antenna, Radio) 24 - 24 - - - 27 Embroidery 100 3,965 4,065 - 195 195 28 Excavator Operators Course 521 - 521 11 - 11 29 Fabric Painting 51 1,771 1,822 - 26 26 30 Football Apprentice 28 276 304 - - - 31 General Training (VOC-B) 854 749 1,603 - - - 32 Glass Painting - 31 31 - - - 33 Hair Dressing 64 98 162 64 98 162 34 Hand Pump Maintenance (VOC-B) 41 - 41 26 - 26 35 Handcraft Making & Designing 17 - 17 17 - 17 36 Handlooms Training 242 435 677 - - - 37 House Hold Appliances 286 283 569 - - - 38 Industrial Electronics 61 - 61 - - - 39 Interior Designing - 144 144 - 43 43 40 Jam,Ketchup Making 30 996 1,026 - 20 20 41 Knitting 5 66 71 - - - 42 Light Vehicle Driving 64 - 64 64 - 64 43 Machinist 154 - 154 - - - 44 Makrama Making 3 73 76 - - - 45 Mason Training 169 15 184 - - - 46 Mehndi Training - 18 18 - 18 18 47 Mobile Cover Making - 16 16 - 16 16 48 Mobile Repairing (Basic) 3,243 - 3,243 10 - 10 49 Mobile Repairing( Advance) 168 - 168 167 - 167 50 Motor Cycle Mechanic 1,637 - 1,637 419 - 419 51 Motor Winding 736 - 736 9 - 9 52 Others 20 7 27 - - - 53 Painter (White Wash) 10 - 10 10 - 10 54 Paper Making 26 15 41 - - - 55 Papier Mache 2 87 89 - - - 56 Patch Work - 279 279 - - - 57 Peter Engine Repair 865 - 865 60 - 60 58 Plumbing & Pipe Fitting 2,046 - 2,046 6 - 6 59 Refrigeration & Air Conditioning 1,573 - 1,573 12 - 12 60 Sewing, Stitching & Embroidery Training 21 17 38 - 17 17 61 Shavel / Dozer Operator 138 51 189 - - - 62 Shop Keeping 113 11 124 - - - 63 Shurbat Making 48 938 986 - - - 64 Soup Making Training (VOC B) - 126 126 - 126 126 65 Steel Fixer 47 - 47 - - - 66 Tailoring (Advance) 419 1,399 1,818 61 1,042 1,103 67 Tailoring Training 2,420 6,309 8,729 - 1,101 1,101 68 Teacher Training Vocational - 50 50 - - - 69 Tie & Dye 381 10,652 11,033 - 266 266 70 Tubewell Maintenance 11 - 11 - - - 71 TV/VCR Repair 283 - 283 - - - 72 UPS Repair 52 - 52 - - - 73 Vaseline Making 2 2,542 2,544 - - - 74 Welding 1,410 - 1,410 129 - 129 75 Wheel Loader Operator Training 16 - 16 - - -
Total 29,856 34,199 64,055 1,613 3,513 5,126 Grand Total 771,487 837,845 1,609,332 120,392 154,094 274,486
NRSP 18th Annual Progress Report 2011-2012
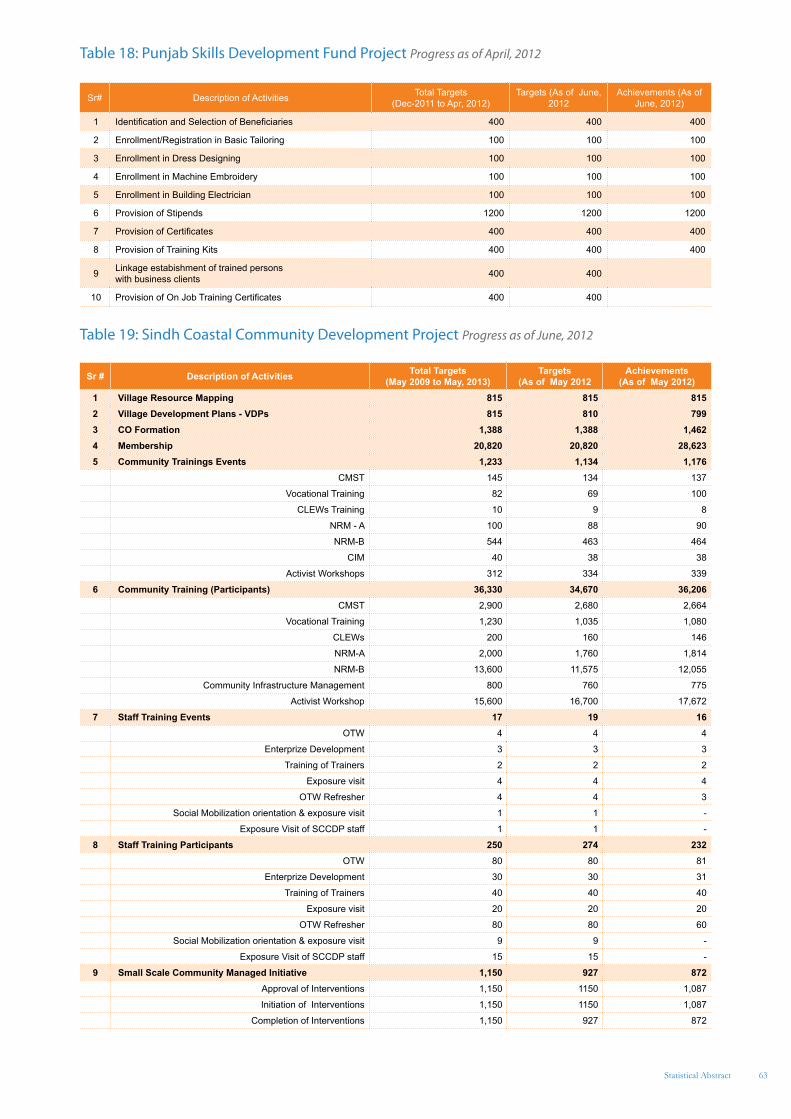
63Statistical Abstract
Table 18: Punjab Skills Development Fund Project Progress as of April, 2012
Sr# Description of Activities Total Targets (Dec-2011 to Apr, 2012)
Targets (As of June, 2012
Achievements (As of June, 2012)
1 Identification and Selection of Beneficiaries 400 400 400
2 Enrollment/Registration in Basic Tailoring 100 100 100
3 Enrollment in Dress Designing 100 100 100
4 Enrollment in Machine Embroidery 100 100 100
5 Enrollment in Building Electrician 100 100 100
6 Provision of Stipends 1200 1200 1200
7 Provision of Certificates 400 400 400
8 Provision of Training Kits 400 400 400
9 Linkage estabishment of trained persons with business clients 400 400
10 Provision of On Job Training Certificates 400 400
Table 19: Sindh Coastal Community Development Project Progress as of June, 2012
Sr # Description of Activities Total Targets (May 2009 to May, 2013)
Targets (As of May 2012
Achievements (As of May 2012)
1 Village Resource Mapping 815 815 815 2 Village Development Plans - VDPs 815 810 799 3 CO Formation 1,388 1,388 1,462 4 Membership 20,820 20,820 28,623 5 Community Trainings Events 1,233 1,134 1,176
CMST 145 134 137
Vocational Training 82 69 100
CLEWs Training 10 9 8
NRM - A 100 88 90
NRM-B 544 463 464
CIM 40 38 38
Activist Workshops 312 334 339
6 Community Training (Participants) 36,330 34,670 36,206 CMST 2,900 2,680 2,664
Vocational Training 1,230 1,035 1,080
CLEWs 200 160 146
NRM-A 2,000 1,760 1,814
NRM-B 13,600 11,575 12,055
Community Infrastructure Management 800 760 775
Activist Workshop 15,600 16,700 17,672
7 Staff Training Events 17 19 16 OTW 4 4 4
Enterprize Development 3 3 3
Training of Trainers 2 2 2
Exposure visit 4 4 4
OTW Refresher 4 4 3
Social Mobilization orientation & exposure visit 1 1 -
Exposure Visit of SCCDP staff 1 1 -
8 Staff Training Participants 250 274 232 OTW 80 80 81
Enterprize Development 30 30 31
Training of Trainers 40 40 40
Exposure visit 20 20 20
OTW Refresher 80 80 60
Social Mobilization orientation & exposure visit 9 9 -
Exposure Visit of SCCDP staff 15 15 -
9 Small Scale Community Managed Initiative 1,150 927 872 Approval of Interventions 1,150 1150 1,087
Initiation of Interventions 1,150 1150 1,087
Completion of Interventions 1,150 927 872
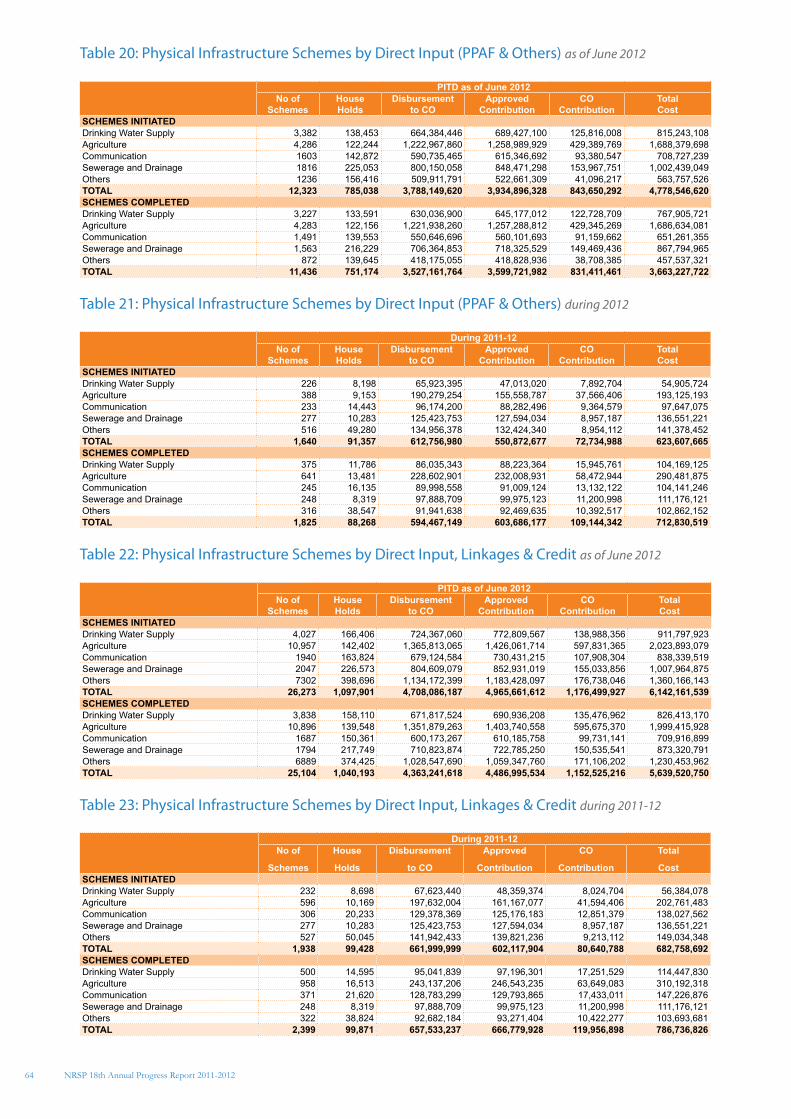
64
Table 20: Physical Infrastructure Schemes by Direct Input (PPAF & Others) as of June 2012
PITD as of June 2012No of
SchemesHouseHolds
Disbursement to CO
ApprovedContribution
COContribution
TotalCost
SCHEMES INITIATED Drinking Water Supply 3,382 138,453 664,384,446 689,427,100 125,816,008 815,243,108Agriculture 4,286 122,244 1,222,967,860 1,258,989,929 429,389,769 1,688,379,698Communication 1603 142,872 590,735,465 615,346,692 93,380,547 708,727,239Sewerage and Drainage 1816 225,053 800,150,058 848,471,298 153,967,751 1,002,439,049Others 1236 156,416 509,911,791 522,661,309 41,096,217 563,757,526TOTAL 12,323 785,038 3,788,149,620 3,934,896,328 843,650,292 4,778,546,620SCHEMES COMPLETED Drinking Water Supply 3,227 133,591 630,036,900 645,177,012 122,728,709 767,905,721 Agriculture 4,283 122,156 1,221,938,260 1,257,288,812 429,345,269 1,686,634,081 Communication 1,491 139,553 550,646,696 560,101,693 91,159,662 651,261,355 Sewerage and Drainage 1,563 216,229 706,364,853 718,325,529 149,469,436 867,794,965 Others 872 139,645 418,175,055 418,828,936 38,708,385 457,537,321 TOTAL 11,436 751,174 3,527,161,764 3,599,721,982 831,411,461 3,663,227,722
Table 21: Physical Infrastructure Schemes by Direct Input (PPAF & Others) during 2012
During 2011-12No of
SchemesHouseHolds
Disbursement to CO
ApprovedContribution
COContribution
TotalCost
SCHEMES INITIATED Drinking Water Supply 226 8,198 65,923,395 47,013,020 7,892,704 54,905,724Agriculture 388 9,153 190,279,254 155,558,787 37,566,406 193,125,193Communication 233 14,443 96,174,200 88,282,496 9,364,579 97,647,075Sewerage and Drainage 277 10,283 125,423,753 127,594,034 8,957,187 136,551,221Others 516 49,280 134,956,378 132,424,340 8,954,112 141,378,452TOTAL 1,640 91,357 612,756,980 550,872,677 72,734,988 623,607,665SCHEMES COMPLETED Drinking Water Supply 375 11,786 86,035,343 88,223,364 15,945,761 104,169,125Agriculture 641 13,481 228,602,901 232,008,931 58,472,944 290,481,875Communication 245 16,135 89,998,558 91,009,124 13,132,122 104,141,246Sewerage and Drainage 248 8,319 97,888,709 99,975,123 11,200,998 111,176,121Others 316 38,547 91,941,638 92,469,635 10,392,517 102,862,152TOTAL 1,825 88,268 594,467,149 603,686,177 109,144,342 712,830,519
Table 22: Physical Infrastructure Schemes by Direct Input, Linkages & Credit as of June 2012
PITD as of June 2012No of
SchemesHouseHolds
Disbursement to CO
ApprovedContribution
COContribution
TotalCost
SCHEMES INITIATED Drinking Water Supply 4,027 166,406 724,367,060 772,809,567 138,988,356 911,797,923Agriculture 10,957 142,402 1,365,813,065 1,426,061,714 597,831,365 2,023,893,079Communication 1940 163,824 679,124,584 730,431,215 107,908,304 838,339,519Sewerage and Drainage 2047 226,573 804,609,079 852,931,019 155,033,856 1,007,964,875Others 7302 398,696 1,134,172,399 1,183,428,097 176,738,046 1,360,166,143TOTAL 26,273 1,097,901 4,708,086,187 4,965,661,612 1,176,499,927 6,142,161,539SCHEMES COMPLETED Drinking Water Supply 3,838 158,110 671,817,524 690,936,208 135,476,962 826,413,170Agriculture 10,896 139,548 1,351,879,263 1,403,740,558 595,675,370 1,999,415,928Communication 1687 150,361 600,173,267 610,185,758 99,731,141 709,916,899Sewerage and Drainage 1794 217,749 710,823,874 722,785,250 150,535,541 873,320,791Others 6889 374,425 1,028,547,690 1,059,347,760 171,106,202 1,230,453,962TOTAL 25,104 1,040,193 4,363,241,618 4,486,995,534 1,152,525,216 5,639,520,750
Table 23: Physical Infrastructure Schemes by Direct Input, Linkages & Credit during 2011-12
During 2011-12No of
Schemes
House
Holds
Disbursement
to CO
Approved
Contribution
CO
Contribution
Total
CostSCHEMES INITIATED Drinking Water Supply 232 8,698 67,623,440 48,359,374 8,024,704 56,384,078Agriculture 596 10,169 197,632,004 161,167,077 41,594,406 202,761,483Communication 306 20,233 129,378,369 125,176,183 12,851,379 138,027,562Sewerage and Drainage 277 10,283 125,423,753 127,594,034 8,957,187 136,551,221Others 527 50,045 141,942,433 139,821,236 9,213,112 149,034,348TOTAL 1,938 99,428 661,999,999 602,117,904 80,640,788 682,758,692SCHEMES COMPLETED Drinking Water Supply 500 14,595 95,041,839 97,196,301 17,251,529 114,447,830Agriculture 958 16,513 243,137,206 246,543,235 63,649,083 310,192,318Communication 371 21,620 128,783,299 129,793,865 17,433,011 147,226,876Sewerage and Drainage 248 8,319 97,888,709 99,975,123 11,200,998 111,176,121Others 322 38,824 92,682,184 93,271,404 10,422,277 103,693,681TOTAL 2,399 99,871 657,533,237 666,779,928 119,956,898 786,736,826
NRSP 18th Annual Progress Report 2011-2012
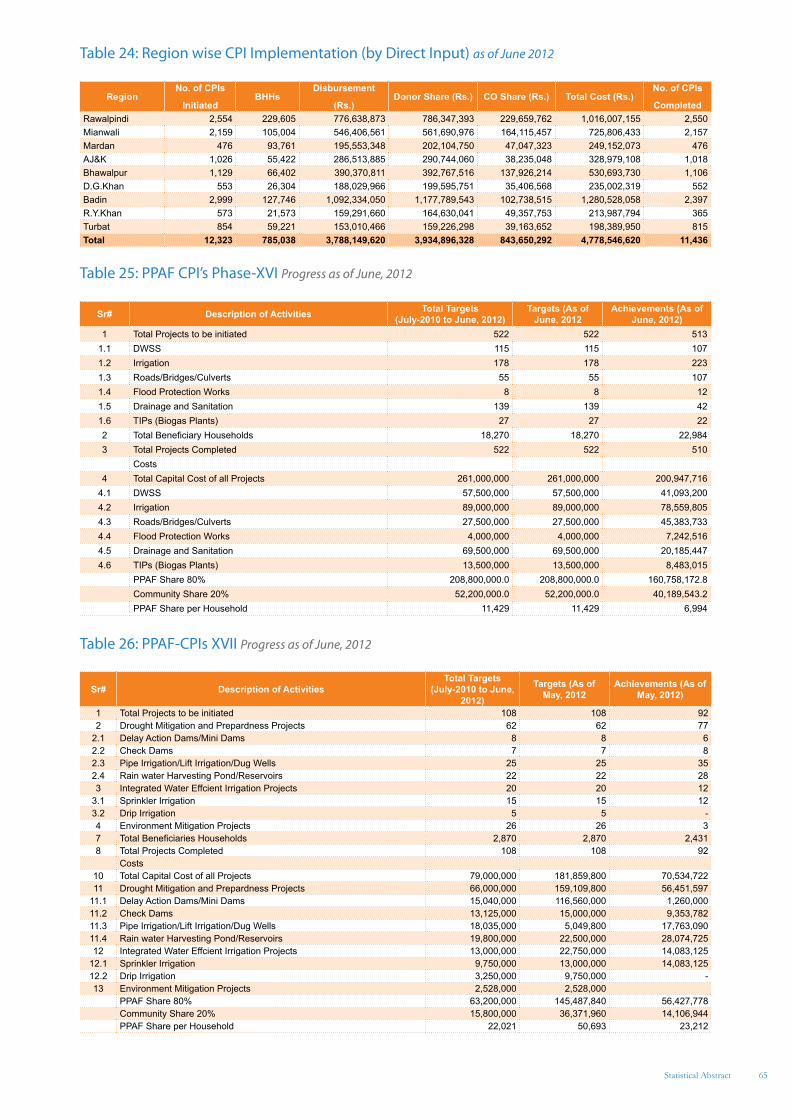
65Statistical Abstract
Table 24: Region wise CPI Implementation (by Direct Input) as of June 2012
RegionNo. of CPIs
InitiatedBHHs
Disbursement
(Rs.)Donor Share (Rs.) CO Share (Rs.) Total Cost (Rs.)
No. of CPIs
CompletedRawalpindi 2,554 229,605 776,638,873 786,347,393 229,659,762 1,016,007,155 2,550 Mianwali 2,159 105,004 546,406,561 561,690,976 164,115,457 725,806,433 2,157 Mardan 476 93,761 195,553,348 202,104,750 47,047,323 249,152,073 476 AJ&K 1,026 55,422 286,513,885 290,744,060 38,235,048 328,979,108 1,018 Bhawalpur 1,129 66,402 390,370,811 392,767,516 137,926,214 530,693,730 1,106 D.G.Khan 553 26,304 188,029,966 199,595,751 35,406,568 235,002,319 552 Badin 2,999 127,746 1,092,334,050 1,177,789,543 102,738,515 1,280,528,058 2,397 R.Y.Khan 573 21,573 159,291,660 164,630,041 49,357,753 213,987,794 365 Turbat 854 59,221 153,010,466 159,226,298 39,163,652 198,389,950 815 Total 12,323 785,038 3,788,149,620 3,934,896,328 843,650,292 4,778,546,620 11,436
Table 25: PPAF CPI’s Phase-XVI Progress as of June, 2012
Sr# Description of Activities Total Targets (July-2010 to June, 2012)
Targets (As of June, 2012
Achievements (As of June, 2012)
1 Total Projects to be initiated 522 522 513 1.1 DWSS 115 115 107 1.2 Irrigation 178 178 223 1.3 Roads/Bridges/Culverts 55 55 107 1.4 Flood Protection Works 8 8 12 1.5 Drainage and Sanitation 139 139 42 1.6 TIPs (Biogas Plants) 27 27 22 2 Total Beneficiary Households 18,270 18,270 22,984 3 Total Projects Completed 522 522 510
Costs4 Total Capital Cost of all Projects 261,000,000 261,000,000 200,947,716
4.1 DWSS 57,500,000 57,500,000 41,093,200 4.2 Irrigation 89,000,000 89,000,000 78,559,805 4.3 Roads/Bridges/Culverts 27,500,000 27,500,000 45,383,733 4.4 Flood Protection Works 4,000,000 4,000,000 7,242,516 4.5 Drainage and Sanitation 69,500,000 69,500,000 20,185,447 4.6 TIPs (Biogas Plants) 13,500,000 13,500,000 8,483,015
PPAF Share 80% 208,800,000.0 208,800,000.0 160,758,172.8 Community Share 20% 52,200,000.0 52,200,000.0 40,189,543.2 PPAF Share per Household 11,429 11,429 6,994
Table 26: PPAF-CPIs XVII Progress as of June, 2012
Sr# Description of ActivitiesTotal Targets
(July-2010 to June, 2012)
Targets (As of May, 2012
Achievements (As of May, 2012)
1 Total Projects to be initiated 108 108 92 2 Drought Mitigation and Prepardness Projects 62 62 77
2.1 Delay Action Dams/Mini Dams 8 8 62.2 Check Dams 7 7 8 2.3 Pipe Irrigation/Lift Irrigation/Dug Wells 25 25 35 2.4 Rain water Harvesting Pond/Reservoirs 22 22 28 3 Integrated Water Effcient Irrigation Projects 20 20 12
3.1 Sprinkler Irrigation 15 15 12 3.2 Drip Irrigation 5 5 - 4 Environment Mitigation Projects 26 26 3 7 Total Beneficiaries Households 2,870 2,870 2,431 8 Total Projects Completed 108 108 92
Costs10 Total Capital Cost of all Projects 79,000,000 181,859,800 70,534,722 11 Drought Mitigation and Prepardness Projects 66,000,000 159,109,800 56,451,597
11.1 Delay Action Dams/Mini Dams 15,040,000 116,560,000 1,260,000 11.2 Check Dams 13,125,000 15,000,000 9,353,782 11.3 Pipe Irrigation/Lift Irrigation/Dug Wells 18,035,000 5,049,800 17,763,090 11.4 Rain water Harvesting Pond/Reservoirs 19,800,000 22,500,000 28,074,725 12 Integrated Water Effcient Irrigation Projects 13,000,000 22,750,000 14,083,125
12.1 Sprinkler Irrigation 9,750,000 13,000,000 14,083,125 12.2 Drip Irrigation 3,250,000 9,750,000 - 13 Environment Mitigation Projects 2,528,000 2,528,000
PPAF Share 80% 63,200,000 145,487,840 56,427,778 Community Share 20% 15,800,000 36,371,960 14,106,944 PPAF Share per Household 22,021 50,693 23,212
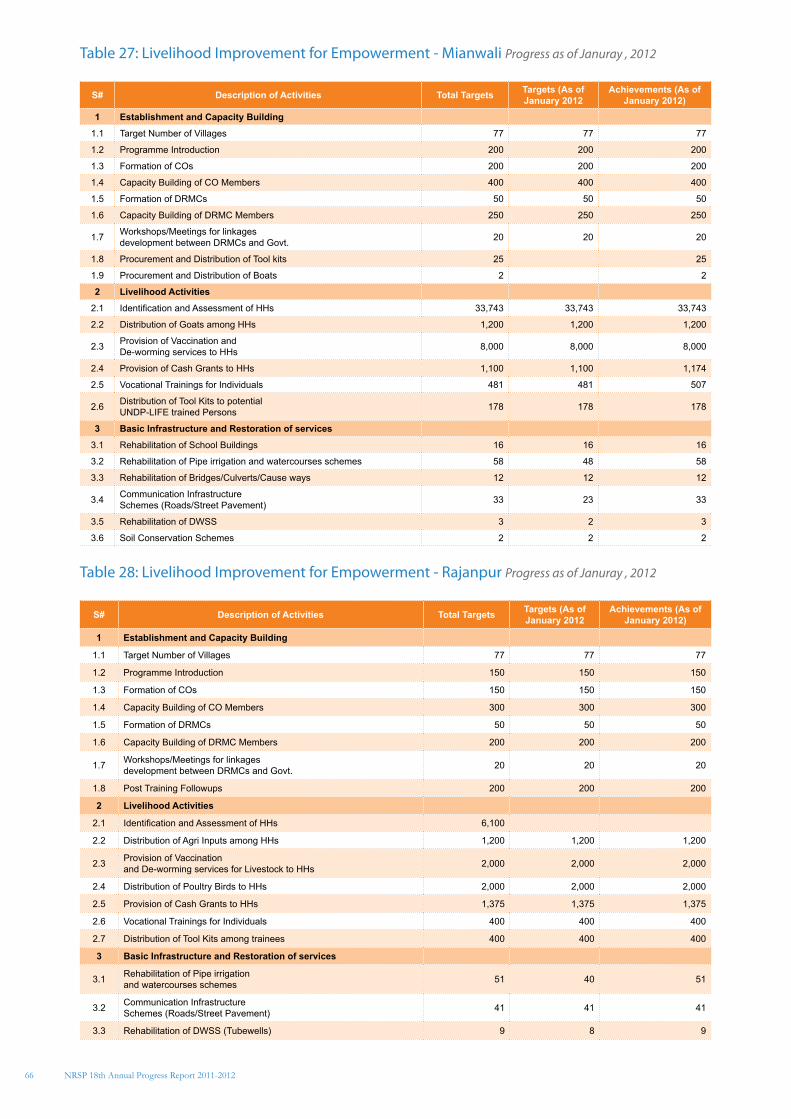
66
Table 27: Livelihood Improvement for Empowerment - Mianwali Progress as of Januray , 2012
S# Description of Activities Total Targets Targets (As of January 2012
Achievements (As of January 2012)
1 Establishment and Capacity Building
1.1 Target Number of Villages 77 77 77
1.2 Programme Introduction 200 200 200
1.3 Formation of COs 200 200 200
1.4 Capacity Building of CO Members 400 400 400
1.5 Formation of DRMCs 50 50 50
1.6 Capacity Building of DRMC Members 250 250 250
1.7 Workshops/Meetings for linkages development between DRMCs and Govt. 20 20 20
1.8 Procurement and Distribution of Tool kits 25 25
1.9 Procurement and Distribution of Boats 2 2
2 Livelihood Activities
2.1 Identification and Assessment of HHs 33,743 33,743 33,743
2.2 Distribution of Goats among HHs 1,200 1,200 1,200
2.3 Provision of Vaccination and De-worming services to HHs 8,000 8,000 8,000
2.4 Provision of Cash Grants to HHs 1,100 1,100 1,174
2.5 Vocational Trainings for Individuals 481 481 507
2.6 Distribution of Tool Kits to potential UNDP-LIFE trained Persons 178 178 178
3 Basic Infrastructure and Restoration of services
3.1 Rehabilitation of School Buildings 16 16 16
3.2 Rehabilitation of Pipe irrigation and watercourses schemes 58 48 58
3.3 Rehabilitation of Bridges/Culverts/Cause ways 12 12 12
3.4 Communication Infrastructure Schemes (Roads/Street Pavement) 33 23 33
3.5 Rehabilitation of DWSS 3 2 3
3.6 Soil Conservation Schemes 2 2 2
Table 28: Livelihood Improvement for Empowerment - Rajanpur Progress as of Januray , 2012
S# Description of Activities Total Targets Targets (As of January 2012
Achievements (As of January 2012)
1 Establishment and Capacity Building
1.1 Target Number of Villages 77 77 77
1.2 Programme Introduction 150 150 150
1.3 Formation of COs 150 150 150
1.4 Capacity Building of CO Members 300 300 300
1.5 Formation of DRMCs 50 50 50
1.6 Capacity Building of DRMC Members 200 200 200
1.7 Workshops/Meetings for linkages development between DRMCs and Govt. 20 20 20
1.8 Post Training Followups 200 200 200
2 Livelihood Activities
2.1 Identification and Assessment of HHs 6,100
2.2 Distribution of Agri Inputs among HHs 1,200 1,200 1,200
2.3 Provision of Vaccination and De-worming services for Livestock to HHs 2,000 2,000 2,000
2.4 Distribution of Poultry Birds to HHs 2,000 2,000 2,000
2.5 Provision of Cash Grants to HHs 1,375 1,375 1,375
2.6 Vocational Trainings for Individuals 400 400 400
2.7 Distribution of Tool Kits among trainees 400 400 400
3 Basic Infrastructure and Restoration of services
3.1 Rehabilitation of Pipe irrigation and watercourses schemes 51 40 51
3.2 Communication Infrastructure Schemes (Roads/Street Pavement) 41 41 41
3.3 Rehabilitation of DWSS (Tubewells) 9 8 9
NRSP 18th Annual Progress Report 2011-2012
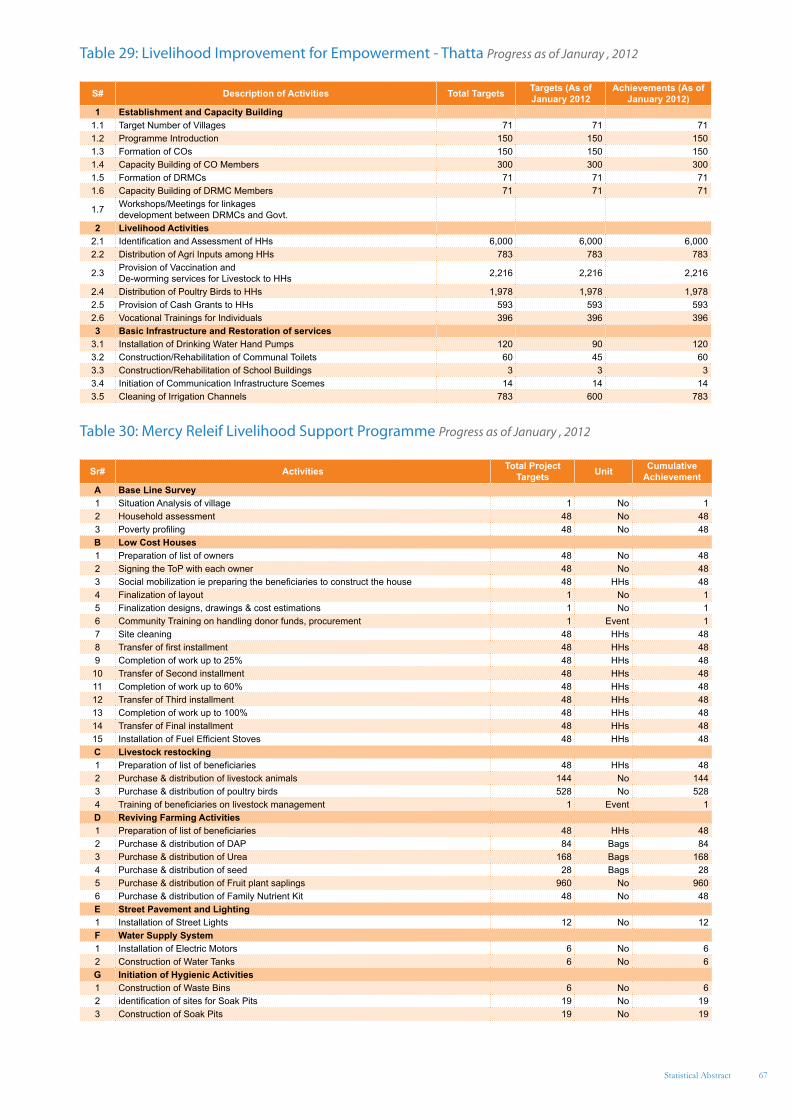
67Statistical Abstract
Table 29: Livelihood Improvement for Empowerment - Thatta Progress as of Januray , 2012
S# Description of Activities Total Targets Targets (As of January 2012
Achievements (As of January 2012)
1 Establishment and Capacity Building1.1 Target Number of Villages 71 71 71 1.2 Programme Introduction 150 150 150 1.3 Formation of COs 150 150 150 1.4 Capacity Building of CO Members 300 300 300 1.5 Formation of DRMCs 71 71 71 1.6 Capacity Building of DRMC Members 71 71 71
1.7 Workshops/Meetings for linkages development between DRMCs and Govt.
2 Livelihood Activities2.1 Identification and Assessment of HHs 6,000 6,000 6,000 2.2 Distribution of Agri Inputs among HHs 783 783 783
2.3 Provision of Vaccination and De-worming services for Livestock to HHs 2,216 2,216 2,216
2.4 Distribution of Poultry Birds to HHs 1,978 1,978 1,978 2.5 Provision of Cash Grants to HHs 593 593 593 2.6 Vocational Trainings for Individuals 396 396 396 3 Basic Infrastructure and Restoration of services
3.1 Installation of Drinking Water Hand Pumps 120 90 120 3.2 Construction/Rehabilitation of Communal Toilets 60 45 60 3.3 Construction/Rehabilitation of School Buildings 3 3 3 3.4 Initiation of Communication Infrastructure Scemes 14 14 14 3.5 Cleaning of Irrigation Channels 783 600 783
Table 30: Mercy Releif Livelihood Support Programme Progress as of January , 2012
Sr# Activities Total Project Targets Unit Cumulative
AchievementA Base Line Survey1 Situation Analysis of village 1 No 12 Household assessment 48 No 483 Poverty profiling 48 No 48B Low Cost Houses1 Preparation of list of owners 48 No 482 Signing the ToP with each owner 48 No 483 Social mobilization ie preparing the beneficiaries to construct the house 48 HHs 484 Finalization of layout 1 No 15 Finalization designs, drawings & cost estimations 1 No 16 Community Training on handling donor funds, procurement 1 Event 17 Site cleaning 48 HHs 488 Transfer of first installment 48 HHs 489 Completion of work up to 25% 48 HHs 48
10 Transfer of Second installment 48 HHs 4811 Completion of work up to 60% 48 HHs 4812 Transfer of Third installment 48 HHs 4813 Completion of work up to 100% 48 HHs 4814 Transfer of Final installment 48 HHs 4815 Installation of Fuel Efficient Stoves 48 HHs 48C Livestock restocking1 Preparation of list of beneficiaries 48 HHs 482 Purchase & distribution of livestock animals 144 No 1443 Purchase & distribution of poultry birds 528 No 5284 Training of beneficiaries on livestock management 1 Event 1D Reviving Farming Activities1 Preparation of list of beneficiaries 48 HHs 482 Purchase & distribution of DAP 84 Bags 843 Purchase & distribution of Urea 168 Bags 1684 Purchase & distribution of seed 28 Bags 285 Purchase & distribution of Fruit plant saplings 960 No 9606 Purchase & distribution of Family Nutrient Kit 48 No 48E Street Pavement and Lighting1 Installation of Street Lights 12 No 12F Water Supply System1 Installation of Electric Motors 6 No 62 Construction of Water Tanks 6 No 6G Initiation of Hygienic Activities1 Construction of Waste Bins 6 No 62 identification of sites for Soak Pits 19 No 193 Construction of Soak Pits 19 No 19
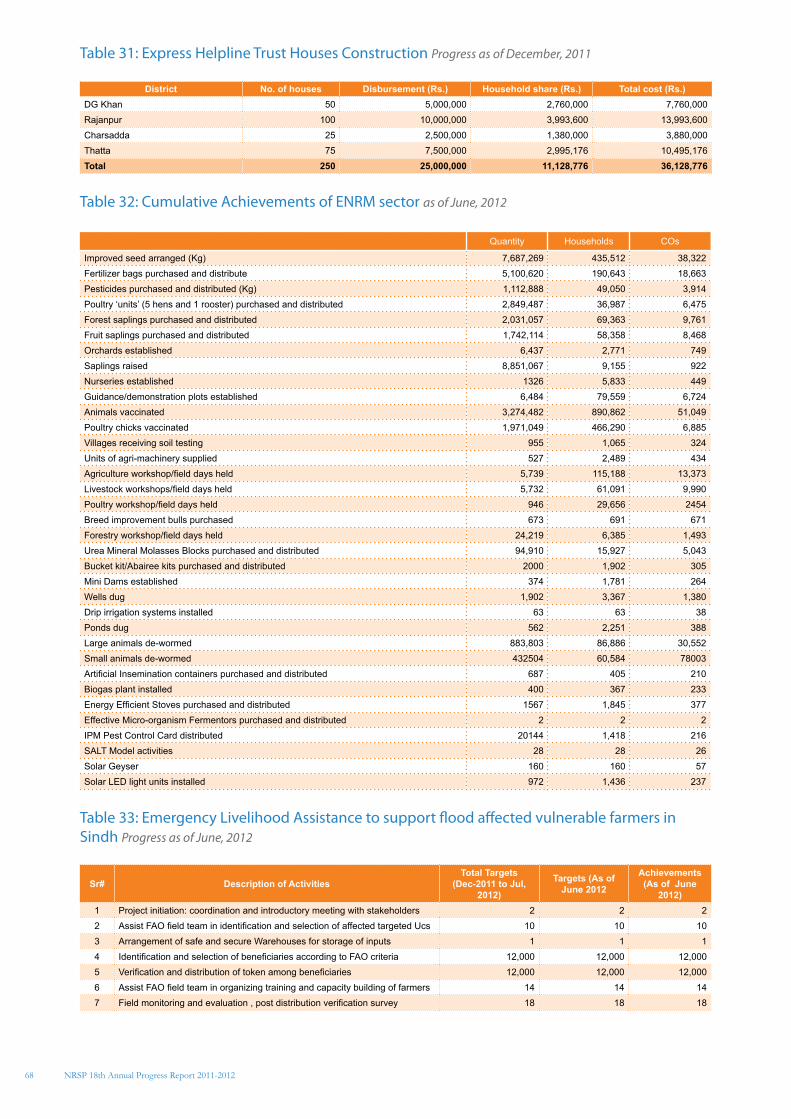
68
Table 31: Express Helpline Trust Houses Construction Progress as of December, 2011
District No. of houses Disbursement (Rs.) Household share (Rs.) Total cost (Rs.)DG Khan 50 5,000,000 2,760,000 7,760,000 Rajanpur 100 10,000,000 3,993,600 13,993,600 Charsadda 25 2,500,000 1,380,000 3,880,000 Thatta 75 7,500,000 2,995,176 10,495,176 Total 250 25,000,000 11,128,776 36,128,776
Table 32: Cumulative Achievements of ENRM sector as of June, 2012
Quantity Households COs
Improved seed arranged (Kg) 7,687,269 435,512 38,322Fertilizer bags purchased and distribute 5,100,620 190,643 18,663Pesticides purchased and distributed (Kg) 1,112,888 49,050 3,914Poultry ‘units’ (5 hens and 1 rooster) purchased and distributed 2,849,487 36,987 6,475Forest saplings purchased and distributed 2,031,057 69,363 9,761Fruit saplings purchased and distributed 1,742,114 58,358 8,468Orchards established 6,437 2,771 749Saplings raised 8,851,067 9,155 922Nurseries established 1326 5,833 449Guidance/demonstration plots established 6,484 79,559 6,724Animals vaccinated 3,274,482 890,862 51,049Poultry chicks vaccinated 1,971,049 466,290 6,885Villages receiving soil testing 955 1,065 324Units of agri-machinery supplied 527 2,489 434Agriculture workshop/field days held 5,739 115,188 13,373Livestock workshops/field days held 5,732 61,091 9,990Poultry workshop/field days held 946 29,656 2454Breed improvement bulls purchased 673 691 671Forestry workshop/field days held 24,219 6,385 1,493Urea Mineral Molasses Blocks purchased and distributed 94,910 15,927 5,043Bucket kit/Abairee kits purchased and distributed 2000 1,902 305Mini Dams established 374 1,781 264Wells dug 1,902 3,367 1,380Drip irrigation systems installed 63 63 38Ponds dug 562 2,251 388Large animals de-wormed 883,803 86,886 30,552Small animals de-wormed 432504 60,584 78003Artificial Insemination containers purchased and distributed 687 405 210Biogas plant installed 400 367 233Energy Efficient Stoves purchased and distributed 1567 1,845 377Effective Micro-organism Fermentors purchased and distributed 2 2 2IPM Pest Control Card distributed 20144 1,418 216SALT Model activities 28 28 26Solar Geyser 160 160 57Solar LED light units installed 972 1,436 237
Table 33: Emergency Livelihood Assistance to support flood affected vulnerable farmers in Sindh Progress as of June, 2012
Sr# Description of ActivitiesTotal Targets
(Dec-2011 to Jul, 2012)
Targets (As of June 2012
Achievements (As of June
2012)1 Project initiation: coordination and introductory meeting with stakeholders 2 2 2 2 Assist FAO field team in identification and selection of affected targeted Ucs 10 10 10 3 Arrangement of safe and secure Warehouses for storage of inputs 1 1 1 4 Identification and selection of beneficiaries according to FAO criteria 12,000 12,000 12,000 5 Verification and distribution of token among beneficiaries 12,000 12,000 12,000 6 Assist FAO field team in organizing training and capacity building of farmers 14 14 14 7 Field monitoring and evaluation , post distribution verification survey 18 18 18
NRSP 18th Annual Progress Report 2011-2012
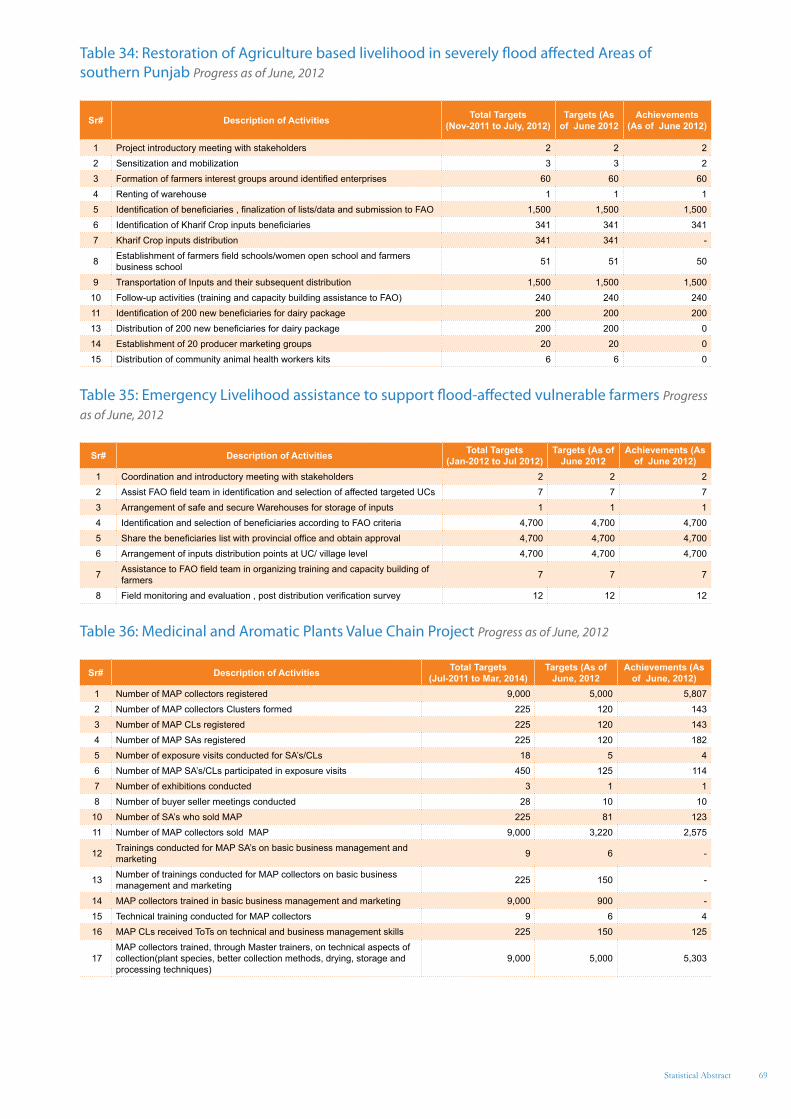
69Statistical Abstract
Table 34: Restoration of Agriculture based livelihood in severely flood affected Areas of southern Punjab Progress as of June, 2012
Sr# Description of Activities Total Targets (Nov-2011 to July, 2012)
Targets (As of June 2012
Achievements (As of June 2012)
1 Project introductory meeting with stakeholders 2 2 2 2 Sensitization and mobilization 3 3 2 3 Formation of farmers interest groups around identified enterprises 60 60 60 4 Renting of warehouse 1 1 1 5 Identification of beneficiaries , finalization of lists/data and submission to FAO 1,500 1,500 1,500 6 Identification of Kharif Crop inputs beneficiaries 341 341 341 7 Kharif Crop inputs distribution 341 341 -
8 Establishment of farmers field schools/women open school and farmers business school 51 51 50
9 Transportation of Inputs and their subsequent distribution 1,500 1,500 1,500 10 Follow-up activities (training and capacity building assistance to FAO) 240 240 240 11 Identification of 200 new beneficiaries for dairy package 200 200 20013 Distribution of 200 new beneficiaries for dairy package 200 200 014 Establishment of 20 producer marketing groups 20 20 015 Distribution of community animal health workers kits 6 6 0
Table 35: Emergency Livelihood assistance to support flood-affected vulnerable farmers Progress as of June, 2012
Sr# Description of Activities Total Targets (Jan-2012 to Jul 2012)
Targets (As of June 2012
Achievements (As of June 2012)
1 Coordination and introductory meeting with stakeholders 2 2 2 2 Assist FAO field team in identification and selection of affected targeted UCs 7 7 7 3 Arrangement of safe and secure Warehouses for storage of inputs 1 1 1 4 Identification and selection of beneficiaries according to FAO criteria 4,700 4,700 4,700 5 Share the beneficiaries list with provincial office and obtain approval 4,700 4,700 4,700 6 Arrangement of inputs distribution points at UC/ village level 4,700 4,700 4,700
7 Assistance to FAO field team in organizing training and capacity building of farmers 7 7 7
8 Field monitoring and evaluation , post distribution verification survey 12 12 12
Table 36: Medicinal and Aromatic Plants Value Chain Project Progress as of June, 2012
Sr# Description of Activities Total Targets (Jul-2011 to Mar, 2014)
Targets (As of June, 2012
Achievements (As of June, 2012)
1 Number of MAP collectors registered 9,000 5,000 5,807 2 Number of MAP collectors Clusters formed 225 120 143 3 Number of MAP CLs registered 225 120 143 4 Number of MAP SAs registered 225 120 182 5 Number of exposure visits conducted for SA’s/CLs 18 5 4 6 Number of MAP SA’s/CLs participated in exposure visits 450 125 114 7 Number of exhibitions conducted 3 1 1 8 Number of buyer seller meetings conducted 28 10 10
10 Number of SA’s who sold MAP 225 81 123 11 Number of MAP collectors sold MAP 9,000 3,220 2,575
12 Trainings conducted for MAP SA’s on basic business management and marketing 9 6 -
13 Number of trainings conducted for MAP collectors on basic business management and marketing 225 150 -
14 MAP collectors trained in basic business management and marketing 9,000 900 - 15 Technical training conducted for MAP collectors 9 6 4 16 MAP CLs received ToTs on technical and business management skills 225 150 125
17MAP collectors trained, through Master trainers, on technical aspects of collection(plant species, better collection methods, drying, storage and processing techniques)
9,000 5,000 5,303
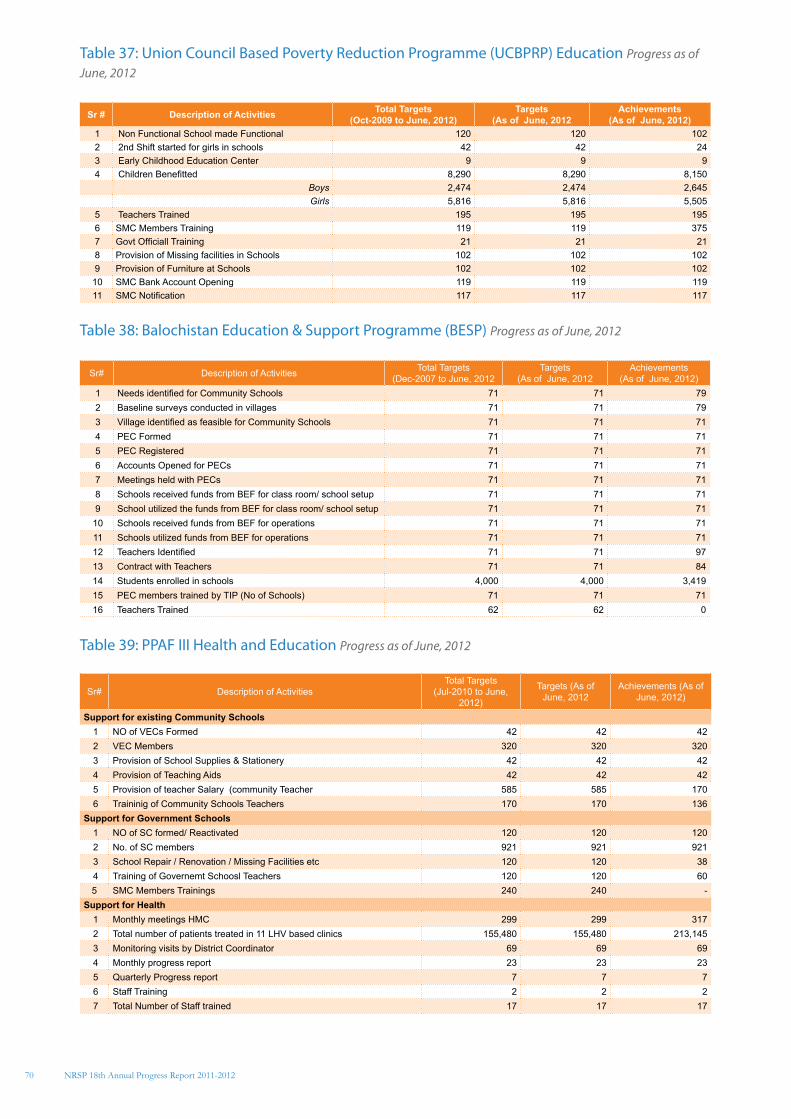
70
Table 37: Union Council Based Poverty Reduction Programme (UCBPRP) Education Progress as of June, 2012
Sr # Description of Activities Total Targets (Oct-2009 to June, 2012)
Targets (As of June, 2012
Achievements (As of June, 2012)
1 Non Functional School made Functional 120 120 102 2 2nd Shift started for girls in schools 42 42 24 3 Early Childhood Education Center 9 9 9 4 Children Benefitted 8,290 8,290 8,150
Boys 2,474 2,474 2,645 Girls 5,816 5,816 5,505
5 Teachers Trained 195 195 195 6 SMC Members Training 119 119 375 7 Govt Officiall Training 21 21 21 8 Provision of Missing facilities in Schools 102 102 102 9 Provision of Furniture at Schools 102 102 102
10 SMC Bank Account Opening 119 119 119 11 SMC Notification 117 117 117
Table 38: Balochistan Education & Support Programme (BESP) Progress as of June, 2012
Sr# Description of Activities Total Targets (Dec-2007 to June, 2012
Targets (As of June, 2012
Achievements (As of June, 2012)
1 Needs identified for Community Schools 71 71 79 2 Baseline surveys conducted in villages 71 71 79 3 Village identified as feasible for Community Schools 71 71 71 4 PEC Formed 71 71 71 5 PEC Registered 71 71 71 6 Accounts Opened for PECs 71 71 71 7 Meetings held with PECs 71 71 71 8 Schools received funds from BEF for class room/ school setup 71 71 71 9 School utilized the funds from BEF for class room/ school setup 71 71 71
10 Schools received funds from BEF for operations 71 71 71 11 Schools utilized funds from BEF for operations 71 71 71 12 Teachers Identified 71 71 97 13 Contract with Teachers 71 71 84 14 Students enrolled in schools 4,000 4,000 3,419 15 PEC members trained by TIP (No of Schools) 71 71 71 16 Teachers Trained 62 62 0
Table 39: PPAF III Health and Education Progress as of June, 2012
Sr# Description of ActivitiesTotal Targets
(Jul-2010 to June, 2012)
Targets (As of June, 2012
Achievements (As of June, 2012)
Support for existing Community Schools 1 NO of VECs Formed 42 42 42 2 VEC Members 320 320 320 3 Provision of School Supplies & Stationery 42 42 42 4 Provision of Teaching Aids 42 42 42 5 Provision of teacher Salary (community Teacher 585 585 170 6 Traininig of Community Schools Teachers 170 170 136
Support for Government Schools 1 NO of SC formed/ Reactivated 120 120 120 2 No. of SC members 921 921 921 3 School Repair / Renovation / Missing Facilities etc 120 120 38 4 Training of Governemt Schoosl Teachers 120 120 60 5 SMC Members Trainings 240 240 -
Support for Health 1 Monthly meetings HMC 299 299 317 2 Total number of patients treated in 11 LHV based clinics 155,480 155,480 213,145 3 Monitoring visits by District Coordinator 69 69 69 4 Monthly progress report 23 23 23 5 Quarterly Progress report 7 7 7 6 Staff Training 2 2 2 7 Total Number of Staff trained 17 17 17
NRSP 18th Annual Progress Report 2011-2012
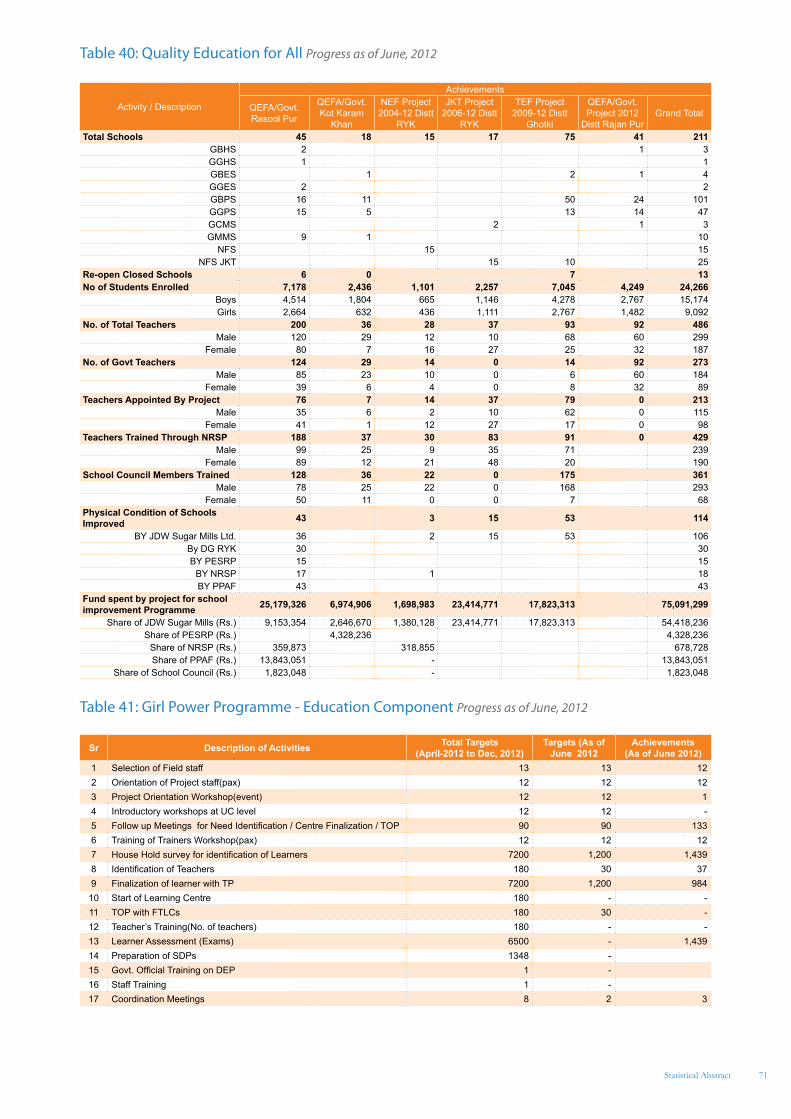
71Statistical Abstract
Table 40: Quality Education for All Progress as of June, 2012
Activity / Description
Achievements
QEFA/Govt. Rasool Pur
QEFA/Govt. Kot Karam
Khan
NEF Project 2004-12 Distt
RYK
JKT Project 2006-12 Distt
RYK
TEF Project 2009-12 Distt
Ghotki
QEFA/Govt. Project 2012
Distt Rajan PurGrand Total
Total Schools 45 18 15 17 75 41 211GBHS 2 1 3GGHS 1 1GBES 1 2 1 4GGES 2 2GBPS 16 11 50 24 101GGPS 15 5 13 14 47GCMS 2 1 3GMMS 9 1 10
NFS 15 15NFS JKT 15 10 25
Re-open Closed Schools 6 0 7 13No of Students Enrolled 7,178 2,436 1,101 2,257 7,045 4,249 24,266
Boys 4,514 1,804 665 1,146 4,278 2,767 15,174Girls 2,664 632 436 1,111 2,767 1,482 9,092
No. of Total Teachers 200 36 28 37 93 92 486Male 120 29 12 10 68 60 299
Female 80 7 16 27 25 32 187No. of Govt Teachers 124 29 14 0 14 92 273
Male 85 23 10 0 6 60 184Female 39 6 4 0 8 32 89
Teachers Appointed By Project 76 7 14 37 79 0 213Male 35 6 2 10 62 0 115
Female 41 1 12 27 17 0 98Teachers Trained Through NRSP 188 37 30 83 91 0 429
Male 99 25 9 35 71 239Female 89 12 21 48 20 190
School Council Members Trained 128 36 22 0 175 361Male 78 25 22 0 168 293
Female 50 11 0 0 7 68Physical Condition of Schools Improved 43 3 15 53 114
BY JDW Sugar Mills Ltd. 36 2 15 53 106By DG RYK 30 30BY PESRP 15 15
BY NRSP 17 1 18BY PPAF 43 43
Fund spent by project for school improvement Programme 25,179,326 6,974,906 1,698,983 23,414,771 17,823,313 75,091,299
Share of JDW Sugar Mills (Rs.) 9,153,354 2,646,670 1,380,128 23,414,771 17,823,313 54,418,236Share of PESRP (Rs.) 4,328,236 4,328,236
Share of NRSP (Rs.) 359,873 318,855 678,728Share of PPAF (Rs.) 13,843,051 - 13,843,051
Share of School Council (Rs.) 1,823,048 - 1,823,048
Table 41: Girl Power Programme - Education Component Progress as of June, 2012
Sr Description of Activities Total Targets (April-2012 to Dec, 2012)
Targets (As of June 2012
Achievements (As of June 2012)
1 Selection of Field staff 13 13 12 2 Orientation of Project staff(pax) 12 12 12 3 Project Orientation Workshop(event) 12 12 1 4 Introductory workshops at UC level 12 12 - 5 Follow up Meetings for Need Identification / Centre Finalization / TOP 90 90 133 6 Training of Trainers Workshop(pax) 12 12 12 7 House Hold survey for identification of Learners 7200 1,200 1,439 8 Identification of Teachers 180 30 37 9 Finalization of learner with TP 7200 1,200 984
10 Start of Learning Centre 180 - - 11 TOP with FTLCs 180 30 - 12 Teacher’s Training(No. of teachers) 180 - - 13 Learner Assessment (Exams) 6500 - 1,439 14 Preparation of SDPs 1348 - 15 Govt. Official Training on DEP 1 - 16 Staff Training 1 - 17 Coordination Meetings 8 2 3
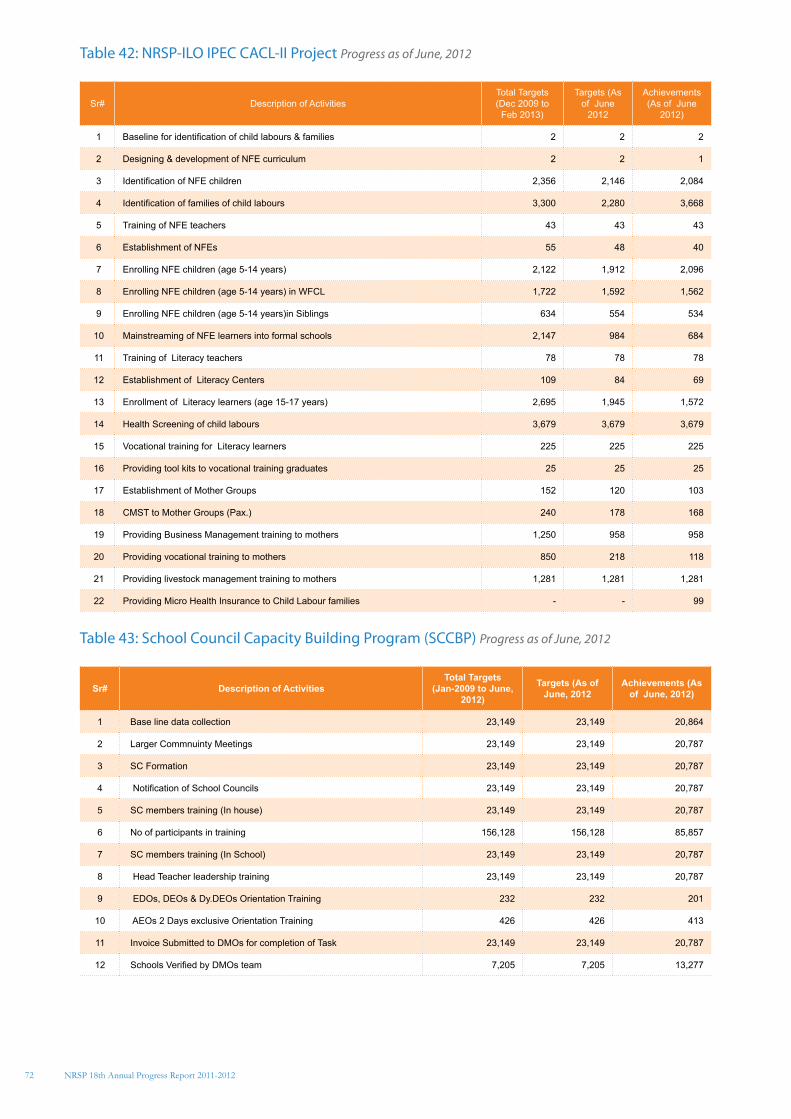
72
Table 42: NRSP-ILO IPEC CACL-II Project Progress as of June, 2012
Sr# Description of ActivitiesTotal Targets (Dec 2009 to
Feb 2013)
Targets (As of June
2012
Achievements (As of June
2012)
1 Baseline for identification of child labours & families 2 2 2
2 Designing & development of NFE curriculum 2 2 1
3 Identification of NFE children 2,356 2,146 2,084
4 Identification of families of child labours 3,300 2,280 3,668
5 Training of NFE teachers 43 43 43
6 Establishment of NFEs 55 48 40
7 Enrolling NFE children (age 5-14 years) 2,122 1,912 2,096
8 Enrolling NFE children (age 5-14 years) in WFCL 1,722 1,592 1,562
9 Enrolling NFE children (age 5-14 years)in Siblings 634 554 534
10 Mainstreaming of NFE learners into formal schools 2,147 984 684
11 Training of Literacy teachers 78 78 78
12 Establishment of Literacy Centers 109 84 69
13 Enrollment of Literacy learners (age 15-17 years) 2,695 1,945 1,572
14 Health Screening of child labours 3,679 3,679 3,679
15 Vocational training for Literacy learners 225 225 225
16 Providing tool kits to vocational training graduates 25 25 25
17 Establishment of Mother Groups 152 120 103
18 CMST to Mother Groups (Pax.) 240 178 168
19 Providing Business Management training to mothers 1,250 958 958
20 Providing vocational training to mothers 850 218 118
21 Providing livestock management training to mothers 1,281 1,281 1,281
22 Providing Micro Health Insurance to Child Labour families - - 99
Table 43: School Council Capacity Building Program (SCCBP) Progress as of June, 2012
Sr# Description of ActivitiesTotal Targets
(Jan-2009 to June, 2012)
Targets (As of June, 2012
Achievements (As of June, 2012)
1 Base line data collection 23,149 23,149 20,864
2 Larger Commnuinty Meetings 23,149 23,149 20,787
3 SC Formation 23,149 23,149 20,787
4 Notification of School Councils 23,149 23,149 20,787
5 SC members training (In house) 23,149 23,149 20,787
6 No of participants in training 156,128 156,128 85,857
7 SC members training (In School) 23,149 23,149 20,787
8 Head Teacher leadership training 23,149 23,149 20,787
9 EDOs, DEOs & Dy.DEOs Orientation Training 232 232 201
10 AEOs 2 Days exclusive Orientation Training 426 426 413
11 Invoice Submitted to DMOs for completion of Task 23,149 23,149 20,787
12 Schools Verified by DMOs team 7,205 7,205 13,277
NRSP 18th Annual Progress Report 2011-2012
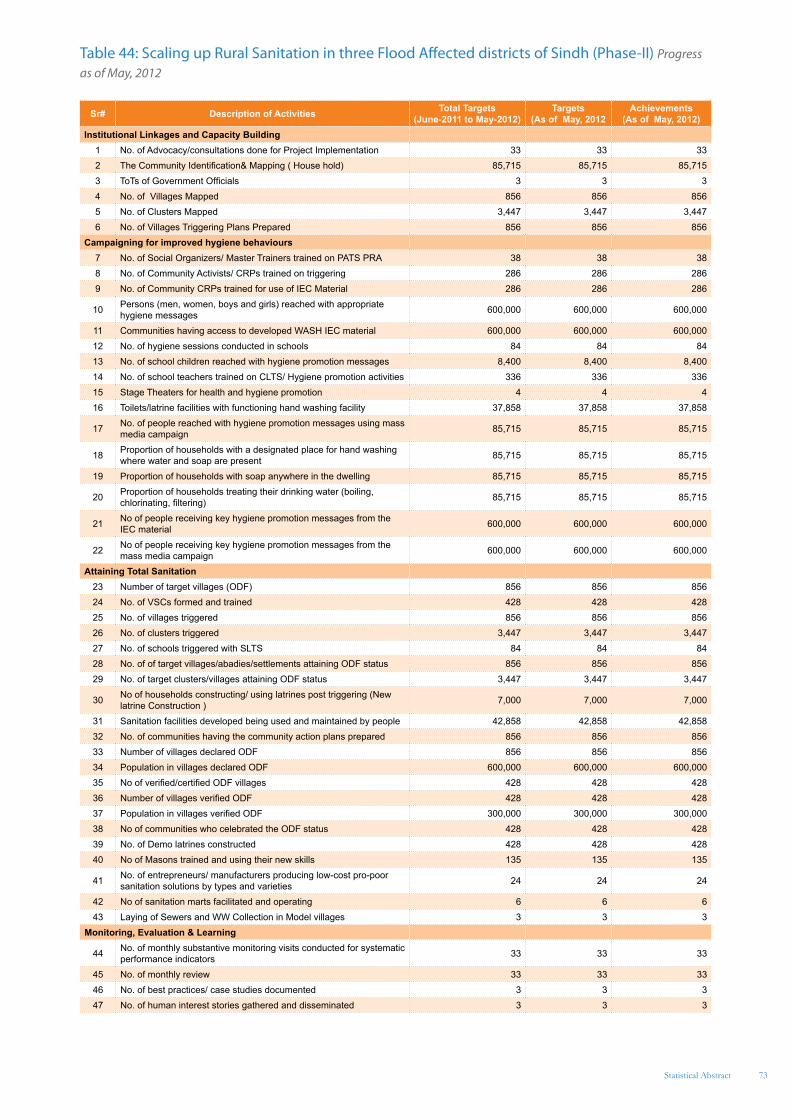
73Statistical Abstract
Table 44: Scaling up Rural Sanitation in three Flood Affected districts of Sindh (Phase-II) Progress as of May, 2012
Sr# Description of Activities Total Targets (June-2011 to May-2012)
Targets (As of May, 2012
Achievements (As of May, 2012)
Institutional Linkages and Capacity Building 1 No. of Advocacy/consultations done for Project Implementation 33 33 33 2 The Community Identification& Mapping ( House hold) 85,715 85,715 85,715 3 ToTs of Government Officials 3 3 3 4 No. of Villages Mapped 856 856 856 5 No. of Clusters Mapped 3,447 3,447 3,447 6 No. of Villages Triggering Plans Prepared 856 856 856
Campaigning for improved hygiene behaviours7 No. of Social Organizers/ Master Trainers trained on PATS PRA 38 38 38 8 No. of Community Activists/ CRPs trained on triggering 286 286 286 9 No. of Community CRPs trained for use of IEC Material 286 286 286
10 Persons (men, women, boys and girls) reached with appropriate hygiene messages 600,000 600,000 600,000
11 Communities having access to developed WASH IEC material 600,000 600,000 600,000 12 No. of hygiene sessions conducted in schools 84 84 84 13 No. of school children reached with hygiene promotion messages 8,400 8,400 8,400 14 No. of school teachers trained on CLTS/ Hygiene promotion activities 336 336 336 15 Stage Theaters for health and hygiene promotion 4 4 4 16 Toilets/latrine facilities with functioning hand washing facility 37,858 37,858 37,858
17 No. of people reached with hygiene promotion messages using mass media campaign 85,715 85,715 85,715
18 Proportion of households with a designated place for hand washing where water and soap are present 85,715 85,715 85,715
19 Proportion of households with soap anywhere in the dwelling 85,715 85,715 85,715
20 Proportion of households treating their drinking water (boiling, chlorinating, filtering) 85,715 85,715 85,715
21 No of people receiving key hygiene promotion messages from the IEC material 600,000 600,000 600,000
22 No of people receiving key hygiene promotion messages from the mass media campaign 600,000 600,000 600,000
Attaining Total Sanitation23 Number of target villages (ODF) 856 856 856 24 No. of VSCs formed and trained 428 428 428 25 No. of villages triggered 856 856 856 26 No. of clusters triggered 3,447 3,447 3,447 27 No. of schools triggered with SLTS 84 84 84 28 No. of of target villages/abadies/settlements attaining ODF status 856 856 856 29 No. of target clusters/villages attaining ODF status 3,447 3,447 3,447
30 No of households constructing/ using latrines post triggering (New latrine Construction ) 7,000 7,000 7,000
31 Sanitation facilities developed being used and maintained by people 42,858 42,858 42,858 32 No. of communities having the community action plans prepared 856 856 856 33 Number of villages declared ODF 856 856 856 34 Population in villages declared ODF 600,000 600,000 600,000 35 No of verified/certified ODF villages 428 428 428 36 Number of villages verified ODF 428 428 428 37 Population in villages verified ODF 300,000 300,000 300,000 38 No of communities who celebrated the ODF status 428 428 428 39 No. of Demo latrines constructed 428 428 428 40 No of Masons trained and using their new skills 135 135 135
41 No. of entrepreneurs/ manufacturers producing low-cost pro-poor sanitation solutions by types and varieties 24 24 24
42 No of sanitation marts facilitated and operating 6 6 6 43 Laying of Sewers and WW Collection in Model villages 3 3 3
Monitoring, Evaluation & Learning
44 No. of monthly substantive monitoring visits conducted for systematic performance indicators 33 33 33
45 No. of monthly review 33 33 33 46 No. of best practices/ case studies documented 3 3 3 47 No. of human interest stories gathered and disseminated 3 3 3
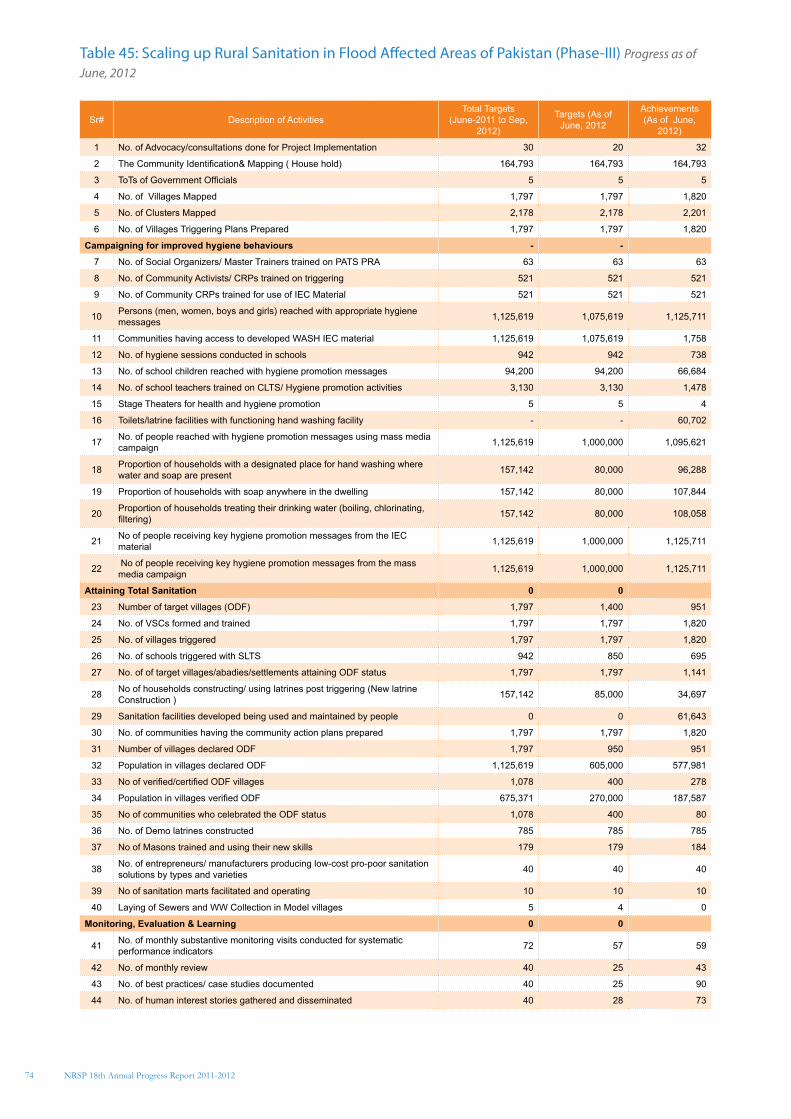
74
Table 45: Scaling up Rural Sanitation in Flood Affected Areas of Pakistan (Phase-III) Progress as of June, 2012
Sr# Description of ActivitiesTotal Targets
(June-2011 to Sep, 2012)
Targets (As of June, 2012
Achievements (As of June,
2012)
1 No. of Advocacy/consultations done for Project Implementation 30 20 32
2 The Community Identification& Mapping ( House hold) 164,793 164,793 164,793
3 ToTs of Government Officials 5 5 5
4 No. of Villages Mapped 1,797 1,797 1,820
5 No. of Clusters Mapped 2,178 2,178 2,201
6 No. of Villages Triggering Plans Prepared 1,797 1,797 1,820
Campaigning for improved hygiene behaviours - -
7 No. of Social Organizers/ Master Trainers trained on PATS PRA 63 63 63
8 No. of Community Activists/ CRPs trained on triggering 521 521 521
9 No. of Community CRPs trained for use of IEC Material 521 521 521
10 Persons (men, women, boys and girls) reached with appropriate hygiene messages 1,125,619 1,075,619 1,125,711
11 Communities having access to developed WASH IEC material 1,125,619 1,075,619 1,758
12 No. of hygiene sessions conducted in schools 942 942 738
13 No. of school children reached with hygiene promotion messages 94,200 94,200 66,684
14 No. of school teachers trained on CLTS/ Hygiene promotion activities 3,130 3,130 1,478
15 Stage Theaters for health and hygiene promotion 5 5 4
16 Toilets/latrine facilities with functioning hand washing facility - - 60,702
17 No. of people reached with hygiene promotion messages using mass media campaign 1,125,619 1,000,000 1,095,621
18 Proportion of households with a designated place for hand washing where water and soap are present 157,142 80,000 96,288
19 Proportion of households with soap anywhere in the dwelling 157,142 80,000 107,844
20 Proportion of households treating their drinking water (boiling, chlorinating, filtering) 157,142 80,000 108,058
21 No of people receiving key hygiene promotion messages from the IEC material 1,125,619 1,000,000 1,125,711
22 No of people receiving key hygiene promotion messages from the mass media campaign 1,125,619 1,000,000 1,125,711
Attaining Total Sanitation 0 0
23 Number of target villages (ODF) 1,797 1,400 951
24 No. of VSCs formed and trained 1,797 1,797 1,820
25 No. of villages triggered 1,797 1,797 1,820
26 No. of schools triggered with SLTS 942 850 695
27 No. of of target villages/abadies/settlements attaining ODF status 1,797 1,797 1,141
28 No of households constructing/ using latrines post triggering (New latrine Construction ) 157,142 85,000 34,697
29 Sanitation facilities developed being used and maintained by people 0 0 61,643
30 No. of communities having the community action plans prepared 1,797 1,797 1,820
31 Number of villages declared ODF 1,797 950 951
32 Population in villages declared ODF 1,125,619 605,000 577,981
33 No of verified/certified ODF villages 1,078 400 278
34 Population in villages verified ODF 675,371 270,000 187,587
35 No of communities who celebrated the ODF status 1,078 400 80
36 No. of Demo latrines constructed 785 785 785
37 No of Masons trained and using their new skills 179 179 184
38 No. of entrepreneurs/ manufacturers producing low-cost pro-poor sanitation solutions by types and varieties 40 40 40
39 No of sanitation marts facilitated and operating 10 10 10
40 Laying of Sewers and WW Collection in Model villages 5 4 0
Monitoring, Evaluation & Learning 0 0
41 No. of monthly substantive monitoring visits conducted for systematic performance indicators 72 57 59
42 No. of monthly review 40 25 43
43 No. of best practices/ case studies documented 40 25 90
44 No. of human interest stories gathered and disseminated 40 28 73
NRSP 18th Annual Progress Report 2011-2012
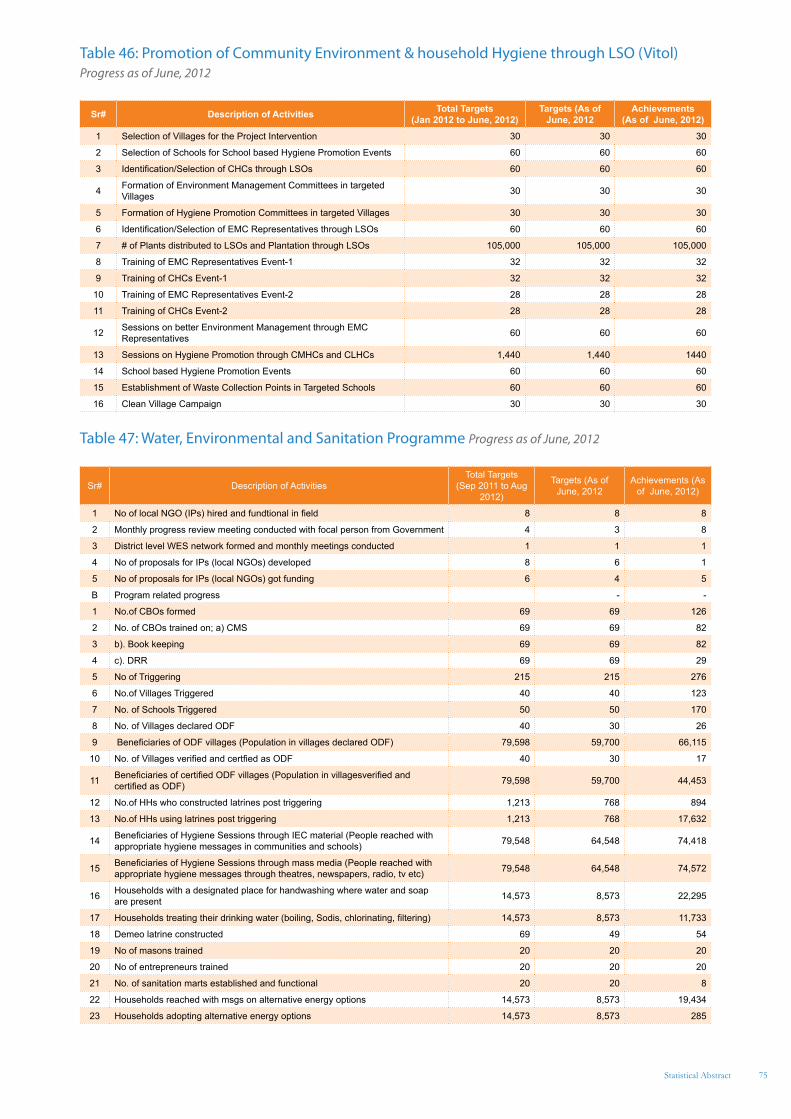
75Statistical Abstract
Table 46: Promotion of Community Environment & household Hygiene through LSO (Vitol) Progress as of June, 2012
Sr# Description of Activities Total Targets (Jan 2012 to June, 2012)
Targets (As of June, 2012
Achievements (As of June, 2012)
1 Selection of Villages for the Project Intervention 30 30 30
2 Selection of Schools for School based Hygiene Promotion Events 60 60 60
3 Identification/Selection of CHCs through LSOs 60 60 60
4 Formation of Environment Management Committees in targeted Villages 30 30 30
5 Formation of Hygiene Promotion Committees in targeted Villages 30 30 30
6 Identification/Selection of EMC Representatives through LSOs 60 60 60
7 # of Plants distributed to LSOs and Plantation through LSOs 105,000 105,000 105,000
8 Training of EMC Representatives Event-1 32 32 32
9 Training of CHCs Event-1 32 32 32
10 Training of EMC Representatives Event-2 28 28 28
11 Training of CHCs Event-2 28 28 28
12 Sessions on better Environment Management through EMC Representatives 60 60 60
13 Sessions on Hygiene Promotion through CMHCs and CLHCs 1,440 1,440 1440
14 School based Hygiene Promotion Events 60 60 60
15 Establishment of Waste Collection Points in Targeted Schools 60 60 60
16 Clean Village Campaign 30 30 30
Table 47: Water, Environmental and Sanitation Programme Progress as of June, 2012
Sr# Description of ActivitiesTotal Targets
(Sep 2011 to Aug 2012)
Targets (As of June, 2012
Achievements (As of June, 2012)
1 No of local NGO (IPs) hired and fundtional in field 8 8 8
2 Monthly progress review meeting conducted with focal person from Government 4 3 8
3 District level WES network formed and monthly meetings conducted 1 1 1
4 No of proposals for IPs (local NGOs) developed 8 6 1
5 No of proposals for IPs (local NGOs) got funding 6 4 5
B Program related progress - -
1 No.of CBOs formed 69 69 126
2 No. of CBOs trained on; a) CMS 69 69 82
3 b). Book keeping 69 69 82
4 c). DRR 69 69 29
5 No of Triggering 215 215 276
6 No.of Villages Triggered 40 40 123
7 No. of Schools Triggered 50 50 170
8 No. of Villages declared ODF 40 30 26
9 Beneficiaries of ODF villages (Population in villages declared ODF) 79,598 59,700 66,115
10 No. of Villages verified and certfied as ODF 40 30 17
11 Beneficiaries of certified ODF villages (Population in villagesverified and certified as ODF) 79,598 59,700 44,453
12 No.of HHs who constructed latrines post triggering 1,213 768 894
13 No.of HHs using latrines post triggering 1,213 768 17,632
14 Beneficiaries of Hygiene Sessions through IEC material (People reached with appropriate hygiene messages in communities and schools) 79,548 64,548 74,418
15 Beneficiaries of Hygiene Sessions through mass media (People reached with appropriate hygiene messages through theatres, newspapers, radio, tv etc) 79,548 64,548 74,572
16 Households with a designated place for handwashing where water and soap are present 14,573 8,573 22,295
17 Households treating their drinking water (boiling, Sodis, chlorinating, filtering) 14,573 8,573 11,733
18 Demeo latrine constructed 69 49 54
19 No of masons trained 20 20 20
20 No of entrepreneurs trained 20 20 20
21 No. of sanitation marts established and functional 20 20 8
22 Households reached with msgs on alternative energy options 14,573 8,573 19,434
23 Households adopting alternative energy options 14,573 8,573 285
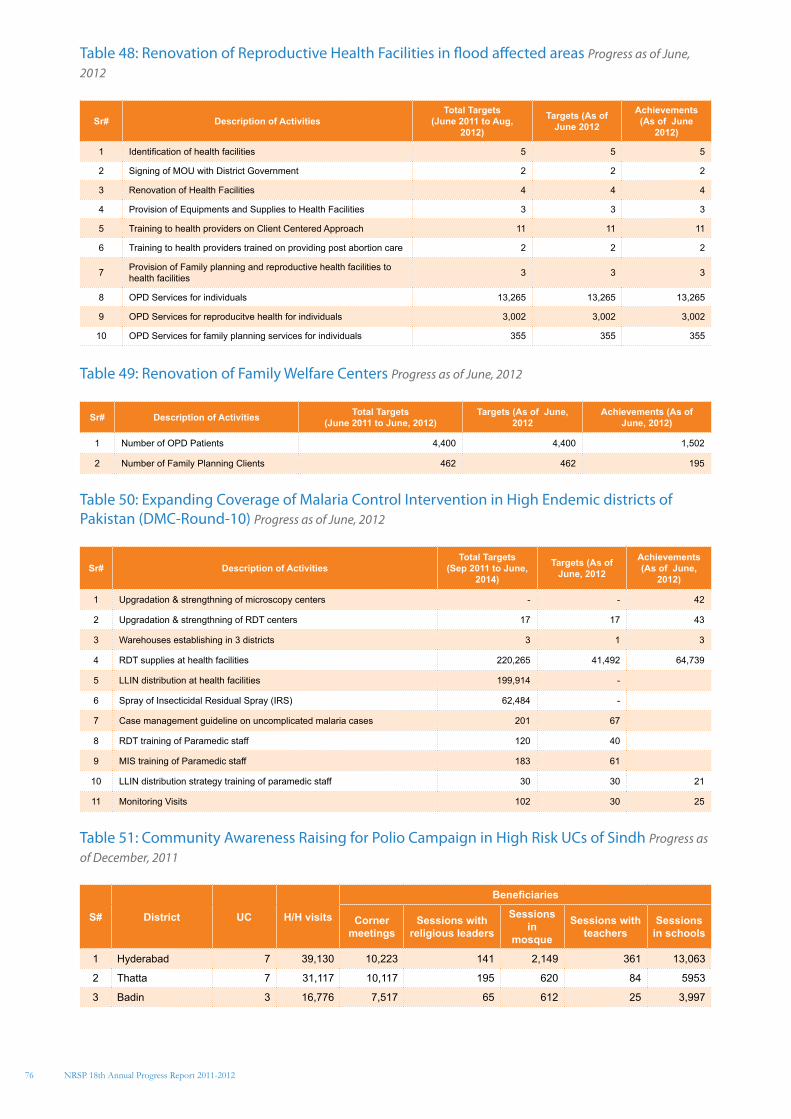
76
Table 48: Renovation of Reproductive Health Facilities in flood affected areas Progress as of June, 2012
Sr# Description of ActivitiesTotal Targets
(June 2011 to Aug, 2012)
Targets (As of June 2012
Achievements (As of June
2012)
1 Identification of health facilities 5 5 5
2 Signing of MOU with District Government 2 2 2
3 Renovation of Health Facilities 4 4 4
4 Provision of Equipments and Supplies to Health Facilities 3 3 3
5 Training to health providers on Client Centered Approach 11 11 11
6 Training to health providers trained on providing post abortion care 2 2 2
7 Provision of Family planning and reproductive health facilities to health facilities 3 3 3
8 OPD Services for individuals 13,265 13,265 13,265
9 OPD Services for reproducitve health for individuals 3,002 3,002 3,002
10 OPD Services for family planning services for individuals 355 355 355
Table 49: Renovation of Family Welfare Centers Progress as of June, 2012
Sr# Description of Activities Total Targets (June 2011 to June, 2012)
Targets (As of June, 2012
Achievements (As of June, 2012)
1 Number of OPD Patients 4,400 4,400 1,502
2 Number of Family Planning Clients 462 462 195
Table 50: Expanding Coverage of Malaria Control Intervention in High Endemic districts of Pakistan (DMC-Round-10) Progress as of June, 2012
Sr# Description of ActivitiesTotal Targets
(Sep 2011 to June, 2014)
Targets (As of June, 2012
Achievements (As of June,
2012)
1 Upgradation & strengthning of microscopy centers - - 42
2 Upgradation & strengthning of RDT centers 17 17 43
3 Warehouses establishing in 3 districts 3 1 3
4 RDT supplies at health facilities 220,265 41,492 64,739
5 LLIN distribution at health facilities 199,914 -
6 Spray of Insecticidal Residual Spray (IRS) 62,484 -
7 Case management guideline on uncomplicated malaria cases 201 67
8 RDT training of Paramedic staff 120 40
9 MIS training of Paramedic staff 183 61
10 LLIN distribution strategy training of paramedic staff 30 30 21
11 Monitoring Visits 102 30 25
Table 51: Community Awareness Raising for Polio Campaign in High Risk UCs of Sindh Progress as of December, 2011
S# District UC H/H visits
Beneficiaries
Corner meetings
Sessions with religious leaders
Sessions in
mosque
Sessions with teachers
Sessions in schools
1 Hyderabad 7 39,130 10,223 141 2,149 361 13,063
2 Thatta 7 31,117 10,117 195 620 84 5953
3 Badin 3 16,776 7,517 65 612 25 3,997
NRSP 18th Annual Progress Report 2011-2012
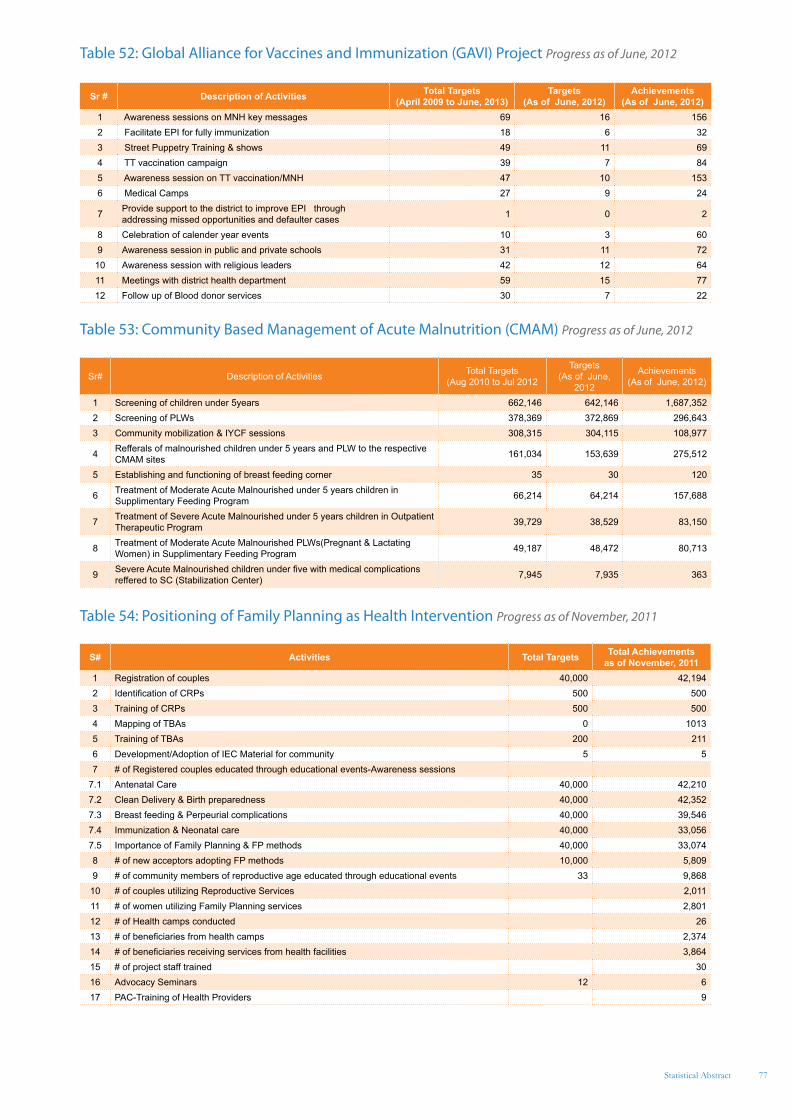
77Statistical Abstract
Table 52: Global Alliance for Vaccines and Immunization (GAVI) Project Progress as of June, 2012
Sr # Description of Activities Total Targets (April 2009 to June, 2013)
Targets (As of June, 2012)
Achievements (As of June, 2012)
1 Awareness sessions on MNH key messages 69 16 156 2 Facilitate EPI for fully immunization 18 6 32 3 Street Puppetry Training & shows 49 11 69 4 TT vaccination campaign 39 7 84 5 Awareness session on TT vaccination/MNH 47 10 153 6 Medical Camps 27 9 24
7 Provide support to the district to improve EPI through addressing missed opportunities and defaulter cases 1 0 2
8 Celebration of calender year events 10 3 60 9 Awareness session in public and private schools 31 11 72
10 Awareness session with religious leaders 42 12 64 11 Meetings with district health department 59 15 77 12 Follow up of Blood donor services 30 7 22
Table 53: Community Based Management of Acute Malnutrition (CMAM) Progress as of June, 2012
Sr# Description of Activities Total Targets (Aug 2010 to Jul 2012
Targets (As of June,
2012
Achievements (As of June, 2012)
1 Screening of children under 5years 662,146 642,146 1,687,352 2 Screening of PLWs 378,369 372,869 296,643 3 Community mobilization & IYCF sessions 308,315 304,115 108,977
4 Refferals of malnourished children under 5 years and PLW to the respective CMAM sites 161,034 153,639 275,512
5 Establishing and functioning of breast feeding corner 35 30 120
6 Treatment of Moderate Acute Malnourished under 5 years children in Supplimentary Feeding Program 66,214 64,214 157,688
7 Treatment of Severe Acute Malnourished under 5 years children in Outpatient Therapeutic Program 39,729 38,529 83,150
8 Treatment of Moderate Acute Malnourished PLWs(Pregnant & Lactating Women) in Supplimentary Feeding Program 49,187 48,472 80,713
9 Severe Acute Malnourished children under five with medical complications reffered to SC (Stabilization Center) 7,945 7,935 363
Table 54: Positioning of Family Planning as Health Intervention Progress as of November, 2011
S# Activities Total Targets Total Achievements as of November, 2011
1 Registration of couples 40,000 42,1942 Identification of CRPs 500 5003 Training of CRPs 500 5004 Mapping of TBAs 0 10135 Training of TBAs 200 2116 Development/Adoption of IEC Material for community 5 57 # of Registered couples educated through educational events-Awareness sessions
7.1 Antenatal Care 40,000 42,2107.2 Clean Delivery & Birth preparedness 40,000 42,3527.3 Breast feeding & Perpeurial complications 40,000 39,5467.4 Immunization & Neonatal care 40,000 33,0567.5 Importance of Family Planning & FP methods 40,000 33,0748 # of new acceptors adopting FP methods 10,000 5,8099 # of community members of reproductive age educated through educational events 33 9,868
10 # of couples utilizing Reproductive Services 2,01111 # of women utilizing Family Planning services 2,80112 # of Health camps conducted 2613 # of beneficiaries from health camps 2,37414 # of beneficiaries receiving services from health facilities 3,86415 # of project staff trained 3016 Advocacy Seminars 12 617 PAC-Training of Health Providers 9
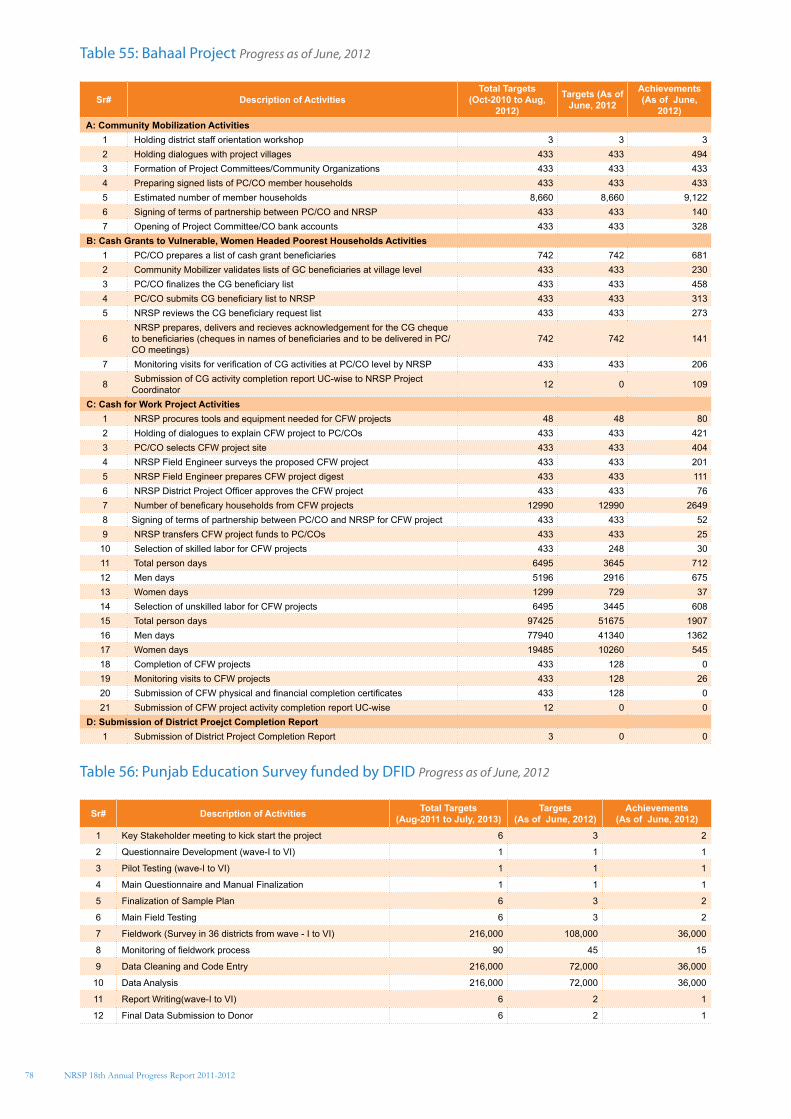
78
Table 55: Bahaal Project Progress as of June, 2012
Sr# Description of ActivitiesTotal Targets
(Oct-2010 to Aug, 2012)
Targets (As of June, 2012
Achievements (As of June,
2012) A: Community Mobilization Activities
1 Holding district staff orientation workshop 3 3 3 2 Holding dialogues with project villages 433 433 494 3 Formation of Project Committees/Community Organizations 433 433 433 4 Preparing signed lists of PC/CO member households 433 433 433 5 Estimated number of member households 8,660 8,660 9,122 6 Signing of terms of partnership between PC/CO and NRSP 433 433 140 7 Opening of Project Committee/CO bank accounts 433 433 328
B: Cash Grants to Vulnerable, Women Headed Poorest Households Activities 1 PC/CO prepares a list of cash grant beneficiaries 742 742 681 2 Community Mobilizer validates lists of GC beneficiaries at village level 433 433 230 3 PC/CO finalizes the CG beneficiary list 433 433 458 4 PC/CO submits CG beneficiary list to NRSP 433 433 313 5 NRSP reviews the CG beneficiary request list 433 433 273
6 NRSP prepares, delivers and recieves acknowledgement for the CG cheque to beneficiaries (cheques in names of beneficiaries and to be delivered in PC/CO meetings)
742 742 141
7 Monitoring visits for verification of CG activities at PC/CO level by NRSP 433 433 206
8 Submission of CG activity completion report UC-wise to NRSP Project Coordinator 12 0 109
C: Cash for Work Project Activities 1 NRSP procures tools and equipment needed for CFW projects 48 48 80 2 Holding of dialogues to explain CFW project to PC/COs 433 433 421 3 PC/CO selects CFW project site 433 433 404 4 NRSP Field Engineer surveys the proposed CFW project 433 433 201 5 NRSP Field Engineer prepares CFW project digest 433 433 111 6 NRSP District Project Officer approves the CFW project 433 433 76 7 Number of beneficary households from CFW projects 12990 12990 2649 8 Signing of terms of partnership between PC/CO and NRSP for CFW project 433 433 52 9 NRSP transfers CFW project funds to PC/COs 433 433 25
10 Selection of skilled labor for CFW projects 433 248 30 11 Total person days 6495 3645 712 12 Men days 5196 2916 675 13 Women days 1299 729 37 14 Selection of unskilled labor for CFW projects 6495 3445 608 15 Total person days 97425 51675 1907 16 Men days 77940 41340 1362 17 Women days 19485 10260 545 18 Completion of CFW projects 433 128 0 19 Monitoring visits to CFW projects 433 128 26 20 Submission of CFW physical and financial completion certificates 433 128 0 21 Submission of CFW project activity completion report UC-wise 12 0 0
D: Submission of District Proejct Completion Report 1 Submission of District Project Completion Report 3 0 0
Table 56: Punjab Education Survey funded by DFID Progress as of June, 2012
Sr# Description of Activities Total Targets (Aug-2011 to July, 2013)
Targets (As of June, 2012)
Achievements (As of June, 2012)
1 Key Stakeholder meeting to kick start the project 6 3 2
2 Questionnaire Development (wave-I to VI) 1 1 1
3 Pilot Testing (wave-I to VI) 1 1 1
4 Main Questionnaire and Manual Finalization 1 1 1
5 Finalization of Sample Plan 6 3 2
6 Main Field Testing 6 3 2
7 Fieldwork (Survey in 36 districts from wave - I to VI) 216,000 108,000 36,000
8 Monitoring of fieldwork process 90 45 15
9 Data Cleaning and Code Entry 216,000 72,000 36,000
10 Data Analysis 216,000 72,000 36,000
11 Report Writing(wave-I to VI) 6 2 1
12 Final Data Submission to Donor 6 2 1
NRSP 18th Annual Progress Report 2011-2012
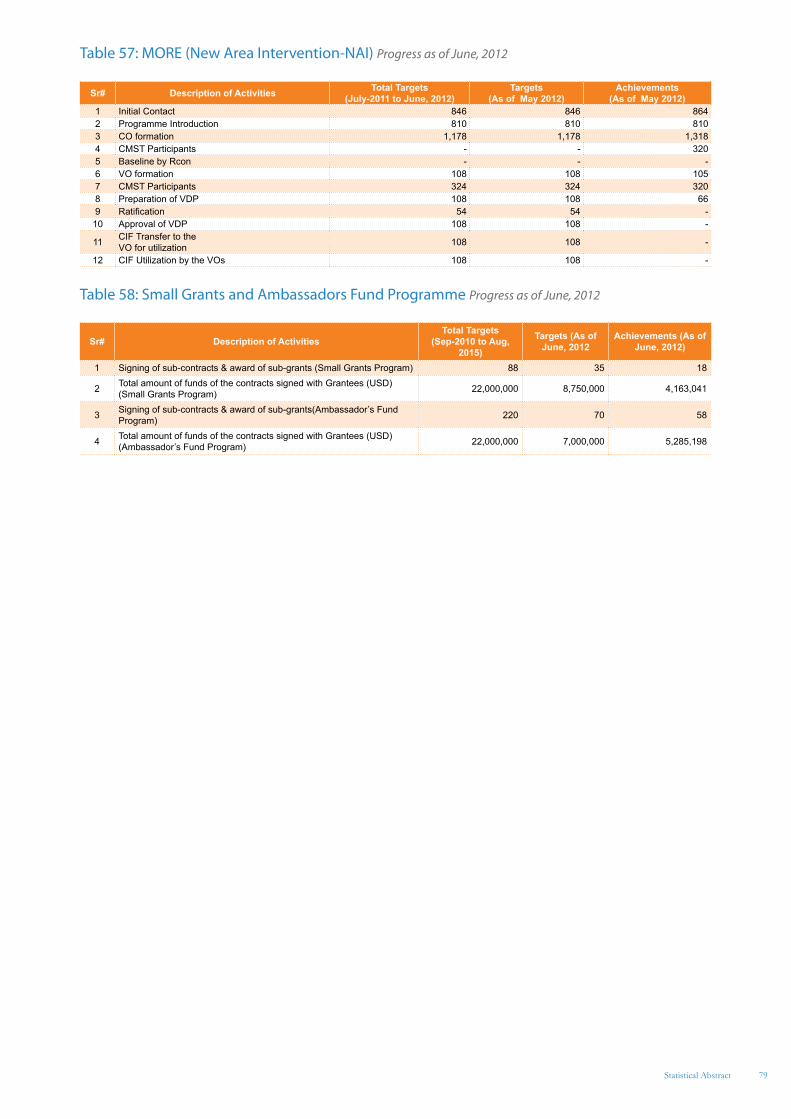
79Statistical Abstract
Table 57: MORE (New Area Intervention-NAI) Progress as of June, 2012
Sr# Description of Activities Total Targets (July-2011 to June, 2012)
Targets (As of May 2012)
Achievements (As of May 2012)
1 Initial Contact 846 846 8642 Programme Introduction 810 810 810 3 CO formation 1,178 1,178 1,318 4 CMST Participants - - 320 5 Baseline by Rcon - - - 6 VO formation 108 108 105 7 CMST Participants 324 324 320 8 Preparation of VDP 108 108 66 9 Ratification 54 54 - 10 Approval of VDP 108 108 -
11 CIF Transfer to the VO for utilization 108 108 -
12 CIF Utilization by the VOs 108 108 -
Table 58: Small Grants and Ambassadors Fund Programme Progress as of June, 2012
Sr# Description of ActivitiesTotal Targets
(Sep-2010 to Aug, 2015)
Targets (As of June, 2012
Achievements (As of June, 2012)
1 Signing of sub-contracts & award of sub-grants (Small Grants Program) 88 35 18
2 Total amount of funds of the contracts signed with Grantees (USD) (Small Grants Program) 22,000,000 8,750,000 4,163,041
3 Signing of sub-contracts & award of sub-grants(Ambassador’s Fund Program) 220 70 58
4 Total amount of funds of the contracts signed with Grantees (USD) (Ambassador’s Fund Program) 22,000,000 7,000,000 5,285,198
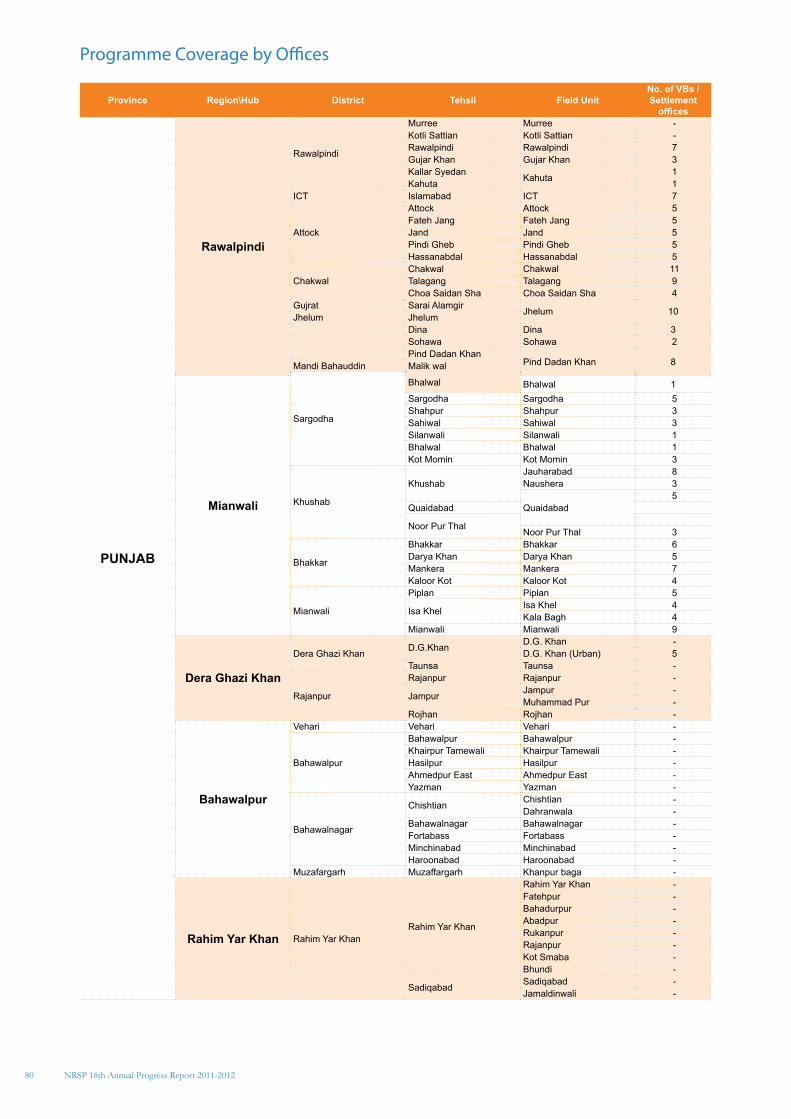
80 NRSP 18th Annual Progress Report 2011-2012
Programme Coverage by Offices
Province Region\Hub District Tehsil Field UnitNo. of VBs /Settlement
offices
PUNJAB
Rawalpindi
Rawalpindi
Murree Murree - Kotli Sattian Kotli Sattian - Rawalpindi Rawalpindi 7 Gujar Khan Gujar Khan 3 Kallar Syedan Kahuta 1 Kahuta 1
ICT Islamabad ICT 7
Attock
Attock Attock 5 Fateh Jang Fateh Jang 5 Jand Jand 5 Pindi Gheb Pindi Gheb 5 Hassanabdal Hassanabdal 5
ChakwalChakwal Chakwal 11 Talagang Talagang 9 Choa Saidan Sha Choa Saidan Sha 4
Gujrat Sarai Alamgir Jhelum 10Jhelum JhelumDina Dina 3Sohawa Sohawa 2 Pind Dadan Khan
Pind Dadan Khan 8Mandi Bahauddin Malik wal
Sargodha
Bhalwal
Mianwali
Bhalwal 1Sargodha Sargodha 5 Shahpur Shahpur 3 Sahiwal Sahiwal 3 Silanwali Silanwali 1 Bhalwal Bhalwal 1 Kot Momin Kot Momin 3
Khushab
KhushabJauharabad 8 Naushera 3
Quaidabad 5
Quaidabad
Noor Pur Thal Noor Pur Thal 3
Bhakkar
Bhakkar Bhakkar 6 Darya Khan Darya Khan 5 Mankera Mankera 7 Kaloor Kot Kaloor Kot 4
Mianwali
Piplan Piplan 5
Isa Khel Isa Khel 4 Kala Bagh 4
Mianwali Mianwali 9
Dera Ghazi Khan
Dera Ghazi Khan D.G.Khan D.G. Khan - D.G. Khan (Urban) 5
Taunsa Taunsa -
Rajanpur
Rajanpur Rajanpur -
Jampur Jampur - Muhammad Pur -
Rojhan Rojhan -
Bahawalpur
Vehari Vehari Vehari -
Bahawalpur
Bahawalpur Bahawalpur - Khairpur Tamewali Khairpur Tamewali - Hasilpur Hasilpur - Ahmedpur East Ahmedpur East - Yazman Yazman -
Bahawalnagar
Chishtian Chishtian - Dahranwala -
Bahawalnagar Bahawalnagar - Fortabass Fortabass - Minchinabad Minchinabad - Haroonabad Haroonabad -
Muzafargarh Muzaffargarh Khanpur baga -
Rahim Yar Khan Rahim Yar KhanRahim Yar Khan
Rahim Yar Khan - Fatehpur - Bahadurpur - Abadpur - Rukanpur - Rajanpur - Kot Smaba - Bhundi -
Sadiqabad Sadiqabad - Jamaldinwali -
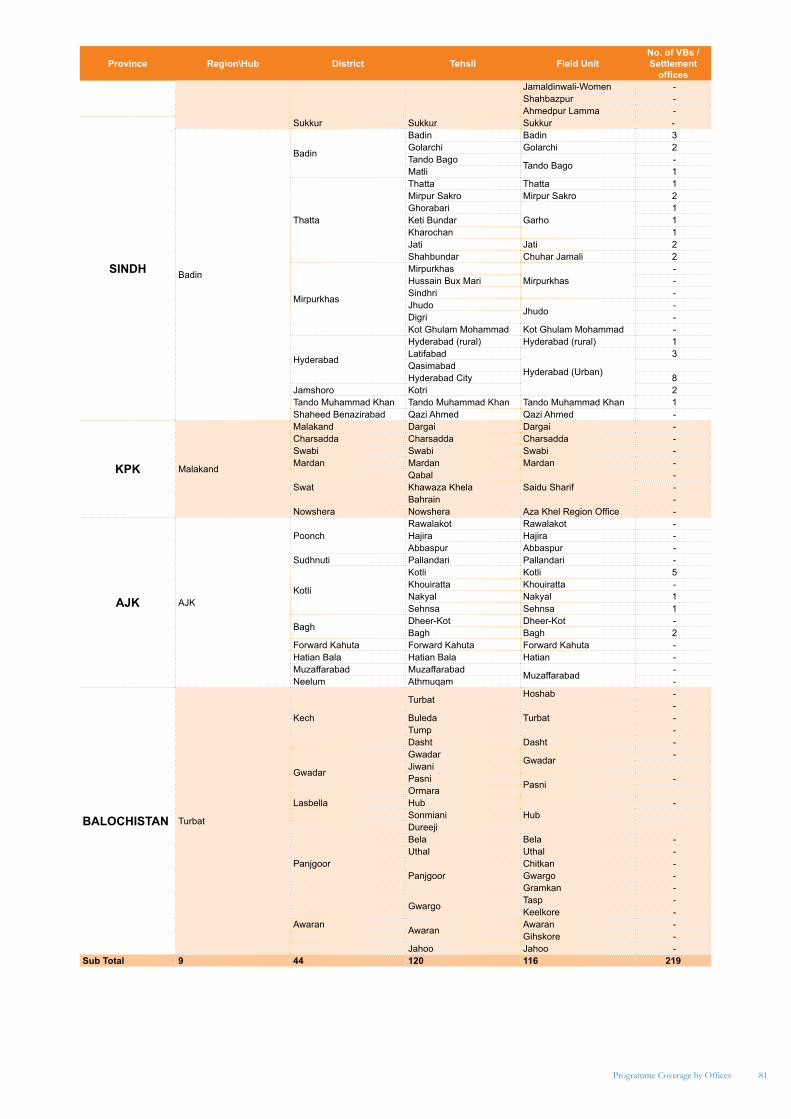
81
Province Region\Hub District Tehsil Field UnitNo. of VBs /Settlement
officesJamaldinwali-Women - Shahbazpur - Ahmedpur Lamma -
SINDH
Sukkur Sukkur Sukkur -
Badin
Badin
Badin Badin 3 Golarchi Golarchi 2 Tando Bago Tando Bago - Matli 1
Thatta
Thatta Thatta 1 Mirpur Sakro Mirpur Sakro 2 Ghorabari
Garho 1
Keti Bundar 1 Kharochan 1 Jati Jati 2 Shahbundar Chuhar Jamali 2
Mirpurkhas
MirpurkhasMirpurkhas
- Hussain Bux Mari - Sindhri - Jhudo Jhudo - Digri - Kot Ghulam Mohammad Kot Ghulam Mohammad -
Hyderabad
Hyderabad (rural) Hyderabad (rural) 1 Latifabad
Hyderabad (Urban)
3 QasimabadHyderabad City 8
Jamshoro Kotri 2 Tando Muhammad Khan Tando Muhammad Khan Tando Muhammad Khan 1 Shaheed Benazirabad Qazi Ahmed Qazi Ahmed -
KPK Malakand
Malakand Dargai Dargai - Charsadda Charsadda Charsadda - Swabi Swabi Swabi - Mardan Mardan Mardan -
SwatQabal
Saidu Sharif -
Khawaza Khela - Bahrain -
Nowshera Nowshera Aza Khel Region Office -
AJK AJK
PoonchRawalakot Rawalakot - Hajira Hajira - Abbaspur Abbaspur -
Sudhnuti Pallandari Pallandari -
Kotli
Kotli Kotli 5 Khouiratta Khouiratta - Nakyal Nakyal 1 Sehnsa Sehnsa 1
Bagh Dheer-Kot Dheer-Kot - Bagh Bagh 2
Forward Kahuta Forward Kahuta Forward Kahuta - Hatian Bala Hatian Bala Hatian - Muzaffarabad Muzaffarabad Muzaffarabad - Neelum Athmuqam -
BALOCHISTAN Turbat
Kech
Turbat Hoshab -
Turbat -
Buleda - Tump - Dasht Dasht -
Gwadar
Gwadar Gwadar - JiwaniPasni Pasni - Ormara
Lasbella HubHub
- SonmianiDureejiBela Bela - Uthal Uthal -
PanjgoorPanjgoor
Chitkan - Gwargo - Gramkan -
Gwargo Tasp - Keelkore -
Awaran Awaran Awaran - Gihskore -
Jahoo Jahoo - Sub Total 9 44 120 116 219
Programme Coverage by Offices
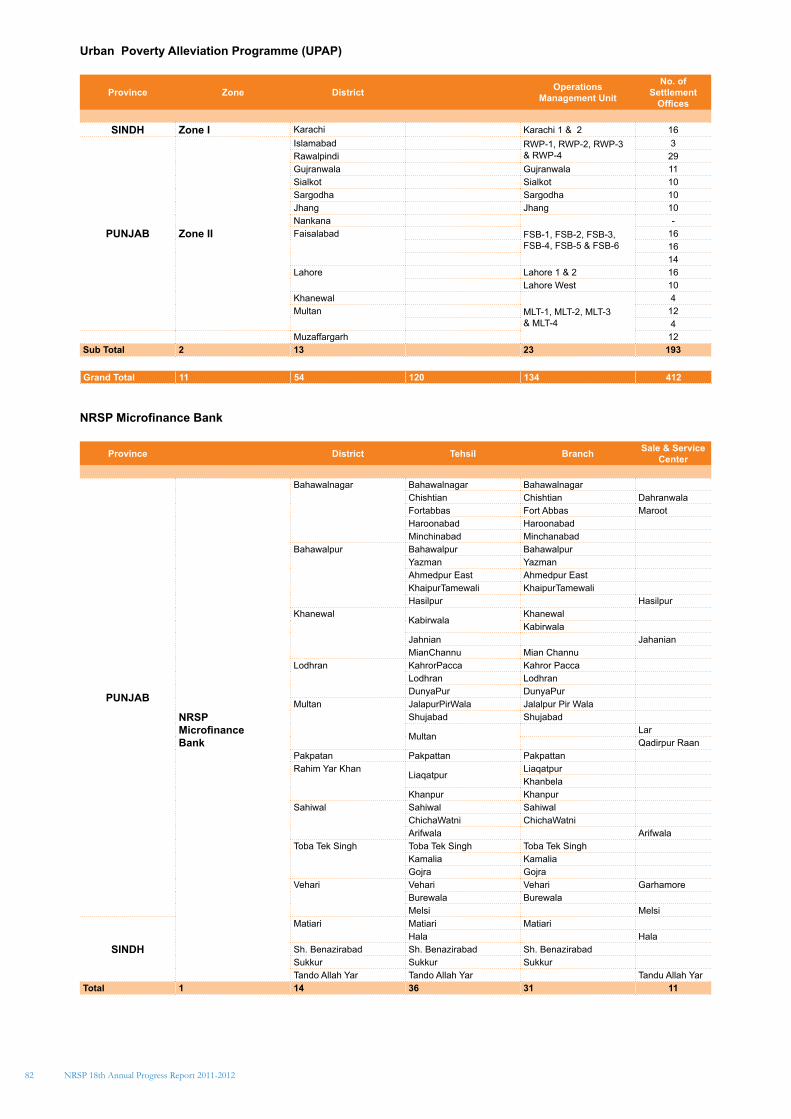
82
Urban Poverty Alleviation Programme (UPAP)
Province Zone District Operations Management Unit
No. of Settlement
Offices
SINDH Zone I Karachi Karachi 1 & 2 16
PUNJAB Zone II
Islamabad RWP-1, RWP-2, RWP-3 & RWP-4
3 Rawalpindi 29 Gujranwala Gujranwala 11 Sialkot Sialkot 10 Sargodha Sargodha 10 Jhang Jhang 10 Nankana
FSB-1, FSB-2, FSB-3, FSB-4, FSB-5 & FSB-6
- Faisalabad 16
16 14
Lahore Lahore 1 & 2 16Lahore West 10
KhanewalMLT-1, MLT-2, MLT-3 & MLT-4
4 Multan 12
4 Muzaffargarh 12
Sub Total 2 13 23 193
Grand Total 11 54 120 134 412
NRSP Microfinance Bank
Province District Tehsil Branch Sale & Service Center
PUNJAB
NRSP Microfinance Bank
Bahawalnagar Bahawalnagar BahawalnagarChishtian Chishtian DahranwalaFortabbas Fort Abbas MarootHaroonabad HaroonabadMinchinabad Minchanabad
Bahawalpur Bahawalpur BahawalpurYazman YazmanAhmedpur East Ahmedpur EastKhaipurTamewali KhaipurTamewaliHasilpur Hasilpur
KhanewalKabirwala
KhanewalKabirwala
Jahnian JahanianMianChannu Mian Channu
Lodhran KahrorPacca Kahror PaccaLodhran LodhranDunyaPur DunyaPur
Multan JalapurPirWala Jalalpur Pir WalaShujabad Shujabad
MultanLarQadirpur Raan
Pakpatan Pakpattan PakpattanRahim Yar Khan
LiaqatpurLiaqatpurKhanbela
Khanpur KhanpurSahiwal Sahiwal Sahiwal
ChichaWatni ChichaWatniArifwala Arifwala
Toba Tek Singh Toba Tek Singh Toba Tek SinghKamalia KamaliaGojra Gojra
Vehari Vehari Vehari GarhamoreBurewala BurewalaMelsi Melsi
SINDH
Matiari Matiari MatiariHala Hala
Sh. Benazirabad Sh. Benazirabad Sh. BenazirabadSukkur Sukkur SukkurTando Allah Yar Tando Allah Yar Tandu Allah Yar
Total 1 14 36 31 11
NRSP 18th Annual Progress Report 2011-2012
83Statement of Audited Accounts of NRSP
Statement of Audited Accounts of NRSP
84 NRSP 18th Annual Progress Report 2011-2012
85Statement of Audited Accounts of NRSP
86 NRSP 18th Annual Progress Report 2011-2012
87Statement of Audited Accounts of NRSP
88 NRSP 18th Annual Progress Report 2011-2012
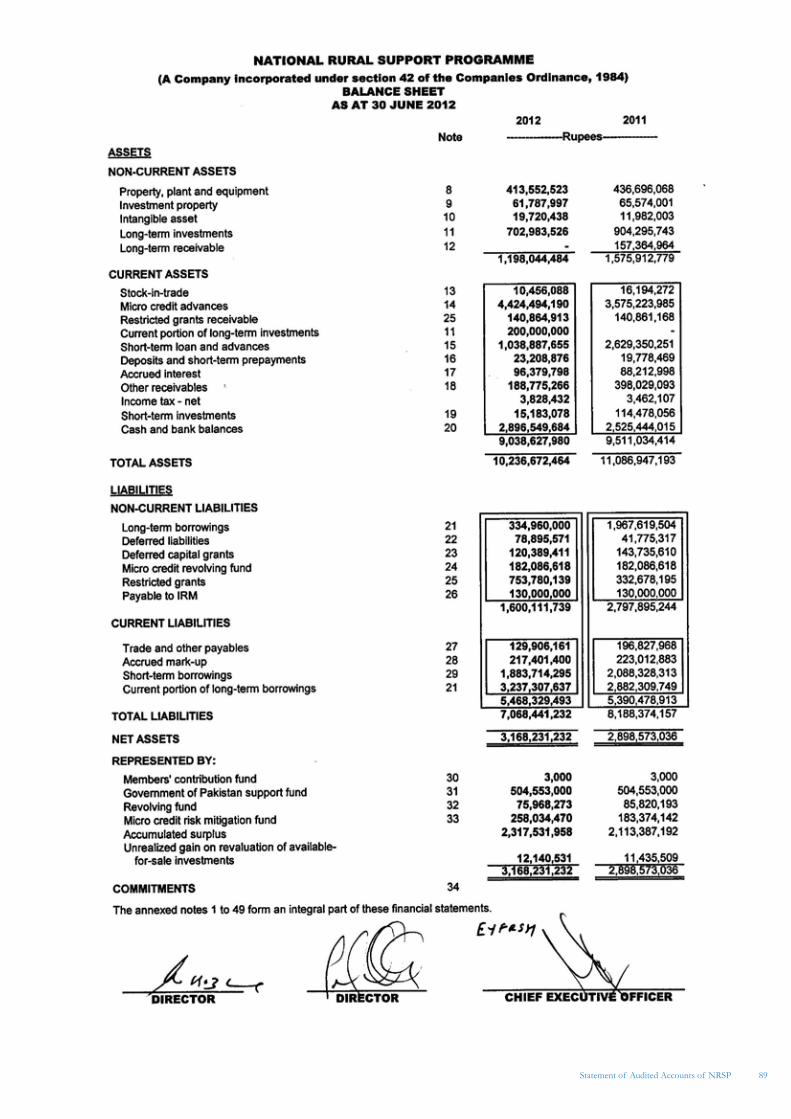
89Statement of Audited Accounts of NRSP
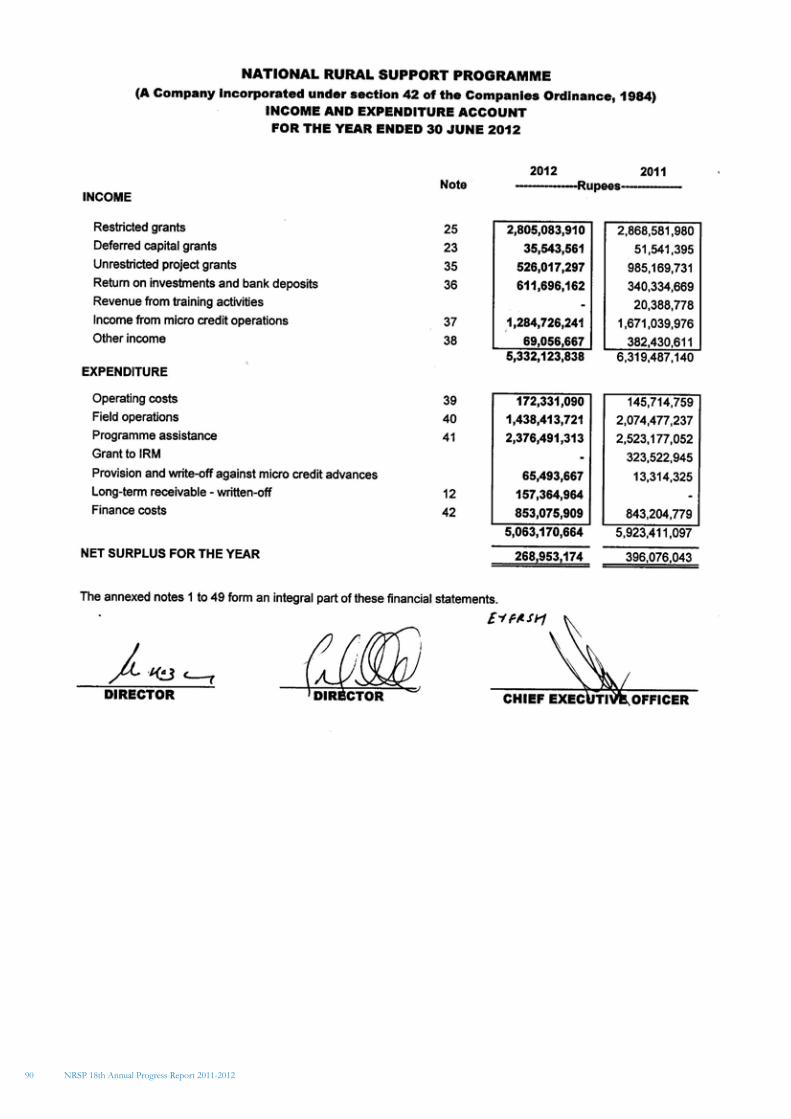
90 NRSP 18th Annual Progress Report 2011-2012
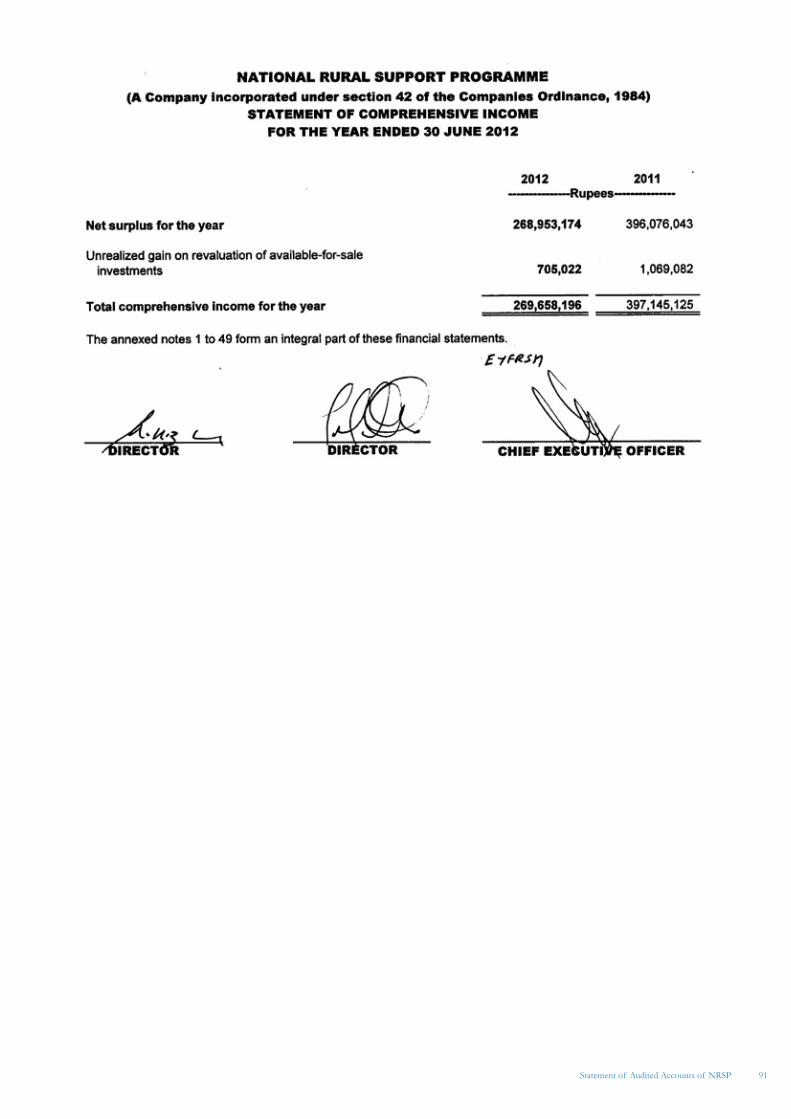
91Statement of Audited Accounts of NRSP
92
Consolidated Statement ofAudited Accounts of NRSP Group
NRSP 18th Annual Progress Report 2011-2012
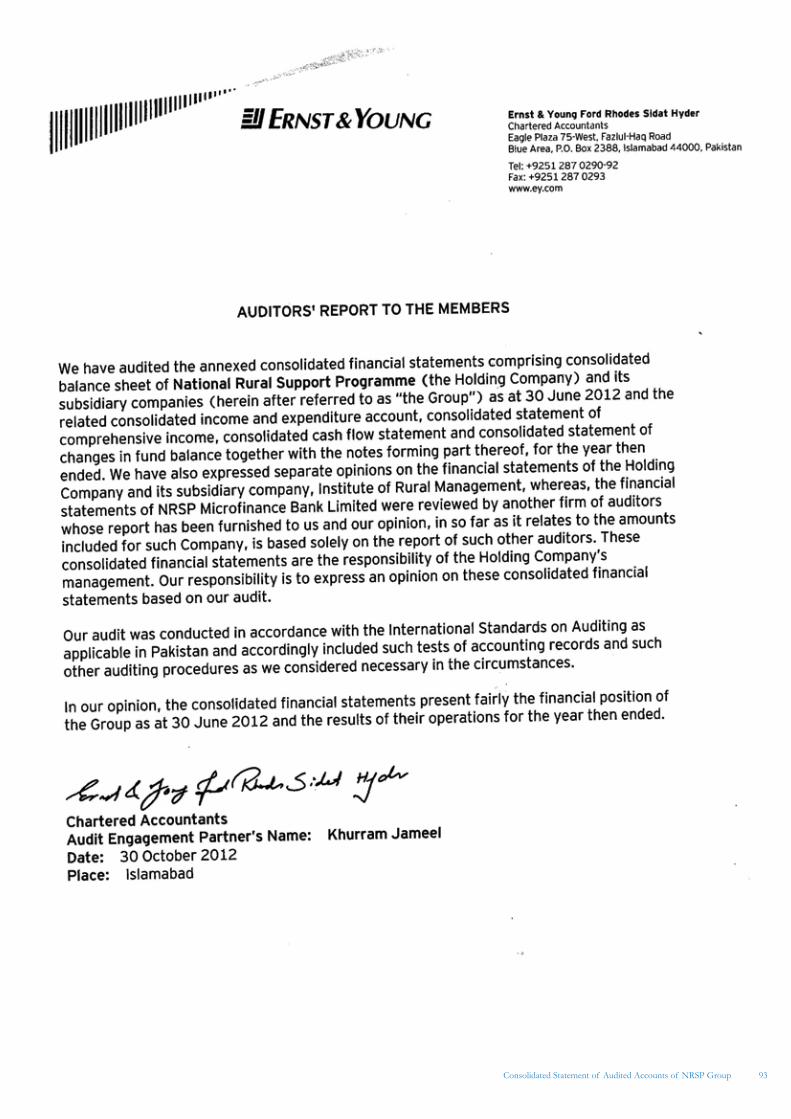
93Consolidated Statement of Audited Accounts of NRSP Group
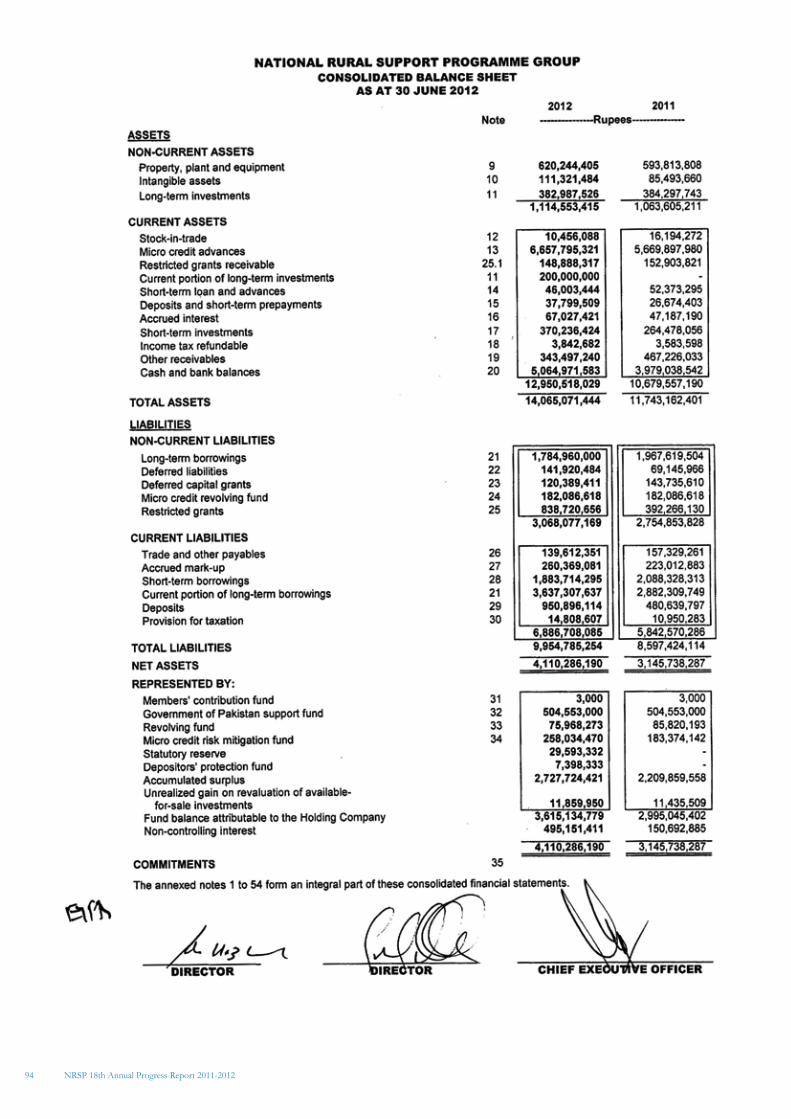
94 NRSP 18th Annual Progress Report 2011-2012
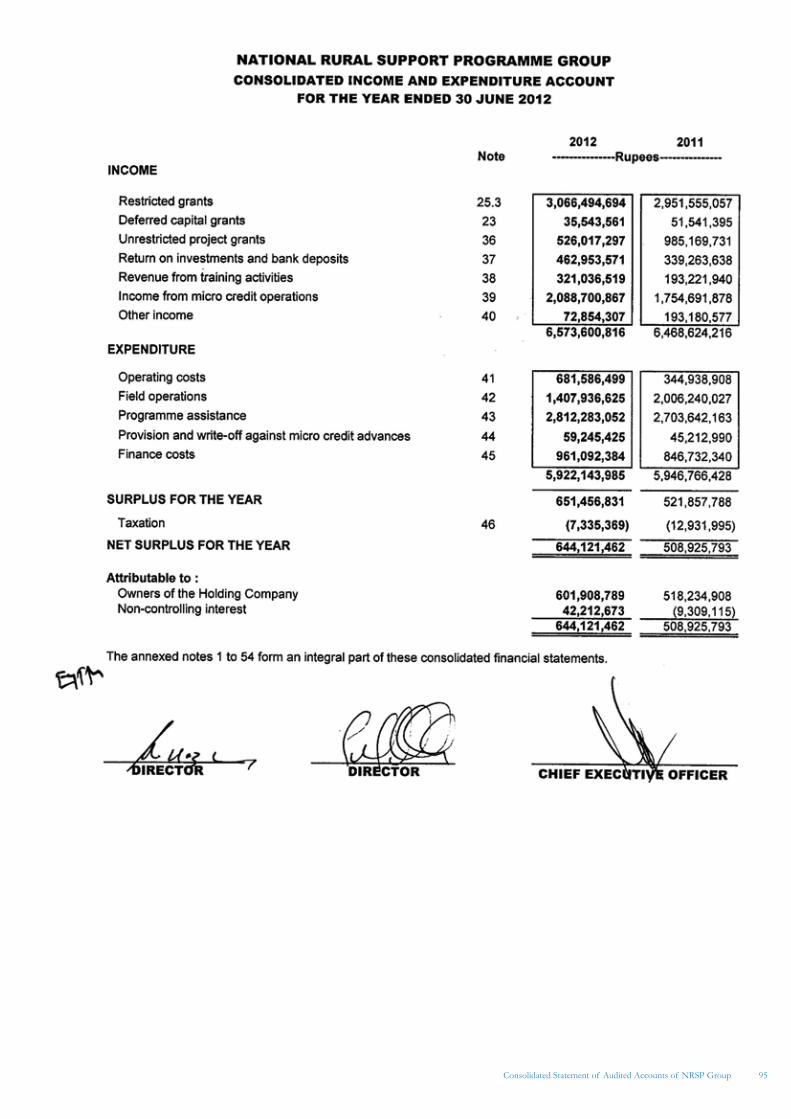
95Consolidated Statement of Audited Accounts of NRSP Group
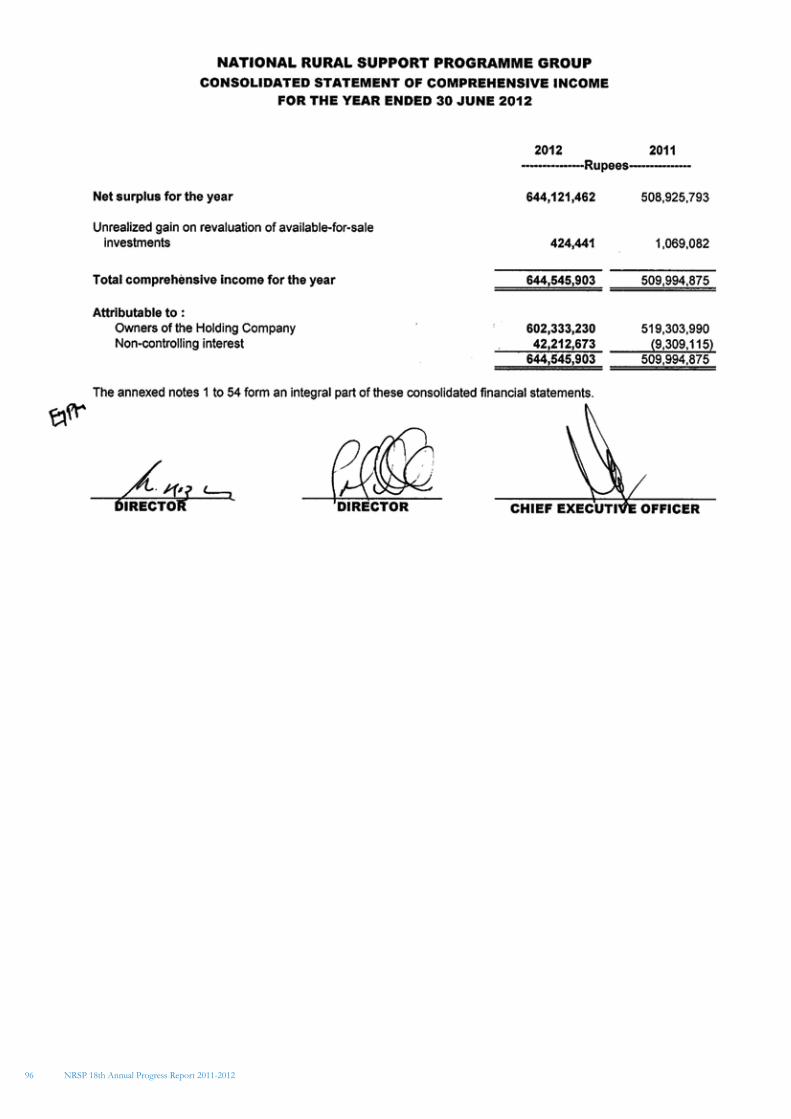
96 NRSP 18th Annual Progress Report 2011-2012
Board of Directors Mr. Shoaib Sultan Khan Mr. Jehangir Khan Tareen
Mr. Tariq Masud Mr. Fazlullah Qureshi
Mr. Muhammad Azam Khan Mr. Bashir Ahmed
Mr. Parvez Masood Mr. Safdar Hussain Kazmi
Ms. Kishwar Naheed Dr. Humayun Khan
Mr. Muhammad Nazar Memon Dr. Arifa Anwar
Dr. Shahida Jaffery Mr. Saeed Ahmed Qureshi
Ex-Officio Directors
Secretary Finance, Government of Pakistan, Islamabad
Secretary LG&RD, Government of Pakistan, Islamabad
Secretary P & D, Government of Pakistan, Islamabad
Dr. Rashid Bajwa, CEO