annual report (2010-11) hcl
TRANSCRIPT

1
HCL TECHNOLOGIES LIMITED
Regd. Office: 806, Siddharth, 96, Nehru Place, New Delhi – 110 019
NOTICE
NOTICE is hereby given that the 19th Annual General Meeting of the members of HCL TechnologiesLimited will be held on Wednesday, November 2, 2011 at 3.00 P.M. at Air Force Auditorium, SubrotoPark, New Delhi -110010 to transact the following business:
ORDINARY BUSINESSORDINARY BUSINESSORDINARY BUSINESSORDINARY BUSINESSORDINARY BUSINESS
Item No. 1 - Adoption of AccountsItem No. 1 - Adoption of AccountsItem No. 1 - Adoption of AccountsItem No. 1 - Adoption of AccountsItem No. 1 - Adoption of Accounts
To receive, consider and adopt the Profit and Loss Account for the year ended June 30, 2011 and theBalance Sheet as at June 30, 2011 together with the Reports of the Directors and Auditors thereon.
Item No. 2 - Retirement of Mr. P.C. Sen as the DirectorItem No. 2 - Retirement of Mr. P.C. Sen as the DirectorItem No. 2 - Retirement of Mr. P.C. Sen as the DirectorItem No. 2 - Retirement of Mr. P.C. Sen as the DirectorItem No. 2 - Retirement of Mr. P.C. Sen as the Director
The following resolution is proposed to be passed with or without modification(s) as an OrdinaryResolution:
“RESOLVED that Mr. P. C. Sen, Director, who retires by rotation and who has expressed his desirenot to seek re-appointment as the Director of the Company, be not re-appointed as Director and thatthe vacancy thereby caused be not filled up.”
Item No. 3 - Retirement of Mr. T. S. R. Subramanian as the DirectorItem No. 3 - Retirement of Mr. T. S. R. Subramanian as the DirectorItem No. 3 - Retirement of Mr. T. S. R. Subramanian as the DirectorItem No. 3 - Retirement of Mr. T. S. R. Subramanian as the DirectorItem No. 3 - Retirement of Mr. T. S. R. Subramanian as the Director
The following resolution is proposed to be passed with or without modification(s) as an OrdinaryResolution:
“RESOLVED that Mr. T. S. R. Subramanian, Director, who retires by rotation and who has expressedhis desire not to seek re-appointment as the Director of the Company, be not re-appointed as Directorand that the vacancy thereby caused be not filled up.”
Item No. 4 - Retirement of Mr. Ajai Chowdhry as the DirectorItem No. 4 - Retirement of Mr. Ajai Chowdhry as the DirectorItem No. 4 - Retirement of Mr. Ajai Chowdhry as the DirectorItem No. 4 - Retirement of Mr. Ajai Chowdhry as the DirectorItem No. 4 - Retirement of Mr. Ajai Chowdhry as the Director
The following resolution is proposed to be passed with or without modification(s) as an OrdinaryResolution:
“RESOLVED that Mr. Ajai Chowdhry, Director, who retires by rotation and who has expressed hisdesire not to seek re-appointment as the Director of the Company, be not re-appointed as Directorand that the vacancy thereby caused be not filled up.”
Item No. 5 - Appointment of Statutory AuditorsItem No. 5 - Appointment of Statutory AuditorsItem No. 5 - Appointment of Statutory AuditorsItem No. 5 - Appointment of Statutory AuditorsItem No. 5 - Appointment of Statutory Auditors
To appoint statutory auditors of the Company to hold office from the conclusion of this Annual GeneralMeeting until the conclusion of the next Annual General Meeting and to fix their remuneration.
The following resolution(s) are proposed to be passed with or without modification(s) as an OrdinaryResolution:
“RESOLVED that M/s. S. R. Batliboi & Co., Chartered Accountants, be and are hereby re-appointedas the Statutory Auditors of the Company to hold office from the conclusion of this Annual GeneralMeeting until the conclusion of the next Annual General Meeting of the Company.”
2
NOTESNOTESNOTESNOTESNOTES - - - - -
1. A MEMBER ENTITLED TO ATTEND AND VOTE AT THE MEETING IS ENTITLED TO APPOINT APROXY TO ATTEND THE MEETING AND ON A POLL, TO VOTE INSTEAD OF HIMSELF/HERSELFAND THE PROXY NEED NOT BE A MEMBER OF THE COMPANY. PROXY FORM, DULYCOMPLETED AND SIGNED, MUST BE RECEIVED AT THE REGISTERED OFFICE OF THECOMPANY, NOT LESS THAN FORTY-EIGHT HOURS BEFORE THE SCHEDULED TIME OF THEANNUAL GENERAL MEETING. A BLANK PROXY FORM IS ENCLOSED WITH THIS NOTICE.
2. The Register of Members and Share Transfer Books of the Company will remain closed fromOctober 25, 2011 to November 2, 2011 (both days inclusive) in terms of the provisions of Section154 of the Companies Act, 1956.
3. The final dividend on equity shares for the year ended June 30, 2011, as recommended by theBoard of Directors, if approved in the Annual General Meeting of the Company, shall be paid tothose members whose names are on the Company's Register of Members on November 2, 2011.In respect of the shares held in electronic form, the final dividend will be payable to the beneficialowners of shares as at the end of October 24, 2011, as per the details furnished by the Depositoriesfor this purpose.
“RESOLVED FURTHER THAT the Board of Directors of the Company be and are hereby authorized tofix their remuneration and reimburse their travelling and out of pocket expenses.”
Item No. 6 - Declaration of dividendItem No. 6 - Declaration of dividendItem No. 6 - Declaration of dividendItem No. 6 - Declaration of dividendItem No. 6 - Declaration of dividend
To declare a final dividend for the financial year ended June 30, 2011.
SPECIAL BUSINESS:SPECIAL BUSINESS:SPECIAL BUSINESS:SPECIAL BUSINESS:SPECIAL BUSINESS:
Item No. 7 - Appointment of Mr. R. Srinivasan as the DirectorItem No. 7 - Appointment of Mr. R. Srinivasan as the DirectorItem No. 7 - Appointment of Mr. R. Srinivasan as the DirectorItem No. 7 - Appointment of Mr. R. Srinivasan as the DirectorItem No. 7 - Appointment of Mr. R. Srinivasan as the Director
To consider and if thought fit, to pass with or without modification(s) the following resolution as anOrdinary Resolution:
“RESOLVED THAT Mr. R. Srinivasan, who was appointed as an Additional Director in the meeting ofthe Board of Directors held on April 19 & 20, 2011 and who holds office up to the date of this AnnualGeneral Meeting and in respect of whom the Company has received a notice in writing along with adeposit of Rs.500/- from a member under Section 257 of the Companies Act, 1956 signifying hisintention to propose Mr. R. Srinivasan as a candidate for the office of Director of the Company, beand is hereby appointed as the Director of the Company, liable to retire by rotation.”
By Order of the Board
for HCL Technologies LimitedHCL Technologies LimitedHCL Technologies LimitedHCL Technologies LimitedHCL Technologies Limited
Place: New Delhi Manish AnandDate: September 26, 2011 Deputy Company Secretary
3
4. Members holding shares in physical form are advised to update their address and NECS detailswith the Company's Registrar & Share Transfer Agent, M/s. Alankit Assignments Limited (Unit:HCL Technologies Limited), 205-208, Anarkali Market, Jhandewalan Extension, New Delhi-110055and in respect of shares held in electronic form, with the respective Depository Participant withwhom the demat account is maintained, latest by October 24, 2011.
5. The Certificates from the Auditors of the Company certifying that the '1999 Stock Option Plan','2000 Stock Option Plan' and '2004 Stock Option Plan' respectively of the Company are beingimplemented in accordance with the SEBI (Employees Stock Option Scheme and EmployeesStock Purchase Scheme) Guidelines, 1999 and in accordance with the resolutions of the membersin the general meetings, shall be available for inspection by the members at the Annual GeneralMeeting.
6. Members/proxies should bring the attendance slips filled in for attending the meeting.
7. The Ministry of Corporate Affairs (‘MCA’), Government of India has recently allowed companies tosend official documents to their shareholders by electronic delivery instead of physical delivery.To join this cause the Company will henceforth send its Annual Report, Notice of the GeneralMeeting(s), NECS intimations for dividends credited, etc. in electronic form instead of the physicalform to all such shareholders whose email addresses are available with the Company. Accordingly,the shareholders holding shares in demat form and physical form are requested to update their e-mail address with their Depository Participant and the Company's Registrar and Share transferagent respectively.
EXPLANATORY EXPLANATORY EXPLANATORY EXPLANATORY EXPLANATORY STATEMENT PURSUANT TO SECTION 173(2) OF THE COMPANIES ACT, 1956STATEMENT PURSUANT TO SECTION 173(2) OF THE COMPANIES ACT, 1956STATEMENT PURSUANT TO SECTION 173(2) OF THE COMPANIES ACT, 1956STATEMENT PURSUANT TO SECTION 173(2) OF THE COMPANIES ACT, 1956STATEMENT PURSUANT TO SECTION 173(2) OF THE COMPANIES ACT, 1956
The following explanatory statement sets out all the material facts, relevant to the item No. 7 of theSpecial Business contained in the notice:
Mr. R. Srinivasan, was appointed as an additional director of the Company with effect from April 19,2011, by the Board of Directors in its meeting held on April 19 & 20, 2011 and pursuant to the provisionsof Section 260 of the Companies Act, 1956, he holds office up to the date of this Annual GeneralMeeting. The Company has received a notice in writing along with a deposit of Rs. 500/- froma member under Section 257 of the Companies Act, 1956 signifying his intention to proposeMr. R. Srinivasan as a candidate for the office of Director, liable to retire by rotation.
Mr. R. Srinivasan aged 55 years holds an Electrical Engineering Degree from Madras University inIndia and an MBA degree from the Indian Institute of Management, Ahmedabad. He is the Founderand Managing Director of Redington (India) Limited, a 3.6 billion dollar technology products supplychain solutions company operating in India, Middle East, Africa & Turkey. Prior to starting Redingtonin Singapore, he spent three years in Indonesia with a leading Textile Company. Mr. Srinivasan'sexperience also includes a number of years with Readers Digest and The Coca-Cola Corporation inIndia.
Nature of expertise in specific functional area: Mr. R. Srinivasan has an expertise in Strategic andBusiness Management.
Mr. R. Srinivasan is the member of the Finance Committee of the Company. As on June 30, 2011, hisshareholding in the Company was nil.
None of the Directors of the Company except Mr. R. Srinivasan is in any way concerned or interestedin the resolution.
The Board recommends the Resolution for approval of the Shareholders.
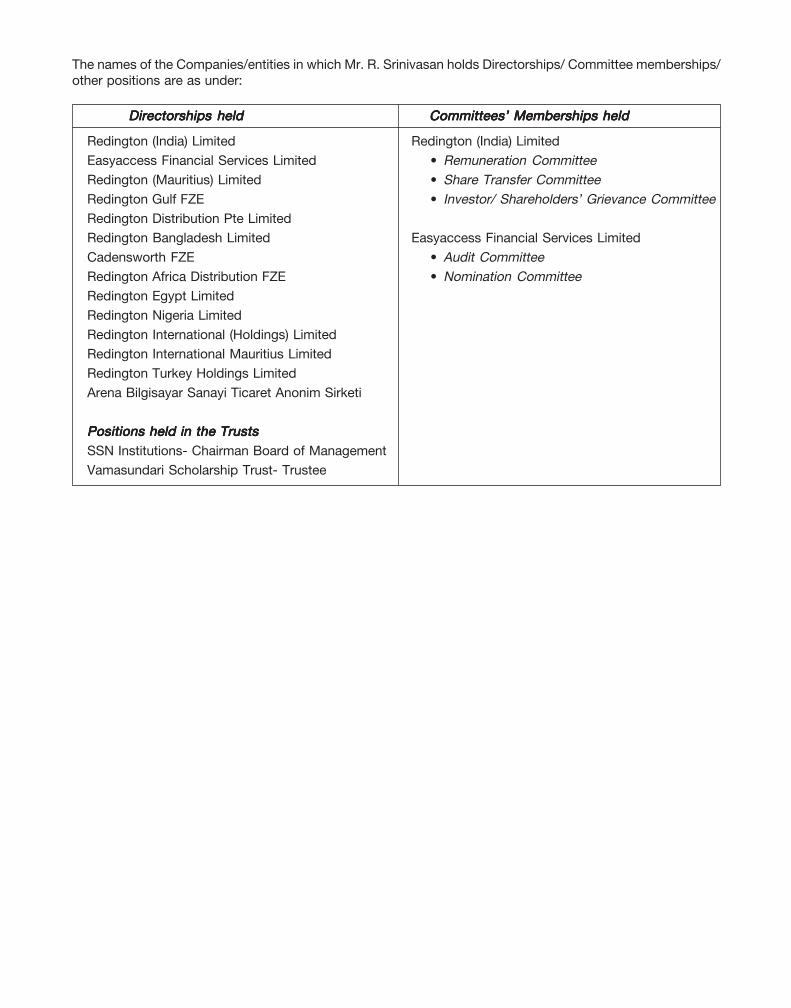
Directorships heldDirectorships heldDirectorships heldDirectorships heldDirectorships held Committees’ Memberships held Committees’ Memberships held Committees’ Memberships held Committees’ Memberships held Committees’ Memberships held
Redington (India) Limited Redington (India) LimitedEasyaccess Financial Services Limited • Remuneration CommitteeRedington (Mauritius) Limited • Share Transfer CommitteeRedington Gulf FZE • Investor/ Shareholders’ Grievance CommitteeRedington Distribution Pte LimitedRedington Bangladesh Limited Easyaccess Financial Services LimitedCadensworth FZE • Audit CommitteeRedington Africa Distribution FZE • Nomination CommitteeRedington Egypt LimitedRedington Nigeria LimitedRedington International (Holdings) LimitedRedington International Mauritius LimitedRedington Turkey Holdings LimitedArena Bilgisayar Sanayi Ticaret Anonim Sirketi
Positions held in the TrustsPositions held in the TrustsPositions held in the TrustsPositions held in the TrustsPositions held in the TrustsSSN Institutions- Chairman Board of ManagementVamasundari Scholarship Trust- Trustee
The names of the Companies/entities in which Mr. R. Srinivasan holds Directorships/ Committee memberships/other positions are as under:
Prin
ted
at T
hom
son
Pre
ss
CONTENTS
Board of Directors 2Management’s Discussion and Analysis 3Directors’ Report 19Corporate Governance 30CEO Declaration on Code of Conduct 57CEO & CFO Certificate 57Financial Statements 59Indian GAAP Standalone 64Consolidated Statements 105Statement under Section 212 144Statement regarding Subsidiary Companies 146
2
BOARD OF DIRECTORSBOARD OF DIRECTORSBOARD OF DIRECTORSBOARD OF DIRECTORSBOARD OF DIRECTORS
MR. SHIV NADARMR. SHIV NADARMR. SHIV NADARMR. SHIV NADARMR. SHIV NADARChairman & Chief Strategy Officer
MR. VINEET NAYARMR. VINEET NAYARMR. VINEET NAYARMR. VINEET NAYARMR. VINEET NAYARVice Chairman, CEO & Whole-time Director
MR. T. S. R. SUBRAMANIANMR. T. S. R. SUBRAMANIANMR. T. S. R. SUBRAMANIANMR. T. S. R. SUBRAMANIANMR. T. S. R. SUBRAMANIANNon- Executive Director
MS. ROBIN ABRAMSMS. ROBIN ABRAMSMS. ROBIN ABRAMSMS. ROBIN ABRAMSMS. ROBIN ABRAMSNon- Executive Director
MR. AJAI CHOWDHRYMR. AJAI CHOWDHRYMR. AJAI CHOWDHRYMR. AJAI CHOWDHRYMR. AJAI CHOWDHRYNon- Executive Director
MR. SUBROTO BHATTACHARYAMR. SUBROTO BHATTACHARYAMR. SUBROTO BHATTACHARYAMR. SUBROTO BHATTACHARYAMR. SUBROTO BHATTACHARYANon- Executive Director
MR. AMAL GANGULIMR. AMAL GANGULIMR. AMAL GANGULIMR. AMAL GANGULIMR. AMAL GANGULINon- Executive Director
MR. P. C. SENMR. P. C. SENMR. P. C. SENMR. P. C. SENMR. P. C. SENNon- Executive Director
MR. R. SRINIVASANMR. R. SRINIVASANMR. R. SRINIVASANMR. R. SRINIVASANMR. R. SRINIVASANNon- Executive Director
AuditorsAuditorsAuditorsAuditorsAuditorsS. R. Batliboi & Co.Chartered AccountantsGurgaon
BankersBankersBankersBankersBankers
Citibank, N.A.Citibank, N.A.Citibank, N.A.Citibank, N.A.Citibank, N.A.Global Corporate & Investment BankingDLF Centre, 5th FloorParliament StreetNew Delhi-110001
Deutsche Bank AGDeutsche Bank AGDeutsche Bank AGDeutsche Bank AGDeutsche Bank AGCorp. Office - DLF Square4th floor, Jacaranda Marg,DLF City, Phase - IIGurgaon-122002
Standard Chartered BankStandard Chartered BankStandard Chartered BankStandard Chartered BankStandard Chartered BankCorporate & Institutional BankingCredit Operations, IndiaH -2, Connaught CircusNew Delhi-110001
State Bank of IndiaState Bank of IndiaState Bank of IndiaState Bank of IndiaState Bank of IndiaCorporate Accounts Group Branch11th /12th Floor, Jawahar Vyapar Bhawan1, Tolstoy MargNew Delhi-110001
3
MANAGEMENT DISCUSSION AND ANALYSIS
Current state of the Indian IT Industry
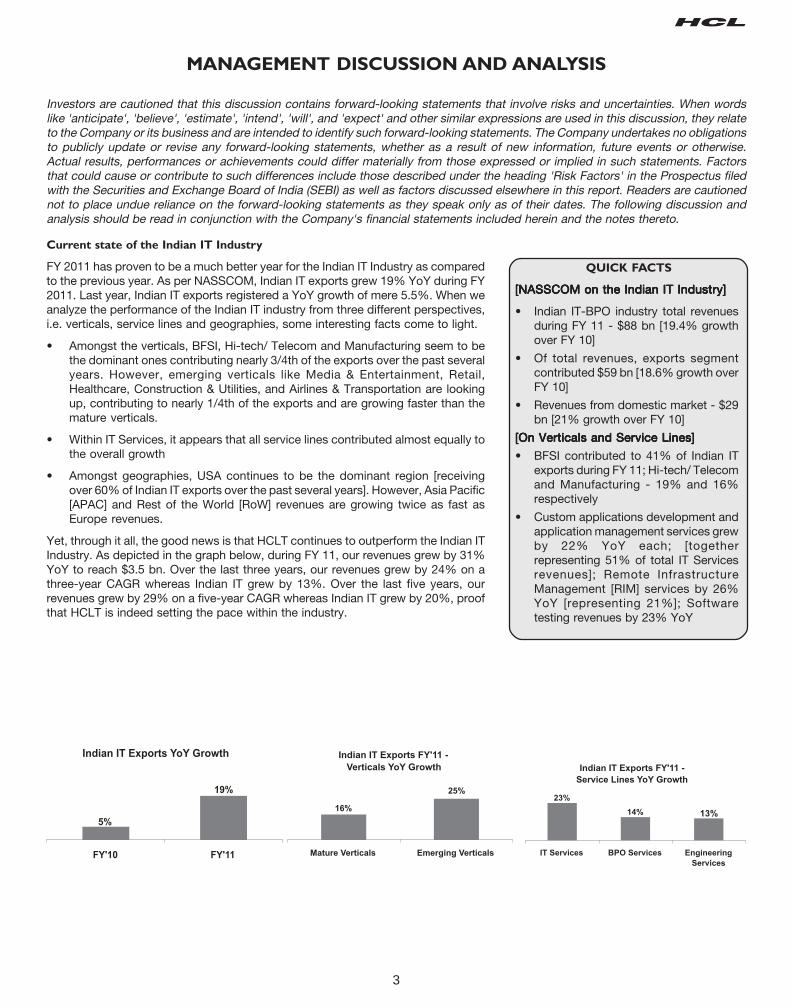
FY 2011 has proven to be a much better year for the Indian IT Industry as comparedto the previous year. As per NASSCOM, Indian IT exports grew 19% YoY during FY2011. Last year, Indian IT exports registered a YoY growth of mere 5.5%. When weanalyze the performance of the Indian IT industry from three different perspectives,i.e. verticals, service lines and geographies, some interesting facts come to light.
• Amongst the verticals, BFSI, Hi-tech/ Telecom and Manufacturing seem to bethe dominant ones contributing nearly 3/4th of the exports over the past severalyears. However, emerging verticals like Media & Entertainment, Retail,Healthcare, Construction & Utilities, and Airlines & Transportation are lookingup, contributing to nearly 1/4th of the exports and are growing faster than themature verticals.
• Within IT Services, it appears that all service lines contributed almost equally tothe overall growth
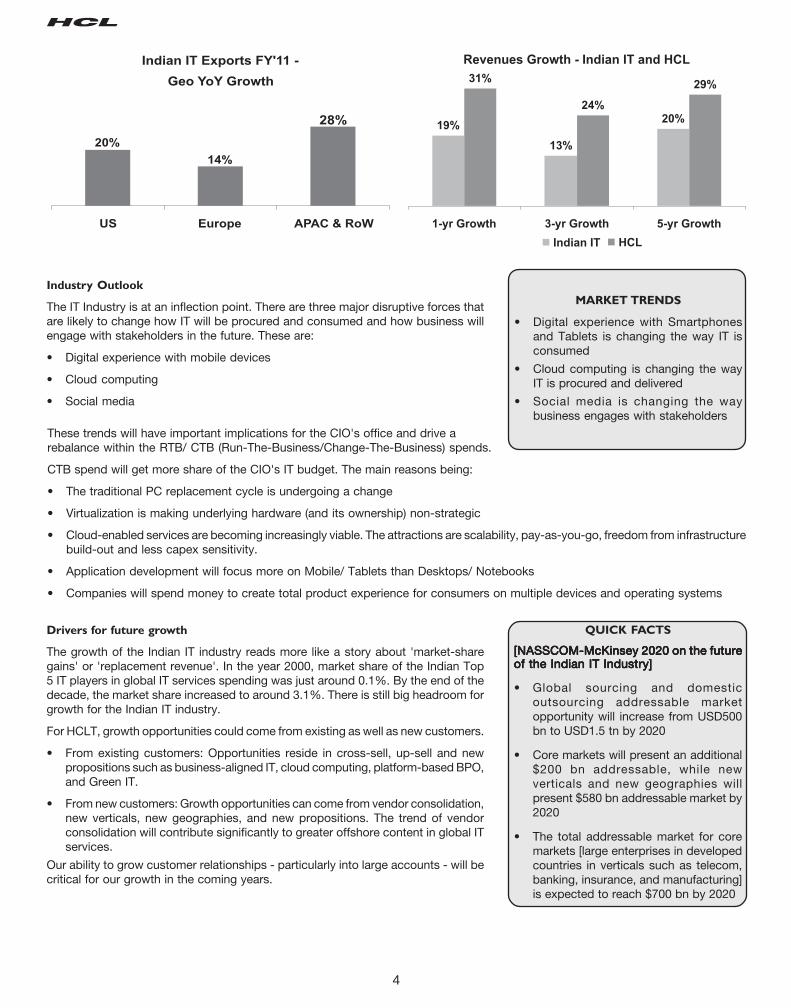
• Amongst geographies, USA continues to be the dominant region [receivingover 60% of Indian IT exports over the past several years]. However, Asia Pacific[APAC] and Rest of the World [RoW] revenues are growing twice as fast asEurope revenues.
Yet, through it all, the good news is that HCLT continues to outperform the Indian ITIndustry. As depicted in the graph below, during FY 11, our revenues grew by 31%YoY to reach $3.5 bn. Over the last three years, our revenues grew by 24% on athree-year CAGR whereas Indian IT grew by 13%. Over the last five years, ourrevenues grew by 29% on a five-year CAGR whereas Indian IT grew by 20%, proofthat HCLT is indeed setting the pace within the industry.
Investors are cautioned that this discussion contains forward-looking statements that involve risks and uncertainties. When wordslike 'anticipate', 'believe', 'estimate', 'intend', 'will', and 'expect' and other similar expressions are used in this discussion, they relateto the Company or its business and are intended to identify such forward-looking statements. The Company undertakes no obligationsto publicly update or revise any forward-looking statements, whether as a result of new information, future events or otherwise.Actual results, performances or achievements could differ materially from those expressed or implied in such statements. Factorsthat could cause or contribute to such differences include those described under the heading 'Risk Factors' in the Prospectus filedwith the Securities and Exchange Board of India (SEBI) as well as factors discussed elsewhere in this report. Readers are cautionednot to place undue reliance on the forward-looking statements as they speak only as of their dates. The following discussion andanalysis should be read in conjunction with the Company's financial statements included herein and the notes thereto.
QUICK FACTS
[NASSCOM on the Indian IT Industry][NASSCOM on the Indian IT Industry][NASSCOM on the Indian IT Industry][NASSCOM on the Indian IT Industry][NASSCOM on the Indian IT Industry]
• Indian IT-BPO industry total revenuesduring FY 11 - $88 bn [19.4% growthover FY 10]
• Of total revenues, exports segmentcontributed $59 bn [18.6% growth overFY 10]
• Revenues from domestic market - $29bn [21% growth over FY 10]
[On Verticals and Service Lines][On Verticals and Service Lines][On Verticals and Service Lines][On Verticals and Service Lines][On Verticals and Service Lines]
• BFSI contributed to 41% of Indian ITexports during FY 11; Hi-tech/ Telecomand Manufacturing - 19% and 16%respectively
• Custom applications development andapplication management services grewby 22% YoY each; [togetherrepresenting 51% of total IT Servicesrevenues]; Remote InfrastructureManagement [RIM] services by 26%YoY [representing 21%]; Softwaretesting revenues by 23% YoY
4
Industry Outlook
The IT Industry is at an inflection point. There are three major disruptive forces thatare likely to change how IT will be procured and consumed and how business willengage with stakeholders in the future. These are:
• Digital experience with mobile devices
• Cloud computing
• Social media
QUICK FACTS
[NASSCOM-McKinsey 2020 on the future[NASSCOM-McKinsey 2020 on the future[NASSCOM-McKinsey 2020 on the future[NASSCOM-McKinsey 2020 on the future[NASSCOM-McKinsey 2020 on the futureof the Indian IT Industry]of the Indian IT Industry]of the Indian IT Industry]of the Indian IT Industry]of the Indian IT Industry]
• Global sourcing and domesticoutsourcing addressable marketopportunity will increase from USD500bn to USD1.5 tn by 2020
• Core markets will present an additional$200 bn addressable, while newverticals and new geographies willpresent $580 bn addressable market by2020
• The total addressable market for coremarkets [large enterprises in developedcountries in verticals such as telecom,banking, insurance, and manufacturing]is expected to reach $700 bn by 2020
MARKET TRENDS
• Digital experience with Smartphonesand Tablets is changing the way IT isconsumed
• Cloud computing is changing the wayIT is procured and delivered
• Social media is changing the waybusiness engages with stakeholders
Drivers for future growth
The growth of the Indian IT industry reads more like a story about 'market-sharegains' or 'replacement revenue'. In the year 2000, market share of the Indian Top5 IT players in global IT services spending was just around 0.1%. By the end of thedecade, the market share increased to around 3.1%. There is still big headroom forgrowth for the Indian IT industry.
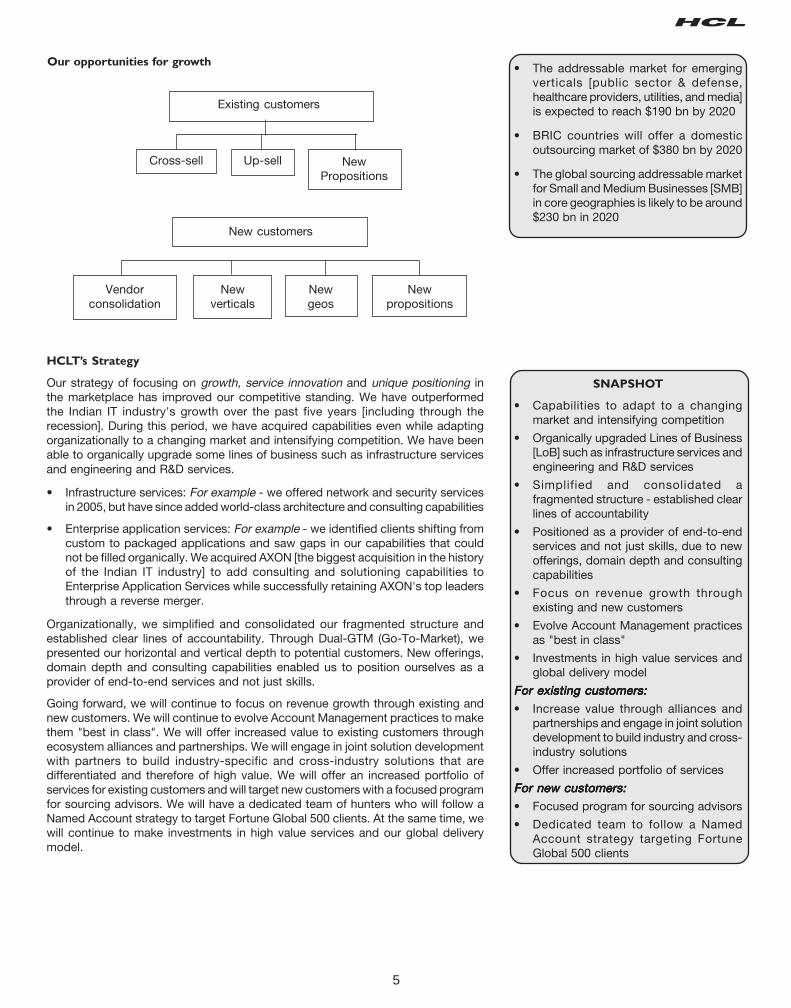
For HCLT, growth opportunities could come from existing as well as new customers.
• From existing customers: Opportunities reside in cross-sell, up-sell and newpropositions such as business-aligned IT, cloud computing, platform-based BPO,and Green IT.
• From new customers: Growth opportunities can come from vendor consolidation,new verticals, new geographies, and new propositions. The trend of vendorconsolidation will contribute significantly to greater offshore content in global ITservices.
Our ability to grow customer relationships - particularly into large accounts - will becritical for our growth in the coming years.
These trends will have important implications for the CIO's office and drive arebalance within the RTB/ CTB (Run-The-Business/Change-The-Business) spends.
CTB spend will get more share of the CIO's IT budget. The main reasons being:
• The traditional PC replacement cycle is undergoing a change
• Virtualization is making underlying hardware (and its ownership) non-strategic
• Cloud-enabled services are becoming increasingly viable. The attractions are scalability, pay-as-you-go, freedom from infrastructurebuild-out and less capex sensitivity.
• Application development will focus more on Mobile/ Tablets than Desktops/ Notebooks
• Companies will spend money to create total product experience for consumers on multiple devices and operating systems
5
Existing customers
Cross-sell Up-sell NewPropositions
New customers
Vendorconsolidation
Newverticals
Newgeos
Newpropositions
• The addressable market for emergingverticals [public sector & defense,healthcare providers, utilities, and media]is expected to reach $190 bn by 2020
• BRIC countries will offer a domesticoutsourcing market of $380 bn by 2020
• The global sourcing addressable marketfor Small and Medium Businesses [SMB]in core geographies is likely to be around$230 bn in 2020
HCLT’s Strategy
Our strategy of focusing on growth, service innovation and unique positioning inthe marketplace has improved our competitive standing. We have outperformedthe Indian IT industry's growth over the past five years [including through therecession]. During this period, we have acquired capabilities even while adaptingorganizationally to a changing market and intensifying competition. We have beenable to organically upgrade some lines of business such as infrastructure servicesand engineering and R&D services.
• Infrastructure services: For example - we offered network and security servicesin 2005, but have since added world-class architecture and consulting capabilities
• Enterprise application services: For example - we identified clients shifting fromcustom to packaged applications and saw gaps in our capabilities that couldnot be filled organically. We acquired AXON [the biggest acquisition in the historyof the Indian IT industry] to add consulting and solutioning capabilities toEnterprise Application Services while successfully retaining AXON's top leadersthrough a reverse merger.
Organizationally, we simplified and consolidated our fragmented structure andestablished clear lines of accountability. Through Dual-GTM (Go-To-Market), wepresented our horizontal and vertical depth to potential customers. New offerings,domain depth and consulting capabilities enabled us to position ourselves as aprovider of end-to-end services and not just skills.
Going forward, we will continue to focus on revenue growth through existing andnew customers. We will continue to evolve Account Management practices to makethem "best in class". We will offer increased value to existing customers throughecosystem alliances and partnerships. We will engage in joint solution developmentwith partners to build industry-specific and cross-industry solutions that aredifferentiated and therefore of high value. We will offer an increased portfolio ofservices for existing customers and will target new customers with a focused programfor sourcing advisors. We will have a dedicated team of hunters who will follow aNamed Account strategy to target Fortune Global 500 clients. At the same time, wewill continue to make investments in high value services and our global deliverymodel.
SNAPSHOT
• Capabilities to adapt to a changingmarket and intensifying competition
• Organically upgraded Lines of Business[LoB] such as infrastructure services andengineering and R&D services
• Simplified and consolidated afragmented structure - established clearlines of accountability
• Positioned as a provider of end-to-endservices and not just skills, due to newofferings, domain depth and consultingcapabilities
• Focus on revenue growth throughexisting and new customers
• Evolve Account Management practicesas "best in class"
• Investments in high value services andglobal delivery model
For existing customers:For existing customers:For existing customers:For existing customers:For existing customers:
• Increase value through alliances andpartnerships and engage in joint solutiondevelopment to build industry and cross-industry solutions
• Offer increased portfolio of services
For new customers:For new customers:For new customers:For new customers:For new customers:
• Focused program for sourcing advisors
• Dedicated team to follow a NamedAccount strategy targeting FortuneGlobal 500 clients
Our opportunities for growth
6
SNAPSHOT
About HCLTAbout HCLTAbout HCLTAbout HCLTAbout HCLT
• Leading provider of businesstransformation, enterprise & customapplications, infrastructuremanagement, BPO, and engineeringservices
• Serving 500+ customers across a widerange of industries - financial services,manufacturing, consumer services,public services, and healthcare
• Global footprint: Delivery model across31 countries
‘Employees First, Customers Second’‘Employees First, Customers Second’‘Employees First, Customers Second’‘Employees First, Customers Second’‘Employees First, Customers Second’[EFCS] in action[EFCS] in action[EFCS] in action[EFCS] in action[EFCS] in action
• First IT company to make a consciousshift from an 'employer driven' to an'employee driven' management style
• One of the outcomes -- the fastestgrowing IT services company in theworld
• Growing global awareness andrecognition through the EFCS book - abestseller in key markets and translatedinto five world languages
• Customers/ Partners enrolling for EFCSworkshops; several globalconglomerates visiting the premises towitness EFCS in action
The recognitions continueThe recognitions continueThe recognitions continueThe recognitions continueThe recognitions continue
• A leader in Applications Outsourcing bykey analyst firms
• Only Indian headquartered company tobe recognized as a leader in SAPservices
• Dominance and leadership in RemoteInfrastructure Management and inEngineering and R&D Services
• Recognized by analyst firms as 'theCIO's best friend'. Through the“reincarnated CIO” program,increasingly becoming the CIO's mosttrusted partner of choice.
The phenomenal performance continues
HCLT has been recognized as a leader in Applications Outsourcing by key analystfirms and became the only Indian headquartered company to be recognized as aleader in SAP services. HCLT's dominance and leadership in Remote InfrastructureManagement and in Engineering and R&D Services continues.
In a recent report published in February 2011, Frost & Sullivan mentioned that HCLTis a perfect example of a company serving in long-term innovation and "solutionsengineering", and that its Engineering Out-of-the-Box [EOOTB] approach is novelbecause it allows HCLT to proactively address the clients' business needs.
HCLT has also successfully positioned itself as the CIO's best friend. Back in 2005,CIOs were looking for an alternative to the Big-4 due to dissatisfaction with largedeals, a desire to optimize and reduce cost, pay for performance, and fortransformational gains. HCLT responded by providing a trusted culture withtransparency and flexibility, integrated service offerings, output/ outcome-based
Increasing customer impactIncreasing customer impactIncreasing customer impactIncreasing customer impactIncreasing customer impact
• Leading in client reference scores -positioned above larger peers
• Number of $10 mn+, $20 mn+ and $50mn+ clients more than doubled in thelast three years
• Customer Advisory Councils (CAC)building stronger relationships withcustomers - providing key strategicinsights and information. [70 CIOs/ CTOsform the HCLT CAC]
• CAC feedback on key strengths:entrepreneurial culture, broad-basedservices, highly engaged people andcustomer alignment
Company Overview
About HCL Technologies Ltd.
HCL is a global technology enterprise and a name to reckon with, in the industry.The passion of its founder and the entrepreneurial zeal of its employees, have madeits Information Technology and Services arm, HCL Technologies, a leading providerof business transformation, enterprise & custom applications, infrastructuremanagement, business process outsourcing, and engineering services. HCLTdelivers solutions across a wide range of verticals such as financial services,manufacturing, consumer services, public services and healthcare. Its delivery modelis spread across 31 countries around the globe, and its empowered 'transformers'are busy working with over 500 forward looking customers, seeking to shiftparadigms and transform the way business is being done.
When HCLT commenced its transformation journey based on the foundation of'Employees First' in 2005, disruptive technologies and new business models werebeginning to impact the industry. HCLT had already anticipated the shift from‘employer driven’ to ‘employee driven’ market conditions. Today, the impact of thisunique management philosophy is being recognized and praised worldwide forempowering employees to become the drivers of growth. HCL has also becomeone of the fastest-growing IT services company in the world.
“Employees First, Customers Second - Turning Conventional Management UpsideDown” - a business book authored by the CEO Vineet Nayar encapsulating HCLT’stransformation journey from 2005, was launched in June 2010. Already a massivebestseller in key markets, the book has won accolades from leading managementthinkers and CEOs such as Tom Peters, Gary Hamel, Tony Hsieh, Judy McGrath,and Victor Fung. Covered by leading media groups around the world, the book hasalready been translated into five languages - French, Spanish, Portuguese, Korean,and Chinese, and over 50 Employees First, Customers Second [EFCS] workshopsfor clients and partner organizations have been conducted in the USA, UK andAPAC.
7
Increasing customer impact
HCLT is a leader in client reference scores. In an independent survey by Forrester for the North American Application wave, HCLTscored the highest across 10 parameters in client reference and was positioned above its larger peers. The number of $10 mn+, $20mn+ and $50 mn+ clients has more than doubled over the past three years.
HCLT has also created Customer Advisory Councils (CAC) to build stronger relationships with customers by providing them with keystrategic insights and information [70 CIOs/ CTOs form the HCLT CAC]. During a brand workshop conducted with HCLT CAC inNovember 2010, customers recognized that HCLT's key strengths lie in its entrepreneurial culture, broad-based services, highlyengaged people and customer alignment, and agreed that “it’s good to do business with HCLT”. HCLT is aspiring to move from“good to do business with” to “great to do business with” by 2015.
Indeed, HCLT is more comfortable in forging its own trail rather than following the expected - thereby bringing about unexpected andpath breaking results year-on-year.
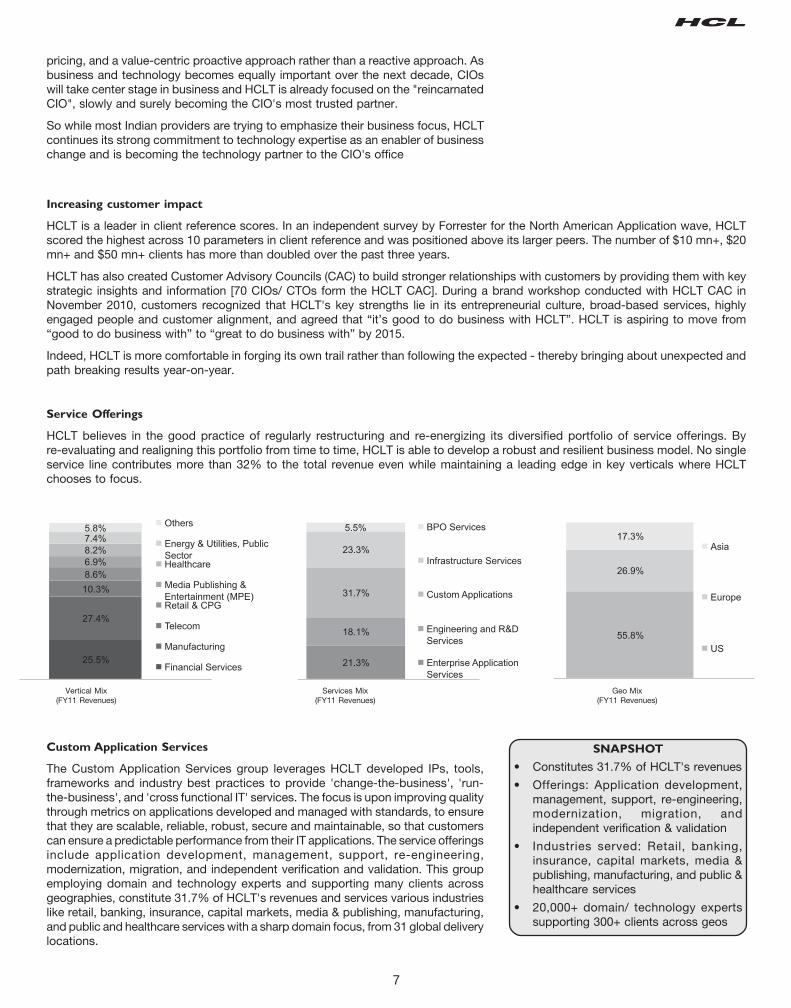
Service Offerings
HCLT believes in the good practice of regularly restructuring and re-energizing its diversified portfolio of service offerings. Byre-evaluating and realigning this portfolio from time to time, HCLT is able to develop a robust and resilient business model. No singleservice line contributes more than 32% to the total revenue even while maintaining a leading edge in key verticals where HCLTchooses to focus.
Vertical Mix(FY11 Revenues)
Services Mix(FY11 Revenues)
Geo Mix(FY11 Revenues)
pricing, and a value-centric proactive approach rather than a reactive approach. Asbusiness and technology becomes equally important over the next decade, CIOswill take center stage in business and HCLT is already focused on the "reincarnatedCIO", slowly and surely becoming the CIO's most trusted partner.
So while most Indian providers are trying to emphasize their business focus, HCLTcontinues its strong commitment to technology expertise as an enabler of businesschange and is becoming the technology partner to the CIO's office
Custom Application Services
The Custom Application Services group leverages HCLT developed IPs, tools,frameworks and industry best practices to provide 'change-the-business', 'run-the-business', and 'cross functional IT' services. The focus is upon improving qualitythrough metrics on applications developed and managed with standards, to ensurethat they are scalable, reliable, robust, secure and maintainable, so that customerscan ensure a predictable performance from their IT applications. The service offeringsinclude application development, management, support, re-engineering,modernization, migration, and independent verification and validation. This groupemploying domain and technology experts and supporting many clients acrossgeographies, constitute 31.7% of HCLT's revenues and services various industrieslike retail, banking, insurance, capital markets, media & publishing, manufacturing,and public and healthcare services with a sharp domain focus, from 31 global deliverylocations.
SNAPSHOT
• Constitutes 31.7% of HCLT's revenues
• Offerings: Application development,management, support, re-engineering,modernization, migration, andindependent verification & validation
• Industries served: Retail, banking,insurance, capital markets, media &publishing, manufacturing, and public &healthcare services
• 20,000+ domain/ technology expertssupporting 300+ clients across geos
8
With a modular approach to design, development, testing, and roll-out, HCLT'sADeX Practice (Application Development Excellence) leverages best in classdevelopment processes and methodologies along with benchmark tools andreference architectures, to ensure that client requirements are met with highproductivity and process compliance. HCLT's ADeX Practice is now launching anew suite of "HCL Assess-Smart" services that leverage a variety of automatedtools for measuring quality of applications at source code level, to arrive at anevaluation of the existing size and state of application performance, reliability,maintainability, and security. This helps our architects provide solutions to meet thedesired "To Be" state in an objective manner with enhanced service levels.
HCLT's MASCOT Framework (Managed Appl. Services leading to ContinuousImprovement & Transformation) is also being implemented across all key ApplicationSupport & Maintenance engagements by the HCLT Application Support &Maintenance [ASM] practice, as a comprehensive framework for run-the-business.It aims to deliver predictable services at a predictable price for large customers andincludes a structured set of key service elements that inter-operate to ensure thedelivery of managed services.
HCLT's value-centric focus keeps it continuously investing in and inventing robustmethodologies, tools and processes and best-of-breed partnerships. Skills arecontinuously upgraded within the practice and customers continue to enjoy fastertime-to-market as they leverage HCLT's extensive research and development onreusable components and frameworks. Currently, HCLT is investing significantly inniche technologies in areas like eCommerce, Mobility and Smart Grid. HCLT firmlybelieves that employees, along with customers, bring in the maximum value. Inorder to continuously empower employees, HCLT has invested in the 'DomainAcademy' to nurture and strengthen industry knowledge across verticals.
HCLT's customized software and application services have been rated in the Leaderquadrant this year by Forrester for North America and EMEA, as well as by Gartner.HCL also has locations and services that are certified at CMMi Level 5.
Engineering and R&D Services (ERS)
This division constitutes 18.1% of the company's overall revenues and is one of thelargest independent Engineering and R&D services organizations in the world. Itoffers end-to-end engineering services and solutions in hardware, embedded,mechanical and software product engineering to industry leaders across nineverticals - Aerospace & Defense, Automotive, Consumer Electronics, IndustrialManufacturing, Medical Devices, Networking & Telecom, Office Automation,Semiconductor, Servers & Storage, and Software Products.
This group helps its customers reduce time to market by leveraging the Global R&Dnetwork. It also offers output based business models that are aligned to the R&Dgoals of the customer. ERS today leverages engineering talent and developmentcapabilities across Australia, China, India, Israel, Poland, and the USA, to delivercomplex engineering solutions.
With over a decade of experience operating in complex multi-vendor environmentsand customer value chains, ERS has been able to seamlessly integrate into acustomer's existing R&D ecosystem. The group has also successfully collaboratedwith other innovation partners, captive centers, universities, industry bodies, andmanufacturing partners.
HCLT's ERS group not only delivers customer-specific innovation throughengineering excellence, but also offers unique risk-reward models such as joint IPdevelopment. For example, HCLT has partnered with Cisco, and filed multiple patentsin the field of Mobility, Banking, etc. Today, HCLT is a strategic partner to keyprojects at Cisco.
For the Swiss division of a global medical device major, HCLT was responsible forthe complete development of a Class III implantable drug delivery medical devicethat has recently been launched in the market. HCLT also runs the largest thirdparty engineering centre for a global networking OEM company. For a EuropeanTier-1 automotive company and a leading French car series, HCLT helped develop
• Investment in the 'Domain Academy' tonurture/ strengthen industry knowledgeacross verticals
• ADeX Practice launches "HCL Assess-Smart" suite of services - leverages avariety of automated tools for measuringquality of applications at source codelevel
• MASCOT Framework (Managed Appl.Services leading to ContinuousImprovement & Transformation) beingimplemented across key ASMengagements as a comprehensive 'run-the-business' framework
• Significant investments in nichetechnologies - eCommerce, Mobility andSmart Grid
SNAPSHOT
• Constitutes 18.1% of HCLT's revenues
• One of the largest independentEngineering and R&D Servicesorganizations in the world
• Offerings: End-to-end engineeringservices & solutions in hardware,embedded, mechanical and softwareproduct engineering
• Key differentiator: "Engineering Out-of-the-Box" [EOOTB]
• Industries served: Aerospace & defense,automotive, consumer electronics,industrial manufacturing, medicaldevices, networking & telecom, officeautomation, semiconductor, servers &storage, and software products
• 15000 experts supporting 200+customers across geographies
• Complete development of a Class IIIimplantable drug delivery medicaldevice, recently launched in the market
• Runs the largest third party engineeringcentre for a global networking OEMcompany
9
a complete infotainment solution. HCLT has also partnered with one of the world'slargest IT management software company to deliver total product development,management and support.
The ERS group believes that the product landscape is undergoing a major and fastpaced transformation based on the ever-changing customer needs. User experienceand value-centricity are becoming the key differentiators for product companies.Market leadership is also no longer associated with only patents and product featuresbut with ecosystem creation and leveraging the right platforms. This is called"Engineering Out-of-the-Box" or EOOTB which is core to the group's underlyingphilosophy.
Clients today prefer outsourcing to companies that share their long-term vision,have a risk and rewards business model in place, and have the ability to developproduct-based ecosystems. Towards this, HCLT is investing heavily in developingits own IPs and solutions to help clients impact the overall product ecosystemfaster and better. Solutions include a unified communication platform, a remotediagnostic reusable module, and telematics & test platforms in multiple verticals.Some key IPs today are: Agora (HCLT's SaaS platform), Nimbo (private cloudenablement solution), Cirrus (Microsoft Azure enablement solution), Athena(sentiment analytics solution), Retail Track & Trace solution, UECPX (unifiedcommunications platform), ASPIRE (product portfolio management system),Telematics platform, and H-PAC (Aerospace verification platform) amongst others.
Enterprise Applications Services (EAS)
HCLT's EAS group is a global pioneer in leveraging leading technologies to drivevalue realization. Strategic partnerships with SAP, Oracle and Microsoft, allow EASto provide the complete range of consulting, hosting and BPO services that isnecessary to define, realize and sustain real business change. The EAS divisionaccounts for over 21.3% of HCLT's revenue and continues to be a key area ofgrowth.
HCL AXON continues to grow from strength to strength and recognitions fromanalysts and client successes continue to grow. In the April 2011 Forrester Research,Inc. report The Forrester Wave™: SAP Services Providers, Q2 2011, HCL AXONwas cited as a leader, ranking 5 out of 5 for overall client satisfaction. According toForrester, "HCL has long had a focus on operational and low-cost services in theSAP space. However, its 2008 acquisition of Axon makes it a compelling option forthe full life cycle of implementation services starting with upfront strategy andtransformational consulting through to the technical implementation and ongoingsupport. Key areas of industry focus include utilities, public sector, aerospace, andtravel and logistics."
The HCL AXON product suite continues to grow and garner strength and recognitionin the marketplace. Recently a large North American transportation company offeringintegrated freight services including ground transportation, warehousing anddistribution and bulk materials management was named a 2011 Computer WorldHonors Laureate. This was given in recognition for their innovation using a HCLAXON product, iCREW.
The Oracle practice has achieved more than 20 specializations, including 6 advancedspecializations making HCL AXON a leader in Oracle competencies. With acommitment to grow the practice, HCL AXON continues to make significantinvestment in North American and European talent acquisition to ensure faster growthin the regions.
Partnership with Microsoft is also growing rapidly as more number of customerslook to leverage the simplicity and ease of use of Microsoft Dynamics. HCL AXON'spartnership with Microsoft's Business Solutions group has been instrumental inindentifying niche market opportunities to drive real customer value.
Delivering accelerated value via transformation projects continues to be at the heartof the EAS business. The EAS division currently signs around one largetransformational deal every month.
• Developed a complete infotainmentsolution for a leading French car series
• Filed multiple patents in Mobility andBanking
• Key IPs: Agora, Nimbo, Cirrus, Athena,Retail Track & Trace, UECPX, ASPIRE,Telematics platform, H-PAC
SNAPSHOT
• Constitutes 21.3% of HCLT's revenues
• Strategic partnerships with SAP, Oracleand Microsoft
• Offerings: consulting, hosting and BPOservices
• HCL AXON, SAP Division cited as aleader, ranking 5 out of 5 for overall clientsatisfaction
• Oracle practice - achieved over20 specializations including 6 advancedspecializations making it a leader inOracle competencies
• Microsoft and HCLT partnership isinstrumental in indentifying niche marketopportunities that drive real value forcustomers
• At least one large transformational dealis signed every month
10
Enterprise Transformation Services (ETS)
HCLT's ETS group offers an integrated "Advise to Execute" approach to itscustomers for developing a transformation roadmap and execution plan. This grouphas grown rapidly through a cross-industry focus on execution excellence inMiddleware & SOA Services, Analytics & Business Intelligence Services, EnterpriseContent Management & Portals Services, Independent Verification & ValidationServices, and Business and Technology Consulting. With experience in well-definedservice lines, our principals drive business case creation and formulate executionplans to support overall benefits realization. Strong capabilities across establishedand disruptive application technologies combined with the right IPs and frameworks,help reduce cost, time and risk while executing transformation plans.
ETS enabled transformations are highly flexible and can be tailored to meet variedcustomer objectives such as organizational, departmental, Business aligned IT,technology platform, IT, and process transformation. ETS services in IT strategyand change management, process transformation and enterprise architecture areencapsulated in its IPs and frameworks. These tools support methodologiescompliant with industry standard frameworks such as ITIL, Six Sigma and CMM-I.
ETS Data Transformation services include data architecture, data warehousing andbusiness intelligence services. These services address new and disruptivetechnologies around NoSQL databases, big data services and analytics. ETSEnterprise Content Management services leverage its Universal Content Migrator(UCM) tool, which supports up to 16 products for effective content migration. Onthe application side, ETS offers application architecture, integration, SOA (servicedevelopment) and business process management (BPM) services. ETS servicesportfolio also includes enterprise collaboration, web portals and emerging servicessuch as customer experience and social analytics services. ETS also provides cuttingedge services in the area of cloud and data center optimization services. ETS cloudservices are offered on multiple platforms including Salesforce.com and VMWarevFabric. Some of the new services launched by the ETS group include MainframeManaged Tools as a Service (MFMTaaS), modernization, zCloud implementationand legacy re-hosting (application lift and shift) services.
ETS services are backed by a rich set of IPs, frameworks and accelerators, domainsolutions, robust methodologies, niche skills and strong infrastructure and BPOcapabilities that put ETS in a unique position to offer guaranteed benefits oftransformation to its customers. Some of the IPs, frameworks and propositionsthat the group launched in 2010-2011 include: PathFINDER (a library of prebuiltbusiness processes), Strategic Cost, Operations & Process Excellence (SCOPE),Cloud Readiness Assessment (covering adoption, governance, security and existingIT assets utilization for monetization of cloud delivery platforms), Integrated CustomerExperience (ICE), and Test Factory-in-a-Box (TFIB).
HCLT's ETS group has recently won several accolades from advisors and partnersfor its propositions, services, frameworks and methodologies, technical depth,innovation and process delivery.
ETS is now a key focus area that will enable HCLT to drive value across variedcustomer engagements. Over the last year, in conjunction with the EAS division,the ETS group has won several global, transformational, and high value deals.
SNAPSHOT
• Specializes in highly flexible and tailoredtransformation programs atorganization, department, businessaligned IT, technology platform, IT orprocess levels
• Offerings: Middleware & SOA, Analytics& Business Intelligence, EnterpriseContent Management & Portals,Independent Verification & Validation,and Business & Technology ConsultingServices
• Cutting edge services: cloud and datacenter optimization
• New services launched: MainframeManaged Tools as a Service(MFMTaaS), modernization, zCloudimplementation, and Legacy re-hosting(application lift & shift) services
• Methodologies compliant with industrystandard frameworks - ITIL, Six Sigmaand CMM-I
• IPs, frameworks and propositionslaunched in 2010-2011: PathFINDER,Strategic Cost, Operations & ProcessExcellence (SCOPE), Cloud ReadinessAssessment, Integrated CustomerExperience (ICE), and Test Factory-in-a-Box (TFIB)
• Bagged several global, transformationaland high value deals in conjunction withHCLT's EAS division
11
Infrastructure Services Division (ISD)
HCLT's Infrastructure Services Division is the fastest growing business line andcontributes to over 23.3% of HCL Technologies' total revenues. Also known asHCL ISD, the division manages mission-critical environments for over 20% of Fortune100 organizations. The company's fast growth has prompted several bestsellingauthors to include the HCL ISD case study in their books.
ISD's key service offerings include End User Computing, Data Center & MainframeServices, Integrated Operations Management, Cross Functional Services, Security& Network and Cloud Computing Services. HCL ISD's vertical reach spans majorindustries including Automotive, Energy (Oil & Gas) and Utilities, Financial Services,Hi-Tech, Insurance, Manufacturing, Retail, Travel, Tourism & Logistics, Banking,Life Sciences, Healthcare & Pharmaceuticals, Telecom & Media, and Publishing &Entertainment. Over 15,000 employees provide infrastructure management servicesto customers through a robust delivery network of 20 service centers across theglobe. Its scale of infrastructure operations involves the centralized management ofglobally distributed assets of over 3 million devices; resolving over 10 million helpdeskcalls while supporting over 1 million business users' needs.
This group has received its share of accolades:
• Information Week conferred 6 HCL ISD customers with the ValueHonorsTM
Award - the industry's first ever award that recognizes companies for creatingvalue and transforming business in their global IT infrastructure outsourcingengagements. [More than 100 Fortune 1000 and Global 2000 companiesparticipated from across the globe in the award's year of inception - 2010 to2011].
• In his latest publication, The Clouds Roll in, renowned author Nicholas G.Carr, [author of bestseller, The Big Switch: Rewiring the World, From Edisonto Google], appreciates the HCL MyCloud Platform by referring to it as crucialfor end users and central to competition amongst the suppliers of technology[2010 to 2011].
• HP recognizes HCL Technologies as the "AllianceONE Partner of the Year"in the “HP Cloud Computing Service Provider of the Year” category [2010-2011].
• Gartner Magic Quadrant, North America, 2011 features HCL ISD in theLeaders Quadrant for Help Desk Outsourcing.
• The Forrester WaveTM: Global IT Infrastructure Outsourcing, Q1 2011 citesHCL ISD as a leader with the strongest current market strategy.
• Datamonitor's Brown & Wilson Group survey ranks HCL ISD as No. 1 inRemote Infrastructure Management Outsourcing [RIMO] and Tier 1 inInfrastructure Outsourcing Categories [2009 - 2010].
Business Process Outsourcing (BPO)
HCL Technologies established its BPO Division in 2001. In doing so, HCLT pioneeredthird party BPO operations in India, in addition to the Integrated Global DeliveryModel and the Platform Business Model. With 10,500 employees across 25 global,integrated delivery centers, this division provides over 200 domain specific andquality driven processes to several Fortune 500/Fortune Global 500 customers.HCLT offers 24x7 multi-channel, multi-lingual support in 8 European languagesand delivers the entire gamut of business services with deep industry, micro-industryand process knowledge. Industry specific solutions include Banking & FinancialServices, Insurance, Healthcare, Media, Publishing & Entertainment, Telecom, Retail,Utilities & Public Services, and Hi-Tech & Manufacturing. HCLT's cross industryhorizontal solutions include Finance & Accounting, Human Resource, CustomerRelationship Management, Knowledge Process, Technical Support Services andSupply Chain Management.
This group pursues a new and revolutionary form of BPO called 'TransformationalBPO', which constitutes Full Process and Multiple Process outsourcing. HCLT is
SNAPSHOT
• Fastest growing business lineconstituting 23.3% of HCLT's revenues
• Manages mission-critical environmentsfor over 20% of Fortune 100organizations
• Offerings: End User Computing, DataCenter & Mainframe Services, IntegratedOperations Management, CrossFunctional Services, Security & Network,and Cloud Computing Services
• Industries served: Automotive, Energy(Oil & Gas) and Utilities, FinancialServices, Hi-tech, Insurance,Manufacturing, Retail, Travel, Tourism &Logistics, Banking, Life Sciences,Healthcare & Pharmaceuticals, Telecom& Media, Publishing & Entertainment
• Scale of operations: centralizedmanagement of globally distributedassets of over 3 million devices;resolving over 10 million helpdesk callswhile supporting over 1 million businessusers’ needs
• Numerous recognitions and awards
SNAPSHOT
• ‘Transformational BPO’ - Full Processand Multiple Process outsourcing
• 10,500 employees providing over200 domain specific and quality drivenprocesses for Fortune 500/FortuneGlobal 500 customers
• 24x7 multi-channel, multi-lingual supportin 8 European languages
• Industries served: Banking & FinancialServices, Insurance, Healthcare, Media,Publishing & Entertainment, Telecom,Retail, Utilities & Public Services, Hi-tech& Manufacturing
12
considered the next generation BPO as it constantly invests in best-in-class enablersacross delivery, innovation and governance. These enablers include:
• Transformation through innovation and improvement-led solutions
• Vertically aligned strategy with horizontal centers of excellence
• End-to-end service offerings bringing technology, people and processes together
• Flexible business models and value based pricing
• A collaborative, business partnership approach
• Delivery through Integrated Global Delivery Centers
• Delivery through the “Employees First Customers Second” (EFCS) platform
The group follows industry best practices and metrics-based quality norms for allits processes. This is supported by robust technology infrastructure, skilled humanresources, customized training programs and transition frameworks.
HCL Business Services is the first BPO Company in the world to be appraised atMaturity Level 5 of People CMM. With stringent internal metrics and audit systems,its quality certifications include CCA Global Standard, COPC 2000 (CSP Release4.1), ISO 9001:2000, OHSAS 18001:2007 and ISO 14001:2004; Security Systemscertification - ISO 27001:2005, ISO 20000:2005 and audit certification in SAS 70Type II. HCL Business Services is the first Indian and the third company in the worldto be Customer Operations Performance Center Inc (COPC) certified in thespecialized area of collections.
With a decade of industry experience, this division is the winner of several industryawards and recognitions. HCLT ranks among the Top 10 ITeS-BPO companies inIndia (NASSCOM & Gartner), and is the largest BPO service provider in NorthernIreland. UK Trade and Investment (UKTI) published an exclusive case study on HCLBusiness Services' engagements in the UK, showcasing the company as an idealinvestment of choice. HCLT was ranked second by Purdue Benchmark in the GlobalPeer Group of BPO Service Providers.
And the global accolades continue:
• Ranked in the ‘Leaders’ category of the 2011 Global Outsourcing100 - International Association of Outsourcing Professionals (IAOP)
• Won the prestigious QCI-DL Shah National Award 2011 on Economics of Quality- the ‘National Best of All Awards’
• Was conferred the ‘Operational Excellence and Quality’ award at the BPOExcellence Awards 2010-11 hosted by the Stars of the Industry Group
• Won the 2010 ‘Outsourcing Service Provider of the Year’ award - NationalOutsourcing Association
• Won the Gold Medal for ‘Best Outsourced Contact Centre in APAC’ (Large) andTwo Silver Medals for ‘Best in Customer Service’ for APAC & EMEA respectively,at the Contact Center World’s 2010 Top Ranking Performers Conference
• Recognized as an ‘Emerging player in multi-process HRO’ - Everest, 2010• Recognized as an established provider offering multi-domain ‘Source to Pay’ -
End-to-end sourcing, procurement and accounts payable BPO services - Gartner,2010
• Horizontal solutions: Finance &Accounting, Human Resource,Customer Relationship Management,Knowledge Process, Technical SupportServices, Supply Chain Management
• First BPO Company in the worldappraised at Maturity Level 5 of PeopleCMM
• First Indian and third company in theworld to be COPC certified in thespecialized area of collections
• Among the Top 10 ITeS-BPO companiesin India and the largest BPO serviceprovider in Northern Ireland
• Quality certifications: CCA GlobalStandard, COPC 2000 (CSP Release4.1), ISO 9001:2000, OHSAS18001:2007 and ISO 14001:2004;Security Systems certification - ISO27001:2005, ISO 20000:2005 auditcertification in SAS 70 Type II
13
Risks and Concerns
Competition Related Risks
New competitors are emerging from adjacent markets anddistant geographies. The Company faces competition not onlyfrom the India based IT services providers but increasingly fromthe multinational IT vendors.
HCLT Strategy
HCLT's differentiation strategy incorporating its unique businessapproach has led to its emerging as a “Thought Leader” in therapidly dynamic IT industry. HCLT’s differentiation strategy isfour fold which includes Employee First initiative, Value centricityand Trust, Transparency and Flexibility.
Employee Related Risks - Managing Talent
Global economy is recovering from the bottoms of one of thedeepest recession era which means more and more opportunitiesare available to the skilled manpower. However, due to costcutting measures already in places, organizations are finding itdifficult to increase the monetary incentives. Due to manpowerintensive business model, IT service organizations are heavilyimpacted by this. In India, there is uptick in attrition in companiesoperating in IT vertical. Consequently, attrition for HCLT has alsoincreased from 15.7% in June 2010 to 16.5% in June 2011.
HCLT Strategy
HCLTs continues with its “Employee First” initiative which hasnow entered in its sixth year of successful implementation. Thefocus on employees as key resources has led to introduction ofseveral employee friendly policies. Success of this programcontinues to be hailed globally as it won various accolades. HCLThas been ranked the No. 1 Employer in India and Best Employerin Asia by Hewitt 2009 Study and was also voted as the MostInnovative Company in the world for its workforce practices andwon the Optimas award instituted by Workforce Managementin US. In addition, HCLT was declared Leaders in the categoryHuman Capital Development and ranked 3rd amongst the 100best global IT service provider companies that made it to theGlobal Services 100 list 2009. In Europe, HCLT was named asone of Britain's Top Employers 2009 for the third successiveyear by CRF International, an independent business researchorganisation.
HCLT Great Britain has been awarded the Payroll Giving Award(Bronze) towards fostering a culture of philanthropy at theworkplace. This award is a symbol of excellence and is awardedto employers who have succeeded in generating sustainableincome sources for UK charities through payroll.
HCLT has been taking adequate steps to improve and augmentthe supply of experienced manpower. It has partnered with selectlocal engineering colleges/institutes and imparts quality andcontemporary technical education.
HCLT continues to make investment in Employee Developmentinitiatives through Up-gradation of skills, re-skilling andleadership development. These programs have not only helpedin ensuring that there is no skill mismatch and building highmotivation levels of employees through skill enhancement.
Technology Risks
HCLT operates in an ever evolving and dynamic technologyenvironment and it is of utmost importance that the Companycontinuously reviews and upgrades its technology, resourcesand processes lest it faces technology obsolescence.
HCLT Strategy
The Company is not dependent on any single technology orplatform. HCLT has developed competencies in varioustechnologies, platforms and operating environment and offersthe wide range of technology options to clients to choose from,for their needs.
HCLT's Chief Delivery Officer (CDO) Organization has dedicatedgroups which provide services to various delivery teams onprocess, tools and technical training. Quality group drivescontinuous process improvement aligning with mature andevolving international process standards and certifications. TheTools group identifies appropriate tools, develops new tools andsupports the tools deployed. TechCEED group focuses onTechnical Competency Enhancement to continually upgrade thetechnical competency of delivery teams. The CDO groups workclosely with Technology Research Council (TRC) of respectiveVertical Delivery Units for adopting and implementing the latesttechnological enhancements in their respective domains. Inaddition to the in-house training and development initiatives,the Company keeps itself abreast and updated on thecontemporary developments in technology landscape throughparticipation in key technology forums and conferences.
Exchange Rate Risks
Global financial position continues to remain volatile with wideswings in both the directions in currencies impacting the ITindustry. This trend is expected to continue in near to mediumterm with added complexity of cross -currency movements.
HCLT Strategy
As a risk containment strategy, HCLT has taken hedges toprotect its receivables and forecast revenues against the foreigncurrency fluctuations. This strategy ensures certainty in revenuecollection and also provides safeguards against any unfavourablemovement to stakeholder. The treasury department of theCompany continues to track the foreign exchange movements& underlying currency exposures and takes advice from financialexperts to decide its hedging strategy from time to time.
Further, there is an increased focus on Europe, Asia Pacific andRest of World for generating business which not only insulatesfrom dependency on a single chosen economy but also ensuresthat the revenue streams are denominated in multiple currenciesthereby partially de-risking the currency.
Physical Security
Increased risk to human life and assets due to frequent incidentsof terror assault remains major risk for companies operating inthird World. The impact would be more on service companiesas against manufacturing companies due to manpower intensivebusiness model applicable to IT/ ITeS companies.
HCLT Strategy
HCLT has stringent security levels on all its facilities and ODCs.Comprehensive security is provided by leveraging on People,Processes and Technologies. Formation of ERT (Emergency
14
Response Team), Evacuation Plan and strengthening of DisasterRecovery and Business Continuity Plan (DR-BCP) are otherrelated steps in this direction to minimize the loss of human lifeand to provide continuity of operations with minimal disruptions.
Compliance with regulatory requirements
As HCLT is operating in no. of developing countries along withnew destinations added in Africa, Latin America, China etc.,therefore there is an increased risk of non-compliance to localregulatory requirements. This risk in terms of ensuring totalcompliance with regulatory framework increases with increasein global reach and operations.
HCLT Strategy
HCLT has put in place a comprehensive Regulatory Complianceframework in place to manage the regulatory compliance relatedissues. Detailed checklists are available with respective processowners to ensure compliance with legal requirements. BesidesSpecialized legal function helps in creating awareness aroundthe regulatory framework and focuses on various localcompliance related aspects being faced by business entities inrespective countries.
Business Continuity & Information Security
HCLT is dealing in maintaining, developing and operating timecritical Business and IT applications for various customers. Anynatural or man-made catastrophe may halt business activitiesand cause irreparable damage to brand reputation of thecompany resulting into loss of business. Similarly, confidentialityand security of confidential data also pose risk of compromiseof information.
HCLT Strategy
HCLT has put in place comprehensive Business Continuityprogram in place to ensure that HCLT meets its BusinessContinuity and Disaster Recovery related requirements as agreedwith Customer. Similarly, there is Information Security team toassess and manage the information security and data privacyand related risks by leveraging on People, Processes &Technology.
Internal Control Systems and their adequacy
The company has put in place an adequate system of internalcontrol commensurate with its size and nature of business. Thesesystems provide a reasonable assurance in respect of providingfinancial and operational information, complying with applicablestatutes, safeguarding of assets of the company and ensuringcompliance with corporate policies.
The company has a dedicated Internal Audit team which ensuresthat:
• Adequate processes, systems, internal controls areimplemented and these controls are commensurate with thesize and operations of the company.
• Transactions are executed in accordance with policies andauthorization.
• Resources have been deployed as per the business plan,policies and authorization.
The company has a rigorous business planning system to settargets and parameters for operations which are reviewed withactual performance to ensure timely initiation of corrective action,if required.
The company’s audit committee comprising of 4 independentdirectors, which is a sub-committee of the board, reviewsadherence to internal control systems, internal audit reports andlegal compliances. This committee reviews all quarterly andyearly results of the company and recommends the same toBoard for their approval.
DISCUSSION ON FINANCIAL PERFORMANCE
The financial performance of the Company as per Indian GAAPis discussed hereunder in two parts:
1. HCL Technologies Limited (Consolidated) which includes theperformance of its subsidiaries and joint ventures.
2. HCL Technologies Limited (Standalone) which excludes theperformance of its subsidiaries and joint ventures.
The Financial Statements have been prepared in compliancewith the requirements of Companies Act 1956, and IndianGenerally Accepted Accounting Practices (GAAP).
HCL Technologies Limited (Consolidated)
The Management Discussion and Analysis in this paragraphrelates to the consolidated financial statements of HCLTechnologies Limited and its subsidiaries. The discussion shouldbe read in conjunction with the financial statements and relatednotes to the consolidated accounts of HCL Technologies Limitedfor the year ended 30 June 2011.
RESULTS OF OPERATIONS (CONSOLIDATED)
(` in Crores)
For the Year Ended For the Year Ended
Particulars June 30, 2011 June 30, 2010 Growth
% % %
Amount Revenue Amount Revenue Increase
Revenue 15,730.4 100.0% 12,136.3 100.0% 29.6%
Total RevenuesTotal RevenuesTotal RevenuesTotal RevenuesTotal Revenues 15,730.415,730.415,730.415,730.415,730.4 100.0%100.0%100.0%100.0%100.0% 12,136.312,136.312,136.312,136.312,136.3 100.0%100.0%100.0%100.0%100.0% 29.6%29.6%29.6%29.6%29.6%
Cost of Goods Sold 522.1 3.3% 443.6 3.7% 17.7%
Personnel Expenses 8,589.6 54.6% 6,253.7 51.5% 37.4%
Operating and other 4,163.2 26.5% 3,498.5 28.8% 19.0%expenses
Depreciation 459.7 2.9% 418.1 3.4% 9.9%
Total ExpenditureTotal ExpenditureTotal ExpenditureTotal ExpenditureTotal Expenditure 13,734.613,734.613,734.613,734.613,734.6 87.3%87.3%87.3%87.3%87.3% 10,613.910,613.910,613.910,613.910,613.9 87.5%87.5%87.5%87.5%87.5% 29.4%29.4%29.4%29.4%29.4%
Profit before Interest,Profit before Interest,Profit before Interest,Profit before Interest,Profit before Interest, 1,995.81,995.81,995.81,995.81,995.8 12.7%12.7%12.7%12.7%12.7% 1,522.41,522.41,522.41,522.41,522.4 12.5%12.5%12.5%12.5%12.5% 31.1%31.1%31.1%31.1%31.1%Other Income & TaxOther Income & TaxOther Income & TaxOther Income & TaxOther Income & Tax
Interest 160.4 1.0% 204.1 1.7% -21.4%
Other Income 299.7 1.9% 154.1 1.3% 94.4%
Profit before TaxProfit before TaxProfit before TaxProfit before TaxProfit before Tax 2,135.12,135.12,135.12,135.12,135.1 13.6%13.6%13.6%13.6%13.6% 1,472.41,472.41,472.41,472.41,472.4 12.1%12.1%12.1%12.1%12.1% 45.0%45.0%45.0%45.0%45.0%
Provision for tax 488.5 3.1% 213.4 1.8% 128.9%
Minority Interest (0.1) 0.0% 0.2 0.0% -160.0%
Profit after taxProfit after taxProfit after taxProfit after taxProfit after tax 1,646.51,646.51,646.51,646.51,646.5 10.5%10.5%10.5%10.5%10.5% 1,259.21,259.21,259.21,259.21,259.2 10.4%10.4%10.4%10.4%10.4% 30.8%30.8%30.8%30.8%30.8%
Fiscal Year 2011 compared with 2010
Revenues:-
Revenues during fiscal 2011 have grown by 29.6% comparedto fiscal 2010.
The Company derives its revenue from three segments vizSoftware, Infrastructure services and Business ProcessOutsourcing services. Among the three segments, revenues fromsoftware services have registered highest growth of 33.2%.
15
June
primarily on account of - (a) Increase in number of employeesduring the year from total of 64,366 at the end of fiscal 2010 to77,046 at the end of fiscal 2011 and (b) increase in average costper employee. Personnel costs as a percentage of revenues haveincreased from 51.5% in 2010 to 54.6% in fiscal 2011.
In respect of Software services division, total softwareprofessional persons- months increased to 520,676 from 381,453person- months during previous year. Of this billed person-months are 399,053 for the fiscal year as compared to 305,662person months for the previous year. The non billable and traineeperson months are 121,623 during the fiscal 2011 compared to75,791 during fiscal 2010.
The utilization of billable software persons are as follows:-
For the Year Ended For the Year Ended
Particulars June 30, 2011 June 30, 2010
Offshore - including trainees 71.2% 75.3%
Offshore - excluding trainees 75.4% 77.9%
Operating and other expenses:-
(` in Crores)
For the Year Ended For the Year Ended
Particulars June 30, 2011 June 30, 2010 Growth
% % %
Amount Revenue Amount Revenue Increase
Rent 239.0 1.5% 249.7 2.8% -4.3%-4.3%-4.3%-4.3%-4.3%
Power & Fuel 158.7 1.0% 118.1 1.3% 34.4%34.4%34.4%34.4%34.4%
Travel and conveyance 1,094.5 7.0% 948.4 8.6% 15.4%15.4%15.4%15.4%15.4%
Outsourcing Cost 1,565.7 10.0% 1,150.2 8.6% 36.1%36.1%36.1%36.1%36.1%
Communication costs 185.6 1.2% 145.8 1.4% 27.3%27.3%27.3%27.3%27.3%
Recruitment Training& Development 124.5 0.8% 66.4 1.0% 87.4%87.4%87.4%87.4%87.4%
Exchange differences 11.5 0.1% - 3.8%
Others 783.6 5.0% 819.9 8.4% -4.4%-4.4%-4.4%-4.4%-4.4%
TotalTotalTotalTotalTotal 4,163.24,163.24,163.24,163.24,163.2 3,498.53,498.53,498.53,498.53,498.5 19.0%19.0%19.0%19.0%19.0%
Outsourcing costs includes (a) outsourcing of several customerrelated activities e.g. hosting services, facilities management,disaster recovery, maintenance, break fix services, etc. inInfrastructure Division. (b) hiring of third party consultants fromtime to time to supplement the in house teams in SoftwareDivision. These costs increased to ` 1565.7 crores in fiscal 2011from ` 1150.2 crores in fiscal 2010.
The Company derives over 90% of its revenues in foreigncurrencies while over 40% of it’s costs are incurred in INR.This exposes the Company to risk of adverse variation in foreigncurrency exchange rates. The Company uses foreign exchangeforward contracts and options to mitigate the risk of movementsin foreign exchange rates associated with receivables andforecasted transactions in certain foreign currencies. Duringthe fiscal year the Company has net exchange loss of ` 11.5crores against gain of ` 4.2 crores (included in other income)during the fiscal 2010 mainly on account of mark to market offorward covers and restatement of foreign currency assets andliabilities.
The Company follows cash flow hedge accounting in respect offorward covers and options taken to hedge the foreign exchangerisks related to the forecasted revenues. Exchange gain / (loss)arising on those forward covers where cash flow hedge
Segment wise details are given below:(` in Crores)
For the Year Ended For the Year Ended
Particulars June 30, 2011 June 30, 2010 Growth
% % %
Amount Revenue Amount Revenue Increase
Software Services 11,227.9 71.4% 8,427.6 69.4% 33.2%33.2%33.2%33.2%33.2%
Infrastructure 3,626.6 23.1% 2,757.8 22.7% 31.5%31.5%31.5%31.5%31.5%Services
Business Process 875.9 5.6% 950.9 7.8% -7.9%-7.9%-7.9%-7.9%-7.9%Outsourcing Services
Total RevenueTotal RevenueTotal RevenueTotal RevenueTotal Revenue 15,730.415,730.415,730.415,730.415,730.4 12,136.312,136.312,136.312,136.312,136.3 29.6%29.6%29.6%29.6%29.6%
The Segmentation of software services income by deliverylocation is as follows:-
For the Year Ended For the Year Ended
Particulars June 30, 2011 June 30, 2010
Onsite 57.8% 58.7%
Offshore 42.2% 41.3%
The segmentation of IT revenue (Software and InfrastructureServices) by project types is as follows:-
For the Year Ended For the Year Ended
Particulars June 30, 2011 June 30, 2010
Fixed Price 41.8% 40.3%
Time and Material 58.2% 59.7%
Geography wise breakdown of revenue
The Company also reviews its business on a geographic basis.The following table classifies total revenue by geographic areas:
(` in Crores)
For the Year Ended For the Year Ended
Particulars June 30, 2011 June 30, 2010 Growth
% % %
Amount Total Amount Total Increase
US 8,654.2 55.0% 6,852.2 56.5% 26.3%26.3%26.3%26.3%26.3%
Europe 4,250.7 27.0% 3,430.5 28.3% 23.9%23.9%23.9%23.9%23.9%
India 742.4 4.7% 660.7 5.4% 12.4%12.4%12.4%12.4%12.4%
Rest of the World 2,083.1 13.2% 1,192.8 9.8% 74.6%74.6%74.6%74.6%74.6%
Total ServiceTotal ServiceTotal ServiceTotal ServiceTotal Service 15,730.415,730.415,730.415,730.415,730.4 100.0%100.0%100.0%100.0%100.0% 12,136.312,136.312,136.312,136.312,136.3 100.0%100.0%100.0%100.0%100.0% 29.6%29.6%29.6%29.6%29.6%RevenueRevenueRevenueRevenueRevenue
Revenues from US geography have grown by 26.3% and Europehas grown by 23.9%.
Personnel Expenses:-
(` in Crores)
For the Year Ended For the Year Ended
Particulars June 30, 2011 June 30, 2010 Growth
% % %
Amount Revenue Amount Revenue Increase
Salaries, Wages and bonus 7,467.1 47.5% 5,572.6 45.9% 34.0%34.0%34.0%34.0%34.0%
Contribution to provident 930.8 5.9% 593.8 4.9% 56.8%56.8%56.8%56.8%56.8%and other employee bebefit
Staff welfare expenses 58.5 0.4% 37.4 0.3% 56.3%56.3%56.3%56.3%56.3%
Employee stock compensation 133.2 0.8% 49.8 0.4% 167.3%167.3%167.3%167.3%167.3%expense
TotalTotalTotalTotalTotal 8.589.68.589.68.589.68.589.68.589.6 54.6%54.6%54.6%54.6%54.6% 6,253.76,253.76,253.76,253.76,253.7 51.5%51.5%51.5%51.5%51.5% 37.4%37.4%37.4%37.4%37.4%
Personnel costs have increased to ̀ 8,589.6 crores in 2011 from` 6,253.7 crores in 2010, an increase of 37.4%. The increase is
16
accounting is followed has been reported under revenues.
Exchange rates for major currencies are given below:-
Average Rate USD GBP EURO AUD
For the Year Ended June 30, 2011 45.15 72.08 62.36 45.41
For the Year Ended June 30, 2010 46.60 73.53 64.58 41.08
Depreciation/(appreciation) (%) -3.1% -2.0% -3.4% 10.5%
Period Ended Rate USD GBP EURO AUD
As at June 30, 2011 45.06 71.58 64.64 47.89
As at June 30, 2010 46.44 69.73 57.03 39.57
Depreciation/(appreciation) (%) -3.0% 2.7% 13.4% 21.0%
Profit before Interest, Other Income & Tax
The Company’s Operating profit has increased to ` 1,995.8crores in fiscal 2011 from ` 1522.4 crores in 2010, increase of31.1%.
Other Income
The details of Other Income are as follows:-(` in Crores)
For the Year Ended For the Year Ended
Particulars June 30, 2011 June 30, 2010
Interest Income 135.9 98.8
Dividend Income 25.8 27.7
Gain on sale of investment 3.9 5.6
Settlement of pre-acquisition claims 102.0 -
Others 32.0 22.1
TotalTotalTotalTotalTotal 299.7299.7299.7299.7299.7 154.1154.1154.1154.1154.1
Taxation:-
The provision for taxation includes tax liabilities in India and anytax liabilities arising overseas. The net tax expense for fiscal2011 stands at ` 488.5 crores as compared to ` 213.4 crores infiscal 2010. Profits from the Group’s operations in Indiaattributable to the export operations from units situated inSoftware Technology Parks (“STP”) are exempt from incometax for a period of any ten consecutive years (tax holiday period)beginning from the financial year of the unit commencingoperations. The tax holiday on all of the units was scheduled toexpire in stages by March 2010. However, the Finance Act, 2009extended the availability of the tax holiday for one more yearsuch that the tax holiday will now be available until the earlier ofMarch 2011 or ten years after the commencement of a tax holidayfor an individual unit. Accordingly, tax holiday period for all STPunits has expired during the current year or earlier periods. Inrespect of units situated in Special Economic Zones (SEZs),under the Special Economic Zone Act, 2005, units in designatedspecial economic zones which begin providing services on orafter April 1, 2005 will be eligible for a deduction of 100 percentof profits or gains derived from the export of services for thefirst five years from commencement of provision of services and50 percent of such profits and gains for a further five years.Certain tax benefits are also available for a further five yearssubject to the unit meeting defined conditions.
Effective April 2007, the Finance Act 2007 has introducedMinimum Alternate Tax (MAT) on the exempt income attributableto export operations of units situated in STPs. Effective April,
2011, Finance Act , 2011 has extended MAT on export operationof units situated in Special Economic Zones (SEZ). Any MATpaid for a year is available for set-off against tax liability for tensubsequent years. Accordingly, the Company has recognizedMAT credit amounting to ` 267.99 and ` 196.04 as at June 30,2011 and June 30, 2010 respectively.
Acquisitions / sale during the year:-
a) Citibank International Plc.
In January 2011, the Company through its subsidiary, acquiredcertain software assets and employees of Citi Securities andFund Services for a total cash consideration of ` 59.08 croresand deferred consideration of ` 54.32 crores payable after oneyear from the date of acquisition. The transaction has beenaccounted by following the purchase method and resulted ingoodwill aggregating to ` 100.76 crores and intangibles of` 9.22 crores.
b) Telecom Expense Management Services
The Company has sold certain portion of its Telecom ExpenseManagement Services business for cash consideration of ̀ 14.32crores ($3.24 Mn) and recorded a gain of ` 2.02 crores($0.41 Mn) in other income during the year ended June 30, 2011.
FINANCIAL POSITION
Share capital:-
(` in Crores)
Particulars 2011 2010
Authorized Share CapitalAuthorized Share CapitalAuthorized Share CapitalAuthorized Share CapitalAuthorized Share Capital 150.0150.0150.0150.0150.0 150.0150.0150.0150.0150.0
Issued Subscribed & paid Up 137.7 135.8
Authorized Share Capital consists of 750,000,000 equity sharesof ` 2 each. During the year, employees exercised 2,068,644,2,909,132 and 4,926,236 equity shares under the employeesstock options plan 1999, 2000 & 2004 respectively. Consequentlyissued subscribed and paid capital increased by 9,904,712 equityshares and share capital increased by ` 1.9 crores.
Borrowings:-
Company has outstanding borrowings of ` 2,187.3 crores as ofJune 30 2011 primarily consisting of the following:-
• Secured redeemable non convertible debentures of` 10 lacs each issued for ` 1,000 crores redeemable intrenches of 2, 3 & 5 years from the date of issue and have aninterest cost ranging between 7.55% to 8.80%.
• Secured long term foreign currency loan of ` 1,020.7 crores(USD Equivalent 228.4 mn) from banks repayable in sevenhalf yearly equal installments starting from Nov 2011 carryinginterest ranging from 3% to 4%.
Fixed Assets:-
The Company has made additions of ̀ 919.2 crores during 2011in the gross block of fixed assets which comprises computers,software, other equipments and investment in facilities. Additionsinclude ` 109.9 crores being goodwill and intangible acquiredon consummation of acquisition during the year. Gross block offixed assets as at the end of fiscal 2011 stood at ̀ 7,829.8 croresand capital work in progress (including capital advances) stoodat ` 609.4 crores.
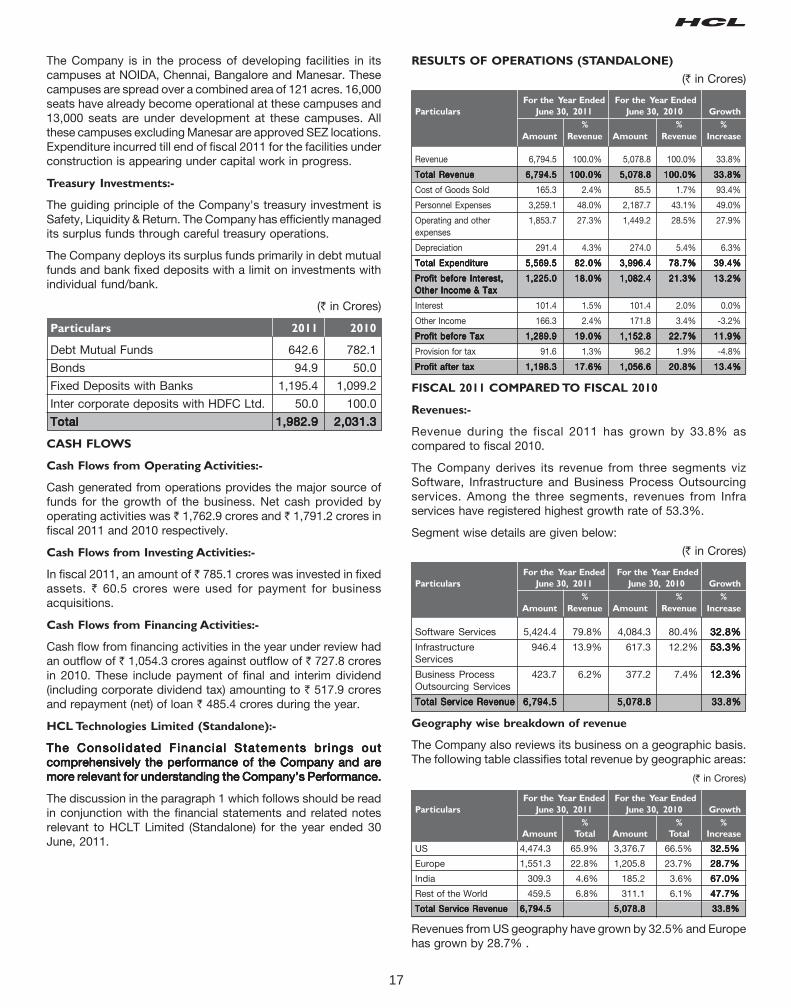
17
The Company is in the process of developing facilities in itscampuses at NOIDA, Chennai, Bangalore and Manesar. Thesecampuses are spread over a combined area of 121 acres. 16,000seats have already become operational at these campuses and13,000 seats are under development at these campuses. Allthese campuses excluding Manesar are approved SEZ locations.Expenditure incurred till end of fiscal 2011 for the facilities underconstruction is appearing under capital work in progress.
Treasury Investments:-
The guiding principle of the Company's treasury investment isSafety, Liquidity & Return. The Company has efficiently managedits surplus funds through careful treasury operations.
The Company deploys its surplus funds primarily in debt mutualfunds and bank fixed deposits with a limit on investments withindividual fund/bank.
(` in Crores)
Particulars 2011 2010
Debt Mutual Funds 642.6 782.1
Bonds 94.9 50.0
Fixed Deposits with Banks 1,195.4 1,099.2
Inter corporate deposits with HDFC Ltd. 50.0 100.0
TotalTotalTotalTotalTotal 1,982.91,982.91,982.91,982.91,982.9 2,031.32,031.32,031.32,031.32,031.3
CASH FLOWS
Cash Flows from Operating Activities:-
Cash generated from operations provides the major source offunds for the growth of the business. Net cash provided byoperating activities was ` 1,762.9 crores and ` 1,791.2 crores infiscal 2011 and 2010 respectively.
Cash Flows from Investing Activities:-
In fiscal 2011, an amount of ` 785.1 crores was invested in fixedassets. ` 60.5 crores were used for payment for businessacquisitions.
Cash Flows from Financing Activities:-
Cash flow from financing activities in the year under review hadan outflow of ` 1,054.3 crores against outflow of ` 727.8 croresin 2010. These include payment of final and interim dividend(including corporate dividend tax) amounting to ` 517.9 croresand repayment (net) of loan ` 485.4 crores during the year.
HCL Technologies Limited (Standalone):-
The Consol idated Financial Statements br ings outThe Consol idated Financial Statements br ings outThe Consol idated Financial Statements br ings outThe Consol idated Financial Statements br ings outThe Consol idated Financial Statements br ings outcomprehensively the performance of the Company and arecomprehensively the performance of the Company and arecomprehensively the performance of the Company and arecomprehensively the performance of the Company and arecomprehensively the performance of the Company and aremore relevant for understanding the Company’s Performance.more relevant for understanding the Company’s Performance.more relevant for understanding the Company’s Performance.more relevant for understanding the Company’s Performance.more relevant for understanding the Company’s Performance.
The discussion in the paragraph 1 which follows should be readin conjunction with the financial statements and related notesrelevant to HCLT Limited (Standalone) for the year ended 30June, 2011.
RESULTS OF OPERATIONS (STANDALONE)
(` in Crores)
For the Year Ended For the Year Ended
Particulars June 30, 2011 June 30, 2010 Growth
% % %
Amount Revenue Amount Revenue Increase
Revenue 6,794.5 100.0% 5,078.8 100.0% 33.8%
Total RevenueTotal RevenueTotal RevenueTotal RevenueTotal Revenue 6,794.56,794.56,794.56,794.56,794.5 100.0%100.0%100.0%100.0%100.0% 5,078.85,078.85,078.85,078.85,078.8 100.0%100.0%100.0%100.0%100.0% 33.8%33.8%33.8%33.8%33.8%
Cost of Goods Sold 165.3 2.4% 85.5 1.7% 93.4%
Personnel Expenses 3,259.1 48.0% 2,187.7 43.1% 49.0%
Operating and other 1,853.7 27.3% 1,449.2 28.5% 27.9%expenses
Depreciation 291.4 4.3% 274.0 5.4% 6.3%
Total ExpenditureTotal ExpenditureTotal ExpenditureTotal ExpenditureTotal Expenditure 5,569.55,569.55,569.55,569.55,569.5 82.0%82.0%82.0%82.0%82.0% 3,996.43,996.43,996.43,996.43,996.4 78.7%78.7%78.7%78.7%78.7% 39.4%39.4%39.4%39.4%39.4%
Profit before Interest,Profit before Interest,Profit before Interest,Profit before Interest,Profit before Interest, 1,225.01,225.01,225.01,225.01,225.0 18.0%18.0%18.0%18.0%18.0% 1,082.41,082.41,082.41,082.41,082.4 21.3%21.3%21.3%21.3%21.3% 13.2%13.2%13.2%13.2%13.2%Other Income & TaxOther Income & TaxOther Income & TaxOther Income & TaxOther Income & Tax
Interest 101.4 1.5% 101.4 2.0% 0.0%
Other Income 166.3 2.4% 171.8 3.4% -3.2%
Profit before TaxProfit before TaxProfit before TaxProfit before TaxProfit before Tax 1,289.91,289.91,289.91,289.91,289.9 19.0%19.0%19.0%19.0%19.0% 1,152.81,152.81,152.81,152.81,152.8 22.7%22.7%22.7%22.7%22.7% 11.9%11.9%11.9%11.9%11.9%
Provision for tax 91.6 1.3% 96.2 1.9% -4.8%
Profit after taxProfit after taxProfit after taxProfit after taxProfit after tax 1,198.31,198.31,198.31,198.31,198.3 17.6%17.6%17.6%17.6%17.6% 1,056.61,056.61,056.61,056.61,056.6 20.8%20.8%20.8%20.8%20.8% 13.4%13.4%13.4%13.4%13.4%
FISCAL 2011 COMPARED TO FISCAL 2010
Revenues:-
Revenue during the fiscal 2011 has grown by 33.8% ascompared to fiscal 2010.
The Company derives its revenue from three segments vizSoftware, Infrastructure and Business Process Outsourcingservices. Among the three segments, revenues from Infraservices have registered highest growth rate of 53.3%.
Segment wise details are given below:
(` in Crores)
For the Year Ended For the Year Ended
Particulars June 30, 2011 June 30, 2010 Growth
% % %
Amount Revenue Amount Revenue Increase
Software Services 5,424.4 79.8% 4,084.3 80.4% 32.8%32.8%32.8%32.8%32.8%
Infrastructure 946.4 13.9% 617.3 12.2% 53.3%53.3%53.3%53.3%53.3%Services
Business Process 423.7 6.2% 377.2 7.4% 12.3%12.3%12.3%12.3%12.3%Outsourcing Services
Total Service RevenueTotal Service RevenueTotal Service RevenueTotal Service RevenueTotal Service Revenue 6,794.56,794.56,794.56,794.56,794.5 5,078.85,078.85,078.85,078.85,078.8 33.8%33.8%33.8%33.8%33.8%
Geography wise breakdown of revenue
The Company also reviews its business on a geographic basis.The following table classifies total revenue by geographic areas:
(` in Crores)
For the Year Ended For the Year Ended
Particulars June 30, 2011 June 30, 2010 Growth
% % %
Amount Total Amount Total Increase
US 4,474.3 65.9% 3,376.7 66.5% 32.5%32.5%32.5%32.5%32.5%
Europe 1,551.3 22.8% 1,205.8 23.7% 28.7%28.7%28.7%28.7%28.7%
India 309.3 4.6% 185.2 3.6% 67.0%67.0%67.0%67.0%67.0%
Rest of the World 459.5 6.8% 311.1 6.1% 47.7%47.7%47.7%47.7%47.7%
Total Service RevenueTotal Service RevenueTotal Service RevenueTotal Service RevenueTotal Service Revenue 6,794.56,794.56,794.56,794.56,794.5 5,078.85,078.85,078.85,078.85,078.8 33.8%33.8%33.8%33.8%33.8%
Revenues from US geography have grown by 32.5% and Europehas grown by 28.7% .
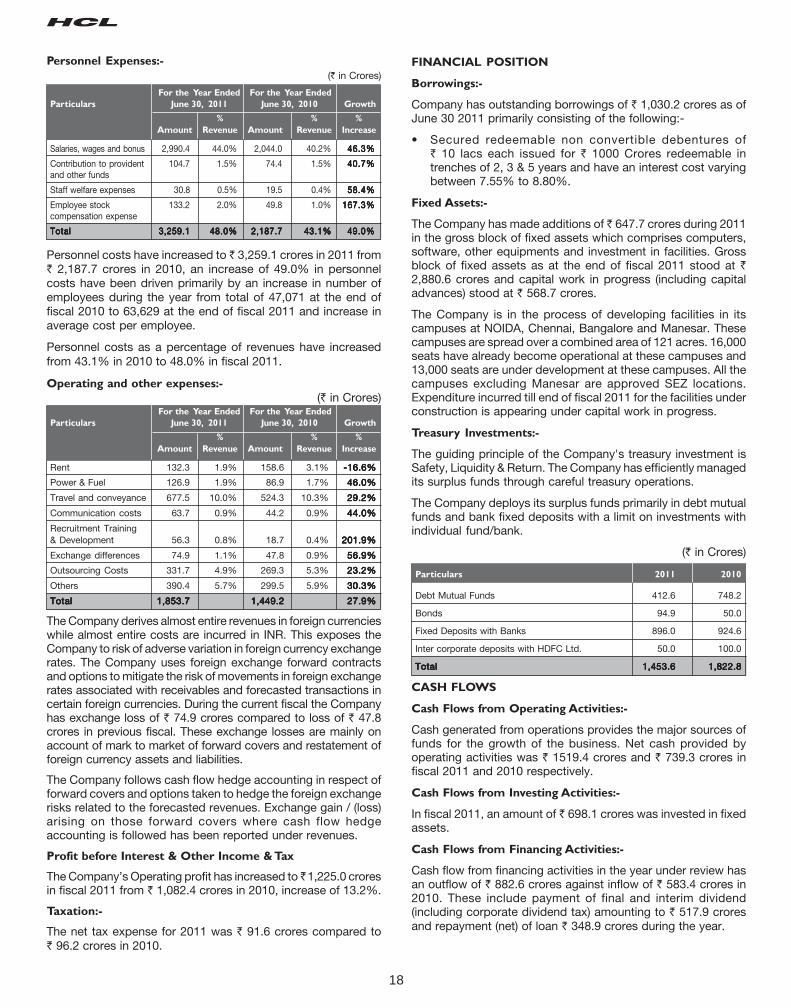
18
Personnel Expenses:-
(` in Crores)
For the Year Ended For the Year Ended
Particulars June 30, 2011 June 30, 2010 Growth
% % %
Amount Revenue Amount Revenue Increase
Salaries, wages and bonus 2,990.4 44.0% 2,044.0 40.2% 46.3%46.3%46.3%46.3%46.3%
Contribution to provident 104.7 1.5% 74.4 1.5% 40.7%40.7%40.7%40.7%40.7%and other funds
Staff welfare expenses 30.8 0.5% 19.5 0.4% 58.4%58.4%58.4%58.4%58.4%
Employee stock 133.2 2.0% 49.8 1.0% 167.3%167.3%167.3%167.3%167.3%compensation expense
TotalTotalTotalTotalTotal 3,259.13,259.13,259.13,259.13,259.1 48.0%48.0%48.0%48.0%48.0% 2,187.72,187.72,187.72,187.72,187.7 43.1%43.1%43.1%43.1%43.1% 49.0%49.0%49.0%49.0%49.0%
Personnel costs have increased to ̀ 3,259.1 crores in 2011 from` 2,187.7 crores in 2010, an increase of 49.0% in personnelcosts have been driven primarily by an increase in number ofemployees during the year from total of 47,071 at the end offiscal 2010 to 63,629 at the end of fiscal 2011 and increase inaverage cost per employee.
Personnel costs as a percentage of revenues have increasedfrom 43.1% in 2010 to 48.0% in fiscal 2011.
Operating and other expenses:-
(` in Crores)For the Year Ended For the Year Ended
Particulars June 30, 2011 June 30, 2010 Growth
% % %
Amount Revenue Amount Revenue Increase
Rent 132.3 1.9% 158.6 3.1% -16.6%-16.6%-16.6%-16.6%-16.6%
Power & Fuel 126.9 1.9% 86.9 1.7% 46.0%46.0%46.0%46.0%46.0%
Travel and conveyance 677.5 10.0% 524.3 10.3% 29.2%29.2%29.2%29.2%29.2%
Communication costs 63.7 0.9% 44.2 0.9% 44.0%44.0%44.0%44.0%44.0%
Recruitment Training& Development 56.3 0.8% 18.7 0.4% 201.9%201.9%201.9%201.9%201.9%
Exchange differences 74.9 1.1% 47.8 0.9% 56.9%56.9%56.9%56.9%56.9%
Outsourcing Costs 331.7 4.9% 269.3 5.3% 23.2%23.2%23.2%23.2%23.2%
Others 390.4 5.7% 299.5 5.9% 30.3%30.3%30.3%30.3%30.3%
TotalTotalTotalTotalTotal 1,853.71,853.71,853.71,853.71,853.7 1,449.21,449.21,449.21,449.21,449.2 27.9%27.9%27.9%27.9%27.9%
The Company derives almost entire revenues in foreign currencieswhile almost entire costs are incurred in INR. This exposes theCompany to risk of adverse variation in foreign currency exchangerates. The Company uses foreign exchange forward contractsand options to mitigate the risk of movements in foreign exchangerates associated with receivables and forecasted transactions incertain foreign currencies. During the current fiscal the Companyhas exchange loss of ` 74.9 crores compared to loss of ` 47.8crores in previous fiscal. These exchange losses are mainly onaccount of mark to market of forward covers and restatement offoreign currency assets and liabilities.
The Company follows cash flow hedge accounting in respect offorward covers and options taken to hedge the foreign exchangerisks related to the forecasted revenues. Exchange gain / (loss)arising on those forward covers where cash flow hedgeaccounting is followed has been reported under revenues.
Profit before Interest & Other Income & Tax
The Company’s Operating profit has increased to ̀ 1,225.0 croresin fiscal 2011 from ` 1,082.4 crores in 2010, increase of 13.2%.
Taxation:-
The net tax expense for 2011 was ` 91.6 crores compared to` 96.2 crores in 2010.
FINANCIAL POSITION
Borrowings:-
Company has outstanding borrowings of ` 1,030.2 crores as ofJune 30 2011 primarily consisting of the following:-
• Secured redeemable non convertible debentures of` 10 lacs each issued for ` 1000 Crores redeemable intrenches of 2, 3 & 5 years and have an interest cost varyingbetween 7.55% to 8.80%.
Fixed Assets:-
The Company has made additions of ̀ 647.7 crores during 2011in the gross block of fixed assets which comprises computers,software, other equipments and investment in facilities. Grossblock of fixed assets as at the end of fiscal 2011 stood at `2,880.6 crores and capital work in progress (including capitaladvances) stood at ` 568.7 crores.
The Company is in the process of developing facilities in itscampuses at NOIDA, Chennai, Bangalore and Manesar. Thesecampuses are spread over a combined area of 121 acres. 16,000seats have already become operational at these campuses and13,000 seats are under development at these campuses. All thecampuses excluding Manesar are approved SEZ locations.Expenditure incurred till end of fiscal 2011 for the facilities underconstruction is appearing under capital work in progress.
Treasury Investments:-
The guiding principle of the Company's treasury investment isSafety, Liquidity & Return. The Company has efficiently managedits surplus funds through careful treasury operations.
The Company deploys its surplus funds primarily in debt mutualfunds and bank fixed deposits with a limit on investments withindividual fund/bank.
(` in Crores)
Particulars 2011 2010
Debt Mutual Funds 412.6 748.2
Bonds 94.9 50.0
Fixed Deposits with Banks 896.0 924.6
Inter corporate deposits with HDFC Ltd. 50.0 100.0
TotalTotalTotalTotalTotal 1,453.61,453.61,453.61,453.61,453.6 1,822.81,822.81,822.81,822.81,822.8
CASH FLOWS
Cash Flows from Operating Activities:-
Cash generated from operations provides the major sources offunds for the growth of the business. Net cash provided byoperating activities was ` 1519.4 crores and ` 739.3 crores infiscal 2011 and 2010 respectively.
Cash Flows from Investing Activities:-
In fiscal 2011, an amount of ` 698.1 crores was invested in fixedassets.
Cash Flows from Financing Activities:-
Cash flow from financing activities in the year under review hasan outflow of ` 882.6 crores against inflow of ` 583.4 crores in2010. These include payment of final and interim dividend(including corporate dividend tax) amounting to ` 517.9 croresand repayment (net) of loan ` 348.9 crores during the year.
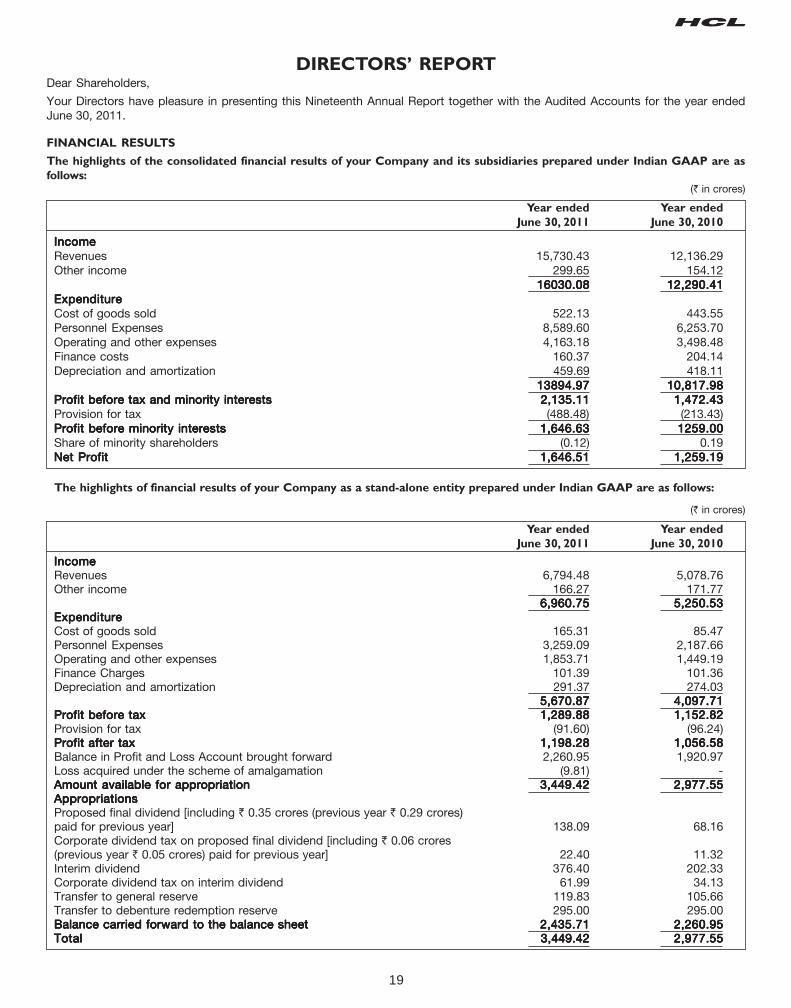
19
DIRECTORS’ REPORT
Dear Shareholders,
Your Directors have pleasure in presenting this Nineteenth Annual Report together with the Audited Accounts for the year endedJune 30, 2011.
FINANCIAL RESULTS
The highlights of the consolidated financial results of your Company and its subsidiaries prepared under Indian GAAP are as
follows:(` in crores)
Year ended Year ended
June 30, 2011 June 30, 2010
IncomeIncomeIncomeIncomeIncomeRevenues 15,730.43 12,136.29Other income 299.65 154.12
16030.0816030.0816030.0816030.0816030.08 12,290.4112,290.4112,290.4112,290.4112,290.41ExpenditureExpenditureExpenditureExpenditureExpenditureCost of goods sold 522.13 443.55Personnel Expenses 8,589.60 6,253.70Operating and other expenses 4,163.18 3,498.48Finance costs 160.37 204.14Depreciation and amortization 459.69 418.11
13894.9713894.9713894.9713894.9713894.97 10,817.9810,817.9810,817.9810,817.9810,817.98Profit before tax and minority interestsProfit before tax and minority interestsProfit before tax and minority interestsProfit before tax and minority interestsProfit before tax and minority interests 2,135.112,135.112,135.112,135.112,135.11 1,472.431,472.431,472.431,472.431,472.43Provision for tax (488.48) (213.43)Profit before minority interestsProfit before minority interestsProfit before minority interestsProfit before minority interestsProfit before minority interests 1,646.631,646.631,646.631,646.631,646.63 1259.001259.001259.001259.001259.00Share of minority shareholders (0.12) 0.19Net ProfitNet ProfitNet ProfitNet ProfitNet Profit 1,646.511,646.511,646.511,646.511,646.51 1,259.191,259.191,259.191,259.191,259.19
The highlights of financial results of your Company as a stand-alone entity prepared under Indian GAAP are as follows:
(` in crores)
Year ended Year ended
June 30, 2011 June 30, 2010
IncomeIncomeIncomeIncomeIncomeRevenues 6,794.48 5,078.76Other income 166.27 171.77
6,960.756,960.756,960.756,960.756,960.75 5,250.535,250.535,250.535,250.535,250.53ExpenditureExpenditureExpenditureExpenditureExpenditureCost of goods sold 165.31 85.47Personnel Expenses 3,259.09 2,187.66Operating and other expenses 1,853.71 1,449.19Finance Charges 101.39 101.36Depreciation and amortization 291.37 274.03
5,670.875,670.875,670.875,670.875,670.87 4,097.714,097.714,097.714,097.714,097.71Profit before taxProfit before taxProfit before taxProfit before taxProfit before tax 1,289.881,289.881,289.881,289.881,289.88 1,152.821,152.821,152.821,152.821,152.82Provision for tax (91.60) (96.24)Profit after taxProfit after taxProfit after taxProfit after taxProfit after tax 1,198.281,198.281,198.281,198.281,198.28 1,056.581,056.581,056.581,056.581,056.58Balance in Profit and Loss Account brought forward 2,260.95 1,920.97Loss acquired under the scheme of amalgamation (9.81) -Amount available for appropriationAmount available for appropriationAmount available for appropriationAmount available for appropriationAmount available for appropriation 3,449.423,449.423,449.423,449.423,449.42 2,977.552,977.552,977.552,977.552,977.55AppropriationsAppropriationsAppropriationsAppropriationsAppropriationsProposed final dividend [including ` 0.35 crores (previous year ` 0.29 crores)paid for previous year] 138.09 68.16Corporate dividend tax on proposed final dividend [including ` 0.06 crores(previous year ` 0.05 crores) paid for previous year] 22.40 11.32Interim dividend 376.40 202.33Corporate dividend tax on interim dividend 61.99 34.13Transfer to general reserve 119.83 105.66Transfer to debenture redemption reserve 295.00 295.00Balance carried forward to the balance sheetBalance carried forward to the balance sheetBalance carried forward to the balance sheetBalance carried forward to the balance sheetBalance carried forward to the balance sheet 2,435.712,435.712,435.712,435.712,435.71 2,260.952,260.952,260.952,260.952,260.95TotalTotalTotalTotalTotal 3,449.42 3,449.42 3,449.42 3,449.42 3,449.42 2,977.552,977.552,977.552,977.552,977.55
20
TRANSFER TO RESERVES
Your Company has transferred ` 119.83 crores to the General Reserve Account and ` 295 crores to the Debenture RedemptionReserve Account for the year ended June 30, 2011. An amount of ` 2,435.71 crores is proposed to be carried forward in the Profit &Loss Account.
OVERVIEW
During the financial year 2010-11, on a standalone basis, your Company’s revenues stood at ` 6,794.48 crores registering a growthof 33.78% over the previous year and on a consolidated basis, the Company's revenues for the year 2010-11 stood at ` 15,730.43crores registering a growth of 29.61% over the previous year.
A detailed analysis on the Company's performance is included in the Management’s Discussion and Analysis Report titled as“Management’s Discussion and Analysis”, which forms part of this Annual Report.
DIVIDENDS
Your Directors are pleased to recommend a final dividend of ` 2/- per equity share of par value of ` 2/- each for the financial yearended June 30, 2011, subject to the approval of the shareholders at the ensuing Annual General Meeting of the Company. During theyear under review, your Directors had declared and paid three interim dividends as per the details given hereunder:
S. No. Interim dividend paid during Rate of dividend Amount of Dividend Distribution Total Outflowthe year ended June 30, 2011 per share dividend paid tax paid by the Company
(face value of (`/crores)
` 2/- each)
1 1st Interim Dividend ` 1.50/- 102.34 17.00 119.342 2nd Interim Dividend ` 2/- 136.91 22.74 159.653 3rd Interim Dividend ` 2/- 137.15 22.25 159.40
The total amount of dividends (including interim dividends paid) for the year ended June 30, 2011 shall be ` 514.49 crores. Dividenddistribution tax paid / payable by the Company for the year would amount to ` 84.39 crores.
SCHEME OF AMALGAMATION
During the year under review, the Hon'ble High Court of Delhivide its order dated August 16, 2010 has approved the Schemeof Amalgamation under section 391 to 394 of the CompaniesAct, 1956 for amalgamation of HCL Technoparks Limited, awholly owned subsidiary of the Company with the Company.The said Order became effective w.e.f. August 27, 2010 beingthe date of filing of the said order with the Office of Registrar ofCompanies, NCT of Delhi & Haryana.
SUBSIDIARIES FORMED DURING THE YEAR
In view of the new business prospects, the Company hasincorporated following step down subsidiaries during the year:
Name of the Subsidiary Country of
Incorporation
HCL Technologies France France
PT HCL Technologies Indonesia Indonesia
HCL Technologies Philippines, Inc. Philippines
HCL Arabia LLC Saudi Arabia
Anzospan Investments Pty. Limited South Africa
HCL Technologies South Africa (Proprietary) Ltd. South Africa
Filial Espanola De HCL Technoloiges S.L. Spain
SUBSIDIARIES- CLOSED DURING THE YEAR
As a rationalization process, your Company has closed downits two steps down subsidiaries viz. Aspire Solutions Sdn. Bhd.,a company incorporated in Malaysia and Axon EBT TrusteesLimited, a company incorporated in United Kingdom. Thesesubsidiaries were non operative.
SUBSIDIARIES - FINANCIALS
The Company has 58 subsidiaries as on June 30, 2011.4 subsidiaries of the Company are not required to prepare thefinancials as on June 30, 2011 as they have been incorporatedduring the current year and the first financial year of thesecompanies shall close subsequent to June 30, 2011.
The Ministry of Corporate Affairs vide its General CircularNo. 2/2011 dated February 8, 2011 has given generalexemption to the companies from annexing the individualaccounts of all the subsidiaries along with the auditedfinancial statements of the Company while publishing theAnnual Report subject to certain conditions as mentioned inthe said circular. Your Company meets all the conditionsstated in the aforesaid circular and therefore the standalonefinancial statements of each subsidiary are not annexed withthe Annual Report for the year ended June 30, 2011.
The consolidated financial statements of the Company and itssubsidiaries are attached in the Annual Report. A statementcontaining brief financial details of all the subsidiaries of theCompany for the year ended June 30, 2011 forms part of theAnnual Report. The Company would provide the annual accountsof the subsidiaries and the related detailed information to theshareholders of the Company on specific request made to it inthis regard by the shareholders.
CHANGES IN CAPITAL STRUCTURE
Issue of shares under Employees Stock Option Plans
During the year ended June 30, 2011, the Company allotted99,04,712 equity shares of ` 2/- each fully paid up under itsEmployees Stock Option Plans.
21
Issued and Paid-up Share Capital
As on June 30, 2011, the issued and paid-up share capital ofthe Company was ` 137,73,77,048/- (previous year:` 135,75,67,624/-) comprising 68,86,88,524 (previous year:67,87,83,812) equity shares of ` 2/- each fully paid-up.
SHARES UNDER COMPULSORY DEMATERIALIZATION
The equity shares of your Company are included in the list ofspecified scrips where delivery of shares in dematerialized(demat) form is compulsorily effective from July 24, 2000, if thesame are traded on a stock exchange, which is linked to adepository. As of June 30, 2011, 99.93% shares were held indemat form.
DEBENTURES
During 2009-10, the Company had issued rated, secured,taxable, redeemable non-convertible debenture(s) as per detailsgiven hereunder:
Date of Issue Amount Coupon Rate Maturity
(` in crores) (Payable Period
quarterly)
August 25, 2009 170 7.55% p.a. 2 years
August 25, 2009 330 8.20% p.a. 3 years
September 10, 2009 500 8.80% p.a. 5 years
A debenture trust deed in favour of IDBI Trusteeship ServicesLimited for the aforesaid issues was executed. The debenturesare secured by way of mortgage(s) and/ or charges on themovable / immovable properties of the Company whetherexisting / future. The said debentures have been listed onWholesale Debt Segment of the National Stock Exchange ofIndia Limited. The Company has paid the interest due on theaforesaid debentures on time and nothing is payable as on date.
INTERNAL CONTROL SYSTEM
The Company has in place adequate internal control systemscommensurate with its size and nature of business. Thesesystems provide a reasonable assurance in respect of providingfinancial and operational information, compliance with applicablestatutes and safeguarding of assets of the Company. Thesesystems ensure that transactions are executed in accordancewith specified policies and resources are deployed as per thebusiness plans and policies.
The Company has an in-house internal audit division and thehead of internal audit function reports directly to the AuditCommittee to ensure independence of this function.
CORPORATE GOVERNANCE
The report of the Board of Directors of the Company onCorporate Governance is given as a separate section titled‘Corporate Governance Report 2010-11’, which forms part ofthis Annual Report.
Certificate of the Statutory Auditors of the Company regardingcompliance with the Corporate Governance requirements asstipulated in clause 49 of the Listing Agreement with the stockexchanges is annexed with the aforesaid Corporate GovernanceReport.
MANAGEMENT'S DISCUSSION & ANALYSIS
The Management's Discussion and Analysis is given separatelyand forms part of this Annual Report.
INSIDER TRADING REGULATIONS
Based on the requirements under SEBI (Prohibition of InsiderTrading) Regulations, 1992, as amended from time to time, theCode of Conduct for prevention of insider trading and the Codefor corporate disclosures are in force.
DIRECTORS
In accordance with the provisions of the Companies Act, 1956and Articles of Association of the Company, Mr. T. S. R.Subramanian, Mr. Ajai Chowdhry and Mr. P. C. Sen, shall retireby rotation as Directors of the Company at the ensuing AnnualGeneral Meeting of the Company. Mr. T. S. R. Subramanian,Mr. Ajai Chowdhry and Mr. P. C. Sen have expressed their desirenot to seek reappointment as the Directors of the Company.
Mr. R. Srinivasan was appointed as an Additional Director of theCompany w.e.f. April 19, 2011. Pursuant to the provisions ofsection 260 of the Companies Act, 1956, Mr. R. Srinivasan holdsthe office till the ensuing Annual General Meeting and is eligiblefor appointment as the Director of the Company.
A brief profile of Mr. R. Srinivasan who is proposed to beappointed as Director of the Company is given in the corporategovernance section of the annual report.
AUDITORS
The statutory auditors, M/s. S. R. Batliboi & Co. CharteredAccountants, retire at the conclusion of the ensuing AnnualGeneral Meeting and they have confirmed their eligibility andwillingness to be re-appointed. The Audit Committee and theBoard of Directors recommend the reappointment as statutoryauditors of M/s. S. R. Batliboi & Co., Chartered Accountants forthe financial year 2011-12 for shareholders’ approval.
TRANSFER OF UNPAID AND UNCLAIMED AMOUNTS TO
IEPF
Pursuant to the provisions of section 205A (5) of the CompaniesAct, 1956, the dividend declared and paid by the Company andwhich have remain unpaid or unclaimed for a period of sevenyears from the date of declaration have been transferred by theCompany to the Investor Education and Protection Fund (“IEPF”)established by the Central Government pursuant to Section 205Cof the said Act. The details of the unpaid/unclaimed dividendthat will be transferred to IEPF A/c in subsequent years are givenin the corporate governance section of the annual report.
GROUP
As per the intimation received from the Promoter(s), for thepurposes of availing exemption from applicability of theprovisions of Regulations 10 to 12 of the Securities ExchangeBoard of India (Substantial Acquisition of Shares and Takeovers)Regulations, 1997, pursuant to Regulation 3(1)(e)(i) thereof,persons constituting 'Group' as defined in the Monopolies andRestrictive Trade Practices Act, 1969 include the following:
Name of the Companies/TrustName of the Companies/TrustName of the Companies/TrustName of the Companies/TrustName of the Companies/Trust
HCL Holdings Pvt. Ltd.Guddu Investments (Pondi) Pvt. Ltd.Vama Sundari Investments (Pondi) Pvt. Ltd.Shiv Nadar Investments (Pondi) Pvt. Ltd.SSN Investments (Pondi) Pvt. Ltd.Shiv Nadar Investments (Chennai) Pvt. Ltd.Shivkiran Investments (Chennai) Pvt. Ltd.
22
Vamasundari Investments (Delhi) Pvt. Ltd.SSN Investments (Delhi) Pvt. Ltd.Vama Sundari Investments (Chennai) Pvt. Ltd.SSN Investments (Chennai) Pvt. Ltd.Guddu Investments (Chennai) Pvt. Ltd.Slocum Investments (Chennai) Pvt. Ltd.Kiranroshni Investments (Chennai) Pvt. Ltd.Slocum Investments (Delhi) Pvt. LtdGuddu Investments (Delhi) Pvt. Ltd.Slocum Investments (Pondi) Pvt. Ltd.KRN Education Pvt. Ltd.Slocum Management Consultancy Pvt. Ltd.SSN TrustShiv Nadar FoundationVama Sundari Scholarship Trust
FIXED DEPOSITS
Your Company has not accepted any fixed deposits.
AWARDS AND RECOGNITIONS
As your Company pursues excellence relentlessly, your Companyis delighted to receive phenomenal share of recognitions andawards this year, not just from the media, but also from analysts,governing bodies, academic institutions, partners and evencustomers. Some of the key accolades received during the yearinclude:
• The Company has been declared as one of Britain's TopEmployers for 2011 for the fifth consecutive year by theCorporate Research Foundation Institute.
• The International Association of Outsourcing Professionals(IAOP) has named HCL a Leader in 2011.
• Global Outsourcing 100 Service Providers List, which is acomprehensive list of the World’s best outsourcing serviceproviders.
• HCL has been felicitated with the prestigious QCI-DL ShahNational Award 2011 on Economics of Quality for the secondconsecutive year. The Quality Council of India (QCI) and theDL Shah Trust honored HCL with its most prestigious citation- the ‘National Best of All Award’.
• The Company has won three REMMY (the RecruitmentMarketing Awards) awards for 2011. These annual awards,presented by the Times Group, recognize and felicitate thecreative genius behind the best advertisements in the fieldof recruitment marketing.
Sustainability
Responsible corporate citizenship has been a part of our corevalues and sustainability has been the driving factor in many ofour initiatives. Today, the sustainability office runs a multi-layeredcorporate program to drive our sustainability vision. We partnerwith multiple stakeholders to form an inclusive working group tocreate policies, processes and other organizational measures.We believe that responsible investments in sustainability willgenerate long term value for all our stakeholders by improvingcompetitiveness and reducing risk.
The first sustainability report of the Company for the year endedJune 30, 2011 is being hosted on the Company’s website. Thisreport reflects the material issues, which have significanteconomic, environmental and social impacts that can
substantially influence the assessments or decisions of ourstakeholders. These are classified under the 4 Rs - ResponsibleBusiness, Rebalance Workplace, Renew Ecosystem and RepaySociety. A brief of the sustainability initiatives taken by theCompany during the year are given in the corporate governancesection of the annual report.
Talent Transformation and Intrapreneurship Development
(T2ID)
T2ID in your Company identifies and recognizes the need togroom and develop employees for developing the future leaders.T2ID has been marked with continuous endeavors to bring allthe elements of “Organizational Effectiveness” together. We arededicatedly focused on building Capability & Culture - the realsustainable pillars for the Company to stand on. Some of thekey initiatives taken during the year include:
EPIC (Employee Passion Indicative Count):EPIC (Employee Passion Indicative Count):EPIC (Employee Passion Indicative Count):EPIC (Employee Passion Indicative Count):EPIC (Employee Passion Indicative Count): EPIC is a year longinitiative which begins with identifying the Top Passion Driversof an individual through a self assessment. This year over 40,000employees participated in EPIC assessment.
HCL Scholar:HCL Scholar:HCL Scholar:HCL Scholar:HCL Scholar: HCL Scholar is an application which offers anonline certification for all employees across the organization. Itis a platform to assess an employee on his understanding aboutthe Company, the culture, business lines, industry sectors,Company's history, investors etc. It helps in promoting a cultureof continuous learning and capabilities building within theorganization and aims to empower the employees to presenttheir organization well in front of the outside world.
TOP GUN - Next generation Leadership developmentTOP GUN - Next generation Leadership developmentTOP GUN - Next generation Leadership developmentTOP GUN - Next generation Leadership developmentTOP GUN - Next generation Leadership developmentprogram:program:program:program:program: This Leadership Program builds the leadership pipelineof the Company by focusing on equipping the next generationof leaders with the Company's identified leadershipcompetencies in order to create World Class Leaders.
HCL- HARVARD Emerging Leaders Program:HCL- HARVARD Emerging Leaders Program:HCL- HARVARD Emerging Leaders Program:HCL- HARVARD Emerging Leaders Program:HCL- HARVARD Emerging Leaders Program: To groombusiness leaders and prepare them to drive strategic initiativesin a very dynamic business environment, your Company haslaunched Emerging Leaders Program which aims to create acapable and distinctive leadership culture. This is a 20-weekprogram with the focus on five critical areas of leadershipdevelopment.
iLearn:iLearn:iLearn:iLearn:iLearn: iLearn has been launched to seamless online registrationand tracking of instructor led training sessions (technical anddomain) and quick online feedback mechanism includingcollection, compilation and analysis.
EMPLOYEES FIRST, CUSTOMERS SECOND
An ideal work culture in today’s competitive environment is theone where employees have a sense of belongings and feel thattheir ideas/ decisions are respected and cared for. Since itsinception, the Company has placed a pronounced emphasis onorganizational culture. However, the biggest milestone in thepeoples' transformation story began in 2005 by adopting aunique and most innovative peoples' philosophy of EmployeesFirst, Customer Second (EFCS). As we believe that employeesbring strategic value to an organization and are critical to itssuccess in the global marketplace. We realized that customersbuy value from our employees who deliver services to them. Sothe maximum value is created at the customer-employeeinterface (we call it the value zone).
23
The EFCS philosophy is grounded, with a clear focus ondeveloping entrepreneurial mind-set, decentralizing decisionmaking and transferring the ownership of “change” to theemployee in the value zone. The employees can meaningfullycontribute to the success of the organization and customerdelight through their innovation, creativity and commitment todeliver. Employees First, come to life through 4 core values ofhonesty, transparency, accountability and empowerment. Inorder to strengthen these values, many initiatives have beenintroduced, some of them are:
1. Smart Service DeskSmart Service DeskSmart Service DeskSmart Service DeskSmart Service Desk where employees can raise SLA-boundtickets on any internal service provider, and only employees'can close these tickets, if satisfied. This brings a culture ofreverse accountability.
2. 360 Degree feedback360 Degree feedback360 Degree feedback360 Degree feedback360 Degree feedback aims to build an organization culturethat fosters the spirit of collaboration and partnership.Manager can receive feedback from everyone who falls underhis/her span of influence rather than the span of control. Thisgives every manager an opportunity to exhibit complete Trustand Transparency. It also inverts the pyramid and makesthe employees a part of the development journey.
3. EPIC-Employee Passion Indicative CountEPIC-Employee Passion Indicative CountEPIC-Employee Passion Indicative CountEPIC-Employee Passion Indicative CountEPIC-Employee Passion Indicative Count is a selfassessment tool, facilitating each employee to identify his/her passion drivers so that they can utilize them to enhancetheir individual productivity and results.
4. Directions-Directions-Directions-Directions-Directions- A Direction is an annual event where CEO andsenior leadership conducts a face-to-face meeting with allthe employees to discuss the Company's strategy anddirection. This event allows each employee to speak the samelanguage and hence, with the information shared, theemployee is empowered to understand how his/her individualcontribution is enabling the Company.
5. U&IU&IU&IU&IU&I is an online blog and discussion forum run by the CEO.Each employee gets an opportunity to raise issues, sharethoughts and ideas as well as debate directly with the CEO.Discussions take place on an open and transparent platformwhere the questions, concerns and comments of employeesand their responses are visible to everyone.
6. Value PortalValue PortalValue PortalValue PortalValue Portal is a platform where employees working on aparticular project can give ideas and suggestions to enhancevalue delivered to the customer. This platform promotesinnovation and intrapreneurship amongst the employees andpersuades them to think out of the box, thereby, indulgingthem in more proactive and lateral thinking.
CONSERVATION OF ENERGY, RESEARCH AND
DEVELOPMENT, TECHNOLOGY ABSORPTION, FOREIGN
EXCHANGE EARNINGS AND OUTGO
Disclosures of particulars as required by the Companies(Disclosure of Particulars in the Report of Board of Directors)Rules, 1988, are set out in the Annexure 1 included in this Report.
DIRECTORS' RESPONSIBILITY STATEMENT
A statement of responsibility of the Directors relating tocompliance with the financial accounting and reportingrequirements in respect of the financial statements, as specifiedunder section 217(2AA) of the Companies Act, 1956 inserted bythe Companies (Amendment) Act, 2000, is annexed as Annexure2 to this Report.
STOCK OPTIONS PLANS
1999 Stock Option Plan / 2000 Stock Option Plan / 20041999 Stock Option Plan / 2000 Stock Option Plan / 20041999 Stock Option Plan / 2000 Stock Option Plan / 20041999 Stock Option Plan / 2000 Stock Option Plan / 20041999 Stock Option Plan / 2000 Stock Option Plan / 2004Stock Option PlanStock Option PlanStock Option PlanStock Option PlanStock Option Plan
The details of these plans have been annexed as Annexure 3 tothis report.
DISCLOSURES UNDER SECTION 217 OF THE
COMPANIES ACT, 1956
Except, as disclosed elsewhere in the report, there have beenno material changes and commitments, which can affect thefinancial position of the Company between the end of the financialyear and the date of this report.
As required under section 217(2A) of the Companies Act, 1956,read with the Companies (Particulars of Employees) Rules, 1975,as amended, the names and other particulars of employees areset out in the Annexure 4 included in this Report.
ACKNOWLEDGEMENTS
The Board wishes to place on record its appreciation to thecontribution made by the employees of the Company and itssubsidiaries during the year under review. The Company hasachieved impressive growth through the competence, hard work,solidarity, cooperation and support of employees at all levels.Your Directors thank the customers, clients, vendors and otherbusiness associates for their continued support in the Company'sgrowth. The Directors also wish to thank the GovernmentAuthorities, Financial Institutions and Shareholders for theircooperation and assistance extended to the Company.
For and on behalf of the Board of DirectorsFor and on behalf of the Board of DirectorsFor and on behalf of the Board of DirectorsFor and on behalf of the Board of DirectorsFor and on behalf of the Board of Directors
Noida (U.P.), India SHIV NADARSHIV NADARSHIV NADARSHIV NADARSHIV NADARJuly 27, 2011 Chairman and Chief Strategy Officer
24
ANNEXURE 1 TO THE DIRECTORS’ REPORT
a) Conservation of Energy
(i) Building Infrastructure:
The Go Green Transformation Initiative launched in 2008has ensured a transformational effect on our universe’s ecofootprints. This is a voluntary initiative combined withcorporate action, and targets the reduction of Green HouseGas (GHG) emissions and carbon foot prints.
Your Company has engaged a consultant for measuring thecarbon foot prints consumption and for LEED certificationunder USGBC LEED: EB: O&M rating system for its campusbuilding. The recommendation is being implemented toachieve the LEED certification status. All buildings underconstruction are as per green building principles and havebeen optimized for energy performance and occupantcomfort. Your Company has also received a star rating forour energy efficient buildings by the Bureau of EnergyEfficiency.
Our Energy Efficiency drive includes:
• Energy efficient lighting - We have installed newgeneration lightings in all / 100% of owned buildings inIndia.
• 2 facilities in Noida and one facility in Chennai havereceived BEE star rating.
• 3 Facilities in Bangalore and 2 facilities in Noida werecertified for ISO 14001 and OSHAS 18001.
• On the event of Earth Hour 2011, the Green Warriors(Employee Network) partnered with WWF to raise theawareness among the employees of the Company onenvironment issues. More than 2500 employeespledged to shut down their lights for one hour acrossthe globe. 90% of India based facilities turned to minimallighting which resulted in savings up to 1700 units ofenergy.
(ii) IT Infrastructure:
Your Company has taken various steps to build a Greenenterprise internally, as well as developed variousframeworks that help its customers to achieve an ideal GreenIT state. Over the past couple of years we have reduced ourserver footprints owing to a massive internal IT optimizationand rationalization exercise that dramatically reduced ourDatacenter carbon footprint.
The plan is guided by the “GreenEdge” Data centerframework. This framework comprises deployment of anintegrated approach involving technology, facility and ITmanagement, which can help to reduce the carbon footprintby 20-25%.
(iii) Carbon Footprint measurement
Your Company has formed a Green Council to address theresponse to Global Warming. The first decision of the councilhas been to start publishing annual Green House Gas(Carbon) emissions reports, starting from the year 2008-09.The measurement is being done by using Company's
developed Carbon accounting framework, ManageCarbon.
Manage Carbon, an IT solution around GHG Protocol forcorporate standard, was developed and deployed formeasuring and reporting carbon emissions. Thetechnologies used in the solution are primarily open-sourcetechnologies to keep a low cost footprint. It integrates withvarious other enterprise applications containing electricitydata, travel data, fuel data etc., using multiple approachesranging from database level integration to web servicesbased integration (both push and pull modes), in addition toproviding options for direct entry of information. This toolhas been successfully piloted internally at the Company andhas helped the Company to monitor and report on carbonemissions.
b) Research and Development ("R & D")
(i) Specific areas in which R&D was carried out
Your Company is one of the few Indian Companieswith significant focus on engineering services. TheEngineering, Research and Development Servicesgroup offers end-to-end engineering services andsolutions in hardware, embedded, mechanical andsoftware product engineering to industry leadersacross aerospace and defence, automotive, consumerelectronics, industrial manufacturing, medical devices,networking and telecom, office automation,semiconductor, servers, storage and softwareproducts.
Your Company understands the importance of R&D inaugmenting its customers’ businesses and is committedto providing these world-class services to them. Over adecade of operating in complex multi-vendorenvironments and customer value chains, we have theability to seamlessly integrate into their existing R&Decosystem, working with other innovation partners,captive centers, universities, industry bodies andmanufacturing partners. The Company has started abusiness unit with a dedicated team to focus onDefence, Space and Security. It has also developed theBusiness Aligned Test Framework to specificallyaddress the industry need for a standard and cost-effective approach to testing and verification activitiesin hardware, software, mechanical, system safetyassessment, test engineering, prototyping, designassurance and new product realization.
Your Company foresees a shift towards clientspreferring outsourcing companies to share their long-term vision, risks, and rewards in developing product-based ecosystems that impact client-experience.Towards this, your Company is investing heavily indeveloping its own IPs and solutions to help customers'impact the overall product ecosystem faster and better.Solutions include a unified communication platform, aremote diagnostic reusable module, telematics and testplatforms in multiple verticals.
Particulars pursuant to the Companies (Disclosure of Particulars in the Report of Board of Directors) Rules, 1988
25
(ii) Benefits derived as a result of above R&D
Your Company’s solutions and frameworks are focusedin creating value to customers in specific micro verticals.The direct benefits to our customers include quickertime to market, reduced cost, increased quality andincreased efficiency of customer business processes.Our solutions like Business Aligned IT will result inenhanced business performance through improvedKPIs, visibility, discovered landscape, stability, costreduction and structured business future planning.
(iii) Future plan of action
Your Company will continue to focus on R&D activitiesand will make investments therein from time to time.
(iv) Expenditure on R&D for the years ended June 30, 2011
and 2010 are as follows:
(` in crores)
Particulars June 30, June 30,
2011 2010
Revenue expenditure 93.16 40.53Capital expenditure - -Total R&D expenditure 93.1693.1693.1693.1693.16 40.5340.5340.5340.5340.53R&D expenditure as a percentage 1.37%1.37%1.37%1.37%1.37% 0.80%0.80%0.80%0.80%0.80%of revenues
c) Technology absorption, adaptation and innovation
Your Company’s core businesses demand absorption ofemerging technologies to stay at the cutting edge oftechnology. New methods for absorbing, adapting andeffectively deploying new technologies have beendeveloped. Your Company has made investments inapplications and other software tools required forengineering design work in all its Software DevelopmentCenters.
d) Foreign exchange earnings and outgo
Your Company is an export-oriented unit and the majorityof the Information Technology (IT) services and BusinessProcess Outsourcing (BPO) services by the Company arefor clients outside India.
Activities relating to exports, initiatives taken to increase
the exports, development of new export markets for
products and services and export plans-
During the year, a substantial portion of the revenue of theCompany was derived from the exports. During the year,your Company has set up subsidiaries in South Africa,France, Spain, Saudi Arabia, Philippines and Indonesia toenhance its business. The various global offices of theCompany are staffed with sales and marketing specialists,who promote and sell services to large international clients.
The foreign exchange earned and spent by the Companyduring the year under review is as follows:
(` in crores)
Particulars June 30, June 30,
2011 2010
Foreign exchange earningsForeign exchange earningsForeign exchange earningsForeign exchange earningsForeign exchange earnings 5,056.955,056.955,056.955,056.955,056.95 4,968.244,968.244,968.244,968.244,968.24Foreign exchange outgoForeign exchange outgoForeign exchange outgoForeign exchange outgoForeign exchange outgo- Expenditure in foreign currency 598.13 688.50- CIF value of imports 193.06 114.91- Dividend remitted in foreign currency 78.51 48.58
869.70869.70869.70869.70869.70 851.99 851.99 851.99 851.99 851.99
For and on behalf of the Board of DirectorsFor and on behalf of the Board of DirectorsFor and on behalf of the Board of DirectorsFor and on behalf of the Board of DirectorsFor and on behalf of the Board of Directors
Noida (U.P.), India SHIV NADARSHIV NADARSHIV NADARSHIV NADARSHIV NADARJuly 27, 2011 Chairman and Chief Strategy Officer
Directors' Responsibility Statement as required under Section 217(2AA) of the Companies Act, 1956 as inserted by the Companies
(Amendment) Act, 2000
i) The financial statements have been prepared in accordancewith the accounting standards issued by the Institute ofChartered Accountants of India and the requirements of theCompanies Act, 1956, to the extent applicable to theCompany. There have been no material departures fromprescribed accounting standards while preparing thesefinancial statements;
ii) The Board of Directors has selected the accounting policiesdescribed in the notes to the accounts, which have beenconsistently applied, except where otherwise stated. Theestimates and judgments relating to the financial statementshave been made on a prudent basis, in order that the financialstatements reflect in a true and fair manner, the state ofaffairs of the Company as at June 30, 2011 and the profit ofthe Company for the year ended on that date;
iii) The Board of Directors has taken proper and sufficient carefor the maintenance of adequate accounting records inaccordance with the provisions of the Companies Act, 1956for safeguarding the assets of the Company and forpreventing and detecting fraud and other irregularities;
iv) The annual accounts have been prepared on the historicalcost convention, as a going concern and on the accrualbasis.
For and on behalf of the Board of DirectorsFor and on behalf of the Board of DirectorsFor and on behalf of the Board of DirectorsFor and on behalf of the Board of DirectorsFor and on behalf of the Board of Directors
Noida (U.P.), India SHIV NADARSHIV NADARSHIV NADARSHIV NADARSHIV NADARJuly 27, 2011 Chairman and Chief Strategy Officer
ANNEXURE 2 TO THE DIRECTORS’ REPORT
26
ANNEXURE – 3 TO THE DIRECTORS’ REPORT
DETAILS ON STOCK OPTION PLANS
1999 Stock Option Plan / 2000 Stock Option Plan / 2004 Stock Option Plan
Pursuant to the approval of the shareholders, your Company had instituted the 1999 Stock Option Plan (“1999 Plan”), 2000 StockOption Plan (“2000 Plan”) and 2004 Stock Option Plan (“2004 Plan”) for all eligible employees of the Company and its subsidiaries.The 1999 Plan, 2000 Plan and 2004 Plan are administered by the Compensation Committee of the Board and provide for the issuanceof 20,000,000; 15,000,000 and 20,000,000 options, respectively.
Each option granted under the 1999 Plan, 2000 Plan and 2004 Plan, entitles the holder to four equity shares of the company at anexercise price, which is approved by the Compensation Committee.
The details of the options granted under the 1999, 2000 and 2004 Plans are given below:
S. Description 1999 Plan 2000 Plan 2004 Plan
No.
1 Total number of options granted (gross) 26,600,874 17,747,401 7,910,172
2 The pricing formula Market price / Market price Market price / priceinternal valuation determined by
Compensation Committee
3 Number of options vested 17,531,472 10,467,938 3,975,355
4 Number of options exercised 13,302,306 6,306,176 3,127,850
5 Total number of shares arising as a result of exercise 53,209,224 25,224,704 12,511,400of options
6 Number of options lapsed 12,552,621 9,956,565 853,647
7 Variation in terms of options None None None
8 Money realized by exercise of options (` crores) 474.26 362.00 8.82
9 Total number of options in force as on June 30, 2011Total number of options in force as on June 30, 2011Total number of options in force as on June 30, 2011Total number of options in force as on June 30, 2011Total number of options in force as on June 30, 2011 745,947745,947745,947745,947745,947 1,484,6591,484,6591,484,6591,484,6591,484,659 3,928,6753,928,6753,928,6753,928,6753,928,675
10 Grant to Senior Management
Number of Options 1,967,175 254,904 2,980,800
Vesting Period 3-7 years 2-7 years 1.20 - 7.96 Years
The diluted earnings per share were ` 17.18 and ` 15.33 for the fiscal years ended June 30, 2011 and 2010 respectively.
HCL TECHNOLOGIES LIMITED EMPLOYEES TRUST
In April 2001, HCL Technologies Limited Employees Trust (“Trust”) was formed for the purpose of acquiring the shares of the Companyand thereby providing such shares to the eligible employees and directors of the Company and/or its subsidiaries at any timepursuant to the Stock Option Plans of the Company. The Company would provide this Trust interest free loan(s) from time to time upto a limit of ` 150 crores for this purpose.
As on June 30, 2011, an amount of ` 6.52 crores is outstanding as loan from the Company and Nil shares of the Company are heldby the trust. The Company has made provision of ` 6.52 crores against the same.
27
Particulars 1999 Plan 2000 Plan 2004 Plan
Total number of options outstanding as on July 1, 2010 1,522,8571,522,8571,522,8571,522,8571,522,857 2,351,1802,351,1802,351,1802,351,1802,351,180 2,079,1122,079,1122,079,1122,079,1122,079,112Number of options granted during the year - - 3,194,000
Pricing formula Market price / Market price Market price /internal valuation price determined
by CompensationCommittee
Number options vested during the year - - 1,352,877Number of options exercised during the year 517,161 727,283 1,231,734Total number of shares arising as a result of exercise of options during the year 2,068,644 2,909,132 4,926,936Number of options lapsed during the year 259,749 139,238 112,703Variation in terms of options None None NoneMoney realised by exercise of options during the year (` crores)(includes issued through Trust) 40.26 47.67 2.63
Total number of options in force as on June 30, 2011Total number of options in force as on June 30, 2011Total number of options in force as on June 30, 2011Total number of options in force as on June 30, 2011Total number of options in force as on June 30, 2011 745,947745,947745,947745,947745,947 1,484,6591,484,6591,484,6591,484,6591,484,659 3,928,6753,928,6753,928,6753,928,6753,928,675
Employees granted options equal to 5% or more of the total number of optionsgranted during the year None None 1,442,000
Employees granted options equal to or exceeding 1% of the issued capitalduring the year None None None
Fair value compensation cost for options granted (` crores) N.A. N.A. 418.30Weighted average exercise price of options granted above market price N.A. N.A. N.A.Weighted average fair value of options granted above market price N.A. N.A. N.A.Weighted average exercise price of options granted at market price N.A. N.A. N.A.Weighted average fair value of options granted at market price N.A. N.A. N.A.Weighted average exercise price of options granted below market price (`) N.A. N.A. 8.00Weighted average fair value of options granted below market price (`) N.A. N.A. 1,309.65
Method and significant assumptions used during the year to estimate theMethod and significant assumptions used during the year to estimate theMethod and significant assumptions used during the year to estimate theMethod and significant assumptions used during the year to estimate theMethod and significant assumptions used during the year to estimate thefair values of optionsfair values of optionsfair values of optionsfair values of optionsfair values of options
MethodMethodMethodMethodMethod Black scholes Black scholes Black scholes
Significant assumptionsSignificant assumptionsSignificant assumptionsSignificant assumptionsSignificant assumptionsRisk free interest rate 7.78% 7.78% 7.78%Expected life upto 46 months upto 46 months upto 46 monthsExpected Volatility 40.93% 40.93% 40.93%Expected Dividend 2.25% 2.25% 2.25%The price of the underlying options in market at the time of grant (`) N.A. N.A. N.A.
ANNEXURE – 3 TO THE DIRECTORS’ REPORT (Contd.)
Details of Stock Option Plans for the year ended June 30, 2011
Pre IPO Details of Stock Option Plan
As on June 30, 2011
Particulars ESOP 1999 Plan
Number of options granted pre IPO 14,223,832Pricing formula Internal valuationNumber of options vested 11,648,957Number of options exercised 10,234,702Total number of shares arising as a result of exercise of options 40,938,808Number of options lapsed 3,989,130Variation in terms of options NoneMoney realised by exercise of options (` crores) 259.41
Total number of options in force as on June 30, 2011Total number of options in force as on June 30, 2011Total number of options in force as on June 30, 2011Total number of options in force as on June 30, 2011Total number of options in force as on June 30, 2011 -
Fair value compensation cost for options granted (` crores) 43.96Weighted average exercise price of options granted (`) 255.00Weighted average fair value of options granted (`) 36.65
Method used to estimate the fair values of options Black-Scholes Method
Significant assumptionsSignificant assumptionsSignificant assumptionsSignificant assumptionsSignificant assumptionsRisk free interest rate 10.00%Expected life 12 to 110 monthsExpected volatility -Expected dividends 0.10%
28
ANNEXURE – 3 TO THE DIRECTORS’ REPORT (Contd.)
Employees Compensation Cost based on fair value of the options
Year ended30 June, 2011
(` crores)Net income, as reported 1,198.281,198.281,198.281,198.281,198.28Add: Stock-based employee compensation expense included in reported net income 133.22Deduct: Total stock-based employee compensation expense determined under fair value based method for all awards 128.09Proforma net incomeProforma net incomeProforma net incomeProforma net incomeProforma net income 1,203.411,203.411,203.411,203.411,203.41Earnings per share `
As reported - Basic 17.53- Diluted 17.18
Adjusted proforma - Basic 17.61- Diluted 17.26
Method used to estimate the fair values of optionsMethod used to estimate the fair values of optionsMethod used to estimate the fair values of optionsMethod used to estimate the fair values of optionsMethod used to estimate the fair values of options Black-Scholes Method
Significant assumptionsSignificant assumptionsSignificant assumptionsSignificant assumptionsSignificant assumptionsDividend yield % 1.52%Expected life upto 46 monthsRisk free interest rates 7.78%Volatility 40.93%
For and on behalf of the Board of Directors
Noida (U.P.), India SHIV NADARSHIV NADARSHIV NADARSHIV NADARSHIV NADARJuly 27, 2011 Chairman and Chief Strategy Officer
Details of options granted to Senior Managerial Personnel of the Company during the year ended June 30, 2011Details of options granted to Senior Managerial Personnel of the Company during the year ended June 30, 2011Details of options granted to Senior Managerial Personnel of the Company during the year ended June 30, 2011Details of options granted to Senior Managerial Personnel of the Company during the year ended June 30, 2011Details of options granted to Senior Managerial Personnel of the Company during the year ended June 30, 2011
Name of EmployeeName of EmployeeName of EmployeeName of EmployeeName of Employee Date of GrantDate of GrantDate of GrantDate of GrantDate of Grant No. of OptionsNo. of OptionsNo. of OptionsNo. of OptionsNo. of OptionsAnant Gupta 28-Jul-10 32,000Anil Chanana 28-Jul-10 11,200Dilip Srivastava 28-Jul-10 8,000Gade Rao 28-Jul-10 11,200Premkumar Seshadri 28-Jul-10 16,000Rahul Singh 28-Jul-10 32,000Rajiv Sodhi 28-Jul-10 11,200Sanjeev Nikore 28-Jul-10 16,000Saurav Adhikari 28-Jul-10 8,000Sriram Vaitheeswarankovil 28-Jul-10 11,200Stephen Cardell 28-Jul-10 192,000Vineet Nayar 19-Oct-10 1,250,000Virender Agarwal 28-Jul-10 16,000
1,614,800 1,614,800 1,614,800 1,614,800 1,614,800
Details of options granted to employees amounting to 5% or more of the options granted during the year endedDetails of options granted to employees amounting to 5% or more of the options granted during the year endedDetails of options granted to employees amounting to 5% or more of the options granted during the year endedDetails of options granted to employees amounting to 5% or more of the options granted during the year endedDetails of options granted to employees amounting to 5% or more of the options granted during the year endedJune 30, 2011June 30, 2011June 30, 2011June 30, 2011June 30, 2011
Name of EmployeeName of EmployeeName of EmployeeName of EmployeeName of Employee Date of GrantDate of GrantDate of GrantDate of GrantDate of Grant No. of OptionsNo. of OptionsNo. of OptionsNo. of OptionsNo. of Options
Stephen Cardell 28-Jul-10 192,000
Vineet Nayar 19-Oct-10 1,250,000
Details of options granted to employees during the year ended June 30, 2011, amounting to 1% or more of the issuedDetails of options granted to employees during the year ended June 30, 2011, amounting to 1% or more of the issuedDetails of options granted to employees during the year ended June 30, 2011, amounting to 1% or more of the issuedDetails of options granted to employees during the year ended June 30, 2011, amounting to 1% or more of the issuedDetails of options granted to employees during the year ended June 30, 2011, amounting to 1% or more of the issuedcapital of the company at the time of the grantcapital of the company at the time of the grantcapital of the company at the time of the grantcapital of the company at the time of the grantcapital of the company at the time of the grant
NoneNoneNoneNoneNone
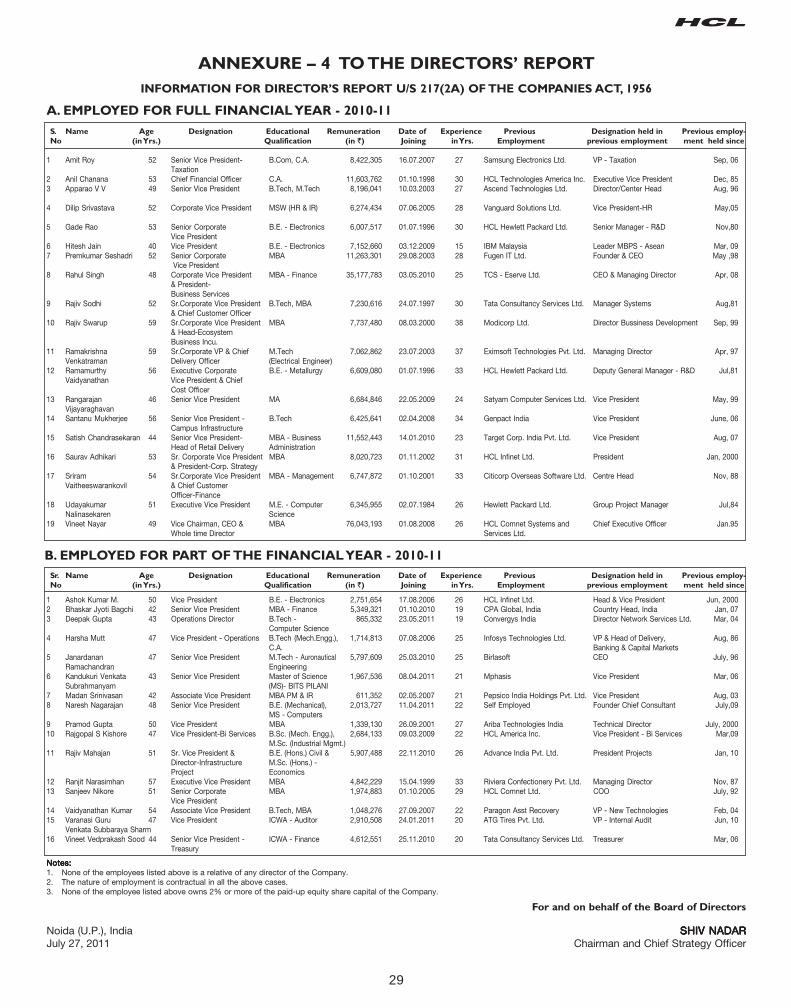
29
S. Name Age Designation Educational Remuneration Date of Experience Previous Designation held in Previous employ-
No (in Yrs.) Qualification (in `) Joining in Yrs. Employment previous employment ment held since
1 Amit Roy 52 Senior Vice President- B.Com, C.A. 8,422,305 16.07.2007 27 Samsung Electronics Ltd. VP - Taxation Sep, 06Taxation
2 Anil Chanana 53 Chief Financial Officer C.A. 11,603,762 01.10.1998 30 HCL Technologies America Inc. Executive Vice President Dec, 853 Apparao V V 49 Senior Vice President B.Tech, M.Tech 8,196,041 10.03.2003 27 Ascend Technologies Ltd. Director/Center Head Aug, 96
4 Dilip Srivastava 52 Corporate Vice President MSW (HR & IR) 6,274,434 07.06.2005 28 Vanguard Solutions Ltd. Vice President-HR May,05
5 Gade Rao 53 Senior Corporate B.E. - Electronics 6,007,517 01.07.1996 30 HCL Hewlett Packard Ltd. Senior Manager - R&D Nov,80Vice President
6 Hitesh Jain 40 Vice President B.E. - Electronics 7,152,660 03.12.2009 15 IBM Malaysia Leader MBPS - Asean Mar, 097 Premkumar Seshadri 52 Senior Corporate MBA 11,263,301 29.08.2003 28 Fugen IT Ltd. Founder & CEO May ,98
Vice President8 Rahul Singh 48 Corporate Vice President MBA - Finance 35,177,783 03.05.2010 25 TCS - Eserve Ltd. CEO & Managing Director Apr, 08
& President-Business Services
9 Rajiv Sodhi 52 Sr.Corporate Vice President B.Tech, MBA 7,230,616 24.07.1997 30 Tata Consultancy Services Ltd. Manager Systems Aug,81& Chief Customer Officer
10 Rajiv Swarup 59 Sr.Corporate Vice President MBA 7,737,480 08.03.2000 38 Modicorp Ltd. Director Bussiness Development Sep, 99& Head-EcosystemBusiness Incu.
11 Ramakrishna 59 Sr.Corporate VP & Chief M.Tech 7,062,862 23.07.2003 37 Eximsoft Technologies Pvt. Ltd. Managing Director Apr, 97Venkatraman Delivery Officer (Electrical Engineer)
12 Ramamurthy 56 Executive Corporate B.E. - Metallurgy 6,609,080 01.07.1996 33 HCL Hewlett Packard Ltd. Deputy General Manager - R&D Jul,81Vaidyanathan Vice President & Chief
Cost Officer13 Rangarajan 46 Senior Vice President MA 6,684,846 22.05.2009 24 Satyam Computer Services Ltd. Vice President May, 99
Vijayaraghavan14 Santanu Mukherjee 56 Senior Vice President - B.Tech 6,425,641 02.04.2008 34 Genpact India Vice President June, 06
Campus Infrastructure15 Satish Chandrasekaran 44 Senior Vice President- MBA - Business 11,552,443 14.01.2010 23 Target Corp. India Pvt. Ltd. Vice President Aug, 07
Head of Retail Delivery Administration16 Saurav Adhikari 53 Sr. Corporate Vice President MBA 8,020,723 01.11.2002 31 HCL Infinet Ltd. President Jan, 2000
& President-Corp. Strategy17 Sriram 54 Sr.Corporate Vice President MBA - Management 6,747,872 01.10.2001 33 Citicorp Overseas Software Ltd. Centre Head Nov, 88
Vaitheeswarankovil & Chief CustomerOfficer-Finance
18 Udayakumar 51 Executive Vice President M.E. - Computer 6,345,955 02.07.1984 26 Hewlett Packard Ltd. Group Project Manager Jul,84Nalinasekaren Science
19 Vineet Nayar 49 Vice Chairman, CEO & MBA 76,043,193 01.08.2008 26 HCL Comnet Systems and Chief Executive Officer Jan.95Whole time Director Services Ltd.
ANNEXURE – 4 TO THE DIRECTORS’ REPORT
INFORMATION FOR DIRECTOR’S REPORT U/S 217(2A) OF THE COMPANIES ACT, 1956
A. EMPLOYED FOR FULL FINANCIAL YEAR - 2010-11
Sr. Name Age Designation Educational Remuneration Date of Experience Previous Designation held in Previous employ-
No (in Yrs.) Qualification (in `) Joining in Yrs. Employment previous employment ment held since
1 Ashok Kumar M. 50 Vice President B.E. - Electronics 2,751,654 17.08.2006 26 HCL Infinet Ltd. Head & Vice President Jun, 20002 Bhaskar Jyoti Bagchi 42 Senior Vice President MBA - Finance 5,349,321 01.10.2010 19 CPA Global, India Country Head, India Jan, 073 Deepak Gupta 43 Operations Director B.Tech - 865,332 23.05.2011 19 Convergys India Director Network Services Ltd. Mar, 04
Computer Science4 Harsha Mutt 47 Vice President - Operations B.Tech (Mech.Engg.), 1,714,813 07.08.2006 25 Infosys Technologies Ltd. VP & Head of Delivery, Aug, 86
C.A. Banking & Capital Markets5 Janardanan 47 Senior Vice President M.Tech - Auronautical 5,797,609 25.03.2010 25 Birlasoft CEO July, 96
Ramachandran Engineering6 Kandukuri Venkata 43 Senior Vice President Master of Science 1,967,536 08.04.2011 21 Mphasis Vice President Mar, 06
Subrahmanyam (MS)- BITS PILANI7 Madan Srinivasan 42 Associate Vice President MBA PM & IR 611,352 02.05.2007 21 Pepsico India Holdings Pvt. Ltd. Vice President Aug, 038 Naresh Nagarajan 48 Senior Vice President B.E. (Mechanical), 2,013,727 11.04.2011 22 Self Employed Founder Chief Consultant July,09
MS - Computers9 Pramod Gupta 50 Vice President MBA 1,339,130 26.09.2001 27 Ariba Technologies India Technical Director July, 200010 Rajgopal S Kishore 47 Vice President-Bi Services B.Sc. (Mech. Engg.), 2,684,133 09.03.2009 22 HCL America Inc. Vice President - Bi Services Mar,09
M.Sc. (Industrial Mgmt.)11 Rajiv Mahajan 51 Sr. Vice President & B.E. (Hons.) Civil & 5,907,488 22.11.2010 26 Advance India Pvt. Ltd. President Projects Jan, 10
Director-Infrastructure M.Sc. (Hons.) -Project Economics
12 Ranjit Narasimhan 57 Executive Vice President MBA 4,842,229 15.04.1999 33 Riviera Confectionery Pvt. Ltd. Managing Director Nov, 8713 Sanjeev Nikore 51 Senior Corporate MBA 1,974,883 01.10.2005 29 HCL Comnet Ltd. COO July, 92
Vice President14 Vaidyanathan Kumar 54 Associate Vice President B.Tech, MBA 1,048,276 27.09.2007 22 Paragon Asst Recovery VP - New Technologies Feb, 0415 Varanasi Guru 47 Vice President ICWA - Auditor 2,910,508 24.01.2011 20 ATG Tires Pvt. Ltd. VP - Internal Audit Jun, 10
Venkata Subbaraya Sharm16 Vineet Vedprakash Sood 44 Senior Vice President - ICWA - Finance 4,612,551 25.11.2010 20 Tata Consultancy Services Ltd. Treasurer Mar, 06
Treasury
B. EMPLOYED FOR PART OF THE FINANCIAL YEAR - 2010-11
For and on behalf of the Board of Directors
Noida (U.P.), India SHIV NADARSHIV NADARSHIV NADARSHIV NADARSHIV NADARJuly 27, 2011 Chairman and Chief Strategy Officer
Notes:Notes:Notes:Notes:Notes:1. None of the employees listed above is a relative of any director of the Company.2. The nature of employment is contractual in all the above cases.3. None of the employee listed above owns 2% or more of the paid-up equity share capital of the Company.
30
Good governance facilitates efficient, effective andentrepreneurial management that can deliver stakeholders valueover the longer term. It is about commitment to values and ethicalbusiness conduct. It is a set of laws, regulations, processes andcustoms affecting the way a Company is directed, administrated,controlled or managed.
Good corporate governance underpins the success and integrityof the organization, institutions and markets. It is one of theessential pillars for building efficient and sustainable environment.
Corporate Governance is based on the principles of integrity,fairness, equity, transparency, accountability and commitmentto values. Good governance practices stem from the cultureand mindset of the organization. As stakeholders across theglobe evince keen interest in the practices and performance ofcompanies, corporate governance has emerged on the centrestage. The Company considers the maintenance of fair andtransparent corporate governance to be one of its most importantmanagement issues, and enhance its organizational systemsand structures accordingly. Some of the important best practicesof corporate governance framework are timely and accuratedisclosure of information regarding the financial situation,performance, ownership and governance of the Company.
Our Company is not only in compliance with the requirementsof the revised guidelines on corporate governance stipulatedunder Clause 49 of the Listing Agreements with the StockExchanges but is also consistently working for the bettermentof the governance system. The highlights of the corporategovernance system include:
• The Board of the Company is well-represented with a fairrepresentation of executive, non-executive andindependent directors, with 77.78% of the Board being theindependent directors.
• The Board has constituted several Committees viz. AuditCommittee, Compensation Committee, Shareholders'Committee, Risk Management Committee, NominationsCommittee, Finance Committee and Employees StockOptions Allotment Committee for more focused attention.
• The Company has established a Code of Conduct and Codeof Conduct for Prevention of Insider Trading for Directorsand employees of the Company.
• The Company has established a Whistle-blower policy tohave direct one on one access to the Chief Executive Officerof the Company.
• The Company has an exhaustive and unique system ofinternal controls which provides a reasonable assurance inrespect of providing accurate financial and operationalinformation, ensuring compliance with applicable statuesand safeguarding the assets of the Company.
• Robust Risk Management framework for identifying variousrisks, assessing their probability as well as likely impactand finalizing risk minimization plans and updating all theinformation to the Audit Committee of the Company onquarterly basis.
• Regular communication with the shareholders, prompt
resolution of their grievances and providing all the relevantinformation, releases and reports in a timely manner.
Our disclosures always seek to attain the best practices incorporate governance. Our actions are governed by our valuesand principles, which are reinforced at all levels within theCompany. We are committed to doing things the right way whichmeans taking business decisions and acting in a way that isethical and is in the compliance with the applicable legalrequirements. We acknowledge our individual and collectiveresponsibilities to manage our business activities with integrity.
Philosophy on Code of GovernancePhilosophy on Code of GovernancePhilosophy on Code of GovernancePhilosophy on Code of GovernancePhilosophy on Code of Governance
Our Corporate Governance philosophy is based on the followingprinciples:
• Satisfy the spirit of the law and not just the letter of the law.Corporate Governance standards should go beyond thelaw.
• Be transparent and maintain a high degree of disclosurelevels. When in doubt, disclose it.
• Make a clear distinction between personal convenience andcorporate resources.
• Communicate externally, in a truthful manner, about howthe Company is run internally.
• Have a simple and transparent corporate structure drivensolely by business needs.
• Comply with the laws in all the countries in which weoperate.
• Management is the trustee of the shareholders’ capital andnot the owner.
Corporate Governance is an integral part of the philosophy ofthe Company in its pursuit of excellence, growth and valuecreation. In addition to complying with the statutoryrequirements, effective governance systems and practicestowards improving transparency, disclosures, internal controland promotion of ethics at work place have beeninstitutionalized. The Company recognizes that goodgovernance is a continuing exercise and reiterates itscommitment to pursue highest standards of corporategovernance in the overall interest of all its stakeholders.
Role of various entitiesRole of various entitiesRole of various entitiesRole of various entitiesRole of various entities
Board of Directors (“Board”) - Board of Directors (“Board”) - Board of Directors (“Board”) - Board of Directors (“Board”) - Board of Directors (“Board”) - The Board of Directorsdetermines the purpose and values of the Company. The primaryrole of the Board is that of trusteeship to protect and enhancestakeholders' value through strategic supervision of theCompany and its subsidiaries.
Our Company is headed by an effective Board that exercisesleadership, integrity and judgment in directing so as to achievecontinuing prosperity and to act in the best interest of theCompany. The Board plays a critical role in overseeing how themanagement serves the short and long term interests ofshareholders and other stakeholders. This is reflected in ourgovernance practices, under which we strive to maintain anactive, informed and independent Board. They ensure that the
CORPORATE GOVERNANCE REPORT 2010-11
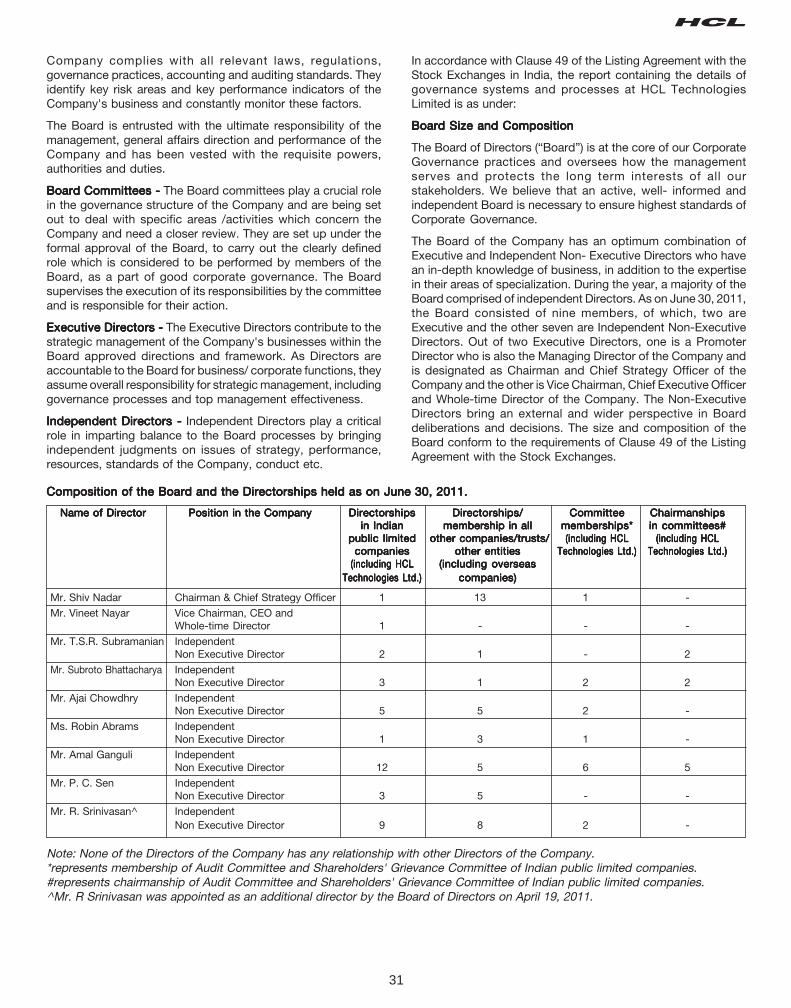
31
Company complies with all relevant laws, regulations,governance practices, accounting and auditing standards. Theyidentify key risk areas and key performance indicators of theCompany's business and constantly monitor these factors.
The Board is entrusted with the ultimate responsibility of themanagement, general affairs direction and performance of theCompany and has been vested with the requisite powers,authorities and duties.
Board Committees -Board Committees -Board Committees -Board Committees -Board Committees - The Board committees play a crucial rolein the governance structure of the Company and are being setout to deal with specific areas /activities which concern theCompany and need a closer review. They are set up under theformal approval of the Board, to carry out the clearly definedrole which is considered to be performed by members of theBoard, as a part of good corporate governance. The Boardsupervises the execution of its responsibilities by the committeeand is responsible for their action.
Executive Directors -Executive Directors -Executive Directors -Executive Directors -Executive Directors - The Executive Directors contribute to thestrategic management of the Company's businesses within theBoard approved directions and framework. As Directors areaccountable to the Board for business/ corporate functions, theyassume overall responsibility for strategic management, includinggovernance processes and top management effectiveness.
Independent Directors -Independent Directors -Independent Directors -Independent Directors -Independent Directors - Independent Directors play a criticalrole in imparting balance to the Board processes by bringingindependent judgments on issues of strategy, performance,resources, standards of the Company, conduct etc.
In accordance with Clause 49 of the Listing Agreement with theStock Exchanges in India, the report containing the details ofgovernance systems and processes at HCL TechnologiesLimited is as under:
Board Size and CompositionBoard Size and CompositionBoard Size and CompositionBoard Size and CompositionBoard Size and Composition
The Board of Directors (“Board”) is at the core of our CorporateGovernance practices and oversees how the managementserves and protects the long term interests of all ourstakeholders. We believe that an active, well- informed andindependent Board is necessary to ensure highest standards ofCorporate Governance.
The Board of the Company has an optimum combination ofExecutive and Independent Non- Executive Directors who havean in-depth knowledge of business, in addition to the expertisein their areas of specialization. During the year, a majority of theBoard comprised of independent Directors. As on June 30, 2011,the Board consisted of nine members, of which, two areExecutive and the other seven are Independent Non-ExecutiveDirectors. Out of two Executive Directors, one is a PromoterDirector who is also the Managing Director of the Company andis designated as Chairman and Chief Strategy Officer of theCompany and the other is Vice Chairman, Chief Executive Officerand Whole-time Director of the Company. The Non-ExecutiveDirectors bring an external and wider perspective in Boarddeliberations and decisions. The size and composition of theBoard conform to the requirements of Clause 49 of the ListingAgreement with the Stock Exchanges.
Composition of the Board and the Directorships held as on June 30, 2011.Composition of the Board and the Directorships held as on June 30, 2011.Composition of the Board and the Directorships held as on June 30, 2011.Composition of the Board and the Directorships held as on June 30, 2011.Composition of the Board and the Directorships held as on June 30, 2011.
Name of DirectorName of DirectorName of DirectorName of DirectorName of Director Position in the CompanyPosition in the CompanyPosition in the CompanyPosition in the CompanyPosition in the Company DirectorshipsDirectorshipsDirectorshipsDirectorshipsDirectorships Directorships/Directorships/Directorships/Directorships/Directorships/ CommitteeCommitteeCommitteeCommitteeCommittee ChairmanshipsChairmanshipsChairmanshipsChairmanshipsChairmanshipsin Indianin Indianin Indianin Indianin Indian membership in allmembership in allmembership in allmembership in allmembership in all memberships*memberships*memberships*memberships*memberships* in committees#in committees#in committees#in committees#in committees#
public limitedpublic limitedpublic limitedpublic limitedpublic limited other companies/trusts/ other companies/trusts/ other companies/trusts/ other companies/trusts/ other companies/trusts/ (including HCL(including HCL(including HCL(including HCL(including HCL (including HCL(including HCL(including HCL(including HCL(including HCLcompaniescompaniescompaniescompaniescompanies other entitiesother entitiesother entitiesother entitiesother entities Technologies Ltd.)Technologies Ltd.)Technologies Ltd.)Technologies Ltd.)Technologies Ltd.) Technologies Ltd.)Technologies Ltd.)Technologies Ltd.)Technologies Ltd.)Technologies Ltd.)
(including HCL(including HCL(including HCL(including HCL(including HCL (including overseas(including overseas(including overseas(including overseas(including overseasTechnologies Ltd.)Technologies Ltd.)Technologies Ltd.)Technologies Ltd.)Technologies Ltd.) companies)companies)companies)companies)companies)
Mr. Shiv Nadar Chairman & Chief Strategy Officer 1 13 1 -
Mr. Vineet Nayar Vice Chairman, CEO andWhole-time Director 1 - - -
Mr. T.S.R. Subramanian IndependentNon Executive Director 2 1 - 2
Mr. Subroto Bhattacharya IndependentNon Executive Director 3 1 2 2
Mr. Ajai Chowdhry IndependentNon Executive Director 5 5 2 -
Ms. Robin Abrams IndependentNon Executive Director 1 3 1 -
Mr. Amal Ganguli IndependentNon Executive Director 12 5 6 5
Mr. P. C. Sen IndependentNon Executive Director 3 5 - -
Mr. R. Srinivasan^ IndependentNon Executive Director 9 8 2 -
Note: None of the Directors of the Company has any relationship with other Directors of the Company.*represents membership of Audit Committee and Shareholders' Grievance Committee of Indian public limited companies.#represents chairmanship of Audit Committee and Shareholders' Grievance Committee of Indian public limited companies.^Mr. R Srinivasan was appointed as an additional director by the Board of Directors on April 19, 2011.
32
Brief Profile of the Board MembersBrief Profile of the Board MembersBrief Profile of the Board MembersBrief Profile of the Board MembersBrief Profile of the Board Members
Shiv NadarShiv NadarShiv NadarShiv NadarShiv Nadar
Mr. Shiv Nadar, aged 66 years, is an Electrical Engineer fromCoimbatore. Mr. Shiv Nadar established HCL as a startup in1976 Acknowledged as a visionary by the IT industry and hispeers, Mr. Shiv Nadar has often made daring forays based onhis conviction of the future. Albeit a more recent entrant in thesoftware services space, HCL is already among top Indian ITsoftware majors and a force to reckon with for global technologygiants.
Mr. Nadar was conferred the Padma Bhushan Award - thePadma Bhushan Award - thePadma Bhushan Award - thePadma Bhushan Award - thePadma Bhushan Award - thethird highest civilian honorthird highest civilian honorthird highest civilian honorthird highest civilian honorthird highest civilian honor conferred by the President of Indiain January 2008, in recognition of not just his contribution totrade & industry in India but also his deep commitment to publicgood. In February 2009, Forbes Magazine featured him in its listof 48 Heroes of Philanthropy in the Asia Pacific region. InSeptember 2009 the UK Trade & Investment India presentedShiv Nadar the 2009 Businessperson of the Year Award inacknowledgement of HCL's pioneering investment in the UK. InNovember 2009 he was conferred the CNBC Asia BusinessLeader Award for Corporate Social Responsibility, their AsiaViewers’ Choice Award and 'India Business Leader Award' forthe year. The University of Madras and IIT Kharagpur awardedhim an Honorary Doctorate Degree in Science for his outstandingcontribution to IT in India.
Determined to give back to the society that supported him,Mr. Nadar has been quietly supporting many significant socialcauses through the Shiv Nadar Foundation.Shiv Nadar Foundation.Shiv Nadar Foundation.Shiv Nadar Foundation.Shiv Nadar Foundation. The Foundationis committed to provide the means to empower individuals tobridge the socio-economic divide and to contribute to thecreation of a more equitable, meritocracy based society, andaims to achieve this primarily through outstanding educationalinstitutions of higher learning. It has established the not-for-profit SSN College of Engineering in Chennai, ranked amongIndia's top fifteen private engineering Colleges. TheFoundation is also running “VidyaGyan”“VidyaGyan”“VidyaGyan”“VidyaGyan”“VidyaGyan” school in UttarPradesh that provide free, world class education to ruraltoppers from economically disadvantaged backgrounds.Mr. Shiv Nadar is an active member of the Executive Boardof the Indian School of Business (ISB), Hyderabad. Concernedwith the public health issues in India, he is involved with thePublic Health Foundation of India (PHFI) - working to establishstandards in public health education and to create a networkof innovative world class India-relevant institutes of publichealth. The President of India appointed him the Chairman,Board of Governors, IIT Kharagpur. He is also very stronglysupports initiatives for the girl child and the empowerment ofwomen.
Nature of expertise in specific functional area- Mr. Shiv Nadarhas an extensive experience and expertise in the informationtechnology sector coupled with strategic planning andmanagement experience.
Mr. Shiv Nadar is a member of Finance Committee, andShareholders' Committee of the Company. He is also theChairman of the Nominations Committee and Employees StockOption Allotment Committee of the Company. As on June 30,2011, he is holding 184 equity shares of ` 2/- each fully paid-upin his own name.
Mr. Vineet NayarMr. Vineet NayarMr. Vineet NayarMr. Vineet NayarMr. Vineet Nayar
Mr. Vineet Nayar, aged 49 years, has a Bachelor's degree inTechnology and a Masters degree in Business Administration.Mr. Vineet Nayar joined HCL in 1985. After spending about sevenyears of his career as engineer, product manager, sales andmarketing head at HCL, he played a key role in enabling HCL toenter into the business for providing IT infrastructure andnetworking services and today HCL is highly placed in RemoteInfrastructure Management space. He became President of HCLTechnologies Ltd. in April 2005 and Chief Executive Officer inOctober 2007. In August 2008, he was designated as CEO andWhole-time Director of the Company and in 2011, he has beendesignated as the Vice Chairman, CEO and Whole-time Directorof the Company.
Mr. Vineet Nayar was instrumental in instituting several radicaltransformational programs across the organization. His mantraof “Employee First” and a strong belief in value-based leadershiphas been recognized globally as an example of “OrganizationalInnovation”. He has won many global citations for developingthe Employees First, Customers Second (“EFCS”) modelincluding the first ever 'Leader in Digital Age Award’ by CeBIT,the world's largest trade fair showcasing ICT and 'HRDExcellence - Pathfinder CEO Award 2010' by the National HRDNetwork. He is an active member of G100, a group of CEOs ofsome of the world’s most significant companies. He is also oneof the founding members of the Asia Gender Parity Group andan active member of the Global Gender Parity Group at the WorldEconomic Forum (WEF). He is also a Governor for the ICTIndustry at WEF and a Steering board member of the WEF GlobalEducation Initiative, WEF ICT and Sustainability initiatives andof the Young Global Leaders.
Under his leadership, the Company has been named BestEmployer in India by Hewitt Associates, and Business Week listedthe Company as one of the five most influential up-comingcompanies in the world. Fortune magazine has characterizedthe Company as having “the world’s most modern management,”and IDC recognized it as having “the most cohesive and articulatevision” in the IT services sector.
Nature of expertise in functional area - Mr. Vineet Nayar has anexpertise in business management and administration, and ininformation technologies sector.
Mr. Vineet Nayar is a member of the Employees Stock OptionAllotment Committee and Nominations Committee of theCompany. As on June 30, 2011, his shareholding in the Companywas 17,00,000 which is held in the name of the family trust.
Ms. Robin AbramsMs. Robin AbramsMs. Robin AbramsMs. Robin AbramsMs. Robin Abrams
Ms. Robin Abrams, aged 60 years holds both a Bachelor of Artsand a Juris Doctor degree from the University of Nebraska.Ms. Robin Abrams was most recently interim CEO at ZiLOG.She had been the President of Palm Computing and Senior VicePresident at 3Com Corporation.
Ms. Abrams was formerly the President and CEO at VeriFone.Before joining VeriFone in 1997, Ms. Abrams held a variety ofsenior management positions with Apple Computers. As VicePresident and General Manager of the Americas, she oversawsales and channel management for U.S., Canada and LatinAmerica. Prior to that, she was the Vice President and General
33
Manager of Apple Asia, where she was responsible for salesand marketing in the region.
Ms. Abrams spent eight years with Unisys in several senior-levelpositions. Her responsibilities included managing the deliveryof business solutions focused on banking, airlines, governmentand networking. A portion of her tenure at Unisys included afive-year stint in Asia Pacific. The first twelve years of her careerwere in various management positions at Wells Fargo Bank(formerly known as Norwest Bank).
Ms. Abrams has served several U.S. public company boardsincluding ZiLOG and BEA Systems (until it was acquired byOracle) and currently serving Sierra Wireless and OpenwaveSystems. Ms. Abrams also serves on the Anita Borg InstituteBoard and several academic advisory committees.
Nature of expertise in specific functional area - Ms. Robin Abramshas nearly 36 years of experience in computing and computingservices, strategic planning and management.
Ms. Robin Abrams is the Chairperson of the CompensationCommittee and member of the Audit Committee and RiskManagement Committee of the Board of Directors of theCompany. As on June 30, 2011, her shareholding in the Companywas Nil.
Mr. T. S. R. SubramanianMr. T. S. R. SubramanianMr. T. S. R. SubramanianMr. T. S. R. SubramanianMr. T. S. R. Subramanian
Mr. T. S. R. Subramanian, aged 72 years, is an Ex-CabinetSecretary to the Government of India. He obtained his first degreein Mathematics at St. Xavier's College, Kolkata and thereafterhis Master's Degree at Kolkata University. He also studied atImperial College, London where he obtained his diploma andhas a Master’s Degree in Public Administration from HarvardUniversity, specializing in economics.
Mr. T. S. R. Subramanian joined the Indian Administrative Servicein 1961 and during his career with the Service he held variouspositions; he rose to the highest post in Indian Administration,that of Cabinet Secretary. As Cabinet Secretary to theGovernment of India, Mr. Subramanian took a number ofinitiatives to modernize and develop the Infrastructure Sector inIndia, especially in the Power, Telecom and Surface TransportSectors.
Nature of expertise in functional area - Mr. T. S. R. Subramanianhas expertise in business administration, and in modernization& development of infrastructure sector.
Mr. T. S. R. Subramanian is the Chairman of the Audit Committee,Risk Management Committee and the Shareholders’ Committeeof the Company. He is also a member of the Employees StockOption Allotment Committee and Nominations Committee of theCompany. As on June 30, 2011, his shareholding in the Companywas 4,600 Equity Shares of ` 2/- each fully paid-up.
Mr. Ajai ChowdhryMr. Ajai ChowdhryMr. Ajai ChowdhryMr. Ajai ChowdhryMr. Ajai Chowdhry
Mr. Ajai Chowdhry, aged 60 years, has a bachelor’s degree inelectronics and communication engineering, and has attendedthe Executive Program at the School of Business Administrationat the University of Michigan in the US. Mr. Ajai Chowdhry is theChairman & Whole- time Director of HCL Infosystems Ltd. He isalso responsible for the significant international growth of HCLInfosystems Ltd. and brings with him substantial experience ofthe South East Asian markets including Malaysia, Thailand, HongKong, Indonesia, People’s Republic of China and Singapore.He was also part of the IT Task Force set up by the Prime Ministerof India, to give shape to India's IT strategy.
During the year, Mr. Ajai Chowdhry was conferred the PadmaBhushan Award - the third highest civilian honor conferred bythe President of India. He has also received ‘Honoris CausaDoctorate’ of Science for his contribution to the Indian IT Industryby IIT Roorkee. He was been named as an ‘Electronics Man ofthe Year’ by the ELCINA-EFY Awards Committee. He hasreceived “The CNBC Asia Business Leader Award 2010” forViewers Choice category. Mr. Chowdhry was also conferred withthe “India Innovator of the Year Award” at the 6th edition of theCNBC TV18 India Business Leader Awards 2010.
Nature of expertise in functional area - Mr. Ajai Chowdhry hasan expertise in business management and administration, andin information technologies (IT) sector.
Mr. Ajai Chowdhry is a member of the Shareholders’ Committeeand Compensation Committee of the Company. As on June 30,2011, his shareholding in the Company was 19,420 equity sharesof ` 2/- each fully paid-up.
Mr. Subroto BhattacharyaMr. Subroto BhattacharyaMr. Subroto BhattacharyaMr. Subroto BhattacharyaMr. Subroto Bhattacharya
Mr. Subroto Bhattacharya, aged 70 years, is a CharteredAccountant. He spent his early career with DCM Limited wherehe rose to the position of a Director on its board. In the lateeighties, he joined the HCL Group and subsequently joined theBoard of the flagship company HCL Limited.
Nature of expertise in specific functional area: Mr. Bhattacharyahas an experience of over 34 years with specialization in Financeand Management Consultancy. He has a vast experience infinancial management, accounts and audit.
Mr. Subroto Bhattacharya is a member of the Audit Committee,Shareholders' Committee, Employee Stock Options AllotmentCommittee, Finance Committee and Risk ManagementCommittee of the Company. As on June 30, 2011, hisshareholding in the Company was nil.
Mr. Amal GanguliMr. Amal GanguliMr. Amal GanguliMr. Amal GanguliMr. Amal Ganguli
Mr. Amal Ganguli, aged 71 years, is a Chartered Accountant.He was earlier associated with Price WaterhouseCoopers, Indiaas its Senior Partner. In a distinguished career spanning nearlyfour decades, Mr. Ganguli was involved with the India practiceof Price WaterhouseCoopers and has an authority on mattersrelated to audit, taxation, mergers and acquisitions and corporaterestructuring.
Nature of expertise in functional area- Mr. Amal Ganguli hasexpertise in areas relating to financial reporting, audit, taxation,mergers and acquisitions and corporate restructuring.
Mr. Amal Ganguli is the chairman of the Finance Committee. Heis also a member of the Audit Committee and Risk ManagementCommittee of the Company. As on June 30, 2011, hisshareholding in the Company was nil.
Mr. P. C. SenMr. P. C. SenMr. P. C. SenMr. P. C. SenMr. P. C. Sen
Mr. P.C. Sen, aged 67 years, is a graduate of St. StephensCollege, Delhi and a post graduate in M.A. (History) and Diplomain Social Anthropology from King's College, Cambridge U.K. andM.Sc. (Economics) from University of Swansea, U.K. He joinedthe Indian Administrative Service in Madhya Pradesh Cadre in1967. He has held a variety of assignments both with theGovernment of Madhya Pradesh and the Government of India.He was the Director of Archaeology and Museums, M.P.,Managing Director of M.P. State Tourism Corporation, PrincipalSecretary of Housing and Environment, Principal Secretary ofCommerce and Industry and IT in the Government of M.P.,
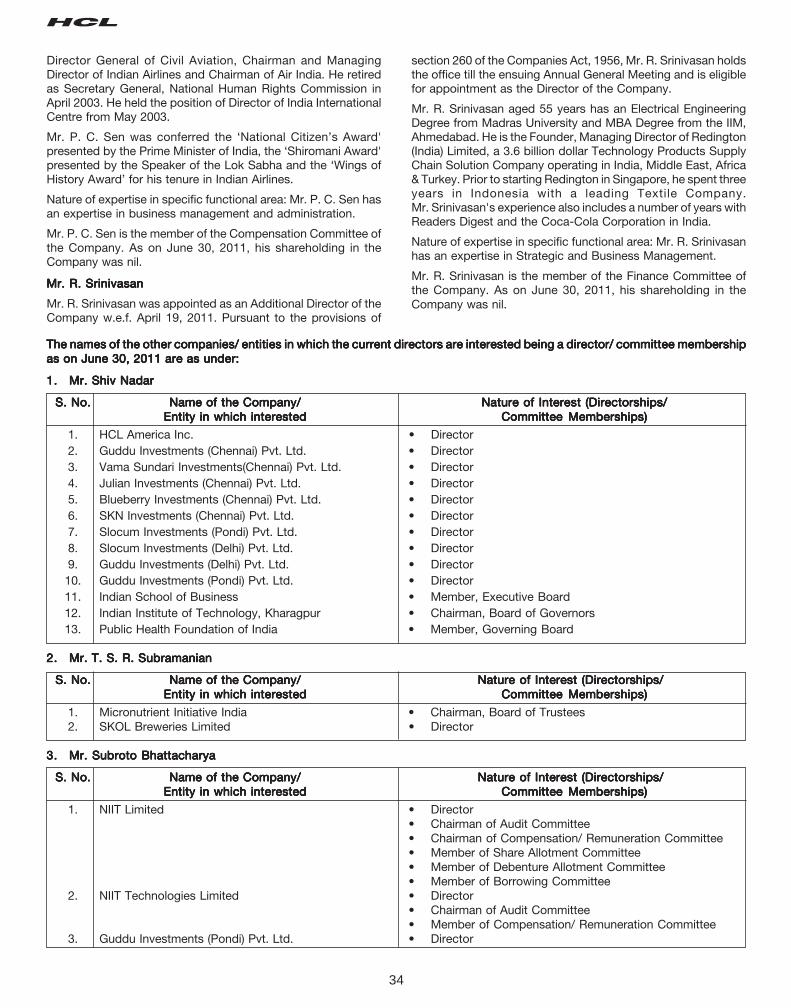
34
Director General of Civil Aviation, Chairman and ManagingDirector of Indian Airlines and Chairman of Air India. He retiredas Secretary General, National Human Rights Commission inApril 2003. He held the position of Director of India InternationalCentre from May 2003.
Mr. P. C. Sen was conferred the ‘National Citizen’s Award'presented by the Prime Minister of India, the ‘Shiromani Award'presented by the Speaker of the Lok Sabha and the ‘Wings ofHistory Award’ for his tenure in Indian Airlines.
Nature of expertise in specific functional area: Mr. P. C. Sen hasan expertise in business management and administration.
Mr. P. C. Sen is the member of the Compensation Committee ofthe Company. As on June 30, 2011, his shareholding in theCompany was nil.
Mr. R. SrinivasanMr. R. SrinivasanMr. R. SrinivasanMr. R. SrinivasanMr. R. Srinivasan
Mr. R. Srinivasan was appointed as an Additional Director of theCompany w.e.f. April 19, 2011. Pursuant to the provisions of
section 260 of the Companies Act, 1956, Mr. R. Srinivasan holdsthe office till the ensuing Annual General Meeting and is eligiblefor appointment as the Director of the Company.
Mr. R. Srinivasan aged 55 years has an Electrical EngineeringDegree from Madras University and MBA Degree from the IIM,Ahmedabad. He is the Founder, Managing Director of Redington(India) Limited, a 3.6 billion dollar Technology Products SupplyChain Solution Company operating in India, Middle East, Africa& Turkey. Prior to starting Redington in Singapore, he spent threeyears in Indonesia with a leading Textile Company.Mr. Srinivasan's experience also includes a number of years withReaders Digest and the Coca-Cola Corporation in India.
Nature of expertise in specific functional area: Mr. R. Srinivasanhas an expertise in Strategic and Business Management.
Mr. R. Srinivasan is the member of the Finance Committee ofthe Company. As on June 30, 2011, his shareholding in theCompany was nil.
The names of the other companies/ entities in which the current directors are interested being a director/ committee membershipThe names of the other companies/ entities in which the current directors are interested being a director/ committee membershipThe names of the other companies/ entities in which the current directors are interested being a director/ committee membershipThe names of the other companies/ entities in which the current directors are interested being a director/ committee membershipThe names of the other companies/ entities in which the current directors are interested being a director/ committee membershipas on June 30, 2011 are as under:as on June 30, 2011 are as under:as on June 30, 2011 are as under:as on June 30, 2011 are as under:as on June 30, 2011 are as under:
1.1.1.1.1. Mr. Shiv NadarMr. Shiv NadarMr. Shiv NadarMr. Shiv NadarMr. Shiv Nadar
S. No.S. No.S. No.S. No.S. No. Name of the Company/Name of the Company/Name of the Company/Name of the Company/Name of the Company/ Nature of Interest (Directorships/Nature of Interest (Directorships/Nature of Interest (Directorships/Nature of Interest (Directorships/Nature of Interest (Directorships/Entity in which interestedEntity in which interestedEntity in which interestedEntity in which interestedEntity in which interested Committee Memberships)Committee Memberships)Committee Memberships)Committee Memberships)Committee Memberships)
1. HCL America Inc. • Director2. Guddu Investments (Chennai) Pvt. Ltd. • Director3. Vama Sundari Investments(Chennai) Pvt. Ltd. • Director4. Julian Investments (Chennai) Pvt. Ltd. • Director5. Blueberry Investments (Chennai) Pvt. Ltd. • Director6. SKN Investments (Chennai) Pvt. Ltd. • Director7. Slocum Investments (Pondi) Pvt. Ltd. • Director8. Slocum Investments (Delhi) Pvt. Ltd. • Director9. Guddu Investments (Delhi) Pvt. Ltd. • Director
10. Guddu Investments (Pondi) Pvt. Ltd. • Director11. Indian School of Business • Member, Executive Board12. Indian Institute of Technology, Kharagpur • Chairman, Board of Governors13. Public Health Foundation of India • Member, Governing Board
2.2.2.2.2. Mr. T. S. R. SubramanianMr. T. S. R. SubramanianMr. T. S. R. SubramanianMr. T. S. R. SubramanianMr. T. S. R. Subramanian
S. No.S. No.S. No.S. No.S. No. Name of the Company/Name of the Company/Name of the Company/Name of the Company/Name of the Company/ Nature of Interest (Directorships/Nature of Interest (Directorships/Nature of Interest (Directorships/Nature of Interest (Directorships/Nature of Interest (Directorships/Entity in which interestedEntity in which interestedEntity in which interestedEntity in which interestedEntity in which interested Committee Memberships)Committee Memberships)Committee Memberships)Committee Memberships)Committee Memberships)
1. Micronutrient Initiative India • Chairman, Board of Trustees2. SKOL Breweries Limited • Director
3.3.3.3.3. Mr. Subroto BhattacharyaMr. Subroto BhattacharyaMr. Subroto BhattacharyaMr. Subroto BhattacharyaMr. Subroto Bhattacharya
S. No.S. No.S. No.S. No.S. No. Name of the Company/Name of the Company/Name of the Company/Name of the Company/Name of the Company/ Nature of Interest (Directorships/Nature of Interest (Directorships/Nature of Interest (Directorships/Nature of Interest (Directorships/Nature of Interest (Directorships/Entity in which interestedEntity in which interestedEntity in which interestedEntity in which interestedEntity in which interested Committee Memberships)Committee Memberships)Committee Memberships)Committee Memberships)Committee Memberships)
1. NIIT Limited • Director• Chairman of Audit Committee• Chairman of Compensation/ Remuneration Committee• Member of Share Allotment Committee• Member of Debenture Allotment Committee• Member of Borrowing Committee
2. NIIT Technologies Limited • Director• Chairman of Audit Committee• Member of Compensation/ Remuneration Committee
3. Guddu Investments (Pondi) Pvt. Ltd. • Director
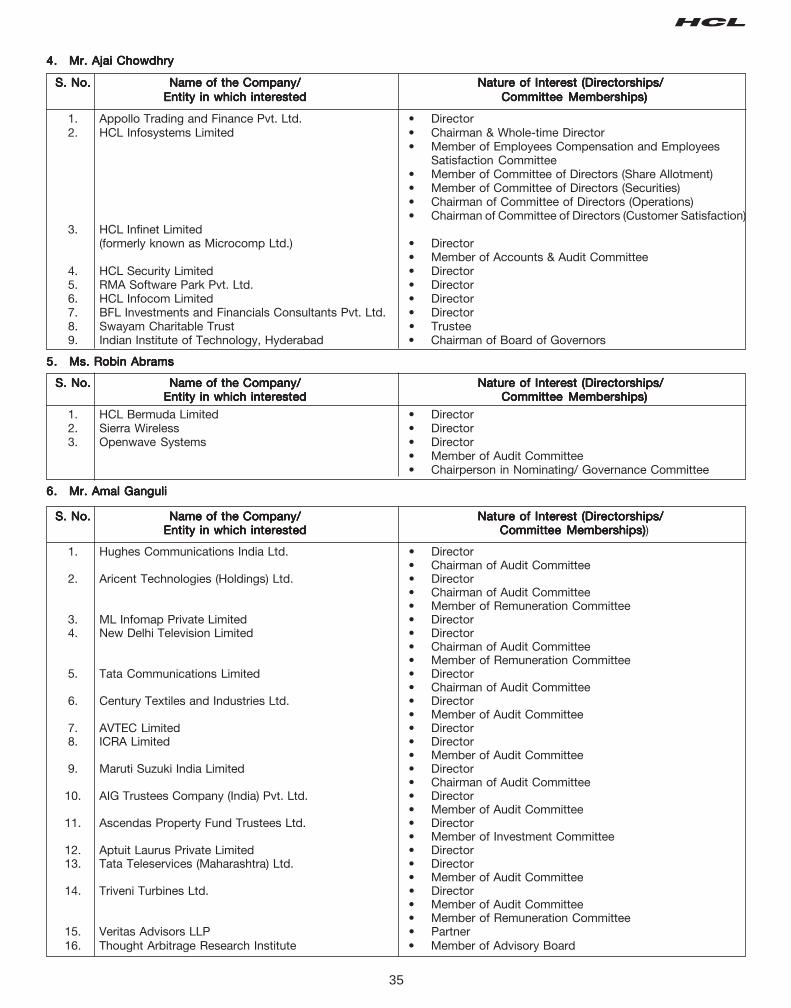
35
4.4.4.4.4. Mr. Ajai ChowdhryMr. Ajai ChowdhryMr. Ajai ChowdhryMr. Ajai ChowdhryMr. Ajai Chowdhry
S. No.S. No.S. No.S. No.S. No. Name of the Company/Name of the Company/Name of the Company/Name of the Company/Name of the Company/ Nature of Interest (Directorships/Nature of Interest (Directorships/Nature of Interest (Directorships/Nature of Interest (Directorships/Nature of Interest (Directorships/Entity in which interestedEntity in which interestedEntity in which interestedEntity in which interestedEntity in which interested Committee Memberships)Committee Memberships)Committee Memberships)Committee Memberships)Committee Memberships)
1. Appollo Trading and Finance Pvt. Ltd. • Director2. HCL Infosystems Limited • Chairman & Whole-time Director
• Member of Employees Compensation and EmployeesSatisfaction Committee
• Member of Committee of Directors (Share Allotment)• Member of Committee of Directors (Securities)• Chairman of Committee of Directors (Operations)• Chairman of Committee of Directors (Customer Satisfaction)
3. HCL Infinet Limited(formerly known as Microcomp Ltd.) • Director
• Member of Accounts & Audit Committee4. HCL Security Limited • Director5. RMA Software Park Pvt. Ltd. • Director6. HCL Infocom Limited • Director7. BFL Investments and Financials Consultants Pvt. Ltd. • Director8. Swayam Charitable Trust • Trustee9. Indian Institute of Technology, Hyderabad • Chairman of Board of Governors
5.5.5.5.5. Ms. Robin AbramsMs. Robin AbramsMs. Robin AbramsMs. Robin AbramsMs. Robin Abrams
S. No.S. No.S. No.S. No.S. No. Name of the Company/Name of the Company/Name of the Company/Name of the Company/Name of the Company/ Nature of Interest (Directorships/Nature of Interest (Directorships/Nature of Interest (Directorships/Nature of Interest (Directorships/Nature of Interest (Directorships/Entity in which interestedEntity in which interestedEntity in which interestedEntity in which interestedEntity in which interested Committee Memberships)Committee Memberships)Committee Memberships)Committee Memberships)Committee Memberships)
1. HCL Bermuda Limited • Director2. Sierra Wireless • Director3. Openwave Systems • Director
• Member of Audit Committee• Chairperson in Nominating/ Governance Committee
6.6.6.6.6. Mr. Amal GanguliMr. Amal GanguliMr. Amal GanguliMr. Amal GanguliMr. Amal Ganguli
S. No.S. No.S. No.S. No.S. No. Name of the Company/Name of the Company/Name of the Company/Name of the Company/Name of the Company/ Nature of Interest (Directorships/Nature of Interest (Directorships/Nature of Interest (Directorships/Nature of Interest (Directorships/Nature of Interest (Directorships/Entity in which interestedEntity in which interestedEntity in which interestedEntity in which interestedEntity in which interested Committee Memberships)Committee Memberships)Committee Memberships)Committee Memberships)Committee Memberships))
1. Hughes Communications India Ltd. • Director• Chairman of Audit Committee
2. Aricent Technologies (Holdings) Ltd. • Director• Chairman of Audit Committee• Member of Remuneration Committee
3. ML Infomap Private Limited • Director4. New Delhi Television Limited • Director
• Chairman of Audit Committee• Member of Remuneration Committee
5. Tata Communications Limited • Director• Chairman of Audit Committee
6. Century Textiles and Industries Ltd. • Director• Member of Audit Committee
7. AVTEC Limited • Director8. ICRA Limited • Director
• Member of Audit Committee9. Maruti Suzuki India Limited • Director
• Chairman of Audit Committee10. AIG Trustees Company (India) Pvt. Ltd. • Director
• Member of Audit Committee11. Ascendas Property Fund Trustees Ltd. • Director
• Member of Investment Committee12. Aptuit Laurus Private Limited • Director13. Tata Teleservices (Maharashtra) Ltd. • Director
• Member of Audit Committee14. Triveni Turbines Ltd. • Director
• Member of Audit Committee• Member of Remuneration Committee
15. Veritas Advisors LLP • Partner16. Thought Arbitrage Research Institute • Member of Advisory Board
36
7.7.7.7.7. Mr. P.C. SenMr. P.C. SenMr. P.C. SenMr. P.C. SenMr. P.C. Sen
S. No.S. No.S. No.S. No.S. No. Name of the Company/Name of the Company/Name of the Company/Name of the Company/Name of the Company/ Nature of Interest (Directorships/Nature of Interest (Directorships/Nature of Interest (Directorships/Nature of Interest (Directorships/Nature of Interest (Directorships/Entity in which interestedEntity in which interestedEntity in which interestedEntity in which interestedEntity in which interested Committee Memberships)Committee Memberships)Committee Memberships)Committee Memberships)Committee Memberships))
1. Delhi Safe Deposit Company Limited • Director2. Rockland Hospitals Limited • Director3. Eklavya • Member, Governing Board4. Sambhava Trust • Trustee5. Helpage India • Vice President, Governing Board6. Age Ventures India • Member, Board of Trustees7. National Foundation of India • Member, Board of Trustees
8.8.8.8.8. R. SrinivasanR. SrinivasanR. SrinivasanR. SrinivasanR. Srinivasan
S. No.S. No.S. No.S. No.S. No. Name of the Company/Name of the Company/Name of the Company/Name of the Company/Name of the Company/ Nature of Interest (Directorships/Nature of Interest (Directorships/Nature of Interest (Directorships/Nature of Interest (Directorships/Nature of Interest (Directorships/Entity in which interestedEntity in which interestedEntity in which interestedEntity in which interestedEntity in which interested Committee Memberships)Committee Memberships)Committee Memberships)Committee Memberships)Committee Memberships))
1. Redington (India) Limited • Director• Member of Investor/ Shareholder's Grievance Committee.• Member of Share Transfer Committee• Member of Remuneration Committee
2. Easyaccess Financial Services Limited • Director• Member of Audit Committee• Member of Nomination Committee
3. Redington (Mauritius) Limited • Director4. Redington Gulf FZE • Director5. Redington Distribution Pte Limited • Director6. Redington Bangladesh Limited • Director7. Cadensworth FZE • Director8. Redington Africa Distribution FZE • Director9. Redington Egypt Limited • Director
10. Redington Nigeria Limited • Director11. Redington International (Holdings) Limited • Director12. Redington International Mauritius Limited • Director13. Redington Turkey Holdings Limited • Director14. Arena Bilgisayar Sanayi Ticaret Anonim Sirketi • Director15. SSN Institutions • Chairman, Board of Management16. Vamasundari Scholarship Trust • Trustee
9.9.9.9.9. Mr. Vineet Nayar -Mr. Vineet Nayar -Mr. Vineet Nayar -Mr. Vineet Nayar -Mr. Vineet Nayar - As on June 30, 2011, Mr. Vineet Nayar does not hold directorship in any other Company.
Independent DirectorsIndependent DirectorsIndependent DirectorsIndependent DirectorsIndependent Directors
As on June 30, 2011, out of nine Directors on Board of theCompany, seven directors are independent non-executivedirectors.
According to Clause 49 of the Listing Agreement with the IndianStock Exchanges, an Independent Director means a NonExecutive Director of the Company who:
a. apart from receiving director's remuneration, does not haveany material pecuniary relationships or transactions with thecompany, its promoters, its directors, its senior managementor its holding company, its subsidiaries and associates whichmay affect independence of the director;
b. is not related to promoters or persons occupyingmanagement positions at the board level or at one levelbelow the board;
c. has not been an executive of the company in the immediatelypreceding three financial years;
d. is not a partner or an executive or was not partner or anexecutive during the preceding three years, of any of thefollowing:i. the statutory audit firm or the internal audit firm that is
associated with the company, and
ii. the legal firm(s) and consulting firm(s) that have amaterial association with the company.
e. is not a material supplier, service provider or customer or alessor or lessee of the company, which may affectindependence of the director;
f. is not a substantial shareholder of the company i.e. owningtwo percent or more of the block of voting shares.
g. is not less than 21 years of age.
The Company has adopted the above mentioned definition ofIndependent Director as mentioned under clause 49 of the listingagreement and all the independent directors of the Companyhave certified their independent status to the Board as on June30, 2011.
The tenure of Independent DirectorsThe tenure of Independent DirectorsThe tenure of Independent DirectorsThe tenure of Independent DirectorsThe tenure of Independent Directors
The tenure of independent directors on the Board of theCompany shall be 9 years. For the current independent directorson Board, the period of 9 years shall be w.e.f. July 1, 2008 andfor new appointments, the said term shall be from the date ofthe appointment.
37
Retirement Policy of the Board of DirectorsRetirement Policy of the Board of DirectorsRetirement Policy of the Board of DirectorsRetirement Policy of the Board of DirectorsRetirement Policy of the Board of Directors
The Board has formulated a retirement policy pursuant to whichthere shall be an age limit of 75 years for all the Directors whoshall serve on the Board of the Company.
Succession PlanningSuccession PlanningSuccession PlanningSuccession PlanningSuccession Planning
Succession planning for certain key positions in the Companyviz. Chief Executive Officer (CEO), Chief Operating Officer (COO),Chief Financial Officer (CFO) is part of the charter of theNominations Committee of the Company. The Committee shallidentify, screen and review candidates, inside or outside theCompany and provide its recommendations to the Board.
Memberships on other BoardsMemberships on other BoardsMemberships on other BoardsMemberships on other BoardsMemberships on other Boards
Executive Directors are also allowed to serve on the Board/Committee of Corporate(s) or Government bodies whose interestare germane to the future of software business, or on the Boardof key economic institutions of the nation or whose primaryobjective is benefiting society.
Independent Directors are expected not to serve on the Board/Committees of competing companies. Other than this, there isno limitation on the Directorships /Committee membershipsexcept those imposed by law and good corporate governance.
Director's ResponsibiltiesDirector's ResponsibiltiesDirector's ResponsibiltiesDirector's ResponsibiltiesDirector's Responsibilties
(a) The principal responsibilty of the Board members is tooversee the management of the Company and in doing so,serve the best interests of the Company and its stockholders.This responsibilty shall include :
• Reviewing and approving fundamental operating,financial and other corporate plans, strategies andobjectives.
• Evaluate whether the corporate resources are beingused only for appropriate business purposes.
• Establising a corporate environment that promotestimely and effective disclosure (including robust andappropriate controls, procedures and incentives), fiscalresponsibilty, high ethical standards and compliancewith all applicable laws and regulations.
• Evaluating the performance of the Company and itssenior executives and taking appropriate action,including removal, where warranted.
• Evaluating the overall effectiveness of the Board andits Committees.
• To attend the Board, Committee and shareholdersmeetings.
(b) Exercise business judgment:Exercise business judgment:Exercise business judgment:Exercise business judgment:Exercise business judgment: In discharging their fiduciaryduties of care and loyalty, the directors are expected toexercise their business judgment to act in what theyreasonably believe to be in the best interests of the Companyand its stockholders.
(c) Understand the Company and its business :Understand the Company and its business :Understand the Company and its business :Understand the Company and its business :Understand the Company and its business : The Directorshave an obligation to remain informed about the Companyand its business, including the principal operational andfinancial objectives, strategies and plans of the Company,relative standing of the business segments within theCompany and vis-a-vis the competitors of the Company,factors that determine the Company's success, results ofoperations and financial conditon of the Company and thesignificant subsidiaries and business segments.
(d) To establish effective systems :To establish effective systems :To establish effective systems :To establish effective systems :To establish effective systems : The Directors areresponsible for determining that effective systems are inplace for periodic and timely reporting to the Board onimportant matters concerning the Company including thefollowing :
• Current business and financial performance, degree ofachievement of approved objectives and the need toaddress forward-planning issues.
• Compliance programs to assure the company'scompliance with laws and corporate polices.
• Material litigation and governmental and regulatorymatters
Board/ Committee meetings functioning and procedureBoard/ Committee meetings functioning and procedureBoard/ Committee meetings functioning and procedureBoard/ Committee meetings functioning and procedureBoard/ Committee meetings functioning and procedure
The Board of Directors is the apex body constituted by theshareholders for overseeing the overall functioning of theCompany. The Board provides and evaluates the strategicdirections of the Company, management policies and theireffectiveness and ensures that the long term interests of theshareholders are being served.
The probable dates of the board meetings for the forthcomingyear are decided in advance and published as part of the AnnualReport.
Board Meeting - Frequency:Board Meeting - Frequency:Board Meeting - Frequency:Board Meeting - Frequency:Board Meeting - Frequency: The Board meets at least once aquarter to review the quarterly results and other items of theagenda. Whenever necessary, additional meetings are held. Incase of business exigencies or urgency of matters, resolutionsare passed by circulations. The Company effectively usesteleconferencing facility to enable the participation of Directorswho could not attend the same due to some urgency.
Board Meeting - Location:Board Meeting - Location:Board Meeting - Location:Board Meeting - Location:Board Meeting - Location: The meetings are generally held atthe Technology HUB of the Company at Noida. Each Director isexpected to attend the Board meetings.
Board Meeting - Matters:Board Meeting - Matters:Board Meeting - Matters:Board Meeting - Matters:Board Meeting - Matters: All divisions/ departments of theCompany are advised to schedule their work plans in advance,particularly with regard to matters requiring discussions/approval/ decision of the Board/ Committee meetings. All suchmatters are communicated to the Company Secretary in advanceso that the same could be included in the Agenda for the Board/Committee meetings.
Board material/ Agenda distributed in advanceBoard material/ Agenda distributed in advanceBoard material/ Agenda distributed in advanceBoard material/ Agenda distributed in advanceBoard material/ Agenda distributed in advance
The agenda for each board meeting is circulated in advance tothe Board members. All material information is incorporated inthe agenda facilitating meaningful and focused discussions inthe meeting. Where it is not practicable to attach any documentin the agenda, the same is tabled before the meeting. Everyboard member is free to suggest items for inclusion in theagenda.
Presentat ions by management:Presentat ions by management:Presentat ions by management:Presentat ions by management:Presentat ions by management: The Board is givenpresentations covering finance, sales, marketing, major businesssegments and operations of the Company, global businessenvironment including business opportunities, business strategyand the risk management practices before taking on record thefinancial results of the Company.
Access to employees:Access to employees:Access to employees:Access to employees:Access to employees: The Directors are provided free accessto officers and employees of the Company. Management isencouraged to invite the Company personnel to any Boardmeeting at which their presence and expertise would help the
38
Board to have a full understanding of matters being considered.
Availability of information to Board members:Availability of information to Board members:Availability of information to Board members:Availability of information to Board members:Availability of information to Board members:
- Annual operating plans and budgets including capitalbudgets and any updates.
- Quarterly results of the Company and its operating divisionsor business segments.
- Minutes of meetings of Audit Committee, CompensationCommittee, Risk Management Committee and ShareholdersCommittee of the Board.
- The information on recruitment and remuneration of seniorofficers just below the Board level, including appointmentor removal of Chief Financial Officer and the CompanySecretary.
- Show cause, demand, prosecution notices and penaltynotices which are materially important.
- Fatal or serious accidents, dangerous occurrences, anymaterial effluent or pollution problems.
- Any material default in the financial obligations to and bythe Company, or substantial non-payment for goods sold /services provided by the Company.
- Any issue, which involves possible public or product liabilityclaims of substantial nature, including any judgment or orderwhich, may have passed strictures on the conduct of theCompany or taken an adverse view regarding anotherenterprise that can have negative implications on theCompany.
- Details of any joint venture or collaboration agreement.- Transactions that involve substantial payment towards
goodwill, brand equity, or intellectual property.- Any significant development in Human Resources / Industrial
Relations front.- Sale of material nature, of investments, subsidiaries, assets,
which is not in normal course of business.- Quarterly details of foreign exchange exposures and the
steps taken by the management to limit the risks of adverseexchange rate movement, if material.
- Non-compliance of any regulatory, statutory nature or listingrequirements and shareholders service such as non-payment of dividend, delay in share transfer etc.
- Statutory compliance report of all laws applicable to theCompany, as well as steps taken by the Company to rectifyinstances of non-compliances, if any.
- Minutes of the board meetings of the subsidiaries along withtheir financial statements and the investments made by thesecompanies.
- Details of the transactions with the related parties.- General notices of interest of directors.
Discussion with Independent DirectorsDiscussion with Independent DirectorsDiscussion with Independent DirectorsDiscussion with Independent DirectorsDiscussion with Independent Directors
Independent Directors are regularly updated on performance ofeach line of business of the Company, business strategy goingforward and new initiatives being taken/ proposed to be takenby the Company.
The Independent Directors meet periodically without theexecutive directors or the management. The IndependentDirectors also periodically have one on one meeting with thestatutory auditors and internal auditors, where neither theexecutive directors nor any person from the management ispresent.
Post meeting follow- up mechanismPost meeting follow- up mechanismPost meeting follow- up mechanismPost meeting follow- up mechanismPost meeting follow- up mechanism
The guidelines for Board and Committee(s) meetings facilitatean effective post meeting follow up review and reporting processfor the decisions taken by the Board and Committee(s) thereof.The important decisions taken at the Board/ Committee(s)meetings are promptly communicated to the concerneddepartments/ divisions. Action taken report on the decisions ofthe previous meeting(s) is placed at the immediately succeedingmeeting of the Board/ Committee(s) for information and reviewby the Board/ Committee(s).
Number of Board Meetings and the dates on which it heldNumber of Board Meetings and the dates on which it heldNumber of Board Meetings and the dates on which it heldNumber of Board Meetings and the dates on which it heldNumber of Board Meetings and the dates on which it held
There were four Board meetings held during the year endedJune 30, 2011.These were held on July 27-29, 2010, October19-20, 2010, January 18-19, 2011 and April 19-20, 2011. Thefollowing table gives the attendance record of the directors inthe Board Meetings and at the last Annual General Meeting:
Name of DirectorName of DirectorName of DirectorName of DirectorName of Director No. of BoardNo. of BoardNo. of BoardNo. of BoardNo. of Board No. ofNo. ofNo. ofNo. ofNo. of WhetherWhetherWhetherWhetherWhetherMeetingsMeetingsMeetingsMeetingsMeetings BoardBoardBoardBoardBoard attendedattendedattendedattendedattended
heldheldheldheldheld MeetingsMeetingsMeetingsMeetingsMeetings last AGMlast AGMlast AGMlast AGMlast AGMattendedattendedattendedattendedattended
Mr. Shiv Nadar 4 4 Yes
Mr. Vineet Nayar 4 4 No
Mr. T. S. R. Subramanian 4 4 Yes
Ms. Robin Abrams 4 4* No
Mr. Ajai Chowdhry 4 3 Yes
Mr. S. Bhattacharya 4 4 Yes
Mr. Amal Ganguli 4 2** No
Mr. P. C. Sen 4 4 No
Mr. R. Srinivasan 4 1# N.A.
* includes one meeting attended through conference call.**includes one meeting attended through conference call.# Mr. R Srinivasan was appointed as an Additional Director ofthe Company on April 19, 2011.
Independence of Statutory AuditorsIndependence of Statutory AuditorsIndependence of Statutory AuditorsIndependence of Statutory AuditorsIndependence of Statutory Auditors
The Board ensures that the statutory auditors of the Companyare independent and have arm's length relationship with theCompany.
Rotation of Statutory AuditorsRotation of Statutory AuditorsRotation of Statutory AuditorsRotation of Statutory AuditorsRotation of Statutory Auditors
While appointing / re-appointing the statutory auditors of theCompany, the Board ensures that the statutory auditors has apolicy in place for rotation of audit partners.
Review of legal compliance reportsReview of legal compliance reportsReview of legal compliance reportsReview of legal compliance reportsReview of legal compliance reports
The Board periodically reviews the compliance report of the lawsapplicable to the Company as well as steps taken by theCompany to rectify the instances of non-compliances, if any.
Appointment/Re-appointment of DirectorsAppointment/Re-appointment of DirectorsAppointment/Re-appointment of DirectorsAppointment/Re-appointment of DirectorsAppointment/Re-appointment of Directors
Mr. R. Srinivasan was appointed as an Additional Director of theCompany w.e.f. April 19, 2011. Pursuant to the provisions ofsection 260 of the Companies Act, 1956, Mr. R. Srinivasan holdsthe office till the ensuing Annual General Meeting and is eligiblefor appointment as the Director of the Company.
Mr. T. S. R. Subramanian, Mr. Ajai Chowdhry and Mr. P. C. Sen,shall retire by rotation as Directors at the ensuing Annual General
39
Meeting of the Company. Mr. T. S. R. Subramanian, Mr. AjaiChowdhry and Mr. P. C. Sen have expressed their desire not toseek reappointment as the Directors of the Company. The detailsand profile of the aforesaid Directors are furnished above in thisreport.
Code of ConductCode of ConductCode of ConductCode of ConductCode of Conduct
The Board has prescribed a Code of Conduct (“Code”) for allBoard members and senior management and other employeesof the Company. The code of conduct covers transparency,behavioral conduct, a gender friendly workplace, legalcompliance and protection of Company's property andinformation. The Code is also posted on the website of theCompany.
All Board members and senior management personnel haveconfirmed compliance with the Code for the year 2010-11. Adeclaration to this effect signed by the Chairman & Chief StrategyOfficer and Vice Chairman and Chief Executive Officer of theCompany is provided elsewhere in this Report.
Board CommitteesBoard CommitteesBoard CommitteesBoard CommitteesBoard Committees
The Board of Directors has constituted Committees withadequate delegation of powers to discharge urgent businesses
of the Company. Currently, the Board has seven Committeesviz. Audit Committee, Compensation Committee, NominationsCommittee, Risk Management Committee, Finance Committee,Shareholders' Committee and Employees' Stock OptionsAllotment Committee.
Keeping in view the requirements of the Companies Act, 1956as well as Clause 49 of the Listing Agreement, the Board decidesthe terms of reference of various committees which set forth thepurposes, goals and responsibilities of the Committees. Allobservations, recommendations and decisions of thecommittees are placed before the Board for information or forapproval.
Frequency and length of meeting of the Committees of theFrequency and length of meeting of the Committees of theFrequency and length of meeting of the Committees of theFrequency and length of meeting of the Committees of theFrequency and length of meeting of the Committees of theBoard and Agenda-Board and Agenda-Board and Agenda-Board and Agenda-Board and Agenda-
The Chairman of each Committee of the Board, in consultationwith the Chairman of the Board and appropriate members ofmanagement determine the frequency and length of the meetingof the Committees' and develop the Committees’ agenda. Theagenda of the Committee meetings shared with all the membersof the Committee.
Chairmanship/ Membership of Directors in Committees of the Board of Directors of the Company:Chairmanship/ Membership of Directors in Committees of the Board of Directors of the Company:Chairmanship/ Membership of Directors in Committees of the Board of Directors of the Company:Chairmanship/ Membership of Directors in Committees of the Board of Directors of the Company:Chairmanship/ Membership of Directors in Committees of the Board of Directors of the Company:
S.S.S.S.S. Name of DirectorName of DirectorName of DirectorName of DirectorName of Director AuditAuditAuditAuditAudit CompensationCompensationCompensationCompensationCompensation Shareholders’Shareholders’Shareholders’Shareholders’Shareholders’ NominationNominationNominationNominationNomination FinanceFinanceFinanceFinanceFinance Employees’Employees’Employees’Employees’Employees’ RiskRiskRiskRiskRiskNo.No.No.No.No. CommitteeCommitteeCommitteeCommitteeCommittee CommitteeCommitteeCommitteeCommitteeCommittee CommitteeCommitteeCommitteeCommitteeCommittee CommitteeCommitteeCommitteeCommitteeCommittee CommitteeCommitteeCommitteeCommitteeCommittee stock optionstock optionstock optionstock optionstock option ManagementManagementManagementManagementManagement
Committee Committee Committee Committee Committee Committee Committee Committee Committee Committee
Executive DirectorsExecutive DirectorsExecutive DirectorsExecutive DirectorsExecutive Directors
1. Mr. Shiv Nadar – – Member Chairman Member Chairman –
2. Mr. Vineet Nayar – – – Member – Member –
Independent Non Executive DirectorsIndependent Non Executive DirectorsIndependent Non Executive DirectorsIndependent Non Executive DirectorsIndependent Non Executive Directors
3. Mr. T. S. R. Subramanian Chairman – Chairman Member – Member Chairman
4. Mr. Subroto Bhattacharya Member – Member – Member Member Member
5. Mr. Ajai Chowdhry – Member Member – – – –
6. Ms. Robin Abrams Member Chairperson – – – – Member
7. Mr. Amal Ganguli Member – – – Chairman – Member
8. Mr. P. C. Sen – Member – – – – –
9. Mr. R. Srinivasan – – – – Member – –
Note: No separate provision for the service of notice period and payment of severance fee to be served/paid by the executivedirectors at the time of their termination.
1.1.1.1.1. Audit CommitteeAudit CommitteeAudit CommitteeAudit CommitteeAudit Committee
The Audit Committee comprises of four Independent Directors,namely:
a) Mr. T. S. R. Subramanian (Chairman)b) Ms. Robin Abramsc) Mr. Subroto Bhattacharyad) Mr. Amal Ganguli
The Deputy Company Secretary acts as a Secretary to theCommittee.
Terms of ReferenceTerms of ReferenceTerms of ReferenceTerms of ReferenceTerms of Reference
The constitution and terms of reference of the Audit Committee(as revised by the Board of Directors in July 2011) meet all therequirements of Section 292A of the Companies Act, 1956 aswell as Clause 49 of the Listing Agreement.
The Terms of Reference for the Audit Committee are as under.
a)a)a)a)a) Statutory AuditorsStatutory AuditorsStatutory AuditorsStatutory AuditorsStatutory Auditors
Recommend to the Board the appointment, re-appointment andif required, the replacement or removal of the Statutory Auditors,fixation of audit fee and also approve payment for any otherservices rendered by the statutory auditors.
b)b)b)b)b) Review independence of statutory auditorsReview independence of statutory auditorsReview independence of statutory auditorsReview independence of statutory auditorsReview independence of statutory auditors
In connection with recommending the firm to be retained as theCompany’s Statutory Auditors, review the information providedby the management relating to the independence of such firm,including, among other things, information relating to the non-audit services provided and expected to be provided by theStatutory Auditors.
40
The Committee is also responsible for:
i) Actively engaging in dialogue with the Statutory Auditorswith respect to any disclosed relationship or servicesthat may impact the objectivity and independence ofthe statutory auditors, and
ii) Recommending that the Board takes appropriate actionin response to the Statutory Auditors’ Report to satisfyitself of their independence.
c)c)c)c)c) Review audit planReview audit planReview audit planReview audit planReview audit plan
Review with the Statutory Auditors their plans for, and thescope of, their annual audit and other examinations.
d)d)d)d)d) Conduct of auditConduct of auditConduct of auditConduct of auditConduct of audit
Discuss with the Statutory Auditors the matters required tobe discussed for the conduct of the audit.
e)e)e)e)e) Review Audit ResultsReview Audit ResultsReview Audit ResultsReview Audit ResultsReview Audit Results
Review with the Statutory Auditors the proposed report onthe annual audit, areas of concern, the accompanyingmanagement letter, if any, the reports of their reviews of theCompany's interim financial statements, and the reports ofthe results of such other examinations outside of the courseof the statutory auditors' normal audit procedures that theymay from time to time undertake.
f)f)f)f)f) Review Financial StatementsReview Financial StatementsReview Financial StatementsReview Financial StatementsReview Financial Statements
Review the Company’s financial reporting process and thedisclosure of its financial information to ensure that thefinancial statements are accurate, sufficient and credible.The Audit Committee reviews with appropriate officers ofthe Company and the Statutory Auditors, the annual financialstatements of the Company prior to submission to the Boardor public release thereof, focusing primarily on:
a. Matters required to be included in the Director'sResponsibility Statement to be included in the Board'sreport in terms of clause (2AA) of Section 217 of theCompanies Act, 1956;
b. Any changes in accounting policies and practices andreasons for the same.
c. Major accounting entries based on exercise ofjudgement by management.
d. Qualifications in draft audit report.
e. Significant adjustments made in the financial statementsarising out of audit.
f. The going concern assumption.
g. Compliance with accounting standards.
h. Compliance with stock exchange and legalrequirements concerning financial statements.
i. Any related party transactions i.e. transactions of theCompany with its subsidiaries, promoters or themanagement, or their relatives, etc. that may haveconflict with the interest of the Company at large.
j. Contingent liabilities.
k. Status of litigations by or against the Company.
l. Claims against the Company and their effect on theaccounts.
g)g)g)g)g) Review Quarterly ResultsReview Quarterly ResultsReview Quarterly ResultsReview Quarterly ResultsReview Quarterly Results
Reviewing with the management, the quarterly/interimfinancial statements before submission to the Board forapproval.
h)h)h)h)h) Review the performance of the Internal and ExternalReview the performance of the Internal and ExternalReview the performance of the Internal and ExternalReview the performance of the Internal and ExternalReview the performance of the Internal and ExternalAuditorsAuditorsAuditorsAuditorsAuditors
Review with the management the performance of thestatutory and internal auditors and adequacy of the internalcontrol systems.
i)i)i)i)i) Oversight RoleOversight RoleOversight RoleOversight RoleOversight Role
Oversight of the company’s financial reporting process andthe disclosure of its financial information to ensure thefinancial statement is correct, sufficient and credible.
j)j)j)j)j) Review policiesReview policiesReview policiesReview policiesReview policies
Review the Company’s financial and risk managementpolicies.
k)k)k)k)k) Review internal audit functionReview internal audit functionReview internal audit functionReview internal audit functionReview internal audit function
Review the adequacy of internal audit function, includingthe structure of internal audit department, staffing andseniority of the official heading the department, reportingstructure coverage and frequency of internal audit.
l)l)l)l)l) Review Internal Audit plansReview Internal Audit plansReview Internal Audit plansReview Internal Audit plansReview Internal Audit plans
Review with the senior internal auditing executive andappropriate members of the staff of the internal auditingdepartment the plans for and the scope of their ongoingaudit activities.
m)m)m)m)m) Review Internal Audit reportsReview Internal Audit reportsReview Internal Audit reportsReview Internal Audit reportsReview Internal Audit reports
Review with the senior internal auditing executive andappropriate members of the staff of the internal auditingdepartment the annual report of the audit activities,examinations and results thereof of the internal auditingdepartment, any significant findings and follow up thereon.The Audit Committee also reviews the findings of any internalinvestigations by the internal auditors into the matters wherethere is suspected fraud or irregularity or a failure of internalcontrol system of a material nature and reporting the matterto the Board.
n)n)n)n)n) Review systems of internal accounting controlsReview systems of internal accounting controlsReview systems of internal accounting controlsReview systems of internal accounting controlsReview systems of internal accounting controls
Review with the statutory auditors, the senior internalauditing executive and, if and to the extent deemedappropriate by the Chairman of the Committee, membersof their respective staffs the adequacy of the Company'sinternal accounting controls, the Company's financial,auditing and accounting organizations and personnel andthe Company’s policies and compliance procedures withrespect to business practices.
o)o)o)o)o) Review recommendations of auditorsReview recommendations of auditorsReview recommendations of auditorsReview recommendations of auditorsReview recommendations of auditors
Review with the senior internal auditing executive and theappropriate members of the staff of the internal auditingdepartment, the recommendations made by the StatutoryAuditors and the senior internal auditing executive, as wellas such other matters, if any, as such persons or otherofficers of the Company may desire to bring to the attentionof the Committee.
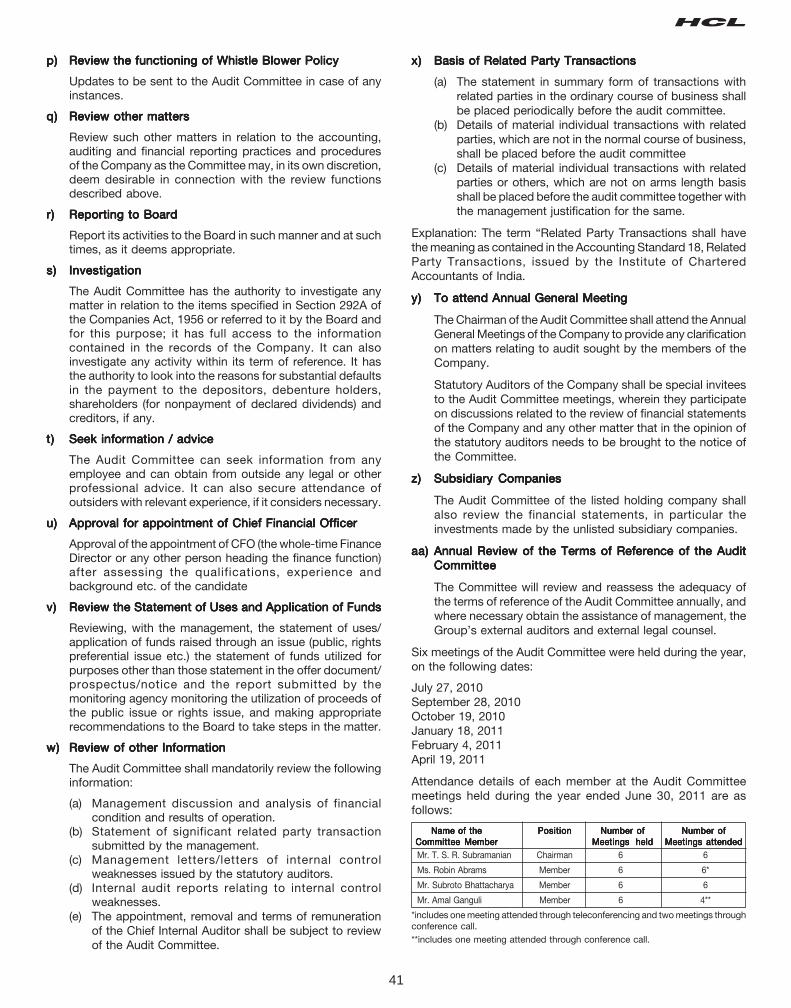
41
p)p)p)p)p) Review the functioning of Whistle Blower PolicyReview the functioning of Whistle Blower PolicyReview the functioning of Whistle Blower PolicyReview the functioning of Whistle Blower PolicyReview the functioning of Whistle Blower Policy
Updates to be sent to the Audit Committee in case of anyinstances.
q)q)q)q)q) Review other mattersReview other mattersReview other mattersReview other mattersReview other matters
Review such other matters in relation to the accounting,auditing and financial reporting practices and proceduresof the Company as the Committee may, in its own discretion,deem desirable in connection with the review functionsdescribed above.
r)r)r)r)r) Reporting to BoardReporting to BoardReporting to BoardReporting to BoardReporting to Board
Report its activities to the Board in such manner and at suchtimes, as it deems appropriate.
s)s)s)s)s) InvestigationInvestigationInvestigationInvestigationInvestigation
The Audit Committee has the authority to investigate anymatter in relation to the items specified in Section 292A ofthe Companies Act, 1956 or referred to it by the Board andfor this purpose; it has full access to the informationcontained in the records of the Company. It can alsoinvestigate any activity within its term of reference. It hasthe authority to look into the reasons for substantial defaultsin the payment to the depositors, debenture holders,shareholders (for nonpayment of declared dividends) andcreditors, if any.
t)t)t)t)t) Seek information / adviceSeek information / adviceSeek information / adviceSeek information / adviceSeek information / advice
The Audit Committee can seek information from anyemployee and can obtain from outside any legal or otherprofessional advice. It can also secure attendance ofoutsiders with relevant experience, if it considers necessary.
u)u)u)u)u) Approval for appointment of Chief Financial OfficerApproval for appointment of Chief Financial OfficerApproval for appointment of Chief Financial OfficerApproval for appointment of Chief Financial OfficerApproval for appointment of Chief Financial Officer
Approval of the appointment of CFO (the whole-time FinanceDirector or any other person heading the finance function)after assessing the qualifications, experience andbackground etc. of the candidate
v)v)v)v)v) Review the Statement of Uses and Application of FundsReview the Statement of Uses and Application of FundsReview the Statement of Uses and Application of FundsReview the Statement of Uses and Application of FundsReview the Statement of Uses and Application of Funds
Reviewing, with the management, the statement of uses/application of funds raised through an issue (public, rightspreferential issue etc.) the statement of funds utilized forpurposes other than those statement in the offer document/prospectus/notice and the report submitted by themonitoring agency monitoring the utilization of proceeds ofthe public issue or rights issue, and making appropriaterecommendations to the Board to take steps in the matter.
w)w)w)w)w) Review of other InformationReview of other InformationReview of other InformationReview of other InformationReview of other Information
The Audit Committee shall mandatorily review the followinginformation:
(a) Management discussion and analysis of financialcondition and results of operation.
(b) Statement of significant related party transactionsubmitted by the management.
(c) Management letters/letters of internal controlweaknesses issued by the statutory auditors.
(d) Internal audit reports relating to internal controlweaknesses.
(e) The appointment, removal and terms of remunerationof the Chief Internal Auditor shall be subject to reviewof the Audit Committee.
x)x)x)x)x) Basis of Related Party TransactionsBasis of Related Party TransactionsBasis of Related Party TransactionsBasis of Related Party TransactionsBasis of Related Party Transactions
(a) The statement in summary form of transactions withrelated parties in the ordinary course of business shallbe placed periodically before the audit committee.
(b) Details of material individual transactions with relatedparties, which are not in the normal course of business,shall be placed before the audit committee
(c) Details of material individual transactions with relatedparties or others, which are not on arms length basisshall be placed before the audit committee together withthe management justification for the same.
Explanation: The term “Related Party Transactions shall havethe meaning as contained in the Accounting Standard 18, RelatedParty Transactions, issued by the Institute of CharteredAccountants of India.
y)y)y)y)y) To attend Annual General MeetingTo attend Annual General MeetingTo attend Annual General MeetingTo attend Annual General MeetingTo attend Annual General Meeting
The Chairman of the Audit Committee shall attend the AnnualGeneral Meetings of the Company to provide any clarificationon matters relating to audit sought by the members of theCompany.
Statutory Auditors of the Company shall be special inviteesto the Audit Committee meetings, wherein they participateon discussions related to the review of financial statementsof the Company and any other matter that in the opinion ofthe statutory auditors needs to be brought to the notice ofthe Committee.
z)z)z)z)z) Subsidiary CompaniesSubsidiary CompaniesSubsidiary CompaniesSubsidiary CompaniesSubsidiary Companies
The Audit Committee of the listed holding company shallalso review the financial statements, in particular theinvestments made by the unlisted subsidiary companies.
aa)aa)aa)aa)aa) Annual Review of the Terms of Reference of the AuditAnnual Review of the Terms of Reference of the AuditAnnual Review of the Terms of Reference of the AuditAnnual Review of the Terms of Reference of the AuditAnnual Review of the Terms of Reference of the AuditCommitteeCommitteeCommitteeCommitteeCommittee
The Committee will review and reassess the adequacy ofthe terms of reference of the Audit Committee annually, andwhere necessary obtain the assistance of management, theGroup’s external auditors and external legal counsel.
Six meetings of the Audit Committee were held during the year,on the following dates:
July 27, 2010September 28, 2010October 19, 2010January 18, 2011February 4, 2011April 19, 2011
Attendance details of each member at the Audit Committeemeetings held during the year ended June 30, 2011 are asfollows:
Name of theName of theName of theName of theName of the PositionPositionPositionPositionPosition Number ofNumber ofNumber ofNumber ofNumber of Number ofNumber ofNumber ofNumber ofNumber ofCommittee MemberCommittee MemberCommittee MemberCommittee MemberCommittee Member Meetings heldMeetings heldMeetings heldMeetings heldMeetings held Meetings attendedMeetings attendedMeetings attendedMeetings attendedMeetings attendedMr. T. S. R. Subramanian Chairman 6 6
Ms. Robin Abrams Member 6 6*
Mr. Subroto Bhattacharya Member 6 6
Mr. Amal Ganguli Member 6 4**
*includes one meeting attended through teleconferencing and two meetings throughconference call.**includes one meeting attended through conference call.
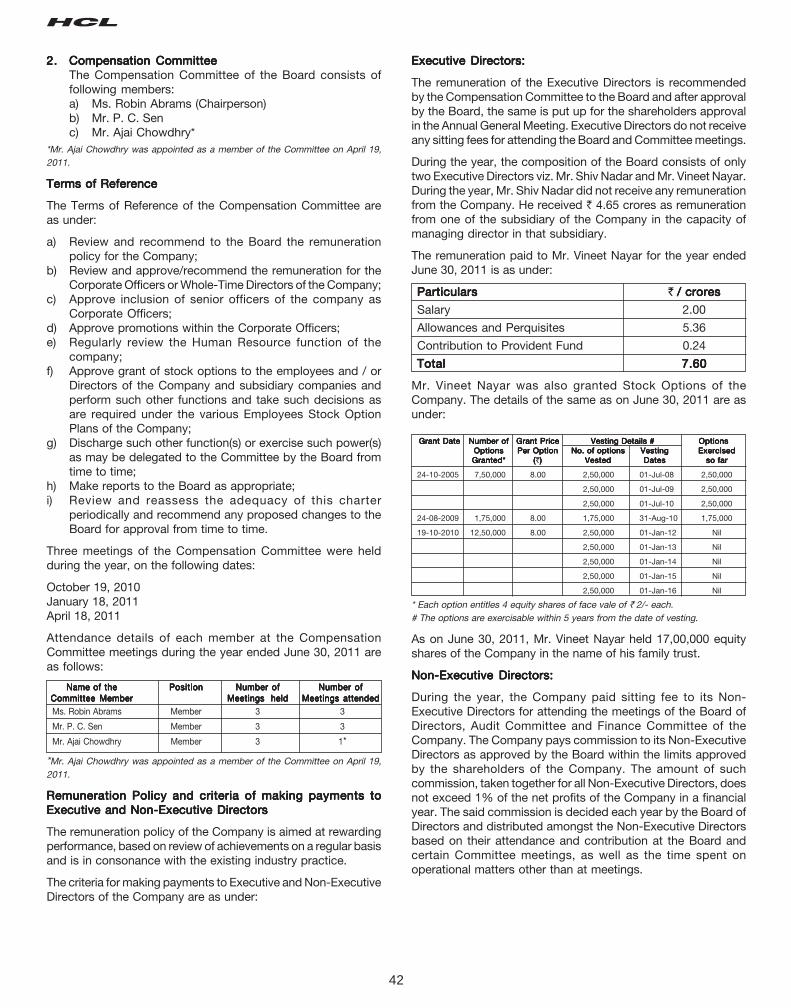
42
2.2.2.2.2. Compensation CommitteeCompensation CommitteeCompensation CommitteeCompensation CommitteeCompensation CommitteeThe Compensation Committee of the Board consists offollowing members:a) Ms. Robin Abrams (Chairperson)b) Mr. P. C. Senc) Mr. Ajai Chowdhry*
*Mr. Ajai Chowdhry was appointed as a member of the Committee on April 19,2011.
Terms of ReferenceTerms of ReferenceTerms of ReferenceTerms of ReferenceTerms of Reference
The Terms of Reference of the Compensation Committee areas under:
a) Review and recommend to the Board the remunerationpolicy for the Company;
b) Review and approve/recommend the remuneration for theCorporate Officers or Whole-Time Directors of the Company;
c) Approve inclusion of senior officers of the company asCorporate Officers;
d) Approve promotions within the Corporate Officers;e) Regularly review the Human Resource function of the
company;f) Approve grant of stock options to the employees and / or
Directors of the Company and subsidiary companies andperform such other functions and take such decisions asare required under the various Employees Stock OptionPlans of the Company;
g) Discharge such other function(s) or exercise such power(s)as may be delegated to the Committee by the Board fromtime to time;
h) Make reports to the Board as appropriate;i) Review and reassess the adequacy of this charter
periodically and recommend any proposed changes to theBoard for approval from time to time.
Three meetings of the Compensation Committee were heldduring the year, on the following dates:
October 19, 2010January 18, 2011April 18, 2011
Attendance details of each member at the CompensationCommittee meetings during the year ended June 30, 2011 areas follows:
Name of theName of theName of theName of theName of the PositionPositionPositionPositionPosition Number ofNumber ofNumber ofNumber ofNumber of Number ofNumber ofNumber ofNumber ofNumber ofCommittee MemberCommittee MemberCommittee MemberCommittee MemberCommittee Member Meetings heldMeetings heldMeetings heldMeetings heldMeetings held Meetings attendedMeetings attendedMeetings attendedMeetings attendedMeetings attendedMs. Robin Abrams Member 3 3
Mr. P. C. Sen Member 3 3
Mr. Ajai Chowdhry Member 3 1*
*Mr. Ajai Chowdhry was appointed as a member of the Committee on April 19,2011.
Remuneration Policy and criteria of making payments toRemuneration Policy and criteria of making payments toRemuneration Policy and criteria of making payments toRemuneration Policy and criteria of making payments toRemuneration Policy and criteria of making payments toExecutive and Non-Executive DirectorsExecutive and Non-Executive DirectorsExecutive and Non-Executive DirectorsExecutive and Non-Executive DirectorsExecutive and Non-Executive Directors
The remuneration policy of the Company is aimed at rewardingperformance, based on review of achievements on a regular basisand is in consonance with the existing industry practice.
The criteria for making payments to Executive and Non-ExecutiveDirectors of the Company are as under:
Executive Directors:Executive Directors:Executive Directors:Executive Directors:Executive Directors:
The remuneration of the Executive Directors is recommendedby the Compensation Committee to the Board and after approvalby the Board, the same is put up for the shareholders approvalin the Annual General Meeting. Executive Directors do not receiveany sitting fees for attending the Board and Committee meetings.
During the year, the composition of the Board consists of onlytwo Executive Directors viz. Mr. Shiv Nadar and Mr. Vineet Nayar.During the year, Mr. Shiv Nadar did not receive any remunerationfrom the Company. He received ` 4.65 crores as remunerationfrom one of the subsidiary of the Company in the capacity ofmanaging director in that subsidiary.
The remuneration paid to Mr. Vineet Nayar for the year endedJune 30, 2011 is as under:
ParticularsParticularsParticularsParticularsParticulars ` / crores/ crores/ crores/ crores/ crores
Salary 2.00
Allowances and Perquisites 5.36
Contribution to Provident Fund 0.24
TotalTotalTotalTotalTotal 7.607.607.607.607.60
Mr. Vineet Nayar was also granted Stock Options of theCompany. The details of the same as on June 30, 2011 are asunder:
Grant DateGrant DateGrant DateGrant DateGrant Date Number ofNumber ofNumber ofNumber ofNumber of Grant PriceGrant PriceGrant PriceGrant PriceGrant Price Vesting Details #Vesting Details #Vesting Details #Vesting Details #Vesting Details # OptionsOptionsOptionsOptionsOptionsOptionsOptionsOptionsOptionsOptions Per OptionPer OptionPer OptionPer OptionPer Option No. of optionsNo. of optionsNo. of optionsNo. of optionsNo. of options VestingVestingVestingVestingVesting ExercisedExercisedExercisedExercisedExercisedGranted*Granted*Granted*Granted*Granted* (((((`))))) VestedVestedVestedVestedVested DatesDatesDatesDatesDates so farso farso farso farso far
24-10-2005 7,50,000 8.00 2,50,000 01-Jul-08 2,50,000
2,50,000 01-Jul-09 2,50,000
2,50,000 01-Jul-10 2,50,000
24-08-2009 1,75,000 8.00 1,75,000 31-Aug-10 1,75,000
19-10-2010 12,50,000 8.00 2,50,000 01-Jan-12 Nil
2,50,000 01-Jan-13 Nil
2,50,000 01-Jan-14 Nil
2,50,000 01-Jan-15 Nil
2,50,000 01-Jan-16 Nil
* Each option entitles 4 equity shares of face vale of ` 2/- each.# The options are exercisable within 5 years from the date of vesting.
As on June 30, 2011, Mr. Vineet Nayar held 17,00,000 equityshares of the Company in the name of his family trust.
Non-Executive Directors:Non-Executive Directors:Non-Executive Directors:Non-Executive Directors:Non-Executive Directors:
During the year, the Company paid sitting fee to its Non-Executive Directors for attending the meetings of the Board ofDirectors, Audit Committee and Finance Committee of theCompany. The Company pays commission to its Non-ExecutiveDirectors as approved by the Board within the limits approvedby the shareholders of the Company. The amount of suchcommission, taken together for all Non-Executive Directors, doesnot exceed 1% of the net profits of the Company in a financialyear. The said commission is decided each year by the Board ofDirectors and distributed amongst the Non-Executive Directorsbased on their attendance and contribution at the Board andcertain Committee meetings, as well as the time spent onoperational matters other than at meetings.
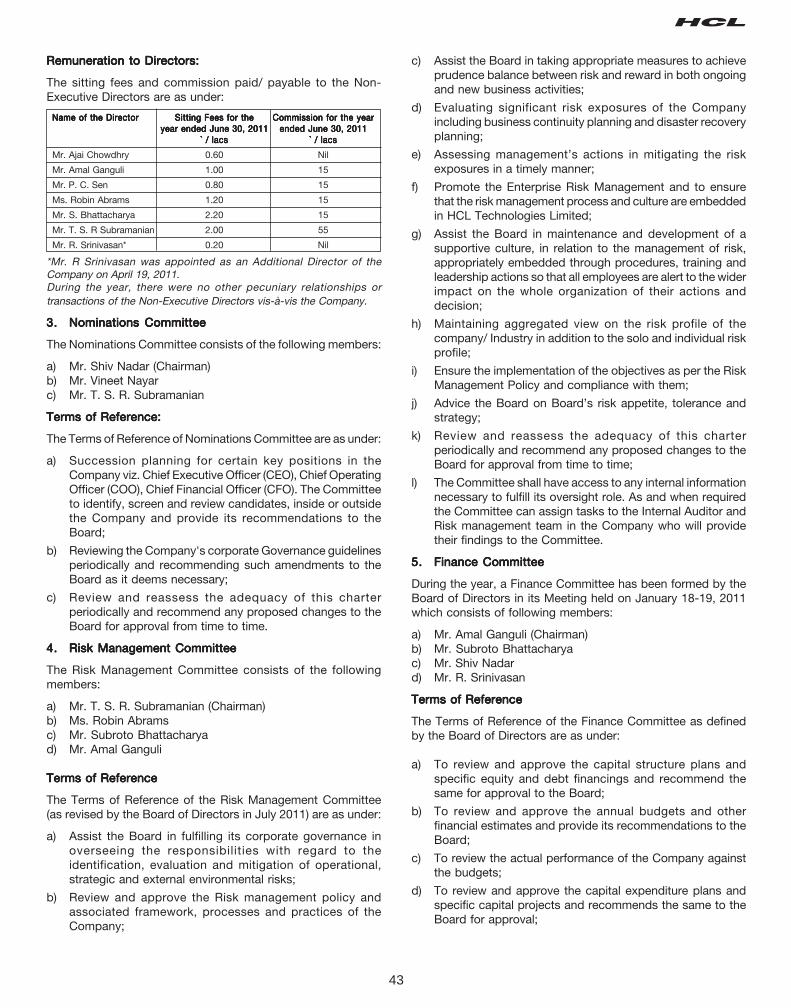
43
Remuneration to Directors:Remuneration to Directors:Remuneration to Directors:Remuneration to Directors:Remuneration to Directors:
The sitting fees and commission paid/ payable to the Non-Executive Directors are as under:
Name of the DirectorName of the DirectorName of the DirectorName of the DirectorName of the Director Sitting Fees for theSitting Fees for theSitting Fees for theSitting Fees for theSitting Fees for the Commission for the yearCommission for the yearCommission for the yearCommission for the yearCommission for the yearyear ended June 30, 2011year ended June 30, 2011year ended June 30, 2011year ended June 30, 2011year ended June 30, 2011 ended June 30, 2011ended June 30, 2011ended June 30, 2011ended June 30, 2011ended June 30, 2011
` / lacs` / lacs` / lacs` / lacs` / lacs ` / lacs` / lacs` / lacs` / lacs` / lacs
Mr. Ajai Chowdhry 0.60 Nil
Mr. Amal Ganguli 1.00 15
Mr. P. C. Sen 0.80 15
Ms. Robin Abrams 1.20 15
Mr. S. Bhattacharya 2.20 15
Mr. T. S. R Subramanian 2.00 55
Mr. R. Srinivasan* 0.20 Nil
*Mr. R Srinivasan was appointed as an Additional Director of theCompany on April 19, 2011.During the year, there were no other pecuniary relationships ortransactions of the Non-Executive Directors vis-à-vis the Company.
3.3.3.3.3. Nominations CommitteeNominations CommitteeNominations CommitteeNominations CommitteeNominations Committee
The Nominations Committee consists of the following members:
a) Mr. Shiv Nadar (Chairman)b) Mr. Vineet Nayarc) Mr. T. S. R. Subramanian
Terms of Reference:Terms of Reference:Terms of Reference:Terms of Reference:Terms of Reference:
The Terms of Reference of Nominations Committee are as under:
a) Succession planning for certain key positions in theCompany viz. Chief Executive Officer (CEO), Chief OperatingOfficer (COO), Chief Financial Officer (CFO). The Committeeto identify, screen and review candidates, inside or outsidethe Company and provide its recommendations to theBoard;
b) Reviewing the Company's corporate Governance guidelinesperiodically and recommending such amendments to theBoard as it deems necessary;
c) Review and reassess the adequacy of this charterperiodically and recommend any proposed changes to theBoard for approval from time to time.
4.4.4.4.4. Risk Management CommitteeRisk Management CommitteeRisk Management CommitteeRisk Management CommitteeRisk Management Committee
The Risk Management Committee consists of the followingmembers:
a) Mr. T. S. R. Subramanian (Chairman)b) Ms. Robin Abramsc) Mr. Subroto Bhattacharyad) Mr. Amal Ganguli
Terms of ReferenceTerms of ReferenceTerms of ReferenceTerms of ReferenceTerms of Reference
The Terms of Reference of the Risk Management Committee(as revised by the Board of Directors in July 2011) are as under:
a) Assist the Board in fulfilling its corporate governance inoverseeing the responsibilities with regard to theidentification, evaluation and mitigation of operational,strategic and external environmental risks;
b) Review and approve the Risk management policy andassociated framework, processes and practices of theCompany;
c) Assist the Board in taking appropriate measures to achieveprudence balance between risk and reward in both ongoingand new business activities;
d) Evaluating significant risk exposures of the Companyincluding business continuity planning and disaster recoveryplanning;
e) Assessing management’s actions in mitigating the riskexposures in a timely manner;
f) Promote the Enterprise Risk Management and to ensurethat the risk management process and culture are embeddedin HCL Technologies Limited;
g) Assist the Board in maintenance and development of asupportive culture, in relation to the management of risk,appropriately embedded through procedures, training andleadership actions so that all employees are alert to the widerimpact on the whole organization of their actions anddecision;
h) Maintaining aggregated view on the risk profile of thecompany/ Industry in addition to the solo and individual riskprofile;
i) Ensure the implementation of the objectives as per the RiskManagement Policy and compliance with them;
j) Advice the Board on Board’s risk appetite, tolerance andstrategy;
k) Review and reassess the adequacy of this charterperiodically and recommend any proposed changes to theBoard for approval from time to time;
l) The Committee shall have access to any internal informationnecessary to fulfill its oversight role. As and when requiredthe Committee can assign tasks to the Internal Auditor andRisk management team in the Company who will providetheir findings to the Committee.
5.5.5.5.5. Finance CommitteeFinance CommitteeFinance CommitteeFinance CommitteeFinance Committee
During the year, a Finance Committee has been formed by theBoard of Directors in its Meeting held on January 18-19, 2011which consists of following members:
a) Mr. Amal Ganguli (Chairman)b) Mr. Subroto Bhattacharyac) Mr. Shiv Nadard) Mr. R. Srinivasan
Terms of ReferenceTerms of ReferenceTerms of ReferenceTerms of ReferenceTerms of Reference
The Terms of Reference of the Finance Committee as definedby the Board of Directors are as under:
a) To review and approve the capital structure plans andspecific equity and debt financings and recommend thesame for approval to the Board;
b) To review and approve the annual budgets and otherfinancial estimates and provide its recommendations to theBoard;
c) To review the actual performance of the Company againstthe budgets;
d) To review and approve the capital expenditure plans andspecific capital projects and recommends the same to theBoard for approval;
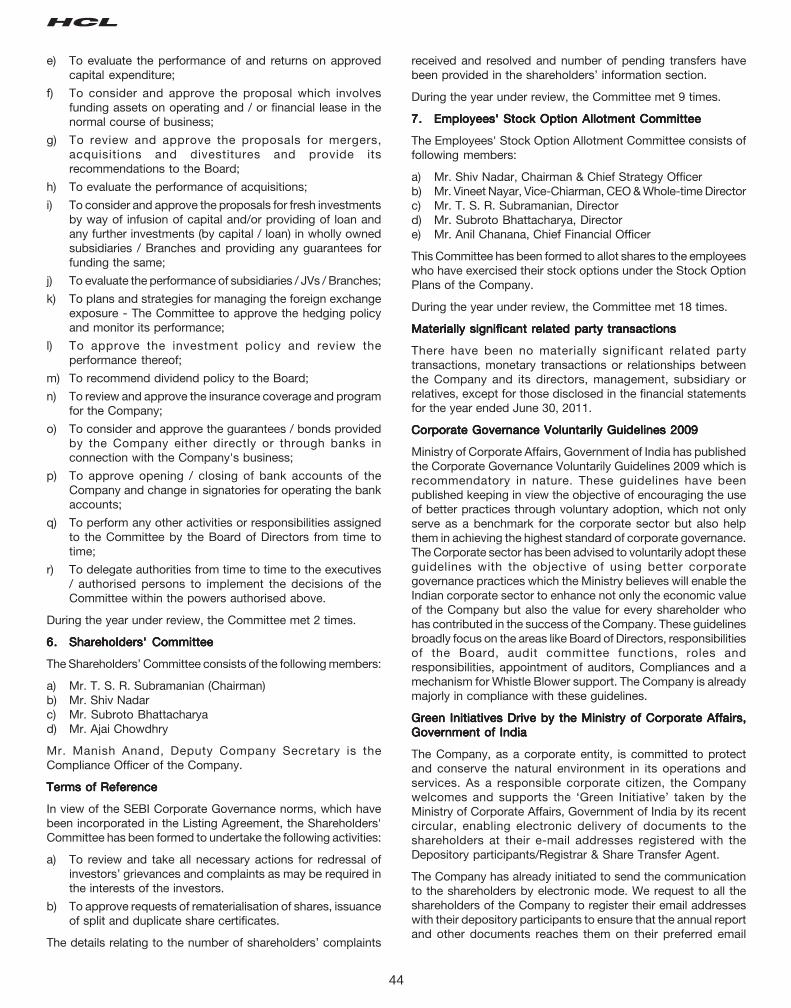
44
e) To evaluate the performance of and returns on approvedcapital expenditure;
f) To consider and approve the proposal which involvesfunding assets on operating and / or financial lease in thenormal course of business;
g) To review and approve the proposals for mergers,acquisitions and divestitures and provide itsrecommendations to the Board;
h) To evaluate the performance of acquisitions;
i) To consider and approve the proposals for fresh investmentsby way of infusion of capital and/or providing of loan andany further investments (by capital / loan) in wholly ownedsubsidiaries / Branches and providing any guarantees forfunding the same;
j) To evaluate the performance of subsidiaries / JVs / Branches;
k) To plans and strategies for managing the foreign exchangeexposure - The Committee to approve the hedging policyand monitor its performance;
l) To approve the investment policy and review theperformance thereof;
m) To recommend dividend policy to the Board;
n) To review and approve the insurance coverage and programfor the Company;
o) To consider and approve the guarantees / bonds providedby the Company either directly or through banks inconnection with the Company's business;
p) To approve opening / closing of bank accounts of theCompany and change in signatories for operating the bankaccounts;
q) To perform any other activities or responsibilities assignedto the Committee by the Board of Directors from time totime;
r) To delegate authorities from time to time to the executives/ authorised persons to implement the decisions of theCommittee within the powers authorised above.
During the year under review, the Committee met 2 times.
6.6.6.6.6. Shareholders' CommitteeShareholders' CommitteeShareholders' CommitteeShareholders' CommitteeShareholders' Committee
The Shareholders’ Committee consists of the following members:
a) Mr. T. S. R. Subramanian (Chairman)b) Mr. Shiv Nadarc) Mr. Subroto Bhattacharyad) Mr. Ajai Chowdhry
Mr. Manish Anand, Deputy Company Secretary is theCompliance Officer of the Company.
Terms of ReferenceTerms of ReferenceTerms of ReferenceTerms of ReferenceTerms of Reference
In view of the SEBI Corporate Governance norms, which havebeen incorporated in the Listing Agreement, the Shareholders'Committee has been formed to undertake the following activities:
a) To review and take all necessary actions for redressal ofinvestors’ grievances and complaints as may be required inthe interests of the investors.
b) To approve requests of rematerialisation of shares, issuanceof split and duplicate share certificates.
The details relating to the number of shareholders’ complaints
received and resolved and number of pending transfers havebeen provided in the shareholders’ information section.
During the year under review, the Committee met 9 times.
7.7.7.7.7. Employees' Stock Option Allotment CommitteeEmployees' Stock Option Allotment CommitteeEmployees' Stock Option Allotment CommitteeEmployees' Stock Option Allotment CommitteeEmployees' Stock Option Allotment Committee
The Employees' Stock Option Allotment Committee consists offollowing members:
a) Mr. Shiv Nadar, Chairman & Chief Strategy Officerb) Mr. Vineet Nayar, Vice-Chiarman, CEO & Whole-time Directorc) Mr. T. S. R. Subramanian, Directord) Mr. Subroto Bhattacharya, Directore) Mr. Anil Chanana, Chief Financial Officer
This Committee has been formed to allot shares to the employeeswho have exercised their stock options under the Stock OptionPlans of the Company.
During the year under review, the Committee met 18 times.
Materially significant related party transactionsMaterially significant related party transactionsMaterially significant related party transactionsMaterially significant related party transactionsMaterially significant related party transactions
There have been no materially significant related partytransactions, monetary transactions or relationships betweenthe Company and its directors, management, subsidiary orrelatives, except for those disclosed in the financial statementsfor the year ended June 30, 2011.
Corporate Governance Voluntarily Guidelines 2009Corporate Governance Voluntarily Guidelines 2009Corporate Governance Voluntarily Guidelines 2009Corporate Governance Voluntarily Guidelines 2009Corporate Governance Voluntarily Guidelines 2009
Ministry of Corporate Affairs, Government of India has publishedthe Corporate Governance Voluntarily Guidelines 2009 which isrecommendatory in nature. These guidelines have beenpublished keeping in view the objective of encouraging the useof better practices through voluntary adoption, which not onlyserve as a benchmark for the corporate sector but also helpthem in achieving the highest standard of corporate governance.The Corporate sector has been advised to voluntarily adopt theseguidelines with the objective of using better corporategovernance practices which the Ministry believes will enable theIndian corporate sector to enhance not only the economic valueof the Company but also the value for every shareholder whohas contributed in the success of the Company. These guidelinesbroadly focus on the areas like Board of Directors, responsibilitiesof the Board, audit committee functions, roles andresponsibilities, appointment of auditors, Compliances and amechanism for Whistle Blower support. The Company is alreadymajorly in compliance with these guidelines.
Green Initiatives Drive by the Ministry of Corporate Affairs,Green Initiatives Drive by the Ministry of Corporate Affairs,Green Initiatives Drive by the Ministry of Corporate Affairs,Green Initiatives Drive by the Ministry of Corporate Affairs,Green Initiatives Drive by the Ministry of Corporate Affairs,Government of IndiaGovernment of IndiaGovernment of IndiaGovernment of IndiaGovernment of India
The Company, as a corporate entity, is committed to protectand conserve the natural environment in its operations andservices. As a responsible corporate citizen, the Companywelcomes and supports the ‘Green Initiative’ taken by theMinistry of Corporate Affairs, Government of India by its recentcircular, enabling electronic delivery of documents to theshareholders at their e-mail addresses registered with theDepository participants/Registrar & Share Transfer Agent.
The Company has already initiated to send the communicationto the shareholders by electronic mode. We request to all theshareholders of the Company to register their email addresseswith their depository participants to ensure that the annual reportand other documents reaches them on their preferred email
45
address. Shareholders who hold shares in physical form arerequested to register their e-mail addresses with the Registrar &Share Transfer Agent, by sending a letter, duly signed by thefirst/ sole holder quoting details of Folio No.
Observance of the Secretarial Standards issued by theObservance of the Secretarial Standards issued by theObservance of the Secretarial Standards issued by theObservance of the Secretarial Standards issued by theObservance of the Secretarial Standards issued by theInstitute of Company Secretaries of IndiaInstitute of Company Secretaries of IndiaInstitute of Company Secretaries of IndiaInstitute of Company Secretaries of IndiaInstitute of Company Secretaries of India
The Institute of Company Secretaries of India (ICSI), one of thepremier professional bodies in India, has issued secretarialstandards on important aspects like board meetings, generalmeetings, payment of dividend, maintenance of registers andrecords, minutes of meetings, transmission of shares anddebentures, passing of resolution by circulation, affixing ofcommon seal, forfeiture of shares and board's report. Althoughthese standards are optional in nature, the Company howeversubstantially adheres to the standards voluntarily.
SustainabilitySustainabilitySustainabilitySustainabilitySustainability
Sustainability is simply good business. Integrating broadersocietal concerns into company strategy makes sound businesssense. Our own interests can be realized by incorporating theinterests of all those with whom we have a mutually dependentrelationship into our operating model. Our sustainability programrests on the 4 R's - Responsible business, Renew Eco System,Repay Society and Redefine Workplace.
Our sustainability priorities are multi fold. Employees wellbeingand creating a culture of innovation through trust andtransparency, and exceeding Customer expectations arepriorities to us. While working on business growth we give equalimportance to the eco system. We are a signatory of UN GlobalCompact (UNGC) and its 10 principles. The Company's seniormanagement team is active in World Economic Forum. We willleverage these global forums to learn and adopt new practices,as well as contribute to public policies.
We have provided few of our programs in this report and theadditional information is available in our sustainability reportavailable on our website www.hcltech.com.
(a)(a)(a)(a)(a) Diversity and The Employee First Councils (EFC)Diversity and The Employee First Councils (EFC)Diversity and The Employee First Councils (EFC)Diversity and The Employee First Councils (EFC)Diversity and The Employee First Councils (EFC)
We reach out to a diverse talent pool that comprises of women,different nationalities, cultures, work experiences and peoplewith disability. In India we recruit employees from Tier II and TierIII cities to facilitate inclusive growth.
We focus on creating and sustaining a nurturing environmentfor employees with diverse backgrounds. Our team leaders areequipped with skills to work across the globe in virtual teams.Affinity networks and Employee First Councils (EFC) help usreach out to the employees of the Company from diversebackgrounds. The networks ensure that diverse perspectivesare included in all business operations.
EFC is a unique platform for all the employees of the Companyto lead change. It is a participative and democratic forumdeveloped for the employees and run by the employees. TheEFC provide opportunities to a diverse group of individuals tocome together and work towards a common cause that theyare passionate about. EFC have nearly 2500+ active memberswho have been instrumental in organizing over 5670 events sinceinception two years ago. A brief snapshot of the various councilssuch as Community, Talent, Grey, Green, Sports, Wellness,
Women and Ambassador are provided in our sustainability reportunder “Redefine Workplace” section.
We also focus on creating support systems and policies thatare based both on infrastructure and people, to facilitate worklife continuity. Our programs include development conferencesand social media for improving the awareness.
(b) Green Initiatives(b) Green Initiatives(b) Green Initiatives(b) Green Initiatives(b) Green Initiatives
Water SustenanceWater SustenanceWater SustenanceWater SustenanceWater Sustenance
We are mindful of the potential impact of our operations andclimate change on water. Our facilities are currently beingassessed for water related impact and risks.
Managing E-wasteManaging E-wasteManaging E-wasteManaging E-wasteManaging E-waste
Our E-waste management is guided by the E-waste policy andcomply with the Pollution Control Board (India) norms for disposaland select vendors approved by the Board. Our IT servicesdepartments which procure and manage internal IT operationsoversee E-waste management and also periodically audit theprocess. During the year, there has not been any non compliancebased on the audits.
Paper UsagePaper UsagePaper UsagePaper UsagePaper Usage
Employees are encouraged to reduce the volume of pagesprinted. Our goals for next year include maximizing usage ofrecycled paper for printing and photocopying purposes.
Energy ManagementEnergy ManagementEnergy ManagementEnergy ManagementEnergy Management
Through our sustainability efforts, we were able to cut down ourcarbon footprint by 11.71% since 2008. We are following adetailed plan including investments for renewable energy todecrease the emissions by 20% in 2020 and have set ourselvesa goal to reduce water consumption by 5% in the next 3 years.
c)c)c)c)c) Community OutreachCommunity OutreachCommunity OutreachCommunity OutreachCommunity Outreach
Founded on the Employees First philosophy, we believe thatemployees are the real value creators who can make a differencenot only to the organization, but their collective effort can changesociety itself. Our commitment to make a positive difference isnot about a one-off initiative but a sustained effort to make avisible change to people's lives.
During the year, the employees of the Company have spent morethan 25,000 person hours on outreach programs coveringchildren, women, disabled and the economically less privilegedin the areas of education, health, hygiene, counseling, coachingand infrastructure such as shelter and sanitation facilities.
The first sustainability report of the Company for the year endedJune 30, 2011 is being launched. Various programs such as“Teach@work”, “Friend in Need” and “MAD LTD” are availableunder “repay Society” of the Sustainability Report.
Sexual Harassment PolicySexual Harassment PolicySexual Harassment PolicySexual Harassment PolicySexual Harassment Policy
In order to ensure an additional available mode for theemployees, under the Sexual Harassment Policy, to voice theirconcern and bring it to the organization's notice, a mechanismis in place for employees to have a critical direct access to theChief Executive Officer to report any issues, abuse, etc. underthe said policy of the Company.
46
Whistle Blower PolicyWhistle Blower PolicyWhistle Blower PolicyWhistle Blower PolicyWhistle Blower Policy
The principles of Trust through Transparency and Accountabilityare at the core of the Company's existence. To ensure strictcompliance with ethical and legal standards across the company,the Whistleblower policy has been created to provide appropriateavenues to the employees, contractors, clients, vendors, internalor external auditors, law enforcement /regulatory agencies or
other third parties to bring to the attention of the managementany issues which are perceived to be in violation or in conflictwith the fundamental business principles of the Company.
The employees are encouraged to raise any of their concernsby way of whistle blowing. All cases registered under the WhistleBlower Policy of the Company are reported directly to the CEO.
General Body MeetingsGeneral Body MeetingsGeneral Body MeetingsGeneral Body MeetingsGeneral Body Meetings
The location and time of the General Meetings held during the preceding 3 years are as follows:
YearYearYearYearYear DateDateDateDateDate VenueVenueVenueVenueVenue TimeTimeTimeTimeTime Special ResolutionSpecial ResolutionSpecial ResolutionSpecial ResolutionSpecial Resolution
Annual General MeetingsAnnual General MeetingsAnnual General MeetingsAnnual General MeetingsAnnual General Meetings
2007-2008 October 22, 2008 FICCI Auditorium, 11.00 A.M. • Approval u/s 309 (4) (b) of the Companies Act, 1956 for
Federation House, payment of commission not exceeding one percent of the net
Tansen Marg, New Delhi. profit of the Company to all the Non-Executive Directors of the
Company collectively in each financial year over a period of five
years beginning from July 1, 2008.
• Approval u/s 372A of the Companies Act, 1956 to make
investment(s) from time to time by way of subscription, purchase
and/or otherwise in the securities of any other body corporate as
the Board may in its absolute discretion deem beneficial and in
the interest of the Company, upto ` 4,000 Crores (Rupees Four
Thousand Crores) over and above the limits that are specified
under section 372A of the Companies Act, 1956.
2008-2009 December 8, 2009 FICCI Auditorium, 11.00 A.M. • Approval u/s 198, 269, 309, and all other applicable provisions of
Federation House, the Companies Act, 1956, (Act) read with Schedule XIII to the
Tansen Marg, New Delhi. said Act, to re-appoint Mr. Shiv Nadar, Chairman & Chief Strategy
Officer as Managing Director of the Company for a period of 5
years w.e.f. September 13, 2009 with the designation of Chairman
& Chief Strategy officer or such other designation as the Board/
Compensation Committee may decide from time to time.
2009-2010 October 28, 2010 FICCI Auditorium, 11.00 A.M. –
Federation House,
Tansen Marg, New Delhi.
Summary of the results of the postal ballot of the Company onJanuary 27, 2011 is as follows:
S.S.S.S.S. ParticularsParticularsParticularsParticularsParticulars DetailsDetailsDetailsDetailsDetailsNo.No.No.No.No.
(a) Total Postal Ballot Forms receivedTotal Postal Ballot Forms receivedTotal Postal Ballot Forms receivedTotal Postal Ballot Forms receivedTotal Postal Ballot Forms receivedNo. of Postal Ballot Forms 1,479No. of Votes exercised 49,84,33,360
(b) Invalid Postal Ballot FormsInvalid Postal Ballot FormsInvalid Postal Ballot FormsInvalid Postal Ballot FormsInvalid Postal Ballot FormsNo. of Invalid Postal Ballot Forms 133No. of Invalid Votes 19,13,618
(c) Valid Postal Ballot FormsValid Postal Ballot FormsValid Postal Ballot FormsValid Postal Ballot FormsValid Postal Ballot Forms- No. of Valid Postal Ballots Forms 1,346- No. of Valid Votes 49,65,19,742
(d) Votes in favour of the ResolutionVotes in favour of the ResolutionVotes in favour of the ResolutionVotes in favour of the ResolutionVotes in favour of the Resolution- No. of Postal Ballots Forms 1,298- No. of Votes in favour of the resolution 49,55,12,537- Percentage of Votes in favour of the resolution 99.7971%
(e) Votes against the ResolutionVotes against the ResolutionVotes against the ResolutionVotes against the ResolutionVotes against the Resolution- No. of Postal Ballot Forms 48- No. of Votes cast against the resolution 10,07,205- Percentage of votes against the resolution 0.2029%
The above results were announced by the Chairman on January 27, 2011.
Details of Resolution passed by way of Postal Ballot:Details of Resolution passed by way of Postal Ballot:Details of Resolution passed by way of Postal Ballot:Details of Resolution passed by way of Postal Ballot:Details of Resolution passed by way of Postal Ballot:
During the year ended June 30, 2011, pursuant to Section 192Aof the Companies Act, 1956 read with the Companies (Passingof the Resolution by Postal Ballot) Rules, 2001, shareholders ofthe Company have approved a resolution by means of postalballot, the details of which are as under:• Ordinary Resolution for the appointment and terms ofMr. Vineet Nayar as the Vice-Chairman, Chief Executive Officerand Whole-time Director of the Company for a period of 5 yearsw.e.f. November 1, 2010.
Details of the person who conducted postal ballot exercise:Details of the person who conducted postal ballot exercise:Details of the person who conducted postal ballot exercise:Details of the person who conducted postal ballot exercise:Details of the person who conducted postal ballot exercise:
During the year ended June 30, 2011, postal ballot exercise wasconducted and Mr. Nityanand Singh, Practising CompanySecretary was appointed as a scrutinizer for the same. The resultsof the postal ballot were announced on January 27, 2011.
47
Subsidiary CompaniesSubsidiary CompaniesSubsidiary CompaniesSubsidiary CompaniesSubsidiary Companies
During the year, none of the subsidiaries was a material non-listed Indian subsidiary Company as per the criteria given inclause 49 of the Listing Agreement. The Audit Committee of theCompany reviews the financial statements and investmentsmade by the unlisted subsidiary companies. The minutes of theboard meetings as well as the statements of significanttransactions and arrangements entered into by the unlistedsubsidiary companies, if any, are placed before the Board ofDirectors of the Company from time to time.
CEO/ CFO CertificationCEO/ CFO CertificationCEO/ CFO CertificationCEO/ CFO CertificationCEO/ CFO Certification
The Certificate as stipulated in clause 49(V) of the ListingAgreement was placed before the Board along with the financialstatements for the year ended June 30, 2011 and the Boardreviewed the same. The said Certificate is provided elsewherein the Annual Report.
DisclosuresDisclosuresDisclosuresDisclosuresDisclosures
a)a)a)a)a) Related party transactionsRelated party transactionsRelated party transactionsRelated party transactionsRelated party transactions
The details of the transactions with related parties or others,if any, as prescribed in the Listing Agreement, are beingplaced before the Audit Committee from time to time. Duringthe year under review, the Company has not entered intoany transaction of a material nature with its subsidiaries,promoters, directors or the management, their relatives, etc.,that may have any potential conflict with the interest of theCompany.
b)b)b)b)b) Compliances by the CompanyCompliances by the CompanyCompliances by the CompanyCompliances by the CompanyCompliances by the Company
The Company has complied with the requirements of theStock Exchanges, SEBI and other statutory authorities onall matters relating to capital markets during the last threeyears. No penalties or strictures have been imposed on theCompany by the Stock Exchanges, SEBI or any otherstatutory authorities relating to the above.
c)c)c)c)c) Material transactions with senior managerial personnelMaterial transactions with senior managerial personnelMaterial transactions with senior managerial personnelMaterial transactions with senior managerial personnelMaterial transactions with senior managerial personnel
During the year, no material transaction has been enteredinto by the Company with the senior management personnelwhere they had or were deemed to have any personalinterest that may have a potential conflict with the interestof the Company. The Company has obtained requisitedeclarations from all senior management personnel in thisregard and the same were placed before the Board ofDirectors.
d)d)d)d)d) Other DisclosuresOther DisclosuresOther DisclosuresOther DisclosuresOther Disclosures
The Company has also laid down the procedures to informthe Board members about the risk assessment andminimization procedures.
During the year, the Company did not raise any moneythrough public issue, right issue or preferential issue andthere was no unspent money raised through such issues.
Means of CommunicationMeans of CommunicationMeans of CommunicationMeans of CommunicationMeans of Communication
a)a)a)a)a) Quarterly Results:Quarterly Results:Quarterly Results:Quarterly Results:Quarterly Results: Quarterly Results of the Company aregenerally published inter alia, in Financial Express andJansatta newspapers.
b)b)b)b)b) Website:Website:Website:Website:Website: Company’s corporate website www.hcltech.com
provides comprehensive information on company’s portfolioof businesses. The website has an entire section dedicatedto Company’s profile, its core values, corporate governance,business lines and Industry sections. An exclusive sectionon ‘Investors’ enables them to access information at theirconvenience. The entire Reports as well as quarterly, halfyearly, annual financial statements, releases andshareholding patterns are available in downloadable formatas a measure of added convenience to the investors.
c)c)c)c)c) News Releases, Presentations, etc.:News Releases, Presentations, etc.:News Releases, Presentations, etc.:News Releases, Presentations, etc.:News Releases, Presentations, etc.: Official news releases,detailed presentations made to media, analysts, institutionalinvestors, etc. are displayed on the Company's websitewww.hcltech.com. Official media releases are also sent tothe Stock Exchanges.
d)d)d)d)d) Annual Report:Annual Report:Annual Report:Annual Report:Annual Report: Annual Report containing, inter alia, AuditedAnnual Accounts, Consolidated Financial Statements,Director's Report, Auditor’s Report and other importantinformation is circulated to members and others entitledthereto. The Annual Report of the Company is available onthe Company's website in a user- friendly and downloadableform.
e)e)e)e)e) Management Discussion and Analysis:Management Discussion and Analysis:Management Discussion and Analysis:Management Discussion and Analysis:Management Discussion and Analysis: The Management'sDiscussion and Analysis (MD & A) Report forms part of theAnnual Report.
f)f)f)f)f) Intimation to the Stock Exchanges:Intimation to the Stock Exchanges:Intimation to the Stock Exchanges:Intimation to the Stock Exchanges:Intimation to the Stock Exchanges: The Companyintimates the Stock Exchanges all price sensitive informationor such other matters which in its opinion are material andof relevance to the Shareholders.
g)g)g)g)g) Corporate Filing and Dissemination System (CFDS) CORPCorporate Filing and Dissemination System (CFDS) CORPCorporate Filing and Dissemination System (CFDS) CORPCorporate Filing and Dissemination System (CFDS) CORPCorporate Filing and Dissemination System (CFDS) CORPFILING:FILING:FILING:FILING:FILING: Pursuant to clause 52 of the Listing Agreement,the Company during the year has uploaded financialinformation like annual and quarterly financial statements,segment-wise results and shareholding pattern on the CFDSwebsite www.corpfiling.co.in
h)h)h)h)h) National ECS facility:National ECS facility:National ECS facility:National ECS facility:National ECS facility: As per RBI notification, with effectfrom October 1, 2009, the remittance of money through ECSis replaced by National Electronic Clearing Services (NECS)and banks have been instructed to move to the NECSplatform.
NECS essentially operates on the new and unique bankaccount number, allotted by banks post implementation ofCore Banking Solutions (CBS) for centralized processes ofinward instructions and efficiency in handling bulktransactions.
The Company is using NECS mandate for remittance ofdividend either through NECS or other electronic modesfailing which the bank details available with DepositoryParticipants are printed on the dividend warrant. All thearrangements are subject to RBI guidelines, issued fromtime to time.
Designated Exclusive email-id:Designated Exclusive email-id:Designated Exclusive email-id:Designated Exclusive email-id:Designated Exclusive email-id: The Company has thefollowing designated email-id [email protected] exclusivelyfor investors servicing.
i)i)i)i)i) Code for Prevention of Insider Trading:Code for Prevention of Insider Trading:Code for Prevention of Insider Trading:Code for Prevention of Insider Trading:Code for Prevention of Insider Trading:
The Company has comprehensive guidelines on preventionof insider trading in line with the SEBI (Prohibition of Insider
48
Trading) Regulations, 1992. The Code for prevention ofInsider Trading inter-alia prohibits purchase/sale of sharesof the Company by employees/directors while in possessionof unpublished price sensitive information in relation to theCompany. The Company within two working days of receiptof the information under the initial and continual disclosuresfrom directors/ employees shall disclose the same to all theStock Exchanges, where the shares of the Company arelisted.
Investor Relations- Enhancing Investor DialogueInvestor Relations- Enhancing Investor DialogueInvestor Relations- Enhancing Investor DialogueInvestor Relations- Enhancing Investor DialogueInvestor Relations- Enhancing Investor Dialogue
Global macro and business environment has been very dynamicin the past year with implications on enterprise’s business andfinancial performance. In this context, corporate recognize theimperatives to maintain continuous dialogue with the investorcommunity. This is done with the objective to abreast theinvestors of all the significant developments that may likely
impact the Company’s performance. This translates into feedingtimely, accurate and relevant information that helps investors intaking informed investment decisions.
We focus on to build investors relations on pillars of trust andtransparency. Our proactive approach has enabled globalinvestor community to better understand our managementobjectives, corporate strategies and overall performance over aperiod of time. Today, we have a mix of quality investors fromacross multiple geographies with long term investment horizondemonstrating their faith in the Company.
To deliver an effective communication, our Investor RelationsDepartment effectively deploys tools like Annual Report,Quarterly Earnings Investor Release, Conference calls, Faceto Face Investor meets, Annual General Meetings and Internet(Web Investor page) to serve as a link to stay connected withinvestors.
Shareholders’ InformationShareholders’ InformationShareholders’ InformationShareholders’ InformationShareholders’ Information
a)a)a)a)a) General InformationGeneral InformationGeneral InformationGeneral InformationGeneral Information
Dates of book closure October 25, 2011 to November 2,2011 (both days inclusive)
Date, time and venue of the ensuing Annual General Meting November 2, 2011 3.00 P.M.Air Force Auditorium, Subroto ParkNew Delhi-110010
Dividend Payment Date (subject to the approval of the shareholders) On or before December 01, 2011Listing of Equity Shares on stock exchanges in India at The National Stock Exchange of India Ltd. (NSE)
Exchange Plaza, 5th Floor, Plot No. C/1G Block, Bandra Kurla Complex, Bandra East,Mumbai - 400 051, India.Tel.: +91-22-26598236, Fax: +91-22-26598237The Bombay Stock Exchange Ltd. (BSE)Phiroze Jeejeebhoy Towers, Dalal Street,Mumbai - 400 001, IndiaTel.: +91-22-22721233, Fax: +91-22-22723121
Listing of Non-Convertible Debentures on stock The Wholesale Debt Market Segment of NSE.exchanges in India atListing fees Paid to all the above stock exchanges for the Year 2011-2012.Stock Code National Stock Exchange - “HCLTECH”
Bombay Stock Exchange - “532281”Corporate Identification Number (CIN) of the Company L74140DL1991PLC046369Registered Office Address 806, Siddharth, 96, Nehru Place,
New Delhi - 110 019, IndiaTel.: +91-11-26444812, Fax: +91-11-26436336Homepage: www.hcltech.com
Registrar & Shares Transfer Agent Alankit Assignments Limited205-208, Anarkali Market,Jhandewalan Extension,New Delhi - 110 055, India.Tel.: +91-11-42541234, 23541234Fax: +91-11-42541967E-mail: [email protected]
Debenture Trustee IDBI Trusteeship Services LimitedAsian Building, Ground Floor,17, R Kamani Marg, Ballard EstateMumbai 400 023
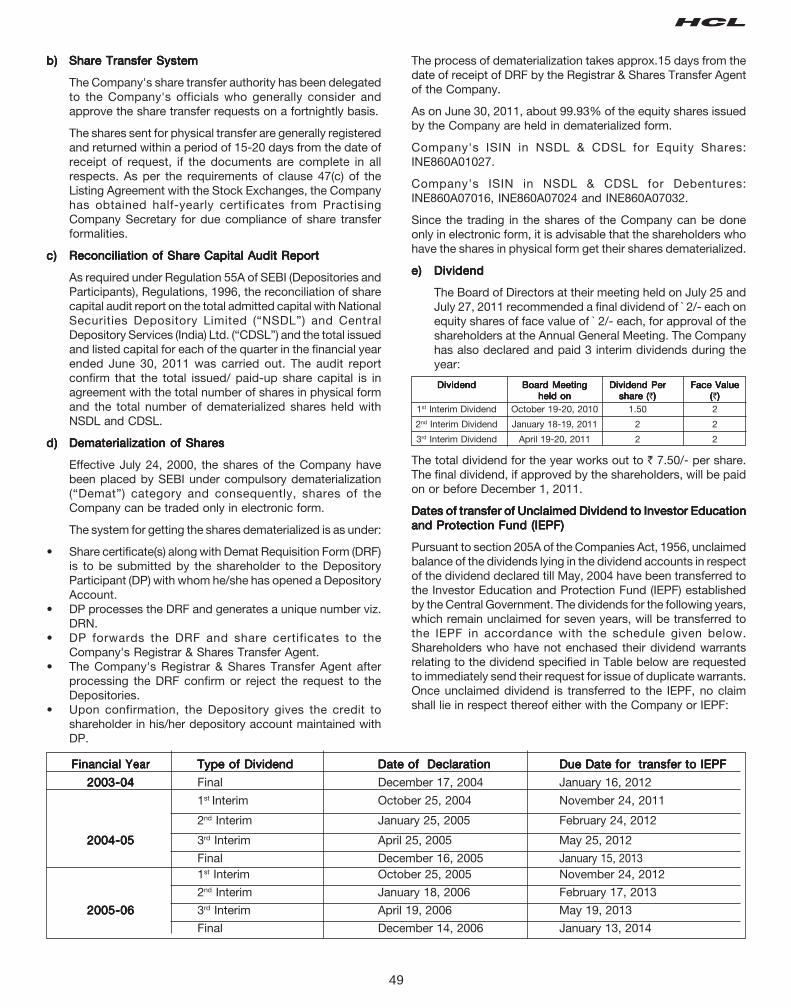
49
b)b)b)b)b) Share Transfer SystemShare Transfer SystemShare Transfer SystemShare Transfer SystemShare Transfer System
The Company's share transfer authority has been delegatedto the Company's officials who generally consider andapprove the share transfer requests on a fortnightly basis.
The shares sent for physical transfer are generally registeredand returned within a period of 15-20 days from the date ofreceipt of request, if the documents are complete in allrespects. As per the requirements of clause 47(c) of theListing Agreement with the Stock Exchanges, the Companyhas obtained half-yearly certificates from PractisingCompany Secretary for due compliance of share transferformalities.
c)c)c)c)c) Reconciliation of Share Capital Audit ReportReconciliation of Share Capital Audit ReportReconciliation of Share Capital Audit ReportReconciliation of Share Capital Audit ReportReconciliation of Share Capital Audit Report
As required under Regulation 55A of SEBI (Depositories andParticipants), Regulations, 1996, the reconciliation of sharecapital audit report on the total admitted capital with NationalSecurities Depository Limited (“NSDL”) and CentralDepository Services (India) Ltd. (“CDSL”) and the total issuedand listed capital for each of the quarter in the financial yearended June 30, 2011 was carried out. The audit reportconfirm that the total issued/ paid-up share capital is inagreement with the total number of shares in physical formand the total number of dematerialized shares held withNSDL and CDSL.
d)d)d)d)d) Dematerialization of SharesDematerialization of SharesDematerialization of SharesDematerialization of SharesDematerialization of Shares
Effective July 24, 2000, the shares of the Company havebeen placed by SEBI under compulsory dematerialization(“Demat”) category and consequently, shares of theCompany can be traded only in electronic form.
The system for getting the shares dematerialized is as under:
• Share certificate(s) along with Demat Requisition Form (DRF)is to be submitted by the shareholder to the DepositoryParticipant (DP) with whom he/she has opened a DepositoryAccount.
• DP processes the DRF and generates a unique number viz.DRN.
• DP forwards the DRF and share certificates to theCompany's Registrar & Shares Transfer Agent.
• The Company's Registrar & Shares Transfer Agent afterprocessing the DRF confirm or reject the request to theDepositories.
• Upon confirmation, the Depository gives the credit toshareholder in his/her depository account maintained withDP.
The process of dematerialization takes approx.15 days from thedate of receipt of DRF by the Registrar & Shares Transfer Agentof the Company.
As on June 30, 2011, about 99.93% of the equity shares issuedby the Company are held in dematerialized form.
Company's ISIN in NSDL & CDSL for Equity Shares:INE860A01027.
Company's ISIN in NSDL & CDSL for Debentures:INE860A07016, INE860A07024 and INE860A07032.
Since the trading in the shares of the Company can be doneonly in electronic form, it is advisable that the shareholders whohave the shares in physical form get their shares dematerialized.
e)e)e)e)e) DividendDividendDividendDividendDividend
The Board of Directors at their meeting held on July 25 andJuly 27, 2011 recommended a final dividend of ̀ 2/- each onequity shares of face value of ` 2/- each, for approval of theshareholders at the Annual General Meeting. The Companyhas also declared and paid 3 interim dividends during theyear:
DividendDividendDividendDividendDividend Board MeetingBoard MeetingBoard MeetingBoard MeetingBoard Meeting Dividend PerDividend PerDividend PerDividend PerDividend Per Face ValueFace ValueFace ValueFace ValueFace Valueheld onheld onheld onheld onheld on share (share (share (share (share (`))))) (((((`)))))
1st Interim Dividend October 19-20, 2010 1.50 2
2nd Interim Dividend January 18-19, 2011 2 2
3rd Interim Dividend April 19-20, 2011 2 2
The total dividend for the year works out to ` 7.50/- per share.The final dividend, if approved by the shareholders, will be paidon or before December 1, 2011.
Dates of transfer of Unclaimed Dividend to Investor EducationDates of transfer of Unclaimed Dividend to Investor EducationDates of transfer of Unclaimed Dividend to Investor EducationDates of transfer of Unclaimed Dividend to Investor EducationDates of transfer of Unclaimed Dividend to Investor Educationand Protection Fund (IEPF)and Protection Fund (IEPF)and Protection Fund (IEPF)and Protection Fund (IEPF)and Protection Fund (IEPF)
Pursuant to section 205A of the Companies Act, 1956, unclaimedbalance of the dividends lying in the dividend accounts in respectof the dividend declared till May, 2004 have been transferred tothe Investor Education and Protection Fund (IEPF) establishedby the Central Government. The dividends for the following years,which remain unclaimed for seven years, will be transferred tothe IEPF in accordance with the schedule given below.Shareholders who have not enchased their dividend warrantsrelating to the dividend specified in Table below are requestedto immediately send their request for issue of duplicate warrants.Once unclaimed dividend is transferred to the IEPF, no claimshall lie in respect thereof either with the Company or IEPF:
Financial Financial Financial Financial Financial YearYearYearYearYear Type of DividendType of DividendType of DividendType of DividendType of Dividend Date of DeclarationDate of DeclarationDate of DeclarationDate of DeclarationDate of Declaration Due Date for transfer to IEPFDue Date for transfer to IEPFDue Date for transfer to IEPFDue Date for transfer to IEPFDue Date for transfer to IEPF
2003-042003-042003-042003-042003-04 Final December 17, 2004 January 16, 2012
1st Interim October 25, 2004 November 24, 2011
2nd Interim January 25, 2005 February 24, 2012
2004-052004-052004-052004-052004-05 3rd Interim April 25, 2005 May 25, 2012
Final December 16, 2005 January 15, 20131st Interim October 25, 2005 November 24, 2012
2nd Interim January 18, 2006 February 17, 2013
2005-062005-062005-062005-062005-06 3rd Interim April 19, 2006 May 19, 2013
Final December 14, 2006 January 13, 2014
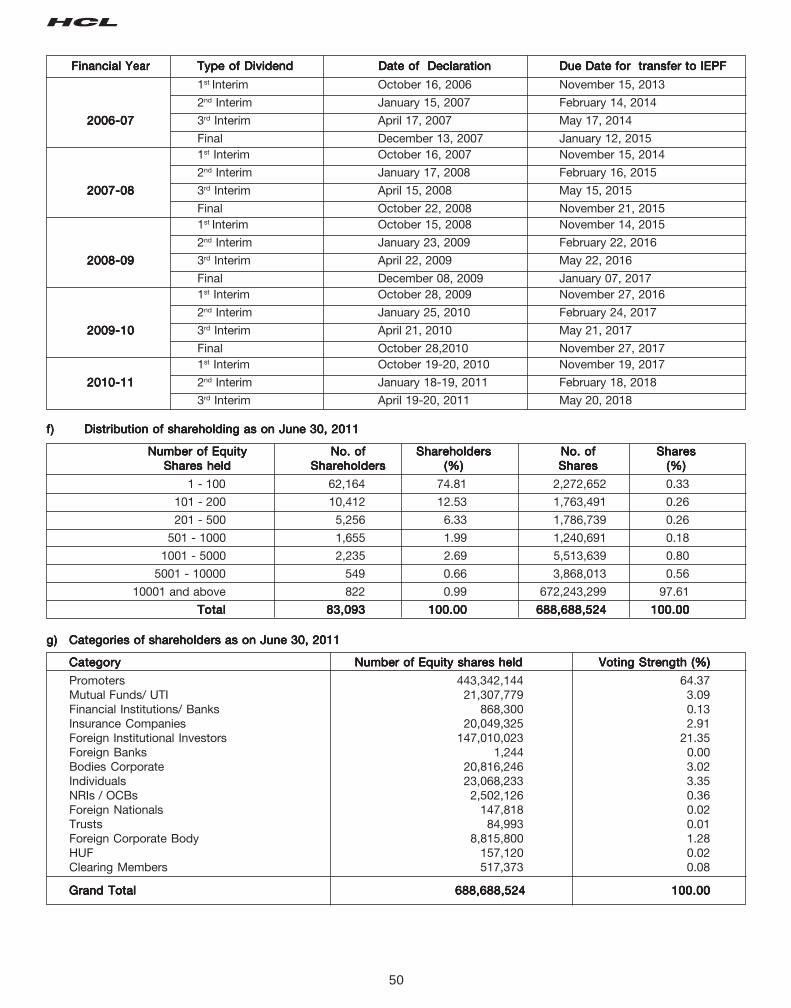
50
1st Interim October 16, 2006 November 15, 2013
2nd Interim January 15, 2007 February 14, 2014
2006-072006-072006-072006-072006-07 3rd Interim April 17, 2007 May 17, 2014
Final December 13, 2007 January 12, 20151st Interim October 16, 2007 November 15, 2014
2nd Interim January 17, 2008 February 16, 2015
2007-082007-082007-082007-082007-08 3rd Interim April 15, 2008 May 15, 2015
Final October 22, 2008 November 21, 20151st Interim October 15, 2008 November 14, 2015
2nd Interim January 23, 2009 February 22, 2016
2008-092008-092008-092008-092008-09 3rd Interim April 22, 2009 May 22, 2016
Final December 08, 2009 January 07, 20171st Interim October 28, 2009 November 27, 2016
2nd Interim January 25, 2010 February 24, 2017
2009-102009-102009-102009-102009-10 3rd Interim April 21, 2010 May 21, 2017
Final October 28,2010 November 27, 20171st Interim October 19-20, 2010 November 19, 2017
2010-112010-112010-112010-112010-11 2nd Interim January 18-19, 2011 February 18, 2018
3rd Interim April 19-20, 2011 May 20, 2018
f)f)f)f)f) Distribution of shareholding as on June 30, 2011Distribution of shareholding as on June 30, 2011Distribution of shareholding as on June 30, 2011Distribution of shareholding as on June 30, 2011Distribution of shareholding as on June 30, 2011
Number of EquityNumber of EquityNumber of EquityNumber of EquityNumber of Equity No. ofNo. ofNo. ofNo. ofNo. of ShareholdersShareholdersShareholdersShareholdersShareholders No. ofNo. ofNo. ofNo. ofNo. of SharesSharesSharesSharesSharesShares heldShares heldShares heldShares heldShares held ShareholdersShareholdersShareholdersShareholdersShareholders (%)(%)(%)(%)(%) SharesSharesSharesSharesShares (%)(%)(%)(%)(%)
1 - 100 62,164 74.81 2,272,652 0.33
101 - 200 10,412 12.53 1,763,491 0.26
201 - 500 5,256 6.33 1,786,739 0.26
501 - 1000 1,655 1.99 1,240,691 0.18
1001 - 5000 2,235 2.69 5,513,639 0.80
5001 - 10000 549 0.66 3,868,013 0.56
10001 and above 822 0.99 672,243,299 97.61
TotalTotalTotalTotalTotal 83,09383,09383,09383,09383,093 100.00100.00100.00100.00100.00 688,688,524688,688,524688,688,524688,688,524688,688,524 100.00100.00100.00100.00100.00
g)g)g)g)g) Categories of shareholders as on June 30, 2011Categories of shareholders as on June 30, 2011Categories of shareholders as on June 30, 2011Categories of shareholders as on June 30, 2011Categories of shareholders as on June 30, 2011
CategoryCategoryCategoryCategoryCategory Number of Equity shares heldNumber of Equity shares heldNumber of Equity shares heldNumber of Equity shares heldNumber of Equity shares held Voting Strength (%)Voting Strength (%)Voting Strength (%)Voting Strength (%)Voting Strength (%)
Promoters 443,342,144 64.37Mutual Funds/ UTI 21,307,779 3.09Financial Institutions/ Banks 868,300 0.13Insurance Companies 20,049,325 2.91Foreign Institutional Investors 147,010,023 21.35Foreign Banks 1,244 0.00Bodies Corporate 20,816,246 3.02Individuals 23,068,233 3.35NRIs / OCBs 2,502,126 0.36Foreign Nationals 147,818 0.02Trusts 84,993 0.01Foreign Corporate Body 8,815,800 1.28HUF 157,120 0.02Clearing Members 517,373 0.08
Grand TotalGrand TotalGrand TotalGrand TotalGrand Total 688,688,524688,688,524688,688,524688,688,524688,688,524 100.00100.00100.00100.00100.00
Financial Financial Financial Financial Financial YearYearYearYearYear Type of DividendType of DividendType of DividendType of DividendType of Dividend Date of DeclarationDate of DeclarationDate of DeclarationDate of DeclarationDate of Declaration Due Date for transfer to IEPFDue Date for transfer to IEPFDue Date for transfer to IEPFDue Date for transfer to IEPFDue Date for transfer to IEPF
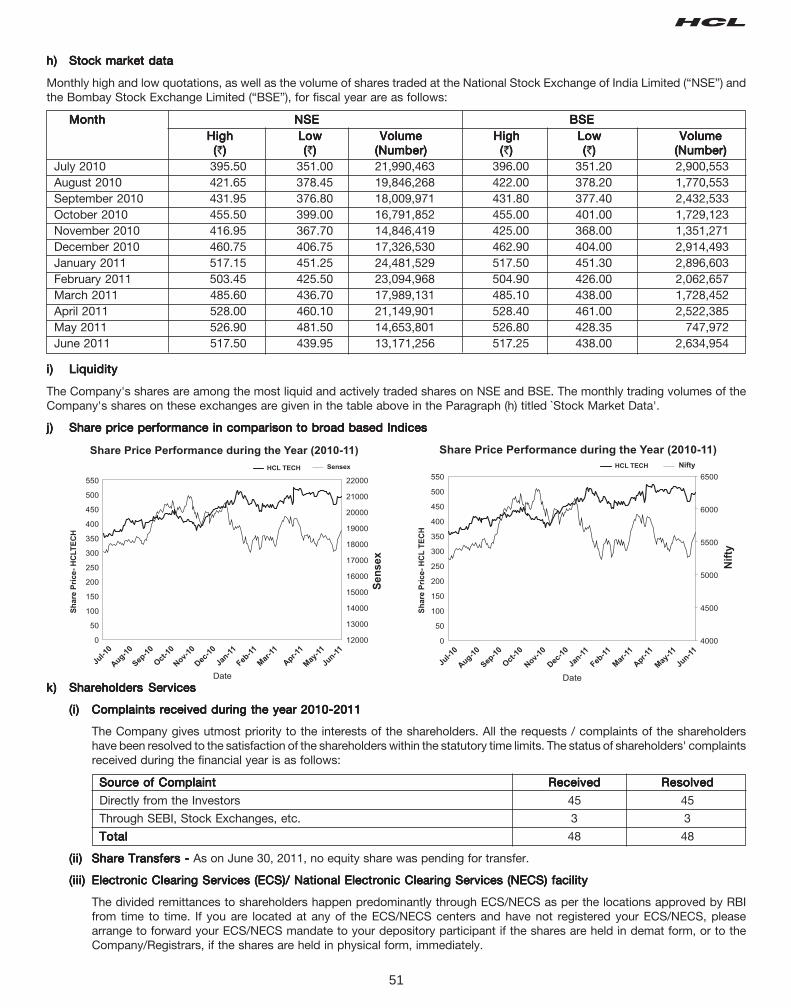
51
h)h)h)h)h) Stock market dataStock market dataStock market dataStock market dataStock market data
Monthly high and low quotations, as well as the volume of shares traded at the National Stock Exchange of India Limited (“NSE”) andthe Bombay Stock Exchange Limited (“BSE”), for fiscal year are as follows:
MonthMonthMonthMonthMonth NSENSENSENSENSE BSEBSEBSEBSEBSEHighHighHighHighHigh LowLowLowLowLow VolumeVolumeVolumeVolumeVolume HighHighHighHighHigh LowLowLowLowLow VolumeVolumeVolumeVolumeVolume(((((`))))) (((((`))))) (Number)(Number)(Number)(Number)(Number) (((((`))))) (((((`))))) (Number)(Number)(Number)(Number)(Number)
July 2010 395.50 351.00 21,990,463 396.00 351.20 2,900,553August 2010 421.65 378.45 19,846,268 422.00 378.20 1,770,553September 2010 431.95 376.80 18,009,971 431.80 377.40 2,432,533October 2010 455.50 399.00 16,791,852 455.00 401.00 1,729,123November 2010 416.95 367.70 14,846,419 425.00 368.00 1,351,271December 2010 460.75 406.75 17,326,530 462.90 404.00 2,914,493January 2011 517.15 451.25 24,481,529 517.50 451.30 2,896,603February 2011 503.45 425.50 23,094,968 504.90 426.00 2,062,657March 2011 485.60 436.70 17,989,131 485.10 438.00 1,728,452April 2011 528.00 460.10 21,149,901 528.40 461.00 2,522,385May 2011 526.90 481.50 14,653,801 526.80 428.35 747,972June 2011 517.50 439.95 13,171,256 517.25 438.00 2,634,954
i)i)i)i)i) LiquidityLiquidityLiquidityLiquidityLiquidity
The Company's shares are among the most liquid and actively traded shares on NSE and BSE. The monthly trading volumes of theCompany's shares on these exchanges are given in the table above in the Paragraph (h) titled `Stock Market Data'.
j)j)j)j)j) Share price performance in comparison to broad based IndicesShare price performance in comparison to broad based IndicesShare price performance in comparison to broad based IndicesShare price performance in comparison to broad based IndicesShare price performance in comparison to broad based Indices
k)k)k)k)k) Shareholders ServicesShareholders ServicesShareholders ServicesShareholders ServicesShareholders Services
(i)(i)(i)(i)(i) Complaints received during the year 2010-2011Complaints received during the year 2010-2011Complaints received during the year 2010-2011Complaints received during the year 2010-2011Complaints received during the year 2010-2011
The Company gives utmost priority to the interests of the shareholders. All the requests / complaints of the shareholdershave been resolved to the satisfaction of the shareholders within the statutory time limits. The status of shareholders' complaintsreceived during the financial year is as follows:
Source of ComplaintSource of ComplaintSource of ComplaintSource of ComplaintSource of Complaint ReceivedReceivedReceivedReceivedReceived ResolvedResolvedResolvedResolvedResolved
Directly from the Investors 45 45
Through SEBI, Stock Exchanges, etc. 3 3
TotalTotalTotalTotalTotal 48 48
(ii)(ii)(ii)(ii)(ii) Share Transfers - Share Transfers - Share Transfers - Share Transfers - Share Transfers - As on June 30, 2011, no equity share was pending for transfer.
(iii)(iii)(iii)(iii)(iii) Electronic Clearing Services (ECS)/ National Electronic Clearing Services (NECS) facilityElectronic Clearing Services (ECS)/ National Electronic Clearing Services (NECS) facilityElectronic Clearing Services (ECS)/ National Electronic Clearing Services (NECS) facilityElectronic Clearing Services (ECS)/ National Electronic Clearing Services (NECS) facilityElectronic Clearing Services (ECS)/ National Electronic Clearing Services (NECS) facility
The divided remittances to shareholders happen predominantly through ECS/NECS as per the locations approved by RBIfrom time to time. If you are located at any of the ECS/NECS centers and have not registered your ECS/NECS, pleasearrange to forward your ECS/NECS mandate to your depository participant if the shares are held in demat form, or to theCompany/Registrars, if the shares are held in physical form, immediately.
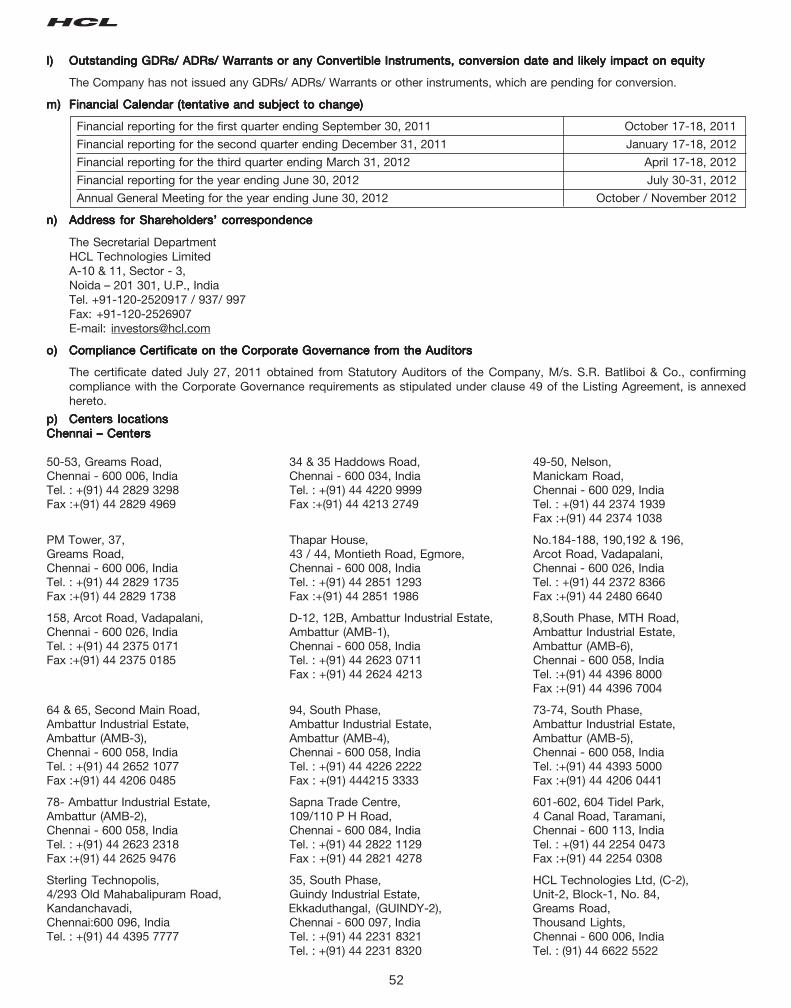
52
l)l)l)l)l) Outstanding GDRs/ ADRs/ Warrants or any Convertible Instruments, conversion date and likely impact on equityOutstanding GDRs/ ADRs/ Warrants or any Convertible Instruments, conversion date and likely impact on equityOutstanding GDRs/ ADRs/ Warrants or any Convertible Instruments, conversion date and likely impact on equityOutstanding GDRs/ ADRs/ Warrants or any Convertible Instruments, conversion date and likely impact on equityOutstanding GDRs/ ADRs/ Warrants or any Convertible Instruments, conversion date and likely impact on equity
The Company has not issued any GDRs/ ADRs/ Warrants or other instruments, which are pending for conversion.
m)m)m)m)m) Financial Calendar (tentative and subject to change)Financial Calendar (tentative and subject to change)Financial Calendar (tentative and subject to change)Financial Calendar (tentative and subject to change)Financial Calendar (tentative and subject to change)
Financial reporting for the first quarter ending September 30, 2011 October 17-18, 2011
Financial reporting for the second quarter ending December 31, 2011 January 17-18, 2012
Financial reporting for the third quarter ending March 31, 2012 April 17-18, 2012
Financial reporting for the year ending June 30, 2012 July 30-31, 2012
Annual General Meeting for the year ending June 30, 2012 October / November 2012
n)n)n)n)n) Address for Shareholders’ correspondenceAddress for Shareholders’ correspondenceAddress for Shareholders’ correspondenceAddress for Shareholders’ correspondenceAddress for Shareholders’ correspondence
The Secretarial DepartmentHCL Technologies LimitedA-10 & 11, Sector - 3,Noida – 201 301, U.P., IndiaTel. +91-120-2520917 / 937/ 997Fax: +91-120-2526907E-mail: [email protected]
o)o)o)o)o) Compliance Certificate on the Corporate Governance from the AuditorsCompliance Certificate on the Corporate Governance from the AuditorsCompliance Certificate on the Corporate Governance from the AuditorsCompliance Certificate on the Corporate Governance from the AuditorsCompliance Certificate on the Corporate Governance from the Auditors
The certificate dated July 27, 2011 obtained from Statutory Auditors of the Company, M/s. S.R. Batliboi & Co., confirmingcompliance with the Corporate Governance requirements as stipulated under clause 49 of the Listing Agreement, is annexedhereto.
p)p)p)p)p) Centers locationsCenters locationsCenters locationsCenters locationsCenters locationsChennai – CentersChennai – CentersChennai – CentersChennai – CentersChennai – Centers
50-53, Greams Road, 34 & 35 Haddows Road, 49-50, Nelson,Chennai - 600 006, India Chennai - 600 034, India Manickam Road,Tel. : +(91) 44 2829 3298 Tel. : +(91) 44 4220 9999 Chennai - 600 029, IndiaFax :+(91) 44 2829 4969 Fax :+(91) 44 4213 2749 Tel. : +(91) 44 2374 1939
Fax :+(91) 44 2374 1038
PM Tower, 37, Thapar House, No.184-188, 190,192 & 196,Greams Road, 43 / 44, Montieth Road, Egmore, Arcot Road, Vadapalani,Chennai - 600 006, India Chennai - 600 008, India Chennai - 600 026, IndiaTel. : +(91) 44 2829 1735 Tel. : +(91) 44 2851 1293 Tel. : +(91) 44 2372 8366Fax :+(91) 44 2829 1738 Fax :+(91) 44 2851 1986 Fax :+(91) 44 2480 6640
158, Arcot Road, Vadapalani, D-12, 12B, Ambattur Industrial Estate, 8,South Phase, MTH Road,Chennai - 600 026, India Ambattur (AMB-1), Ambattur Industrial Estate,Tel. : +(91) 44 2375 0171 Chennai - 600 058, India Ambattur (AMB-6),Fax :+(91) 44 2375 0185 Tel. : +(91) 44 2623 0711 Chennai - 600 058, India
Fax : +(91) 44 2624 4213 Tel. :+(91) 44 4396 8000Fax :+(91) 44 4396 7004
64 & 65, Second Main Road, 94, South Phase, 73-74, South Phase,Ambattur Industrial Estate, Ambattur Industrial Estate, Ambattur Industrial Estate,Ambattur (AMB-3), Ambattur (AMB-4), Ambattur (AMB-5),Chennai - 600 058, India Chennai - 600 058, India Chennai - 600 058, IndiaTel. : +(91) 44 2652 1077 Tel. : +(91) 44 4226 2222 Tel. :+(91) 44 4393 5000Fax :+(91) 44 4206 0485 Fax : +(91) 444215 3333 Fax :+(91) 44 4206 0441
78- Ambattur Industrial Estate, Sapna Trade Centre, 601-602, 604 Tidel Park,Ambattur (AMB-2), 109/110 P H Road, 4 Canal Road, Taramani,Chennai - 600 058, India Chennai - 600 084, India Chennai - 600 113, IndiaTel. : +(91) 44 2623 2318 Tel. : +(91) 44 2822 1129 Tel. : +(91) 44 2254 0473Fax :+(91) 44 2625 9476 Fax : +(91) 44 2821 4278 Fax :+(91) 44 2254 0308
Sterling Technopolis, 35, South Phase, HCL Technologies Ltd, (C-2),4/293 Old Mahabalipuram Road, Guindy Industrial Estate, Unit-2, Block-1, No. 84,Kandanchavadi, Ekkaduthangal, (GUINDY-2), Greams Road,Chennai:600 096, India Chennai - 600 097, India Thousand Lights,Tel. : +(91) 44 4395 7777 Tel. : +(91) 44 2231 8321 Chennai - 600 006, India
Tel. : +(91) 44 2231 8320 Tel. : (91) 44 6622 5522
53
HCL Technologies Ltd,(C-3), HCL Technologies Ltd. (C-5), HCL Technologies Ltd.,(C-4),Unit-2, Block-1, No. 84, Module 1, Tower 1, Unit-2, Block-1, No.84,Greams Road, Floor Nos. 1 & 6, Greams Road,Thousand Lights, “Chennai One” SEZ Unit, Thousand Lights,Chennai - 600 006, India ETL Infrastructure Services Ltd., Chennai - 600 006, IndiaTel. : +(91) 44 6622 5522 200 Ft, Thoraipakkam, Tel. : +(91) 44 6622 5522
Pallavaram Ring Road,Thoraipakkam, Chennai - 600 096Tel. : +(91) 44 6630 1000
HCL Technologies Ltd. (C-1),#30, Ethiraj Salai, Egmore,Chennai - 600105, IndiaTel : +(91) 44 2828 9200
Chennai SEZChennai SEZChennai SEZChennai SEZChennai SEZHCL Technologies Ltd., HCL Technologies Limited, ETA- Techno Park” Block I, ELCOT – SEZ Unit -I,SPECIAL ECONOMIC ZONE, Special Economic Zone,33, Rajiv Gandhi Salai, Navallur Village and 602/3, 138, Shollinganallur Village,Panchayat, Thiruporur Panchayat Union, Chengalpet Taluk, Shollinganallur - Medavakkam High Road,Kanchipuram dist, Tambaram Taluk, Kancheepuram (Dist.),Chennai - 603 103 Chennai - 600 119, Tamilnadu, IndiaTel. : +(91) 44 4746 1000 Tel. : +(91) 44 6105 0000Fax : +(91) 44 6741 2222 Fax: +(91) 44 4332 5443
HCL Technologies Ltd., HCL Technologies Limited,ETA- Techno Park” Block IV, ELCOT – SEZ Unit -II,SPECIAL ECONOMIC ZONE, Special Economic Zone,33, Rajiv Gandhi Salai, Navallur Village and Panchayat, 602/3, 138, Shollinganallur Village,Thiruporur Panchayat Union, Chengalpet Taluk, Shollinganallur - Medavakkam High Road,Kanchipuram dist, Chennai - 603 103.Tel. : +(91) 44 4746 4000
Gurgaon – CentersGurgaon – CentersGurgaon – CentersGurgaon – CentersGurgaon – Centers3, Udyog Vihar Phase 1, Plot No. 244, Udyog Vihar Phase 1, Plot No C-1, Sector-34Gurgaon - 122 016 Gurgaon - 122 016 Gurgaon - 122 002Haryana, India Haryana, India Haryana, IndiaTel. : +(91) 124 434 6400 Tel. : +(91) 124 434 6200 Tel. : +(91) 124-661-6565, 465-6565Fax : +(91) 124 243 9910 Fax : +(91) 124 234 9020 Fax : +(91) 124 221 2381
Kolkata CentersKolkata CentersKolkata CentersKolkata CentersKolkata CentersHCL Technologies Ltd., HCL Technologies Ltd., HCL Technologies Ltd. - SEZ Unit,SDF Building, 1st & 3rd floors, INFINITY Building, Tower – II, M/s. Unitech Hi-Tech Structures Ltd.,Module Nos. 212-214, 228-230 &413, 13th, 14th & 15th. Floors, Special Economic Zone – IT/ITES,Block – GP, Sector – V, Plot No. 3A, Block GP, Sector-V, Plot No.1, Block No. A2, 3rd & 4th,Salt Lake, Kolkata 700 091, India Salt Lake, Kolkata – 700 091, India Floors, DH Street, 316 New Town,Tel. : +(91) 33 2357 3024-3025 Tel. : +(91) 33 2357 2487- 90 Rajarhat, Dist. North 24 Parganas,Fax : +(91) 33 2357 3027 Fax : +(91) 33 2357 2491 Kolkata - 700 156, India
Noida CentersNoida CentersNoida CentersNoida CentersNoida Centers
A 9, 10 & 11, Sector 3, A – 5, Sector 24, A11, Sector 16,Noida - 201 301, Noida - 201 301, Noida - 201 301,U.P., India U.P., India U.P., IndiaTel. : +(91) 120 2520917 Tel. : +(91) 120 4382020 Tel. : +(91) 120 4383000Fax : +(91) 120 2526907 Fax :+(91) 120 2411005 Fax : +(91) 120 2510713
PLOT NO 1& 2, Noida Express Highway A 91, Sector 2,,,,, A- 8 & 9, Sector 60,Sector-125, Noida - 201 301, Noida - 201 301, Noida - 201 301,U.P., India U.P., India U.P., IndiaTel. : +(91) 120 4046000 Tel. : +(91) 120 450 2700 Tel. : +(91) 120 4384000Fax :+(91) 120 4258946 Fax :+(91) 120 252 9000 Fax : +(91) 120 2582915
54
C - 22 A, Sector 57, C-39, Sector 59, C-49, Sec-57,Noida - 201301, Noida - 201 301, Noida - 201 301,U.P., India, U.P., India U.P. India,Tel. : +(91) 120 4385000 Tel. : +(91) - 0120-2589690 Tel. :+(91) 120 3387000Fax : +(91) 120 2586420 Fax : +(91) - 0120-2589688 Fax. :+(91) 120 4120303
A - 22, Sector 60, A-104, Sector 58, B-34 / 3, Sector 59,Noida - 201 301, Noida 201301, Noida - 201 301,U.P., India U.P., India U.P., IndiaTel. : +(91) 120-2589690 Tel. : +(91) 120-4364200 Tel. : +(91) 120-4364488Fax : +(91) 120-4347485 Fax :+(91) 120-2589688 Fax : +(91) 120-2589688
C-23, Sector 58, Noida SEZNoida SEZNoida SEZNoida SEZNoida SEZ Mumbai CenterMumbai CenterMumbai CenterMumbai CenterMumbai CenterNoida - 201 301, HCL Technologies Ltd., Unit No.181 B, SDF 6, First Floor,U.P., India Noida Technology Hub (SEZ), SEEPZ, Andheri (East),Tel : +(91) 120-4364500 Plot No: 3A, Sector-126, Mumbai - 400 096, IndiaFax : +(91) 120-2490428 Noida - 201 303 Tel. : +(91) 22 28291440
U.P., India Tel. : +(91) 22 28292665Tel : +(91) 120 4683000 Fax : +(91) 22 28292373Fax :+(91) 120 4683030
Hyderabad CenterHyderabad CenterHyderabad CenterHyderabad CenterHyderabad Center
DHFLVC Silicon Towers, Second Floor, Tower: H08, Phoenix Infocity Pvt. Ltd.{SEZ}, Ascendas IT Park,Kothaguda, HITEC CITY 2 -Survey No.30, 34, 35 & 38, The V, First Floor, Auriga Block,Hyderabad - 500 084 Hyderabad - 500 081, India Plot No.17, Software Units Layout,Tel. : +91 (40) 4430 2222 Land Mark: Behind Cyber Gateway Madhapur,
Tel. : +(91) 40 3094 1000 Hyderabad - 500 081, IndiaFax : +(91) 40 4027 3333 Tel. : +(91) 40 3056 3500
Tower: H01B, Phoenix Infocity Pvt. Ltd.{SEZ},HITEC CITY 2 -Survey No.30, 34, 35 & 38,Hyderabad - 500 081, IndiaTel. : +(91) 40 3094 1000Fax : +(91) 40 4027 3333
Bangalore – CentersBangalore – CentersBangalore – CentersBangalore – CentersBangalore – Centers
Vertex Tech Park, The Senate, 8 & 9, G.B. Palya,#564, Pattandur Agrahara Road, # 33/1, Ulsoor Road, Off. Hosur Road,Off Whitefield Road , Next to ITPL, Bangalore - 560 042, India Bangalore - 560 068, IndiaBangalore - 560 066, India Tel. : +(91) 80 4190 6000 Ph: +(91) 80 4158 4000Tel. : +(91) 80 4187 3000 Fax : +(91) 80 4124 6888 Fax:+(91) 80 2573 5516Fax : +(91) 80 4115 7474
#690, 5th & 6th Floor, Surya Sappihre, HCL EAI Services Ltd.,Gold Hill Square (GHS), Plot No: 3, #6, A.S. Chambers,Bommanahalli, 1st Phase Electronic City, 80 Feet Road,Hosur Main Road, Hosur Road, 6th Block, Koramangala.Bangalore - 560 068, India Bangalore - 560 100, India Bangalore – 560 095, IndiaTel. : +(91) 80 4141 5000 Tel. : +(91) 80 6626 7000 Ph: +(91) 80 6644 1000Fax : +(91) 80 2572 7989 Fax : +(91) 80 2852 9100 Fax: +(91) 80 6644 1117
Bangalore SEZBangalore SEZBangalore SEZBangalore SEZBangalore SEZ
HCL Technologies Limited (SEZ),No. 129, Jigani Bomasandra,Link Road , Jigani Industrial Area,Bangalore - 562 106, IndiaTel. : +(91) 80 6781 0000Fax : +(91) 80 6631 1111
55
Compliance with non-mandatory requirements of clause 49 of the Listing AgreementCompliance with non-mandatory requirements of clause 49 of the Listing AgreementCompliance with non-mandatory requirements of clause 49 of the Listing AgreementCompliance with non-mandatory requirements of clause 49 of the Listing AgreementCompliance with non-mandatory requirements of clause 49 of the Listing Agreement
Clause 49 of the Listing Agreement mandates us to obtain a certificate either from the auditors or from the practicing companysecretary regarding the compliance of conditions of corporate governance as stipulated in clause 49 of the listing agreement andannex the certificate with the director's report, which is sent annually to the shareholders. We have obtained a certificate from ourstatutory auditors to this effect and the same is given as annexure to this report.
The clause further states that the non-mandatory requirements may be implemented as per the discretion of the Company. Wecomply with the following non-mandatory requirements:
1.1.1.1.1. The tenor of Independent DirectorThe tenor of Independent DirectorThe tenor of Independent DirectorThe tenor of Independent DirectorThe tenor of Independent Director
The Board has decided that Independent Directors shall have tenure, in the aggregate, a period of 9 years on the Board of theCompany. The said tenure shall begin from July 1, 2008 for the current Independent Directors on the Board and for the newappointments the tenure shall begin from the date of the appointment of the Independent Director on the Board.
2.2.2.2.2. Remuneration CommitteeRemuneration CommitteeRemuneration CommitteeRemuneration CommitteeRemuneration Committee
The Compensation Committee of the Company is in existence from September, 1999. Ms. Robin Abrams, an independent nonexecutive director of the Company is the Chairperson of the Compensation Committee. All the members of the CompensationCommittee are independent non executive directors. The details of the Compensation Committee are provided in the report.
3.3.3.3.3. Shareholders RightsShareholders RightsShareholders RightsShareholders RightsShareholders Rights
The Clause states that half- yearly declaration of financial performance including summary of the significant events in the last sixmonths, may be sent to each shareholder.
We communicate with investors regularly through e-mail, telephone and face to face meetings either in investor's conferences,Company visits or on road shows.
We also leverage the internet in communicating with our investor's base. After the announcement of the quarterly results, abusiness television channel in India telecasts discussions with our Management. This enables a large number of retail investorsin India to understand our operations better. The announcement of quarterly results is followed by media briefing in pressconferences and earning conference calls. The earning calls are also webcast live on the internet. Further, transcripts of theearnings calls are posted on the website www.hcltech.com. We also publish our quarterly results in English and Hindi dailynewspapers.
4.4.4.4.4. Audit QualificationsAudit QualificationsAudit QualificationsAudit QualificationsAudit Qualifications
It is always the Company's endeavor to present unqualified financial statements. There is no audit qualification in the Company'sfinancial statements for the year ended June 30, 2011.
5.5.5.5.5. Training to Board MembersTraining to Board MembersTraining to Board MembersTraining to Board MembersTraining to Board Members
The Board has adopted a policy for training of new non-executive directors which shall inter-alia provide (a) orientation andpresentations to the non-executive directors to enable them to get familiarize with the operations of the Company; (b) orientationon group structure, subsidiaries, constitution, Board procedures and matters reserved for the Board, major risks and riskmanagement strategies, etc. and (c) training on corporate excellence.
The Company believes that the Board be continuously empowered with the knowledge of the latest developments in the Company'sbusinesses and the external environment affecting the industry as a whole. The non executive directors are also provided withreports issued by the Company from time to time and internal policies to enable them to familiarize with the Company's proceduresand practices. Independent Directors are regularly updated on performance of each line of business of the Company, businessstrategy going forward and new initiatives being taken/ proposed to be taken by the Company.
6.6.6.6.6. Whistle Blower MechanismWhistle Blower MechanismWhistle Blower MechanismWhistle Blower MechanismWhistle Blower Mechanism
A mechanism for the employees to have direct one on one access to the Chief Executive Officer (CEO) has been put in place. Thismechanism focuses on reporting by the employees, any concerns on unethical behavior, actual/ suspected fraud, violation of thecode of conduct or any such issue to the CEO.
56
AUDITORS' CERTIFICATEAUDITORS' CERTIFICATEAUDITORS' CERTIFICATEAUDITORS' CERTIFICATEAUDITORS' CERTIFICATE
REGARDING COMPLIANCE OF CONDITIONS OF CORPORATE GOVERNANCEREGARDING COMPLIANCE OF CONDITIONS OF CORPORATE GOVERNANCEREGARDING COMPLIANCE OF CONDITIONS OF CORPORATE GOVERNANCEREGARDING COMPLIANCE OF CONDITIONS OF CORPORATE GOVERNANCEREGARDING COMPLIANCE OF CONDITIONS OF CORPORATE GOVERNANCE
To the Members of HCL Technologies LimitedTo the Members of HCL Technologies LimitedTo the Members of HCL Technologies LimitedTo the Members of HCL Technologies LimitedTo the Members of HCL Technologies Limited
We have examined the compliance of conditions of corporate governance by HCL Technologies Limited (the ‘Company’), for the yearended on June 30, 2011, as stipulated in clause 49 of the Listing Agreement of the said Company with stock exchanges.
The compliance of conditions of corporate governance is the responsibility of the management. Our examination was limited toprocedures and implementation thereof, adopted by the Company for ensuring the compliance of the conditions of the CorporateGovernance. It is neither an audit nor an expression of opinion on the financial statements of the Company.
In our opinion and to the best of our information and according to the explanations given to us, we certify that the Company hascomplied with the conditions of Corporate Governance as stipulated in the above mentioned Listing Agreement.
We further state that such compliance is neither an assurance as to the future viability of the Company nor the efficiency or effectivenesswith which the management has conducted the affairs of the Company.
For S. R. Batliboi & Co.For S. R. Batliboi & Co.For S. R. Batliboi & Co.For S. R. Batliboi & Co.For S. R. Batliboi & Co.Firm registration number: 301003EFirm registration number: 301003EFirm registration number: 301003EFirm registration number: 301003EFirm registration number: 301003EChartered Accountants
per Tridibes Basuper Tridibes Basuper Tridibes Basuper Tridibes Basuper Tridibes BasuPartnerMembership No.: 17401
Gurgaon (Haryana)Date: July 27, 2011
57
DECLARATION BY CHIEF EXECUTIVE OFFICER PURSUANT TODECLARATION BY CHIEF EXECUTIVE OFFICER PURSUANT TODECLARATION BY CHIEF EXECUTIVE OFFICER PURSUANT TODECLARATION BY CHIEF EXECUTIVE OFFICER PURSUANT TODECLARATION BY CHIEF EXECUTIVE OFFICER PURSUANT TO
CLAUSE 49(I)(D)(ii) OF THE LISTING AGREEMENT OF THE INDIAN STOCK EXCHANGESCLAUSE 49(I)(D)(ii) OF THE LISTING AGREEMENT OF THE INDIAN STOCK EXCHANGESCLAUSE 49(I)(D)(ii) OF THE LISTING AGREEMENT OF THE INDIAN STOCK EXCHANGESCLAUSE 49(I)(D)(ii) OF THE LISTING AGREEMENT OF THE INDIAN STOCK EXCHANGESCLAUSE 49(I)(D)(ii) OF THE LISTING AGREEMENT OF THE INDIAN STOCK EXCHANGES
We, Shiv Nadar, Chairman & Chief Strategy Officer and Vineet Nayar, Vice Chairman, Chief Executive Officer & Whole-time Directorof HCL Technologies Limited (“the Company”) confirm that the Company has adopted a Code of Conduct (“Code”) for its Boardmembers and senior management personnel and the Code is available on the Company's web site.
We, further confirm that the Company has in respect of the financial year ended June 30, 2011, received from its Board members aswell as senior management personnel affirmation as to compliance with the Code of Conduct.
Place: Noida (U.P.), India Vineet NayarVineet NayarVineet NayarVineet NayarVineet Nayar Shiv NadarShiv NadarShiv NadarShiv NadarShiv NadarDate: July 27, 2011 Vice Chairman, CEO & Chairman and Chief Strategy Officer
Whole-time Director
CERTIFICATE BY CHIEF EXECUTIVE OFFICER (CEO) AND CHIEF FINANCIAL OFFICER (CFO)CERTIFICATE BY CHIEF EXECUTIVE OFFICER (CEO) AND CHIEF FINANCIAL OFFICER (CFO)CERTIFICATE BY CHIEF EXECUTIVE OFFICER (CEO) AND CHIEF FINANCIAL OFFICER (CFO)CERTIFICATE BY CHIEF EXECUTIVE OFFICER (CEO) AND CHIEF FINANCIAL OFFICER (CFO)CERTIFICATE BY CHIEF EXECUTIVE OFFICER (CEO) AND CHIEF FINANCIAL OFFICER (CFO)PURSUANT TO CLAUSE 49(V) OF THE LISTING AGREEMENT OF THE INDIAN STOCK EXCHANGESPURSUANT TO CLAUSE 49(V) OF THE LISTING AGREEMENT OF THE INDIAN STOCK EXCHANGESPURSUANT TO CLAUSE 49(V) OF THE LISTING AGREEMENT OF THE INDIAN STOCK EXCHANGESPURSUANT TO CLAUSE 49(V) OF THE LISTING AGREEMENT OF THE INDIAN STOCK EXCHANGESPURSUANT TO CLAUSE 49(V) OF THE LISTING AGREEMENT OF THE INDIAN STOCK EXCHANGES
We, Shiv Nadar, Chairman & Chief Strategy Officer, Vineet Nayar, Vice Chairman, Chief Executive Officer & Whole-time Director, AnilChanana, Chief Financial Officer, Sandip Gupta, Deputy Chief Financial Officer, Prahlad Rai Bansal, Corporate Vice President- Financeand Mr. Raj Kumar Walia, Senior Vice President- Finance & Accounts of HCL Technologies Limited (“the Company”) certify that:
1. We have reviewed the financial statements and the Cash Flow Statement of the Company for the year ended June 30, 2011 andthat to the best of our knowledge and belief -
(i) these statements do not contain any materially untrue statement or omit any material fact or contain statements that mightbe misleading;
(ii) these statements together present a true and fair view of the Company's affairs and are in compliance with the existingaccounting standards, applicable laws and regulations.
2. There are, to the best of our knowledge and belief, no transactions entered into by the Company during the year which arefraudulent, illegal or violative of the Company's code of conduct.
3. We accept responsibility for establishing and maintaining internal controls for financial reporting and that we have evaluated theeffectiveness of internal control systems of the Company pertaining to financial reporting and we have disclosed to the auditorsand the Audit Committee, deficiencies in the design or operation of such internal controls, if any, of which we are aware and thesteps we have taken or propose to take to rectify these deficiencies.
4. We have indicated to the auditors and the Audit Committee -
(i) significant changes, if any, in internal control over financial reporting during the year.
(ii) significant changes, if any, in accounting policies during the year and that the same have been disclosed in the notes to thefinancial statements; and
(iii) instances of significant fraud of which we are aware and the involvement therein, if any, of the management or an employeehaving a significant role in the Company's internal control system over financial reporting.
Vineet Nayar Shiv Nadar
Vice Chairman, CEO & Chairman and Chief Strategy OfficerWhole-time Director
Anil Chanana Sandip Gupta
Chief Financial Officer Deputy Chief Financial Officer
Place Noida (U.P.), India Prahlad Rai Bansal Raj Kumar Walia
Date : July 27, 2011 Corporate Vice President - Finance Senior Vice President - Finance & Accounts


59
Financial Statements

60
61
1.1.1.1.1. We have audited the attached balance sheet of HCLTechnologies Limited (the 'Company') as at June 30, 2011and also the profit and loss account and the cash flowstatement for the year ended on that date annexed thereto.These financial statements are the responsibility of theCompany's management. Our responsibility is to expressan opinion on these financial statements based on our audit.
2.2.2.2.2. We conducted our audit in accordance with auditingstandards generally accepted in India. Those Standardsrequire that we plan and perform the audit to obtainreasonable assurance about whether the financialstatements are free of material misstatement. An auditincludes examining, on a test basis, evidence supportingthe amounts and disclosures in the financial statements.An audit also includes assessing the accounting principlesused and significant estimates made by management, aswell as evaluating the overall financial statementpresentation. We believe that our audit provides areasonable basis for our opinion.
3.3.3.3.3. As required by the Companies (Auditors' Report) Order,2003 (as amended) (the 'Order') issued by the CentralGovernment of India in terms of sub-section (4A) of Section227 of the Companies Act, 1956 (the 'Act'), we enclose inthe Annexure a statement on the matters specified inparagraphs 4 and 5 of the said Order.
4.4.4.4.4. Further to our comments in the Annexure referred to above,we report that:
i.i.i.i.i. We have obtained all the information and explanations,which to the best of our knowledge and belief werenecessary for the purposes of our audit;
ii.ii.ii.ii.ii. In our opinion, proper books of account as required bylaw have been kept by the Company so far as appearsfrom our examination of those books;
iii.iii.iii.iii.iii. The balance sheet, profit and loss account and cashflow statement dealt with by this report are in agreementwith the books of account;
iv.iv.iv.iv.iv. In our opinion, the balance sheet, profit and lossaccount and cash flow statement dealt with by thisreport comply with the accounting standards referredto in sub-section (3C) of Section 211 of the Act;
v.v.v.v.v. On the basis of the written representations receivedfrom the directors, as on June 30, 2011, and taken onrecord by the Board of Directors, we report that noneof the directors is disqualified as on June 30, 2011 frombeing appointed as a director in terms of clause (g) ofsub-section (1) of Section 274 of the Act; and
vi.vi.vi.vi.vi. In our opinion and to the best of our information andaccording to the explanations given to us, the saidaccounts give the information required by the Act, inthe manner so required and give a true and fair view in
Annexure referred to in paragraph 3 of our reportAnnexure referred to in paragraph 3 of our reportAnnexure referred to in paragraph 3 of our reportAnnexure referred to in paragraph 3 of our reportAnnexure referred to in paragraph 3 of our reportof even dateof even dateof even dateof even dateof even date
(i) (a) The Company has maintained proper recordsshowing full particulars, including quantitative detailsand situation of fixed assets.
(b) All fixed assets were physically verified by themanagement in the previous year in accordance witha planned programme of verifying them once in threeyears which, in our opinion, is reasonable havingregard to the size of the Company and the nature ofits assets. No material discrepancies were noticedon such verification.
(c) There was no substantial disposal of fixed assetsduring the year.
(ii) (a) The management has conducted physical verificationof inventory at reasonable intervals during the year.
(b) The procedures of physical verification of inventoryfollowed by the management are reasonable andadequate in relation to the size of the Company andthe nature of its business.
(c) The Company is maintaining proper records ofinventory and no material discrepancies were noticedon physical verification.
(iii) (a) According to the information and explanations givento us, the Company has not granted any loans,secured or unsecured to companies, firms or other
AUDITORS’ REPORTTo the Members of HCL Technologies Limited
conformity with the accounting principles generallyaccepted in India:
(a)(a)(a)(a)(a) in the case of the balance sheet, of the state ofaffairs of the Company as at June 30, 2011;
(b)(b)(b)(b)(b) in the case of the profit and loss account, of theprofit for the year ended on that date; and
(c)(c)(c)(c)(c) in the case of cash flow statement, of the cashflows for the year ended on that date.
For S.R. Batliboi & Co.For S.R. Batliboi & Co.For S.R. Batliboi & Co.For S.R. Batliboi & Co.For S.R. Batliboi & Co.Firm registration number: 301003EFirm registration number: 301003EFirm registration number: 301003EFirm registration number: 301003EFirm registration number: 301003EChartered Accountants
per Tridibes Basuper Tridibes Basuper Tridibes Basuper Tridibes Basuper Tridibes BasuPartnerMembership No.: 17401
Gurgaon, IndiaJuly 27 , 2011
62
parties covered in the register maintained undersection 301 of the Act. Accordingly, the provisions ofclause 4 (iii) (a) to (d) of the Order are not applicableto the Company and hence not commented upon.
(b) According to information and explanations given tous, the Company has not taken any loans, securedor unsecured from companies, firms or other partiescovered in the register maintained under section 301of the Act. Accordingly, the provisions of clause 4(iii) (e) to (g) of the Order are not applicable to theCompany and hence not commented upon.
(iv) In our opinion and according to the information andexplanations given to us, there is an adequate internalcontrol system commensurate with the size of theCompany and the nature of its business, for the purchaseof inventory and fixed assets and for the sale of goodsand services. During the course of our audit, we have notobserved any major weakness or continuing failure tocorrect major weakness in internal control system of theCompany in respect of these areas.
(v) In our opinion, there are no contracts or arrangementsthat need to be entered in the register maintained underSection 301 of the Act.
(vi) The Company has not accepted any deposits from thepublic.
(vii) In our opinion, the Company has an internal audit systemcommensurate with the size and nature of its business.
(viii) To the best of our knowledge and as explained, the CentralGovernment has not prescribed maintenance of costrecords under clause (d) of sub-section (1) of section 209of the Act for the products of the Company.
(ix) (a) Undisputed statutory dues including provident fund,investor education and protection fund, employees'state insurance, income-tax, sales-tax, wealth-tax,service tax, customs duty, excise duty, cess and othermaterial statutory dues have generally been regularlydeposited with the appropriate authorities thoughthere has been a slight delay in a few cases.
Further, since the Central Government has till datenot prescribed the amount of cess payable undersection 441 A of the Act, we are not in a position tocomment upon the regularity or otherwise of thecompany in depositing the same.
(b) According to the information and explanations givento us, no undisputed amounts payable in respect ofprovident fund, investor education and protectionfund, employees' state insurance, income-tax,wealth-tax, service tax, sales-tax, customs duty,excise duty, cess and other material statutory dueswere outstanding, at the year end, for a period of morethan six months from the date they became payable.
(c) According to the records of the Company, the dues
outstanding of income-tax, sales-tax, wealth-tax,service tax, customs duty, excise duty and cess onaccount of any dispute, are as follows:
Name of Nature of Amount Period to Forum where
the Statute Dues (Rs.) which the dispute
amount is pending
relates
Income Tax Income Tax 1,105,830,990 2006-07 Income TaxAct, 1961 Appellate Tribunal
Income Tax Income Tax 10,729,493 2005-06 Commissioner of Act, 1961 Income Tax
(Appeals)
Income Tax Income Tax 6,821,418 2005-06 Income Tax Act, 1961 Appellate Tribunal
Income Tax Income Tax 110,913,309 2005-06 Commissioner of Act, 1961 Income Tax
(Appeals)
Income Tax Income Tax 413,109 2004-05 Commissioner ofAct, 1961 Income Tax
(Appeals)
Income Tax Income Tax 12,390,000 2004-05 Income TaxAct, 1961 Appellate Tribunal
Income Tax Income Tax 1,180,000 2003-04 Income TaxAct, 1961 Appellate Tribunal
Income Tax Income Tax 54,239,366 2003-04 Commissioner ofAct, 1961 Income Tax
(Appeals)
Income Tax Income Tax 35,792,992 2002-03 Commissioner ofAct, 1961 Income Tax
(Appeals)
Income Tax Income Tax 2,065,000 2001-02 Commissioner ofAct, 1961 Income Tax
(Appeals)
Central Excise Custom Duty 2,018,406 2005-06 Customs, Excise,and Customs Service Tax Act, 1962 Appellant Tribunal,
Bangalore
Indian Stamp Stamp Duty 17,500,000 2005-06 Chief ControllingAct, 1889 Revenue Authority,
Meerut
Sales Tax Sales Tax 2,712,000 2007-08 Sales Tax, JointCommissionerAppeal, Bangalore.
(x) The Company has no accumulated losses at the end ofthe financial year and it has not incurred cash losses inthe current and immediately preceding financial year.
(xi) Based on our audit procedures and as per the informationand explanations given by the management, we are ofthe opinion that the Company has not defaulted inrepayment of dues to a financial institution, bank ordebenture holders.
(xii) According to the information and explanations given tous and based on the documents and records producedbefore us, the Company has not granted loans andadvances on the basis of security by way of pledge ofshares, debentures and other securities.
(xiii) In our opinion, the Company is not a chit fund or a nidhi /mutual benefit fund / society. Therefore, the provisions ofclause 4(xiii) of the Order are not applicable to theCompany.
63
(xiv) In our opinion, the Company is not dealing in or trading inshares, securities, debentures and other investments.Accordingly, the provisions of clause 4(xiv) of the Orderare not applicable to the Company.
(xv) According to the information and explanations given tous, the Company has given guarantees for loans taken byothers from bank or financial institutions, the terms andconditions whereof in our opinion are not prima-facieprejudicial to the interest of the Company.
(xvi) Based on the information and explanations given to us bythe management, term loans were applied for the purposefor which the loans were obtained.
(xvii) According to the information and explanations given tous and on an overall examination of the balance sheet ofthe Company, we report that no funds raised on short-term basis have been used for long-term investment.
(xviii) The Company has not made any preferential allotment ofshares to parties or companies covered in the registermaintained under section 301 of the Act.
(xix) The Company has created security or charge in respectof debentures outstanding at the year end.
(xx) The Company has not raised any money by public issueduring the year.
(xxi) To the best of our knowledge and according to theinformation and explanations given to us, no fraud by theCompany and no material fraud on the Company has beennoticed or reported during the year.
For S.R. Batliboi & Co.For S.R. Batliboi & Co.For S.R. Batliboi & Co.For S.R. Batliboi & Co.For S.R. Batliboi & Co.Firm registration number: 301003EFirm registration number: 301003EFirm registration number: 301003EFirm registration number: 301003EFirm registration number: 301003EChartered Accountants
per Tridibes Basuper Tridibes Basuper Tridibes Basuper Tridibes Basuper Tridibes BasuPartnerMembership No.: 17401
Gurgaon, IndiaJuly 27 , 2011
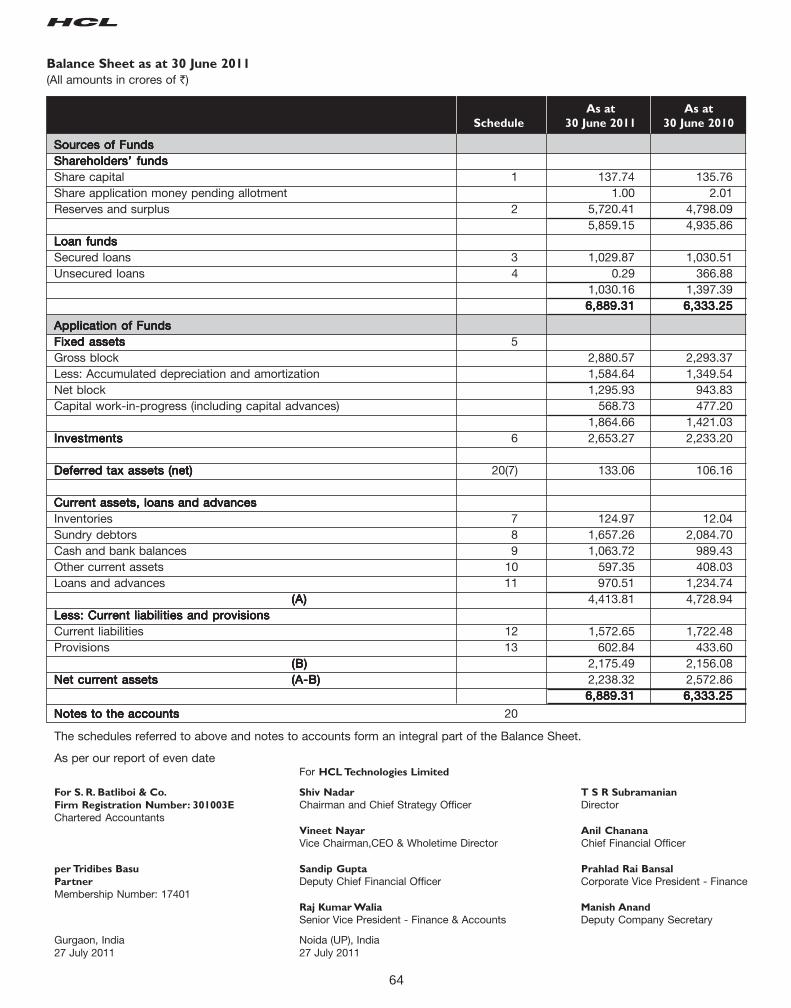
64
Balance Sheet as at 30 June 2011
(All amounts in crores of `)
As at As at
Schedule 30 June 2011 30 June 2010
Sources of FundsSources of FundsSources of FundsSources of FundsSources of FundsShareholders’ fundsShareholders’ fundsShareholders’ fundsShareholders’ fundsShareholders’ fundsShare capital 1 137.74 135.76Share application money pending allotment 1.00 2.01Reserves and surplus 2 5,720.41 4,798.09
5,859.15 4,935.86Loan fundsLoan fundsLoan fundsLoan fundsLoan fundsSecured loans 3 1,029.87 1,030.51Unsecured loans 4 0.29 366.88
1,030.16 1,397.396,889.316,889.316,889.316,889.316,889.31 6,333.256,333.256,333.256,333.256,333.25
Application of FundsApplication of FundsApplication of FundsApplication of FundsApplication of FundsFixed assetsFixed assetsFixed assetsFixed assetsFixed assets 5Gross block 2,880.57 2,293.37Less: Accumulated depreciation and amortization 1,584.64 1,349.54Net block 1,295.93 943.83Capital work-in-progress (including capital advances) 568.73 477.20
1,864.66 1,421.03InvestmentsInvestmentsInvestmentsInvestmentsInvestments 6 2,653.27 2,233.20
Deferred tax assets (net)Deferred tax assets (net)Deferred tax assets (net)Deferred tax assets (net)Deferred tax assets (net) 20(7) 133.06 106.16
Current assets, loans and advancesCurrent assets, loans and advancesCurrent assets, loans and advancesCurrent assets, loans and advancesCurrent assets, loans and advancesInventories 7 124.97 12.04Sundry debtors 8 1,657.26 2,084.70Cash and bank balances 9 1,063.72 989.43Other current assets 10 597.35 408.03Loans and advances 11 970.51 1,234.74
(A)(A)(A)(A)(A) 4,413.81 4,728.94Less: Current liabilities and provisionsLess: Current liabilities and provisionsLess: Current liabilities and provisionsLess: Current liabilities and provisionsLess: Current liabilities and provisionsCurrent liabilities 12 1,572.65 1,722.48Provisions 13 602.84 433.60
(B)(B)(B)(B)(B) 2,175.49 2,156.08Net current assetsNet current assetsNet current assetsNet current assetsNet current assets (A-B)(A-B)(A-B)(A-B)(A-B) 2,238.32 2,572.86
6,889.316,889.316,889.316,889.316,889.31 6,333.256,333.256,333.256,333.256,333.25
Notes to the accountsNotes to the accountsNotes to the accountsNotes to the accountsNotes to the accounts 20
The schedules referred to above and notes to accounts form an integral part of the Balance Sheet.
As per our report of even dateFor HCL Technologies Limited
For S. R. Batliboi & Co. Shiv Nadar T S R Subramanian
Firm Registration Number: 301003E Chairman and Chief Strategy Officer DirectorChartered Accountants
Vineet Nayar Anil Chanana
Vice Chairman,CEO & Wholetime Director Chief Financial Officer
per Tridibes Basu Sandip Gupta Prahlad Rai Bansal
Partner Deputy Chief Financial Officer Corporate Vice President - FinanceMembership Number: 17401
Raj Kumar Walia Manish Anand
Senior Vice President - Finance & Accounts Deputy Company Secretary
Gurgaon, India Noida (UP), India27 July 2011 27 July 2011
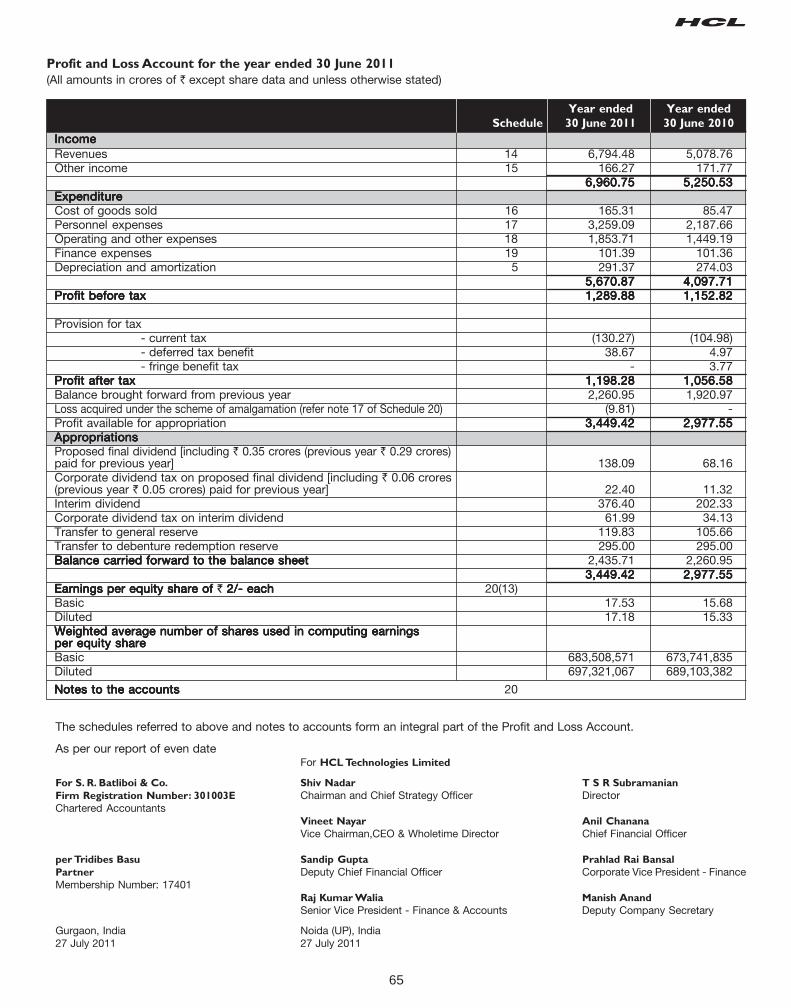
65
Profit and Loss Account for the year ended 30 June 2011
(All amounts in crores of ` except share data and unless otherwise stated)
Year ended Year ended
Schedule 30 June 2011 30 June 2010
IncomeIncomeIncomeIncomeIncomeRevenues 14 6,794.48 5,078.76Other income 15 166.27 171.77
6,960.756,960.756,960.756,960.756,960.75 5,250.535,250.535,250.535,250.535,250.53ExpenditureExpenditureExpenditureExpenditureExpenditureCost of goods sold 16 165.31 85.47Personnel expenses 17 3,259.09 2,187.66Operating and other expenses 18 1,853.71 1,449.19Finance expenses 19 101.39 101.36Depreciation and amortization 5 291.37 274.03
5,670.875,670.875,670.875,670.875,670.87 4,097.714,097.714,097.714,097.714,097.71Profit before taxProfit before taxProfit before taxProfit before taxProfit before tax 1,289.881,289.881,289.881,289.881,289.88 1,152.821,152.821,152.821,152.821,152.82
Provision for tax- current tax (130.27) (104.98)- deferred tax benefit 38.67 4.97- fringe benefit tax - 3.77
Profit after taxProfit after taxProfit after taxProfit after taxProfit after tax 1,198.281,198.281,198.281,198.281,198.28 1,056.581,056.581,056.581,056.581,056.58Balance brought forward from previous year 2,260.95 1,920.97Loss acquired under the scheme of amalgamation (refer note 17 of Schedule 20) (9.81) -Profit available for appropriation 3,449.423,449.423,449.423,449.423,449.42 2,977.552,977.552,977.552,977.552,977.55AppropriationsAppropriationsAppropriationsAppropriationsAppropriationsProposed final dividend [including ` 0.35 crores (previous year ` 0.29 crores)paid for previous year] 138.09 68.16Corporate dividend tax on proposed final dividend [including ` 0.06 crores(previous year ` 0.05 crores) paid for previous year] 22.40 11.32Interim dividend 376.40 202.33Corporate dividend tax on interim dividend 61.99 34.13Transfer to general reserve 119.83 105.66Transfer to debenture redemption reserve 295.00 295.00Balance carried forward to the balance sheetBalance carried forward to the balance sheetBalance carried forward to the balance sheetBalance carried forward to the balance sheetBalance carried forward to the balance sheet 2,435.71 2,260.95
3,449.423,449.423,449.423,449.423,449.42 2,977.552,977.552,977.552,977.552,977.55Earnings per equity share of Earnings per equity share of Earnings per equity share of Earnings per equity share of Earnings per equity share of ` 2/- each 2/- each 2/- each 2/- each 2/- each 20(13)Basic 17.53 15.68Diluted 17.18 15.33Weighted average number of shares used in computing earningsWeighted average number of shares used in computing earningsWeighted average number of shares used in computing earningsWeighted average number of shares used in computing earningsWeighted average number of shares used in computing earningsper equity shareper equity shareper equity shareper equity shareper equity shareBasic 683,508,571 673,741,835Diluted 697,321,067 689,103,382
Notes to the accountsNotes to the accountsNotes to the accountsNotes to the accountsNotes to the accounts 20
The schedules referred to above and notes to accounts form an integral part of the Profit and Loss Account.
As per our report of even dateFor HCL Technologies Limited
For S. R. Batliboi & Co. Shiv Nadar T S R Subramanian
Firm Registration Number: 301003E Chairman and Chief Strategy Officer DirectorChartered Accountants
Vineet Nayar Anil Chanana
Vice Chairman,CEO & Wholetime Director Chief Financial Officer
per Tridibes Basu Sandip Gupta Prahlad Rai Bansal
Partner Deputy Chief Financial Officer Corporate Vice President - FinanceMembership Number: 17401
Raj Kumar Walia Manish Anand
Senior Vice President - Finance & Accounts Deputy Company Secretary
Gurgaon, India Noida (UP), India27 July 2011 27 July 2011
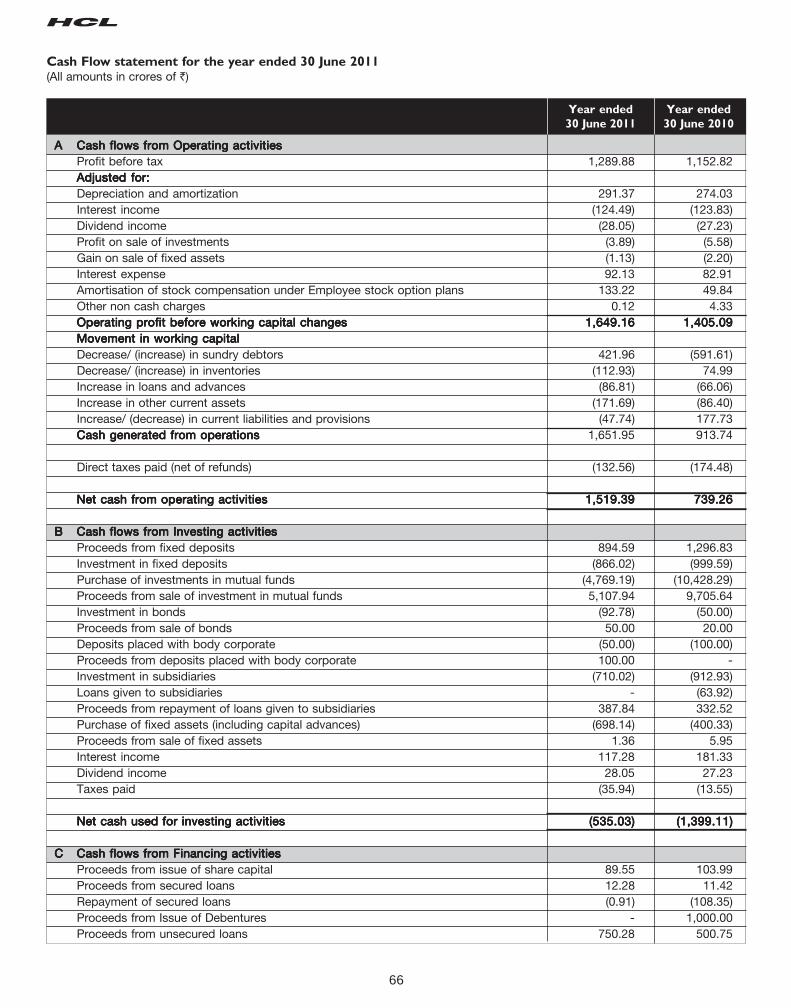
66
Cash Flow statement for the year ended 30 June 2011(All amounts in crores of `)
Year ended Year ended
30 June 2011 30 June 2010
AAAAA Cash flows from Operating activitiesCash flows from Operating activitiesCash flows from Operating activitiesCash flows from Operating activitiesCash flows from Operating activitiesProfit before tax 1,289.88 1,152.82Adjusted for:Adjusted for:Adjusted for:Adjusted for:Adjusted for:Depreciation and amortization 291.37 274.03Interest income (124.49) (123.83)Dividend income (28.05) (27.23)Profit on sale of investments (3.89) (5.58)Gain on sale of fixed assets (1.13) (2.20)Interest expense 92.13 82.91Amortisation of stock compensation under Employee stock option plans 133.22 49.84Other non cash charges 0.12 4.33Operating profit before working capital changesOperating profit before working capital changesOperating profit before working capital changesOperating profit before working capital changesOperating profit before working capital changes 1,649.161,649.161,649.161,649.161,649.16 1,405.091,405.091,405.091,405.091,405.09Movement in working capitalMovement in working capitalMovement in working capitalMovement in working capitalMovement in working capitalDecrease/ (increase) in sundry debtors 421.96 (591.61)Decrease/ (increase) in inventories (112.93) 74.99Increase in loans and advances (86.81) (66.06)Increase in other current assets (171.69) (86.40)Increase/ (decrease) in current liabilities and provisions (47.74) 177.73Cash generated from operationsCash generated from operationsCash generated from operationsCash generated from operationsCash generated from operations 1,651.95 913.74
Direct taxes paid (net of refunds) (132.56) (174.48)
Net cash from operating activitiesNet cash from operating activitiesNet cash from operating activitiesNet cash from operating activitiesNet cash from operating activities 1,519.391,519.391,519.391,519.391,519.39 739.26739.26739.26739.26739.26
BBBBB Cash flows from Investing activitiesCash flows from Investing activitiesCash flows from Investing activitiesCash flows from Investing activitiesCash flows from Investing activitiesProceeds from fixed deposits 894.59 1,296.83Investment in fixed deposits (866.02) (999.59)Purchase of investments in mutual funds (4,769.19) (10,428.29)Proceeds from sale of investment in mutual funds 5,107.94 9,705.64Investment in bonds (92.78) (50.00)Proceeds from sale of bonds 50.00 20.00Deposits placed with body corporate (50.00) (100.00)Proceeds from deposits placed with body corporate 100.00 -Investment in subsidiaries (710.02) (912.93)Loans given to subsidiaries - (63.92)Proceeds from repayment of loans given to subsidiaries 387.84 332.52Purchase of fixed assets (including capital advances) (698.14) (400.33)Proceeds from sale of fixed assets 1.36 5.95Interest income 117.28 181.33Dividend income 28.05 27.23Taxes paid (35.94) (13.55)
Net cash used for investing activitiesNet cash used for investing activitiesNet cash used for investing activitiesNet cash used for investing activitiesNet cash used for investing activities (535.03)(535.03)(535.03)(535.03)(535.03) (1,399.11)(1,399.11)(1,399.11)(1,399.11)(1,399.11)
CCCCC Cash flows from Financing activitiesCash flows from Financing activitiesCash flows from Financing activitiesCash flows from Financing activitiesCash flows from Financing activitiesProceeds from issue of share capital 89.55 103.99Proceeds from secured loans 12.28 11.42Repayment of secured loans (0.91) (108.35)Proceeds from Issue of Debentures - 1,000.00Proceeds from unsecured loans 750.28 500.75
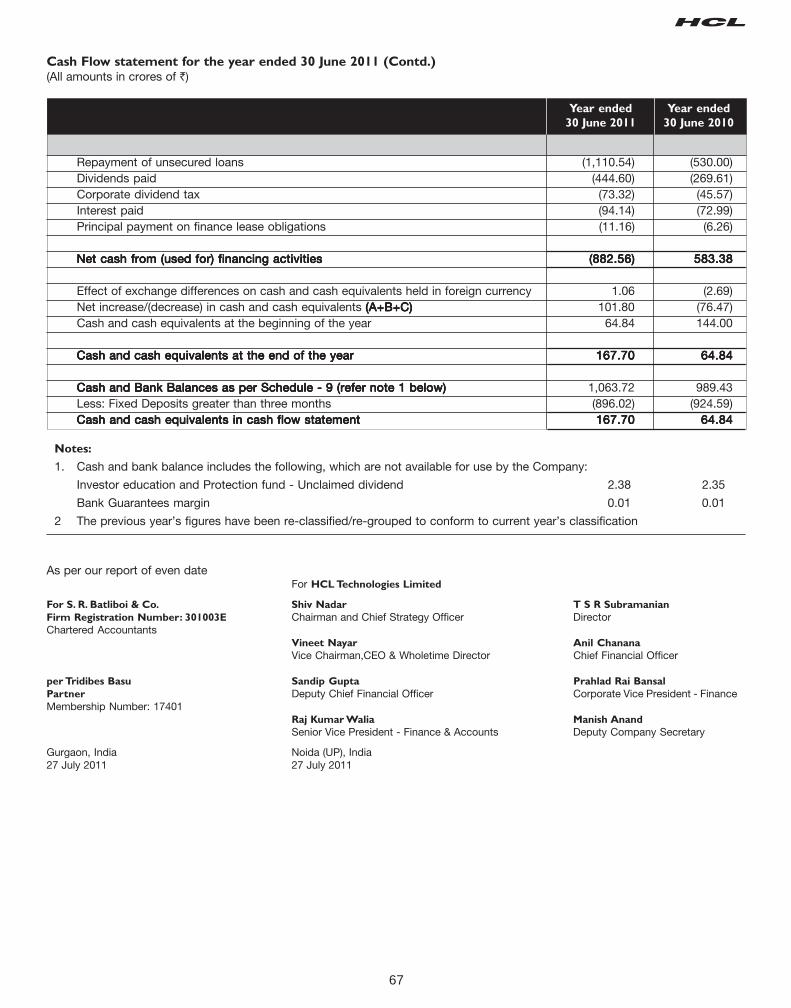
67
Cash Flow statement for the year ended 30 June 2011 (Contd.)(All amounts in crores of `)
Repayment of unsecured loans (1,110.54) (530.00)Dividends paid (444.60) (269.61)Corporate dividend tax (73.32) (45.57)Interest paid (94.14) (72.99)Principal payment on finance lease obligations (11.16) (6.26)
Net cash from (used for) financing activitiesNet cash from (used for) financing activitiesNet cash from (used for) financing activitiesNet cash from (used for) financing activitiesNet cash from (used for) financing activities (882.56)(882.56)(882.56)(882.56)(882.56) 583.38583.38583.38583.38583.38
Effect of exchange differences on cash and cash equivalents held in foreign currency 1.06 (2.69)Net increase/(decrease) in cash and cash equivalents (A+B+C)(A+B+C)(A+B+C)(A+B+C)(A+B+C) 101.80 (76.47)Cash and cash equivalents at the beginning of the year 64.84 144.00
Cash and cash equivalents at the end of the yearCash and cash equivalents at the end of the yearCash and cash equivalents at the end of the yearCash and cash equivalents at the end of the yearCash and cash equivalents at the end of the year 167.70167.70167.70167.70167.70 64.8464.8464.8464.8464.84
Cash and Bank Balances as per Schedule - 9 (refer note 1 below)Cash and Bank Balances as per Schedule - 9 (refer note 1 below)Cash and Bank Balances as per Schedule - 9 (refer note 1 below)Cash and Bank Balances as per Schedule - 9 (refer note 1 below)Cash and Bank Balances as per Schedule - 9 (refer note 1 below) 1,063.72 989.43Less: Fixed Deposits greater than three months (896.02) (924.59)Cash and cash equivalents in cash flow statementCash and cash equivalents in cash flow statementCash and cash equivalents in cash flow statementCash and cash equivalents in cash flow statementCash and cash equivalents in cash flow statement 167.70167.70167.70167.70167.70 64.8464.8464.8464.8464.84
-Notes:
1. Cash and bank balance includes the following, which are not available for use by the Company:
Investor education and Protection fund - Unclaimed dividend 2.38 2.35
Bank Guarantees margin 0.01 0.01
2 The previous year’s figures have been re-classified/re-grouped to conform to current year’s classification
Year ended Year ended
30 June 2011 30 June 2010
As per our report of even dateFor HCL Technologies Limited
For S. R. Batliboi & Co. Shiv Nadar T S R Subramanian
Firm Registration Number: 301003E Chairman and Chief Strategy Officer DirectorChartered Accountants
Vineet Nayar Anil Chanana
Vice Chairman,CEO & Wholetime Director Chief Financial Officer
per Tridibes Basu Sandip Gupta Prahlad Rai Bansal
Partner Deputy Chief Financial Officer Corporate Vice President - FinanceMembership Number: 17401
Raj Kumar Walia Manish Anand
Senior Vice President - Finance & Accounts Deputy Company Secretary
Gurgaon, India Noida (UP), India27 July 2011 27 July 2011
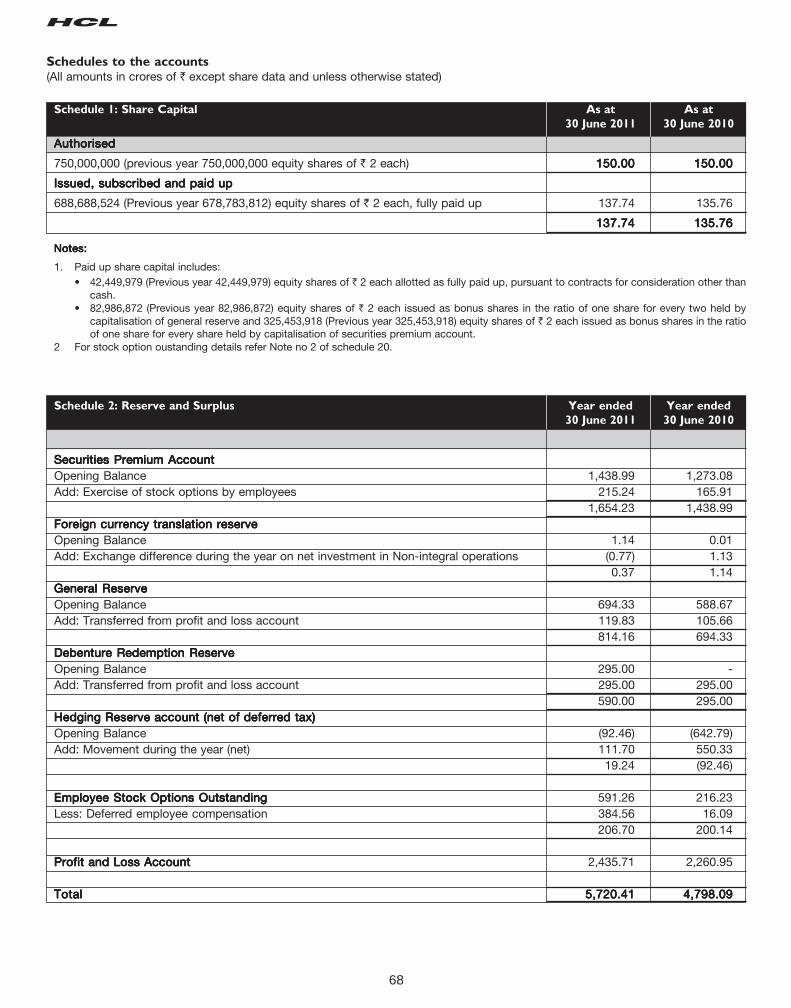
68
Schedules to the accounts(All amounts in crores of ` except share data and unless otherwise stated)
Schedule 1: Share Capital As at As at
30 June 2011 30 June 2010
AuthorisedAuthorisedAuthorisedAuthorisedAuthorised
750,000,000 (previous year 750,000,000 equity shares of ` 2 each) 150.00150.00150.00150.00150.00 150.00150.00150.00150.00150.00
Issued, subscribed and paid upIssued, subscribed and paid upIssued, subscribed and paid upIssued, subscribed and paid upIssued, subscribed and paid up
688,688,524 (Previous year 678,783,812) equity shares of ` 2 each, fully paid up 137.74 135.76
137.74137.74137.74137.74137.74 135.76135.76135.76135.76135.76
Notes:Notes:Notes:Notes:Notes:
1. Paid up share capital includes:• 42,449,979 (Previous year 42,449,979) equity shares of ` 2 each allotted as fully paid up, pursuant to contracts for consideration other than
cash.• 82,986,872 (Previous year 82,986,872) equity shares of ` 2 each issued as bonus shares in the ratio of one share for every two held by
capitalisation of general reserve and 325,453,918 (Previous year 325,453,918) equity shares of ` 2 each issued as bonus shares in the ratioof one share for every share held by capitalisation of securities premium account.
2 For stock option oustanding details refer Note no 2 of schedule 20.
Schedule 2: Reserve and Surplus Year ended Year ended
30 June 2011 30 June 2010
Securities Premium AccountSecurities Premium AccountSecurities Premium AccountSecurities Premium AccountSecurities Premium AccountOpening Balance 1,438.99 1,273.08Add: Exercise of stock options by employees 215.24 165.91
1,654.23 1,438.99Foreign currency translation reserveForeign currency translation reserveForeign currency translation reserveForeign currency translation reserveForeign currency translation reserveOpening Balance 1.14 0.01Add: Exchange difference during the year on net investment in Non-integral operations (0.77) 1.13
0.37 1.14General ReserveGeneral ReserveGeneral ReserveGeneral ReserveGeneral ReserveOpening Balance 694.33 588.67Add: Transferred from profit and loss account 119.83 105.66
814.16 694.33Debenture Redemption ReserveDebenture Redemption ReserveDebenture Redemption ReserveDebenture Redemption ReserveDebenture Redemption ReserveOpening Balance 295.00 -Add: Transferred from profit and loss account 295.00 295.00
590.00 295.00Hedging Reserve account (net of deferred tax)Hedging Reserve account (net of deferred tax)Hedging Reserve account (net of deferred tax)Hedging Reserve account (net of deferred tax)Hedging Reserve account (net of deferred tax)Opening Balance (92.46) (642.79)Add: Movement during the year (net) 111.70 550.33
19.24 (92.46)
Employee Stock Options OutstandingEmployee Stock Options OutstandingEmployee Stock Options OutstandingEmployee Stock Options OutstandingEmployee Stock Options Outstanding 591.26 216.23Less: Deferred employee compensation 384.56 16.09
206.70 200.14
Profit and Loss AccountProfit and Loss AccountProfit and Loss AccountProfit and Loss AccountProfit and Loss Account 2,435.71 2,260.95
TotalTotalTotalTotalTotal 5,720.415,720.415,720.415,720.415,720.41 4,798.094,798.094,798.094,798.094,798.09
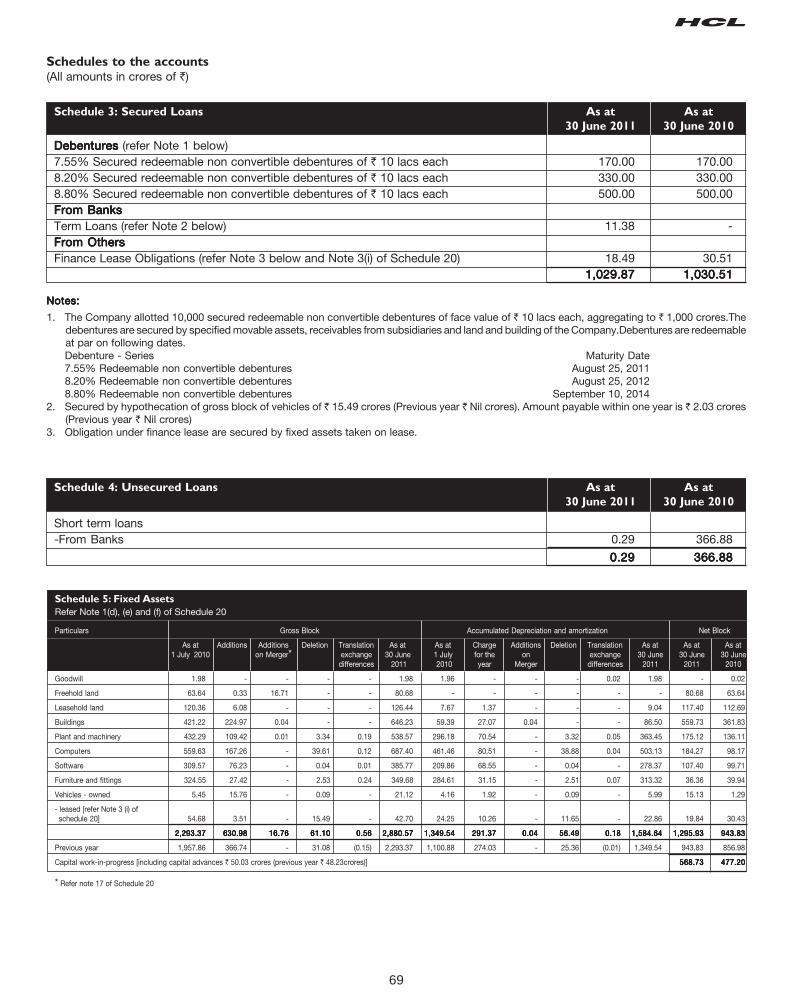
69
Schedules to the accounts(All amounts in crores of `)
Schedule 3: Secured Loans As at As at
30 June 2011 30 June 2010
Debentures Debentures Debentures Debentures Debentures (refer Note 1 below)7.55% Secured redeemable non convertible debentures of ` 10 lacs each 170.00 170.008.20% Secured redeemable non convertible debentures of ` 10 lacs each 330.00 330.008.80% Secured redeemable non convertible debentures of ` 10 lacs each 500.00 500.00From BanksFrom BanksFrom BanksFrom BanksFrom BanksTerm Loans (refer Note 2 below) 11.38 -From OthersFrom OthersFrom OthersFrom OthersFrom OthersFinance Lease Obligations (refer Note 3 below and Note 3(i) of Schedule 20) 18.49 30.51
1,029.871,029.871,029.871,029.871,029.87 1,030.511,030.511,030.511,030.511,030.51
Notes:Notes:Notes:Notes:Notes:
1. The Company allotted 10,000 secured redeemable non convertible debentures of face value of ` 10 lacs each, aggregating to ` 1,000 crores.Thedebentures are secured by specified movable assets, receivables from subsidiaries and land and building of the Company.Debentures are redeemableat par on following dates.Debenture - Series Maturity Date7.55% Redeemable non convertible debentures August 25, 20118.20% Redeemable non convertible debentures August 25, 20128.80% Redeemable non convertible debentures September 10, 2014
2. Secured by hypothecation of gross block of vehicles of ` 15.49 crores (Previous year ` Nil crores). Amount payable within one year is ` 2.03 crores(Previous year ` Nil crores)
3. Obligation under finance lease are secured by fixed assets taken on lease.
Schedule 4: Unsecured Loans As at As at
30 June 2011 30 June 2010
Short term loans-From Banks 0.29 366.88
0.290.290.290.290.29 366.88366.88366.88366.88366.88
Schedule 5: Fixed Assets
Refer Note 1(d), (e) and (f) of Schedule 20
Particulars Gross Block Accumulated Depreciation and amortization Net Block
As at Additions Additions Deletion Translation As at As at Charge Additions Deletion Translation As at As at As at1 July 2010 on Merger* exchange 30 June 1 July for the on exchange 30 June 30 June 30 June
differences 2011 2010 year Merger differences 2011 2011 2010
Goodwill 1.98 - - - - 1.98 1.96 - - - 0.02 1.98 - 0.02
Freehold land 63.64 0.33 16.71 - - 80.68 - - - - - - 80.68 63.64
Leasehold land 120.36 6.08 - - - 126.44 7.67 1.37 - - - 9.04 117.40 112.69
Buildings 421.22 224.97 0.04 - - 646.23 59.39 27.07 0.04 - - 86.50 559.73 361.83
Plant and machinery 432.29 109.42 0.01 3.34 0.19 538.57 296.18 70.54 - 3.32 0.05 363.45 175.12 136.11
Computers 559.63 167.26 - 39.61 0.12 687.40 461.46 80.51 - 38.88 0.04 503.13 184.27 98.17
Software 309.57 76.23 - 0.04 0.01 385.77 209.86 68.55 - 0.04 - 278.37 107.40 99.71
Furniture and fittings 324.55 27.42 - 2.53 0.24 349.68 284.61 31.15 - 2.51 0.07 313.32 36.36 39.94
Vehicles - owned 5.45 15.76 - 0.09 - 21.12 4.16 1.92 - 0.09 - 5.99 15.13 1.29
- leased [refer Note 3 (i) ofschedule 20] 54.68 3.51 - 15.49 - 42.70 24.25 10.26 - 11.65 - 22.86 19.84 30.43
2,293.372,293.372,293.372,293.372,293.37 630.98630.98630.98630.98630.98 16.7616.7616.7616.7616.76 61.1061.1061.1061.1061.10 0.560.560.560.560.56 2,880.572,880.572,880.572,880.572,880.57 1,349.541,349.541,349.541,349.541,349.54 291.37291.37291.37291.37291.37 0.040.040.040.040.04 56.4956.4956.4956.4956.49 0.180.180.180.180.18 1,584.641,584.641,584.641,584.641,584.64 1,295.931,295.931,295.931,295.931,295.93 943.83943.83943.83943.83943.83
Previous year 1,957.86 366.74 - 31.08 (0.15) 2,293.37 1,100.88 274.03 - 25.36 (0.01) 1,349.54 943.83 856.98
Capital work-in-progress [including capital advances ` 50.03 crores (previous year ` 48.23crores)] 568.73568.73568.73568.73568.73 477.20477.20477.20477.20477.20
* Refer note 17 of Schedule 20
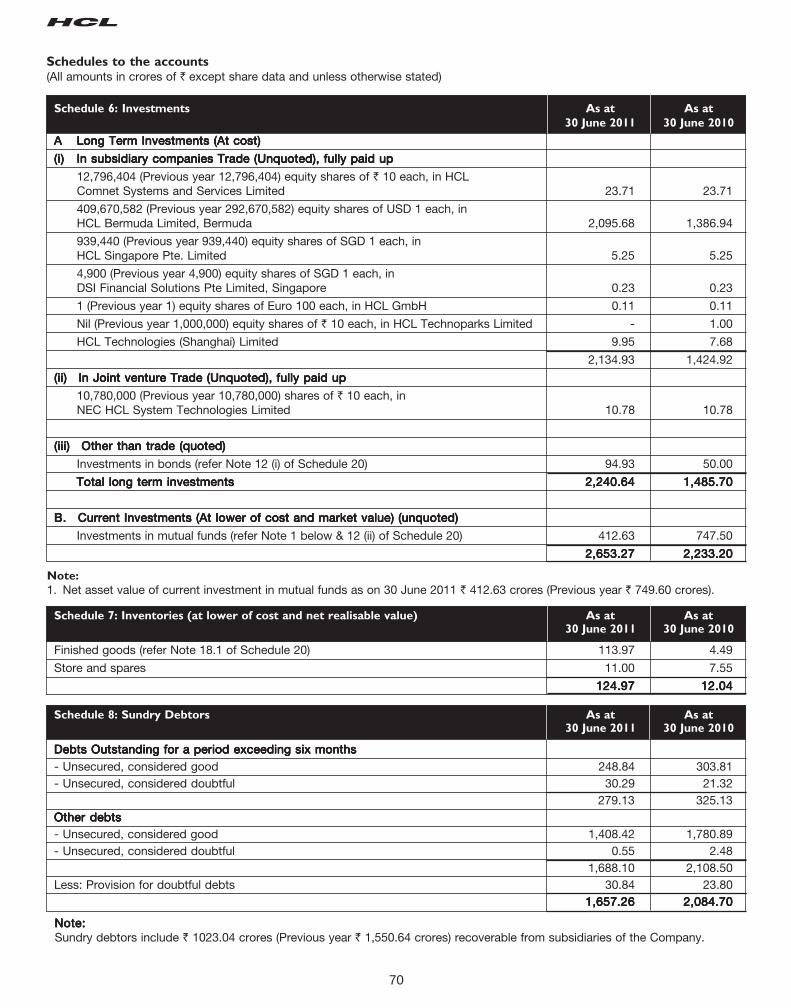
70
Schedules to the accounts(All amounts in crores of ` except share data and unless otherwise stated)
Note:
1. Net asset value of current investment in mutual funds as on 30 June 2011 ` 412.63 crores (Previous year ` 749.60 crores).
Schedule 6: Investments As at As at
30 June 2011 30 June 2010
AAAAA Long Term Investments (At cost)Long Term Investments (At cost)Long Term Investments (At cost)Long Term Investments (At cost)Long Term Investments (At cost)
(i)(i)(i)(i)(i) In subsidiary companies Trade (Unquoted), fully paid upIn subsidiary companies Trade (Unquoted), fully paid upIn subsidiary companies Trade (Unquoted), fully paid upIn subsidiary companies Trade (Unquoted), fully paid upIn subsidiary companies Trade (Unquoted), fully paid up
12,796,404 (Previous year 12,796,404) equity shares of ` 10 each, in HCLComnet Systems and Services Limited 23.71 23.71
409,670,582 (Previous year 292,670,582) equity shares of USD 1 each, inHCL Bermuda Limited, Bermuda 2,095.68 1,386.94
939,440 (Previous year 939,440) equity shares of SGD 1 each, inHCL Singapore Pte. Limited 5.25 5.25
4,900 (Previous year 4,900) equity shares of SGD 1 each, inDSI Financial Solutions Pte Limited, Singapore 0.23 0.23
1 (Previous year 1) equity shares of Euro 100 each, in HCL GmbH 0.11 0.11
Nil (Previous year 1,000,000) equity shares of ` 10 each, in HCL Technoparks Limited - 1.00
HCL Technologies (Shanghai) Limited 9.95 7.68
2,134.93 1,424.92
(ii)(ii)(ii)(ii)(ii) In Joint venture Trade (Unquoted), fully paid upIn Joint venture Trade (Unquoted), fully paid upIn Joint venture Trade (Unquoted), fully paid upIn Joint venture Trade (Unquoted), fully paid upIn Joint venture Trade (Unquoted), fully paid up
10,780,000 (Previous year 10,780,000) shares of ` 10 each, inNEC HCL System Technologies Limited 10.78 10.78
(iii)(iii)(iii)(iii)(iii) Other than trade (quoted)Other than trade (quoted)Other than trade (quoted)Other than trade (quoted)Other than trade (quoted)
Investments in bonds (refer Note 12 (i) of Schedule 20) 94.93 50.00
Total long term investmentsTotal long term investmentsTotal long term investmentsTotal long term investmentsTotal long term investments 2,240.642,240.642,240.642,240.642,240.64 1,485.701,485.701,485.701,485.701,485.70
B.B.B.B.B. Current Investments (At lower of cost and market value) (unquoted)Current Investments (At lower of cost and market value) (unquoted)Current Investments (At lower of cost and market value) (unquoted)Current Investments (At lower of cost and market value) (unquoted)Current Investments (At lower of cost and market value) (unquoted)
Investments in mutual funds (refer Note 1 below & 12 (ii) of Schedule 20) 412.63 747.50
2,653.272,653.272,653.272,653.272,653.27 2,233.202,233.202,233.202,233.202,233.20
Schedule 7: Inventories (at lower of cost and net realisable value) As at As at30 June 2011 30 June 2010
Finished goods (refer Note 18.1 of Schedule 20) 113.97 4.49
Store and spares 11.00 7.55
124.97124.97124.97124.97124.97 12.0412.0412.0412.0412.04
Schedule 8: Sundry Debtors As at As at30 June 2011 30 June 2010
Debts Outstanding for a period exceeding six monthsDebts Outstanding for a period exceeding six monthsDebts Outstanding for a period exceeding six monthsDebts Outstanding for a period exceeding six monthsDebts Outstanding for a period exceeding six months- Unsecured, considered good 248.84 303.81- Unsecured, considered doubtful 30.29 21.32
279.13 325.13Other debtsOther debtsOther debtsOther debtsOther debts- Unsecured, considered good 1,408.42 1,780.89- Unsecured, considered doubtful 0.55 2.48
1,688.10 2,108.50Less: Provision for doubtful debts 30.84 23.80
1,6571,6571,6571,6571,657.26.26.26.26.26 2,084.702,084.702,084.702,084.702,084.70
Note:Note:Note:Note:Note:Sundry debtors include ` 1023.04 crores (Previous year ` 1,550.64 crores) recoverable from subsidiaries of the Company.
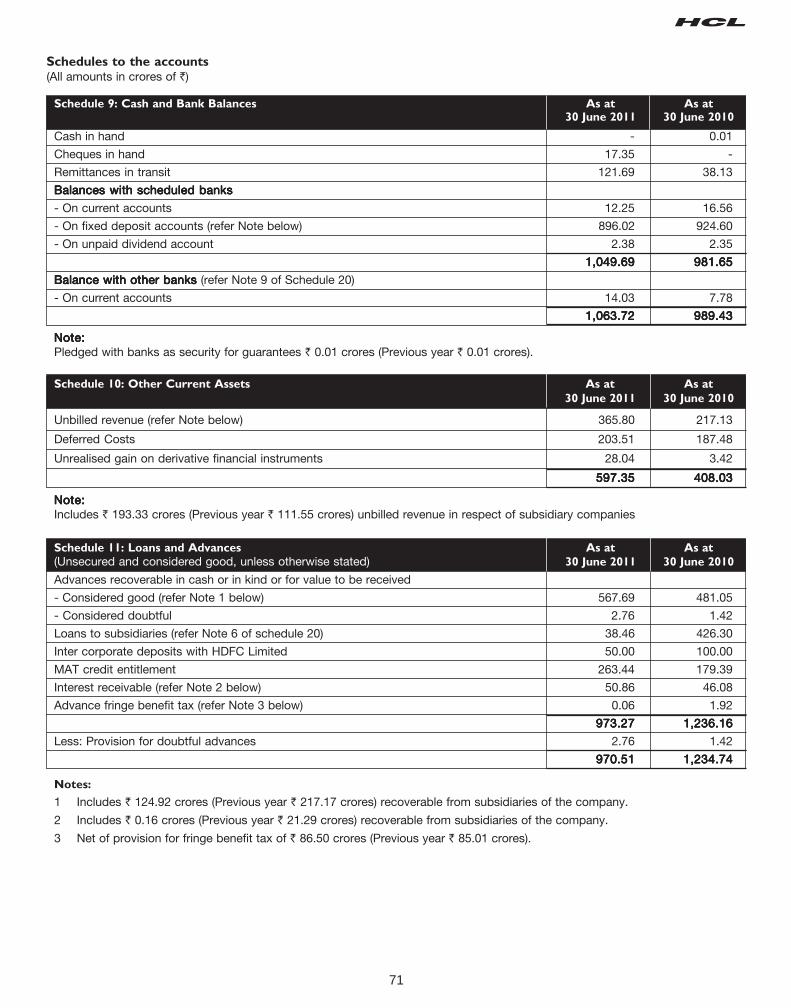
71
Schedules to the accounts(All amounts in crores of `)
Schedule 9: Cash and Bank Balances As at As at30 June 2011 30 June 2010
Cash in hand - 0.01
Cheques in hand 17.35 -
Remittances in transit 121.69 38.13
Balances with scheduled banksBalances with scheduled banksBalances with scheduled banksBalances with scheduled banksBalances with scheduled banks
- On current accounts 12.25 16.56
- On fixed deposit accounts (refer Note below) 896.02 924.60
- On unpaid dividend account 2.38 2.35
1,049.691,049.691,049.691,049.691,049.69 981.65981.65981.65981.65981.65
Balance with other banks Balance with other banks Balance with other banks Balance with other banks Balance with other banks (refer Note 9 of Schedule 20)
- On current accounts 14.03 7.78
1,063.721,063.721,063.721,063.721,063.72 989.43989.43989.43989.43989.43
Note:Note:Note:Note:Note:Pledged with banks as security for guarantees ` 0.01 crores (Previous year ` 0.01 crores).
Schedule 10: Other Current Assets As at As at
30 June 2011 30 June 2010
Unbilled revenue (refer Note below) 365.80 217.13
Deferred Costs 203.51 187.48
Unrealised gain on derivative financial instruments 28.04 3.42
597.35597.35597.35597.35597.35 408.03408.03408.03408.03408.03
Note:Note:Note:Note:Note:Includes ` 193.33 crores (Previous year ` 111.55 crores) unbilled revenue in respect of subsidiary companies
Schedule 11: Loans and Advances As at As at
(Unsecured and considered good, unless otherwise stated) 30 June 2011 30 June 2010
Advances recoverable in cash or in kind or for value to be received
- Considered good (refer Note 1 below) 567.69 481.05
- Considered doubtful 2.76 1.42
Loans to subsidiaries (refer Note 6 of schedule 20) 38.46 426.30
Inter corporate deposits with HDFC Limited 50.00 100.00
MAT credit entitlement 263.44 179.39
Interest receivable (refer Note 2 below) 50.86 46.08
Advance fringe benefit tax (refer Note 3 below) 0.06 1.92
973.27973.27973.27973.27973.27 1,236.161,236.161,236.161,236.161,236.16
Less: Provision for doubtful advances 2.76 1.42
970.51970.51970.51970.51970.51 1,234.741,234.741,234.741,234.741,234.74
Notes:
1 Includes ` 124.92 crores (Previous year ` 217.17 crores) recoverable from subsidiaries of the company.
2 Includes ` 0.16 crores (Previous year ` 21.29 crores) recoverable from subsidiaries of the company.
3 Net of provision for fringe benefit tax of ` 86.50 crores (Previous year ` 85.01 crores).
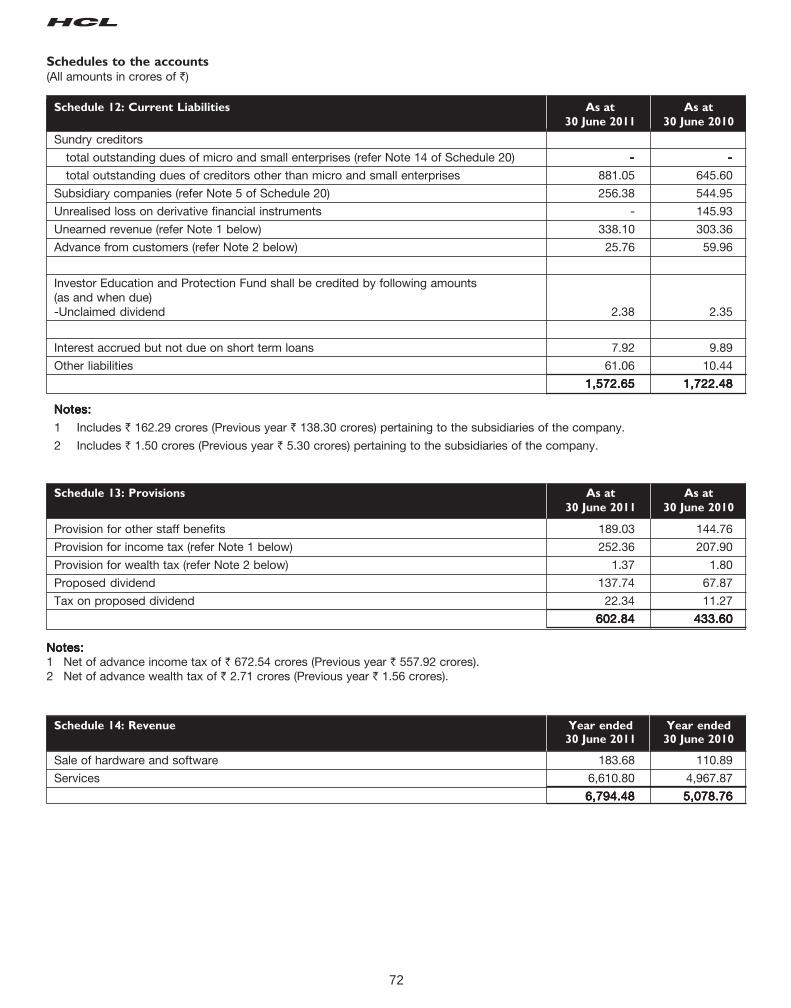
72
Schedule 13: Provisions As at As at
30 June 2011 30 June 2010
Provision for other staff benefits 189.03 144.76
Provision for income tax (refer Note 1 below) 252.36 207.90
Provision for wealth tax (refer Note 2 below) 1.37 1.80
Proposed dividend 137.74 67.87
Tax on proposed dividend 22.34 11.27
602.84602.84602.84602.84602.84 433.60433.60433.60433.60433.60
Notes:Notes:Notes:Notes:Notes:1 Net of advance income tax of ` 672.54 crores (Previous year ` 557.92 crores).2 Net of advance wealth tax of ` 2.71 crores (Previous year ` 1.56 crores).
Schedule 12: Current Liabilities As at As at
30 June 2011 30 June 2010
Sundry creditors
total outstanding dues of micro and small enterprises (refer Note 14 of Schedule 20) ----- -----
total outstanding dues of creditors other than micro and small enterprises 881.05 645.60
Subsidiary companies (refer Note 5 of Schedule 20) 256.38 544.95
Unrealised loss on derivative financial instruments - 145.93
Unearned revenue (refer Note 1 below) 338.10 303.36
Advance from customers (refer Note 2 below) 25.76 59.96
Investor Education and Protection Fund shall be credited by following amounts(as and when due)-Unclaimed dividend 2.38 2.35
Interest accrued but not due on short term loans 7.92 9.89
Other liabilities 61.06 10.44
1,572.651,572.651,572.651,572.651,572.65 1,722.481,722.481,722.481,722.481,722.48
Notes:Notes:Notes:Notes:Notes:
1 Includes ` 162.29 crores (Previous year ` 138.30 crores) pertaining to the subsidiaries of the company.
2 Includes ` 1.50 crores (Previous year ` 5.30 crores) pertaining to the subsidiaries of the company.
Schedules to the accounts(All amounts in crores of `)
Schedule 14: Revenue Year ended Year ended30 June 2011 30 June 2010
Sale of hardware and software 183.68 110.89
Services 6,610.80 4,967.87
6,794.486,794.486,794.486,794.486,794.48 5,078.765,078.765,078.765,078.765,078.76
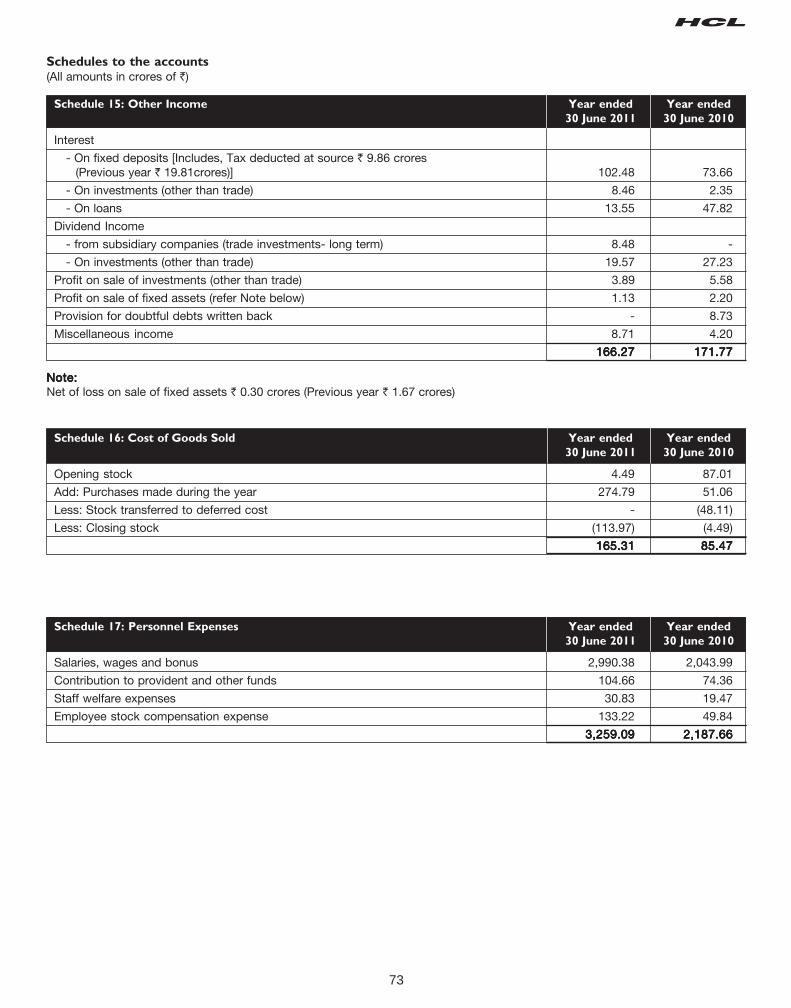
73
Schedule 15: Other Income Year ended Year ended
30 June 2011 30 June 2010
Interest
- On fixed deposits [Includes, Tax deducted at source ` 9.86 crores (Previous year ` 19.81crores)] 102.48 73.66
- On investments (other than trade) 8.46 2.35
- On loans 13.55 47.82
Dividend Income
- from subsidiary companies (trade investments- long term) 8.48 -
- On investments (other than trade) 19.57 27.23
Profit on sale of investments (other than trade) 3.89 5.58
Profit on sale of fixed assets (refer Note below) 1.13 2.20
Provision for doubtful debts written back - 8.73
Miscellaneous income 8.71 4.20
166.27166.27166.27166.27166.27 171.77171.77171.77171.77171.77
Note:Note:Note:Note:Note:Net of loss on sale of fixed assets ` 0.30 crores (Previous year ` 1.67 crores)
Schedules to the accounts(All amounts in crores of `)
Schedule 16: Cost of Goods Sold Year ended Year ended
30 June 2011 30 June 2010
Opening stock 4.49 87.01
Add: Purchases made during the year 274.79 51.06
Less: Stock transferred to deferred cost - (48.11)
Less: Closing stock (113.97) (4.49)
165.31165.31165.31165.31165.31 85.4785.4785.4785.4785.47
Schedule 17: Personnel Expenses Year ended Year ended
30 June 2011 30 June 2010
Salaries, wages and bonus 2,990.38 2,043.99
Contribution to provident and other funds 104.66 74.36
Staff welfare expenses 30.83 19.47
Employee stock compensation expense 133.22 49.84
3,259.093,259.093,259.093,259.093,259.09 2,187.662,187.662,187.662,187.662,187.66
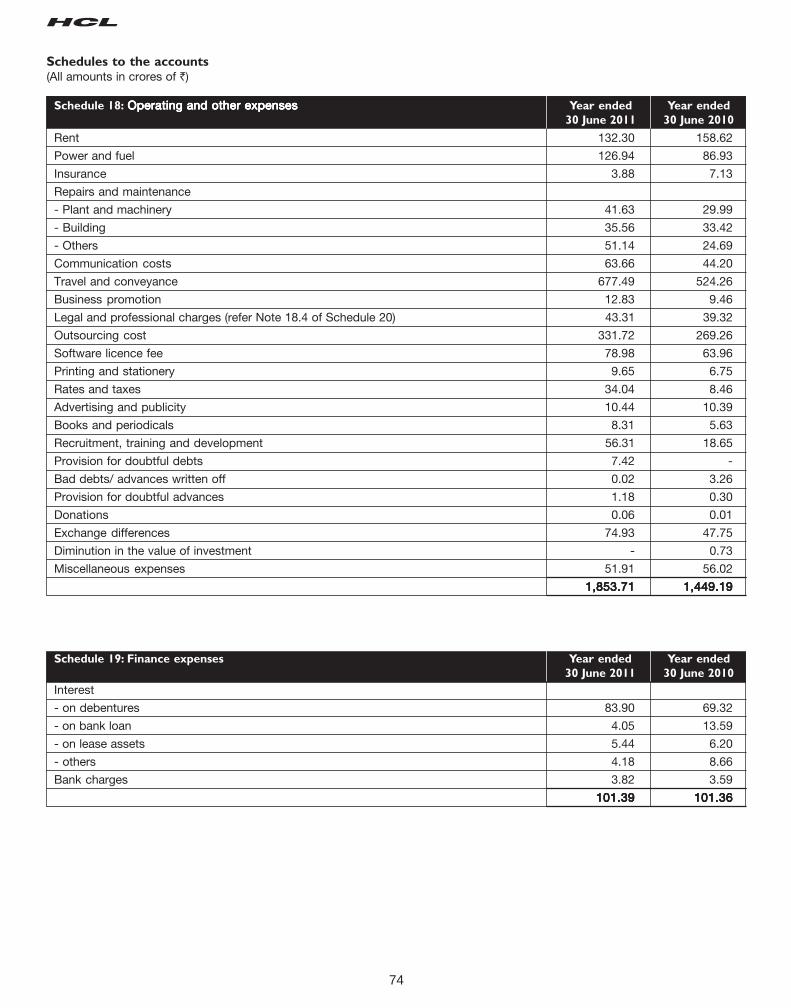
74
Schedules to the accounts(All amounts in crores of `)
Schedule 18: Operating and other expensesOperating and other expensesOperating and other expensesOperating and other expensesOperating and other expenses Year ended Year ended
30 June 2011 30 June 2010
Rent 132.30 158.62
Power and fuel 126.94 86.93
Insurance 3.88 7.13
Repairs and maintenance
- Plant and machinery 41.63 29.99
- Building 35.56 33.42
- Others 51.14 24.69
Communication costs 63.66 44.20
Travel and conveyance 677.49 524.26
Business promotion 12.83 9.46
Legal and professional charges (refer Note 18.4 of Schedule 20) 43.31 39.32
Outsourcing cost 331.72 269.26
Software licence fee 78.98 63.96
Printing and stationery 9.65 6.75
Rates and taxes 34.04 8.46
Advertising and publicity 10.44 10.39
Books and periodicals 8.31 5.63
Recruitment, training and development 56.31 18.65
Provision for doubtful debts 7.42 -
Bad debts/ advances written off 0.02 3.26
Provision for doubtful advances 1.18 0.30
Donations 0.06 0.01
Exchange differences 74.93 47.75
Diminution in the value of investment - 0.73
Miscellaneous expenses 51.91 56.02
1,853.711,853.711,853.711,853.711,853.71 1,449.191,449.191,449.191,449.191,449.19
Schedule 19: Finance expenses Year ended Year ended
30 June 2011 30 June 2010
Interest
- on debentures 83.90 69.32
- on bank loan 4.05 13.59
- on lease assets 5.44 6.20
- others 4.18 8.66
Bank charges 3.82 3.59
101.39101.39101.39101.39101.39 101.36101.36101.36101.36101.36
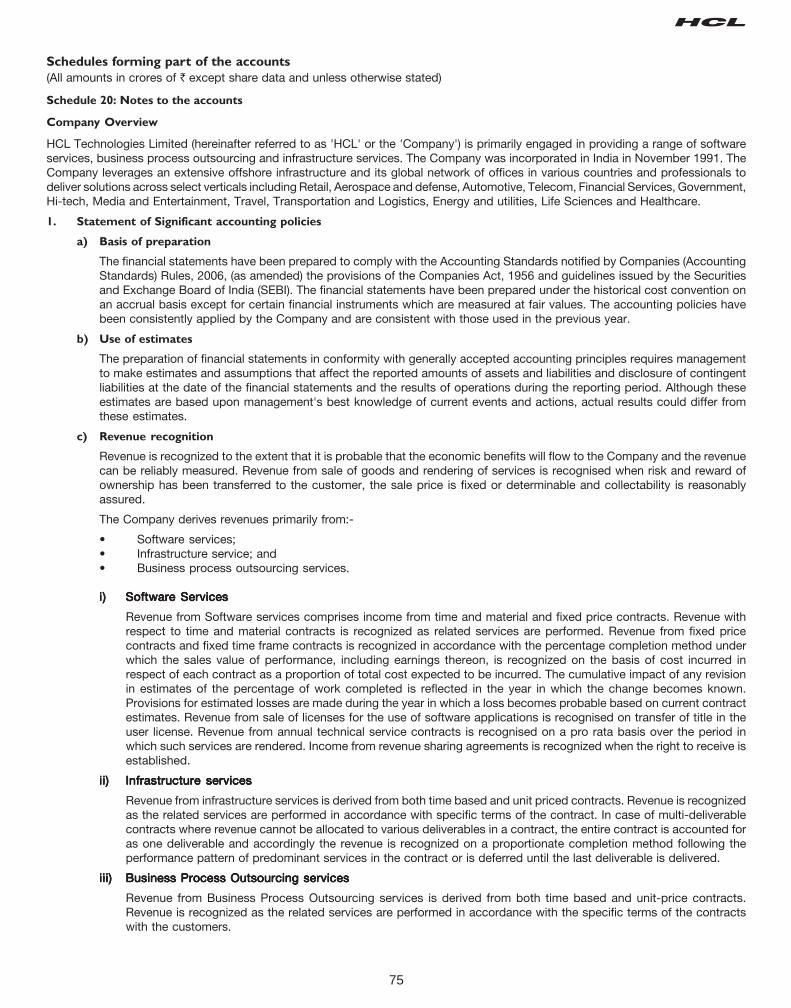
75
Schedules forming part of the accounts
(All amounts in crores of ` except share data and unless otherwise stated)
Schedule 20: Notes to the accounts
Company Overview
HCL Technologies Limited (hereinafter referred to as 'HCL' or the 'Company') is primarily engaged in providing a range of softwareservices, business process outsourcing and infrastructure services. The Company was incorporated in India in November 1991. TheCompany leverages an extensive offshore infrastructure and its global network of offices in various countries and professionals todeliver solutions across select verticals including Retail, Aerospace and defense, Automotive, Telecom, Financial Services, Government,Hi-tech, Media and Entertainment, Travel, Transportation and Logistics, Energy and utilities, Life Sciences and Healthcare.
1. Statement of Significant accounting policies
a) Basis of preparation
The financial statements have been prepared to comply with the Accounting Standards notified by Companies (AccountingStandards) Rules, 2006, (as amended) the provisions of the Companies Act, 1956 and guidelines issued by the Securitiesand Exchange Board of India (SEBI). The financial statements have been prepared under the historical cost convention onan accrual basis except for certain financial instruments which are measured at fair values. The accounting policies havebeen consistently applied by the Company and are consistent with those used in the previous year.
b) Use of estimates
The preparation of financial statements in conformity with generally accepted accounting principles requires managementto make estimates and assumptions that affect the reported amounts of assets and liabilities and disclosure of contingentliabilities at the date of the financial statements and the results of operations during the reporting period. Although theseestimates are based upon management's best knowledge of current events and actions, actual results could differ fromthese estimates.
c) Revenue recognition
Revenue is recognized to the extent that it is probable that the economic benefits will flow to the Company and the revenuecan be reliably measured. Revenue from sale of goods and rendering of services is recognised when risk and reward ofownership has been transferred to the customer, the sale price is fixed or determinable and collectability is reasonablyassured.
The Company derives revenues primarily from:-
• Software services;• Infrastructure service; and• Business process outsourcing services.
i)i)i)i)i) Software ServicesSoftware ServicesSoftware ServicesSoftware ServicesSoftware Services
Revenue from Software services comprises income from time and material and fixed price contracts. Revenue withrespect to time and material contracts is recognized as related services are performed. Revenue from fixed pricecontracts and fixed time frame contracts is recognized in accordance with the percentage completion method underwhich the sales value of performance, including earnings thereon, is recognized on the basis of cost incurred inrespect of each contract as a proportion of total cost expected to be incurred. The cumulative impact of any revisionin estimates of the percentage of work completed is reflected in the year in which the change becomes known.Provisions for estimated losses are made during the year in which a loss becomes probable based on current contractestimates. Revenue from sale of licenses for the use of software applications is recognised on transfer of title in theuser license. Revenue from annual technical service contracts is recognised on a pro rata basis over the period inwhich such services are rendered. Income from revenue sharing agreements is recognized when the right to receive isestablished.
ii)ii)ii)ii)ii) Infrastructure servicesInfrastructure servicesInfrastructure servicesInfrastructure servicesInfrastructure services
Revenue from infrastructure services is derived from both time based and unit priced contracts. Revenue is recognizedas the related services are performed in accordance with specific terms of the contract. In case of multi-deliverablecontracts where revenue cannot be allocated to various deliverables in a contract, the entire contract is accounted foras one deliverable and accordingly the revenue is recognized on a proportionate completion method following theperformance pattern of predominant services in the contract or is deferred until the last deliverable is delivered.
iii)iii)iii)iii)iii) Business Process Outsourcing servicesBusiness Process Outsourcing servicesBusiness Process Outsourcing servicesBusiness Process Outsourcing servicesBusiness Process Outsourcing services
Revenue from Business Process Outsourcing services is derived from both time based and unit-price contracts.Revenue is recognized as the related services are performed in accordance with the specific terms of the contractswith the customers.
76
Schedules forming part of the accounts
(All amounts in crores of ` except share data and unless otherwise stated)Schedule 20: Notes to the accounts (Contd.)
Cost and earnings in excess of billing are classified as unbilled revenue, while billing in excess of cost and earnings areclassified as unearned revenue. Incremental revenue from existing contracts arising on future sales of the customers'products will be recognized when it is earned. Revenue and related direct costs from transition services in outsourcingarrangements are deferred and recognized over the period of the arrangement. Certain upfront non-recurring costsincurred in the initial phases of outsourcing contracts and contract acquisition costs, are deferred and amortizedusually on a straight line basis over the term of the contract. The Company periodically estimates the undiscountedcash flows from the arrangement and compares it with the unamortized costs. If the unamortized costs exceed theundiscounted cash flow, a loss is recognized.
The Company gives volume discounts and pricing incentives to customers. The discount terms in the Company'sarrangements with customers generally entitle the customer to discounts, if the customer completes a specified levelof revenue transactions. In some arrangements, the level of discount varies with increases in the levels of revenuetransactions. The Company recognizes discount obligations as a reduction of revenue based on the rateable allocationof the discount to each of the underlying revenue transactions that result in progress by the customer toward earningthe discount.
Revenues are shown net of sales tax, value added tax, service tax and applicable discounts and allowances.
iv)iv)iv)iv)iv) OthersOthersOthersOthersOthers
Profit on sale of Investments is recorded on transfer of title from the Company and is determined as the differencebetween the sales price and the then carrying value of the investment. Interest on the deployment of surplus funds isrecognised using the time-proportion method, based on interest rates implicit in the transaction. Brokerage, commissionand rent are recognised once the same are earned and accrued to the Company and dividend income is recognisedwhen the right to receive the same is established. Dividend from subsidiaries is recognised even if same are declaredafter the balance sheet date but pertains to period on or before the date of the balance sheet as per the requirementsof schedule VI of the Companies Act, 1956.
d) Fixed assets
Fixed assets are stated at the cost less accumulated depreciation and impairment losses if any. Cost comprises thepurchase price and any attributable cost of bringing the asset to its working condition for its intended use. Fixed assetsunder construction, advances paid towards acquisition of fixed assets and cost of assets not ready for use before the year-end, are disclosed as capital work in progress.
e) Depreciation and amortization
Depreciation on fixed assets except leasehold land and leasehold improvements is provided on the straight-line methodover their estimated useful lives, as determined by the management, at the rates which are equal to or higher than the ratesprescribed under Schedule XIV of the Companies Act, 1956. Leasehold land is amortised over the period of lease. Leaseholdimprovements are amortised over a period of four years or the remaining period of the lease, whichever is shorter. Depreciationis charged on a pro-rata basis for assets purchased/sold during the year. Assets costing less than ̀ 5,000 are fully depreciatedin the year of purchase.
Intangible assets are amortized over their respective individual estimated useful life or on a straight line basis.
The management's estimate of the useful life of the various fixed assets used for depreciation are as follows:
Life (in years)
Fixed AssetsFixed AssetsFixed AssetsFixed AssetsFixed Assets
Buildings 20
Plant and machinery (including office equipment, 4 to 5air conditioners and electrical installations)
Computers 2 to 4
Furniture and fixtures 4
Vehicles - owned 5
Vehicles - leased Over the period of lease or 5 years, whichever is lower
IntangiblesIntangiblesIntangiblesIntangiblesIntangibles
Software 3
77
Schedules forming part of the accounts
(All amounts in crores of ` except share data and unless otherwise stated)Schedule 20: Notes to the accounts (Contd.)
(f) Impairment of assets:
The carrying amounts of assets are reviewed at each balance sheet date if there is any indication of impairment based oninternal/external factors. An impairment loss is recognized wherever the carrying amount of an asset exceeds its recoverableamount. The recoverable amount is the greater of the asset's net selling price and value in use. In assessing value in use,the estimated future cash flows are discounted to their present value using a pre-tax discount rate that reflects currentmarket assessments of the time value of money and risks specific to the asset.
g) Leases
Where the Company is the lesseeWhere the Company is the lesseeWhere the Company is the lesseeWhere the Company is the lesseeWhere the Company is the lessee
Finance leases, which effectively transfer to the Company substantially all the risks and benefits incidental to ownershipof the leased item, are capitalized at the lower of the fair value and present value of the minimum lease payments at theinception of the lease term and disclosed as leased assets. Lease payments are apportioned between the finance chargesand reduction of the lease liability based on the implicit rate of return. Finance charges are charged directly againstincome.
Leases where the lessor effectively retains substantially all the risks and benefits of ownership of the leased item, areclassified as operating leases. Operating lease payments are recognized as an expense in the Profit and Loss account ona straight-line basis over the lease term.
h) Investments
Trade investments are the investments made to enhance the Company's business interests. Investments that are readilyrealisable and intended to be held for not more than a year are classified as current investments. All other investments areclassified as long-term investments. Current investments are carried at lower of cost and fair value determined on anindividual investment basis. Long-term investments are carried at cost. However, provision for diminution in value is madeto recognise a decline other than temporary in the value of the investments.
i) Foreign exchange transactions
(i)(i)(i)(i)(i) Initial RecognitionInitial RecognitionInitial RecognitionInitial RecognitionInitial Recognition
Foreign currency transactions are recorded in the reporting currency, by applying to the foreign currency amountthe exchange rate between the reporting currency and the foreign currency at the date of the transaction.
(ii)(ii)(ii)(ii)(ii) ConversionConversionConversionConversionConversion
Foreign currency monetary items are reported using the closing rate. Non-monetary items which are carried in termsof historical cost denominated in a foreign currency are reported using the exchange rate at the date of the transaction.
(iii)(iii)(iii)(iii)(iii) Exchange DifferencesExchange DifferencesExchange DifferencesExchange DifferencesExchange Differences
Exchange differences arising on the settlement of monetary items, or on reporting such monetary items of Companyat rates different from those at which they were initially recorded during the year, or reported in previous financialstatements, are recognized as income or as expenses in the year in which they arise.
(iv)(iv)(iv)(iv)(iv) HedgingHedgingHedgingHedgingHedging
a)a)a)a)a) Cash flow hedgingCash flow hedgingCash flow hedgingCash flow hedgingCash flow hedging
The Company uses derivative financial instruments (foreign currency forward and option contracts) to hedgeits risks associated with foreign currency fluctuations relating to certain forecasted transactions.
The use of foreign currency forward contracts and options are governed by the Company's policies, whichprovide written principles on the use of such financial derivatives consistent with the Company's risk managementstrategy. The Company does not use derivative financial instruments for speculative purposes.
The derivative instruments are initially measured at fair value, and are remeasured at subsequent reportingdates.
In respect of derivatives designated as hedges, the Company formally documents all relationships betweenhedging instruments and hedged items, as well as its risk management objective and strategy for undertakingvarious hedge transactions. The Company also formally assesses both at the inception of the hedge and on anongoing basis, whether each derivative is highly effective in offsetting changes in fair values or cash flows ofthe hedged item. Changes in the fair value of these derivatives (net of tax) that are designated and effective ashedges of future cash flows are recognised directly in Hedging Reserve Account under shareholders' fundsand the ineffective portion is recognized immediately in profit and loss account. Changes in the fair value ofderivative financial instruments that do not qualify for hedge accounting are recognized in profit and lossaccount as they arise.
78
Hedge accounting is discontinued from the last testing date when the hedging instrument expires or is sold,terminated, or exercised, or no longer qualifies for hedge accounting. Cumulative gain or loss on such hedginginstrument recognised in shareholder's funds is retained there until the forecasted transaction occurs. If ahedged transaction is no longer expected to occur, the net cumulative gain or loss recognised in shareholders'funds is transferred to profit and loss account for the year.
b)b)b)b)b) Hedging of monetary assets and liabilitiesHedging of monetary assets and liabilitiesHedging of monetary assets and liabilitiesHedging of monetary assets and liabilitiesHedging of monetary assets and liabilities
The premium or discount arising at the inception of forward exchange contracts and option is amortised asexpense or income over the life of the contract. Exchange differences on such contracts are recognised in thestatement of profit and loss in the year in which the exchange rates change. Any profit or loss arising oncancellation or renewal of forward exchange contract is recognised as income or as expense for the year.
(v)(v)(v)(v)(v) Translation of Integral and Non-integral foreign operationTranslation of Integral and Non-integral foreign operationTranslation of Integral and Non-integral foreign operationTranslation of Integral and Non-integral foreign operationTranslation of Integral and Non-integral foreign operation
The financial statements of an integral foreign operation are translated as if the transactions of the foreign operationhave been those of the Company itself.
In translating the financial statements of a non-integral foreign operation for incorporation in financial statements,the assets and liabilities, both monetary and non-monetary, of the non-integral foreign operation are translated atthe closing rate; income and expense items of the non-integral foreign operation are translated at monthly weightedaverage rates ,which approximate the actual exchange rates; and all resulting exchange differences are accumulatedin a foreign currency translation reserve until the disposal of the net investment.
On the disposal of a non-integral foreign operation, the cumulative amount of the exchange differences which havebeen deferred and which relate to that operation are recognised as income or as expenses in the same period inwhich the gain or loss on disposal is recognised.
j) Inventories
Finished goods are valued at lower of cost and net realisable value. Net realizable value is the estimated selling price in theordinary course of business, less estimated costs of completion and estimated costs necessary to make the sale. Cost ofgoods that are procured for specific projects is assigned by specific identification of their individual costs. Cost of goodsthat are interchangeable and not specific to any project is determined using weighted average cost formula. Stores andspare parts are carried at cost, less provision for obsolescence.
k) Employee stock compensation cost
The Company calculates the compensation cost based on the intrinsic value method wherein the excess of market priceof underlying equity shares on the date of the grant of options over the exercise price of the options given to employeesunder the employee stock option schemes of the Company, is recognised as deferred stock compensation cost and isamortised on a graded vesting basis over the vesting period of the options.
l) Taxation
Tax expense comprises current and deferred tax. Current income tax expense comprises taxes on income from operationsin India and in foreign jurisdictions. Income tax payable in India is determined in accordance with the provisions ofthe Income Tax Act, 1961 and tax expense relating to overseas operations is determined in accordance with tax lawsapplicable in countries where such operations are domiciled.
Deferred tax expense or benefit is recognised on timing differences being the difference between taxable income andaccounting income that originate in one period and are capable of reversal in one or more subsequent periods.
Deferred tax assets and liabilities are measured using the tax rates and tax laws that have been enacted or substantivelyenacted by the balance sheet date. Deferred tax assets and deferred tax liabilities are offset, if a legally enforceable rightexists to set off current tax assets against current tax liabilities and the deferred tax assets and deferred tax liabilitiesrelate to the taxes on income levied by the same governing taxation laws.
Deferred tax assets are recognised only to the extent that there is reasonable certainty that sufficient future taxableincome will be available against which such deferred tax assets can be realised. In situations where the Company hasunabsorbed depreciation or carry forward tax losses, all deferred tax assets are recognised only if there is virtual certaintysupported by convincing evidence that they can be realised against future taxable profits.
At each balance sheet date the Company re-assesses recognized and unrecognised deferred tax assets. The Companywrites-down the carrying amount of a deferred tax asset to the extent that it is no longer reasonably certain or virtuallycertain, as the case may be, that sufficient future taxable income will be available against which the deferred tax asset canbe realised. Any such write-down is reversed to the extent that it becomes reasonably certain or virtually certain, as thecase may be, that sufficient future taxable income will be available. The Company recognizes unrecognized deferred tax
Schedules forming part of the accounts
(All amounts in crores of ` except share data and unless otherwise stated)Schedule 20: Notes to the accounts (Contd.)
79
Schedules forming part of the accounts
(All amounts in crores of ` except share data and unless otherwise stated)Schedule 20: Notes to the accounts (Contd.)
assets to the extent that it has become reasonably certain or virtually certain, as the case may be, that sufficient futuretaxable income will be available against which such deferred tax assets can be realised.
Minimum Alternative tax (MAT) credit is recognised as an asset only when and to the extent there is convincing evidencethat the Company will pay normal income tax during the specified period. In the year in which the MAT credit becomeseligible to be recognized as an asset in accordance with the recommendations contained in guidance note issued by theInstitute of Chartered Accountants of India, the said asset is created by way of a credit to the profit and loss account andshown as MAT Credit Entitlement. The Company reviews the same at each balance sheet date and writes down thecarrying amount of MAT Credit Entitlement to the extent there is no longer convincing evidence to the effect that Companywill pay normal income tax during the specified period.
m) Employee benefits
i)i)i)i)i) Contributions to provident fund, a defined benefit plan, are deposited with a Recognised Provident Fund Trust, setup by the Company. The contributions are charged to the profit and loss account of the year when the contributionsto the fund are due. The interest rate payable by the trust to the beneficiaries every year is notified by the governmentand the Company has an obligation to make good the shortfall, if any, between the return from the investments ofthe trust and the notified interest rate.
ii)ii)ii)ii)ii) The Company makes contributions to a scheme administered by an insurance company in respect of superannuationfor applicable employees and such contributions are charged to profit and loss account. The Company has nofurther obligations to the superannuation plan beyond its contributions.
iii)iii)iii)iii)iii) Gratuity liability is a defined benefit obligation and is provided for on the basis of an actuarial valuation on projectedunit credit method made at the end of each financial year
iv)iv)iv)iv)iv) Short term compensated absences are provided for based on estimates. Long term compensated absences areprovided for based on actuarial valuation at the year end. The actuarial valuation is done as per projected unit creditmethod.
v)v)v)v)v) Actuarial gains/losses are immediately taken to profit and loss account and are not deferred.
vi)vi)vi)vi)vi) The Company's contribution to State Plans namely Employee State Insurance Fund and Employees Pension Schemeare charged to profit and loss account when the contributions are due.
n) Research and Development
Research costs are expensed as incurred. Development expenditure incurred on an individual project is recognized as anintangible asset when the Company can demonstrate:
(i)(i)(i)(i)(i) The technical feasibility of completing the intangible asset so that it will be available for use or sale;
(ii)(ii)(ii)(ii)(ii) Its intention to complete the asset and use or sell it;
(iii)(iii)(iii)(iii)(iii) its ability to use or sell the asset;
(iv)(iv)(iv)(iv)(iv) how the asset will generate probable future economic benefits;
(v)(v)(v)(v)(v) the availability of adequate resources to complete the development and to use or sell the asset; and
(vi)(vi)(vi)(vi)(vi) the ability to measure reliably the expenditure attributable to the intangible asset during development.
Any expenditure so capitalized is amortised over the period of expected future sales from the related project.
The carrying value of development costs is reviewed for impairment annually when the asset is not yet in use, and otherwisewhen events or changes in circumstances indicate that the carrying value may not be recoverable.
o) Earnings per share
Basic earnings per share are calculated by dividing the net profit or loss for the period attributable to equity shareholdersby the weighted average number of equity shares outstanding during the period. For the purpose of calculating dilutedearnings per share, the net profit or loss for the period attributable to equity shareholders and the weighted averagenumber of shares outstanding during the period are adjusted for the effects of all dilutive potential equity shares.
p) Borrowing cost
Borrowing costs directly attributable to the acquisition, construction or production of an asset that necessarily takes asubstantial period of time to get ready for its intended use or sale are capitalized as part of the cost of the respective asset.All other borrowing costs are expensed in the period they occur. Borrowing costs consist of interest and other costs thatthe Company incurs in connection with the borrowing of funds.
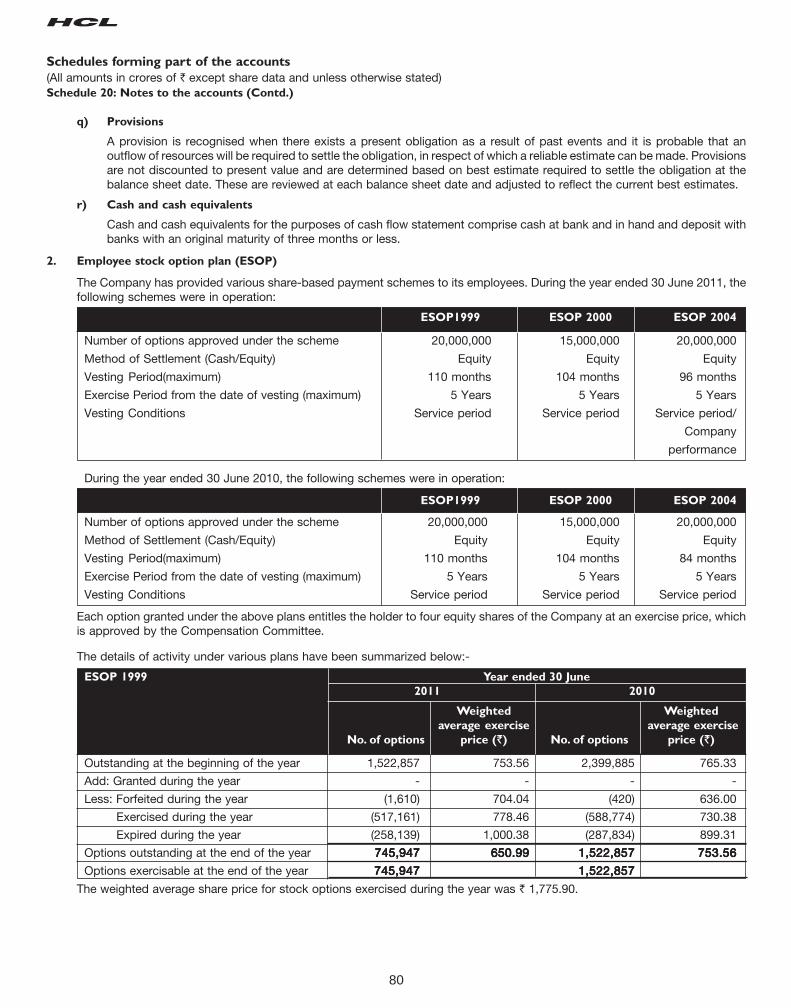
80
Schedules forming part of the accounts
(All amounts in crores of ` except share data and unless otherwise stated)Schedule 20: Notes to the accounts (Contd.)
q) Provisions
A provision is recognised when there exists a present obligation as a result of past events and it is probable that anoutflow of resources will be required to settle the obligation, in respect of which a reliable estimate can be made. Provisionsare not discounted to present value and are determined based on best estimate required to settle the obligation at thebalance sheet date. These are reviewed at each balance sheet date and adjusted to reflect the current best estimates.
r) Cash and cash equivalents
Cash and cash equivalents for the purposes of cash flow statement comprise cash at bank and in hand and deposit withbanks with an original maturity of three months or less.
2. Employee stock option plan (ESOP)
The Company has provided various share-based payment schemes to its employees. During the year ended 30 June 2011, thefollowing schemes were in operation:
ESOP1999 ESOP 2000 ESOP 2004
Number of options approved under the scheme 20,000,000 15,000,000 20,000,000
Method of Settlement (Cash/Equity) Equity Equity Equity
Vesting Period(maximum) 110 months 104 months 96 months
Exercise Period from the date of vesting (maximum) 5 Years 5 Years 5 Years
Vesting Conditions Service period Service period Service period/
Company
performance
During the year ended 30 June 2010, the following schemes were in operation:
ESOP1999 ESOP 2000 ESOP 2004
Number of options approved under the scheme 20,000,000 15,000,000 20,000,000
Method of Settlement (Cash/Equity) Equity Equity Equity
Vesting Period(maximum) 110 months 104 months 84 months
Exercise Period from the date of vesting (maximum) 5 Years 5 Years 5 Years
Vesting Conditions Service period Service period Service period
Each option granted under the above plans entitles the holder to four equity shares of the Company at an exercise price, whichis approved by the Compensation Committee.
The details of activity under various plans have been summarized below:-
ESOP 1999 Year ended 30 June
2011 2010
Weighted Weighted
average exercise average exercise
No. of options price (`) No. of options price (`)
Outstanding at the beginning of the year 1,522,857 753.56 2,399,885 765.33
Add: Granted during the year - - - -
Less: Forfeited during the year (1,610) 704.04 (420) 636.00
Exercised during the year (517,161) 778.46 (588,774) 730.38
Expired during the year (258,139) 1,000.38 (287,834) 899.31
Options outstanding at the end of the year 745,947 745,947 745,947 745,947 745,947 650.99 650.99 650.99 650.99 650.99 1,522,8571,522,8571,522,8571,522,8571,522,857 753.56753.56753.56753.56753.56
Options exercisable at the end of the year 745,947745,947745,947745,947745,947 1,522,8571,522,8571,522,8571,522,8571,522,857
The weighted average share price for stock options exercised during the year was ` 1,775.90.
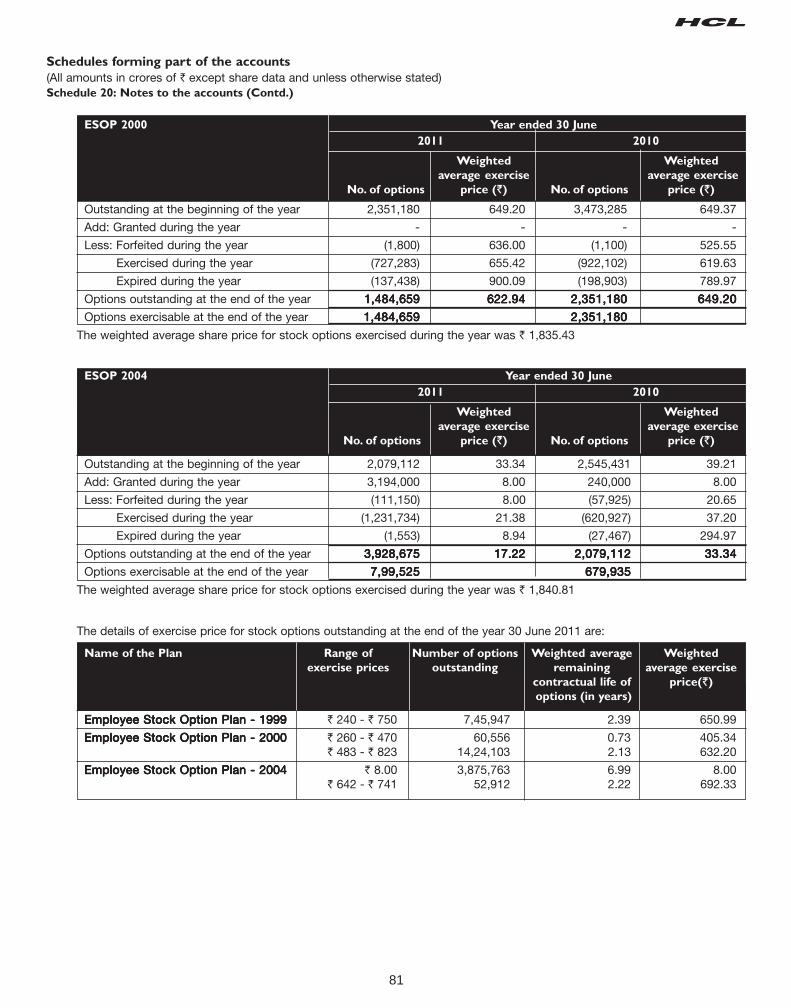
81
Schedules forming part of the accounts
(All amounts in crores of ` except share data and unless otherwise stated)Schedule 20: Notes to the accounts (Contd.)
The details of exercise price for stock options outstanding at the end of the year 30 June 2011 are:
Name of the Plan Range of Number of options Weighted average Weighted
exercise prices outstanding remaining average exercise
contractual life of price(`)
options (in years)
Employee Stock Option Plan - 1999Employee Stock Option Plan - 1999Employee Stock Option Plan - 1999Employee Stock Option Plan - 1999Employee Stock Option Plan - 1999 ` 240 - ` 750 7,45,947 2.39 650.99
Employee Stock Option Plan - 2000Employee Stock Option Plan - 2000Employee Stock Option Plan - 2000Employee Stock Option Plan - 2000Employee Stock Option Plan - 2000 ` 260 - ` 470 60,556 0.73 405.34` 483 - ` 823 14,24,103 2.13 632.20
Employee Stock Option Plan - 2004Employee Stock Option Plan - 2004Employee Stock Option Plan - 2004Employee Stock Option Plan - 2004Employee Stock Option Plan - 2004 ` 8.00 3,875,763 6.99 8.00 ` 642 - ` 741 52,912 2.22 692.33
ESOP 2000 Year ended 30 June
2011 2010
Weighted Weighted
average exercise average exercise
No. of options price (`) No. of options price (`)
Outstanding at the beginning of the year 2,351,180 649.20 3,473,285 649.37
Add: Granted during the year - - - -
Less: Forfeited during the year (1,800) 636.00 (1,100) 525.55
Exercised during the year (727,283) 655.42 (922,102) 619.63
Expired during the year (137,438) 900.09 (198,903) 789.97
Options outstanding at the end of the year 1,484,6591,484,6591,484,6591,484,6591,484,659 622.94 622.94 622.94 622.94 622.94 2,351,1802,351,1802,351,1802,351,1802,351,180 649.20649.20649.20649.20649.20
Options exercisable at the end of the year 1,484,6591,484,6591,484,6591,484,6591,484,659 2,351,1802,351,1802,351,1802,351,1802,351,180
The weighted average share price for stock options exercised during the year was ` 1,835.43
ESOP 2004 Year ended 30 June
2011 2010
Weighted Weighted
average exercise average exercise
No. of options price (`) No. of options price (`)
Outstanding at the beginning of the year 2,079,112 33.34 2,545,431 39.21
Add: Granted during the year 3,194,000 8.00 240,000 8.00
Less: Forfeited during the year (111,150) 8.00 (57,925) 20.65
Exercised during the year (1,231,734) 21.38 (620,927) 37.20
Expired during the year (1,553) 8.94 (27,467) 294.97
Options outstanding at the end of the year 3,928,6753,928,6753,928,6753,928,6753,928,675 17.22 17.22 17.22 17.22 17.22 2,079,1122,079,1122,079,1122,079,1122,079,112 33.3433.3433.3433.3433.34
Options exercisable at the end of the year 7,99,5257,99,5257,99,5257,99,5257,99,525 679,935679,935679,935679,935679,935
The weighted average share price for stock options exercised during the year was ` 1,840.81
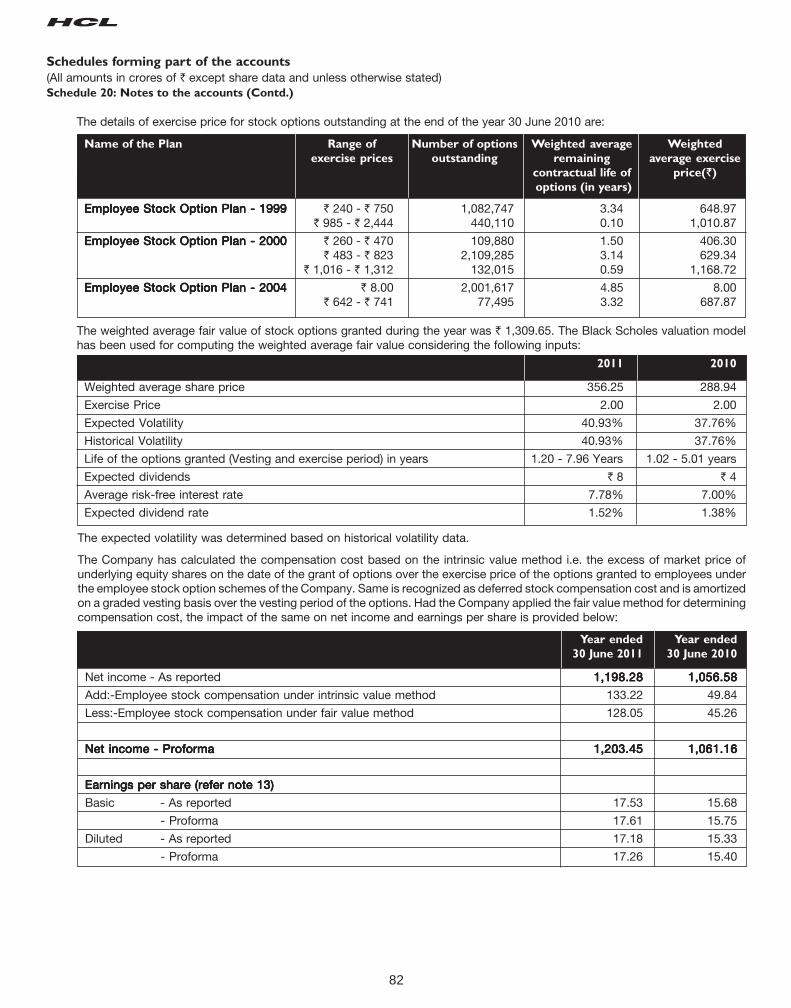
82
Schedules forming part of the accounts
(All amounts in crores of ` except share data and unless otherwise stated)Schedule 20: Notes to the accounts (Contd.)
The details of exercise price for stock options outstanding at the end of the year 30 June 2010 are:
Name of the Plan Range of Number of options Weighted average Weighted
exercise prices outstanding remaining average exercise
contractual life of price(`)
options (in years)
Employee Stock Option Plan - 1999Employee Stock Option Plan - 1999Employee Stock Option Plan - 1999Employee Stock Option Plan - 1999Employee Stock Option Plan - 1999 ` 240 - ` 750 1,082,747 3.34 648.97` 985 - ` 2,444 440,110 0.10 1,010.87
Employee Stock Option Plan - 2000Employee Stock Option Plan - 2000Employee Stock Option Plan - 2000Employee Stock Option Plan - 2000Employee Stock Option Plan - 2000 ` 260 - ` 470 109,880 1.50 406.30` 483 - ` 823 2,109,285 3.14 629.34
` 1,016 - ` 1,312 132,015 0.59 1,168.72
Employee Stock Option Plan - 2004Employee Stock Option Plan - 2004Employee Stock Option Plan - 2004Employee Stock Option Plan - 2004Employee Stock Option Plan - 2004 ` 8.00 2,001,617 4.85 8.00` 642 - ` 741 77,495 3.32 687.87
The weighted average fair value of stock options granted during the year was ` 1,309.65. The Black Scholes valuation modelhas been used for computing the weighted average fair value considering the following inputs:
2011 2010
Weighted average share price 356.25 288.94
Exercise Price 2.00 2.00
Expected Volatility 40.93% 37.76%
Historical Volatility 40.93% 37.76%
Life of the options granted (Vesting and exercise period) in years 1.20 - 7.96 Years 1.02 - 5.01 years
Expected dividends ` 8 ` 4
Average risk-free interest rate 7.78% 7.00%
Expected dividend rate 1.52% 1.38%
The expected volatility was determined based on historical volatility data.
The Company has calculated the compensation cost based on the intrinsic value method i.e. the excess of market price ofunderlying equity shares on the date of the grant of options over the exercise price of the options granted to employees underthe employee stock option schemes of the Company. Same is recognized as deferred stock compensation cost and is amortizedon a graded vesting basis over the vesting period of the options. Had the Company applied the fair value method for determiningcompensation cost, the impact of the same on net income and earnings per share is provided below:
Year ended Year ended
30 June 2011 30 June 2010
Net income - As reported 1,198.281,198.281,198.281,198.281,198.28 1,056.581,056.581,056.581,056.581,056.58
Add:-Employee stock compensation under intrinsic value method 133.22 49.84
Less:-Employee stock compensation under fair value method 128.05 45.26
Net income - ProformaNet income - ProformaNet income - ProformaNet income - ProformaNet income - Proforma 1,203.451,203.451,203.451,203.451,203.45 1,061.161,061.161,061.161,061.161,061.16
Earnings per share (refer note 13)Earnings per share (refer note 13)Earnings per share (refer note 13)Earnings per share (refer note 13)Earnings per share (refer note 13)
Basic - As reported 17.53 15.68
- Proforma 17.61 15.75
Diluted - As reported 17.18 15.33
- Proforma 17.26 15.40
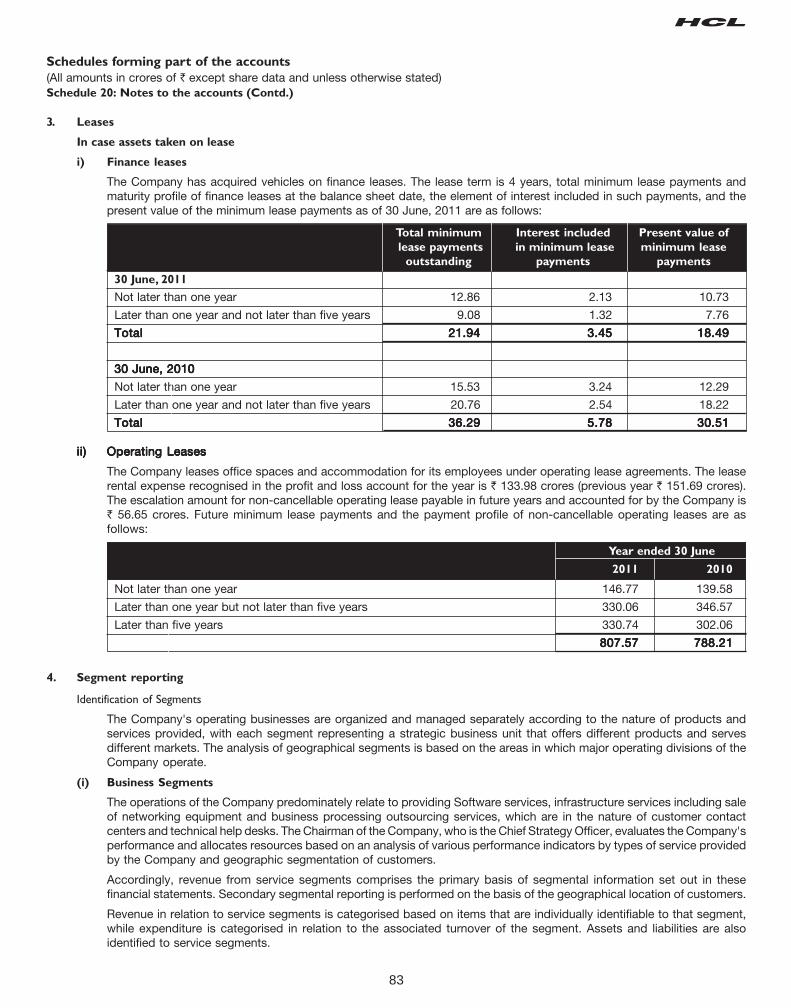
83
Schedules forming part of the accounts
(All amounts in crores of ` except share data and unless otherwise stated)Schedule 20: Notes to the accounts (Contd.)
3. Leases
In case assets taken on lease
i) Finance leases
The Company has acquired vehicles on finance leases. The lease term is 4 years, total minimum lease payments andmaturity profile of finance leases at the balance sheet date, the element of interest included in such payments, and thepresent value of the minimum lease payments as of 30 June, 2011 are as follows:
Total minimum Interest included Present value of
lease payments in minimum lease minimum lease
outstanding payments payments
30 June, 2011
Not later than one year 12.86 2.13 10.73
Later than one year and not later than five years 9.08 1.32 7.76
TotalTotalTotalTotalTotal 21.9421.9421.9421.9421.94 3.453.453.453.453.45 18.4918.4918.4918.4918.49
30 June, 201030 June, 201030 June, 201030 June, 201030 June, 2010
Not later than one year 15.53 3.24 12.29
Later than one year and not later than five years 20.76 2.54 18.22
TotalTotalTotalTotalTotal 36.2936.2936.2936.2936.29 5.785.785.785.785.78 30.5130.5130.5130.5130.51
ii)ii)ii)ii)ii) Operating LeasesOperating LeasesOperating LeasesOperating LeasesOperating Leases
The Company leases office spaces and accommodation for its employees under operating lease agreements. The leaserental expense recognised in the profit and loss account for the year is ` 133.98 crores (previous year ` 151.69 crores).The escalation amount for non-cancellable operating lease payable in future years and accounted for by the Company is` 56.65 crores. Future minimum lease payments and the payment profile of non-cancellable operating leases are asfollows:
Year ended 30 June
2011 2010
Not later than one year 146.77 139.58
Later than one year but not later than five years 330.06 346.57
Later than five years 330.74 302.06
807.57807.57807.57807.57807.57 788.21788.21788.21788.21788.21
Movement in Stock options Year ended Year ended
4. Segment reporting
Identification of Segments
The Company's operating businesses are organized and managed separately according to the nature of products andservices provided, with each segment representing a strategic business unit that offers different products and servesdifferent markets. The analysis of geographical segments is based on the areas in which major operating divisions of theCompany operate.
(i) Business Segments
The operations of the Company predominately relate to providing Software services, infrastructure services including saleof networking equipment and business processing outsourcing services, which are in the nature of customer contactcenters and technical help desks. The Chairman of the Company, who is the Chief Strategy Officer, evaluates the Company'sperformance and allocates resources based on an analysis of various performance indicators by types of service providedby the Company and geographic segmentation of customers.
Accordingly, revenue from service segments comprises the primary basis of segmental information set out in thesefinancial statements. Secondary segmental reporting is performed on the basis of the geographical location of customers.
Revenue in relation to service segments is categorised based on items that are individually identifiable to that segment,while expenditure is categorised in relation to the associated turnover of the segment. Assets and liabilities are alsoidentified to service segments.
84
Schedules forming part of the accounts
(All amounts in crores of ` except share data and unless otherwise stated)Schedule 20: Notes to the accounts (Contd.)
(ii) Geographic Segments
Geographic segmentation is based on the location of the respective client. The principal geographical segments havebeen classified as America, Europe and others. Europe comprises business operations conducted by the Company in theUnited Kingdom, Sweden, Germany, Italy, Belgium, Netherlands, Finland, Switzerland, Ireland and Poland. Since servicesprovided by the Company within these European entities are subject to similar risks and returns, their operating resultshave been reported as one segment, namely Europe. All other customers, mainly in Japan, Australia, New Zealand,Singapore, Malaysia, Israel, South Korea, India, China, Hong Kong, Czech Republic, Macau, UAE, Portugal and Russiaare included in others.
(iii) Segment accounting policies
The accounting principles consistently used in the preparation of the financial statements and consistently applied torecord revenue and expenditure in individual segments are as set out in Note 1 to this schedule on significant accountingpolicies. The accounting policies in relation to segment accounting are as under:
a) Segment assets and liabilities
All segment assets and liabilities have been allocated to the various segments on the basis of specific identification.
Segment assets consist principally of fixed assets, sundry debtors, loans and advances, cash and bank balancesand unbilled receivables. Segment assets do not include unallocated corporate and treasury assets, net deferredtax assets and advance taxes.
Segment liabilities include sundry creditors and other liabilities. Segment liabilities do not include share capital,reserves, secured loans, unsecured loan and provision for taxes.
b) Segment revenue and expenses
Segment revenue is directly attributable to the segment and segment expenses have been allocated to varioussegments on the basis of specific identification. However, segment revenue does not include miscellaneous income,income from investments and other income. Segment expenses do not include premium amortized on bonds,diminution allowance in respect of current and trade investments, other than temporary diminution in the value oflong term investment, charge taken for stock options issued to employees, corporate expenses and finance cost.
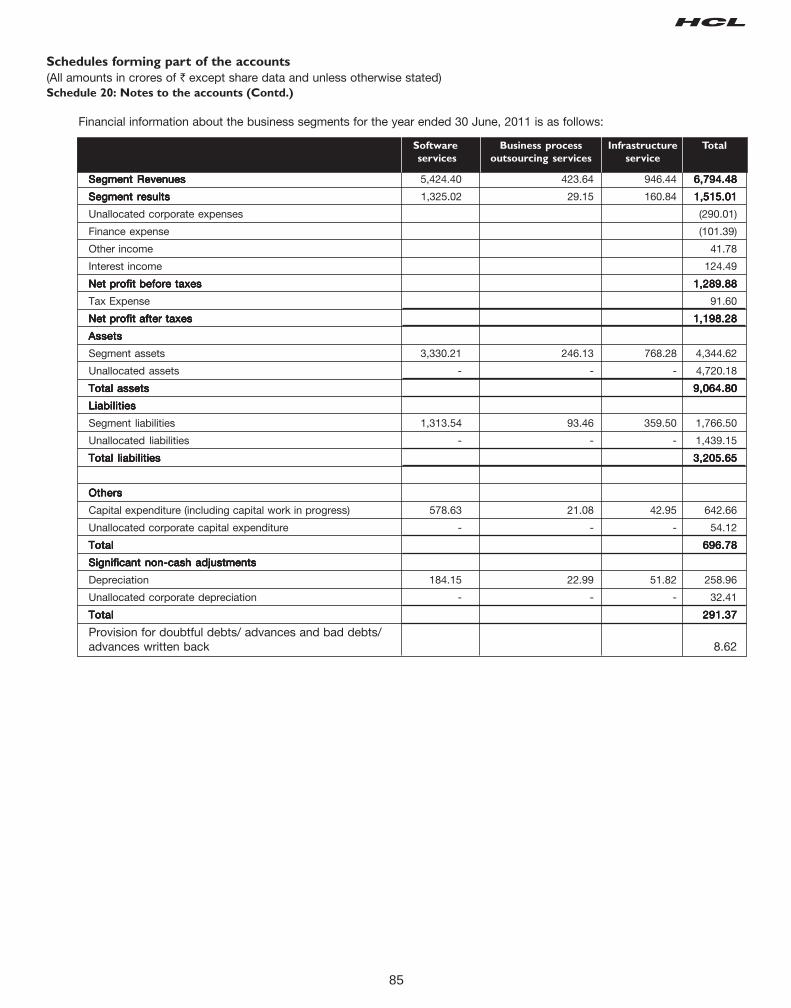
85
Schedules forming part of the accounts
(All amounts in crores of ` except share data and unless otherwise stated)Schedule 20: Notes to the accounts (Contd.)
Software Business process Infrastructure Total
services outsourcing services service
Segment RevenuesSegment RevenuesSegment RevenuesSegment RevenuesSegment Revenues 5,424.40 423.64 946.44 6,794.48 6,794.48 6,794.48 6,794.48 6,794.48
Segment resultsSegment resultsSegment resultsSegment resultsSegment results 1,325.02 29.15 160.84 1,515.011,515.011,515.011,515.011,515.01
Unallocated corporate expenses (290.01)
Finance expense (101.39)
Other income 41.78
Interest income 124.49
Net profit before taxesNet profit before taxesNet profit before taxesNet profit before taxesNet profit before taxes 1,289.881,289.881,289.881,289.881,289.88
Tax Expense 91.60
Net profit after taxesNet profit after taxesNet profit after taxesNet profit after taxesNet profit after taxes 1,198.281,198.281,198.281,198.281,198.28
AssetsAssetsAssetsAssetsAssets
Segment assets 3,330.21 246.13 768.28 4,344.62
Unallocated assets - - - 4,720.18
Total assetsTotal assetsTotal assetsTotal assetsTotal assets 9,064.809,064.809,064.809,064.809,064.80
LiabilitiesLiabilitiesLiabilitiesLiabilitiesLiabilities
Segment liabilities 1,313.54 93.46 359.50 1,766.50
Unallocated liabilities - - - 1,439.15
Total liabilitiesTotal liabilitiesTotal liabilitiesTotal liabilitiesTotal liabilities 3,205.653,205.653,205.653,205.653,205.65
OthersOthersOthersOthersOthers
Capital expenditure (including capital work in progress) 578.63 21.08 42.95 642.66
Unallocated corporate capital expenditure - - - 54.12
TotalTotalTotalTotalTotal 696.78696.78696.78696.78696.78
Significant non-cash adjustmentsSignificant non-cash adjustmentsSignificant non-cash adjustmentsSignificant non-cash adjustmentsSignificant non-cash adjustments
Depreciation 184.15 22.99 51.82 258.96
Unallocated corporate depreciation - - - 32.41
TotalTotalTotalTotalTotal 291.37291.37291.37291.37291.37
Provision for doubtful debts/ advances and bad debts/advances written back 8.62
Financial information about the business segments for the year ended 30 June, 2011 is as follows:
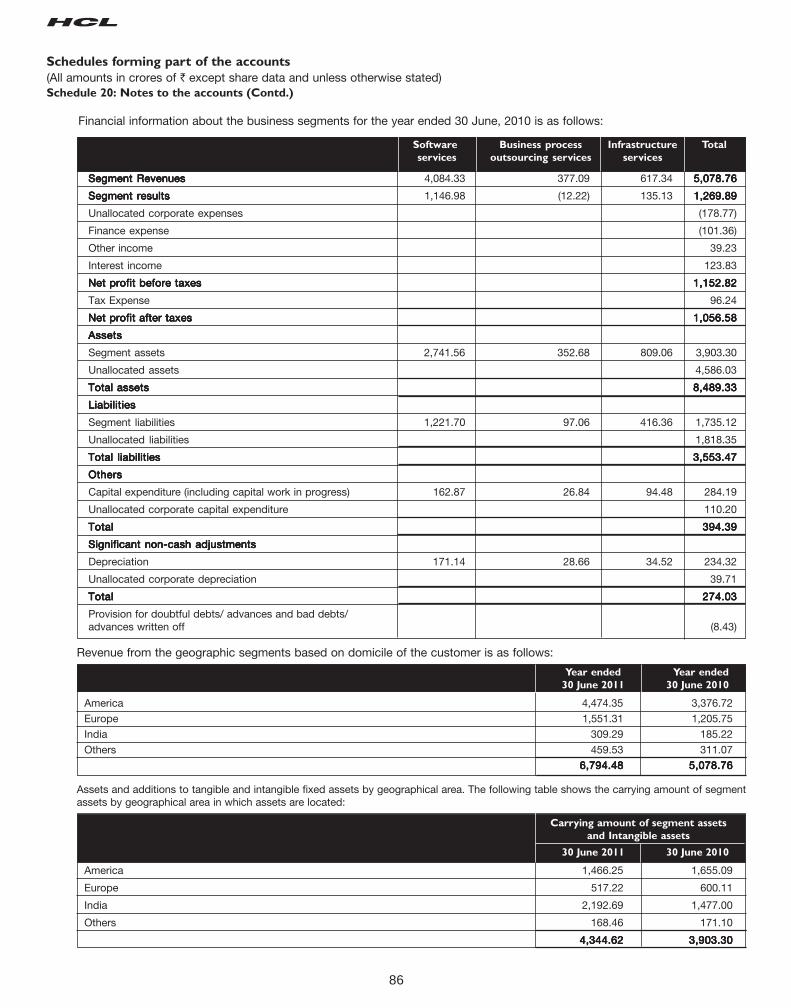
86
Schedules forming part of the accounts
(All amounts in crores of ` except share data and unless otherwise stated)Schedule 20: Notes to the accounts (Contd.)
Financial information about the business segments for the year ended 30 June, 2010 is as follows:
Revenue from the geographic segments based on domicile of the customer is as follows:
Year ended Year ended
30 June 2011 30 June 2010
America 4,474.35 3,376.72
Europe 1,551.31 1,205.75
India 309.29 185.22
Others 459.53 311.07
6,794.486,794.486,794.486,794.486,794.48 5,078.765,078.765,078.765,078.765,078.76
Assets and additions to tangible and intangible fixed assets by geographical area. The following table shows the carrying amount of segmentassets by geographical area in which assets are located:
Software Business process Infrastructure Total
services outsourcing services services
Segment RevenuesSegment RevenuesSegment RevenuesSegment RevenuesSegment Revenues 4,084.33 377.09 617.34 5,078.765,078.765,078.765,078.765,078.76
Segment resultsSegment resultsSegment resultsSegment resultsSegment results 1,146.98 (12.22) 135.13 1,269.891,269.891,269.891,269.891,269.89
Unallocated corporate expenses (178.77)
Finance expense (101.36)
Other income 39.23
Interest income 123.83
Net profit before taxesNet profit before taxesNet profit before taxesNet profit before taxesNet profit before taxes 1,152.821,152.821,152.821,152.821,152.82
Tax Expense 96.24
Net profit after taxesNet profit after taxesNet profit after taxesNet profit after taxesNet profit after taxes 1,056.581,056.581,056.581,056.581,056.58
AssetsAssetsAssetsAssetsAssets
Segment assets 2,741.56 352.68 809.06 3,903.30
Unallocated assets 4,586.03
Total assetsTotal assetsTotal assetsTotal assetsTotal assets 8,489.338,489.338,489.338,489.338,489.33
LiabilitiesLiabilitiesLiabilitiesLiabilitiesLiabilities
Segment liabilities 1,221.70 97.06 416.36 1,735.12
Unallocated liabilities 1,818.35
Total liabilitiesTotal liabilitiesTotal liabilitiesTotal liabilitiesTotal liabilities 3,553.473,553.473,553.473,553.473,553.47
OthersOthersOthersOthersOthers
Capital expenditure (including capital work in progress) 162.87 26.84 94.48 284.19
Unallocated corporate capital expenditure 110.20
TotalTotalTotalTotalTotal 394.39394.39394.39394.39394.39
Significant non-cash adjustmentsSignificant non-cash adjustmentsSignificant non-cash adjustmentsSignificant non-cash adjustmentsSignificant non-cash adjustments
Depreciation 171.14 28.66 34.52 234.32
Unallocated corporate depreciation 39.71
TotalTotalTotalTotalTotal 274.03274.03274.03274.03274.03
Provision for doubtful debts/ advances and bad debts/advances written off (8.43)
Carrying amount of segment assets
and Intangible assets
30 June 2011 30 June 2010
America 1,466.25 1,655.09
Europe 517.22 600.11
India 2,192.69 1,477.00
Others 168.46 171.10
4,344.624,344.624,344.624,344.624,344.62 3,903.303,903.303,903.303,903.303,903.30
87
5. Related party transactions
a) Related parties where control exists
Subsidiaries
HCL Comnet Systems and Services LimitedHCL Bermuda LimitedHCL Technologies (Shanghai) LimitedHCL Great Britain LimitedHCL (Netherlands) BVHCL GmbHHCL Belgium NVHCL Sweden ABHCL Italy SLRHCL Australia Services Pty. LimitedHCL (New Zealand) LimitedHCL Hong Kong SAR LimitedHCL Japan LimitedHCL Comnet LimitedHCL America Inc.HCL Holdings GmbHHCL Global Processing Services Limited (formerly Intelicent India Limited)DSI Financial Solutions Pte. LimitedHCL BPO Services (NI) LimitedHCL Jones Technologies LLCHCL Singapore Pte. LimitedHCL (Malaysia) Sdn. Bhd.HCL EAI Services LimitedHCL Poland sp. z o.oCapital Stream, Inc.HCL EAS LimitedHCL Insurance BPO Services LimitedHCL Expense Management Services Inc.Axon Group Limited.Axon Solutions (Canada) Inc.Bywater LimitedAxon Solutions Schweiz GmbhAxon Solutions Pty. LimitedAxon Solutions Inc.Axon Acquisition Company, Inc.Axon Solutions LimitedAxon Solutions Sdn. Bhd.Axon Solutions Singapore Pte. LimitedAxon Solutions (Shanghai) Co. LimitedHCL Axon (Proprietary) LimitedJSPC- I Solutions Sdn. Bhd.JSP Consulting Sdn. Bhd.HCL Technologies Canada Inc.HCL Argentina s.a.HCL Mexico S. de R.L.HCL Technologies Romania s.r.l.HCL Hungary LimitedHCL Latin America Holding LLCHCL (Brazil) Technologia da informacao Ltda.HCL Technologies Denmark AppsHCL Technologies Norway ASHCL Technologies South Africa (Proprietary) LimitedPT. HCL Technologies Indonesia LimitedHCL Arabia LLCHCL Technologies FranceAnzospan Investments PTY LimitedFILIAL ESPAÑOLA DE HCL TECHNOLOGIES, S.L(Spain)
Schedules forming part of the accounts
(All amounts in crores of ` except share data and unless otherwise stated)Schedule 20: Notes to the accounts (Contd.)
88
Employee benefit trustsEmployee benefit trustsEmployee benefit trustsEmployee benefit trustsEmployee benefit trustsHCL Technologies Limited Employees TrustAxon Group Plc Employee Benefit Trust No. 3Axon Group Plc Employee Benefit Trust No. 4
Jointly controlled entitiesJointly controlled entitiesJointly controlled entitiesJointly controlled entitiesJointly controlled entitiesNEC HCL System Technologies Limited, IndiaAxon Puerto Rico Inc., Puerto Rico- through subsidiary
b) Related parties with whom transactions have taken place during the year
Subsidiaries
HCL America Inc., United States of AmericaHCL Great Britain Limited, United KingdomHCL (Netherlands) BV, NetherlandsHCL GmbH, GermanyHCL Belgium NV, BelgiumHCL Sweden AB, SwedenHCL Australia Services Pty. Limited, AustraliaHCL (New Zealand) Limited, New ZealandHCL Hong Kong SAR Limited, Hong KongHCL Comnet Systems and Services Limited, IndiaHCL Comnet Limited, IndiaHCL Bermuda Limited, BermudaHCL Technologies (Shanghai) Limited, ShanghaiHCL BPO Services (NI) Limited, Northern IrelandHCL Singapore Pte. Limited, SingaporeHCL (Malaysia) Sdn. Bhd., MalaysiaHCL EAI Services Limited, IndiaHCL Global Processing Services Limited(formerly Intelicent India Limited)HCL Poland Sp.z.o.o., PolandCapital Stream Inc., United States of AmericaHCL Axon (Pty) LimitedAxon Solutions Inc. , United States of AmericaAxon Solutions Limited, UKAxon Solutions Singapore Pte LimitedAxon Solutions Sdn. Bhd., MalaysiaHCL Insurance BPO Services Limited, UKAxon Solutions (Canada) Inc., CanadaHCL Technologies Canada Inc.Axon Group Limited.HCL FranceHCL EAS Limited, UK
Jointly controlled entitiesJointly controlled entitiesJointly controlled entitiesJointly controlled entitiesJointly controlled entities
NEC HCL System Technologies Limited, India
Others (Significant influence)Others (Significant influence)Others (Significant influence)Others (Significant influence)Others (Significant influence)
HCL Corporation LimitedHCL Infosystems LimitedHCL Security LimitedHCL Infinet Limited.HCL Holding Pvt. Limited.HCL Insys Pte Limited., Singapore
c) Key Management Personnel
Shiv Nadar, Chairman and Chief Strategy OfficerVineet Nayar, Chief Executive Officer and Whole-time Director
Schedules forming part of the accounts
(All amounts in crores of ` except share data and unless otherwise stated)Schedule 20: Notes to the accounts (Contd.)
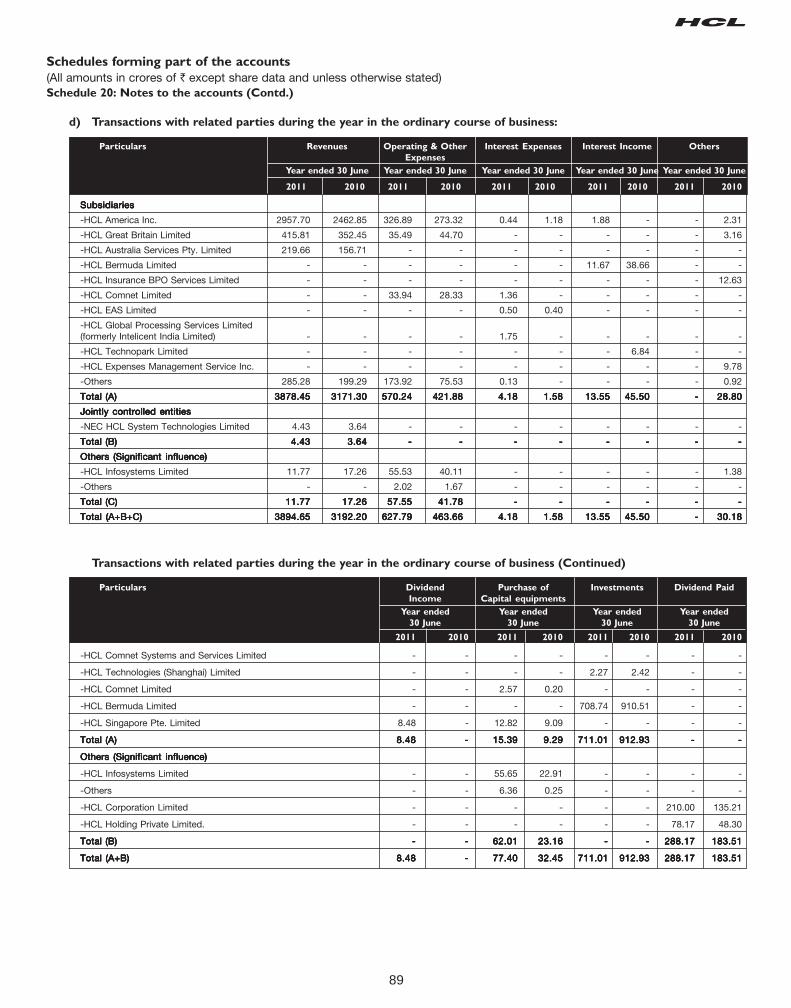
89
Schedules forming part of the accounts
(All amounts in crores of ` except share data and unless otherwise stated)Schedule 20: Notes to the accounts (Contd.)
d) Transactions with related parties during the year in the ordinary course of business:
Particulars Revenues Operating & Other Interest Expenses Interest Income Others
Expenses
Year ended 30 June Year ended 30 June Year ended 30 June Year ended 30 June Year ended 30 June
2011 2010 2011 2010 2011 2010 2011 2010 2011 2010
SSSSSubsidiariesubsidiariesubsidiariesubsidiariesubsidiaries
-HCL America Inc. 2957.70 2462.85 326.89 273.32 0.44 1.18 1.88 - - 2.31
-HCL Great Britain Limited 415.81 352.45 35.49 44.70 - - - - - 3.16
-HCL Australia Services Pty. Limited 219.66 156.71 - - - - - - - -
-HCL Bermuda Limited - - - - - - 11.67 38.66 - -
-HCL Insurance BPO Services Limited - - - - - - - - - 12.63
-HCL Comnet Limited - - 33.94 28.33 1.36 - - - - -
-HCL EAS Limited - - - - 0.50 0.40 - - - -
-HCL Global Processing Services Limited(formerly Intelicent India Limited) - - - - 1.75 - - - - -
-HCL Technopark Limited - - - - - - - 6.84 - -
-HCL Expenses Management Service Inc. - - - - - - - - - 9.78
-Others 285.28 199.29 173.92 75.53 0.13 - - - - 0.92
Total (A)Total (A)Total (A)Total (A)Total (A) 3878.453878.453878.453878.453878.45 3171.303171.303171.303171.303171.30 570.24570.24570.24570.24570.24 421.88421.88421.88421.88421.88 4.184.184.184.184.18 1.581.581.581.581.58 13.5513.5513.5513.5513.55 45.5045.5045.5045.5045.50 ----- 28.8028.8028.8028.8028.80
Jointly controlled entitiesJointly controlled entitiesJointly controlled entitiesJointly controlled entitiesJointly controlled entities
-NEC HCL System Technologies Limited 4.43 3.64 - - - - - - - -
Total (B)Total (B)Total (B)Total (B)Total (B) 4.434.434.434.434.43 3.643.643.643.643.64 ----- ----- ----- ----- ----- ----- ----- -----
Others (Significant influence)Others (Significant influence)Others (Significant influence)Others (Significant influence)Others (Significant influence)
-HCL Infosystems Limited 11.77 17.26 55.53 40.11 - - - - - 1.38
-Others - - 2.02 1.67 - - - - - -
Total (C)Total (C)Total (C)Total (C)Total (C) 11.7711.7711.7711.7711.77 17.2617.2617.2617.2617.26 57.5557.5557.5557.5557.55 41.7841.7841.7841.7841.78 ----- ----- ----- ----- ----- -----
Total (A+B+C)Total (A+B+C)Total (A+B+C)Total (A+B+C)Total (A+B+C) 3894.653894.653894.653894.653894.65 3192.203192.203192.203192.203192.20 627.79627.79627.79627.79627.79 463.66463.66463.66463.66463.66 4.184.184.184.184.18 1.581.581.581.581.58 13.5513.5513.5513.5513.55 45.5045.5045.5045.5045.50 ----- 30.1830.1830.1830.1830.18
Transactions with related parties during the year in the ordinary course of business (Continued)
Particulars Dividend Purchase of Investments Dividend Paid
Income Capital equipments
Year ended Year ended Year ended Year ended
30 June 30 June 30 June 30 June
2011 2010 2011 2010 2011 2010 2011 2010
-HCL Comnet Systems and Services Limited - - - - - - - -
-HCL Technologies (Shanghai) Limited - - - - 2.27 2.42 - -
-HCL Comnet Limited - - 2.57 0.20 - - - -
-HCL Bermuda Limited - - - - 708.74 910.51 - -
-HCL Singapore Pte. Limited 8.48 - 12.82 9.09 - - - -
Total (A)Total (A)Total (A)Total (A)Total (A) 8.488.488.488.488.48 ----- 15.3915.3915.3915.3915.39 9.299.299.299.299.29 711.01711.01711.01711.01711.01 912.93912.93912.93912.93912.93 ----- -----
Others (Significant influence)Others (Significant influence)Others (Significant influence)Others (Significant influence)Others (Significant influence)
-HCL Infosystems Limited - - 55.65 22.91 - - - -
-Others - - 6.36 0.25 - - - -
-HCL Corporation Limited - - - - - - 210.00 135.21
-HCL Holding Private Limited. - - - - - - 78.17 48.30
Total (B)Total (B)Total (B)Total (B)Total (B) ----- ----- 62.0162.0162.0162.0162.01 23.1623.1623.1623.1623.16 ----- ----- 288.17288.17288.17288.17288.17 183.51183.51183.51183.51183.51
Total (A+B)Total (A+B)Total (A+B)Total (A+B)Total (A+B) 8.488.488.488.488.48 ----- 77.4077.4077.4077.4077.40 32.4532.4532.4532.4532.45 711.01711.01711.01711.01711.01 912.93912.93912.93912.93912.93 288.17288.17288.17288.17288.17 183.51183.51183.51183.51183.51
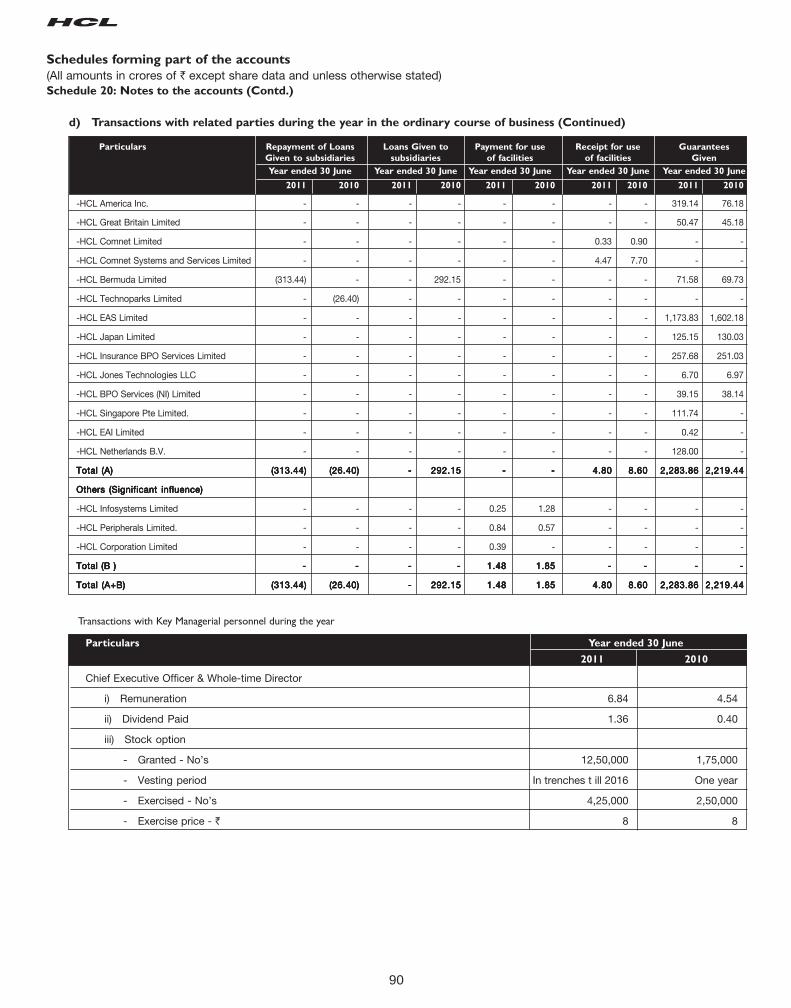
90
Schedules forming part of the accounts
(All amounts in crores of ` except share data and unless otherwise stated)Schedule 20: Notes to the accounts (Contd.)
d) Transactions with related parties during the year in the ordinary course of business (Continued)
Particulars Repayment of Loans Loans Given to Payment for use Receipt for use Guarantees
Given to subsidiaries subsidiaries of facilities of facilities Given
Year ended 30 June Year ended 30 June Year ended 30 June Year ended 30 June Year ended 30 June
2011 2010 2011 2010 2011 2010 2011 2010 2011 2010
-HCL America Inc. - - - - - - - - 319.14 76.18
-HCL Great Britain Limited - - - - - - - - 50.47 45.18
-HCL Comnet Limited - - - - - - 0.33 0.90 - -
-HCL Comnet Systems and Services Limited - - - - - - 4.47 7.70 - -
-HCL Bermuda Limited (313.44) - - 292.15 - - - - 71.58 69.73
-HCL Technoparks Limited - (26.40) - - - - - - - -
-HCL EAS Limited - - - - - - - - 1,173.83 1,602.18
-HCL Japan Limited - - - - - - - - 125.15 130.03
-HCL Insurance BPO Services Limited - - - - - - - - 257.68 251.03
-HCL Jones Technologies LLC - - - - - - - - 6.70 6.97
-HCL BPO Services (NI) Limited - - - - - - - - 39.15 38.14
-HCL Singapore Pte Limited. - - - - - - - - 111.74 -
-HCL EAI Limited - - - - - - - - 0.42 -
-HCL Netherlands B.V. - - - - - - - - 128.00 -
Total (A)Total (A)Total (A)Total (A)Total (A) (313.44)(313.44)(313.44)(313.44)(313.44) (26.40)(26.40)(26.40)(26.40)(26.40) ----- 292.15292.15292.15292.15292.15 ----- ----- 4.804.804.804.804.80 8.608.608.608.608.60 2,283.862,283.862,283.862,283.862,283.86 2,219.442,219.442,219.442,219.442,219.44
Others (Significant influence)Others (Significant influence)Others (Significant influence)Others (Significant influence)Others (Significant influence)
-HCL Infosystems Limited - - - - 0.25 1.28 - - - -
-HCL Peripherals Limited. - - - - 0.84 0.57 - - - -
-HCL Corporation Limited - - - - 0.39 - - - - -
Total (B )Total (B )Total (B )Total (B )Total (B ) ----- ----- ----- ----- 1.481.481.481.481.48 1.851.851.851.851.85 ----- ----- ----- -----
Total (A+B)Total (A+B)Total (A+B)Total (A+B)Total (A+B) (313.44)(313.44)(313.44)(313.44)(313.44) (26.40)(26.40)(26.40)(26.40)(26.40) ----- 292.15292.15292.15292.15292.15 1.481.481.481.481.48 1.851.851.851.851.85 4.804.804.804.804.80 8.608.608.608.608.60 2,283.862,283.862,283.862,283.862,283.86 2,219.442,219.442,219.442,219.442,219.44
Transactions with Key Managerial personnel during the year
Particulars Year ended 30 June
2011 2010
Chief Executive Officer & Whole-time Director
i) Remuneration 6.84 4.54
ii) Dividend Paid 1.36 0.40
iii) Stock option
- Granted - No’s 12,50,000 1,75,000
- Vesting period In trenches t ill 2016 One year
- Exercised - No’s 4,25,000 2,50,000
- Exercise price - ` 8 8
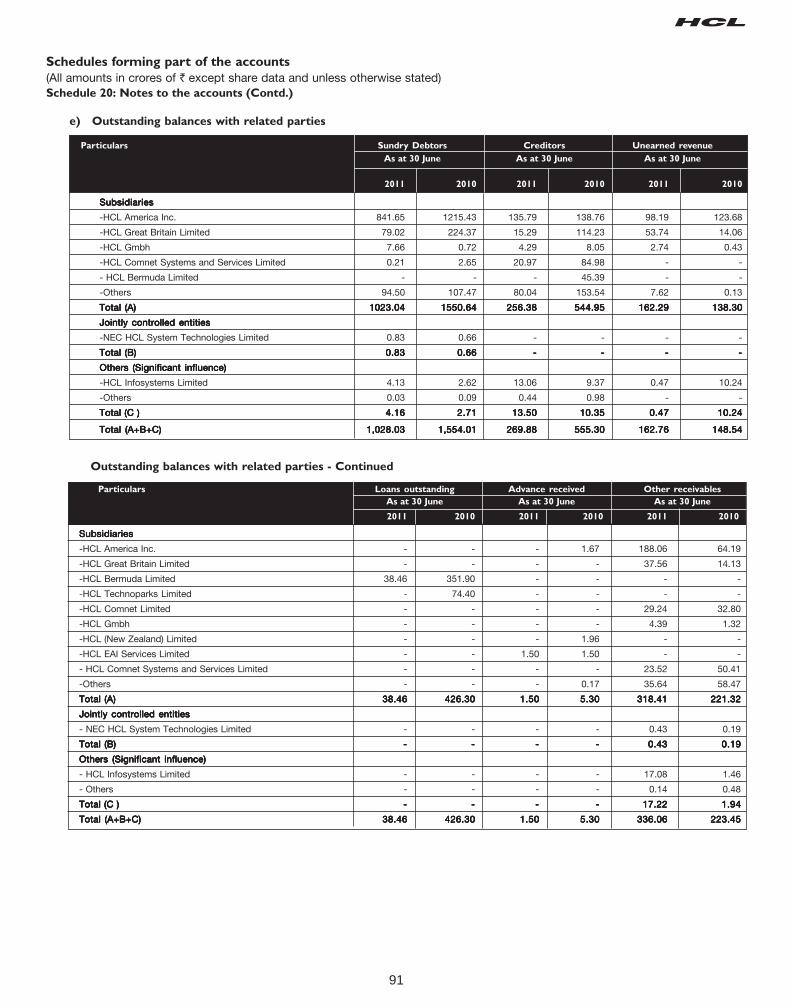
91
Schedules forming part of the accounts
(All amounts in crores of ` except share data and unless otherwise stated)Schedule 20: Notes to the accounts (Contd.)
SubsidiariesSubsidiariesSubsidiariesSubsidiariesSubsidiaries
-HCL America Inc. - - - 1.67 188.06 64.19
-HCL Great Britain Limited - - - - 37.56 14.13
-HCL Bermuda Limited 38.46 351.90 - - - -
-HCL Technoparks Limited - 74.40 - - - -
-HCL Comnet Limited - - - - 29.24 32.80
-HCL Gmbh - - - - 4.39 1.32
-HCL (New Zealand) Limited - - - 1.96 - -
-HCL EAI Services Limited - - 1.50 1.50 - -
- HCL Comnet Systems and Services Limited - - - - 23.52 50.41
-Others - - - 0.17 35.64 58.47
Total (A)Total (A)Total (A)Total (A)Total (A) 38.4638.4638.4638.4638.46 426.30426.30426.30426.30426.30 1.501.501.501.501.50 5.305.305.305.305.30 318.41318.41318.41318.41318.41 221.32221.32221.32221.32221.32
Jointly controlled entitiesJointly controlled entitiesJointly controlled entitiesJointly controlled entitiesJointly controlled entities
- NEC HCL System Technologies Limited - - - - 0.43 0.19
Total (B)Total (B)Total (B)Total (B)Total (B) ----- ----- ----- ----- 0.430.430.430.430.43 0.190.190.190.190.19
Others (Significant influence)Others (Significant influence)Others (Significant influence)Others (Significant influence)Others (Significant influence)
- HCL Infosystems Limited - - - - 17.08 1.46
- Others - - - - 0.14 0.48
Total (C )Total (C )Total (C )Total (C )Total (C ) ----- ----- ----- ----- 17.2217.2217.2217.2217.22 1.941.941.941.941.94
Total (A+B+C)Total (A+B+C)Total (A+B+C)Total (A+B+C)Total (A+B+C) 38.4638.4638.4638.4638.46 426.30426.30426.30426.30426.30 1.501.501.501.501.50 5.305.305.305.305.30 336.06336.06336.06336.06336.06 223.45223.45223.45223.45223.45
Particulars Loans outstanding Advance received Other receivables
As at 30 June As at 30 June As at 30 June
2011 2010 2011 2010 2011 2010
Outstanding balances with related parties - Continued
e) Outstanding balances with related parties
Particulars Sundry Debtors Creditors Unearned revenue
As at 30 June As at 30 June As at 30 June
2011 2010 2011 2010 2011 2010
SubsidiariesSubsidiariesSubsidiariesSubsidiariesSubsidiaries
-HCL America Inc. 841.65 1215.43 135.79 138.76 98.19 123.68
-HCL Great Britain Limited 79.02 224.37 15.29 114.23 53.74 14.06
-HCL Gmbh 7.66 0.72 4.29 8.05 2.74 0.43
-HCL Comnet Systems and Services Limited 0.21 2.65 20.97 84.98 - -
- HCL Bermuda Limited - - - 45.39 - -
-Others 94.50 107.47 80.04 153.54 7.62 0.13
Total (A)Total (A)Total (A)Total (A)Total (A) 1023.041023.041023.041023.041023.04 1550.641550.641550.641550.641550.64 256.38256.38256.38256.38256.38 544.95544.95544.95544.95544.95 162.29162.29162.29162.29162.29 138.30138.30138.30138.30138.30
Jointly controlled entitiesJointly controlled entitiesJointly controlled entitiesJointly controlled entitiesJointly controlled entities
-NEC HCL System Technologies Limited 0.83 0.66 - - - -
Total (B)Total (B)Total (B)Total (B)Total (B) 0.830.830.830.830.83 0.660.660.660.660.66 ----- ----- ----- -----
Others (Significant influence)Others (Significant influence)Others (Significant influence)Others (Significant influence)Others (Significant influence)
-HCL Infosystems Limited 4.13 2.62 13.06 9.37 0.47 10.24
-Others 0.03 0.09 0.44 0.98 - -
Total (C )Total (C )Total (C )Total (C )Total (C ) 4.164.164.164.164.16 2.712.712.712.712.71 13.5013.5013.5013.5013.50 10.3510.3510.3510.3510.35 0.470.470.470.470.47 10.2410.2410.2410.2410.24
Total (A+B+C)Total (A+B+C)Total (A+B+C)Total (A+B+C)Total (A+B+C) 1,028.031,028.031,028.031,028.031,028.03 1,554.011,554.011,554.011,554.011,554.01 269.88269.88269.88269.88269.88 555.30555.30555.30555.30555.30 162.76162.76162.76162.76162.76 148.54148.54148.54148.54148.54
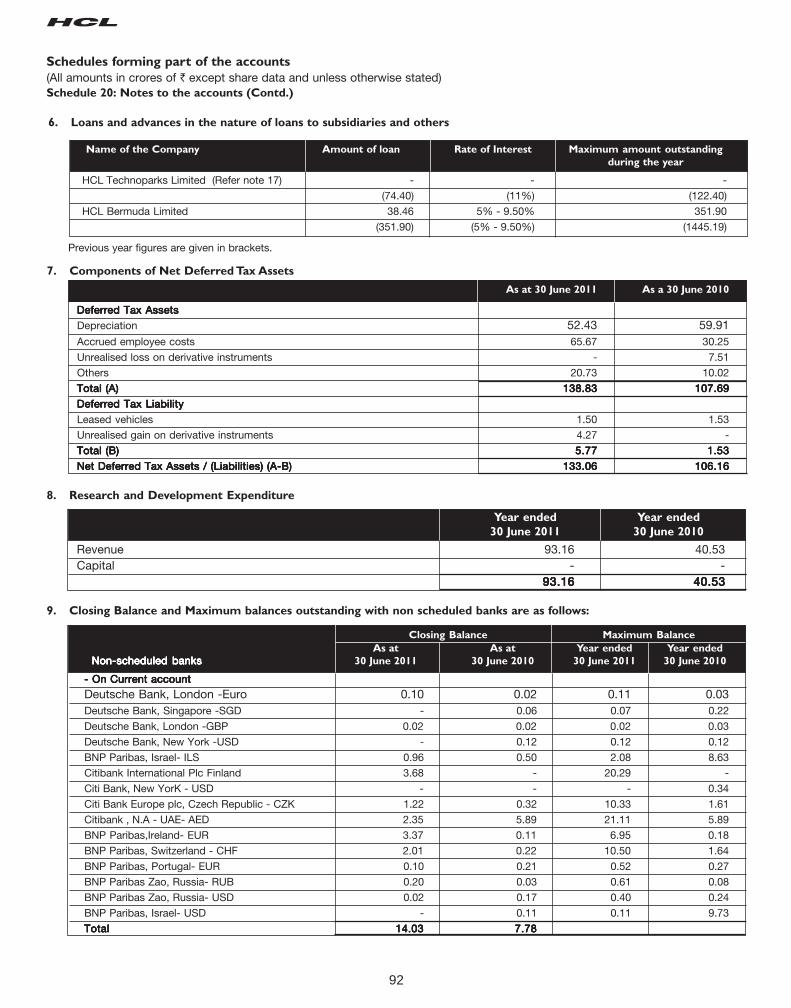
92
Schedules forming part of the accounts
(All amounts in crores of ` except share data and unless otherwise stated)Schedule 20: Notes to the accounts (Contd.)
8. Research and Development Expenditure
Year ended Year ended
30 June 2011 30 June 2010
Revenue 93.16 40.53Capital - -
93.1693.1693.1693.1693.16 40.5340.5340.5340.5340.53
9. Closing Balance and Maximum balances outstanding with non scheduled banks are as follows:
Closing Balance Maximum Balance
As at As at Year ended Year ended
Non-scheduled banksNon-scheduled banksNon-scheduled banksNon-scheduled banksNon-scheduled banks 30 June 2011 30 June 2010 30 June 2011 30 June 2010
- On Current account- On Current account- On Current account- On Current account- On Current account
Deutsche Bank, London -Euro 0.10 0.02 0.11 0.03Deutsche Bank, Singapore -SGD - 0.06 0.07 0.22
Deutsche Bank, London -GBP 0.02 0.02 0.02 0.03
Deutsche Bank, New York -USD - 0.12 0.12 0.12
BNP Paribas, Israel- ILS 0.96 0.50 2.08 8.63
Citibank International Plc Finland 3.68 - 20.29 -
Citi Bank, New YorK - USD - - - 0.34
Citi Bank Europe plc, Czech Republic - CZK 1.22 0.32 10.33 1.61
Citibank , N.A - UAE- AED 2.35 5.89 21.11 5.89
BNP Paribas,Ireland- EUR 3.37 0.11 6.95 0.18
BNP Paribas, Switzerland - CHF 2.01 0.22 10.50 1.64
BNP Paribas, Portugal- EUR 0.10 0.21 0.52 0.27
BNP Paribas Zao, Russia- RUB 0.20 0.03 0.61 0.08
BNP Paribas Zao, Russia- USD 0.02 0.17 0.40 0.24
BNP Paribas, Israel- USD - 0.11 0.11 9.73
TotalTotalTotalTotalTotal 14.0314.0314.0314.0314.03 7.787.787.787.787.78
7. Components of Net Deferred Tax Assets
As at 30 June 2011 As a 30 June 2010
Deferred Tax AssetsDeferred Tax AssetsDeferred Tax AssetsDeferred Tax AssetsDeferred Tax Assets
Depreciation 52.43 59.91Accrued employee costs 65.67 30.25
Unrealised loss on derivative instruments - 7.51
Others 20.73 10.02
Total (A)Total (A)Total (A)Total (A)Total (A) 138.83138.83138.83138.83138.83 107.69107.69107.69107.69107.69
Deferred Tax LiabilityDeferred Tax LiabilityDeferred Tax LiabilityDeferred Tax LiabilityDeferred Tax Liability
Leased vehicles 1.50 1.53
Unrealised gain on derivative instruments 4.27 -
Total (B)Total (B)Total (B)Total (B)Total (B) 5.775.775.775.775.77 1.531.531.531.531.53
Net Deferred Tax Assets / (Liabilities) (A-B)Net Deferred Tax Assets / (Liabilities) (A-B)Net Deferred Tax Assets / (Liabilities) (A-B)Net Deferred Tax Assets / (Liabilities) (A-B)Net Deferred Tax Assets / (Liabilities) (A-B) 133.06133.06133.06133.06133.06 106.16106.16106.16106.16106.16
6. Loans and advances in the nature of loans to subsidiaries and others
Name of the Company Amount of loan Rate of Interest Maximum amount outstanding
during the year
HCL Technoparks Limited (Refer note 17) - - -
(74.40) (11%) (122.40)
HCL Bermuda Limited 38.46 5% - 9.50% 351.90
(351.90) (5% - 9.50%) (1445.19)
Previous year figures are given in brackets.
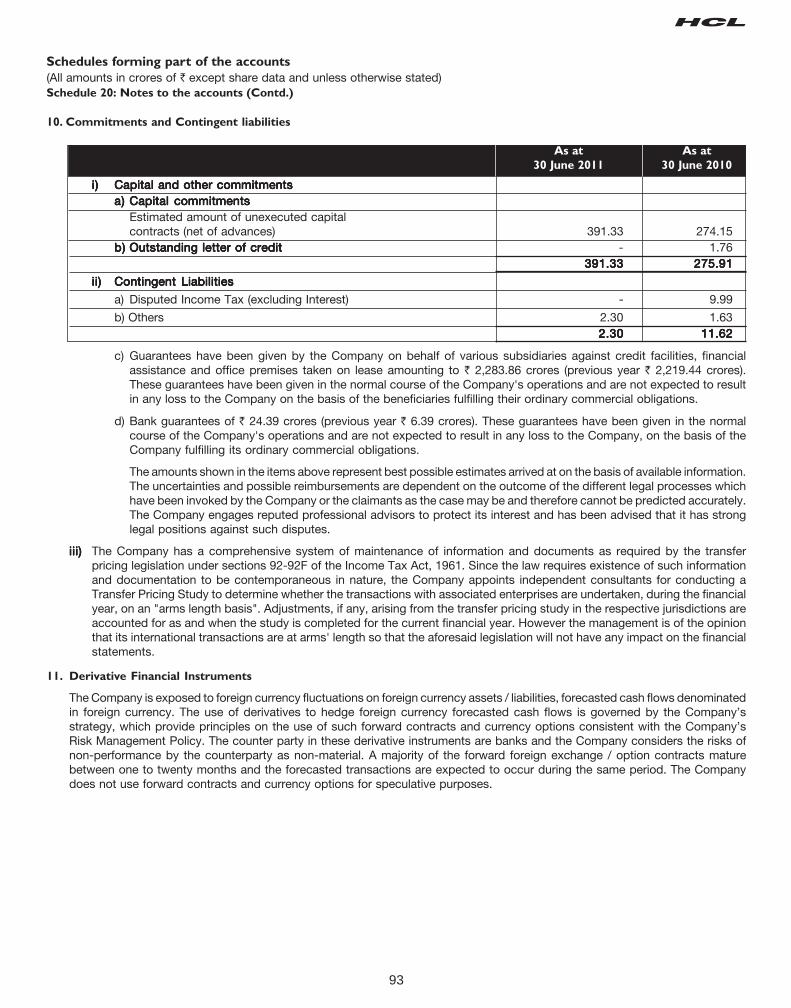
93
Sell Covers
Schedules forming part of the accounts
(All amounts in crores of ` except share data and unless otherwise stated)Schedule 20: Notes to the accounts (Contd.)
10. Commitments and Contingent liabilities
As at As at
30 June 2011 30 June 2010
i)i)i)i)i) Capital and other commitmentsCapital and other commitmentsCapital and other commitmentsCapital and other commitmentsCapital and other commitmentsa)a)a)a)a) Capital commitmentsCapital commitmentsCapital commitmentsCapital commitmentsCapital commitments
Estimated amount of unexecuted capitalcontracts (net of advances) 391.33 274.15
b)b)b)b)b) Outstanding letter of creditOutstanding letter of creditOutstanding letter of creditOutstanding letter of creditOutstanding letter of credit - 1.76391.33391.33391.33391.33391.33 275.91275.91275.91275.91275.91
ii)ii)ii)ii)ii) Contingent LiabilitiesContingent LiabilitiesContingent LiabilitiesContingent LiabilitiesContingent Liabilities
a) Disputed Income Tax (excluding Interest) - 9.99
b) Others 2.30 1.632.302.302.302.302.30 11.6211.6211.6211.6211.62
c) Guarantees have been given by the Company on behalf of various subsidiaries against credit facilities, financialassistance and office premises taken on lease amounting to ` 2,283.86 crores (previous year ` 2,219.44 crores).These guarantees have been given in the normal course of the Company's operations and are not expected to resultin any loss to the Company on the basis of the beneficiaries fulfilling their ordinary commercial obligations.
d) Bank guarantees of ` 24.39 crores (previous year ` 6.39 crores). These guarantees have been given in the normalcourse of the Company's operations and are not expected to result in any loss to the Company, on the basis of theCompany fulfilling its ordinary commercial obligations.
The amounts shown in the items above represent best possible estimates arrived at on the basis of available information.The uncertainties and possible reimbursements are dependent on the outcome of the different legal processes whichhave been invoked by the Company or the claimants as the case may be and therefore cannot be predicted accurately.The Company engages reputed professional advisors to protect its interest and has been advised that it has stronglegal positions against such disputes.
iii)iii)iii)iii)iii) The Company has a comprehensive system of maintenance of information and documents as required by the transferpricing legislation under sections 92-92F of the Income Tax Act, 1961. Since the law requires existence of such informationand documentation to be contemporaneous in nature, the Company appoints independent consultants for conducting aTransfer Pricing Study to determine whether the transactions with associated enterprises are undertaken, during the financialyear, on an "arms length basis". Adjustments, if any, arising from the transfer pricing study in the respective jurisdictions areaccounted for as and when the study is completed for the current financial year. However the management is of the opinionthat its international transactions are at arms' length so that the aforesaid legislation will not have any impact on the financialstatements.
11. Derivative Financial Instruments
The Company is exposed to foreign currency fluctuations on foreign currency assets / liabilities, forecasted cash flows denominatedin foreign currency. The use of derivatives to hedge foreign currency forecasted cash flows is governed by the Company’sstrategy, which provide principles on the use of such forward contracts and currency options consistent with the Company’sRisk Management Policy. The counter party in these derivative instruments are banks and the Company considers the risks ofnon-performance by the counterparty as non-material. A majority of the forward foreign exchange / option contracts maturebetween one to twenty months and the forecasted transactions are expected to occur during the same period. The Companydoes not use forward contracts and currency options for speculative purposes.
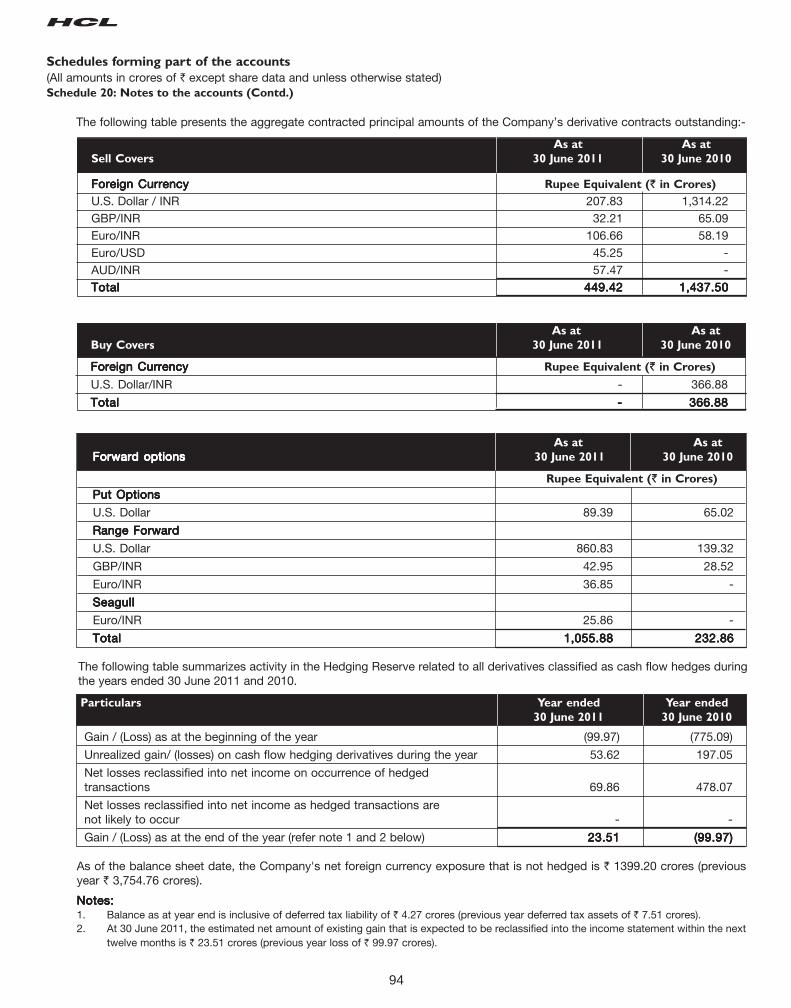
94
Schedules forming part of the accounts
(All amounts in crores of ` except share data and unless otherwise stated)Schedule 20: Notes to the accounts (Contd.)
The following table summarizes activity in the Hedging Reserve related to all derivatives classified as cash flow hedges duringthe years ended 30 June 2011 and 2010.
As at As at
Forward optionsForward optionsForward optionsForward optionsForward options 30 June 2011 30 June 2010
Rupee Equivalent (` in Crores)
Put OptionsPut OptionsPut OptionsPut OptionsPut Options
U.S. Dollar 89.39 65.02
Range ForwardRange ForwardRange ForwardRange ForwardRange Forward
U.S. Dollar 860.83 139.32
GBP/INR 42.95 28.52
Euro/INR 36.85 -
SeagullSeagullSeagullSeagullSeagull
Euro/INR 25.86 -
TotalTotalTotalTotalTotal 1,055.881,055.881,055.881,055.881,055.88 232.86232.86232.86232.86232.86
Particulars Year ended Year ended
30 June 2011 30 June 2010
Gain / (Loss) as at the beginning of the year (99.97) (775.09)
Unrealized gain/ (losses) on cash flow hedging derivatives during the year 53.62 197.05
Net losses reclassified into net income on occurrence of hedgedtransactions 69.86 478.07
Net losses reclassified into net income as hedged transactions arenot likely to occur - -
Gain / (Loss) as at the end of the year (refer note 1 and 2 below) 23.5123.5123.5123.5123.51 (99.97)(99.97)(99.97)(99.97)(99.97)
As of the balance sheet date, the Company's net foreign currency exposure that is not hedged is ` 1399.20 crores (previousyear ` 3,754.76 crores).
Notes:Notes:Notes:Notes:Notes:1. Balance as at year end is inclusive of deferred tax liability of ` 4.27 crores (previous year deferred tax assets of ` 7.51 crores).2. At 30 June 2011, the estimated net amount of existing gain that is expected to be reclassified into the income statement within the next
twelve months is ` 23.51 crores (previous year loss of ` 99.97 crores).
As at As at
Buy Covers 30 June 2011 30 June 2010
Foreign CurrencyForeign CurrencyForeign CurrencyForeign CurrencyForeign Currency Rupee Equivalent (` in Crores)
U.S. Dollar/INR - 366.88
TotalTotalTotalTotalTotal ----- 366.88366.88366.88366.88366.88
The following table presents the aggregate contracted principal amounts of the Company’s derivative contracts outstanding:-
As at As at
Sell Covers 30 June 2011 30 June 2010
Foreign CurrencyForeign CurrencyForeign CurrencyForeign CurrencyForeign Currency Rupee Equivalent (` in Crores)
U.S. Dollar / INR 207.83 1,314.22GBP/INR 32.21 65.09Euro/INR 106.66 58.19Euro/USD 45.25 -AUD/INR 57.47 -TotalTotalTotalTotalTotal 449.42449.42449.42449.42449.42 1,437.501,437.501,437.501,437.501,437.50
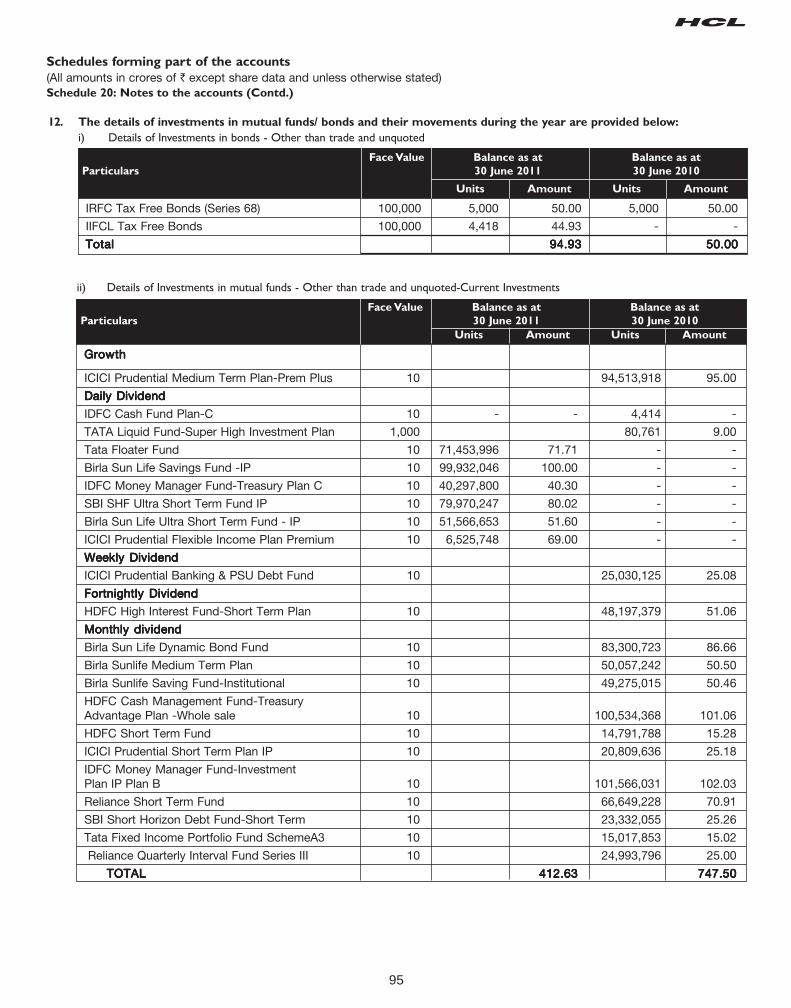
95
Schedules forming part of the accounts
(All amounts in crores of ` except share data and unless otherwise stated)Schedule 20: Notes to the accounts (Contd.)
ii) Details of Investments in mutual funds - Other than trade and unquoted-Current Investments
Face Value Balance as at Balance as at
Particulars 30 June 2011 30 June 2010
Units Amount Units Amount
GrowthGrowthGrowthGrowthGrowth
ICICI Prudential Medium Term Plan-Prem Plus 10 94,513,918 95.00
Daily DividendDaily DividendDaily DividendDaily DividendDaily Dividend
IDFC Cash Fund Plan-C 10 - - 4,414 -
TATA Liquid Fund-Super High Investment Plan 1,000 80,761 9.00
Tata Floater Fund 10 71,453,996 71.71 - -
Birla Sun Life Savings Fund -IP 10 99,932,046 100.00 - -
IDFC Money Manager Fund-Treasury Plan C 10 40,297,800 40.30 - -
SBI SHF Ultra Short Term Fund IP 10 79,970,247 80.02 - -
Birla Sun Life Ultra Short Term Fund - IP 10 51,566,653 51.60 - -
ICICI Prudential Flexible Income Plan Premium 10 6,525,748 69.00 - -
Weekly DividendWeekly DividendWeekly DividendWeekly DividendWeekly Dividend
ICICI Prudential Banking & PSU Debt Fund 10 25,030,125 25.08
Fortnightly DividendFortnightly DividendFortnightly DividendFortnightly DividendFortnightly Dividend
HDFC High Interest Fund-Short Term Plan 10 48,197,379 51.06
Monthly dividendMonthly dividendMonthly dividendMonthly dividendMonthly dividend
Birla Sun Life Dynamic Bond Fund 10 83,300,723 86.66
Birla Sunlife Medium Term Plan 10 50,057,242 50.50
Birla Sunlife Saving Fund-Institutional 10 49,275,015 50.46
HDFC Cash Management Fund-TreasuryAdvantage Plan -Whole sale 10 100,534,368 101.06
HDFC Short Term Fund 10 14,791,788 15.28
ICICI Prudential Short Term Plan IP 10 20,809,636 25.18
IDFC Money Manager Fund-InvestmentPlan IP Plan B 10 101,566,031 102.03
Reliance Short Term Fund 10 66,649,228 70.91
SBI Short Horizon Debt Fund-Short Term 10 23,332,055 25.26
Tata Fixed Income Portfolio Fund SchemeA3 10 15,017,853 15.02
Reliance Quarterly Interval Fund Series III 10 24,993,796 25.00
TOTALTOTALTOTALTOTALTOTAL 412.63412.63412.63412.63412.63 747.50747.50747.50747.50747.50
i) Details of Investments in bonds - Other than trade and unquoted
Face Value Balance as at Balance as at
Particulars 30 June 2011 30 June 2010
Units Amount Units Amount
IRFC Tax Free Bonds (Series 68) 100,000 5,000 50.00 5,000 50.00
IIFCL Tax Free Bonds 100,000 4,418 44.93 - -
TotalTotalTotalTotalTotal 94.9394.9394.9394.9394.93 50.0050.0050.0050.0050.00
12. The details of investments in mutual funds/ bonds and their movements during the year are provided below:
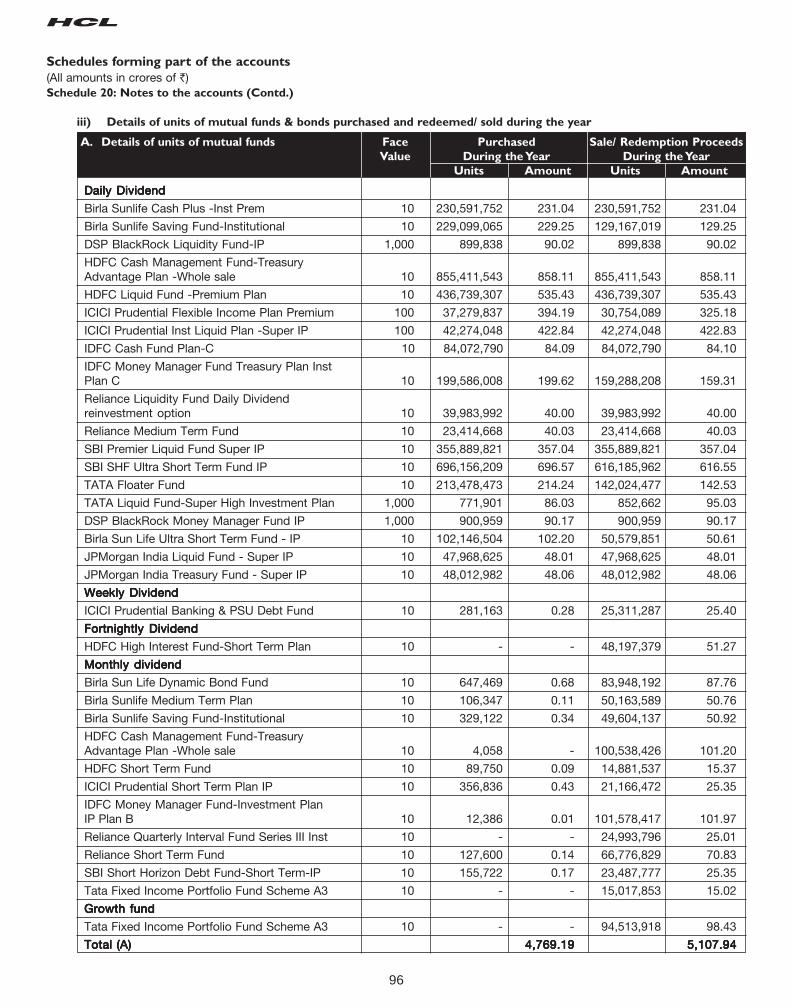
96
Schedules forming part of the accounts
(All amounts in crores of `)Schedule 20: Notes to the accounts (Contd.)
iii) Details of units of mutual funds & bonds purchased and redeemed/ sold during the year
A. Details of units of mutual funds Face Purchased Sale/ Redemption Proceeds
Value During the Year During the Year
Units Amount Units Amount
Daily DividendDaily DividendDaily DividendDaily DividendDaily Dividend
Birla Sunlife Cash Plus -Inst Prem 10 230,591,752 231.04 230,591,752 231.04
Birla Sunlife Saving Fund-Institutional 10 229,099,065 229.25 129,167,019 129.25
DSP BlackRock Liquidity Fund-IP 1,000 899,838 90.02 899,838 90.02
HDFC Cash Management Fund-TreasuryAdvantage Plan -Whole sale 10 855,411,543 858.11 855,411,543 858.11
HDFC Liquid Fund -Premium Plan 10 436,739,307 535.43 436,739,307 535.43
ICICI Prudential Flexible Income Plan Premium 100 37,279,837 394.19 30,754,089 325.18
ICICI Prudential Inst Liquid Plan -Super IP 100 42,274,048 422.84 42,274,048 422.83
IDFC Cash Fund Plan-C 10 84,072,790 84.09 84,072,790 84.10
IDFC Money Manager Fund Treasury Plan InstPlan C 10 199,586,008 199.62 159,288,208 159.31
Reliance Liquidity Fund Daily Dividendreinvestment option 10 39,983,992 40.00 39,983,992 40.00
Reliance Medium Term Fund 10 23,414,668 40.03 23,414,668 40.03
SBI Premier Liquid Fund Super IP 10 355,889,821 357.04 355,889,821 357.04
SBI SHF Ultra Short Term Fund IP 10 696,156,209 696.57 616,185,962 616.55
TATA Floater Fund 10 213,478,473 214.24 142,024,477 142.53
TATA Liquid Fund-Super High Investment Plan 1,000 771,901 86.03 852,662 95.03
DSP BlackRock Money Manager Fund IP 1,000 900,959 90.17 900,959 90.17
Birla Sun Life Ultra Short Term Fund - IP 10 102,146,504 102.20 50,579,851 50.61
JPMorgan India Liquid Fund - Super IP 10 47,968,625 48.01 47,968,625 48.01
JPMorgan India Treasury Fund - Super IP 10 48,012,982 48.06 48,012,982 48.06
Weekly DividendWeekly DividendWeekly DividendWeekly DividendWeekly Dividend
ICICI Prudential Banking & PSU Debt Fund 10 281,163 0.28 25,311,287 25.40
Fortnightly DividendFortnightly DividendFortnightly DividendFortnightly DividendFortnightly Dividend
HDFC High Interest Fund-Short Term Plan 10 - - 48,197,379 51.27
Monthly dividendMonthly dividendMonthly dividendMonthly dividendMonthly dividend
Birla Sun Life Dynamic Bond Fund 10 647,469 0.68 83,948,192 87.76
Birla Sunlife Medium Term Plan 10 106,347 0.11 50,163,589 50.76
Birla Sunlife Saving Fund-Institutional 10 329,122 0.34 49,604,137 50.92
HDFC Cash Management Fund-TreasuryAdvantage Plan -Whole sale 10 4,058 - 100,538,426 101.20
HDFC Short Term Fund 10 89,750 0.09 14,881,537 15.37
ICICI Prudential Short Term Plan IP 10 356,836 0.43 21,166,472 25.35
IDFC Money Manager Fund-Investment PlanIP Plan B 10 12,386 0.01 101,578,417 101.97
Reliance Quarterly Interval Fund Series III Inst 10 - - 24,993,796 25.01
Reliance Short Term Fund 10 127,600 0.14 66,776,829 70.83
SBI Short Horizon Debt Fund-Short Term-IP 10 155,722 0.17 23,487,777 25.35
Tata Fixed Income Portfolio Fund Scheme A3 10 - - 15,017,853 15.02
Growth fundGrowth fundGrowth fundGrowth fundGrowth fund
Tata Fixed Income Portfolio Fund Scheme A3 10 - - 94,513,918 98.43
Total (A)Total (A)Total (A)Total (A)Total (A) 4,769.194,769.194,769.194,769.194,769.19 5,107.945,107.945,107.945,107.945,107.94
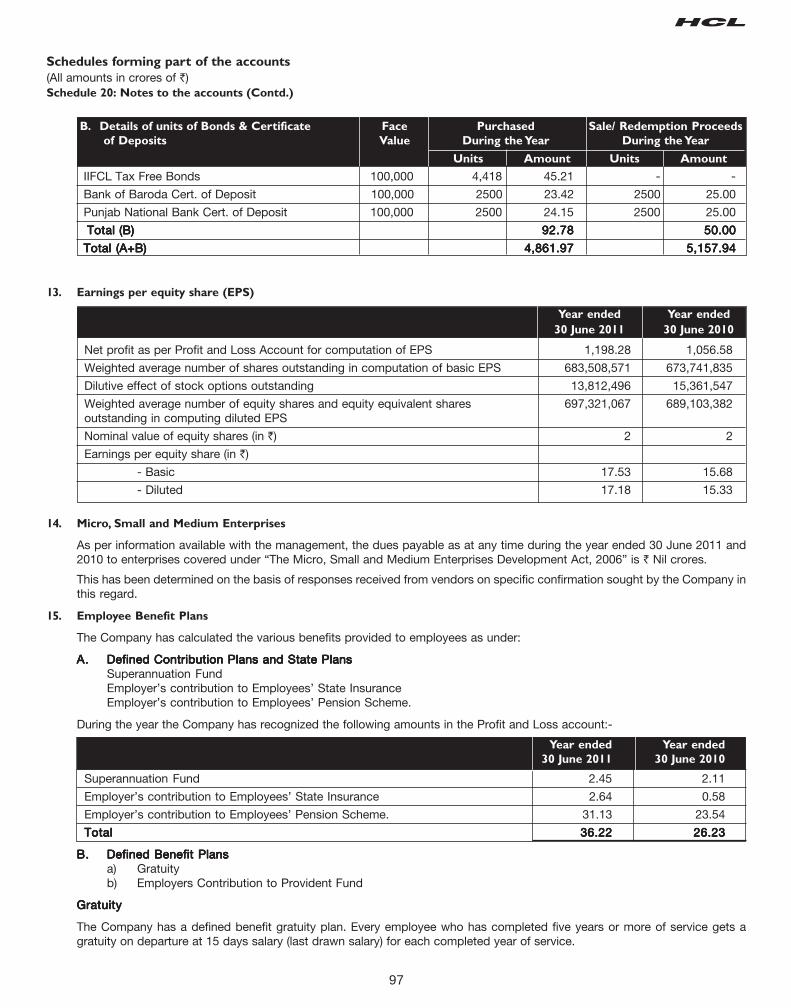
97
Schedules forming part of the accounts
(All amounts in crores of `)Schedule 20: Notes to the accounts (Contd.)
IIFCL Tax Free Bonds 100,000 4,418 45.21 - -
Bank of Baroda Cert. of Deposit 100,000 2500 23.42 2500 25.00
Punjab National Bank Cert. of Deposit 100,000 2500 24.15 2500 25.00
Total (B)Total (B)Total (B)Total (B)Total (B) 92.7892.7892.7892.7892.78 50.0050.0050.0050.0050.00
Total (A+B)Total (A+B)Total (A+B)Total (A+B)Total (A+B) 4,861.974,861.974,861.974,861.974,861.97 5,157.945,157.945,157.945,157.945,157.94
B. Details of units of Bonds & Certificate Face Purchased Sale/ Redemption Proceeds
of Deposits Value During the Year During the Year
Units Amount Units Amount
13. Earnings per equity share (EPS)
Year ended Year ended
30 June 2011 30 June 2010
Net profit as per Profit and Loss Account for computation of EPS 1,198.28 1,056.58
Weighted average number of shares outstanding in computation of basic EPS 683,508,571 673,741,835
Dilutive effect of stock options outstanding 13,812,496 15,361,547
Weighted average number of equity shares and equity equivalent shares 697,321,067 689,103,382outstanding in computing diluted EPS
Nominal value of equity shares (in `) 2 2
Earnings per equity share (in `)
- Basic 17.53 15.68
- Diluted 17.18 15.33
14. Micro, Small and Medium Enterprises
As per information available with the management, the dues payable as at any time during the year ended 30 June 2011 and2010 to enterprises covered under “The Micro, Small and Medium Enterprises Development Act, 2006” is ` Nil crores.
This has been determined on the basis of responses received from vendors on specific confirmation sought by the Company inthis regard.
15. Employee Benefit Plans
The Company has calculated the various benefits provided to employees as under:
A.A.A.A.A. Defined Contribution Plans and State PlansDefined Contribution Plans and State PlansDefined Contribution Plans and State PlansDefined Contribution Plans and State PlansDefined Contribution Plans and State PlansSuperannuation FundEmployer’s contribution to Employees’ State InsuranceEmployer’s contribution to Employees’ Pension Scheme.
During the year the Company has recognized the following amounts in the Profit and Loss account:-
Year ended Year ended
30 June 2011 30 June 2010
Superannuation Fund 2.45 2.11
Employer’s contribution to Employees’ State Insurance 2.64 0.58
Employer’s contribution to Employees’ Pension Scheme. 31.13 23.54
TotalTotalTotalTotalTotal 36.2236.2236.2236.2236.22 26.2326.2326.2326.2326.23
B.B.B.B.B. Defined Benefit PlansDefined Benefit PlansDefined Benefit PlansDefined Benefit PlansDefined Benefit Plansa) Gratuityb) Employers Contribution to Provident Fund
GratuityGratuityGratuityGratuityGratuity
The Company has a defined benefit gratuity plan. Every employee who has completed five years or more of service gets agratuity on departure at 15 days salary (last drawn salary) for each completed year of service.
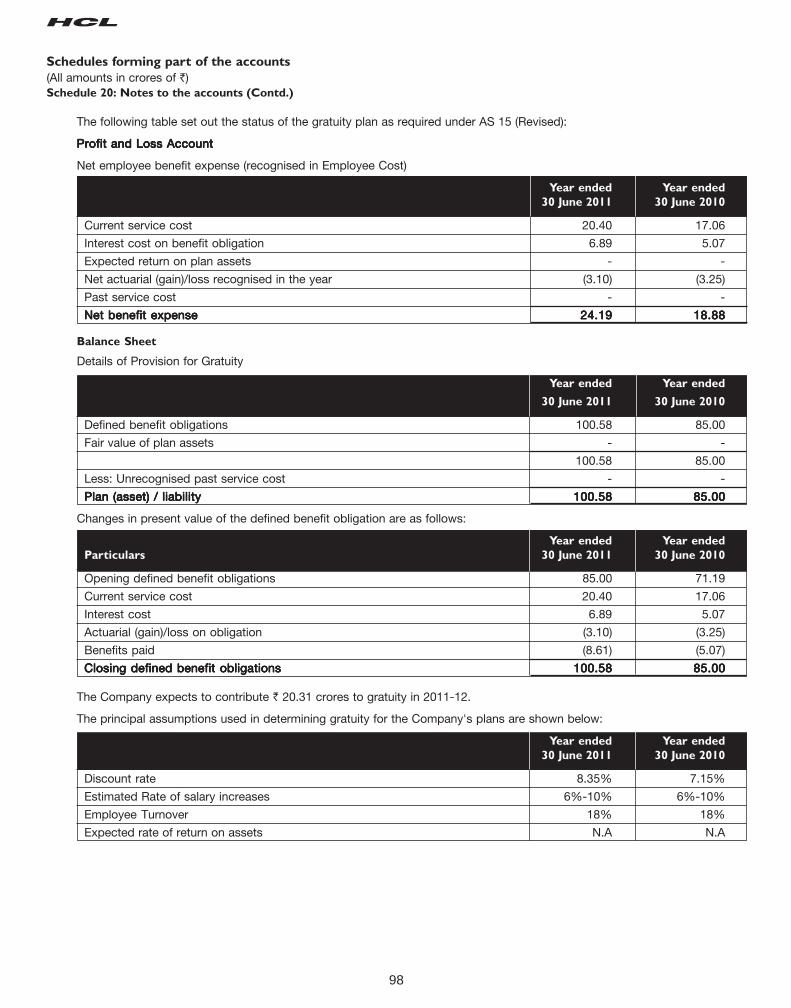
98
Schedules forming part of the accounts
(All amounts in crores of `)Schedule 20: Notes to the accounts (Contd.)
The following table set out the status of the gratuity plan as required under AS 15 (Revised):
Profit and Loss AccountProfit and Loss AccountProfit and Loss AccountProfit and Loss AccountProfit and Loss Account
Net employee benefit expense (recognised in Employee Cost)
Year ended Year ended
30 June 2011 30 June 2010
Current service cost 20.40 17.06
Interest cost on benefit obligation 6.89 5.07
Expected return on plan assets - -
Net actuarial (gain)/loss recognised in the year (3.10) (3.25)
Past service cost - -
Net benefit expenseNet benefit expenseNet benefit expenseNet benefit expenseNet benefit expense 24.1924.1924.1924.1924.19 18.8818.8818.8818.8818.88
Balance Sheet
Details of Provision for Gratuity
Year ended Year ended
30 June 2011 30 June 2010
Defined benefit obligations 100.58 85.00
Fair value of plan assets - -
100.58 85.00
Less: Unrecognised past service cost - -
Plan (asset) / liabilityPlan (asset) / liabilityPlan (asset) / liabilityPlan (asset) / liabilityPlan (asset) / liability 100.58100.58100.58100.58100.58 85.0085.0085.0085.0085.00
Changes in present value of the defined benefit obligation are as follows:
Year ended Year ended
Particulars 30 June 2011 30 June 2010
Opening defined benefit obligations 85.00 71.19
Current service cost 20.40 17.06
Interest cost 6.89 5.07
Actuarial (gain)/loss on obligation (3.10) (3.25)
Benefits paid (8.61) (5.07)
Closing defined benefit obligationsClosing defined benefit obligationsClosing defined benefit obligationsClosing defined benefit obligationsClosing defined benefit obligations 100.58100.58100.58100.58100.58 85.0085.0085.0085.0085.00
The Company expects to contribute ` 20.31 crores to gratuity in 2011-12.
The principal assumptions used in determining gratuity for the Company's plans are shown below:
Year ended Year ended
30 June 2011 30 June 2010
Discount rate 8.35% 7.15%
Estimated Rate of salary increases 6%-10% 6%-10%
Employee Turnover 18% 18%
Expected rate of return on assets N.A N.A
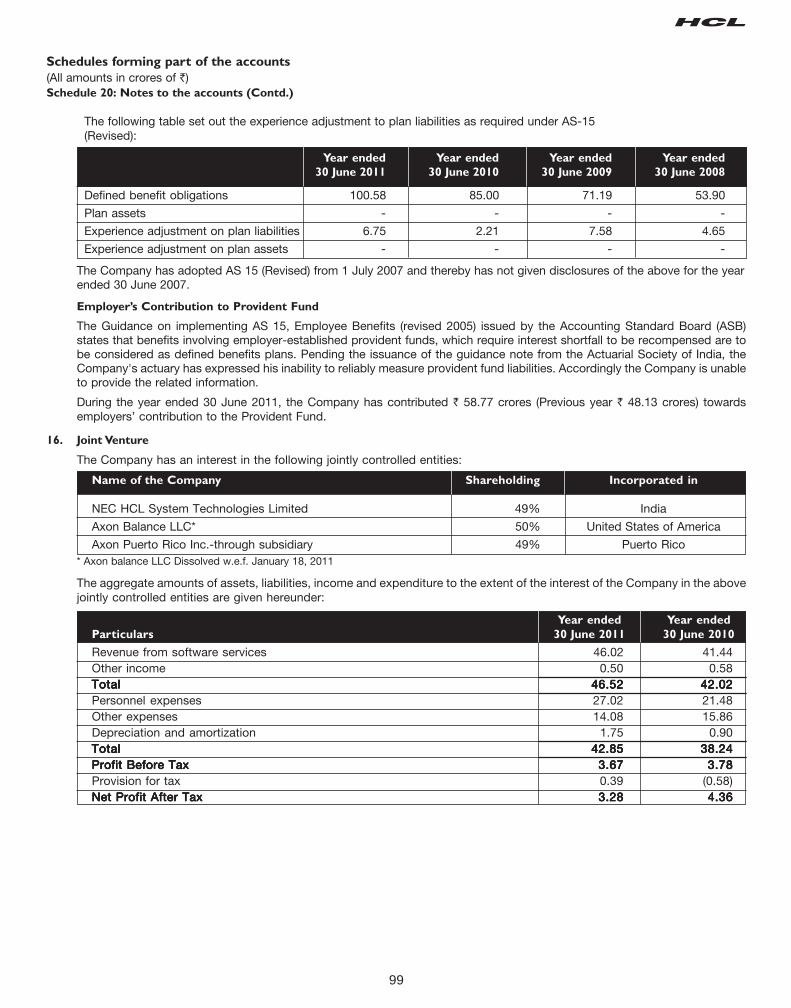
99
Schedules forming part of the accounts
(All amounts in crores of `)Schedule 20: Notes to the accounts (Contd.)
The following table set out the experience adjustment to plan liabilities as required under AS-15(Revised):
Year ended Year ended Year ended Year ended
30 June 2011 30 June 2010 30 June 2009 30 June 2008
Defined benefit obligations 100.58 85.00 71.19 53.90
Plan assets - - - -
Experience adjustment on plan liabilities 6.75 2.21 7.58 4.65
Experience adjustment on plan assets - - - -
The Company has adopted AS 15 (Revised) from 1 July 2007 and thereby has not given disclosures of the above for the yearended 30 June 2007.
Employer’s Contribution to Provident Fund
The Guidance on implementing AS 15, Employee Benefits (revised 2005) issued by the Accounting Standard Board (ASB)states that benefits involving employer-established provident funds, which require interest shortfall to be recompensed are tobe considered as defined benefits plans. Pending the issuance of the guidance note from the Actuarial Society of India, theCompany's actuary has expressed his inability to reliably measure provident fund liabilities. Accordingly the Company is unableto provide the related information.
During the year ended 30 June 2011, the Company has contributed ` 58.77 crores (Previous year ` 48.13 crores) towardsemployers’ contribution to the Provident Fund.
16. Joint Venture
The Company has an interest in the following jointly controlled entities:
Name of the Company Shareholding Incorporated in
NEC HCL System Technologies Limited 49% India
Axon Balance LLC* 50% United States of America
Axon Puerto Rico Inc.-through subsidiary 49% Puerto Rico* Axon balance LLC Dissolved w.e.f. January 18, 2011
The aggregate amounts of assets, liabilities, income and expenditure to the extent of the interest of the Company in the abovejointly controlled entities are given hereunder:
Year ended Year ended
Particulars 30 June 2011 30 June 2010
Revenue from software services 46.02 41.44Other income 0.50 0.58TotalTotalTotalTotalTotal 46.5246.5246.5246.5246.52 42.0242.0242.0242.0242.02Personnel expenses 27.02 21.48Other expenses 14.08 15.86Depreciation and amortization 1.75 0.90TotalTotalTotalTotalTotal 42.8542.8542.8542.8542.85 38.2438.2438.2438.2438.24Profit Before TaxProfit Before TaxProfit Before TaxProfit Before TaxProfit Before Tax 3.673.673.673.673.67 3.783.783.783.783.78Provision for tax 0.39 (0.58)Net Profit After TaxNet Profit After TaxNet Profit After TaxNet Profit After TaxNet Profit After Tax 3.283.283.283.283.28 4.364.364.364.364.36
100
Schedules forming part of the accounts
(All amounts in crores of `)Schedule 20: Notes to the accounts (Contd.)
As at As at
Particulars 30 June 2011 30 June 2010
AssetsAssetsAssetsAssetsAssetsFixed assets 10.86 10.89Investments - -Sundry Debtors 11.56 7.09Cash and Bank Balances 12.64 11.10Other Current Assets 4.38 3.49LiabilitiesLiabilitiesLiabilitiesLiabilitiesLiabilitiesCurrent liabilities and provisions 15.62 15.17
Notes:Notes:Notes:Notes:Notes:a. NEC HCL System Technologies Limited financial statements are for the year ended 31 March, 2011 and 2010 respectively.b. Axon Puerto Rico Inc. financial statements are for the period ended 31 May, 2011 and 2010 respectively.c. There is no material transaction between the reporting dates of the JV and that of Company.
17.17.17.17.17. A scheme of Amalgamation ("Scheme") under sections 391 to 394 of the Companies Act, 1956 for amalgamation without issueof shares of HCL Technopark Limited, a wholly owned subsidiary ("Transferor Company"), held directly, with the Company hasbeen approved by the Hon'ble High Court of Delhi on August 16, 2010 and is effective from April 1, 2009. The TransferorCompany was engaged in the business of a developer of facilities for the IT industry. The amalgamation is expected to channelizesynergies and lead to optimum utilisation of available resources and result in greater economies of scale.
The Company has accounted for the amalgamation under the 'pooling of interest method' being an amalgamation in the natureof merger, as prescribed by the Accounting standard "AS-14", "Accounting for Amalgamations" as per Accounting Standardsnotified by Companies (Accounting Standards) Rules, 2006, (as amended).
In terms of the Scheme, the shortfall represents the aggregate value of the assets reduced by the aggregate value of theliabilities and balance in profit & loss account and reserves of the Transferor Company over the value of inter se loans andinvestments and share capital cancelled pursuant to the amalgamation. This shortfall of ` 9.81 crores has been adjusted fromthe profit & loss account. Details are given below:
Amount
AssetsAssetsAssetsAssetsAssets
Fixed assets (net) (Including capital work in progress ` 94.59 crores ) 111.35
Cash and bank balances 0.22
Other assets 0.21
TotalTotalTotalTotalTotal 111.78111.78111.78111.78111.78
LiabilitiesLiabilitiesLiabilitiesLiabilitiesLiabilities
Current liabilities 20.42
TotalTotalTotalTotalTotal 20.4220.4220.4220.4220.42
Net assets acquired on amalgamationNet assets acquired on amalgamationNet assets acquired on amalgamationNet assets acquired on amalgamationNet assets acquired on amalgamation 91.3691.3691.3691.3691.36
Transfer of balances of amalgamated companyTransfer of balances of amalgamated companyTransfer of balances of amalgamated companyTransfer of balances of amalgamated companyTransfer of balances of amalgamated company
Less:-Less:-Less:-Less:-Less:-
Adjustment for cancellation of Company's investment in Transferor Company 1.00
Adjustment of loan given to Transferor company 100.17
Shortfall arising on amalgamationShortfall arising on amalgamationShortfall arising on amalgamationShortfall arising on amalgamationShortfall arising on amalgamation 9.819.819.819.819.81
Balance transferred to profit & loss account as at July 1, 2010Balance transferred to profit & loss account as at July 1, 2010Balance transferred to profit & loss account as at July 1, 2010Balance transferred to profit & loss account as at July 1, 2010Balance transferred to profit & loss account as at July 1, 2010 9.819.819.819.819.81
101
Schedules forming part of the accounts
(All amounts in crores of `)Schedule 20: Notes to the accounts (Contd.)
18. Additional information pursuant to the provisions of paragraphs 3, 4, 4C and 4D of Part II of Schedule VI to the Companies
Act, 1956
18.1 Particulars of purchases, sales and closing stock of trading goods:
Opening Stock Purchases Sales Closing Stock
ITEMS Qty Value Qty Value Qty Value Qty Value
(Nos.) (`) (Nos.) (`) (Nos.) (`) (Nos.) (`)
Software Licenses (Unlimited Users) - - - 84.16 - 60.69 - 27.77
(-) (32.24) (-) (-) (-) (29.83) (-) (-)
Servers - - 609 15.10 463 14.56 146 4.94
(225) (22.15) (-) (-) (225) (20.50) (-) (-)
Storage devices - - 166 3.41 17 10.75 149 1.49
(107) (20.06) (-) (-) (107) (18.56) (-) (-)
Routers - - 4,045 56.17 943 31.95 3,102 40.87
(-) (-) (-) (-) (-) (-) (-) (-)
Switches - - 1,956 19.04 506 19.33 1,450 9.25
(-) (-) (-) (-) (-) (-) (-) (-)
Others* 24,646 4.49 295,636 96.91 183,666 46.40 136,616 29.65
(51) (12.56) (119,968) (51.06) (95,373) (42.00) (24,646) (4.49)
TotalTotalTotalTotalTotal 24,64624,64624,64624,64624,646 4.494.494.494.494.49 302,412302,412302,412302,412302,412 274.79274.79274.79274.79274.79 185,595185,595185,595185,595185,595 183.68183.68183.68183.68183.68 141,463141,463141,463141,463141,463 113.97113.97113.97113.97113.97
(383) (87.01) (119,968) (51.06) (95,705) (110.89) (24,646) (4.49)
* * * * * Does not include any item which in value individually accounts for 10% or more of the total value of sales/ stockNotes:Notes:Notes:Notes:Notes:1. Previous year figures are given in brackets.2. Quantities have been shown wherever determinable
18.2 Managerial remuneration
a) Computation of Net Profit in accordance with Section 349 of the Companies Act, 1956 and calculation of commissionpayable to non whole-time directors:
Year endedYear endedYear endedYear endedYear ended Year endedYear endedYear endedYear endedYear ended30 June 201130 June 201130 June 201130 June 201130 June 2011 30 June 201030 June 201030 June 201030 June 201030 June 2010
Profit Profit Profit Profit Profit before Tax as per Profit and Loss Accountbefore Tax as per Profit and Loss Accountbefore Tax as per Profit and Loss Accountbefore Tax as per Profit and Loss Accountbefore Tax as per Profit and Loss Account 1,289.881,289.881,289.881,289.881,289.88 1,152.821,152.821,152.821,152.821,152.82
Add:Add:Add:Add:Add:Depreciation as per books of accounts 291.37 274.03Provision for doubtful debts/ advances 8.60 (8.43)
299.97299.97299.97299.97299.97 265.60265.60265.60265.60265.60Less:Less:Less:Less:Less:Depreciation under section 350 of the Companies Act, 1956 291.37 274.03Profit on sale of fixed assets (net) 1.13 2.20Profit on sale of Investments (net) 3.89 4.85
296.39296.39296.39296.39296.39 281.08281.08281.08281.08281.08Profit as per section 349Profit as per section 349Profit as per section 349Profit as per section 349Profit as per section 349 1,293.461,293.461,293.461,293.461,293.46 1,137.341,137.341,137.341,137.341,137.34
Add:Add:Add:Add:Add:Commission to non- executive directors 1.15 1.15Profit as per section 198Profit as per section 198Profit as per section 198Profit as per section 198Profit as per section 198 1,294.611,294.611,294.611,294.611,294.61 1,138.491,138.491,138.491,138.491,138.49
Commission payable to non whole-time directors:Commission payable to non whole-time directors:Commission payable to non whole-time directors:Commission payable to non whole-time directors:Commission payable to non whole-time directors:Maximum commission under Section 309 of the Companies Act, 1956 @ 1% 12.95 11.38Commission approved by the boardCommission approved by the boardCommission approved by the boardCommission approved by the boardCommission approved by the board 1.151.151.151.151.15 1.151.151.151.151.15
102
Schedules forming part of the accounts
(All amounts in crores of `)Schedule 20: Notes to the accounts (Contd.)
b) Managerial remuneration comprises:
Year ended Year ended
30 June 2011 30 June 2010
Salaries and allowances 6.60 4.40
Contribution to provident fund 0.24 0.14
Sitting fees 0.08 0.13
Commission to non-executive directors 1.15 1.15
8.078.078.078.078.07 5.825.825.825.825.82
The above does not include provision for encashable leave and gratuity, which is actuarially determined on anoverall basis.
The wholly owned subsidiaries have made the following payments to a director of the Company:
Year ended Year ended
30 June 2011 30 June 2010
Remuneration paid to Executive director 4.65 4.76
4.654.654.654.654.65 4.764.764.764.764.76
18.4. Auditors’ remuneration *
Year ended Year ended
30 June 2011 30 June 2010
As Auditors
Statutory audit 1.83 1.80
Tax audit fees 0.19 0.26
2.022.022.022.022.02 2.062.062.062.062.06
* excluding service tax
18.5. Expenditure in foreign currency (on accrual basis unless otherwise stated)
Year ended Year ended
30 June 2011 30 June 2010
Software development expenses 260.87 319.77
Interest 4.20 4.64
Travel (on cash basis) 244.48 198.08
Rates and taxes 11.75 4.95
Software License Fee 7.75 4.07
Communication costs 0.03 2.48
Professional fees 13.56 7.21
Personnel Expenses 5.27 74.14
Others 50.22 73.16
598.13598.13598.13598.13598.13 688.50688.50688.50688.50688.50
18.3. CIF value of imports
Year ended Year ended
30 June 2011 30 June 2010
Capital goods 193.06 114.91
193.06193.06193.06193.06193.06 114.91114.91114.91114.91114.91
103
Schedules forming part of the accounts
(All amounts in crores of `)Schedule 20: Notes to the accounts (Contd.)
18.6 Earnings in foreign currency (on accrual basis)
Year ended Year ended
30 June 2011 30 June 2010
Income from Services 5,056.95 4,968.24
5,056.955,056.955,056.955,056.955,056.95 4,968.244,968.244,968.244,968.244,968.24
18.7 Dividend remitted in foreign currency
Year ended Year ended
30 June 2011 30 June 2010
Final dividendFinal dividendFinal dividendFinal dividendFinal dividendNumber of non-resident shareholders 75 81Number of shares held 120,778,581 121,961,684Amount remitted in INR (net of tax) 12.08 12.20Amount remitted FCY $2,723,919 $2,614,286Year to which it relates 2009-10 2008-09
1st Interim dividend1st Interim dividend1st Interim dividend1st Interim dividend1st Interim dividendNumber of non-resident shareholders 75 84Number of shares held 120,778,581 121,998,748Amount remitted in INR (net of tax) 18.12 12.20Amount remitted FCY $4,085,879 $2,623,065Year to which it relates 2010-11 2009-10
2nd Interim dividend2nd Interim dividend2nd Interim dividend2nd Interim dividend2nd Interim dividendNumber of non-resident shareholders 77 79Number of shares held 120,779,711 120,920,184Amount remitted in INR (net of tax) 24.16 12.09Amount remitted FCY $5,297,356 $2,584,317Year to which it relates 2010-11 2009-10
3rd Interim dividend3rd Interim dividend3rd Interim dividend3rd Interim dividend3rd Interim dividendNumber of non-resident shareholders 71 74Number of shares held 120,729,884 120,947,704Amount remitted in INR (net of tax) 24.15 12.09Amount remitted FCY $5,423,625 $2,709,402Year to which it relates 2010-11 2009-10
19. Previous year comparatives
The previous year's figures have been re-classified/re-grouped to conform to current year's classification.
As per our report of even dateFor HCL Technologies Limited
For S. R. Batliboi & Co. Shiv Nadar T S R SubramanianFirm Registration Number: 301003E Chairman and Chief Strategy Officer DirectorChartered Accountants
Vineet Nayar Anil ChananaVice Chairman,CEO & Wholetime Director Chief Financial Officer
per Tridibes Basu Sandip Gupta Prahlad Rai BansalPartner Deputy Chief Financial Officer Corporate Vice President - FinanceMembership Number: 17401
Raj Kumar Walia Manish AnandSenior Vice President - Finance & Accounts Deputy Company Secretary
Gurgaon, India Noida (UP), India27 July, 2011 27 July, 2011
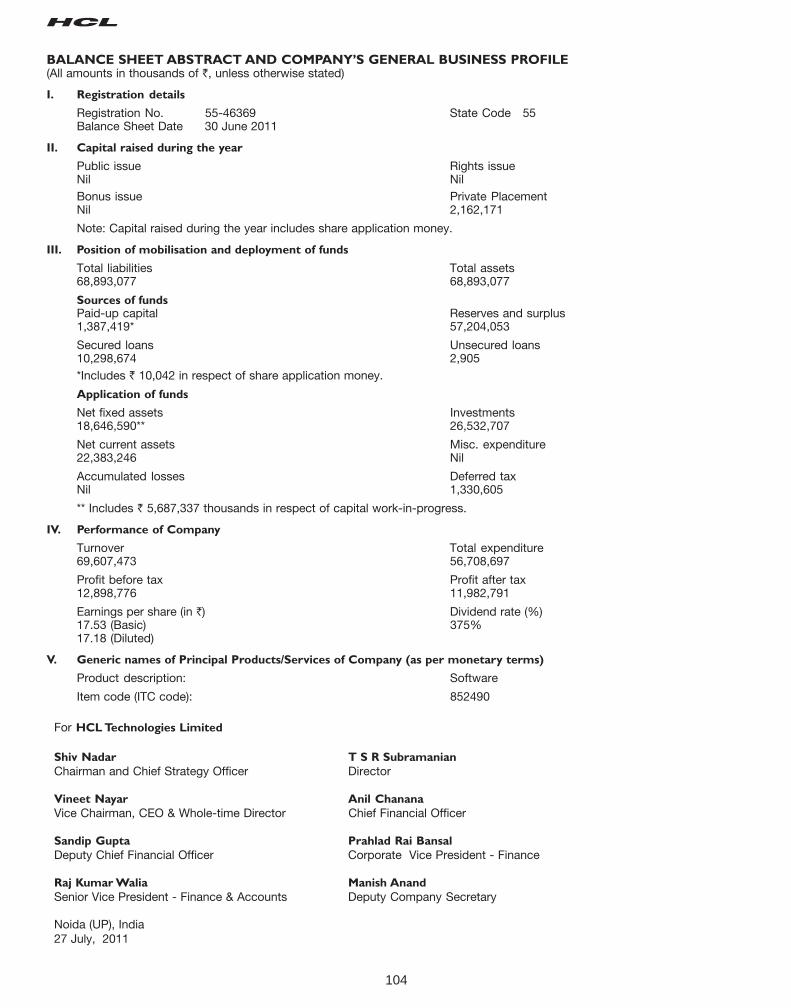
104
BALANCE SHEET ABSTRACT AND COMPANY’S GENERAL BUSINESS PROFILE(All amounts in thousands of `, unless otherwise stated)
I. Registration details
Registration No. 55-46369 State Code 55Balance Sheet Date 30 June 2011
II. Capital raised during the year
Public issue Rights issueNil NilBonus issue Private PlacementNil 2,162,171
Note: Capital raised during the year includes share application money.
III. Position of mobilisation and deployment of funds
Total liabilities Total assets68,893,077 68,893,077
Sources of fundsPaid-up capital Reserves and surplus1,387,419* 57,204,053
Secured loans Unsecured loans10,298,674 2,905*Includes ` 10,042 in respect of share application money.
Application of funds
Net fixed assets Investments18,646,590** 26,532,707
Net current assets Misc. expenditure22,383,246 Nil
Accumulated losses Deferred taxNil 1,330,605
** Includes ` 5,687,337 thousands in respect of capital work-in-progress.
IV. Performance of Company
Turnover Total expenditure69,607,473 56,708,697
Profit before tax Profit after tax12,898,776 11,982,791
Earnings per share (in `) Dividend rate (%)17.53 (Basic) 375%17.18 (Diluted)
V. Generic names of Principal Products/Services of Company (as per monetary terms)
Product description: Software
Item code (ITC code): 852490
For HCL Technologies Limited
Shiv Nadar T S R Subramanian
Chairman and Chief Strategy Officer Director
Vineet Nayar Anil Chanana
Vice Chairman, CEO & Whole-time Director Chief Financial Officer
Sandip Gupta Prahlad Rai Bansal
Deputy Chief Financial Officer Corporate Vice President - Finance
Raj Kumar Walia Manish Anand
Senior Vice President - Finance & Accounts Deputy Company Secretary
Noida (UP), India27 July, 2011

Consolidated Statements

106
107
AUDITORS’ REPORT
The Board of Directors
HCL Technologies Limited
We have audited the attached consolidated balance sheet ofHCL Technologies Limited, its subsidiaries and joint ventures(together refer to as ‘Group’), as at June 30, 2011, and also theconsolidated profit and loss account and the consolidated cashflow statement for the year ended on that date annexed thereto.These financial statements are the responsibility of the Group'smanagement. Our responsibility is to express an opinion on thesefinancial statements based on our audit.
We conducted our audit in accordance with the auditingstandards generally accepted in India. Those Standards requirethat we plan and perform the audit to obtain reasonableassurance about whether the financial statements are free ofmaterial misstatement. An audit includes examining, on a testbasis, evidence supporting the amounts and disclosures in thefinancial statements. An audit also includes assessing theaccounting principles used and significant estimates made bymanagement, as well as evaluating the overall financial statementpresentation. We believe that our audit provides a reasonablebasis for our opinion.
We report that the consolidated financial statements have beenprepared by the Group's management in accordance with therequirements of Accounting Standards (AS) 21, Consolidatedfinancial statements and Accounting Standard (AS) 27, FinancialReporting of Interests in Joint Ventures [notified pursuant to theCompanies (Accounting Standards) Rules, 2006, (as amended)].
In our opinion and to the best of our information and accordingto the explanations given to us, the consolidated financialstatements give a true and fair view in conformity with theaccounting principles generally accepted in India:
(a) in the case of the consolidated balance sheet, of the stateof affairs of the Group as at June 30, 2011;
(b) in the case of the consolidated profit and loss account, ofthe profit for the year ended on that date; and
(c) in the case of the consolidated cash flow statement, of thecash flows for the year ended on that date.
For S.R. Batliboi & Co.For S.R. Batliboi & Co.For S.R. Batliboi & Co.For S.R. Batliboi & Co.For S.R. Batliboi & Co.Firm registration number: 301003EFirm registration number: 301003EFirm registration number: 301003EFirm registration number: 301003EFirm registration number: 301003EChartered Accountants
per Tridibes Basuper Tridibes Basuper Tridibes Basuper Tridibes Basuper Tridibes BasuPartnerMembership No.: 17401
Gurgaon, IndiaJuly 27, 2011
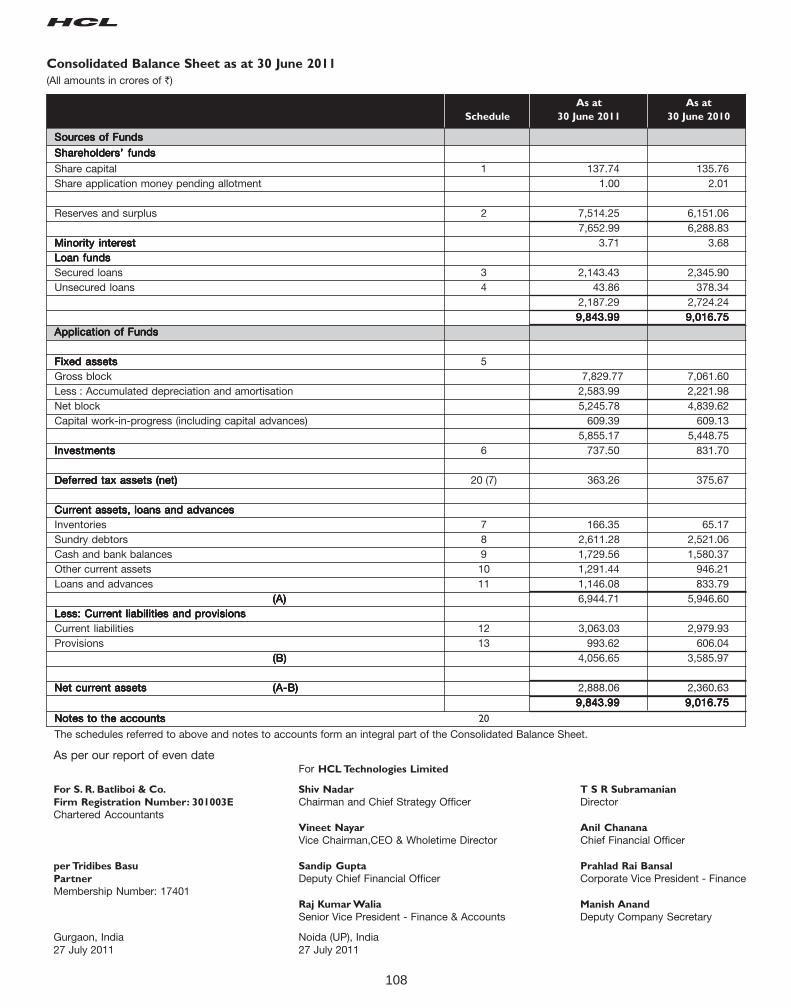
108
Consolidated Balance Sheet as at 30 June 2011
(All amounts in crores of `)
As at As at
Schedule 30 June 2011 30 June 2010
Sources of FundsSources of FundsSources of FundsSources of FundsSources of Funds
ShareholdShareholdShareholdShareholdShareholders’ fundsers’ fundsers’ fundsers’ fundsers’ funds
Share capital 1 137.74 135.76Share application money pending allotment 1.00 2.01
Reserves and surplus 2 7,514.25 6,151.06 7,652.99 6,288.83
Minority interestMinority interestMinority interestMinority interestMinority interest 3.71 3.68Loan fundsLoan fundsLoan fundsLoan fundsLoan fundsSecured loans 3 2,143.43 2,345.90Unsecured loans 4 43.86 378.34
2,187.29 2,724.249,843.999,843.999,843.999,843.999,843.99 9,016.75 9,016.75 9,016.75 9,016.75 9,016.75
Application of FundsApplication of FundsApplication of FundsApplication of FundsApplication of Funds
Fixed assetsFixed assetsFixed assetsFixed assetsFixed assets 5Gross block 7,829.77 7,061.60Less : Accumulated depreciation and amortisation 2,583.99 2,221.98Net block 5,245.78 4,839.62Capital work-in-progress (including capital advances) 609.39 609.13
5,855.17 5,448.75InvestmentsInvestmentsInvestmentsInvestmentsInvestments 6 737.50 831.70
Deferred tax assets (net)Deferred tax assets (net)Deferred tax assets (net)Deferred tax assets (net)Deferred tax assets (net) 20 (7) 363.26 375.67
Current assets, loans and advancesCurrent assets, loans and advancesCurrent assets, loans and advancesCurrent assets, loans and advancesCurrent assets, loans and advancesInventories 7 166.35 65.17Sundry debtors 8 2,611.28 2,521.06Cash and bank balances 9 1,729.56 1,580.37Other current assets 10 1,291.44 946.21Loans and advances 11 1,146.08 833.79
(A)(A)(A)(A)(A) 6,944.71 5,946.60Less: Current liabilities and provisionsLess: Current liabilities and provisionsLess: Current liabilities and provisionsLess: Current liabilities and provisionsLess: Current liabilities and provisionsCurrent liabilities 12 3,063.03 2,979.93Provisions 13 993.62 606.04
(B)(B)(B)(B)(B) 4,056.65 3,585.97
Net current assetsNet current assetsNet current assetsNet current assetsNet current assets (A-B)(A-B)(A-B)(A-B)(A-B) 2,888.06 2,360.639,843.999,843.999,843.999,843.999,843.99 9,016.759,016.759,016.759,016.759,016.75
Notes to the accountsNotes to the accountsNotes to the accountsNotes to the accountsNotes to the accounts 20 (0.00) (0.00)
The schedules referred to above and notes to accounts form an integral part of the Consolidated Balance Sheet.
As per our report of even dateFor HCL Technologies Limited
For S. R. Batliboi & Co. Shiv Nadar T S R Subramanian
Firm Registration Number: 301003E Chairman and Chief Strategy Officer DirectorChartered Accountants
Vineet Nayar Anil Chanana
Vice Chairman,CEO & Wholetime Director Chief Financial Officer
per Tridibes Basu Sandip Gupta Prahlad Rai Bansal
Partner Deputy Chief Financial Officer Corporate Vice President - FinanceMembership Number: 17401
Raj Kumar Walia Manish Anand
Senior Vice President - Finance & Accounts Deputy Company Secretary
Gurgaon, India Noida (UP), India27 July 2011 27 July 2011
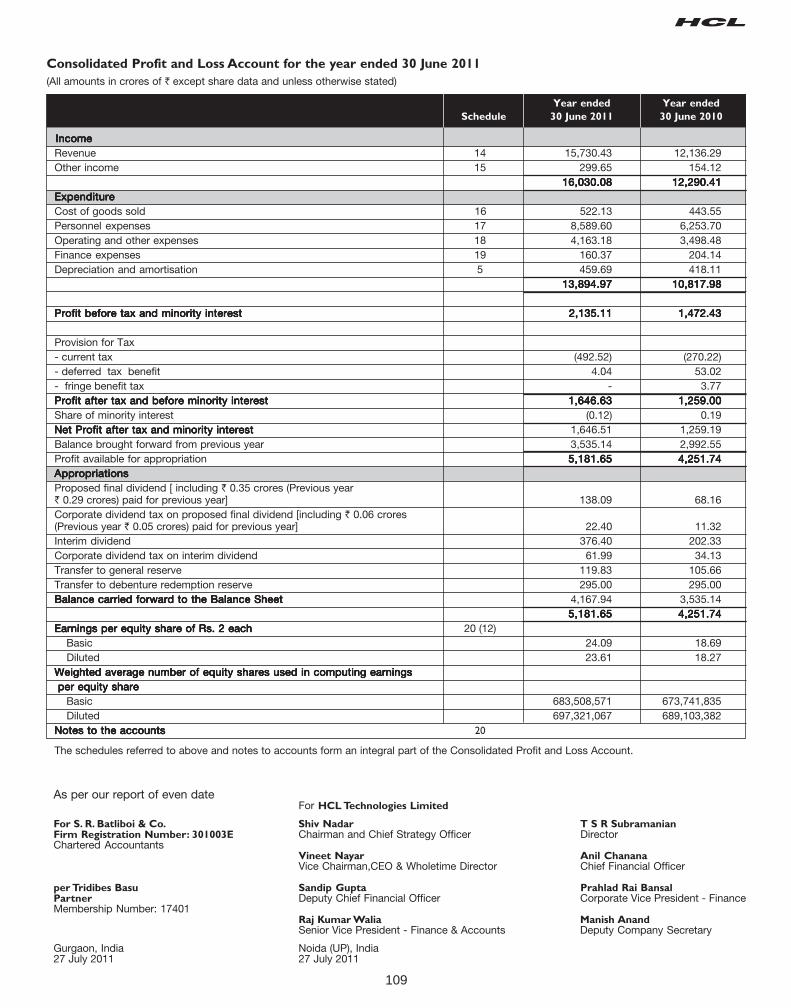
109
Consolidated Profit and Loss Account for the year ended 30 June 2011
(All amounts in crores of ` except share data and unless otherwise stated)
Year ended Year ended
Schedule 30 June 2011 30 June 2010
Income Income Income Income IncomeRevenue 14 15,730.43 12,136.29Other income 15 299.65 154.12
16,030.0816,030.0816,030.0816,030.0816,030.08 12,290.41 12,290.41 12,290.41 12,290.41 12,290.41ExpenditureExpenditureExpenditureExpenditureExpenditureCost of goods sold 16 522.13 443.55Personnel expenses 17 8,589.60 6,253.70Operating and other expenses 18 4,163.18 3,498.48Finance expenses 19 160.37 204.14Depreciation and amortisation 5 459.69 418.11
13,894.9713,894.9713,894.9713,894.9713,894.97 10,817.98 10,817.98 10,817.98 10,817.98 10,817.98
Profit before tax and minority interestProfit before tax and minority interestProfit before tax and minority interestProfit before tax and minority interestProfit before tax and minority interest 2,135.11 2,135.11 2,135.11 2,135.11 2,135.11 1,472.43 1,472.43 1,472.43 1,472.43 1,472.43
Provision for Tax- current tax (492.52) (270.22)- deferred tax benefit 4.04 53.02- fringe benefit tax - 3.77Profit after tax and before minority interestProfit after tax and before minority interestProfit after tax and before minority interestProfit after tax and before minority interestProfit after tax and before minority interest 1,646.631,646.631,646.631,646.631,646.63 1,259.00 1,259.00 1,259.00 1,259.00 1,259.00Share of minority interest (0.12) 0.19Net Profit after tax and minority interestNet Profit after tax and minority interestNet Profit after tax and minority interestNet Profit after tax and minority interestNet Profit after tax and minority interest 1,646.51 1,259.19Balance brought forward from previous year 3,535.14 2,992.55Profit available for appropriation 5,181.655,181.655,181.655,181.655,181.65 4,251.74 4,251.74 4,251.74 4,251.74 4,251.74AppropriationsAppropriationsAppropriationsAppropriationsAppropriationsProposed final dividend [ including ` 0.35 crores (Previous year` 0.29 crores) paid for previous year] 138.09 68.16Corporate dividend tax on proposed final dividend [including ` 0.06 crores(Previous year ` 0.05 crores) paid for previous year] 22.40 11.32Interim dividend 376.40 202.33Corporate dividend tax on interim dividend 61.99 34.13Transfer to general reserve 119.83 105.66Transfer to debenture redemption reserve 295.00 295.00Balance carried forward to the Balance SheetBalance carried forward to the Balance SheetBalance carried forward to the Balance SheetBalance carried forward to the Balance SheetBalance carried forward to the Balance Sheet 4,167.94 3,535.14
5,181.655,181.655,181.655,181.655,181.65 4,251.74 4,251.74 4,251.74 4,251.74 4,251.74Earnings per equity share of Rs. 2 eachEarnings per equity share of Rs. 2 eachEarnings per equity share of Rs. 2 eachEarnings per equity share of Rs. 2 eachEarnings per equity share of Rs. 2 each 20 (12) Basic 24.09 18.69 Diluted 23.61 18.27Weighted average number of equity shares used in computing earningsWeighted average number of equity shares used in computing earningsWeighted average number of equity shares used in computing earningsWeighted average number of equity shares used in computing earningsWeighted average number of equity shares used in computing earnings per equity share per equity share per equity share per equity share per equity share Basic 683,508,571 673,741,835 Diluted 697,321,067 689,103,382Notes to the accountsNotes to the accountsNotes to the accountsNotes to the accountsNotes to the accounts 20
The schedules referred to above and notes to accounts form an integral part of the Consolidated Profit and Loss Account.
As per our report of even dateFor HCL Technologies Limited
For S. R. Batliboi & Co. Shiv Nadar T S R SubramanianFirm Registration Number: 301003E Chairman and Chief Strategy Officer DirectorChartered Accountants
Vineet Nayar Anil ChananaVice Chairman,CEO & Wholetime Director Chief Financial Officer
per Tridibes Basu Sandip Gupta Prahlad Rai BansalPartner Deputy Chief Financial Officer Corporate Vice President - FinanceMembership Number: 17401
Raj Kumar Walia Manish AnandSenior Vice President - Finance & Accounts Deputy Company Secretary
Gurgaon, India Noida (UP), India27 July 2011 27 July 2011
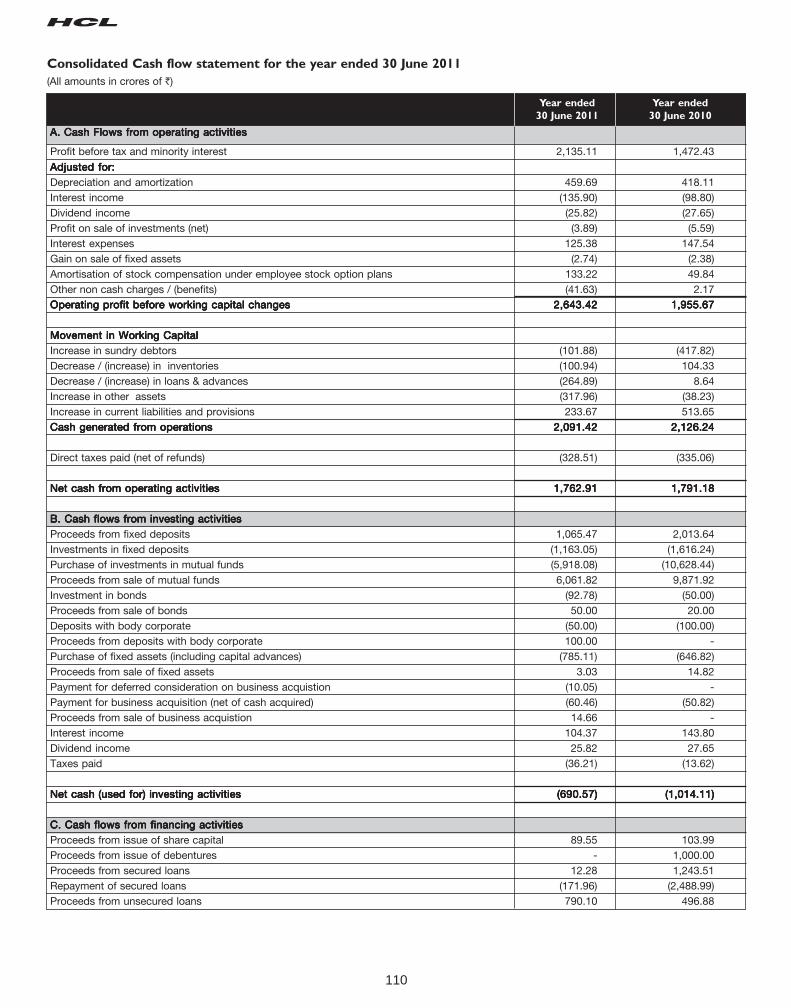
110
Consolidated Cash flow statement for the year ended 30 June 2011
(All amounts in crores of `)
Year ended Year ended
30 June 2011 30 June 2010
A. Cash Flows from operating activitiesA. Cash Flows from operating activitiesA. Cash Flows from operating activitiesA. Cash Flows from operating activitiesA. Cash Flows from operating activities
Profit before tax and minority interest 2,135.11 1,472.43
Adjusted for:Adjusted for:Adjusted for:Adjusted for:Adjusted for:Depreciation and amortization 459.69 418.11Interest income (135.90) (98.80)Dividend income (25.82) (27.65)Profit on sale of investments (net) (3.89) (5.59)Interest expenses 125.38 147.54Gain on sale of fixed assets (2.74) (2.38)Amortisation of stock compensation under employee stock option plans 133.22 49.84Other non cash charges / (benefits) (41.63) 2.17Operating profit before working capital changesOperating profit before working capital changesOperating profit before working capital changesOperating profit before working capital changesOperating profit before working capital changes 2,643.422,643.422,643.422,643.422,643.42 1,955.67 1,955.67 1,955.67 1,955.67 1,955.67
Movement in Working CapitalMovement in Working CapitalMovement in Working CapitalMovement in Working CapitalMovement in Working CapitalIncrease in sundry debtors (101.88) (417.82)Decrease / (increase) in inventories (100.94) 104.33Decrease / (increase) in loans & advances (264.89) 8.64Increase in other assets (317.96) (38.23)Increase in current liabilities and provisions 233.67 513.65Cash generated from operationsCash generated from operationsCash generated from operationsCash generated from operationsCash generated from operations 2,091.422,091.422,091.422,091.422,091.42 2,126.24 2,126.24 2,126.24 2,126.24 2,126.24
Direct taxes paid (net of refunds) (328.51) (335.06)
Net cash from operating activitiesNet cash from operating activitiesNet cash from operating activitiesNet cash from operating activitiesNet cash from operating activities 1,762.911,762.911,762.911,762.911,762.91 1,791.18 1,791.18 1,791.18 1,791.18 1,791.18
B. Cash flows from investing activitiesB. Cash flows from investing activitiesB. Cash flows from investing activitiesB. Cash flows from investing activitiesB. Cash flows from investing activitiesProceeds from fixed deposits 1,065.47 2,013.64Investments in fixed deposits (1,163.05) (1,616.24)Purchase of investments in mutual funds (5,918.08) (10,628.44)Proceeds from sale of mutual funds 6,061.82 9,871.92Investment in bonds (92.78) (50.00)Proceeds from sale of bonds 50.00 20.00Deposits with body corporate (50.00) (100.00)Proceeds from deposits with body corporate 100.00 -Purchase of fixed assets (including capital advances) (785.11) (646.82)Proceeds from sale of fixed assets 3.03 14.82Payment for deferred consideration on business acquistion (10.05) -Payment for business acquisition (net of cash acquired) (60.46) (50.82)Proceeds from sale of business acquistion 14.66 -Interest income 104.37 143.80Dividend income 25.82 27.65Taxes paid (36.21) (13.62)
Net cash (used for) investing activitiesNet cash (used for) investing activitiesNet cash (used for) investing activitiesNet cash (used for) investing activitiesNet cash (used for) investing activities (690.57)(690.57)(690.57)(690.57)(690.57) (1,014.11) (1,014.11) (1,014.11) (1,014.11) (1,014.11)
C. Cash flows from financing activitiesC. Cash flows from financing activitiesC. Cash flows from financing activitiesC. Cash flows from financing activitiesC. Cash flows from financing activitiesProceeds from issue of share capital 89.55 103.99Proceeds from issue of debentures - 1,000.00Proceeds from secured loans 12.28 1,243.51Repayment of secured loans (171.96) (2,488.99)Proceeds from unsecured loans 790.10 496.88
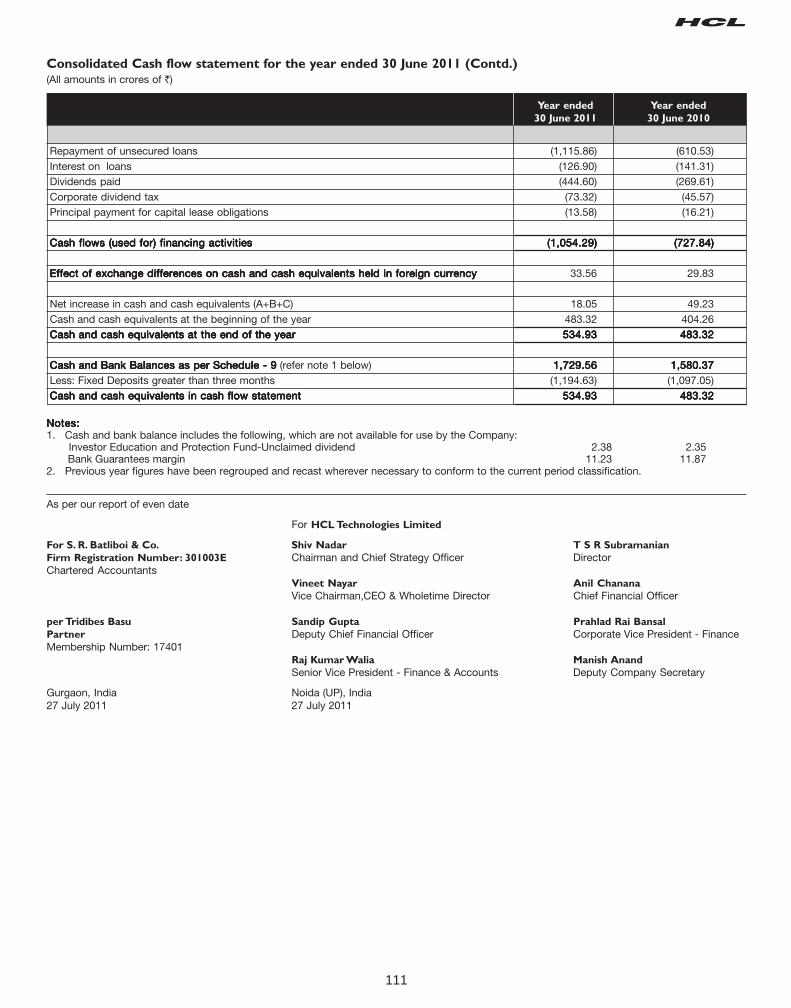
111
Consolidated Cash flow statement for the year ended 30 June 2011 (Contd.)(All amounts in crores of `)
Notes:Notes:Notes:Notes:Notes:1. Cash and bank balance includes the following, which are not available for use by the Company: Investor Education and Protection Fund-Unclaimed dividend 2.38 2.35 Bank Guarantees margin 11.23 11.872. Previous year figures have been regrouped and recast wherever necessary to conform to the current period classification.
As per our report of even date
Year ended Year ended
30 June 2011 30 June 2010
Repayment of unsecured loans (1,115.86) (610.53)Interest on loans (126.90) (141.31)Dividends paid (444.60) (269.61)Corporate dividend tax (73.32) (45.57)Principal payment for capital lease obligations (13.58) (16.21)
Cash flows (used for) financing activitiesCash flows (used for) financing activitiesCash flows (used for) financing activitiesCash flows (used for) financing activitiesCash flows (used for) financing activities (1,054.29)(1,054.29)(1,054.29)(1,054.29)(1,054.29) (727.84) (727.84) (727.84) (727.84) (727.84)
Effect of exchange differences on cash and cash equivalents held in foreign currencyEffect of exchange differences on cash and cash equivalents held in foreign currencyEffect of exchange differences on cash and cash equivalents held in foreign currencyEffect of exchange differences on cash and cash equivalents held in foreign currencyEffect of exchange differences on cash and cash equivalents held in foreign currency 33.56 29.83
Net increase in cash and cash equivalents (A+B+C) 18.05 49.23Cash and cash equivalents at the beginning of the year 483.32 404.26Cash and cash equivalents at the end of the yearCash and cash equivalents at the end of the yearCash and cash equivalents at the end of the yearCash and cash equivalents at the end of the yearCash and cash equivalents at the end of the year 534.93534.93534.93534.93534.93 483.32 483.32 483.32 483.32 483.32
Cash and Bank Balances as per Schedule - 9Cash and Bank Balances as per Schedule - 9Cash and Bank Balances as per Schedule - 9Cash and Bank Balances as per Schedule - 9Cash and Bank Balances as per Schedule - 9 (refer note 1 below) 1,729.561,729.561,729.561,729.561,729.56 1,580.37 1,580.37 1,580.37 1,580.37 1,580.37Less: Fixed Deposits greater than three months (1,194.63) (1,097.05)Cash and cash equivalents in cash flow statementCash and cash equivalents in cash flow statementCash and cash equivalents in cash flow statementCash and cash equivalents in cash flow statementCash and cash equivalents in cash flow statement 534.93534.93534.93534.93534.93 483.32 483.32 483.32 483.32 483.32(0.00)
For HCL Technologies Limited
For S. R. Batliboi & Co. Shiv Nadar T S R Subramanian
Firm Registration Number: 301003E Chairman and Chief Strategy Officer DirectorChartered Accountants
Vineet Nayar Anil Chanana
Vice Chairman,CEO & Wholetime Director Chief Financial Officer
per Tridibes Basu Sandip Gupta Prahlad Rai Bansal
Partner Deputy Chief Financial Officer Corporate Vice President - FinanceMembership Number: 17401
Raj Kumar Walia Manish Anand
Senior Vice President - Finance & Accounts Deputy Company Secretary
Gurgaon, India Noida (UP), India27 July 2011 27 July 2011
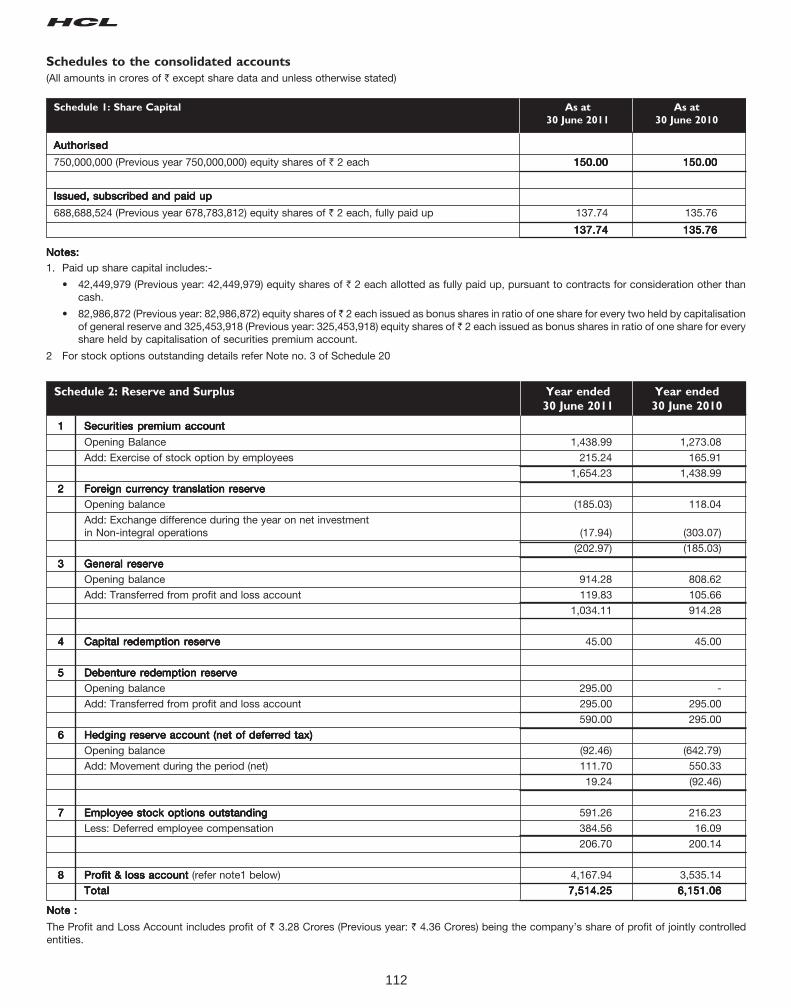
112
Schedules to the consolidated accounts
(All amounts in crores of ` except share data and unless otherwise stated)
Schedule 1: Share Capital As at As at
30 June 2011 30 June 2010
AuthorisedAuthorisedAuthorisedAuthorisedAuthorised
750,000,000 (Previous year 750,000,000) equity shares of ` 2 each 150.00150.00150.00150.00150.00 150.00150.00150.00150.00150.00
Issued, subscribed and paid upIssued, subscribed and paid upIssued, subscribed and paid upIssued, subscribed and paid upIssued, subscribed and paid up
688,688,524 (Previous year 678,783,812) equity shares of ` 2 each, fully paid up 137.74 135.76
137.74137.74137.74137.74137.74 135.76135.76135.76135.76135.76
Notes:Notes:Notes:Notes:Notes:
1. Paid up share capital includes:-
• 42,449,979 (Previous year: 42,449,979) equity shares of ` 2 each allotted as fully paid up, pursuant to contracts for consideration other thancash.
• 82,986,872 (Previous year: 82,986,872) equity shares of ̀ 2 each issued as bonus shares in ratio of one share for every two held by capitalisationof general reserve and 325,453,918 (Previous year: 325,453,918) equity shares of ` 2 each issued as bonus shares in ratio of one share for everyshare held by capitalisation of securities premium account.
2 For stock options outstanding details refer Note no. 3 of Schedule 20
Schedule 2: Reserve and Surplus Year ended Year ended
30 June 2011 30 June 2010
11111 Securities premium accountSecurities premium accountSecurities premium accountSecurities premium accountSecurities premium account
Opening Balance 1,438.99 1,273.08
Add: Exercise of stock option by employees 215.24 165.91
1,654.23 1,438.99
22222 Foreign currency translation reserveForeign currency translation reserveForeign currency translation reserveForeign currency translation reserveForeign currency translation reserve
Opening balance (185.03) 118.04
Add: Exchange difference during the year on net investmentin Non-integral operations (17.94) (303.07)
(202.97) (185.03)
33333 General reserveGeneral reserveGeneral reserveGeneral reserveGeneral reserve
Opening balance 914.28 808.62
Add: Transferred from profit and loss account 119.83 105.66
1,034.11 914.28
44444 Capital redemption reserveCapital redemption reserveCapital redemption reserveCapital redemption reserveCapital redemption reserve 45.00 45.00
55555 Debenture redemption reserveDebenture redemption reserveDebenture redemption reserveDebenture redemption reserveDebenture redemption reserve
Opening balance 295.00 -
Add: Transferred from profit and loss account 295.00 295.00
590.00 295.00
66666 Hedging reserve account (net of deferred tax)Hedging reserve account (net of deferred tax)Hedging reserve account (net of deferred tax)Hedging reserve account (net of deferred tax)Hedging reserve account (net of deferred tax)
Opening balance (92.46) (642.79)
Add: Movement during the period (net) 111.70 550.33
19.24 (92.46)
77777 Employee stock options outstandingEmployee stock options outstandingEmployee stock options outstandingEmployee stock options outstandingEmployee stock options outstanding 591.26 216.23
Less: Deferred employee compensation 384.56 16.09
206.70 200.14
88888 Profit & loss account Profit & loss account Profit & loss account Profit & loss account Profit & loss account (refer note1 below) 4,167.94 3,535.14
TotalTotalTotalTotalTotal 7,514.257,514.257,514.257,514.257,514.25 6,151.066,151.066,151.066,151.066,151.06
Note :Note :Note :Note :Note :
The Profit and Loss Account includes profit of ` 3.28 Crores (Previous year: ` 4.36 Crores) being the company’s share of profit of jointly controlledentities.
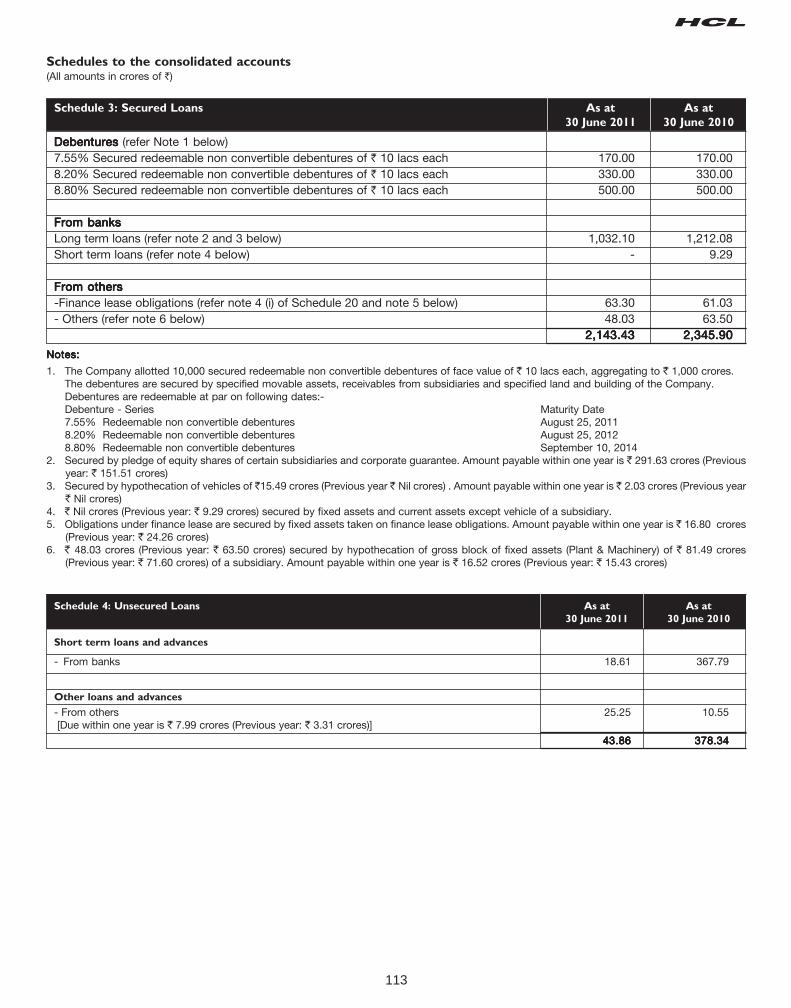
113
Schedules to the consolidated accounts(All amounts in crores of `)
Schedule 4: Unsecured Loans As at As at
30 June 2011 30 June 2010
Short term loans and advances
- From banks 18.61 367.79
Other loans and advances
- From others 25.25 10.55 [Due within one year is ` 7.99 crores (Previous year: ` 3.31 crores)]
43.8643.8643.8643.8643.86 378.34378.34378.34378.34378.34
Schedule 3: Secured Loans As at As at
30 June 2011 30 June 2010
Debentures Debentures Debentures Debentures Debentures (refer Note 1 below)7.55% Secured redeemable non convertible debentures of ` 10 lacs each 170.00 170.008.20% Secured redeemable non convertible debentures of ` 10 lacs each 330.00 330.008.80% Secured redeemable non convertible debentures of ` 10 lacs each 500.00 500.00
From banksFrom banksFrom banksFrom banksFrom banksLong term loans (refer note 2 and 3 below) 1,032.10 1,212.08Short term loans (refer note 4 below) - 9.29
From othersFrom othersFrom othersFrom othersFrom others-Finance lease obligations (refer note 4 (i) of Schedule 20 and note 5 below) 63.30 61.03- Others (refer note 6 below) 48.03 63.50
2,143.432,143.432,143.432,143.432,143.43 2,345.902,345.902,345.902,345.902,345.90
Notes:Notes:Notes:Notes:Notes:
1. The Company allotted 10,000 secured redeemable non convertible debentures of face value of ` 10 lacs each, aggregating to ` 1,000 crores.The debentures are secured by specified movable assets, receivables from subsidiaries and specified land and building of the Company.Debentures are redeemable at par on following dates:-Debenture - Series Maturity Date7.55% Redeemable non convertible debentures August 25, 20118.20% Redeemable non convertible debentures August 25, 20128.80% Redeemable non convertible debentures September 10, 2014
2. Secured by pledge of equity shares of certain subsidiaries and corporate guarantee. Amount payable within one year is ` 291.63 crores (Previousyear: ` 151.51 crores)
3. Secured by hypothecation of vehicles of `15.49 crores (Previous year ` Nil crores) . Amount payable within one year is ` 2.03 crores (Previous year` Nil crores)
4. ` Nil crores (Previous year: ` 9.29 crores) secured by fixed assets and current assets except vehicle of a subsidiary.5. Obligations under finance lease are secured by fixed assets taken on finance lease obligations. Amount payable within one year is ` 16.80 crores
(Previous year: ` 24.26 crores)6. ` 48.03 crores (Previous year: ` 63.50 crores) secured by hypothecation of gross block of fixed assets (Plant & Machinery) of ` 81.49 crores
(Previous year: ` 71.60 crores) of a subsidiary. Amount payable within one year is ` 16.52 crores (Previous year: ` 15.43 crores)
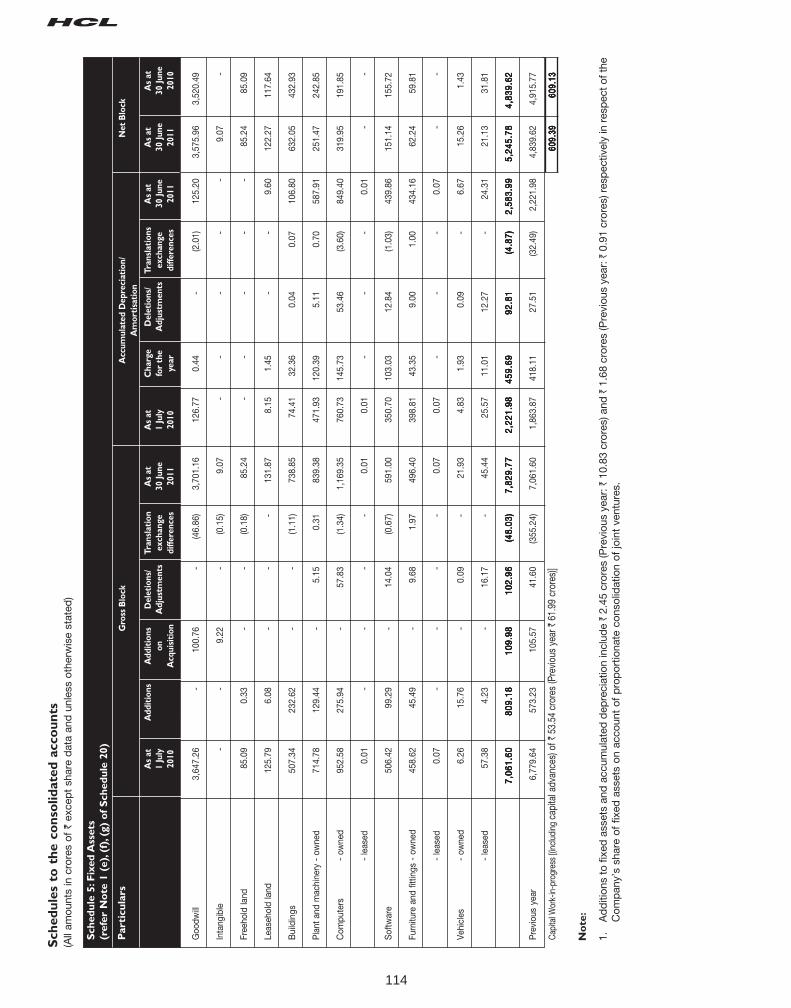
114
Sch
ed
ule
s to
th
e c
on
solid
ate
d a
cco
un
ts(A
ll am
ount
s in
cro
res
of `
exc
ept
shar
e d
ata
and
unl
ess
othe
rwis
e st
ated
)
Sch
ed
ule
5: F
ixed
Ass
ets
(refe
r N
ote
1 (
e), (
f), (g
) o
f S
ch
ed
ule
20)
Parti
cu
lars
Gro
ss B
lock
Acc
um
ula
ted
Dep
reci
ati
on
/N
et
Blo
ck
Am
ort
isati
on
As
at
Ad
dit
ion
sA
dd
itio
ns
Dele
tio
ns/
Tra
nsl
ati
on
As
at
As
at
Ch
arg
eD
ele
tio
ns/
Tra
nsl
ati
on
sA
s at
As
at
As
at
1 J
uly
on
Ad
just
men
tsexch
an
ge
30 J
un
e1 J
uly
for
the
Ad
just
men
tsexch
an
ge
30 J
un
e30 J
un
e30 J
un
e
2010
Acq
uis
itio
nd
iffe
ren
ces
2011
2010
year
diffe
ren
ces
2011
2011
2010
Goo
dwill
3,64
7.26
-10
0.76
-(4
6.86
)3,
701.
1612
6.77
0.44
-(2
.01)
125.
203,
575.
963,
520.
49
Inta
ngib
le-
-9.
22-
(0.1
5)9.
07-
--
--
9.07
-
Free
hold
land
85.0
90.
33-
-(0
.18)
85.2
4-
--
--
85.2
485
.09
Leas
ehol
d la
nd12
5.79
6.08
--
-13
1.87
8.15
1.45
--
9.60
122.
2711
7.64
Bui
ldin
gs50
7.34
232.
62-
-(1
.11)
738.
8574
.41
32.3
60.
040.
0710
6.80
632.
0543
2.93
Plan
t and
mac
hine
ry -
ow
ned
714.
7812
9.44
-5.
150.
3183
9.38
471.
9312
0.39
5.11
0.70
587.
9125
1.47
242.
85
Com
pute
rs-
owne
d95
2.58
275.
94-
57.8
3(1
.34)
1,16
9.35
760.
7314
5.73
53.4
6(3
.60)
849.
4031
9.95
191.
85
- le
ased
0.01
--
--
0.01
0.01
--
-0.
01-
-
Softw
are
506.
4299
.29
-14
.04
(0.6
7)59
1.00
350.
7010
3.03
12.8
4(1
.03)
439.
8615
1.14
155.
72
Furn
iture
and
fitti
ngs
- ow
ned
458.
6245
.49
-9.
681.
9749
6.40
398.
8143
.35
9.00
1.00
434.
1662
.24
59.8
1
- le
ased
0.07
--
--
0.07
0.07
--
-0.
07-
-
Vehi
cles
- ow
ned
6.26
15.7
6-
0.09
-21
.93
4.83
1.93
0.09
-6.
6715
.26
1.43
- le
ased
57.3
84.
23-
16.1
7-
45.4
425
.57
11.0
112
.27
-24
.31
21.1
331
.81
7,06
1.60
7,06
1.60
7,06
1.60
7,06
1.60
7,06
1.60
809.
1880
9.18
809.
1880
9.18
809.
1810
9.98
109.
9810
9.98
109.
9810
9.98
102.
9610
2.96
102.
9610
2.96
102.
96(4
8.03
)(4
8.03
)(4
8.03
)(4
8.03
)(4
8.03
)7,
829.
777,
829.
777,
829.
777,
829.
777,
829.
772,
221.
982,
221.
982,
221.
982,
221.
982,
221.
9845
9.69
459.
6945
9.69
459.
6945
9.69
92.8
192
.81
92.8
192
.81
92.8
1(4
.87)
(4.8
7)(4
.87)
(4.8
7)(4
.87)
2,58
3.99
2,58
3.99
2,58
3.99
2,58
3.99
2,58
3.99
5,24
5.78
5,24
5.78
5,24
5.78
5,24
5.78
5,24
5.78
4,83
9.62
4,83
9.62
4,83
9.62
4,83
9.62
4,83
9.62
Prev
ious
yea
r6,
779.
6457
3.23
105.
5741
.60
(355
.24)
7,06
1.60
1,86
3.87
418.
1127
.51
(32.
49)
2,22
1.98
4,83
9.62
4,91
5.77
Capi
tal W
ork-
in-p
rogr
ess
[(incl
udin
g ca
pita
l adv
ance
s) o
f ` 5
3.54
cro
res
(Pre
vious
yea
r ` 6
1.99
cro
res)
]60
9.39
609.
3960
9.39
609.
3960
9.39
609.
1360
9.13
609.
1360
9.13
609.
13
No
te:
1.A
dd
ition
s to
fixe
d a
sset
s an
d a
ccum
ulat
ed d
epre
ciat
ion
incl
ude
` 2
.45
cror
es (P
revi
ous
year
: ` 1
0.83
cro
res)
and
` 1
.68
cror
es (P
revi
ous
year
: ` 0
.91
cror
es) r
esp
ectiv
ely
in r
esp
ect o
f the
Com
pan
y’s
shar
e of
fix
ed a
sset
s on
acc
ount
of
pro
por
tiona
te c
onso
lidat
ion
of jo
int
vent
ures
.
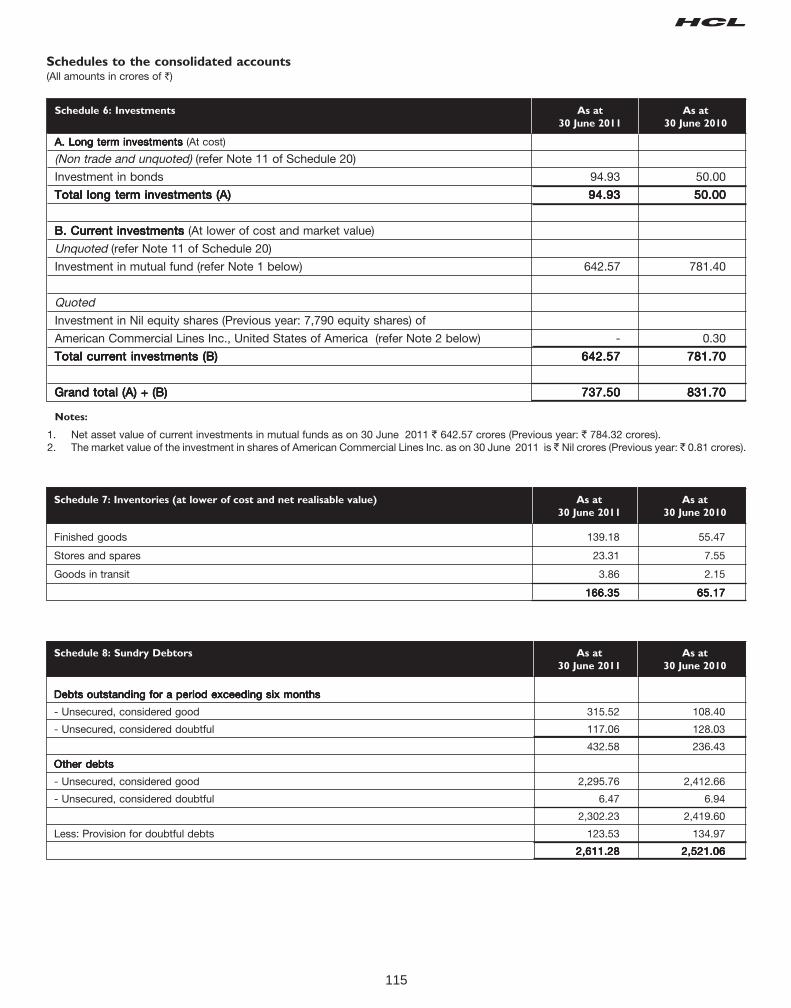
115
Schedules to the consolidated accounts(All amounts in crores of `)
Schedule 6: Investments As at As at
30 June 2011 30 June 2010
A. Long term investments A. Long term investments A. Long term investments A. Long term investments A. Long term investments (At cost)
(Non trade and unquoted) (refer Note 11 of Schedule 20)
Investment in bonds 94.93 50.00
Total long term investments (A)Total long term investments (A)Total long term investments (A)Total long term investments (A)Total long term investments (A) 94.9394.9394.9394.9394.93 50.0050.0050.0050.0050.00
B. Current investments B. Current investments B. Current investments B. Current investments B. Current investments (At lower of cost and market value)
Unquoted (refer Note 11 of Schedule 20)
Investment in mutual fund (refer Note 1 below) 642.57 781.40
Quoted
Investment in Nil equity shares (Previous year: 7,790 equity shares) of
American Commercial Lines Inc., United States of America (refer Note 2 below) - 0.30
Total current investments (B)Total current investments (B)Total current investments (B)Total current investments (B)Total current investments (B) 642.57642.57642.57642.57642.57 781.70781.70781.70781.70781.70
Grand total (A) + (B)Grand total (A) + (B)Grand total (A) + (B)Grand total (A) + (B)Grand total (A) + (B) 737.50737.50737.50737.50737.50 831.70831.70831.70831.70831.70
Notes:
1. Net asset value of current investments in mutual funds as on 30 June 2011 ` 642.57 crores (Previous year: ` 784.32 crores).2. The market value of the investment in shares of American Commercial Lines Inc. as on 30 June 2011 is ̀ Nil crores (Previous year: ` 0.81 crores).
Finished goods 139.18 55.47
Stores and spares 23.31 7.55
Goods in transit 3.86 2.15
166.35166.35166.35166.35166.35 65.1765.1765.1765.1765.17
Schedule 7: Inventories (at lower of cost and net realisable value) As at As at
30 June 2011 30 June 2010
Schedule 8: Sundry Debtors As at As at
30 June 2011 30 June 2010
Debts outstanding for a period exceeding six monthsDebts outstanding for a period exceeding six monthsDebts outstanding for a period exceeding six monthsDebts outstanding for a period exceeding six monthsDebts outstanding for a period exceeding six months
- Unsecured, considered good 315.52 108.40
- Unsecured, considered doubtful 117.06 128.03
432.58 236.43
Other debtsOther debtsOther debtsOther debtsOther debts
- Unsecured, considered good 2,295.76 2,412.66
- Unsecured, considered doubtful 6.47 6.94
2,302.23 2,419.60
Less: Provision for doubtful debts 123.53 134.97
2,611.282,611.282,611.282,611.282,611.28 2,521.062,521.062,521.062,521.062,521.06
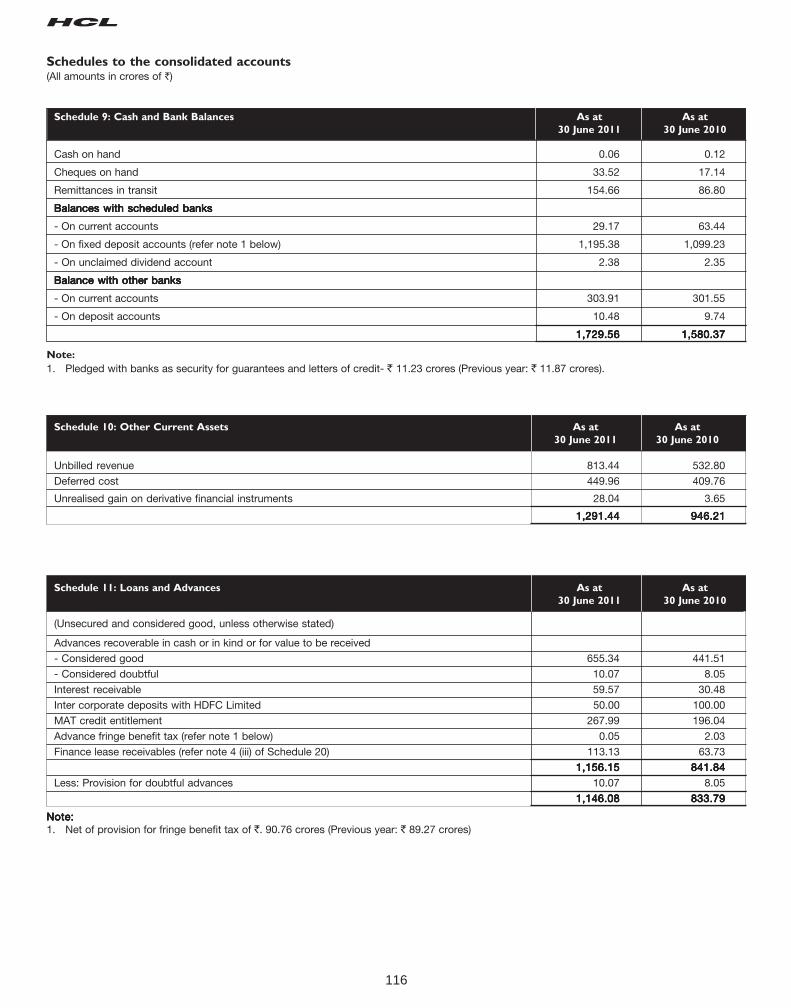
116
(Unsecured and considered good, unless otherwise stated)
Advances recoverable in cash or in kind or for value to be received
- Considered good 655.34 441.51
- Considered doubtful 10.07 8.05
Interest receivable 59.57 30.48
Inter corporate deposits with HDFC Limited 50.00 100.00
MAT credit entitlement 267.99 196.04
Advance fringe benefit tax (refer note 1 below) 0.05 2.03
Finance lease receivables (refer note 4 (iii) of Schedule 20) 113.13 63.73
1,156.151,156.151,156.151,156.151,156.15 841.84841.84841.84841.84841.84
Less: Provision for doubtful advances 10.07 8.05
1,146.081,146.081,146.081,146.081,146.08 833.79833.79833.79833.79833.79
Schedule 11: Loans and Advances As at As at
30 June 2011 30 June 2010
Schedule 10: Other Current Assets As at As at
30 June 2011 30 June 2010
Unbilled revenue 813.44 532.80
Deferred cost 449.96 409.76
Unrealised gain on derivative financial instruments 28.04 3.65
1,291.441,291.441,291.441,291.441,291.44 946.21946.21946.21946.21946.21
Schedules to the consolidated accounts(All amounts in crores of `)
Schedule 9: Cash and Bank Balances As at As at
30 June 2011 30 June 2010
Cash on hand 0.06 0.12
Cheques on hand 33.52 17.14
Remittances in transit 154.66 86.80
Balances with scheduled banksBalances with scheduled banksBalances with scheduled banksBalances with scheduled banksBalances with scheduled banks
- On current accounts 29.17 63.44
- On fixed deposit accounts (refer note 1 below) 1,195.38 1,099.23
- On unclaimed dividend account 2.38 2.35
Balance with other banksBalance with other banksBalance with other banksBalance with other banksBalance with other banks
- On current accounts 303.91 301.55
- On deposit accounts 10.48 9.74
1,729.561,729.561,729.561,729.561,729.56 1,580.371,580.371,580.371,580.371,580.37
Note:
1. Pledged with banks as security for guarantees and letters of credit- ` 11.23 crores (Previous year: ` 11.87 crores).
Note:Note:Note:Note:Note:1. Net of provision for fringe benefit tax of `. 90.76 crores (Previous year: ` 89.27 crores)
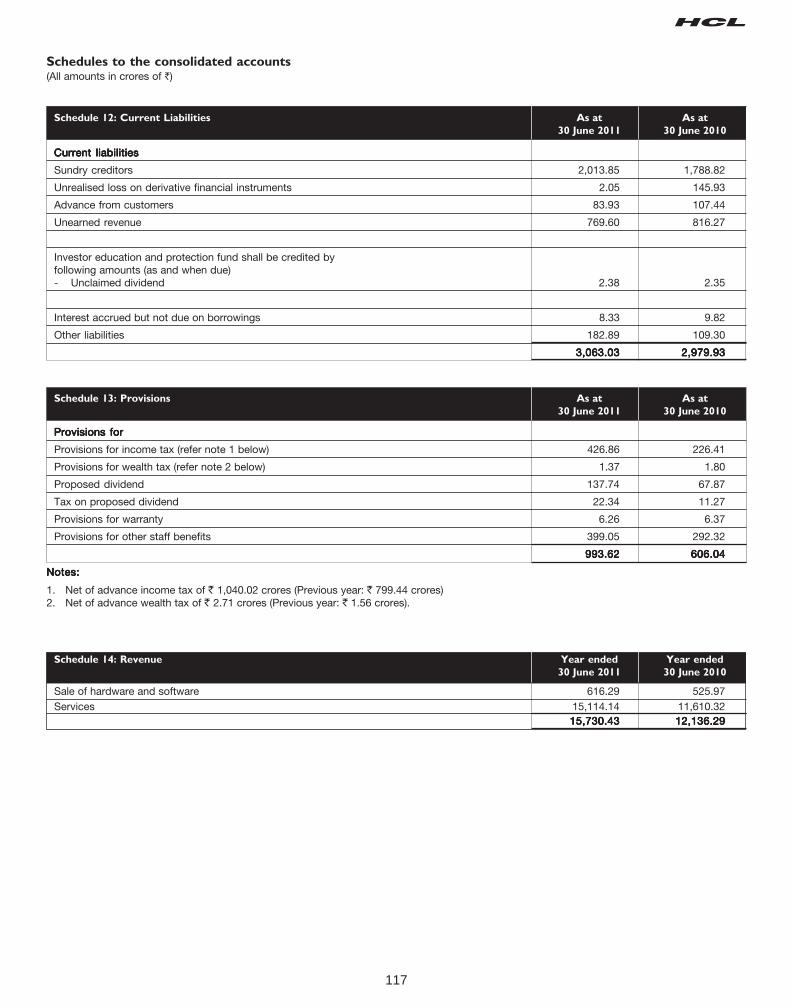
117
Provisions forProvisions forProvisions forProvisions forProvisions for
Provisions for income tax (refer note 1 below) 426.86 226.41
Provisions for wealth tax (refer note 2 below) 1.37 1.80
Proposed dividend 137.74 67.87
Tax on proposed dividend 22.34 11.27
Provisions for warranty 6.26 6.37
Provisions for other staff benefits 399.05 292.32
993.62993.62993.62993.62993.62 606.04606.04606.04606.04606.04
Schedules to the consolidated accounts(All amounts in crores of `)
Current liabilitiesCurrent liabilitiesCurrent liabilitiesCurrent liabilitiesCurrent liabilities
Sundry creditors 2,013.85 1,788.82
Unrealised loss on derivative financial instruments 2.05 145.93
Advance from customers 83.93 107.44
Unearned revenue 769.60 816.27
Investor education and protection fund shall be credited byfollowing amounts (as and when due)- Unclaimed dividend 2.38 2.35
Interest accrued but not due on borrowings 8.33 9.82
Other liabilities 182.89 109.30
3,063.033,063.033,063.033,063.033,063.03 2,979.932,979.932,979.932,979.932,979.93
Schedule 12: Current Liabilities As at As at
30 June 2011 30 June 2010
Notes:Notes:Notes:Notes:Notes:
1. Net of advance income tax of ` 1,040.02 crores (Previous year: ` 799.44 crores)2. Net of advance wealth tax of ` 2.71 crores (Previous year: ` 1.56 crores).
Schedule 13: Provisions As at As at
30 June 2011 30 June 2010
Sale of hardware and software 616.29 525.97Services 15,114.14 11,610.32
15,730.4315,730.4315,730.4315,730.4315,730.43 12,136.2912,136.2912,136.2912,136.2912,136.29
Schedule 14: Revenue Year ended Year ended
30 June 2011 30 June 2010
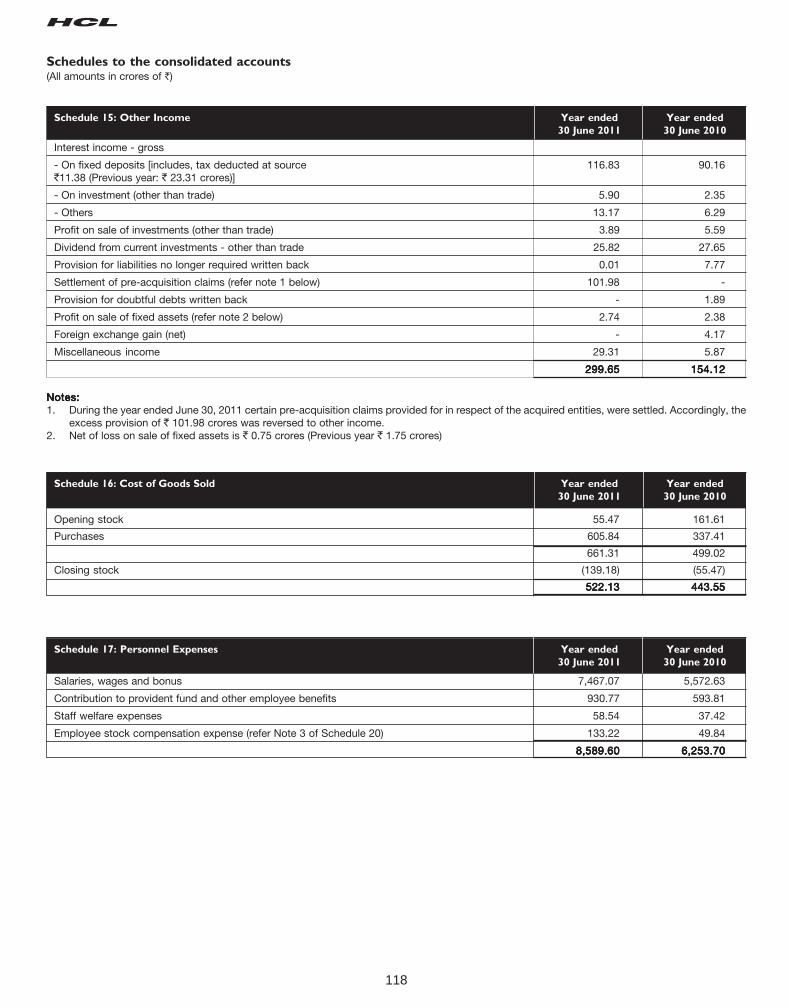
118
Schedules to the consolidated accounts(All amounts in crores of `)
Interest income - gross
- On fixed deposits [includes, tax deducted at source 116.83 90.16`11.38 (Previous year: ` 23.31 crores)]
- On investment (other than trade) 5.90 2.35
- Others 13.17 6.29
Profit on sale of investments (other than trade) 3.89 5.59
Dividend from current investments - other than trade 25.82 27.65
Provision for liabilities no longer required written back 0.01 7.77
Settlement of pre-acquisition claims (refer note 1 below) 101.98 -
Provision for doubtful debts written back - 1.89
Profit on sale of fixed assets (refer note 2 below) 2.74 2.38
Foreign exchange gain (net) - 4.17
Miscellaneous income 29.31 5.87
299.65299.65299.65299.65299.65 154.12154.12154.12154.12154.12
Schedule 15: Other Income Year ended Year ended
30 June 2011 30 June 2010
Opening stock 55.47 161.61
Purchases 605.84 337.41
661.31 499.02
Closing stock (139.18) (55.47)
522.13 522.13 522.13 522.13 522.13 443.55 443.55 443.55 443.55 443.55
Schedule 16: Cost of Goods Sold Year ended Year ended
30 June 2011 30 June 2010
Salaries, wages and bonus 7,467.07 5,572.63
Contribution to provident fund and other employee benefits 930.77 593.81
Staff welfare expenses 58.54 37.42
Employee stock compensation expense (refer Note 3 of Schedule 20) 133.22 49.84
8,589.608,589.608,589.608,589.608,589.60 6,253.706,253.706,253.706,253.706,253.70
Schedule 17: Personnel Expenses Year ended Year ended
30 June 2011 30 June 2010
Notes:Notes:Notes:Notes:Notes:1. During the year ended June 30, 2011 certain pre-acquisition claims provided for in respect of the acquired entities, were settled. Accordingly, the
excess provision of ` 101.98 crores was reversed to other income.2. Net of loss on sale of fixed assets is ` 0.75 crores (Previous year ` 1.75 crores)
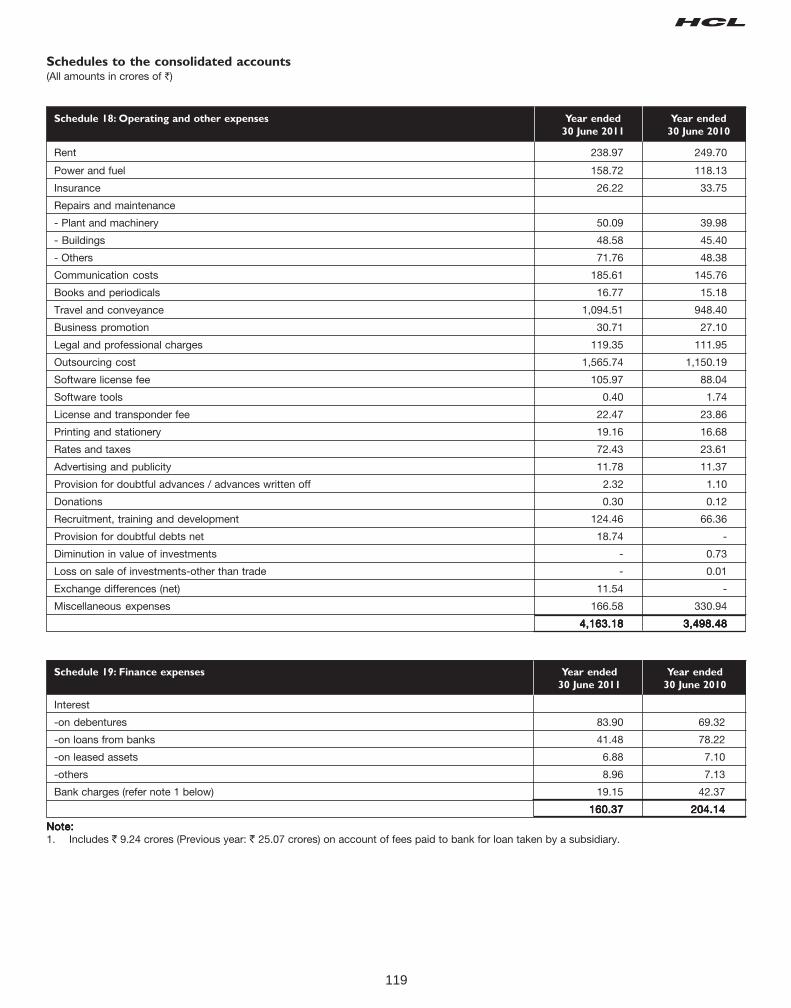
119
Schedules to the consolidated accounts(All amounts in crores of `)
Schedule 18: Operating and other expenses Year ended Year ended
30 June 2011 30 June 2010
Rent 238.97 249.70
Power and fuel 158.72 118.13
Insurance 26.22 33.75
Repairs and maintenance
- Plant and machinery 50.09 39.98
- Buildings 48.58 45.40
- Others 71.76 48.38
Communication costs 185.61 145.76
Books and periodicals 16.77 15.18
Travel and conveyance 1,094.51 948.40
Business promotion 30.71 27.10
Legal and professional charges 119.35 111.95
Outsourcing cost 1,565.74 1,150.19
Software license fee 105.97 88.04
Software tools 0.40 1.74
License and transponder fee 22.47 23.86
Printing and stationery 19.16 16.68
Rates and taxes 72.43 23.61
Advertising and publicity 11.78 11.37
Provision for doubtful advances / advances written off 2.32 1.10
Donations 0.30 0.12
Recruitment, training and development 124.46 66.36
Provision for doubtful debts net 18.74 -
Diminution in value of investments - 0.73
Loss on sale of investments-other than trade - 0.01
Exchange differences (net) 11.54 -
Miscellaneous expenses 166.58 330.94
4,163.184,163.184,163.184,163.184,163.18 3,498.483,498.483,498.483,498.483,498.48
Schedule 19: Finance expenses Year ended Year ended
30 June 2011 30 June 2010
Interest
-on debentures 83.90 69.32
-on loans from banks 41.48 78.22
-on leased assets 6.88 7.10
-others 8.96 7.13
Bank charges (refer note 1 below) 19.15 42.37
160.37160.37160.37160.37160.37 204.14204.14204.14204.14204.14
Note:Note:Note:Note:Note:1. Includes ` 9.24 crores (Previous year: ` 25.07 crores) on account of fees paid to bank for loan taken by a subsidiary.
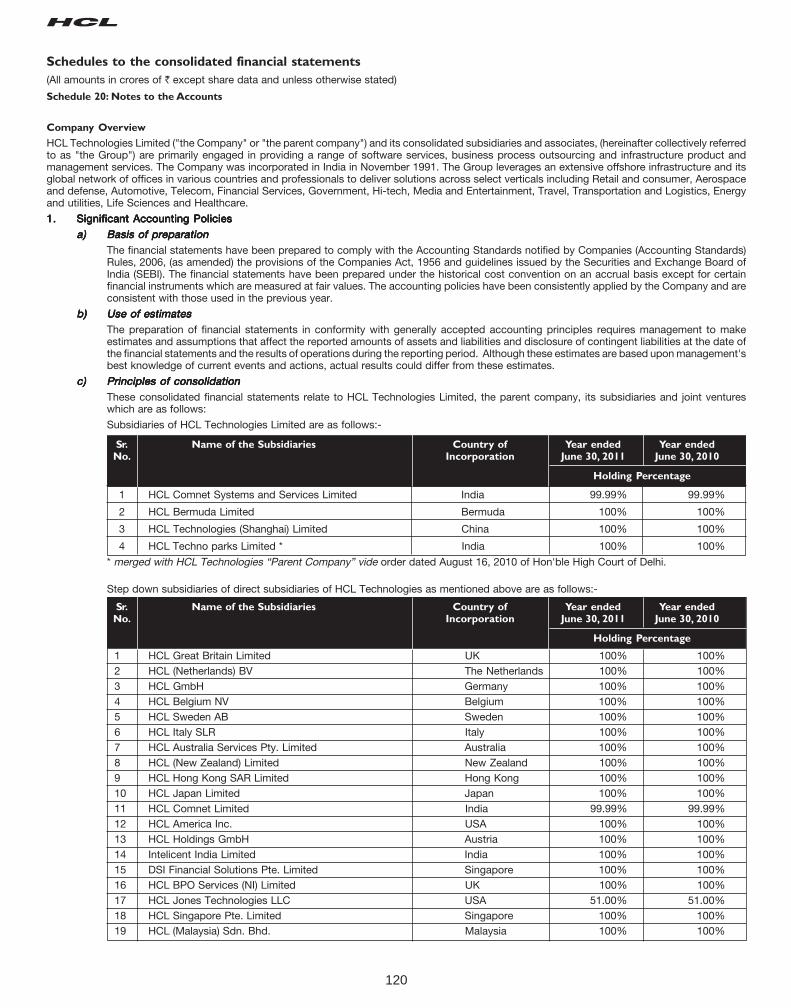
120
Schedules to the consolidated financial statements
(All amounts in crores of ` except share data and unless otherwise stated)
Schedule 20: Notes to the Accounts
Company Overview
HCL Technologies Limited ("the Company" or "the parent company") and its consolidated subsidiaries and associates, (hereinafter collectively referredto as "the Group") are primarily engaged in providing a range of software services, business process outsourcing and infrastructure product andmanagement services. The Company was incorporated in India in November 1991. The Group leverages an extensive offshore infrastructure and itsglobal network of offices in various countries and professionals to deliver solutions across select verticals including Retail and consumer, Aerospaceand defense, Automotive, Telecom, Financial Services, Government, Hi-tech, Media and Entertainment, Travel, Transportation and Logistics, Energyand utilities, Life Sciences and Healthcare.
1.1.1.1.1. Significant Accounting PoliciesSignificant Accounting PoliciesSignificant Accounting PoliciesSignificant Accounting PoliciesSignificant Accounting Policies
a)a)a)a)a) Basis of preparationBasis of preparationBasis of preparationBasis of preparationBasis of preparationThe financial statements have been prepared to comply with the Accounting Standards notified by Companies (Accounting Standards)Rules, 2006, (as amended) the provisions of the Companies Act, 1956 and guidelines issued by the Securities and Exchange Board ofIndia (SEBI). The financial statements have been prepared under the historical cost convention on an accrual basis except for certainfinancial instruments which are measured at fair values. The accounting policies have been consistently applied by the Company and areconsistent with those used in the previous year.
b)b)b)b)b) Use of estimatesUse of estimatesUse of estimatesUse of estimatesUse of estimatesThe preparation of financial statements in conformity with generally accepted accounting principles requires management to makeestimates and assumptions that affect the reported amounts of assets and liabilities and disclosure of contingent liabilities at the date ofthe financial statements and the results of operations during the reporting period. Although these estimates are based upon management'sbest knowledge of current events and actions, actual results could differ from these estimates.
c)c)c)c)c) Principles of consolidationPrinciples of consolidationPrinciples of consolidationPrinciples of consolidationPrinciples of consolidationThese consolidated financial statements relate to HCL Technologies Limited, the parent company, its subsidiaries and joint ventureswhich are as follows:
Subsidiaries of HCL Technologies Limited are as follows:-
Sr. Name of the Subsidiaries Country of Year ended Year endedNo. Incorporation June 30, 2011 June 30, 2010
Holding Percentage
1 HCL Comnet Systems and Services Limited India 99.99% 99.99%
2 HCL Bermuda Limited Bermuda 100% 100%
3 HCL Technologies (Shanghai) Limited China 100% 100%
4 HCL Techno parks Limited * India 100% 100%
* merged with HCL Technologies “Parent Company” vide order dated August 16, 2010 of Hon'ble High Court of Delhi.
Step down subsidiaries of direct subsidiaries of HCL Technologies as mentioned above are as follows:-
Sr. Name of the Subsidiaries Country of Year ended Year endedNo. Incorporation June 30, 2011 June 30, 2010
Holding Percentage
1 HCL Great Britain Limited UK 100% 100%2 HCL (Netherlands) BV The Netherlands 100% 100%3 HCL GmbH Germany 100% 100%4 HCL Belgium NV Belgium 100% 100%5 HCL Sweden AB Sweden 100% 100%6 HCL Italy SLR Italy 100% 100%7 HCL Australia Services Pty. Limited Australia 100% 100%8 HCL (New Zealand) Limited New Zealand 100% 100%9 HCL Hong Kong SAR Limited Hong Kong 100% 100%10 HCL Japan Limited Japan 100% 100%11 HCL Comnet Limited India 99.99% 99.99%12 HCL America Inc. USA 100% 100%13 HCL Holdings GmbH Austria 100% 100%14 Intelicent India Limited India 100% 100%15 DSI Financial Solutions Pte. Limited Singapore 100% 100%16 HCL BPO Services (NI) Limited UK 100% 100%17 HCL Jones Technologies LLC USA 51.00% 51.00%18 HCL Singapore Pte. Limited Singapore 100% 100%19 HCL (Malaysia) Sdn. Bhd. Malaysia 100% 100%
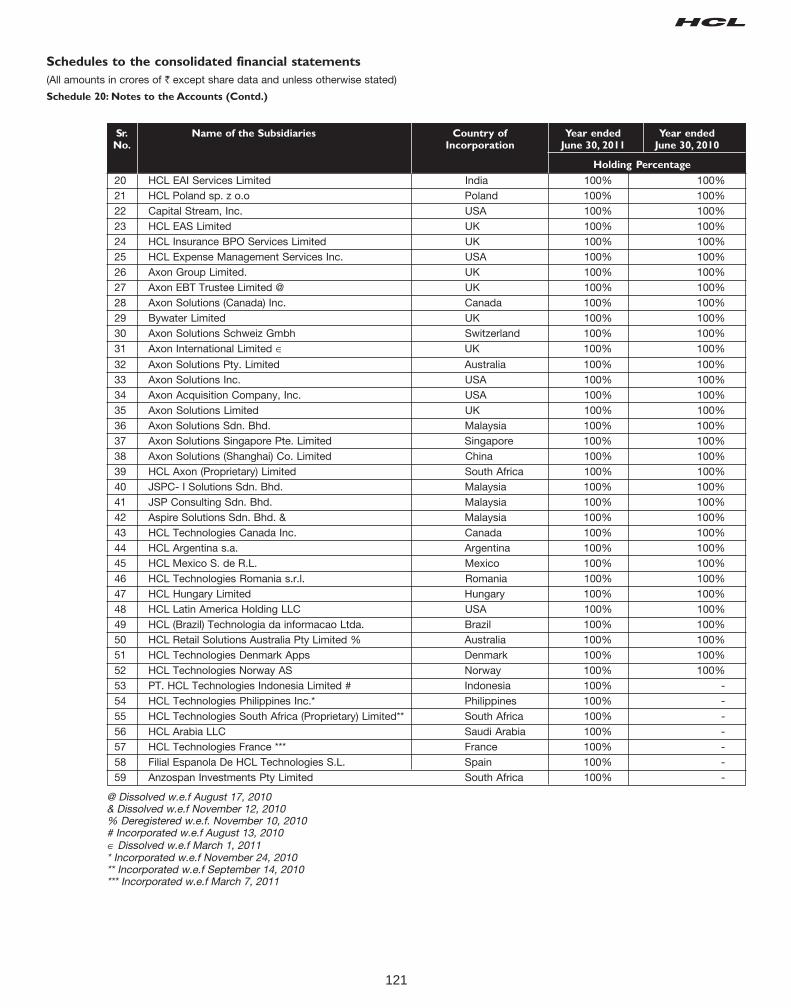
121
Schedules to the consolidated financial statements
(All amounts in crores of ` except share data and unless otherwise stated)
Schedule 20: Notes to the Accounts (Contd.)
Sr. Name of the Subsidiaries Country of Year ended Year endedNo. Incorporation June 30, 2011 June 30, 2010
Holding Percentage
20 HCL EAI Services Limited India 100% 100%21 HCL Poland sp. z o.o Poland 100% 100%22 Capital Stream, Inc. USA 100% 100%23 HCL EAS Limited UK 100% 100%24 HCL Insurance BPO Services Limited UK 100% 100%25 HCL Expense Management Services Inc. USA 100% 100%26 Axon Group Limited. UK 100% 100%27 Axon EBT Trustee Limited @ UK 100% 100%28 Axon Solutions (Canada) Inc. Canada 100% 100%29 Bywater Limited UK 100% 100%30 Axon Solutions Schweiz Gmbh Switzerland 100% 100%31 Axon International Limited ∈ UK 100% 100%
32 Axon Solutions Pty. Limited Australia 100% 100%33 Axon Solutions Inc. USA 100% 100%34 Axon Acquisition Company, Inc. USA 100% 100%35 Axon Solutions Limited UK 100% 100%36 Axon Solutions Sdn. Bhd. Malaysia 100% 100%37 Axon Solutions Singapore Pte. Limited Singapore 100% 100%38 Axon Solutions (Shanghai) Co. Limited China 100% 100%39 HCL Axon (Proprietary) Limited South Africa 100% 100%40 JSPC- I Solutions Sdn. Bhd. Malaysia 100% 100%41 JSP Consulting Sdn. Bhd. Malaysia 100% 100%42 Aspire Solutions Sdn. Bhd. & Malaysia 100% 100%43 HCL Technologies Canada Inc. Canada 100% 100%44 HCL Argentina s.a. Argentina 100% 100%45 HCL Mexico S. de R.L. Mexico 100% 100%46 HCL Technologies Romania s.r.l. Romania 100% 100%47 HCL Hungary Limited Hungary 100% 100%48 HCL Latin America Holding LLC USA 100% 100%49 HCL (Brazil) Technologia da informacao Ltda. Brazil 100% 100%50 HCL Retail Solutions Australia Pty Limited % Australia 100% 100%51 HCL Technologies Denmark Apps Denmark 100% 100%52 HCL Technologies Norway AS Norway 100% 100%53 PT. HCL Technologies Indonesia Limited # Indonesia 100% -54 HCL Technologies Philippines Inc.* Philippines 100% -55 HCL Technologies South Africa (Proprietary) Limited** South Africa 100% -56 HCL Arabia LLC Saudi Arabia 100% -57 HCL Technologies France *** France 100% -58 Filial Espanola De HCL Technologies S.L. Spain 100% -59 Anzospan Investments Pty Limited South Africa 100% -
@ Dissolved w.e.f August 17, 2010& Dissolved w.e.f November 12, 2010% Deregistered w.e.f. November 10, 2010# Incorporated w.e.f August 13, 2010∈ Dissolved w.e.f March 1, 2011* Incorporated w.e.f November 24, 2010** Incorporated w.e.f September 14, 2010*** Incorporated w.e.f March 7, 2011
122
Sr. Name of the Joint Ventures Country of Year ended Year endedNo. Incorporation June 30, 2011 June 30, 2010
Holding Percentage
1 NEC HCL System Technologies Limited. India 49% 49%
2 Axon Balance LLC # United States of America 50% 50%
3 Axon Puerto Rico Puerto Rico 49% 49%
# Dissolved w.e.f. January 18,2011
Subsidiary companies are those in which the Group, directly or indirectly, have an interest of more than one half of the voting power orotherwise has power to exercise control over the operations. Subsidiaries are consolidated from the date on which effective control istransferred to the Company until the date of cessation of the parent-subsidiary relationship. Joint ventures are accounted for usingproportionate consolidation.
All material inter company transactions, balances and unrealized surplus and deficit on transactions between Group companies areeliminated. Consistency in adoption of accounting policies among all Group companies is ensured to the extent practicable. Separatedisclosures are made of minority interest.
Investment in business entities over which the Group exercises joint control is accounted for using proportionate consolidation exceptwhere the control is considered to be temporary.
Minority interest in subsidiaries represents the minority shareholders' proportionate share of net assets and the net income of HCL'smajority owned subsidiaries.
Goodwill has been recorded to the extent that the cost of acquisition, comprising purchase consideration and transaction costs, exceedsthe book value of net assets in each acquired company. The goodwill arising on consolidation is not amortized but tested for impairmenton a periodic basis.
d)d)d)d)d) Revenue recognitionRevenue recognitionRevenue recognitionRevenue recognitionRevenue recognition
Revenue is recognized to the extent that it is probable that the economic benefits will flow to the group and the revenue can be reliablymeasured. Revenue from sale of goods and rendering of services is recognised when risk and reward of ownership has been transferredto the customer, the sale price is fixed or determinable and collectability is reasonably assured. The Group derives revenues primarilyfrom:-• Software services;• Infrastructure service; and• Business process outsourcing services.
i) Software services
Revenue from Software services comprises income from time and material and fixed price contracts. Revenue with respect to timeand material contracts is recognized as related services are performed. Revenue from fixed price contracts and fixed time framecontracts is recognized in accordance with the percentage completion method under which the sales value of performance,including earnings thereon, is recognized on the basis of cost incurred in respect of each contract as a proportion of total costexpected to be incurred. The cumulative impact of any revision in estimates of the percentage of work completed is reflected in theyear in which the change becomes known. Provisions for estimated losses are made during the year in which a loss becomesprobable based on current contract estimates. Revenue from sale of licenses for the use of software applications is recognised ontransfer of title in the user license. Revenue from annual technical service contracts is recognised on a pro rata basis over theperiod in which such services are rendered. Income from revenue sharing agreements is recognized when the right to receive isestablished.
ii) Infrastructure Services
Revenue from sale of products is recognized when risk and reward of ownership has been transferred to the customer, the salesprice is fixed or determinable and collectability is reasonably assured. Revenue from installation services is recognized wheninstallation of networking equipment at customer site is completed and accepted by the customer. Revenue from bandwidthservices is recognized upon actual usage of such services by customers based on either the time for which these service areprovided or volume of data transferred or both and excludes service tax. Revenue from maintenance services is recognized ratablyover the period of the contract. Revenue from infrastructure management services comprise income from time-and-material, andfixed price contracts. Revenue with respect to time-and-material contracts is recognized as related services are performed. Revenuewith respect to fixed price contracts is recognized in accordance with the percentage of completion method.
Warranty costs on sale of goods and services are accrued based on management estimates and historical data at the time thoserelated revenues are recognized.
Unearned income arising in respect of bandwidth services and maintenance services is calculated on the basis of unutilized periodof service at the balance sheet date and represents revenue, which is expected to be earned in future periods in respect of theseservices.
In case of multi-deliverable contracts where revenue cannot be allocated to various deliverables in a contract, the entire contractis accounted for as one deliverable and accordingly the revenue is recognized on a proportionate completion method following theperformance pattern of predominant services in the contract or is deferred until the last deliverable is delivered.
Schedules to the consolidated financial statements
(All amounts in crores of ` except share data and unless otherwise stated)
Schedule 20: Notes to the Accounts (Contd.)
123
iii) Business process outsourcing services
Revenue from business process outsourcing services is derived from both time based and unit-price contracts. Revenue is recognizedas the related services are performed in accordance with the specific terms of the contracts with the customers.
Costs and earnings in excess of billing are classified as unbilled revenue, while billing in excess of costs and earnings are classifiedas unearned revenue. Incremental revenue from existing contracts arising on future sales of the customers' products will berecognized when it is earned. Revenue and related direct costs from transition services in outsourcing arrangements are deferredand recognized over the period of the arrangement. Certain upfront non-recurring costs incurred in the initial phases of outsourcingcontracts and contract acquisition costs, are deferred and amortized usually on a straight line basis over the term of the contract.The Group periodically estimates the undiscounted cash flows from the arrangement and compares it with the unamortized costs.If the unamortized costs exceed the undiscounted cash flow, a loss is recognized.
The Group gives volume discounts and pricing incentives to customers. The discount terms in the Group's arrangements withcustomers generally entitle the customer to discounts, if the customer completes a specified level of revenue transactions. In somearrangements, the level of discount varies with increases in the levels of revenue transactions. The Group recognizes discountobligations as a reduction of revenue based on the rateable allocation of the discount to each of the underlying revenue transactionsthat result in progress by the customer toward earning the discount.
Revenues are shown net of sales tax, value added tax, service tax and applicable discounts and allowances. The revenue isrecognized net of discounts and allowances.
iv) Others
Profit on sale of Investments is recorded on transfer of title from the Group and is determined as the difference between the salesprice and the then carrying value of the investment. Interest on the deployment of surplus funds is recognized using the time-proportion method, based on interest rates implicit in the transaction. Brokerage, commission and rent are recognised once thesame are earned and accrued to the Company and dividend income is recognised when the right to receive the same is established.
e)e)e)e)e) Fixed assets, intangible assets and capital work-in-progressFixed assets, intangible assets and capital work-in-progressFixed assets, intangible assets and capital work-in-progressFixed assets, intangible assets and capital work-in-progressFixed assets, intangible assets and capital work-in-progress
Fixed assets are stated at cost less accumulated depreciation and impairment losses if any. Cost comprises the purchase price and anyattributable cost of bringing the asset to its working condition for its intended use. Fixed assets under construction, advances paidtowards acquisition of fixed assets and cost of assets not ready for use before the year-end, are disclosed as capital work in progress.Intangible assets represent goodwill which arise or have been acquired through acquisitions and software.
f)f)f)f)f) Depreciation and amortizationDepreciation and amortizationDepreciation and amortizationDepreciation and amortizationDepreciation and amortization
Depreciation on fixed assets except leasehold land and leasehold improvement is provided on the straight-line method over their estimateduseful lives, as determined by the management, at the rate which are equal to or higher than the rates prescribed under Schedule XIV ofthe Companies Act, 1956. Leasehold land is amortized over the period of lease. Leasehold improvements are amortized over a period offour years or the remaining period of the lease, whichever is shorter. Depreciation is charged on a pro-rata basis for assets purchased/sold during the year. Assets costing less than ` 5,000 are fully depreciated in the year of purchase.
Intangible assets other than goodwill acquired on consolidation are amortized over their respective individual estimated useful life or ona straight line basis.
The management's estimates of the useful life of the various fixed assets/intangibles used for depreciation are as follows:
Life (in years)
Fixed AssetsFixed AssetsFixed AssetsFixed AssetsFixed Assets
Buildings 20
Plant and machinery (including office equipment, air conditioners and electrical installations) 4 to 5
Computers 2 to 4
Furniture and fixtures 4
Vehicles - owned 5
Vehicles - leased Over the period of lease or 5 years, whichever is lower
IntangiblesIntangiblesIntangiblesIntangiblesIntangibles
Software 3
Intellectual Property Rights 10
g)g)g)g)g) Impairment of AssetsImpairment of AssetsImpairment of AssetsImpairment of AssetsImpairment of Assets
The carrying amounts of assets are reviewed at each balance sheet date if there is any indication of impairment based on internal/externalfactors. An impairment loss is recognized wherever the carrying amount of an asset exceeds its recoverable amount. The recoverableamount is the greater of the asset's net selling price and value in use. In assessing value in use, the estimated future cash flows arediscounted to their present value using a pre-tax discount rate that reflects current market assessments of the time value of money andrisks specific to the asset.
Schedules to the consolidated financial statements
(All amounts in crores of ` except share data and unless otherwise stated)
Schedule 20: Notes to the Accounts (Contd.)
124
h)h)h)h)h) LeasesLeasesLeasesLeasesLeases
Where the Company is the lesseeWhere the Company is the lesseeWhere the Company is the lesseeWhere the Company is the lesseeWhere the Company is the lessee
Finance leases, which effectively transfer to the Company substantially all the risks and benefits incidental to ownership of the leaseditem, are capitalized at the lower of the fair value and present value of the minimum lease payments at the inception of the lease term anddisclosed as leased assets. Lease payments are apportioned between the finance charges and reduction of the lease liability based onthe implicit rate of return. Finance charges are charged directly against income.
Leases where the lessor effectively retains substantially all the risks and benefits of ownership of the leased item, are classified asoperating leases. Operating lease payments are recognized as an expense in the Profit and Loss account on a straight-line basis over thelease term.
Where the Company is the lessorWhere the Company is the lessorWhere the Company is the lessorWhere the Company is the lessorWhere the Company is the lessor
Assets given under a finance lease are recognised as a receivable at an amount equal to the net investment in the lease. Lease rentals areapportioned between principal and interest. The principal amount received reduces the net investment in the lease and interest is recognisedas revenue.
Assets subject to operating leases are included in fixed assets. Lease income is recognised in the Profit and Loss Account on a straight-line basis over the lease term. Costs, including depreciation are recognised as an expense in the Profit and Loss Account.
i)i)i)i)i) InvestmentsInvestmentsInvestmentsInvestmentsInvestments
Trade investments are the investments made to enhance the Group's business interests. Investments that are readily realisable andintended to be held for not more than a year are classified as current investments. All other investments are classified as long-terminvestments. Current investments are carried at lower of cost and fair value determined on an individual investment basis. Long-terminvestments are carried at cost. However, provision for diminution in value is made to recognise a decline other than temporary in thevalue of the long term investments.
j)j)j)j)j) Foreign currency translationForeign currency translationForeign currency translationForeign currency translationForeign currency translation
(i) Initial RecognitionForeign currency transactions are recorded in the reporting currency, by applying to the foreign currency amount the exchangerate between the reporting currency and the foreign currency at the date of the transaction.
(ii) ConversionForeign currency monetary items are reported using the closing rate. Non-monetary items which are carried in terms of historicalcost denominated in a foreign currency are reported using the exchange rate at the date of the transaction.
(iii) Exchange DifferencesExchange differences arising on the settlement of monetary items, or on reporting such monetary items of Group at rates differentfrom those at which they were initially recorded during the year, or reported in previous financial statements, are recognized asincome or as expenses in the year in which they arise.
(iv) Hedging
(a) Cash flow hedgingThe Group uses derivative financial instruments (foreign currency forward and option contracts) to hedge its risks associatedwith foreign currency fluctuations relating to certain forecasted transactions.
The use of foreign currency forward and options contracts is governed by the Group's policies, which provide writtenprinciples on the use of such financial derivatives consistent with the Group's risk management strategy. The Group doesnot use derivative financial instruments for speculative purposes.
The derivative instruments are initially measured at fair value, and are remeasured at subsequent reporting dates.
In respect of derivatives designated as hedges, the Group formally documents all relationships between hedging instrumentsand hedged items, as well as its risk management objective and strategy for undertaking various hedge transactions. TheGroup also formally assesses both at the inception of the hedge and on an ongoing basis, whether each derivative is highlyeffective in offsetting changes in fair values or cash flows of the hedged item. Changes in the fair value of these derivatives(net of tax) that are designated and effective as hedges of future cash flows are recognised directly in Hedging ReserveAccount under shareholders’ funds and the ineffective portion is recognized immediately in profit and loss account. Changesin the fair value of derivative financial instruments that do not qualify for hedge accounting are recognized in profit and lossaccount as they arise.
Hedge accounting is discontinued from the last testing date when the hedging instrument expires or is sold, terminated, orexercised, or no longer qualifies for hedge accounting. Cumulative gain or loss on such hedging instrument recognised inshareholder's funds is retained there until the forecasted transaction occurs. If a hedged transaction is no longer expectedto occur, the net cumulative gain or loss recognised in shareholders' funds is transferred to profit and loss account for theyear.
(b) Hedging of monetary assets and liabilitiesThe premium or discount arising at the inception of forward exchange contracts and option is amortised as expense orincome over the life of the contract. Exchange differences on such contracts are recognised in the statement of profit and
Schedules to the consolidated financial statements
(All amounts in crores of ` except share data and unless otherwise stated)
Schedule 20: Notes to the Accounts (Contd.)
125
loss in the year in which the exchange rates change. Any profit or loss arising on cancellation or renewal of forward exchangecontract is recognised as income or as expense for the year.
(v) Translation of Integral and Non-integral foreign operationThe financial statements of an integral foreign operation are translated as if the transactions of the foreign operation have beenthose of the Group itself.
In translating the financial statements of a non-integral foreign operation for incorporation in financial statements, the assets andliabilities, both monetary and non-monetary, of the non-integral foreign operation are translated at the closing rate; income andexpense items of the non-integral foreign operation are translated at monthly weighted average rates,which approximate theactual exchange rates; and all resulting exchange differences are accumulated in a foreign currency translation reserve until thedisposal of the net investment.
On the disposal of a non-integral foreign operation, the cumulative amount of the exchange differences which have been deferredand which relate to that operation are recognised as income or as expenses in the same period in which the gain or loss ondisposal is recognised.
k)k)k)k)k) InventoryInventoryInventoryInventoryInventory
Finished goods are valued at lower of the cost or net realizable value. Net realizable value is the estimated selling price in the ordinarycourse of business, less estimated costs of completion and estimated costs necessary to make the sale. Cost of goods that are procuredfor specific projects is assigned by specific identification of their individual costs. Costs of goods that are interchangeable and notspecific to any project is determined using weighted average cost formula. Stores and spare parts are carried at cost, less provision forobsolescence.
l)l)l)l)l) Employee stock compensation costEmployee stock compensation costEmployee stock compensation costEmployee stock compensation costEmployee stock compensation cost
The Group calculates the compensation cost based on the intrinsic value method wherein the excess of market price of underlying equityshares on the date of the grant of the options over the exercise price of the options given to the employees under the employee stockoption schemes of the Company, is recognized as deferred stock compensation cost and is amortized on graded vesting basis over thevesting period of the options.
m)m)m)m)m) TaxationTaxationTaxationTaxationTaxation
Tax expense comprises current and deferred tax. Current income tax expense comprises taxes on income from operations in India andin foreign jurisdictions. Income tax payable in India is determined in accordance with the provisions of the Income Tax Act, 1961 and taxexpense relating to overseas operations is determined in accordance with tax laws applicable in countries where such operations aredomiciled.
Deferred tax expense or benefit is recognised on timing differences being the difference between taxable income and accounting incomethat originate in one period and are capable of reversal in one or more subsequent periods.
Deferred tax assets and liabilities are measured using the tax rates and tax laws that have been enacted or substantively enacted by thebalance sheet date. Deferred tax assets and deferred tax liabilities are offset, if a legally enforceable right exists to set off current taxassets against current tax liabilities and the deferred tax assets and deferred tax liabilities relate to the taxes on income levied by thesame governing taxation laws.
Deferred tax assets are recognised only to the extent that there is reasonable certainty that sufficient future taxable income will beavailable against which such deferred tax assets can be realised. In situations where the Company has unabsorbed depreciation or carryforward tax losses, all deferred tax assets are recognised only if there is virtual certainty supported by convincing evidence that they canbe realised against future taxable profits.
At each balance sheet date the Company re-assesses recognized and unrecognised deferred tax assets. The Company writes-down thecarrying amount of a deferred tax asset to the extent that it is no longer reasonably certain or virtually certain, as the case may be, thatsufficient future taxable income will be available against which the deferred tax asset can be realised. Any such write-down is reversed tothe extent that it becomes reasonably certain or virtually certain, as the case may be, that sufficient future taxable income will beavailable. The Company recognizes unrecognized deferred tax assets to the extent that it has become reasonably certain or virtuallycertain, as the case may be, that sufficient future taxable income will be available against which such deferred tax assets can be realised.
Minimum Alternate Tax (MAT) credit is recognised as an asset only when and to the extent there is convincing evidence that the Companywill pay normal income tax during the specified period. In the year in which the MAT credit becomes eligible to be recognized as an assetin accordance with the recommendations contained in guidance note issued by the Institute of Chartered Accountants of India, the saidasset is created by way of a credit to the profit and loss account and shown as MAT Credit Entitlement. The Company reviews the sameat each balance sheet date and writes down the carrying amount of MAT Credit Entitlement to the extent there is no longer convincingevidence to the effect that Company will pay normal income tax during the specified period.
n)n)n)n)n) Employee benefitsEmployee benefitsEmployee benefitsEmployee benefitsEmployee benefits
IndiaIndiaIndiaIndiaIndia
i. Contributions to provident fund, a defined benefit plan, are deposited with a Recognised Provident Fund Trust, set up by theCompany. The contributions are charged to the profit and loss account of the year when the contributions to the fund are due. Theinterest rate payable by the trust to the beneficiaries every year is notified by the government and the company has an obligationto make good the shortfall, if any, between the return from the investments of the trust and the notified interest rate.
Schedules to the consolidated financial statements
(All amounts in crores of ` except share data and unless otherwise stated)
Schedule 20: Notes to the Accounts (Contd.)
126
ii. The Company made contributions to a scheme administered by an insurance company in respect of superannuation for applicableemployees and such contributions are charged to profit and loss account. The Company had no further obligations to thesuperannuation plan beyond its contributions.
iii. Gratuity liability is a defined benefit obligation and are provided for on the basis of an actuarial valuation on projected unit methodmade at the end of each financial year.
iv. Short term compensated absences are provided for based on estimates. Long term compensated absences are provided forbased on actuarial valuation at the year end. The actuarial valuation is done as per projected unit credit method.
v. Actuarial gains/losses are immediately taken to profit and loss account and are not deferred.
vi. State Plans : The Company's contribution to State Plans namely Employee State Insurance Fund and Employees Pension Schemeare charged to profit and loss account every year, when the contributions are due.
Subsidiaries in the USSubsidiaries in the USSubsidiaries in the USSubsidiaries in the USSubsidiaries in the US
The Company has a saving and investment plan under section 401(k) of the Internal Revenue Code of the United States of America. Thisis a defined contribution plan. Contributions are charged to income in the period in which they accrue.
Subsidiaries in EuropeSubsidiaries in EuropeSubsidiaries in EuropeSubsidiaries in EuropeSubsidiaries in Europe
The Company contributes towards pension plans of the various governments for the employees of its subsidiaries in United Kingdom,Sweden, Netherlands, Belgium, Germany and Northern Ireland.
Subsidiaries in AustraliaSubsidiaries in AustraliaSubsidiaries in AustraliaSubsidiaries in AustraliaSubsidiaries in Australia
As per local laws of Australia, employers must provide a minimum level of superannuation for most employees or incur a non-taxdeductible superannuation guarantee charge including interest and penalties. The required level of employer superannuation contributionis a percentage of the employee's earnings base. The Company contributes to a fund approved by the Government of Australia.
Subsidiaries in Malaysia and SingaporeSubsidiaries in Malaysia and SingaporeSubsidiaries in Malaysia and SingaporeSubsidiaries in Malaysia and SingaporeSubsidiaries in Malaysia and Singapore
As per local laws of Malaysia and Singapore, employers are required to contribute up to 13% of the basic salary of the employees. TheCompany contributes to a fund approved by the Government of the Country.
o)o)o)o)o) Research and developmentResearch and developmentResearch and developmentResearch and developmentResearch and development
Research costs are expensed as incurred. Development expenditure incurred on an individual project is recognized as an intangibleasset when the Group can demonstrate:
(i) The technical feasibility of completing the intangible asset so that it will be available for use or sale;
(ii) Its intention to complete the asset and use or sell it;
(iii) its ability to use or sell the asset;
(iv) how the asset will generate probable future economic benefits;
(v) the availability of adequate resources to complete the development and to use or sell the asset; and
(vi) the ability to measure reliably the expenditure attributable to the intangible asset during development.
Any expenditure so capitalized is amortised over the period of expected future sales from the related project.
The carrying value of development costs is reviewed for impairment annually when the asset is not yet in use, and otherwise when eventsor changes in circumstances indicate that the carrying value may not be recoverable.
p)p)p)p)p) Earnings per shareEarnings per shareEarnings per shareEarnings per shareEarnings per share
Basic earnings per share are calculated by dividing the net profit or loss for the period attributable to equity shareholders by the weightedaverage number of equity shares outstanding during the period.
For the purpose of calculating diluted earnings per share, the net profit or loss for the period attributable to equity shareholders and theweighted average number of shares outstanding during the period are adjusted for the effects of all dilutive potential equity shares.
q)q)q)q)q) Borrowing costBorrowing costBorrowing costBorrowing costBorrowing cost
Borrowing costs directly attributable to the acquisition, construction or production of an asset that necessarily takes a substantial periodof time to get ready for its intended use or sale are capitalized as part of the cost of the respective asset. All other borrowing costs areexpensed in the period they occur. Borrowing costs consist of interest and other costs that the Group incurs in connection with theborrowing of funds.
r)r)r)r)r) ProvisionsProvisionsProvisionsProvisionsProvisions
A provision is recognised when there exists a present obligation as a result of past events and it is probable that an outflow of resourceswill be required to settle the obligation, in respect of which a reliable estimate can be made. Provisions are not discounted to presentvalue and are determined based on best estimate required to settle the obligation at the balance sheet date. These are reviewed at eachbalance sheet date and adjusted to reflect the current best estimates.
Schedules to the consolidated financial statements
(All amounts in crores of ` except share data and unless otherwise stated)
Schedule 20: Notes to the Accounts (Contd.)
127
s)s)s)s)s) Cash and cash equivalentCash and cash equivalentCash and cash equivalentCash and cash equivalentCash and cash equivalent
Cash and cash equivalents for the purposes of cash flow statement comprise cash at bank and in hand and deposits with banks with anoriginal maturity of three months or less.
2.2.2.2.2. Acquisitions / SaleAcquisitions / SaleAcquisitions / SaleAcquisitions / SaleAcquisitions / Sale
A.A.A.A.A. Current year sale / acquisitionsCurrent year sale / acquisitionsCurrent year sale / acquisitionsCurrent year sale / acquisitionsCurrent year sale / acquisitions
a)a)a)a)a) Telecom Expense Management ServicesTelecom Expense Management ServicesTelecom Expense Management ServicesTelecom Expense Management ServicesTelecom Expense Management Services
The Group has sold certain portion of its Telecom Expense Management Services business for cash consideration of ` 14.32crores ($3.24 Mn) and recorded a gain of ` 2.02 crores ($0.45 Mn) in other income during the year ended June 30, 2011.
b)b)b)b)b) Citibank International Plc.Citibank International Plc.Citibank International Plc.Citibank International Plc.Citibank International Plc.
In January 2011, the Group, acquired certain software assets and employees of Citi Securities and Fund Services for a total cashconsideration of ` 59.08 crores and deferred consideration of ` 50.90 crores payable after one year from the date of acquisition.The transaction has been accounted by following the purchase method and resulted in goodwill aggregating to ` 100.76 croresand intangibles of ` 9.22 crores. The goodwill has been allocated to software segment.
B.B.B.B.B. Previous year acquisitionsPrevious year acquisitionsPrevious year acquisitionsPrevious year acquisitionsPrevious year acquisitions
a)a)a)a)a) UCS Solutions holding (Pty) LimitedUCS Solutions holding (Pty) LimitedUCS Solutions holding (Pty) LimitedUCS Solutions holding (Pty) LimitedUCS Solutions holding (Pty) Limited
On August 1, 2009, the Group, through its subsidiary, acquired Enterprise Solution SAP practice of UCS Group in South Africa fora cash consideration of ` 38.43 Crores (ZAR 57.13mn) and ` 44.13 crores as earn out payable on achieving specified targets overthe next 2 years. The transaction has been accounted by following the purchase method and resulted in goodwill aggregating to` 82.37 Crores. The goodwill has been allocated to software segment. During the year ended June 30, 2011 ` 10.00 crores havebeen paid on achieving the specified targets.
b)b)b)b)b) RKV TechnologiesRKV TechnologiesRKV TechnologiesRKV TechnologiesRKV Technologies
On March 31, 2010, the Group through its subsidiary, acquired unemployment Insurance Practice for a total cash consideration of` 22.17 crores (USD 5mn). The transaction has been accounted by following the purchase method and resulted in goodwill aggregatingto ` 23.20 crores. The goodwill has been allocated to software segment.
3.3.3.3.3. Employee Stock Option Plan (ESOP)Employee Stock Option Plan (ESOP)Employee Stock Option Plan (ESOP)Employee Stock Option Plan (ESOP)Employee Stock Option Plan (ESOP)
The Group has provided various share-based payment schemes to its employees. During the year ended 30 June 2011, the following schemeswere in operation:
ESOP 1999 ESOP 2000 ESOP 2004
Number of options granted 20,000,000 15,000,000 20,000,000
Method of Settlement (Cash/Equity) Equity Equity Equity
Vesting Period (Maximum) 110 months 104 months 96 months
Exercise Period from the date of vesting (maximum) 5 years 5 years 5 years
Vesting Conditions Service Period Service Period Service Period /Company
Performance
During the year ended 30 June 2010, the following schemes were in operation:
ESOP 1999 ESOP 2000 ESOP 2004
Number of options granted 20,000,000 15,000,000 20,000,000
Method of Settlement (Cash/Equity) Equity Equity Equity
Vesting Period (Maximum) 110 months 104 months 84 months
Exercise Period from the date of vesting (maximum) 5 years 5 years 5 years
Vesting Conditions Service Period Service Period Service Period
Each option granted under the above plans entitles the holder to four equity shares of the Company at an exercise price, which is approved bythe Compensation Committee.
Schedules to the consolidated financial statements
(All amounts in crores of ` except share data and unless otherwise stated)
Schedule 20: Notes to the Accounts (Contd.)
128
The details of activity under various plans have been summarized below:-
ESOP 1999 Year ended 30 June
2011 2010
No. of options Weighted No. of options Weighted
average average
exercise price exercise price
(`) (`)
Outstanding at the beginning of the year 1,522,857 753.56 2,399,885 765.33
Add: Granted during the year - - - -
Less: Forfeited during the year (1,610) 704.04 (420) 636.00
Exercised during the year (517,161) 778.46 (588,774) 730.38
Expired during the year (258,139) 1,000.38 (287,834) 899.31
Options outstanding at the end of the year 745,947 745,947 745,947 745,947 745,947 650.99 650.99 650.99 650.99 650.99 1,522,8571,522,8571,522,8571,522,8571,522,857 753.56753.56753.56753.56753.56
Options exercisable at the end of the year 745,947745,947745,947745,947745,947 1,522,8571,522,8571,522,8571,522,8571,522,857
The weighted average share price for stock options exercised during the year was ` 1,775.90.
ESOP 2000ESOP 2000ESOP 2000ESOP 2000ESOP 2000 Year ended 30 June
2011 2010
No. of options Weighted No. of options Weighted
average average
exercise price exercise price
(`) (`)
Outstanding at the beginning of the year 2,351,180 649.20 3,473,285 649.37
Add: Granted during the year - - - -
Less: Forfeited during the year (1,800) 636.00 (1,100) 525.55
Exercised during the year (727,283) 655.42 (922,102) 619.63
Expired during the year (137,438) 900.09 (198,903) 789.97
Options outstanding at the end of the year 1,484,6591,484,6591,484,6591,484,6591,484,659 622.94 622.94 622.94 622.94 622.94 2,351,1802,351,1802,351,1802,351,1802,351,180 649.20649.20649.20649.20649.20
Options exercisable at the end of the year 1,484,6591,484,6591,484,6591,484,6591,484,659 2,351,1802,351,1802,351,1802,351,1802,351,180
The weighted average share price for stock options exercised during the year was ` 1,835.43
ESOP 2004 Year ended 30 June
2011 2010
No. of options Weighted No. of options Weighted
average average
exercise price exercise price
(`) (`)
Outstanding at the beginning of the year 2,079,112 33.34 2,545,431 39.21
Add: Granted during the year 3,194,000 8.00 240,000 8.00
Less: Forfeited during the year (111,150) 8.00 (57,925) 20.65
Exercised during the year (1,231,734) 21.38 (620,927) 37.20
Expired during the year (1,553) 8.94 (27,467) 294.97
Options outstanding at the end of the year 3,928,6753,928,6753,928,6753,928,6753,928,675 17.22 17.22 17.22 17.22 17.22 2,079,1122,079,1122,079,1122,079,1122,079,112 33.3433.3433.3433.3433.34
Options exercisable at the end of the year 799,525799,525799,525799,525799,525 679,935679,935679,935679,935679,935
The weighted average share price for stock options exercised during the year was ` 1,840.81
Schedules to the consolidated financial statements
(All amounts in crores of ` except share data and unless otherwise stated)
Schedule 20: Notes to the Accounts (Contd.)
129
The details of exercise price for stock options outstanding at the end of the year 30 June 2011 are:
Name of the Plan Range of exercise Number of options Weighted average Weighted
prices outstanding remaining average
contractual life of exercise
options (in years) price(`)
Employee Stock Option Plan - 1999Employee Stock Option Plan - 1999Employee Stock Option Plan - 1999Employee Stock Option Plan - 1999Employee Stock Option Plan - 1999 ` 240 - ` 750 7,45,947 2.39 650.99
Employee Stock Option Plan - 2000Employee Stock Option Plan - 2000Employee Stock Option Plan - 2000Employee Stock Option Plan - 2000Employee Stock Option Plan - 2000 ` 260 - ` 470 60,556 0.73 405.34` 483 - ` 823 14,24,103 2.13 632.20
Employee Stock Option Plan - 2004Employee Stock Option Plan - 2004Employee Stock Option Plan - 2004Employee Stock Option Plan - 2004Employee Stock Option Plan - 2004 ` 8.00 3,875,763 6.99 8.00 ` 642 - ` 741 52,912 2.22 692.33
The details of exercise price for stock options outstanding at the end of the year 30 June 2010 are:
NName of the Plan Range of exercise Number of options Weighted average Weighted
prices outstanding remaining average
contractual life of exercise
options (in years) price(`)
Employee Stock Option Plan - 1999Employee Stock Option Plan - 1999Employee Stock Option Plan - 1999Employee Stock Option Plan - 1999Employee Stock Option Plan - 1999 ` 240 - ` 750 1,082,747 3.34 648.97` 985 - ` 2,444 440,110 0.10 1,010.87
Employee Stock Option Plan - 2000Employee Stock Option Plan - 2000Employee Stock Option Plan - 2000Employee Stock Option Plan - 2000Employee Stock Option Plan - 2000 ` 260 - ` 470 109,880 1.50 406.30` 483 - ` 823 2,109,285 3.14 629.34
` 1,016 - ` 1,312 132,015 0.59 1,168.72
Employee Stock Option Plan - 2004Employee Stock Option Plan - 2004Employee Stock Option Plan - 2004Employee Stock Option Plan - 2004Employee Stock Option Plan - 2004 ` 8.00 2,001,617 4.85 8.00` 642 - ` 741 77,495 3.32 687.87
The weighted average fair value of stock options granted during the year was ` 1,309.65. The Black Scholes valuation model has been used forcomputing the weighted average fair value considering the following inputs:
ParticularsParticularsParticularsParticularsParticulars Year ended 30 June
2011 2010
Weighted average share price 356.25 288.94
Exercise Price ` 2.00 ` 2.00
Expected Volatility 40.93% 37.76%
Historical Volatility 40.93% 37.76%
Life of the options granted (Vesting and exercise period) in years 1.20 - 7.96 years 1.02 - 5.01 years
Expected dividends ` 8 ` 4
Average risk-free interest rate 7.78% 7.00%
Expected dividend rate 1.52% 1.38%
The expected volatility was determined based on historical volatility data.
Schedules to the consolidated financial statements
(All amounts in crores of ` except share data and unless otherwise stated)
Schedule 20: Notes to the Accounts (Contd.)
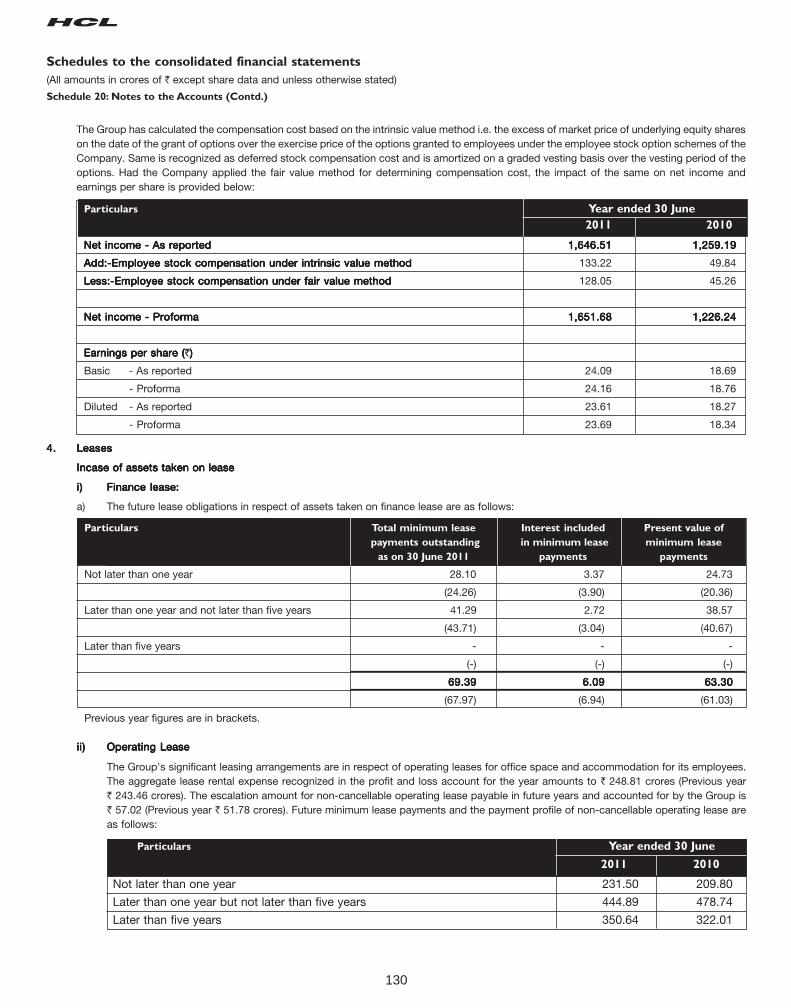
130
The Group has calculated the compensation cost based on the intrinsic value method i.e. the excess of market price of underlying equity shareson the date of the grant of options over the exercise price of the options granted to employees under the employee stock option schemes of theCompany. Same is recognized as deferred stock compensation cost and is amortized on a graded vesting basis over the vesting period of theoptions. Had the Company applied the fair value method for determining compensation cost, the impact of the same on net income andearnings per share is provided below:
Particulars Year ended 30 June
2011 2010
Net income - As reportedNet income - As reportedNet income - As reportedNet income - As reportedNet income - As reported 1,646.511,646.511,646.511,646.511,646.51 1,259.191,259.191,259.191,259.191,259.19
Add:-Employee stock compensation under intrinsic value methodAdd:-Employee stock compensation under intrinsic value methodAdd:-Employee stock compensation under intrinsic value methodAdd:-Employee stock compensation under intrinsic value methodAdd:-Employee stock compensation under intrinsic value method 133.22 49.84
Less:-Employee stock compensation under fair value methodLess:-Employee stock compensation under fair value methodLess:-Employee stock compensation under fair value methodLess:-Employee stock compensation under fair value methodLess:-Employee stock compensation under fair value method 128.05 45.26
Net income - ProformaNet income - ProformaNet income - ProformaNet income - ProformaNet income - Proforma 1,651.681,651.681,651.681,651.681,651.68 1,226.241,226.241,226.241,226.241,226.24
Earnings per share (Earnings per share (Earnings per share (Earnings per share (Earnings per share (`)))))
Basic - As reported 24.09 18.69
- Proforma 24.16 18.76
Diluted - As reported 23.61 18.27
- Proforma 23.69 18.34
Schedules to the consolidated financial statements
(All amounts in crores of ` except share data and unless otherwise stated)
Schedule 20: Notes to the Accounts (Contd.)
4.4.4.4.4. LeasesLeasesLeasesLeasesLeases
Incase of assets taken on leaseIncase of assets taken on leaseIncase of assets taken on leaseIncase of assets taken on leaseIncase of assets taken on lease
i)i)i)i)i) Finance lease:Finance lease:Finance lease:Finance lease:Finance lease:
a) The future lease obligations in respect of assets taken on finance lease are as follows:
Particulars Total minimum lease Interest included Present value of
payments outstanding in minimum lease minimum lease
as on 30 June 2011 payments payments
Not later than one year 28.10 3.37 24.73
(24.26) (3.90) (20.36)
Later than one year and not later than five years 41.29 2.72 38.57
(43.71) (3.04) (40.67)
Later than five years - - -
(-) (-) (-)
69.3969.3969.3969.3969.39 6.096.096.096.096.09 63.3063.3063.3063.3063.30
(67.97) (6.94) (61.03)
Previous year figures are in brackets.
iiiiii)i)i)i)i) Operating LeaseOperating LeaseOperating LeaseOperating LeaseOperating Lease
The Group's significant leasing arrangements are in respect of operating leases for office space and accommodation for its employees.The aggregate lease rental expense recognized in the profit and loss account for the year amounts to ` 248.81 crores (Previous year` 243.46 crores). The escalation amount for non-cancellable operating lease payable in future years and accounted for by the Group is` 57.02 (Previous year ` 51.78 crores). Future minimum lease payments and the payment profile of non-cancellable operating lease areas follows:
Particulars Year ended 30 June
2011 2010
Not later than one year 231.50 209.80
Later than one year but not later than five years 444.89 478.74
Later than five years 350.64 322.01
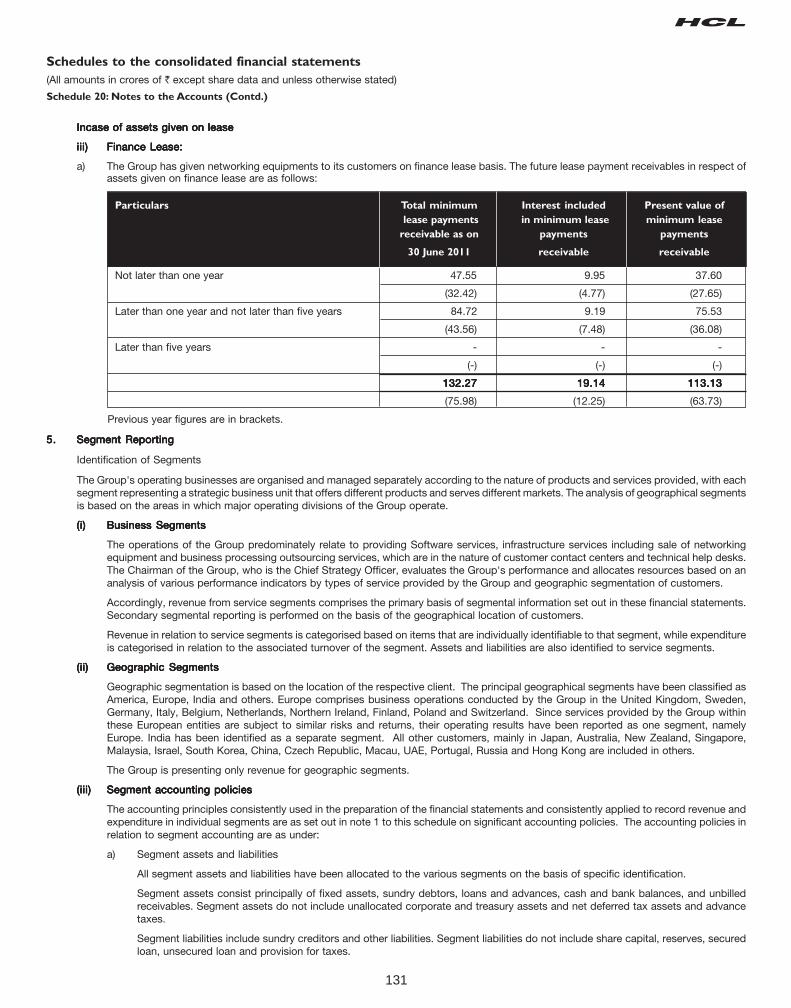
131
Particulars Total minimum Interest included Present value of
lease payments in minimum lease minimum lease
receivable as on payments payments
30 June 2011 receivable receivable
Not later than one year 47.55 9.95 37.60
(32.42) (4.77) (27.65)
Later than one year and not later than five years 84.72 9.19 75.53
(43.56) (7.48) (36.08)
Later than five years - - -
(-) (-) (-)
132.27132.27132.27132.27132.27 19.1419.1419.1419.1419.14 113.13113.13113.13113.13113.13
(75.98) (12.25) (63.73)
Previous year figures are in brackets.
5.5.5.5.5. Segment ReportingSegment ReportingSegment ReportingSegment ReportingSegment Reporting
Identification of Segments
The Group's operating businesses are organised and managed separately according to the nature of products and services provided, with eachsegment representing a strategic business unit that offers different products and serves different markets. The analysis of geographical segmentsis based on the areas in which major operating divisions of the Group operate.
(i)(i)(i)(i)(i) Business SegmentsBusiness SegmentsBusiness SegmentsBusiness SegmentsBusiness Segments
The operations of the Group predominately relate to providing Software services, infrastructure services including sale of networkingequipment and business processing outsourcing services, which are in the nature of customer contact centers and technical help desks.The Chairman of the Group, who is the Chief Strategy Officer, evaluates the Group's performance and allocates resources based on ananalysis of various performance indicators by types of service provided by the Group and geographic segmentation of customers.
Accordingly, revenue from service segments comprises the primary basis of segmental information set out in these financial statements.Secondary segmental reporting is performed on the basis of the geographical location of customers.
Revenue in relation to service segments is categorised based on items that are individually identifiable to that segment, while expenditureis categorised in relation to the associated turnover of the segment. Assets and liabilities are also identified to service segments.
(ii)(ii)(ii)(ii)(ii) Geographic SegmentsGeographic SegmentsGeographic SegmentsGeographic SegmentsGeographic Segments
Geographic segmentation is based on the location of the respective client. The principal geographical segments have been classified asAmerica, Europe, India and others. Europe comprises business operations conducted by the Group in the United Kingdom, Sweden,Germany, Italy, Belgium, Netherlands, Northern Ireland, Finland, Poland and Switzerland. Since services provided by the Group withinthese European entities are subject to similar risks and returns, their operating results have been reported as one segment, namelyEurope. India has been identified as a separate segment. All other customers, mainly in Japan, Australia, New Zealand, Singapore,Malaysia, Israel, South Korea, China, Czech Republic, Macau, UAE, Portugal, Russia and Hong Kong are included in others.
The Group is presenting only revenue for geographic segments.
(iii)(iii)(iii)(iii)(iii) Segment accounting policiesSegment accounting policiesSegment accounting policiesSegment accounting policiesSegment accounting policies
The accounting principles consistently used in the preparation of the financial statements and consistently applied to record revenue andexpenditure in individual segments are as set out in note 1 to this schedule on significant accounting policies. The accounting policies inrelation to segment accounting are as under:
a) Segment assets and liabilities
All segment assets and liabilities have been allocated to the various segments on the basis of specific identification.
Segment assets consist principally of fixed assets, sundry debtors, loans and advances, cash and bank balances, and unbilledreceivables. Segment assets do not include unallocated corporate and treasury assets and net deferred tax assets and advancetaxes.
Segment liabilities include sundry creditors and other liabilities. Segment liabilities do not include share capital, reserves, securedloan, unsecured loan and provision for taxes.
Incase of assets given on leaseIncase of assets given on leaseIncase of assets given on leaseIncase of assets given on leaseIncase of assets given on lease
iii)iii)iii)iii)iii) Finance Lease:Finance Lease:Finance Lease:Finance Lease:Finance Lease:
a) The Group has given networking equipments to its customers on finance lease basis. The future lease payment receivables in respect ofassets given on finance lease are as follows:
Schedules to the consolidated financial statements
(All amounts in crores of ` except share data and unless otherwise stated)
Schedule 20: Notes to the Accounts (Contd.)
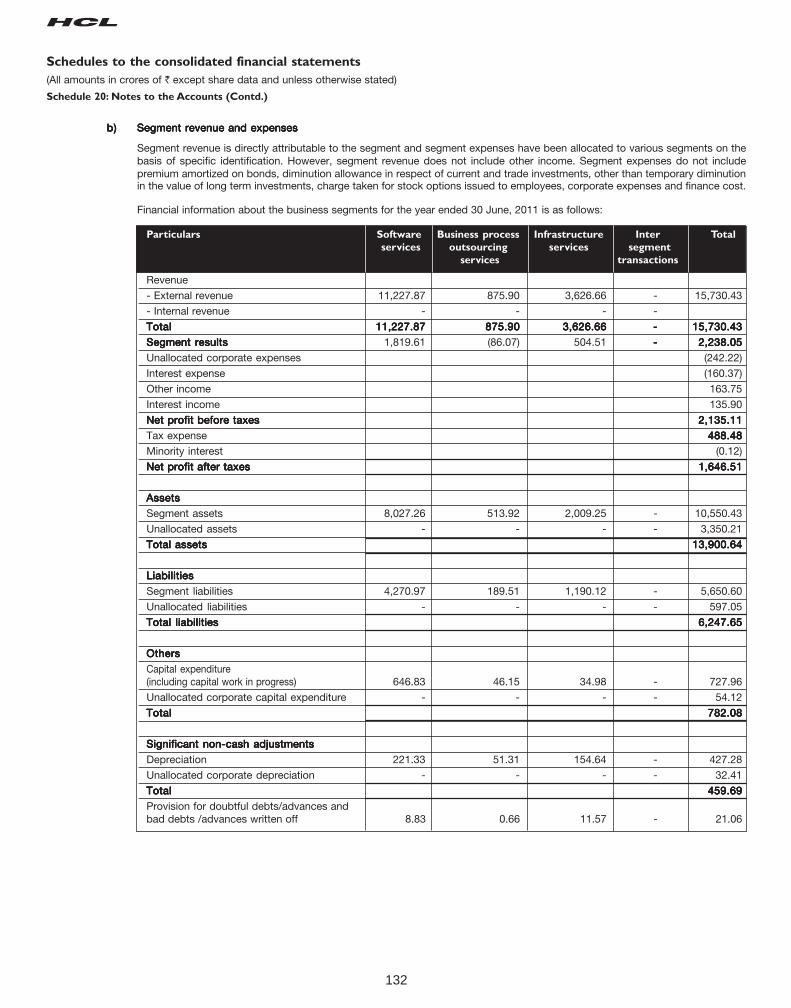
132
Particulars Software Business process Infrastructure Inter Total
services outsourcing services segment
services transactions
Revenue
- External revenue 11,227.87 875.90 3,626.66 - 15,730.43
- Internal revenue - - - -
TotalTotalTotalTotalTotal 11,227.8711,227.8711,227.8711,227.8711,227.87 875.90875.90875.90875.90875.90 3,626.663,626.663,626.663,626.663,626.66 ----- 15,730.4315,730.4315,730.4315,730.4315,730.43
Segment resultsSegment resultsSegment resultsSegment resultsSegment results 1,819.61 (86.07) 504.51 ----- 2,238.052,238.052,238.052,238.052,238.05
Unallocated corporate expenses (242.22)
Interest expense (160.37)
Other income 163.75
Interest income 135.90
Net profit before taxesNet profit before taxesNet profit before taxesNet profit before taxesNet profit before taxes 2,135.112,135.112,135.112,135.112,135.11
Tax expense 488.48488.48488.48488.48488.48
Minority interest (0.12)
Net profit after taxesNet profit after taxesNet profit after taxesNet profit after taxesNet profit after taxes 1,646.511,646.511,646.511,646.511,646.51
AssetsAssetsAssetsAssetsAssets
Segment assets 8,027.26 513.92 2,009.25 - 10,550.43
Unallocated assets - - - - 3,350.21
Total assetsTotal assetsTotal assetsTotal assetsTotal assets 13,900.6413,900.6413,900.6413,900.6413,900.64
LiabilitiesLiabilitiesLiabilitiesLiabilitiesLiabilities
Segment liabilities 4,270.97 189.51 1,190.12 - 5,650.60
Unallocated liabilities - - - - 597.05
Total liabilitiesTotal liabilitiesTotal liabilitiesTotal liabilitiesTotal liabilities 6,247.656,247.656,247.656,247.656,247.65
OthersOthersOthersOthersOthers
Capital expenditure(including capital work in progress) 646.83 46.15 34.98 - 727.96
Unallocated corporate capital expenditure - - - - 54.12
TotalTotalTotalTotalTotal 782.08782.08782.08782.08782.08
Significant non-cash adjustmentsSignificant non-cash adjustmentsSignificant non-cash adjustmentsSignificant non-cash adjustmentsSignificant non-cash adjustments
Depreciation 221.33 51.31 154.64 - 427.28
Unallocated corporate depreciation - - - - 32.41
TotalTotalTotalTotalTotal 459.69459.69459.69459.69459.69
Provision for doubtful debts/advances andbad debts /advances written off 8.83 0.66 11.57 - 21.06
b)b)b)b)b) Segment revenue and expensesSegment revenue and expensesSegment revenue and expensesSegment revenue and expensesSegment revenue and expenses
Segment revenue is directly attributable to the segment and segment expenses have been allocated to various segments on thebasis of specific identification. However, segment revenue does not include other income. Segment expenses do not includepremium amortized on bonds, diminution allowance in respect of current and trade investments, other than temporary diminutionin the value of long term investments, charge taken for stock options issued to employees, corporate expenses and finance cost.
Financial information about the business segments for the year ended 30 June, 2011 is as follows:
Schedules to the consolidated financial statements
(All amounts in crores of ` except share data and unless otherwise stated)
Schedule 20: Notes to the Accounts (Contd.)
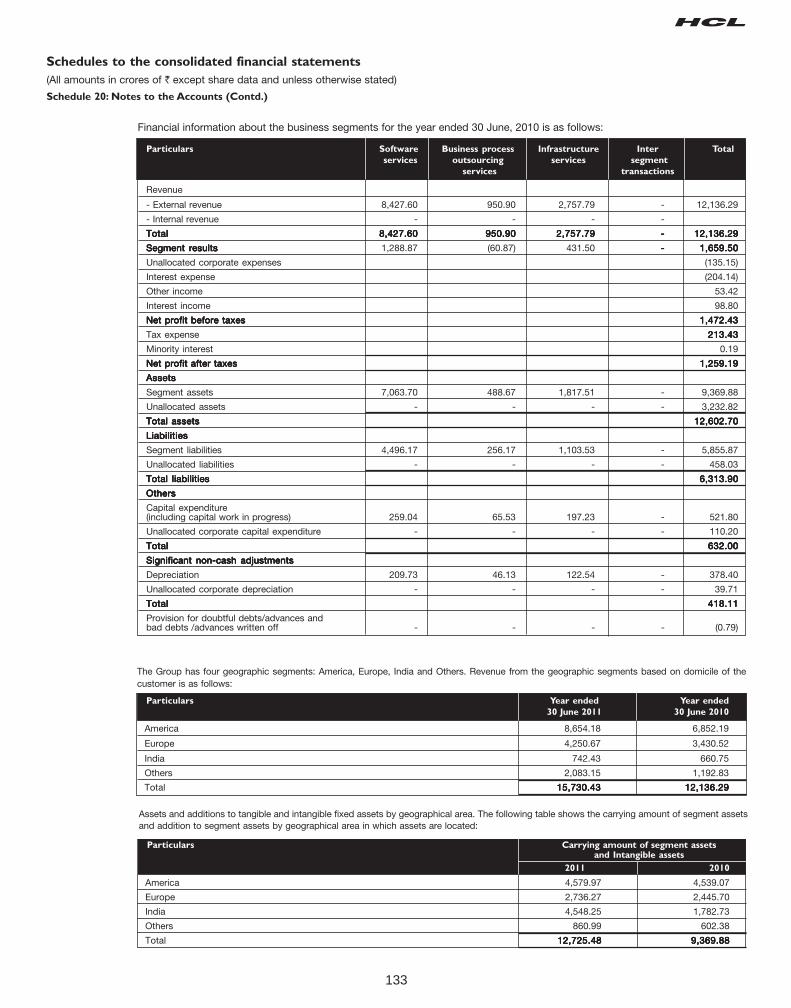
133
The Group has four geographic segments: America, Europe, India and Others. Revenue from the geographic segments based on domicile of thecustomer is as follows:
Particulars Year ended Year ended
30 June 2011 30 June 2010
America 8,654.18 6,852.19
Europe 4,250.67 3,430.52
India 742.43 660.75
Others 2,083.15 1,192.83
Total 15,730.4315,730.4315,730.4315,730.4315,730.43 12,136.2912,136.2912,136.2912,136.2912,136.29
Particulars Software Business process Infrastructure Inter Total
services outsourcing services segment
services transactions
Revenue
- External revenue 8,427.60 950.90 2,757.79 - 12,136.29
- Internal revenue - - - -
TotalTotalTotalTotalTotal 8,427.608,427.608,427.608,427.608,427.60 950.90950.90950.90950.90950.90 2,757.792,757.792,757.792,757.792,757.79 ----- 12,136.2912,136.2912,136.2912,136.2912,136.29
Segment resultsSegment resultsSegment resultsSegment resultsSegment results 1,288.87 (60.87) 431.50 ----- 1,659.501,659.501,659.501,659.501,659.50
Unallocated corporate expenses (135.15)
Interest expense (204.14)
Other income 53.42
Interest income 98.80
Net profit before taxesNet profit before taxesNet profit before taxesNet profit before taxesNet profit before taxes 1,472.431,472.431,472.431,472.431,472.43
Tax expense 213.43213.43213.43213.43213.43
Minority interest 0.19
Net profit after taxesNet profit after taxesNet profit after taxesNet profit after taxesNet profit after taxes 1,259.191,259.191,259.191,259.191,259.19
AssetsAssetsAssetsAssetsAssets
Segment assets 7,063.70 488.67 1,817.51 - 9,369.88
Unallocated assets - - - - 3,232.82
Total assetsTotal assetsTotal assetsTotal assetsTotal assets 12,602.7012,602.7012,602.7012,602.7012,602.70
LiabilitiesLiabilitiesLiabilitiesLiabilitiesLiabilities
Segment liabilities 4,496.17 256.17 1,103.53 - 5,855.87
Unallocated liabilities - - - - 458.03
Total liabilitiesTotal liabilitiesTotal liabilitiesTotal liabilitiesTotal liabilities 6,313.906,313.906,313.906,313.906,313.90
OthersOthersOthersOthersOthers
Capital expenditure(including capital work in progress) 259.04 65.53 197.23 - 521.80
Unallocated corporate capital expenditure - - - - 110.20
TotalTotalTotalTotalTotal 632.00632.00632.00632.00632.00
Significant non-cash adjustmentsSignificant non-cash adjustmentsSignificant non-cash adjustmentsSignificant non-cash adjustmentsSignificant non-cash adjustments
Depreciation 209.73 46.13 122.54 - 378.40
Unallocated corporate depreciation - - - - 39.71
TotalTotalTotalTotalTotal 418.11418.11418.11418.11418.11
Provision for doubtful debts/advances andbad debts /advances written off - - - - (0.79)
Financial information about the business segments for the year ended 30 June, 2010 is as follows:
Assets and additions to tangible and intangible fixed assets by geographical area. The following table shows the carrying amount of segment assetsand addition to segment assets by geographical area in which assets are located:
Particulars Carrying amount of segment assetsand Intangible assets
2011 2010
America 4,579.97 4,539.07
Europe 2,736.27 2,445.70
India 4,548.25 1,782.73
Others 860.99 602.38
Total 12,725.4812,725.4812,725.4812,725.4812,725.48 9,369.889,369.889,369.889,369.889,369.88
Schedules to the consolidated financial statements
(All amounts in crores of ` except share data and unless otherwise stated)
Schedule 20: Notes to the Accounts (Contd.)
134
6.6.6.6.6. Related PartiesRelated PartiesRelated PartiesRelated PartiesRelated Parties
a) Related parties where control exists
HCL Technologies Limited Employees TrustAxon Group Plc Employee Benefit Trust No. 3Axon Group Plc Employee Benefit Trust No. 4
Jointly controlled entitiesJointly controlled entitiesJointly controlled entitiesJointly controlled entitiesJointly controlled entitiesNEC HCL System Technologies LimitedAxon Puerto Rico Inc., Puerto Rico
b) Related parties with whom transactions have taken place during the year
Key Management PersonnelKey Management PersonnelKey Management PersonnelKey Management PersonnelKey Management PersonnelShiv Nadar - Chairman and Chief Strategy OfficerVineet Nayar - CEO and Whole Time Director
Others (Significant influence)Others (Significant influence)Others (Significant influence)Others (Significant influence)Others (Significant influence)
HCL Infosystems LimitedHCL Security LimitedHCL Infinet Limited.HCL Holding LimitedHCL Corporation Limited
Schedules to the consolidated financial statements
(All amounts in crores of ` except share data and unless otherwise stated)
Schedule 20: Notes to the Accounts (Contd.)
Transactions with related parties during the normal course of business:
Particulars Jointly controlled Others Dividend Paidentities
Year ended Year ended Year ended30 June 30 June 30 June
2011 2010 2011 2010 2011 2010
Sale of materials and servicesSale of materials and servicesSale of materials and servicesSale of materials and servicesSale of materials and services 16.5816.5816.5816.5816.58 19.9919.9919.9919.9919.99 12.6312.6312.6312.6312.63 19.3719.3719.3719.3719.37 ----- -----
-NEC HCL Systems Technologies Limited 5.26 13.19 - - - -
-Axon Puerto Rico 11.32 6.80 - - - -
-HCL Infosystems Limited - - 11.81 17.43 - -
Others - - 0.82 1.94 - -
Purchase of materials and servicesPurchase of materials and servicesPurchase of materials and servicesPurchase of materials and servicesPurchase of materials and services 16.2016.2016.2016.2016.20 9.439.439.439.439.43 80.7280.7280.7280.7280.72 74.5574.5574.5574.5574.55 ----- -----
-HCL Infosystems Limited - - 60.15 48.03 - -
-HCL Infinet Limited - - 20.02 24.63 - -
-Axon Puerto Rico INC. 16.20 9.43 - - - -
-Others - - 0.55 1.89 - -
Payment for use of facilitiesPayment for use of facilitiesPayment for use of facilitiesPayment for use of facilitiesPayment for use of facilities ----- ----- 1.481.481.481.481.48 1.851.851.851.851.85 ----- -----
-HCL Infosystems Limited - - 0.25 1.28 - -
- HCL Peripherals Limited - - 0.84 0.57 - -
- HCL Corporation Limited - - 0.39 - - -
Purchase of capital equipmentsPurchase of capital equipmentsPurchase of capital equipmentsPurchase of capital equipmentsPurchase of capital equipments ----- ----- 65.8165.8165.8165.8165.81 24.6624.6624.6624.6624.66 ----- -----
-HCL Infosystems Limited - - 59.45 24.31 - -
- Others - - 6.36 0.35 - -
Others (Significant influence)Others (Significant influence)Others (Significant influence)Others (Significant influence)Others (Significant influence) ----- ----- ----- ----- 289.53289.53289.53289.53289.53 183.91183.91183.91183.91183.91
-HCL Corporation Limited - - - - 210.00 135.21
-HCL Holding Pvt. Ltd. - - - - 78.17 48.30
135
Schedules to the consolidated financial statements
(All amounts in crores of ` except share data and unless otherwise stated)
Schedule 20: Notes to the Accounts (Contd.)
Transactions with Key Managerial personnel during the year
Particulars Year ended 30 June
2011 2010
Chairman and Chief Strategy Officer
i) Remuneration 4.65 4.76
Chief Executive Officer & Whole-time Director
i) Remuneration 6.84 4.54
ii) Dividend Paid 1.36 0.40
iii) Stock option
- Granted - No’s 12,50,000 1,75,000
- Vesting period In trenches till 2016 One year
- Exercised - No’s 4,25,000 2,50,000
- Exercise price - ` 8 8
Outstanding balances
Particulars Jointly controlled Othersentities
As at 30 June As at 30 June
2011 2010 2011 2010
DebtorsDebtorsDebtorsDebtorsDebtors 11.9711.9711.9711.9711.97 1.451.451.451.451.45 12.1412.1412.1412.1412.14 2.802.802.802.802.80
-HCL Infosystems Limited - - 12.06 2.67
-HCL Infinet Limited. - - 0.08 0.13
-NEC HCL Systems Technologies Limited 10.69 0.58 - -
-Axon Puerto Rico INC. 1.28 0.87 - -
Other receivablesOther receivablesOther receivablesOther receivablesOther receivables 1.621.621.621.621.62 0.190.190.190.190.19 17.3817.3817.3817.3817.38 12.3012.3012.3012.3012.30
-HCL Infosystems Limited - - 17.24 11.81
-Axon Puerto Rico INC. 1.19 - - -
-NEC HCL Systems Technologies Limited 0.43 0.19 - -
-Others - - 0.14 0.49
CreditorsCreditorsCreditorsCreditorsCreditors 4.484.484.484.484.48 2.222.222.222.222.22 13.5713.5713.5713.5713.57 10.9410.9410.9410.9410.94
-HCL Infosystems Limited - - 13.13 9.90
-Axon Puerto Rico INC. 2.82 1.26 - -
-NEC HCL Systems Technologies Limited 1.66 0.96 - -
-Others - - 0.44 1.04
136
Schedules to the consolidated financial statements
(All amounts in crores of ` except share data and unless otherwise stated)
Schedule 20: Notes to the Accounts (Contd.)
7. Components of Deferred Tax Assets / LiabilitiesComponents of Deferred Tax Assets / LiabilitiesComponents of Deferred Tax Assets / LiabilitiesComponents of Deferred Tax Assets / LiabilitiesComponents of Deferred Tax Assets / Liabilities
Particulars As at As a
30 June 2011 30 June 2010
Deferred Tax AssetsDeferred Tax AssetsDeferred Tax AssetsDeferred Tax AssetsDeferred Tax Assets
Business losses * 40.86 95.98
Provision for doubtful debts 35.30 33.20
Accrued employee costs 52.85 72.65
Unrealized Loss on derivative financial instruments 0.83 7.51
Depreciation and amortization 81.16 89.03
Employee stock compensation 25.63 23.81
Others 144.89 67.30
Gross Deferred Tax AssetsGross Deferred Tax AssetsGross Deferred Tax AssetsGross Deferred Tax AssetsGross Deferred Tax Assets 381.52381.52381.52381.52381.52 389.48389.48389.48389.48389.48
Deferred Tax liabilitiesDeferred Tax liabilitiesDeferred Tax liabilitiesDeferred Tax liabilitiesDeferred Tax liabilities
Depreciation and amortization 4.49 3.01
Unrealized gain on derivative financial instruments 4.27 -
Others 9.50 10.80
Gross Deferred tax LiabilitiesGross Deferred tax LiabilitiesGross Deferred tax LiabilitiesGross Deferred tax LiabilitiesGross Deferred tax Liabilities 18.26 13.81
Net Deferred Tax AssetsNet Deferred Tax AssetsNet Deferred Tax AssetsNet Deferred Tax AssetsNet Deferred Tax Assets 363.26363.26363.26363.26363.26 375.67375.67375.67375.67375.67
* The Company files a consolidated tax return with its US parent who is having a consistent profit history and as such recognized deferred taxassets on such portion of the carry forward business losses which can be utilized against US parent's profit within the limit and carryover periodpermitted under US law.
8. Research and Development Expenditure
Particulars Year ended Year ended
30 June 2011 30 June 2010
Revenue 110.58 55.01
Capital - -
110.58110.58110.58110.58110.58 55.0155.0155.0155.0155.01
9. Commitments and Contingent liabilities
Particulars As at As at
30 June 2011 30 June 2010
i)i)i)i)i) Capital and Other CommitmentsCapital and Other CommitmentsCapital and Other CommitmentsCapital and Other CommitmentsCapital and Other Commitments
a)a)a)a)a) Capital commitmentsCapital commitmentsCapital commitmentsCapital commitmentsCapital commitments
Estimated amount of unexecuted capital 433.54 305.56contracts (net of advances)
b)b)b)b)b) Outstanding letters of creditOutstanding letters of creditOutstanding letters of creditOutstanding letters of creditOutstanding letters of credit 3.16 46.88
436.70436.70436.70436.70436.70 352.44352.44352.44352.44352.44
ii)ii)ii)ii)ii) Contingent LiabilitiesContingent LiabilitiesContingent LiabilitiesContingent LiabilitiesContingent Liabilities
a) Disputed Income Tax (excluding Interest) 2.46 9.99
b) Others 5.28 17.76
7.747.747.747.747.74 27.7527.7527.7527.7527.75
c) Guarantees have been given by the Group against credit facilities, financial assistance and office premises taken on lease amountingto ` 35.66 crores (Previous year ` 20.94 crores). These guarantees have been given in the normal course of the Group's operationsand are not expected to result in any loss to the Group, on the basis of the Group fulfilling its ordinary commercial obligations.
137
Sell Covers As at As at
30 June 2011 30 June 2010
Foreign Currency Rupee Equivalent (` in Crores)
USD / INR 207.83 1,314.22
GBP / INR 32.21 65.09
EURO / INR 106.66 58.19
EURO / USD 45.25 -
AUD / INR 57.47 -
AUD / USD 9.58 -
USD / ZAR 44.03 -
USD / CAD 64.79 -
567.82567.82567.82567.82567.82 1,437.501,437.501,437.501,437.501,437.50
Schedules to the consolidated financial statements
(All amounts in crores of ` except share data and unless otherwise stated)
Schedule 20: Notes to the Accounts (Contd.)
d) The Group and its various subsidiaries are required to comply with the local transfer pricing regulations, which are contemporaneousin nature. The Group appoints independent consultants annually for conducting a transfer pricing study to determine whethertransactions with associate enterprises are undertaken, during the financial year, on an arms length basis. Adjustments, if any,arising from the transfer pricing study in the respective jurisdictions shall be accounted for as and when the study is completed forthe current financial year. The management is of the opinion that its international transactions are at arms length so that aforesaidlegislation will not have any impact on the financial statements.
The amounts shown in the item above represent best possible estimates arrived at on the basis of available information. The uncertaintiesand possible reimbursements are dependent on the outcome of the different legal processes which have been invoked by the Group orthe claimants as the case may be and therefore cannot be predicted accurately. The Group engages reputed professional advisors toprotect its interest and has been advised that it has strong legal positions against such disputes.
10. Derivative Financial Instruments and Hedge AccountingDerivative Financial Instruments and Hedge AccountingDerivative Financial Instruments and Hedge AccountingDerivative Financial Instruments and Hedge AccountingDerivative Financial Instruments and Hedge Accounting
(a)(a)(a)(a)(a) Foreign currency forward and option contractsForeign currency forward and option contractsForeign currency forward and option contractsForeign currency forward and option contractsForeign currency forward and option contracts
The Group is exposed to foreign currency fluctuations on foreign currency assets / liabilities, forecasted cash flows denominated inforeign currency. The use of derivatives to hedge foreign currency forecasted cash flows is governed by the Group's strategy, whichprovide principles on the use of such forward contracts and currency options consistent with the Group's Risk Management Policy. Thecounter party in these derivative instruments is a bank and the Group considers the risks of non-performance by the counterparty as non-material. A majority of the forward foreign exchange/option contracts mature between one to 12 months and the forecasted transactionsare expected to occur during the same period. The Group does not use forward covers and currency options for speculative purposes.
The following table presents the aggregate contracted principal amounts of the Group's derivative contracts outstanding:
Buy Covers As at As at
30 June 2011 30 June 2010
Foreign Currency Rupee Equivalent (` in Crores)
USD/INR - 376.16
TotalTotalTotalTotalTotal ----- 376.16376.16376.16376.16376.16
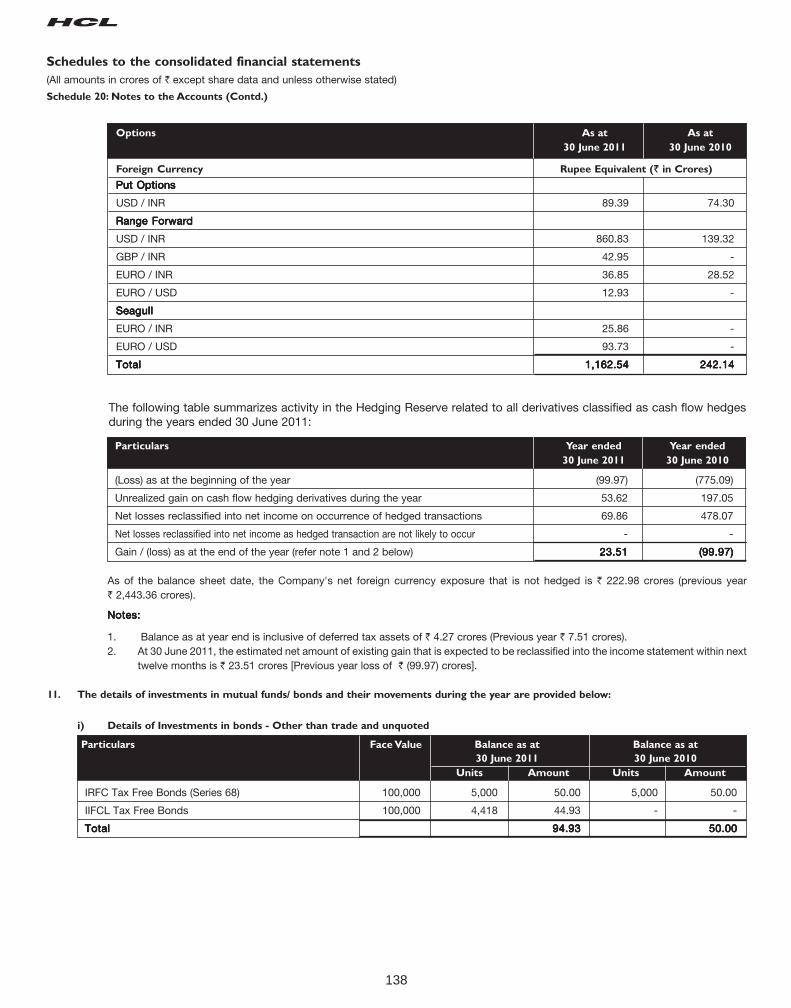
138
Particulars Year ended Year ended
30 June 2011 30 June 2010
(Loss) as at the beginning of the year (99.97) (775.09)
Unrealized gain on cash flow hedging derivatives during the year 53.62 197.05
Net losses reclassified into net income on occurrence of hedged transactions 69.86 478.07
Net losses reclassified into net income as hedged transaction are not likely to occur - -
Gain / (loss) as at the end of the year (refer note 1 and 2 below) 23.5123.5123.5123.5123.51 (99.97)(99.97)(99.97)(99.97)(99.97)
As of the balance sheet date, the Company's net foreign currency exposure that is not hedged is ` 222.98 crores (previous year` 2,443.36 crores).
Notes:Notes:Notes:Notes:Notes:
1. Balance as at year end is inclusive of deferred tax assets of ` 4.27 crores (Previous year ` 7.51 crores).2. At 30 June 2011, the estimated net amount of existing gain that is expected to be reclassified into the income statement within next
twelve months is ` 23.51 crores [Previous year loss of ` (99.97) crores].
11. The details of investments in mutual funds/ bonds and their movements during the year are provided below:
The following table summarizes activity in the Hedging Reserve related to all derivatives classified as cash flow hedgesduring the years ended 30 June 2011:
Options As at As at
30 June 2011 30 June 2010
Foreign Currency Rupee Equivalent (` in Crores)
Put OptionsPut OptionsPut OptionsPut OptionsPut Options
USD / INR 89.39 74.30
Range ForwardRange ForwardRange ForwardRange ForwardRange Forward
USD / INR 860.83 139.32
GBP / INR 42.95 -
EURO / INR 36.85 28.52
EURO / USD 12.93 -
SeagullSeagullSeagullSeagullSeagull
EURO / INR 25.86 -
EURO / USD 93.73 -
TotalTotalTotalTotalTotal 1,162.541,162.541,162.541,162.541,162.54 242.14242.14242.14242.14242.14
i) Details of Investments in bonds - Other than trade and unquoted
Particulars Face Value Balance as at Balance as at
30 June 2011 30 June 2010
Units Amount Units Amount
IRFC Tax Free Bonds (Series 68) 100,000 5,000 50.00 5,000 50.00
IIFCL Tax Free Bonds 100,000 4,418 44.93 - -
TotalTotalTotalTotalTotal 94.9394.9394.9394.9394.93 50.0050.0050.0050.0050.00
Schedules to the consolidated financial statements
(All amounts in crores of ` except share data and unless otherwise stated)
Schedule 20: Notes to the Accounts (Contd.)
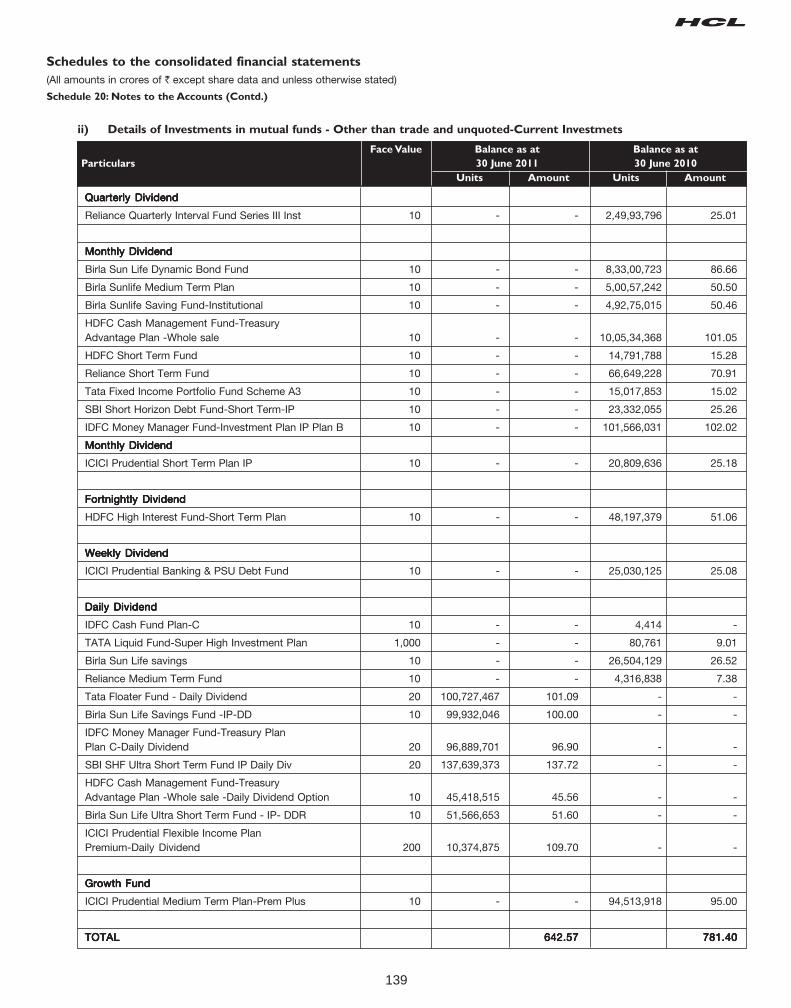
139
ii) Details of Investments in mutual funds - Other than trade and unquoted-Current Investmets
Face Value Balance as at Balance as at
Particulars 30 June 2011 30 June 2010
Units Amount Units Amount
Quarterly DividendQuarterly DividendQuarterly DividendQuarterly DividendQuarterly Dividend
Reliance Quarterly Interval Fund Series III Inst 10 - - 2,49,93,796 25.01
Monthly DividendMonthly DividendMonthly DividendMonthly DividendMonthly Dividend
Birla Sun Life Dynamic Bond Fund 10 - - 8,33,00,723 86.66
Birla Sunlife Medium Term Plan 10 - - 5,00,57,242 50.50
Birla Sunlife Saving Fund-Institutional 10 - - 4,92,75,015 50.46
HDFC Cash Management Fund-TreasuryAdvantage Plan -Whole sale 10 - - 10,05,34,368 101.05
HDFC Short Term Fund 10 - - 14,791,788 15.28
Reliance Short Term Fund 10 - - 66,649,228 70.91
Tata Fixed Income Portfolio Fund Scheme A3 10 - - 15,017,853 15.02
SBI Short Horizon Debt Fund-Short Term-IP 10 - - 23,332,055 25.26
IDFC Money Manager Fund-Investment Plan IP Plan B 10 - - 101,566,031 102.02
Monthly DividendMonthly DividendMonthly DividendMonthly DividendMonthly Dividend
ICICI Prudential Short Term Plan IP 10 - - 20,809,636 25.18
Fortnightly DividendFortnightly DividendFortnightly DividendFortnightly DividendFortnightly Dividend
HDFC High Interest Fund-Short Term Plan 10 - - 48,197,379 51.06
Weekly DividendWeekly DividendWeekly DividendWeekly DividendWeekly Dividend
ICICI Prudential Banking & PSU Debt Fund 10 - - 25,030,125 25.08
Daily DividendDaily DividendDaily DividendDaily DividendDaily Dividend
IDFC Cash Fund Plan-C 10 - - 4,414 -
TATA Liquid Fund-Super High Investment Plan 1,000 - - 80,761 9.01
Birla Sun Life savings 10 - - 26,504,129 26.52
Reliance Medium Term Fund 10 - - 4,316,838 7.38
Tata Floater Fund - Daily Dividend 20 100,727,467 101.09 - -
Birla Sun Life Savings Fund -IP-DD 10 99,932,046 100.00 - -
IDFC Money Manager Fund-Treasury PlanPlan C-Daily Dividend 20 96,889,701 96.90 - -
SBI SHF Ultra Short Term Fund IP Daily Div 20 137,639,373 137.72 - -
HDFC Cash Management Fund-TreasuryAdvantage Plan -Whole sale -Daily Dividend Option 10 45,418,515 45.56 - -
Birla Sun Life Ultra Short Term Fund - IP- DDR 10 51,566,653 51.60 - -
ICICI Prudential Flexible Income PlanPremium-Daily Dividend 200 10,374,875 109.70 - -
Growth FundGrowth FundGrowth FundGrowth FundGrowth Fund
ICICI Prudential Medium Term Plan-Prem Plus 10 - - 94,513,918 95.00
TOTALTOTALTOTALTOTALTOTAL 642.57642.57642.57642.57642.57 781.40781.40781.40781.40781.40
Schedules to the consolidated financial statements
(All amounts in crores of ` except share data and unless otherwise stated)
Schedule 20: Notes to the Accounts (Contd.)
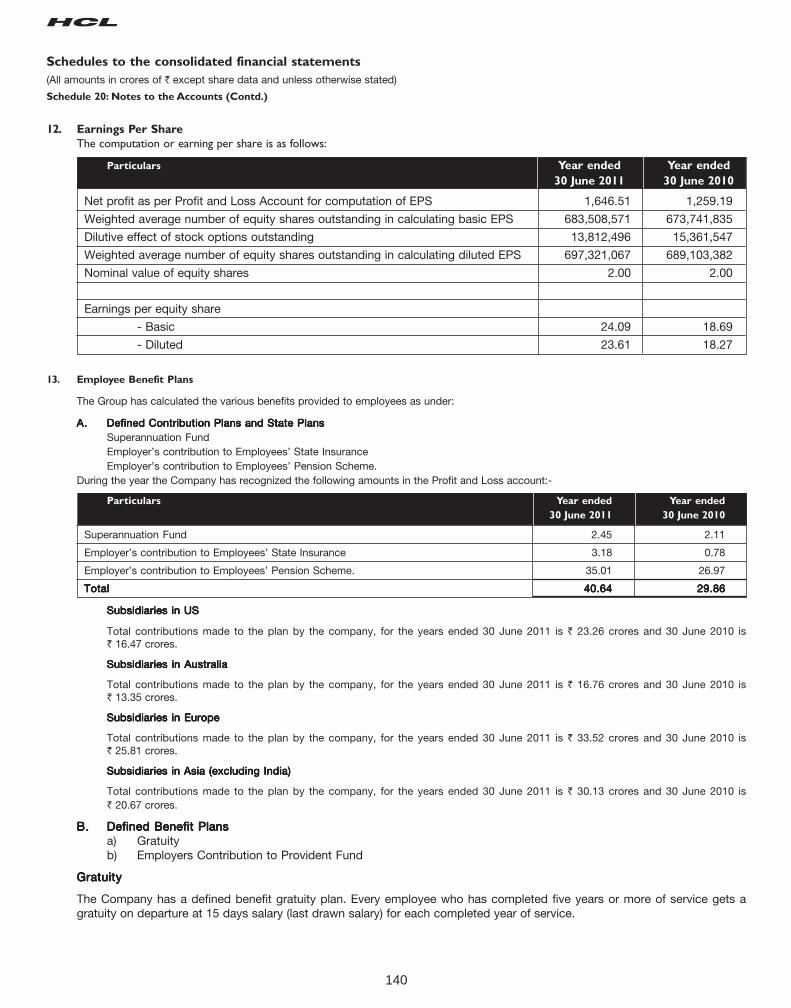
140
13. Employee Benefit Plans
The Group has calculated the various benefits provided to employees as under:
A.A.A.A.A. Defined Contribution Plans and State PlansDefined Contribution Plans and State PlansDefined Contribution Plans and State PlansDefined Contribution Plans and State PlansDefined Contribution Plans and State PlansSuperannuation FundEmployer’s contribution to Employees’ State InsuranceEmployer’s contribution to Employees’ Pension Scheme.
During the year the Company has recognized the following amounts in the Profit and Loss account:-
Particulars Year ended Year ended
30 June 2011 30 June 2010
Superannuation Fund 2.45 2.11
Employer’s contribution to Employees’ State Insurance 3.18 0.78
Employer’s contribution to Employees’ Pension Scheme. 35.01 26.97
TotalTotalTotalTotalTotal 40.6440.6440.6440.6440.64 29.8629.8629.8629.8629.86
Subsidiaries in USSubsidiaries in USSubsidiaries in USSubsidiaries in USSubsidiaries in US
Total contributions made to the plan by the company, for the years ended 30 June 2011 is ` 23.26 crores and 30 June 2010 is` 16.47 crores.
Subsidiaries in AustraliaSubsidiaries in AustraliaSubsidiaries in AustraliaSubsidiaries in AustraliaSubsidiaries in Australia
Total contributions made to the plan by the company, for the years ended 30 June 2011 is ` 16.76 crores and 30 June 2010 is` 13.35 crores.
Subsidiaries in EuropeSubsidiaries in EuropeSubsidiaries in EuropeSubsidiaries in EuropeSubsidiaries in Europe
Total contributions made to the plan by the company, for the years ended 30 June 2011 is ` 33.52 crores and 30 June 2010 is` 25.81 crores.
Subsidiaries in Asia (excluding India)Subsidiaries in Asia (excluding India)Subsidiaries in Asia (excluding India)Subsidiaries in Asia (excluding India)Subsidiaries in Asia (excluding India)
Total contributions made to the plan by the company, for the years ended 30 June 2011 is ` 30.13 crores and 30 June 2010 is` 20.67 crores.
B.B.B.B.B. Defined Benefit PlansDefined Benefit PlansDefined Benefit PlansDefined Benefit PlansDefined Benefit Plansa) Gratuityb) Employers Contribution to Provident Fund
GratuityGratuityGratuityGratuityGratuity
The Company has a defined benefit gratuity plan. Every employee who has completed five years or more of service gets agratuity on departure at 15 days salary (last drawn salary) for each completed year of service.
Schedules to the consolidated financial statements
(All amounts in crores of ` except share data and unless otherwise stated)
Schedule 20: Notes to the Accounts (Contd.)
12. Earnings Per Share
The computation or earning per share is as follows:
Particulars Year ended Year ended
30 June 2011 30 June 2010
Net profit as per Profit and Loss Account for computation of EPS 1,646.51 1,259.19
Weighted average number of equity shares outstanding in calculating basic EPS 683,508,571 673,741,835
Dilutive effect of stock options outstanding 13,812,496 15,361,547
Weighted average number of equity shares outstanding in calculating diluted EPS 697,321,067 689,103,382
Nominal value of equity shares 2.00 2.00
Earnings per equity share
- Basic 24.09 18.69
- Diluted 23.61 18.27
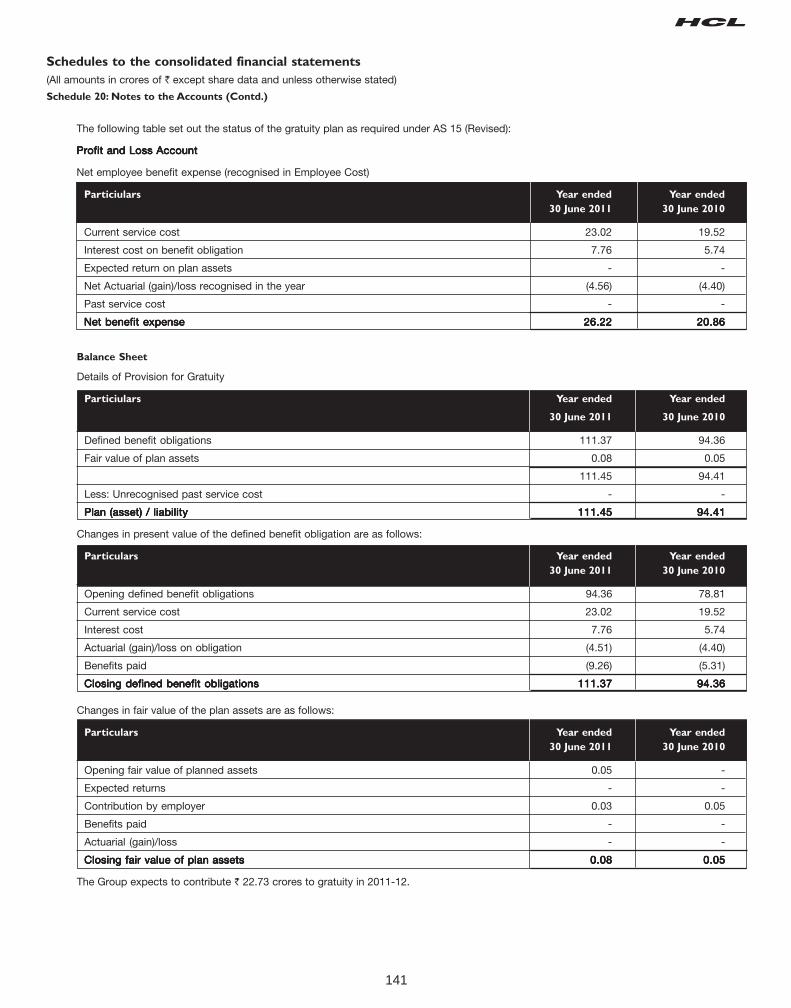
141
Balance Sheet
Details of Provision for Gratuity
Particiulars Year ended Year ended
30 June 2011 30 June 2010
Defined benefit obligations 111.37 94.36
Fair value of plan assets 0.08 0.05
111.45 94.41
Less: Unrecognised past service cost - -
Plan (asset) / liabilityPlan (asset) / liabilityPlan (asset) / liabilityPlan (asset) / liabilityPlan (asset) / liability 111.45111.45111.45111.45111.45 94.4194.4194.4194.4194.41
Changes in present value of the defined benefit obligation are as follows:
Particulars Year ended Year ended
30 June 2011 30 June 2010
Opening defined benefit obligations 94.36 78.81
Current service cost 23.02 19.52
Interest cost 7.76 5.74
Actuarial (gain)/loss on obligation (4.51) (4.40)
Benefits paid (9.26) (5.31)
Closing defined benefit obligationsClosing defined benefit obligationsClosing defined benefit obligationsClosing defined benefit obligationsClosing defined benefit obligations 111.37111.37111.37111.37111.37 94.3694.3694.3694.3694.36
Changes in fair value of the plan assets are as follows:
Particulars Year ended Year ended
30 June 2011 30 June 2010
Opening fair value of planned assets 0.05 -
Expected returns - -
Contribution by employer 0.03 0.05
Benefits paid - -
Actuarial (gain)/loss - -
Closing fair value of plan assetsClosing fair value of plan assetsClosing fair value of plan assetsClosing fair value of plan assetsClosing fair value of plan assets 0.080.080.080.080.08 0.050.050.050.050.05
The Group expects to contribute ` 22.73 crores to gratuity in 2011-12.
Schedules to the consolidated financial statements
(All amounts in crores of ` except share data and unless otherwise stated)
Schedule 20: Notes to the Accounts (Contd.)
The following table set out the status of the gratuity plan as required under AS 15 (Revised):
Profit and Loss AccountProfit and Loss AccountProfit and Loss AccountProfit and Loss AccountProfit and Loss Account
Net employee benefit expense (recognised in Employee Cost)
Particiulars Year ended Year ended
30 June 2011 30 June 2010
Current service cost 23.02 19.52
Interest cost on benefit obligation 7.76 5.74
Expected return on plan assets - -
Net Actuarial (gain)/loss recognised in the year (4.56) (4.40)
Past service cost - -
Net benefit expenseNet benefit expenseNet benefit expenseNet benefit expenseNet benefit expense 26.2226.2226.2226.2226.22 20.8620.8620.8620.8620.86
142
The following table set out the experience adjustment to plan liabilities as required under AS-15 (Revised):
Particulars Year ended Year ended Year ended Year ended
30 June 2011 30 June 2010 30 June 2009 30 June 2008
Defined benefit obligations 111.37 94.36 78.70 57.64
Plan assets 0.08 0.05 - -
Experience adjustment on plan liabilities 5.15 (2.23) (6.69) 5.09
Experience adjustment on plan assets - - - -
The Group has adopted AS 15 revised from 01 July 2007 and thereby has not given disclosures of the above for the year ended 30 June 2007.
Employers Contribution to Provident Fund
The Guidance on implementing AS 15, Employee Benefits (revised 2005) issued by the Accounting Standard Board (ASB) states that benefitsinvolving employer - established provident funds, which require interest shortfall to be recompensed are to be considered as defined benefitsplans. Pending the issuance of the guidance note from the Actuarial Society of India, the Group's actuary has expressed his inability to reliablymeasure provident fund liabilities. Accordingly the Group is unable to provide the related information.
During the year ended 30 June 2011, the Group has contributed ` 72.73 crores (Previous year ` 72.18 crores) towards employers' contributionto the Provident Fund.
Schedules to the consolidated financial statements
(All amounts in crores of ` except share data and unless otherwise stated)
Schedule 20: Notes to the Accounts (Contd.)
The overall expected rate of return on assets is determined based on the market prices prevailing on that date, applicable to the period overwhich the obligation is to be settled.
The principal assumptions used in determining gratuity for the Group's plans are shown below:
Particulars Year ended Year ended
30 June 2011 30 June 2010
Discount rate 8.35% 7.15%
Estimated Rate of salary increases 6%-10% 6%-10%
Employee Turnover 18.00% 18.00%
Expected rate of return on assets N.A N.A
14. Joint Venture
The Group has an interest in the following jointly controlled entities:
Name of the Company Shareholding Incorporated in
NEC HCL System Technologies Limited 49% India
Axon Balance LLC* 50% United States of America
Axon Puerto Rico Inc. 49% Puerto Rico
* Dissolved w.e.f. January 18, 2011
143
Particulars As at As at
30 June 2011 30 June 2010
AssetsAssetsAssetsAssetsAssetsFixed Assets 10.86 10.89Sundry debtors 11.56 7.09Cash and Bank balances 12.64 11.10Other Current Assets 4.38 3.49LiabilitiesLiabilitiesLiabilitiesLiabilitiesLiabilitiesCurrent liabilities and provisions 15.62 15.17
Notes:Notes:Notes:Notes:Notes:a. NEC HCL System Technologies Limited financial statements are for the year ended 31 March, 2011 and 2010 respectively.b. Axon Puerto Rico Inc. financial statements are for the period ended 31 May 2011 and 2010 respectively.c. There is no material transaction between the reporting dates of the JV and that of Group.
15. Previous year comparatives
Previous year figures have been re-classified/re-grouped to conform to current year's classifications.
Schedules to the consolidated financial statements
(All amounts in crores of ` except share data and unless otherwise stated)
Schedule 20: Notes to the Accounts (Contd.)
The aggregate amounts of assets, liabilities, income and expenditure to the extent of the interest of the Group in the above jointly controlledentities are given hereunder:
Particulars Year ended Year ended
30 June 2011 30 June 2010
Revenue from software services 46.02 41.44
Other income 0.50 0.58
TotalTotalTotalTotalTotal 46.5246.5246.5246.5246.52 42.0242.0242.0242.0242.02
Personnel expenses 27.02 21.48
Other Expenses 14.08 15.86
Depreciation and Amortization 1.75 0.90
TotalTotalTotalTotalTotal 42.8542.8542.8542.8542.85 38.2438.2438.2438.2438.24
Profit Before TaxProfit Before TaxProfit Before TaxProfit Before TaxProfit Before Tax 3.673.673.673.673.67 3.783.783.783.783.78
Provision for tax 0.39 (0.58)
Net profit after taxNet profit after taxNet profit after taxNet profit after taxNet profit after tax 3.283.283.283.283.28 4.364.364.364.364.36
As per our report of even dateFor HCL Technologies Limited
For S. R. Batliboi & Co. Shiv Nadar T S R Subramanian
Firm Registration Number: 301003E Chairman and Chief Strategy Officer DirectorChartered Accountants
Vineet Nayar Anil Chanana
Vice Chairman,CEO & Wholetime Director Chief Financial Officer
per Tridibes Basu Sandip Gupta Prahlad Rai Bansal
Partner Deputy Chief Financial Officer Corporate Vice President - FinanceMembership Number: 17401
Raj Kumar Walia Manish Anand
Senior Vice President - Finance & Accounts Deputy Company Secretary
Gurgaon, India Noida (UP), India27 July 2011 27 July 2011
144
1 HCL Bermuda Limited 30-Jun-11 409,670,582 100 (1,536,580) (1,406,549) Nil Nil
2 HCL America Inc. 30-Jun-11 6,089,870 100 55,473 2,623,232 Nil Nil
3 HCL Great Britain Limited 30-Jun-11 10,568,334 100 460,622 (367,796) Nil Nil
4 HCL Sweden AB 30-Jun-11 10,000 100 46,706 61,395 Nil Nil
5 HCL (Netherlands) BV 30-Jun-11 400 100 209,688 110,651 Nil Nil
6 HCL GmbH 30-Jun-11 257 100 79,447 (130,749) Nil Nil
7 HCL Italy SLR 30-Jun-11 20,000,000 100 (74,130) (57,072) Nil Nil
8 HCL Belgium NV 30-Jun-11 2,750 100 (21,705) (53,978) Nil Nil
9 HCL Australia Services Pty. Limited 30-Jun-11 500,000 100 867,596 1,053,866 Nil Nil
10 HCL (New Zealand) Limited 30-Jun-11 10 100 201,806 199,889 Nil Nil
11 HCL Hong Kong SAR Limited 30-Jun-11 193,167 100 94,516 19,168 Nil Nil
12 HCL Japan Limited 30-Jun-11 4,400 100 62,463 48,514 Nil Nil
13 HCL Holdings GmbH 31-Dec-10 6,500,000 100 (13,085) 4,182,371 Nil Nil
14 HCL Global Processing Services Limited(formerly Intelicent India Limited) 30-Jun-11 106,070 100 20,084 250,376 Nil Nil
15 HCL Comnet Systems and Services Limited 30-Jun-11 12,796,404 99.99 1,634,778 6,640,510 Nil 19610
16 DSI Financial Solutions Pte Limited 30-Jun-11 10,000 100 149 (1,731) Nil Nil
17 HCL BPO Services (NI) Limited 30-Jun-11 444,445 100 (125,767) (47,866) Nil Nil
18 HCL Comnet Limited 30-Jun-11 949,840 99.99 (80,788) 598,714 Nil Nil
19 HCL Jones Technologies LLC ## 30-Jun-11 - 51.00 - 29,442 Nil Nil
20 HCL Singapore Pte Limited 30-Jun-11 2,000,000 100 358,059 1,038,839 181894 45245
21 HCL (Malaysia) Sdn. Bhd 30-Jun-11 100,000 100 66,488 255,826 Nil Nil
22 HCL EAI Services Limited 30-Jun-11 1,050,100 100 (14,398) 42,492 Nil Nil
23 HCL Technologies Denmark Apps 30-Jun-11 1,000,000 100 2,539 - Nil Nil
24 HCL Poland Sp.z.o.o. 30-Jun-11 17,000 100 (37,930) (43,740) Nil Nil
25 HCL Technologies (Shanghai) Limited 31-Dec-10 Not Applicable 100 10,742 (60,705) Nil Nil
26 Capital Stream Inc. 30-Jun-11 10,000 100 43,429 (169,951) Nil Nil
27 HCL Expense Management Services Inc 30-Jun-11 1 100 (702,933) (381,694) Nil Nil
28 Axon Group Limited 30-Jun-11 69,601,824 100 1,122,958 (27,348) Nil Nil
29 Axon Solutions Inc, 30-Jun-11 3,097,000 100 (223,365) (704,412) Nil Nil
30 Bywater Limited 30-Jun-11 1,129,982 100 (1,838) 4,600 Nil Nil
31 Axon Solutions Limited 30-Jun-11 100,150 100 1,963,960 (222,217) Nil Nil
32 Axon Solutions Sdn. Bhd. 30-Jun-11 10,000,000 100 (594,315) (592,499) Nil Nil
33 Axon Solutions (Shanghai) Co. Ltd. 31-Dec-10 Not Applicable 100 (80,362) 2,184 Nil Nil
34 Axon Solutions Singapore Pte Ltd. 30-Jun-11 100,000 100 (19,185) (31,815) Nil Nil
35 JSPC i-Solutions Sdn Bhd 30-Jun-11 1,000,000 100 284 386,686 Nil Nil
36 JSP Consulting Sdn. Bhd. 30-Jun-11 500,000 100 (738) (788) Nil Nil
37 HCL Technologies Philippines Inc. 30-Jun-11 87,300 100 (988) - Nil Nil
38 HCL Technologies South Africa(Proprietary) Limited 30-Jun-11 100 100 (4,882) - Nil Nil
39 Axon Solution (Canada) Inc 30-Jun-11 1,000 100 (140,429) (221,516) Nil Nil
40 Axon Solutions Australia Pty Limited 30-Jun-11 627,517 100 (232,394) (269,532) Nil Nil
41 Axon Solutions Schweiz GmbH 30-Jun-11 20,000 100 (980) 77 Nil Nil
42 Axon Acquisition Company, Inc. 30-Jun-11 1,000 100 - - Nil Nil
43 HCL Technologies Norway AS 30-Jun-11 1,600 100 (26,047) - Nil Nil
44 HCL Insurance BPO Services Ltd. 30-Jun-11 7,810,000 100 (89,619) (187,104) Nil Nil
45 HCL Technologies Canada Inc. 30-Jun-11 180,000 100 337 75,614 Nil Nil
46 HCL EAS Limited, 30-Jun-11 101,843,957 100 694,068 (2,026,260) Nil Nil
Statement regarding Subsidiary Companies pursuant to Section 212 of the Companies Act, 1956
S.No. Name of the Subsidiary Company
Net aggregate amount ofSubsidiary Company’s Profits afterdeducting its losses or vice versa, sofar as it concerns members ofHolding Company which are dealtwith in the Company’s accounts(All amounts in ` thousands)
Net aggregate amount ofSubsidiary Company’s Profits afterdeducting its losses or vice versa,so far as it concerns members ofHolding Company which are notdealt with in the Company’saccounts (All amounts in `
thousands)
Holding Company’s interest inthe subsidiary at the end of
financial year
For previousfinancial years
of the subsidiarysince it became
the HoldingCompany’ssubsidiary
For the yearended
June 30, 2011
For previousfinancial years
of the subsidiarysince it became
the HoldingCompany’ssubsidiary
Extent ofholding
(%)
Shareholding(No. of shares)
For the yearended
June 30, 2011
Financial yearto whichAccountsrelate
145
Notes:
a) In respect of the subsidiaries whose financial year do not coincide with the financial year of the Company, neither there has been change in the holding company'sinterest in the subsidiary nor any material transaction has occurred, between the end of the financial year of such subsidiary and end of financial year of thecompany.
## Since the company is under liquidation, no profit and loss account has been prepared and amount distributable to common shareholders has been shown underreserves.
For HCL Technologies LimitedFor HCL Technologies LimitedFor HCL Technologies LimitedFor HCL Technologies LimitedFor HCL Technologies Limited
Shiv NadarShiv NadarShiv NadarShiv NadarShiv Nadar T S R SubramanianT S R SubramanianT S R SubramanianT S R SubramanianT S R SubramanianChairman and Chief Strategy Officer Director
Vineet NayarVineet NayarVineet NayarVineet NayarVineet Nayar Anil ChananaAnil ChananaAnil ChananaAnil ChananaAnil ChananaVice Chairman, CEO & Wholetime Director Chief Financial Officer
Sandip GuptaSandip GuptaSandip GuptaSandip GuptaSandip Gupta Prahlad Rai BansalPrahlad Rai BansalPrahlad Rai BansalPrahlad Rai BansalPrahlad Rai BansalDeputy Chief Financial Officer Corporate Vice President - Finance
Raj Kumar WaliaRaj Kumar WaliaRaj Kumar WaliaRaj Kumar WaliaRaj Kumar Walia Manish AnandManish AnandManish AnandManish AnandManish AnandSenior Vice President - Finance & Accounts Deputy Company Secretary
Place: Noida, UP (India)Place: Noida, UP (India)Place: Noida, UP (India)Place: Noida, UP (India)Place: Noida, UP (India)Date: 16 September, 2011
Note: Information on subsidiaries is provided in compliance with the General Circular no. 2/2011 dated February 8, 2011 issued by the Ministry of Corporate Affairs,Government of India. The Company would provide the annual accounts of the subsidiaries and the related detailed information to the shareholders of the Company and itssubsidiaries on specific requests made to it in this regard by the said shareholders at any point of time. The annual accounts of the subsidiaries will also be kept forinspection by any shareholder at the registered office of the Company and that of the subsidiary company concerned.
Statement regarding Subsidiary Companies pursuant to Section 212 of the Companies Act, 1956
S.No. Name of the Subsidiary Company
Net aggregate amount ofSubsidiary Company’s Profits afterdeducting its losses or vice versa, sofar as it concerns members ofHolding Company which are dealtwith in the Company’s accounts(All amounts in ` thousands)
Net aggregate amount ofSubsidiary Company’s Profits afterdeducting its losses or vice versa,so far as it concerns members ofHolding Company which are notdealt with in the Company’saccounts (All amounts in `
thousands)
Holding Company’s interest inthe subsidiary at the end of
financial year
For previousfinancial years
of the subsidiarysince it became
the HoldingCompany’ssubsidiary
For the yearended
June 30, 2011
For previousfinancial years
of the subsidiarysince it became
the HoldingCompany’ssubsidiary
Extent ofholding
(%)
Shareholding(No. of shares)
For the yearended
June 30, 2011
Financial yearto whichAccountsrelate
47 HCL Axon (Pty) Ltd. 30-Jun-11 100 100 99,537 54,021 Nil Nil
48 HCL (Brazil) Technologia da informacao Ltda. 31-Dec-10 12,701,741 100 (229,054) (87,139) Nil Nil
49 HCL Technologies Romania s.r.l. 30-Jun-11 5,329 100 (1,496) (941) Nil Nil
50 HCL Hungary Limited 30-Jun-11 9,000,000 100 1,147 (27) Nil Nil
51 HCL Latin America Holding LLC 30-Jun-11 11,296 100 (120) (293) Nil Nil
52 HCL Argentina s.a. 30-Jun-11 512,125 100 (584) (746) Nil Nil
53 FILIAL ESPAÑOLA DE HCL 30-Jun-11 350 100 (253) - Nil NilTECHNOLOGIES, S.L.(HCL Spain)
54 HCL Mexico S. de R.L. 31-Dec-10 6,490,497 100 7,076 - Nil Nil
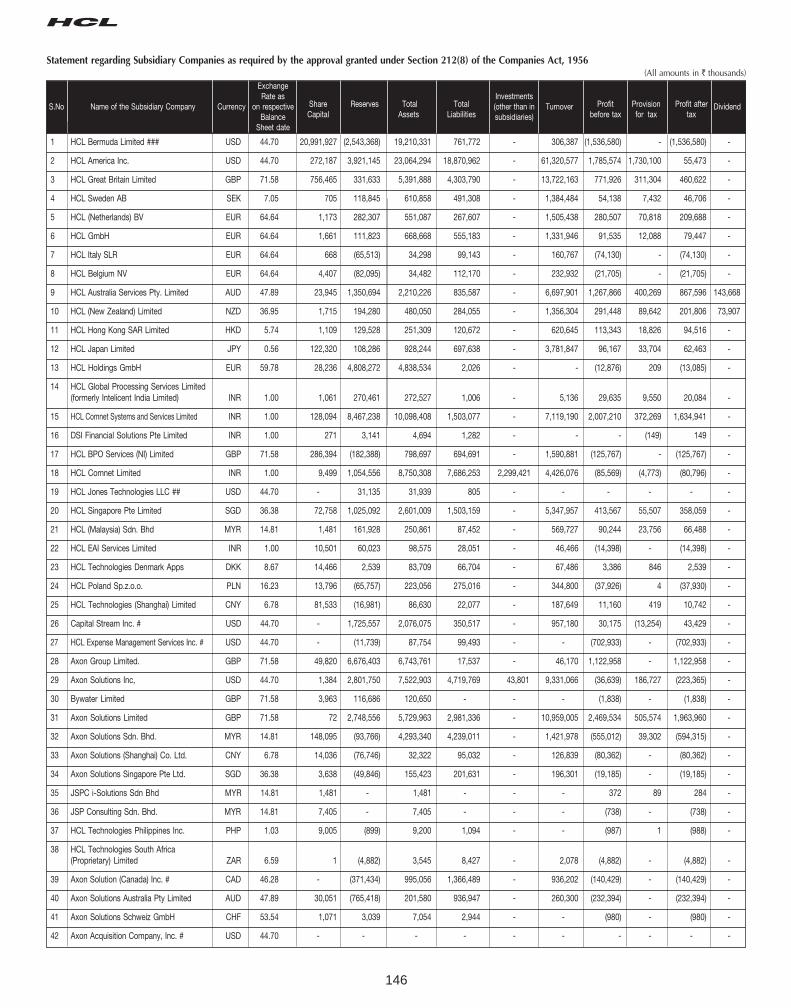
146
ExchangeRate as Investments
S.No Name of the Subsidiary Company Currency on respective Share Reserves Total Total (other than in Turnover Profit Provision Profit after DividendBalance Capital Assets Liabilities subsidiaries) before tax for tax tax
Sheet date
1 HCL Bermuda Limited ### USD 44.70 20,991,927 (2,543,368) 19,210,331 761,772 - 306,387 (1,536,580) - (1,536,580) -
2 HCL America Inc. USD 44.70 272,187 3,921,145 23,064,294 18,870,962 - 61,320,577 1,785,574 1,730,100 55,473 -
3 HCL Great Britain Limited GBP 71.58 756,465 331,633 5,391,888 4,303,790 - 13,722,163 771,926 311,304 460,622 -
4 HCL Sweden AB SEK 7.05 705 118,845 610,858 491,308 - 1,384,484 54,138 7,432 46,706 -
5 HCL (Netherlands) BV EUR 64.64 1,173 282,307 551,087 267,607 - 1,505,438 280,507 70,818 209,688 -
6 HCL GmbH EUR 64.64 1,661 111,823 668,668 555,183 - 1,331,946 91,535 12,088 79,447 -
7 HCL Italy SLR EUR 64.64 668 (65,513) 34,298 99,143 - 160,767 (74,130) - (74,130) -
8 HCL Belgium NV EUR 64.64 4,407 (82,095) 34,482 112,170 - 232,932 (21,705) - (21,705) -
9 HCL Australia Services Pty. Limited AUD 47.89 23,945 1,350,694 2,210,226 835,587 - 6,697,901 1,267,866 400,269 867,596 143,668
10 HCL (New Zealand) Limited NZD 36.95 1,715 194,280 480,050 284,055 - 1,356,304 291,448 89,642 201,806 73,907
11 HCL Hong Kong SAR Limited HKD 5.74 1,109 129,528 251,309 120,672 - 620,645 113,343 18,826 94,516 -
12 HCL Japan Limited JPY 0.56 122,320 108,286 928,244 697,638 - 3,781,847 96,167 33,704 62,463 -
13 HCL Holdings GmbH EUR 59.78 28,236 4,808,272 4,838,534 2,026 - - (12,876) 209 (13,085) -
14 HCL Global Processing Services Limited(formerly Intelicent India Limited) INR 1.00 1,061 270,461 272,527 1,006 - 5,136 29,635 9,550 20,084 -
15 HCL Comnet Systems and Services Limited INR 1.00 128,094 8,467,238 10,098,408 1,503,077 - 7,119,190 2,007,210 372,269 1,634,941 -
16 DSI Financial Solutions Pte Limited INR 1.00 271 3,141 4,694 1,282 - - - (149) 149 -
17 HCL BPO Services (NI) Limited GBP 71.58 286,394 (182,388) 798,697 694,691 - 1,590,881 (125,767) - (125,767) -
18 HCL Comnet Limited INR 1.00 9,499 1,054,556 8,750,308 7,686,253 2,299,421 4,426,076 (85,569) (4,773) (80,796) -
19 HCL Jones Technologies LLC ## USD 44.70 - 31,135 31,939 805 - - - - - -
20 HCL Singapore Pte Limited SGD 36.38 72,758 1,025,092 2,601,009 1,503,159 - 5,347,957 413,567 55,507 358,059 -
21 HCL (Malaysia) Sdn. Bhd MYR 14.81 1,481 161,928 250,861 87,452 - 569,727 90,244 23,756 66,488 -
22 HCL EAI Services Limited INR 1.00 10,501 60,023 98,575 28,051 - 46,466 (14,398) - (14,398) -
23 HCL Technologies Denmark Apps DKK 8.67 14,466 2,539 83,709 66,704 - 67,486 3,386 846 2,539 -
24 HCL Poland Sp.z.o.o. PLN 16.23 13,796 (65,757) 223,056 275,016 - 344,800 (37,926) 4 (37,930) -
25 HCL Technologies (Shanghai) Limited CNY 6.78 81,533 (16,981) 86,630 22,077 - 187,649 11,160 419 10,742 -
26 Capital Stream Inc. # USD 44.70 - 1,725,557 2,076,075 350,517 - 957,180 30,175 (13,254) 43,429 -
27 HCL Expense Management Services Inc. # USD 44.70 - (11,739) 87,754 99,493 - - (702,933) - (702,933) -
28 Axon Group Limited. GBP 71.58 49,820 6,676,403 6,743,761 17,537 - 46,170 1,122,958 - 1,122,958 -
29 Axon Solutions Inc, USD 44.70 1,384 2,801,750 7,522,903 4,719,769 43,801 9,331,066 (36,639) 186,727 (223,365) -
30 Bywater Limited GBP 71.58 3,963 116,686 120,650 - - - (1,838) - (1,838) -
31 Axon Solutions Limited GBP 71.58 72 2,748,556 5,729,963 2,981,336 - 10,959,005 2,469,534 505,574 1,963,960 -
32 Axon Solutions Sdn. Bhd. MYR 14.81 148,095 (93,766) 4,293,340 4,239,011 - 1,421,978 (555,012) 39,302 (594,315) -
33 Axon Solutions (Shanghai) Co. Ltd. CNY 6.78 14,036 (76,746) 32,322 95,032 - 126,839 (80,362) - (80,362) -
34 Axon Solutions Singapore Pte Ltd. SGD 36.38 3,638 (49,846) 155,423 201,631 - 196,301 (19,185) - (19,185) -
35 JSPC i-Solutions Sdn Bhd MYR 14.81 1,481 - 1,481 - - - 372 89 284 -
36 JSP Consulting Sdn. Bhd. MYR 14.81 7,405 - 7,405 - - - (738) - (738) -
37 HCL Technologies Philippines Inc. PHP 1.03 9,005 (899) 9,200 1,094 - - (987) 1 (988) -
38 HCL Technologies South Africa(Proprietary) Limited ZAR 6.59 1 (4,882) 3,545 8,427 - 2,078 (4,882) - (4,882) -
39 Axon Solution (Canada) Inc. # CAD 46.28 - (371,434) 995,056 1,366,489 - 936,202 (140,429) - (140,429) -
40 Axon Solutions Australia Pty Limited AUD 47.89 30,051 (765,418) 201,580 936,947 - 260,300 (232,394) - (232,394) -
41 Axon Solutions Schweiz GmbH CHF 53.54 1,071 3,039 7,054 2,944 - - (980) - (980) -
42 Axon Acquisition Company, Inc. # USD 44.70 - - - - - - - - - -
Statement regarding Subsidiary Companies as required by the approval granted under Section 212(8) of the Companies Act, 1956(All amounts in ` thousands)

147
Name of the Subsidiary CompanyName of the Subsidiary CompanyName of the Subsidiary CompanyName of the Subsidiary CompanyName of the Subsidiary Company Share Capital (Share Capital (Share Capital (Share Capital (Share Capital (`)))))
Capital Stream Inc. 447.00
HCL Expense Management Services Inc. 44.70
Axon Solution (Canada) Inc 463.00
Axon Acquisition Company, Inc. 45.00
## Since the company is under liquidation, no profit and loss account has been prepared and amount distributable to common shareholders has beenshown under reserves.
### Share application money pending allotment has been included in share capital.
For HCL Technologies LimitedFor HCL Technologies LimitedFor HCL Technologies LimitedFor HCL Technologies LimitedFor HCL Technologies Limited
Shiv NadarShiv NadarShiv NadarShiv NadarShiv Nadar T S R SubramanianT S R SubramanianT S R SubramanianT S R SubramanianT S R SubramanianChairman and Chief Strategy Officer Director
Vineet NayarVineet NayarVineet NayarVineet NayarVineet Nayar Anil ChananaAnil ChananaAnil ChananaAnil ChananaAnil ChananaVice Chairman, CEO & Wholetime Director Chief Financial Officer
Sandip GuptaSandip GuptaSandip GuptaSandip GuptaSandip Gupta Prahlad Rai BansalPrahlad Rai BansalPrahlad Rai BansalPrahlad Rai BansalPrahlad Rai BansalDeputy Chief Financial Officer Corporate Vice President - Finance
Raj Kumar WaliaRaj Kumar WaliaRaj Kumar WaliaRaj Kumar WaliaRaj Kumar Walia Manish AnandManish AnandManish AnandManish AnandManish AnandSenior Vice President - Finance & Accounts Deputy Company Secretary
Place: Noida, UP (India)Place: Noida, UP (India)Place: Noida, UP (India)Place: Noida, UP (India)Place: Noida, UP (India)Date: 16 September, 2011
Notes:# Refer table given below for absolute amount of share capital in each of the following companies:-
(All amounts in ` thousands)
Statement regarding Subsidiary Companies as required by the approval granted under Section 212(8) of the Companies Act, 1956
ExchangeRate as Investments
S.No Name of the Subsidiary Company Currency on respective Share Reserves Total Total (other than in Turnover Profit Provision Profit after DividendBalance Capital Assets Liabilities subsidiaries) before tax for tax tax
Sheet date
43 HCL Technologies Norway AS NOK 8.32 13,306 (26,047) 61,292 74,032 - 55,018 (36,176) (10,130) (26,047) -
44 HCL Insurance BPO Services Ltd. GBP 71.58 559,045 (253,324) 1,237,559 931,838 - 2,845,118 (100,786) (11,167) (89,619) -
45 HCL Technologies Canada Inc. CAD 46.28 9,594 56,021 161,038 95,424 - 557,314 563 225 337 -
46 HCL EAS Limited, USD 44.70 7,042,171 (938,494) 32,772,852 26,669,175 - - 694,068 - 694,068 -
47 HCL Axon (Pty) Ltd. ZAR 6.59 1 128,104 1,328,317 1,200,213 - 1,934,553 113,738 14,201 99,537 -
48 HCL (Brazil) Technologia da informacao Ltda. BRL 26.94 342,174 (316,862) 194,821 169,509 - 284,485 (229,054) - (229,054) -
49 HCL Technologies Romania s.r.l. RON 15.26 813 (2,596) 3,697 5,480 - 5,703 (1,463) 33 (1,496) -
50 HCL Hungary Limited HUF 0.24 2,189 1,115 4,690 1,386 - 11,030 1,354 207 1,147 -
51 HCL Latin America Holding LLC ### INR 1.00 533,780 (412) 533,367 - - - (120) - (120) -
52 HCL Argentina s.a. ARS 10.89 5,579 (2,571) 3,888 880 - 6,433 (584) - (584) -
53 FILIAL ESPAÑOLA DE HCLTECHNOLOGIES, S.L.(HCL Spain) EUR 64.64 226 (253) 227 253 - - (253) - (253) -
54 HCL Mexico S. de R.L. MXN 3.61 23,413 7,076 72,552 42,063 - 63,518 10,704 3,628 7,076 -
Prin
ted
at T
hom
son
Pre
ss
UT
ILIT
YF
OR
MS
PV
T.LT
D.P
h.D
elh
i-46757575
Mum
bai-6
6944090
Chennai-4
3542737
#50449
19th Annual General Meeting on Wednesday, 2nd November, 2011 at 3.00 P.M. at Air Force Auditorium, Subroto Park, New Delhi-110 010.
HCL TECHNOLOGIES LIMITED
Regd. Office: 806, Siddharth,
96, Nehru Place, New Delhi 110 019.
ATTENDANCE SLIP
FOR THE ATTENTION OF SHAREHOLDERSNO GIFTS WOULD BE DISTRIBUTED BY THE COMPANY AT THE AGM
Notes : 1. Please complete the Attendance slip and hand it over at the Registration Counter at the venue.
2. Members are requested to bring their copies of the Annual Report in the meeting.
PROXY FORM
I/We ……………………………………………………... of …………………………....................………………….......... being
a Member/Members of HCL Technologies Limited, hereby appoint .............................................. of ...................................
........................................... or failing him ........................................................ of ................................................................
as my/our Proxy to attend and vote for me/us on my/our behalf at the 19 Annual General Meeting of the Company, to be
held on Wednesday, at 3:00 P.M. at and any
adjournment thereof.
th
2nd November, 2011 Air Force Auditorium, Subroto Park, New Delhi-110 010
S
1. The proxies, to be effective, should be deposited at the Registered Office of the Company, at 806, Siddharth,96, Nehru Place, New Delhi - 110 019 not later than before the commencement of themeeting.
2. A proxy need not be a member of the Company.
3. In case of multiple proxies, proxy later in time shall be accepted.
igned this .................... day of .................... 2011(Signatures)
Notes:FORTY EIGHT HOURS
HCL TECHNOLOGIES LIMITEDRegd. Office: 806, Siddharth,96, Nehru Place, New Delhi 110 019.
________________________________________
Affix
Re.1/-
Revenue
Stamp
I hereby record my presence at the 19 Annual General Meeting of the Company held on
at 3:00 P.M. at
thWednesday, 2nd November, 2011
Air Force Auditorium, Subroto Park, New Delhi-110 010.
I am a member of the Company / I am a Proxy / Authorised Representative of the member(s)*.
.......................................................................................... ................................................................................................Name of the Member/Proxy/Authorised Representative* Signatures of the Member/Proxy/Authorised Representative*(in BLOCK LETTERS)
*Please strike off whichever is not applicable.