annual general meeting 2014 - upmassets.upm.com/governance/agm2014/ceo_presentation_final.pdf ·...
TRANSCRIPT

President and CEO
Jussi Pesonen
ANNUAL GENERAL MEETING 2014
| © UPM
Contents
• Year 2013
• UPM in transformation
• UPM strategy
• Sustainable competitiveness
• Summary
2

YEAR 2013
3 | © UPM

| © UPM
0
2
4
6
8
10
12
2008 2009 2010 2011 2012 2013
-6,0
-4,0
-2,0
0,0
2,0
4,0
6,0
8,0
10,0
2008 2009 2010 2011 2012 2013 2014E
Operating profit excl. special items
Profitability over two economic slowdowns
Europe has underperformed
the other major economic zones
Real GDP y-o-y growth % % of sales
EU
US
Emerging markets
4
Real GDP y-o-y growth %
5.4
3.5
8.2
6.8
5.3
6.8
Source: IHS Global Insight
| © UPM
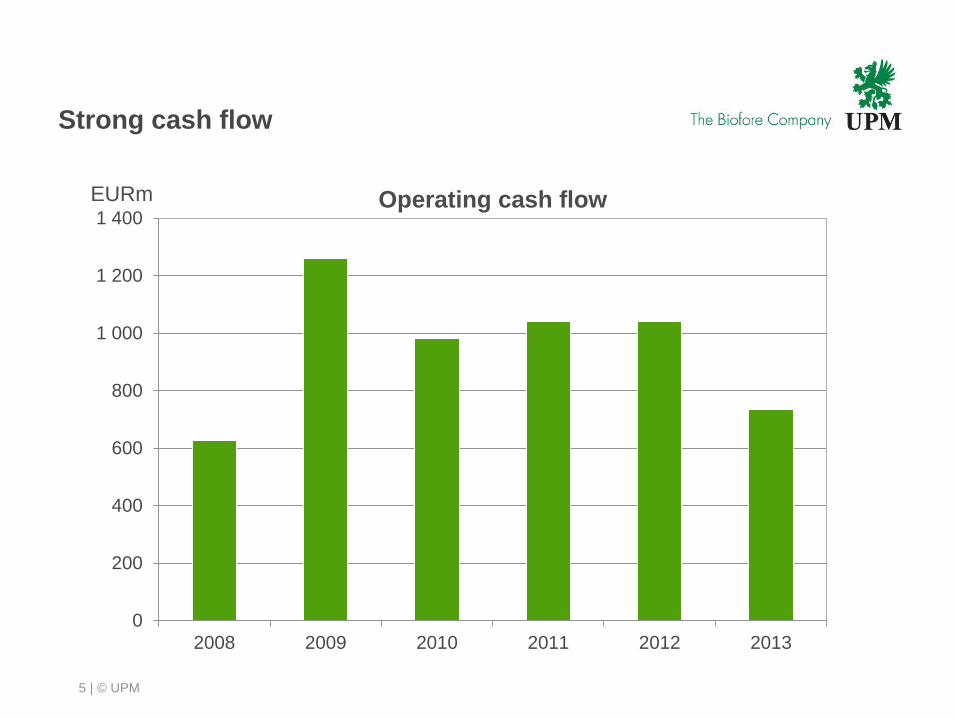
0
200
400
600
800
1 000
1 200
1 400
2008 2009 2010 2011 2012 2013
Strong cash flow
5
Operating cash flow EURm
| © UPM
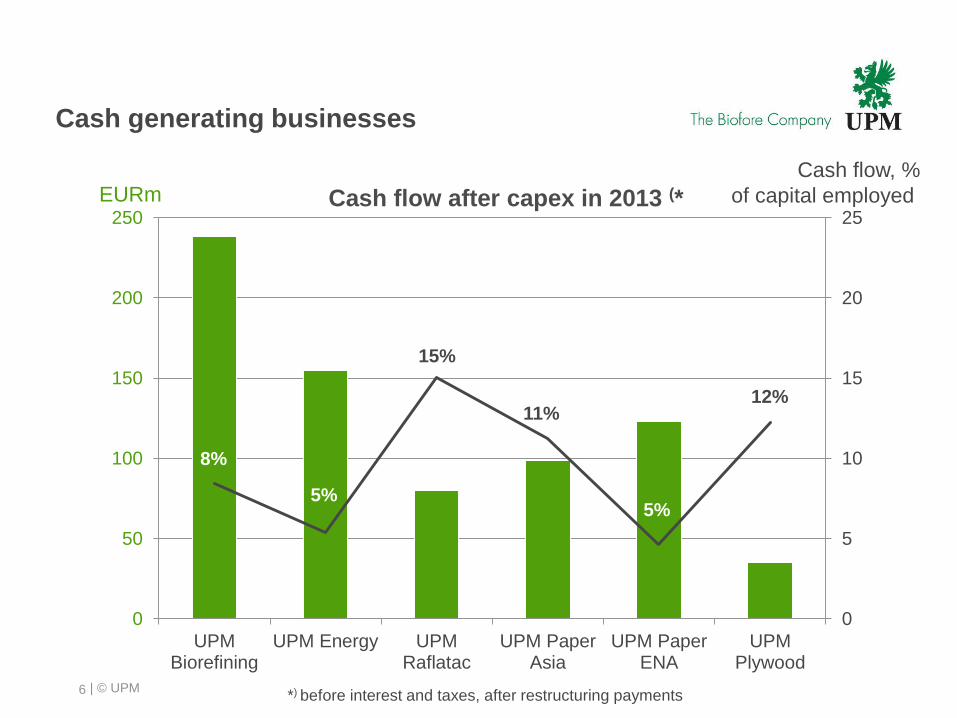
Cash generating businesses
0
5
10
15
20
25
0
50
100
150
200
250
UPMBiorefining
UPM Energy UPMRaflatac
UPM PaperAsia
UPM PaperENA
UPMPlywood
EURm Cash flow after capex in 2013 (*
6
Cash flow, %
of capital employed
8%
5%
15%
11%
5%
12%
*) before interest and taxes, after restructuring payments
| © UPM
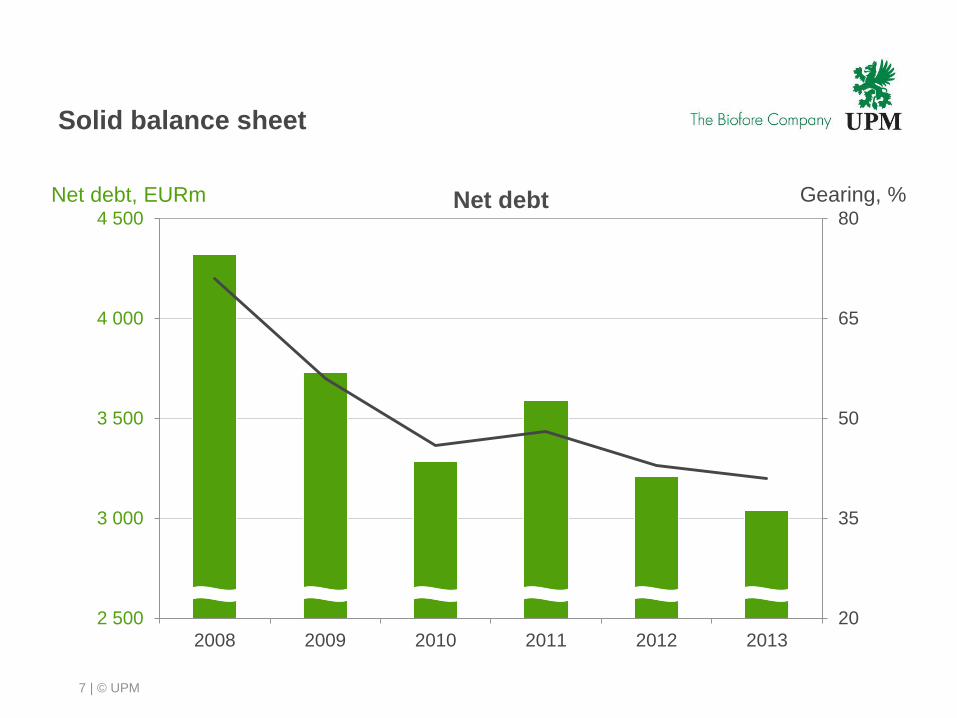
20
35
50
65
80
2 500
3 000
3 500
4 000
4 500
2008 2009 2010 2011 2012 2013
Solid balance sheet
7
Net debt Net debt, EURm Gearing, %

| © UPM
Low investment needs in existing assets allow
growth initiatives with modest total capex
8
0
200
400
600
800
1 000
1 200
2008 2009 2010 2011 2012 2013 2014e
EURm
Operational investments
329
Capital expenditure
Strategic investments
Depreciation
Uruguay
acquisition
Myllykoski
acquisition
450
Estimate

| © UPM
0,00
0,10
0,20
0,30
0,40
0,50
0,60
0,70
0,80
2008 2009 2010 2011 2012 2013
Cash flow based dividend
EUR per
share
0.40
0.45
0.55
9
Dividend policy
• at least 1/3 of net cash flow from
operating activities less
operational capital expenditure
• net cash flow calculated as an
average over three years
Minimum dividend by the
policy
• EUR 0.45 per share
Board’s proposal 2013
• EUR 0.60 (0.60) per share
0.60 0.60 0.60
Dividend and the Board’s proposal

| © UPM
ROCE (*
6.0% +1.8pp
Sales
EUR 10,054 m -4%
EBITDA
EUR 1,155 m -12%
Financials 2013 – summary
Operating cash flow
EUR 735 m -305m
Net debt
EUR 3,040 m -170m
*) excluding special items 10
Operating profit (*
EUR 683 m +23%
EPS (*
EUR 0.91 +0.17 Market capitalisation
EUR 6,497 m +40%
Board’s dividend proposal
EUR 0.60 / share same
Gearing
41% -2 pp
| © UPM 11 | © UPM
UPM IN TRANSFORMATION

| © UPM
Materials and energy efficiency
Renewable and recyclable products
Innovation and new businesses
Resource scarcity
Power shift in global economy
Climate change
Digitalisation
World is changing Biofore – growth
and competitiveness
FOREST OF NEW OPPORTUNITIES
12

| © UPM
UPM in transformation
13
0 %
20 %
40 %
60 %
80 %
100 %
2013
Paper ENA
Plywood
Energy
Paper Asia
Raflatac
Biorefining
0 %
20 %
40 %
60 %
80 %
100 %
2003
Sold units
Paper
Plywood
Raflatac
Sawmilling
2003:
integrated
paper company
2008:
towards market-
driven businesses
2013:
six separate
businesses
Sales
EBIT (*
Net debt
Market cap
Personnel
EUR 9.9bn
EUR 429m
EUR 4.9bn
EUR 7.9bn
34,500
EUR 9.5bn
EUR 513m
EUR 4.3bn
EUR 4.7bn
25,000
EUR 10.1bn
EUR 683m
EUR 3.0bn
EUR 6.5bn
21,000
Business
portfolio,
sales
*) excluding special items
0 %
20 %
40 %
60 %
80 %
100 %
2008
Sold units
Paper
Plywood
Raflatac
Sawmilling

| © UPM
UPM’s new business structure
14
UPM Biorefining
UPM Paper Asia
UPM Raflatac
UPM Energy
UPM Paper ENA
UPM Plywood
| © UPM
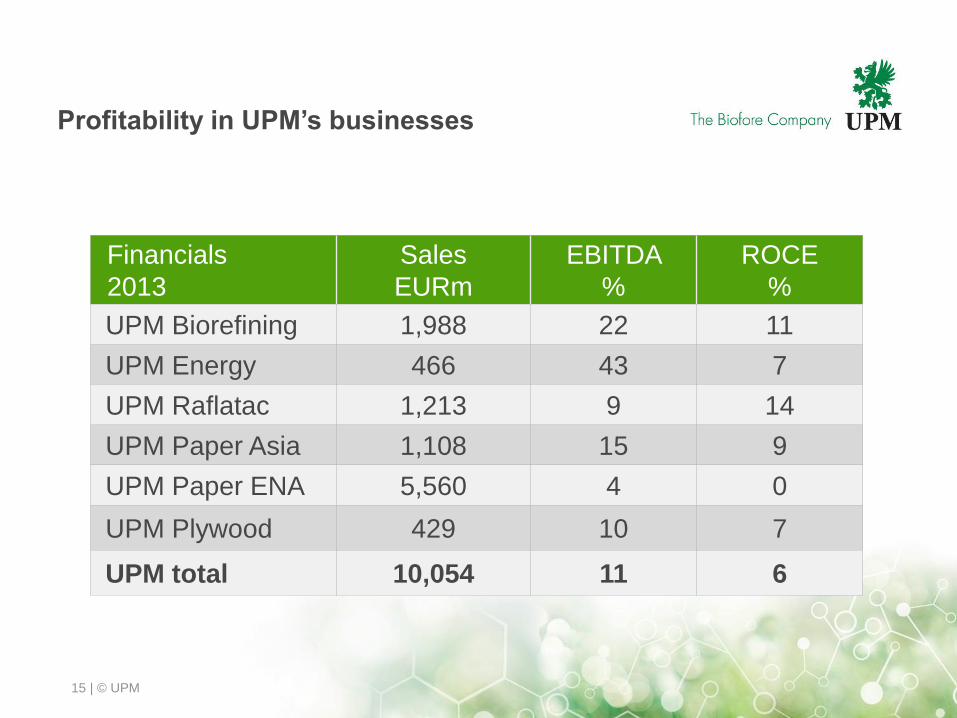
Profitability in UPM’s businesses
15
Financials
2013
Sales
EURm
EBITDA
%
ROCE
%
UPM Biorefining 1,988 22 11
UPM Energy 466 43 7
UPM Raflatac 1,213 9 14
UPM Paper Asia 1,108 15 9
UPM Paper ENA 5,560 4 0
UPM Plywood 429 10 7
UPM total 10,054 11 6

| © UPM
UPM Energy
High performing energy business
Competitive low-emission electricity generation: hydro, nuclear and condensing power
Electricity trading in physical and derivatives markets
16
UPM Energy 2013 (EURm)
Sales 466
EBITDA 198
EBITDA, % 43%
ROCE, % 7%
| © UPM
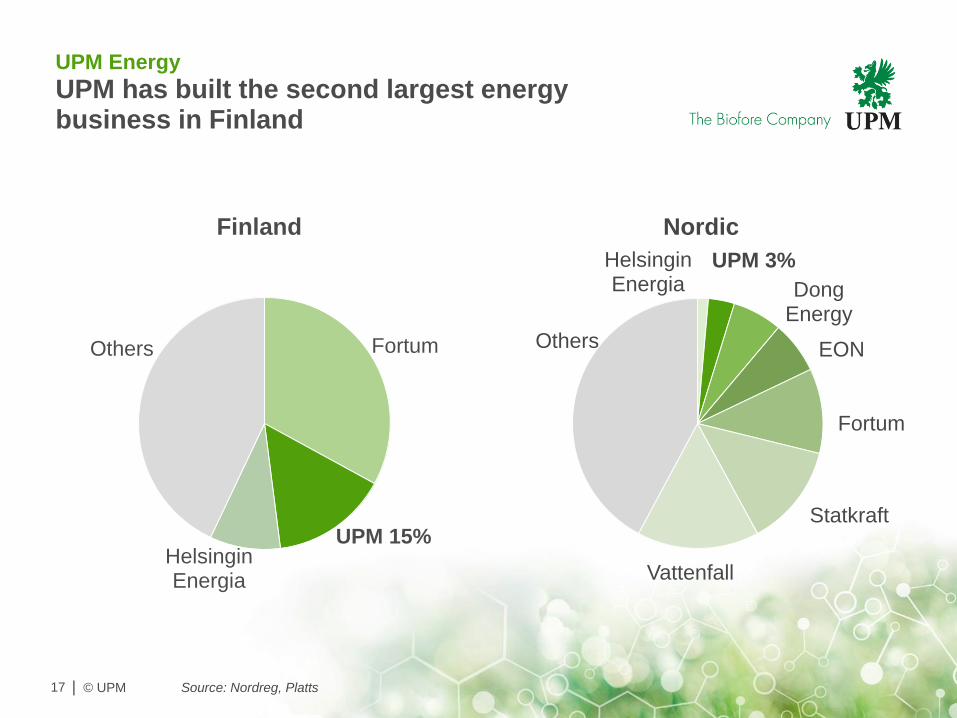
Source: Nordreg, Platts
UPM Energy
UPM has built the second largest energy business in Finland
17
Helsingin Energia
UPM 3%
Dong Energy
EON
Fortum
Statkraft
Vattenfall
Others
Nordic
Fortum
UPM 15% Helsingin Energia
Others
Finland

| © UPM
UPM Energy
Competitive energy sources and trading capability keys to profitability
• Commodity prices,
e.g. coal and CO2
• Hydrological balance
• Growing renewables
capacity
• Interconnectors to Central
Europe and Russia
18
Source: Reuters
0
10
20
30
40
50
60
70
80
0
10
20
30
40
50
60
70
80
Coal SRMC Front Year
System Front Year
Helsinki Front Year
EUR/MWh Finnish and Nordic
electricity prices

| © UPM
UPM Paper ENA 2013 (EURm)
Sales 5,560
EBITDA 232
EBITDA, % 4%
ROCE, % 0%
Cash flow/CE 5%
UPM Paper ENA
Driving for cash
Paper for magazine and newspaper
publishers, advertising and home
and office
Large low-cost asset base and
global sales network
19 | © UPM

| © UPM
UPM 21 %
Stora Enso 16 %
Sappi 8 %
Norske Skog 5 %
Burgo 5 %
Mondi 4 %
Portucel 4 %
Holmen 3 %
IP 3 %
Lecta 3 %
Palm 2 %
Industry structure 45 million tons (end of 2013)
UPM Paper ENA
European graphic paper market is oversupplied,
industry structure is fragmented
Sources: Euro-Graph, PPPC
0
10
20
30
40
50
60
2008 2009 2010 2011 2012 2013p
Million tonnes
Demand Net Exports Capacity
Demand and capacity
Sources: JP Webbmill
89 smaller
producers
20

| © UPM
-20
-15
-10
-5
0
5
10
15
20
-6,0
-3,0
0,0
3,0
6,0
1996 1997 1998 1999 2000 2001 2002 2003 2004 2005 2006 2007 2008 2009 2010 2011 2012 2013 2014
Paper demand growth (% trailing 3 month)
Sources: Euro-Graph, OECD
Euro zone composite leading indicator* (Y/Y %)
Graphic paper demand growth
Euro zone composite leading indicator
21
UPM Paper ENA
Signs of improvement in European economy –
impact on paper demand too early to conclude
| © UPM
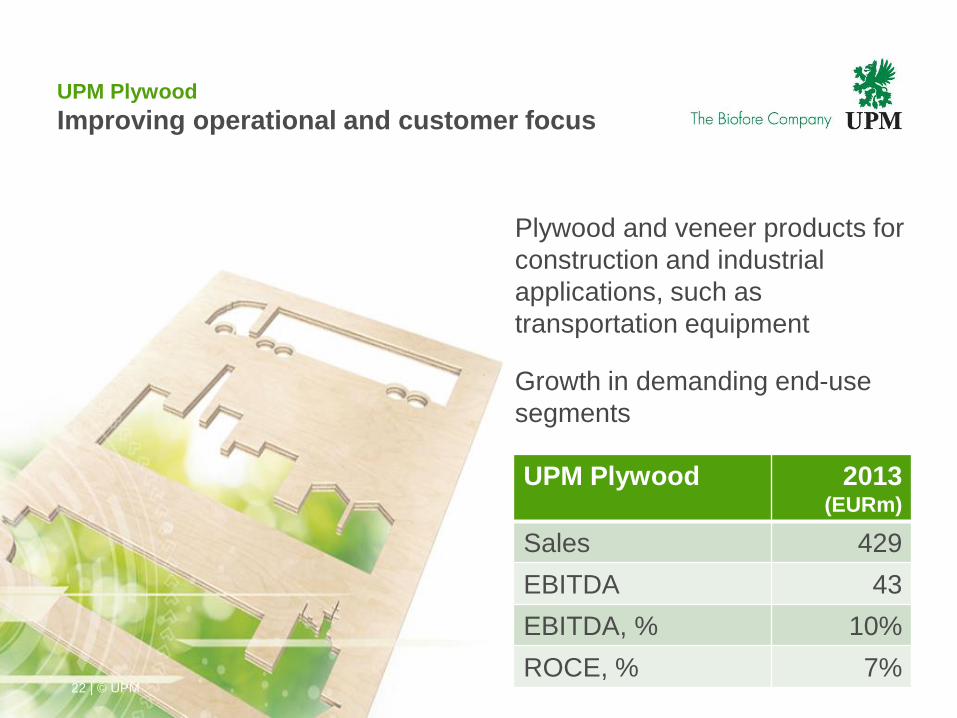
UPM Plywood
Improving operational and customer focus
UPM Plywood 2013 (EURm)
Sales 429
EBITDA 43
EBITDA, % 10%
ROCE, % 7% 22 | © UPM
Plywood and veneer products for
construction and industrial
applications, such as
transportation equipment
Growth in demanding end-use
segments

| © UPM
UPM Plywood
Profitability turnaround achieved with
internal measures
• Improvement in UPM
Plywood’s sales
– Renewed commercial
strategy
– Growth in demanding
end-use segments, e.g.
the LNG industry
• Significant improvement in
productivity, strict cost control
23
Source: FEIC, Euroconstruct
90
100
110
120
130
2010 2011 2012 2013
Index
0%
5%
10%
15%
20%
25%
30%
2010 2011 2012 2013
UPM Plywood sales
Eurozone GDP
EU construction
Emerging markets, % of sales
| © UPM
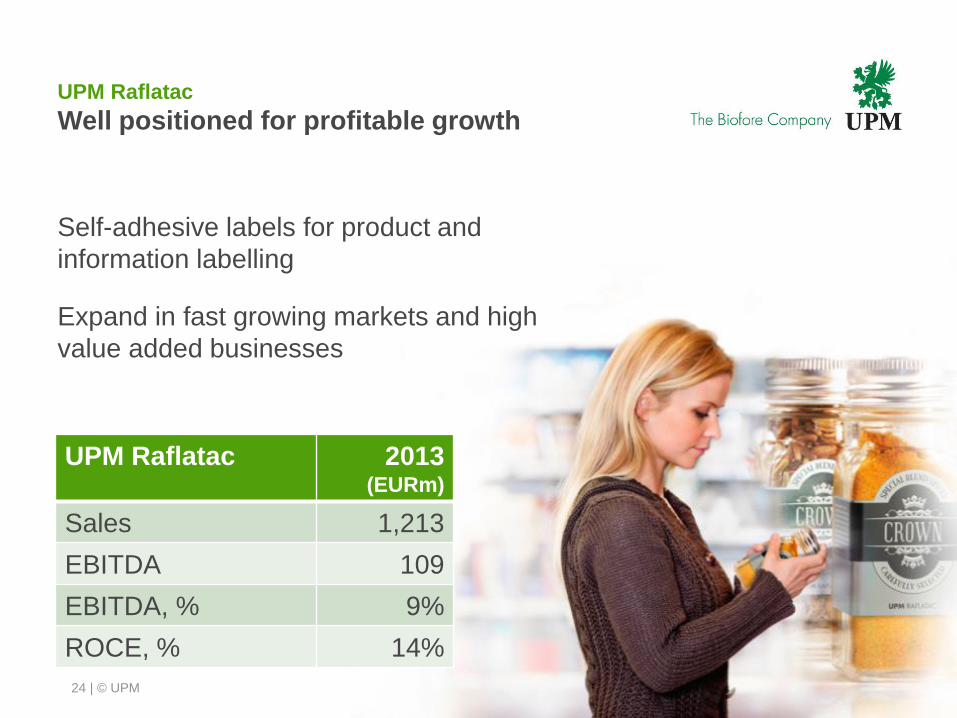
UPM Raflatac
Well positioned for profitable growth
Self-adhesive labels for product and
information labelling
Expand in fast growing markets and high
value added businesses
UPM Raflatac 2013 (EURm)
Sales 1,213
EBITDA 109
EBITDA, % 9%
ROCE, % 14%
24

| © UPM
UPM Raflatac
UPM is the second largest self-adhesive
label supplier globally
Our products
touch
peoples’ lives
in numerous
ways
each day
25
| © UPM
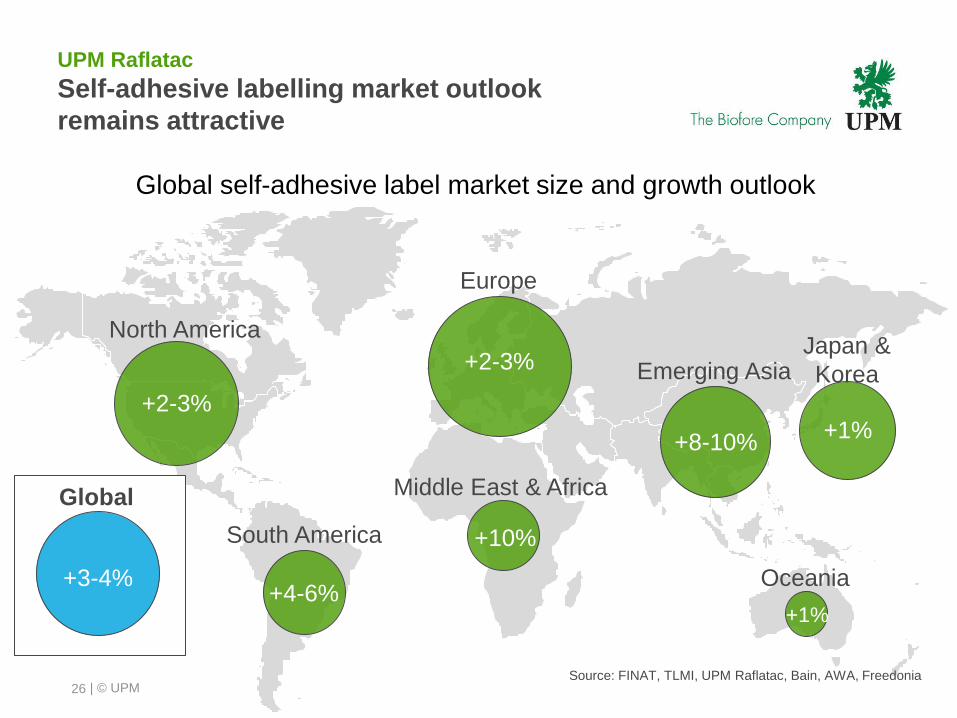
UPM Raflatac
Self-adhesive labelling market outlook
remains attractive
26
+2-3%
North America
Europe
+2-3%
South America
+4-6%
Middle East & Africa
+10%
Emerging Asia
+8-10%
Japan &
Korea
+1%
Oceania
+1%
Global self-adhesive label market size and growth outlook
Source: FINAT, TLMI, UPM Raflatac, Bain, AWA, Freedonia
+3-4%
Global

| © UPM
UPM Paper Asia
Growing in attractive segments
27
Fine and office papers in Asia, and
labelling materials globally
Recognized industry leader in
sustainability
Extensive own sales network
UPM Paper Asia 2013 (EURm)
Sales 1,108
EBITDA 161
EBITDA, % 15%
ROCE, % 9%

| © UPM
2012 2020
UPM Paper Asia
Global market leader in labelling materials
28
2012 2020
2012 2020
2012 2020
2012 2020
Source: AWA, Bain, Poyry, RISI, UPM *)Glassine/SCK are papers used in labelling materials as release liners
Tervasaari Jämsänkoski
Changshu
Labelling: glassine/SCK(* demand outlook by 2020
North America +2% p.a.
Europe +3% p.a.
South America +7% p.a.
Globally +4% p.a.
Asia Pacific +8% p.a.

| © UPM
Changshu
29
Regional warehouse in China
Sales office
2012 2020 2012 2020
UPM Paper Asia
Market leader in high quality office papers in
China with extensive, own sales network
Source: RISI, Poyry, UPM
Fine and office paper demand in Asia by 2020
WFC
WFU
China APAC
+2% p.a. +3% p.a.

| © UPM
UPM Biorefining
Creating value on biomass
30
Pulp, biofuels, sawn timber and integrated
energy production
Integration synergies in wood sourcing and
mill operations
UPM Biorefining aims to grow both in
terms of volumes and in product diversity
UPM Biorefining 2013
(EURm)
Sales 1,988
EBITDA 435
EBITDA, % 22%
ROCE, % 11%

| © UPM
UPM Biorefining
85% of pulp demand is in growing end-use
segments
Bleached market pulp demand by end-use and region
*Source: Hawkins Wright.
End use markets for bleached kraft pulp,
September 2013
WE NA China ROW Total
P&W 11% 4% 11% 8% 34%
Tissue 10% 6% 6% 10% 32%
Packaging 1% 0% 4% 2% 8%
Speciality 6% 1% 4% 4% 16%
Fluff 2% 2% 1% 4% 10%
30% 14% 27% 28% 100%
= declining market segment (15%)
= growing market segment (85%)
31
| © UPM
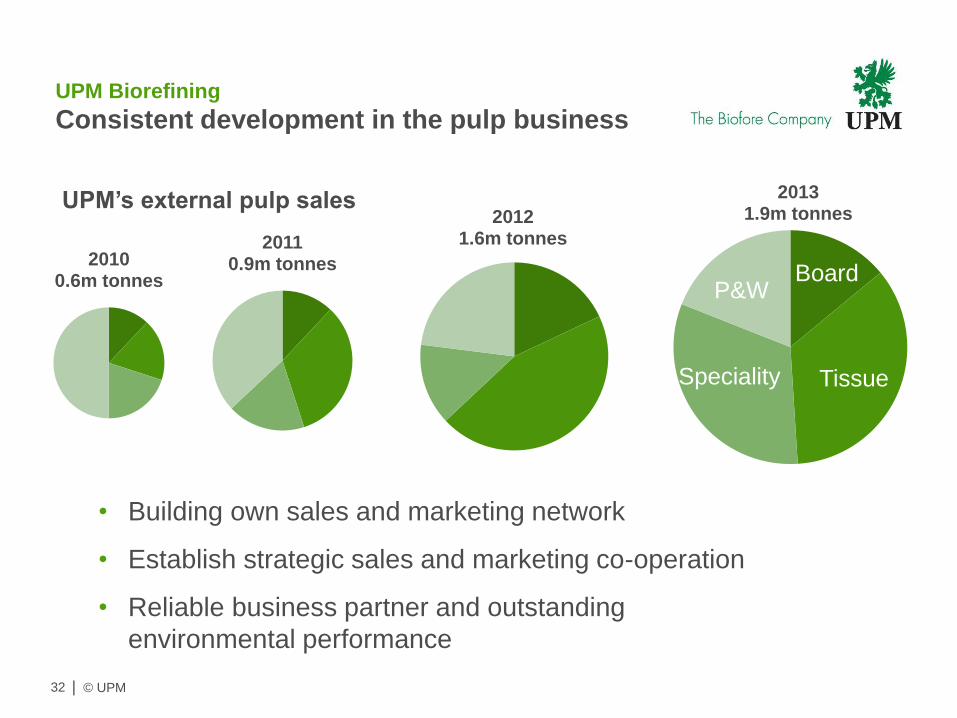
UPM Biorefining Consistent development in the pulp business
32
2010 0.6m tonnes
2011 0.9m tonnes
2012 1.6m tonnes
2013 1.9m tonnes
• Building own sales and marketing network
• Establish strategic sales and marketing co-operation
• Reliable business partner and outstanding
environmental performance
UPM’s external pulp sales
Board
Tissue Speciality
P&W
| © UPM 33
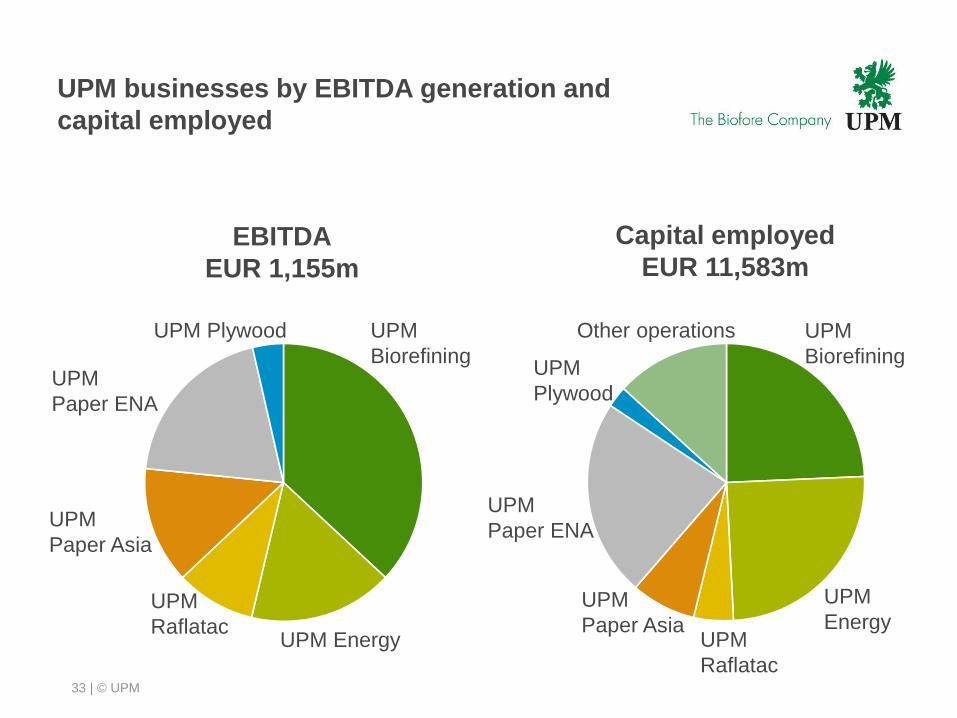
EBITDA
EUR 1,155m
Capital employed
EUR 11,583m
UPM
Energy
UPM
Biorefining
UPM
Raflatac
UPM
Paper Asia
UPM
Paper ENA
UPM
Plywood
Other operations
UPM Energy
UPM
Biorefining
UPM
Raflatac
UPM
Paper Asia
UPM
Paper ENA
UPM Plywood
UPM businesses by EBITDA generation and
capital employed

| © UPM
Performance • Top performance in each business area
Portfolio • Develop UPM business portfolio in order to
increase its value and create growth
Financials • Strong cash flow, operating profit margin > 10%
Balance sheet • Strong balance sheet
Dividend policy • Cash flow based, good dividend
34
Group targets
| © UPM 35 | © UPM
UPM STRATEGY

| © UPM
Profit
improvement
programme
EUR 200m
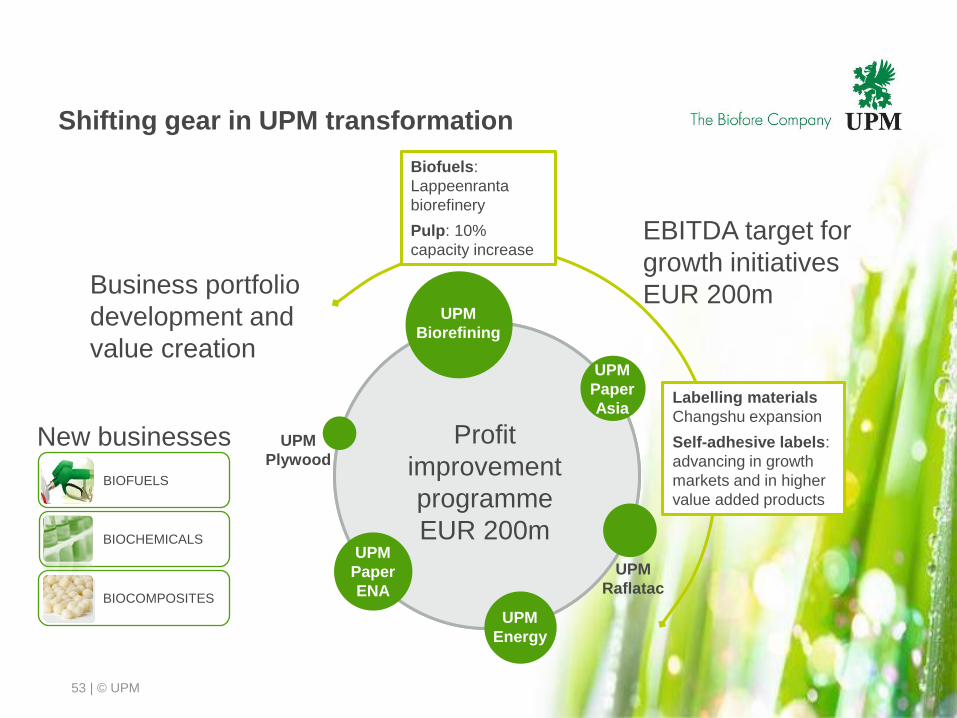
Shifting gear in UPM transformation
36
UPM
Biorefining
UPM
Paper
Asia
UPM
Raflatac
UPM
Energy
UPM
Paper
ENA
UPM
Plywood
EBITDA target for
growth initiatives
EUR 200m
Biofuels:
Lappeenranta
biorefinery
Pulp: 10%
capacity increase
Labelling materials
Changshu expansion
Self-adhesive labels:
advancing in growth
markets and in higher
value added products
Business portfolio
development and
value creation
BIOCHEMICALS
BIOCOMPOSITES
BIOFUELS
New businesses

| © UPM
Profit
improvement
programme
EUR 200m
Shifting gear in UPM transformation
37
UPM
Biorefining
UPM
Paper
Asia
UPM
Raflatac
UPM
Energy
UPM
Paper
ENA
UPM
Plywood
EBITDA target for
growth initiatives
EUR 200m
Biofuels:
Lappeenranta
biorefinery
Pulp: 10%
capacity increase
Labelling materials
Changshu expansion
Self-adhesive labels:
advancing in growth
markets and in higher
value added products
Business portfolio
development and
value creation
BIOCHEMICALS
BIOCOMPOSITES
BIOFUELS
New businesses 1.

| © UPM
Profit improvement programme
progressing fast
0
50
100
150
200
250
Q213 Q313 Q413 Q114 Q214 Q314 Q414 Q115
38
EURm
Full impact of the programme is expected by the end
of 2014, as compared with the Q2/13 results
48%
achieved
in Q4/13
EUR 200m
annualised
fixed and
variable
cost
savings

| © UPM
Profit
improvement
programme
EUR 200m
Shifting gear in UPM transformation
39
UPM
Biorefining
UPM
Paper
Asia
UPM
Raflatac
UPM
Energy
UPM
Paper
ENA
UPM
Plywood
EBITDA target for
growth initiatives
EUR 200m
Biofuels:
Lappeenranta
biorefinery
Pulp: 10%
capacity increase
Labelling materials
Changshu expansion
Self-adhesive labels:
advancing in growth
markets and in higher
value added products
Business portfolio
development and
value creation
BIOCHEMICALS
BIOCOMPOSITES
BIOFUELS
New businesses
2.
| © UPM
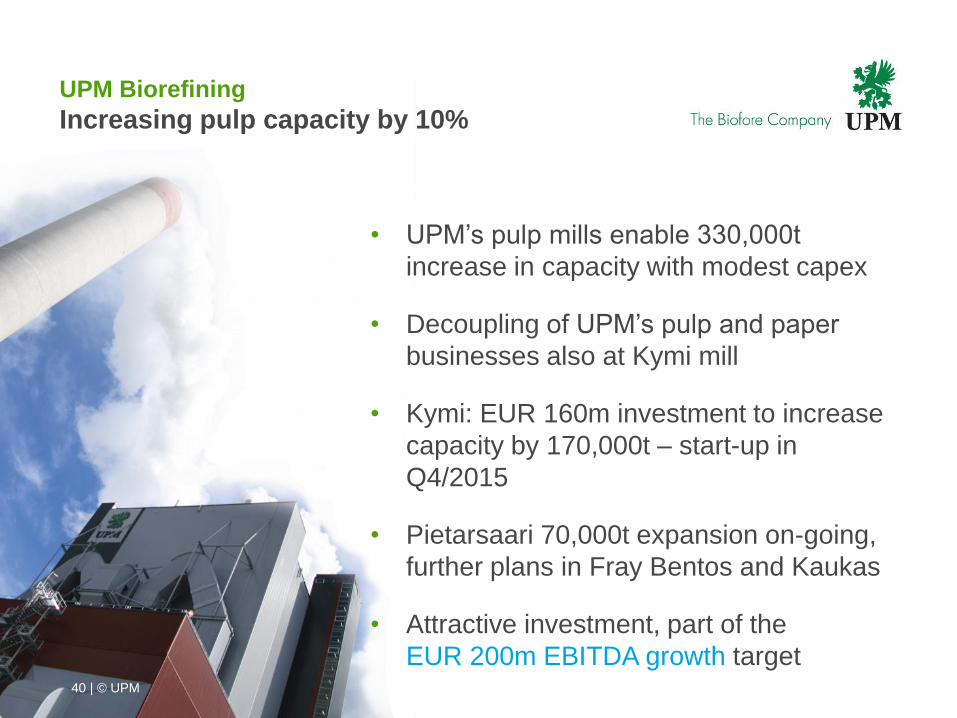
UPM Biorefining
Increasing pulp capacity by 10%
• UPM’s pulp mills enable 330,000t
increase in capacity with modest capex
• Decoupling of UPM’s pulp and paper
businesses also at Kymi mill
• Kymi: EUR 160m investment to increase
capacity by 170,000t – start-up in
Q4/2015
• Pietarsaari 70,000t expansion on-going,
further plans in Fray Bentos and Kaukas
• Attractive investment, part of the
EUR 200m EBITDA growth target
40 | © UPM

| © UPM
UPM Biorefining
UPM creates new business in
wood-based renewable diesel
• Potential to become a large new business
• Renewable diesel for all diesel engines
• UPM technology
• Lappeenranta 100,000t refinery start-up
in summer 2014
• Attractive EUR 150m investment, part of
the EUR 200m EBITDA growth target
41 41 | © UPM

| © UPM
UPM Paper Asia
Changshu expansion in labelling materials
• Strengthen UPM’s leading global position in
labelling materials
• New production line in Changshu, China – up
to 360,000t of labelling materials and speciality
papers
• Start-up by the end of 2015
• Attractive EUR 277m investment, part of
the EUR 200m EBITDA growth target
8 April 2014 42

| © UPM 43
UPM Raflatac
Profitable growth in self-adhesive labels
• Capture global market growth
• Strengthen position in fast growing markets:
50% expansion in China and Malaysia
• Develop high value added products
• Grow with low capex and attractive returns,
part of the EUR 200m EBITDA growth target

| © UPM
Profit
improvement
programme
EUR 200m
Shifting gear in UPM transformation
44
UPM
Biorefining
UPM
Paper
Asia
UPM
Raflatac
UPM
Energy
UPM
Paper
ENA
UPM
Plywood
EBITDA target for
growth initiatives
EUR 200m
Biofuels:
Lappeenranta
biorefinery
Pulp: 10%
capacity increase
Labelling materials
Changshu expansion
Self-adhesive labels:
advancing in growth
markets and in higher
value added products
Business portfolio
development and
value creation
BIOCHEMICALS
BIOCOMPOSITES
BIOFUELS
New businesses
3.

| © UPM
Portfolio development and value creation
• Performance: targeting top performance
in each business
• Grow: focused high-return growth
investments and synergistic M&A
• Simplify: best value realisation for UPM
• Consolidation in European paper
market, without increasing capital
45 | © UPM

| © UPM
Profit
improvement
programme
EUR 200m
Shifting gear in UPM transformation
46
UPM
Biorefining
UPM
Paper
Asia
UPM
Raflatac
UPM
Energy
UPM
Paper
ENA
UPM
Plywood
EBITDA target for
growth initiatives
EUR 200m
Biofuels:
Lappeenranta
biorefinery
Pulp: 10%
capacity increase
Labelling materials
Changshu expansion
Self-adhesive labels:
advancing in growth
markets and in higher
value added products
Business portfolio
development and
value creation
BIOCHEMICALS
BIOCOMPOSITES
BIOFUELS
New businesses
4.

| © UPM | © UPM
• Biofuels renewable drop-in
diesel suitable for all diesel
engines
• Biochemicals renewable
drop-in alternatives for oil-
based chemicals
• Biocomposites for injection
moulding to replace oil-based
raw materials
0
50
100
150
200
250
300
350
2009 2010 2011 2012 2013
Annual patent filings 2009–2013
47
New businesses based on UPM’s
development work

SUSTAINABLE COMPETITIVENESS
48 | © UPM

| © UPM
Productivity development in 10 years
0,20
0,25
0,30
0,35
0,40
0,45
0,50
49
EURm
IN FIVE YEARS
+27%
IN TEN YEARS
+69%
Sales per employee

| © UPM
Materials efficiency development in 10 years
in UPM’s paper mills
50
WATER CONSUMPTION
–25% LANDFILL WASTE
–10% ELECTRICITY
CONSUMPTION
–20% CERTIFIED FIBRE
80%
| © UPM
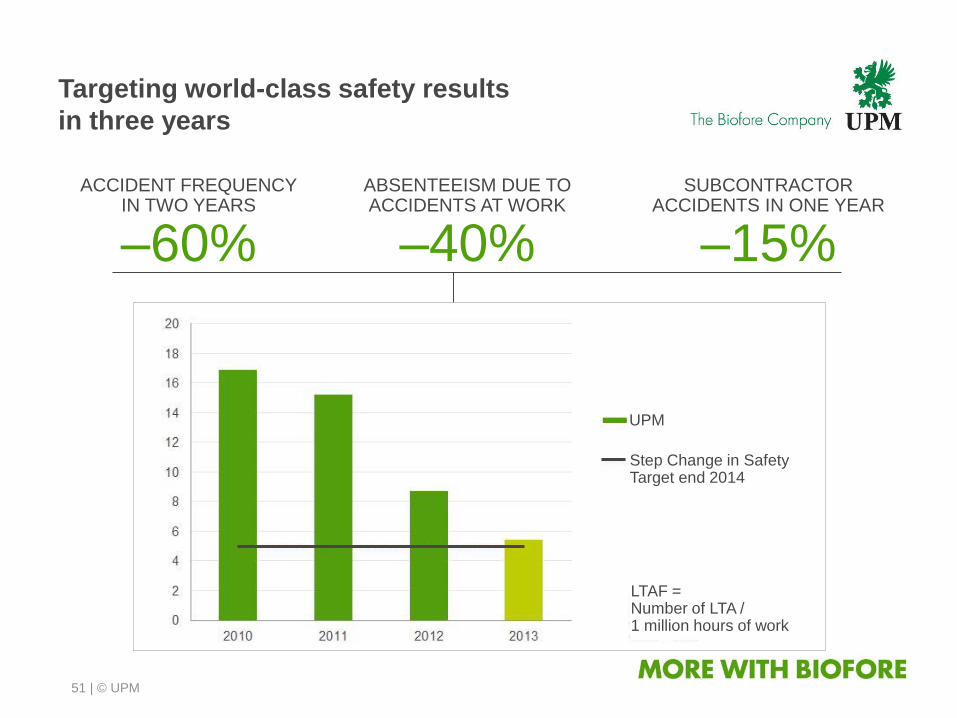
Targeting world-class safety results
in three years
ACCIDENT FREQUENCY IN TWO YEARS
–60%
SUBCONTRACTOR ACCIDENTS IN ONE YEAR
–15%
ABSENTEEISM DUE TO ACCIDENTS AT WORK
–40%
UPM
Step Change in Safety Target end 2014
LTAF = Number of LTA / 1 million hours of work
51

SUMMARY
52 | © UPM
| © UPM
Profit
improvement
programme
EUR 200m
Shifting gear in UPM transformation
53
UPM
Biorefining
UPM
Paper
Asia
UPM
Raflatac
UPM
Energy
UPM
Paper
ENA
UPM
Plywood
EBITDA target for
growth initiatives
EUR 200m
Biofuels:
Lappeenranta
biorefinery
Pulp: 10%
capacity increase
Labelling materials
Changshu expansion
Self-adhesive labels:
advancing in growth
markets and in higher
value added products
Business portfolio
development and
value creation
BIOCHEMICALS
BIOCOMPOSITES
BIOFUELS
New businesses
