annual assessment of the microfinance · pdf fileannual assessment of the microfinance...
TRANSCRIPT
PAKISTAN MICROFINANCE REVIEWAnnual Assessment of the Microfinance Industry
FINANCIAL SERVICES FOR ALL
2012

2
Produced by: Pakistan Microfinance NetworkArt Direction: Sumaira SagheerDesign & Layout: Uzma ToorPhotocredits: Retroactive Studios LibraryPrinted at: Pangraphics
© 2013 Pakistan Microfinance Network
PAKISTAN MICROFINANCE REVIEWAnnual Assessment of the Microfinance Industry
FINANCIAL SERVICES FOR ALL

EDITORIAL BOARD
Mr. Ghalib Nishtar Chairperson Editorial Board President, Khushali Bank
Dr. Saeed Ahmed Head of Department, Agriculture Credit and Microfinance Department State Bank of Pakistan
Mr. Blain Stephens COO and Director of Analysis Microfinance Information eXchange, Inc. (MIX)
Mr. Raza Khan Statistics & Results Adviser, Results & Evaluation Team- Economic Growth Group Department for International Development (UK)
Mr. Yasir Ashfaq Group Head, Financial Services Group Pakistan Poverty Alleviation Fund
Mr. Abrar Mir EVP and Group Head, Digital Money & Mobile Payments, United Bank Limited (UBL)
Mr. Masood Safdar Gill Director Program, Urban Poverty Alleviation Program National Rural Support Programme
PMN TEAMMs. Aban Haq Advisor
Mr. Ali Basharat Author and Managing Editor
Mr. Ammar Arshad Co-Author
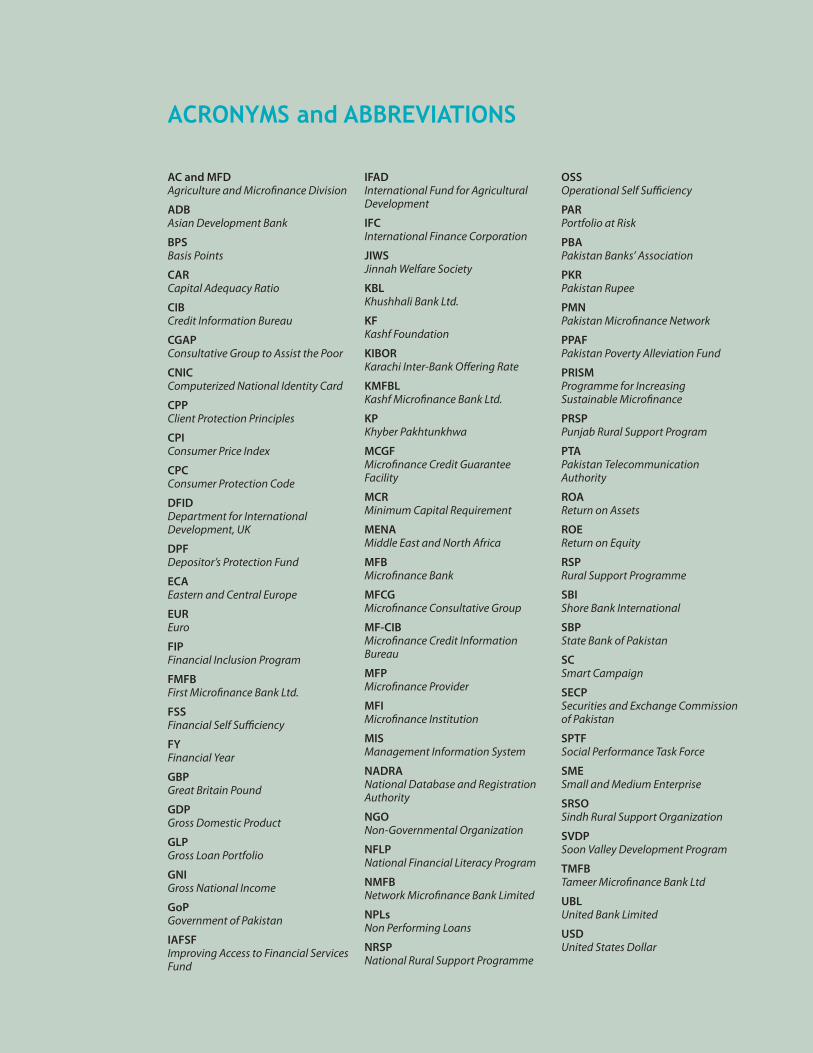
ACRONYMS and ABBREVIATIONS
AC and MFD Agriculture and Microfinance Division
ADB Asian Development Bank
BPS Basis Points
CAR Capital Adequacy Ratio
CIB Credit Information Bureau
CGAP Consultative Group to Assist the Poor
CNIC Computerized National Identity Card
CPP Client Protection Principles
CPI Consumer Price Index
CPC Consumer Protection Code
DFID Department for International Development, UK
DPF Depositor’s Protection Fund
ECA Eastern and Central Europe
EUR Euro
FIP Financial Inclusion Program
FMFB First Microfinance Bank Ltd.
FSS Financial Self Sufficiency
FY Financial Year
GBP Great Britain Pound
GDP Gross Domestic Product
GLP Gross Loan Portfolio
GNI Gross National Income
GoP Government of Pakistan
IAFSF Improving Access to Financial Services Fund
IFAD International Fund for Agricultural Development
IFC International Finance Corporation
JIWS Jinnah Welfare Society
KBL Khushhali Bank Ltd.
KF Kashf Foundation
KIBOR Karachi Inter-Bank Offering Rate
KMFBL Kashf Microfinance Bank Ltd.
KP Khyber Pakhtunkhwa
MCGF Microfinance Credit Guarantee Facility
MCR Minimum Capital Requirement
MENA Middle East and North Africa
MFB Microfinance Bank
MFCG Microfinance Consultative Group
MF-CIB Microfinance Credit Information Bureau
MFP Microfinance Provider
MFI Microfinance Institution
MIS Management Information System
NADRA National Database and Registration Authority
NGO Non-Governmental Organization
NFLP National Financial Literacy Program
NMFB Network Microfinance Bank Limited
NPLs Non Performing Loans
NRSP National Rural Support Programme
OSS Operational Self Sufficiency
PAR Portfolio at Risk
PBA Pakistan Banks’ Association
PKR Pakistan Rupee
PMN Pakistan Microfinance Network
PPAF Pakistan Poverty Alleviation Fund
PRISM Programme for Increasing Sustainable Microfinance
PRSP Punjab Rural Support Program
PTA Pakistan Telecommunication Authority
ROA Return on Assets
ROE Return on Equity
RSP Rural Support Programme
SBI Shore Bank International
SBP State Bank of Pakistan
SC Smart Campaign
SECP Securities and Exchange Commission of Pakistan
SPTF Social Performance Task Force
SME Small and Medium Enterprise
SRSO Sindh Rural Support Organization
SVDP Soon Valley Development Program
TMFB Tameer Microfinance Bank Ltd
UBL United Bank Limited
USD United States Dollar
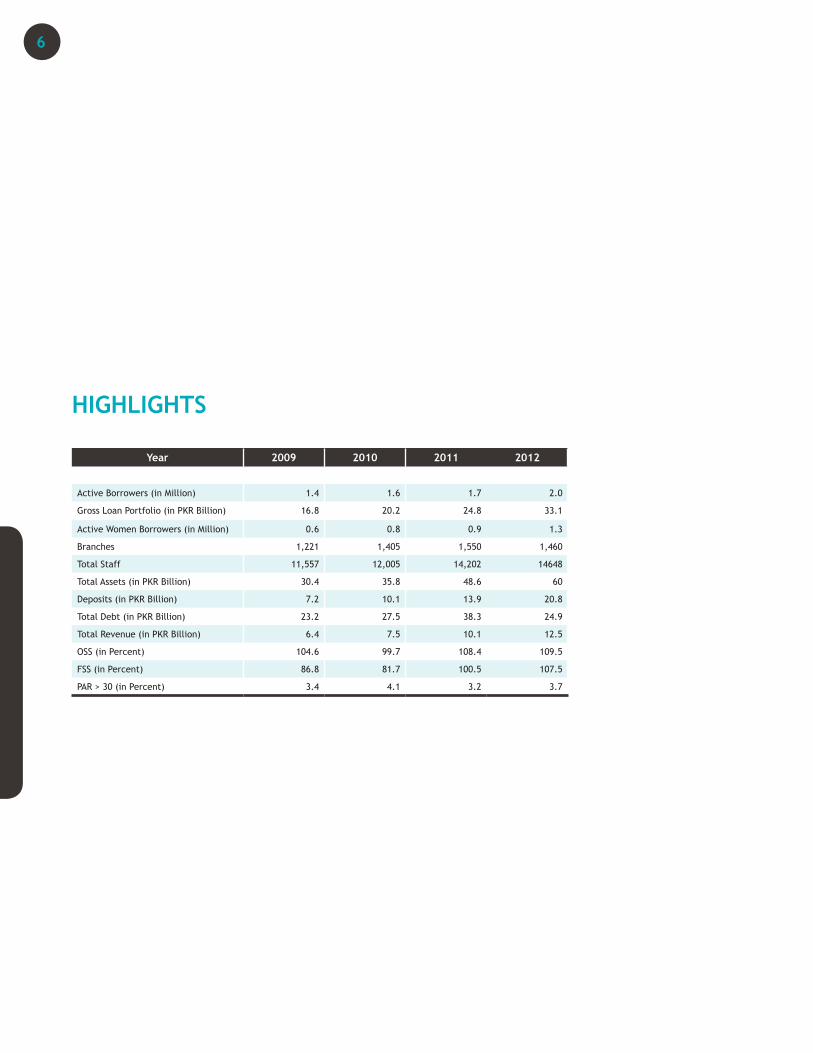
HIGHLIGHTS
Year 2009 2010 2011 2012
Active Borrowers (in Million) 1.4 1.6 1.7 2.0
Gross Loan Portfolio (in PKR Billion) 16.8 20.2 24.8 33.1
Active Women Borrowers (in Million) 0.6 0.8 0.9 1.3
Branches 1,221 1,405 1,550 1,460
Total Staff 11,557 12,005 14,202 14648
Total Assets (in PKR Billion) 30.4 35.8 48.6 60
Deposits (in PKR Billion) 7.2 10.1 13.9 20.8
Total Debt (in PKR Billion) 23.2 27.5 38.3 24.9
Total Revenue (in PKR Billion) 6.4 7.5 10.1 12.5
OSS (in Percent) 104.6 99.7 108.4 109.5
FSS (in Percent) 86.8 81.7 100.5 107.5
PAR > 30 (in Percent) 3.4 4.1 3.2 3.7
6
CONTENTS
SECTION 1: THE YEAR IN REVIEW
1.1. Macro-economy and the Microfinance Industry . . . . . . . . . . . . . . 101.2. Policy and Regulatory Environment . . . . . . . . . . . . . . . . . . . . . 121.3. Microfinance Industry Initiatives . . . . . . . . . . . . . . . . . . . . . . . 141.4. Conclusion . . . . . . . . . . . . . . . . . . . . . . . . . . . . . . . . . . . . . 20
SECTION 2: INDUSTRY PERFORMANCE
2.1. Industry Overview . . . . . . . . . . . . . . . . . . . . . . . . . . . . . . . . 252.2. Scale and Outreach . . . . . . . . . . . . . . . . . . . . . . . . . . . . . . . 262.3. Financial Structure . . . . . . . . . . . . . . . . . . . . . . . . . . . . . . . . 342.4. Funding Profile . . . . . . . . . . . . . . . . . . . . . . . . . . . . . . . . . . . 362.5. Profitability and Sustainability . . . . . . . . . . . . . . . . . . . . . . . . 372.6. Efficiency and Productivity . . . . . . . . . . . . . . . . . . . . . . . . . . . 402.7. Risk Analysis . . . . . . . . . . . . . . . . . . . . . . . . . . . . . . . . . . . . 422.8. Conclusion . . . . . . . . . . . . . . . . . . . . . . . . . . . . . . . . . . . . . 43
SECTION 3: THE WAY FORWARD
3.1. Challenges . . . . . . . . . . . . . . . . . . . . . . . . . . . . . . . . . . . . . 463.2. Opportunities . . . . . . . . . . . . . . . . . . . . . . . . . . . . . . . . . . . 50
ANNEXURES
Annexure A-1: Performance Indicators-Industry Aggregate (2007-2011) . 56Annexure A-2: Performance Indicators-Individual Institutions and Peer Groups (2012) . . . . . . . . . . . . . . . . . . . . . . . 64Annexure B: Regional Benchmarks 2010 . . . . . . . . . . . . . . . . . . . . . . 94Annexure C: Sources of Data 2012 . . . . . . . . . . . . . . . . . . . . . . . . . 96Annexure D: Adjustments to Financial Data . . . . . . . . . . . . . . . . . . 106Annexure E: Terms and Definitions . . . . . . . . . . . . . . . . . . . . . . . . 108

SECTION ONE
THE YEAR IN REVIEW
CONTENTS
1 Macro-economy and the Microfinance Industry
2 Policy and Regulatory Environment
3 Microfinance Industry Initiatives
4 Conclusion

“The key to ending extreme poverty is to enable the poorest of the poor to get their foot on the ladder of development.”
Jeffrey d. Sachs
The year 2012 saw the industry aiming for growth and profitability although the external environment remained challenging with the adverse security situation and continuing energy shortages in Pakistan. Despite these challenges the industry experienced higher growth in outreach as compared to the last five years1, continued entry of new players and ongoing regulatory and policy reforms. Within the microfinance industry, the total Gross Loan Portfolio (GLP) continued to grow at a fast pace backed by higher loan sizes. Moreover, the Microfinance Banks (MFBs) experienced tremendous growth in deposits.
Pakistan’s economy remained sluggish in 2012. Inflation witnessed a slight decline leading to gradual easing of monetary policy by the State Bank Pakistan. However, the decrease in policy rate did not result in increased private sector borrowing due to heavy borrowing by the government to finance an expanding fiscal deficit.
Within the microfinance sector, there was a major undertaking on the policy and regulatory front as efforts to bring non-bank MFPs under a regulatory umbrella were initiated and regulations for micro-insurance moved forward. Also, the Small and Medium Enterprise (SME) Guarantee facility offered by the State Bank of Pakistan (SBP) was extended to MFBs allowing them to upscale loans while the Microfinance Credit Guarantee Facility (MCGF) coverage was also extended to debt capital markets. In addition, the Pakistan Poverty Alleviation Fund (PPAF), the national apex, aligned the pricing of its loans with market-based floating interest rates.
1: MicroWatch, A quarterly update on microfinance outreach in Pakistan.
SECTION ONE
The year also saw a number of new initiatives being launched and earlier ones being built upon. Branchless banking saw the entry of two new players and witnessed continued growth. The national roll out of the Microfinance – Credit Information Bureau (MF-CIB) took place in June. A Corporate Governance Initiative is underway to strengthen governance practices in the industry while a number of social performance initiatives have also been launched to improve client protection and promote pricing transparency.
MACRO-ECONOMY AND THE MICROFINANCE INDUSTRY
Pakistan’s economy witnessed modest growth of 3.7 percent in the financial year 2012 against a target of 4.2 percent2. The under-performance was mainly due to security challenges, energy shortages and catastrophic flooding in the last two consecutive years. The growth was broad based and evenly distributed across agriculture, industry and services sectors. In comparison, the microfinance industry outperformed overall economic growth as outreach increased by 10 percent and GLP grew by 23 percent in the same time period3.
Robust private consumption, the vibrant informal economy, strong worker remittances and high fiscal spending were identified as the main drivers of growth. Investment continued to remain sluggish for the fifth consecutive year with the Investment to GDP ratio further declining to 12.5 percent as shown in the 2: Economic Survey of Pakistan, 2011-12, Ministry of Finance, Government of Pakistan3: MicroWatch, A quarterly update on microfinance outreach in Pakistan.
THE YEAR IN REVIEW
10
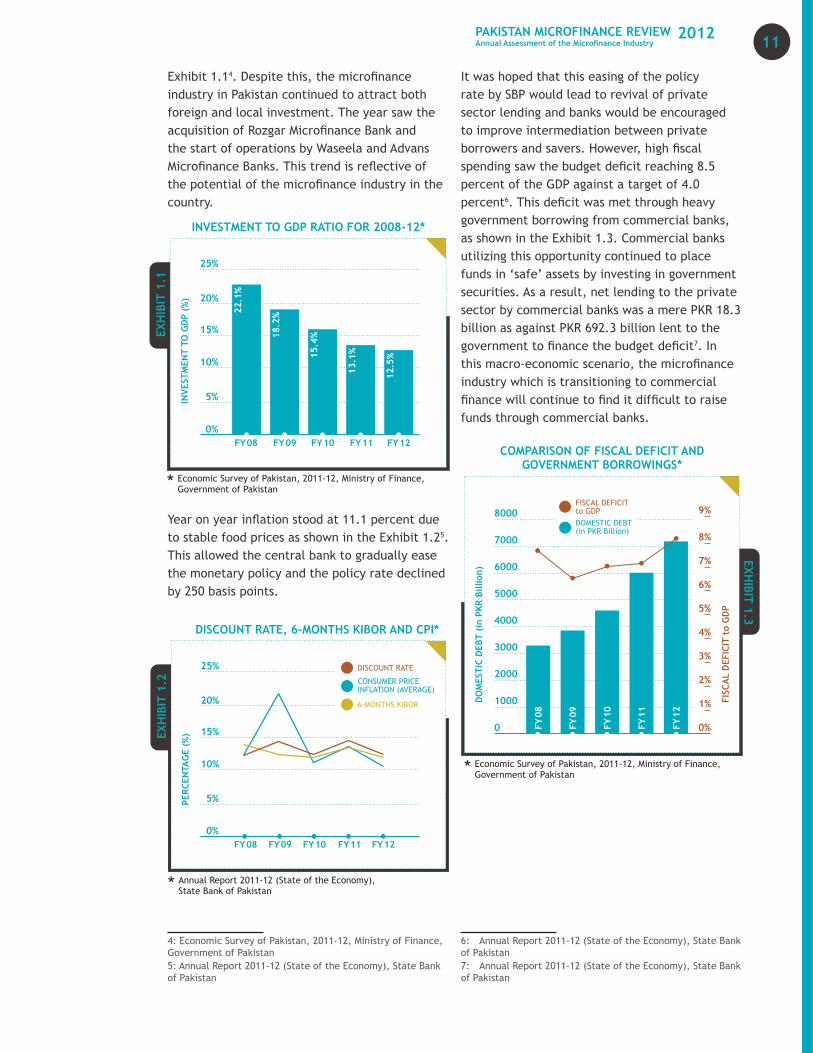
Exhibit 1.14. Despite this, the microfinance industry in Pakistan continued to attract both foreign and local investment. The year saw the acquisition of Rozgar Microfinance Bank and the start of operations by Waseela and Advans Microfinance Banks. This trend is reflective of the potential of the microfinance industry in the country.
Year on year inflation stood at 11.1 percent due to stable food prices as shown in the Exhibit 1.25. This allowed the central bank to gradually ease the monetary policy and the policy rate declined by 250 basis points.
4: Economic Survey of Pakistan, 2011-12, Ministry of Finance, Government of Pakistan5: Annual Report 2011-12 (State of the Economy), State Bank of Pakistan
It was hoped that this easing of the policy rate by SBP would lead to revival of private sector lending and banks would be encouraged to improve intermediation between private borrowers and savers. However, high fiscal spending saw the budget deficit reaching 8.5 percent of the GDP against a target of 4.0 percent6. This deficit was met through heavy government borrowing from commercial banks, as shown in the Exhibit 1.3. Commercial banks utilizing this opportunity continued to place funds in ‘safe’ assets by investing in government securities. As a result, net lending to the private sector by commercial banks was a mere PKR 18.3 billion as against PKR 692.3 billion lent to the government to finance the budget deficit7. In this macro-economic scenario, the microfinance industry which is transitioning to commercial finance will continue to find it difficult to raise funds through commercial banks.
6: Annual Report 2011-12 (State of the Economy), State Bank of Pakistan7: Annual Report 2011-12 (State of the Economy), State Bank of Pakistan
11PAKISTAN MICROFINANCE REVIEWAnnual Assessment of the Microfinance Industry
2012
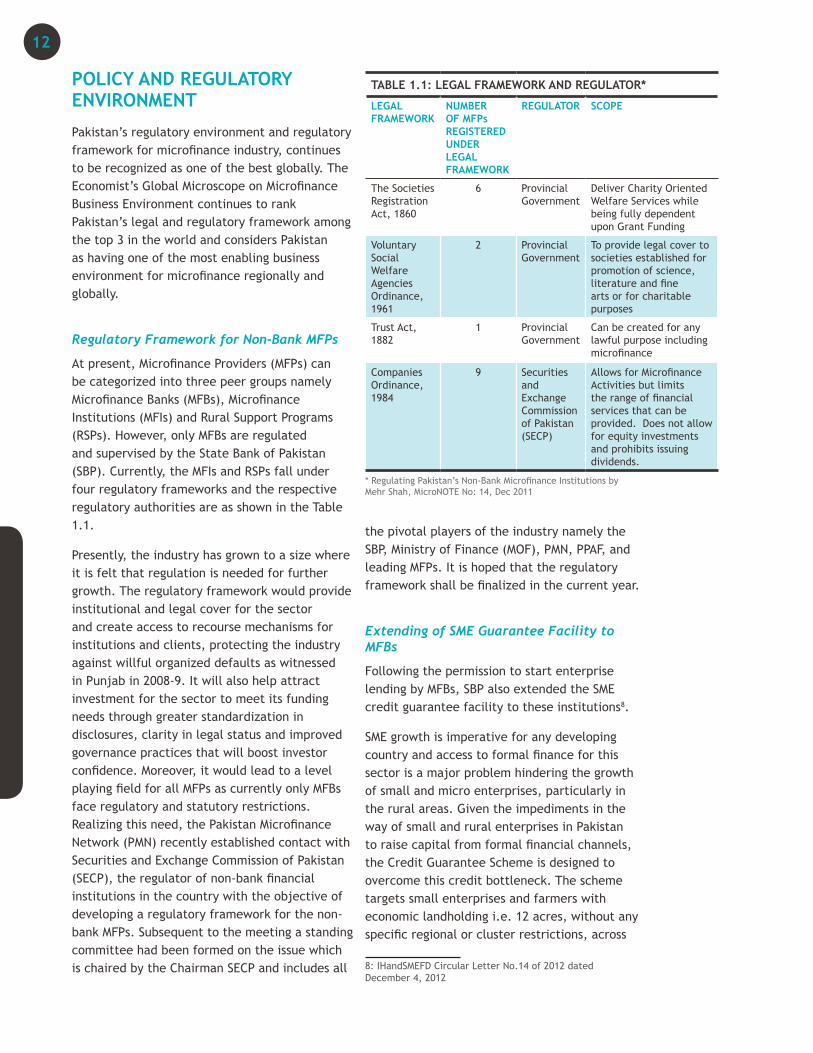
POLICY AND REGULATORY ENVIRONMENT
Pakistan’s regulatory environment and regulatory framework for microfinance industry, continues to be recognized as one of the best globally. The Economist’s Global Microscope on Microfinance Business Environment continues to rank Pakistan’s legal and regulatory framework among the top 3 in the world and considers Pakistan as having one of the most enabling business environment for microfinance regionally and globally.
Regulatory Framework for Non-Bank MFPs
At present, Microfinance Providers (MFPs) can be categorized into three peer groups namely Microfinance Banks (MFBs), Microfinance Institutions (MFIs) and Rural Support Programs (RSPs). However, only MFBs are regulated and supervised by the State Bank of Pakistan (SBP). Currently, the MFIs and RSPs fall under four regulatory frameworks and the respective regulatory authorities are as shown in the Table 1.1.
Presently, the industry has grown to a size where it is felt that regulation is needed for further growth. The regulatory framework would provide institutional and legal cover for the sector and create access to recourse mechanisms for institutions and clients, protecting the industry against willful organized defaults as witnessed in Punjab in 2008-9. It will also help attract investment for the sector to meet its funding needs through greater standardization in disclosures, clarity in legal status and improved governance practices that will boost investor confidence. Moreover, it would lead to a level playing field for all MFPs as currently only MFBs face regulatory and statutory restrictions. Realizing this need, the Pakistan Microfinance Network (PMN) recently established contact with Securities and Exchange Commission of Pakistan (SECP), the regulator of non-bank financial institutions in the country with the objective of developing a regulatory framework for the non-bank MFPs. Subsequent to the meeting a standing committee had been formed on the issue which is chaired by the Chairman SECP and includes all
the pivotal players of the industry namely the SBP, Ministry of Finance (MOF), PMN, PPAF, and leading MFPs. It is hoped that the regulatory framework shall be finalized in the current year.
Extending of SME Guarantee Facility to MFBs
Following the permission to start enterprise lending by MFBs, SBP also extended the SME credit guarantee facility to these institutions8.
SME growth is imperative for any developing country and access to formal finance for this sector is a major problem hindering the growth of small and micro enterprises, particularly in the rural areas. Given the impediments in the way of small and rural enterprises in Pakistan to raise capital from formal financial channels, the Credit Guarantee Scheme is designed to overcome this credit bottleneck. The scheme targets small enterprises and farmers with economic landholding i.e. 12 acres, without any specific regional or cluster restrictions, across
8: IHandSMEFD Circular Letter No.14 of 2012 dated December 4, 2012
TABLE 1.1: LEGAL FRAMEWORK AND REGULATOR*
LEGAL FRAMEWORK
NUMBER OF MFPs REGISTERED UNDER LEGAL FRAMEWORK
REGULATOR SCOPE
The Societies Registration Act, 1860
6 Provincial Government
Deliver Charity Oriented Welfare Services while being fully dependent upon Grant Funding
Voluntary Social Welfare Agencies Ordinance, 1961
2 Provincial Government
To provide legal cover to societies established for promotion of science, literature and fine arts or for charitable purposes
Trust Act, 1882
1 Provincial Government
Can be created for any lawful purpose including microfinance
Companies Ordinance, 1984
9 Securities and Exchange Commission of Pakistan (SECP)
Allows for Microfinance Activities but limits the range of financial services that can be provided. Does not allow for equity investments and prohibits issuing dividends.
* Regulating Pakistan’s Non-Bank Microfinance Institutions by Mehr Shah, MicroNOTE No: 14, Dec 2011
12
the country. Preference for use of the Guarantee Fund is given to fresh and collateral-deficient borrowers.
The SME Credit Guarantee Facility is also part of the Financial Inclusion Program (FIP) but unlike Microfinance Credit Guarantee Fund (MCGF) is not a wholesale guarantee but an enterprise guarantee. The scheme guarantees up to 40 percent of fresh portfolio of financing to small enterprises and farmers. Instead of evaluating each and every loan being extended by banks, the portfolio (principal amount only) of loans (extended after allocation of Credit Guarantee Limit) of a financial institution is guaranteed under the Scheme to the extent of its allocated Credit Guarantee Limit. Banks may apply a market-based mark-up rate under the scheme, as there is be no cap on pricing of loans. The loans for short term and medium term working capital for a period up to 3 years, with maximum amount of PKR 15 million for small enterprises and PKR 2 million for farmers with economic landholdings are guaranteed.
As of now, only one MFB has sought and been allocated a line from the guarantee fund. The remaining MFBs are still in the process of planning to tap the facility and have yet to utilize the opportunity.
Micro-Insurance Regulations
Microfinance does not only meet the borrowing needs of the clients but also provides them with avenues of saving and protection against risks through micro-insurance (MI) products.
At present, micro-insurance in Pakistan is being provided by 19 MFPs. The number of policy holders stood at 2.9 million and sum insured at PKR 36.5 billion. Micro-insurance growth, however, has exhibited a volatile trend over the years as institutions struggle to get the models, products and pricing right. Currently, only two products are being offered i.e. health and credit-life insurance, with the latter accounting for 57 percent of the sum insured. In addition, pilot projects have been launched by the national apex to extend insurance coverage to agriculture sector.
Keeping in view the fragmented nature of the market, the Securities and Exchange Commission Pakistan (SECP) as the regulator of the insurance industry in the country stepped in and is taking a number of steps to regulate and develop micro-insurance in Pakistan. Initially, it commissioned a diagnostic study in collaboration with World Bank that maps the supply and demand for micro-insurance. In addition, a working group9 has been formed under the auspices of to facilitate the development of a regulatory framework for micro-insurance and a development strategy for this segment. The working group has completed its work in this context and the documents will soon be made available for public comment. The group and SECP is also looking into the idea of setting up specialized micro-insurance companies, which will provide micro-insurance products only and have limited capital requirements – a model parallel to the MFBs in the banking sector.
Extending MCGF Coverage to Capital Markets
The State Bank of Pakistan (SBP) through a circular in June 201210, allowed MFPs to raise funds from non-bank sources / capital markets under the Microfinance Credit Guarantee Facility (MCGF). This step effectively extends coverage of the MFCG to debt capital markets.
SBP has taken a number of steps to promote lending to the MFPs through the commercial banking sector. MCGF is big part of this effort. Launched in 2008 with a GBP 10 million grant from UKAID as part of the overall Financial Inclusion Program (FIP), the facility is one of two guarantee funds available to MFPs in the country. The facility aims to allow MFPs to mobilize funds from banks for onward lending to microfinance clients. In order to meet the increasing need of funds by the sector to expand microfinance outreach, the guarantee’s coverage has been extended to non-bank sources. This will allow the MFPs to not only fund their growth but also allow them to diversify their sources of funds by tapping debt markets.
9: The group comprises of a cross section of stakeholders including MFPs, PMN, PPAF, DFID, Insurance Association of Pakistan (IAP), insurance companies and insurance brokers.10: AC and MFD Circular No. 03 of 2012 dated June 21, 2012
13PAKISTAN MICROFINANCE REVIEWAnnual Assessment of the Microfinance Industry
2012
BOX
1.1
In the current scenario where there is heavy public sector borrowing, practitioners can use debt markets to meet their financing needs. Moreover, this will allow capital markets to reduce their risk perception of the industry and lead to enhanced recognition in the investor community. MFPs have been quick to recognize this opportunity and subsequent to the revision of the MFCG guidelines, TMFB issued retail bonds. (See Box 1.1 for details)
Revision of PPAF Pricing Policy
In continuation of its policy to transition from subsidized lending to commercial based lending, PPAF revised its pricing policy of loans being extended to microfinance industry in the year 2012. Interest rates moved towards market based prices with the aim of transforming the industry into a sustainable and viable part of the financial landscape. Earlier, loan sizes below PKR 500 million were charged flat 8 percent.
In the early days of microfinance, PPAF focused on developing and strengthening institutions thus charges were subsided substantially to allow for new players to enter the market and get access to funds for on-lending. Now as institutions have become more robust and sustainable, PPAF has moved towards market based floating interest rates for all loan sizes. Another reason was to correct the pricing anomaly which resulted in growing firms being charged at commercial rates when funds borrowed by them from PPAF increased above PKR 500 million.
Interest rates are now benchmarked with KIBOR. Non-for-profit organizations are extended funding facilities at 6-month KIBOR whereas for profit entities the rate is 6-months KIBOR + 1. Keeping in view large swathes in the country that are yet to be tapped, PPAF continues to subsidize loans for MFPs working in deprived areas where the cost of delivery remains significantly higher as compared to the more developed areas.
MICROFINANCE INDUSTRY INITIATIVES
BRANCHLESS BANKING
The previous year witnessed branchless banking continuing to prosper in terms of entrance of new players and products as well as usage. Pakistan has been described as one of the most innovative places in the world for mobile banking services, with the SBP playing a leading role in its development.”
Recently, the branchless banking sector of Pakistan saw the entrance of two new players - Mobicash and Timepey, bringing the total number of branchless banking deployments to four in the country. Mobicash is an example of a Mobile Network Operator (MNO) entering the market through launching a green field MFB while Timepey is a unique model with a commercial bank and MNO partnering to launch branchless banking services.
Waseela Microfinance Bank in partnership with Mobilink introduced Mobicash as their branchless banking solution. The Mobicash suite of financial services currently includes only domestic remittances and bill payments. However, in the near future, Mobicash expects to introduce a variety of offerings such as ‘Mobile Wallets’, making it possible for customers to transact money directly through their Mobilink mobile connections.
Askari Bank Limited in partnership with Zong launched its branchless banking service under the brand name ‘Timepey’. Unlike the
LAUNCH OF RETAIL BONDS BY TMFB
TMFB successfully listed its Term Finance Certificates (TFCs) & Tameer Sarmaya Certificates (TSC) on the Karachi Stock Exchanges in early 2013. This is the second time a MFP has issued TFCs to raise financing but a first for MFBs. The TFCs have been issued for one year (13 months) and two year (24 months) time periods at a rate of 12 percent and 12.5 percent respectively, with a monthly profit payment mechanism. The total amount of TFCs is PKR 1 billion and the issue is partially secured against the MCGF. Standard Chartered was the lead arranger of the issue and have been assigned an “A” rating by JCR-VIS.
14
BOX
1.2
other BB platforms in the market such as Telenor (EasyPaisa) and Mobilink (Mobicash) which involve an MNO’s direct ownership of a microfinance bank, Timepey is an alliance between a commercial bank and an MNO. The three main services offered by Timepey include Utility Bill Payment, Mobile Account and Funds Transfer.
Table 1.2 shows the list of different players in the branchless banking sector and services being offered currently.
Most of the products being offered are geared towards payments. Branchless banking operators need to go beyond payments and transfer and expand into savings, insurance and loan disbursements solutions. Only then can branchless banking provide a path to scale for financial inclusion.
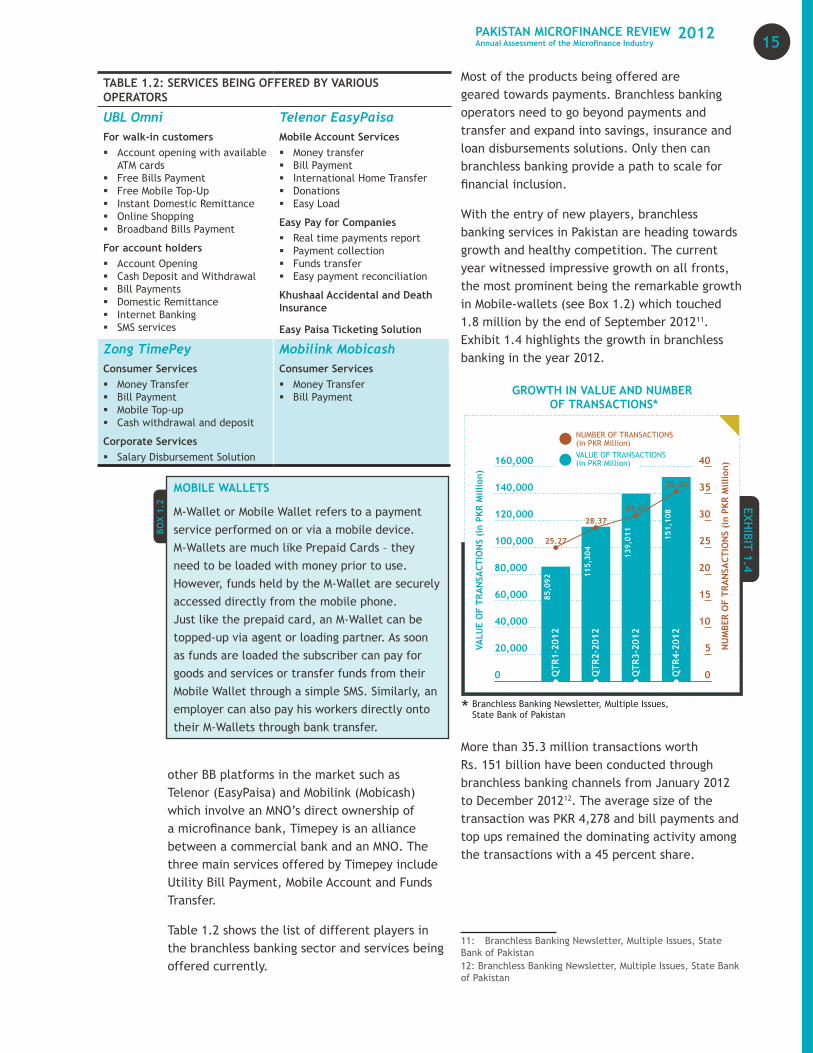
With the entry of new players, branchless banking services in Pakistan are heading towards growth and healthy competition. The current year witnessed impressive growth on all fronts, the most prominent being the remarkable growth in Mobile-wallets (see Box 1.2) which touched 1.8 million by the end of September 201211. Exhibit 1.4 highlights the growth in branchless banking in the year 2012.
More than 35.3 million transactions worth Rs. 151 billion have been conducted through branchless banking channels from January 2012 to December 201212. The average size of the transaction was PKR 4,278 and bill payments and top ups remained the dominating activity among the transactions with a 45 percent share.
11: Branchless Banking Newsletter, Multiple Issues, State Bank of Pakistan12: Branchless Banking Newsletter, Multiple Issues, State Bank of Pakistan
MOBILE WALLETS
M-Wallet or Mobile Wallet refers to a payment service performed on or via a mobile device. M-Wallets are much like Prepaid Cards – they need to be loaded with money prior to use. However, funds held by the M-Wallet are securely accessed directly from the mobile phone. Just like the prepaid card, an M-Wallet can be topped-up via agent or loading partner. As soon as funds are loaded the subscriber can pay for goods and services or transfer funds from their Mobile Wallet through a simple SMS. Similarly, an employer can also pay his workers directly onto their M-Wallets through bank transfer.
TABLE 1.2: SERVICES BEING OFFERED BY VARIOUS OPERATORS
UBL OmniFor walk-in customers � Account opening with available
ATM cards � Free Bills Payment � Free Mobile Top-Up � Instant Domestic Remittance � Online Shopping � Broadband Bills Payment
For account holders � Account Opening � Cash Deposit and Withdrawal � Bill Payments � Domestic Remittance � Internet Banking � SMS services
Telenor EasyPaisaMobile Account Services � Money transfer � Bill Payment � International Home Transfer � Donations � Easy Load
Easy Pay for Companies � Real time payments report � Payment collection � Funds transfer � Easy payment reconciliation
Khushaal Accidental and Death Insurance
Easy Paisa Ticketing Solution
Zong TimePeyConsumer Services � Money Transfer � Bill Payment � Mobile Top-up � Cash withdrawal and deposit
Corporate Services � Salary Disbursement Solution
Mobilink MobicashConsumer Services � Money Transfer � Bill Payment
15PAKISTAN MICROFINANCE REVIEWAnnual Assessment of the Microfinance Industry
2012
Microfinance - Credit Information Bureau (MF-CIB)
Credit Bureaus play a vital role in mitigating the challenges faced by microfinance ranging from information asymmetry, adverse selection, and moral hazard to over-indebtedness due to multiple borrowing. The credit information provided by the bureau helps financial institutions reduce risks, loan process time, costs and default rates. For borrowers, it leads to lower interest rates, making loans more affordable and more widely available. Analyses of the delinquency crises in Andhra Pradesh, India in 2009 and Punjab, Pakistan, in 2008/9 show that improved credit information about the borrowers could have helped in averting these disasters. Consequently, to address the above mentioned issues, a pilot MF-CIB was initiated in Pakistan in 2010.
PMN, with support of SBP, PPAF, UKaid and the International Finance Corporation (IFC), launched the nation-wide rollout of the MF-CIB in June 2012. The objective of the project is to make MFPs “Bureau Ready and institutionalize MF-CIB in the microfinance ecosystem” by ensuring that MFPs are reporting their data on time and making enquiries on every loan application received. Some major developments and milestones were achieved in 2012 as the national roll out moved forward. A major achievement was the collection of 2.2 million records, which currently are being reconciled. Also, National Database and Registration Authority (NADRA) completed verification of approximately 2.23 million records which greatly increases the integrity of the data repository. The consolidation of the NADRA verified data is in process and would go live in 2013. Most organizations who did not participate in the pilot have been signed up for the MF-CIB and their technical capacity vis-à-vis data reporting and inquiries is being built through trainings, workshops, dedicated CIB Coordinators and technical and financial support in MIS up-gradation. Not only are nearly all PMN members now on board but also PPAF partners that are not members of PMN have been signed up. In the first phase, the emphasis has been on the collection and verification of data to improve data integrity as the quality of the credit report
would ultimately depend on the reliability and consistency of the data in the repository. Also, in order to give exposure to its members regarding the functioning of Credit Bureaus, PMN organized two exposure visits to study the working of a mature bureau in Bolivia and South Korea called “InfoCred” and “NICE” respectively.
As data collection becomes institutionalized, the next focus will be on generation and use of the credit report. PMN is working with MFPs to make them bureau ready and ensuring that their staff is able to analyze the report and make effective credit decisions. To ensure effective monitoring of the project, all donors and PMN agreed to form a project steering committee which comprises of individuals from SBP, PPAF, IFC, UKaid and PMN policy committee. This committee is responsible for providing strategic input, oversight and policy level interventions for effective implementation of the national rollout of MF-CIB.
With the implementation of MF-CIB it is certain that there will be significant developments of credit market discipline in the microfinance industry.
Social Performance
Keeping in view that microfinance is a double bottom line industry where social performance is as important as sustainability and profitability; a number of new initiatives were launched in 2012 by PMN and PPAF.
Pricing Transparency Initiative
PMN in partnership with MicroFinance Transparency and in collaboration with the SBP, PPAF and UKaid has launched a Transparent Pricing Initiative for Pakistan. The aim is to provide an opportunity for microfinance service providers in the Pakistan market to exchange information, standardize pricing practices and demonstrate their commitment to transparent and responsible pricing. Non-transparency has not only damaged the public image of the industry, but has encouraged political and regulatory reactions, such as interest rate caps, that have reduced the availability of credit to the poor in other countries. Via the Transparent
16
Pricing Initiative in Pakistan, MicroFinance Transparency will encourage Pakistan’s microfinance industry to publicly demonstrate its commitment to pricing transparency, integrity and responsible finance. Embarking on this initiative at the industry level will help dispel any threats to microfinance providers in terms of first mover disadvantages that exist in implementing transparent pricing. This initiative will also help provide a level playing field for all types of microfinance providers regardless of legal status to ensure their pricing is transparent to the consumers, and create an environment in which transparency leads to a strengthening of the local microfinance industry.
Social Performance Implementation Fund for Advanced Networks
PMN has been selected to be the part of Global Implementation Program of the Universal Standards for Social Performance Management (USSPM). The Global Implementation Program of the USSPM, funded by the Ford Foundation and managed by the Microfinance Centre (MFC), is working with advanced networks from all over the world to pioneer the roll-out of the USSPM in each of the nine selected countries.
As part of the program PMN will work with its member MFPs to implement the following areas within the USSPM:
1) Ensuring Board, management and employee commitment to social goals
2) Design products, services, delivery models and channels that meet client needs and preferences
3) Treating clients responsibly
Meeting the Standards signifies that an MFP has “strong” social performance management (SPM) practices. It is hoped that the implementation of Universal Standards would allows MFP to assess informally their current level of social performance management, guide their strategies and self-regulate their social performance.
Client Protection Monitoring Initiative, in partnership with the Smart Campaign
This initiative is being conducted by the PMN in partnership with the Smart Campaign at the Centre for Financial Inclusion at ACCION International with support from the State Bank of Pakistan (SBP) under the Financial Inclusion Program (FIP).
The major objective of this initiative is to help member MFPs monitor their client protection, and provide a baseline of client protection practices in place, with the aim of improving client protection at all member MFPs in accordance with globally accepted benchmarks (Smart Campaign’s Client Protection Principles). It involves conducting Smart assessments of all member MFPs during 2013 to 2015.
Client protection can only be achieved in a sustained manner if its core values are institutionalized through practice at MFPs. A key step then is to institutionalize a monitoring process within practitioners to look at compliance with principles of client protection. PMN feels that conducting assessments of MFPs on the client protection principles will help to provide a baseline of existing client protection practices at MFPs, help strengthen monitoring and control within the practitioners for future, and ultimately lead to successful institutionalization of client protection measures. Additionally, building capacity of other players in the industry (like technical assistance providers) will help create a supply of CP monitoring services externally.
Truelift (formerly Seal of Excellence)
PPAF and Microcredit Summit Campaign have signed a Memorandum of Understanding (MOU) to launch the global initiative of Truelift for poverty outreach and transformation in Pakistan. Truelift aims to recognize microfinance institutions that are doing the most to help poor households lift themselves out of poverty and improve their lives. The International Fund for Agricultural Development (IFAD) has provided financial
17PAKISTAN MICROFINANCE REVIEWAnnual Assessment of the Microfinance Industry
2012
support for this exercise which is also being replicated in Jordan, Bolivia, India, Senegal, Peru, South Africa and the Philippines. PPAF is participating in a beta test of the Seal of Excellence in Pakistan through a strategic partnership with the Microcredit Summit Campaign. The seal would ensure that the rights of clients are protected, the focus remains on impact and the double bottom line is assured.
The overall goal of Truelift is to accredit microfinance institutions which are responsible, genuinely inclusive and contributing to positive change in the society. The Truelift looks into all aspects of clients’ protection, social performance and several additional indicators. Institutions will be able to get certified once they undergo an assessment carried out by a firm contracted by the Seal of Excellence. An international rating agency is currently engaged in the assessment of two microfinance institutions in Pakistan.
Crop and Livestock Micro-Insurance Products
IFAD and PPAF through a strategic partnership with the SECP designed an index-based crop insurance and livestock insurance product under the Program for Increasing Sustainable Microfinance (PRISM). The purpose of this initiative is to implement action research on a sustainable market based crop and livestock insurance model which best suits the economic needs and social characteristics of the country with particular focus on small and marginal income farmers. In line with IFAD’s key focus on agricultural development, this product is being rolled-out as a market based commercially viable model.
Keeping this in mind, PPAF is piloting two products which are a Weather-Indexed Crop Insurance and a Live-Weight Livestock Insurance. Alfalah and United Insurance are the insurers for the pilots, and the products are being disseminated to communities in Soon Valley and Talagang through partner organizations, Soon Valley Development Program (SVDP) and National Rural Support Program (NRSP).
In addition to these pilots, PPAF is also currently in the process of implementing pilots for livestock insurance in Tharparkar, while also building a product specifically for milk-producing animals in Southern Punjab. Going forward, these are expected to scale up to include the hybrid ‘live-weight’ livestock insurance product in other areas of Pakistan.
Inclusion of MFBs in SBP’s Agriculture Disbursement Monitoring Framework
MFBs have been included in SBP’s Agriculture Disbursement Monitoring Framework since July 2011. Rural borrowers make up 56 percent of the total active borrowers (see Section 2) for the microfinance sector. Inclusion of MFBs in the framework is recognition of the role being played in agri lending by the microfinance industry in the country. MFBs and non-bank MFIs enjoy a healthy penetration in the rural areas as compared to other financial institutions. There are avenues which can be explored by financial institutions routing funds for agriculture lending through MFPs.
Microfinance Impact Assessment
During the last one decade, the sector has grown through government support in the form of an enabling policy framework and public funds (through donor grants, smart subsidies and tax exemption). This inflow of public money and other concessions have generated a demand to demonstrate impact. In context of the recent crises in microfinance in different countries, stakeholders, such as governments, donors and investors are beginning to question the impact microfinance is having on the lives of the poor. Even within the microfinance sector in Pakistan, there is a need to look inwards and evaluate whether the current strategies, methodology, products and services are serving the ultimate goal of creating social impact.
In order to fill the current knowledge gaps with respect to the impact of microfinance services on the lives of microfinance clients, the Pakistan Microfinance Network (PMN) proposes to conduct a comprehensive impact evaluation study to empirically estimate the social benefits accruing to microfinance clients.
18
The proposed impact evaluation study will seek to overcome the limitations of the existing body of knowledge on the impact of microfinance in Pakistan and deliver more sound and robust estimates of benefits accruing to the microfinance clients, in terms of higher income/ lower poverty levels, improved education and health outcomes and greater empowerment of women, amongst others.
ACQUISITIONS AND ENTRY OF NEW PLAYERS
The year 2012 witnessed continued investor interest in the industry. Two new green field MFBs entered the market and one existing MFB was acquired. Acquisitions and entry of new MFBs at one place is positive reflection on the market potential but also shows investor’s confidence in the business models of MFBs. The series of acquisitions and entry of new players over the last few years reflect positively on the industry’s potential in the country and also ensures that these entities are adequately capitalized. These institutions can if required leverage the balance sheets of their sponsors to raise funds.
Waseela Microfinance Bank:
Waseela Microfinance Bank Limited (WMBL) started its operations as a microfinance bank, with its first branch in Islamabad, in April 2012. The State Bank of Pakistan had issued a license to the bank earlier but the bank was unable to commence operations as it had not met SBP’s requirement of maintaining a minimum asset base of PKR 1 billion.
Later in the year, WMBL also announced the commencement of commercial operations for branchless banking on the back of SBP’s approval to launch Mobile Financial Services (MFS) in Pakistan. WMBL is a fully owned subsidiary of Orascom Telecom Holdings, and a sister concern of Mobilink – Pakistan Mobile Communications Limited (PMCL).
WMBL is the 10th licensed microfinance bank in Pakistan under the MFI Ordinance 2001. It is currently operating with four branches: one in the south region, two in the central region and one in the north region. WMBL plans to introduce mass-market financial products for
providing more choices and benefits to the people of Pakistan, which include cash deposit and withdrawal, fund transfer from account-to-account and person-to-person, Mobilink top-ups and utility bill payment amongst other services.
Advans Pakistan Microfinance Bank
Advans Pakistan Microfinance Bank (APMB) was provided with a license to operate in the province of Sindh, and has commenced its operations with one branch in Karachi. The shareholders of APMB, Advans South Africa and FMO (the Netherlands Development Financial Company) have vast international experience in providing financial services to the informal sector. Advans South Africa is currently operating in six countries, in Africa (Cameroon, Ghana, Democratic Republic of Congo, Tanzania and Ivory Coast) and in Asia (Cambodia). The entry of Advans in the local market is an important step for the industry as it shows that not only local but also international investors are keen to invest in the Pakistani microfinance industry.
Advans Pakistan has established APMB with the view of not only providing microcredit but also helping small businesses. APMB plans to offer loans as well as deposit products with the ambition of catering to the financial requirements for micro and small and medium enterprises in Pakistan.
U Microfinance Bank
Another microfinance bank that has recently re-entered the market is U Microfinance Bank Limited (formerly Rozgar Microfinance Bank Limited). Pakistan Telecommunication Company Limited (PTCL) had acquired 100 percent shareholding of Rozgar Microfinance Bank Limited in August 2012 to roll out its branchless banking setup throughout the country.
SBP had allowed PTCL to buy out Rozgar Microfinance Bank Limited on the condition that PTCL would enhance the status of this microfinance bank into a nationwide MFB within one year. Before the acquisition, Rozgar Microfinance Bank Limited was a district-wide microfinance bank operating in Karachi with one branch and six service centers.
19PAKISTAN MICROFINANCE REVIEWAnnual Assessment of the Microfinance Industry
2012
CONCLUSION
On the whole, the external economy remained challenging for the industry. Persistent energy crisis and security challenges affected the growth in outreach of the microfinance industry. Despite the easing of monetary policy, commercial banks showed limited appetite for lending to private sector. In this scenario, MFPs found it difficult to borrow from banks. Overall, growth in the national economy was modest. But the microfinance industry remained bullish and savings continued to be the main driver of growth for the sector.
On the policy side and regulatory side, Pakistan continued to be recognized among the best enabling environments. Keeping in view the need to extend regulatory and legal cover to non-bank MFIs, a steering committee has been established under the SECP. In addition, in order to promote and expand micro-insurance regulations are being developed. Also, in order to facilitate access to commercial finance for the sector, MCGF was topped and its coverage extended to debt capital markets. Continuing with the policy maker’s desire for microfinance to extend financial services to small and micro-enterprises, SME guarantee fund was extended to the sector.
The year saw launch of number of new initiatives in the microfinance industry and entry of new players. Branchless banking continued to witness growth and saw two new branchless banking systems being deployed. A number of milestones were achieved in the nationwide implementation of MF-CIB. On the social performance and responsible finance side a number of new initiatives were launched. The national PPAF successfully ran the pilots for crop and livestock insurance which is now ready to replicated national level.
The industry continues to receive continued interest from local and international investors. The year saw the launch of two green field institutes and acquisition of another by a mobile network operator (MNO).
20

21PAKISTAN MICROFINANCE REVIEWAnnual Assessment of the Microfinance Industry
2012

SECTION TWO
INDUSTRY PERFORMANCE
CONTENTS
1 Industry Overview
2 Scale and Outreach
3 Financial Structure
4 Funding Profile
5 Profitability and Sustainability
6 Efficiency and Productivity
7 Risk Analysis
8 Conclusion

“Our goal is far beyond extending more credit to more poor people. Our goal is to figure out how to work together in partnership to build financial sectors that work for everyone and in particular for those that are trying desperately to climb the economic ladder to get out of poverty.” Dirk Jan Van Den Berg
This section provides a detailed analysis of the financial performance of the microfinance industry in the country. Performance has been assessed on three levels: industry wide, across peer groups and institution wise. The analysis is backed by 88 financial indicators, calculated from the audited financial statements of the reporting organizations. These indicators have been compared across time and regions to develop a reliable and fair assessment of sector.
Detailed financial information is provided in the Annex A-I and A-II of the PMR. Aggregate data has been reproduced for five years, whereas, the peer group and institution specific data has been made available only for the year 2012.
A total of 22 MFPs submitted their audited financial statements for the PMR 2012. Two new respondents – Farmers Friend Organization (FFO) and Ghazi Barotha Taraqiati Idara (GBTI) – are included in this year’s dataset. For a complete list of reporting organizations refer to Annex B.
Industry Players are categorized into three groups for the purposes of benchmarking and comparison: Microfinance Banks (MFBs), Microfinance Institutions (MFIs) and Rural Support Programmes (RSPs). See Box 2.1 for detailed definitions.
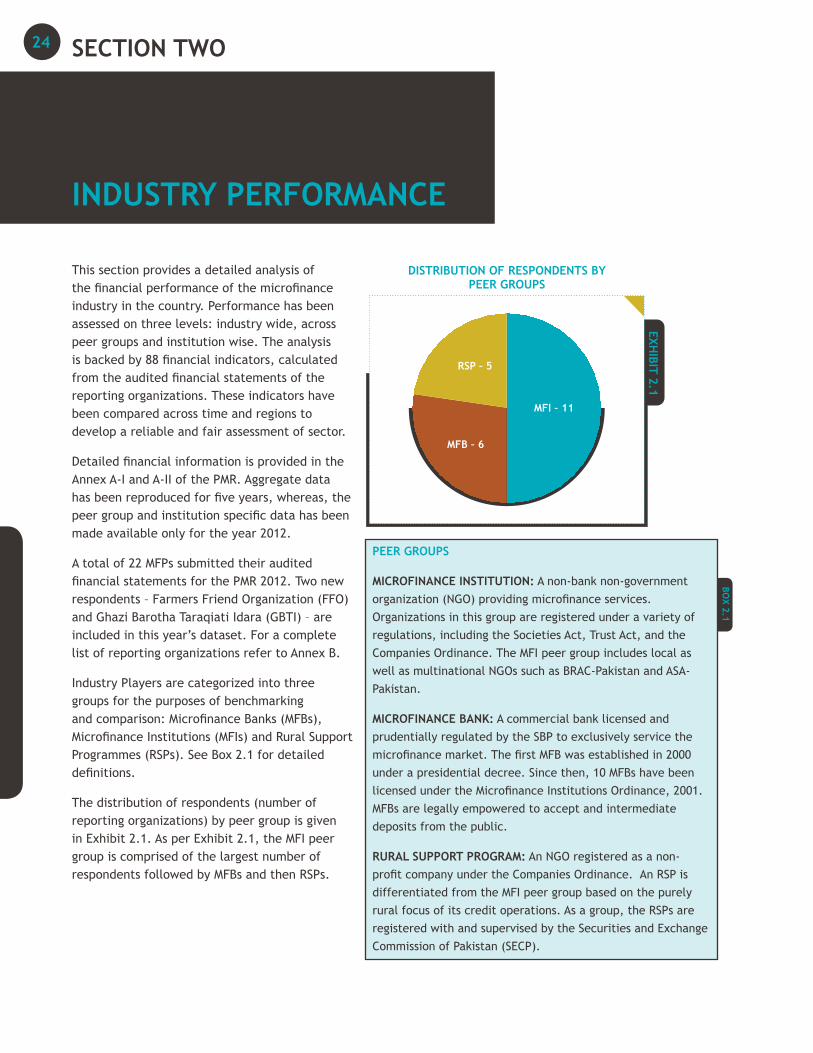
The distribution of respondents (number of reporting organizations) by peer group is given in Exhibit 2.1. As per Exhibit 2.1, the MFI peer group is comprised of the largest number of respondents followed by MFBs and then RSPs.
BOX 2.1
PEER GROUPS
MICROFINANCE INSTITUTION: A non-bank non-government organization (NGO) providing microfinance services. Organizations in this group are registered under a variety of regulations, including the Societies Act, Trust Act, and the Companies Ordinance. The MFI peer group includes local as well as multinational NGOs such as BRAC-Pakistan and ASA-Pakistan.
MICROFINANCE BANK: A commercial bank licensed and prudentially regulated by the SBP to exclusively service the microfinance market. The first MFB was established in 2000 under a presidential decree. Since then, 10 MFBs have been licensed under the Microfinance Institutions Ordinance, 2001. MFBs are legally empowered to accept and intermediate deposits from the public.
RURAL SUPPORT PROGRAM: An NGO registered as a non-profit company under the Companies Ordinance. An RSP is differentiated from the MFI peer group based on the purely rural focus of its credit operations. As a group, the RSPs are registered with and supervised by the Securities and Exchange Commission of Pakistan (SECP).
SECTION TWO
INDUSTRY PERFORMANCE
24
INDUSTRY OVERVIEW
As of December 2012, the total asset base of the reporting microfinance providers stood at PKR 60.5 billion (USD 617 million), depicting an increase of 24 percent as compared to the previous year. Out of the total assets, Gross Loan Portfolio (GLP) was PKR 33.1 billion making up 55 percent of the total assets. Outreach has grown to 2.0 million active borrowers and 1.7 active depositors.
The figures presented above vary significantly from outreach estimates as reported in the PMN’s quarterly publication for the same period i.e. MicroWATCH, December 2012. According to the quarterly update, outreach was estimated at 2.4 million borrowers and 4.68 million savers (savers are the sum 1.9 million depositors intermediated by MFB and 2.8 million savers mobilized by RSPs and MFIs as part of social mobilization).
The significant variation is due to the number of reporting organizations – some of the MFPs contributing data to the MicroWATCH are not affiliated with PMN and hence, do not report for the PMR. Also, some members and affiliates have not been able to provide audited financials for this report before it goes into publication.
SCALE AND OUTREACH
This section focuses on outreach indicators to provide performance analysis of the industry in terms of credit growth and composition, deposit mobilization, depth of outreach and gender.
SCALE AND OUTREACH: BREADTH
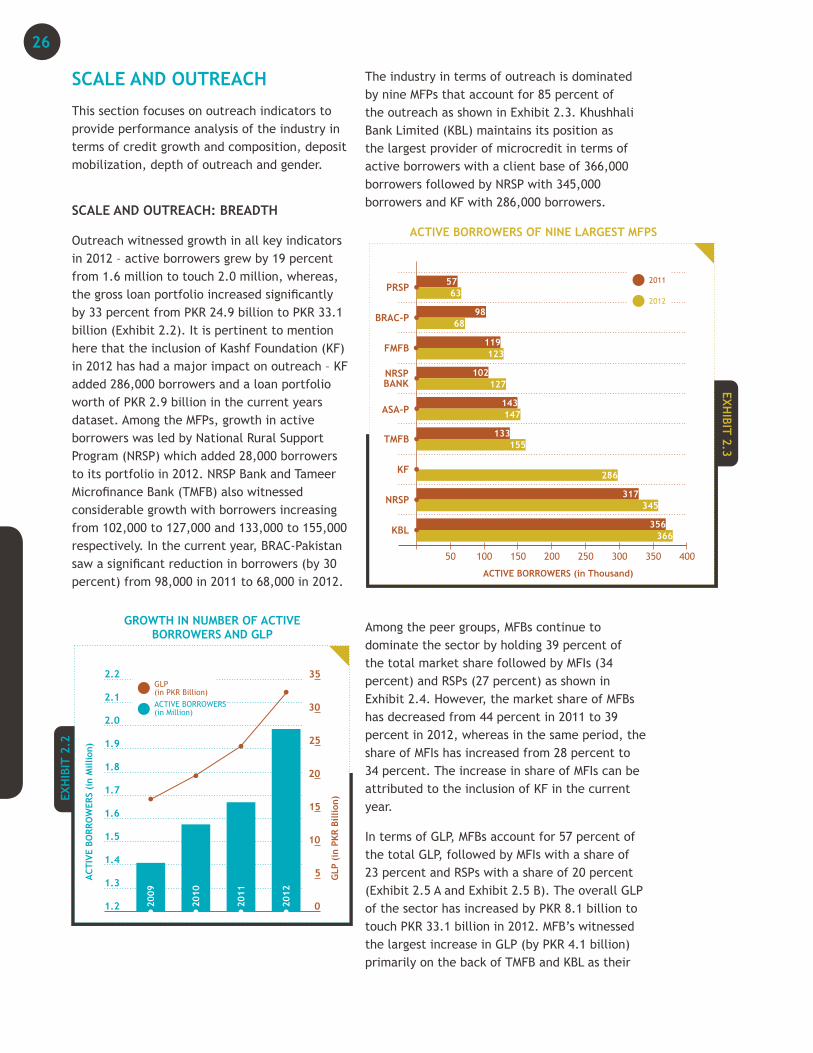
Outreach witnessed growth in all key indicators in 2012 – active borrowers grew by 19 percent from 1.6 million to touch 2.0 million, whereas, the gross loan portfolio increased significantly by 33 percent from PKR 24.9 billion to PKR 33.1 billion (Exhibit 2.2). It is pertinent to mention here that the inclusion of Kashf Foundation (KF) in 2012 has had a major impact on outreach – KF added 286,000 borrowers and a loan portfolio worth of PKR 2.9 billion in the current years dataset. Among the MFPs, growth in active borrowers was led by National Rural Support Program (NRSP) which added 28,000 borrowers to its portfolio in 2012. NRSP Bank and Tameer Microfinance Bank (TMFB) also witnessed considerable growth with borrowers increasing from 102,000 to 127,000 and 133,000 to 155,000 respectively. In the current year, BRAC-Pakistan saw a significant reduction in borrowers (by 30 percent) from 98,000 in 2011 to 68,000 in 2012.
The industry in terms of outreach is dominated by nine MFPs that account for 85 percent of the outreach as shown in Exhibit 2.3. Khushhali Bank Limited (KBL) maintains its position as the largest provider of microcredit in terms of active borrowers with a client base of 366,000 borrowers followed by NRSP with 345,000 borrowers and KF with 286,000 borrowers.
Among the peer groups, MFBs continue to dominate the sector by holding 39 percent of the total market share followed by MFIs (34 percent) and RSPs (27 percent) as shown in Exhibit 2.4. However, the market share of MFBs has decreased from 44 percent in 2011 to 39 percent in 2012, whereas in the same period, the share of MFIs has increased from 28 percent to 34 percent. The increase in share of MFIs can be attributed to the inclusion of KF in the current year.
In terms of GLP, MFBs account for 57 percent of the total GLP, followed by MFIs with a share of 23 percent and RSPs with a share of 20 percent (Exhibit 2.5 A and Exhibit 2.5 B). The overall GLP of the sector has increased by PKR 8.1 billion to touch PKR 33.1 billion in 2012. MFB’s witnessed the largest increase in GLP (by PKR 4.1 billion) primarily on the back of TMFB and KBL as their
26
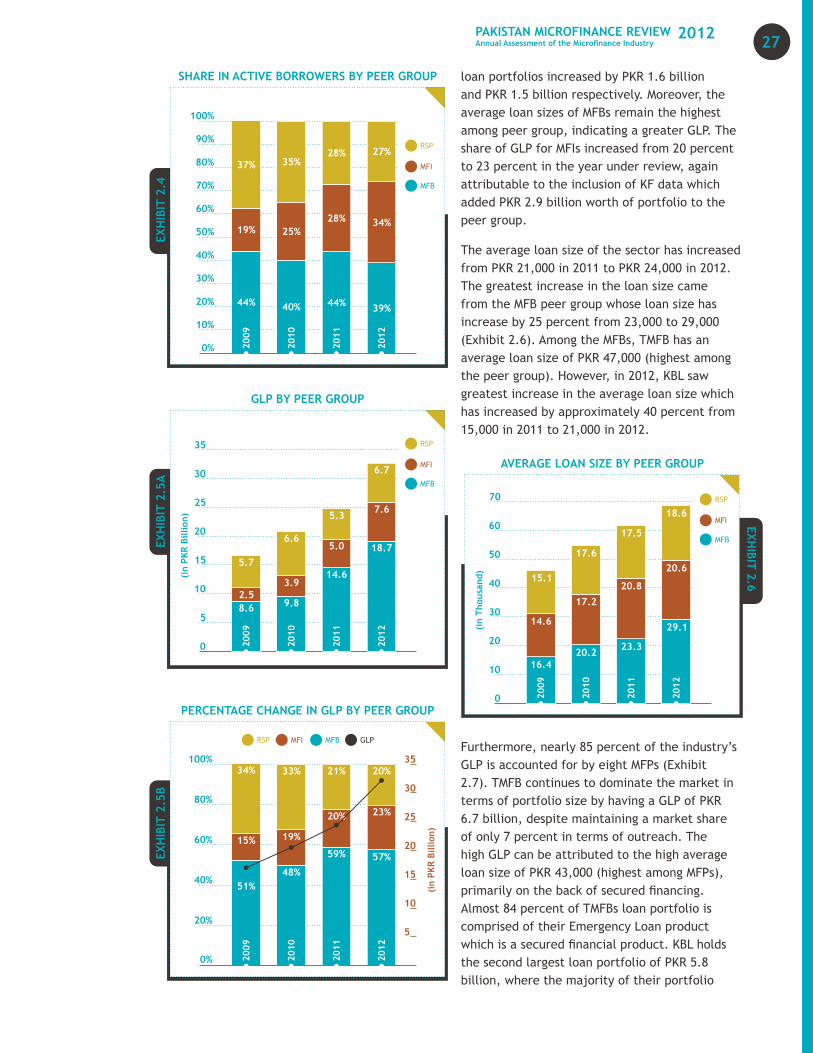
loan portfolios increased by PKR 1.6 billion and PKR 1.5 billion respectively. Moreover, the average loan sizes of MFBs remain the highest among peer group, indicating a greater GLP. The share of GLP for MFIs increased from 20 percent to 23 percent in the year under review, again attributable to the inclusion of KF data which added PKR 2.9 billion worth of portfolio to the peer group.
The average loan size of the sector has increased from PKR 21,000 in 2011 to PKR 24,000 in 2012. The greatest increase in the loan size came from the MFB peer group whose loan size has increase by 25 percent from 23,000 to 29,000 (Exhibit 2.6). Among the MFBs, TMFB has an average loan size of PKR 47,000 (highest among the peer group). However, in 2012, KBL saw greatest increase in the average loan size which has increased by approximately 40 percent from 15,000 in 2011 to 21,000 in 2012.
Furthermore, nearly 85 percent of the industry’s GLP is accounted for by eight MFPs (Exhibit 2.7). TMFB continues to dominate the market in terms of portfolio size by having a GLP of PKR 6.7 billion, despite maintaining a market share of only 7 percent in terms of outreach. The high GLP can be attributed to the high average loan size of PKR 43,000 (highest among MFPs), primarily on the back of secured financing. Almost 84 percent of TMFBs loan portfolio is comprised of their Emergency Loan product which is a secured financial product. KBL holds the second largest loan portfolio of PKR 5.8 billion, where the majority of their portfolio
27PAKISTAN MICROFINANCE REVIEWAnnual Assessment of the Microfinance Industry
2012
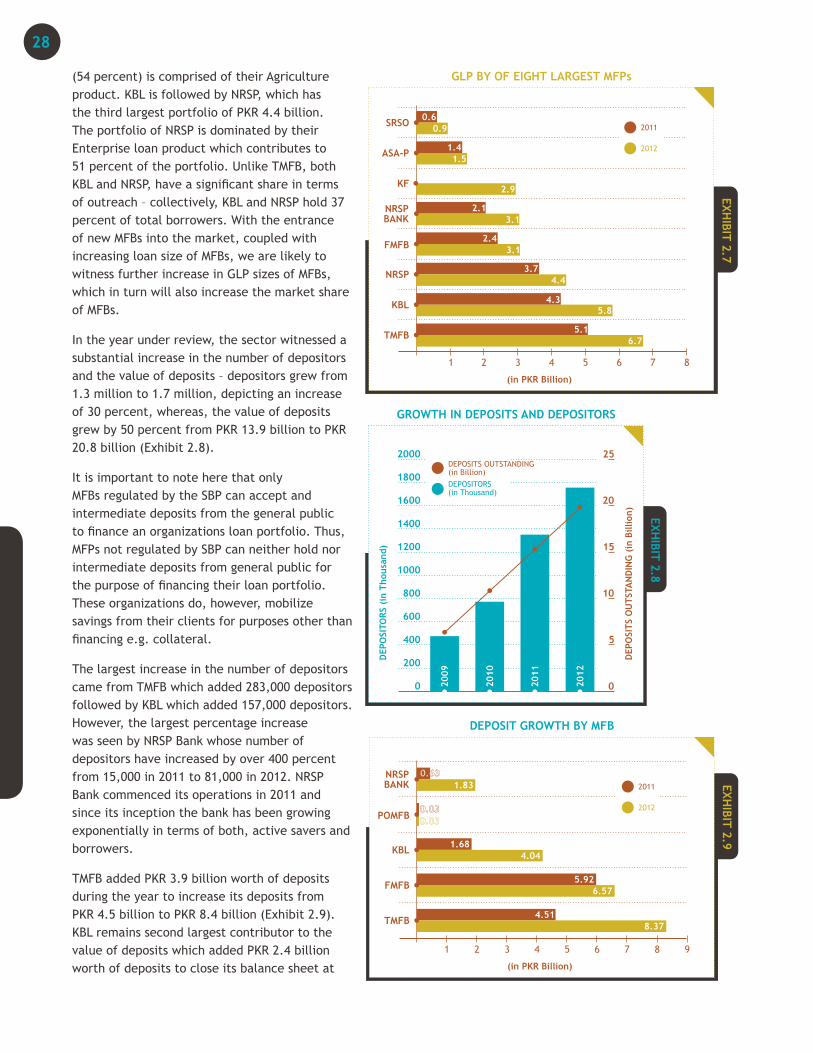
(54 percent) is comprised of their Agriculture product. KBL is followed by NRSP, which has the third largest portfolio of PKR 4.4 billion. The portfolio of NRSP is dominated by their Enterprise loan product which contributes to 51 percent of the portfolio. Unlike TMFB, both KBL and NRSP, have a significant share in terms of outreach – collectively, KBL and NRSP hold 37 percent of total borrowers. With the entrance of new MFBs into the market, coupled with increasing loan size of MFBs, we are likely to witness further increase in GLP sizes of MFBs, which in turn will also increase the market share of MFBs.
In the year under review, the sector witnessed a substantial increase in the number of depositors and the value of deposits – depositors grew from 1.3 million to 1.7 million, depicting an increase of 30 percent, whereas, the value of deposits grew by 50 percent from PKR 13.9 billion to PKR 20.8 billion (Exhibit 2.8).
It is important to note here that only MFBs regulated by the SBP can accept and intermediate deposits from the general public to finance an organizations loan portfolio. Thus, MFPs not regulated by SBP can neither hold nor intermediate deposits from general public for the purpose of financing their loan portfolio. These organizations do, however, mobilize savings from their clients for purposes other than financing e.g. collateral.
The largest increase in the number of depositors came from TMFB which added 283,000 depositors followed by KBL which added 157,000 depositors. However, the largest percentage increase was seen by NRSP Bank whose number of depositors have increased by over 400 percent from 15,000 in 2011 to 81,000 in 2012. NRSP Bank commenced its operations in 2011 and since its inception the bank has been growing exponentially in terms of both, active savers and borrowers.
TMFB added PKR 3.9 billion worth of deposits during the year to increase its deposits from PKR 4.5 billion to PKR 8.4 billion (Exhibit 2.9). KBL remains second largest contributor to the value of deposits which added PKR 2.4 billion worth of deposits to close its balance sheet at
28
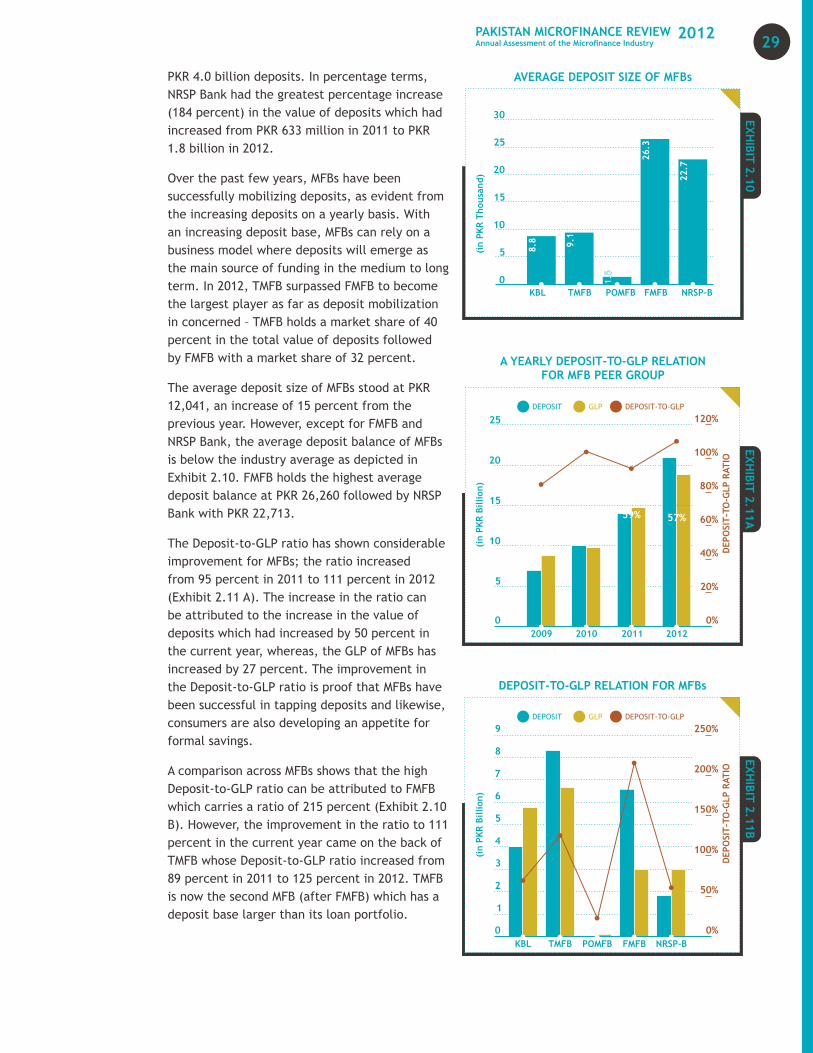
PKR 4.0 billion deposits. In percentage terms, NRSP Bank had the greatest percentage increase (184 percent) in the value of deposits which had increased from PKR 633 million in 2011 to PKR 1.8 billion in 2012.
Over the past few years, MFBs have been successfully mobilizing deposits, as evident from the increasing deposits on a yearly basis. With an increasing deposit base, MFBs can rely on a business model where deposits will emerge as the main source of funding in the medium to long term. In 2012, TMFB surpassed FMFB to become the largest player as far as deposit mobilization in concerned – TMFB holds a market share of 40 percent in the total value of deposits followed by FMFB with a market share of 32 percent.
The average deposit size of MFBs stood at PKR 12,041, an increase of 15 percent from the previous year. However, except for FMFB and NRSP Bank, the average deposit balance of MFBs is below the industry average as depicted in Exhibit 2.10. FMFB holds the highest average deposit balance at PKR 26,260 followed by NRSP Bank with PKR 22,713.
The Deposit-to-GLP ratio has shown considerable improvement for MFBs; the ratio increased from 95 percent in 2011 to 111 percent in 2012 (Exhibit 2.11 A). The increase in the ratio can be attributed to the increase in the value of deposits which had increased by 50 percent in the current year, whereas, the GLP of MFBs has increased by 27 percent. The improvement in the Deposit-to-GLP ratio is proof that MFBs have been successful in tapping deposits and likewise, consumers are also developing an appetite for formal savings.
A comparison across MFBs shows that the high Deposit-to-GLP ratio can be attributed to FMFB which carries a ratio of 215 percent (Exhibit 2.10 B). However, the improvement in the ratio to 111 percent in the current year came on the back of TMFB whose Deposit-to-GLP ratio increased from 89 percent in 2011 to 125 percent in 2012. TMFB is now the second MFB (after FMFB) which has a deposit base larger than its loan portfolio.
29PAKISTAN MICROFINANCE REVIEWAnnual Assessment of the Microfinance Industry
2012
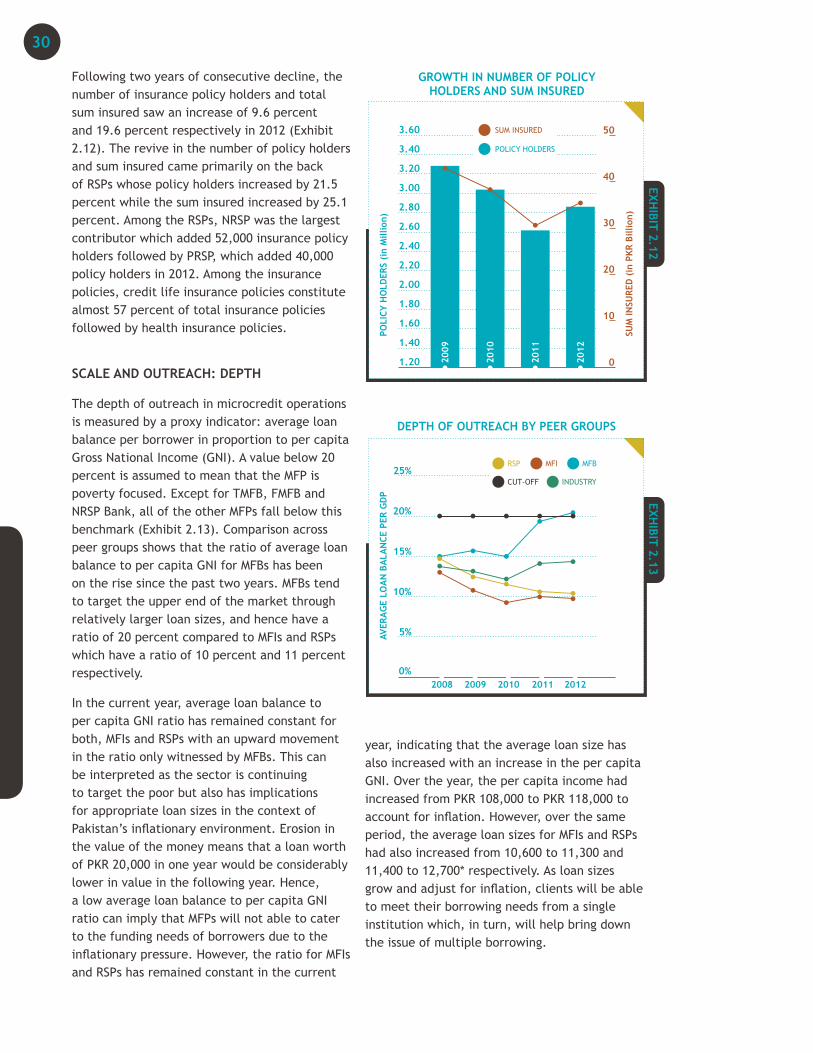
Following two years of consecutive decline, the number of insurance policy holders and total sum insured saw an increase of 9.6 percent and 19.6 percent respectively in 2012 (Exhibit 2.12). The revive in the number of policy holders and sum insured came primarily on the back of RSPs whose policy holders increased by 21.5 percent while the sum insured increased by 25.1 percent. Among the RSPs, NRSP was the largest contributor which added 52,000 insurance policy holders followed by PRSP, which added 40,000 policy holders in 2012. Among the insurance policies, credit life insurance policies constitute almost 57 percent of total insurance policies followed by health insurance policies.
SCALE AND OUTREACH: DEPTH
The depth of outreach in microcredit operations is measured by a proxy indicator: average loan balance per borrower in proportion to per capita Gross National Income (GNI). A value below 20 percent is assumed to mean that the MFP is poverty focused. Except for TMFB, FMFB and NRSP Bank, all of the other MFPs fall below this benchmark (Exhibit 2.13). Comparison across peer groups shows that the ratio of average loan balance to per capita GNI for MFBs has been on the rise since the past two years. MFBs tend to target the upper end of the market through relatively larger loan sizes, and hence have a ratio of 20 percent compared to MFIs and RSPs which have a ratio of 10 percent and 11 percent respectively.
In the current year, average loan balance to per capita GNI ratio has remained constant for both, MFIs and RSPs with an upward movement in the ratio only witnessed by MFBs. This can be interpreted as the sector is continuing to target the poor but also has implications for appropriate loan sizes in the context of Pakistan’s inflationary environment. Erosion in the value of the money means that a loan worth of PKR 20,000 in one year would be considerably lower in value in the following year. Hence, a low average loan balance to per capita GNI ratio can imply that MFPs will not able to cater to the funding needs of borrowers due to the inflationary pressure. However, the ratio for MFIs and RSPs has remained constant in the current
year, indicating that the average loan size has also increased with an increase in the per capita GNI. Over the year, the per capita income had increased from PKR 108,000 to PKR 118,000 to account for inflation. However, over the same period, the average loan sizes for MFIs and RSPs had also increased from 10,600 to 11,300 and 11,400 to 12,700* respectively. As loan sizes grow and adjust for inflation, clients will be able to meet their borrowing needs from a single institution which, in turn, will help bring down the issue of multiple borrowing.
30
Lending Methodology
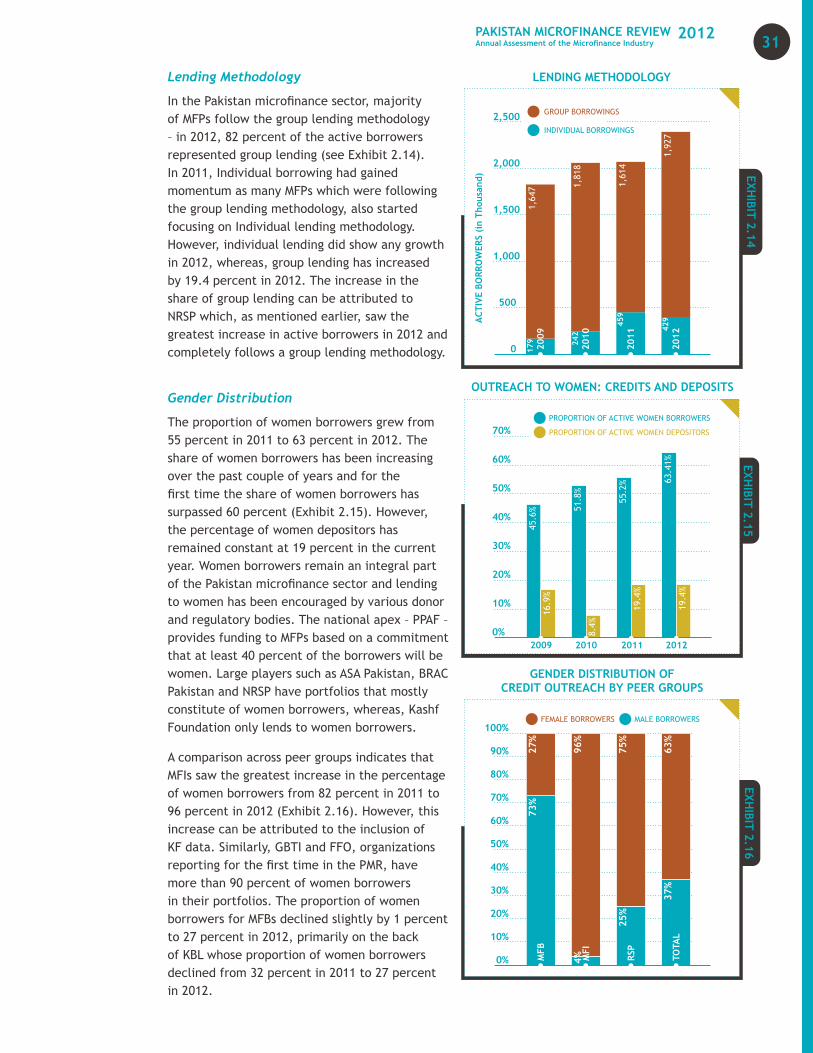
In the Pakistan microfinance sector, majority of MFPs follow the group lending methodology – in 2012, 82 percent of the active borrowers represented group lending (see Exhibit 2.14). In 2011, Individual borrowing had gained momentum as many MFPs which were following the group lending methodology, also started focusing on Individual lending methodology. However, individual lending did show any growth in 2012, whereas, group lending has increased by 19.4 percent in 2012. The increase in the share of group lending can be attributed to NRSP which, as mentioned earlier, saw the greatest increase in active borrowers in 2012 and completely follows a group lending methodology.
Gender Distribution
The proportion of women borrowers grew from 55 percent in 2011 to 63 percent in 2012. The share of women borrowers has been increasing over the past couple of years and for the first time the share of women borrowers has surpassed 60 percent (Exhibit 2.15). However, the percentage of women depositors has remained constant at 19 percent in the current year. Women borrowers remain an integral part of the Pakistan microfinance sector and lending to women has been encouraged by various donor and regulatory bodies. The national apex – PPAF – provides funding to MFPs based on a commitment that at least 40 percent of the borrowers will be women. Large players such as ASA Pakistan, BRAC Pakistan and NRSP have portfolios that mostly constitute of women borrowers, whereas, Kashf Foundation only lends to women borrowers.
A comparison across peer groups indicates that MFIs saw the greatest increase in the percentage of women borrowers from 82 percent in 2011 to 96 percent in 2012 (Exhibit 2.16). However, this increase can be attributed to the inclusion of KF data. Similarly, GBTI and FFO, organizations reporting for the first time in the PMR, have more than 90 percent of women borrowers in their portfolios. The proportion of women borrowers for MFBs declined slightly by 1 percent to 27 percent in 2012, primarily on the back of KBL whose proportion of women borrowers declined from 32 percent in 2011 to 27 percent in 2012.
31PAKISTAN MICROFINANCE REVIEWAnnual Assessment of the Microfinance Industry
2012
Given NRSP accounts for the bulk of RSPs’ outreach, the institute remained the main driver in increasing the share of women borrowers for RSPs from 72 percent to 75 percent, by adding 33,000 women borrowers in the current year.
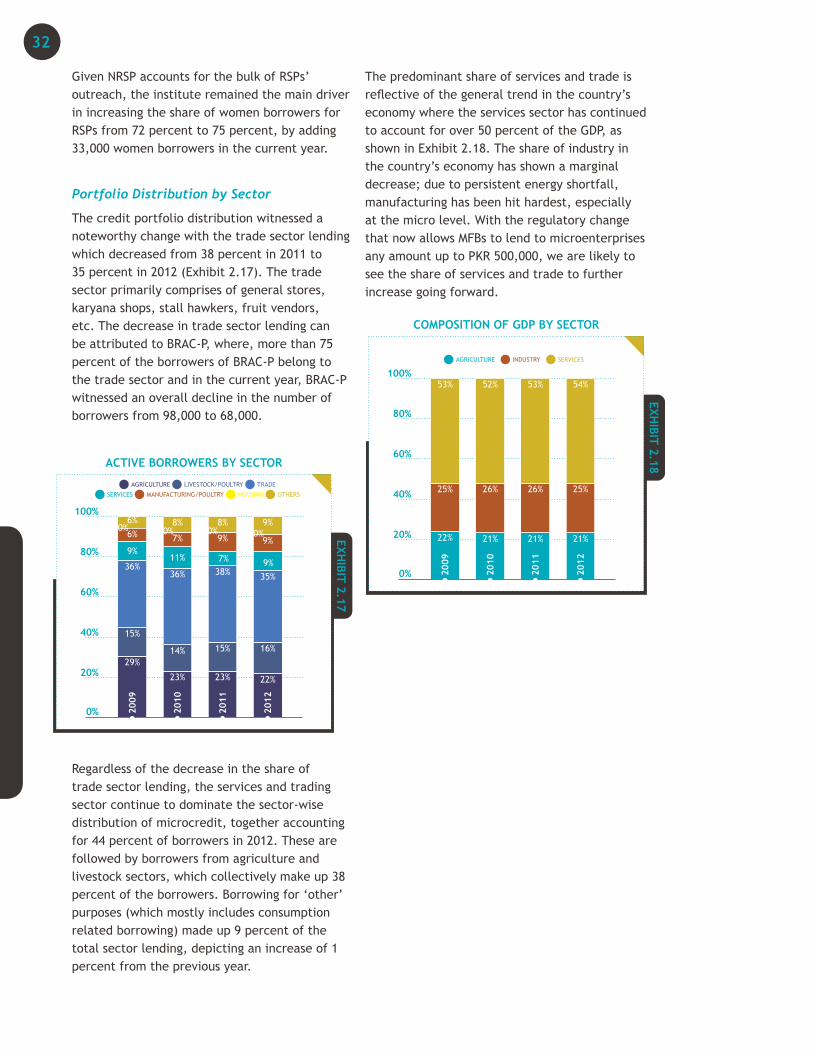
Portfolio Distribution by Sector
The credit portfolio distribution witnessed a noteworthy change with the trade sector lending which decreased from 38 percent in 2011 to 35 percent in 2012 (Exhibit 2.17). The trade sector primarily comprises of general stores, karyana shops, stall hawkers, fruit vendors, etc. The decrease in trade sector lending can be attributed to BRAC-P, where, more than 75 percent of the borrowers of BRAC-P belong to the trade sector and in the current year, BRAC-P witnessed an overall decline in the number of borrowers from 98,000 to 68,000.
Regardless of the decrease in the share of trade sector lending, the services and trading sector continue to dominate the sector-wise distribution of microcredit, together accounting for 44 percent of borrowers in 2012. These are followed by borrowers from agriculture and livestock sectors, which collectively make up 38 percent of the borrowers. Borrowing for ‘other’ purposes (which mostly includes consumption related borrowing) made up 9 percent of the total sector lending, depicting an increase of 1 percent from the previous year.
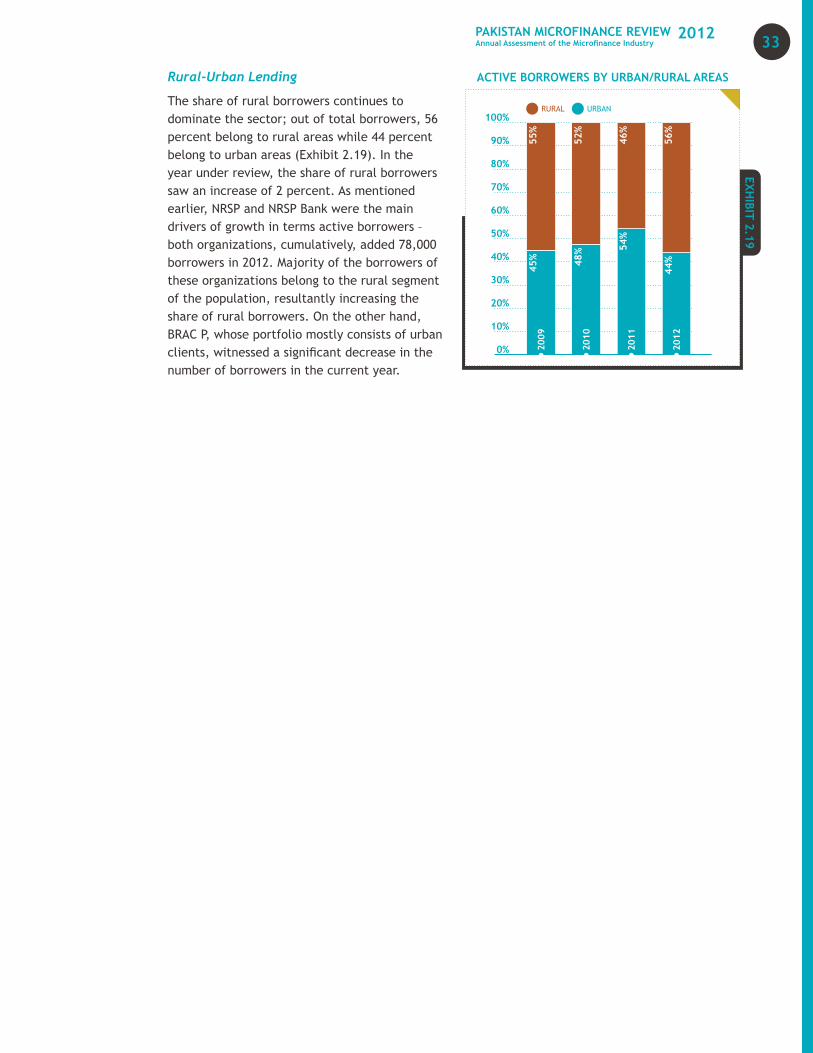
The predominant share of services and trade is reflective of the general trend in the country’s economy where the services sector has continued to account for over 50 percent of the GDP, as shown in Exhibit 2.18. The share of industry in the country’s economy has shown a marginal decrease; due to persistent energy shortfall, manufacturing has been hit hardest, especially at the micro level. With the regulatory change that now allows MFBs to lend to microenterprises any amount up to PKR 500,000, we are likely to see the share of services and trade to further increase going forward.
32
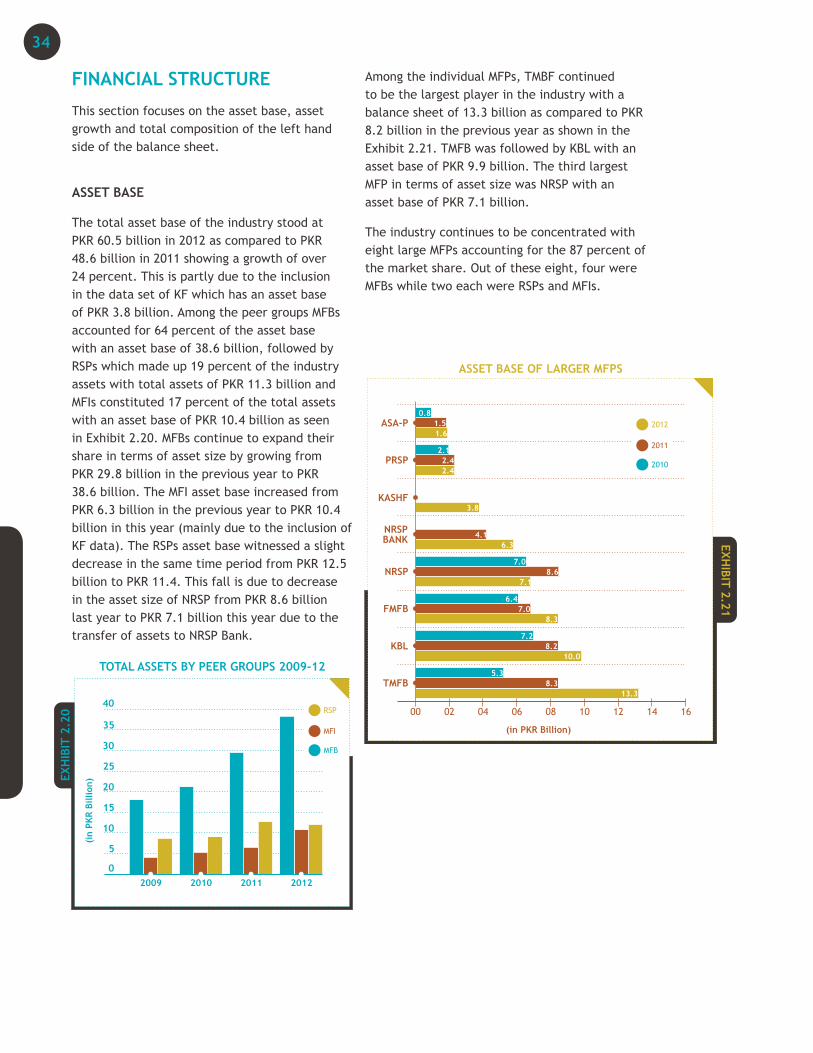
Rural-Urban Lending
The share of rural borrowers continues to dominate the sector; out of total borrowers, 56 percent belong to rural areas while 44 percent belong to urban areas (Exhibit 2.19). In the year under review, the share of rural borrowers saw an increase of 2 percent. As mentioned earlier, NRSP and NRSP Bank were the main drivers of growth in terms active borrowers – both organizations, cumulatively, added 78,000 borrowers in 2012. Majority of the borrowers of these organizations belong to the rural segment of the population, resultantly increasing the share of rural borrowers. On the other hand, BRAC P, whose portfolio mostly consists of urban clients, witnessed a significant decrease in the number of borrowers in the current year.
33PAKISTAN MICROFINANCE REVIEWAnnual Assessment of the Microfinance Industry
2012
FINANCIAL STRUCTURE
This section focuses on the asset base, asset growth and total composition of the left hand side of the balance sheet.
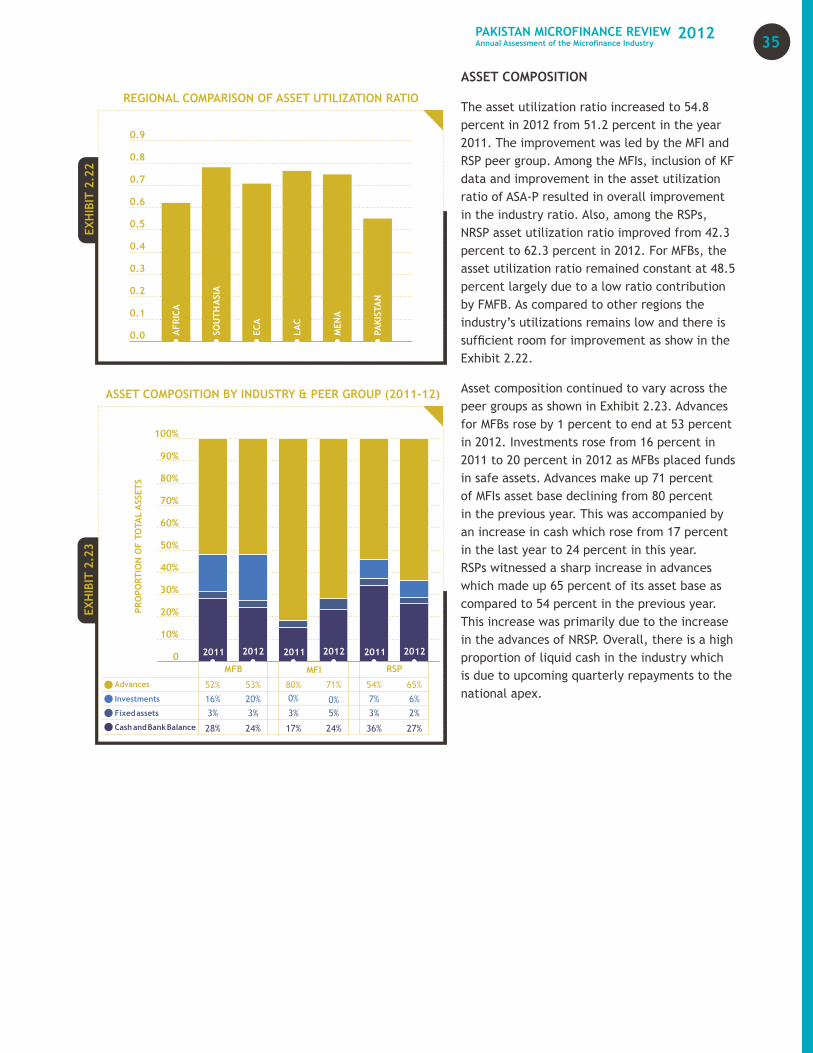
ASSET BASE
The total asset base of the industry stood at PKR 60.5 billion in 2012 as compared to PKR 48.6 billion in 2011 showing a growth of over 24 percent. This is partly due to the inclusion in the data set of KF which has an asset base of PKR 3.8 billion. Among the peer groups MFBs accounted for 64 percent of the asset base with an asset base of 38.6 billion, followed by RSPs which made up 19 percent of the industry assets with total assets of PKR 11.3 billion and MFIs constituted 17 percent of the total assets with an asset base of PKR 10.4 billion as seen in Exhibit 2.20. MFBs continue to expand their share in terms of asset size by growing from PKR 29.8 billion in the previous year to PKR 38.6 billion. The MFI asset base increased from PKR 6.3 billion in the previous year to PKR 10.4 billion in this year (mainly due to the inclusion of KF data). The RSPs asset base witnessed a slight decrease in the same time period from PKR 12.5 billion to PKR 11.4. This fall is due to decrease in the asset size of NRSP from PKR 8.6 billion last year to PKR 7.1 billion this year due to the transfer of assets to NRSP Bank.
Among the individual MFPs, TMBF continued to be the largest player in the industry with a balance sheet of 13.3 billion as compared to PKR 8.2 billion in the previous year as shown in the Exhibit 2.21. TMFB was followed by KBL with an asset base of PKR 9.9 billion. The third largest MFP in terms of asset size was NRSP with an asset base of PKR 7.1 billion.
The industry continues to be concentrated with eight large MFPs accounting for the 87 percent of the market share. Out of these eight, four were MFBs while two each were RSPs and MFIs.
34
ASSET COMPOSITION
The asset utilization ratio increased to 54.8 percent in 2012 from 51.2 percent in the year 2011. The improvement was led by the MFI and RSP peer group. Among the MFIs, inclusion of KF data and improvement in the asset utilization ratio of ASA-P resulted in overall improvement in the industry ratio. Also, among the RSPs, NRSP asset utilization ratio improved from 42.3 percent to 62.3 percent in 2012. For MFBs, the asset utilization ratio remained constant at 48.5 percent largely due to a low ratio contribution by FMFB. As compared to other regions the industry’s utilizations remains low and there is sufficient room for improvement as show in the Exhibit 2.22.
Asset composition continued to vary across the peer groups as shown in Exhibit 2.23. Advances for MFBs rose by 1 percent to end at 53 percent in 2012. Investments rose from 16 percent in 2011 to 20 percent in 2012 as MFBs placed funds in safe assets. Advances make up 71 percent of MFIs asset base declining from 80 percent in the previous year. This was accompanied by an increase in cash which rose from 17 percent in the last year to 24 percent in this year. RSPs witnessed a sharp increase in advances which made up 65 percent of its asset base as compared to 54 percent in the previous year. This increase was primarily due to the increase in the advances of NRSP. Overall, there is a high proportion of liquid cash in the industry which is due to upcoming quarterly repayments to the national apex.
35PAKISTAN MICROFINANCE REVIEWAnnual Assessment of the Microfinance Industry
2012
FUNDING PROFILE
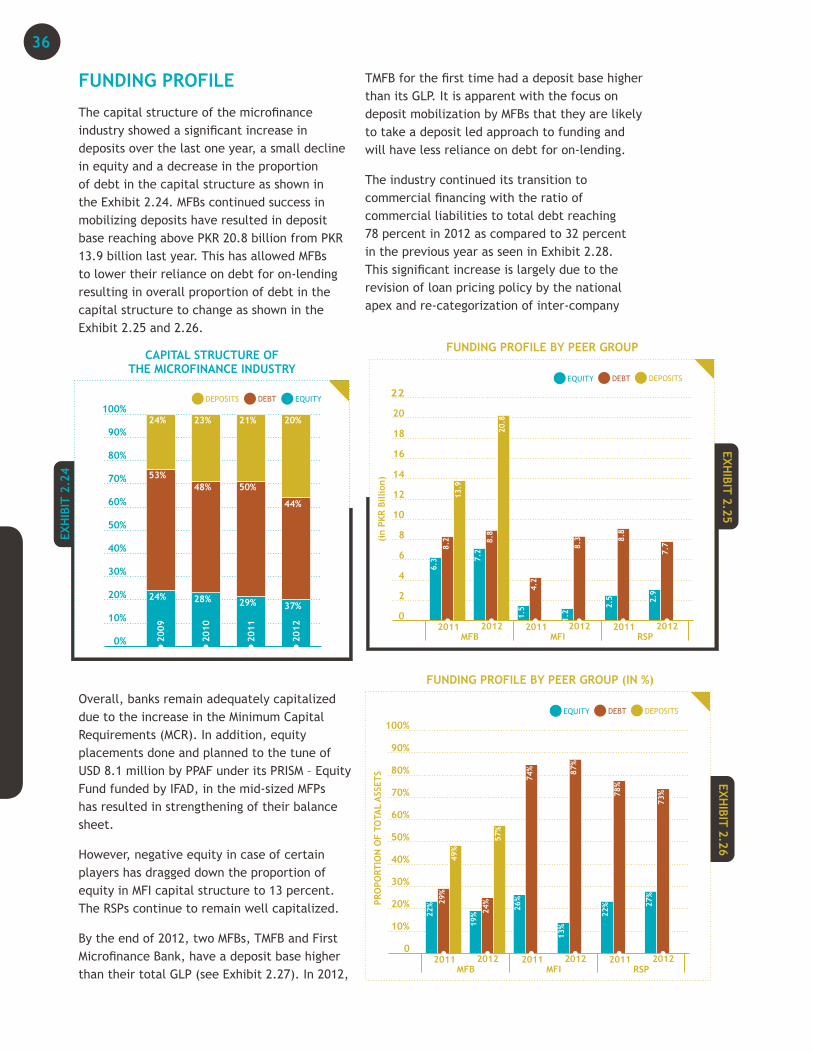
The capital structure of the microfinance industry showed a significant increase in deposits over the last one year, a small decline in equity and a decrease in the proportion of debt in the capital structure as shown in the Exhibit 2.24. MFBs continued success in mobilizing deposits have resulted in deposit base reaching above PKR 20.8 billion from PKR 13.9 billion last year. This has allowed MFBs to lower their reliance on debt for on-lending resulting in overall proportion of debt in the capital structure to change as shown in the Exhibit 2.25 and 2.26.
Overall, banks remain adequately capitalized due to the increase in the Minimum Capital Requirements (MCR). In addition, equity placements done and planned to the tune of USD 8.1 million by PPAF under its PRISM – Equity Fund funded by IFAD, in the mid-sized MFPs has resulted in strengthening of their balance sheet.
However, negative equity in case of certain players has dragged down the proportion of equity in MFI capital structure to 13 percent. The RSPs continue to remain well capitalized.
By the end of 2012, two MFBs, TMFB and First Microfinance Bank, have a deposit base higher than their total GLP (see Exhibit 2.27). In 2012,
TMFB for the first time had a deposit base higher than its GLP. It is apparent with the focus on deposit mobilization by MFBs that they are likely to take a deposit led approach to funding and will have less reliance on debt for on-lending.
The industry continued its transition to commercial financing with the ratio of commercial liabilities to total debt reaching 78 percent in 2012 as compared to 32 percent in the previous year as seen in Exhibit 2.28. This significant increase is largely due to the revision of loan pricing policy by the national apex and re-categorization of inter-company
36
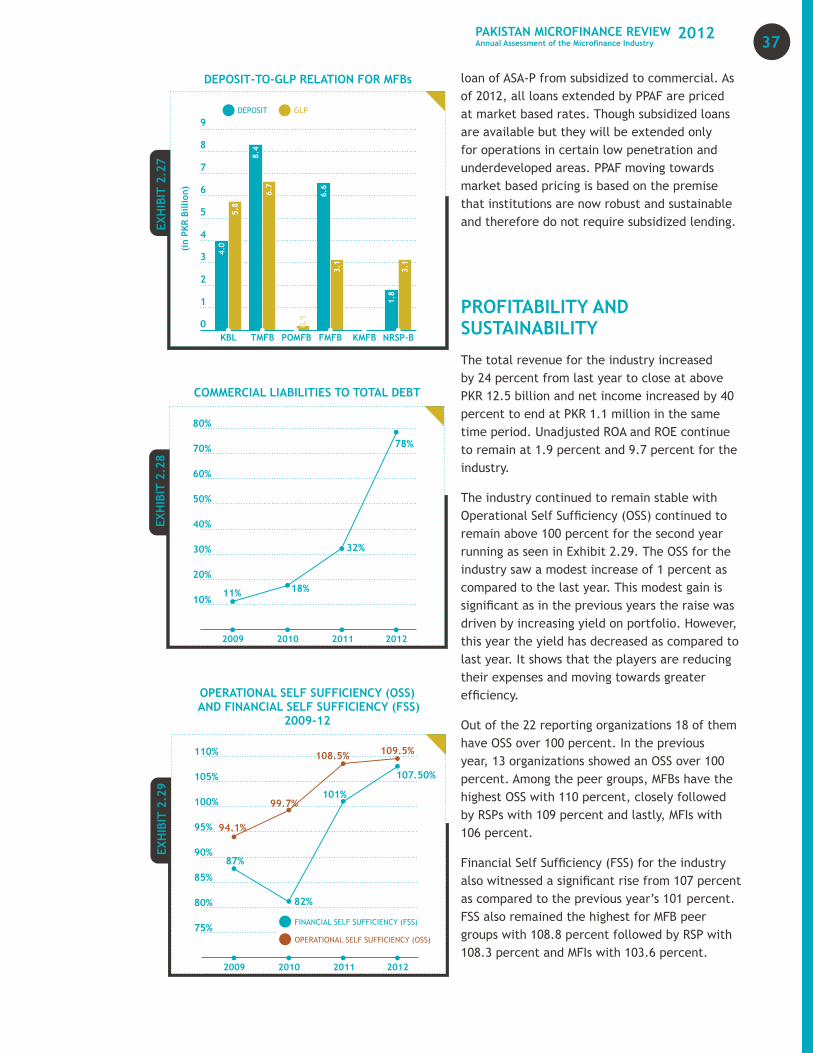
loan of ASA-P from subsidized to commercial. As of 2012, all loans extended by PPAF are priced at market based rates. Though subsidized loans are available but they will be extended only for operations in certain low penetration and underdeveloped areas. PPAF moving towards market based pricing is based on the premise that institutions are now robust and sustainable and therefore do not require subsidized lending.
PROFITABILITY AND SUSTAINABILITY
The total revenue for the industry increased by 24 percent from last year to close at above PKR 12.5 billion and net income increased by 40 percent to end at PKR 1.1 million in the same time period. Unadjusted ROA and ROE continue to remain at 1.9 percent and 9.7 percent for the industry.
The industry continued to remain stable with Operational Self Sufficiency (OSS) continued to remain above 100 percent for the second year running as seen in Exhibit 2.29. The OSS for the industry saw a modest increase of 1 percent as compared to the last year. This modest gain is significant as in the previous years the raise was driven by increasing yield on portfolio. However, this year the yield has decreased as compared to last year. It shows that the players are reducing their expenses and moving towards greater efficiency.
Out of the 22 reporting organizations 18 of them have OSS over 100 percent. In the previous year, 13 organizations showed an OSS over 100 percent. Among the peer groups, MFBs have the highest OSS with 110 percent, closely followed by RSPs with 109 percent and lastly, MFIs with 106 percent.
Financial Self Sufficiency (FSS) for the industry also witnessed a significant rise from 107 percent as compared to the previous year’s 101 percent. FSS also remained the highest for MFB peer groups with 108.8 percent followed by RSP with 108.3 percent and MFIs with 103.6 percent.
37PAKISTAN MICROFINANCE REVIEWAnnual Assessment of the Microfinance Industry
2012
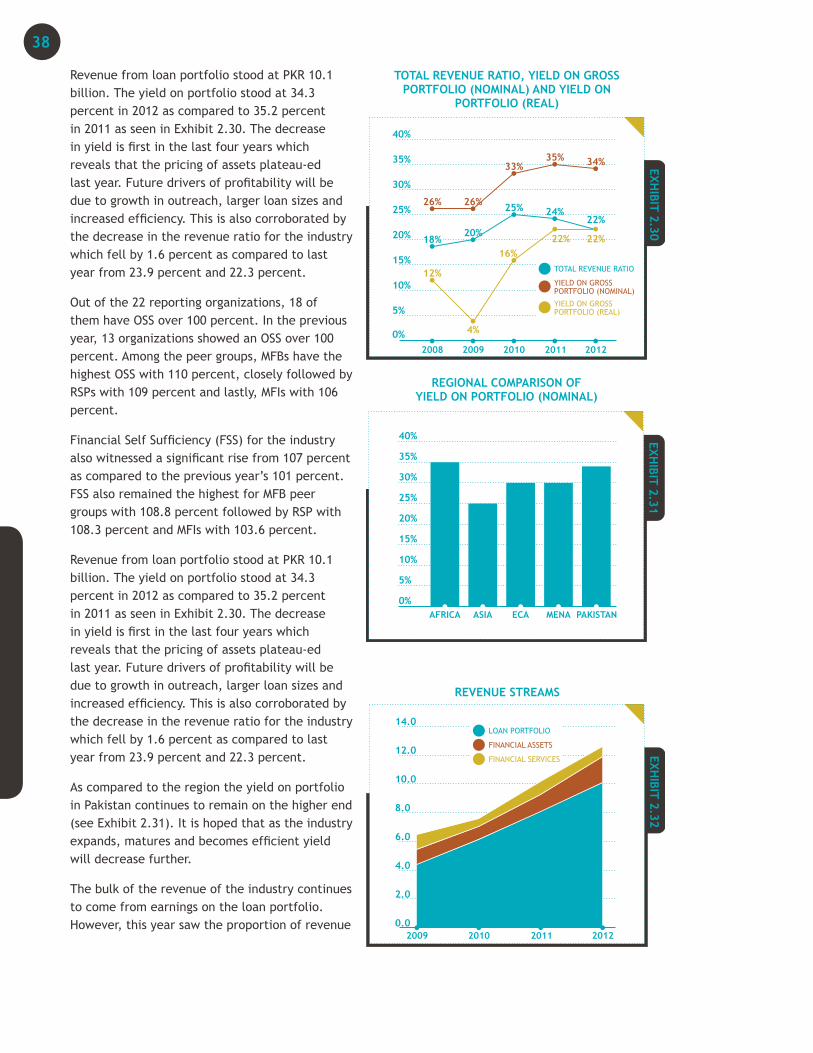
Revenue from loan portfolio stood at PKR 10.1 billion. The yield on portfolio stood at 34.3 percent in 2012 as compared to 35.2 percent in 2011 as seen in Exhibit 2.30. The decrease in yield is first in the last four years which reveals that the pricing of assets plateau-ed last year. Future drivers of profitability will be due to growth in outreach, larger loan sizes and increased efficiency. This is also corroborated by the decrease in the revenue ratio for the industry which fell by 1.6 percent as compared to last year from 23.9 percent and 22.3 percent.
Out of the 22 reporting organizations, 18 of them have OSS over 100 percent. In the previous year, 13 organizations showed an OSS over 100 percent. Among the peer groups, MFBs have the highest OSS with 110 percent, closely followed by RSPs with 109 percent and lastly, MFIs with 106 percent.
Financial Self Sufficiency (FSS) for the industry also witnessed a significant rise from 107 percent as compared to the previous year’s 101 percent. FSS also remained the highest for MFB peer groups with 108.8 percent followed by RSP with 108.3 percent and MFIs with 103.6 percent.
Revenue from loan portfolio stood at PKR 10.1 billion. The yield on portfolio stood at 34.3 percent in 2012 as compared to 35.2 percent in 2011 as seen in Exhibit 2.30. The decrease in yield is first in the last four years which reveals that the pricing of assets plateau-ed last year. Future drivers of profitability will be due to growth in outreach, larger loan sizes and increased efficiency. This is also corroborated by the decrease in the revenue ratio for the industry which fell by 1.6 percent as compared to last year from 23.9 percent and 22.3 percent.
As compared to the region the yield on portfolio in Pakistan continues to remain on the higher end (see Exhibit 2.31). It is hoped that as the industry expands, matures and becomes efficient yield will decrease further.
The bulk of the revenue of the industry continues to come from earnings on the loan portfolio. However, this year saw the proportion of revenue
38
from investments in financial assets increase to 14 percent from 12 percent last year as MFBs placed surplus funds into financial assets to provide them with a financial cushion and meet their liquidity needs (see Exhibit 2.32). Income from branchless banking for TMFB stood at PKR 445 million which more than doubled as compared to the previous year.
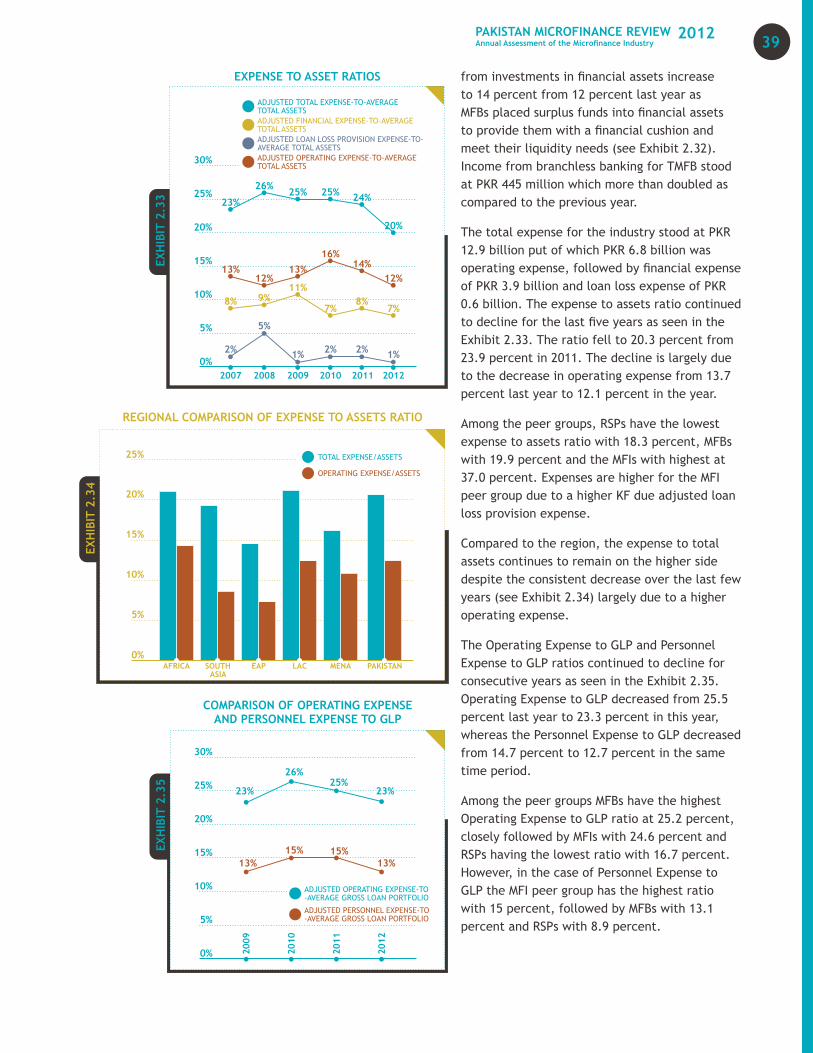
The total expense for the industry stood at PKR 12.9 billion put of which PKR 6.8 billion was operating expense, followed by financial expense of PKR 3.9 billion and loan loss expense of PKR 0.6 billion. The expense to assets ratio continued to decline for the last five years as seen in the Exhibit 2.33. The ratio fell to 20.3 percent from 23.9 percent in 2011. The decline is largely due to the decrease in operating expense from 13.7 percent last year to 12.1 percent in the year.
Among the peer groups, RSPs have the lowest expense to assets ratio with 18.3 percent, MFBs with 19.9 percent and the MFIs with highest at 37.0 percent. Expenses are higher for the MFI peer group due to a higher KF due adjusted loan loss provision expense.
Compared to the region, the expense to total assets continues to remain on the higher side despite the consistent decrease over the last few years (see Exhibit 2.34) largely due to a higher operating expense.
The Operating Expense to GLP and Personnel Expense to GLP ratios continued to decline for consecutive years as seen in the Exhibit 2.35. Operating Expense to GLP decreased from 25.5 percent last year to 23.3 percent in this year, whereas the Personnel Expense to GLP decreased from 14.7 percent to 12.7 percent in the same time period.
Among the peer groups MFBs have the highest Operating Expense to GLP ratio at 25.2 percent, closely followed by MFIs with 24.6 percent and RSPs having the lowest ratio with 16.7 percent. However, in the case of Personnel Expense to GLP the MFI peer group has the highest ratio with 15 percent, followed by MFBs with 13.1 percent and RSPs with 8.9 percent.
39PAKISTAN MICROFINANCE REVIEWAnnual Assessment of the Microfinance Industry
2012
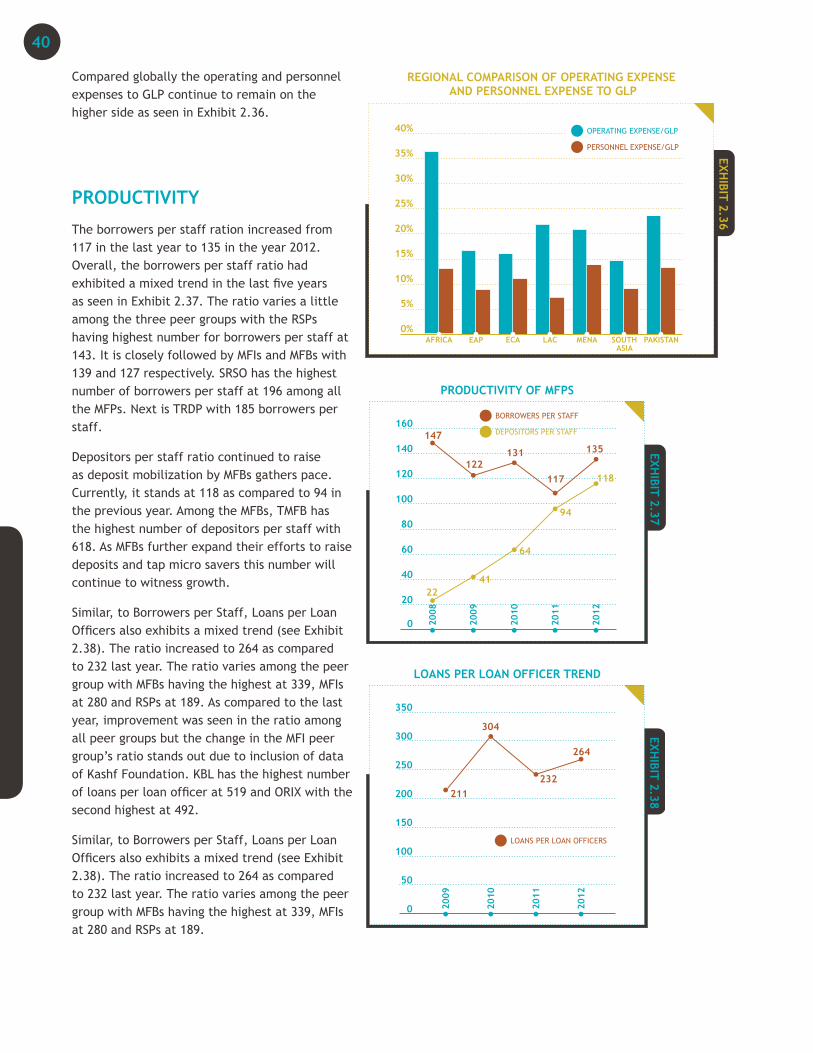
Compared globally the operating and personnel expenses to GLP continue to remain on the higher side as seen in Exhibit 2.36.
PRODUCTIVITY
The borrowers per staff ration increased from 117 in the last year to 135 in the year 2012. Overall, the borrowers per staff ratio had exhibited a mixed trend in the last five years as seen in Exhibit 2.37. The ratio varies a little among the three peer groups with the RSPs having highest number for borrowers per staff at 143. It is closely followed by MFIs and MFBs with 139 and 127 respectively. SRSO has the highest number of borrowers per staff at 196 among all the MFPs. Next is TRDP with 185 borrowers per staff.
Depositors per staff ratio continued to raise as deposit mobilization by MFBs gathers pace. Currently, it stands at 118 as compared to 94 in the previous year. Among the MFBs, TMFB has the highest number of depositors per staff with 618. As MFBs further expand their efforts to raise deposits and tap micro savers this number will continue to witness growth.
Similar, to Borrowers per Staff, Loans per Loan Officers also exhibits a mixed trend (see Exhibit 2.38). The ratio increased to 264 as compared to 232 last year. The ratio varies among the peer group with MFBs having the highest at 339, MFIs at 280 and RSPs at 189. As compared to the last year, improvement was seen in the ratio among all peer groups but the change in the MFI peer group’s ratio stands out due to inclusion of data of Kashf Foundation. KBL has the highest number of loans per loan officer at 519 and ORIX with the second highest at 492.
Similar, to Borrowers per Staff, Loans per Loan Officers also exhibits a mixed trend (see Exhibit 2.38). The ratio increased to 264 as compared to 232 last year. The ratio varies among the peer group with MFBs having the highest at 339, MFIs at 280 and RSPs at 189.
40
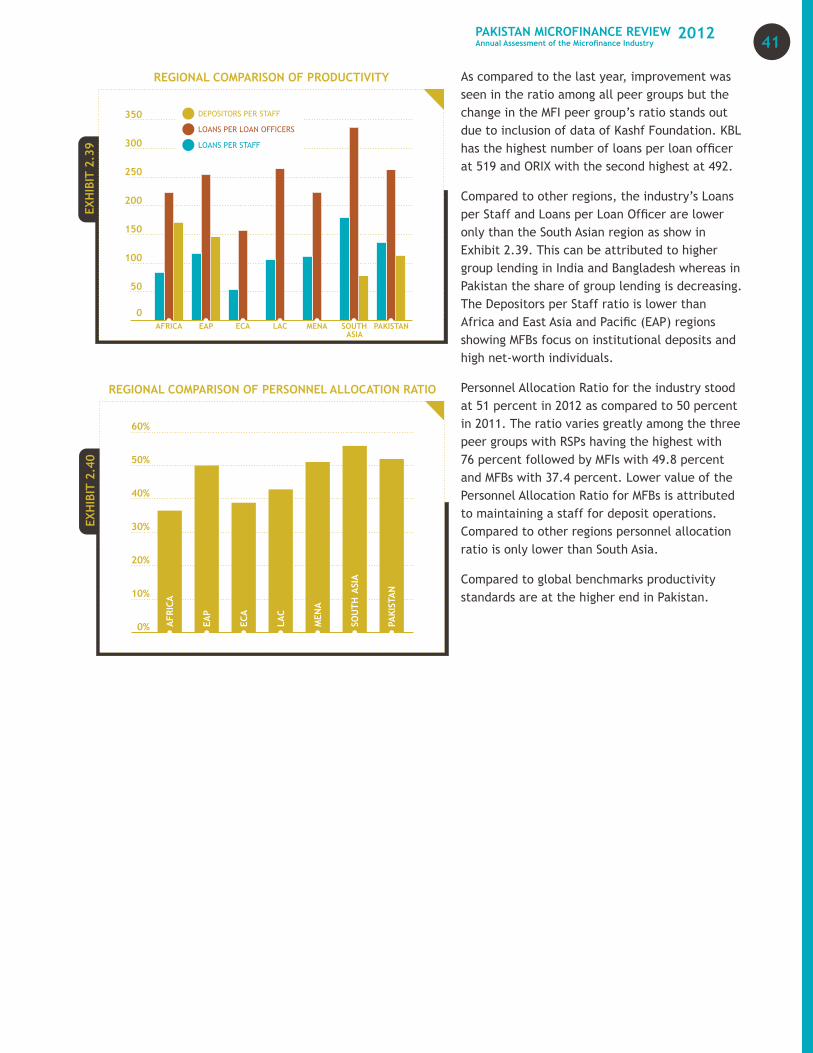
As compared to the last year, improvement was seen in the ratio among all peer groups but the change in the MFI peer group’s ratio stands out due to inclusion of data of Kashf Foundation. KBL has the highest number of loans per loan officer at 519 and ORIX with the second highest at 492.
Compared to other regions, the industry’s Loans per Staff and Loans per Loan Officer are lower only than the South Asian region as show in Exhibit 2.39. This can be attributed to higher group lending in India and Bangladesh whereas in Pakistan the share of group lending is decreasing. The Depositors per Staff ratio is lower than Africa and East Asia and Pacific (EAP) regions showing MFBs focus on institutional deposits and high net-worth individuals.
Personnel Allocation Ratio for the industry stood at 51 percent in 2012 as compared to 50 percent in 2011. The ratio varies greatly among the three peer groups with RSPs having the highest with 76 percent followed by MFIs with 49.8 percent and MFBs with 37.4 percent. Lower value of the Personnel Allocation Ratio for MFBs is attributed to maintaining a staff for deposit operations. Compared to other regions personnel allocation ratio is only lower than South Asia.
Compared to global benchmarks productivity standards are at the higher end in Pakistan.
41PAKISTAN MICROFINANCE REVIEWAnnual Assessment of the Microfinance Industry
2012
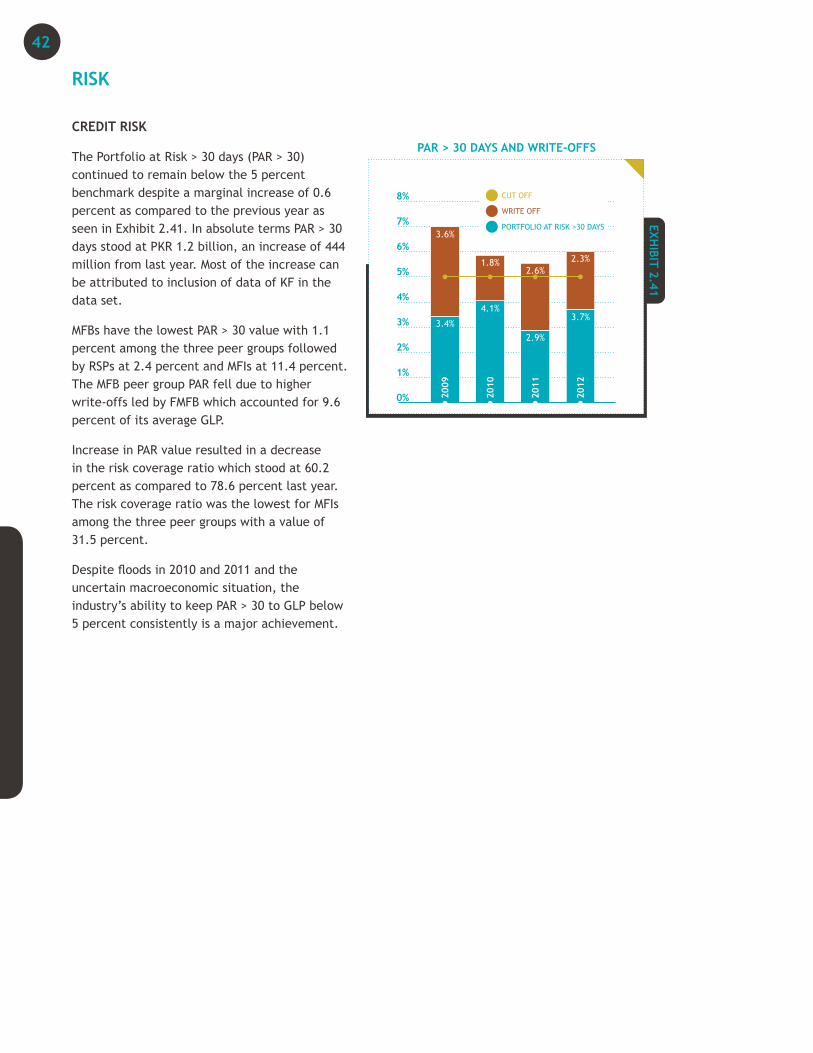
RISK
CREDIT RISK
The Portfolio at Risk > 30 days (PAR > 30) continued to remain below the 5 percent benchmark despite a marginal increase of 0.6 percent as compared to the previous year as seen in Exhibit 2.41. In absolute terms PAR > 30 days stood at PKR 1.2 billion, an increase of 444 million from last year. Most of the increase can be attributed to inclusion of data of KF in the data set.
MFBs have the lowest PAR > 30 value with 1.1 percent among the three peer groups followed by RSPs at 2.4 percent and MFIs at 11.4 percent. The MFB peer group PAR fell due to higher write-offs led by FMFB which accounted for 9.6 percent of its average GLP.
Increase in PAR value resulted in a decrease in the risk coverage ratio which stood at 60.2 percent as compared to 78.6 percent last year. The risk coverage ratio was the lowest for MFIs among the three peer groups with a value of 31.5 percent.
Despite floods in 2010 and 2011 and the uncertain macroeconomic situation, the industry’s ability to keep PAR > 30 to GLP below 5 percent consistently is a major achievement.
42
CONCLUSION
The microfinance industry in Pakistan experienced growth and expansion in the year 2012. Outreach grew by highest as compared to last five years. GLP continues to expand on the back of increasing loan sizes and growth in outreach. However, the average loan balance per capita continues to remain below 20 percent indicating that the increase in loan sizes is largely as a result of correction in loan size due to inflation. Deposits continue to be the main driver of the growth in the industry as they completed another year of remarkable increase but only two MFBs have a deposit base higher than their loan portfolio. Micro-insurance continued to be dominated by credit life and health which are dovetailed with credit products. Women borrowers continue to make up majority of the active borrowers. The year saw reversal in the trend with rural borrowers making up a higher percentage of active borrowers for the industry. Group lending continues to dominate the lending methodology but gradual increase in individual lending shows its growing popularity with the practitioners.
Overall the industry continues to remain sustainable with both FSS and OSS remaining above 100 percent. However, the yield on portfolio which plateaued in the previous year saw a decrease showing that future profitability will be either due to cost reduction and growth in revenues to increasing outreach. Overall, the industry continues to be highly productive when compared to the region. Also, the credit risk continues to remain below 5 percent which is a reflection of quality of portfolio.

SECTION THREE
THE WAY FORWARD
CONTENTS
1 Challenges
2 Opportunities
“To me, the poor are like Bonsai trees. When you plant the best seed of the tallest tree in a six-inch deep flower pot, you get a perfect replica of the tallest tree, but it is only inches tall. There is nothing wrong with the seed you planted; only the soil-base you provided was inadequate.
Poor people are bonsai people. There is nothing wrong with their seeds. Only society never gave them a base to grow on.”
Muhammad Yunus

CHALLENGES
STAGNANCY IN CREDIT GROWTH
While the industry’s GLP continues to experience growth as lenders have incrementally increased loan sizes, growth in outreach in terms of the number of borrowers remains sluggish. Signs of recovery in outreach growth have begun to emerge in recent quarters but the penetration rate remains below nine percent13. What is preventing faster growth? Various factors are part of the answer.
The external environment of the country has not been conducive for any business, including microfinance, in recent years. The security situation in Khyber Pakhtunkhwa and Baluchistan have rendered these marginal markets for MFPs and operations in these areas have been scaled back or even closed down. Also, the floods in 2010 and 2011 forced MFPs especially those in rural areas to consolidate rather than pursue growth. In addition, the persistent energy crisis has badly affected all segments of the economy including urban micro enterprises. The combination of a sluggish economy and political instability made MFPs cautious and hesitant to pursue aggressive growth strategies.
That said, there were various endogenous factors also affecting the sector’s growth. Funding is a constraint – although a few MFBs have been able to successfully mobilize deposits, other MFBs and all non-bank MFBs have had to rely solely on debt. Despite the presence of guarantee funds, the ability of the sector to raise funds from commercial banks has been limited. Although the commercial banks’ appetite to lend to the
13: MicroWATCH, Quarter 4, (Oct-Dec 2012)
private sector is one factor in this, other reasons include lack of understanding on the commercial banks’ part about microfinance models, their confidence in the portfolio quality of MFPs (especially MFIs), their concerns with standards of corporate governance and management quality of the relatively smaller institutions. Absence of a regulatory and legal framework for the non-banks MFPs has also been another hurdle. In addition to funding, the sector underwent major transitions in the past couple of years with several mergers and acquisitions, and management changes in previously fast growing institutions.
The sector is taking proactive steps to address these challenges. To address external uncertainties such as natural calamities and security related losses, deliberation has begun under the leadership of SBP to set up a risk mitigation fund for the sector. The mergers and consolidation phase is nearly complete, with strong investors now backing microfinance banks that will drive their organizations more strategically. PPAF is undergoing a spin-off process to become more customized to meet the funding needs of the sector. Closer engagement is being initiated with commercial banks and MFPs are looking towards other avenues such as debt capital markets to also raise funds. A regulatory and legal framework for non-bank MFIs is also being debated under SECP’s auspices. Industry infrastructure is being strengthened with the MF-CIB. It can be anticipated that all these positive developments will help growth pick up in the near future. It is also, however, clear that growth rates will be lower than what was seen before 2008/09. These will be based on better market information and segmentation, more sustainable funding channels and with a
46 SECTION THREE
THE WAY FORWARD
view to maintain strong internal controls and focus on client protection mechanisms.
PRODUCT DIVERSIFICATION
Low income households have complex financial needs. Access to finance enables them to invest and grow their businesses, smooth their often irregular income streams, save in a secure and efficient manner and hedge risks. Obviously, these diverse needs cannot be met with one or two standard products, and require service providers to offer a range of products. This benefits not only the client but also the MFP through strengthening the relationship with clients, being able to cross sell and reduce their risk.
Product development has come a long way in Pakistan’s microfinance sector and we see that nearly all MFPs now offer more than one credit product and MFBs have a menu of savings products. A number of new products were also introduced under the auspices of Microfinance Innovation and Outreach Program (MIOP) by PPAF. That said, there is considerable room to do more in both credit and savings.
Low income households need safe and affordable savings mechanisms. A look at the current menu of savings products offered by most MFPs shows that these mirror products in the commercial banking space. Products designed to capture excess cash flows of the low income – through conventional methods or through branchless banking channels – are still limited. Also, it seems that most MFBs are still going after the low hanging fruit – institutional deposits. In doing so, they have to compete with commercial banks and may be at a disadvantage in terms of cost of these deposits and also the services they can offer. Although global evidence shows that institutional deposits play an important role in funding the assets of most large microfinance banks, products tailored to capture the small deposits are also important. This is the niche that the microfinance sector needs to target through differentiated products.
In addition to savings and credit, micro-insurance has been fast carving out its space in the menu of products in the microfinance sector. Although credit-life and health remain the two major MI products in the market today, there are a number of initiatives underway to promote MI. SECP’s framework for regulating MI will create an enabling environment for the sector’s growth. In addition, PPAF has piloted innovative products in crop and livestock insurance using index-based methods. As SECP takes a lead and adopts a sector development approach towards micro-insurance as SBP did for microcredit and savings, we can expect significant activity and development in terms of product development, innovation in delivery and business models and outreach growth of micro-insurance.
INSTITUTIONAL DEVELOPMENT
Pakistan’s microfinance industry can clearly be classified as mature in the global context, with strong fundamentals in place to enable its sustainable long term development. MFPs operate in one of the best regulatory and policy regimes in the world, with an active apex funder and network. Considerable investments have been ploughed in by donors to support capacity building and systems development. Some institutions have optimally used these conditions to develop institutional strength and depth while others, despite having been in operation for a long time, continue to struggle. Both need to take an inward look to prepare themselves for the next generation of microfinance in Pakistan, which will have less access to donor money, will have to be able to tap commercial funding (debt, deposits and equity) sources for growth, focus on product development and market segmentation and will be more closely regulated and supervised.
To continue to post growth and adequate profitability, institutions will have to improve efficiency. There are opportunities that technology and new markets offer, and MFPs that take advantage of these will clearly have an edge over their competitors. Focus on strengthening governance and transparency, improving quality of senior management teams and a focus on human resource by MFPs will
47PAKISTAN MICROFINANCE REVIEWAnnual Assessment of the Microfinance Industry
2012
be critical for the sector’s development. It requires efficient processes, effective internal management and organizational systems. Players need to be responsive and innovative to meet market demands in terms of products and replicate global good practices to foster institutional development.
SECURED FINANCING
Gold backed lending has been gaining momentum in Pakistan as it is seen as a secure form of lending, and is hence, being used by microfinance providers to mitigate credit risk. Although the service had existed for decades in Pakistan, TMFB was the first microfinance bank to introduce gold backed lending as a viable financial offering for the microfinance sector, and today more than 85 percent of its loan portfolio is backed by gold. Following the success of TMFB, other leading microfinance banks have also introduced gold backed lending products.
The product’s success can be attributed to a variety of factors, some of which are listed as follows:
Short disbursement time – Borrowers do not have to wait or go through lengthy processes for the disbursement of gold backed loans. The quick disbursement is a big improvement for clients compared to the days or weeks often required for other loans.
Lower interest rates – The interest rate on gold backed loans is lower than un-collateralized loans; TMFB offers gold loans at an annual interest rate that is 4-6% lower than their uncollateralized loans.
Third party guarantees – With gold as collateral, there are no further requirements to provide third party guarantees. Hence the decision to apply for a gold backed loan can be made at any time by an individual or household instead of the more rigid and demanding group mechanism.
Availability of gold – Gold is one commodity that is readily available in most households in Pakistan. It is often maintained in the form of
jewelry in rural areas, and is passed on from one generation to the next.
The product is also attractive from an MFP’s perspective: gold backed lending is more convenient, cost effective and secure. Unlike un-collateralized lending, gold backed lending reduces credit risk for MFBs and lowers their overall provisioning requirements. It is a highly liquid commodity whose market value can be instantly established. As mentioned above, gold is usually kept in the form of jewelry which makes it easy for MFPs to store.
Despite its attractiveness, the product also has its pitfalls. The social and sentimental value attached to gold in Pakistani culture is far greater than its monetary value, and the fear of losing such an item will put tremendous pressure on borrowers, who will be willing to take extreme measures to recover their valuables. Institutions that are forced to foreclose on a gold backed loan can also potentially face social backlash given the nature of this collateral14.
Another obvious risk is the fluctuation in the price of gold, which unlike conventional collateral, fluctuates on a daily basis. Any major downturn in gold prices in the international market (and we see a recent example of this in Exhibit 3.1) will have a negative impact on MFPs, as the gold might not be worth the value it was when marked as collateral. This becomes especially an area of concern in cases where portfolios are heavily concentrated in this one product. MFPs are trying to account for this by keeping a margin of 30 to 35 percent against market value when making the loan.
Critics of gold backed microfinance loans also argue that MF is meant to cater to low income and poor households, including people who do not have gold to offer as collateral. Pushing this as a main product would hamper access to credit for this segment. Similarly, by focusing on secured lending the sector may be at risk of losing the fundamental advantage it had in terms of having the systems and people that are able to make unsecured loans at low risk. 14: However, the ratio of default for gold backed loans is low and MFBs rarely resort to selling the jewelry.
48

Moreover, the national apex does not allow funds lent by it to MFPs be used up for on-lending against gold.
FUNDING
Funding continues to be a major challenge for the sector. The prevailing macroeconomic conditions have seen financiers shy away from taking risks and exploring new financing avenues like the microfinance industry. The industry continues to rely on the national apex and the guarantee funds to meet the bulk of their financing needs. However, for the industry to become truly viable and sustainable it is imperative that it is able to raise funds from commercial sources with ease.
Keeping in view that the industry’s long term viability and sustainability is dependent upon successful transition from subsidized lending to commercial lending, PPAF converted to market based pricing of loans in 2012 with subsidized lending available only for on-lending to low penetrations areas. This will result in increase in the cost of funds for the sector and impact their profitability but also push players to borrow funds from commercial sources.
Guarantee funds will continue to play an important role in allowing MFPs to access from commercial banks. However, practitioners will need to build on these credit relationships and attract clean lending on the basis of the strength of their balance sheets and profitability. With
the recent extension and top-up of the MCGF to cover debt exposure in capital markets for another two years, MFPs have an opportunity to diversify their sources of financing.
MFBs continue to experience success in mobilizing deposits: at present two banks have deposits greater than their advances. MFBs have been mobilizing deposits by offering attractive market rates and attracting high-net worth individuals and institutional deposits. However, this will expose MFBs to competition from commercial banks that have a more established presence in the market. In the long run MFBs will have to develop micro-savings products and intermediate deposits via branchless banking models. SBP is already looking into the possibility of providing MFBs membership of the clearing house to further facilitate their deposit mobilization efforts. In addition, PMN is working on the possibility of linking up the sector to the country’s ATM networks.
SBP’s decision to gradually increase Minimum Capital Requirement (MCR) of MFBs over the last few years has ensured that these banks are well capitalized. Moreover, the recent wave of acquisitions and entry of new players owned by deep pocket investors has strengthened the balance sheet of the MFBs.
However, the same cannot be said for the non-banks MFIs. Their non-profit structure makes them unable to raise funds from commercial sources making them dependent upon grants and retained earnings. PPAF has placed endowments with a number of mid and small tier non-bank MFIs which has strengthened their balance sheet, paving the way for them to access commercial finance. Regulatory framework for non-bank MFIs will lead to setting up of minimum capital requirements and also, enable them to access commercial finance.
MICROFINANCE MARKET SIZE
Microfinance market in Pakistan is estimated to be 27 million. Looking at this number from narrow prism of microcredit does not meet the financial services requirements of the low income segments. They have complex financial
49PAKISTAN MICROFINANCE REVIEWAnnual Assessment of the Microfinance Industry
2012
needs which are just limited to credit only but also need insurance to hedge against unexpected shocks that life may bring; savings to smooth out cash requirements and fast and inexpensive remittances system.
However, the figure of 27 million potential microfinance clients does not break-up the clientage into credit, insurance, savings and remittances client and also does not account for the overlap among them. Keeping this in view, PMN is working on revising and further sub-divide the market size in the country to give a better view microfinance potential in the country.
OPPORTUNITIES
SCALING UP TO FINANCE SMALL ENTERPRISES
According to estimates, there are 3.8 million SMEs in the country. Over 70 percent of them can be categorized as small enterprises, defined as an entity that has twenty employees including contract employees and an annual turnover up to PKR 75 million15. Although clubbed into one large group, in practice the dynamics of medium and small enterprises differ significantly, and small enterprises are considered to have more in common with mature micro enterprises rather than with medium enterprises. Similar to micro enterprises, small firms in Pakistan have serious issues with access to formal finance given their informal nature, lack of documentation and acceptable collateral. Although commercial banks have had some success with downscaling to meet the needs of medium sized firms in Pakistan, small entrepreneurs remain off their radar screen and it seems highly unlikely that the mainstream banks will serve this segment in the near future. However, MFPs, especially the MFBs and large MFIs, seem well positioned to enter this market due to its similarities with the microfinance clientele.
The current enabling environment where SBP has allowed MFBs to initiate micro-enterprise lending and extending the SME Guarantee Fund
15: SME Business Support Fund, Ministry of Finance, Government of Pakistan
to the industry is a favorable opportunity for the industry. It will not only allow the MFPs to cater to a new segment but also provide opportunities for returning clients that have graduated beyond the micro-enterprise level. However, this shall be challenging as MFPs lack expertise in larger enterprise lending. This requires significant up-scaling of loan sizes from the present average loan of PKR 24,000. In addition, the focus of conventional microfinance has been on household repayment capacity which will now have to be moved to the enterprise’s repayment capacity. This will require investment into understanding the demand and needs of this market segment, building a different skill set amongst staff, finding sources of funds to meet the financing needs driven by the relatively larger loan sizes, developing the right products and understanding the risks. As of now, only one MFP has obtained permission from SBP to start enterprise lending and sought a line from the guarantee fund while a few others are exploring the possibilities.
DEVELOPMENTS IN BRANCHLESS BANKING
Pakistan has clearly emerged as a leader in branchless banking on the global stage. Till date, there are five branchless banking players operating in Pakistan, with five more in the pipeline16. These developments have created numerous opportunities for financial service providers in terms of expanding access to formal finance, including microfinance providers. A number of MFIs have linked up with branchless banking platforms to collect repayments from clients initially. It is hope that it will expand into loan disbursement and provision of saving & insurance products. MFIs hope to lower their cost of delivery, better cash management, expand outreach and limit unnecessary person to person interaction.
Microfinance banks that have collaborated with BB platforms are also cashing in on opportunities in the huge G2P payments and domestic remittance market. In 2013, CGAP commissioned a report which discusses the G2P
16: Currently operating players include EasyPaisa, Omni, MobiCash, TimePey and HBL Express. Those currently piloting their platforms include MCB Bank, U Microfinance Bank, Bank Alfalah with Warid Telecom, Meezan Bank and Dubai Islamic Bank.
50
payments sector in Pakistan and demonstrates how social cash transfers can help bring poor people into the formal financial system17. The Benazir Income Support Program (BISP), the largest social cash transfer program in Pakistan is looking at the use of mobile phones as the means of transferring funds to the beneficiaries (which amounted to USD 1.1 billion in 2012). Other organizations such as the Employee Old-Age Benefits Institution, the social pension provider for private sector retirees, began providing the option to cash-out payments using EasyPaisa at four hundred agent locations in 2012. In terms of the domestic remittance market, it is estimated that it amounts to USD 9.3 billion per year, with 11.5 million persons moving funds across the country. Microfinance banks that are partners of telecom companies in offering these solutions have an opportunity to offer full fledged banking services to this vast market. This is an opportunity to mobilize savings, offer insurance and even sell credit through less costly mechanisms to a large number of people that were previously financially excluded, or relied on informal financial systems.
17: An Overview of the G2P Payments Sector in Pakistan, CGAP, Jan 2013
Already we see that the first movers in the sector, UBL Omni18 and EasyPaisa19 have begun to offer a wide array of products. Recently, EasyPaisa has introduced “Khushaal Munafa”, a saving product, and “Khushaal Beema” which is a saving product with insurance dovetailed to it (see Box 1 for similar products from two other countries). As relationships between the Mobile Network Operators (MNOs) and banks develop and mature, it can be expected that this menu will grow to create a win-win for all involved – the telecom company, the bank and the client.
STRENGTHENING OF INDUSTRY INFRASTRUCTURE
The industry infrastructure has received significant support by and been the focus of all stakeholders in the past few years. As a consequence various initiatives have been taken and several are in the pipeline. One of these is the Microfinance Credit Information Bureau (MF-CIB), which will cover all types of MFPs and provide positive data on borrowers. The MF-CIB will create many opportunities for MFPs as it will allow them to use credit histories as complementary collateral to social or physical collateral. It would also allow MFPs to differentiate between good and bad borrowers and offer better rates/more flexibility to the former. Also, MFPs will be able to better judge credit appetite and needs of the borrower, thus developing more appropriate products to meet their needs. The bureau will also provide the space for developing credit scoring models going forward, that will further benefit MFPs.
In addition to the MF-CIB, the sector stakeholders are also working of setting up a risk mitigation fund for the sector. Over the last 10 years, the country has suffered multiple disasters. The northern part of the country was devastated by a massive earthquake in 2005, 2009 saw the internally displaced persons’ crisis in KPK and then mass flooding shook the country in 2010 and 2011. The impact on the microfinance industry can gauged by the fact that the 2010 floods affected 10.2 percent of the sector’s total GLP while 2011 floods in Sindh 18: Of UBL, which also owns KhushhaliBank Limited.19: Of Telenor, which also owns Tameer Microfinance Bank Limited.
BOX
3.1
MICRO-INSURANCE THROUGH BRANCHLESS BANKING
A report published by CGAP “Branchless Banking and Micro-insurance: A Perfect Marriage?” in 2011, identifies some micro-insurance products that utilize branchless banking avenues. For example in Ghana, mobile operator Tigo has partnered with insurance companies to offer insurance to their customers based on their usage of airtime. The amount of cover that the customer is entitled to has a minimum and maximum range based on the value of airtime that was purchased during the previous calendar month.
Similarly another example is from the Philippines where a telecommunication company, Globe, provides hospitalization insurance to clients who receive international remittance in their Globe account. The recipient of an international remittance transfer is automatically entitled to cash assistance for each day of hospitalization, up to a maximum of ten days, should he/she require medical treatment within the 30 days after receiving the remittance.
Source: Branchless Banking and Micro-insurance: A Perfect Marriage? Chris Bold, CGAP
51PAKISTAN MICROFINANCE REVIEWAnnual Assessment of the Microfinance Industry
2012
BOX
3.2
Is Microfinance a tool for Poverty Alleviation or Financial Inclusion?
Some say that microfinance is going through an identity crisis. For a long time, it was seen as the silver bullet to alleviate poverty globally - and pay for itself along the way. However, the debate about what microfinance can do and what it cannot has evolved around the globe and there is a better understanding of how it helps the poor.
For one, it has become clear that sustainable microfinance, or to be more specific – microcredit, is not meant for the poorest of the poor. It is more relevant for the economically active poor and the low income that live close to the poverty line (above and below). Treating microfinance as a social safety net is inappropriate and creates expectations that it cannot deliver. For another, microfinance does help alleviate poverty but the transmission mechanisms are quite different from those that were initially hypothesized. It plays a critical role in create access to finance, which is considered a key bottleneck when it comes to raising standards of living at the base of the pyramid. Microfinance is a key component of national strategies for expanding financial inclusion. By bringing more people into the financial sector, providing them products to smooth consumption, manage risks, and increase incomes, microfinance contributes to economic development at the BOP. Simply put, poverty alleviation is the end objective and financial inclusion is one of the vehicles to achieve it. Thus microfinance can by no means be the sole weapon, or even perhaps the main weapon, in this war against poverty.
The challenge of poverty is huge in Pakistan: estimates of those living below the poverty line range from 23.9 percent to 37.5 percent of the population. It is clear that the policymakers require a rich and diverse repertoire of tools and strategies if a significant dent is to be made in the medium term. Given that all the ‘poor’ are not the same, the tools will have to be different to target different groups. For the poorest of the poor, approaches like the targeted cash transfer programs such as BISP may be needed with microfinance catering to the less poor and low income.
affected nearly 63.9 percent of the province’s portfolio. These shocks not only have adverse effects on the sector but also wipe out the social gains made by their clients. While institutions themselves need to strengthen their ability to absorb shocks, a sector level buffer is also needed. Under the SBP’s leadership a committee has been formed to explore possible options in this context. Establishment of such a fund would enhance MFPs confidence to grow and continue lending in vulnerable sectors (such as agriculture) and vulnerable districts.
Another major development in the pipeline is the spin-off of PPAF’s microfinance operations. The new entity should offer specialized funding products customized according to the size, requirements, clientele and geographic spread of the MFP. Moreover, it can provide international funds to channelize their funds to MFPs enabling them to have a foothold in the Pakistani Microfinance Market.
52

53PAKISTAN MICROFINANCE REVIEWAnnual Assessment of the Microfinance Industry
2012

“Efficient financial systems are vital for the prosperity of a community and a nation as whole. To ensure that poor people are included in the benefits of development, it is necessary that these vast numbers have consistent access to financial services, access that can translate into a key element of economic growth and poverty alleviation: options.” José Antonio Ocampo
ANNEXURES

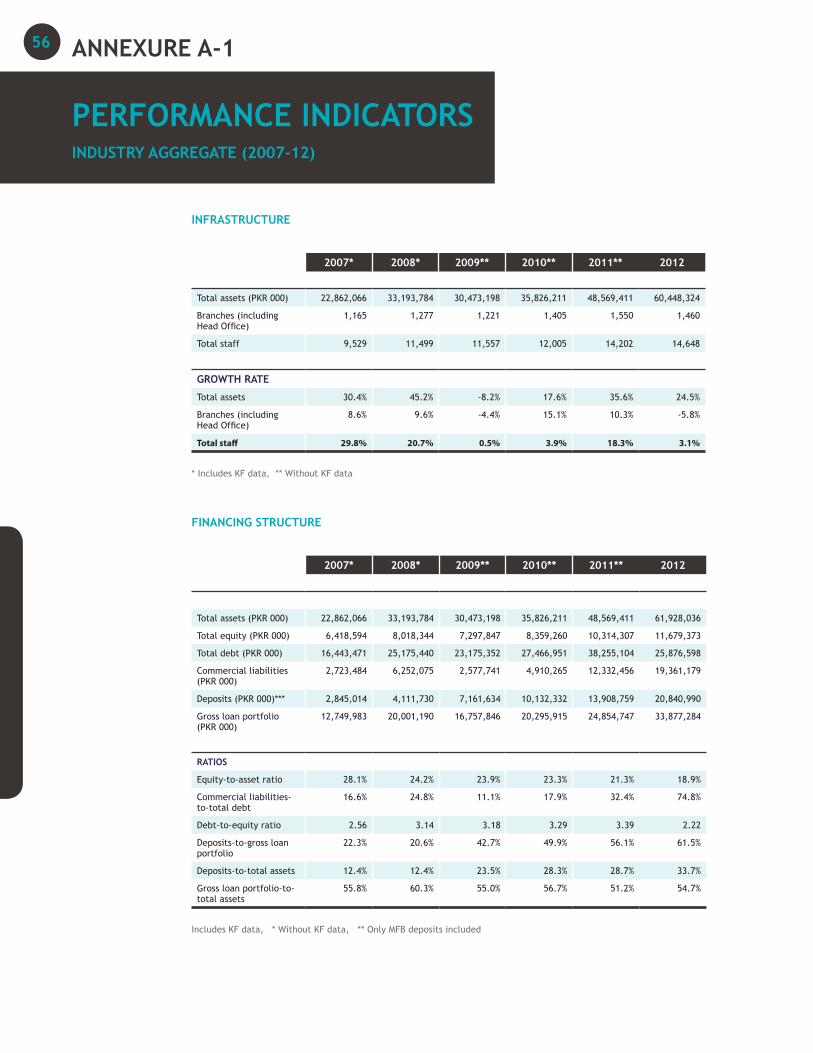
INFRASTRUCTURE
2007* 2008* 2009** 2010** 2011** 2012
Total assets (PKR 000) 22,862,066 33,193,784 30,473,198 35,826,211 48,569,411 60,448,324
Branches (including Head Office)
1,165 1,277 1,221 1,405 1,550 1,460
Total staff 9,529 11,499 11,557 12,005 14,202 14,648
GROWTH RATE
Total assets 30.4% 45.2% -8.2% 17.6% 35.6% 24.5%
Branches (including Head Office)
8.6% 9.6% -4.4% 15.1% 10.3% -5.8%
Total staff 29.8% 20.7% 0.5% 3.9% 18.3% 3.1%
* Includes KF data, ** Without KF data
FINANCING STRUCTURE
2007* 2008* 2009** 2010** 2011** 2012
Total assets (PKR 000) 22,862,066 33,193,784 30,473,198 35,826,211 48,569,411 61,928,036
Total equity (PKR 000) 6,418,594 8,018,344 7,297,847 8,359,260 10,314,307 11,679,373
Total debt (PKR 000) 16,443,471 25,175,440 23,175,352 27,466,951 38,255,104 25,876,598
Commercial liabilities (PKR 000)
2,723,484 6,252,075 2,577,741 4,910,265 12,332,456 19,361,179
Deposits (PKR 000)*** 2,845,014 4,111,730 7,161,634 10,132,332 13,908,759 20,840,990
Gross loan portfolio (PKR 000)
12,749,983 20,001,190 16,757,846 20,295,915 24,854,747 33,877,284
RATIOS
Equity-to-asset ratio 28.1% 24.2% 23.9% 23.3% 21.3% 18.9%
Commercial liabilities-to-total debt
16.6% 24.8% 11.1% 17.9% 32.4% 74.8%
Debt-to-equity ratio 2.56 3.14 3.18 3.29 3.39 2.22
Deposits-to-gross loan portfolio
22.3% 20.6% 42.7% 49.9% 56.1% 61.5%
Deposits-to-total assets 12.4% 12.4% 23.5% 28.3% 28.7% 33.7%
Gross loan portfolio-to-total assets
55.8% 60.3% 55.0% 56.7% 51.2% 54.7%
Includes KF data, * Without KF data, ** Only MFB deposits included
ANNEXURE A-1
PERFORMANCE INDICATORSINDUSTRY AGGREGATE (2007-12)
56
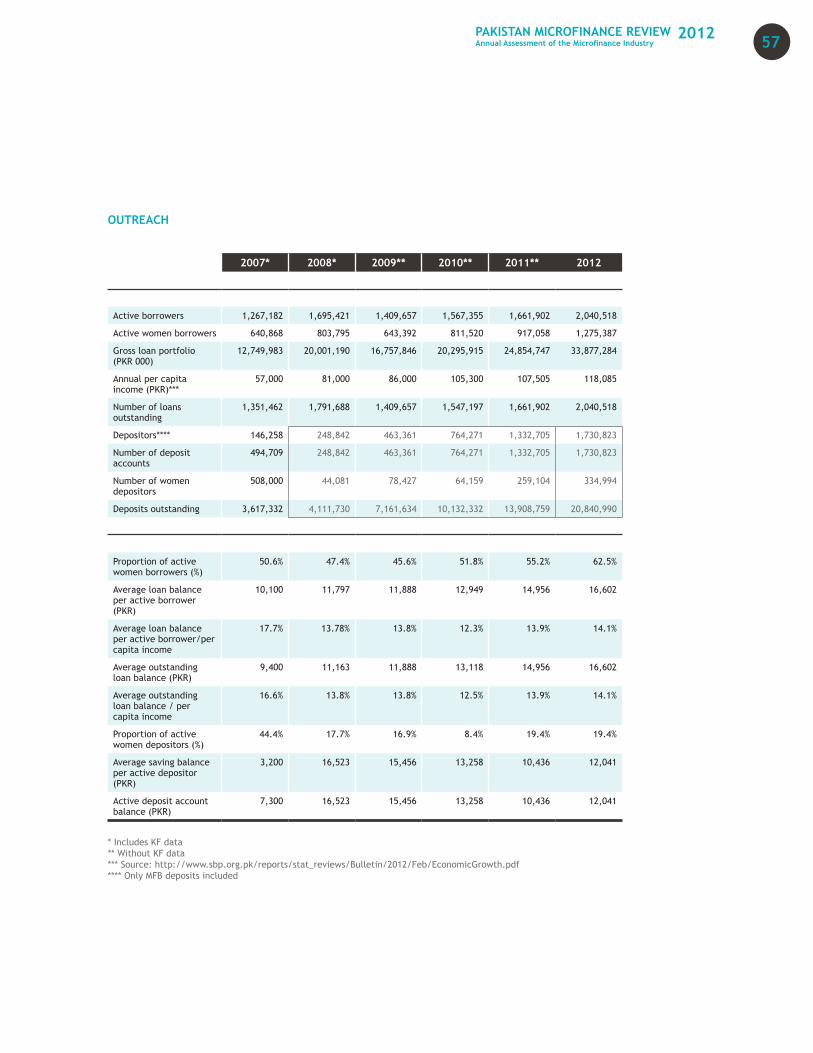
OUTREACH
2007* 2008* 2009** 2010** 2011** 2012
Active borrowers 1,267,182 1,695,421 1,409,657 1,567,355 1,661,902 2,040,518
Active women borrowers 640,868 803,795 643,392 811,520 917,058 1,275,387
Gross loan portfolio (PKR 000)
12,749,983 20,001,190 16,757,846 20,295,915 24,854,747 33,877,284
Annual per capita income (PKR)***
57,000 81,000 86,000 105,300 107,505 118,085
Number of loans outstanding
1,351,462 1,791,688 1,409,657 1,547,197 1,661,902 2,040,518
Depositors**** 146,258 248,842 463,361 764,271 1,332,705 1,730,823
Number of deposit accounts
494,709 248,842 463,361 764,271 1,332,705 1,730,823
Number of women depositors
508,000 44,081 78,427 64,159 259,104 334,994
Deposits outstanding 3,617,332 4,111,730 7,161,634 10,132,332 13,908,759 20,840,990
Proportion of active women borrowers (%)
50.6% 47.4% 45.6% 51.8% 55.2% 62.5%
Average loan balance per active borrower (PKR)
10,100 11,797 11,888 12,949 14,956 16,602
Average loan balance per active borrower/per capita income
17.7% 13.78% 13.8% 12.3% 13.9% 14.1%
Average outstanding loan balance (PKR)
9,400 11,163 11,888 13,118 14,956 16,602
Average outstanding loan balance / per capita income
16.6% 13.8% 13.8% 12.5% 13.9% 14.1%
Proportion of active women depositors (%)
44.4% 17.7% 16.9% 8.4% 19.4% 19.4%
Average saving balance per active depositor (PKR)
3,200 16,523 15,456 13,258 10,436 12,041
Active deposit account balance (PKR)
7,300 16,523 15,456 13,258 10,436 12,041
* Includes KF data ** Without KF data *** Source: http://www.sbp.org.pk/reports/stat_reviews/Bulletin/2012/Feb/EconomicGrowth.pdf **** Only MFB deposits included
57PAKISTAN MICROFINANCE REVIEWAnnual Assessment of the Microfinance Industry
2012
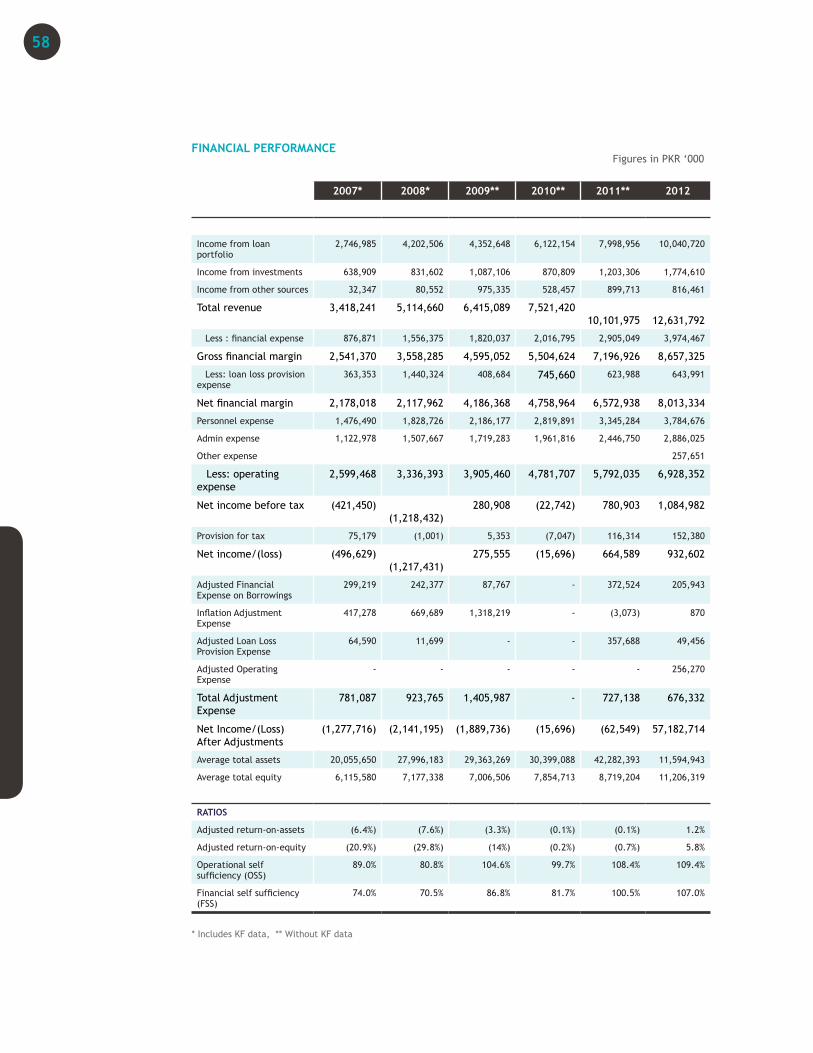
FINANCIAL PERFORMANCE
2007* 2008* 2009** 2010** 2011** 2012
Income from loan portfolio
2,746,985 4,202,506 4,352,648 6,122,154 7,998,956 10,040,720
Income from investments 638,909 831,602 1,087,106 870,809 1,203,306 1,774,610
Income from other sources 32,347 80,552 975,335 528,457 899,713 816,461
Total revenue 3,418,241 5,114,660 6,415,089 7,521,420 10,101,975
12,631,792
Less : financial expense 876,871 1,556,375 1,820,037 2,016,795 2,905,049 3,974,467
Gross financial margin 2,541,370 3,558,285 4,595,052 5,504,624 7,196,926 8,657,325
Less: loan loss provision expense
363,353 1,440,324 408,684 745,660 623,988 643,991
Net financial margin 2,178,018 2,117,962 4,186,368 4,758,964 6,572,938 8,013,334
Personnel expense 1,476,490 1,828,726 2,186,177 2,819,891 3,345,284 3,784,676
Admin expense 1,122,978 1,507,667 1,719,283 1,961,816 2,446,750 2,886,025
Other expense 257,651
Less: operating expense
2,599,468 3,336,393 3,905,460 4,781,707 5,792,035 6,928,352
Net income before tax (421,450) (1,218,432)
280,908 (22,742) 780,903 1,084,982
Provision for tax 75,179 (1,001) 5,353 (7,047) 116,314 152,380
Net income/(loss) (496,629) (1,217,431)
275,555 (15,696) 664,589 932,602
Adjusted Financial Expense on Borrowings
299,219 242,377 87,767 - 372,524 205,943
Inflation Adjustment Expense
417,278 669,689 1,318,219 - (3,073) 870
Adjusted Loan Loss Provision Expense
64,590 11,699 - - 357,688 49,456
Adjusted Operating Expense
- - - - - 256,270
Total Adjustment Expense
781,087 923,765 1,405,987 - 727,138 676,332
Net Income/(Loss) After Adjustments
(1,277,716) (2,141,195) (1,889,736) (15,696) (62,549) 57,182,714
Average total assets 20,055,650 27,996,183 29,363,269 30,399,088 42,282,393 11,594,943
Average total equity 6,115,580 7,177,338 7,006,506 7,854,713 8,719,204 11,206,319
RATIOS
Adjusted return-on-assets (6.4%) (7.6%) (3.3%) (0.1%) (0.1%) 1.2%
Adjusted return-on-equity (20.9%) (29.8%) (14%) (0.2%) (0.7%) 5.8%
Operational self sufficiency (OSS)
89.0% 80.8% 104.6% 99.7% 108.4% 109.4%
Financial self sufficiency (FSS)
74.0% 70.5% 86.8% 81.7% 100.5% 107.0%
* Includes KF data, ** Without KF data
Figures in PKR ‘000
58

OPERATING INCOME
2007* 2008* 2009** 2010** 2011** 2012
Revenue from loan portfolio
2,746,985 4,202,506 4,352,648 6,122,154 7,998,956 10,040,720
Total revenue 3,418,241 5,114,660 5,804,616 7,521,420 10,101,975 12,631,792
Adjusted net operating income / (loss)
(1,202,537) (2,113,788) (887,558) (22,742) 5,252 828,712
Average total assets 20,055,650 27,996,183 29,363,269 30,399,088 42,282,393 57,182,714
Gross loan portfolio (opening balance)
8,283,941 12,698,918 16,780,162 16,948,466 20,576,342 25,743,757
Gross loan portfolio (closing balance)
12,749,983 20,001,190 16,757,846 20,295,915 24,854,747 33,877,284
Average gross loan portfolio
10,516,962 16,350,054 16,769,004 18,622,190 22,715,544 29,810,520
Inflation rate *** 7.9% 12.0% 20.8% 15.0% 11.2% 10.4%
Total revenue ratio (total revenue-to-average total assets)
17.0% 18.3% 19.8% 24.7% 23.9% 22.3%
Adjusted profit margin (adjusted profit/(loss)-to-total revenue)
(32.5%) (41.3%) (24.6%) (0.3%) 0.1% 7.0%
Yield on gross portfolio (nominal)
26.1% 25.7% 26.0% 32.9% 35.2% 34.2%
Yield on gross portfolio (real)
16.9% 12.2% 4.3% 15.5% 21.6% 21.6%
* Includes KF data
** Without KF data
*** Source: http://www.sbp.org.pk/reports/stat_reviews/Bulletin/2012/Feb/IND.pdf
Figures in PKR ‘000
59PAKISTAN MICROFINANCE REVIEWAnnual Assessment of the Microfinance Industry
2012
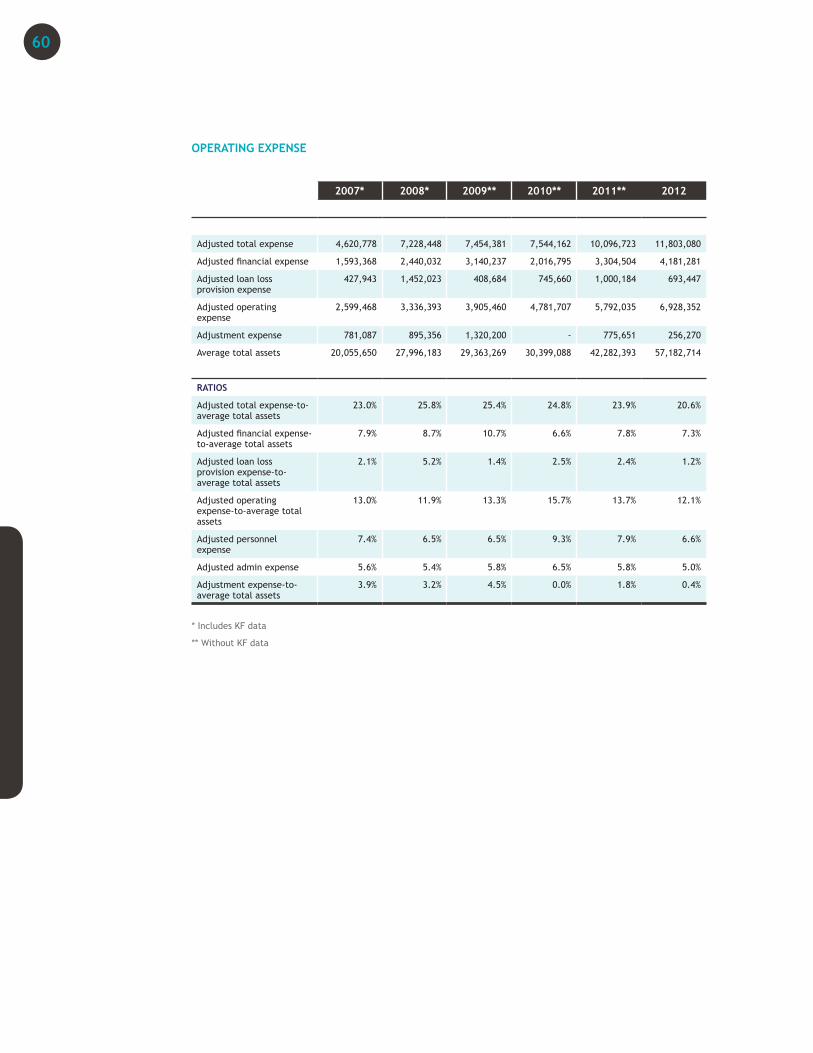
OPERATING EXPENSE
2007* 2008* 2009** 2010** 2011** 2012
Adjusted total expense 4,620,778 7,228,448 7,454,381 7,544,162 10,096,723 11,803,080
Adjusted financial expense 1,593,368 2,440,032 3,140,237 2,016,795 3,304,504 4,181,281
Adjusted loan loss provision expense
427,943 1,452,023 408,684 745,660 1,000,184 693,447
Adjusted operating expense
2,599,468 3,336,393 3,905,460 4,781,707 5,792,035 6,928,352
Adjustment expense 781,087 895,356 1,320,200 - 775,651 256,270
Average total assets 20,055,650 27,996,183 29,363,269 30,399,088 42,282,393 57,182,714
RATIOS
Adjusted total expense-to-average total assets
23.0% 25.8% 25.4% 24.8% 23.9% 20.6%
Adjusted financial expense-to-average total assets
7.9% 8.7% 10.7% 6.6% 7.8% 7.3%
Adjusted loan loss provision expense-to-average total assets
2.1% 5.2% 1.4% 2.5% 2.4% 1.2%
Adjusted operating expense-to-average total assets
13.0% 11.9% 13.3% 15.7% 13.7% 12.1%
Adjusted personnel expense
7.4% 6.5% 6.5% 9.3% 7.9% 6.6%
Adjusted admin expense 5.6% 5.4% 5.8% 6.5% 5.8% 5.0%
Adjustment expense-to-average total assets
3.9% 3.2% 4.5% 0.0% 1.8% 0.4%
* Includes KF data
** Without KF data
60
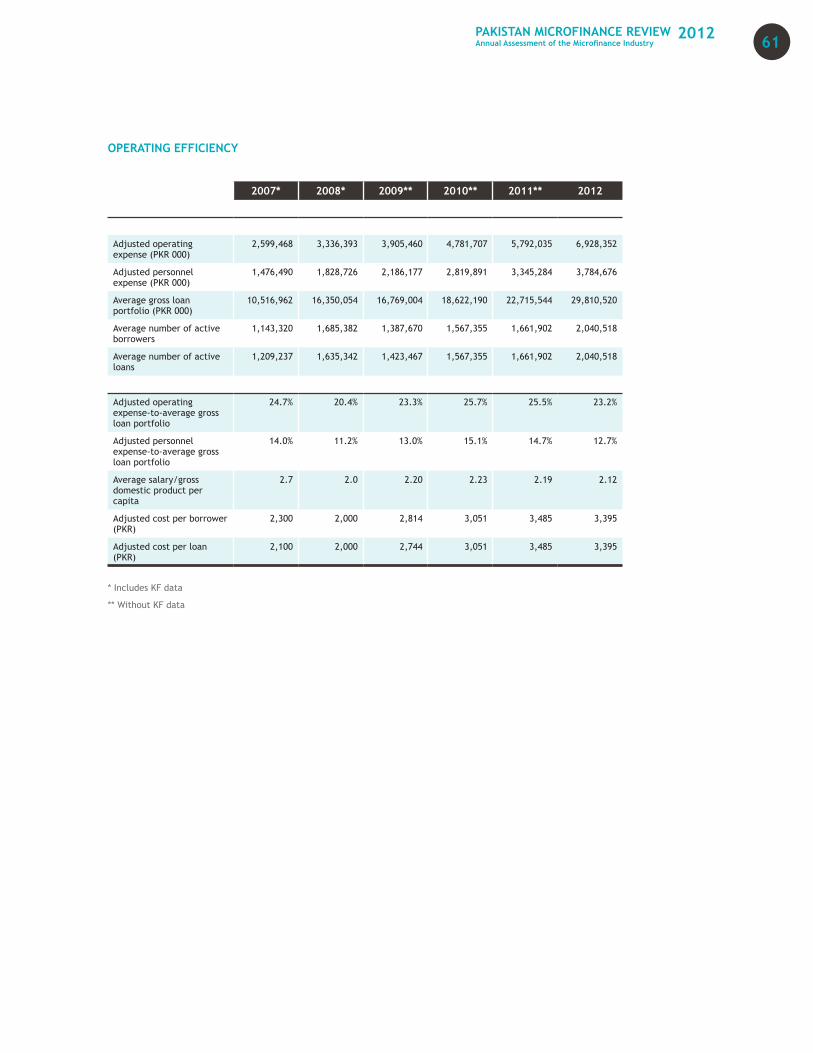
OPERATING EFFICIENCY
2007* 2008* 2009** 2010** 2011** 2012
Adjusted operating expense (PKR 000)
2,599,468 3,336,393 3,905,460 4,781,707 5,792,035 6,928,352
Adjusted personnel expense (PKR 000)
1,476,490 1,828,726 2,186,177 2,819,891 3,345,284 3,784,676
Average gross loan portfolio (PKR 000)
10,516,962 16,350,054 16,769,004 18,622,190 22,715,544 29,810,520
Average number of active borrowers
1,143,320 1,685,382 1,387,670 1,567,355 1,661,902 2,040,518
Average number of active loans
1,209,237 1,635,342 1,423,467 1,567,355 1,661,902 2,040,518
Adjusted operating expense-to-average gross loan portfolio
24.7% 20.4% 23.3% 25.7% 25.5% 23.2%
Adjusted personnel expense-to-average gross loan portfolio
14.0% 11.2% 13.0% 15.1% 14.7% 12.7%
Average salary/gross domestic product per capita
2.7 2.0 2.20 2.23 2.19 2.12
Adjusted cost per borrower (PKR)
2,300 2,000 2,814 3,051 3,485 3,395
Adjusted cost per loan (PKR)
2,100 2,000 2,744 3,051 3,485 3,395
* Includes KF data
** Without KF data
61PAKISTAN MICROFINANCE REVIEWAnnual Assessment of the Microfinance Industry
2012
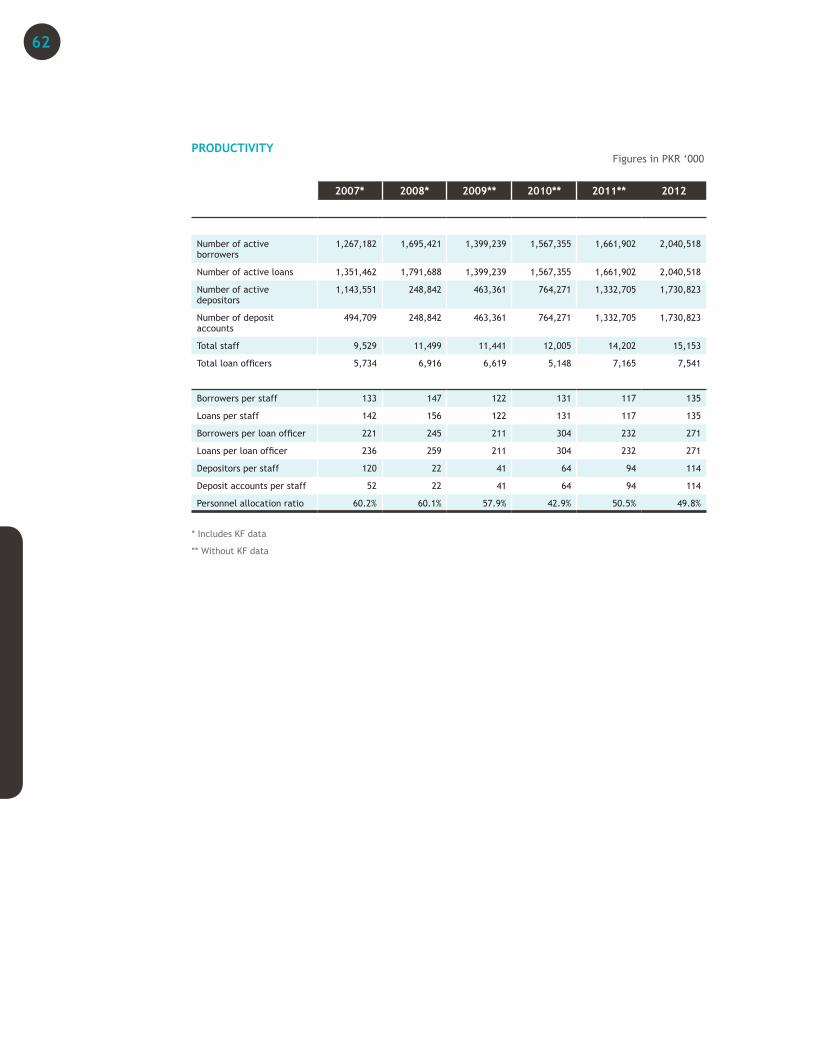
Figures in PKR ‘000PRODUCTIVITY
2007* 2008* 2009** 2010** 2011** 2012
Number of active borrowers
1,267,182 1,695,421 1,399,239 1,567,355 1,661,902 2,040,518
Number of active loans 1,351,462 1,791,688 1,399,239 1,567,355 1,661,902 2,040,518
Number of active depositors
1,143,551 248,842 463,361 764,271 1,332,705 1,730,823
Number of deposit accounts
494,709 248,842 463,361 764,271 1,332,705 1,730,823
Total staff 9,529 11,499 11,441 12,005 14,202 15,153
Total loan officers 5,734 6,916 6,619 5,148 7,165 7,541
Borrowers per staff 133 147 122 131 117 135
Loans per staff 142 156 122 131 117 135
Borrowers per loan officer 221 245 211 304 232 271
Loans per loan officer 236 259 211 304 232 271
Depositors per staff 120 22 41 64 94 114
Deposit accounts per staff 52 22 41 64 94 114
Personnel allocation ratio 60.2% 60.1% 57.9% 42.9% 50.5% 49.8%
* Includes KF data
** Without KF data
62
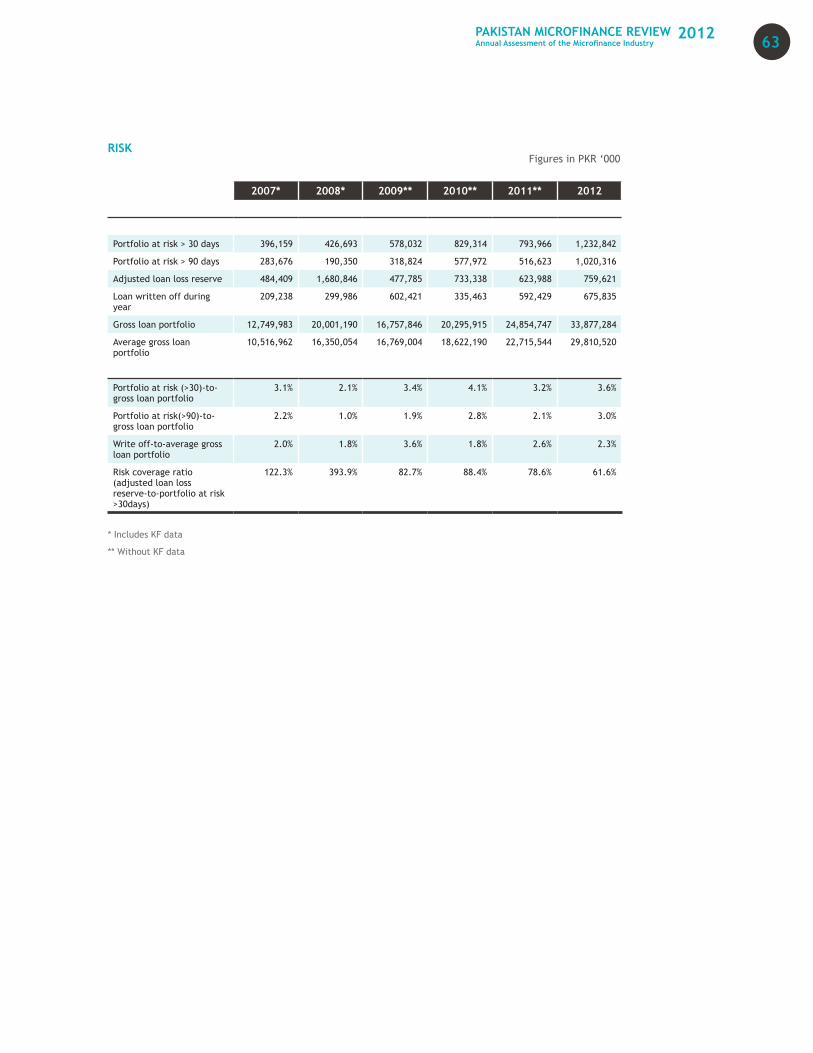
RISK
2007* 2008* 2009** 2010** 2011** 2012
Portfolio at risk > 30 days 396,159 426,693 578,032 829,314 793,966 1,232,842
Portfolio at risk > 90 days 283,676 190,350 318,824 577,972 516,623 1,020,316
Adjusted loan loss reserve 484,409 1,680,846 477,785 733,338 623,988 759,621
Loan written off during year
209,238 299,986 602,421 335,463 592,429 675,835
Gross loan portfolio 12,749,983 20,001,190 16,757,846 20,295,915 24,854,747 33,877,284
Average gross loan portfolio
10,516,962 16,350,054 16,769,004 18,622,190 22,715,544 29,810,520
Portfolio at risk (>30)-to-gross loan portfolio
3.1% 2.1% 3.4% 4.1% 3.2% 3.6%
Portfolio at risk(>90)-to-gross loan portfolio
2.2% 1.0% 1.9% 2.8% 2.1% 3.0%
Write off-to-average gross loan portfolio
2.0% 1.8% 3.6% 1.8% 2.6% 2.3%
Risk coverage ratio (adjusted loan loss reserve-to-portfolio at risk >30days)
122.3% 393.9% 82.7% 88.4% 78.6% 61.6%
* Includes KF data
** Without KF data
Figures in PKR ‘000
63PAKISTAN MICROFINANCE REVIEWAnnual Assessment of the Microfinance Industry
2012
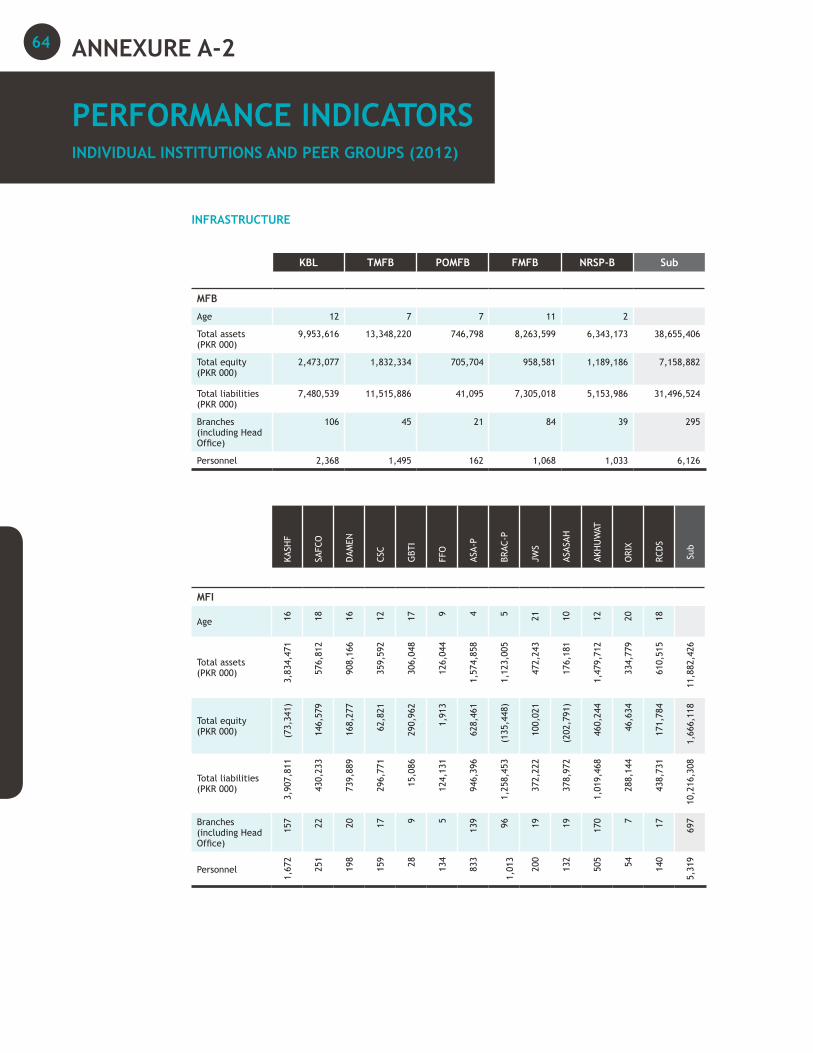
INFRASTRUCTURE
KBL TMFB POMFB FMFB NRSP-B Sub
MFB
Age 12 7 7 11 2
Total assets (PKR 000)
9,953,616 13,348,220 746,798 8,263,599 6,343,173 38,655,406
Total equity (PKR 000)
2,473,077 1,832,334 705,704 958,581 1,189,186 7,158,882
Total liabilities (PKR 000)
7,480,539 11,515,886 41,095 7,305,018 5,153,986 31,496,524
Branches (including Head Office)
106 45 21 84 39 295
Personnel 2,368 1,495 162 1,068 1,033 6,126
KASH
F
SAFC
O
DAM
EN
CSC
GBT
I
FFO
ASA-
P
BRAC
-P
JWS
ASAS
AH
AKH
UW
AT
ORI
X
RCD
S
Sub
MFI
Age 16
18
16
12
17 9
4 5 21
10
12
20
18
Total assets (PKR 000)
3,83
4,47
1
576
,812
908
,166
359
,592
306
,048
126
,044
1,57
4,85
8
1,12
3,00
5
472,
243
176
,181
1,4
79,7
12
334
,779
610
,515
11,
882,
426
Total equity (PKR 000) (7
3,34
1)
146
,579
168
,277
62,
821
290
,962
1,9
13
628,
461
(135
,448
)
100,
021
(20
2,79
1)
460
,244
46,
634
171
,784
1,6
66,1
18
Total liabilities (PKR 000)
3,90
7,81
1
430
,233
739
,889
296
,771
15,
086
124
,131
946,
396
1,25
8,45
3
372,
222
378
,972
1,0
19,4
68
288
,144
438
,731
10,
216,
308
Branches (including Head Office)
157
22
20
17 9
5
139 96
19
19
170
7
17
697
Personnel
1,67
2
251
198
159
28
134
833
1,01
3
200
132
505
54
140
5,31
9
ANNEXURE A-2
PERFORMANCE INDICATORSINDIVIDUAL INSTITUTIONS AND PEER GROUPS (2012)
64

INFRASTRUCTURE
NRSP PRSP SRSP TRDP SRSO Sub
RSP
Age 19 14 21 15 9
Total assets (PKR 000)
7,143,452 2,356,368 36,517 696,129 1,157,738 11,390,204
Total equity (PKR 000)
1,447,368 1,018,152 26,421 173,957 188,475 2,854,373
Total liabilities (PKR 000)
5,696,084 1,338,216 10,096 522,172 969,263 8,535,831
Branches (including Head Office)
455 60 11 60 52 638
Personnel 2,145 914 28 300 321 3,708
MFB Sub MFI Sub RSP Sub Total
Age
Total assets (PKR 000)
38,655,406 11,882,426 11,390,204 61,928,036
Total equity (PKR 000)
7,158,882 1,666,118 2,854,373 11,679,373
Total liabilities (PKR 000)
31,496,524 10,216,308 8,535,831 50,248,663
Branches (including Head Office)
295 697 638 1,630
Personnel 6,126 5,319 3,708 15,153
65PAKISTAN MICROFINANCE REVIEWAnnual Assessment of the Microfinance Industry
2012
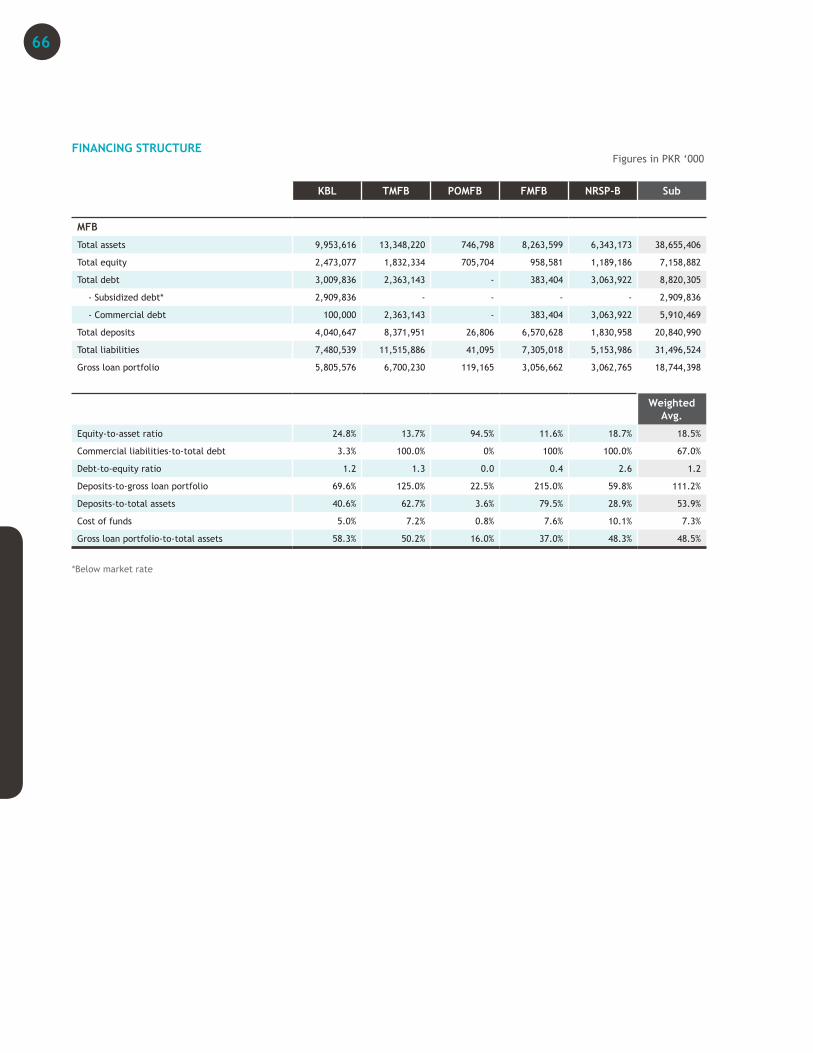
FINANCING STRUCTURE
KBL TMFB POMFB FMFB NRSP-B Sub
MFB
Total assets 9,953,616 13,348,220 746,798 8,263,599 6,343,173 38,655,406
Total equity 2,473,077 1,832,334 705,704 958,581 1,189,186 7,158,882
Total debt 3,009,836 2,363,143 - 383,404 3,063,922 8,820,305
- Subsidized debt* 2,909,836 - - - - 2,909,836
- Commercial debt 100,000 2,363,143 - 383,404 3,063,922 5,910,469
Total deposits 4,040,647 8,371,951 26,806 6,570,628 1,830,958 20,840,990
Total liabilities 7,480,539 11,515,886 41,095 7,305,018 5,153,986 31,496,524
Gross loan portfolio 5,805,576 6,700,230 119,165 3,056,662 3,062,765 18,744,398
Weighted Avg.
Equity-to-asset ratio 24.8% 13.7% 94.5% 11.6% 18.7% 18.5%
Commercial liabilities-to-total debt 3.3% 100.0% 0% 100% 100.0% 67.0%
Debt-to-equity ratio 1.2 1.3 0.0 0.4 2.6 1.2
Deposits-to-gross loan portfolio 69.6% 125.0% 22.5% 215.0% 59.8% 111.2%
Deposits-to-total assets 40.6% 62.7% 3.6% 79.5% 28.9% 53.9%
Cost of funds 5.0% 7.2% 0.8% 7.6% 10.1% 7.3%
Gross loan portfolio-to-total assets 58.3% 50.2% 16.0% 37.0% 48.3% 48.5%
*Below market rate
Figures in PKR ‘000
66
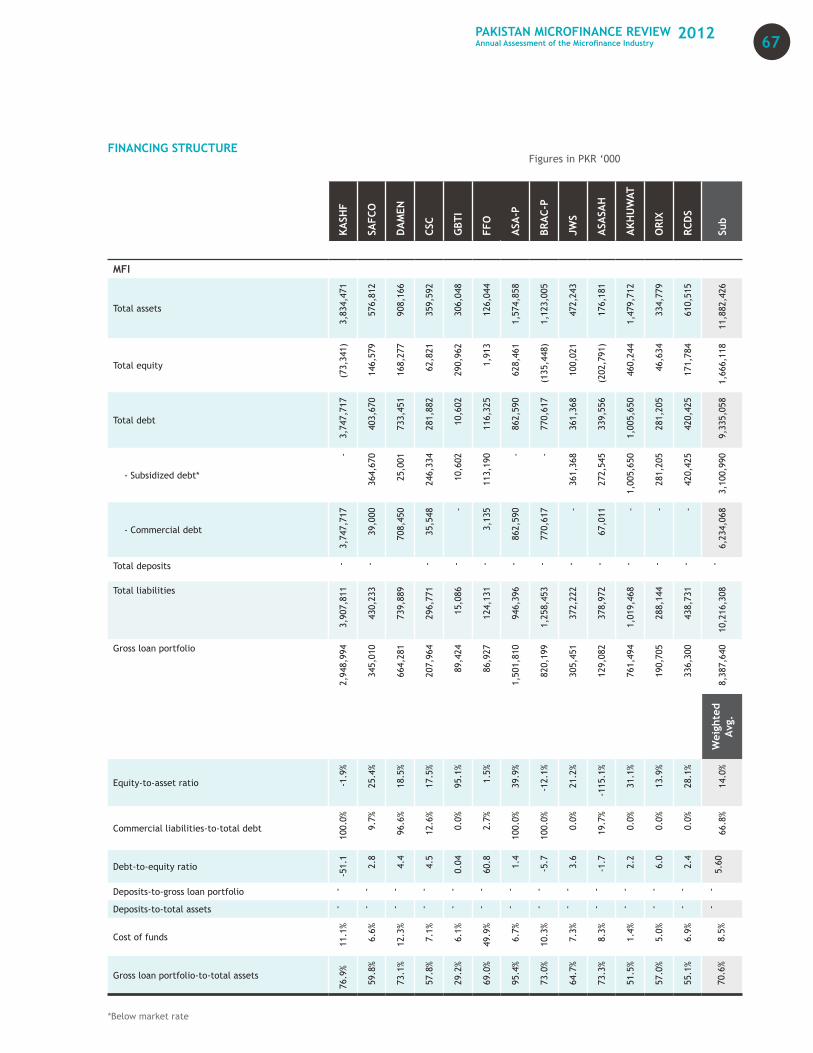
FINANCING STRUCTURE
KASH
F
SAFC
O
DA
MEN
CSC
GBT
I
FFO
ASA
-P
BRA
C-P
JWS
ASA
SAH
AKH
UW
AT
ORI
X
RCD
S
Sub
MFI
Total assets
3,83
4,47
1
576
,812
908
,166
359
,592
306
,048
126
,044
1,5
74,8
58
1,1
23,0
05
472
,243
176
,181
1,4
79,7
12
334
,779
610
,515
11,
882,
426
Total equity
(73,
341)
146
,579
168
,277
62,
821
290
,962
1,9
13
628
,461
(13
5,44
8)
100
,021
(20
2,79
1)
460
,244
46,
634
171
,784
1,6
66,1
18
Total debt
3,74
7,71
7
403
,670
733
,451
281
,882
10,
602
116
,325
862
,590
770
,617
361
,368
339
,556
1,0
05,6
50
281
,205
420
,425
9,3
35,0
58
- Subsidized debt*
-
364
,670
25,
001
246
,334
10,
602
113
,190
-
-
361
,368
272
,545
1,0
05,6
50
281
,205
420
,425
3,1
00,9
90
- Commercial debt
3,74
7,71
7
39,
000
708
,450
35,
548 -
3,1
35
862
,590
770
,617
-
67,
011 -
-
-
6,2
34,0
68
Total deposits -
-
-
-
-
-
-
-
-
-
-
-
-
Total liabilities
3,90
7,81
1
430
,233
739
,889
296
,771
15,
086
124
,131
946
,396
1,25
8,45
3
372
,222
378
,972
1,0
19,4
68
288
,144
438
,731
10,2
16,3
08
Gross loan portfolio
2,94
8,99
4
345
,010
664
,281
207
,964
89,
424
86,
927
1,50
1,81
0
820
,199
305
,451
129
,082
761
,494
190
,705
336
,300
8,3
87,6
40
Wei
ghte
d Av
g.
Equity-to-asset ratio -1.9
%
25.4
%
18.5
%
17.5
%
95.1
%
1.5%
39.9
%
-12.
1%
21.2
%
-115
.1%
31.1
%
13.9
%
28.1
%
14.0
%
Commercial liabilities-to-total debt
100.
0%
9.7%
96.6
%
12.6
%
0.0%
2.7%
100.
0%
100.
0%
0.0%
19.7
%
0.0%
0.0%
0.0%
66.8
%
Debt-to-equity ratio
-51.
1
2.8
4.4
4.5
0.04
60.8 1.4
-5.7 3.6
-1.7 2.2
6.0
2.4
5.60
Deposits-to-gross loan portfolio -
-
-
-
-
-
-
-
-
-
-
-
-
-
Deposits-to-total assets -
-
-
-
-
-
-
-
-
-
-
-
-
-
Cost of funds
11.1
%
6.6%
12.3
%
7.1%
6.1%
49.9
%
6.7%
10.3
%
7.3%
8.3%
1.4%
5.0%
6.9%
8.5%
Gross loan portfolio-to-total assets
76.9
%
59.8
%
73.1
%
57.8
%
29.2
%
69.0
%
95.4
%
73.0
%
64.7
%
73.3
%
51.5
%
57.0
%
55.1
%
70.6
%
*Below market rate
Figures in PKR ‘000
67PAKISTAN MICROFINANCE REVIEWAnnual Assessment of the Microfinance Industry
2012
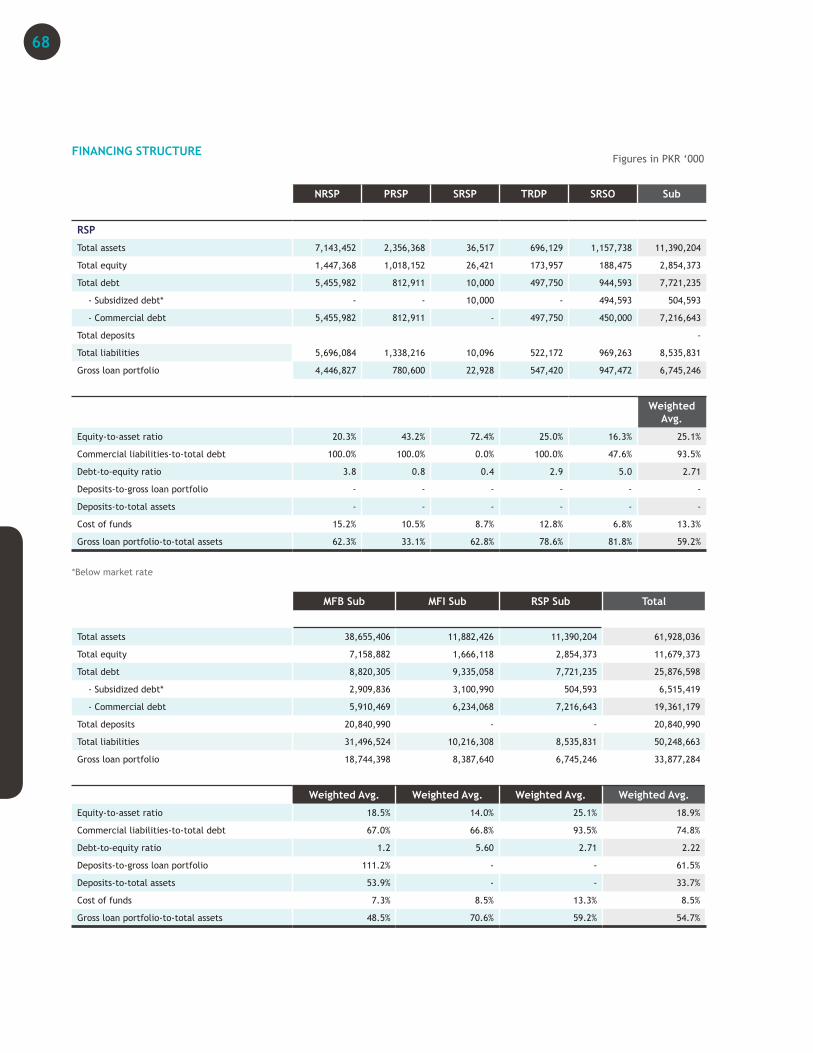
FINANCING STRUCTURE
NRSP PRSP SRSP TRDP SRSO Sub
RSP
Total assets 7,143,452 2,356,368 36,517 696,129 1,157,738 11,390,204
Total equity 1,447,368 1,018,152 26,421 173,957 188,475 2,854,373
Total debt 5,455,982 812,911 10,000 497,750 944,593 7,721,235
- Subsidized debt* - - 10,000 - 494,593 504,593
- Commercial debt 5,455,982 812,911 - 497,750 450,000 7,216,643
Total deposits -
Total liabilities 5,696,084 1,338,216 10,096 522,172 969,263 8,535,831
Gross loan portfolio 4,446,827 780,600 22,928 547,420 947,472 6,745,246
Weighted Avg.
Equity-to-asset ratio 20.3% 43.2% 72.4% 25.0% 16.3% 25.1%
Commercial liabilities-to-total debt 100.0% 100.0% 0.0% 100.0% 47.6% 93.5%
Debt-to-equity ratio 3.8 0.8 0.4 2.9 5.0 2.71
Deposits-to-gross loan portfolio - - - - - -
Deposits-to-total assets - - - - - -
Cost of funds 15.2% 10.5% 8.7% 12.8% 6.8% 13.3%
Gross loan portfolio-to-total assets 62.3% 33.1% 62.8% 78.6% 81.8% 59.2%
*Below market rate
MFB Sub MFI Sub RSP Sub Total
Total assets 38,655,406 11,882,426 11,390,204 61,928,036
Total equity 7,158,882 1,666,118 2,854,373 11,679,373
Total debt 8,820,305 9,335,058 7,721,235 25,876,598
- Subsidized debt* 2,909,836 3,100,990 504,593 6,515,419
- Commercial debt 5,910,469 6,234,068 7,216,643 19,361,179
Total deposits 20,840,990 - - 20,840,990
Total liabilities 31,496,524 10,216,308 8,535,831 50,248,663
Gross loan portfolio 18,744,398 8,387,640 6,745,246 33,877,284
Weighted Avg. Weighted Avg. Weighted Avg. Weighted Avg.
Equity-to-asset ratio 18.5% 14.0% 25.1% 18.9%
Commercial liabilities-to-total debt 67.0% 66.8% 93.5% 74.8%
Debt-to-equity ratio 1.2 5.60 2.71 2.22
Deposits-to-gross loan portfolio 111.2% - - 61.5%
Deposits-to-total assets 53.9% - - 33.7%
Cost of funds 7.3% 8.5% 13.3% 8.5%
Gross loan portfolio-to-total assets 48.5% 70.6% 59.2% 54.7%
Figures in PKR ‘000
68
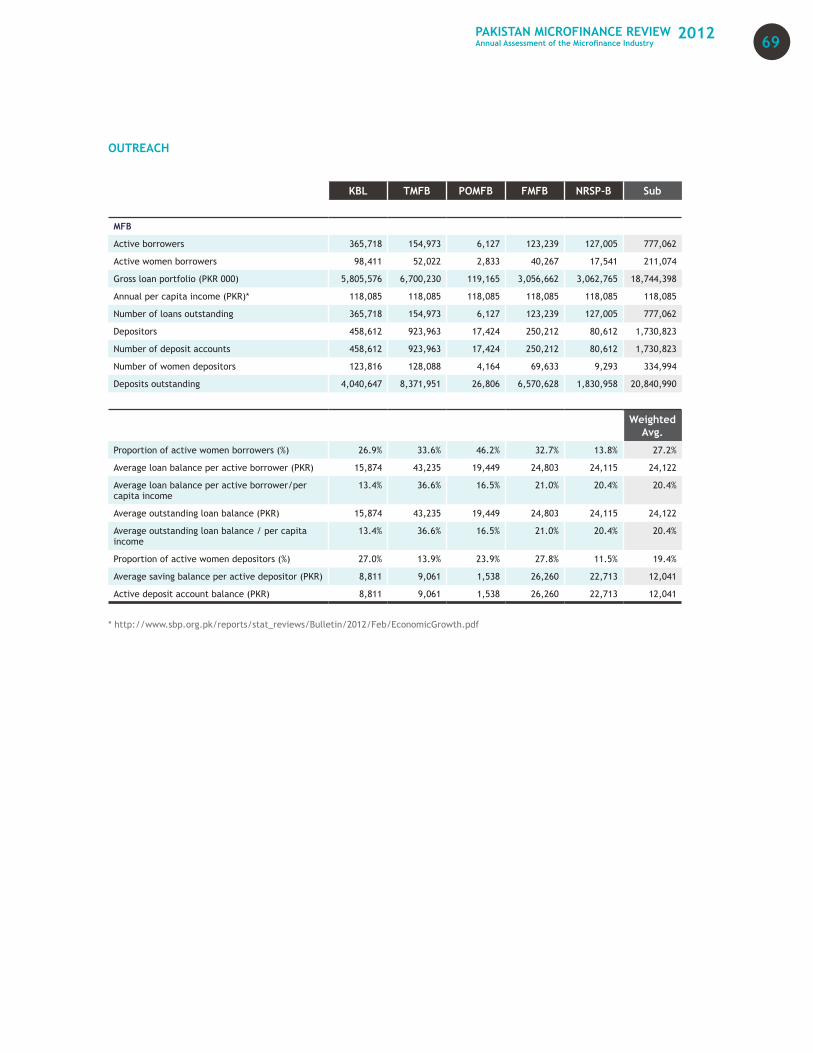
OUTREACH
KBL TMFB POMFB FMFB NRSP-B Sub
MFB
Active borrowers 365,718 154,973 6,127 123,239 127,005 777,062
Active women borrowers 98,411 52,022 2,833 40,267 17,541 211,074
Gross loan portfolio (PKR 000) 5,805,576 6,700,230 119,165 3,056,662 3,062,765 18,744,398
Annual per capita income (PKR)* 118,085 118,085 118,085 118,085 118,085 118,085
Number of loans outstanding 365,718 154,973 6,127 123,239 127,005 777,062
Depositors 458,612 923,963 17,424 250,212 80,612 1,730,823
Number of deposit accounts 458,612 923,963 17,424 250,212 80,612 1,730,823
Number of women depositors 123,816 128,088 4,164 69,633 9,293 334,994
Deposits outstanding 4,040,647 8,371,951 26,806 6,570,628 1,830,958 20,840,990
Weighted Avg.
Proportion of active women borrowers (%) 26.9% 33.6% 46.2% 32.7% 13.8% 27.2%
Average loan balance per active borrower (PKR) 15,874 43,235 19,449 24,803 24,115 24,122
Average loan balance per active borrower/per capita income
13.4% 36.6% 16.5% 21.0% 20.4% 20.4%
Average outstanding loan balance (PKR) 15,874 43,235 19,449 24,803 24,115 24,122
Average outstanding loan balance / per capita income
13.4% 36.6% 16.5% 21.0% 20.4% 20.4%
Proportion of active women depositors (%) 27.0% 13.9% 23.9% 27.8% 11.5% 19.4%
Average saving balance per active depositor (PKR) 8,811 9,061 1,538 26,260 22,713 12,041
Active deposit account balance (PKR) 8,811 9,061 1,538 26,260 22,713 12,041
* http://www.sbp.org.pk/reports/stat_reviews/Bulletin/2012/Feb/EconomicGrowth.pdf
69PAKISTAN MICROFINANCE REVIEWAnnual Assessment of the Microfinance Industry
2012
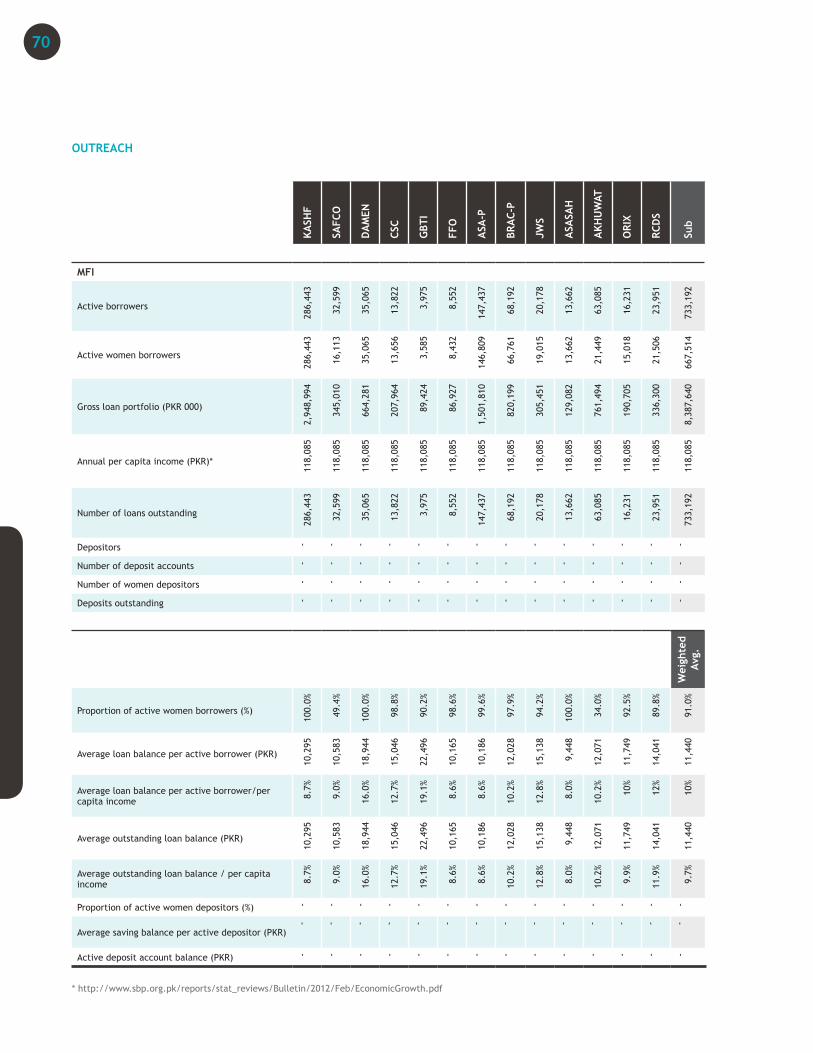
OUTREACH
KASH
F
SAFC
O
DA
MEN
CSC
GBT
I
FFO
ASA
-P
BRA
C-P
JWS
ASA
SAH
AKH
UW
AT
ORI
X
RCD
S
Sub
MFI
Active borrowers 2
86,4
43
32,
599
35,
065
13,
822
3,9
75
8,5
52
147
,437
68,
192
20,
178
13,
662
63,
085
16,
231
23,
951
733
,192
Active women borrowers
286
,443
16,
113
35,
065
13,
656
3,5
85
8,4
32
146
,809
66,
761
19,
015
13,
662
21,
449
15,
018
21,
506
667
,514
Gross loan portfolio (PKR 000)
2,9
48,9
94
345
,010
664
,281
207
,964
89,
424
86,
927
1,5
01,8
10
820
,199
305
,451
129
,082
761
,494
190
,705
336
,300
8,3
87,6
40
Annual per capita income (PKR)*
118
,085
118
,085
118
,085
118
,085
118
,085
118
,085
118
,085
118
,085
118
,085
118
,085
118
,085
118
,085
118
,085
118
,085
Number of loans outstanding
286
,443
32,
599
35,
065
13,
822
3,9
75
8,5
52
147
,437
68,
192
20,
178
13,
662
63,
085
16,
231
23,
951
733
,192
Depositors - - - - - - - - - - - - - -
Number of deposit accounts - - - - - - - - - - - - - -
Number of women depositors - - - - - - - - - - - - - -
Deposits outstanding - - - - - - - - - - - - - -
Wei
ghte
d Av
g.Proportion of active women borrowers (%)
100.
0%
49.4
%
100.
0%
98.8
%
90.2
%
98.6
%
99.6
%
97.9
%
94.2
%
100.
0%
34.0
%
92.5
%
89.8
%
91.0
%
Average loan balance per active borrower (PKR)
10,2
95
10,5
83
18,9
44
15,0
46
22,4
96
10,1
65
10,1
86
12,0
28
15,1
38
9,44
8
12,0
71
11,7
49
14,0
41
11,4
40
Average loan balance per active borrower/per capita income
8.7%
9.0%
16.0
%
12.7
%
19.1
%
8.6%
8.6%
10.2
%
12.8
%
8.0%
10.2
%
10%
12%
10%
Average outstanding loan balance (PKR)
10,2
95
10,5
83
18,9
44
15,0
46
22,4
96
10,1
65
10,1
86
12,0
28
15,1
38
9,44
8
12,0
71
11,7
49
14,0
41
11,4
40
Average outstanding loan balance / per capita income 8.
7%
9.0%
16.0
%
12.7
%
19.1
%
8.6%
8.6%
10.2
%
12.8
%
8.0%
10.2
%
9.9%
11.9
%
9.7%
Proportion of active women depositors (%) - - - - - - - - - - - - - -
Average saving balance per active depositor (PKR)
- - - - - - - - - - - - - -
Active deposit account balance (PKR) -
-
-
-
-
-
-
-
-
-
-
-
-
-
* http://www.sbp.org.pk/reports/stat_reviews/Bulletin/2012/Feb/EconomicGrowth.pdf
70
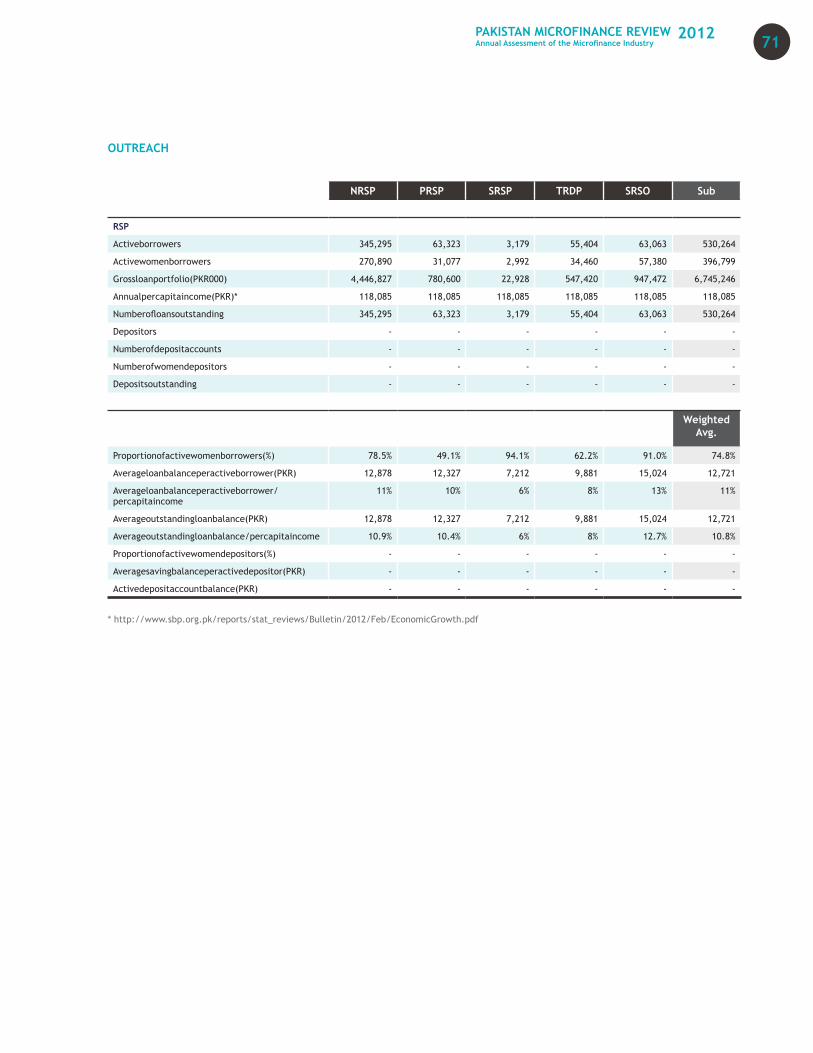
OUTREACH
NRSP PRSP SRSP TRDP SRSO Sub
RSP
Activeborrowers 345,295 63,323 3,179 55,404 63,063 530,264
Activewomenborrowers 270,890 31,077 2,992 34,460 57,380 396,799
Grossloanportfolio(PKR000) 4,446,827 780,600 22,928 547,420 947,472 6,745,246
Annualpercapitaincome(PKR)* 118,085 118,085 118,085 118,085 118,085 118,085
Numberofloansoutstanding 345,295 63,323 3,179 55,404 63,063 530,264
Depositors - - - - - -
Numberofdepositaccounts - - - - - -
Numberofwomendepositors - - - - - -
Depositsoutstanding - - - - - -
Weighted Avg.
Proportionofactivewomenborrowers(%) 78.5% 49.1% 94.1% 62.2% 91.0% 74.8%
Averageloanbalanceperactiveborrower(PKR) 12,878 12,327 7,212 9,881 15,024 12,721
Averageloanbalanceperactiveborrower/percapitaincome
11% 10% 6% 8% 13% 11%
Averageoutstandingloanbalance(PKR) 12,878 12,327 7,212 9,881 15,024 12,721
Averageoutstandingloanbalance/percapitaincome 10.9% 10.4% 6% 8% 12.7% 10.8%
Proportionofactivewomendepositors(%) - - - - - -
Averagesavingbalanceperactivedepositor(PKR) - - - - - -
Activedepositaccountbalance(PKR) - - - - - -
* http://www.sbp.org.pk/reports/stat_reviews/Bulletin/2012/Feb/EconomicGrowth.pdf
71PAKISTAN MICROFINANCE REVIEWAnnual Assessment of the Microfinance Industry
2012
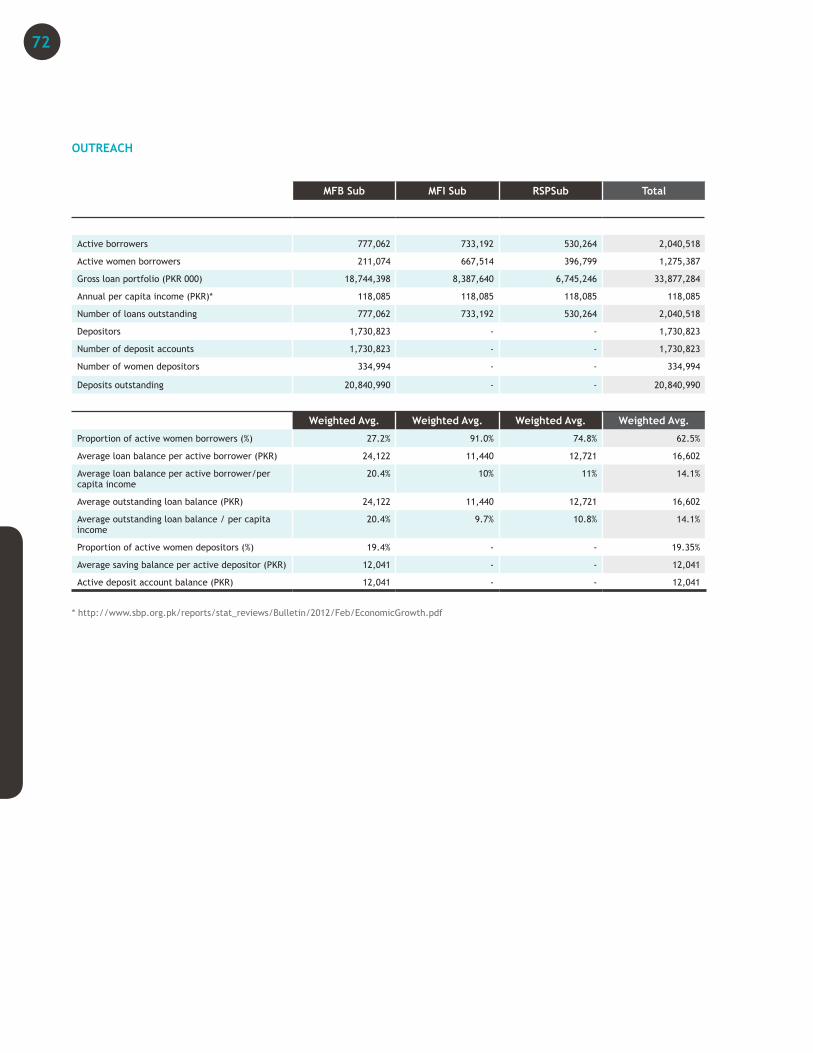
OUTREACH
MFB Sub MFI Sub RSPSub Total
Active borrowers 777,062 733,192 530,264 2,040,518
Active women borrowers 211,074 667,514 396,799 1,275,387
Gross loan portfolio (PKR 000) 18,744,398 8,387,640 6,745,246 33,877,284
Annual per capita income (PKR)* 118,085 118,085 118,085 118,085
Number of loans outstanding 777,062 733,192 530,264 2,040,518
Depositors 1,730,823 - - 1,730,823
Number of deposit accounts 1,730,823 - - 1,730,823
Number of women depositors 334,994 - - 334,994
Deposits outstanding 20,840,990 - - 20,840,990
Weighted Avg. Weighted Avg. Weighted Avg. Weighted Avg.
Proportion of active women borrowers (%) 27.2% 91.0% 74.8% 62.5%
Average loan balance per active borrower (PKR) 24,122 11,440 12,721 16,602
Average loan balance per active borrower/per capita income
20.4% 10% 11% 14.1%
Average outstanding loan balance (PKR) 24,122 11,440 12,721 16,602
Average outstanding loan balance / per capita income
20.4% 9.7% 10.8% 14.1%
Proportion of active women depositors (%) 19.4% - - 19.35%
Average saving balance per active depositor (PKR) 12,041 - - 12,041
Active deposit account balance (PKR) 12,041 - - 12,041
* http://www.sbp.org.pk/reports/stat_reviews/Bulletin/2012/Feb/EconomicGrowth.pdf
72
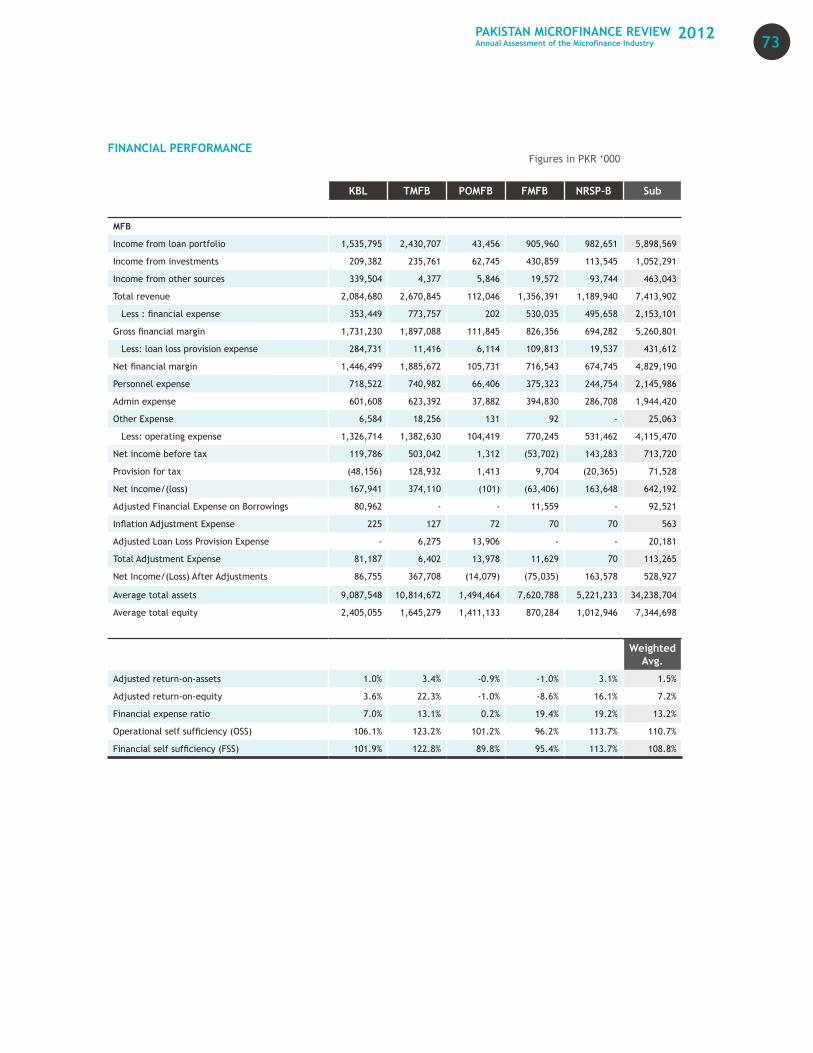
FINANCIAL PERFORMANCE
KBL TMFB POMFB FMFB NRSP-B Sub
MFB
Income from loan portfolio 1,535,795 2,430,707 43,456 905,960 982,651 5,898,569
Income from investments 209,382 235,761 62,745 430,859 113,545 1,052,291
Income from other sources 339,504 4,377 5,846 19,572 93,744 463,043
Total revenue 2,084,680 2,670,845 112,046 1,356,391 1,189,940 7,413,902
Less : financial expense 353,449 773,757 202 530,035 495,658 2,153,101
Gross financial margin 1,731,230 1,897,088 111,845 826,356 694,282 5,260,801
Less: loan loss provision expense 284,731 11,416 6,114 109,813 19,537 431,612
Net financial margin 1,446,499 1,885,672 105,731 716,543 674,745 4,829,190
Personnel expense 718,522 740,982 66,406 375,323 244,754 2,145,986
Admin expense 601,608 623,392 37,882 394,830 286,708 1,944,420
Other Expense 6,584 18,256 131 92 - 25,063
Less: operating expense 1,326,714 1,382,630 104,419 770,245 531,462 4,115,470
Net income before tax 119,786 503,042 1,312 (53,702) 143,283 713,720
Provision for tax (48,156) 128,932 1,413 9,704 (20,365) 71,528
Net income/(loss) 167,941 374,110 (101) (63,406) 163,648 642,192
Adjusted Financial Expense on Borrowings 80,962 - - 11,559 - 92,521
Inflation Adjustment Expense 225 127 72 70 70 563
Adjusted Loan Loss Provision Expense - 6,275 13,906 - - 20,181
Total Adjustment Expense 81,187 6,402 13,978 11,629 70 113,265
Net Income/(Loss) After Adjustments 86,755 367,708 (14,079) (75,035) 163,578 528,927
Average total assets 9,087,548 10,814,672 1,494,464 7,620,788 5,221,233 34,238,704
Average total equity 2,405,055 1,645,279 1,411,133 870,284 1,012,946 7,344,698
Weighted Avg.
Adjusted return-on-assets 1.0% 3.4% -0.9% -1.0% 3.1% 1.5%
Adjusted return-on-equity 3.6% 22.3% -1.0% -8.6% 16.1% 7.2%
Financial expense ratio 7.0% 13.1% 0.2% 19.4% 19.2% 13.2%
Operational self sufficiency (OSS) 106.1% 123.2% 101.2% 96.2% 113.7% 110.7%
Financial self sufficiency (FSS) 101.9% 122.8% 89.8% 95.4% 113.7% 108.8%
Figures in PKR ‘000
73PAKISTAN MICROFINANCE REVIEWAnnual Assessment of the Microfinance Industry
2012
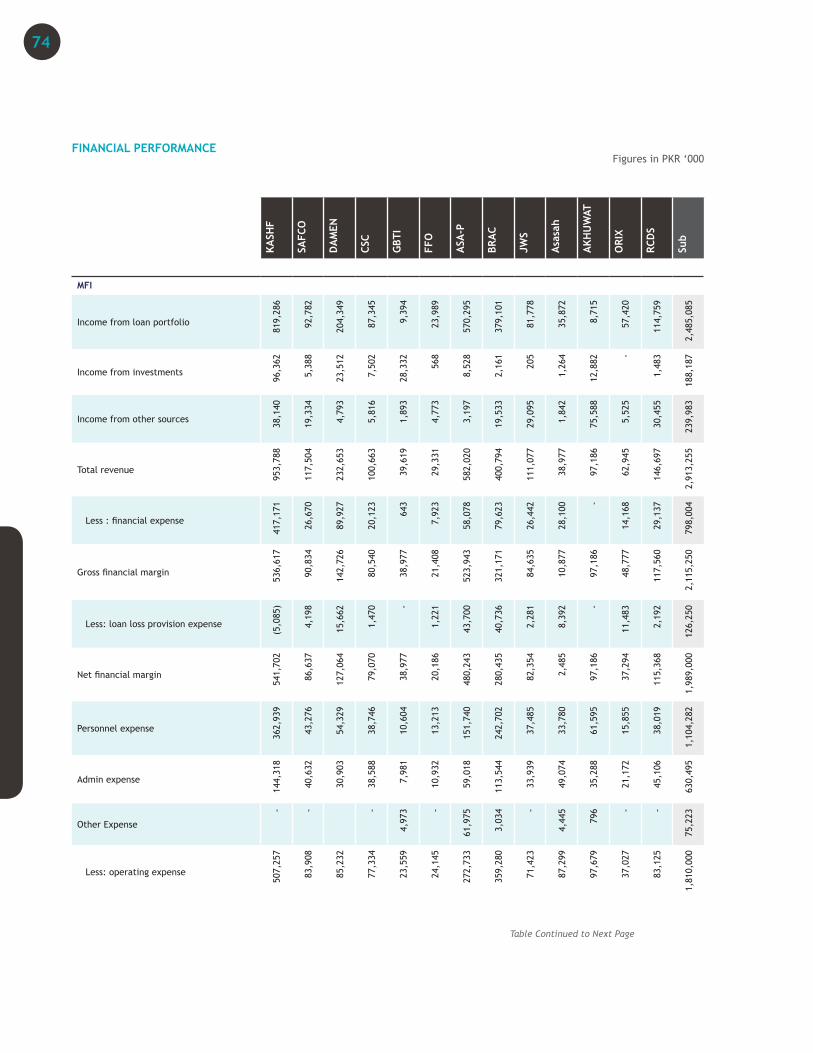
FINANCIAL PERFORMANCE
KASH
F
SAFC
O
DA
MEN
CSC
GBT
I
FFO
ASA
-P
BRA
C
JWS
Asa
sah
AKH
UW
AT
ORI
X
RCD
S
Sub
MFI
Income from loan portfolio
819
,286
92,
782
204
,349
87,
345
9,3
94
23,
989
570
,295
379
,101
81,
778
35,
872
8,7
15
57,
420
114
,759
2,4
85,0
85
Income from investments
96,
362
5,3
88
23,
512
7,5
02
28,
332
568
8,5
28
2,1
61
205
1,2
64
12,
882 -
1,4
83
188
,187
Income from other sources
38,
140
19,
334
4,7
93
5,8
16
1,8
93
4,7
73
3,1
97
19,
533
29,
095
1,8
42
75,
588
5,5
25
30,
455
239
,983
Total revenue
953
,788
117
,504
232
,653
100
,663
39,
619
29,
331
582
,020
400
,794
111
,077
38,
977
97,
186
62,
945
146
,697
2,91
3,25
5
Less : financial expense
417
,171
26,
670
89,
927
20,
123
643
7,9
23
58,
078
79,
623
26,
442
28,
100 -
14,
168
29,
137
798
,004
Gross financial margin
536
,617
90,
834
142
,726
80,
540
38,
977
21,
408
523
,943
321
,171
84,
635
10,
877
97,
186
48,
777
117
,560
2,1
15,2
50
Less: loan loss provision expense
(5,
085)
4,1
98
15,
662
1,4
70
-
1,2
21
43,
700
40,
736
2,2
81
8,3
92
-
11,
483
2,1
92
126
,250
Net financial margin
541
,702
86,
637
127
,064
79,
070
38,
977
20,
186
480
,243
280
,435
82,
354
2,4
85
97,
186
37,
294
115
,368
1,98
9,00
0
Personnel expense
362
,939
43,
276
54,
329
38,
746
10,
604
13,
213
151
,740
242
,702
37,
485
33,
780
61,
595
15,
855
38,
019
1,10
4,28
2
Admin expense
144
,318
40,
632
30,
903
38,
588
7,9
81
10,
932
59,
018
113
,544
33,
939
49,
074
35,
288
21,
172
45,
106
630
,495
Other Expense
-
-
-
4,9
73
-
61,9
75
3,0
34
-
4,4
45
796
-
-
75,
223
Less: operating expense
507
,257
83,
908
85,
232
77,
334
23,
559
24,
145
272
,733
359
,280
71,
423
87,
299
97,
679
37,
027
83,
125
1,81
0,00
0
Figures in PKR ‘000
Table Continued to Next Page
74
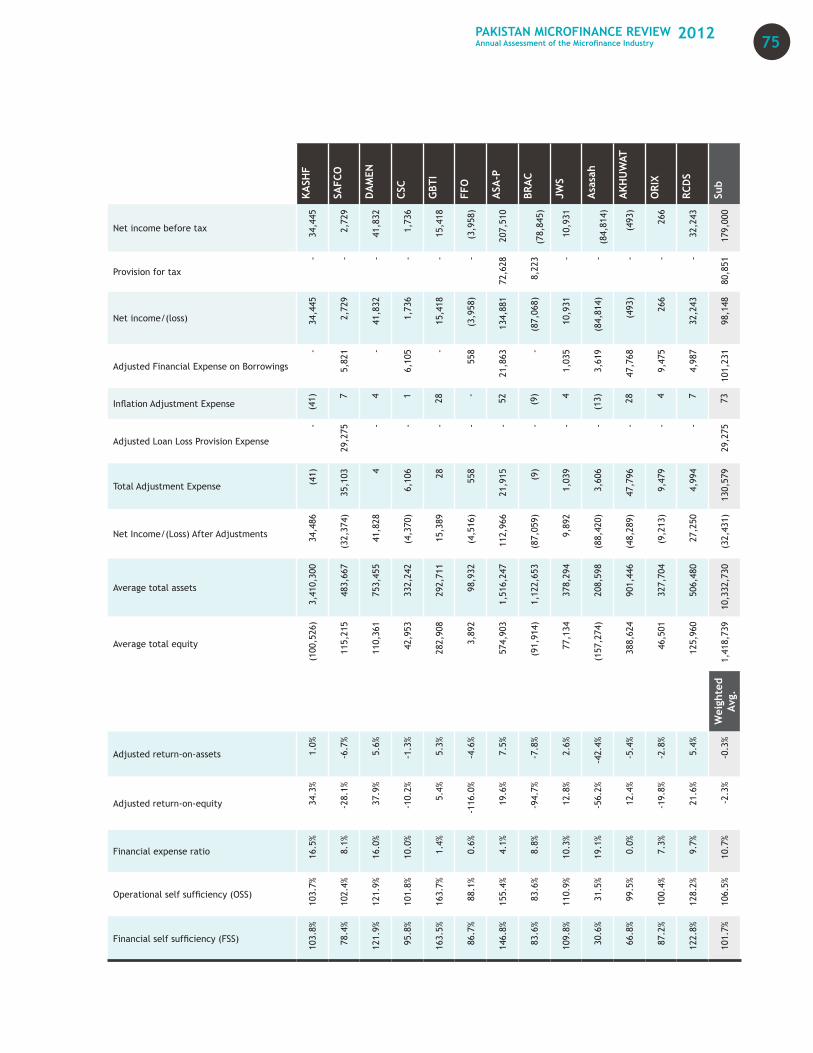
KASH
F
SAFC
O
DA
MEN
CSC
GBT
I
FFO
ASA
-P
BRA
C
JWS
Asa
sah
AKH
UW
AT
ORI
X
RCD
S
Sub
Net income before tax
34,4
45
2,7
29
41,
832
1,7
36
15,
418
(3,
958)
207,
510
(78,
845)
10,
931
(84,
814)
(49
3)
266
32,
243
179,
000
Provision for tax
-
-
-
-
-
-
72,6
28
8,2
23
-
-
-
-
-
80,8
51
Net income/(loss) 3
4,44
5
2,7
29
41,
832
1,7
36
15,
418
(3,
958)
134,
881
(87,
068)
10,
931
(84,
814)
(49
3)
266
32,
243
98,1
48
Adjusted Financial Expense on Borrowings
-
5,8
21
-
6,1
05
-
558
21,
863 -
1,0
35
3,6
19
47,
768
9,4
75
4,9
87
101,
231
Inflation Adjustment Expense
(41
) 7
4
1
28 -
52
(9) 4
(13
)
28 4
7
73
Adjusted Loan Loss Provision Expense
-
29,2
75
-
-
-
-
-
-
-
-
-
-
-
29,2
75
Total Adjustment Expense (41
)
35,
103 4
6,1
06
28
558
21,
915
(9)
1,0
39
3,6
06
47,
796
9,4
79
4,9
94
130,
579
Net Income/(Loss) After Adjustments
34,
486
(32
,374
)
41,
828
(4,
370)
15,
389
(4,
516)
112
,966
(87
,059
)
9,8
92
(88
,420
)
(48
,289
)
(9,
213)
27,
250
(32,
431)
Average total assets
3,4
10,3
00
483
,667
753
,455
332
,242
292
,711
98,
932
1,5
16,2
47
1,1
22,6
53
378
,294
208
,598
901
,446
327
,704
506
,480
10,3
32,7
30
Average total equity
(100
,526
)
115
,215
110
,361
42,
953
282
,908
3,8
92
574
,903
(91
,914
)
77,
134
(157
,274
)
388
,624
46,
501
125
,960
1,41
8,73
9 W
eigh
ted
Avg.
Adjusted return-on-assets 1.0%
-6.7
%
5.6%
-1.3
%
5.3%
-4.6
%
7.5%
-7.8
%
2.6%
-42.
4%
-5.4
%
-2.8
%
5.4%
-0.3
%
Adjusted return-on-equity 34.3
%
-28.
1%
37.9
%
-10.
2%
5.4%
-116
.0%
19.6
%
-94.
7%
12.8
%
-56.
2%
12.4
%
-19.
8%
21.6
%
-2.3
%
Financial expense ratio 16.5
%
8.1%
16.0
%
10.0
%
1.4%
0.6%
4.1%
8.8%
10.3
%
19.1
%
0.0%
7.3%
9.7%
10.7
%
Operational self sufficiency (OSS)
103.
7%
102.
4%
121.
9%
101.
8%
163.
7%
88.1
%
155.
4%
83.6
%
110.
9%
31.5
%
99.5
%
100.
4%
128.
2%
106.
5%
Financial self sufficiency (FSS)
103.
8%
78.4
%
121.
9%
95.8
%
163.
5%
86.7
%
146.
8%
83.6
%
109.
8%
30.6
%
66.8
%
87.2
%
122.
8%
101.
7%
75PAKISTAN MICROFINANCE REVIEWAnnual Assessment of the Microfinance Industry
2012

FINANCIAL PERFORMANCE
NRSP PRSP SRSP TRDP SRSO Sub
RSP
Income from loan portfolio 1,228,865 125,369 4,620 125,558 172,655 1,657,067
Income from investments 432,041 85,505 - - 16,586 534,132
Income from other sources 36,132 23,324 7,105 36,315 10,560 113,436
Total revenue 1,697,039 234,198 11,725 161,872 199,801 2,304,635
Less : financial expense 829,689 85,529 873 43,362 63,909 1,023,361
Gross financial margin 867,350 148,669 10,852 118,510 135,892 1,281,273
Less: loan loss provision expense 66,183 9,943 - 10,003 - 86,129
Net financial margin 801,167 138,726 10,852 108,507 135,892 1,195,144
Personnel expense 403,538 28,118 4,924 34,863 62,964 534,407
Admin expense 215,415 21,611 4,089 30,511 39,484 311,110
Other Expense 157,365 - - - 157,365
Less: operating expense 776,318 49,729 9,013 65,374 102,448 1,002,882
Net income before tax 24,849 88,997 1,839 43,133 33,444 192,262
Provision for tax - - - - - -
Net income/(loss) 24,849 88,997 1,839 43,133 33,444 192,262
Adjusted Financial Expense on Borrowings - - - 3,691 8,500 12,191
Inflation Adjustment Expense 142 64 2 12 14 234
Adjusted Loan Loss Provision Expense - - - - - -
Total Adjustment Expense 142 64 2 3,703 8,514 12,425
Net Income/(Loss) After Adjustments 24,707 88,933 1,837 39,430 24,930 179,837
Average total assets 7,874,758 2,392,075 33,083 1,361,266 950,097 12,611,280
Average total equity 1,434,587 899,287 25,501 305,751 166,381 2,831,507
Weighted Avg.
Adjusted return-on-assets 0.3% 3.7% 5.6% 2.9% 2.6% 1.4%
Adjusted return-on-equity 1.7% 9.9% 7.2% 12.9% 15.0% 6.4%
Financial expense ratio 20.5% 12.4% 4.4% 9.2% 8.3% 17.0%
Operational self sufficiency (OSS) 101.5% 161.3% 118.6% 136.3% 120.1% 109.1%
Financial self sufficiency (FSS) 101.5% 161.2% 118.6% 132.2% 114.3% 108.5%
Figures in PKR ‘000
76
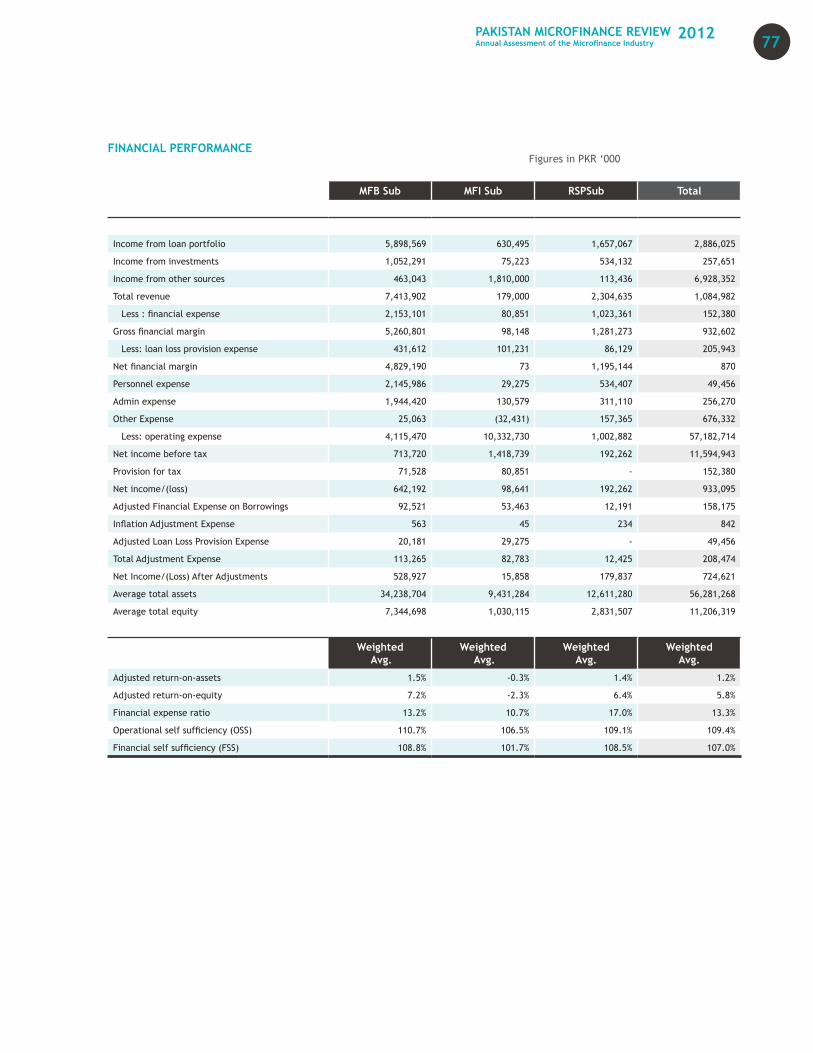
FINANCIAL PERFORMANCE
MFB Sub MFI Sub RSPSub Total
Income from loan portfolio 5,898,569 630,495 1,657,067 2,886,025
Income from investments 1,052,291 75,223 534,132 257,651
Income from other sources 463,043 1,810,000 113,436 6,928,352
Total revenue 7,413,902 179,000 2,304,635 1,084,982
Less : financial expense 2,153,101 80,851 1,023,361 152,380
Gross financial margin 5,260,801 98,148 1,281,273 932,602
Less: loan loss provision expense 431,612 101,231 86,129 205,943
Net financial margin 4,829,190 73 1,195,144 870
Personnel expense 2,145,986 29,275 534,407 49,456
Admin expense 1,944,420 130,579 311,110 256,270
Other Expense 25,063 (32,431) 157,365 676,332
Less: operating expense 4,115,470 10,332,730 1,002,882 57,182,714
Net income before tax 713,720 1,418,739 192,262 11,594,943
Provision for tax 71,528 80,851 - 152,380
Net income/(loss) 642,192 98,641 192,262 933,095
Adjusted Financial Expense on Borrowings 92,521 53,463 12,191 158,175
Inflation Adjustment Expense 563 45 234 842
Adjusted Loan Loss Provision Expense 20,181 29,275 - 49,456
Total Adjustment Expense 113,265 82,783 12,425 208,474
Net Income/(Loss) After Adjustments 528,927 15,858 179,837 724,621
Average total assets 34,238,704 9,431,284 12,611,280 56,281,268
Average total equity 7,344,698 1,030,115 2,831,507 11,206,319
Weighted Avg.
Weighted Avg.
Weighted Avg.
Weighted Avg.
Adjusted return-on-assets 1.5% -0.3% 1.4% 1.2%
Adjusted return-on-equity 7.2% -2.3% 6.4% 5.8%
Financial expense ratio 13.2% 10.7% 17.0% 13.3%
Operational self sufficiency (OSS) 110.7% 106.5% 109.1% 109.4%
Financial self sufficiency (FSS) 108.8% 101.7% 108.5% 107.0%
Figures in PKR ‘000
77PAKISTAN MICROFINANCE REVIEWAnnual Assessment of the Microfinance Industry
2012
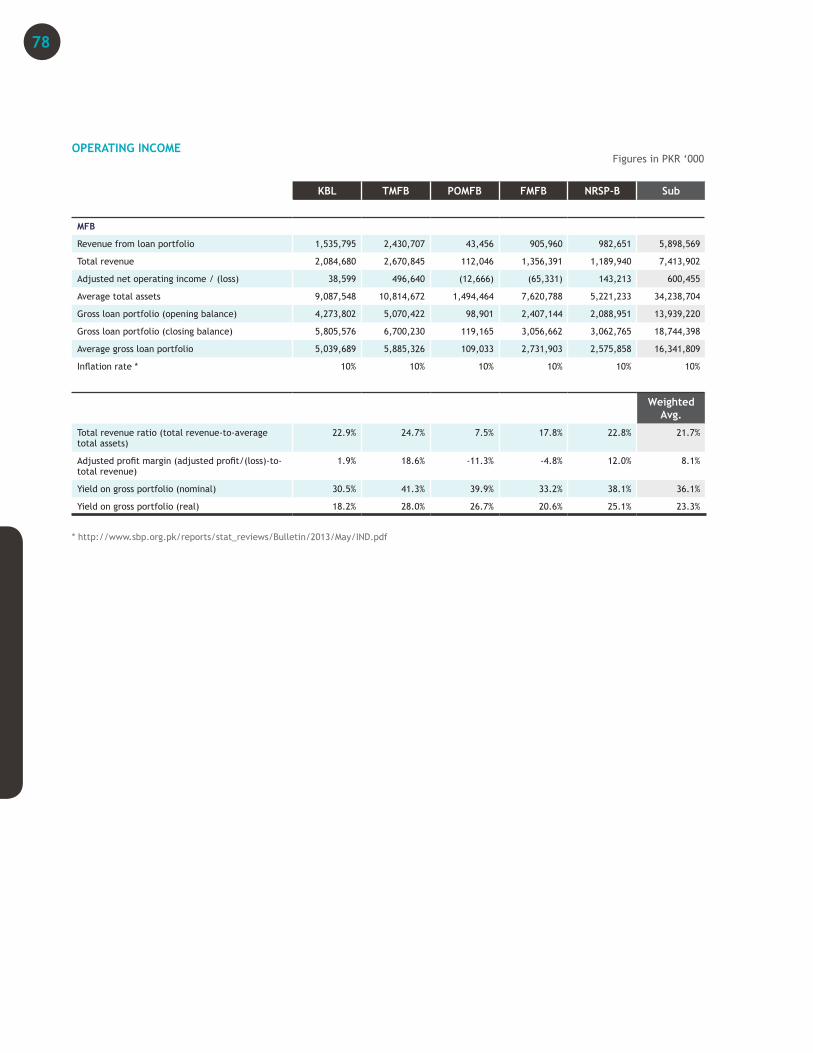
OPERATING INCOME
KBL TMFB POMFB FMFB NRSP-B Sub
MFB
Revenue from loan portfolio 1,535,795 2,430,707 43,456 905,960 982,651 5,898,569
Total revenue 2,084,680 2,670,845 112,046 1,356,391 1,189,940 7,413,902
Adjusted net operating income / (loss) 38,599 496,640 (12,666) (65,331) 143,213 600,455
Average total assets 9,087,548 10,814,672 1,494,464 7,620,788 5,221,233 34,238,704
Gross loan portfolio (opening balance) 4,273,802 5,070,422 98,901 2,407,144 2,088,951 13,939,220
Gross loan portfolio (closing balance) 5,805,576 6,700,230 119,165 3,056,662 3,062,765 18,744,398
Average gross loan portfolio 5,039,689 5,885,326 109,033 2,731,903 2,575,858 16,341,809
Inflation rate * 10% 10% 10% 10% 10% 10%
Weighted Avg.
Total revenue ratio (total revenue-to-average total assets)
22.9% 24.7% 7.5% 17.8% 22.8% 21.7%
Adjusted profit margin (adjusted profit/(loss)-to-total revenue)
1.9% 18.6% -11.3% -4.8% 12.0% 8.1%
Yield on gross portfolio (nominal) 30.5% 41.3% 39.9% 33.2% 38.1% 36.1%
Yield on gross portfolio (real) 18.2% 28.0% 26.7% 20.6% 25.1% 23.3%
* http://www.sbp.org.pk/reports/stat_reviews/Bulletin/2013/May/IND.pdf
Figures in PKR ‘000
78
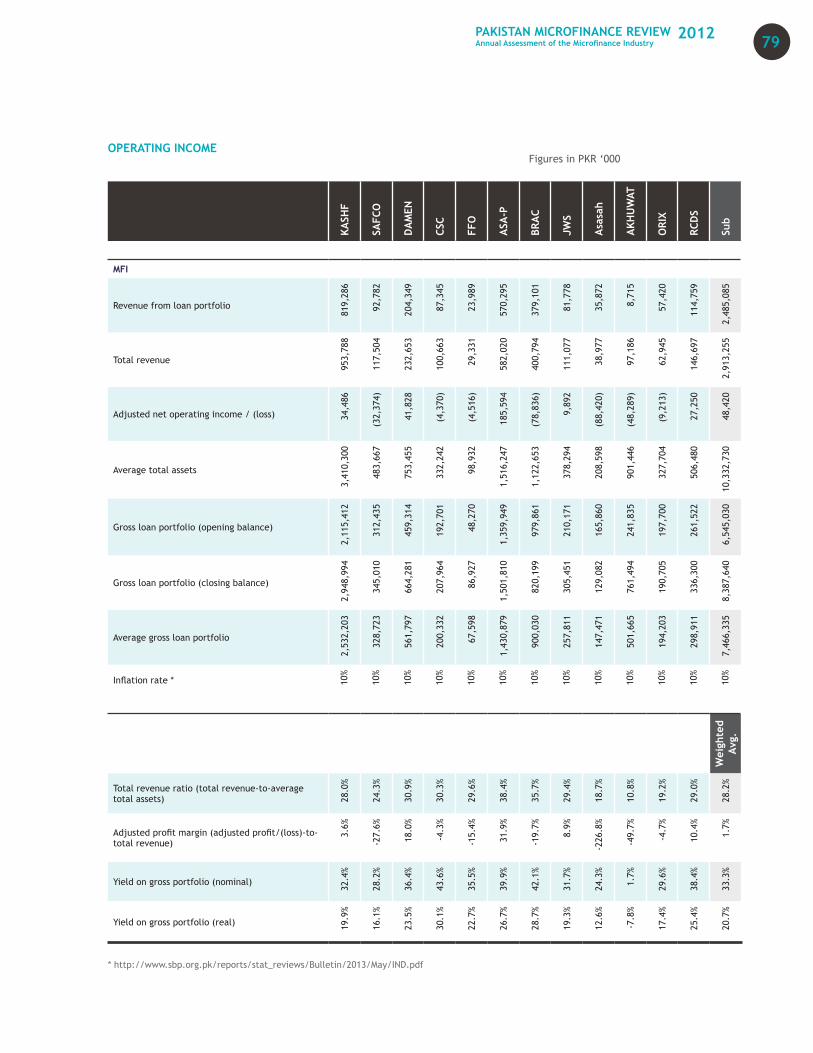
OPERATING INCOME
KASH
F
SAFC
O
DA
MEN
CSC
FFO
ASA
-P
BRA
C
JWS
Asa
sah
AKH
UW
AT
ORI
X
RCD
S
Sub
MFI
Revenue from loan portfolio
819
,286
92,
782
204
,349
87,
345
23,
989
570
,295
379
,101
81,
778
35,
872
8,7
15
57,
420
114
,759
2,4
85,0
85
Total revenue
953
,788
117
,504
232
,653
100
,663
29,
331
582
,020
400
,794
111
,077
38,
977
97,
186
62,
945
146
,697
2,9
13,2
55
Adjusted net operating income / (loss)
34,
486
(32
,374
)
41,
828
(4,
370)
(4,
516)
185
,594
(78
,836
)
9,8
92
(88
,420
)
(48
,289
)
(9,
213)
27,
250
48,
420
Average total assets
3,4
10,3
00
483
,667
753
,455
332
,242
98,
932
1,5
16,2
47
1,1
22,6
53
378
,294
208
,598
901
,446
327
,704
506
,480
10,3
32,7
30
Gross loan portfolio (opening balance)
2,1
15,4
12
312
,435
459
,314
192
,701
48,
270
1,3
59,9
49
979
,861
210
,171
165
,860
241
,835
197
,700
261
,522
6,5
45,0
30
Gross loan portfolio (closing balance)
2,94
8,99
4
345
,010
664
,281
207
,964
86,
927
1,5
01,8
10
820
,199
305
,451
129
,082
761
,494
190
,705
336
,300
8,3
87,6
40
Average gross loan portfolio
2,53
2,20
3
328
,723
561
,797
200
,332
67,
598
1,4
30,8
79
900
,030
257
,811
147
,471
501
,665
194
,203
298
,911
7,4
66,3
35
Inflation rate * 10%
10%
10%
10%
10%
10%
10%
10%
10%
10%
10%
10%
10%
Wei
ghte
d Av
g.
Total revenue ratio (total revenue-to-average total assets) 28
.0%
24.3
%
30.9
%
30.3
%
29.6
%
38.4
%
35.7
%
29.4
%
18.7
%
10.8
%
19.2
%
29.0
%
28.2
%
Adjusted profit margin (adjusted profit/(loss)-to-total revenue)
3.6%
-27.
6%
18.0
%
-4.3
%
-15.
4%
31.9
%
-19.
7%
8.9%
-226
.8%
-49.
7%
-4.7
%
10.4
%
1.7%
Yield on gross portfolio (nominal)
32.4
%
28.2
%
36.4
%
43.6
%
35.5
%
39.9
%
42.1
%
31.7
%
24.3
%
1.7%
29.6
%
38.4
%
33.3
%
Yield on gross portfolio (real) 19.9
%
16.1
%
23.5
%
30.1
%
22.7
%
26.7
%
28.7
%
19.3
%
12.6
%
-7.8
%
17.4
%
25.4
%
20.7
%
* http://www.sbp.org.pk/reports/stat_reviews/Bulletin/2013/May/IND.pdf
Figures in PKR ‘000
79PAKISTAN MICROFINANCE REVIEWAnnual Assessment of the Microfinance Industry
2012
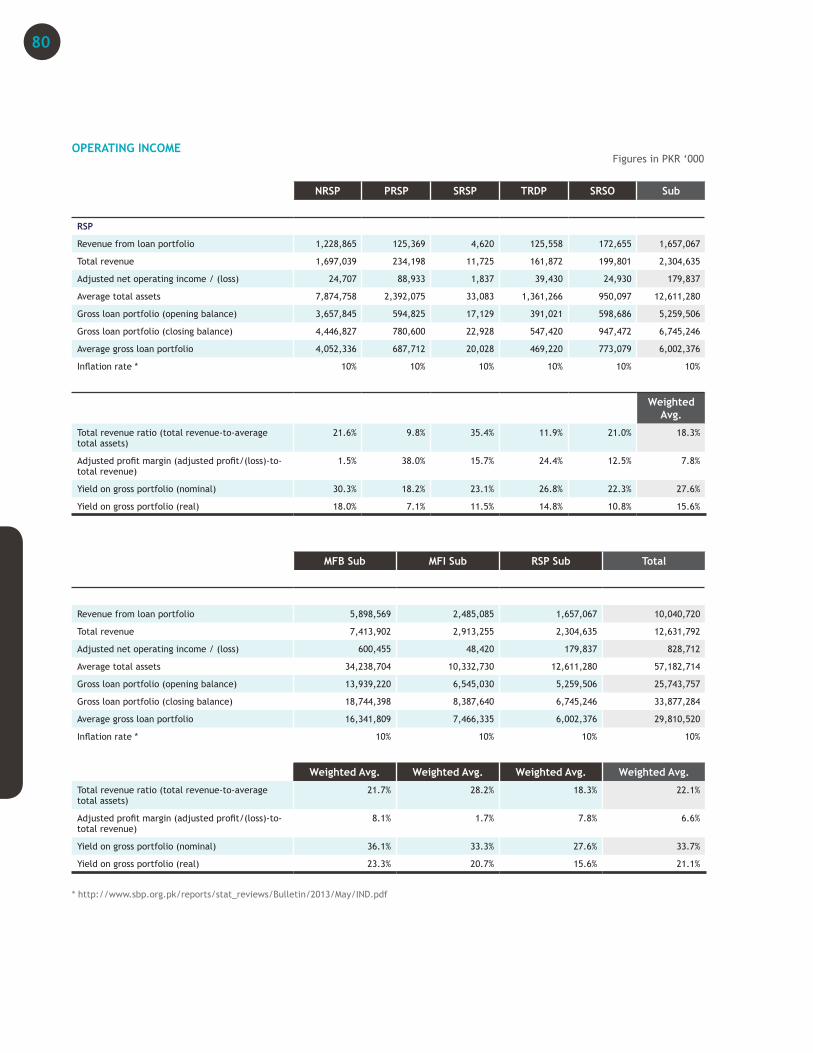
OPERATING INCOME
NRSP PRSP SRSP TRDP SRSO Sub
RSP
Revenue from loan portfolio 1,228,865 125,369 4,620 125,558 172,655 1,657,067
Total revenue 1,697,039 234,198 11,725 161,872 199,801 2,304,635
Adjusted net operating income / (loss) 24,707 88,933 1,837 39,430 24,930 179,837
Average total assets 7,874,758 2,392,075 33,083 1,361,266 950,097 12,611,280
Gross loan portfolio (opening balance) 3,657,845 594,825 17,129 391,021 598,686 5,259,506
Gross loan portfolio (closing balance) 4,446,827 780,600 22,928 547,420 947,472 6,745,246
Average gross loan portfolio 4,052,336 687,712 20,028 469,220 773,079 6,002,376
Inflation rate * 10% 10% 10% 10% 10% 10%
Weighted Avg.
Total revenue ratio (total revenue-to-average total assets)
21.6% 9.8% 35.4% 11.9% 21.0% 18.3%
Adjusted profit margin (adjusted profit/(loss)-to-total revenue)
1.5% 38.0% 15.7% 24.4% 12.5% 7.8%
Yield on gross portfolio (nominal) 30.3% 18.2% 23.1% 26.8% 22.3% 27.6%
Yield on gross portfolio (real) 18.0% 7.1% 11.5% 14.8% 10.8% 15.6%
MFB Sub MFI Sub RSP Sub Total
Revenue from loan portfolio 5,898,569 2,485,085 1,657,067 10,040,720
Total revenue 7,413,902 2,913,255 2,304,635 12,631,792
Adjusted net operating income / (loss) 600,455 48,420 179,837 828,712
Average total assets 34,238,704 10,332,730 12,611,280 57,182,714
Gross loan portfolio (opening balance) 13,939,220 6,545,030 5,259,506 25,743,757
Gross loan portfolio (closing balance) 18,744,398 8,387,640 6,745,246 33,877,284
Average gross loan portfolio 16,341,809 7,466,335 6,002,376 29,810,520
Inflation rate * 10% 10% 10% 10%
Weighted Avg. Weighted Avg. Weighted Avg. Weighted Avg.
Total revenue ratio (total revenue-to-average total assets)
21.7% 28.2% 18.3% 22.1%
Adjusted profit margin (adjusted profit/(loss)-to-total revenue)
8.1% 1.7% 7.8% 6.6%
Yield on gross portfolio (nominal) 36.1% 33.3% 27.6% 33.7%
Yield on gross portfolio (real) 23.3% 20.7% 15.6% 21.1%
* http://www.sbp.org.pk/reports/stat_reviews/Bulletin/2013/May/IND.pdf
Figures in PKR ‘000
80
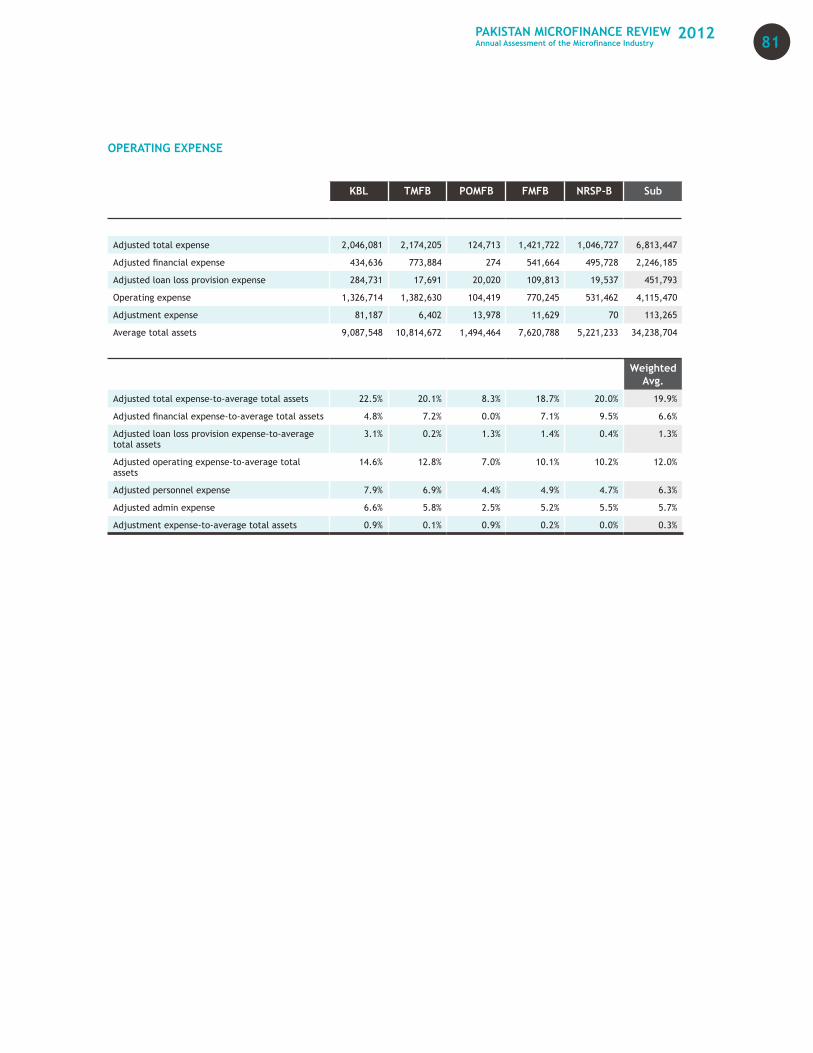
OPERATING EXPENSE
KBL TMFB POMFB FMFB NRSP-B Sub
Adjusted total expense 2,046,081 2,174,205 124,713 1,421,722 1,046,727 6,813,447
Adjusted financial expense 434,636 773,884 274 541,664 495,728 2,246,185
Adjusted loan loss provision expense 284,731 17,691 20,020 109,813 19,537 451,793
Operating expense 1,326,714 1,382,630 104,419 770,245 531,462 4,115,470
Adjustment expense 81,187 6,402 13,978 11,629 70 113,265
Average total assets 9,087,548 10,814,672 1,494,464 7,620,788 5,221,233 34,238,704
Weighted Avg.
Adjusted total expense-to-average total assets 22.5% 20.1% 8.3% 18.7% 20.0% 19.9%
Adjusted financial expense-to-average total assets 4.8% 7.2% 0.0% 7.1% 9.5% 6.6%
Adjusted loan loss provision expense-to-average total assets
3.1% 0.2% 1.3% 1.4% 0.4% 1.3%
Adjusted operating expense-to-average total assets
14.6% 12.8% 7.0% 10.1% 10.2% 12.0%
Adjusted personnel expense 7.9% 6.9% 4.4% 4.9% 4.7% 6.3%
Adjusted admin expense 6.6% 5.8% 2.5% 5.2% 5.5% 5.7%
Adjustment expense-to-average total assets 0.9% 0.1% 0.9% 0.2% 0.0% 0.3%
81PAKISTAN MICROFINANCE REVIEWAnnual Assessment of the Microfinance Industry
2012
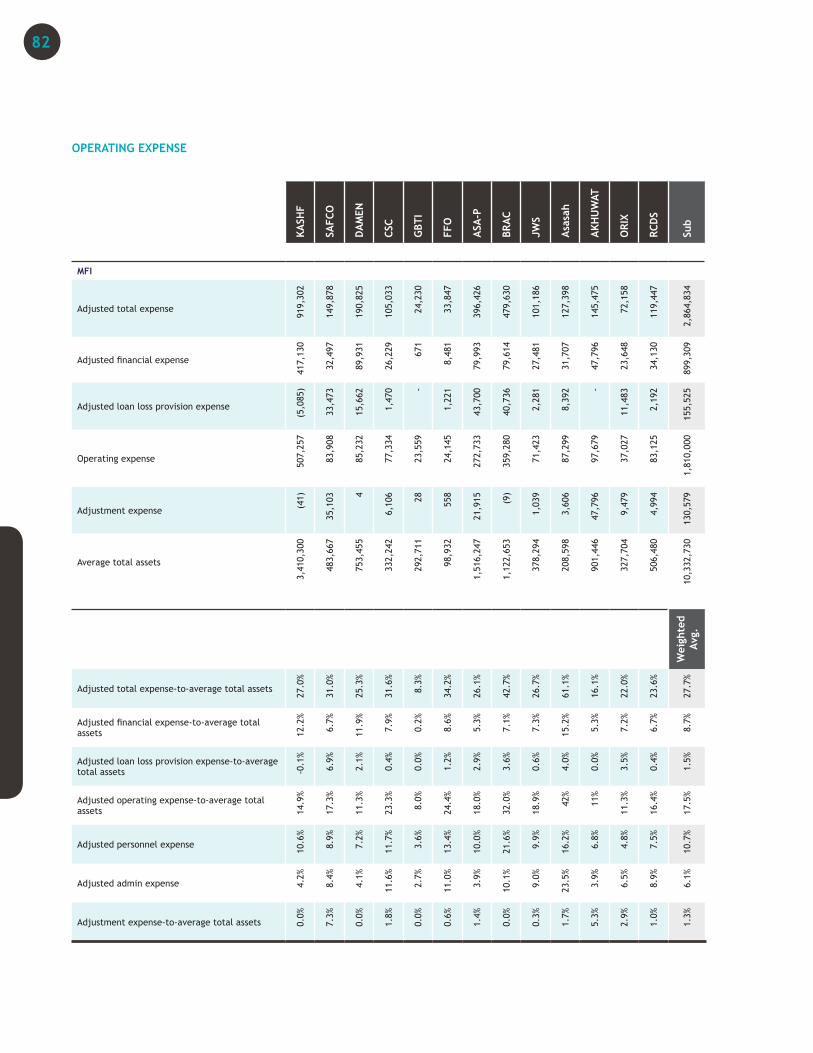
OPERATING EXPENSE
KASH
F
SAFC
O
DA
MEN
CSC
GBT
I
FFO
ASA
-P
BRA
C
JWS
Asa
sah
AKH
UW
AT
ORI
X
RCD
S
Sub
MFI
Adjusted total expense 9
19,3
02
149
,878
190
,825
105
,033
24,
230
33,
847
396
,426
479
,630
101
,186
127
,398
145
,475
72,
158
119
,447
2,8
64,8
34
Adjusted financial expense
417
,130
32,
497
89,
931
26,
229
671
8,4
81
79,
993
79,
614
27,
481
31,
707
47,
796
23,
648
34,
130
899
,309
Adjusted loan loss provision expense
(5,
085)
33,
473
15,
662
1,4
70
-
1,2
21
43,
700
40,
736
2,2
81
8,3
92
-
11,
483
2,1
92
155
,525
Operating expense
507
,257
83,
908
85,
232
77,
334
23,
559
24,
145
272
,733
359
,280
71,
423
87,
299
97,
679
37,
027
83,
125
1,8
10,0
00
Adjustment expense (41
)
35,
103 4
6,1
06
28
558
21,
915
(9)
1,0
39
3,6
06
47,
796
9,4
79
4,9
94
130
,579
Average total assets
3,41
0,30
0
483,
667
753,
455
332,
242
292,
711
98,
932
1,51
6,24
7
1,12
2,65
3
378,
294
208,
598
901,
446
327,
704
506,
480
10,3
32,7
30
Wei
ghte
d Av
g.Adjusted total expense-to-average total assets
27.0
%
31.0
%
25.3
%
31.6
%
8.3%
34.2
%
26.1
%
42.7
%
26.7
%
61.1
%
16.1
%
22.0
%
23.6
%
27.7
%
Adjusted financial expense-to-average total assets 12
.2%
6.7%
11.9
%
7.9%
0.2%
8.6%
5.3%
7.1%
7.3%
15.2
%
5.3%
7.2%
6.7%
8.7%
Adjusted loan loss provision expense-to-average total assets -0
.1%
6.9%
2.1%
0.4%
0.0%
1.2%
2.9%
3.6%
0.6%
4.0%
0.0%
3.5%
0.4%
1.5%
Adjusted operating expense-to-average total assets 14
.9%
17.3
%
11.3
%
23.3
%
8.0%
24.4
%
18.0
%
32.0
%
18.9
%
42%
11%
11.3
%
16.4
%
17.5
%
Adjusted personnel expense
10.6
%
8.9%
7.2%
11.7
%
3.6%
13.4
%
10.0
%
21.6
%
9.9%
16.2
%
6.8%
4.8%
7.5%
10.7
%
Adjusted admin expense 4.2%
8.4%
4.1%
11.6
%
2.7%
11.0
%
3.9%
10.1
%
9.0%
23.5
%
3.9%
6.5%
8.9%
6.1%
Adjustment expense-to-average total assets 0.0%
7.3%
0.0%
1.8%
0.0%
0.6%
1.4%
0.0%
0.3%
1.7%
5.3%
2.9%
1.0%
1.3%
82
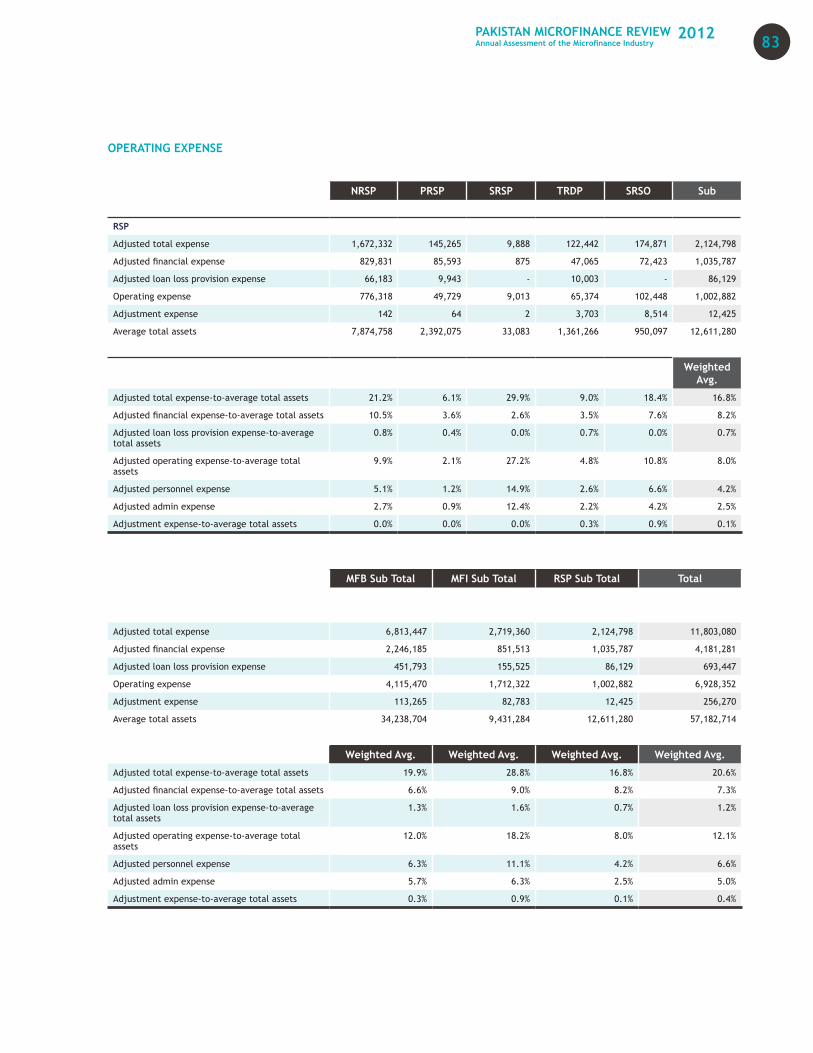
OPERATING EXPENSE
NRSP PRSP SRSP TRDP SRSO Sub
RSP
Adjusted total expense 1,672,332 145,265 9,888 122,442 174,871 2,124,798
Adjusted financial expense 829,831 85,593 875 47,065 72,423 1,035,787
Adjusted loan loss provision expense 66,183 9,943 - 10,003 - 86,129
Operating expense 776,318 49,729 9,013 65,374 102,448 1,002,882
Adjustment expense 142 64 2 3,703 8,514 12,425
Average total assets 7,874,758 2,392,075 33,083 1,361,266 950,097 12,611,280
Weighted Avg.
Adjusted total expense-to-average total assets 21.2% 6.1% 29.9% 9.0% 18.4% 16.8%
Adjusted financial expense-to-average total assets 10.5% 3.6% 2.6% 3.5% 7.6% 8.2%
Adjusted loan loss provision expense-to-average total assets
0.8% 0.4% 0.0% 0.7% 0.0% 0.7%
Adjusted operating expense-to-average total assets
9.9% 2.1% 27.2% 4.8% 10.8% 8.0%
Adjusted personnel expense 5.1% 1.2% 14.9% 2.6% 6.6% 4.2%
Adjusted admin expense 2.7% 0.9% 12.4% 2.2% 4.2% 2.5%
Adjustment expense-to-average total assets 0.0% 0.0% 0.0% 0.3% 0.9% 0.1%
MFB Sub Total MFI Sub Total RSP Sub Total Total
Adjusted total expense 6,813,447 2,719,360 2,124,798 11,803,080
Adjusted financial expense 2,246,185 851,513 1,035,787 4,181,281
Adjusted loan loss provision expense 451,793 155,525 86,129 693,447
Operating expense 4,115,470 1,712,322 1,002,882 6,928,352
Adjustment expense 113,265 82,783 12,425 256,270
Average total assets 34,238,704 9,431,284 12,611,280 57,182,714
Weighted Avg. Weighted Avg. Weighted Avg. Weighted Avg.
Adjusted total expense-to-average total assets 19.9% 28.8% 16.8% 20.6%
Adjusted financial expense-to-average total assets 6.6% 9.0% 8.2% 7.3%
Adjusted loan loss provision expense-to-average total assets
1.3% 1.6% 0.7% 1.2%
Adjusted operating expense-to-average total assets
12.0% 18.2% 8.0% 12.1%
Adjusted personnel expense 6.3% 11.1% 4.2% 6.6%
Adjusted admin expense 5.7% 6.3% 2.5% 5.0%
Adjustment expense-to-average total assets 0.3% 0.9% 0.1% 0.4%
83PAKISTAN MICROFINANCE REVIEWAnnual Assessment of the Microfinance Industry
2012
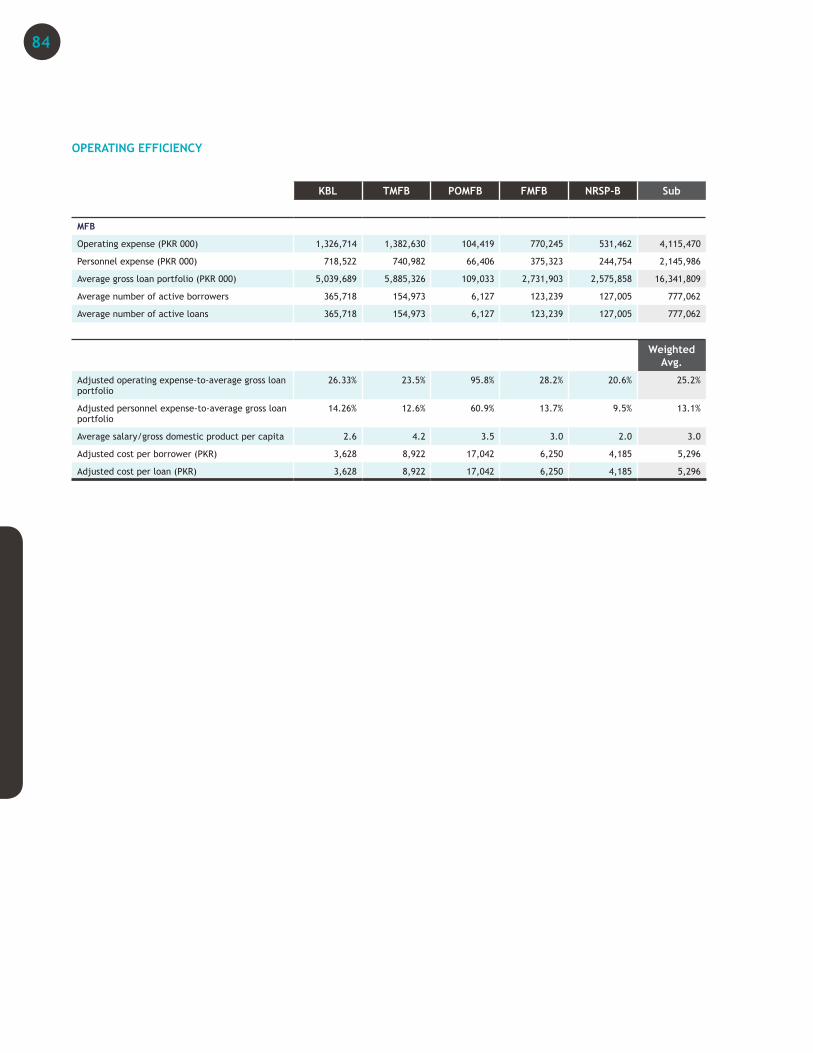
OPERATING EFFICIENCY
KBL TMFB POMFB FMFB NRSP-B Sub
MFB
Operating expense (PKR 000) 1,326,714 1,382,630 104,419 770,245 531,462 4,115,470
Personnel expense (PKR 000) 718,522 740,982 66,406 375,323 244,754 2,145,986
Average gross loan portfolio (PKR 000) 5,039,689 5,885,326 109,033 2,731,903 2,575,858 16,341,809
Average number of active borrowers 365,718 154,973 6,127 123,239 127,005 777,062
Average number of active loans 365,718 154,973 6,127 123,239 127,005 777,062
Weighted Avg.
Adjusted operating expense-to-average gross loan portfolio
26.33% 23.5% 95.8% 28.2% 20.6% 25.2%
Adjusted personnel expense-to-average gross loan portfolio
14.26% 12.6% 60.9% 13.7% 9.5% 13.1%
Average salary/gross domestic product per capita 2.6 4.2 3.5 3.0 2.0 3.0
Adjusted cost per borrower (PKR) 3,628 8,922 17,042 6,250 4,185 5,296
Adjusted cost per loan (PKR) 3,628 8,922 17,042 6,250 4,185 5,296
84
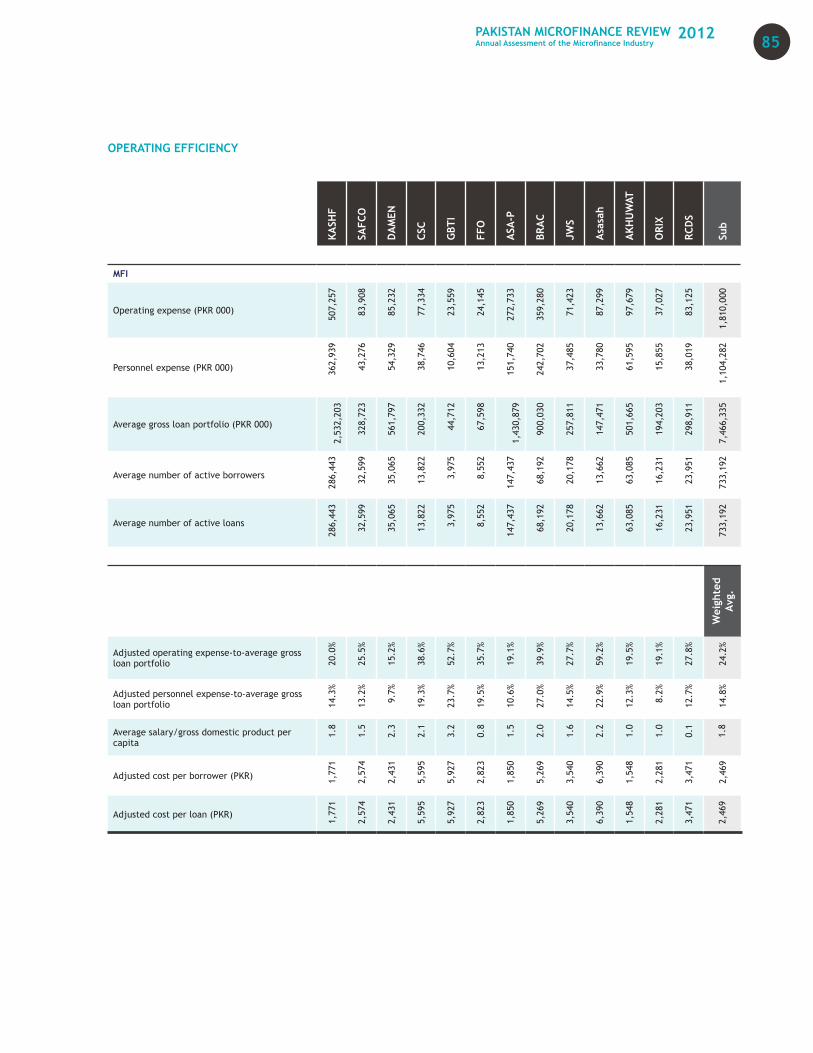
OPERATING EFFICIENCY
KASH
F
SAFC
O
DA
MEN
CSC
GBT
I
FFO
ASA
-P
BRA
C
JWS
Asa
sah
AKH
UW
AT
ORI
X
RCD
S
Sub
MFI
Operating expense (PKR 000)
507
,257
83,
908
85,
232
77,
334
23,
559
24,
145
272
,733
359
,280
71,
423
87,
299
97,
679
37,
027
83,
125
1,8
10,0
00
Personnel expense (PKR 000)
362
,939
43,
276
54,
329
38,
746
10,
604
13,
213
151
,740
242
,702
37,
485
33,
780
61,
595
15,
855
38,
019
1,1
04,2
82
Average gross loan portfolio (PKR 000)
2,
532,
203
328
,723
561
,797
200
,332
44,
712
67,
598
1,43
0,87
9
900
,030
257
,811
147
,471
501
,665
194
,203
298
,911
7,46
6,33
5
Average number of active borrowers
286
,443
32,
599
35,
065
13,
822
3,9
75
8,5
52
147
,437
68,
192
20,
178
13,
662
63,
085
16,
231
23,
951
733
,192
Average number of active loans
286
,443
32,
599
35,
065
13,
822
3,9
75
8,5
52
147
,437
68,
192
20,
178
13,
662
63,
085
16,
231
23,
951
733
,192
W
eigh
ted
Avg.
Adjusted operating expense-to-average gross loan portfolio 20
.0%
25.5
%
15.2
%
38.6
%
52.7
%
35.7
%
19.1
%
39.9
%
27.7
%
59.2
%
19.5
%
19.1
%
27.8
%
24.2
%
Adjusted personnel expense-to-average gross loan portfolio 14
.3%
13.2
%
9.7%
19.3
%
23.7
%
19.5
%
10.6
%
27.0
%
14.5
%
22.9
%
12.3
%
8.2%
12.7
%
14.8
%Average salary/gross domestic product per capita
1.8
1.5
2.3
2.1
3.2
0.8
1.5
2.0
1.6
2.2
1.0
1.0
0.1
1.8
Adjusted cost per borrower (PKR) 1,77
1
2,57
4
2,43
1
5,59
5
5,92
7
2,82
3
1,85
0
5,26
9
3,54
0
6,39
0
1,54
8
2,28
1
3,47
1
2,46
9
Adjusted cost per loan (PKR)
1,77
1
2,57
4
2,43
1
5,59
5
5,92
7
2,82
3
1,85
0
5,26
9
3,54
0
6,39
0
1,54
8
2,28
1
3,47
1
2,46
9
85PAKISTAN MICROFINANCE REVIEWAnnual Assessment of the Microfinance Industry
2012
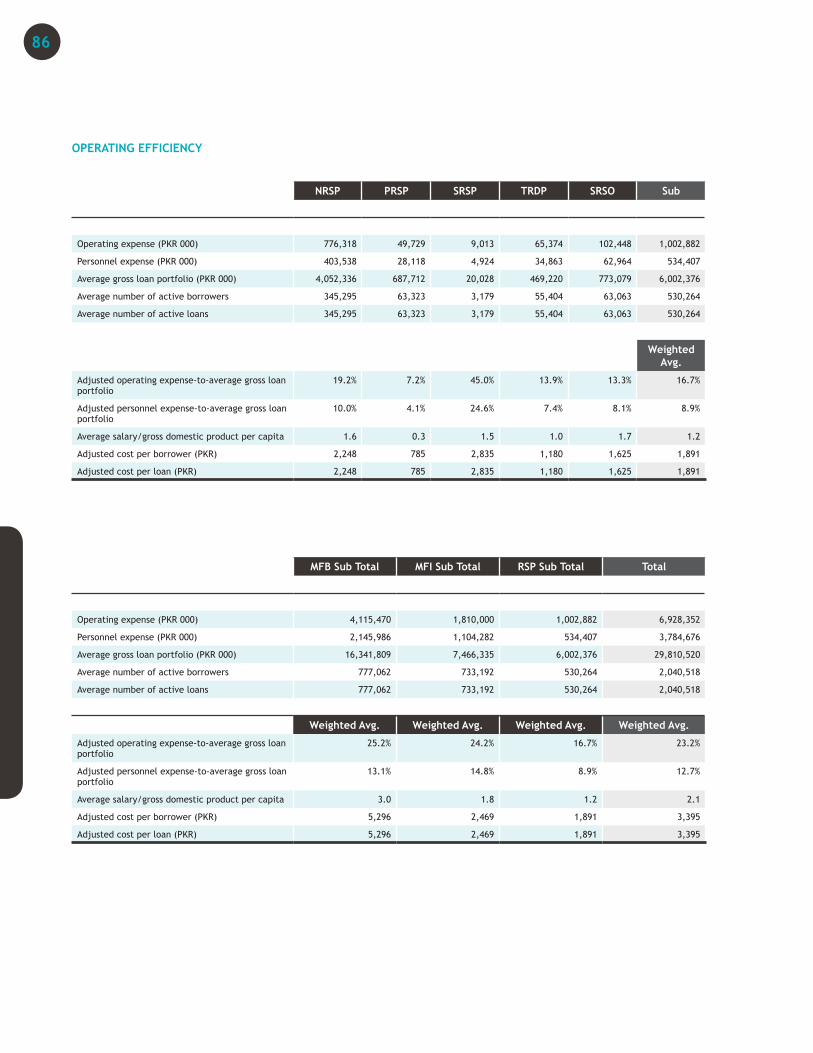
OPERATING EFFICIENCY
NRSP PRSP SRSP TRDP SRSO Sub
Operating expense (PKR 000) 776,318 49,729 9,013 65,374 102,448 1,002,882
Personnel expense (PKR 000) 403,538 28,118 4,924 34,863 62,964 534,407
Average gross loan portfolio (PKR 000) 4,052,336 687,712 20,028 469,220 773,079 6,002,376
Average number of active borrowers 345,295 63,323 3,179 55,404 63,063 530,264
Average number of active loans 345,295 63,323 3,179 55,404 63,063 530,264
Weighted Avg.
Adjusted operating expense-to-average gross loan portfolio
19.2% 7.2% 45.0% 13.9% 13.3% 16.7%
Adjusted personnel expense-to-average gross loan portfolio
10.0% 4.1% 24.6% 7.4% 8.1% 8.9%
Average salary/gross domestic product per capita 1.6 0.3 1.5 1.0 1.7 1.2
Adjusted cost per borrower (PKR) 2,248 785 2,835 1,180 1,625 1,891
Adjusted cost per loan (PKR) 2,248 785 2,835 1,180 1,625 1,891
MFB Sub Total MFI Sub Total RSP Sub Total Total
Operating expense (PKR 000) 4,115,470 1,810,000 1,002,882 6,928,352
Personnel expense (PKR 000) 2,145,986 1,104,282 534,407 3,784,676
Average gross loan portfolio (PKR 000) 16,341,809 7,466,335 6,002,376 29,810,520
Average number of active borrowers 777,062 733,192 530,264 2,040,518
Average number of active loans 777,062 733,192 530,264 2,040,518
Weighted Avg. Weighted Avg. Weighted Avg. Weighted Avg.
Adjusted operating expense-to-average gross loan portfolio
25.2% 24.2% 16.7% 23.2%
Adjusted personnel expense-to-average gross loan portfolio
13.1% 14.8% 8.9% 12.7%
Average salary/gross domestic product per capita 3.0 1.8 1.2 2.1
Adjusted cost per borrower (PKR) 5,296 2,469 1,891 3,395
Adjusted cost per loan (PKR) 5,296 2,469 1,891 3,395
86
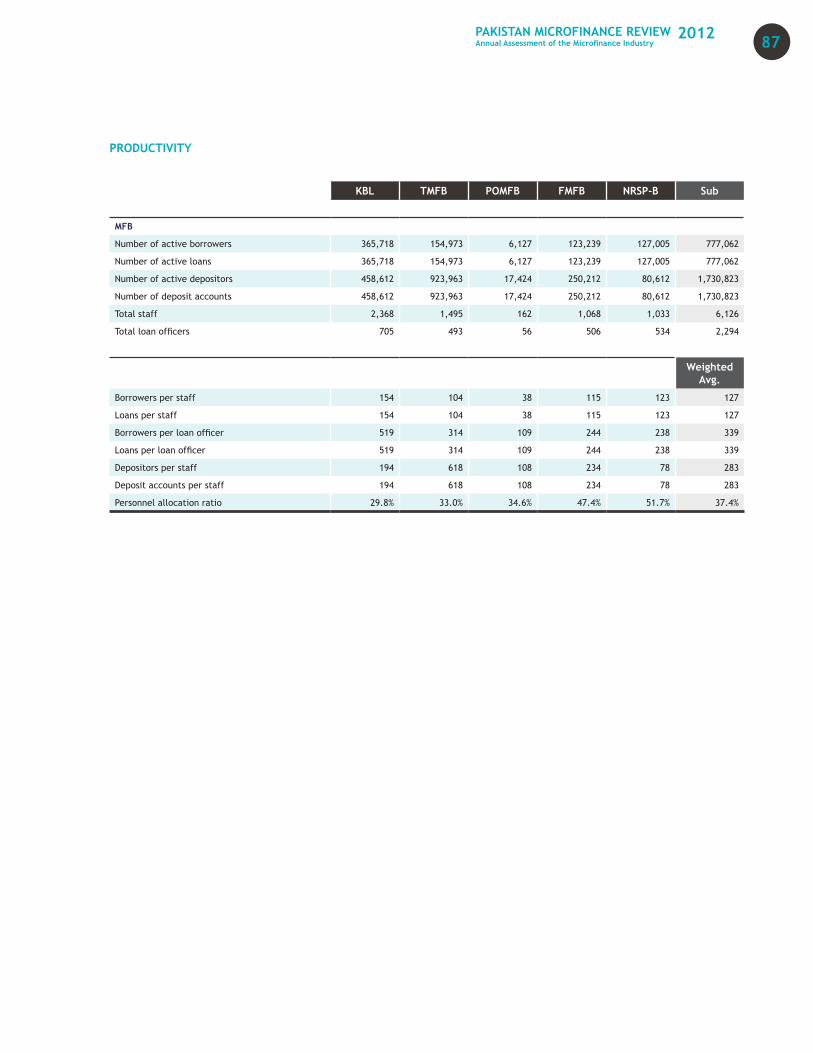
PRODUCTIVITY
KBL TMFB POMFB FMFB NRSP-B Sub
MFB
Number of active borrowers 365,718 154,973 6,127 123,239 127,005 777,062
Number of active loans 365,718 154,973 6,127 123,239 127,005 777,062
Number of active depositors 458,612 923,963 17,424 250,212 80,612 1,730,823
Number of deposit accounts 458,612 923,963 17,424 250,212 80,612 1,730,823
Total staff 2,368 1,495 162 1,068 1,033 6,126
Total loan officers 705 493 56 506 534 2,294
Weighted Avg.
Borrowers per staff 154 104 38 115 123 127
Loans per staff 154 104 38 115 123 127
Borrowers per loan officer 519 314 109 244 238 339
Loans per loan officer 519 314 109 244 238 339
Depositors per staff 194 618 108 234 78 283
Deposit accounts per staff 194 618 108 234 78 283
Personnel allocation ratio 29.8% 33.0% 34.6% 47.4% 51.7% 37.4%
87PAKISTAN MICROFINANCE REVIEWAnnual Assessment of the Microfinance Industry
2012
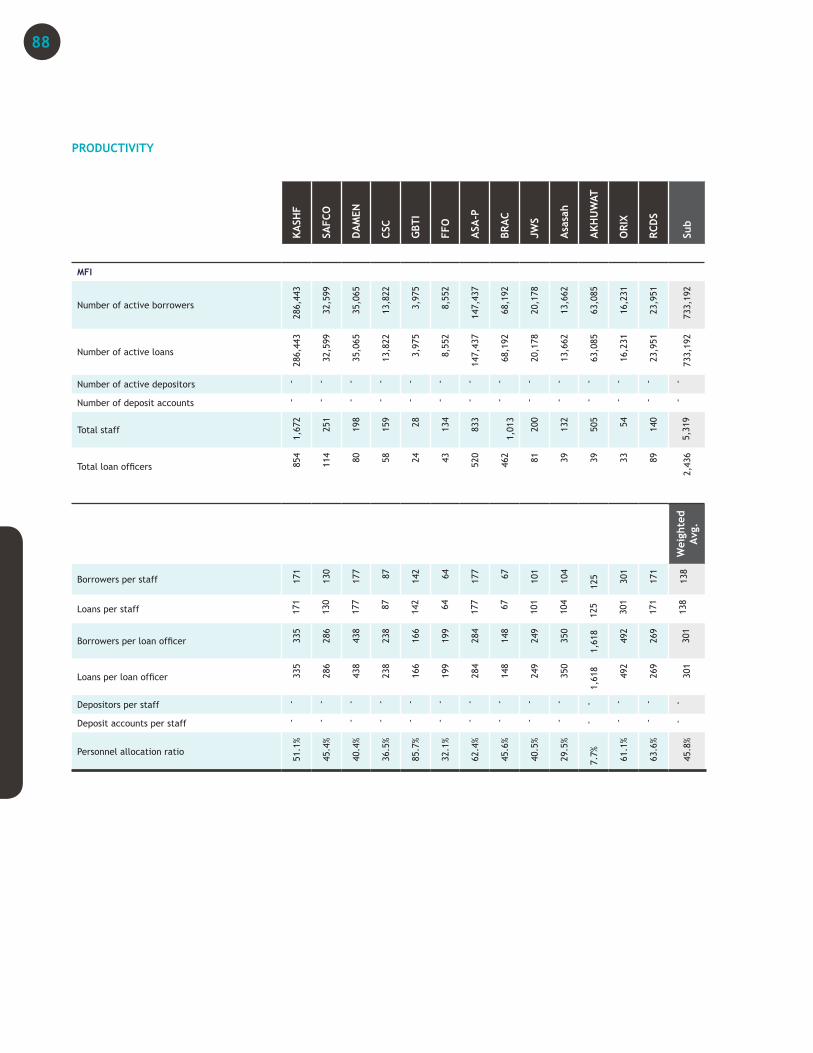
PRODUCTIVITY
KASH
F
SAFC
O
DA
MEN
CSC
GBT
I
FFO
ASA
-P
BRA
C
JWS
Asa
sah
AKH
UW
AT
ORI
X
RCD
S
Sub
MFI
Number of active borrowers 2
86,4
43
32,
599
35,
065
13,
822
3,9
75
8,5
52
147
,437
68,
192
20,
178
13,
662
63,
085
16,
231
23,
951
733,
192
Number of active loans
286,
443
32,
599
35,
065
13,
822
3,9
75
8,5
52
147
,437
68,
192
20,
178
13,
662
63,
085
16,
231
23,
951
733,
192
Number of active depositors -
-
-
-
-
-
-
-
-
-
-
-
-
-
Number of deposit accounts -
-
-
-
-
-
-
-
-
-
-
-
-
-
Total staff
1,67
2
251
198
159
28
134
833
1,
013
200
132
505
54
140
5,31
9
Total loan officers 854
114
80
58
24
43
520
462
81
39
39
33
89
2,43
6 W
eigh
ted
Avg.
Borrowers per staff 171
130
177 87 142 64 177 67 101
104
125 301
171
138
Loans per staff 171
130
177 87 142 64 177 67 101
104
125
301
171
138
Borrowers per loan officer 335
286
438
238
166
199
284
148
249
350
1,61
8
492
269
301
Loans per loan officer 335
286
438
238
166
199
284
148
249
350
1,61
8
492
269
301
Depositors per staff -
-
-
-
-
-
-
-
-
-
- -
-
-
Deposit accounts per staff -
-
-
-
-
-
-
-
-
-
- -
-
-
Personnel allocation ratio
51.1
%
45.4
%
40.4
%
36.5
%
85.7
%
32.1
%
62.4
%
45.6
%
40.5
%
29.5
%
7.7% 61.1
%
63.6
%
45.8
%
88
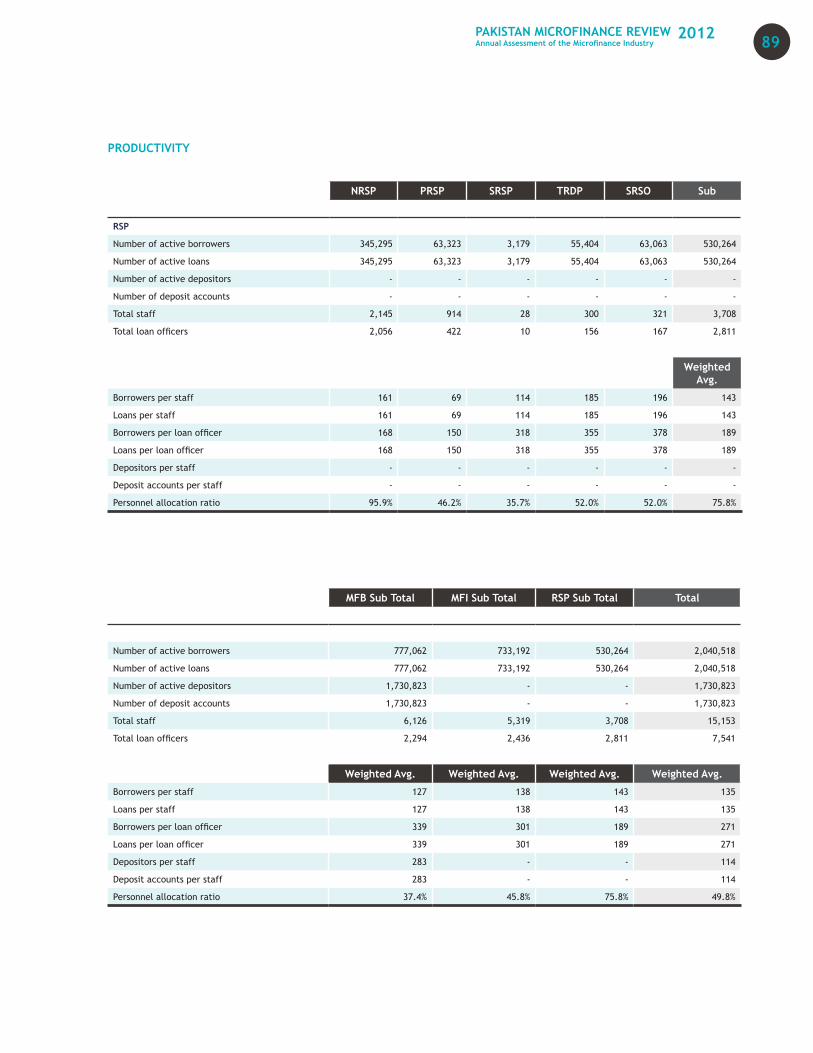
PRODUCTIVITY
NRSP PRSP SRSP TRDP SRSO Sub
RSP
Number of active borrowers 345,295 63,323 3,179 55,404 63,063 530,264
Number of active loans 345,295 63,323 3,179 55,404 63,063 530,264
Number of active depositors - - - - - -
Number of deposit accounts - - - - - -
Total staff 2,145 914 28 300 321 3,708
Total loan officers 2,056 422 10 156 167 2,811
Weighted Avg.
Borrowers per staff 161 69 114 185 196 143
Loans per staff 161 69 114 185 196 143
Borrowers per loan officer 168 150 318 355 378 189
Loans per loan officer 168 150 318 355 378 189
Depositors per staff - - - - - -
Deposit accounts per staff - - - - - -
Personnel allocation ratio 95.9% 46.2% 35.7% 52.0% 52.0% 75.8%
MFB Sub Total MFI Sub Total RSP Sub Total Total
Number of active borrowers 777,062 733,192 530,264 2,040,518
Number of active loans 777,062 733,192 530,264 2,040,518
Number of active depositors 1,730,823 - - 1,730,823
Number of deposit accounts 1,730,823 - - 1,730,823
Total staff 6,126 5,319 3,708 15,153
Total loan officers 2,294 2,436 2,811 7,541
Weighted Avg. Weighted Avg. Weighted Avg. Weighted Avg.
Borrowers per staff 127 138 143 135
Loans per staff 127 138 143 135
Borrowers per loan officer 339 301 189 271
Loans per loan officer 339 301 189 271
Depositors per staff 283 - - 114
Deposit accounts per staff 283 - - 114
Personnel allocation ratio 37.4% 45.8% 75.8% 49.8%
89PAKISTAN MICROFINANCE REVIEWAnnual Assessment of the Microfinance Industry
2012
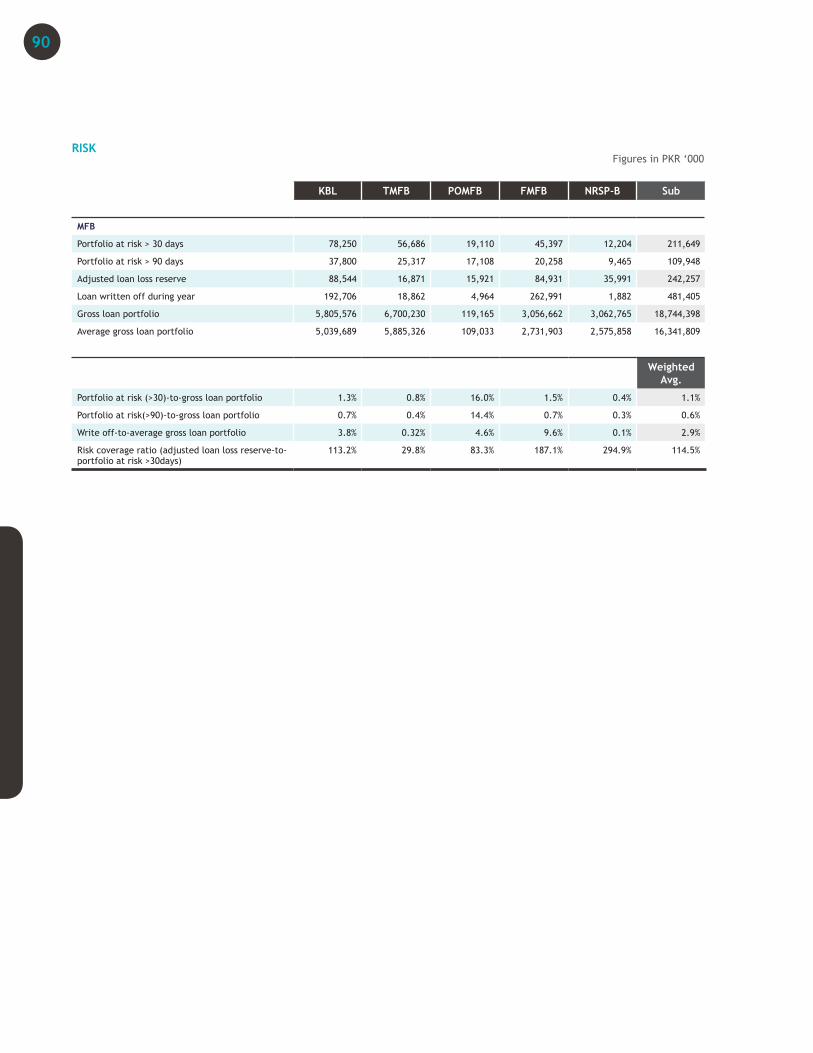
RISK
KBL TMFB POMFB FMFB NRSP-B Sub
MFB
Portfolio at risk > 30 days 78,250 56,686 19,110 45,397 12,204 211,649
Portfolio at risk > 90 days 37,800 25,317 17,108 20,258 9,465 109,948
Adjusted loan loss reserve 88,544 16,871 15,921 84,931 35,991 242,257
Loan written off during year 192,706 18,862 4,964 262,991 1,882 481,405
Gross loan portfolio 5,805,576 6,700,230 119,165 3,056,662 3,062,765 18,744,398
Average gross loan portfolio 5,039,689 5,885,326 109,033 2,731,903 2,575,858 16,341,809
Weighted Avg.
Portfolio at risk (>30)-to-gross loan portfolio 1.3% 0.8% 16.0% 1.5% 0.4% 1.1%
Portfolio at risk(>90)-to-gross loan portfolio 0.7% 0.4% 14.4% 0.7% 0.3% 0.6%
Write off-to-average gross loan portfolio 3.8% 0.32% 4.6% 9.6% 0.1% 2.9%
Risk coverage ratio (adjusted loan loss reserve-to-portfolio at risk >30days)
113.2% 29.8% 83.3% 187.1% 294.9% 114.5%
Figures in PKR ‘000
90

RISK
KASH
F
SAFC
O
DA
MEN
CSC
GBT
I
FFO
ASA
-P
BRA
C
JWS
Asa
sah
AKH
UW
AT
Ori
x
RCD
S
Sub
MFI
Portfolio at risk > 30 days
629,
841
70,
105
12,
333
995
-
478
51,
291
68,
132
534
2,2
22
2,1
27
26,
840
3,1
81
868,
080
Portfolio at risk > 90 days62
6,78
9
60,
437
7,4
78
366
-
194
38,
253
26,
714
387
2,0
82
-
2,1
65
2,5
31
767,
395
Adjusted loan loss reserve
53,
729
32,
612
19,
221
10,
151
52,
445
2,6
71
36,
963
33,
777
8,9
42
8,2
47
-
1,6
72
12,
734
273,
164
Loan written off during year
-
6,7
40
10,9
67
598
13
23
14,9
79
35,2
63
335
3,8
21
-
9,4
18
313
82,4
70
Gross loan portfolio
2,94
8,99
4
345
,010
664
,281
207
,964
89,
424
86,
927
1,50
1,81
0
820
,199
305
,451
129
,082
761
,494
190
,705
336
,300
8,38
7,64
0
Average gross loan portfolio
2,53
2,20
3
328
,723
561
,797
200
,332
44,
712
67,
598
1,43
0,87
9
900
,030
257
,811
147
,471
501
,665
194
,203
298
,911
7,46
6,33
5 W
eigh
ted
Avg.
Portfolio at risk (>30)-to-gross loan portfolio
21.4
%
20.3
%
1.9%
0.5%
0.0%
0.6%
3.4%
8.3%
0.2%
1.7%
0.3%
14.1
%
0.9%
10.3
%
Portfolio at risk(>90)-to-gross loan portfolio
21.3
%
17.5
%
1.1%
0.2%
0.0%
0.2%
2.5%
3.3%
0.1%
1.6%
0.0%
1.1%
0.8%
9.1%
Write off-to-average gross loan portfolio 0.0%
2.1%
2.0%
0.3%
0.0%
0.0%
1.0%
3.9%
0.1%
2.6%
0.0%
4.8%
0.1%
1.1%
Risk coverage ratio (adjusted loan loss reserve-to-portfolio at risk >30days)
8.5%
46.5
%
155.
9%
1020
.5%
0.0%
558.
3%
72.1
%
49.6
%
1673
.2%
371.
1%
0.0%
6.2%
400.
3%
31.5
%
Figures in PKR ‘000
91PAKISTAN MICROFINANCE REVIEWAnnual Assessment of the Microfinance Industry
2012
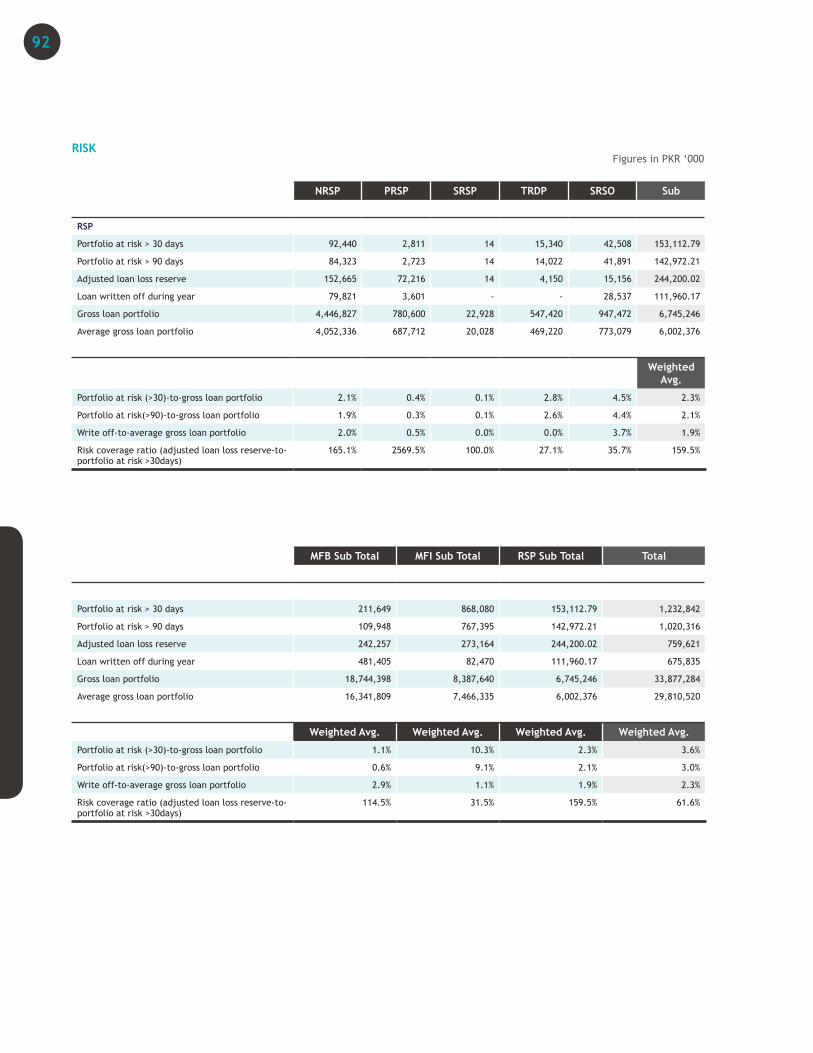
RISK
NRSP PRSP SRSP TRDP SRSO Sub
RSP
Portfolio at risk > 30 days 92,440 2,811 14 15,340 42,508 153,112.79
Portfolio at risk > 90 days 84,323 2,723 14 14,022 41,891 142,972.21
Adjusted loan loss reserve 152,665 72,216 14 4,150 15,156 244,200.02
Loan written off during year 79,821 3,601 - - 28,537 111,960.17
Gross loan portfolio 4,446,827 780,600 22,928 547,420 947,472 6,745,246
Average gross loan portfolio 4,052,336 687,712 20,028 469,220 773,079 6,002,376
Weighted Avg.
Portfolio at risk (>30)-to-gross loan portfolio 2.1% 0.4% 0.1% 2.8% 4.5% 2.3%
Portfolio at risk(>90)-to-gross loan portfolio 1.9% 0.3% 0.1% 2.6% 4.4% 2.1%
Write off-to-average gross loan portfolio 2.0% 0.5% 0.0% 0.0% 3.7% 1.9%
Risk coverage ratio (adjusted loan loss reserve-to-portfolio at risk >30days)
165.1% 2569.5% 100.0% 27.1% 35.7% 159.5%
MFB Sub Total MFI Sub Total RSP Sub Total Total
Portfolio at risk > 30 days 211,649 868,080 153,112.79 1,232,842
Portfolio at risk > 90 days 109,948 767,395 142,972.21 1,020,316
Adjusted loan loss reserve 242,257 273,164 244,200.02 759,621
Loan written off during year 481,405 82,470 111,960.17 675,835
Gross loan portfolio 18,744,398 8,387,640 6,745,246 33,877,284
Average gross loan portfolio 16,341,809 7,466,335 6,002,376 29,810,520
Weighted Avg. Weighted Avg. Weighted Avg. Weighted Avg.
Portfolio at risk (>30)-to-gross loan portfolio 1.1% 10.3% 2.3% 3.6%
Portfolio at risk(>90)-to-gross loan portfolio 0.6% 9.1% 2.1% 3.0%
Write off-to-average gross loan portfolio 2.9% 1.1% 1.9% 2.3%
Risk coverage ratio (adjusted loan loss reserve-to-portfolio at risk >30days)
114.5% 31.5% 159.5% 61.6%
Figures in PKR ‘000
92

93PAKISTAN MICROFINANCE REVIEWAnnual Assessment of the Microfinance Industry
2012
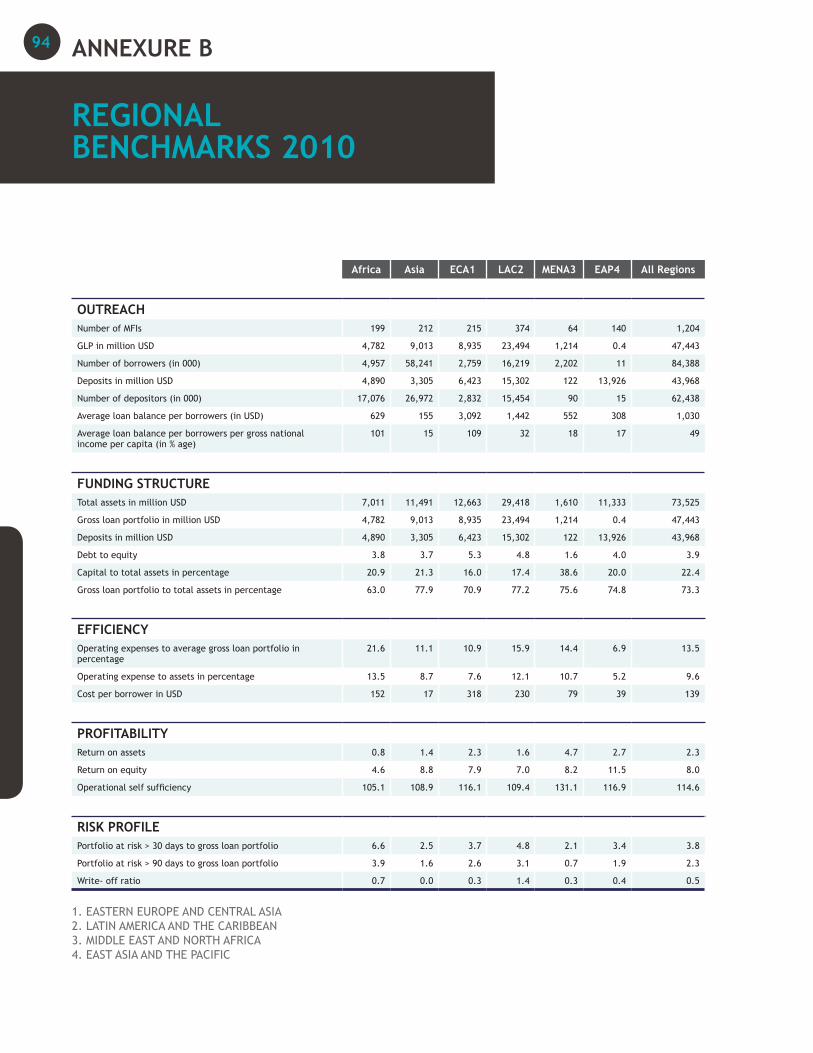
Africa Asia ECA1 LAC2 MENA3 EAP4 All Regions
OUTREACHNumber of MFIs 199 212 215 374 64 140 1,204
GLP in million USD 4,782 9,013 8,935 23,494 1,214 0.4 47,443
Number of borrowers (in 000) 4,957 58,241 2,759 16,219 2,202 11 84,388
Deposits in million USD 4,890 3,305 6,423 15,302 122 13,926 43,968
Number of depositors (in 000) 17,076 26,972 2,832 15,454 90 15 62,438
Average loan balance per borrowers (in USD) 629 155 3,092 1,442 552 308 1,030
Average loan balance per borrowers per gross national income per capita (in % age)
101 15 109 32 18 17 49
FUNDING STRUCTURETotal assets in million USD 7,011 11,491 12,663 29,418 1,610 11,333 73,525
Gross loan portfolio in million USD 4,782 9,013 8,935 23,494 1,214 0.4 47,443
Deposits in million USD 4,890 3,305 6,423 15,302 122 13,926 43,968
Debt to equity 3.8 3.7 5.3 4.8 1.6 4.0 3.9
Capital to total assets in percentage 20.9 21.3 16.0 17.4 38.6 20.0 22.4
Gross loan portfolio to total assets in percentage 63.0 77.9 70.9 77.2 75.6 74.8 73.3
EFFICIENCYOperating expenses to average gross loan portfolio in percentage
21.6 11.1 10.9 15.9 14.4 6.9 13.5
Operating expense to assets in percentage 13.5 8.7 7.6 12.1 10.7 5.2 9.6
Cost per borrower in USD 152 17 318 230 79 39 139
PROFITABILITYReturn on assets 0.8 1.4 2.3 1.6 4.7 2.7 2.3
Return on equity 4.6 8.8 7.9 7.0 8.2 11.5 8.0
Operational self sufficiency 105.1 108.9 116.1 109.4 131.1 116.9 114.6
RISK PROFILEPortfolio at risk > 30 days to gross loan portfolio 6.6 2.5 3.7 4.8 2.1 3.4 3.8
Portfolio at risk > 90 days to gross loan portfolio 3.9 1.6 2.6 3.1 0.7 1.9 2.3
Write- off ratio 0.7 0.0 0.3 1.4 0.3 0.4 0.5
1. EASTERN EUROPE AND CENTRAL ASIA 2. LATIN AMERICA AND THE CARIBBEAN 3. MIDDLE EAST AND NORTH AFRICA 4. EAST ASIA AND THE PACIFIC
ANNEXURE B
REGIONAL BENCHMARKS 2010
94

95PAKISTAN MICROFINANCE REVIEWAnnual Assessment of the Microfinance Industry
2012
MICROFINANCE BANKS (MFBS)
Khushhali Bank Ltd. (KBL)
�� KBL provided PMN with its audited accounts. The numbers reported in the PMR match these reports. A.F. Ferguson audited the annual accounts of KBL for the year ending at 31st December 2012.
�� The financial statements have been presented as per the requirements of the State Bank of Pakistan.
�� All necessary adjustments to the KBL data have been made in order to remove subsidies. Adjustments were not made for loan loss provisioning expense, since KBL is aggressive in its policies, as required by the SBP.
�� KBL prepares its accounts on historical cost basis using the accrual system of accounting.
�� The related party transactions have been properly disclosed in notes to the financial statements.
�� The grant income has been properly disclosed in financial statements as well as there is a proper disclosure on grants in notes to the financial statements.
�� The following numbers have been taken from KBL’s MIS: i). rural-urban clients; ii). male-female clients; iii). Portfolio aging; iv). Number of staff; v). Number of credit officers; and vi). Number of branches (also available in audited accounts).
�� As per the CGAP requirements, portfolio quality, sustainability/profitability and asset/liability management ratios should be presented to represent the true and fair picture to stakeholders.
Pak Oman Microfinance Bank Ltd. (POMFB)
�� POMFB reported its audited accounts in newspapers, from whence the accounts were obtained. The numbers reported in the PMR match these reports. M. Yossuf Adil Saleem and Co. audited the annual accounts of POMFB for the year ending at 31st December 2012.
�� The financial statements have been presented as per the requirements of the State Bank of Pakistan.
�� All necessary adjustments to the POMFB data have been made in order to remove subsidies. No adjustments were made to financial cost since POMFB was not using any concessional or commercial borrowing during the reported period. POMFB is aggressive in its policies, as required by the SBP.
�� POMFB prepares accounts on historical cost basis using the accrual system of accounting.
�� The related party transactions have been properly disclosed in notes to the financial statements.
�� The grant income has been properly disclosed in financial statements as well as there is a proper disclosure on grants in notes to the financial statements.
�� The following numbers have been taken from POMFB’s MIS: i). rural-urban clients; ii). male-female clients; iii). Portfolio Aging and Write-Offs (verified from audited accounts); iv). Number of staff; v). Number of credit officers; and vi). Number of branches (also available in audited accounts).
�� As per the CGAP requirements portfolio quality, sustainability/profitability and asset/liability management ratios should be presented to represent the true and fair picture to stakeholders.
ANNEXURE C
SOURCES OF DATA 2012
96
Tameer Microfinance Bank Ltd. (TMFB)
�� TMFB provided PMN with its audited accounts. The numbers reported in the PMR match these reports. Ernst and Young Ford Rhodes Sidat Hyder and Co., audited the annual accounts of TMFB for the year ending at 31st December 2012.
�� The financial statements have been presented as per the requirements of the State Bank of Pakistan.
�� All necessary adjustments to TMFB data have been made in order to remove subsidies. Adjustment for cost of borrowing was not made since it was entirely commercial borrowing. TMFB prepares accounts on historical cost basis using the accrual system of accounting.
�� The related party transactions have been properly disclosed in notes to the financial statements.
�� The grant income has been properly disclosed in financial statements as well as there is a proper disclosure on grants in notes to the financial statements.
�� The following numbers have been taken from TMFB’s MIS: i). rural-urban clients; ii). male-female clients; iii). Number of staff; iv). Number of credit officers; and v). Number of branches (also available in audited accounts).
�� As per the CGAP requirements, portfolio quality, sustainability/profitability and asset/liability management ratios should be presented to represent the true and fair picture to stakeholders.
The First Microfinance Bank Ltd. (FMFBL)
�� FMFB provided PMN with its audited accounts. The numbers reported in the PMR match these reports. KPMG audited the annual accounts of FMFBL for the year ending at 31st December 2012.
�� The financial statements have been presented as per the requirements of the State Bank of Pakistan.
�� All necessary adjustments to FMFBL data have been made in order to remove subsidies. Adjustments were not made for loan loss provisioning expense, since FMFBL is aggressive in its policies, as required by the SBP.
�� FMFBL prepares accounts on historical cost basis using the accrual system of accounting.
�� The related party transactions have been properly disclosed in notes to the financial statements.
�� The grant income has been properly disclosed in financial statements and there is proper disclosure on grants in notes to the financial statements.
�� There is a proper disclosure regarding the loan portfolio and write-offs.
�� The following numbers have been taken from FMFB’s MIS: i). rural-urban clients; ii). male-female clients; iii). Portfolio Aging and Write-offs (verified from audited accounts); iv). Number of staff; v). Number of credit officers; and vi). Number of branches (also available in audited accounts).
�� As per the CGAP requirements, portfolio quality, sustainability/profitability and asset/liability management ratios should be presented to represent the true and fair picture to stake holders.
National Rural Support Programme Microfinance Bank. (NRSP-B)
�� NRSP-B provided PMN with its audited accounts. The numbers reported in the PMR match these reports. M. Yossuf Adil Saleem and Co. audited the annual accounts of NRSP-B for the year ending at 31st December 2012.
�� The financial statements have been presented as per the requirements of the State Bank of Pakistan.
�� All necessary adjustments to NRSP-B data have been made in order to remove subsidies. Adjustments were not made for loan loss provisioning expense, since NRSP-B
97PAKISTAN MICROFINANCE REVIEWAnnual Assessment of the Microfinance Industry
2012
is aggressive in its policies as required by the SBP. Adjustment for cost of borrowing was not made since it was entirely commercial borrowing. NRSP-B prepares accounts on historical cost basis using the accrual system of accounting.
�� The related party transactions have been properly disclosed in notes to the financial statements.
�� The grant income has been properly disclosed in financial statements as well as there is a proper disclosure on grants in notes to the financial statements.
�� The following numbers have been taken from NRSP-B’s MIS: i). rural-urban clients; ii). male-female clients; iii). Number of staff; iv). Number of credit officers; and v). Number of branches (also available in audited accounts).
�� As per the CGAP requirements, portfolio quality, sustainability/profitability and asset/liability management ratios should be presented to represent the true and fair picture to stakeholders.
MICROFINANCE INSTITUTION (MFI)
ASA Pakistan limited
�� ASA provided PMN with its audited accounts. The numbers reported in the PMR match these reports. KPMG has audited the annual accounts of ASA-P for the year ending at 31st December 2012.
�� ASA prepares its financial statements under the historical cost convention and in conformity with accepted accounting practices.
�� Adjustments were not made to loan loss provisioning expense as ASA is aggressive in
its policies.
�� The following numbers have been taken from the organization’s MIS: i). rural-urban clients; and ii). male-female clients;
�� There is proper disclosure on the balance sheet of loan portfolio, and loan loss provision; expense charged during the year is disclosed on the income statement.
�� The related party transactions have been properly disclosed in notes to the financial statements.
�� The grant income should be properly presented in financial statements as well as there should be disclosure on grants in notes to the financial statements.
�� As per the CGAP requirements, portfolio quality, sustainability/profitability and asset/liability management ratios should be presented to represent the true and fair picture to stakeholders.
ASASAH
�� Asasah provided PMN with its audited accounts. The numbers reported in the PMR match these reports. Grant Thornton has audited the annual accounts of Asasah for the year ending at 30th June 2012.
�� Asasah prepares its financial statements under the historical cost convention, in conformity with accepted accounting practices.
�� There is proper disclosure on the movement in portfolio, loan loss provisioning, and write-offs.
�� The related party transactions have been properly disclosed in notes to the financial statements.
�� The grant income has been properly disclosed in financial statements. Additionally, there is proper disclosure on grants in notes to the financial statements.
�� As per the CGAP requirements, portfolio quality, sustainability/profitability and
98
asset/liability management ratios should be presented to represent the true and fair picture to stakeholders.
BRAC-Pakistan
�� BRAC-Pakistan provided PMN with its audited accounts. The numbers reported in the PMR match these reports. KPMG (Taseer Hadi and Co) has audited the annual accounts of BRAC-Pakistan for the year ending at 31st December 2012.
�� BRAC prepares its financial statements under the historical cost convention and in conformity with accepted accounting policies.
�� BRAC is an integrated program and, therefore, prepares separate financial accounts for all its programs. The audit is done and a consolidated audit report is prepared with clear differentiations of both revenue and costs for each program in light of accounting standards.
Community Support Concern (CSC)
�� CSC provided PMN with its audited accounts. The numbers reported in the PMR match these reports. Riaz Ahmad & Co. audited the annual accounts of CSC for the year ending at 30th June 2012.
�� All necessary adjustments to CSC data have been made in order to remove subsidies. No adjustment was made to loan loss provisioning expense as CSC is aggressive in its policies.
�� CSC prepares its financial statements under the historical cost convention and in conformity with accepted accounting practices.
�� The following numbers have been taken from the organization’s MIS: i). rural-urban clients; ii). male-female clients; iii). Aging on number of loans and value of portfolio (not verifiable from audited accounts); iv). Number of staff; v). Number of credit officers; and vi). Number of offices.
�� There is proper disclosure on the balance sheet of loan portfolio, and loan loss provision; expense charged during the year is disclosed on the income statement.
�� The grant income has been properly disclosed in financial statements and there is proper disclosure on grants in notes to the financial statements.
�� The related party transactions should be presented in notes to the financial statements.
�� As per the CGAP requirements portfolio quality, sustainability/profitability and asset/liability management ratios should be presented to represent the true and fair picture to stakeholders.
Farmers Friend Organization (FFO)
�� FFO provided PMN with its audited accounts. The numbers reported in the PMR match these reports. Maqbool Haroon Shahid Safdar & Co audited the annual accounts for FFO for the year ending at 30th June 2012.
�� All necessary adjustments to FFO data have been made in order to remove subsidies. There is no adjustment on loan loss provisioning expense as FFO is aggressive in its policies.
�� FFO prepares its financial statements under the historical cost convention and in conformity with accepted accounting practices.
�� The following numbers have been taken from the organization’s MIS: i). rural-urban clients; ii). male-female clients; iii). Aging on number of loans and value of portfolio (not verifiable from audited accounts); iv). Number of staff; v). Number of credit officers; and vi). Number of offices.
�� There is proper disclosure on the balance sheet of loan portfolio, and loan loss provision; expense charged during the year is disclosed on the income statement.
�� The grant income has been properly
99PAKISTAN MICROFINANCE REVIEWAnnual Assessment of the Microfinance Industry
2012
disclosed in financial statements. Additionally, there is proper disclosure on grants in notes to the financial statements.
�� The related party transactions should be presented in notes to the financial statements.
�� As per the CGAP requirements portfolio quality, sustainability/profitability and asset/liability management ratios should be presented to represent the true and fair picture to stakeholders.
Development Action for Mobilization and Emancipation (DAMEN)
�� DAMEN provided PMN with its audited accounts. The numbers reported in the PMR match these reports. Ernst & Young Ford Rhodes Sidat Hyder and Co., audited the annual accounts for DAMEN for the year ending at 31st December 2012.
�� As DAMEN is a multi-dimensional development organization accounts for its microfinance function are kept separate.
�� All necessary adjustments to DAMEN data have been made in order to remove subsidies. There is no adjustment on cost of borrowing since DAMEN’s actual cost is higher than the adjusted cost. Similarly, no adjustment was made to loan loss provisioning expense; DAMEN is aggressive in its policies.
�� DAMEN prepares its financial statements under the historical cost convention and in conformity with accepted accounting practices.
�� The grant income has been properly disclosed in financial statements. Additionally, there is proper disclosure on grants in notes to the financial statements.
�� The following numbers have been taken from the organization’s MIS: i). rural-urban clients; ii). male-female clients; iii). Aging on number of loans and value of portfolio (verifiable from audited accounts); iv). Breakup for the number of loans doubtful;
v). Number of staff; vi). Number of credit officers
�� DAMEN has proper disclosure in terms of movement in portfolio, loan loss provisioning and write-offs.
�� The related party transactions should be presented in the notes to the financial statements.
�� As per the CGAP requirements, portfolio quality, sustainability/profitability and asset/liability management ratios should be presented to represent the true and fair picture to stakeholders.
Kashf Foundation (KF)
�� KF provided PMN with its audited accounts. The numbers reported in the PMR match these reports. KPMG (Taseer Hadi and Co) audited the annual accounts for KF for the year ending at 30th June 2012.
�� The financial statements have been presented as per the requirements of the State Bank of Pakistan.
�� All necessary adjustments to KF data have been made in order to remove subsidies. Adjustments were not made for loan loss provisioning expense, since KF is aggressive in its policies as required by the SBP. Adjustment for cost of borrowing was not made since it was entirely commercial borrowing. KF prepares accounts on historical cost basis using the accrual system of accounting.
�� The related party transactions have been properly disclosed in notes to the financial statements.
�� The grant income has been properly disclosed in financial statements as well as there is a proper disclosure on grants in notes to the financial statements.
�� The following numbers have been taken from NRSP-B’s MIS: i). rural-urban clients; ii). male-female clients; iii). Number of staff; iv). Number of credit officers; and
100
v). Number of branches (also available in audited accounts).
�� As per the CGAP requirements, portfolio quality, sustainability/profitability and asset/liability management ratios should be presented to represent the true and fair picture to stakeholders.
Ghazi Barotha Taraqiati Idara (GBTI)
�� GBTI provided PMN with its audited accounts. The numbers reported in the PMR match these reports. KPMG (Taseer Hadi and Co) audited the annual accounts for GBTI for the year ending at 30th June 2012.
�� GBTI prepares its financial statements under the historical cost convention and in conformity with accepted accounting practices. Revenue is recognized on receipt basis.
�� GBTI prepares its financial statements under the historical cost convention and in conformity with accepted accounting practices.
�� The following numbers have been taken from the organization’s MIS: i). rural-urban clients; ii). male-female clients; iii). Aging on number of loans and value of portfolio (not verifiable from audited accounts); iv). Number of staff; v). Number of credit officers; and vi). Number of offices.
�� There is proper disclosure on the balance sheet of loan portfolio, and loan loss provision; expense charged during the year is disclosed on the income statement.
�� The grant income has been properly disclosed in financial statements. Additionally, there is proper disclosure on grants in notes to the financial statements.
�� The related party transactions should be presented in notes to the financial statements.
�� As per the CGAP requirements portfolio quality, sustainability/profitability and asset/liability management ratios should
be presented to represent the true and fair picture to stakeholders.
Rural Community Development Society (RCDS)
�� RCDS provided PMN with its audited accounts. The numbers reported in the PMR match these reports. Ijaz Tabassum & Co. audited the annual accounts for RCDS for the year ending at 30th June 2012.
�� RCDS prepares its financial statements under the historical cost convention and in conformity with accepted accounting practices. Revenue is recognized on receipt basis.
�� The following numbers have been taken from the organization’s MIS: i). rural-urban clients; ii). male-female clients; iii). Aging on number of loans and value of portfolio (verified from audited accounts); iv). Number of staff; v). Number of credit officers; and vi). Number of branches (also available in audited accounts).
�� There should be proper disclosure on movement in portfolio, loan loss provisioning, and write-offs.
�� The related party transactions have been properly disclosed in notes to financial statements.
�� As per the CGAP requirements, portfolio quality, sustainability/profitability and asset/liability management ratios should be presented to represent the true and fair picture to stakeholders.
SAFCO Support Fund (SAFCO)
�� SAFCO provided PMN with its audited accounts. The numbers reported in the PMR match these reports. Grant Thornton (Anjum Asim Shahid Rehman) audited the annual accounts for SAFCO for the year ending at 30th June 2012.
�� Income and expense are booked on an accrual basis.
101PAKISTAN MICROFINANCE REVIEWAnnual Assessment of the Microfinance Industry
2012
�� All necessary adjustments to SAFCO data have been made in order to remove subsidies.
�� SAFCO prepares its financial statements under the historical cost convention and in conformity with accepted accounting practices using the principles of fund accounting.
�� The following numbers have been taken from the organization’s MIS: i). rural-urban clients; ii). male-female clients; iii). Aging on number of loans and value of portfolio (not verifiable from audited accounts); iv). Number of staff; and v). Number of credit officers.
�� There is proper disclosure on movement in portfolio, loan loss provisioning, and write-offs. Figures on loan loss provisioning, OLP, and loan loss reserve are disclosed in the financial statements.
�� The grant income has been properly disclosed in financial statements. Additionally, there is proper disclosure on grants in notes to the financial statements.
�� The related party transactions have been properly disclosed in notes to the financial statements.
�� As per the CGAP requirements, portfolio quality, sustainability/profitability and asset/liability management ratios should be presented to represent the true and fair picture to stakeholders.
Jinnah Welfare Society (JWS)
�� JWS provided PMN with its audited accounts. The numbers reported in the PMR match these reports. Ijaz Tabassum & Co. audited the annual accounts for JWS for the year ending at 30th June 2012.
�� JWS prepares its financial statements under the historical cost convention and in conformity with accepted accounting practices. Revenue is recognized on receipt basis.
�� The following numbers have been taken from the organization’s MIS: i). rural-urban clients; ii). male-female clients; iii). Aging on number of loans and value of portfolio (verified from audited accounts); iv). Number of staff; v). Number of credit officers; and vi). Number of branches (also available in audited accounts).
�� There should be a proper disclosure on the movement in portfolio, loan loss provisioning, and write-offs.
�� The related party transactions have been properly disclosed in notes to financial statements.
�� As per the CGAP requirements, portfolio quality, sustainability/profitability and asset/liability management ratios should be presented to represent the true and fair picture to stake holders.
Orix Leasing Pakistan Ltd. (OLP)
�� OLP has provided its audited accounts for the reporting period to PMN.
�� However, given that OLP’s audited accounts do not disclose figures related to its Microfinance Division (MFD), the data reported in the PMR is not verifiable with audited accounts.
�� OLP has separate staff and offices for microfinance. OLP’s MFD has provided data specific to its microfinance operations.
�� OLP prepares its financial statements under the historical cost convention in using accrual system of accounting.
�� Adjustments to the data have been made as per the PMN’s adjustment policies. These adjustments are in line with international practices being followed by The MIX.
102
RURAL SUPPORT PROGRAMME (RSP)
National Rural Support Programme (NRSP)
�� NRSP has provided its audited accounts for the reporting period to PMN and the figures tally with the reported data. Ernst & Young Ford Rhodes Sidat Hyder and Co., audited the annual accounts for NRSP for the year ending at 30th June 2012.
�� NRSP has prepared separate financial statements for its microfinance operations for the first time.
�� All necessary adjustments to NRSP data have been made in order to remove subsidies. Adjustment for cost of borrowing was not made since it was entirely commercial borrowing. Similarly, there is no adjustment on loan loss provisioning expense, since NRSP is aggressive in its policies and all loans > 90 days past due are 100% provisioned for.
�� NRSP prepares its financial statements under the historical cost convention, in conformity with accepted accounting practices.
�� Data on distribution of clients in terms of the urban-rural mix is not provided in the disclosures. However, given that NRSP has a separate program for urban areas and rural areas and their information is available separately, the disaggregation can be made quite accurately. The data on gender segregation was taken from the MIS and is not available in notes to the accounts.
�� The ageing of portfolio in rupee value is not verifiable from audited accounts. Both ageing on the number of loans and value of portfolio was obtained from the MIS. There is proper disclosure on the movement in portfolio and write-offs. It will be valuable if NRSP could provide separate disclosure on movement in provisioning of portfolio.
�� Data on the number of total staff, loan officers and branches has been drawn from audited accounts.
�� The related party transactions have been properly disclosed in notes to financial statements.
�� As per the CGAP requirements, portfolio quality, sustainability/profitability and asset/liability management ratios are presented in the notes to financial statements.
Punjab Rural Support Programme (PRSP)
�� PRSP has provided its audited accounts for the reporting period to PMN. Ernst & Young Ford Rhodes Sidat Hyder and Co., audited the annual accounts for PRSP for the year ending at 30th June 2012.
�� Since PRSP is an integrated programme, the following resource allocation process was followed: a. The identified accounts for credit and non-credit functions were directly transferred to the respective programs. b. All other accounts that were common to the institution were transferred in the ratio of 60% to credit and 40% to non-credit functions. c. 60% of PRSP’s investment income was credited to its credit operations
�� All necessary adjustments to PRSP data have been made in order to remove subsidies. This also includes writing off all the GLP 360 days past due.
�� PRSP prepares its financial statements under the historical cost convention, in conformity with accepted accounting practices.
�� Data on distribution of clients in terms of the urban-rural mix is not provided in the disclosures. However, given that PRSP only works in rural Punjab the information can be accurately deduced. The data on gender segregation was taken from the MIS and is not available in notes to the accounts.
�� The ageing of portfolio in rupee value is not verifiable from audited accounts. Both ageing on the number of loans and value of portfolio was obtained from the MIS. There is proper disclosure on movement in
103PAKISTAN MICROFINANCE REVIEWAnnual Assessment of the Microfinance Industry
2012
portfolio, loan loss provisioning and write-offs.
�� Data on number of staff for PRSP as a whole is available. These numbers have been allocated between credit and non-credit functions of PRSP on the basis mentioned above. Data for credit officers has been obtained from the organization’s MIS.
�� The grant income has been properly disclosed in financial statements as well as there is a proper disclosure on grants in notes to the financial statements.
�� The related party transactions have been properly disclosed in notes to financial statements.
�� As per the CGAP requirements, portfolio quality, sustainability / profitability and asset/liability management ratios should be presented to represent the true and fair picture to stakeholders.
Sarhad Rural Support Programme (SRSP)
�� SRSP has provided its audited accounts for the reporting period to PMN. KPMG (Taseer Hadi and Co) audited the annual accounts for SRSP for the year ending at 30th June 2012.
�� SRSP is a multi-dimensional development organization. It has provided its integrated audited accounts for the reporting period to PMN and has also extracted accounts for its microfinance operations from the consolidated audited statements.
�� All necessary adjustments to SRSP data have been made in order to remove subsidies. There is no adjustment on loan loss provisioning expense, since SRSP is aggressive in its policies and all loans > 90 days past due are 100% provisioned for.
�� SRSP prepares its financial statements under the historical cost convention in conformity with accepted accounting practices.
�� The ageing of portfolio in rupee value is not verifiable from audited accounts. Both ageing on number of loans and value of portfolio was obtained from the MIS. However, there is proper disclosure on the movement in portfolio and write-offs. It will be valuable if SRSP could provide separate disclosure on movement in provisioning of portfolio as suggested previously.
�� Data on the number of total staff, loan officers and branches has been drawn from audited accounts.
Thardeep Rural Development Programme (TRDP)
�� TRDP has provided its audited accounts for the microfinance program (inclusive of credit and non-credit functions). Grant Thornton (Anjum Asim Shahid Rehman) audited the annual accounts for TRDP for the year ending at 30th June 2012.
�� All necessary adjustments to TRDP data have been made in order to remove subsidies.
�� TRDP prepares its financial statements under the historical cost convention in conformity with accepted accounting practices.
�� The following numbers have been taken from the organization’s MIS: i). rural-urban clients; ii). male-female clients; iii). Number of staff; and iv). Number of credit officers.
�� The ageing of portfolio (in rupee value and number of loans) is taken from audited accounts..
Sindh Rural Support Organization (SRSO)
�� SRSO has provided its audited accounts for the microfinance program (inclusive of credit and non-credit functions). Ernst & Young Ford Rhodes Sidat Hyder and Co., audited the annual accounts for SRSO for the year ending at 30th June 2012.
�� All necessary adjustments to SRSO data have been made in order to remove subsidies.
�� SRSO prepares its financial statements under
104

the historical cost convention in conformity with accepted accounting practices.
�� The following numbers have been taken from the organization’s MIS: i). rural-urban clients; ii). male-female clients; iii). Number of staff; and iv). Number of credit officers.
�� The ageing of portfolio (in rupee value and number of loans) is taken from audited accounts.
105PAKISTAN MICROFINANCE REVIEWAnnual Assessment of the Microfinance Industry
2012
A. Inflation adjustmentInflation adjustment adjusts for the effect of inflation on an MFP’s equity and non-monetary assets i.e., fixed assets. Inflation decreases the real value of an MFP’s equity. Fixed assets are capable of tracking the increase in price levels; their monetary value is increased. The net loss (or gain) is considered to be a cost of funds, and results in a decrease (or increase) in net operating income.
CALCULATION OF INFLATION ADJUSTMENT
Inflation adjustment revenue
Multiply the prior year’s Net Fixed Assets by the current year’s average annual inflation rate (Average Core CPI for current financial year)
Formula:
NET FIXED ASSETS (PRIOR YEAR) X AVERAGE ANNUAL INFLATION RATE (CURRENT FINANCIAL YEAR)
Inflation adjustment expense
Multiply the prior year’s Equity by the current year’s average annual inflation rate, (Average Core CPI for current year)
Formula:
EQUITY (PRIOR YEAR) X AVERAGE ANNUAL INFLATION RATE (CURRENT YEAR)
Net inflation adjustment expense
Subtract the Inflation Adjustment Revenue from the Inflation Adjustment Expense
Formula:
INFLATION ADJUSTED REVENUE – INFLATION ADJUSTED EXPENSE
B. Subsidies adjustmentAdjustments for three types of subsidies are made:
�� A cost-of-funds subsidy from loans at below-market rates
�� Current year cash donations to fund portfolio and cover expenses
�� In-kind subsidies, such as rent-free office space or the services of personnel not paid by the MFP and thus not reflected on its income statement.
Additionally, for multipurpose MFPs, an attempt to isolate the performance of the financial services program is made by removing the effect of any cross-subsidization. Cash donations flowing through the income statement are accounted for by reclassifying them below net operating income on the income statement. Thus, adjustments for cash donations are not made since these are handled through a direct reclassification on the income statement. This year no MFP has disclosed receipt of in-kind subsidy.
B.1 COST-OF-FUNDS SUBSIDY
The cost-of-funds adjustment reflects the impact of soft loans on the financial performance of an MFP. The analyst needs to calculate the difference between what an MFP actually paid in interest on its subsidized liabilities and a shadow market rate for each country. This difference represents the value of the subsidy, considered an additional financial expense. Only funds received as loans need to be adjusted. Client deposits are not adjusted. Only loans that have a finite (1-5 years) term length are adjusted. Subordinated debt and other quasi-equity accounts are reclassified as ‘other equity’ on the balance sheet.
The analyst must be careful in the choice of an appropriate shadow rate thus, PMN has used the KIBOR
RATIONALEAdjustments to financial statements are made when doing benchmark analysis. Adjustments are made for two primary reasons:
�� To give an institution a more accurate picture of its financial position, by accounting for factors unique to an MFP including the predominance of below-market-rate funding sources. Such factors distort an MFP’s on-going performance.
�� To make the data of various MFPs comparable. Thus, adjustments are made in order to bring organizations operating under varying conditions and with varying levels of subsidy onto a level playing field.
The following adjustments are made to data used for the PMR:
ANNEXURE D
ADJUSTMENTS TO FINANCIAL DATA
106
rate on outstanding loans as reported by the State Bank of Pakistan on its website (12.5%) to make this adjustment.
Calculation of cost-of-funds subsidy
1. Calculate average balance for all borrowings. Borrowings do not include deposits or “other liabilities”. If an MFI has given an average balance, see if this is more appropriate to use; if not, calculate average from last year’s ending balance.
2. Multiply the average balance by the shadow market rate
3. Compare with the amount actually paid in interest and fees. If less “market” rate, impute the difference (market price minus Financial Expense paid on Borrowings) to the Subsidized Cost of Funds Adjustment Expense
B.2 CASH DONATIONS
Funds donated to cover operational costs constitute a direct subsidy to an MFP. The value of the subsidy is therefore, equal to the amount donated to cover expenses incurred in the period reported. Some donations are provided to cover operating shortfall over a period greater than one year. Only the amount spent in the year is recorded on the income statement as revenue. Any amount still to be used in subsequent years appears as a liability on the balance sheet (deferred revenue). This occurs because theoretically, if an MFP stopped operations in the middle of a multi-year operating grant, it would have to return the unused portion of the grant to the donor. The unused amount is therefore, considered as a liability.
Funds donated to pay for operations should be reported on the income statement separately from the revenue generated by lending and investment activities. This practice is meant for accurately reporting the earned revenue of an MFP. Donated funds are deducted from revenue or net income prior to any financial performance analysis because they do not represent revenue earned from operations.
Note: Costs incurred to obtain donor funds (fundraising costs) should also be separated from operating expenses, because the benefit of receiving the funds is not included.
B.3 IN-KIND SUBSIDY
Imputed cost (book value) of donated/loaned-out vehicles, machinery and buildings need to be included in operating expenses. Expatriate staff salaries paid by donor or parent company, or other technical assistance, need to be accounted for. Here, imputed salaries are used instead of salaries actually received by them i.e., the salary range that a local hire would get for the same level of work-load/position is used.
Note: The analyst must use his/her judgment
in deciding whether or not the in-kind donation represents a key input to the on-going operations of the MFP. An appropriate basis for valuation is important. This could include selecting a percentage of the total cost and attributing it to program expense. The percentage may be selected on the basis of sales proportion, management input, etc.
Calculation of in-kind subsidy
Sum of in-kind subsidies by operating expense account, added to unadjusted numbers for each account.
C. Loan loss provisioningPMN standardizes loan loss provisioning for MFPs to a minimum threshold or risk. MFPs vary tremendously in accounting for loan delinquency. Some count the entire loan balance as overdue the day a payment is missed. Others do not consider a loan delinquent until its full term has expired. Some MFPs write off bad debt within one year of the initial delinquency, while others never write off bad loans, thus carrying forward a default that they have little chance of ever recovering.
The analyst applies a standard loan loss provisioning to all MFPs and adjusts, where necessary, to bring them to the minimum threshold. In some cases, these adjustments may not be precise. Portfolio aging information may only be available on different aging scales.
Calculation of loan loss provisioning
Step 1: Multiply the PAR age categories by the following reserve factors: PAR up to 89 days no provisioning PAR 91 – 180 x 0.50 PAR 181 – 360 x 1.00 Renegotiated loans x 0.50
Step 2: Sum above reserve calculations. If sum is more than current reserves make calculated reserve new Loan Loss Reserve. If not, keep current reserves.
Step 3: Add the Unadjusted Loan Loss Provision Expense to the difference between the Adjusted Net Loan Portfolio and the Unadjusted Net Loan Portfolio. This is the Adjusted Loan Loss Provision Expense.
107PAKISTAN MICROFINANCE REVIEWAnnual Assessment of the Microfinance Industry
2012
Age
Number of years an organization has been functioning as a microfinance provider (MFP).
Active Saving Account Balance
It is the average balance of savings per account (not per depositor).
Adjustment Expense
Total adjustment cost related to inflation, subsidized cost of borrowing, loan loss provisioning and in-kind subsidies.
Adjusted Financial Expense Ratio
It is calculated by using standardized ageing-of-portfolio technique. The principle of conservatism is used which is why loan loss provision in audited accounts is greater than the amount computed by the analyst.
Adjusted Loan Loss ReserveFormula:
Adjusted Financial Expense
Adjusted Average Total Assets
Adjusted Operating Expense
Also included in operating expense:
�� Imputed cost (book value) of donated/loaned vehicles, machinery and buildings
�� Expatriate staff salaries paid by donor or parent company
�� Other technical assistance paid for with donations
NOTE: Imputed salaries should be used instead of salaries actually received by such persons. For imputation, the salary range that a local hire would get for the same level of work-load/position should be used. Judgment is used to decide whether or not the in-kind donation represents a key input to the on-going operations of the MFP
Formula:
Personnel Expense + Administrative Expense
Adjusted Operating Expense RatioFormula:
Adjusted Operating Expense
Adjusted Average Total Assets
Adjusted Portfolio at Risk > (30, 60, 90 Days)
Indicates the credit risk of a borrower above the specified number of days (30, 60, 90) past his/her due date for installment payment.
Formula:
Outstanding balance, loans overdue > (30 or 60 or 90) Days
Adjusted Gross Loan Portfolio
Adjusted Cost per Borrower
In case of loan size differentials, generally operating expense ratio is lower (more efficient) for institutions with higher loan sizes, ceteris paribus. This indicator discounts the effect of loan size on efficient management of loan portfolio.
Formula:
Adjusted Operating Expense
Average Number of Active Borrowers
Adjusted Cost per LoanFormula:
Adjusted Operating Expense
Average Number of Active Loans
Adjustment Expense RatioFormula:
Net inflation, in kind, loan loss provision and subsidized cost-of-funds adjustment expense
Adjusted Average Total Assets
Adjusted Financial Expense
It includes actual cost of borrowing and shadow cost of subsidized funding.
Adjusted Financial Expense on Borrowing
The cost-of-funds adjustment reflects the impact of soft loans on the financial performance of the institution. The analyst calculates the difference between what the MFP actually paid in interest on its subsidized liabilities and what it would have paid at a shadow market rate for each country. This difference represents the value of the subsidy, considered an additional financial expense.
ANNEXURE E
TERMS AND DEFINITIONS
108
Adjusted Loan Loss Provision Expense RatioFormula:
Adjusted Net Loan Loss Provision Expense
Adjusted Average Total Assets
Adjusted Loan Loss Provision Expense
Loan loss provision expense calculated with standardized ageing-of-portfolio technique. It is however ensured that if the actual loan loss provision expense is higher than the adjusted then the conservatism principle is followed.
Adjusted Operating Expense
It includes actual operational expenses and in-kind subsidy adjustments.
Adjusted Operating Expense Ratio
It indicates efficiency of an MFP’s loan portfolio.
Formula:
Adjusted Operating Expense
Average Gross Loan Portfolio
Adjusted Personnel Expense
Includes actual personnel expenses (salaries and benefits), and in-kind subsidy adjustments.
Adjusted Personnel Expense RatioFormula:
Adjusted Personnel Expense
Average Gross Loan Portfolio
Adjusted Profit Margin
Formula:
Adjusted Net Operating Income
Adjusted Financial Revenue
Adjusted Return on AssetsFormula:
Adjusted Net Operating Income, net of taxes
Average Total Assets
Adjusted Return on EquityFormula:
Adjusted Net Operating Income, net of taxes
Average Total Equity
Adjusted Total Expense
Includes all actual and adjusted expenses related to operations, cost of borrowings, loan losses and inflation adjustment.
Adjusted Total Expense RatioFormula:
Adjusted (Financial Expense + Net Loan Loss Provision Expense + Operating Expense) Cost
Average Total Assets
Average Gross Loan Portfolio
Average of opening and closing balance of Gross Loan Portfolio (GLP).
Average Loan Balance per Active Borrower
Indicates average loan balance outstanding.
Average Loan Balance per Active Borrower to Per Capita Income
Used to measure depth of outreach. The lower the ratio the more poverty-focused the MFP.
Average Number of Active Borrowers
It is average of opening and closing balance of active borrowers.
Formula:
[Active Borrowers (Opening Balance) + Active Borrowers (Closing Balance)]
2
Average Number of Active Loans
Average of opening and closing balance of active loans
Average Outstanding Balance
It indicates the average balance of loans outstanding.
Formula:
Adjusted Gross Loan Portfolio
Adjusted Number of Loans Outstanding
Average Outstanding Balance to Per Capita Income
It measure of depth of outreach. The lower the ratio the more poverty-focused the MFP.
Formula:
Average Outstanding Balance
Per Capita Income
Average Saving Balance per Saver
It indicates average amount of saving balance per saver.
109PAKISTAN MICROFINANCE REVIEWAnnual Assessment of the Microfinance Industry
2012
Average Total Assets
It is average of opening and closing balance of total assets.
Average Total Equity
It is average of opening and closing balance of total equity.
Borrowers per Loan Officer
It measure of loan officer productivity. It indicates the number of borrowers managed by a loan officer.
Formula:
Number of Active Borrowers
Number of Loan Officers
Borrowers per Staff
It measure of staff productivity. It indicates the number of borrowers managed by the staff on average.
Formula:
Number of Active Borrowers
Number of Total Personnel
Commercial Liabilities
It is principal balance of all borrowings, including overdraft accounts, for which the organization pays a nominal rate of interest that may be greater than or equal to the local commercial interest rate.
Commercial Liabilities-to-Gross Loan Portfolio Ratio
It indicates efficiency of an MFP’s loan portfolio.
Formula:
All liabilities with “market” price
Gross Loan Portfolio
Deposits
Demand deposits from the general public and members (clients) held with the institution. These deposits are not conditional to accessing a current or future loan from the MFP and include certificates of deposit or other fixed term deposits.
Deposit-to-Gross Loan Portfolio Ratio
It is inverse of the advance-to-deposit ratio.
Formula:
Deposits
Gross Loan Portfolio
Deposit-to-Total Asset Ratio
Indicates the percentage of assets financed through deposits.
Formula:
Deposits
Total Assets
Equity-to-Asset Ratio
This is a simple version of the capital adequacy ratio as it does not take in to account risk weighted assets. This ratio indicates the proportion of a company’s equity that is accounted for by assets.
Formula:
Total Equity
Total Assets
Financial Expense
It is total of financial expense on liabilities and deposits.
Financial Revenue
It is total of revenue from loan portfolio and other financial assets, as well as other financial revenue from financial services.
Financial Revenue from Other Financial Assets
It is net gains on other financial assets.
Financial Revenue from Loan Portfolio
It is total interest, fees and commission on loan portfolio.
Financial Revenue Ratio
Indicates the efficiency with which an MFP is utilizing its assets to earn income from them.
Formula:
Financial Revenue
Average Total Assets
Financial Self-Sufficiency
Formula:
Financial Revenue
Adjusted (Financial Expense + Net Loan Loss Provision Expense + Operating Expense + Inflation Adjustment)
Gross Loan Portfolio
It is the outstanding principal for all outstanding client loans, including current, delinquent and restructured loans. It does not include:
110
�� Loans that have been written-off
�� Interest receivable
�� Employee loans
For accounting purposes GLP is categorized as an asset.
Gross Loan Portfolio-to-Total Asset Ratio
Indicates the efficiency of assets deployed in high yield instruments/core business of an MFP.
Formula:
Gross Loan Portfolio
Total Assets
Inflation Adjustment Expense
Inflation decreases the real value of an MFP’s equity. Fixed assets are considered to track the increase in price levels, and their value is considered increased. The net loss (or gain) is treated as a cost of funds, is disclosed on the income statement, and decreases net operating income.
Inflation Rate
Latest annualized consumer price index (CPI) as reported by the State Bank of Pakistan.
Liabilities-to-Equity Ratio (debt-equity ratio)
Formula:
Adjusted Net Loan Loss Provision Expense
Adjusted Average Total Assets
Total Liabilities
Total Equity
Loan Loss Provision Expense
It is the sum of loan loss provision expense and recovery on loan loss provision.
Loans per Loan Officer
Formula:
Adjusted Net Loan Loss Provision Expense
Adjusted Average Total Assets
Number of Active Loans
Number of Loan Officers
Loans per Staff
Formula:
Adjusted Net Loan Loss Provision Expense
Adjusted Average Total Assets
Number of Active Loans
Number of Personnel
Net Adjusted Loan Loss Provision Expense
It is the sum of loan loss provision expense and recovery on loan loss provision. MFPs vary tremendously in accounting for loan delinquency. Some count the entire loan balance as overdue the day a payment is missed. Others do not consider a loan delinquent until its full term has expired. Some MFPs write off bad debt within one year of the initial delinquency, while others never write off bad loans, thus carrying forward a defaulting loan that they have little chance of ever recovering.
Number of Active Borrowers
Number of borrowers with loan amount outstanding.
Number of Active Loans
The number of loans that have been neither fully repaid nor written off, and thus that are part of the MFP’s gross loan portfolio.
Number of Active Women Borrowers
Number of women borrowers with loan amount outstanding.
Number of Active Women Borrowers to total Active Borrowers
It indicates percentage of women borrower to total active borrowers.
Number of Loans Outstanding
It is the number of loans outstanding at the end of the reporting period. Depending upon the policy of an MFP one borrower can have two loans outstanding; hence, the number of loans could be more than the number of borrowers.
Number of Savers
It is the number of depositors maintaining voluntary demand deposit and time deposit accounts with an MFP.
Number of Saving Accounts
One depositor can have more than two deposit accounts. Hence, the number of deposit accounts could be more than the number of depositors.
111PAKISTAN MICROFINANCE REVIEWAnnual Assessment of the Microfinance Industry
2012

Number of Women Savers
It is the number of women savers with voluntary demand deposit and time deposit accounts.
Offices
The total number of staffed points of service (POS) and administrative sites (including head office) used to deliver or support the delivery of financial services to microfinance clients.
Operating Expense
It is total of Personnel Expense and Administrative Expense.
Operational Self-SufficiencyFormula:
Financial Revenue
(Financial Expense + Net Loan Loss Provision Expense + Operating Expense)
Per Capita Income
It is average income per person.
Percentage of Women Savers to Total Savers
It indicates the percentage of women in the total saving portfolio.
Personnel
It is the number of individuals actively employed by an MFP. This number includes contract employees and advisors who dedicate the majority of their time to the organization, even if they are not on the MFP’s roster of employees. This number is expressed as a full-time equivalent, such that an advisor who spends 2/3 of his/her time with the MFP is accounted for as 2/3 of a full-time employee.
Personnel Allocation Ratio
The higher the indicator the more lean the head office structure of the organization. This indictor is used to measure organizational efficiency.
Formula:
Loan Officers
Total Staff
Risk Coverage Ratio
Indicates the provision created by an MFP against its credit risk.
Formula:
Adjusted Loan Loss Reserve
PAR > 30 Days
Saving Outstanding
Total value of demand deposit and time deposit accounts.
Savers per StaffFormula:
Number of Savers
Number of Personnel
Loan Loss Provision Expense
It is the sum of loan loss provision expense and recovery on loan loss provision.
Loans per Loan OfficerFormula:
Adjusted Loan Loss Reserve
PAR > 30 Days
Total Assets
Total net asset accounts i.e., all asset accounts net of any allowance. The one exception to this is the separate disclosure of the gross loan portfolio and loan loss reserve.
Total Equity
Equity represents the worth of an organization net of what it owes (liabilities). Equity accounts are presented net of distributions, such as dividends.
Formula:
Total Assets – Total Liabilities
Total Liabilities
Liabilities represent the borrowings of an organization i.e., the amount owed. Examples of liabilities include loans, and deposits. This number includes both interest and non-interest bearing liabilities of an MFP.
Total Number of Loan Officers
The number of staff members who dedicate the majority of their time to direct client contact. Front office staff include more than those typically qualified as credit or loan officers. They may also include tellers, personnel who open and maintain accounts—such as savings accounts—for clients, delinquent loan recovery officers, and others whose primary responsibilities bring them in direct contact with microfinance clients.
Loan Written Off during Year
It is the value of loans written off during the year.
112
Write-Off RateFormula:
Loans written off during the year
Average Gross Loan Portfolio
Yield on Gross Portfolio (Nominal)
Indicates the yield on an MFPs loan portfolio and is usually used as a proxy to look at MFPs (realized) effective interest rate.
Formula:
Financial Revenue from Loan Portfolio
Average Gross Loan Portfolio
Yield on Gross Portfolio (Real)
It is the number of depositors maintaining voluntary demand deposit and time deposit accounts with an MFP.
Formula:
(Yield on Gross Portfolio (nominal) - Inflation Rate)
(1 + Inflation Rate)
113PAKISTAN MICROFINANCE REVIEWAnnual Assessment of the Microfinance Industry
2012

114


www.pmronline.info