annexure “c” responses to the audit report€¦ · 108 nelson mandela bay metropolitan...
TRANSCRIPT
107
ANNEXURE “C”
RESPONSES TO THE AUDIT REPORT
108
NELSON MANDELA BAY METROPOLITAN MUNICIPALITY –
RESPONSES TO AUDIT REPORT ON CONSOLIDATED FINANCIAL
STATEMENTS FOR YEAR ENDED 30 JUNE 2006
PURPOSE
In accordance with the Public Audit Act No. 25 of 2004, the Council has to
consider the audit report within one month after its first sitting after the audit
report has been submitted by the Auditor-General (Annexure “A”).
Detailed below are the comments, with reference being made to the
paragraph numbering in the audit report:
4.1 PRESENTATION OF FINANCIAL STATEMENTS
4.1.1 BASIS OF PRESENTATION
The issues raised pertaining to the effect on the financial statements, will be
responded to under the relevant paragraphs in the audit report, where
considered necessary.
4.1.2 STATEMENT OF CHANGES IN NET ASSETS
This issue was not reported on by the Auditor-General’s Office as part of the
initial informal audit query system and first surfaced in the Draft Auditor-
General’s report of 23 March 2007, as a qualification item, several months
after the completion of the Consolidated Financial Statements, on
30 September 2006. Management was therefore not in a position to respond
to it previously.
The AG’s contention that the accumulated surplus is misstated, is not
considered to be factually correct. The accumulated surplus for the financial
year ended 30 June 2006 was indeed R64,7 million, after the relevant
revenue and expenditure items were taken into account.
109
It is acknowledged that the presentation of the Statement of Changes in Net
Assets (SCNA) requires refinement. The presentation of the SCNA will
accordingly be addressed in the 2006/07 Financial Statements.
4.1.3 PRIOR PERIOD ERROR NOT CORRECTED/APPLIED
RETROSPECTIVELY
Management is aware that the prior year’s financial statements should have
been restated. In order to perform the restatement, the value of the opening
inventory for the 2004/05 financial year would have been required, which was
unfortunately not available as the recording of the value of water inventory
only commenced in the 2005/06 Financial year.
The necessary disclosures will therefore be made in the 2006/07 Financial
Statements.
4.2 NON-CURRENT LIABILITIES
4.2.2 LONG-TERM LIABILITIES: POST-RETIREMENT LIABIL ITIES
As there was no applicable GAMAP standard in the 2004/05 financial year,
the AG’s local office assessed the reasonableness of the Municipality’s
approach in dealing with post-retirement benefits. As the Municipality had
adopted a strategy to fund the liability in respect of post-retirement benefits
over a fifteen-year period, taking into account financial affordability
constraints, the AG concluded in that year’s report that the Municipality’s
approach was appropriate, with the result that this matter was not qualified in
the Municipality’s audit report.
For the 2005/06 audit, however, the AG’s office relied on GAAP, as it is
deemed to be the applicable standard. As a consequence, this matter has
now become a qualification, as GAAP requires the total liability to be
accounted for in one financial year. It is noted that GAAP does not recognise
110
the financial position of local government in dealing with this liability and the
consequential impact thereof on a municipality’s Statement of Financial
Position.
In order to comply with the relevant GAAP standard, management intends to
record the entire liability in the 2006/7 Financial Statements, as required. This
will result in a reduction in Council’s net assets of at least R327 million, which
will require strategies to eliminate it in future years.
Management is furthermore in the process of undertaking an updated
actuarial valuation of its post-retirement benefit obligations, as it was last done
in 2002, in order to accurately determine the amount of the liability – this
updated valuation will be used to record the full liability as soon as it is
completed.
4.3 CURRENT LIABILITIES
4.3.1 CREDITORS
4.3.1.1 Limitation of scope: supporting documentati on not submitted
It is acknowledged that at the time of the audit, the required files and
documents were difficult to locate, as the audit was conducted during a period
when the Creditors Section was conducting major business process reviews
and a relocation.
It is important to note that one of the main factors affecting proper access to
documentation and loss of documentation was inadequate storage and office
facilities for the Creditors Section. This problem had been ongoing for a
number of years. An arrangement was entered into with Corporate
Administration to obtain the required accommodation, and during
September 2006, the Creditors Section undertook the relocation to
accommodation that then became available. This relocation, however,
coincided with the audit conducted by the auditors.
111
Efforts were made to locate and present the required documentation to the
AG, but this was only achieved after the cut-of date for audit testing. The
Auditors acknowledged receipt of the required source documents, but
informed management that they could not be taken into consideration for audit
purposes, as it was past the cut-off date.
This oversight in good planning and meeting timeframes set for audit
purposes is noted. Management has put the following control measures in
place in an effort to prevent a recurrence:
• An electronic Document Tracking System has been developed and is
being implemented;
• A Papertrail Document Management System is being developed by IT
and should be ready for implementation in the new financial year;
• Proper control over all source documents has been implemented and
these are now filed in an appropriate sequence to facilitate easy
access;
• Access to source documents is now controlled by a designated official.
4.3.1.2 Creditors reconciliations not performed
It is acknowledged that the reconciliation of creditors’ accounts was not
performed in full. This was due to a lack of skilled staff, aggravated by the
fact that a number of staff members of the Creditors Section left Council’s
service in a short space of time, leaving a skills void that had to be filled by
inexperienced temporary and junior staff.
The business process has been revised and a proposed organogram has
been submitted for consideration. Temporary staff have in the interim been
appointed to perform the required reconciliation of creditors’ accounts.
112
It is the intention to review the Stores and Creditors system so as to ensure
that the desired reports are produced to facilitate reconciliation.
4.3.2 CURRENT LIABILITIES: PROVISION FOR RESTORING/
REHABILITATING LANDFILL SITES
The Arlington and Koedoeskloof landfill sites will be operational for at least
another 40 years, and their closure is therefore not imminent, as is suggested
by the AG.
The following is the factual position relating to the sites in question:
Municipality’s Operating Landfill Sites:
The Arlington Waste Site is operating under a legal permit, with the expected
remaining lifespan being approximately 60 years. The permit conditions do not
cite an expiry date for the permit. Only approximately 20% of the site has
been filled with waste to date, with rehabilitation of the area anticipated to
occur in approximately 20 years’ time only.
Koedoeskloof is operating under a legal permit, with no time limit. Once fully
developed, the expected remaining life span will be 50 years. Rehabilitation is
taking place as each cell is completed. Discussions are well advanced, with a
view of introducing a levy on the current disposal tariffs in order to build up a
rehabilitation provision for both sites.
Municipality’s Closed Landfill Site (Ibhayi)
The rehabilitation of the Ibhayi Landfill Site is a registered Municipal
Infrastructure Grant project.
The project has been implemented in phases. As at May 2006, Phase 4 of
the project was completed, resulting in rehabilitation of the lower portion of the
site. Rehabilitation of the upper site is currently not possible, as the
113
approximately 3 000 households residing there have to be relocated by the
Housing and Land Business Unit. (According the H&L, funding is currently
being sourced externally for such relocation, Province being responsible for
the allocation of housing budgets).
Once the final rehabilitation is completed, the site will be isolated from the
immediate environment on account of landfill gas, leachate and stormwater
and only then will a closure permit be issued.
In the meantime monitoring and auditing of the site is being conducted
through a service provider contracted by the NMBMM.
Compliance with the accounting standard as set out in GAMAP 19 will be
dealt with in preparation of the 2006/07 Financial Statements.
In order, however, to ensure compliance, the relevant rehabilitation costs will
firstly have to be determined. Without the aforementioned determination, it is
not possible to express a view on whether this matter will have a material
effect on the financial statements
4.4 NON-CURRENT ASSETS
4.4.1 PROPERTY, PLANT AND EQUIPMENT
4.4.1.1 Physical verification, reconciliations and valuations not
performed
All Business Units will be tasked to physically verify the assets under their
control, including an assessment of the associated useful lives and a
reconciliation of the assets with the fixed assets register. Once this exercise is
completed, the necessary updating of the fixed assets register will be
conducted.
The entire land assets base will only be fully included in the assets register
once the municipal property valuation project, in conjunction with the land
asset management project, is completed (estimated completion date :
30 June 2008.
114
The validity of associating water losses solely with asset impairment is
disputed. Water losses are attributable to a myriad of reasons, including not
billing all the water consumers in the city, i.e. not all water consumers are on
the billing records and their consumption is accounted as water losses.
Furthermore, the Municipality is fully recovering the costs associated with the
provision of the water service and does not anticipate any difficulty continuing
to do so, which indicates no asset impairment in this case. A review of some
other municipalities has revealed a water loss rate of 30%, which, whilst not
desired, is considered to be within industry norms.
Asset impairment is usually applied to consumer or production related goods
and services where impairment resulting from a change in technology or the
loss of a dedicated consumer leads to some financial loss to an organisation.
The organisation then suffers an impairment loss, as it may not be able to sell
these products.
Management is also of the view that the results of any impairment
assessment would most likely be immaterial, for the reasons stated above,
whilst the cost to perform such a detailed study might be financially
prohibitive. Management will accordingly explore this issue further with other
similar municipalities, the Accountant-General and the Auditor-General in
order to develop and implement the most appropriate actions to resolve the
asset impairment issue.
4.4.2 LAND
The current municipal property valuation project will include the determination
of the 'fair value' of land, which will be used to update the fixed assets
register. Property records will also be analysed as part of the land asset
management project to determine the classification of properties in relation to
'property held for resale', investment properties and property, plant and
equipment and will be recorded under the appropriate categories in the
Financial Statements.
115
4.5 REVENUE
4.5.1 SERVICE CHARGES NOT ACCOUNTED FOR
It is the intention to fully recognise service charges in the 2006/07 Financial
Statements.
However, the amount of R7,8 million represents only 0,6% of the total
electricity and water sales in the amount to R1,28 billion, and is not
considered to have a material effect on the financial statements.
The AG’s reference to IAS 32 pertaining to the Municipality’s service charges
income is considered inappropriate, as it refers to financial instruments such
as equities and derivatives that are unrelated to the tariff income derived from
consumer debtors. The disclosure requirements of IAS 32 are, however, not
relevant to consumer debtors’ income, as no financial instruments are
recorded as income in the Municipality’s books of account.
4.5.2 REVENUE FROM REGIONAL SERVICES COUNCIL (RSC) LEVIES
4.5.2.1 RSC levy debtors
An accrual in excess of R22 million was raised at year-end to account for RSC
levy income received subsequent to 30 June 2006.
Due to the abolishment of RSC levies as from 1 July 2006, this matter will not
impact on the 2006/07 Financial Statements.
4.5.2.2 Inherent uncertainty and incompleteness of RSC levy income
The incompleteness of RSC levy income has been mentioned in previous
audit reports. This issue is not within the full control of the Municipality. The
incompleteness of the income stems from shortcomings in the RSC levy
legislation, as only the staff of SARS is permitted to audit the books of an
enterprise to ascertain the correctness of the figures supplied.
116
Due to the abolishment of RSC levies as from 1 July 2006, this matter will not
impact on the 2006/07 Financial Statements.
4.6 EXPENDITURE
4.6.1 GENERAL EXPENSES: LEASES
A major portion of the amount of R106 million quoted by the AG represents
Council’s internal lease and hire charges, such as automotive plant and
vehicle lease charges amounting to R64.9 million; the occasional hire of
vehicles, amounting to R28.2 million; and other internal hiring charges of
R3.6 million, totalling R96.7 million.
The amount of R1.14 million, as disclosed in the notes to the financial
statements, represents the external lease charges as identified by the various
Business Units.
It is the intention to improve the administration of lease records and to
maintain adequate, auditable documentation on leases.
It is to be noted that this particular issue does not represent a financial
misstatement, as contended by the AG, but is rather a matter of appropriate
disclosure in the financial statements.
4.6.2 GENERAL EXPENSES: HOUSING CONTRACTS
4.6.2.1 Limitation of scope: housing agreements not submitted
Since December 2006, management has implemented measures to improve
the safeguarding of agreements and general record-keeping, such as routing
the signed contract documents directly from the Executive Director’s Office to
the Archives Office to mitigate the risk of documents being misplaced.
117
4.6.2.2 Excess payments for work in progress
No excess payments in the amount of R5.3 million were made to contractors.
This was explained in a response to an informal audit query. To date, the AG
has not responded to indicate whether the response was satisfactory or not.
4.6.2.3 Contract, internal schedule and documentati on discrepancies
Since December 2006, management has implemented measures to address
the internal control weaknesses highlighted in the audit report. Measures such
as comparing the housing contract value to value as per the letter of award,
have been implemented as part and parcel of the project and contract
reconciliations, which are firstly signed off by the financial and administration
clerks and then by the Assistant Director : Housing and Land Finance.
6. EMPHASIS OF MATTER
6.1 INTERNAL CONTROL AND CONTROL ENVIRONMENT
Management understands and is committed to the maintenance of strong
internal controls and a control environment that supports managers and all
employees in adhering to the Municipality’s financial policies and other legal
obligations. The Municipal Manager has also instituted regular reporting by
Executive Directors on the status of their intended actions to address internal
control weaknesses, including an assessment of the extent to which internal
controls are improving. The aforementioned reports are submitted on a
monthly basis to Executive Directors meetings.
6.1.1 CONTROL WEAKNESSES NOTED
6.1.1.1 A lack of sufficient implemented controls i s evidenced by the
following:
(a) As permanent top management posts are filled, proper accountability for
the risk assessment and management will be implemented, which will
118
form part of the incumbents’ performance contracts. This KPA (risk
management) is embedded in their contracts. The Municipal Manager
will ensure compliance.
(b) The concern is noted, and proper controls and monitoring mechanisms
are now in place. Management has implemented procedures to
reconcile these inventories as at 30 June 2007, and monthly thereafter.
(c) Management will implement performance contracts for the appropriate
levels of management.
(d) Levels of authority are defined for categories of employees below Office
Manager level, informed in part by the provisions of the Supply Chain
Management Policy.
6.1.1.2 Implemented controls that had not functione d properly or were
not adhered to at all times are listed below:
(a) The segregation of duties regarding the Journal Management system
has been implemented and has been functional since July 2006. A
recent check confirmed that it is functional. Appropriate segregation of
duties pertaining to the fuel stock system will be implemented.
(b) – (d) The Audit findings relate to management’s role in implementing
internal controls, including internal and external audit recommendations.
Internal Audit will continue to follow up with management regarding the
implementation of recommendations and will report non-implementation
to the Municipal Manager in the first instance. Internal Audit will also
conduct follow-up audits to ascertain the extent of implementation of
recommendations.
6.1.2 INTERNAL AUDIT
The continued staff shortages and the high number of forensic audits have
impacted on the full implementation of the internal audit plan as envisaged.
119
The Internal Audit Division is in the interim concentrating on performing work
in line with the plan and intends to outsource forensic audit work.
6.1.3 AUDIT COMMITTEE
Comment noted. The poor response to the advertisement for Audit Committee
members and the associated selection of suitable members have delayed the
establishment of the Committee.
6.2 EXPENDITURE
6.2.1 TENDERS: SUPPLY CHAIN MANAGEMENT
Management continually strives to improve the monitoring and control over
the tender process.
6.2.1.1 Limitation of scope: access to database not provided
Firstly, in order to address the lack of access to original quotations, the IT
Department will be requested to obtain access to the scanned images of the
original quotes from TradeWorld. These images will then be linked and be
made visible in electronic tender file format in the Informal Tender Scoring
System (ITSS).
Secondly, access to view scanned images of the suppliers’ CIPRO, BEE
status and tax clearance certificate is available via the TradeWorld website.
The delay in granting the AG access to the Supplier Database is regrettable. It
is, however, the intention to address the issues raised.
It is to be noted that the AG was granted access, albeit after the cut-off date
for the submission of the required information.
120
6.2.1.2 Non-adherence to Supply Chain Management Po licy
(a) A circular will be distributed to all Directorates, requesting that adequate
reasons be furnished when tenders are awarded to contractors who did
not score the highest points.
(b) Clearance certificates relating to informal tenders are not archived in
contract files. Tax/Billing Clearance certificate compliance relating to
informal tenders below R200 000 is administered and archived by
TradeWorld. If the supplier does not have a clearance certificate, that
supplier’s quoted price will not be made visible by TradeWorld to the
Purchasing Office. The Purchasing Office will therefore not be able to
award a contract to that supplier.
Formal tenders above R200 000 require the bidder to submit a tax
clearance and a billing clearance as part of their tender documents. Non-
inclusion of a clearance certificate will result in the bidder not being
eligible for evaluation. Clearance certificates relating to formal tenders
are archived in contract files by the Directorate responsible for the
contract.
(c) Regarding informal tenders below R200 000, TradeWorld has sole
access to the original quotations; the Municipality is not able to verify
whether or not the supplier has signed the quotation and relies on
TradeWorld to ensure that quotations are signed by the suppliers.
With formal tenders above R200 000, the Evaluation Committee is
responsible for inspecting the tender documents for completeness.
(d) Informal tenders rely on TradeWorld to determine the split between price
and equity. Incomplete preference points scoring fields are being forward
to the Municipality by TradeWorld.
In formal tenders, the split between price and equity is determined prior
to the opening of the tender. The FTSS requires the Specifications
Committee to enter the scoring criteria prior to the opening of the tender.
121
Once the tender has been opened to the public, the scoring criteria
cannot be edited. At the close of the tender, the Evaluation Committee
inputs the bidder’s price and equity status. The FTSS then uses the
PPPFA scoring criteria created by the Specifications Committee,
together with the price and equity status entered by the Evaluation
Committee, to score the tender. It is not possible to edit the scored
tender.
(e) A circular will be distributed to all Directorates, requesting that adequate
reasons be furnished when tenders are awarded to contractors who were
not recommended at evaluation.
(f) As reflected in 6.2.1.2 (c) above, TradeWorld has sole access to the
original quotations; with the result that the Municipality is not able to
verify whether or not the supplier has submitted all the required tender
documentation. With formal tenders above R200 000, the Evaluation
Committee is responsible for inspecting the tender documents for
completeness.
6.2.1.3 Formal tender scoring system
The Formal Tender Scoring System (FTSS) was not designed as a financial
system with links to the general ledger, but rather as a management tool to
assist the Supply Chain Management Unit with the scoring of formal tenders
and to keep track of the status and progress of all formal tenders.
(a); (d) and (e) The FTSS allows the user to input the requisition number,
directorate and contract number. The FTSS also enables the user to
upload the specifications and evaluation document.
(b) The Supply Chain Management Unit will reconcile the approved
tenders with the orders placed with the suppliers.
(c) The Specifications Committee will ensure that all fields on the FTSS
are correctly completed and that the specification document is
uploaded.
122
(f) The FTSS initially allowed the user to manually input a sequential
tender number. The system was enhanced in June 2006 to automate
the generation of the sequential numbering of tenders.
6.2.2 EMPLOYEE-RELATED COSTS
6.2.2.1 Poor administration and record-keeping with in the Human
Resources Business Unit
Apart from challenges that the organisation still faces in securing adequate
space to keep personnel files at a central point, notable improvements have
been implemented since October 2006. Improvements are, inter alia, in
relation to the safe-keeping of documentation relating to new appointments (a
template or checklist has subsequently been designed and implemented to
rectify shortcomings in this area), that evidence of qualifications is placed on
file and general improvements in record-keeping, e.g. leave records,
allowances paid, etc. At the same time, the organization, through the review of
its recruitment processes and practices, is planning to institute a mechanism
for the verification of incumbents’ qualifications before appointments are
concluded. Relating to instances of allegations of misrepresentation of
educational qualifications, the Internal Audit Sub-Directorate of the
Municipality is finalising investigations in this regard.
6.2.2.2 Leave pay accrual
Leave records are being audited and updated to ensure reliability. The
enhanced reliability of the leave records will result in a more accurate leave
pay accrual.
6.3 WATER UNACCOUNTED FOR
The following actions are being taken to reduce unaccounted for water:
123
• Replacement of Old Domestic Meters
A programme to replace 27 000 of the old PE meters started in April 2006.
Since July 2006, 16 595 water meters have been replaced at a cost of
R3,97 million, with a saving of 28 700 kl of water that was underrecorded
previously. This previously unbilled water is now accounted for and will reduce
unaccounted for water. This programme will also be rolled out to the rest of
the city.
• Replacement of Large Diameter Industrial Meters
Large water meters serving commercial and industrial consumers have been
replaced and the programme to replace them at a two-yearly interval is in
place. This is necessary as these consumers are the highest water user per
connection and it is therefore imperative that these meters record the amount
of water used accurately.
• Billing
Investigations have revealed that certain parts of the city are not being billed;
approximately 20 000 water meters are not on the system. The affected sites
have been identified on a GIS map. Aspects such as the integration between
the current and previous three individual billing systems are being addressed.
A plan to address these gaps will be discussed at the next Water Task Team
meeting on unaccounted for water.
• Metering of communal standpipes
There are approximately 300 communal standpipes throughout Nelson
Mandela Bay. Of these, 77 have now been metered and a plan is in place to
meter the remainder.
124
• Leakage Management in KwaZakhele and New Brighton
A contract has been awarded for 4 200 existing unmetered connections to be
metered. To date 2 303 connections have been installed.
• Shared Toilets Project
Unmetered and shared toilet water connections are being separated by the
shared toilet project. Currently, 1 021 metered connections have been
installed out of a project total of 2 400.
6.4 DEBTORS
6.4.1 COLLECTION OF OUTSTANDING DEBT
Management acknowledges that the 'collection period' target is not being met.
However, the collections rate has improved from 89% in 2003/04 to 97% in
2005/06, due to much more aggressive collection efforts. The continuing
consistent enforcement of collection practices will ensure that the Municipality
meets its revenue collection targets. Progress towards achieving the target
days has been made during the current financial year, but the target will,
however, only be achieved if payment for municipal services remains above
100%.
6.4.2 HOUSING PENALTIES NOT CHARGED IN TERMS OF CON TRACTS
ENTERED INTO
With the awarding of contracts to emerging contractors, it was not possible to
charge penalties in view of doubts regarding the recoverability of the debt.
Accordingly, the Housing and Land Business Unit adopted a process of
contract termination, which has been implemented since December 2006.
125
In order to comprehensively respond to the audit finding, the Auditor-General
should provide the supporting documentation for the penalties in the amount
of R27,5 million.
6.4.3 ASSESSMENT OF DEBTORS
The Municipality had a provision for doubtful debts of R626 million as at 30
June 2006, compared to the total outstanding debtors’ accounts of R1,164
billion. Management is of the view that the provision (approximately 54% of
outstanding debtors) is more than adequate, irrespective of the scientific
calculation thereof. For the 2006/07 Annual Financial Statements,
management intends reviewing the basis used to calculate the provision,
including the AG’s recommendations, in order to determine if it would result in
a more accurate provision.
6.5 ASSET MANAGEMENT
6.5.1 BANK BALANCES AND CASH
It is acknowledged that there are certain long outstanding reconciling items,
and a concerted effort is presently being made to clear these items.
The statement by the Auditor-General that “the reconciliation was also
prepared using cumulative figures, for example, amounts reimbursed
represent the total of all reimbursements processed since the introduction of
the stores and creditors system” is, however, not understood as the
reconciliation of a balance sheet item including the balance carried over from
one financial year to another and is, therefore, cumulative.
Management intends discussing the issue further with the AG’s
representatives to obtain a common and detailed understanding of the issue,
and will make changes, if required.
126
6.5.2 INVENTORY MOVEMENTS NOT RECORDED IN CORRECT PERIOD
The necessary corrective measures will be implemented.
6.5.3 VEHICLES
While each Directorate is responsible for the management and supervision of
the vehicles leased from Fleet Management Services, the Infrastructure and
Engineering Directorate has identified the need for a corporate and co-
ordinated approach to the management of the municipal fleet, in order to
address the issues raised, as well as other issues such as improved
productivity and vehicle abuse. To assist Directorates in the monitoring and
management of their fleet, as well as to allow Fleet Management Services the
ability to co-ordinate the use of vehicles, the Municipality has embarked on
implementing:
• A Fleet Management Information System, which will be operational from
1 July 2007. The tender for this project was awarded by the Adjudication
Committee on 23 March 2007.
• A Vehicle Monitoring System (tracking system), which will be operational
from 1 July, 2007. The tender for this project was awarded by the
Adjudication Committee on 19 April 2007.
• A Fuel Management System, which will monitor the fuel usage of the
fleet. The tender for this project was awarded by the Adjudication
Committee on 23 March 2007.
In addition to the above measures, the Executive Mayor has approved the
establishment of a Fleet Monitoring Committee, which will address matters
such as those raised by the AG. Every Directorate is represented on this
Committee by a Director(s). A meeting of the Fleet Monitoring Committee will
be held on 3 May 2007, where this issue will also be discussed to ensure that
solutions are implemented.
127
6.6 IRREGULAR AS WELL AS FRUITLESS AND WASTEFUL
EXPENDITURE
Management has developed and implemented formal procedures to ensure
that all such instances are reported to the relevant offices and the necessary
action is taken. It is also the intention to disclose it in the 2006/07 Financial
Statements.
6.7 POTENTIAL FOR FRAUD
(a) The Anti-fraud and Anti-corruption Policy has been implemented, but not
updated. This will be done during 2007.
(b) The relevant Directorates will be tasked to institute corrective measures
to address the major internal control weaknesses.
(c) Critical vacancies are being filled, depending on budget availability.
(d) The comments are noted.
(e) The Audit Committee has been functioning effectively since its
establishment. With the filling of posts, Internal Audit should be able to
meet its mandate of providing assurance on the internal controls, risk
management and governance processes.
(f) – (h) It is considered that measures have been implemented by
management to mitigate the risks.
6.8 ENVIRONMENTAL, SUSTAINABLE DEVELOPMENT, AND
OCCUPATIONAL HEALTH AND SAFETY ISSUES
Motherwell Canal : Consultants have been commissioned for the design and
installation of mechanical screens in the canal. Reed beds will be installed at
the foot of the canal to intercept any possible spillages entering the Swartkops
River. The procedure for the monitoring and reporting of spillages has been
updated.
128
Walmer Township : The lack of alternative land to which the households can
be relocated is hampering this project. Regular monitoring of the site for gas
emissions is being undertaken. This matter was recently reported to the
Housing and Land Committee.
Internal audit involvement : The current audit plan provides for
environmental audits to be conducted. Internal Audit currently participates in
the Environmental Steering Committee meetings to understand/identify the
areas of risk for control testing and to ensure legal compliance.
North End Lake pollution : From the data that is available, it has been
determined that the area is not suitable for contact recreation. In terms of the
2010 process, a Spatial Planning and Environmental Technical Task Team
will identify all the planning and environmental issues that need to be taken
into account with regard to the upgrading of facilities around the lake. This will
also include water quality issues. Some additional funding will also be applied
for from DEAT. Water samples are being taken on a regular basis.
Swartkops River pollution : The audit finding is accepted. Numerous
attempts have been made by the Department of Water Affairs and Forestry
(DWAF) to remove alien vegetation along the Swartkops River. A resolution
was taken that a Swartkops River Forum be established, whose aim will be to
primarily focus on the effects of pollution in the river, in consultation with
DWAF.
Sewage leaks into natural water systems: The Baaken s River : Pipeline
tracking inspections are now carried out regularly in this area to monitor
potential spillage locations. Corrective measures are being taken.
Hlalani Settlement (Soweto-on-Sea) : The Soweto-on-Sea/Veeplaas area is
part of the Zanemvula Project , which is a national project. The project is
being driven by the National and Provincial Departments of Housing and the
Municipality. The business plan has already been approved, and this includes
the upgrading of the entire Soweto-on-Sea area, as well as the relocation of
the 2 900 people who are living below the floodplain to other areas in the
Municipality, in particular Chatty 3 and 4, which is the relocation area. The
first 300 relocations from the flood-plain area have been undertaken and
before the end of the financial year, a further 600 relocations will take place.
A transitional relocation area has been established, which will take another
250 families out of the floodplain area. Some of the challenges that need to
129
be dealt with are, firstly, to demarcate the floodplain area and, secondly, to
physically demarcate the floodplain area on the ground so as to prevent the
re-establishment of shacks along the floodplain area.
Waste Issues
� Soweto-on-Sea is serviced by Cocisizwe Cooperative, one of the Waste
Management Division’s contracted cooperatives.
� The cooperative is responsible for rendering a weekly kerb-side removal
service and a cleansing service, i.e. litter picking and removal of illegal
dumping.
� An anomaly has been noted in the removal of waste, i.e. due to difficult
access the cooperative has not been rendering an effective service with
regard to the collection and removal of illegal dumping.
The following actions have since been taken to improve the situation:
� Review of the current collection points in order to improve the retrieval rate
of waste.
� Focus on the cleansing service, i.e. litter picking, as machinery cannot be
used to remove illegal dumping.
� Engagement of the community in order to create awareness regarding the
impact of improper waste management.
Although the above measures are currently being undertaken, it should be
noted that the communities residing within this flood area will soon be
relocated within the current financial year as part of the Zanemvula Project (a
combined national, provincial and local government funded project). The area
will be properly cleaned and rehabilitated as part of the project.
Waste Water Conveyance
The area is currently being serviced. The services in this area are also
dependent on progress with the Housing delivery programme. Water samples
are also to be taken from the Chatty River.
130
6.9 MUNICIPAL ENTITIES
In relation to the irregular expenditure, the Mandela Bay Development Agency
instituted corrective measures by cancelling the contract originally awarded, at
no cost to the agency.
The audit findings in relation to Feathermarket Promotions, Centenary
Promotions and Nelson Mandela Metropolitan Art Museum will primarily be
addressed in the 2006/07 Financial Statements.
131
ANNEXURE “D”
REPORT ON THE CONSOLIDATED
FINANCIAL STATEMENTS
132
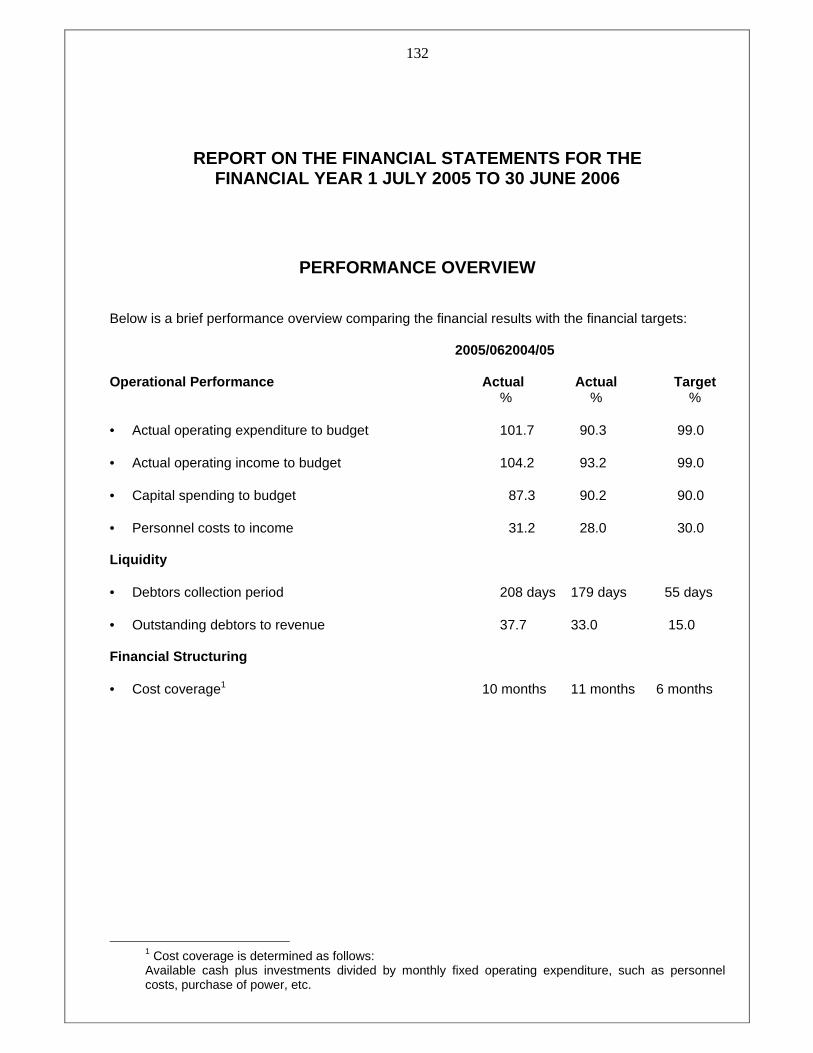
REPORT ON THE FINANCIAL STATEMENTS FOR THE FINANCIAL YEAR 1 JULY 2005 TO 30 JUNE 2006
PERFORMANCE OVERVIEW Below is a brief performance overview comparing the financial results with the financial targets: 2005/062004/05 Operational Performance Actual Actual Target % % % • Actual operating expenditure to budget 101.7 90.3 99.0 • Actual operating income to budget 104.2 93.2 99.0 • Capital spending to budget 87.3 90.2 90.0 • Personnel costs to income 31.2 28.0 30.0 Liquidity • Debtors collection period 208 days 179 days 55 days • Outstanding debtors to revenue 37.7 33.0 15.0 Financial Structuring • Cost coverage1 10 months 11 months 6 months
1 Cost coverage is determined as follows: Available cash plus investments divided by monthly fixed operating expenditure, such as personnel costs, purchase of power, etc.
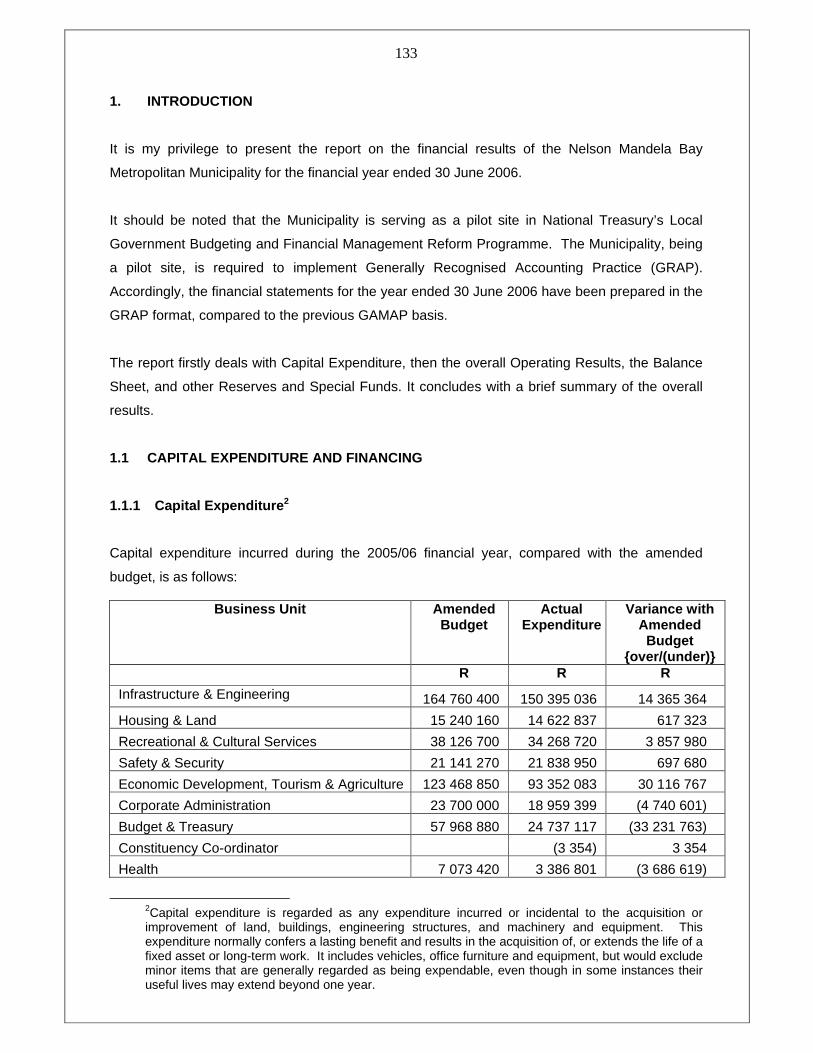
133
1. INTRODUCTION
It is my privilege to present the report on the financial results of the Nelson Mandela Bay
Metropolitan Municipality for the financial year ended 30 June 2006.
It should be noted that the Municipality is serving as a pilot site in National Treasury’s Local
Government Budgeting and Financial Management Reform Programme. The Municipality, being
a pilot site, is required to implement Generally Recognised Accounting Practice (GRAP).
Accordingly, the financial statements for the year ended 30 June 2006 have been prepared in the
GRAP format, compared to the previous GAMAP basis.
The report firstly deals with Capital Expenditure, then the overall Operating Results, the Balance
Sheet, and other Reserves and Special Funds. It concludes with a brief summary of the overall
results.
1.1 CAPITAL EXPENDITURE AND FINANCING
1.1.1 Capital Expenditure 2
Capital expenditure incurred during the 2005/06 financial year, compared with the amended
budget, is as follows:
Business Unit Amended Budget
Actual Expenditure
Variance with Amended
Budget {over/(under)}
R R R
Infrastructure & Engineering 164 760 400 150 395 036 14 365 364
Housing & Land 15 240 160 14 622 837 617 323
Recreational & Cultural Services 38 126 700 34 268 720 3 857 980
Safety & Security 21 141 270 21 838 950 697 680
Economic Development, Tourism & Agriculture 123 468 850 93 352 083 30 116 767
Corporate Administration 23 700 000 18 959 399 (4 740 601)
Budget & Treasury 57 968 880 24 737 117 (33 231 763)
Constituency Co-ordinator (3 354) 3 354
Health 7 073 420 3 386 801 (3 686 619)
2Capital expenditure is regarded as any expenditure incurred or incidental to the acquisition or improvement of land, buildings, engineering structures, and machinery and equipment. This expenditure normally confers a lasting benefit and results in the acquisition of, or extends the life of a fixed asset or long-term work. It includes vehicles, office furniture and equipment, but would exclude minor items that are generally regarded as being expendable, even though in some instances their useful lives may extend beyond one year.
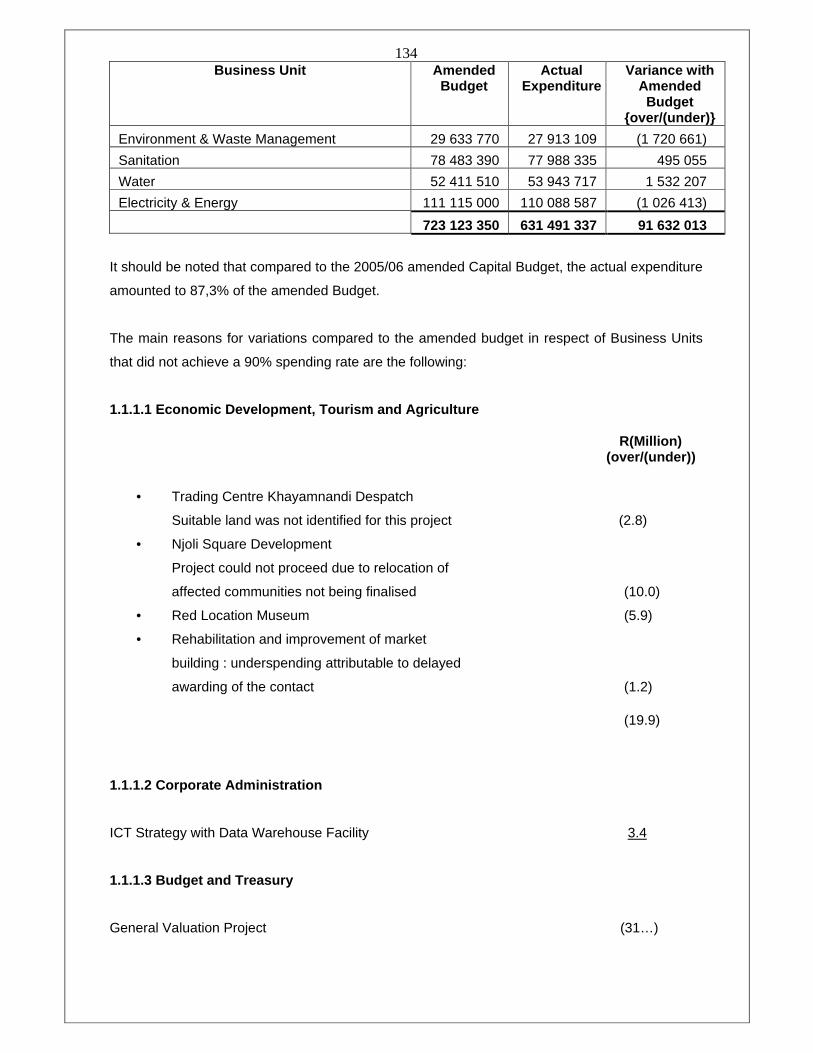
134 Business Unit Amended
Budget Actual
Expenditure Variance with
Amended Budget
{over/(under)}
Environment & Waste Management 29 633 770 27 913 109 (1 720 661)
Sanitation 78 483 390 77 988 335 495 055
Water 52 411 510 53 943 717 1 532 207
Electricity & Energy 111 115 000 110 088 587 (1 026 413)
723 123 350 631 491 337 91 632 013
It should be noted that compared to the 2005/06 amended Capital Budget, the actual expenditure
amounted to 87,3% of the amended Budget.
The main reasons for variations compared to the amended budget in respect of Business Units
that did not achieve a 90% spending rate are the following:
1.1.1.1 Economic Development, Tourism and Agricultu re
R(Million) (over/(under))
• Trading Centre Khayamnandi Despatch
Suitable land was not identified for this project (2.8)
• Njoli Square Development
Project could not proceed due to relocation of
affected communities not being finalised (10.0)
• Red Location Museum (5.9)
• Rehabilitation and improvement of market
building : underspending attributable to delayed
awarding of the contact (1.2)
(19.9)
1.1.1.2 Corporate Administration
ICT Strategy with Data Warehouse Facility 3.4
1.1.1.3 Budget and Treasury
General Valuation Project (31…)
135
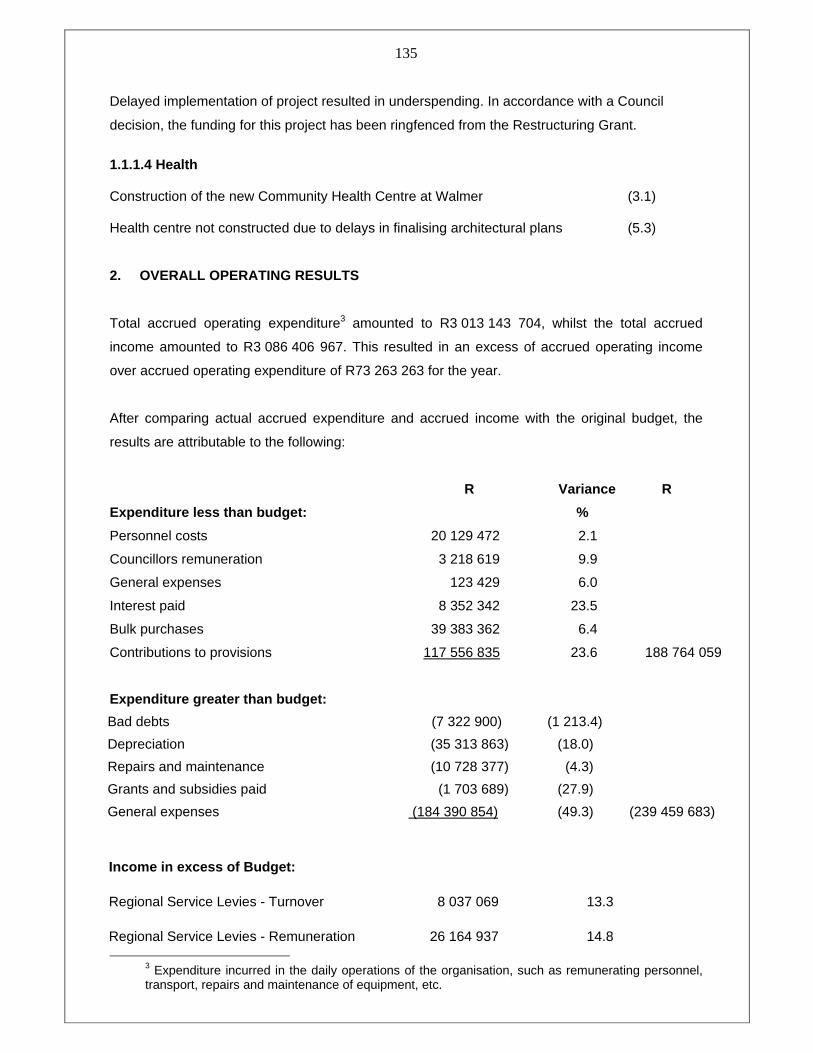
Delayed implementation of project resulted in underspending. In accordance with a Council
decision, the funding for this project has been ringfenced from the Restructuring Grant.
1.1.1.4 Health Construction of the new Community Health Centre at Walmer (3.1) Health centre not constructed due to delays in finalising architectural plans (5.3)
2. OVERALL OPERATING RESULTS
Total accrued operating expenditure3 amounted to R3 013 143 704, whilst the total accrued
income amounted to R3 086 406 967. This resulted in an excess of accrued operating income
over accrued operating expenditure of R73 263 263 for the year.
After comparing actual accrued expenditure and accrued income with the original budget, the
results are attributable to the following:
R Variance R
Expenditure less than budget: %
Personnel costs 20 129 472 2.1
Councillors remuneration 3 218 619 9.9
General expenses 123 429 6.0
Interest paid 8 352 342 23.5
Bulk purchases 39 383 362 6.4
Contributions to provisions 117 556 835 23.6 188 764 059
Expenditure greater than budget:
Bad debts (7 322 900) (1 213.4)
Depreciation (35 313 863) (18.0)
Repairs and maintenance (10 728 377) (4.3)
Grants and subsidies paid (1 703 689) (27.9)
General expenses (184 390 854) (49.3) (239 459 683)
Income in excess of Budget:
Regional Service Levies - Turnover 8 037 069 13.3
Regional Service Levies - Remuneration 26 164 937 14.8
3 Expenditure incurred in the daily operations of the organisation, such as remunerating personnel, transport, repairs and maintenance of equipment, etc.
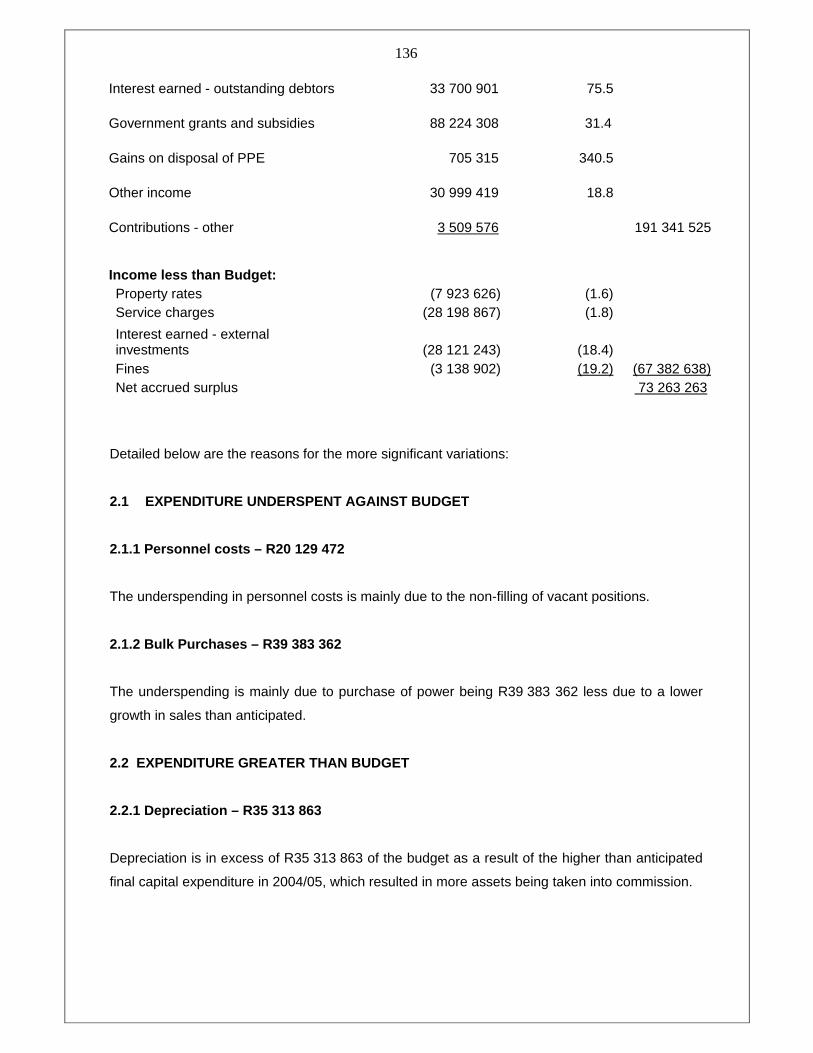
136
Interest earned - outstanding debtors 33 700 901 75.5
Government grants and subsidies 88 224 308 31.4
Gains on disposal of PPE 705 315 340.5
Other income 30 999 419 18.8
Contributions - other 3 509 576 191 341 525 Income less than Budget: Property rates (7 923 626) (1.6) Service charges (28 198 867) (1.8)
Interest earned - external investments (28 121 243) (18.4) Fines (3 138 902) (19.2) (67 382 638) Net accrued surplus 73 263 263
Detailed below are the reasons for the more significant variations:
2.1 EXPENDITURE UNDERSPENT AGAINST BUDGET
2.1.1 Personnel costs – R20 129 472
The underspending in personnel costs is mainly due to the non-filling of vacant positions.
2.1.2 Bulk Purchases – R39 383 362
The underspending is mainly due to purchase of power being R39 383 362 less due to a lower
growth in sales than anticipated.
2.2 EXPENDITURE GREATER THAN BUDGET
2.2.1 Depreciation – R35 313 863
Depreciation is in excess of R35 313 863 of the budget as a result of the higher than anticipated
final capital expenditure in 2004/05, which resulted in more assets being taken into commission.
137
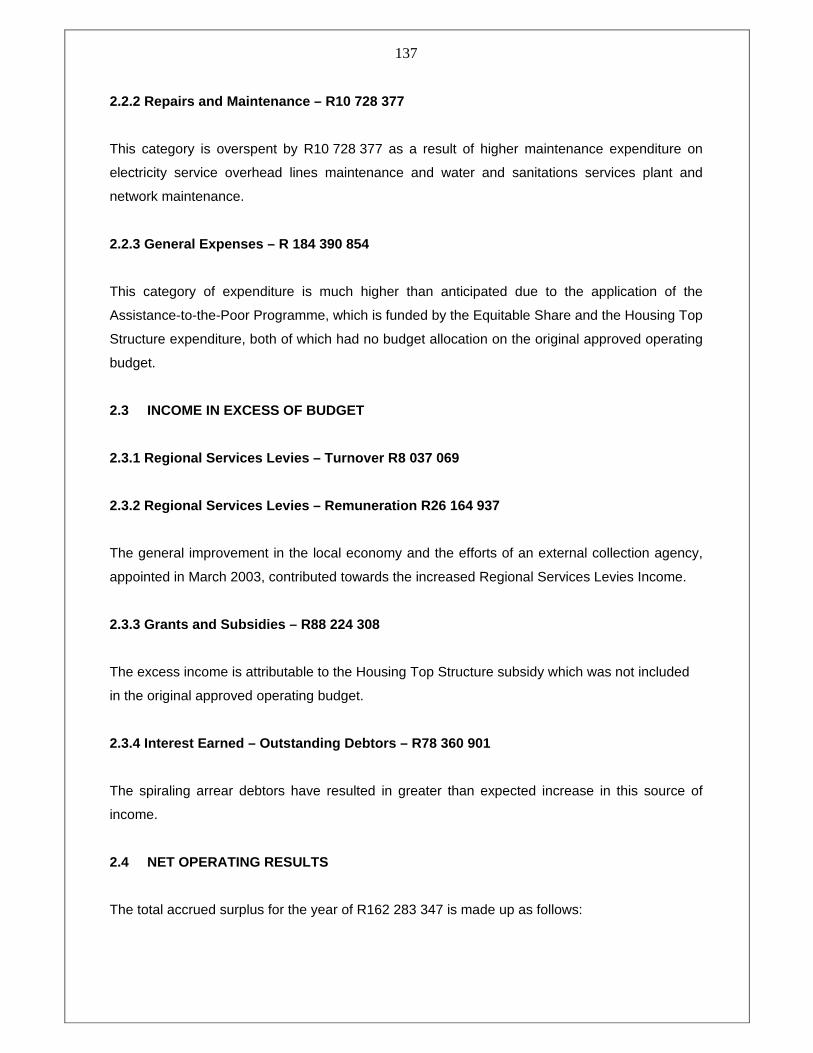
2.2.2 Repairs and Maintenance – R10 728 377
This category is overspent by R10 728 377 as a result of higher maintenance expenditure on
electricity service overhead lines maintenance and water and sanitations services plant and
network maintenance.
2.2.3 General Expenses – R 184 390 854
This category of expenditure is much higher than anticipated due to the application of the
Assistance-to-the-Poor Programme, which is funded by the Equitable Share and the Housing Top
Structure expenditure, both of which had no budget allocation on the original approved operating
budget.
2.3 INCOME IN EXCESS OF BUDGET
2.3.1 Regional Services Levies – Turnover R8 037 06 9
2.3.2 Regional Services Levies – Remuneration R26 1 64 937
The general improvement in the local economy and the efforts of an external collection agency,
appointed in March 2003, contributed towards the increased Regional Services Levies Income.
2.3.3 Grants and Subsidies – R88 224 308
The excess income is attributable to the Housing Top Structure subsidy which was not included
in the original approved operating budget.
2.3.4 Interest Earned – Outstanding Debtors – R78 3 60 901
The spiraling arrear debtors have resulted in greater than expected increase in this source of
income.
2.4 NET OPERATING RESULTS
The total accrued surplus for the year of R162 283 347 is made up as follows:
138
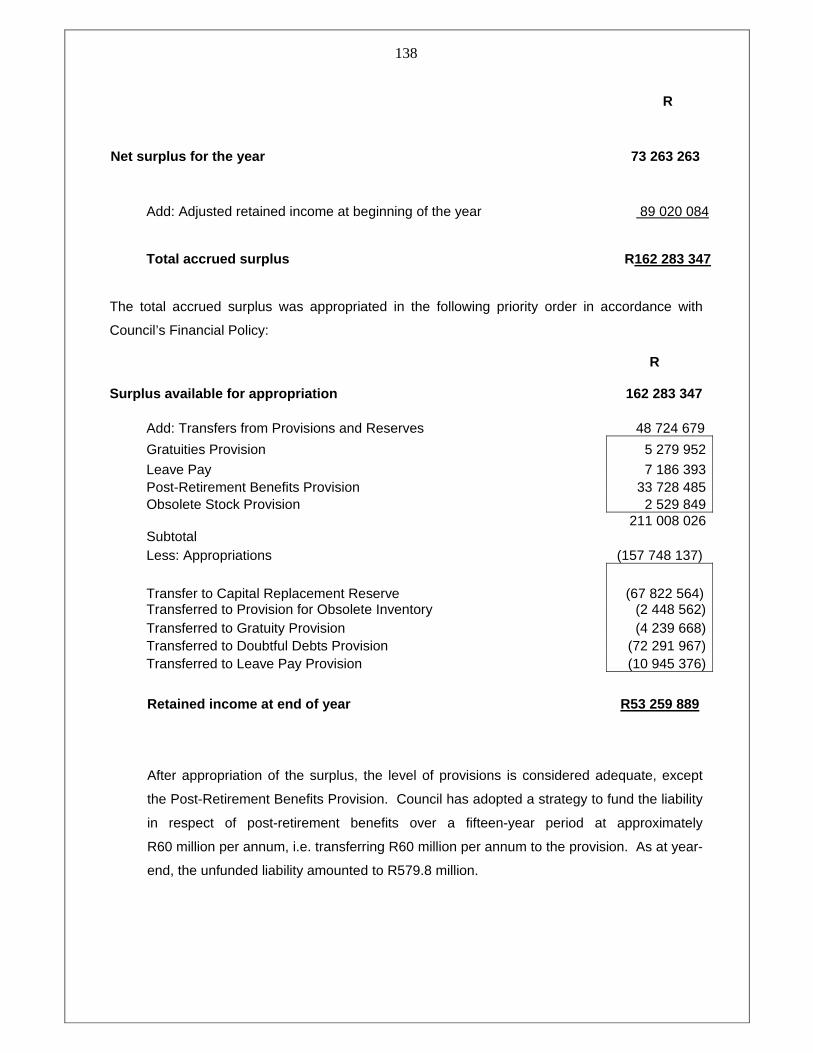
R
Net surplus for the year 73 263 263
Add: Adjusted retained income at beginning of the year 89 020 084
Total accrued surplus R162 283 347
The total accrued surplus was appropriated in the following priority order in accordance with
Council’s Financial Policy:
R
Surplus available for appropriation 162 283 347
Add: Transfers from Provisions and Reserves 48 724 679
Gratuities Provision 5 279 952
Leave Pay 7 186 393 Post-Retirement Benefits Provision 33 728 485 Obsolete Stock Provision 2 529 849
Subtotal 211 008 026
Less: Appropriations (157 748 137)
Transfer to Capital Replacement Reserve (67 822 564) Transferred to Provision for Obsolete Inventory (2 448 562) Transferred to Gratuity Provision (4 239 668) Transferred to Doubtful Debts Provision (72 291 967) Transferred to Leave Pay Provision (10 945 376)
Retained income at end of year R53 259 889
After appropriation of the surplus, the level of provisions is considered adequate, except
the Post-Retirement Benefits Provision. Council has adopted a strategy to fund the liability
in respect of post-retirement benefits over a fifteen-year period at approximately
R60 million per annum, i.e. transferring R60 million per annum to the provision. As at year-
end, the unfunded liability amounted to R579.8 million.
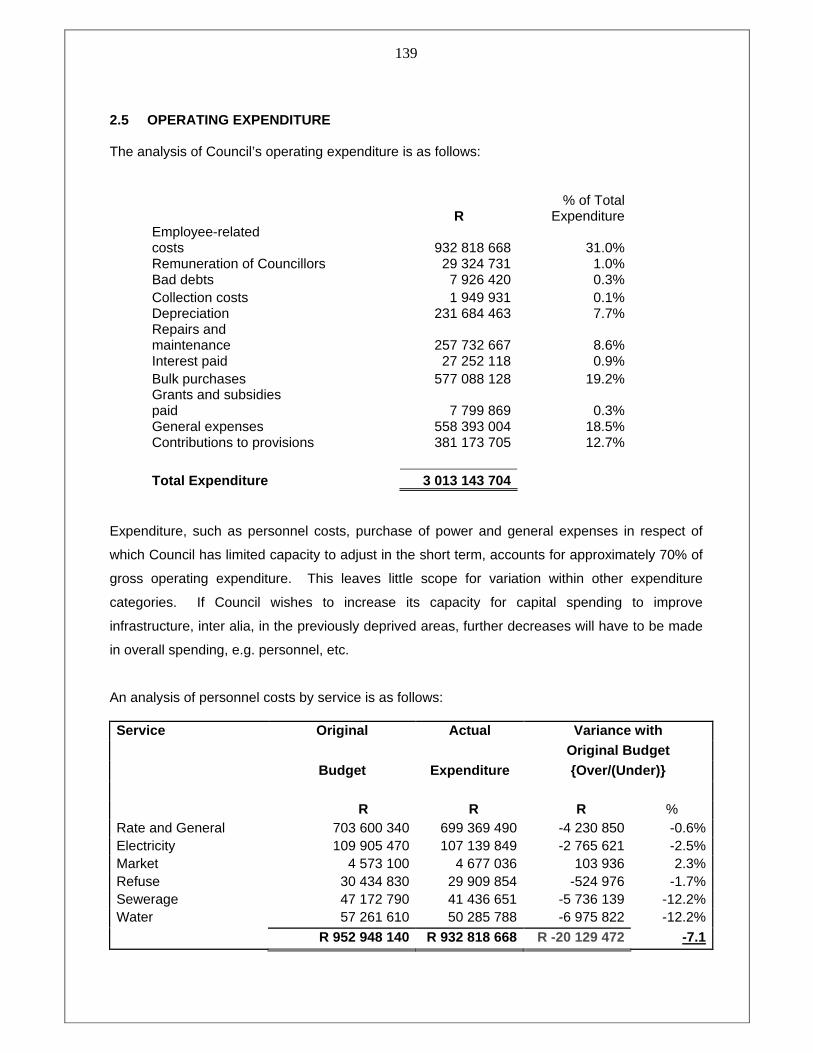
139 2.5 OPERATING EXPENDITURE
The analysis of Council’s operating expenditure is as follows:
R % of Total
Expenditure Employee-related costs 932 818 668 31.0% Remuneration of Councillors 29 324 731 1.0% Bad debts 7 926 420 0.3% Collection costs 1 949 931 0.1% Depreciation 231 684 463 7.7% Repairs and maintenance 257 732 667 8.6% Interest paid 27 252 118 0.9% Bulk purchases 577 088 128 19.2% Grants and subsidies paid 7 799 869 0.3% General expenses 558 393 004 18.5% Contributions to provisions 381 173 705 12.7% Total Expenditure 3 013 143 704
Expenditure, such as personnel costs, purchase of power and general expenses in respect of
which Council has limited capacity to adjust in the short term, accounts for approximately 70% of
gross operating expenditure. This leaves little scope for variation within other expenditure
categories. If Council wishes to increase its capacity for capital spending to improve
infrastructure, inter alia, in the previously deprived areas, further decreases will have to be made
in overall spending, e.g. personnel, etc.
An analysis of personnel costs by service is as follows:
Variance with Original Actual Original Budget
Budget Expenditure {Over/(Under)}
Service
R R R % Rate and General 703 600 340 699 369 490 -4 230 850 -0.6% Electricity 109 905 470 107 139 849 -2 765 621 -2.5% Market 4 573 100 4 677 036 103 936 2.3% Refuse 30 434 830 29 909 854 -524 976 -1.7% Sewerage 47 172 790 41 436 651 -5 736 139 -12.2% Water 57 261 610 50 285 788 -6 975 822 -12.2%
R 952 948 140 R 932 818 668 R -20 129 472 -7.1
140
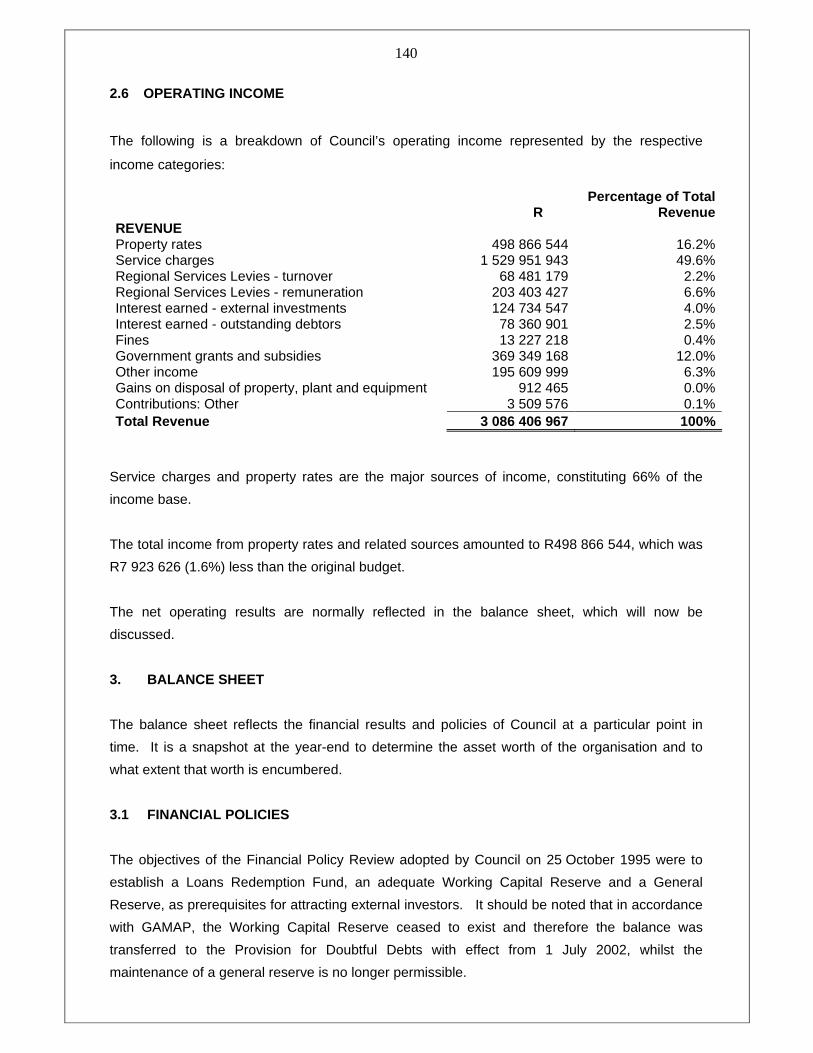
2.6 OPERATING INCOME
The following is a breakdown of Council’s operating income represented by the respective
income categories:
R Percentage of Total
Revenue REVENUE Property rates 498 866 544 16.2% Service charges 1 529 951 943 49.6% Regional Services Levies - turnover 68 481 179 2.2% Regional Services Levies - remuneration 203 403 427 6.6% Interest earned - external investments 124 734 547 4.0% Interest earned - outstanding debtors 78 360 901 2.5% Fines 13 227 218 0.4% Government grants and subsidies 369 349 168 12.0% Other income 195 609 999 6.3% Gains on disposal of property, plant and equipment 912 465 0.0% Contributions: Other 3 509 576 0.1% Total Revenue 3 086 406 967 100%
Service charges and property rates are the major sources of income, constituting 66% of the
income base.
The total income from property rates and related sources amounted to R498 866 544, which was
R7 923 626 (1.6%) less than the original budget.
The net operating results are normally reflected in the balance sheet, which will now be
discussed.
3. BALANCE SHEET
The balance sheet reflects the financial results and policies of Council at a particular point in
time. It is a snapshot at the year-end to determine the asset worth of the organisation and to
what extent that worth is encumbered.
3.1 FINANCIAL POLICIES
The objectives of the Financial Policy Review adopted by Council on 25 October 1995 were to
establish a Loans Redemption Fund, an adequate Working Capital Reserve and a General
Reserve, as prerequisites for attracting external investors. It should be noted that in accordance
with GAMAP, the Working Capital Reserve ceased to exist and therefore the balance was
transferred to the Provision for Doubtful Debts with effect from 1 July 2002, whilst the
maintenance of a general reserve is no longer permissible.
141
There were no major financial policy reviews in the year under review that deviated from this
course. The level of the Provision for Doubtful Debts is maintained at 100% of amounts owing by
debtors older than 90 days.
The Loans Redemption Fund provides an internal guarantee for the repayment of external loans,
while the Provision for Doubtful Debts must be maintained at an adequate level to recognise the
recoverability of outstanding debtors.
3.2 HOUSING DEVELOPMENT FUND
The fund increased by R9 991 995 (12,4%) from R80 329 448 to R90 321 443.
3.3 CAPITAL REPLACEMENT RESERVE
The reserve increased by R7 644 083 (3,3%) from R228 489 429 to R236 133 512.
This increase is mainly attributable to increased contributions to the reserve.
3.4 GOVERNMENT GRANT RESERVE
The reserve increased by R93 780 329 (24,7%) from R378 977 220 to R472 757 549.
3.5 DONATIONS AND PUBLIC CONTRIBUTION RESERVE
The reserve increased by R4 263 557 (15,6%) from R27 414 303 to R31 677 860.
3.6 LONG-TERM LIABILITIES 5
Long-term liabilities amounted to R712 151 875, compared to R702 624 515 in the previous
financial year and is made up as follows:
2005/06 2004/05
R R
External loans 284 993 041 303 971 526
Provision for ABSA
Leaseback rental 154 633 786 123 289 031
Provision for Post-Retirement Benefits 298 895 129 275 363 958
R712 151 875 R702 624 515
142
Long-term liabilities consequently increased by R9,5 million, compared to the 2004/05 financial
year, mainly as a result of the increase in the Provision for Post-Retirement Benefits .
3.7. PROPERTY, PLANT AND EQUIPMENT
Property, plant and equipment include infrastructure, buildings, plant and equipment, and
amounted to R3 123 233 692 compared to R2 839 186 939 in the 2004/05 financial year. This
represents an increase of R284 million or 10%.
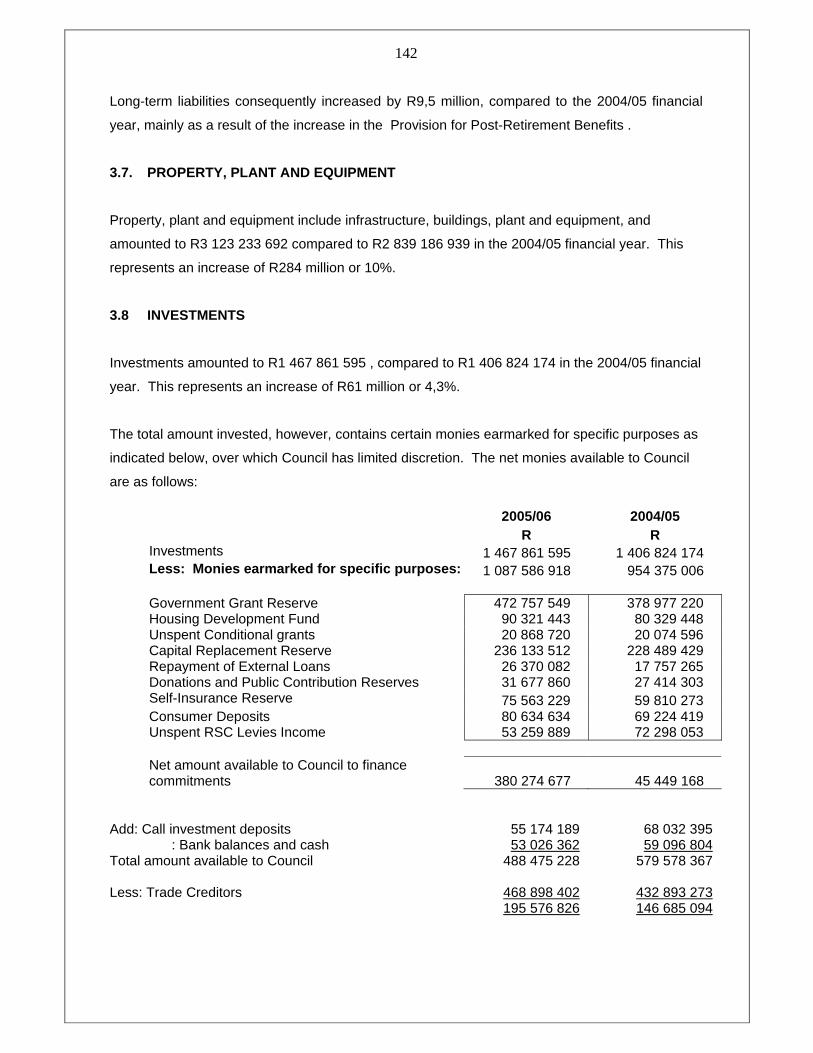
3.8 INVESTMENTS
Investments amounted to R1 467 861 595 , compared to R1 406 824 174 in the 2004/05 financial
year. This represents an increase of R61 million or 4,3%.
The total amount invested, however, contains certain monies earmarked for specific purposes as
indicated below, over which Council has limited discretion. The net monies available to Council
are as follows:
2005/06 2004/05 R R Investments 1 467 861 595 1 406 824 174 Less: Monies earmarked for specific purposes: 1 087 586 918 954 375 006 Government Grant Reserve 472 757 549 378 977 220 Housing Development Fund 90 321 443 80 329 448 Unspent Conditional grants 20 868 720 20 074 596 Capital Replacement Reserve 236 133 512 228 489 429 Repayment of External Loans 26 370 082 17 757 265 Donations and Public Contribution Reserves 31 677 860 27 414 303 Self-Insurance Reserve 75 563 229 59 810 273 Consumer Deposits 80 634 634 69 224 419 Unspent RSC Levies Income 53 259 889 72 298 053 Net amount available to Council to finance commitments 380 274 677 45 449 168
Add: Call investment deposits 55 174 189 68 032 395 : Bank balances and cash 53 026 362 59 096 804 Total amount available to Council 488 475 228 579 578 367 Less: Trade Creditors 468 898 402 432 893 273 195 576 826 146 685 094
143
3.9 DEBTORS
Debtors amounted to R1 164 307 215 before deduction of the Provision for Doubtful Debts of
R625 962 919.
The increase in debtors is a source of concern for the following main reasons:
• It diminishes the ability to spend on infrastructure development desperately needed for
anticipated economic growth and to address service backlogs in the underdeveloped
areas.
• It influences Council’s credit rating and ability to raise loans on competitive terms.
• It limits the ability to budget for growth.
• It affects tariffs negatively, requiring higher than inflation increases. Council may also
lose its competitive advantage as an investment destination over other centres.
• It influences the level of expenditure on the maintenance of assets.
The inability to collect outstanding debts timeously is reflected in the debtors collection period.
The situation is as follows: 3.9.1 Average Debtors Collection Period for Electri city, Water, Refuse, Sewerage and
Property Rates
Debtors 1 157 671 157 Tariff income and rates 2 028 818 487 Number of Days 208 Target 55 The following calculation illustrates the amount unnecessarily tied up in debtors as at 30 June 2006:
208-55 (days) ------------------ x R1 157 671 157 = R851 556 188
208 (days)
If the debtor’s turnover ratio could be reduced to 55 days, an amount of R851 million will become
available, which could be used for service delivery, infrastructure development and supporting
more affordable tariffs, all of which would contribute towards making the Nelson Mandela Bay
Metropolitan Municipality more attractive as an investment destination.
144
3.10 CREDITORS
Creditors amounted to R543 181 065, compared to R499 112 563 in the previous financial year.
It should be noted that creditors are paid regularly.
4. CAPITALISATION RESERVE
The reserve amounted to R3 177 543 370, compared to R2 824 232 119 in the 2004/05 financial
year.
In accordance with GAMAP, certain non-distributable reserves had to be established. Upon the
purchase of an asset funded from the AFF, an amount equivalent to the cost price of the asset
purchased has to be transferred from the AFF to a non-distributable reserve called the AFF NDR.
This reserve is equivalent to the remaining depreciable value (book value) of assets purchased
out of the AFF.
Furthermore, upon receipt, capital receipts in relation to government grants, subsidies and
contributions from the public must be deposited into a NDR Unutilised Capital Receipts. Upon
the purchase of an asset funded from the NDR Unutilised Capital Receipts, an amount equivalent
to the cost price of the asset has to be transferred from the NDR Unutilised Capital Receipts into
another Non-Distributable Reserve, called the NDR Utilised Capital Receipts.
The following NDRs have been established:
2004/05 2003/04 R R AFF NDR 1 010 778 381 868 555 007 NDR Unutilised Capital Receipts 84 444 514 96 646 835 NDR Utilised Capital Receipts 1 209 320 226 990 981 357 NDR (to provide for future depreciation Charges) 628 036 323 708 095 651 Operating NDRs 311 712 112 312 979 316 R3 244 291 556 R2 977 258 166
It should be noted that an NDR was established to provide for future depreciation charges. With
the introduction of GAMAP, depreciation had to be determined for the first time from the date
municipal assets were initially put into use. During the determination of depreciation charges
certain “credits” arose, which were transferred to an NDR. This NDR is equivalent to the amount
of future depreciation charges still to be written off in respect of assets still in use as at
30 June 2005.
145
5. SELF-INSURANCE RESERVE
The reserve balance increased from R5 810 273 to R75 563 229.
Claims expenditure exceeded premium income by R704 946, while interest earnings amounted
to R3 866 653, resulting in a surplus of R4 571 599 for the year, which was transferred to the
accumulated fund.
The insured value of Council’s assets amounted to R2,7 billion. The fund is also re-insured
externally to cover major losses.
6. CONTINGENT LIABILITIES
The major contingent liability reflected in the notes to the balance sheet is as follows:
Unfunded Post-Retirement Benefits 579 800 000
7. OVERALL RESULTS AND COMMENTS
The overall financial results are generally considered to be acceptable. In order to sustain this
situation the maintenance of sound financial management practices is required, as well as
mitigating the risks that impact on financial sustainability and instituting appropriate measures to
address such risks.
The present risks are essentially the following:
• Continued non-payment of accounts by debtors.
• Escalating personnel costs.
• Non-compliance with sound financial management practices.
• Limited spending on the maintenance and renewal of infrastructure assets.
• Possible acceptance by the Municipality of unfunded mandates.
• The current level of unfunded liabilities.