anhydrous phosphates of molybdenum …hss.ulb.uni-bonn.de/2012/2760/2760.pdfanhydrous phosphates of...
TRANSCRIPT
ANHYDROUS PHOSPHATES OF MOLYBDENUM AND RHENIUM
SYNTHESIS, CRYSTALLIZATION, CRYSTAL STRUCTURES, AND
SPECTROSCOPIC INVESTIGATIONS
Dissertation zur
Erlangung des Doktorgrades (Dr. rer. nat.) der
Mathematisch-Naturwissenschaftlichen Fakultät der
Rheinischen Friedrich-Wilhelms-Universität Bonn
vorgelegt von
Master of Science in Chemistry
Muhammad Saiful Islam aus Munshigonj / Bangladesch
Bonn, 2011


Angefertigt mit Genehmigung der Mathematisch-Naturwissenschaftlichen Fakultät der Rheinischen Friedrich-Wilhelms-Universität Bonn 1. Gutachter: Prof. Dr. R. Glaum 2. Gutachter: Prof. Dr. J. Beck Tag der Promotion: 06.12.2011 Erscheinungsjahr: 2012 Diese Dissertation ist auf dem Hochschulschriftenserver der ULB Bonn http://hss.ulb.uni-bonn.de/diss_online elektronisch publiziert.


Dedicated to my parents, wife Rony Akhter and daughter Tanihsa Islam

Index
I
1 Introduction 1
2 Chemical Vapour Transport 4
3 Three Component Systems 7
4 Ligand Field Theory 9
5 Experimental 13
5.1 Preparation of Silica Ampoules 13 5.2 Vacuum Line 14 5.3 Furnaces 15 5.4 Solid-state Reactions 16 5.5 Chemical Vapour Transport Experiments 17
6 Characterization Methods 18
6.1 X-ray Diffraction Techniques 18 6.1.1 X-ray Powder Diffraction 19 6.1.1.1 The Guinier Method 19 6.1.1.2 Simulations and Analyses of X-ray Powder Diffraction 22 6.1.2 Single-crystal Investigations 23 6.1.2.1 Selection and Mounting of a Single-crystal 23 6.1.2.2 Intensity Data Collection Using a κ-CCD Diffractometer 24 6.1.2.3 Evaluation of the Results 26 6.1.2.4 Structure Solution and Refinement 29 6.1.3 EDX Analysis 34 6.2 Spectroscopic Investigations 35 6.2.1 Solid-sate MAS-NMR Spectroscopy 35 6.2.2 Single-crystal UV/Vis/NIR Spectroscopy 39 6.2.3 Vibrational Spectroscopy 41 6.2.4 Magnetic Measurements 43
7 Chemicals Used Throughout This Thesis 46
7.1 Purchasable Chemicals 46 7.2 Chemicals Synthesized 47 7.2.1 Molybdenyl(VI) oxidepyrophosphate 47 7.2.2 Rhenium(VI) oxide 47 7.2.3 Rhenium(IV) oxide 47
8 Molybdenyl(V) oxidepyrophosphate 48
8.1 Introduction 48 8.2 Syntheses and Crystallization of Molybdenyl(V) phosphates 51 8.3 EDX Analyses of Molybdenyl(V) phosphates 56 8.4 X-ray Single-crystal Study of Molybdenyl(V) phosphates 57 8.5 Description and Discussion of the Crystal structures of Molybdenyl(V) phosphates
62 8.6 UV/Vis/NIR Investigations of Molybdenyl(V) phosphates 69 8.7 Magnetic Behaviour of Molybdenyl(V) phosphates 72 8.8 Infrared Spectra of (MoO)4(P2O7)3 and Phase X1 74
9 Molybdenyl(VI) oxidepyrophosphate (MoVIO2)2(P2O7) 76
9.1 Introduction 76 9.2 Syntheses and Crystallization 77 9.3 X-ray Investigations 79
Index
II
9.4 Description and Discussion of the Crystal structure 85 9.5 UV/Vis Absorption Spectra 90
10 The Ternary System Rhenium / Phosphorus / Oxygen 92
10.1 Introduction 92 10.2 Equilibrium Phase Relation in System Re / P / O 93
11 Rhenium(IV) phosphates 96
11.1 Introduction 96 11.2 Syntheses and Crystallization of Rhenium(IV) phosphates 98 11.3 Thermal Behaviour and Chemical Vapour Transport of Rhenium(IV) phosphates105 11.4 X-ray Investigations 107 11.5 Descriptions and Discussions of the Crystal structures 112 11.5.1 Rhenium(IV) pyrophosphate ReP2O7 112 11.5.2 Sodium Rhenium(IV) phosphate NaRe2(PO4)3 115 11.5.3 Rhenium(IV) silicophosphate Re3[Si2O(PO4)6] 118 11.5.4 Rutile-related (Re0.17V0.83)O2 122 11.6 Electronic Spectra of Rhenium(IV) phosphates 124 11.7 Magnetic Behaviour of ReP2O7 and NaRe2(PO4)3 129
12 Rhenium(V)-oxidepyrophosphate Re2O3(P2O7) 131
12.1 Introduction 131 12.2 Experimental 132 12.2.1 Syntheses and Crystallization 132 12.2.2 Characterization 135 12.3 Results and Discussions 139
13 Rhenium(VI)-oxidephosphate Re2O3(PO4)2 143
13.1 Introduction 143 13.2 Experimental 144 13.2.1 Syntheses and Crystallization 144 13.2.2 Characterization 147 13.3 Results and Discussions 152 13.3.1 Syntheses and Crystallization 152 13.3.2 Crystal structure 153 13.3.3 Electronic structure 155
14 Rhenium(VII)-oxidephosphates ReVIIO2(PO4) and (ReVII2O5)Si2°[Si2
tO(PO4)6] 156
14.1 Introduction 156 14.2 Experimental 157 14.2.1 Syntheses and Crystallization 157 14.2.2 Characterizations 161 14.3 Results and Discussions 168 14.3.1 Syntheses and Crystallization 168 14.3.2 Crystal structure 169 14.3.3 Spectroscopic Investigations 177
15 Conclusion 182
16 Appendix 188
16.A1 Molybdenyl(V) oxidepyrophosphates 188 16.A2 βI-Molybdenyl(V) oxidephosphate 199 16.A3 α-Molybdenyl(VI) oxidepyrophosphate 202 16.B1 Rhenium(IV) phosphates 207
Index
III
16.B2 Rhenium(V) oxidepyrophosphate 210 16.B3 Rhenium(VI) oxidephosphate 212 16.B4 Rhenium(VII) oxidephosphates 214 16.C1 α-Vanadyl(V) rhenate 219
17 References 224

IV
Introduction
1
1 Introduction
Up to now crystalline, anhydrous phosphates have been structurally characterized for all
transition metals with the only exception of radioactive technetium [1, 2, 3]. The Inorganic
Crystal Structures Database (version 2011/01) lists some 300 entries for anhydrous
phosphates of transition metals containing just one metal [4, 5]. The driving forces for the
formation of a plethora of transition metal phosphates are the stabilization of several
oxidation states for a given transition metal, the compositional variability n(metal oxide) :
n(phosphorus oxide), and the ability of transition metals to form various co-ordination
polyhedra. In addition to the crystal chemistry, for more than forty years the interest in this
family of compounds is driven by its fascinating applications. Anhydrous phosphates are used
as heterogeneous catalysts for selective oxidation of light hydrocarbons (e. g. (VO)2P2O7 [6]),
ionic conductors (NASICON and related compounds [7]), crystalline non-linear optical
materials (e. g. KTiOPO4 [8]), cathode materials for rechargeable batteries (e. g. LiFePO4
[9]), fuel cell (e. g. a hybrid PEM of Zr(HPO4)2 and Nafion [10]), and hydrogen storage (e. g.
nanoporous nickel(II) phosphate [11]). Most of these applications are related to the redox
properties of transition metals in a phosphate matrix. Systematic studies on the redox
behaviour of titanium [12, 13, 14], vanadium [15, 16], niobium [17], chromium [18],
molybdenum [19], tungsten [20], manganese [21], iron [22], and copper [23] have been
undertaken during the last twenty years. A review of the various phase diagrams M / P / O (M
= Ti, V, Cr, Mn, Fe, Co, Ni, Cu, Zn, Zr, Nb, Mo, W) has been given recently [2].
In 1995 LENZ [19] carried out a systematic search for new molybdenum phosphates by
Chemical Vapor Transport (CVT) and found the metastable molybdenyl(V) pyrophosphate
(MoVO)4(P2O7)3. He developed the ternary phase diagram of Mo / P / O [19] which contains
eight phosphates {(MoVIO2)2(P2O7) [24, 25], (MoVIO2)(PO3)2 [26], MoVOPO4 [27],
(MoVO)4(P2O7)3 [19], (MoVO)2P4O13 [28, 29], Mo~V1.3O(P2O7) [30], MoIVP2O7 [31], and
MoIII(PO3)3 [32]}. According to LENZ the crystal structure of (MoVO)4(P2O7)3 is closely
related to TiP2O7 [33]. Formally, the structure of (MoVO)4(P2O7)3 can be derived from that of
pyrophosphates M I V P2O7. Despite this formal understanding the detailed crystal structure of
(MoVO)4(P2O7)3 was not refined. The inability to refine the crystal structure of
(MoVO)4(P2O7)3 might have been a consequence of the lack of a suitable crystal for X-ray
single-crystal investigation as well as its very complex crystal structure. In the present work,
in addition to a nicely reproducible procedure for the crystallization of (MoVO)4(P2O7)3, a
crystal structure model will be presented.
Introduction
2
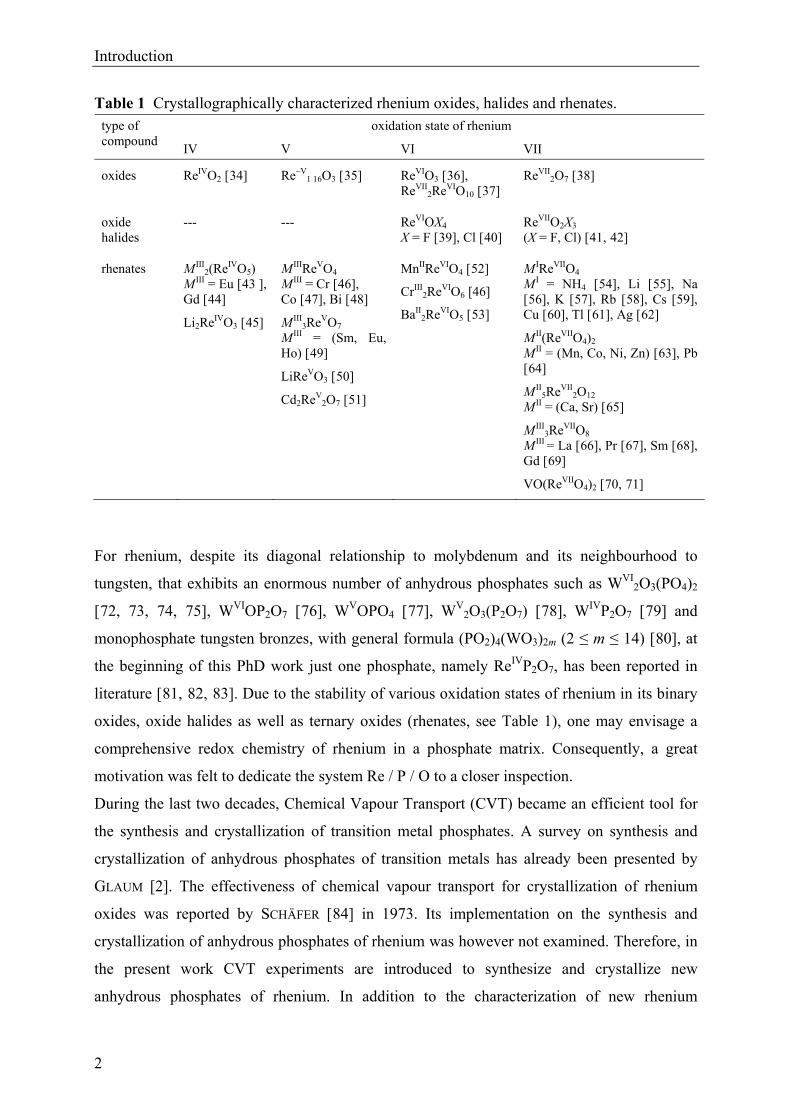
Table 1 Crystallographically characterized rhenium oxides, halides and rhenates. oxidation state of rhenium type of
compound IV V VI VII
oxides ReIVO2 [34] Re~V1 16O3 [35] ReVIO3 [36],
ReVII2ReVIO10 [37]
ReVII2O7 [38]
oxide halides
--- --- ReVIOX4 X = F [39], Cl [40]
ReVIIO2X3 (X = F, Cl) [41, 42]
rhenates M III2(ReIVO5)
M III = Eu [43 ], Gd [44]
Li2ReIVO3 [45]
M IIIReVO4 M III = Cr [46], Co [47], Bi [48]
M III3ReVO7
M III = (Sm, Eu, Ho) [49]
LiReVO3 [50]
Cd2ReV2O7 [51]
MnIIReVIO4 [52]
CrIII2ReVIO6 [46]
BaII2ReVIO5 [53]
M IReVIIO4 M I = NH4 [54], Li [55], Na [56], K [57], Rb [58], Cs [59], Cu [60], Tl [61], Ag [62]
M II(ReVIIO4)2 M II = (Mn, Co, Ni, Zn) [63], Pb [64]
M II5ReVII
2O12 M II = (Ca, Sr) [65]
M III3ReVIIO8
M III = La [66], Pr [67], Sm [68], Gd [69]
VO(ReVIIO4)2 [70, 71]
For rhenium, despite its diagonal relationship to molybdenum and its neighbourhood to
tungsten, that exhibits an enormous number of anhydrous phosphates such as WVI2O3(PO4)2
[72, 73, 74, 75], WVIOP2O7 [76], WVOPO4 [77], WV2O3(P2O7) [78], WIVP2O7 [79] and
monophosphate tungsten bronzes, with general formula (PO2)4(WO3)2m (2 ≤ m ≤ 14) [80], at
the beginning of this PhD work just one phosphate, namely ReIVP2O7, has been reported in
literature [81, 82, 83]. Due to the stability of various oxidation states of rhenium in its binary
oxides, oxide halides as well as ternary oxides (rhenates, see Table 1), one may envisage a
comprehensive redox chemistry of rhenium in a phosphate matrix. Consequently, a great
motivation was felt to dedicate the system Re / P / O to a closer inspection.
During the last two decades, Chemical Vapour Transport (CVT) became an efficient tool for
the synthesis and crystallization of transition metal phosphates. A survey on synthesis and
crystallization of anhydrous phosphates of transition metals has already been presented by
GLAUM [2]. The effectiveness of chemical vapour transport for crystallization of rhenium
oxides was reported by SCHÄFER [84] in 1973. Its implementation on the synthesis and
crystallization of anhydrous phosphates of rhenium was however not examined. Therefore, in
the present work CVT experiments are introduced to synthesize and crystallize new
anhydrous phosphates of rhenium. In addition to the characterization of new rhenium
Introduction
3
phosphates, it might be interesting to compare the redox behaviour of rhenium phosphates to
its neighbour elements i.e, V, Nb, Mo, and W phosphates.
Apart from crystallographic and chemical aspects of molybdenum and rhenium phosphates, it
is worth to investigate the electronic structure of these metals in phosphates. Thus, more
detailed information about the chemical composition, crystal structure, and bonding might be
obtained. To understand the structure-property-relationship it is more demanding to
synthesize new phosphates of molybdenum and rhenium of suitable optical quality. In
addition to electronic absorption spectra, studies on magnetic behaviour are valuable in order
to gain precise knowledge on the electronic state of the transition metal. Furthermore,
vibrational (IR and Raman) spectroscopic investigations are introduced for the study of the
bonding phenomena in molybdenum and rhenium phosphates. 31P- and 29Si-MAS-NMR investigations have already shown its tremendous success for the
characterization of the bonding situation of these elements in solids. In addition to knowledge
of the individual sites of the respective elements in the crystal structure, the chemical shift
parameters obtained from 31P- and 29Si-MAS-NMR provide more detailed knowledge on
chemical bonding of the phosphate or the silicate groups and their chemical environment. In
the present work, 31P- and 29Si-MAS-NMR investigations were included for the anhydrous
phosphates of rhenium.
Chemical Vapour Transport
4
2 Chemical Vapour Transport
A fascinating and prospectively useful preparative method has been developed in particular
by SCHÄFER [85], is the method of Chemical Vapour Transport (CVT) in a temperature
gradient. This method proved to be very convenient for the syntheses of new compounds
(even metastable ones), the growth of single-crystals as well as the purification of the solids.
CVT requires the reversible conversion of nonvolatile solids (or liquids) into volatile
derivatives according to equation 2.1.
a As,l + b Bs = c Cg + d Dg (2.1)
The transport of substance A is attained by a difference in partial pressures of the gaseous
species C, D, …. between the source region (side of dissolution of the condensed phase in gas
phase) and the sink region (side of deposition of the condensed phase from the gas phase;
crystallization zone). The CVT experiments are generally carried out in evacuated glass tubes
heated in a two zone furnace. Typically a temperature gradient 50 < T < 150 K is applied.
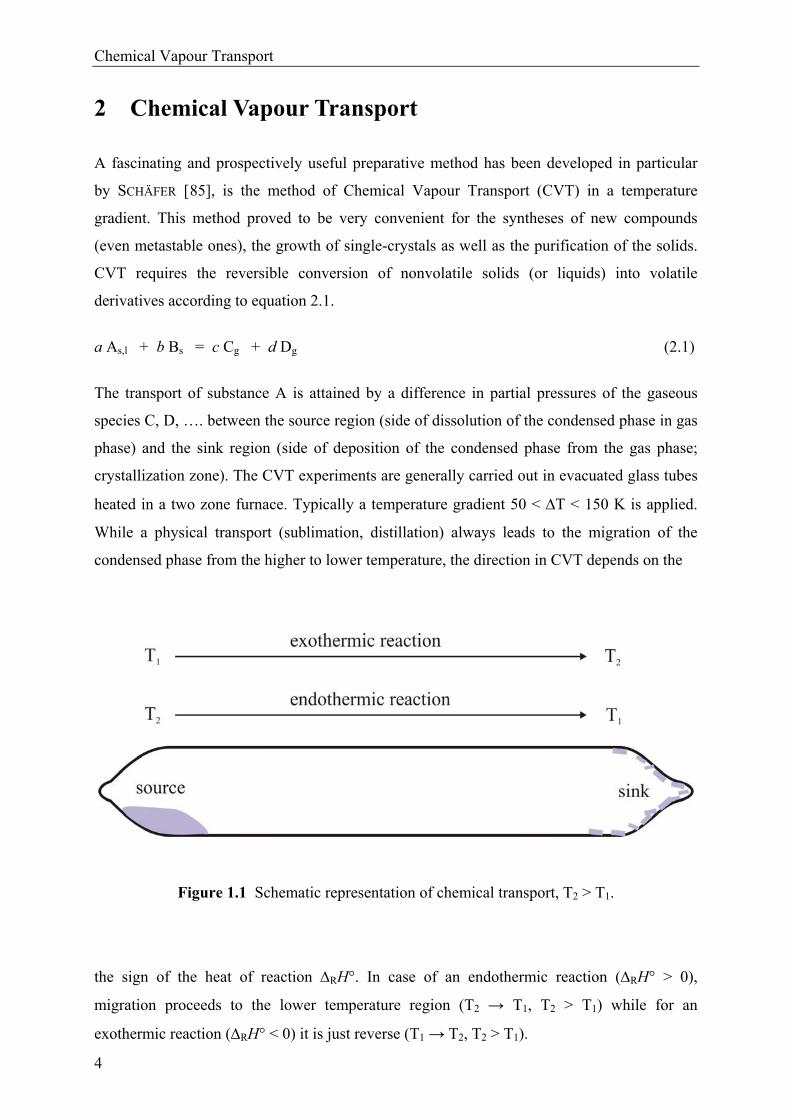
While a physical transport (sublimation, distillation) always leads to the migration of the
condensed phase from the higher to lower temperature, the direction in CVT depends on the
Figure 1.1 Schematic representation of chemical transport, T2 > T1.
the sign of the heat of reaction RH°. In case of an endothermic reaction (RH° > 0),
migration proceeds to the lower temperature region (T2 → T1, T2 > T1) while for an
exothermic reaction (RH° < 0) it is just reverse (T1 → T2, T2 > T1).
Chemical Vapour Transport
5
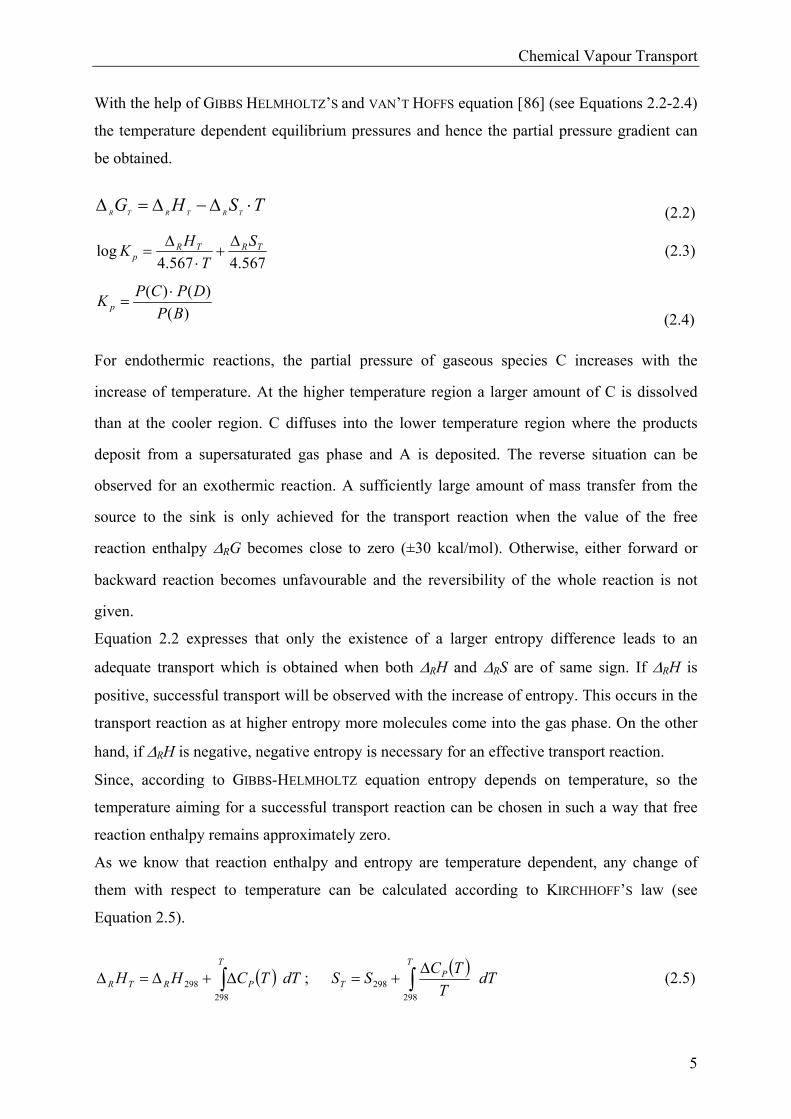
With the help of GIBBS HELMHOLTZ’S and VAN’T HOFFS equation [86] (see Equations 2.2-2.4)
the temperature dependent equilibrium pressures and hence the partial pressure gradient can
be obtained.
TSHGTRTRTR (2.2)
567.4567.4log TRTR
p
S
T
HK
(2.3)
)(
)()(
BP
DPCPK p
(2.4)
For endothermic reactions, the partial pressure of gaseous species C increases with the
increase of temperature. At the higher temperature region a larger amount of C is dissolved
than at the cooler region. C diffuses into the lower temperature region where the products
deposit from a supersaturated gas phase and A is deposited. The reverse situation can be
observed for an exothermic reaction. A sufficiently large amount of mass transfer from the
source to the sink is only achieved for the transport reaction when the value of the free
reaction enthalpy RG becomes close to zero (±30 kcal/mol). Otherwise, either forward or
backward reaction becomes unfavourable and the reversibility of the whole reaction is not
given.
Equation 2.2 expresses that only the existence of a larger entropy difference leads to an
adequate transport which is obtained when both RH and RS are of same sign. If RH is
positive, successful transport will be observed with the increase of entropy. This occurs in the
transport reaction as at higher entropy more molecules come into the gas phase. On the other
hand, if RH is negative, negative entropy is necessary for an effective transport reaction.
Since, according to GIBBS-HELMHOLTZ equation entropy depends on temperature, so the
temperature aiming for a successful transport reaction can be chosen in such a way that free
reaction enthalpy remains approximately zero.
As we know that reaction enthalpy and entropy are temperature dependent, any change of
them with respect to temperature can be calculated according to KIRCHHOFF’S law (see
Equation 2.5).
T
PRTR dTTCHH298
298 ;
T
PT dT
T
TCSS
298
298 (2.5)
Chemical Vapour Transport
6
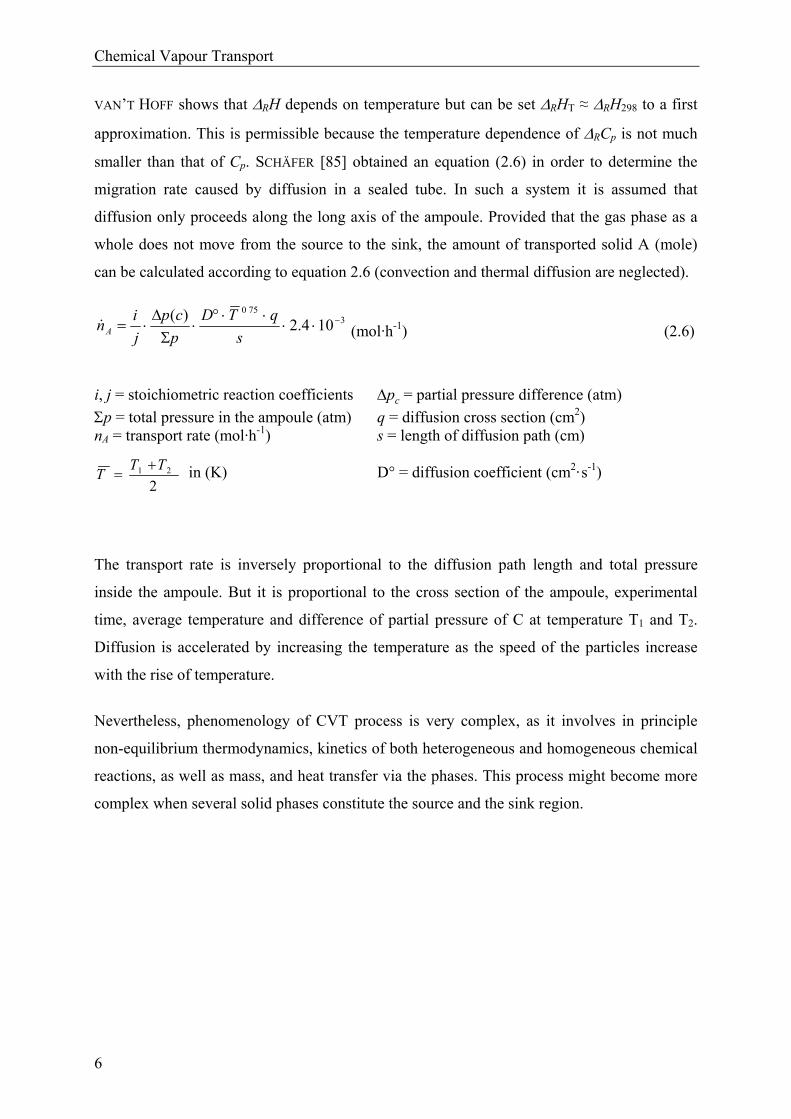
VAN’T HOFF shows that RH depends on temperature but can be set RHT ≈ RH298 to a first
approximation. This is permissible because the temperature dependence of RCp is not much
smaller than that of Cp. SCHÄFER [85] obtained an equation (2.6) in order to determine the
migration rate caused by diffusion in a sealed tube. In such a system it is assumed that
diffusion only proceeds along the long axis of the ampoule. Provided that the gas phase as a
whole does not move from the source to the sink, the amount of transported solid A (mole)
can be calculated according to equation 2.6 (convection and thermal diffusion are neglected).
3750
104.2)(
s
qTD
p
cp
j
inA (mol·h-1) (2.6)
i, j = stoichiometric reaction coefficients pc = partial pressure difference (atm)
p = total pressure in the ampoule (atm) q = diffusion cross section (cm2) nA = transport rate (mol·h-1) s = length of diffusion path (cm)
in (K) D° = diffusion coefficient (cm2·s-1)
The transport rate is inversely proportional to the diffusion path length and total pressure
inside the ampoule. But it is proportional to the cross section of the ampoule, experimental
time, average temperature and difference of partial pressure of C at temperature T1 and T2.
Diffusion is accelerated by increasing the temperature as the speed of the particles increase
with the rise of temperature.
Nevertheless, phenomenology of CVT process is very complex, as it involves in principle
non-equilibrium thermodynamics, kinetics of both heterogeneous and homogeneous chemical
reactions, as well as mass, and heat transfer via the phases. This process might become more
complex when several solid phases constitute the source and the sink region.
221 TT
T
Three Component Systems
7
3 Three Component Systems
Apart from achievement of rapid equilibria between solids and gas phases, better crystallinity
of the compounds can be obtained by chemical vapour transport. Furthermore, different
distribution of temperature in sink and source side of the ampoule frequently leads to different
phases. Such information facilitates to developoment of a phase diagram at a particular
temperature. In this work, a ternary phase diagram of Re / P / O has been developed at 500
and 800°C.
Based on thermodynamics, GIBBS' Phase Rule [87] provides the theoretical foundation for the
characterization of the chemical state of a system and predicting the equilibrium relations of
the phases present as a function of physical conditions (for exmple pressure and temperature).
It also allows constructing of a phase diagram, to represent and to interpret the results of
equilibrium experiments in heterogeneous systems. In straightforward, the phase rule (see
equation 3.1) shows a general relationship among the number of degrees of freedom F,
number of the components C and the number of co-existing phases P of a system for a given
parameters (generally pressure and temperature).
P + F = C + 2 (3.1)
For example, in a three component (C = 3) system, F = 5 – P, or 4 degrees of freedom are
possible, i.e., temperature, pressure and the composition of the two components. If the
composition or concentration of the two components in a phase is fixed, the third is
automatically fixed by difference. In order to represent the dependence of the phase equilibria
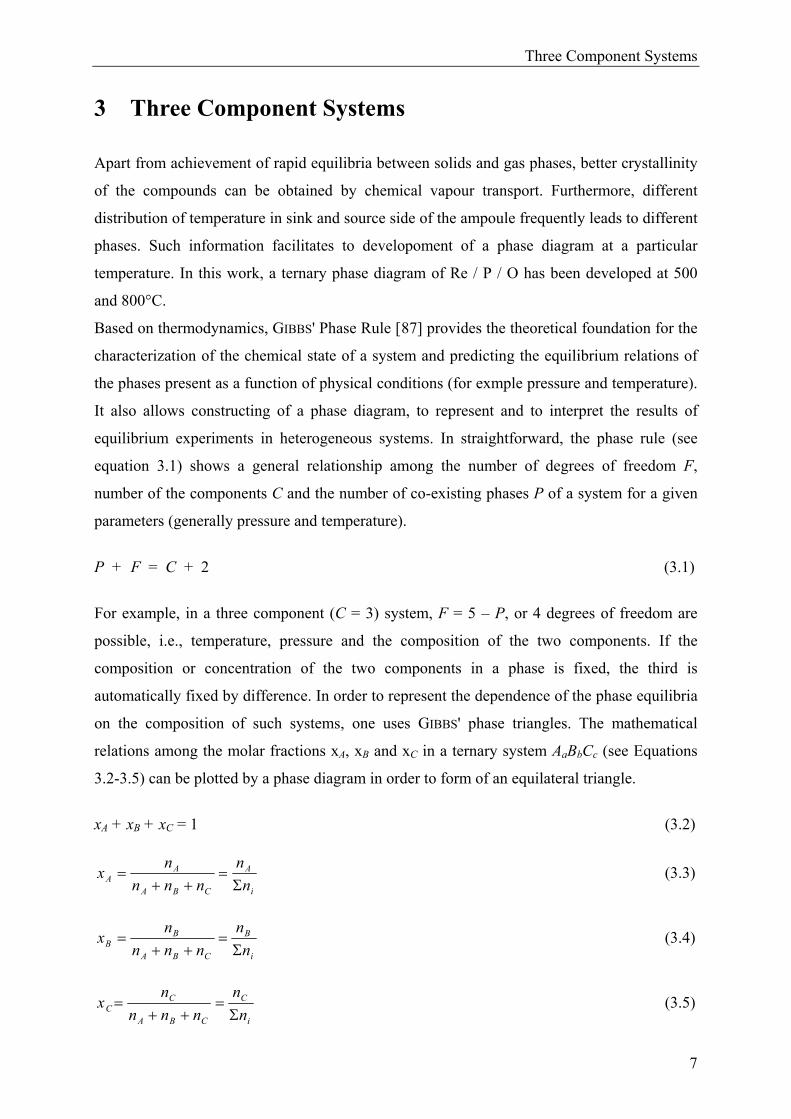
on the composition of such systems, one uses GIBBS' phase triangles. The mathematical
relations among the molar fractions xA, xB and xC in a ternary system AaBbCc (see Equations
3.2-3.5) can be plotted by a phase diagram in order to form of an equilateral triangle.
xA + xB + xC = 1 (3.2)
i
A
CBA
AA n
n
nnn
nx
(3.3)
i
B
CBA
BB n
n
nnn
nx
(3.4)
i
C
CBA
CC n
n
nnn
nx
(3.5)
Three Component Systems
8
nA, nB, nC, ni amount substance (mol) xA, xB, xC mole fraction
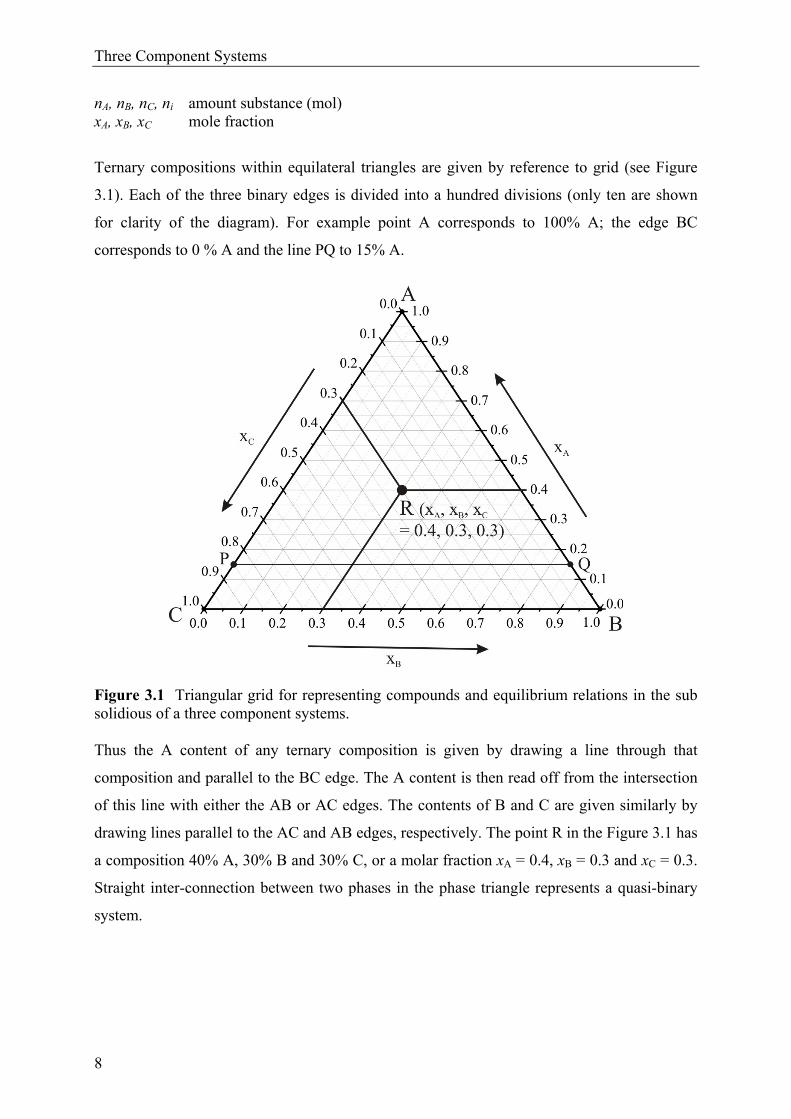
Ternary compositions within equilateral triangles are given by reference to grid (see Figure
3.1). Each of the three binary edges is divided into a hundred divisions (only ten are shown
for clarity of the diagram). For example point A corresponds to 100% A; the edge BC
corresponds to 0 % A and the line PQ to 15% A.
Figure 3.1 Triangular grid for representing compounds and equilibrium relations in the sub solidious of a three component systems. Thus the A content of any ternary composition is given by drawing a line through that
composition and parallel to the BC edge. The A content is then read off from the intersection
of this line with either the AB or AC edges. The contents of B and C are given similarly by
drawing lines parallel to the AC and AB edges, respectively. The point R in the Figure 3.1 has
a composition 40% A, 30% B and 30% C, or a molar fraction xA = 0.4, xB = 0.3 and xC = 0.3.
Straight inter-connection between two phases in the phase triangle represents a quasi-binary
system.
Ligand Field Theory
9
4 Ligand Field Theory
In the present work compounds of 4- and 5d-transition metal ions coordinated by oxygen
ligands have been investigated. The metal ions in these compounds attain independent
crystallographic sites. The influence of the ligands on the electronic structure of the central
ions can be described nicely with in the ligand field theory. The ligand field theory is an
advanced development of the crystal field theory, which considers the symmetry, strength of
the electrostatic crystal field and the electronic structure of free ions of the transition metals.
The disadvantage of the crystal field theory is the view of purely electrostatic interaction.
Covalent interactions between the central metal atom and the ligands are completely ignored.
A more detailed description of bonding in coordination compounds is provided by Ligand
Field Theory. The principle of Ligand Field Theory is similar to those of Molecular Orbital
Theory. The following list summarizes the key concepts of Ligand Field Theory.
One or more orbitals of the ligand overlap with one or more atomic orbitals of the
metal.
If the metal- and ligand-based orbitals have compatible symmetries, a net interaction
exists.
These interactions lead to stabilization / destabilization of the interacting orbitals
(formation of bonding and anti-bonding orbitals).
The amount of stabilization / destabilization depends on the overlap integral of two
orbitals and their absolute energy.
The net interaction produces a new set of orbitals, one bonding and the other anti-
bonding in nature.
Where no net interaction exists, the original atomic and molecular orbitals are
unaffected and are nonbonding in nature as regards the metal-ligand interaction.
Bonding and anti-bonding orbitals are of sigma (σ) or pi (π) character, depending upon
whether the bonding or anti-bonding interaction lies along the line connecting the
metal and the ligand. Delta (δ) bonding is also possible, but it is unusual and is
generally rather weak.
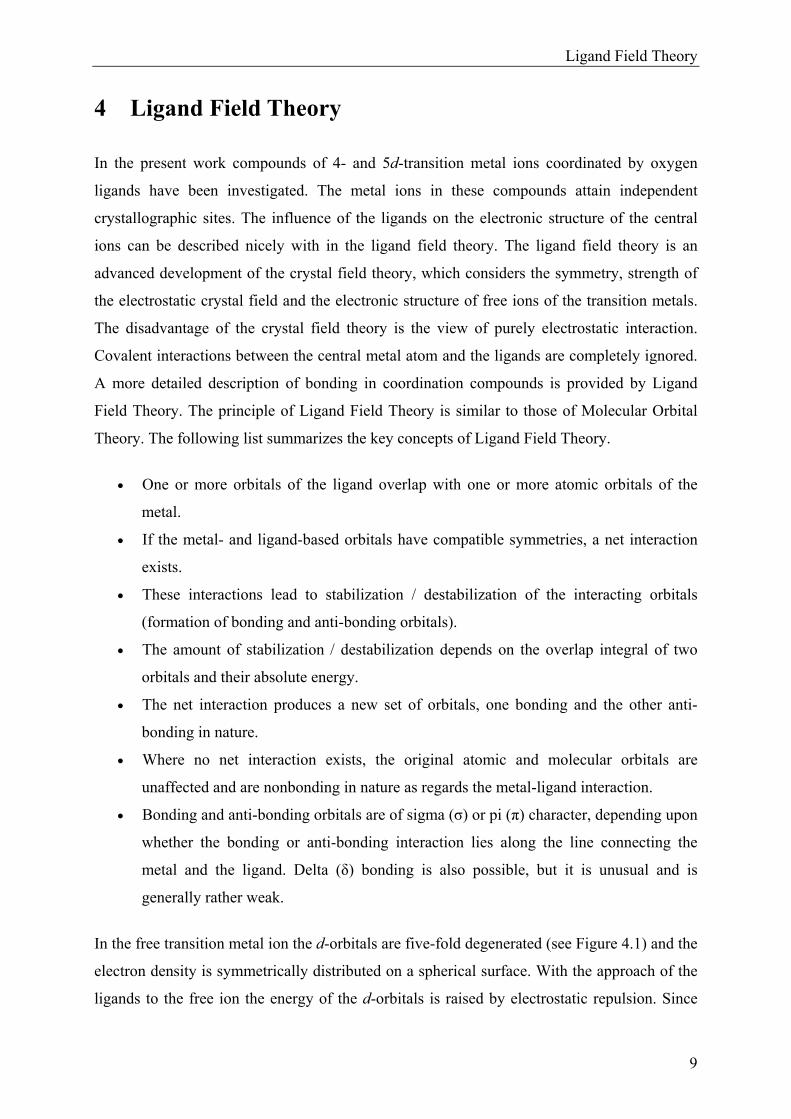
In the free transition metal ion the d-orbitals are five-fold degenerated (see Figure 4.1) and the
electron density is symmetrically distributed on a spherical surface. With the approach of the
ligands to the free ion the energy of the d-orbitals is raised by electrostatic repulsion. Since
Ligand Field Theory
10
the total charge of the ligands is not distributed uniformly on the spherical surface, the
degeneracy of the d-orbitals of the central metal ion is in parts or even completely removed.
Figure 4.1 Representation of the 5 3d-orbitals.
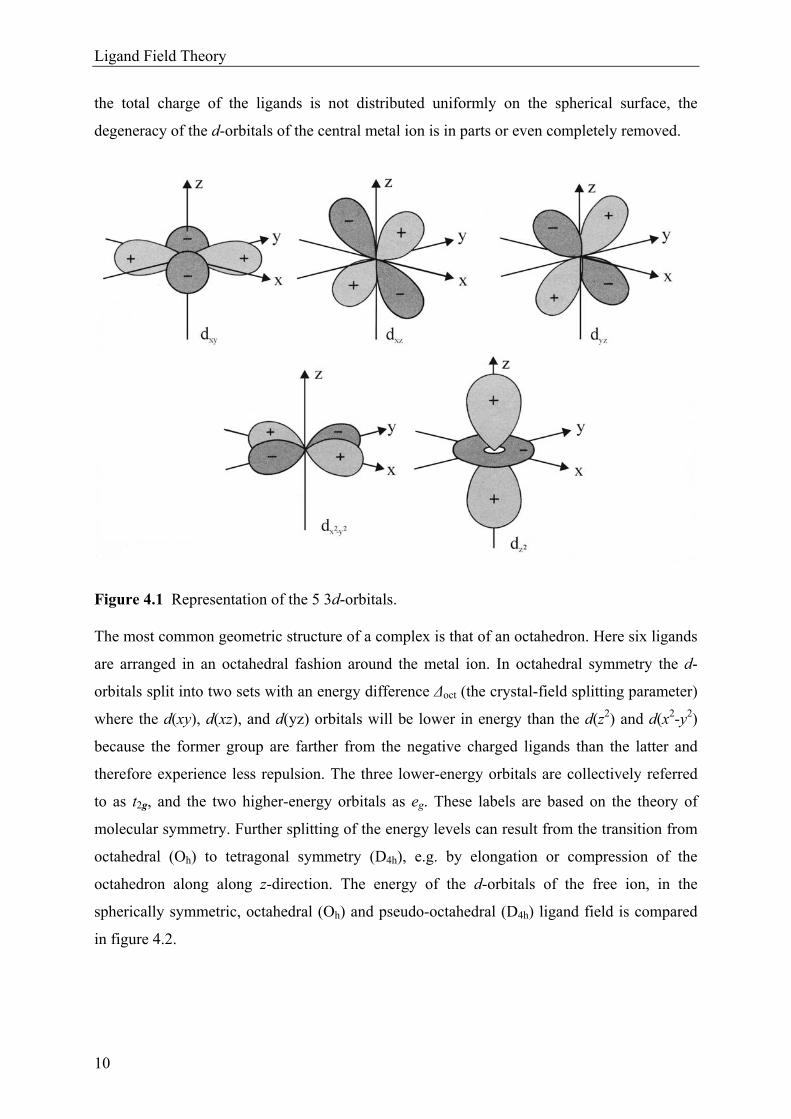
The most common geometric structure of a complex is that of an octahedron. Here six ligands
are arranged in an octahedral fashion around the metal ion. In octahedral symmetry the d-
orbitals split into two sets with an energy difference Δoct (the crystal-field splitting parameter)
where the d(xy), d(xz), and d(yz) orbitals will be lower in energy than the d(z2) and d(x2-y2)
because the former group are farther from the negative charged ligands than the latter and
therefore experience less repulsion. The three lower-energy orbitals are collectively referred
to as t2g, and the two higher-energy orbitals as eg. These labels are based on the theory of
molecular symmetry. Further splitting of the energy levels can result from the transition from
octahedral (Oh) to tetragonal symmetry (D4h), e.g. by elongation or compression of the
octahedron along along z-direction. The energy of the d-orbitals of the free ion, in the
spherically symmetric, octahedral (Oh) and pseudo-octahedral (D4h) ligand field is compared
in figure 4.2.
Ligand Field Theory
11
Figure 4.2 Energy diagram of the d-orbitals for ligand fields of different symmetry. Energy states of the orbitals are represented for free ion (a), spherical symmetry (b), octahedron (Oh) (c), distortions along z-axis so called pseudo octahedra (D4h), while elongation (d) and compression (e) along z-axis.
In case of octahedral symmetry the energy difference between the t2g and eg orbitals is
regarded as Δoct = 10Dq. 10Dq (in cm-1) is regarded as ligand field strength parameter. It
depends on the strength of the ligands, geometry of the complex and the oxidation state of the
central metal ion. The field strength parameter for the transition metal complexes lies in the
range between 7000 ≤ Δo ≤ 30000 cm-1.
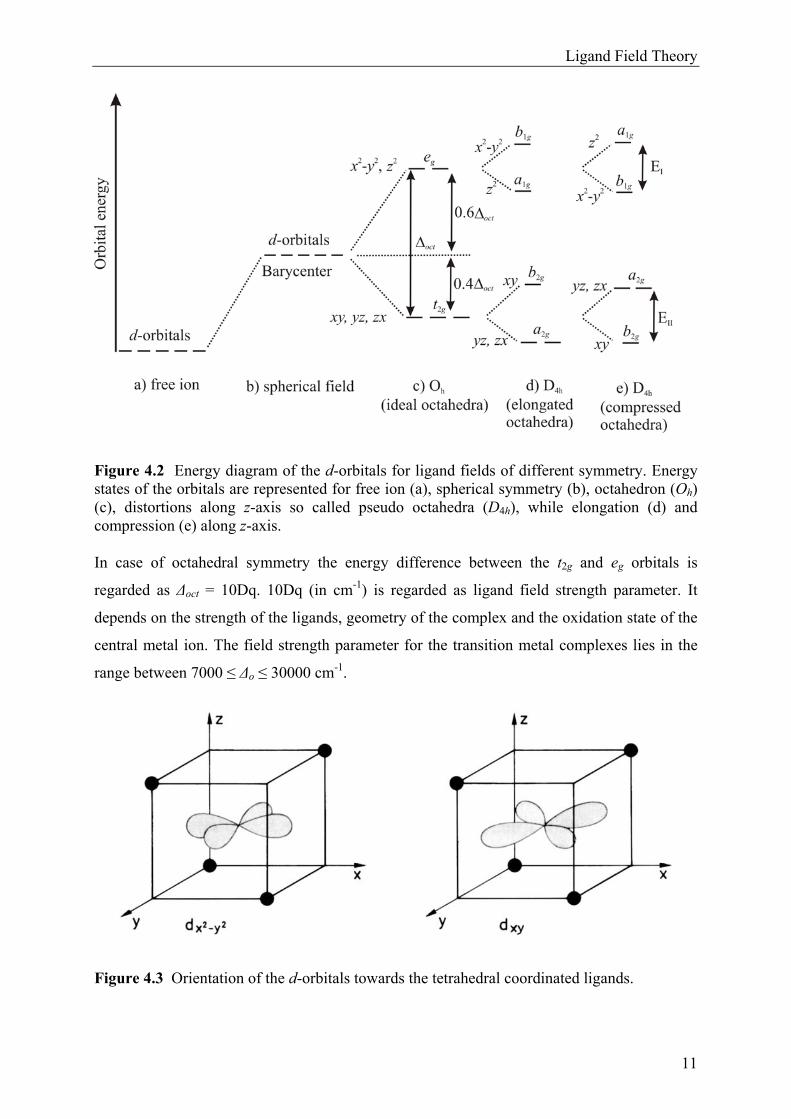
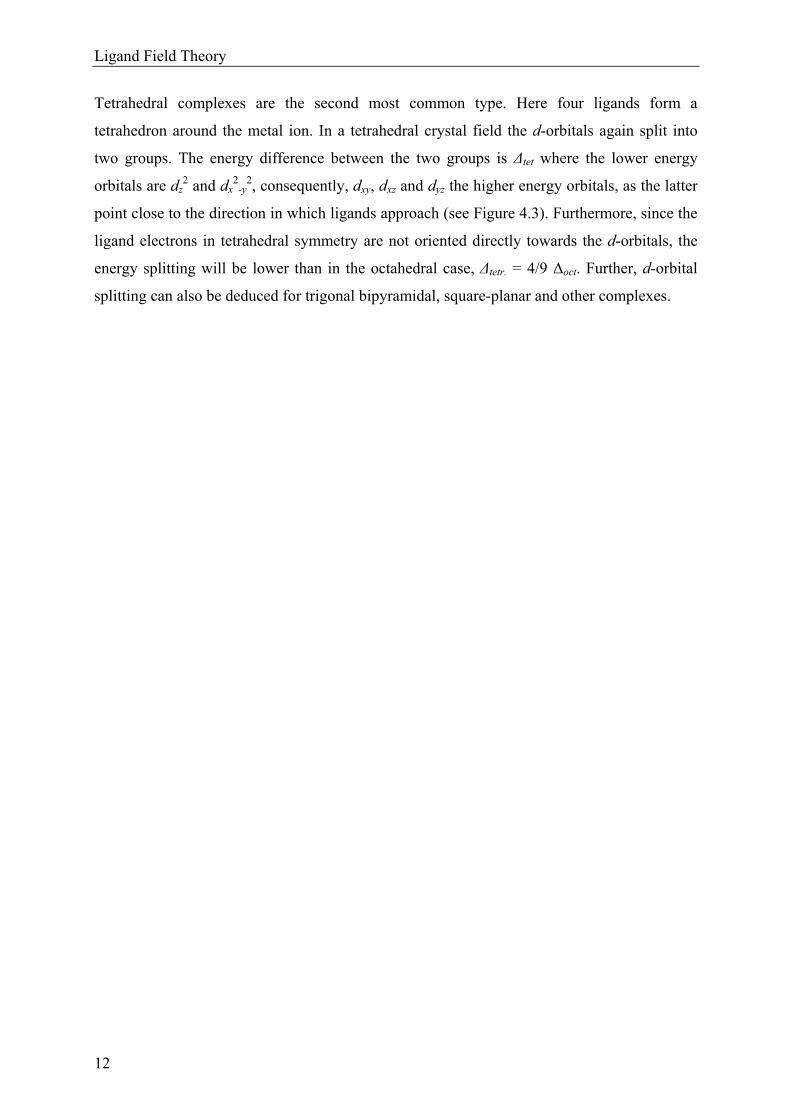
Figure 4.3 Orientation of the d-orbitals towards the tetrahedral coordinated ligands.
Ligand Field Theory
12
Tetrahedral complexes are the second most common type. Here four ligands form a
tetrahedron around the metal ion. In a tetrahedral crystal field the d-orbitals again split into
two groups. The energy difference between the two groups is Δtet where the lower energy
orbitals are dz2 and dx
2-y
2, consequently, dxy, dxz and dyz the higher energy orbitals, as the latter
point close to the direction in which ligands approach (see Figure 4.3). Furthermore, since the
ligand electrons in tetrahedral symmetry are not oriented directly towards the d-orbitals, the
energy splitting will be lower than in the octahedral case, Δtetr. = 4/9 Δoct. Further, d-orbital
splitting can also be deduced for trigonal bipyramidal, square-planar and other complexes.
Experimental
13
5 Experimental
5.1 Preparation of Silica Ampoules
In the present work chemical vapour transports as well as isothermal heating experiments
were carried out exclusively in evacuated sealed silica tubes. These were made from silica
tubes (Ø: 12-18 mm, thickness of the wall: 0.8 - 1.8 mm, length: 150 cm, company GVB,
Aachen). With the help of glass cutter they were at first divided into three pieces of about 50
cm in lengths and then melted in the middle of the already obtained pieces with the help of an
oxygen / hydrogen burner. Thus two half ampoules of about 25 cm in lengths were achieved.
At the open end of the half tubes a ground glass joint (NS 19.5) was attached in order to
connect it to vacuum line.
The ampoules were cleaned thoroughly with customarily used cleaning agents and then rinsed
with demineralised water and acetone respectively. Afterwards these tubes were dried at
105°C overnight in a drying oven. The dried raw ampoules were heated at last in a tube
furnace for about four hours at 800°C under vacuum (10-3 – 10-4 atm) as silica has strong
ability to bind a significant amount of water reversibly [88]. Thus any influence of water on
the experiments should be avoided. Once the ampoules are cooled down to ambient
temperature, they were filled with argon as inert gas and removed from the vacuum line. The
prepared reactants were put in a small sample holder which was attached to a long glass stick
to place the reactants in the tube (e.g. Re2O7, P4O10, I2). Thus contamination on the wall of
tube was avoided. Reactants containing end of the ampoule was cooled with a wet paper or
with liquid nitrogen in order to prevent the vaporization of reactants. Finally a capillary was
made (preferably ~ 10 cm away from the closed end of the half ampoules) with the help of a
oxygen / hydrogen burner and then connected to the vacuum line. If the test of evacuation by
a ionization source (Spark tester, Edwards company) shows a significant amount of
evacuation, the capillary was sealed. This new end of the ampoule is rounded carefully using
a burner. Prior to putting the ampoule into the furnace its surface was cleaned by washing
agents and rinse with acetone and demineralised water to prevent recrystallization of the silica
during annealing.
Experimental
14
5.2 Vacuum Line
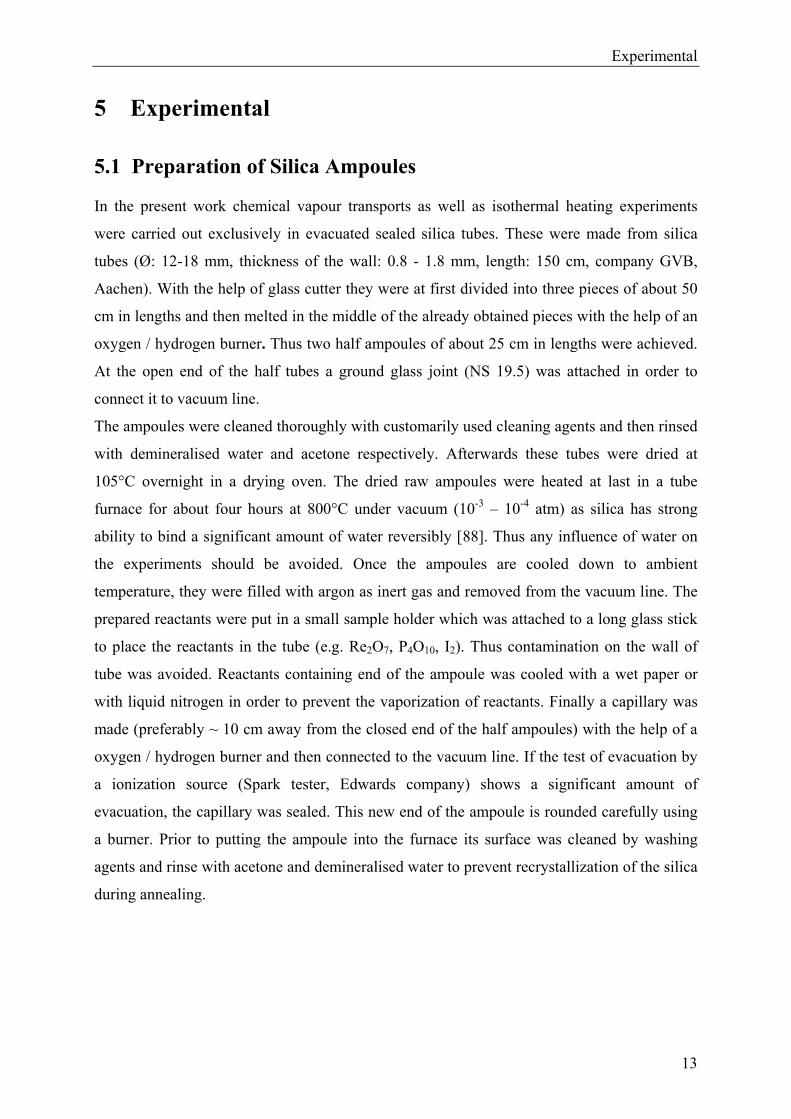
Figure 5.1 represents a combination of the heating furnace and a vacuum pump that allows the
preparation of silica ampoules for the isothermal and chemical vapour transport experiments.
This combination lets simultaneous drying and evacuation of the ampoule. At the final stage
the half ampoule were filled with dry argon. For evacuating an oil pump (BS5000, Edwards
company) was used.
Figure 5.1 Lay out of the vacuum line [18].
Experimental
15
5.3 Furnaces
For the synthesis and crystallization experiments different types of furnaces were used. A
single zone tube furnace was used to heat the ampoules during the evacuation. It consists of a
ceramic tube which is made of pythagorasmass with an inner diameter of 4 cm. A heating coil
made of Kanthal wire (Kanthal A-1: 22% Cr, 5.8% Al, 72.2% Fe) attach just to the outer
surface of the tube which is then surrounded by an insulator to prevent the loss of heat.
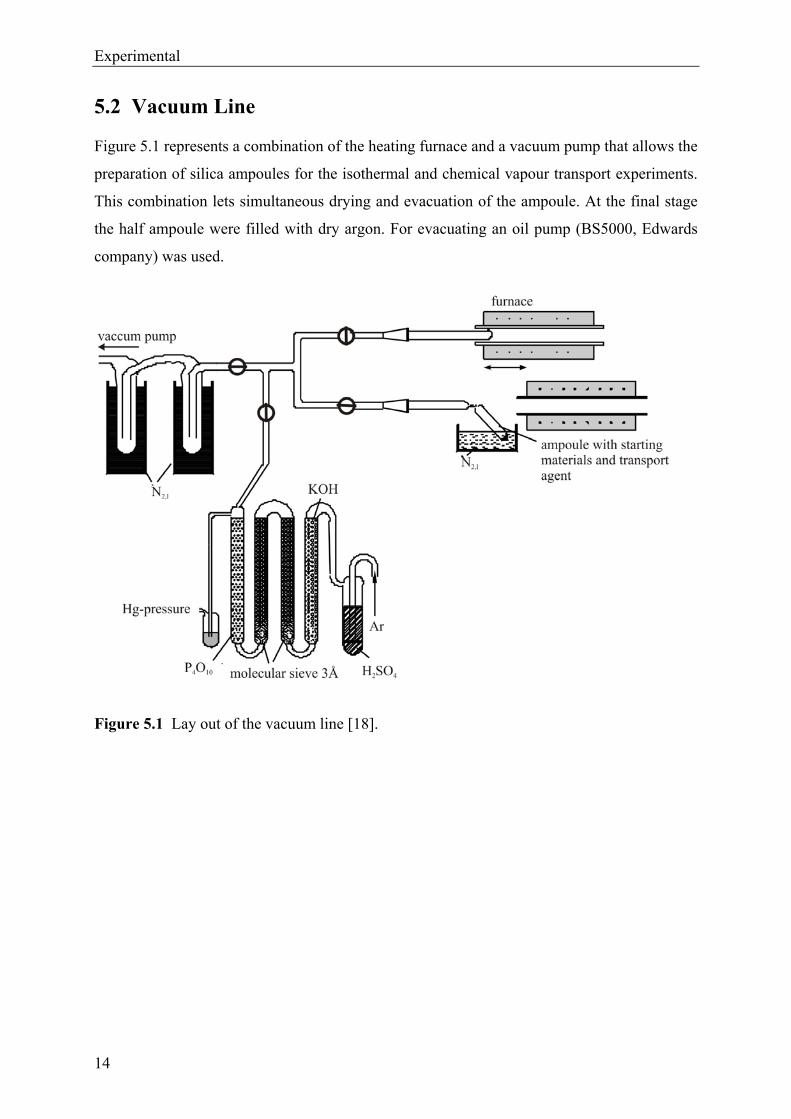
Chemical Vapour Transport was carried out in a two zone tube furnace so called “transport
furnace”. It consists of two independent heating coils. Thus the two sides of the tube furnace
can be heated to different temperatures. This furnace can work up to 1100°C. A continuous
temperature gradient is always established between the defined temperatures. The temperature
drops significantly at the ends of the furnace (see Figure 5.2). Both ends of the furnace are
closed with ceramic stoppers in order to stabilize the temperature and to reduce thermal
convection. The temperature of the furnace is controlled either by Pt/Pt-Rh or Ni/Cr-thermo
couples.
Figure 5.2 Temperature profile of a two zone furnace. T max ~ 1100°C, T: 50 – 150°C, thermocouple at the ends of the ampoule.
Isothermal experiments were carried out in sealed ampoules. In some cases the reactants were
heated in half ampoules in muffle furnaces (Type Le16 7PS from Lenton Furnaces or type
B170 from Nabertherm) in order to release water or other volatile substances.
Experimental
16
5.4 Solid-state Reactions
In most cases solid state reactions exhibit a very slow reaction rate which is due to the very
slow diffusion of the reactants into each other. Therefore, mineralizers are used sometimes to
speed up the reaction rate. The use of some mineralizers, for example chlorine, however may
dissolve a significant amount of SiO2 from the wall of the silica tube. Another approach to
speed up the reaction rate is to reduce the length of the diffusion path among the reactants.
This can be achieved through a homogeneous mixture of finely ground reactants. The
homogeneity of the mixture can be achieved by mixing the reactants thoroughly in an agate
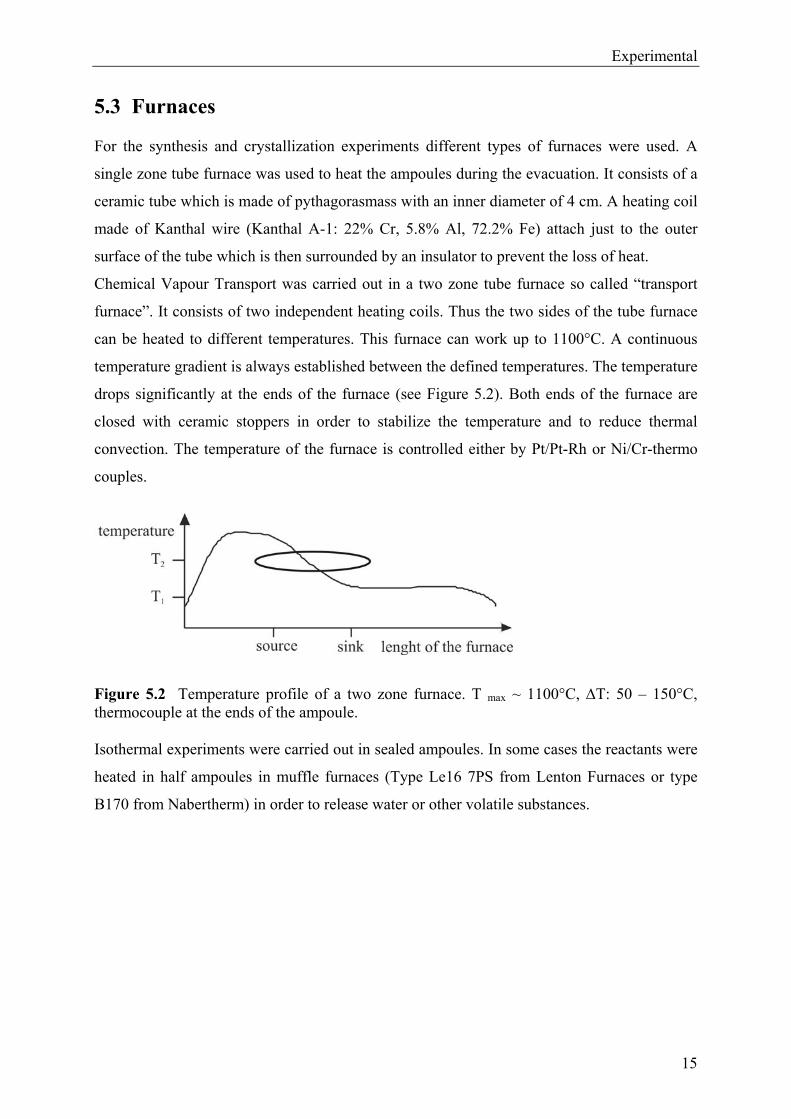
mortar and a pellet can be prepared by applying a pressure on the mixture. About 200 mg of
the homogeneously ground mixture were introduced into the slot of the powder compaction
tool (see Figure 5.3a) with the help of a funnel. It is then inserted in the hydraulic press (see
Figure 5.3b) and the pellet is obtained by a force of 20 kN for about 20 minutes. Finally, the
pressure is relaxed carefully and the pellet is taken from the tool. In this way, rectangular
pellets with dimensions of about 1222 mm3 were prepared. This sample was then
transferred into the silica tube according to section 5.1 and heated in the furnace. An
important advantage of the pellet is its low contact with the ampoule wall by which reaction
between the sample and the silica wall can be minimized.
Figure 5.3 Lay out of the sample holder (a) and Hydraulic Press (b).
a) b)
Experimental
17
5.5 Chemical Vapour Transport Experiments
At the very beginning furnace zones are set to the desired temperatures. The already prepared
ampoule (see. Sect. 5.1) is brought into the transport furnace in such a way so that about ⅔ of
the ampoule remain at the source temperature and ⅓ at the sink temperature. Thus, a small
crystallization zone can be ensured. The ampoule is at first held in a reverse temperature
gradient for about 24 hours which is in opposite to the actual transport direction (reverse
transport). Consequently, the sink end of the ampoule can be cleaned by removing unwanted
crystal seeds. At the end of the transport experiment the source side of the ampoule is
removed at first so that all the unwanted gaseous species are condensed. The hot ampoule is
put on a curved gauge and the source end is sunk down in cold water or liquid nitrogen so that
condensation of the equilibrium gas phase occurs rapidly. Thus, contamination of the crystals
grown in the sink region can be avoided. The tube was cut into two approximately equal parts
by a diamond saw. The crystals or the solid substances are taken out from the ampoule very
carefully. If they are attached firmly to the ampoule wall, the half ampoule is filled with 5%
hydrofluoric acid. After couple of hours, the crystals separated from the wall can be collected.
The solid substances are filtered and then washed by distilled water. Subsequently, they are
dried in the drying oven for about one hour and then examined under the microscope.
Characterization Methods
18
6 Characterization Methods
In the present work all the solid compounds were identified by X-ray powder diffraction.
Crystals of unknown substances were structurally characterized by X-ray single-crystal
studies as well. Elemental analyses were carried out with the help of energy-dispersive X-ray
fluorescence (EDX). In addition, selected compounds have been investigated by spectroscopic
techniques such as Solid-state MAS-NMR, UV/Vis/NIR, Infrared, and Raman. Magnetic
behaviour was also studied for some molybdenum- and rhenium-phosphates.
6.1 X-ray Diffraction Techniques
X-ray scattering is used in a family of non-destructive analytical techniques which provides
information about the crystallographic structure and chemical composition of solids. These
techniques are based on the scattering X-rays hitting a crystalline substance. X-ray
wavelengths are comparable with inter-atomic distances (~1Å). Therefore, it is regarded an
excellent means of crystal diffraction study for this length scale. Atoms scatter X-ray waves,
primarily through the atoms' electrons that can emanate secondary spherical waves. This
phenomenon is known as elastic scattering, and the electron shell is known as the scatterer. A
regular array of scatterers produces a regular array of spherical waves. Although these waves
cancel one another out for most of the directions through destructive interference, they add
constructively in a few specific directions, determined by BRAGG'S law [89] (see Equation
6.1.1).
n· = 2·d·sin (6.1.1)
where n is an integer determined by the order given, λ is the wavelength of the X-rays , d is
the spacing between the planes in the atomic lattice, and θ is the angle between the incident
ray and the scattering planes.
Characterization Methods
19
6.1.1 X-ray Powder Diffraction
6.1.1.1 The Guinier Method
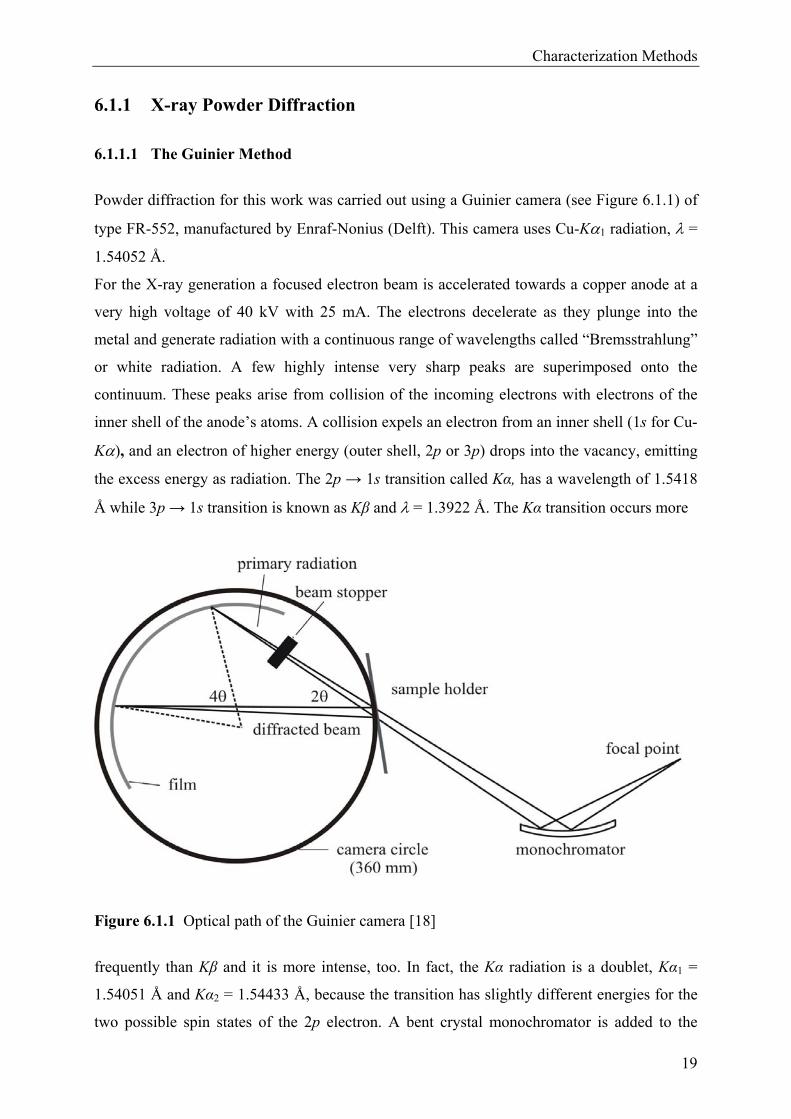
Powder diffraction for this work was carried out using a Guinier camera (see Figure 6.1.1) of
type FR-552, manufactured by Enraf-Nonius (Delft). This camera uses Cu-K1 radiation, =
1.54052 Å.
For the X-ray generation a focused electron beam is accelerated towards a copper anode at a
very high voltage of 40 kV with 25 mA. The electrons decelerate as they plunge into the
metal and generate radiation with a continuous range of wavelengths called “Bremsstrahlung”
or white radiation. A few highly intense very sharp peaks are superimposed onto the
continuum. These peaks arise from collision of the incoming electrons with electrons of the
inner shell of the anode’s atoms. A collision expels an electron from an inner shell (1s for Cu-
K), and an electron of higher energy (outer shell, 2p or 3p) drops into the vacancy, emitting
the excess energy as radiation. The 2p → 1s transition called Kα, has a wavelength of 1.5418
Å while 3p → 1s transition is known as Kβ and = 1.3922 Å. The Kα transition occurs more
Figure 6.1.1 Optical path of the Guinier camera [18]
frequently than Kβ and it is more intense, too. In fact, the Kα radiation is a doublet, Kα1 =
1.54051 Å and Kα2 = 1.54433 Å, because the transition has slightly different energies for the
two possible spin states of the 2p electron. A bent crystal monochromator is added to the
Characterization Methods
20
Guinier focusing camera that allows the separation of the Kα1 (used for the X-ray diffraction)
from the rest and also to produce an intense convergent X-ray beam. The crystal
monochromator consists of a large (1-2 cm) bent single-crystal of quartz (α-SiO2), orientated
such that by the (101) plane strongly monochromatic X-ray beam is diffracted. The
monochromatic beam strikes a finely powdered sample that, ideally, has crystals randomly
arranged in every possible orientation. In such a powder sample, the various lattice planes are
also present in every possible orientation. For each set of planes, at least some crystals must
be orientated at the Bragg angle θ, to the incident beam. Thus, diffraction occurs for these
crystalites. The sample and the diffracted beams are arranged to focus at the surface of the
film. Radiation that is not diffracted is stopped by a beam stopper, placed in front of the
photographic film to prevent its blackening.
For the present work, a non-conventional film, so called image plate (IP) film of type BAS-IP
MS 2325 manufactured by Fuji was used. The chosen geometry results from the inter relation
between diffraction angle, 4θ, and the distance of the reflection position from the primary
beam on the film. 1 mm distance corresponds exactly to 1° (in 4θ). The IP is approximately
0.5 mm in thickness, and is composed of a flexible plastic coated with fine X-ray sensitive
phosphor crystals of BaFBr:Eu2+ combined with an organic layer. The IP technology is based
on “photo stimulated luminescence” (PSL) [90]. When the image plate is bit by incoming X-
rays, some of the Eu2+ is oxidized to Eu3+ liberating electrons to the conduction band of the
crystal. The electrons are trapped in bromine vacancies, forming a color centre. These are
called F-centres and store information. This latent diffraction pattern is scanned afterwards
with a laser scanner. For this work an instrument BAS-1800 II manufactured by Fuji was
used. By stimulation of laser (λ = 632.8 nm) the stored information is released as light of
wavelength λ = 390 nm, where the intensity of the luminescence UV-radiation is proportional
to the intensity of absorbed X-ray.
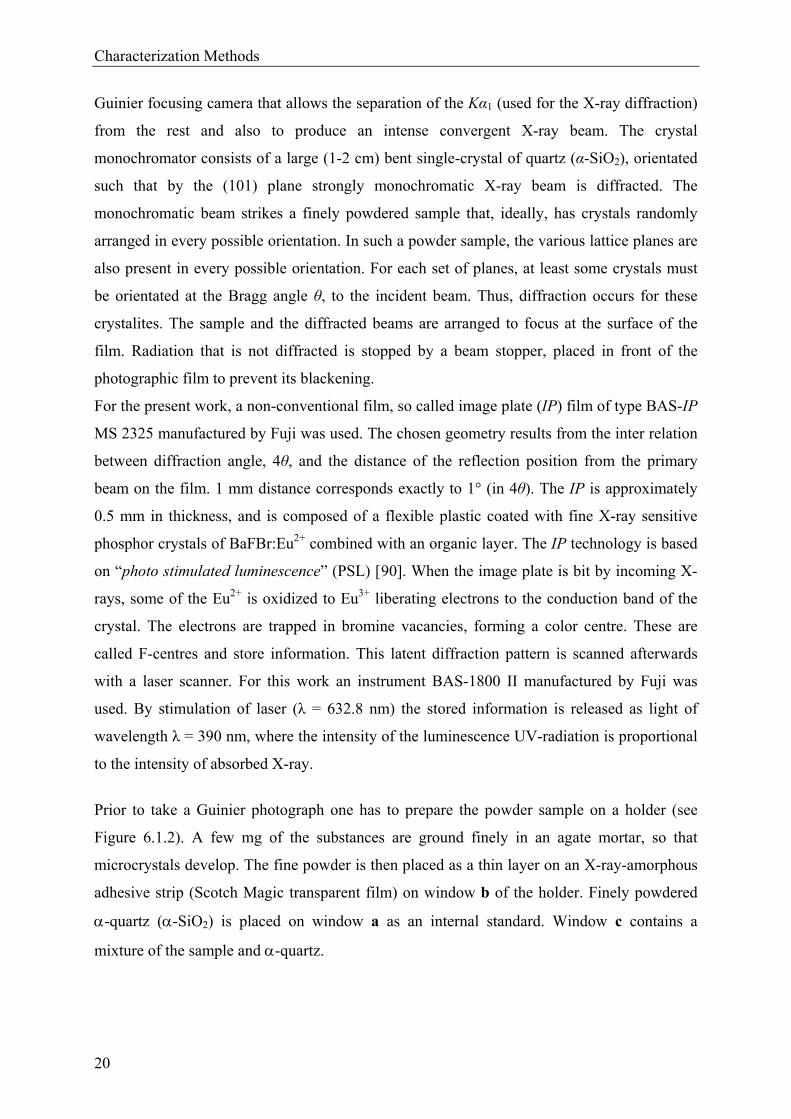
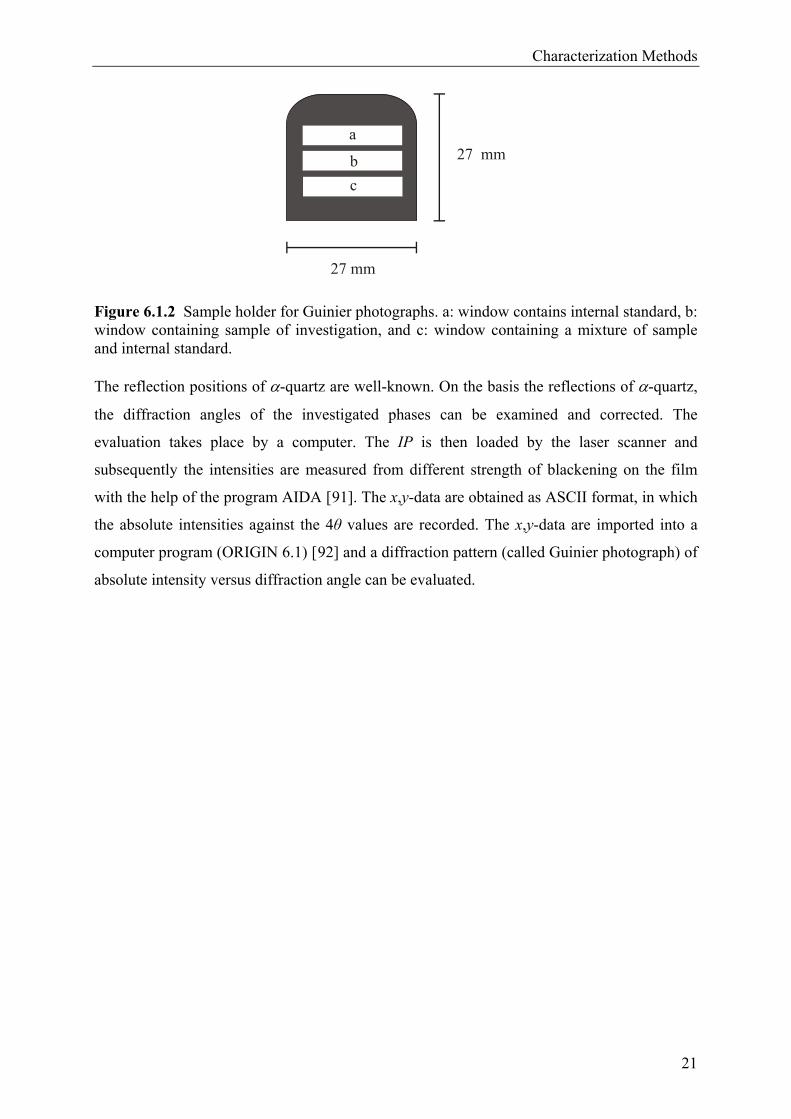
Prior to take a Guinier photograph one has to prepare the powder sample on a holder (see
Figure 6.1.2). A few mg of the substances are ground finely in an agate mortar, so that
microcrystals develop. The fine powder is then placed as a thin layer on an X-ray-amorphous
adhesive strip (Scotch Magic transparent film) on window b of the holder. Finely powdered
-quartz (-SiO2) is placed on window a as an internal standard. Window c contains a
mixture of the sample and -quartz.
Characterization Methods
21
c
a27 mm
27 mm
b
Figure 6.1.2 Sample holder for Guinier photographs. a: window contains internal standard, b: window containing sample of investigation, and c: window containing a mixture of sample and internal standard.
The reflection positions of -quartz are well-known. On the basis the reflections of -quartz,
the diffraction angles of the investigated phases can be examined and corrected. The
evaluation takes place by a computer. The IP is then loaded by the laser scanner and
subsequently the intensities are measured from different strength of blackening on the film
with the help of the program AIDA [91]. The x,y-data are obtained as ASCII format, in which
the absolute intensities against the 4θ values are recorded. The x,y-data are imported into a
computer program (ORIGIN 6.1) [92] and a diffraction pattern (called Guinier photograph) of
absolute intensity versus diffraction angle can be evaluated.
Characterization Methods
22
6.1.1.2 Simulations and Analyses of X-ray Powder Diffraction
In order to identify the investigated compounds already obtained powder diffraction patterns
were compared with the simulation of the diffraction patterns of already known compounds
from the Inorganic Crystal System Database (ICSD) [93]. With the help of the computer
program LAZY PULVERIX [94] the integrated intensity (Ic) of each powder diffraction peak
can be calculated according to equation 6.1.2.
ATHPLGFICC
2
(6.1.2)
Fc Calculated structure factor PLG Polarization-, Lorentz- und Geometric factor H Multiplicity factor T Temperature factor A Absorption factor
The computer program SOS [95] allows the determination of the cell parameters on the basis
of the diffraction angles, obtained from Guinier photographs. SOS1 accomplishes a correction
of reflection positions with the help of an internal standard (-SiO2). The error like an
incorrect positioning of the film in the camera’s film holder can be corrected. This correction
of the reflection position is attained by the corresponding polynomial regression of the fourth
order using the program SOS1. From the accurate position of the reflections SOS2 determines
the cell parameters with the help of the principle of “least square errors”, whereby the
indexing of the reflections has to be known. In case of new compounds the indexing can
either be achieved from single crystal data or from indexing by “Trial and Error” [96] or with
computer programs like TREOR-90 [97], DICVOL [98] or VISSER [99] (in Program packet
WinPLOTR [100]). All these programs are using to the de Wolff algorithm [101].
Characterization Methods
23
6.1.2 Single-crystal Investigations
Single-crystal X-ray diffraction is a powerful analytical technique which provides detailed
information about the structure of crystalline substances, including unit cell dimensions,
bond-lengths, bond-angles, and on site-ordering.
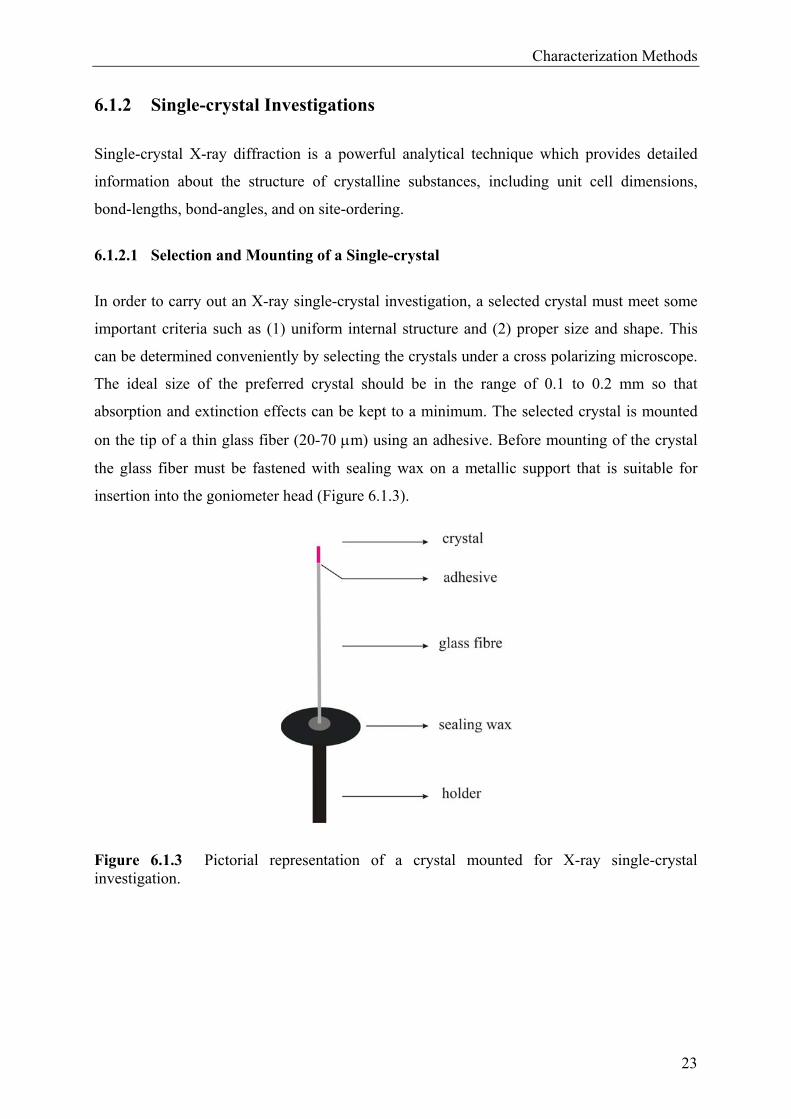
6.1.2.1 Selection and Mounting of a Single-crystal
In order to carry out an X-ray single-crystal investigation, a selected crystal must meet some
important criteria such as (1) uniform internal structure and (2) proper size and shape. This
can be determined conveniently by selecting the crystals under a cross polarizing microscope.
The ideal size of the preferred crystal should be in the range of 0.1 to 0.2 mm so that
absorption and extinction effects can be kept to a minimum. The selected crystal is mounted
on the tip of a thin glass fiber (20-70 m) using an adhesive. Before mounting of the crystal
the glass fiber must be fastened with sealing wax on a metallic support that is suitable for
insertion into the goniometer head (Figure 6.1.3).
Figure 6.1.3 Pictorial representation of a crystal mounted for X-ray single-crystal investigation.
Characterization Methods
24
6.1.2.2 Intensity Data Collection Using a κ-CCD Diffractometer
A charge-coupled device (CCD) is a detector that is based on a method of electronic imaging,
which employs an X-ray sensitive layer of fluorescent material such as gadolinium oxide.
Reflections can be recorded very fast by the CCD detector. A disadvantage is the level of
background noise which is problematic especially for weakly scattering materials or the
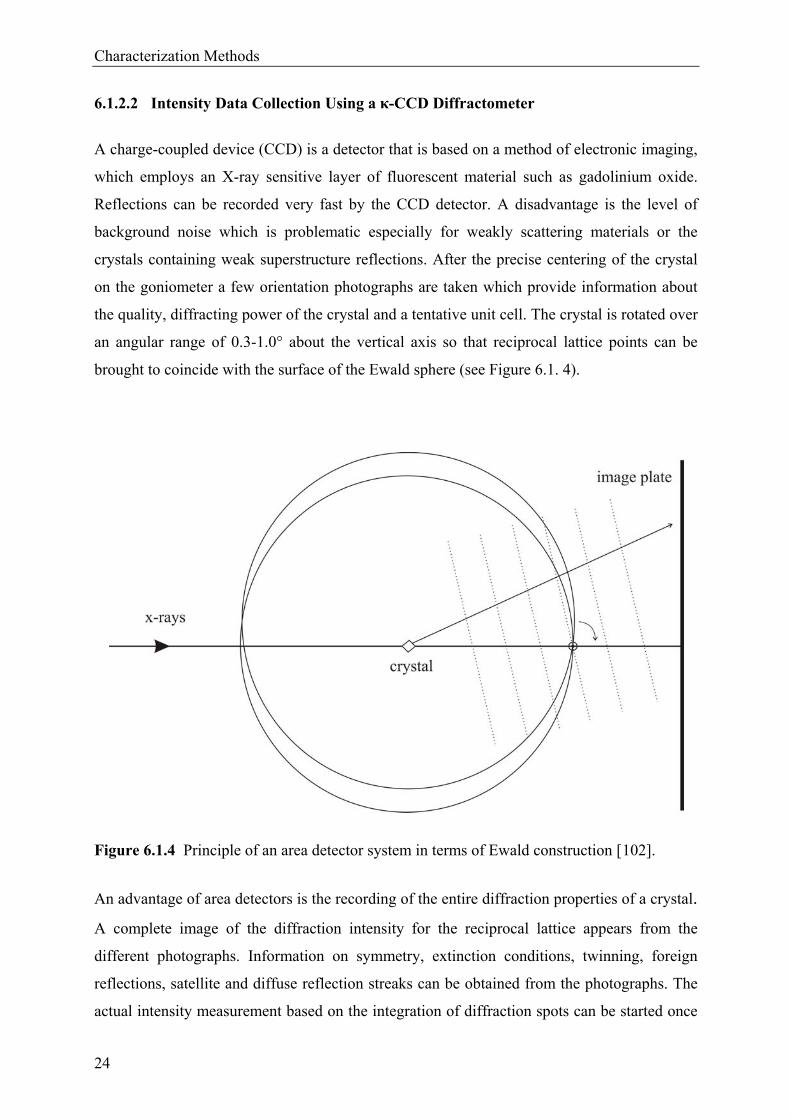
crystals containing weak superstructure reflections. After the precise centering of the crystal
on the goniometer a few orientation photographs are taken which provide information about
the quality, diffracting power of the crystal and a tentative unit cell. The crystal is rotated over
an angular range of 0.3-1.0° about the vertical axis so that reciprocal lattice points can be
brought to coincide with the surface of the Ewald sphere (see Figure 6.1. 4).
Figure 6.1.4 Principle of an area detector system in terms of Ewald construction [102].
An advantage of area detectors is the recording of the entire diffraction properties of a crystal.
A complete image of the diffraction intensity for the reciprocal lattice appears from the
different photographs. Information on symmetry, extinction conditions, twinning, foreign
reflections, satellite and diffuse reflection streaks can be obtained from the photographs. The
actual intensity measurement based on the integration of diffraction spots can be started once
Characterization Methods
25
no anomalies in the data were found. The initial step is to determine a more accurate
orientation matrix by selecting a range of spot positions throughout the data. Then a
computer-assisted program can determine the angle dependent reflection profiles. From the
matrix of this profile information, the software can refine the exposures and the positions to
search for components of each reflection hkl. Around the calculated positions a circular area is
scanned with an area determined by a profile-function. The pixel intensities inside the circle
are summed to yield the raw intensity. The intensities around the edge are used to estimate the
background. These are then scaled and subtracted from the raw intensities to acquire a net
intensity. After the data collection and reduction, the corrected intensities can be converted
into the structure factors Fo, which are directly comparable with the calculated values Fc.
From the corrected data, the starting positional parameters are obtained by the program with
the help of Direct Methods (SHELXS-97 [103]) or Charge Flipping (SUPERFLIP [104]).
Finally, the crystal structure is refined using the program SHELX-97 [105].
Characterization Methods
26
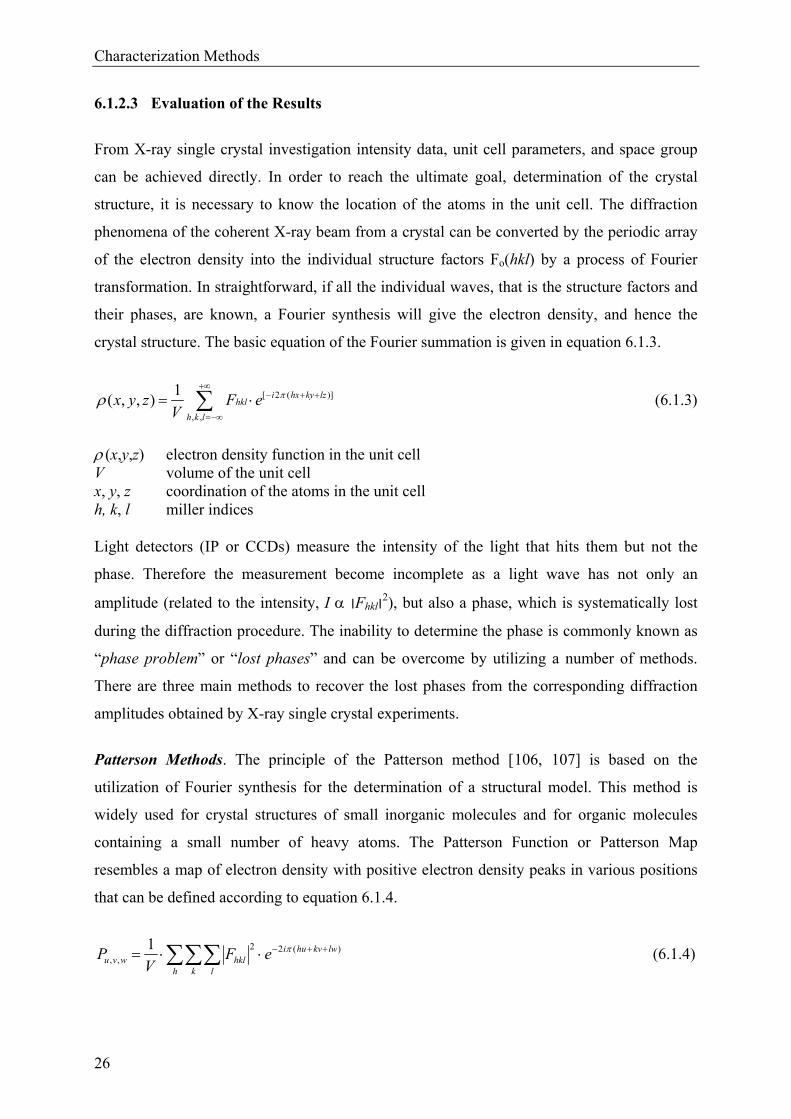
6.1.2.3 Evaluation of the Results
From X-ray single crystal investigation intensity data, unit cell parameters, and space group
can be achieved directly. In order to reach the ultimate goal, determination of the crystal
structure, it is necessary to know the location of the atoms in the unit cell. The diffraction
phenomena of the coherent X-ray beam from a crystal can be converted by the periodic array
of the electron density into the individual structure factors Fo(hkl) by a process of Fourier
transformation. In straightforward, if all the individual waves, that is the structure factors and
their phases, are known, a Fourier synthesis will give the electron density, and hence the
crystal structure. The basic equation of the Fourier summation is given in equation 6.1.3.
[ 2 ( )]
, ,
1( , , ) i hx ky lz
hkl
h k l
x y z F eV
(6.1.3)
(x,y,z) electron density function in the unit cell V volume of the unit cell x, y, z coordination of the atoms in the unit cell h, k, l miller indices
Light detectors (IP or CCDs) measure the intensity of the light that hits them but not the
phase. Therefore the measurement become incomplete as a light wave has not only an
amplitude (related to the intensity, I ׀Fhkl׀2), but also a phase, which is systematically lost
during the diffraction procedure. The inability to determine the phase is commonly known as
“phase problem” or “lost phases” and can be overcome by utilizing a number of methods.
There are three main methods to recover the lost phases from the corresponding diffraction
amplitudes obtained by X-ray single crystal experiments.
Patterson Methods. The principle of the Patterson method [106, 107] is based on the
utilization of Fourier synthesis for the determination of a structural model. This method is
widely used for crystal structures of small inorganic molecules and for organic molecules
containing a small number of heavy atoms. The Patterson Function or Patterson Map
resembles a map of electron density with positive electron density peaks in various positions
that can be defined according to equation 6.1.4.
h k l
lwkvhuihklwvu eF
VP )(22
,,
1 (6.1.4)
Characterization Methods
27
Pu, v, w patterson-fuction V volume of the unit cell u, v, w coordinates in Patterson-space
2
hklF structure factor
h, k, l miller indices
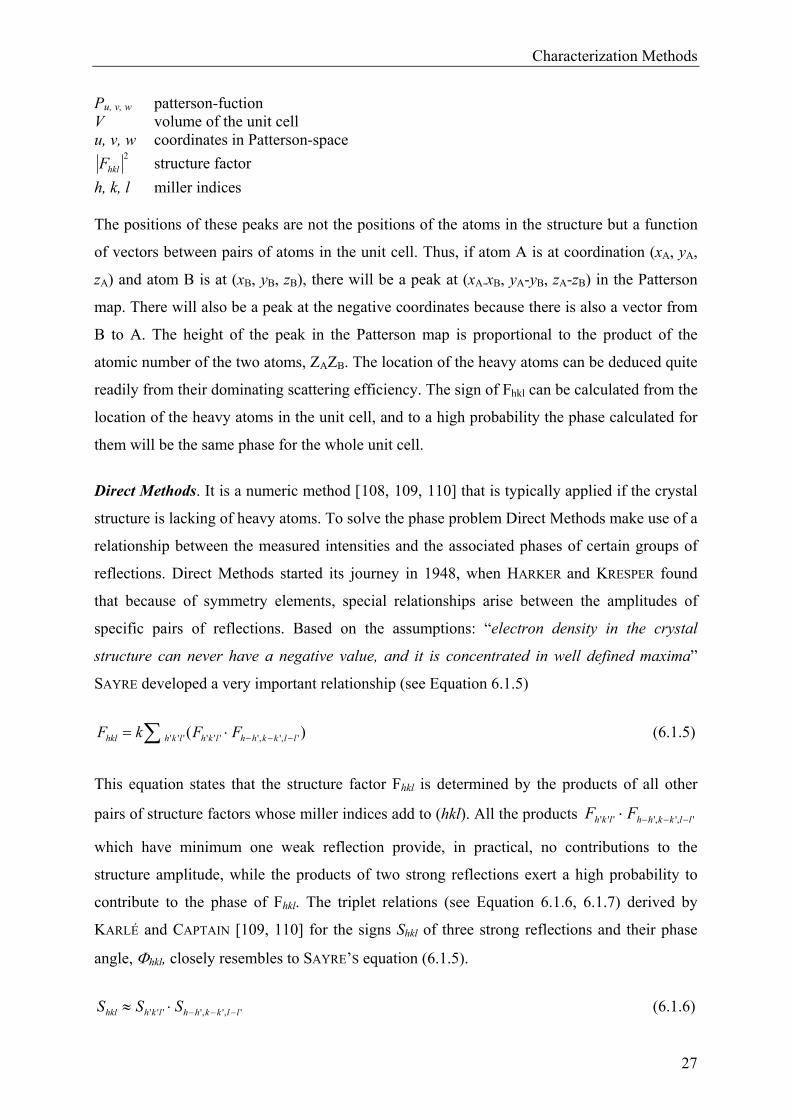
The positions of these peaks are not the positions of the atoms in the structure but a function
of vectors between pairs of atoms in the unit cell. Thus, if atom A is at coordination (xA, yA,
zA) and atom B is at (xB, yB, zB), there will be a peak at (xA-xB, yA-yB, zA-zB) in the Patterson
map. There will also be a peak at the negative coordinates because there is also a vector from
B to A. The height of the peak in the Patterson map is proportional to the product of the
atomic number of the two atoms, ZAZB. The location of the heavy atoms can be deduced quite
readily from their dominating scattering efficiency. The sign of Fhkl can be calculated from the
location of the heavy atoms in the unit cell, and to a high probability the phase calculated for
them will be the same phase for the whole unit cell.
Direct Methods. It is a numeric method [108, 109, 110] that is typically applied if the crystal
structure is lacking of heavy atoms. To solve the phase problem Direct Methods make use of a
relationship between the measured intensities and the associated phases of certain groups of
reflections. Direct Methods started its journey in 1948, when HARKER and KRESPER found
that because of symmetry elements, special relationships arise between the amplitudes of
specific pairs of reflections. Based on the assumptions: “electron density in the crystal
structure can never have a negative value, and it is concentrated in well defined maxima”
SAYRE developed a very important relationship (see Equation 6.1.5)
)( ',',''''''' llkkhhlkhlkhhkl FFkF (6.1.5)
This equation states that the structure factor Fhkl is determined by the products of all other
pairs of structure factors whose miller indices add to (hkl). All the products ',','''' llkkhhlkh FF
which have minimum one weak reflection provide, in practical, no contributions to the
structure amplitude, while the products of two strong reflections exert a high probability to
contribute to the phase of Fhkl. The triplet relations (see Equation 6.1.6, 6.1.7) derived by
KARLÉ and CAPTAIN [109, 110] for the signs Shkl of three strong reflections and their phase
angle, hkl, closely resembles to SAYRE’S equation (6.1.5).
',','''' llkkhhlkhhkl SSS (6.1.6)
Characterization Methods
28
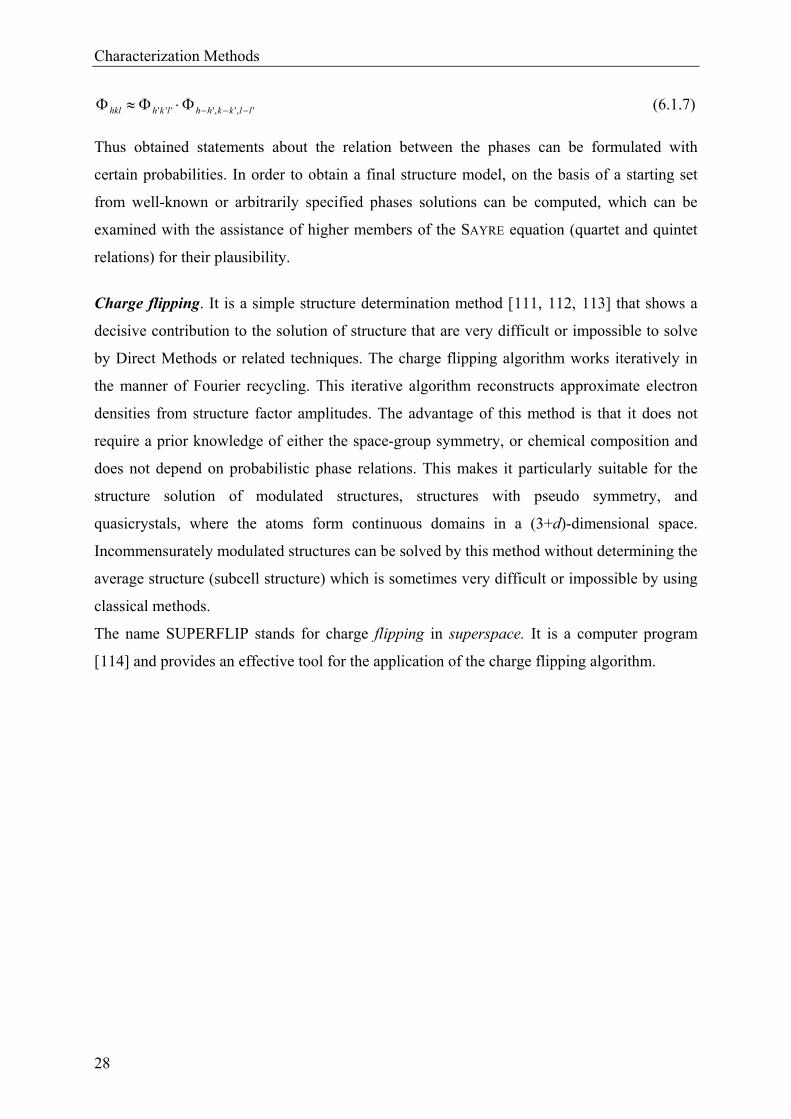
',','''' llkkhhlkhhkl (6.1.7)
Thus obtained statements about the relation between the phases can be formulated with
certain probabilities. In order to obtain a final structure model, on the basis of a starting set
from well-known or arbitrarily specified phases solutions can be computed, which can be
examined with the assistance of higher members of the SAYRE equation (quartet and quintet
relations) for their plausibility.
Charge flipping. It is a simple structure determination method [111, 112, 113] that shows a
decisive contribution to the solution of structure that are very difficult or impossible to solve
by Direct Methods or related techniques. The charge flipping algorithm works iteratively in
the manner of Fourier recycling. This iterative algorithm reconstructs approximate electron
densities from structure factor amplitudes. The advantage of this method is that it does not
require a prior knowledge of either the space-group symmetry, or chemical composition and
does not depend on probabilistic phase relations. This makes it particularly suitable for the
structure solution of modulated structures, structures with pseudo symmetry, and
quasicrystals, where the atoms form continuous domains in a (3+d)-dimensional space.
Incommensurately modulated structures can be solved by this method without determining the
average structure (subcell structure) which is sometimes very difficult or impossible by using
classical methods.
The name SUPERFLIP stands for charge flipping in superspace. It is a computer program
[114] and provides an effective tool for the application of the charge flipping algorithm.
Characterization Methods
29
6.1.2.4 Structure Solution and Refinement
The Difference Fourier Syntheses. Using the starting atomic positions obtained by methdods
described in section 6.1.2.3 Difference Fourier Syntheses (program SHELXL-97 [105]) can
calculate the atomic positions as well as anisotropic displacement parameters for all the
atoms. However, the resulting structural model contains still errors, which are due to the
shortcoming of the solution methods or the calculation of electron density maxima from
Fourier syntheses, and errors within the recorded data set. Therefore, the calculated structure
factors Fc for the reflection hkl do not match with the observed Fo-values. For this
discrepancy Difference Fourier Syntheses are necessary to obtain FOURIER-coefficients (Fo-
Fc) (see Equation 6.1.8).
h k l
lzkyhxicocalcobs eFF
V)(2)(
1 (6.1.8)
difference of the electron density obs. observed electron density calc. calculated electron density V volume of the unit cell Fo observed structure amplitude Fc calculated structure amplitude hkl miller indices x, y, z positional parameter of the atoms
The Difference Fourier Syntheses describe the difference between the electron density of the
real structure and the incompletely determined structural model. Therefore for the structural
model, where the atoms are missing considerable electron density maxima arise, which must
be assigned to appropriate atoms in the next step of the refinement. The closer the structural
model approaches the actual crystal structure, the less is the difference of the electron density.
Difference Fourier Syntheses has several valuable properties which are as following:
(1) Incorrectly placed atoms correspond to the regions of high electron density in
calc(x,y,z) and low density in o(x,y,z), (x,y,z) is therefore negative in this regions.
(2) A correctly placed atom with either too small atomic number or too high temperature
factor, shows up as a small positive area in . The converse situations produce
negative peaks in .
(3) An atom that requires a small positional correction tends to lie in a negative area at the
side of a small positive peak. The correction is applied by moving the atom into the
positive area.
Characterization Methods
30
(4) Very light atoms, such as hydrogen, may be revealed by a synthesis when the
places are essentially correct, after least squares refinement has been carried out.
Least Square Refinement. It is a method used to compare experimental data with calculated
data to obtain a degree of similarity between them. For crystal structure refinement the
similarities between the experimental (observed) structural factor, Fo, and calculated
structural factor, Fc is compared in term of the residual index or R-factor by equation 6.1.9.
hklo
hklco
F
FFR (6.1.9)
R residual value (R1 value)
0F observed structure factor
cF calculated structure factor
Ideal solutions would have R-values of 0, however, due to random errors, this is never
achieved. R-values (listed as percents) of less than 5% are considered good solutions; high
quality refinements often result in R-values lower than 2.5%. wR2 is similar to R1, but refers to
squared F-values. This results in wR2 always higher than R1 (about twice as high).
hklo
hklco
Fw
FFwwR
22
222
2)(
)( (6.1.10)
with PvPuF
wo
222 )()(
1
(6.1.10a)
and LP
IFo
)(
)( 2 (6.1.10b)
wR2 weighted R-value w weighting factor (Fo
2) standard deviation from Fo2
(I) standard deviation of the intensity Fo
2 observed structure factor P polarization factor ( /3)2( 22
co FFP )
Fc2 calculated structure factor
L Lorentz-Factor u, v balancing factor
Characterization Methods
31
The final value, GooF, refers to the "goodness of fit" of the solution. In addition to the
difference in F values, the GooF also takes into account the number of observed reflections
and the parameters used (see Equation 6.1.11). At the end of refinement, the GooF should
approach 1.
)(
)( 222
pn
FFwGooF hkl
co
(6.1.11)
n / p number of reflection / number of parameter
Characterization Methods
32
Displacement parameters. Atoms execute more or less substantial vibrations about their
mean positions. Therefore, in order to obtain a realistic structure model, the vibrational
behaviour of the atoms should be considered. This behaviour is described by six parameters,
known as anisotropic displacement coefficients. With these vibrational ellipsoids can be
drawn, which represent the spatial propagation and the direction of the oscillations. The
consideration of this anisotropic displacement for the calculation of the structure amplitude
Fc(hkl) of a reflection hkl (equation 6.1.12) takes place via introduction of an anisotropic
temperature factor Tj (hkl) for each atom j (Equation 6.1.12a).
n
j
lzkyhxijic
jjjehklTfhklF1
)](2[)()( 6.1.12)
With )(2)(2)(2)()()([2 1323122
332
222
112
)( alhcUcklbUbhkaUlcUkbUhaU
j ehklT (6.1.12a)
Tj(hkl) anisotropic temperature factor a*, b*, c* reciprocal lattice constant h, k, l miller indices Uij coefficient of thermal ellipsoids of an atoms j /Å2.
The shape and orientation of the vibration can be given by six parameters Uij (equation 6.12a).
In orthogonal system, the diagonal components U11, U22 and U33 are mutually perpendicular
like principle axes of the vibration ellipsoid U1, U2 and U3, and represent the extend of
vibration along a, b, c respectively. The “off diagonal term” Uij refers to the orientation of the
ellipsoid to that of the reciprocal axes. In non orthogonal systems, they also have the
components related to the length of the principle axes. With an isotropic refinement
(direction-independent vibration behaviour) there is only one parameter, so called “isotropic
vibrational coefficient” Ueq which is almost equal to 1/3(U11 + U22 + U33). In drawings of the
structure, atoms are often very effectively represented as thermal ellipsoids. For this purpose,
the principle axes U1, U2 and U3 are scaled in such a way that the ellipsoid represents the
space in which the centre of the electron density can be localized with a specific probability
(normally 50%).
Extinction correction. An additional effect must be taken into account in the final stage of the
refinement that reveals its presence when the reflection of high intensity and low scattering
angle systematically give │Fo│ < │Fc│. This is usually due to extinction, divided into
primary and secondary extinction. Primary extinction occurs when a strong diffracted ray
functions significantly as primary beam and is thus weakened by further diffraction.
Characterization Methods
33
Secondary extinction arises when the primary beam proceeds through the crystal; a significant
fraction is diffracted by the first layers encountered. This means that planes further into the
crystal experience a reduced primary beam, and the overall effect is that the reflection is
weakened. In an ideally imperfect crystal the intensity of the primary beam is little affected by
the scattering (less than 1%) and is neglected. Secondary extinction, however, is more
common than the primary extinction.
Absorption correction. When X-rays pass through a crystal different physical processes such
as elastic (Rayleigh) or inelastic (Compton) scattering or ionization reduce its strength. These
effects increase with the fourth power of the atomic number Z of the scattering atoms and
with third power of the wavelength λ of the used X-radiation. With the help of equation
6.1.13, these can be recapitulated in terms of the linear absorption coefficient, .
I = I0·e-x (6.1.13)
I Intensity of the X-ray beam before striking the crystal I0 Intensity of the X-ray beam after passing through the crystal linear absorption coefficient / mm-1 x thickness of the crystal that is travelled by the X-ray
Whether an absorption correction is necessary, depends on the shape of the crystal and the
atomic number of the elements. Correction becomes very important if the crystal is very
anisotropic (thin plate, needle). In such a case, depending on the orientation of the crystal,
there may be very big differences in the length of the path of X-ray beam through the crystal.
Therefore a large error may arise during the measuring of the relative intensities. Different
absorption correction methods are available. In this work semi empirical absorption
corrections based on equivalent reflections [115] were applied. For different orientations of
the crystal to the X-ray many equivalent reflections appear several times when the data are
collected with the help of an area detector. It models the absorption surface using a spherical
harmonic series based on differences between equivalent reflections.
Characterization Methods
34
6.1.3 EDX Analysis
EDX stands for Energy Dispersive X-ray analysis. Sometimes, it is however, referred to as
EDS or EDAX analysis. It is a technique used for identifying the elemental composition of
the specimen. The EDX [116, 117, 118] analysis system works as an integrated feature of a
scanning electron microscope (SEM).
During EDX analysis, the specimen is bombarded with an electron beam inside the scanning
electron microscope. The bombarding electrons collide with the electrons of the atoms of the
specimen, knocking some of them off in the process. A position is thus vacated by an ejected
inner shell electron which is then eventually occupied by a higher-energy electron from an
outer shell. On the way of this occupancy, the transferring outer electron must give up some
of its energy by emitting an X-ray.
The amount of energy released by the transferring electron obviously depends on which shell
it is transferring from, as well as which shell it is transferring to. Furthermore, every element
releases X-rays with unique amounts of energy during the relaxation process. Thus, by
measuring the energy of X-rays being released by a specimen the identity of the atom from
which the X-ray was emitted can be established.
The output of an EDX analysis is an EDX spectrum. The EDX spectrum is just a plot of how
frequently an X-ray is received for each energy level. An EDX spectrum normally displays
peaks corresponding to the energy levels for which the most X-rays had been received. Each
of these peaks is unique to an atom, and therefore corresponds to a single element. The higher
is a peak in the spectrum, the more concentrated the element is in the specimen.
Characterization Methods
35
6.2 Spectroscopic Investigations
6.2.1 Solid-sate MAS-NMR Spectroscopy
Over the last decades, NMR spectroscopy has grown into an indispensable tool for chemical
analyses and structure determination in organic, inorganic, and biological systems. The NMR
phenomenon is based on the fact that nuclei of atoms have magnetic properties that can be
utilized to yield chemical information. Quantum mechanical subatomic particles (protons,
neutron, electrons) have spin. In some atoms (for example 12C, 14N, 16O) these spins are paired
and cancel each other so that the nucleus of the atom has no overall spin. However, in many
isotopes (1H, 13C, 19F, 29Si, 31P etc) the nucleus does possess an overall spin, I. Quantum
mechanics tells us that a nucleus of spin I will have 2I + 1 possible orientations. A nucleus
with spin 1/2 will have 2 possible orientations. In the absence of an external magnetic field,
these orientations are of equal energy. If a magnetic field is applied, then the energy levels
split. For each level there is a magnetic quantum number, m. Since the nucleus is positively
charged and spinning, it generates its own magnetic field. This implies a magnetic moment
() which is proportional to its spin (I) as in equation 6.2.1.
2
Ih (6.2.1)
The constant, γ, is called the gyromagnetic ratio and is defined as a fundamental nuclear
constant of proportionality between nuclear angular momentum and magnetic moment. For a
proton, γ = 2.674×10⁴ gauss-1 sec-1. This precession process generates an electric field with
frequency ωo. If we irradiate the sample with radio waves (in MHz frequency range), the
proton will absorb the energy and be promoted to the less favorable higher energy state. This
absorption is called resonance because the frequency of the applied radiation and the
precession coincide or resonate. Since constant γ attains a constant value for each nucleus,
consequently it is logical that all atoms of the same type would always experience the same
energy from the applied magnetic field and thus all show up on a spectrum as a singular peak
denoting that specific atom. This is however not the case due to the principle of nuclear
shielding. This aspect of NMR is due to the fact that the electronic effects of some nuclei,
generally nuclei with excess electron density, affects the effect of the external magnetic field
by shielding them from the full effect of the external force. The inverse of this, is deshielding,
which entails the removal of electron density from another nuclei by some electron poor
nucleus. If the nucleus is more shielded, then its NMR signal will be shifted upfield (lower
Characterization Methods
36
chemical shift). If it is more deshielded, then the signal will be shifted downfield (higher
chemical shift). Depending on the local symmetry at the nuclear site, the magnitude of the
chemical shift varies as a function of the orientation of the molecule with respect to the
external magnetic field. This orientation dependence of the chemical shift is referred to as
chemical shift anisotropy. Mathematically, the chemical shift anisotropy is described by a
second-rank tensor (a 3 × 3 matrix), which in the case of the symmetric part of the chemical
shift tensor consists of six independent components. Generally, one is able to express the
chemical shift tensor in a coordinate frame where all off-diagonal elements vanish. In this
principal axis system, the chemical shift tensor is fully described by the three diagonal
elements - the principal components - and the three eigenvectors or Euler angles describing
the orientation of the principal axes with respect to an arbitrary frame. In addition, various
combinations of the principal components (and their orientations) are in use to describe the
chemical shift tensor. Chemical shift can be classified as isotropic and anisotropic. In contrast
to the anisotropic chemical shift aniso, the isotropic chemical shift iso is independent of the
orientation of the molecule towards the magnetic field. While anisotropic chemical shifts aniso
are observed exclusively in Solid-State NMR, isotropic chemical shifts iso appear for the
NMR investigation in solution, where the molecule rotates so strongly by Brownian’s
molecular motion that all the direction orientated interactions becomes average. In contrast to
this the line-width, for the Solid-State NMR experiments can be often up to kilohertz (kHz).
An excellent example is provided by water whose proton NMR line-width at room
temperature is 0.1 Hz, while for ice it becomes 105 Hz, six orders of magnitude broader [119].
This broadening is the result of the presence of the anisotropic chemical shift as well as the
Dipole-Dipole interactions between the spinning nuclei. In order to reduce the line-widths of a
solid sample, a technique so called Magic Angle Spinning (MAS) [120] is applied. By
spinning the sample (usually at a frequency of 1 to 70 kHz) at the magic angle θm (θm =
54.74°) with respect to the direction of the magnetic field the orientation dependence averages
to zero. The angle θm = 54.74°, results for the contribution of the chemical shift to the
Hamilton operator Hcs (Equation 6.2.2).
Ĥcs = iso··B0·Îz + (1-3cos2)·aniso (6.2.2)
= gyromagentic constant Bo = strength of external magnetic field Îz = operator of the z-component
Characterization Methods
37
Other problems which arise in solid-state NMR spectroscopy are related to the strong
heteronuclear interactions and to the existence of very long spin-lattice relaxation times T1 of
the order of minutes to hours. These can be solved in the Cross Polarization ( CP ) technique.
The chemical shift of a molecule with arbitrary orientation to the magnetic field can be
described generally by six parameters, with three center lines δ11, δ22, δ33 (tensor principal
values) and the three angles Θ = {α, β, γ}, which describe orientation relative to the magnetic
field axis. The three principle axes can take very different values, as a consequence of that,
the observed chemical shift of the measured NMR signal depends on the orientation of the
molecule relative to the applied magnetic field. In contrast to liquid NMR spectroscopy, all
six components play an important role in Solid-State NMR spectroscopy which reveal useful
correlations with the structure. Both orientation and the size of the principal tensor adopt
values for specific building groups and are therefore suitable for the characterization of
structural properties of inorganic samples. Since during the measurement of a powder sample
the orientation of the chemical shift is statistically distributed with respect to the Z-axis,
orientation dependence is lost and only the three principal tensor values δ11, δ22, δ33 can be
determined. For the correlation with the structure the three principal values are represented
favorably into another form. One transforms {δ11, δ22, δ33 } to {δiso, δaniso, η} so that both
representations possess the same content. The representation with isotropic chemical shift δiso,
anisotropy δaniso, and asymmetry parameters η can be brought however more easily into a
chemical composition, than those of the tensor principal values. The chemical shift δ is
defined in accordance with equation 6.2.3.
ref
ref
)(
(6.2.3)
chemical shift / ppm resonance frequency of the sample / Hz ref resonance frequency of the standard sample with chemical shift = 0 / Hz
The axial values of the chemical shifts can be arranged according to the resonance frequency
(Equation 6.2.4). δ corresponds to the direction of least shielding, with the highest frequency,
while δ33 corresponds to the direction of highest shielding, with the lowest frequency.
δ11 ≥ δ22 ≥ δ33 (6.2.4)
Characterization Methods
38
The isotropic values, iso, are the average values of the principal components, and correspond
to the center of gravity of the line shape. The isotropic chemical shift iso can be defined as
equation 6.2.5.
3
)( 332211
iso (6.2.5)
One can sort the differences concerning the isotropic chemical shift as in eqaution 6.2.6.
|δcc - δiso| ≥ |δbb- δiso| ≥ | δaa- δiso| (6.2.6)
The anisotropic chemical shift δaniso describes the largest separation from the centre of gravity.
The sign of the anisotropy indicates on which side of the isotropic value one can find the
largest separation. It can be defined as in equation 6.2.7.
isoccaniso (6.2.7)
The asymmetry parameter η, indicates how much the line shape deviates from that of an
axially symmetric tensor. It can be calculated according to equation 6.2.8.
aniso
aabb
, [0, 1] (6.2.8)
It is worth mentioning that, both 31P (100% natural abundance) and 29Si (4.7% natural
abundance) nuclei have spin I = ½, thus don’t suffer from quadrupolar peak broadening and
distortion. Thus, they are particularly attractive nuclei for Solid-State NMR measurements. In
the present work, 31P- and 29Si-MAS-NMR spectra were recorded and analyzed in order to
attain a correlation with the crystal structure determined by X-ray single crystal
investigations.
Characterization Methods
39
6.2.2 Single-crystal UV/Vis/NIR Spectroscopy
The colour of transition metal complexes is caused by electronic transitions through the
absorption of light in the UV/Vis region, 400-800 nm; 25000-12500 cm-1. With the help of the
UV/Vis absorption spectroscopy electronic transition of transition metal complexes are
investigated in order to determine the symmetry of the chromophore as well as the oxidation
state of the transition metal ion. However, the investigations of the following two kinds of
transitions in UV/Vis/NIR spectroscopy are of special importance:
(i) The transition of an electron from one orbital to another at a higher energy state of
the same atom. This type of transition is known as d-d electron transition, observed in
transition metal complexes. These transitions in centrosymmetric chromophores are Laporte-
forbidden. However, it is sometimes observed (example in ideal octahedrons) where the
intensity is comparatively low.
(ii) Charge transfer spectra reflect a redistribution of the electron density in a complex.
This transition is either from a filled ligand orbital to a partly filled or empty d orbital on the
metal or from a filled or partly filled metal d orbital to a vacant ligand orbital. These are
termed as ligand → metal (L → M) and metal → ligand (M → L) charge transfer transitions,
respectively. Apart from this electronic transition along M → M is known as intervalent
charge transfer transition.
With these processes parts of the electromagnetic radiation are absorbed. The measurements
were accomplished at a single-crystal spectrometer CARY 17, which was developed in the
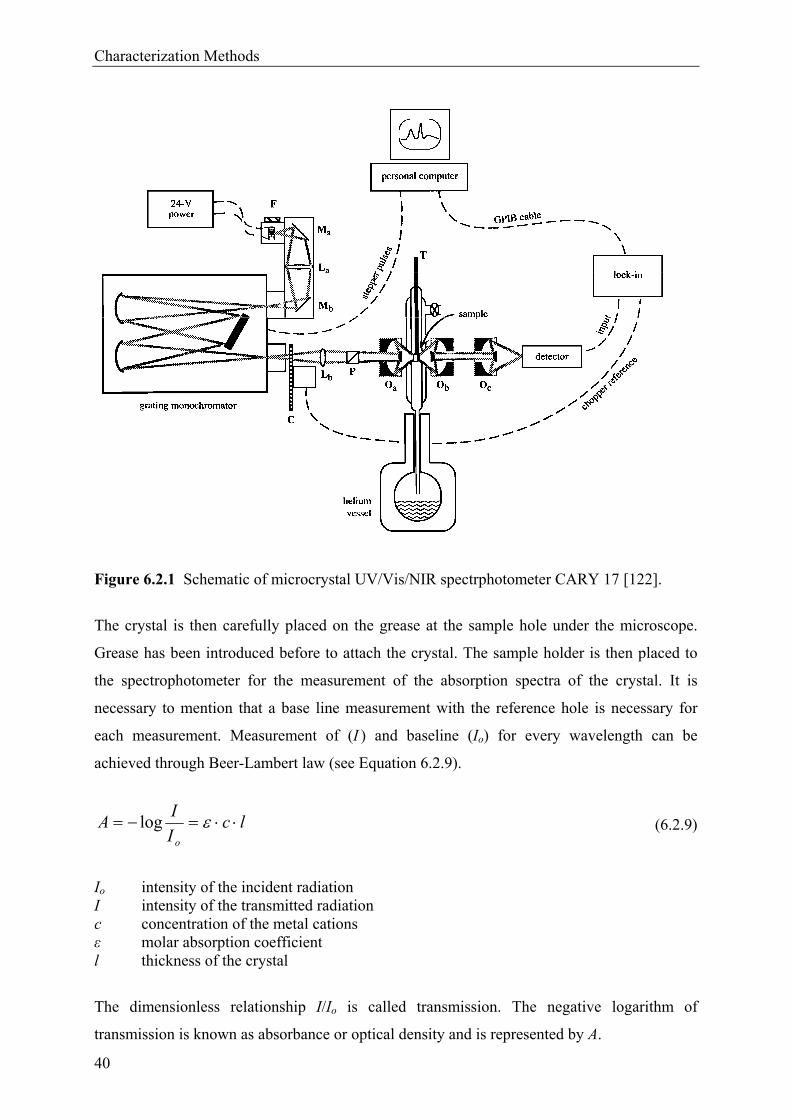
Research School of Chemistry (Canberra, Australia) [121, 122]. The schematic diagram of
the spectrometer is represented in Figure 6.2.1.
A halogen lamp is introduced as a light source and a photomultiplier is used as a detector for
the measurement at the UV/Vis range (12000-30000 cm-1). For measurement in the near
infrared (6000-16000 cm-1) region, a germanium semiconductor detector is used, which was
cooled in liquid nitrogen. A polarization filter allows measurements at horizontal as well as
vertical polarization of the incident light beam.
A small transparent single-crystal is selected under a microscope. Subsequently, an aluminum
foil is attached on a sample holder so that the holes of the sample holder are masked. Under
the microscope two equally large holes (sample hole and reference hole) are made into the foil
with the help of pin. The holes should be some what smaller than the selected crystals.
Characterization Methods
40
Figure 6.2.1 Schematic of microcrystal UV/Vis/NIR spectrphotometer CARY 17 [122].
The crystal is then carefully placed on the grease at the sample hole under the microscope.
Grease has been introduced before to attach the crystal. The sample holder is then placed to
the spectrophotometer for the measurement of the absorption spectra of the crystal. It is
necessary to mention that a base line measurement with the reference hole is necessary for
each measurement. Measurement of (I ) and baseline (Io) for every wavelength can be
achieved through Beer-Lambert law (see Equation 6.2.9).
lcI
IA
o
log (6.2.9)
Io intensity of the incident radiation I intensity of the transmitted radiation c concentration of the metal cations ε molar absorption coefficient l thickness of the crystal
The dimensionless relationship I/Io is called transmission. The negative logarithm of
transmission is known as absorbance or optical density and is represented by A.
Characterization Methods
41
6.2.3 Vibrational Spectroscopy
Infrared spectroscopy [123, 124] utilizes the fact that molecules (having a permanent dipole
moment) absorb specific frequencies as light quanta in the range 10 to 14000 cm-1. These
absorptions are obviously resonance frequencies, i.e. the frequency of the absorbed radiation
matches the frequency of the bond or group that vibrates. The energies are determined by the
shape of the molecular potential energy surfaces, the masses of the atoms, and the associated
vibronic coupling that can be expressed in terms of equation (6.2.10)
E = (v + ½)·h·ν (6.2.10)
v vibrational quantum number (selection rule: Δv = ±1) h Planck’s constant / 6.626·10-34 J·s ν frequencity / s-1
The natural frequencies of vibration of a bond are given by equation 6.2.11. According to this
equation frequency depends upon force constant K, and reduced mass μ of the vibrating
atoms.
k
2
1 (6.2.11)
K = force constant / N.m-1
= reduced mass / kg
This expression immediately meets the following two concepts.
(i) Stronger bonds have larger force constant K and vibrate at higher frequencies
than weaker bonds. Force constants vary from one bond to another.
(ii) Bonds between atoms of higher masses (larger reduced mass, ) vibrate at lower
frequencies than that of lighter atoms.
For this work on molybdenum and rhenium phosphates, it was rather interesting to
characterize [MO6] (M = Mo, Re), [PO4] and [P2O7] groups with the help of infrared
spectroscopy. The infrared spectra of a few selected crystals of the phosphates were measured
using mainly a NICOLET 380 FT-IR spectrometer (SMART ORBIT).
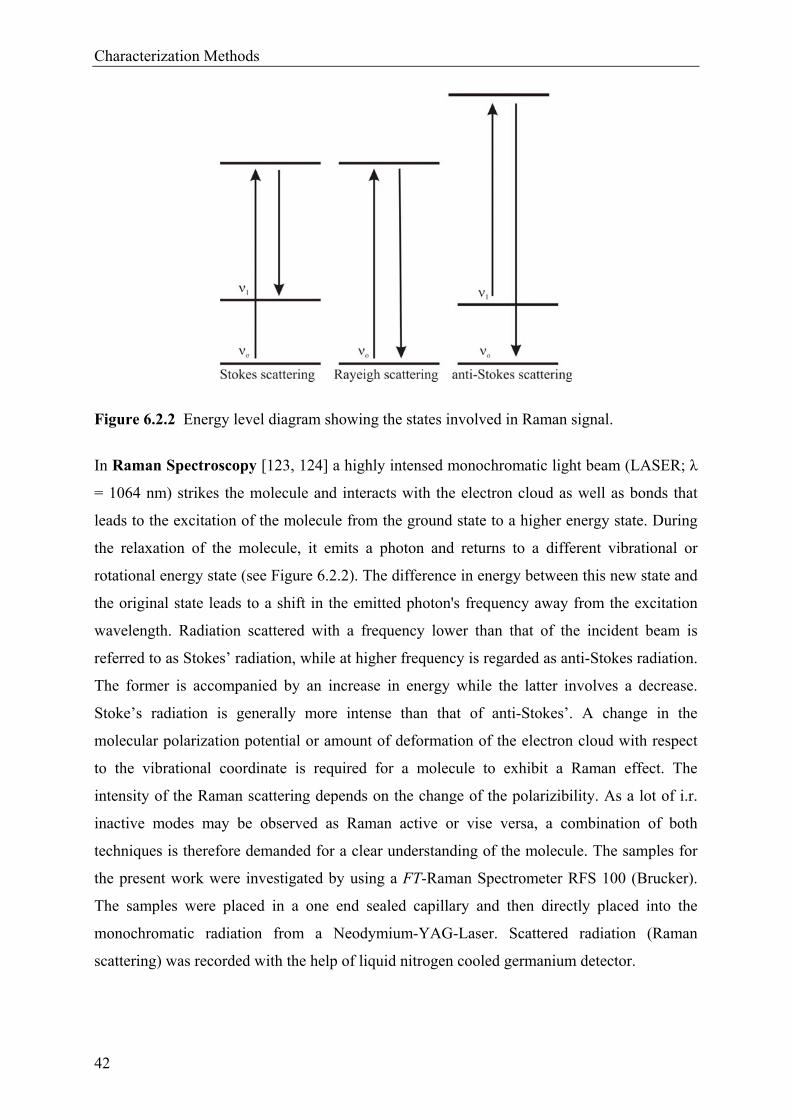
Characterization Methods
42
Figure 6.2.2 Energy level diagram showing the states involved in Raman signal.
In Raman Spectroscopy [123, 124] a highly intensed monochromatic light beam (LASER; λ
= 1064 nm) strikes the molecule and interacts with the electron cloud as well as bonds that
leads to the excitation of the molecule from the ground state to a higher energy state. During
the relaxation of the molecule, it emits a photon and returns to a different vibrational or
rotational energy state (see Figure 6.2.2). The difference in energy between this new state and
the original state leads to a shift in the emitted photon's frequency away from the excitation
wavelength. Radiation scattered with a frequency lower than that of the incident beam is
referred to as Stokes’ radiation, while at higher frequency is regarded as anti-Stokes radiation.
The former is accompanied by an increase in energy while the latter involves a decrease.
Stoke’s radiation is generally more intense than that of anti-Stokes’. A change in the
molecular polarization potential or amount of deformation of the electron cloud with respect
to the vibrational coordinate is required for a molecule to exhibit a Raman effect. The
intensity of the Raman scattering depends on the change of the polarizibility. As a lot of i.r.
inactive modes may be observed as Raman active or vise versa, a combination of both
techniques is therefore demanded for a clear understanding of the molecule. The samples for
the present work were investigated by using a FT-Raman Spectrometer RFS 100 (Brucker).
The samples were placed in a one end sealed capillary and then directly placed into the
monochromatic radiation from a Neodymium-YAG-Laser. Scattered radiation (Raman
scattering) was recorded with the help of liquid nitrogen cooled germanium detector.
Characterization Methods
43
6.2.4 Magnetic Measurements
Inorganic solids exhibit magnetic properties which are due to the presence of unpaired
electrons centered usually at the metal cations. Therefore, magnetic behaviour is generally
restricted to compounds of transition metals and lanthanides, which posses unpaired d or f
electrons, respectively. Electrons moving in a circular path in an atom or molecule are
constantly undergoing acceleration and therefore, generate a magnetic field perpendicular to
their direction of motion, the orbital magnetic moment. Electrons also spin around their own
axis, which produces a magnetic spin moment. If the electrons are paired in a wave function,
their spin magnetic fields are equal and opposite (spin paired). If these moving electrons are
placed into a large external magnetic field, then the external field induces an additional
current that causes a magnetic field by itself. The induced magnetic field is opposite to the
external magnetic field (LENZ law). As a consequence, the magnetic field (B is the magnetic
flux density) inside the sample Binternal < Bexternal, and the sample is repelled by the applied
field. This phenomenon is known as diamagnetism. Binternal > Bexternal is called paramagnetism
(Equation 6.2.12). Every electron contributes to the diamagnetism of a substance,
consequently diamagnetism is present in every matter. Equation 6.2.12, can be written in two
different ways (Equations 6.2.12a and b).
Binternal = Bexternal + B΄ (6.2.12)
Binternal = µrBexternal (6.2.12a)
Binternal = (1 + χv) Bexternal (6.2.12b)
r = relative magnetic permeability B΄ = χvBexternal
χv = magnetic susceptibility (volume susceptibility)
For a diamagnetic substance B΄ is negative and r < 1. The substance may be paramagnetic,
ferromagnetic, ferrimagnetic, or antiferromagnetic if B΄ is positive and r > 1. Generally,
susceptibility is referred to the number of moles. With the help of the molar volume Vmol, the
molar susceptibility χmol of one mole of substance can be determined according to equation
6.2.13.
molvmol V (cm3 · mol-1) (6.2.13)
Characterization Methods
44
The total magnetic susceptibility mol of one mole of a substance is the sum of all the
diamagnetic and paramagnetic contributions from all the electrons in the sample (see
Equation 6.2.14).
paramol
diamolmol (6.2.14)
On the basis of the LANGEVIN equation the diamagnetic fraction can be obtained as
2
1
2
6
n
ii
e
Ldiamol R
m
Ne (6.2.15)
diamol diamagnetic fraction of the molar susceptibility (cm3.·.mol-1)
e elementary charge ]...[].[ 2 sscmgsdyn
NL avogadro constant (mol-1) me rest mass of electron (g) n number of electron Ri distance between the electron and nucleus (cm)
While the core electrons are responsible for the diamagnetic susceptibility, paramagnetic
susceptibility results from the unpaired electrons of the valence shell. Paramagnetic
susceptibility can be calculated on the basis of the consideration of the influence of orbital-
and spin angular momentum of the electrons (Russel-Saunders- or L. S. coupling) of the
atoms or ions of the transition metals (see Equation 6.2.16).
)]1(4)1([3
)( 2
SSLL
TR
N BLparamol
(6.2.16)
Effective magnetic moments LS arise on the basis of the spin orbital coupling according to
the equation 6.2.17.
)1(4)1( SSLLBLSeff (6.2.17)
L total angular momentum quantum number S total spin quantum number
B Bohr magneton, 9.27×10⁻²¹ (erg · Oe-1) T temperature (K) R gas constant, 8.3144×10⁷ (erg · K-1 · mol-1)
Characterization Methods
45
If L is dropped from equation 6.2.17, an expression is obtained where spin angular
momentum alone is the basis of the magnetic behaviour of an ion. This expression is known
as spin only formula for magnetic moment (Equation 6.2.18)
)1(2)1(4 SSSS BBSOeff (6.2.18)
The relation between temperature and susceptibility can be achieved from the well known
Curie-Weiss relation (Equation 6.2.19).
)/( TCm (6.2.19)
C is called Curie constant, whereas θ is the Curie Weiss constant, has a fundamental
significance.
In the present work, effective magnetic moment was calculated based on of the equation
6.2.20.
BBeff n
T
n
C
12505.0
).(.
12505.0. (6.2.20)
Here n is the number of paramagnetic center per formula unit and the value of χ and T were
obtained from the graphical representation of 1/χ vs T.
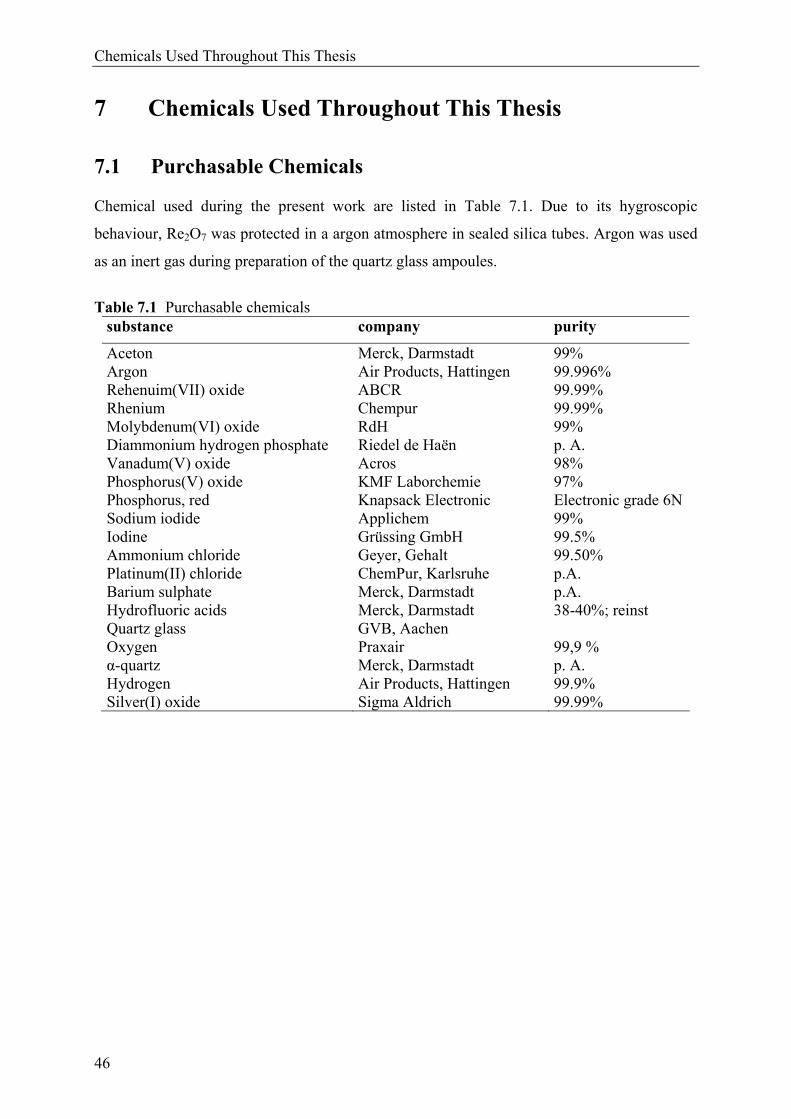
Chemicals Used Throughout This Thesis
46
7 Chemicals Used Throughout This Thesis
7.1 Purchasable Chemicals
Chemical used during the present work are listed in Table 7.1. Due to its hygroscopic
behaviour, Re2O7 was protected in a argon atmosphere in sealed silica tubes. Argon was used
as an inert gas during preparation of the quartz glass ampoules.
Table 7.1 Purchasable chemicals substance company purity
Aceton Merck, Darmstadt 99% Argon Air Products, Hattingen 99.996% Rehenuim(VII) oxide ABCR 99.99% Rhenium Chempur 99.99% Molybdenum(VI) oxide RdH 99% Diammonium hydrogen phosphate Riedel de Haën p. A. Vanadum(V) oxide Acros 98% Phosphorus(V) oxide KMF Laborchemie 97% Phosphorus, red Knapsack Electronic Electronic grade 6NSodium iodide Applichem 99% Iodine Grüssing GmbH 99.5% Ammonium chloride Geyer, Gehalt 99.50% Platinum(II) chloride ChemPur, Karlsruhe p.A. Barium sulphate Merck, Darmstadt p.A. Hydrofluoric acids Merck, Darmstadt 38-40%; reinst Quartz glass GVB, Aachen Oxygen Praxair 99,9 % α-quartz Merck, Darmstadt p. A. Hydrogen Air Products, Hattingen 99.9% Silver(I) oxide Sigma Aldrich 99.99%
Chemicals Used Throughout This Thesis
47
7.2 Chemicals Synthesized
7.2.1 Molybdenyl(VI) oxidepyrophosphate
A microcrystalline powder of (MoO2)2P2O7 was prepared by heating a mixture of MoO3 and
(NH4)2HPO4 in an open silica tube according to equation 7.2.1. The heating was conducted
initially at 250 (2 days) and 400°C (2 days) in order to remove volatile gaseous species from
(NH4)2HPO4, followed by a subsequent heating at 600°C.
MoO3 + (NH4)2HPO4 → ½ (MoO2)2P2O7 + 2 NH3 + 3/2 H2O (7.2.1)
7.2.2 Rhenium(VI) oxide
Rhenium(VI) oxide was synthesized by reduction of Re2O7 by metallic rhenium according to
equation 7.2.2 [84, 125]. A red powder of ReO3 was obtained when a stoichiometric mixture
of Re2O7 and metallic rhenium was heated isothermally at 300°C for three days in an
evacuated sealed silica tube (l ≈ 11 cm, d ≈ 1.5 cm, V ≈ 20 cm3). About 40 mg of iodine was
used as a mineralizer.
3 Re2O7 + Re → 7 ReO3 (7.2.2)
7.2.3 Rhenium(IV) oxide
A microcrystalline grey powder of rhenium(IV) oxide was synthesized by the reduction of
Re2O7 by metallic rhenium according to equation 7.2.3. ReO2 was obtained when a
stoichiometric mixture of Re2O7 and metallic rhenium was heated isothermally at 300°C for
three days in an evacuated sealed silica tube (l ≈ 11 cm, d ≈ 1.5 cm, V ≈ 20 cm3). About 50
mg of iodine was used as a mineralizer.
2 Re2O7 + 3 Re → 7 ReO2 (7.2.3)
Molybdenyl(V) oxidepyrophosphate
48
8 Molybdenyl(V) oxidepyrophosphate
8.1 Introduction
Dealing with synthesis, crystallization, purification and thermochemical characterization of
solids Chemical Vapour Transport (CVT) has become a valuable tool [85, 126]. The potential
applicability of CVT for synthesis and crystallization of transition metal phosphates has been
already discussed in detail [2].
Anhydrous phosphates of molybdenum at oxidation states +III, +IV, +V, and +VI have been
synthesized and characterized. The comparable stability of various oxidation states of
molybdenum is the key to formation of several thermodynamically stable phosphates. The
ratio n(molybdenum oxide) : n(phosphorus oxide) in ternary molybdenum phosphates covers
a range form 1/3 in Mo(PO3)3 [32] to 1 in MoO(PO4) [27]. Molybdenum phosphates show a
large structural diversity. Corner sharing between [MoO6] octahedra and a variety of
phosphate anions (PO43-, P2O7
4-, P4O136-, PO3
-) is the main structural feature.
The crystal structure of (MoVIO2)2(P2O7) [24, 25, this work] consists of [MoVIO6] octahedra
and [P2O7] groups. [MoVIO6] octahedra form zigzag chains by sharing their corners. Two
successive chains are connected to each other by [P2O7] groups. Conversely, MoVIO2(PO3)2
[26] is built up of [MoVIO6] octahedra connected by metaphosphate chains. In this way, two
oxygen atoms in each [MoVIO6] octahedron are bound only to molybdenum and the remaining
four oxygen atoms are shared with (PO3) chains. Thus infinite wavelike layers of the
composition MoVIO2(PO3)2 are formed. Up to date, two phosphates of molybdenum in its
pentavalent state, MoO(PO4) [27] and (MoO)2P4O13) [28, 29], are structurally characterized.
The framework of molybdenyl(V) oxide phosphate, MoO(PO4) is built up from [MoVO6]
octahedra and [PO4] tetrahedra. The [MoVO6] octahedra share opposite corners to form
infinite chains (O=Mo····O=Mo····O) along the c-axis of the tetragonal structure. These chains
are interconnected to each other by corner sharing [PO4] tetrahedra. The crystal structure of
(MoO)2P4O13 consists of [MoVO6] octahedra sharing five of their corners with P4O136- groups.
The sixth one corresponds to a molybdenyl group. The original framework of Mo~V1.3O(P2O7)
is built up from [(Mo~V=O)O5] octahedra, [P2O7] groups and also from [MoO4], [Mo2O4] and
[Mo3O8] units containing Mo2 and Mo3 clusters [30]. MoP2O7 [31] is isotypic to the cubic
modification of ZrP2O7 [127] and built up by corner sharing of [MoIVO6] octahedra and
[P2O7] groups. Interestingly, this pyrophosphate shows a 3·3·3 superstructure of the subcell
[128]. The structure of Mo(PO3)3 [32] consists of infinite chains
)( 31 PO bridged by isolated
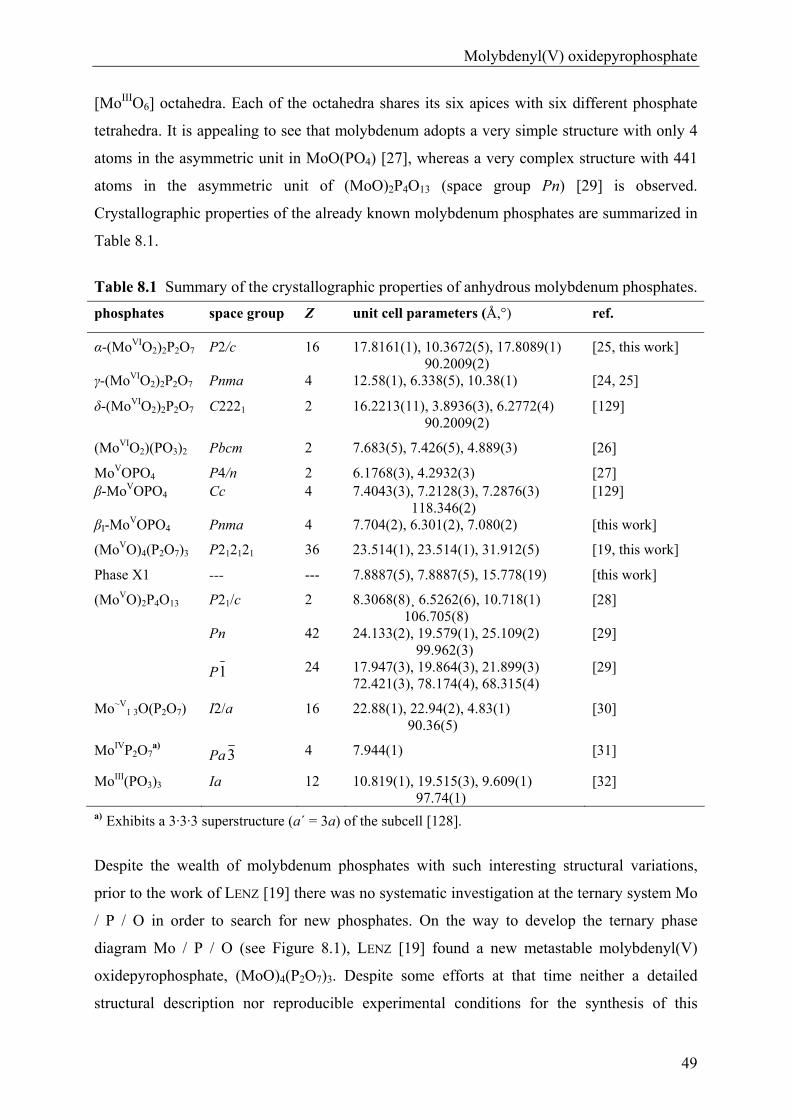
Molybdenyl(V) oxidepyrophosphate
49
[MoIIIO6] octahedra. Each of the octahedra shares its six apices with six different phosphate
tetrahedra. It is appealing to see that molybdenum adopts a very simple structure with only 4
atoms in the asymmetric unit in MoO(PO4) [27], whereas a very complex structure with 441
atoms in the asymmetric unit of (MoO)2P4O13 (space group Pn) [29] is observed.
Crystallographic properties of the already known molybdenum phosphates are summarized in
Table 8.1.
Table 8.1 Summary of the crystallographic properties of anhydrous molybdenum phosphates.
a) Exhibits a 3·3·3 superstructure (a΄ = 3a) of the subcell [128].
Despite the wealth of molybdenum phosphates with such interesting structural variations,
prior to the work of LENZ [19] there was no systematic investigation at the ternary system Mo
/ P / O in order to search for new phosphates. On the way to develop the ternary phase
diagram Mo / P / O (see Figure 8.1), LENZ [19] found a new metastable molybdenyl(V)
oxidepyrophosphate, (MoO)4(P2O7)3. Despite some efforts at that time neither a detailed
structural description nor reproducible experimental conditions for the synthesis of this
phosphates space group Z unit cell parameters (Å,°) ref.
α-(MoVIO2)2P2O7 P2/c 16 17.8161(1), 10.3672(5), 17.8089(1) 90.2009(2)
[25, this work]
γ-(MoVIO2)2P2O7 Pnma 4 12.58(1), 6.338(5), 10.38(1) [24, 25]
δ-(MoVIO2)2P2O7 C2221 2 16.2213(11), 3.8936(3), 6.2772(4) 90.2009(2)
[129]
(MoVIO2)(PO3)2 Pbcm 2 7.683(5), 7.426(5), 4.889(3) [26]
MoVOPO4 P4/n 2 6.1768(3), 4.2932(3) [27] β-MoVOPO4 Cc 4 7.4043(3), 7.2128(3), 7.2876(3)
118.346(2) [129]
βI-MoVOPO4 Pnma 4 7.704(2), 6.301(2), 7.080(2) [this work]
(MoVO)4(P2O7)3 P212121 36 23.514(1), 23.514(1), 31.912(5) [19, this work]
Phase X1 --- --- 7.8887(5), 7.8887(5), 15.778(19) [this work]
P21/c 2 8.3068(8)¸ 6.5262(6), 10.718(1) 106.705(8)
[28]
Pn 42 24.133(2), 19.579(1), 25.109(2) 99.962(3)
[29]
(MoVO)2P4O13
P1 24 17.947(3), 19.864(3), 21.899(3) 72.421(3), 78.174(4), 68.315(4)
[29]
Mo~V1 3O(P2O7) I2/a 16 22.88(1), 22.94(2), 4.83(1)
90.36(5) [30]
MoIVP2O7a) Pa 3 4 7.944(1) [31]
MoIII(PO3)3 Ia 12 10.819(1), 19.515(3), 9.609(1) 97.74(1)
[32]
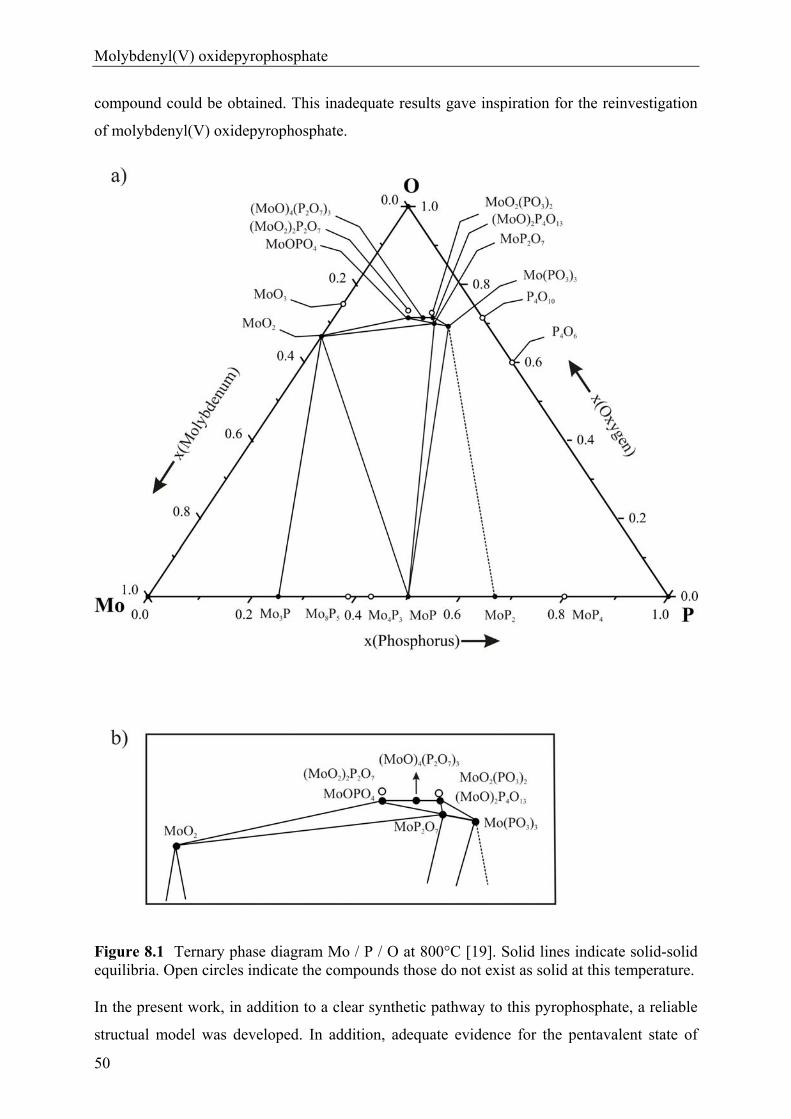
Molybdenyl(V) oxidepyrophosphate
50
compound could be obtained. This inadequate results gave inspiration for the reinvestigation
of molybdenyl(V) oxidepyrophosphate.
Figure 8.1 Ternary phase diagram Mo / P / O at 800°C [19]. Solid lines indicate solid-solid equilibria. Open circles indicate the compounds those do not exist as solid at this temperature.
In the present work, in addition to a clear synthetic pathway to this pyrophosphate, a reliable
structual model was developed. In addition, adequate evidence for the pentavalent state of
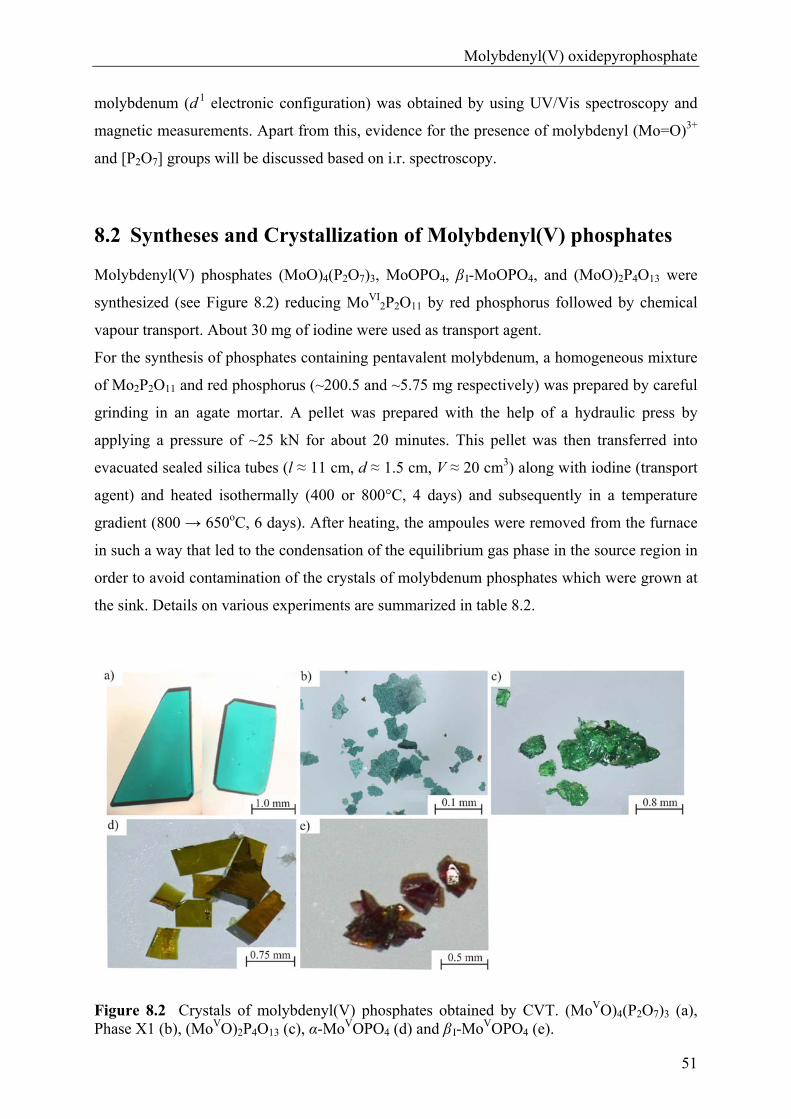
Molybdenyl(V) oxidepyrophosphate
51
molybdenum (d 1 electronic configuration) was obtained by using UV/Vis spectroscopy and
magnetic measurements. Apart from this, evidence for the presence of molybdenyl (Mo=O)3+
and [P2O7] groups will be discussed based on i.r. spectroscopy.
8.2 Syntheses and Crystallization of Molybdenyl(V) phosphates
Molybdenyl(V) phosphates (MoO)4(P2O7)3, MoOPO4, β I-MoOPO4, and (MoO)2P4O13 were
synthesized (see Figure 8.2) reducing MoVI2P2O11 by red phosphorus followed by chemical
vapour transport. About 30 mg of iodine were used as transport agent.
For the synthesis of phosphates containing pentavalent molybdenum, a homogeneous mixture
of Mo2P2O11 and red phosphorus (~200.5 and ~5.75 mg respectively) was prepared by careful
grinding in an agate mortar. A pellet was prepared with the help of a hydraulic press by
applying a pressure of ~25 kN for about 20 minutes. This pellet was then transferred into
evacuated sealed silica tubes (l ≈ 11 cm, d ≈ 1.5 cm, V ≈ 20 cm3) along with iodine (transport
agent) and heated isothermally (400 or 800°C, 4 days) and subsequently in a temperature
gradient (800 → 650oC, 6 days). After heating, the ampoules were removed from the furnace
in such a way that led to the condensation of the equilibrium gas phase in the source region in
order to avoid contamination of the crystals of molybdenum phosphates which were grown at
the sink. Details on various experiments are summarized in table 8.2.
Figure 8.2 Crystals of molybdenyl(V) phosphates obtained by CVT. (MoVO)4(P2O7)3 (a), Phase X1 (b), (MoVO)2P4O13 (c), α-MoVOPO4 (d) and β I-MoVOPO4 (e).
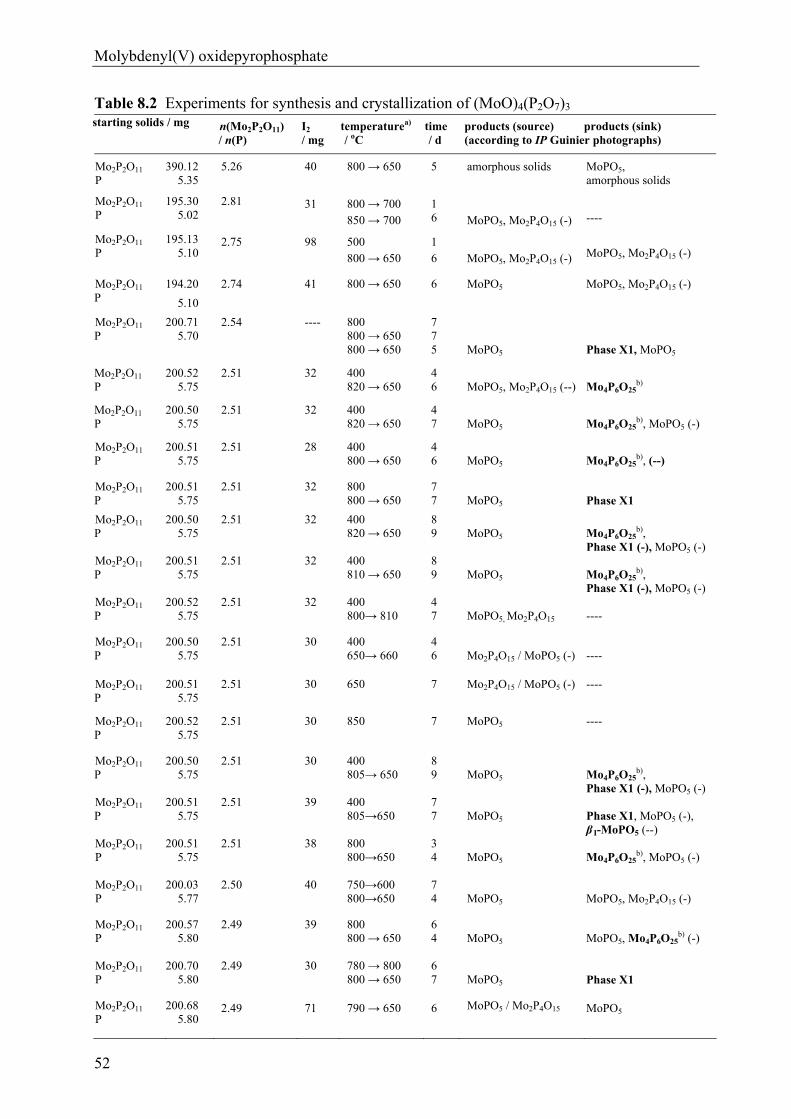
Molybdenyl(V) oxidepyrophosphate
52
Table 8.2 Experiments for synthesis and crystallization of (MoO)4(P2O7)3 starting solids / mg n(Mo2P2O11)
/ n(P) I2 / mg
temperaturea) / oC
time / d
products (source) products (sink) (according to IP Guinier photographs)
Mo2P2O11 P
390.12 5.35
5.26 40 800 → 650 5 amorphous solids MoPO5, amorphous solids
Mo2P2O11 P
195.30 5.02
2.81 31 800 → 700 850 → 700
1 6
MoPO5, Mo2P4O15 (-)
----
Mo2P2O11 P
195.13 5.10
2.75 98 500 800 → 650
1 6
MoPO5, Mo2P4O15 (-)
MoPO5, Mo2P4O15 (-)
Mo2P2O11 P
194.20
5.10
2.74 41 800 → 650 6 MoPO5 MoPO5, Mo2P4O15 (-)
Mo2P2O11 P
200.71 5.70
2.54 ---- 800 800 → 650 800 → 650
7 7 5
MoPO5
Phase X1, MoPO5
Mo2P2O11 P
200.52 5.75
2.51 32 400 820 → 650
4 6
MoPO5, Mo2P4O15 (--)
Mo4P6O25
b)
Mo2P2O11
P 200.50 5.75
2.51 32 400 820 → 650
4 7
MoPO5
Mo4P6O25
b), MoPO5 (-)
Mo2P2O11 P
200.51 5.75
2.51 28 400 800 → 650
4 6
MoPO5
Mo4P6O25
b), (--)
Mo2P2O11 P
200.51 5.75
2.51 32 800 800 → 650
7 7
MoPO5
Phase X1
Mo2P2O11 P
200.50 5.75
2.51 32 400 820 → 650
8 9
MoPO5
Mo4P6O25
b), Phase X1 (-), MoPO5 (-)
Mo2P2O11 P
200.51 5.75
2.51 32 400 810 → 650
8 9
MoPO5
Mo4P6O25
b), Phase X1 (-), MoPO5 (-)
Mo2P2O11 P
200.52 5.75
2.51 32 400 800→ 810
4 7
MoPO5, Mo2P4O15
----
Mo2P2O11 P
200.50 5.75
2.51 30 400 650→ 660
4 6
Mo2P4O15 / MoPO5 (-)
----
Mo2P2O11 P
200.51 5.75
2.51 30 650 7 Mo2P4O15 / MoPO5 (-) ----
Mo2P2O11 P
200.52 5.75
2.51 30 850 7 MoPO5 ----
Mo2P2O11 P
200.50 5.75
2.51 30 400 805→ 650
8 9
MoPO5
Mo4P6O25
b), Phase X1 (-), MoPO5 (-)
Mo2P2O11 P
200.51 5.75
2.51 39 400 805→650
7 7
MoPO5
Phase X1, MoPO5 (-), β I-MoPO5 (--)
Mo2P2O11 P
200.51 5.75
2.51 38 800 800→650
3 4
MoPO5
Mo4P6O25
b), MoPO5 (-)
Mo2P2O11 P
200.03 5.77
2.50 40 750→600 800→650
7 4
MoPO5
MoPO5, Mo2P4O15 (-)
Mo2P2O11 P
200.57 5.80
2.49 39 800 800 → 650
6 4
MoPO5
MoPO5, Mo4P6O25
b) (-)
Mo2P2O11 P
200.70 5.80
2.49 30 780 → 800 800 → 650
6 7
MoPO5
Phase X1
Mo2P2O11 P
200.68 5.80
2.49 71 790 → 650 6 MoPO5 / Mo2P4O15 MoPO5
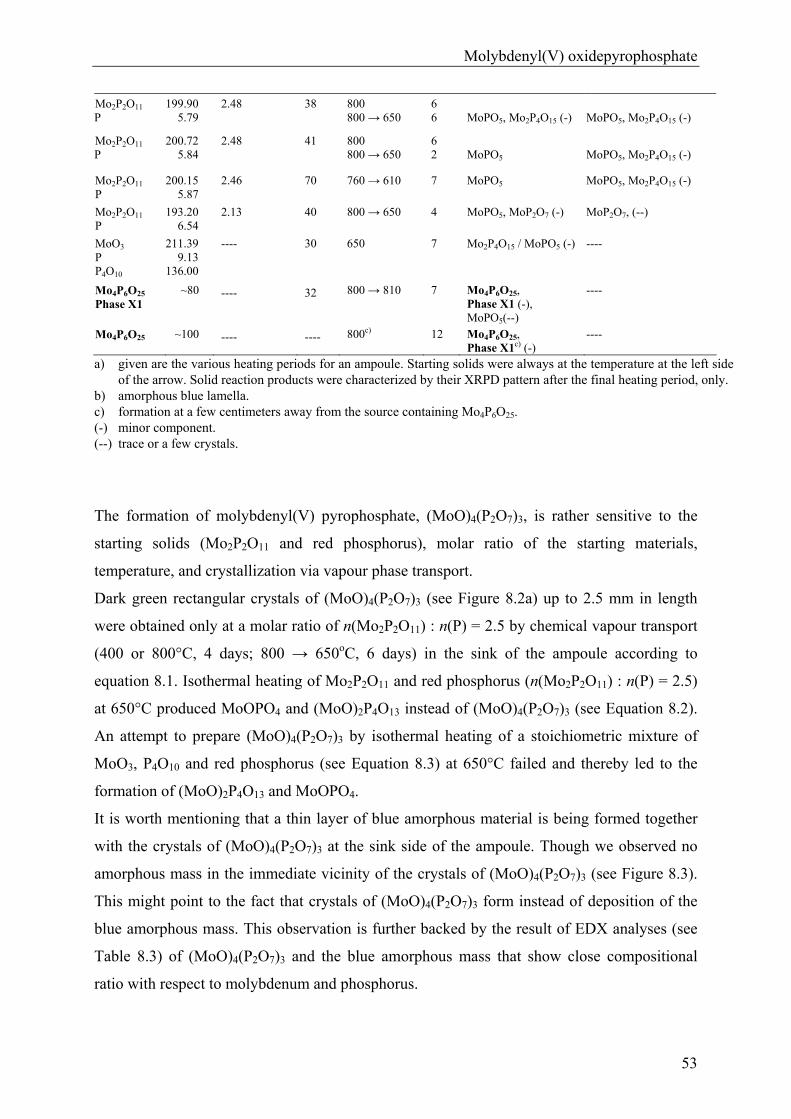
Molybdenyl(V) oxidepyrophosphate
53
Mo2P2O11 P
199.90 5.79
2.48 38 800 800 → 650
6 6
MoPO5, Mo2P4O15 (-)
MoPO5, Mo2P4O15 (-)
Mo2P2O11 P
200.72 5.84
2.48 41 800 800 → 650
6 2
MoPO5
MoPO5, Mo2P4O15 (-)
Mo2P2O11 P
200.15 5.87
2.46 70 760 → 610
7
MoPO5 MoPO5, Mo2P4O15 (-)
Mo2P2O11 P
193.20 6.54
2.13 40 800 → 650 4 MoPO5, MoP2O7 (-) MoP2O7, (--)
MoO3 P P4O10
211.39 9.13 136.00
---- 30 650 7 Mo2P4O15 / MoPO5 (-) ----
Mo4P6O25
Phase X1 ~80 ---- 32 800 → 810 7 Mo4P6O25,
Phase X1 (-), MoPO5(--)
----
Mo4P6O25 ~100 ---- ---- 800c) 12 Mo4P6O25, Phase X1c) (-)
----
a) given are the various heating periods for an ampoule. Starting solids were always at the temperature at the left side of the arrow. Solid reaction products were characterized by their XRPD pattern after the final heating period, only.
b) amorphous blue lamella. c) formation at a few centimeters away from the source containing Mo4P6O25. (-) minor component. (--) trace or a few crystals.
The formation of molybdenyl(V) pyrophosphate, (MoO)4(P2O7)3, is rather sensitive to the
starting solids (Mo2P2O11 and red phosphorus), molar ratio of the starting materials,
temperature, and crystallization via vapour phase transport.
Dark green rectangular crystals of (MoO)4(P2O7)3 (see Figure 8.2a) up to 2.5 mm in length
were obtained only at a molar ratio of n(Mo2P2O11) : n(P) = 2.5 by chemical vapour transport
(400 or 800°C, 4 days; 800 → 650oC, 6 days) in the sink of the ampoule according to
equation 8.1. Isothermal heating of Mo2P2O11 and red phosphorus (n(Mo2P2O11) : n(P) = 2.5)
at 650°C produced MoOPO4 and (MoO)2P4O13 instead of (MoO)4(P2O7)3 (see Equation 8.2).
An attempt to prepare (MoO)4(P2O7)3 by isothermal heating of a stoichiometric mixture of
MoO3, P4O10 and red phosphorus (see Equation 8.3) at 650°C failed and thereby led to the
formation of (MoO)2P4O13 and MoOPO4.
It is worth mentioning that a thin layer of blue amorphous material is being formed together
with the crystals of (MoO)4(P2O7)3 at the sink side of the ampoule. Though we observed no
amorphous mass in the immediate vicinity of the crystals of (MoO)4(P2O7)3 (see Figure 8.3).
This might point to the fact that crystals of (MoO)4(P2O7)3 form instead of deposition of the
blue amorphous mass. This observation is further backed by the result of EDX analyses (see
Table 8.3) of (MoO)4(P2O7)3 and the blue amorphous mass that show close compositional
ratio with respect to molybdenum and phosphorus.
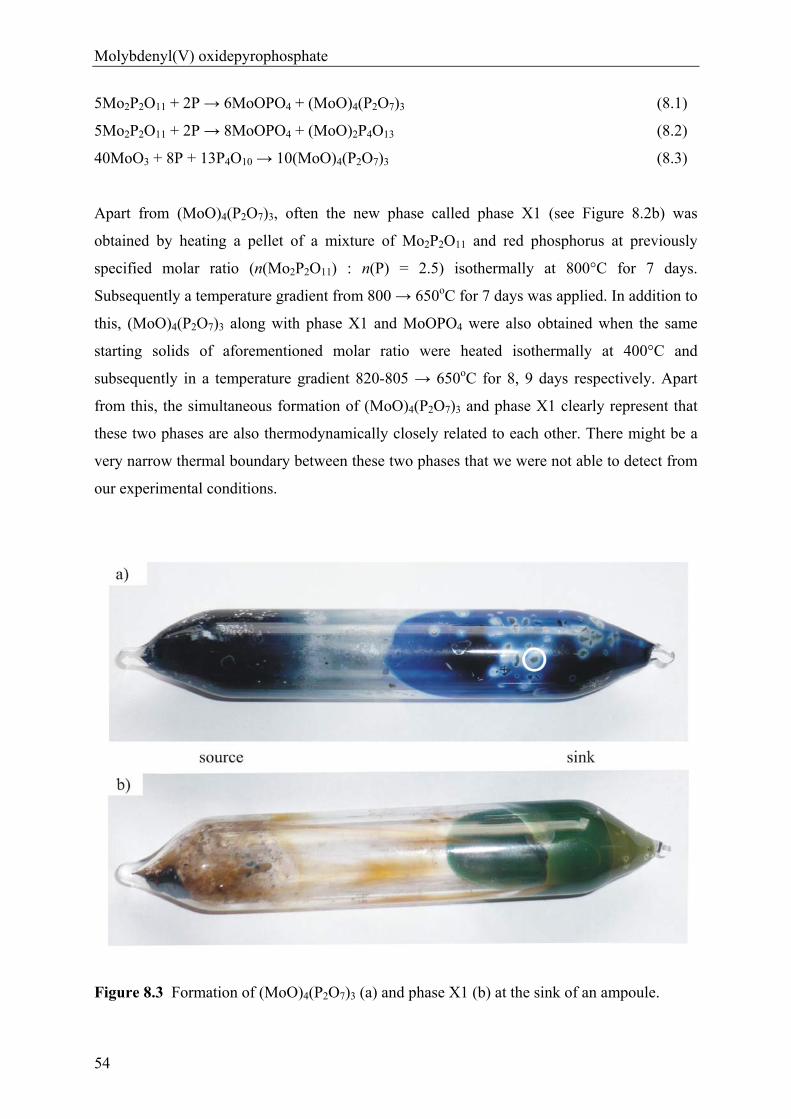
Molybdenyl(V) oxidepyrophosphate
54
5Mo2P2O11 + 2P → 6MoOPO4 + (MoO)4(P2O7)3 (8.1)
5Mo2P2O11 + 2P → 8MoOPO4 + (MoO)2P4O13 (8.2)
40MoO3 + 8P + 13P4O10 → 10(MoO)4(P2O7)3 (8.3)
Apart from (MoO)4(P2O7)3, often the new phase called phase X1 (see Figure 8.2b) was
obtained by heating a pellet of a mixture of Mo2P2O11 and red phosphorus at previously
specified molar ratio (n(Mo2P2O11) : n(P) = 2.5) isothermally at 800°C for 7 days.
Subsequently a temperature gradient from 800 → 650oC for 7 days was applied. In addition to
this, (MoO)4(P2O7)3 along with phase X1 and MoOPO4 were also obtained when the same
starting solids of aforementioned molar ratio were heated isothermally at 400°C and
subsequently in a temperature gradient 820-805 → 650oC for 8, 9 days respectively. Apart
from this, the simultaneous formation of (MoO)4(P2O7)3 and phase X1 clearly represent that
these two phases are also thermodynamically closely related to each other. There might be a
very narrow thermal boundary between these two phases that we were not able to detect from
our experimental conditions.
Figure 8.3 Formation of (MoO)4(P2O7)3 (a) and phase X1 (b) at the sink of an ampoule.
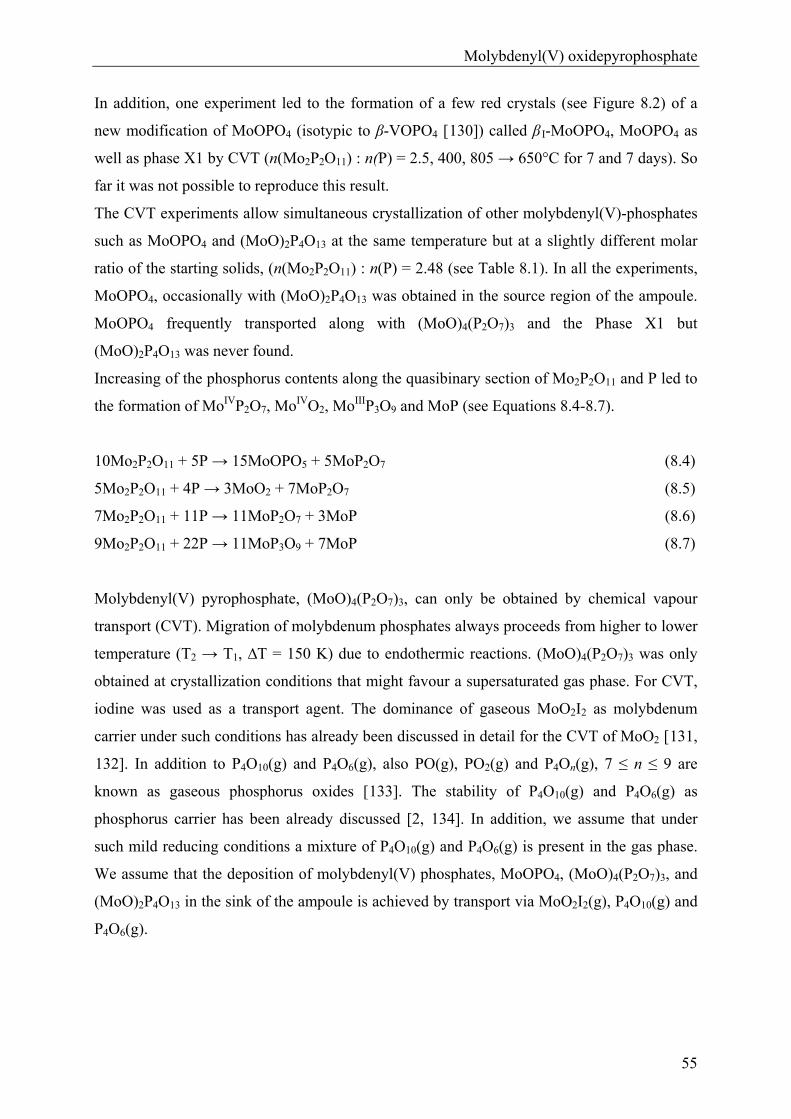
Molybdenyl(V) oxidepyrophosphate
55
In addition, one experiment led to the formation of a few red crystals (see Figure 8.2) of a
new modification of MoOPO4 (isotypic to β-VOPO4 [130]) called β I-MoOPO4, MoOPO4 as
well as phase X1 by CVT (n(Mo2P2O11) : n(P) = 2.5, 400, 805 → 650°C for 7 and 7 days). So
far it was not possible to reproduce this result.
The CVT experiments allow simultaneous crystallization of other molybdenyl(V)-phosphates
such as MoOPO4 and (MoO)2P4O13 at the same temperature but at a slightly different molar
ratio of the starting solids, (n(Mo2P2O11) : n(P) = 2.48 (see Table 8.1). In all the experiments,
MoOPO4, occasionally with (MoO)2P4O13 was obtained in the source region of the ampoule.
MoOPO4 frequently transported along with (MoO)4(P2O7)3 and the Phase X1 but
(MoO)2P4O13 was never found.
Increasing of the phosphorus contents along the quasibinary section of Mo2P2O11 and P led to
the formation of MoIVP2O7, MoIVO2, MoIIIP3O9 and MoP (see Equations 8.4-8.7).
10Mo2P2O11 + 5P → 15MoOPO5 + 5MoP2O7 (8.4)
5Mo2P2O11 + 4P → 3MoO2 + 7MoP2O7 (8.5)
7Mo2P2O11 + 11P → 11MoP2O7 + 3MoP (8.6)
9Mo2P2O11 + 22P → 11MoP3O9 + 7MoP (8.7)
Molybdenyl(V) pyrophosphate, (MoO)4(P2O7)3, can only be obtained by chemical vapour
transport (CVT). Migration of molybdenum phosphates always proceeds from higher to lower
temperature (T2 → T1, ∆T = 150 K) due to endothermic reactions. (MoO)4(P2O7)3 was only
obtained at crystallization conditions that might favour a supersaturated gas phase. For CVT,
iodine was used as a transport agent. The dominance of gaseous MoO2I2 as molybdenum
carrier under such conditions has already been discussed in detail for the CVT of MoO2 [131,
132]. In addition to P4O10(g) and P4O6(g), also PO(g), PO2(g) and P4On(g), 7 ≤ n ≤ 9 are
known as gaseous phosphorus oxides [133]. The stability of P4O10(g) and P4O6(g) as
phosphorus carrier has been already discussed [2, 134]. In addition, we assume that under
such mild reducing conditions a mixture of P4O10(g) and P4O6(g) is present in the gas phase.
We assume that the deposition of molybdenyl(V) phosphates, MoOPO4, (MoO)4(P2O7)3, and
(MoO)2P4O13 in the sink of the ampoule is achieved by transport via MoO2I2(g), P4O10(g) and
P4O6(g).
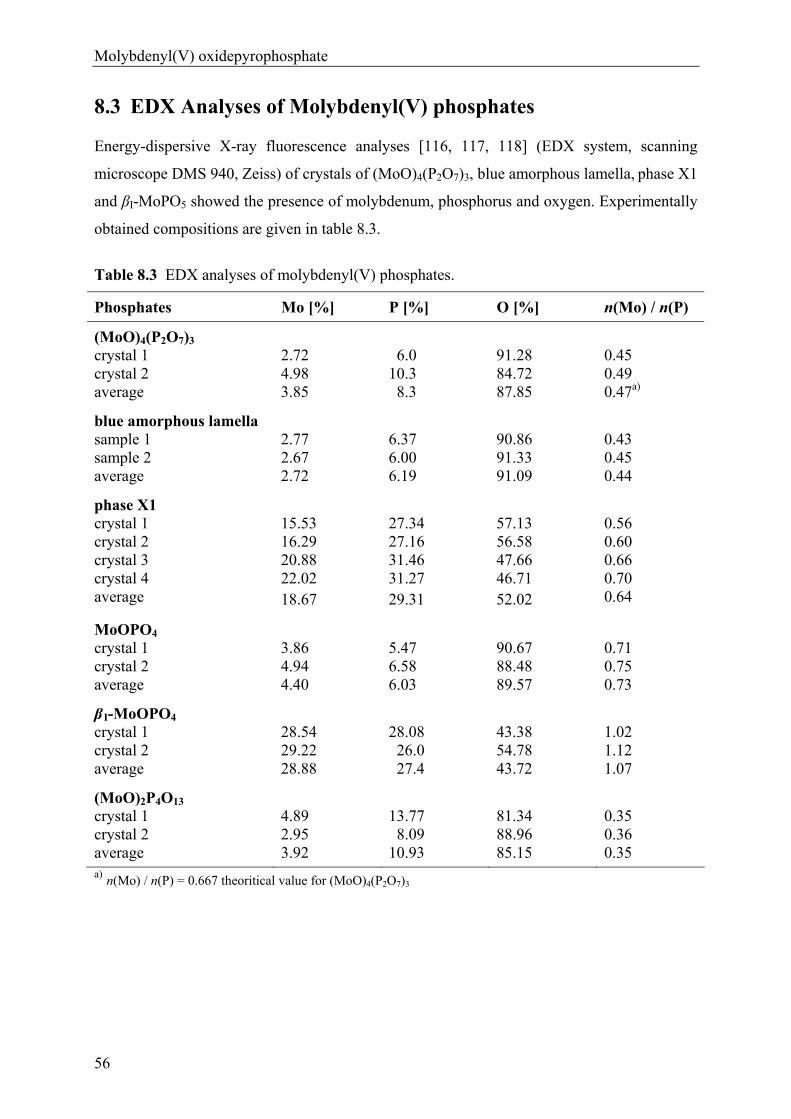
Molybdenyl(V) oxidepyrophosphate
56
8.3 EDX Analyses of Molybdenyl(V) phosphates
Energy-dispersive X-ray fluorescence analyses [116, 117, 118] (EDX system, scanning
microscope DMS 940, Zeiss) of crystals of (MoO)4(P2O7)3, blue amorphous lamella, phase X1
and βI-MoPO5 showed the presence of molybdenum, phosphorus and oxygen. Experimentally
obtained compositions are given in table 8.3.
Table 8.3 EDX analyses of molybdenyl(V) phosphates.
Phosphates Mo [%] P [%] O [%] n(Mo) / n(P)
(MoO)4(P2O7)3
crystal 1 2.72 6.0 91.28 0.45 crystal 2 4.98 10.3 84.72 0.49 average 3.85 8.3 87.85 0.47a)
blue amorphous lamella
sample 1 2.77 6.37 90.86 0.43 sample 2 2.67 6.00 91.33 0.45 average 2.72 6.19 91.09 0.44
phase X1
crystal 1 15.53 27.34 57.13 0.56 crystal 2 16.29 27.16 56.58 0.60 crystal 3 20.88 31.46 47.66 0.66 crystal 4 22.02 31.27 46.71 0.70 average 18.67 29.31 52.02 0.64
MoOPO4 crystal 1 3.86 5.47 90.67 0.71 crystal 2 4.94 6.58 88.48 0.75 average 4.40 6.03 89.57 0.73
β I-MoOPO4
crystal 1 28.54 28.08 43.38 1.02 crystal 2 29.22 26.0 54.78 1.12 average 28.88 27.4 43.72 1.07
(MoO)2P4O13 crystal 1 4.89 13.77 81.34 0.35 crystal 2 2.95 8.09 88.96 0.36 average 3.92 10.93 85.15 0.35 a) n(Mo) / n(P) = 0.667 theoritical value for (MoO)4(P2O7)3
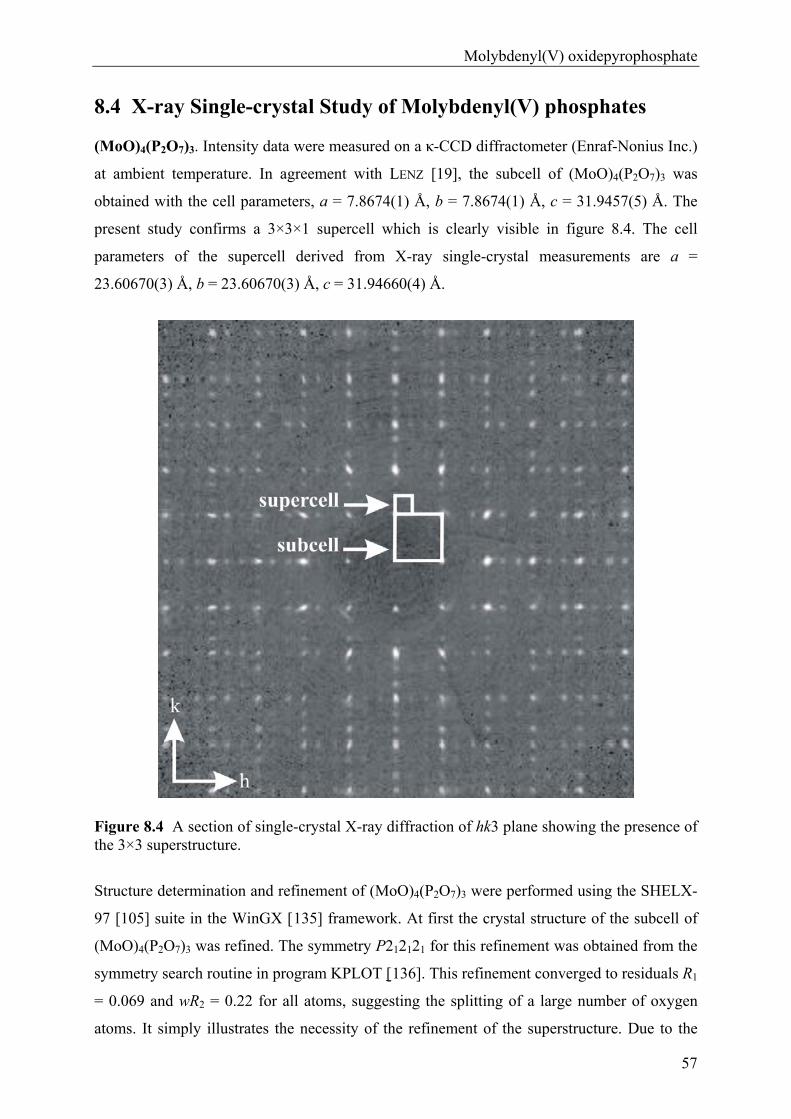
Molybdenyl(V) oxidepyrophosphate
57
8.4 X-ray Single-crystal Study of Molybdenyl(V) phosphates
(MoO)4(P2O7)3. Intensity data were measured on a κ-CCD diffractometer (Enraf-Nonius Inc.)
at ambient temperature. In agreement with LENZ [19], the subcell of (MoO)4(P2O7)3 was
obtained with the cell parameters, a = 7.8674(1) Å, b = 7.8674(1) Å, c = 31.9457(5) Å. The
present study confirms a 3×3×1 supercell which is clearly visible in figure 8.4. The cell
parameters of the supercell derived from X-ray single-crystal measurements are a =
23.60670(3) Å, b = 23.60670(3) Å, c = 31.94660(4) Å.
Figure 8.4 A section of single-crystal X-ray diffraction of hk3 plane showing the presence of the 3×3 superstructure.
Structure determination and refinement of (MoO)4(P2O7)3 were performed using the SHELX-
97 [105] suite in the WinGX [135] framework. At first the crystal structure of the subcell of
(MoO)4(P2O7)3 was refined. The symmetry P212121 for this refinement was obtained from the
symmetry search routine in program KPLOT [136]. This refinement converged to residuals R1
= 0.069 and wR2 = 0.22 for all atoms, suggesting the splitting of a large number of oxygen
atoms. It simply illustrates the necessity of the refinement of the superstructure. Due to the
Molybdenyl(V) oxidepyrophosphate
58
presence of a large number of very weak reflections in the superstructure of (MoO)4(P2O7)3,
no reliable space group determination was possible on the basis of systematic absences and of
statistic intensity distributions. Therefore, the structure refinement of the superstructure was
carried out in space group P212121 obtained from the isomorphic transition of index 3 in space
group P212121 found for the subcell (MoO)4(P2O7)3. Starting parameters were obtained by
Direct Methods in SHELXS [137]. Thus molybdenum and phosphorus atoms were revealed.
Subsequent ∆-Fourier syntheses allowed localization of most of the oxygen atoms. The
missing oxygen atoms were determined assuming oxygen atoms required for the completion
of the coordination polyhedra around molybdenum and phosphorus. Therefore two oxygen
atoms O531 and b27 were introduced for the completion of the coordination of P54 and P53.
Apart from these, 18 oxygen sites (from O19A, O19B to O27A, O27B) were introduced in the
Z = 1/8 layer found as phosphorus and oxygen deficient layer in the crystal structure (see
detail in section 8.5). At this stage the model refinement gave a residual R1 = 0.159 and wR2 =
0.47. The refinement of the crystal structure allowing for a two-fold axis along [1 1 0] as twin
element 0 1 0 1 0 0 0 0 1 converged at R1 = 0.128, wR2 = 0.401. Only eighteen molybdenum
atoms were refined allowing anisotropic displacement parameters while for other atoms the
refinement is blocked due to too small array B. Introduction of restrains for the split
molybdenum atoms (EXYZ or EADP) as well as for distances d(Mo-O) and d(P-O) (DFIX)
revealed the refinement to be unstable. We can relate these problems to the large number of
parameters involved in the refinement of the superstructure of (MoO)4(P2O7)3.
Details on X-ray single crystal data collections as well as structural refinements are given in
table 8.4. Atomic coordinates, anisotropic displacement parameters are given in Appendix A1
(Table A1.1 to Table A1.5).
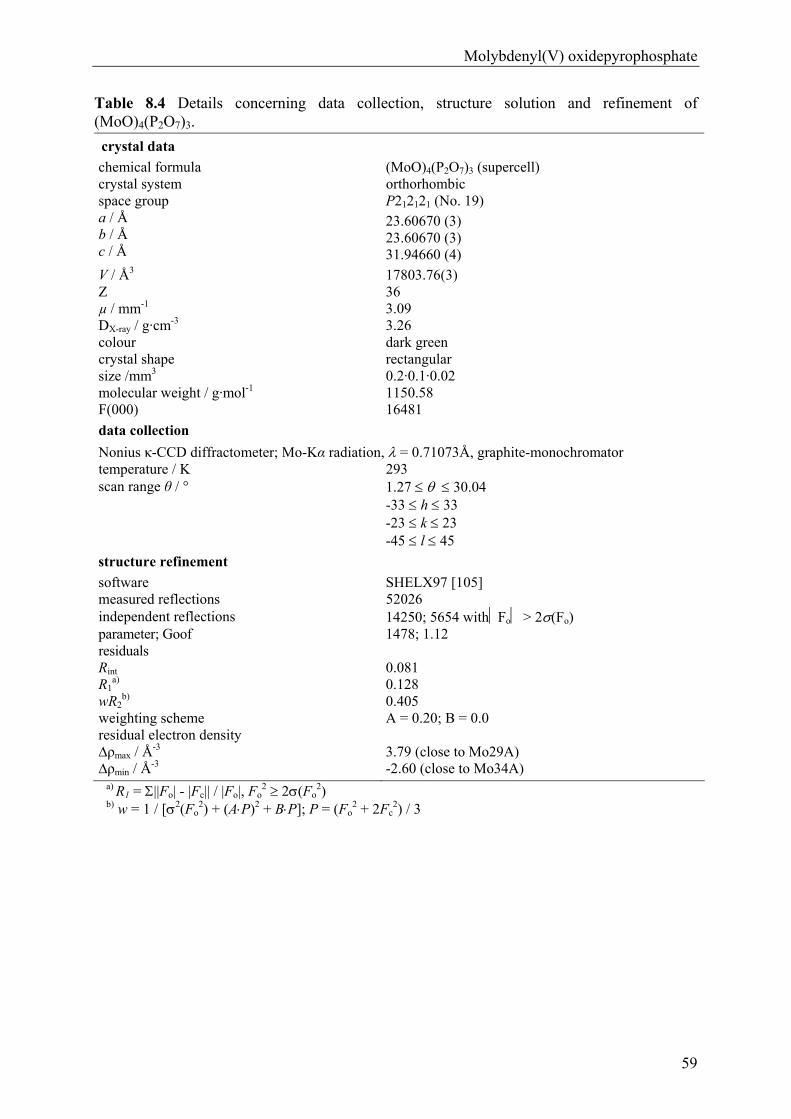
Molybdenyl(V) oxidepyrophosphate
59
Table 8.4 Details concerning data collection, structure solution and refinement of (MoO)4(P2O7)3.
crystal data
chemical formula (MoO)4(P2O7)3 (supercell) crystal system orthorhombic space group P212121 (No. 19) a / Å b / Å c / Å
23.60670 (3) 23.60670 (3) 31.94660 (4)
V / Å3 17803.76(3) Z 36 µ / mm-1 3.09 DX-ray / g·cm-3 3.26 colour dark green crystal shape size /mm3
rectangular 0.2·0.1·0.02
molecular weight / g·mol-1 1150.58 F(000) 16481
data collection
Nonius κ-CCD diffractometer; Mo-Kα radiation, = 0.71073Å, graphite-monochromator temperature / K 293 scan range θ / ° 1.27 30.04
-33 h 33 -23 k 23 -45 l 45
structure refinement
software SHELX97 [105] measured reflections 52026 independent reflections 14250; 5654 withFo > 2(Fo) parameter; Goof 1478; 1.12 residuals Rint R1
a) wR2
b)
0.081 0.128 0.405
weighting scheme A = 0.20; B = 0.0 residual electron density ∆ρmax / Å
-3 ∆ρmin / Å
-3
3.79 (close to Mo29A) -2.60 (close to Mo34A)
a) R1 = ||Fo| - |Fc|| / |Fo|, Fo2 2(Fo
2) b) w = 1 / [2(Fo
2) + (AP)2 + BP]; P = (Fo2 + 2Fc
2) / 3
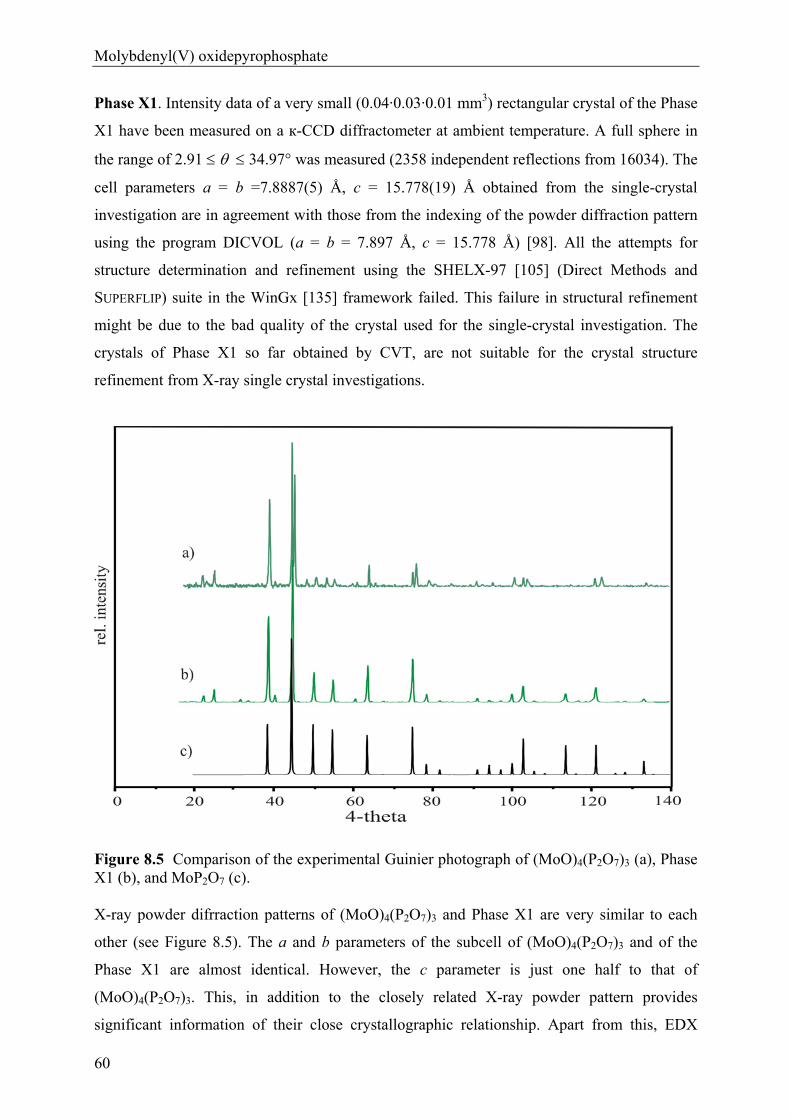
Molybdenyl(V) oxidepyrophosphate
60
Phase X1. Intensity data of a very small (0.04·0.03·0.01 mm3) rectangular crystal of the Phase
X1 have been measured on a к-CCD diffractometer at ambient temperature. A full sphere in
the range of 2.91 34.97° was measured (2358 independent reflections from 16034). The
cell parameters a = b =7.8887(5) Å, c = 15.778(19) Å obtained from the single-crystal
investigation are in agreement with those from the indexing of the powder diffraction pattern
using the program DICVOL (a = b = 7.897 Å, c = 15.778 Å) [98]. All the attempts for
structure determination and refinement using the SHELX-97 [105] (Direct Methods and
SUPERFLIP) suite in the WinGx [135] framework failed. This failure in structural refinement
might be due to the bad quality of the crystal used for the single-crystal investigation. The
crystals of Phase X1 so far obtained by CVT, are not suitable for the crystal structure
refinement from X-ray single crystal investigations.
Figure 8.5 Comparison of the experimental Guinier photograph of (MoO)4(P2O7)3 (a), Phase X1 (b), and MoP2O7 (c).
X-ray powder difrraction patterns of (MoO)4(P2O7)3 and Phase X1 are very similar to each
other (see Figure 8.5). The a and b parameters of the subcell of (MoO)4(P2O7)3 and of the
Phase X1 are almost identical. However, the c parameter is just one half to that of
(MoO)4(P2O7)3. This, in addition to the closely related X-ray powder pattern provides
significant information of their close crystallographic relationship. Apart from this, EDX
Molybdenyl(V) oxidepyrophosphate
61
analyses show the ratio Mo : P = 1:1.5. Therefore, it might be reasonable to state that the
Phase X1 is a second polymorph of (MoO)4(P2O7)3.
β I-MoOPO4. In the course of this investigation (Table 8.2) a few reddish crystals of the new
polymorph of molybdenyl(V)-orthophosphate were obtained. We call this β I-MoOPO4 in
accordance with the isotypic β-VOPO4 [130].
Single-crystal intensity data of a small (0.04·0.03·0.02 mm3) rectangular red crystal of β I-
MoOPO4 have been measured on a к-CCD diffractometer at ambient temperature. Structure
determination and refinement were performed using the SHELX-97 [105] suite in the WinGx
[135] framework. Despite the reasonable bond-lengths and angles, the refinement of β I-
MoOPO4 converged to the rather high residuals of R1 = 0.1005 and wR2 = 0.2838. We relate
these high residuals to the poor quality of the crystal used for X-ray single-crystal experiment.
Details on this compound are given as Appendix A2 (see Table A2.1 to A2.4, Figiure A2.1).
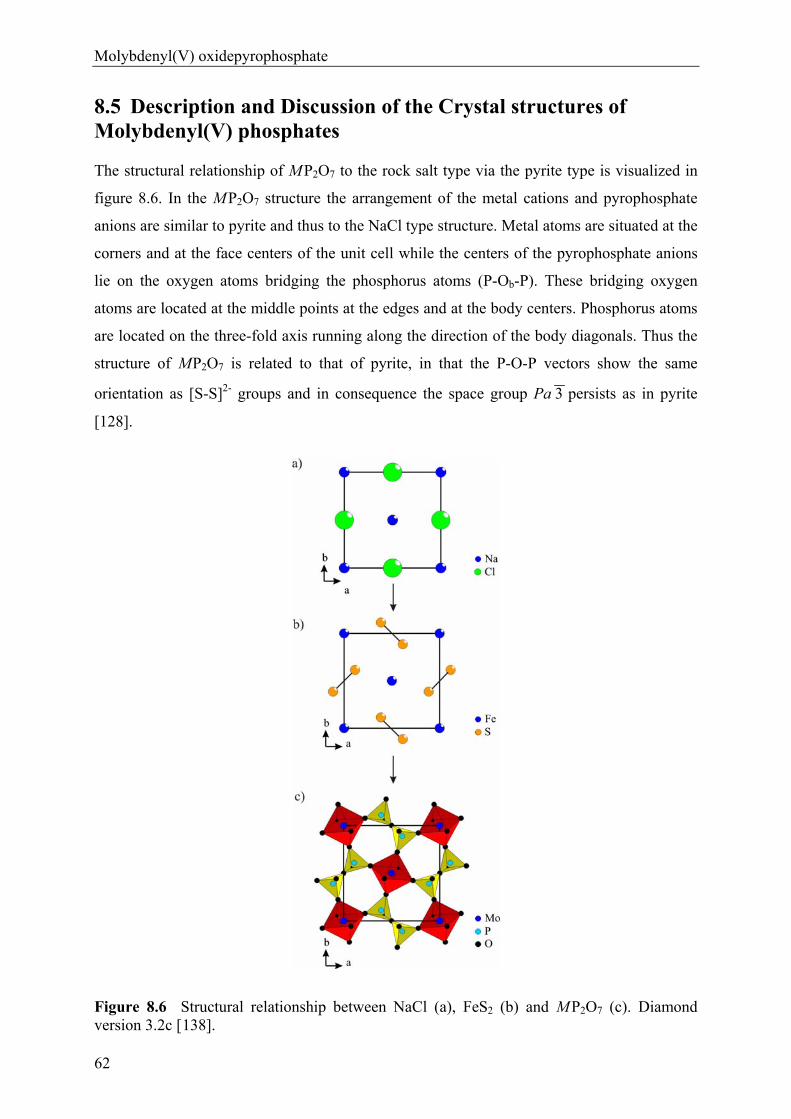
Molybdenyl(V) oxidepyrophosphate
62
8.5 Description and Discussion of the Crystal structures of Molybdenyl(V) phosphates
The structural relationship of M P2O7 to the rock salt type via the pyrite type is visualized in
figure 8.6. In the M P2O7 structure the arrangement of the metal cations and pyrophosphate
anions are similar to pyrite and thus to the NaCl type structure. Metal atoms are situated at the
corners and at the face centers of the unit cell while the centers of the pyrophosphate anions
lie on the oxygen atoms bridging the phosphorus atoms (P-Ob-P). These bridging oxygen
atoms are located at the middle points at the edges and at the body centers. Phosphorus atoms
are located on the three-fold axis running along the direction of the body diagonals. Thus the
structure of MP2O7 is related to that of pyrite, in that the P-O-P vectors show the same
orientation as [S-S]2- groups and in consequence the space group Pa 3 persists as in pyrite
[128].
Figure 8.6 Structural relationship between NaCl (a), FeS2 (b) and M P2O7 (c). Diamond version 3.2c [138].
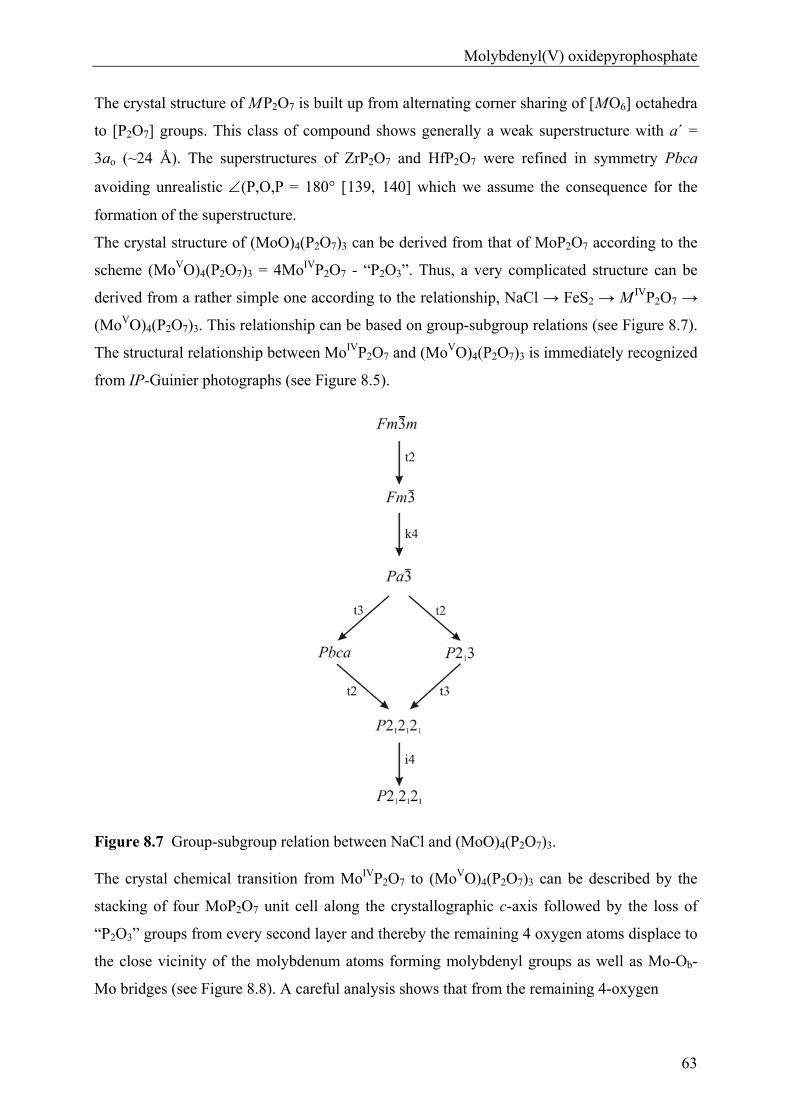
Molybdenyl(V) oxidepyrophosphate
63
The crystal structure of M P2O7 is built up from alternating corner sharing of [MO6] octahedra
to [P2O7] groups. This class of compound shows generally a weak superstructure with a΄ =
3ao (~24 Å). The superstructures of ZrP2O7 and HfP2O7 were refined in symmetry Pbca
avoiding unrealistic (P,O,P = 180° [139, 140] which we assume the consequence for the
formation of the superstructure.
The crystal structure of (MoO)4(P2O7)3 can be derived from that of MoP2O7 according to the
scheme (MoVO)4(P2O7)3 = 4MoIVP2O7 - “P2O3”. Thus, a very complicated structure can be
derived from a rather simple one according to the relationship, NaCl → FeS2 → M IVP2O7 →
(MoVO)4(P2O7)3. This relationship can be based on group-subgroup relations (see Figure 8.7).
The structural relationship between MoIVP2O7 and (MoVO)4(P2O7)3 is immediately recognized
from IP-Guinier photographs (see Figure 8.5).
Figure 8.7 Group-subgroup relation between NaCl and (MoO)4(P2O7)3.
The crystal chemical transition from MoIVP2O7 to (MoVO)4(P2O7)3 can be described by the
stacking of four MoP2O7 unit cell along the crystallographic c-axis followed by the loss of
“P2O3” groups from every second layer and thereby the remaining 4 oxygen atoms displace to
the close vicinity of the molybdenum atoms forming molybdenyl groups as well as Mo-Ob-
Mo bridges (see Figure 8.8). A careful analysis shows that from the remaining 4-oxygen
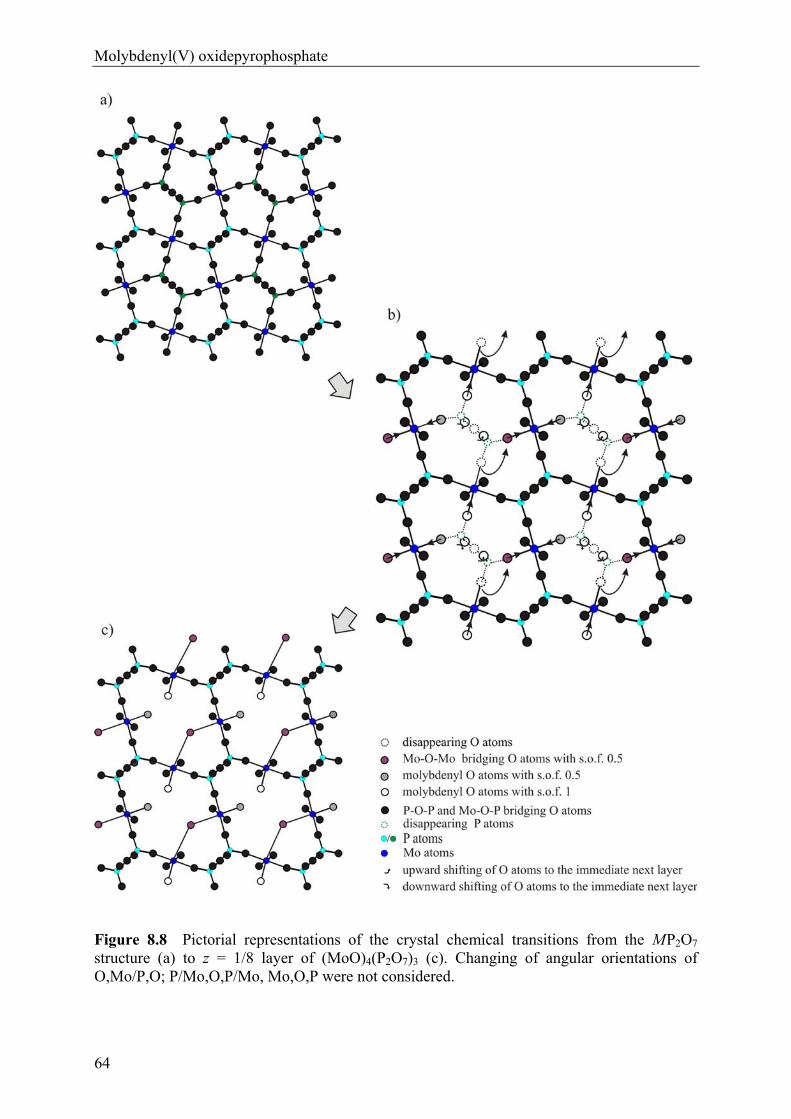
Molybdenyl(V) oxidepyrophosphate
64
Figure 8.8 Pictorial representations of the crystal chemical transitions from the MP2O7 structure (a) to z = 1/8 layer of (MoO)4(P2O7)3 (c). Changing of angular orientations of O,Mo/P,O; P/Mo,O,P/Mo, Mo,O,P were not considered.
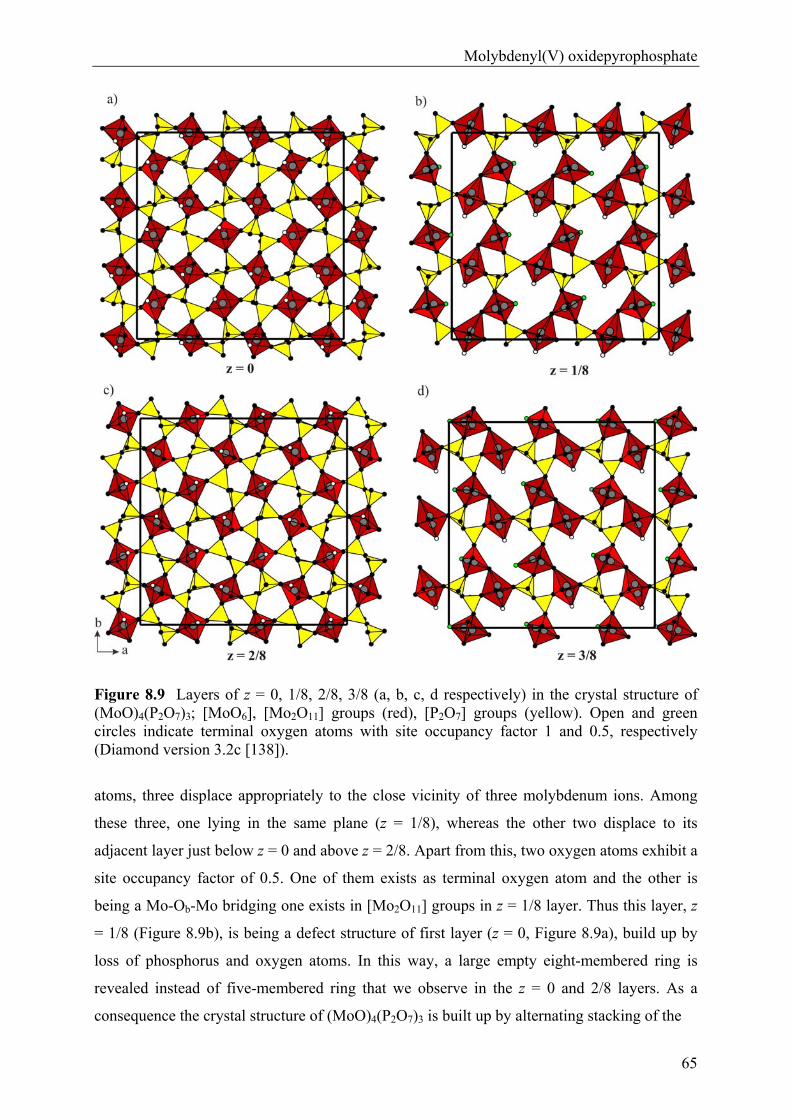
Molybdenyl(V) oxidepyrophosphate
65
Figure 8.9 Layers of z = 0, 1/8, 2/8, 3/8 (a, b, c, d respectively) in the crystal structure of (MoO)4(P2O7)3; [MoO6], [Mo2O11] groups (red), [P2O7] groups (yellow). Open and green circles indicate terminal oxygen atoms with site occupancy factor 1 and 0.5, respectively (Diamond version 3.2c [138]).
atoms, three displace appropriately to the close vicinity of three molybdenum ions. Among
these three, one lying in the same plane (z = 1/8), whereas the other two displace to its
adjacent layer just below z = 0 and above z = 2/8. Apart from this, two oxygen atoms exhibit a
site occupancy factor of 0.5. One of them exists as terminal oxygen atom and the other is
being a Mo-Ob-Mo bridging one exists in [Mo2O11] groups in z = 1/8 layer. Thus this layer, z
= 1/8 (Figure 8.9b), is being a defect structure of first layer (z = 0, Figure 8.9a), build up by
loss of phosphorus and oxygen atoms. In this way, a large empty eight-membered ring is
revealed instead of five-membered ring that we observe in the z = 0 and 2/8 layers. As a
consequence the crystal structure of (MoO)4(P2O7)3 is built up by alternating stacking of the
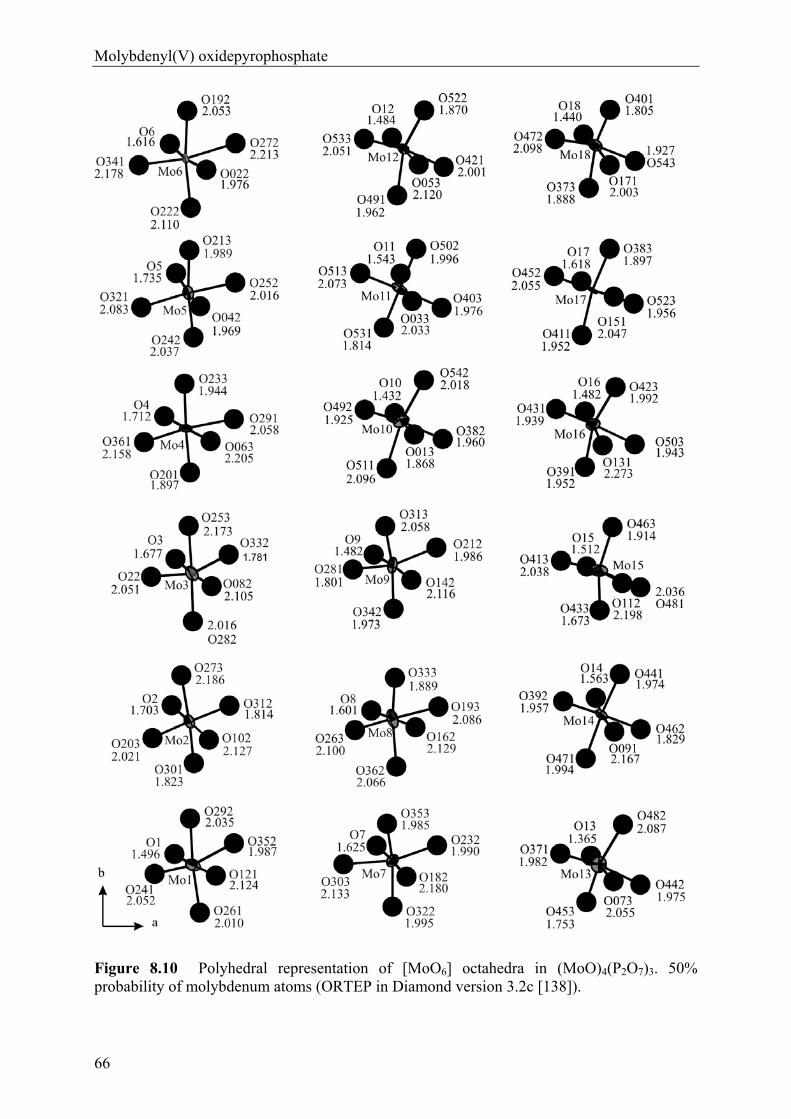
Molybdenyl(V) oxidepyrophosphate
66
Figure 8.10 Polyhedral representation of [MoO6] octahedra in (MoO)4(P2O7)3. 50% probability of molybdenum atoms (ORTEP in Diamond version 3.2c [138]).
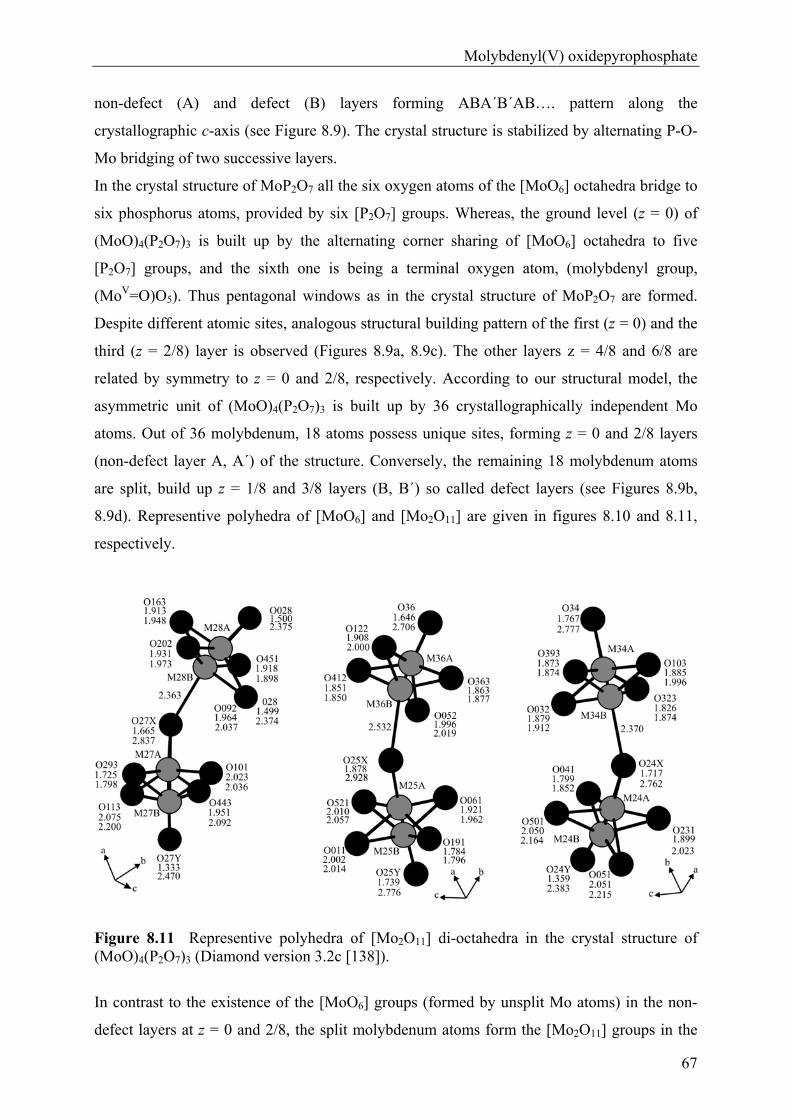
Molybdenyl(V) oxidepyrophosphate
67
non-defect (A) and defect (B) layers forming ABA΄B΄AB…. pattern along the
crystallographic c-axis (see Figure 8.9). The crystal structure is stabilized by alternating P-O-
Mo bridging of two successive layers.
In the crystal structure of MoP2O7 all the six oxygen atoms of the [MoO6] octahedra bridge to
six phosphorus atoms, provided by six [P2O7] groups. Whereas, the ground level (z = 0) of
(MoO)4(P2O7)3 is built up by the alternating corner sharing of [MoO6] octahedra to five
[P2O7] groups, and the sixth one is being a terminal oxygen atom, (molybdenyl group,
(MoV=O)O5). Thus pentagonal windows as in the crystal structure of MoP2O7 are formed.
Despite different atomic sites, analogous structural building pattern of the first (z = 0) and the
third (z = 2/8) layer is observed (Figures 8.9a, 8.9c). The other layers z = 4/8 and 6/8 are
related by symmetry to z = 0 and 2/8, respectively. According to our structural model, the
asymmetric unit of (MoO)4(P2O7)3 is built up by 36 crystallographically independent Mo
atoms. Out of 36 molybdenum, 18 atoms possess unique sites, forming z = 0 and 2/8 layers
(non-defect layer A, A΄) of the structure. Conversely, the remaining 18 molybdenum atoms
are split, build up z = 1/8 and 3/8 layers (B, B΄) so called defect layers (see Figures 8.9b,
8.9d). Representive polyhedra of [MoO6] and [Mo2O11] are given in figures 8.10 and 8.11,
respectively.
Figure 8.11 Representive polyhedra of [Mo2O11] di-octahedra in the crystal structure of (MoO)4(P2O7)3 (Diamond version 3.2c [138]).
In contrast to the existence of the [MoO6] groups (formed by unsplit Mo atoms) in the non-
defect layers at z = 0 and 2/8, the split molybdenum atoms form the [Mo2O11] groups in the
Molybdenyl(V) oxidepyrophosphate
68
defect layer (z = 1/8, and 3/8). The current structural model shows that molybdenum atoms of
layer z = 1/8, and 3/8 form the [Mo2O11] groups. However, the existence of the five-fold
coordination instead of [Mo2O11] groups can not be completely ruled out. The existence of
[Mo2O11] groups is found in the crystal structure of AI2MoV
2P2O11 (AI = Rb [141], Tl [142]).
We noticed that in [Mo2O11] di-octahedra, the terminal oxygen atoms persist trans
conformation with the site occupancy factor of 1 and 0.5, respectively. Half occupancy of the
oxygen atoms can also be observed for the bridging oxygen atoms of the Mo-O-Mo linkage in
[Mo2O11] di-octahedra.
The crystal structure of (MoVO)4(P2O7)3 is a hybrid of a non-defect like MP2O7 and “P2O3”
defect structure. This structure model for (MoVO)4(P2O7)3 i.e. “MoVP1.5O6.25” is distinctly
different to that of NbVP1.8O7 [143], another variation of the M I V P2O7 structure type. In the
niobium(V)-phosphate, charge balance does not occur by the occupation of M IV positions in
MP2O7, but by the occupation of the phosphorus positions [143], apparently by the building
of (NbO)3+ groups and orthophosphate unit. In (MoO)4(P2O7)3, MoV+ is attained due to
“P2O3” deficiency following by the formation of molybdenyl groups, (MoO)4+.
Despite our detailed knowledge on the structural model of the pyrophosphate, (MoO)4(P2O7)3,
structural refinement in many cases gave physically meaningless distances d(P-O) and d(Mo-
O). In addition to this, splitting of half of the molybdenum atoms (18) in the z = 1/8 and 3/8
layer appeared. These observations might indicate that the true cell is even larger which we
were unable to identify from X-ray single-crystal investigations or the symmetry is even
lower.
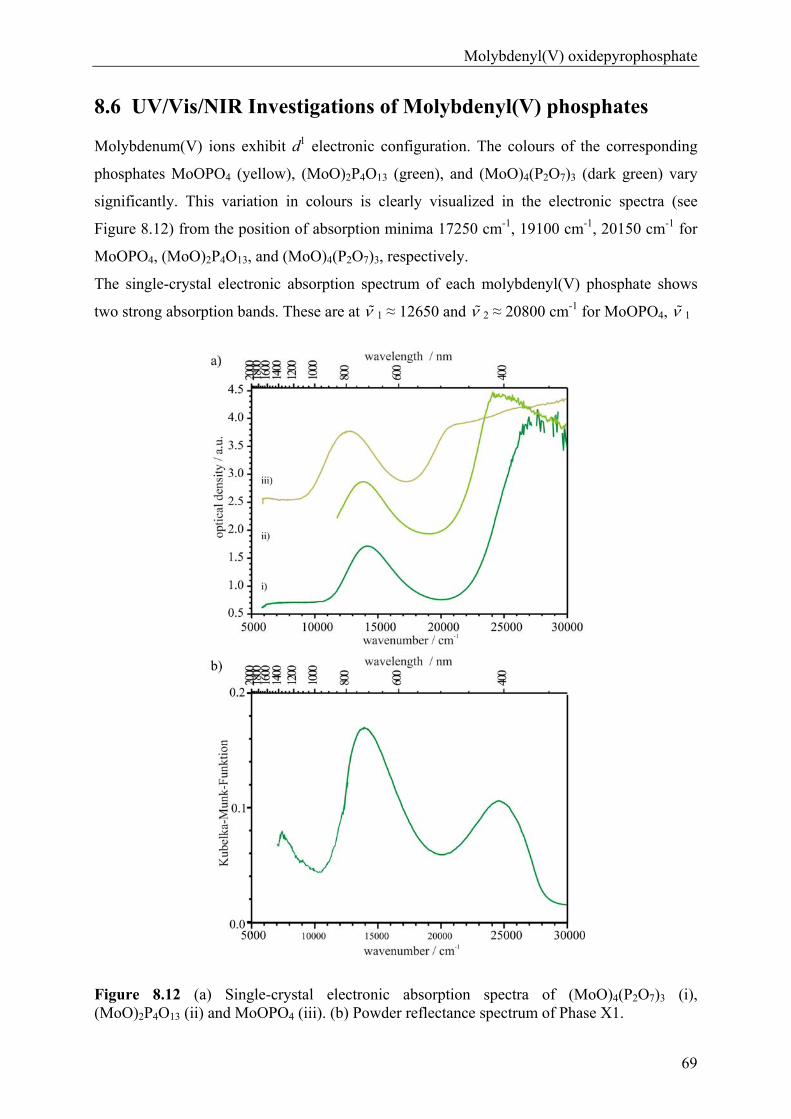
Molybdenyl(V) oxidepyrophosphate
69
8.6 UV/Vis/NIR Investigations of Molybdenyl(V) phosphates
Molybdenum(V) ions exhibit d1 electronic configuration. The colours of the corresponding
phosphates MoOPO4 (yellow), (MoO)2P4O13 (green), and (MoO)4(P2O7)3 (dark green) vary
significantly. This variation in colours is clearly visualized in the electronic spectra (see
Figure 8.12) from the position of absorption minima 17250 cm-1, 19100 cm-1, 20150 cm-1 for
MoOPO4, (MoO)2P4O13, and (MoO)4(P2O7)3, respectively.
The single-crystal electronic absorption spectrum of each molybdenyl(V) phosphate shows
two strong absorption bands. These are at 1 ≈ 12650 and 2 ≈ 20800 cm-1 for MoOPO4, 1
Figure 8.12 (a) Single-crystal electronic absorption spectra of (MoO)4(P2O7)3 (i), (MoO)2P4O13 (ii) and MoOPO4 (iii). (b) Powder reflectance spectrum of Phase X1.
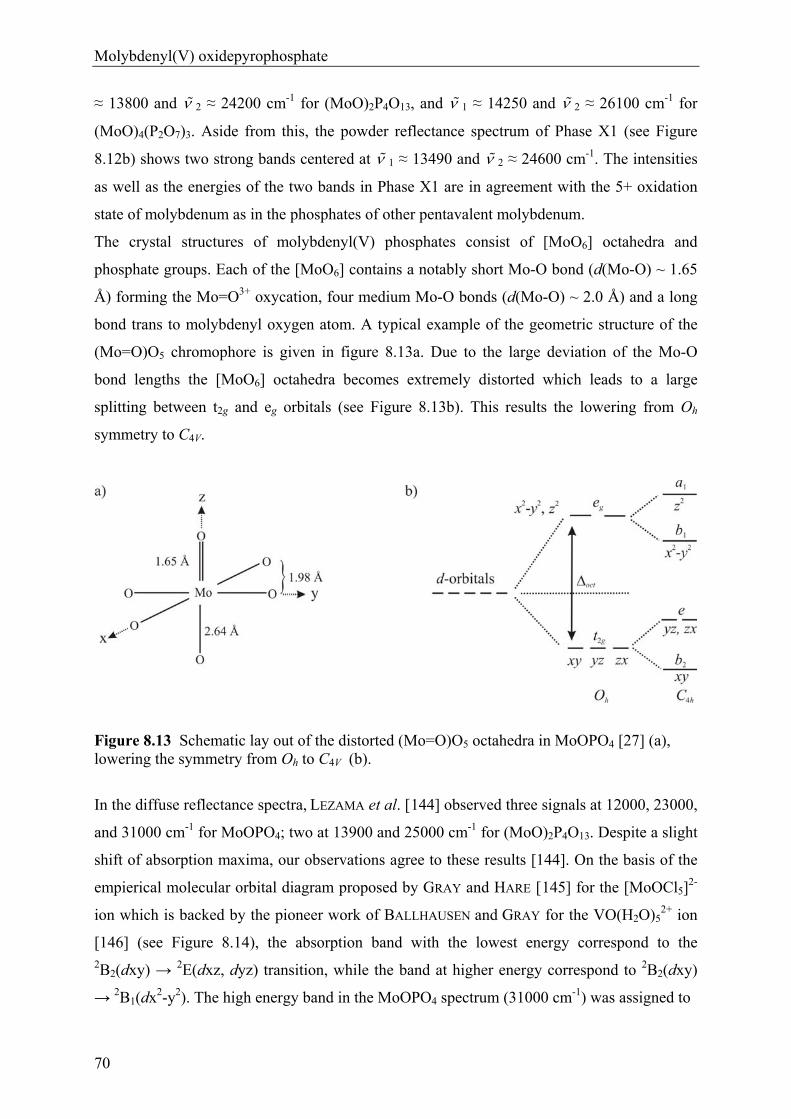
Molybdenyl(V) oxidepyrophosphate
70
≈ 13800 and 2 ≈ 24200 cm-1 for (MoO)2P4O13, and 1 ≈ 14250 and 2 ≈ 26100 cm-1 for
(MoO)4(P2O7)3. Aside from this, the powder reflectance spectrum of Phase X1 (see Figure
8.12b) shows two strong bands centered at 1 ≈ 13490 and 2 ≈ 24600 cm-1. The intensities
as well as the energies of the two bands in Phase X1 are in agreement with the 5+ oxidation
state of molybdenum as in the phosphates of other pentavalent molybdenum.
The crystal structures of molybdenyl(V) phosphates consist of [MoO6] octahedra and
phosphate groups. Each of the [MoO6] contains a notably short Mo-O bond (d(Mo-O) ~ 1.65
Å) forming the Mo=O3+ oxycation, four medium Mo-O bonds (d(Mo-O) ~ 2.0 Å) and a long
bond trans to molybdenyl oxygen atom. A typical example of the geometric structure of the
(Mo=O)O5 chromophore is given in figure 8.13a. Due to the large deviation of the Mo-O
bond lengths the [MoO6] octahedra becomes extremely distorted which leads to a large
splitting between t2g and eg orbitals (see Figure 8.13b). This results the lowering from Oh
symmetry to C4V.
Figure 8.13 Schematic lay out of the distorted (Mo=O)O5 octahedra in MoOPO4 [27] (a), lowering the symmetry from Oh to C4V (b).
In the diffuse reflectance spectra, LEZAMA et al. [144] observed three signals at 12000, 23000,
and 31000 cm-1 for MoOPO4; two at 13900 and 25000 cm-1 for (MoO)2P4O13. Despite a slight
shift of absorption maxima, our observations agree to these results [144]. On the basis of the
empierical molecular orbital diagram proposed by GRAY and HARE [145] for the [MoOCl5]2-
ion which is backed by the pioneer work of BALLHAUSEN and GRAY for the VO(H2O)52+ ion
[146] (see Figure 8.14), the absorption band with the lowest energy correspond to the 2B2(dxy) → 2E(dxz, dyz) transition, while the band at higher energy correspond to 2B2(dxy)
→ 2B1(dx2-y2). The high energy band in the MoOPO4 spectrum (31000 cm-1) was assigned to
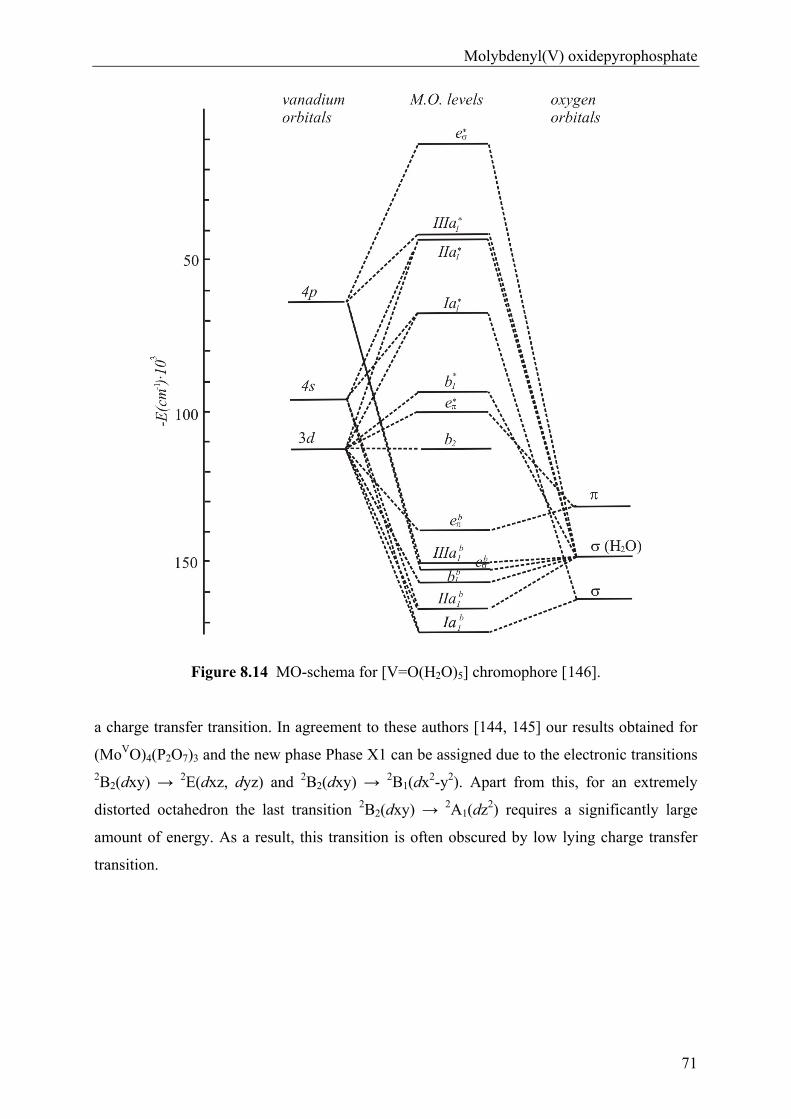
Molybdenyl(V) oxidepyrophosphate
71
Figure 8.14 MO-schema for [V=O(H2O)5] chromophore [146].
a charge transfer transition. In agreement to these authors [144, 145] our results obtained for
(MoVO)4(P2O7)3 and the new phase Phase X1 can be assigned due to the electronic transitions 2B2(dxy) → 2E(dxz, dyz) and 2B2(dxy) → 2B1(dx2-y2). Apart from this, for an extremely
distorted octahedron the last transition 2B2(dxy) → 2A1(dz2) requires a significantly large
amount of energy. As a result, this transition is often obscured by low lying charge transfer
transition.
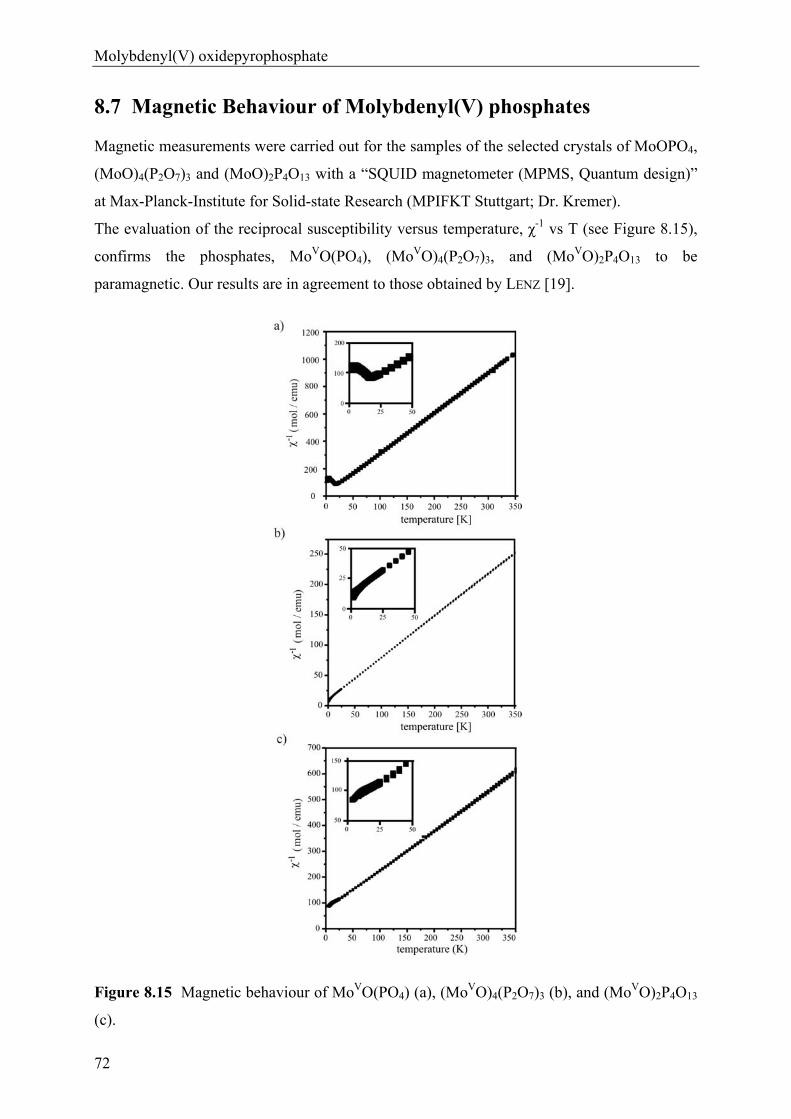
Molybdenyl(V) oxidepyrophosphate
72
8.7 Magnetic Behaviour of Molybdenyl(V) phosphates
Magnetic measurements were carried out for the samples of the selected crystals of MoOPO4,
(MoO)4(P2O7)3 and (MoO)2P4O13 with a “SQUID magnetometer (MPMS, Quantum design)”
at Max-Planck-Institute for Solid-state Research (MPIFKT Stuttgart; Dr. Kremer).
The evaluation of the reciprocal susceptibility versus temperature, χ-1 vs T (see Figure 8.15),
confirms the phosphates, MoVO(PO4), (MoVO)4(P2O7)3, and (MoVO)2P4O13 to be
paramagnetic. Our results are in agreement to those obtained by LENZ [19].
Figure 8.15 Magnetic behaviour of MoVO(PO4) (a), (MoVO)4(P2O7)3 (b), and (MoVO)2P4O13
(c).
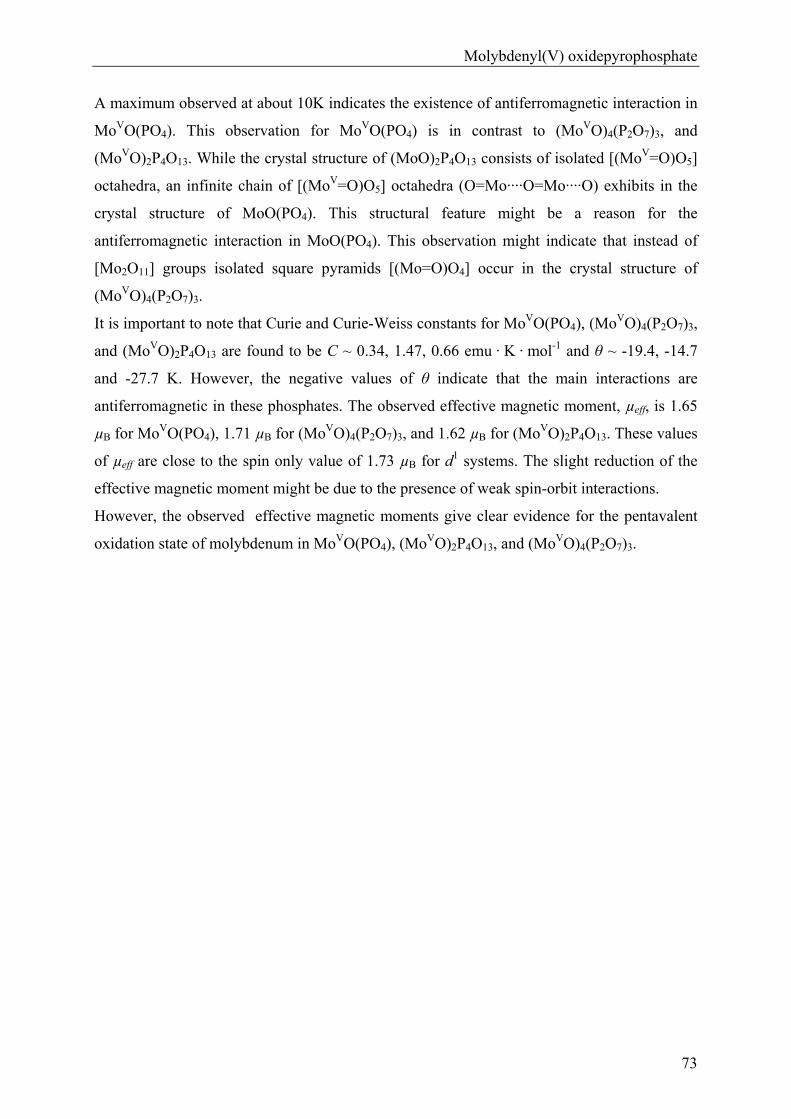
Molybdenyl(V) oxidepyrophosphate
73
A maximum observed at about 10K indicates the existence of antiferromagnetic interaction in
MoVO(PO4). This observation for MoVO(PO4) is in contrast to (MoVO)4(P2O7)3, and
(MoVO)2P4O13. While the crystal structure of (MoO)2P4O13 consists of isolated [(MoV=O)O5]
octahedra, an infinite chain of [(MoV=O)O5] octahedra (O=Mo····O=Mo····O) exhibits in the
crystal structure of MoO(PO4). This structural feature might be a reason for the
antiferromagnetic interaction in MoO(PO4). This observation might indicate that instead of
[Mo2O11] groups isolated square pyramids [(Mo=O)O4] occur in the crystal structure of
(MoVO)4(P2O7)3.
It is important to note that Curie and Curie-Weiss constants for MoVO(PO4), (MoVO)4(P2O7)3,
and (MoVO)2P4O13 are found to be C ~ 0.34, 1.47, 0.66 emu · K · mol-1 and θ ~ -19.4, -14.7
and -27.7 K. However, the negative values of θ indicate that the main interactions are
antiferromagnetic in these phosphates. The observed effective magnetic moment, µeff, is 1.65
µB for MoVO(PO4), 1.71 µB for (MoVO)4(P2O7)3, and 1.62 µB for (MoVO)2P4O13. These values
of µeff are close to the spin only value of 1.73 µB for d1 systems. The slight reduction of the
effective magnetic moment might be due to the presence of weak spin-orbit interactions.
However, the observed effective magnetic moments give clear evidence for the pentavalent
oxidation state of molybdenum in MoVO(PO4), (MoVO)2P4O13, and (MoVO)4(P2O7)3.
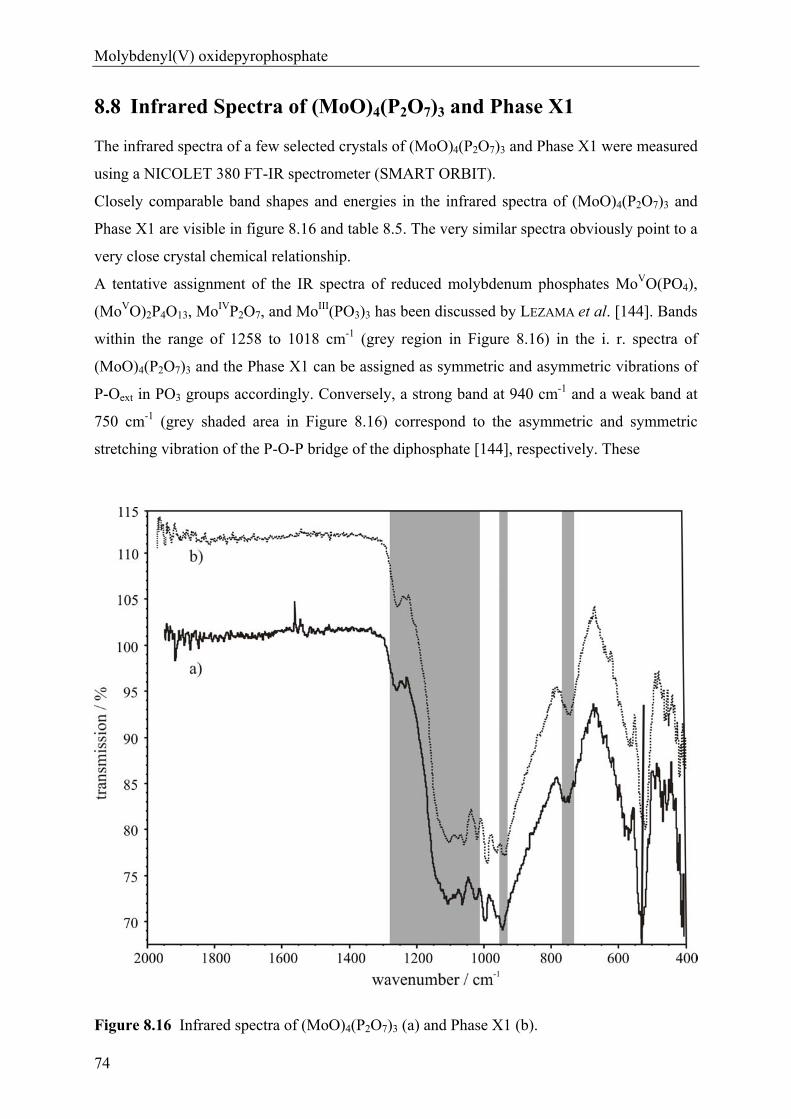
Molybdenyl(V) oxidepyrophosphate
74
8.8 Infrared Spectra of (MoO)4(P2O7)3 and Phase X1
The infrared spectra of a few selected crystals of (MoO)4(P2O7)3 and Phase X1 were measured
using a NICOLET 380 FT-IR spectrometer (SMART ORBIT).
Closely comparable band shapes and energies in the infrared spectra of (MoO)4(P2O7)3 and
Phase X1 are visible in figure 8.16 and table 8.5. The very similar spectra obviously point to a
very close crystal chemical relationship.
A tentative assignment of the IR spectra of reduced molybdenum phosphates MoVO(PO4),
(MoVO)2P4O13, MoIVP2O7, and MoIII(PO3)3 has been discussed by LEZAMA et al. [144]. Bands
within the range of 1258 to 1018 cm-1 (grey region in Figure 8.16) in the i. r. spectra of
(MoO)4(P2O7)3 and the Phase X1 can be assigned as symmetric and asymmetric vibrations of
P-Oext in PO3 groups accordingly. Conversely, a strong band at 940 cm-1 and a weak band at
750 cm-1 (grey shaded area in Figure 8.16) correspond to the asymmetric and symmetric
stretching vibration of the P-O-P bridge of the diphosphate [144], respectively. These
Figure 8.16 Infrared spectra of (MoO)4(P2O7)3 (a) and Phase X1 (b).
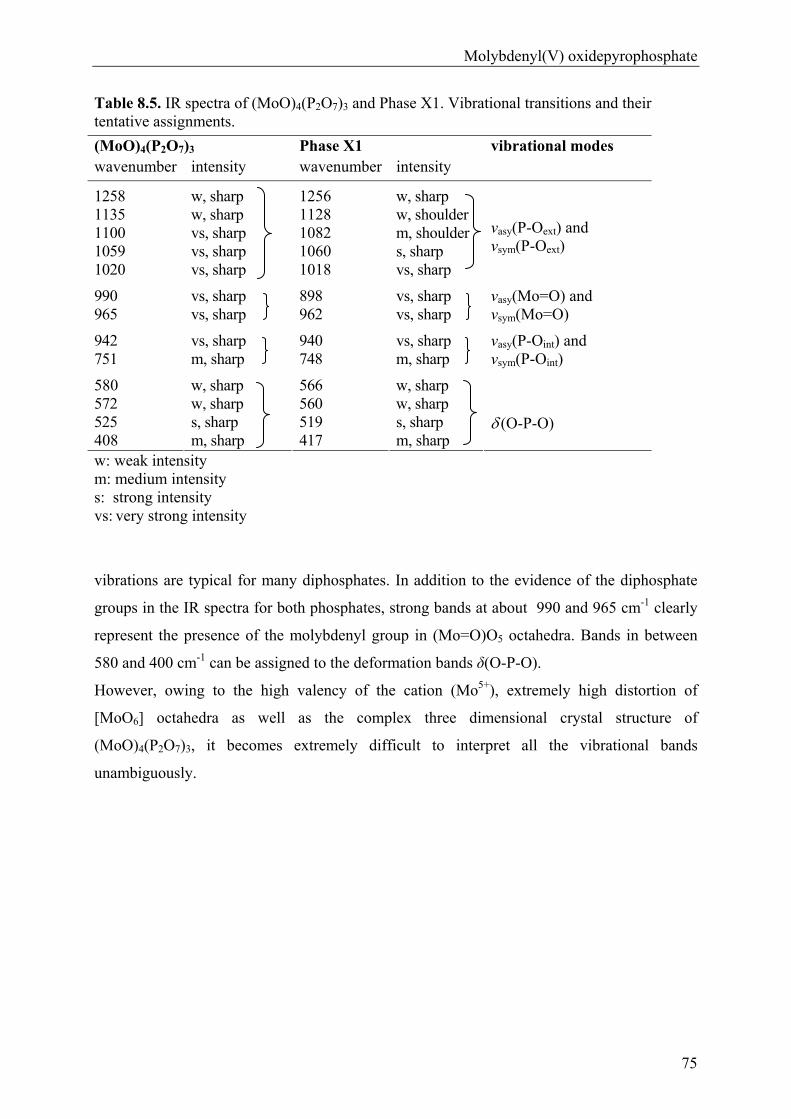
Molybdenyl(V) oxidepyrophosphate
75
Table 8.5. IR spectra of (MoO)4(P2O7)3 and Phase X1. Vibrational transitions and their tentative assignments.
(MoO)4(P2O7)3 Phase X1 wavenumber intensity wavenumber intensity
vibrational modes
1258 w, sharp 1256 w, sharp 1135 w, sharp 1128 w, shoulder 1100 vs, sharp 1082 m, shoulder 1059 vs, sharp 1060 s, sharp 1020 vs, sharp 1018 vs, sharp
νasy(P-Oext) and νsym(P-Oext)
990 vs, sharp 898 vs, sharp 965 vs, sharp 962 vs, sharp
νasy(Mo=O) and νsym(Mo=O)
942 vs, sharp 940 vs, sharp 751 m, sharp 748 m, sharp
νasy(P-Oint) and νsym(P-Oint)
580 w, sharp 566 w, sharp 572 w, sharp 560 w, sharp 525 s, sharp 519 s, sharp 408 m, sharp 417 m, sharp
(O-P-O)
w: weak intensity m: medium intensity s: strong intensity vs: very strong intensity
vibrations are typical for many diphosphates. In addition to the evidence of the diphosphate
groups in the IR spectra for both phosphates, strong bands at about 990 and 965 cm-1 clearly
represent the presence of the molybdenyl group in (Mo=O)O5 octahedra. Bands in between
580 and 400 cm-1 can be assigned to the deformation bands δ(O-P-O).
However, owing to the high valency of the cation (Mo5+), extremely high distortion of
[MoO6] octahedra as well as the complex three dimensional crystal structure of
(MoO)4(P2O7)3, it becomes extremely difficult to interpret all the vibrational bands
unambiguously.
Molybdenyl(VI) oxidepyrophosphate
76
9 Molybdenyl(VI) oxidepyrophosphate (MoVIO2)2(P2O7)
9.1 Introduction
As already mentioned in the preceding sections, in the ternary system Mo / P / O up to now
two fully oxidized molybdenum phosphates (MoVIO2)2(P2O7) [24, 25] and MoVIO2(PO3)2 [26]
have been characterized. LENZ has given in his PhD thesis [19] a survey on the crystallization
of only reduced molybdenum phosphates by Chemical Vapour Transport (CVT). The crystal
structure of (MoO2)2(P2O7) derived by KIERKEGAARD [24] converged at a rather high residual
(R1 = 0.18) along with crystal chemically dobious interatomic distances and angles. This
author also reported a four times superstructure of its sublattice cell that forms along the
crystallographic b-axis. In contrast to two phosphorus sites in structure refinement of the
(MoO2)2(P2O7) subcell by KIERKEGAARD [24] the 31P-MAS-NMR spectrum shows four
resonance peaks with an approximate integrals of 2:1:1:1:3 [147]. This observation is also
agreement to structural complexity which was reported by KIERKEGAARD [24]. These results
inspired us to reinvestigate this compound.
During our study LISTER et al. [25] reported in detail on this compound in 2010. LISTER et al.
[25], have refined the crystal structure of (MoO2)2(P2O7) from X-ray and neutron powder
diffraction at 423 K and 500 K, respectively. These authors reported the subcell as γ-phase
(space group Pnma). In addition to this, LISTER et al. indexed the room temperature phase,
called α-phase (space group P21/c) from electron diffraction. The structure of the α-
(MoO2)2(P2O7) was determined and refined, from X-ray and neutron powder diffraction at
250 K. It was assumed that the intermediate β-phase adopts an incommensurately modulated
structure. Apart from this, a fourth modification δ-(MoO2)2(P2O7) is also reported [129].
LISTER et al. [25] have excellently shown from variable temperature 31P-Solid-state NMR that
the high temperature (419 K) γ-phase contains two phosphorus sites which is in agreement to
the structural model derived by KIERKEGAARD [24]. These authors have also shown that at
277 K, the appearance of the five signals with a ratio of intensity of 2:1:1:1:3 is in agreement
to the structure model at room temperature α-phase.
In the present work, (MoO2)2P2O7 was synthesized and crystallized by CVT. The crystal
structure of the α-(MoO2)2P2O7 was determined and refined for the first time from X-ray
single-crystal diffraction data collected at 293 K.
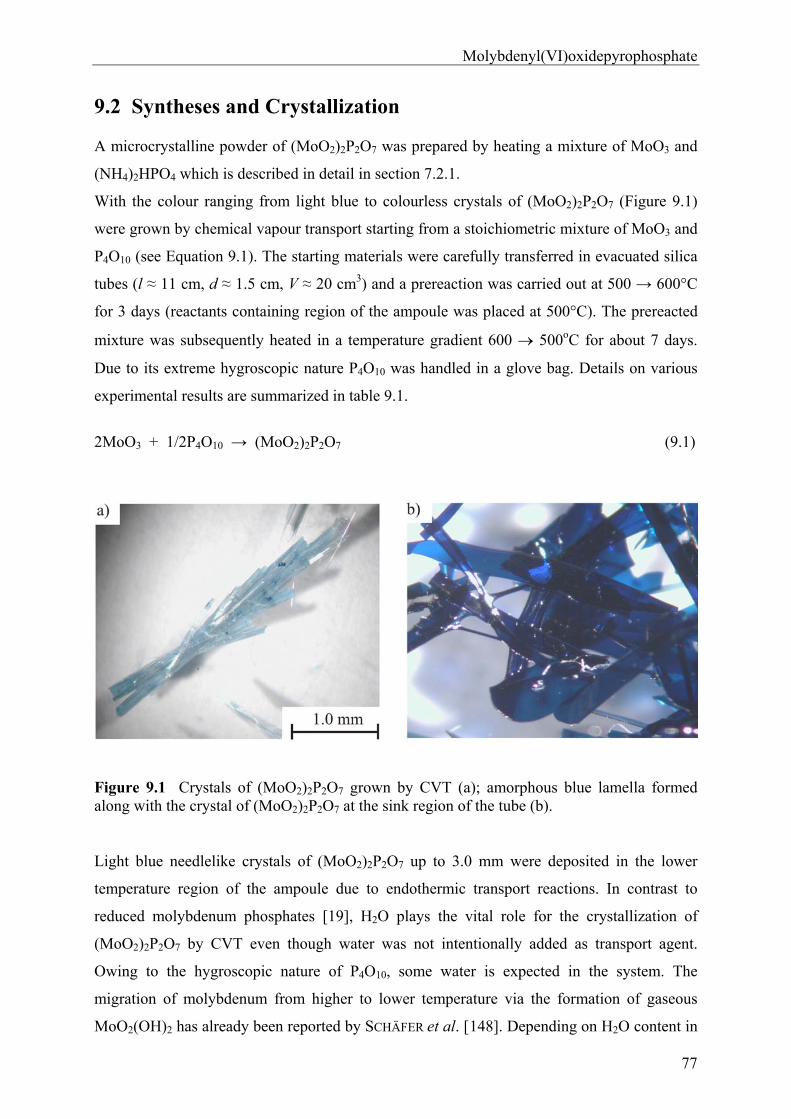
Molybdenyl(VI)oxidepyrophosphate
77
9.2 Syntheses and Crystallization
A microcrystalline powder of (MoO2)2P2O7 was prepared by heating a mixture of MoO3 and
(NH4)2HPO4 which is described in detail in section 7.2.1.
With the colour ranging from light blue to colourless crystals of (MoO2)2P2O7 (Figure 9.1)
were grown by chemical vapour transport starting from a stoichiometric mixture of MoO3 and
P4O10 (see Equation 9.1). The starting materials were carefully transferred in evacuated silica
tubes (l ≈ 11 cm, d ≈ 1.5 cm, V ≈ 20 cm3) and a prereaction was carried out at 500 → 600°C
for 3 days (reactants containing region of the ampoule was placed at 500°C). The prereacted
mixture was subsequently heated in a temperature gradient 600 500oC for about 7 days.
Due to its extreme hygroscopic nature P4O10 was handled in a glove bag. Details on various
experimental results are summarized in table 9.1.
2MoO3 + 1/2P4O10 → (MoO2)2P2O7 (9.1)
Figure 9.1 Crystals of (MoO2)2P2O7 grown by CVT (a); amorphous blue lamella formed along with the crystal of (MoO2)2P2O7 at the sink region of the tube (b).
Light blue needlelike crystals of (MoO2)2P2O7 up to 3.0 mm were deposited in the lower
temperature region of the ampoule due to endothermic transport reactions. In contrast to
reduced molybdenum phosphates [19], H2O plays the vital role for the crystallization of
(MoO2)2P2O7 by CVT even though water was not intentionally added as transport agent.
Owing to the hygroscopic nature of P4O10, some water is expected in the system. The
migration of molybdenum from higher to lower temperature via the formation of gaseous
MoO2(OH)2 has already been reported by SCHÄFER et al. [148]. Depending on H2O content in
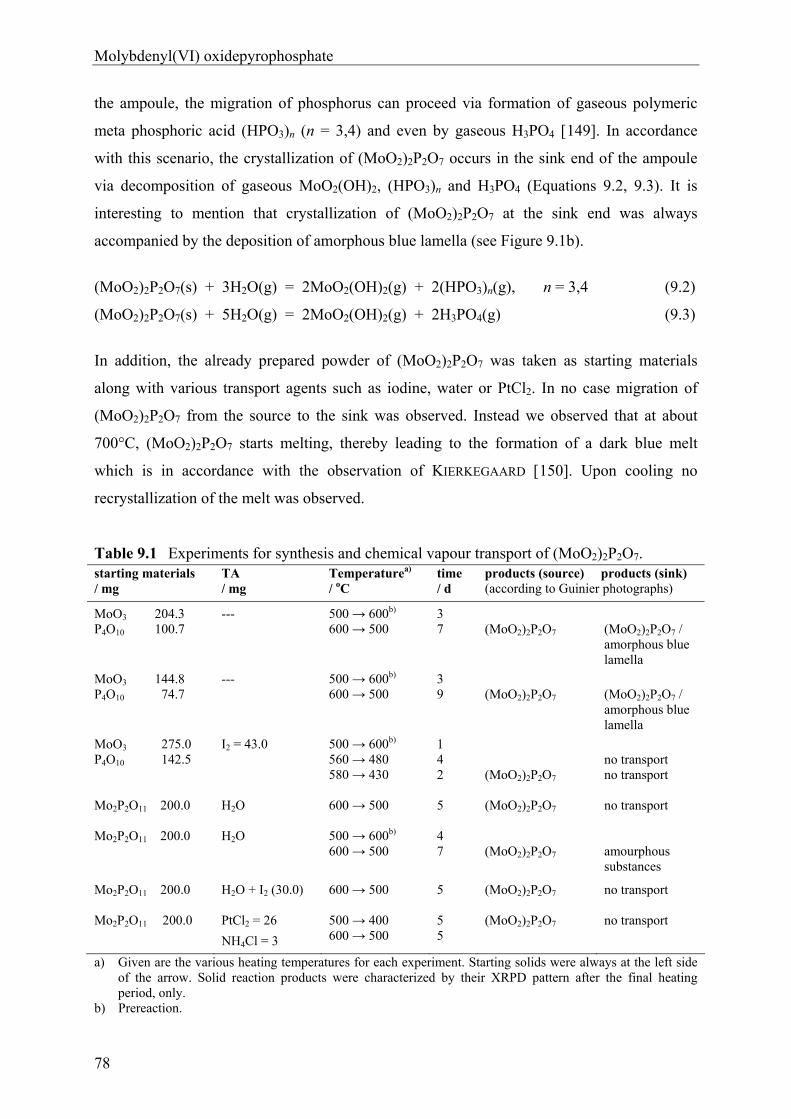
Molybdenyl(VI) oxidepyrophosphate
78
the ampoule, the migration of phosphorus can proceed via formation of gaseous polymeric
meta phosphoric acid (HPO3)n (n = 3,4) and even by gaseous H3PO4 [149]. In accordance
with this scenario, the crystallization of (MoO2)2P2O7 occurs in the sink end of the ampoule
via decomposition of gaseous MoO2(OH)2, (HPO3)n and H3PO4 (Equations 9.2, 9.3). It is
interesting to mention that crystallization of (MoO2)2P2O7 at the sink end was always
accompanied by the deposition of amorphous blue lamella (see Figure 9.1b).
(MoO2)2P2O7(s) + 3H2O(g) = 2MoO2(OH)2(g) + 2(HPO3)n(g), n = 3,4 (9.2)
(MoO2)2P2O7(s) + 5H2O(g) = 2MoO2(OH)2(g) + 2H3PO4(g) (9.3)
In addition, the already prepared powder of (MoO2)2P2O7 was taken as starting materials
along with various transport agents such as iodine, water or PtCl2. In no case migration of
(MoO2)2P2O7 from the source to the sink was observed. Instead we observed that at about
700°C, (MoO2)2P2O7 starts melting, thereby leading to the formation of a dark blue melt
which is in accordance with the observation of KIERKEGAARD [150]. Upon cooling no
recrystallization of the melt was observed.
Table 9.1 Experiments for synthesis and chemical vapour transport of (MoO2)2P2O7. starting materials / mg
TA / mg
Temperaturea) / oC
time / d
products (source) products (sink) (according to Guinier photographs)
MoO3 204.3 P4O10 100.7
--- 500 → 600b) 600 → 500
3 7
(MoO2)2P2O7
(MoO2)2P2O7 / amorphous blue lamella
MoO3 144.8 P4O10 74.7
--- 500 → 600b) 600 → 500
3 9
(MoO2)2P2O7
(MoO2)2P2O7 / amorphous blue lamella
MoO3 275.0 P4O10 142.5
I2 = 43.0 500 → 600b) 560 → 480 580 → 430
1 4 2
(MoO2)2P2O7
no transport no transport
Mo2P2O11 200.0 H2O 600 → 500
5 (MoO2)2P2O7 no transport
Mo2P2O11 200.0 H2O 500 → 600b) 600 → 500
4 7
(MoO2)2P2O7
amourphous substances
Mo2P2O11 200.0 H2O + I2 (30.0) 600 → 500
5 (MoO2)2P2O7 no transport
Mo2P2O11 200.0 PtCl2 = 26
NH4Cl = 3
500 → 400 600 → 500
5 5
(MoO2)2P2O7 no transport
a) Given are the various heating temperatures for each experiment. Starting solids were always at the left side of the arrow. Solid reaction products were characterized by their XRPD pattern after the final heating period, only.
b) Prereaction.
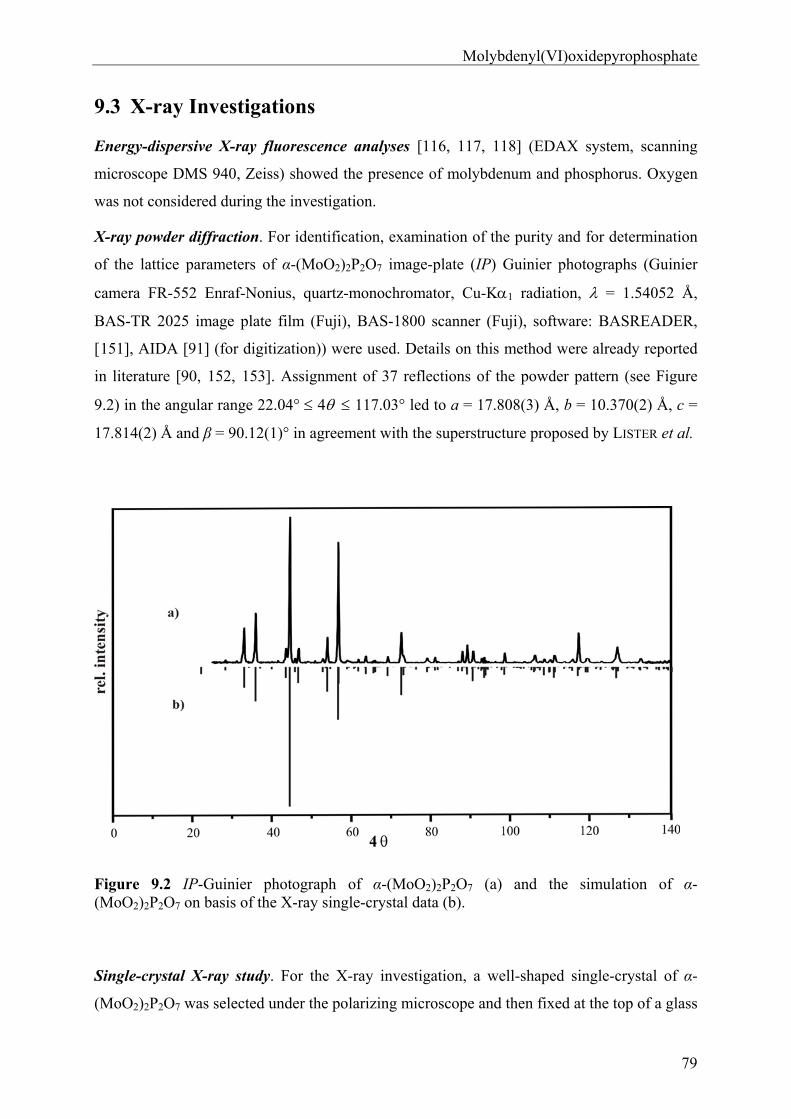
Molybdenyl(VI)oxidepyrophosphate
79
9.3 X-ray Investigations
Energy-dispersive X-ray fluorescence analyses [116, 117, 118] (EDAX system, scanning
microscope DMS 940, Zeiss) showed the presence of molybdenum and phosphorus. Oxygen
was not considered during the investigation.
X-ray powder diffraction. For identification, examination of the purity and for determination
of the lattice parameters of α-(MoO2)2P2O7 image-plate (IP) Guinier photographs (Guinier
camera FR-552 Enraf-Nonius, quartz-monochromator, Cu-K1 radiation, = 1.54052 Å,
BAS-TR 2025 image plate film (Fuji), BAS-1800 scanner (Fuji), software: BASREADER,
[151], AIDA [91] (for digitization)) were used. Details on this method were already reported
in literature [90, 152, 153]. Assignment of 37 reflections of the powder pattern (see Figure
9.2) in the angular range 22.04° 4 117.03° led to a = 17.808(3) Å, b = 10.370(2) Å, c =
17.814(2) Å and β = 90.12(1)° in agreement with the superstructure proposed by LISTER et al.
Figure 9.2 IP-Guinier photograph of α-(MoO2)2P2O7 (a) and the simulation of α- (MoO2)2P2O7 on basis of the X-ray single-crystal data (b).
Single-crystal X-ray study. For the X-ray investigation, a well-shaped single-crystal of α-
(MoO2)2P2O7 was selected under the polarizing microscope and then fixed at the top of a glass
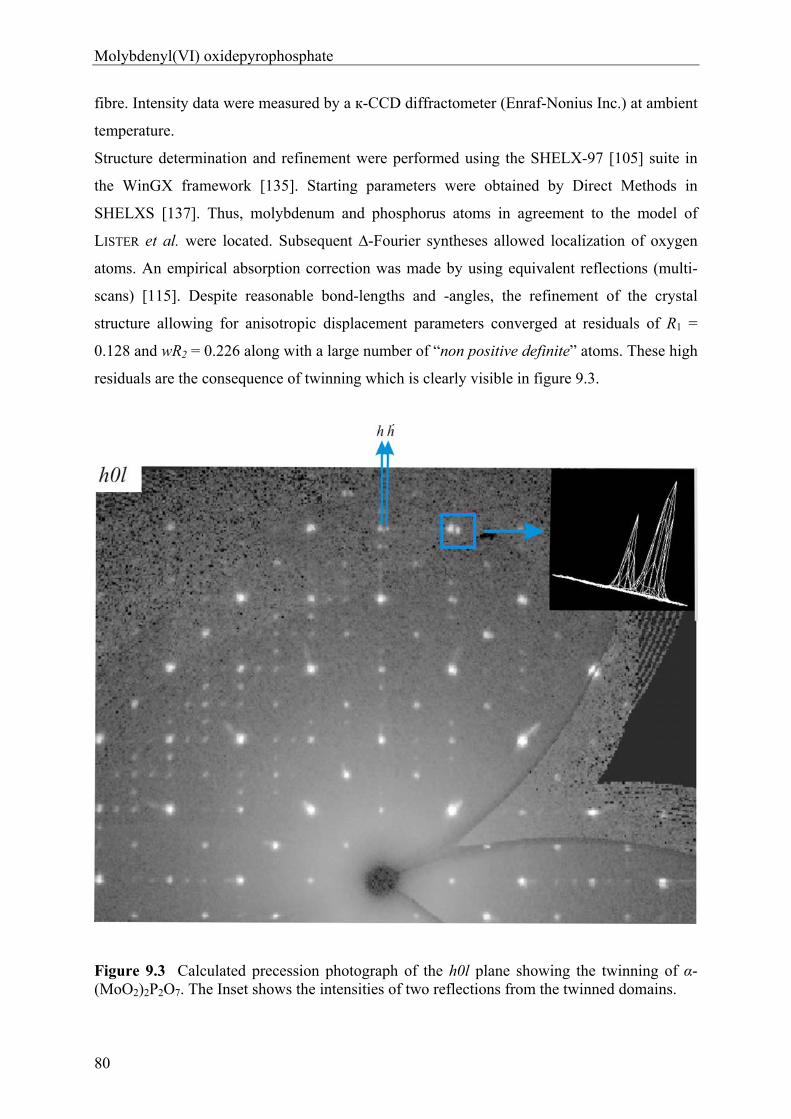
Molybdenyl(VI) oxidepyrophosphate
80
fibre. Intensity data were measured by a к-CCD diffractometer (Enraf-Nonius Inc.) at ambient
temperature.
Structure determination and refinement were performed using the SHELX-97 [105] suite in
the WinGX framework [135]. Starting parameters were obtained by Direct Methods in
SHELXS [137]. Thus, molybdenum and phosphorus atoms in agreement to the model of
LISTER et al. were located. Subsequent ∆-Fourier syntheses allowed localization of oxygen
atoms. An empirical absorption correction was made by using equivalent reflections (multi-
scans) [115]. Despite reasonable bond-lengths and -angles, the refinement of the crystal
structure allowing for anisotropic displacement parameters converged at residuals of R1 =
0.128 and wR2 = 0.226 along with a large number of “non positive definite” atoms. These high
residuals are the consequence of twinning which is clearly visible in figure 9.3.
Figure 9.3 Calculated precession photograph of the h0l plane showing the twinning of α-(MoO2)2P2O7. The Inset shows the intensities of two reflections from the twinned domains.
Molybdenyl(VI)oxidepyrophosphate
81
The assumption of the loss of a mirror plane perpendicular to the b-axis of α-(MoO2)2P2O7 as
twin element 0 0 1 0 1 0 1 0 0 gave an immediate improvement in the refinement of the
crystal structure. It avoided all the “non posite definite” and led to residuals of R1 = 0.039, wR2
= 0.079.
Details concerning data collection, structure solution and refinement of α-(MoO2)2P2O7 are
summarized in table 9.2. Final atomic coordinates are listed in table 9.3. A complete list of
interatomic distances, indexing of the cell parameters and anisotropic displacement
parameters are given in Appendix A3 (Table A3.1 to Table A3.3).
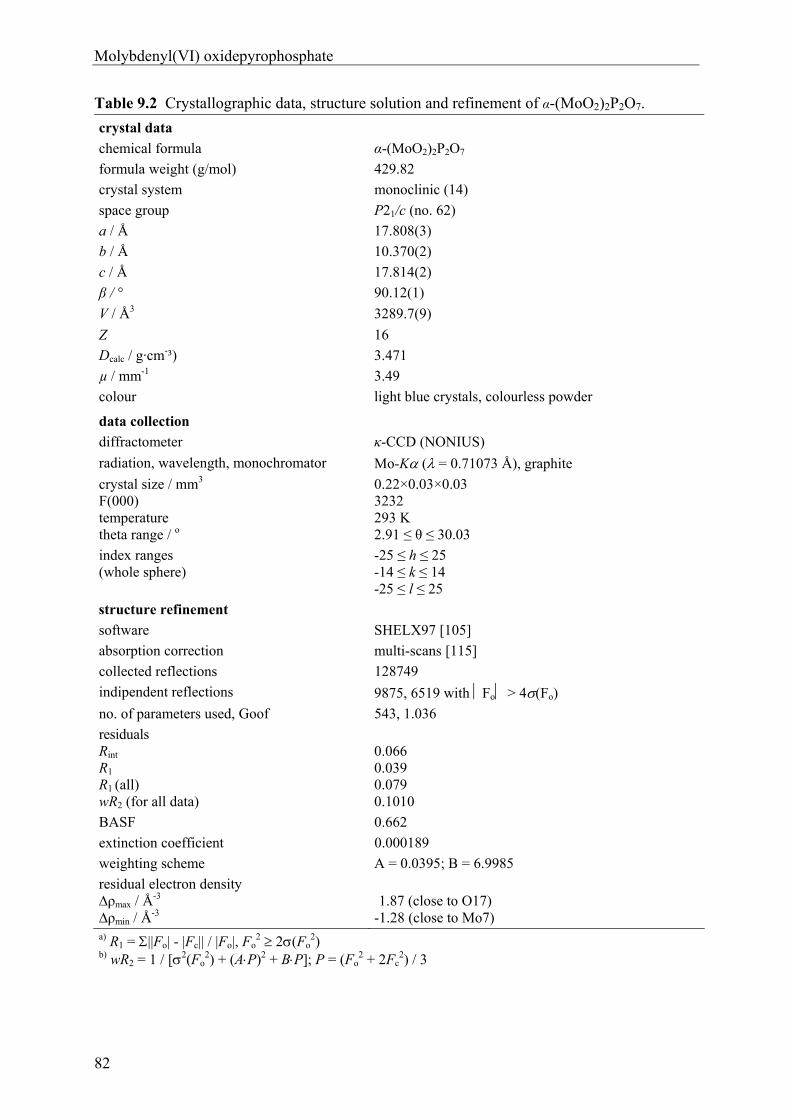
Molybdenyl(VI) oxidepyrophosphate
82
Table 9.2 Crystallographic data, structure solution and refinement of α-(MoO2)2P2O7.
crystal data
chemical formula α-(MoO2)2P2O7
formula weight (g/mol) 429.82
crystal system monoclinic (14)
space group P21/c (no. 62)
a / Å 17.808(3)
b / Å 10.370(2)
c / Å 17.814(2)
β / ° 90.12(1)
V / Å3 3289.7(9)
Z 16
Dcalc / g·cm-³) 3.471
µ / mm-1 3.49
colour light blue crystals, colourless powder
data collection
diffractometer κ-CCD (NONIUS)
radiation, wavelength, monochromator Mo-K ( = 0.71073 Å), graphite
crystal size / mm3 F(000) temperature theta range / o
0.22×0.03×0.03 3232 293 K 2.91 ≤ θ ≤ 30.03
index ranges (whole sphere)
-25 ≤ h ≤ 25 -14 ≤ k ≤ 14 -25 ≤ l ≤ 25
structure refinement
software SHELX97 [105]
absorption correction multi-scans [115]
collected reflections 128749
indipendent reflections 9875, 6519 with Fo > 4(Fo)
no. of parameters used, Goof 543, 1.036
residuals Rint R1 R1 (all) wR2 (for all data)
0.066 0.039 0.079 0.1010
BASF 0.662
extinction coefficient 0.000189
weighting scheme A = 0.0395; B = 6.9985
residual electron density ∆ρmax / Å
-3 ∆ρmin / Å
-3
1.87 (close to O17) -1.28 (close to Mo7)
a) R1 = ||Fo| - |Fc|| / |Fo|, Fo2 2(Fo
2) b) wR2 = 1 / [2(Fo
2) + (AP)2 + BP]; P = (Fo2 + 2Fc
2) / 3
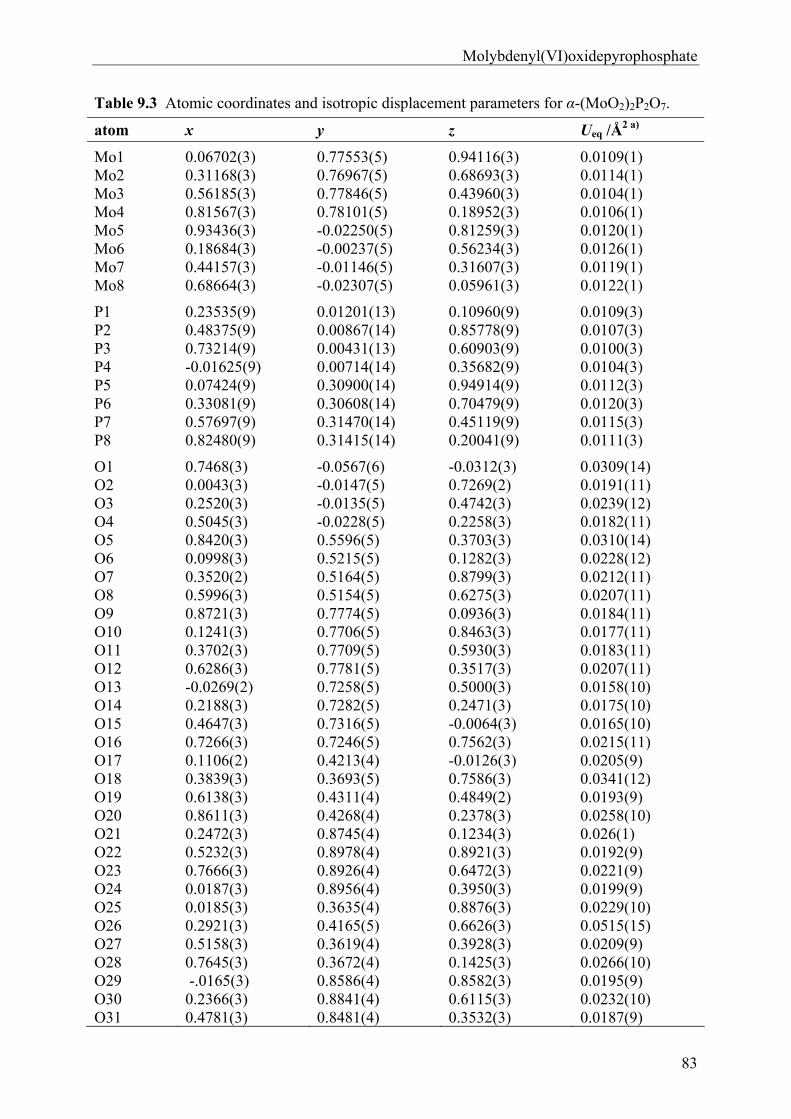
Molybdenyl(VI)oxidepyrophosphate
83
Table 9.3 Atomic coordinates and isotropic displacement parameters for α-(MoO2)2P2O7.
atom x y z Ueq /Å2 a)
Mo1 0.06702(3) 0.77553(5) 0.94116(3) 0.0109(1) Mo2 0.31168(3) 0.76967(5) 0.68693(3) 0.0114(1) Mo3 0.56185(3) 0.77846(5) 0.43960(3) 0.0104(1) Mo4 0.81567(3) 0.78101(5) 0.18952(3) 0.0106(1) Mo5 0.93436(3) -0.02250(5) 0.81259(3) 0.0120(1) Mo6 0.18684(3) -0.00237(5) 0.56234(3) 0.0126(1) Mo7 0.44157(3) -0.01146(5) 0.31607(3) 0.0119(1) Mo8 0.68664(3) -0.02307(5) 0.05961(3) 0.0122(1)
P1 0.23535(9) 0.01201(13) 0.10960(9) 0.0109(3) P2 0.48375(9) 0.00867(14) 0.85778(9) 0.0107(3) P3 0.73214(9) 0.00431(13) 0.60903(9) 0.0100(3) P4 -0.01625(9) 0.00714(14) 0.35682(9) 0.0104(3) P5 0.07424(9) 0.30900(14) 0.94914(9) 0.0112(3) P6 0.33081(9) 0.30608(14) 0.70479(9) 0.0120(3) P7 0.57697(9) 0.31470(14) 0.45119(9) 0.0115(3) P8 0.82480(9) 0.31415(14) 0.20041(9) 0.0111(3)
O1 0.7468(3) -0.0567(6) -0.0312(3) 0.0309(14) O2 0.0043(3) -0.0147(5) 0.7269(2) 0.0191(11) O3 0.2520(3) -0.0135(5) 0.4742(3) 0.0239(12) O4 0.5045(3) -0.0228(5) 0.2258(3) 0.0182(11) O5 0.8420(3) 0.5596(5) 0.3703(3) 0.0310(14) O6 0.0998(3) 0.5215(5) 0.1282(3) 0.0228(12) O7 0.3520(2) 0.5164(5) 0.8799(3) 0.0212(11) O8 0.5996(3) 0.5154(5) 0.6275(3) 0.0207(11) O9 0.8721(3) 0.7774(5) 0.0936(3) 0.0184(11) O10 0.1241(3) 0.7706(5) 0.8463(3) 0.0177(11) O11 0.3702(3) 0.7709(5) 0.5930(3) 0.0183(11) O12 0.6286(3) 0.7781(5) 0.3517(3) 0.0207(11) O13 -0.0269(2) 0.7258(5) 0.5000(3) 0.0158(10) O14 0.2188(3) 0.7282(5) 0.2471(3) 0.0175(10) O15 0.4647(3) 0.7316(5) -0.0064(3) 0.0165(10) O16 0.7266(3) 0.7246(5) 0.7562(3) 0.0215(11) O17 0.1106(2) 0.4213(4) -0.0126(3) 0.0205(9) O18 0.3839(3) 0.3693(5) 0.7586(3) 0.0341(12) O19 0.6138(3) 0.4311(4) 0.4849(2) 0.0193(9) O20 0.8611(3) 0.4268(4) 0.2378(3) 0.0258(10) O21 0.2472(3) 0.8745(4) 0.1234(3) 0.026(1) O22 0.5232(3) 0.8978(4) 0.8921(3) 0.0192(9) O23 0.7666(3) 0.8926(4) 0.6472(3) 0.0221(9) O24 0.0187(3) 0.8956(4) 0.3950(3) 0.0199(9) O25 0.0185(3) 0.3635(4) 0.8876(3) 0.0229(10) O26 0.2921(3) 0.4165(5) 0.6626(3) 0.0515(15) O27 0.5158(3) 0.3619(4) 0.3928(3) 0.0209(9) O28 0.7645(3) 0.3672(4) 0.1425(3) 0.0266(10) O29 -.0165(3) 0.8586(4) 0.8582(3) 0.0195(9) O30 0.2366(3) 0.8841(4) 0.6115(3) 0.0232(10) O31 0.4781(3) 0.8481(4) 0.3532(3) 0.0187(9)
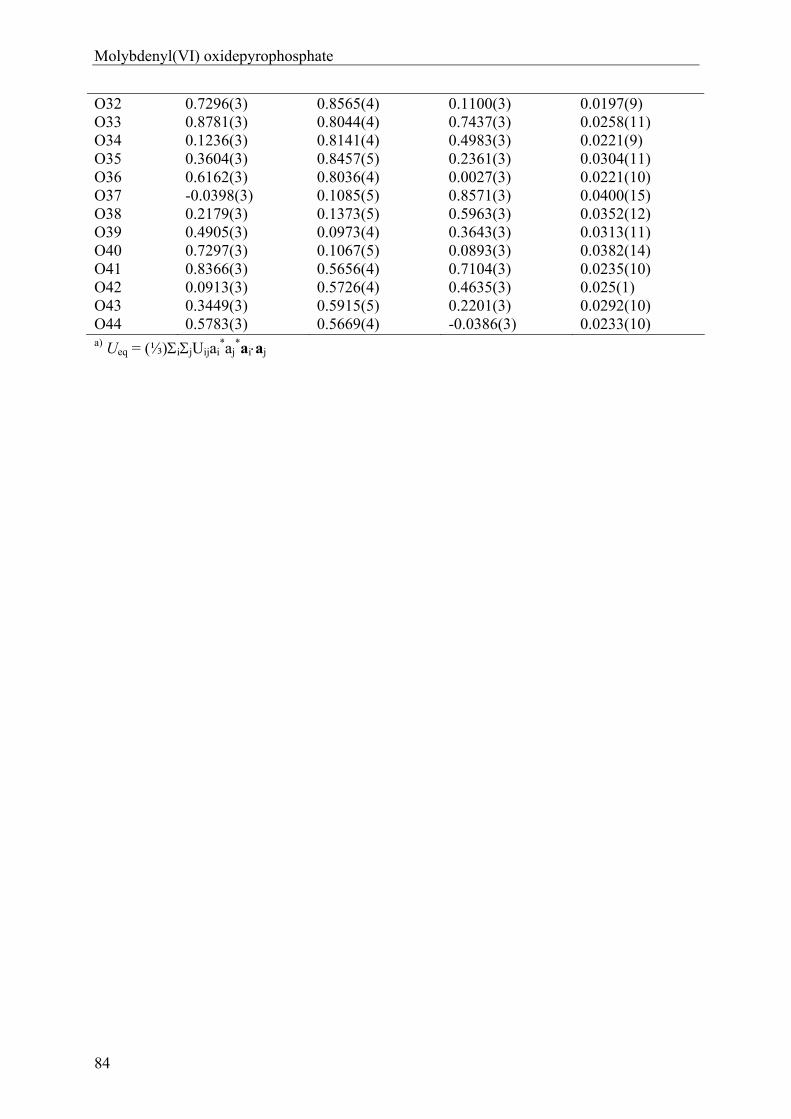
Molybdenyl(VI) oxidepyrophosphate
84
O32 0.7296(3) 0.8565(4) 0.1100(3) 0.0197(9) O33 0.8781(3) 0.8044(4) 0.7437(3) 0.0258(11) O34 0.1236(3) 0.8141(4) 0.4983(3) 0.0221(9) O35 0.3604(3) 0.8457(5) 0.2361(3) 0.0304(11) O36 0.6162(3) 0.8036(4) 0.0027(3) 0.0221(10) O37 -0.0398(3) 0.1085(5) 0.8571(3) 0.0400(15) O38 0.2179(3) 0.1373(5) 0.5963(3) 0.0352(12) O39 0.4905(3) 0.0973(4) 0.3643(3) 0.0313(11) O40 0.7297(3) 0.1067(5) 0.0893(3) 0.0382(14) O41 0.8366(3) 0.5656(4) 0.7104(3) 0.0235(10) O42 0.0913(3) 0.5726(4) 0.4635(3) 0.025(1) O43 0.3449(3) 0.5915(5) 0.2201(3) 0.0292(10) O44 0.5783(3) 0.5669(4) -0.0386(3) 0.0233(10) a) Ueq = (⅓)ijUijai
*aj*aiaj
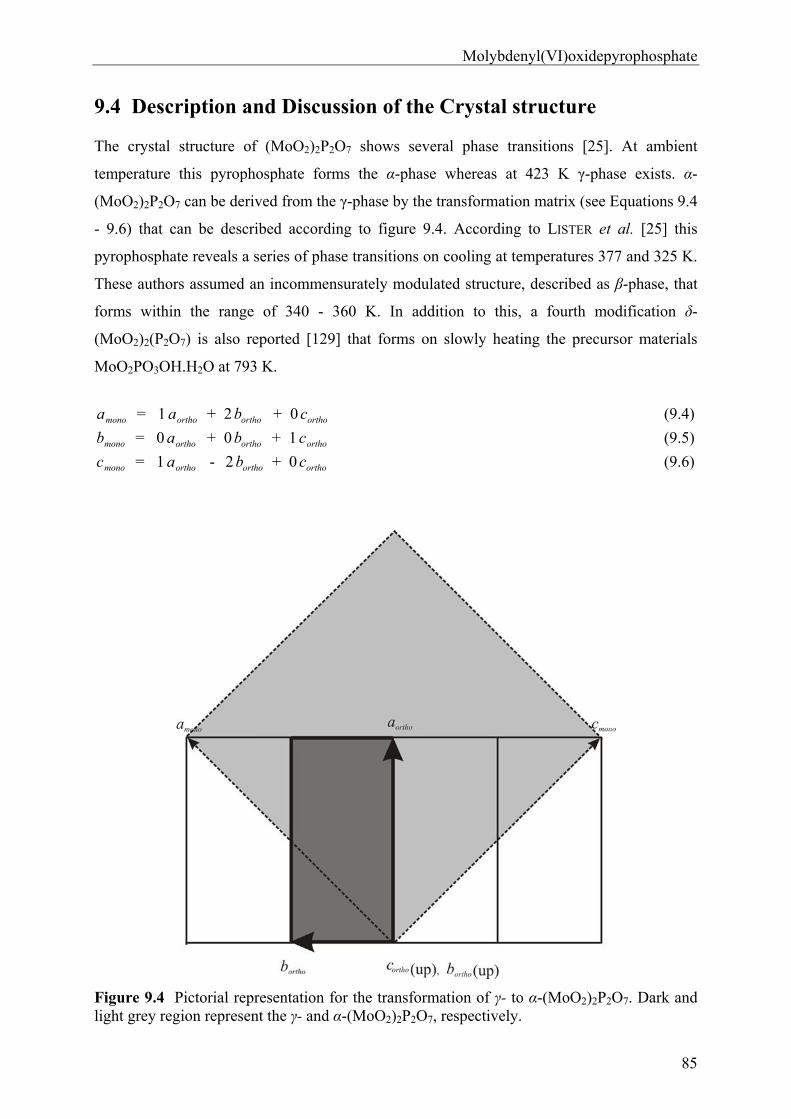
Molybdenyl(VI)oxidepyrophosphate
85
9.4 Description and Discussion of the Crystal structure
The crystal structure of (MoO2)2P2O7 shows several phase transitions [25]. At ambient
temperature this pyrophosphate forms the α-phase whereas at 423 K γ-phase exists. α-
(MoO2)2P2O7 can be derived from the γ-phase by the transformation matrix (see Equations 9.4
- 9.6) that can be described according to figure 9.4. According to LISTER et al. [25] this
pyrophosphate reveals a series of phase transitions on cooling at temperatures 377 and 325 K.
These authors assumed an incommensurately modulated structure, described as β-phase, that
forms within the range of 340 - 360 K. In addition to this, a fourth modification δ-
(MoO2)2(P2O7) is also reported [129] that forms on slowly heating the precursor materials
MoO2PO3OH.H2O at 793 K.
monoa = 1 orthoa + 2 orthob + 0 orthoc (9.4)
monob = 0 orthoa + 0 orthob + 1 orthoc (9.5)
monoc = 1 orthoa - 2 orthob + 0 orthoc (9.6)
Figure 9.4 Pictorial representation for the transformation of γ- to α-(MoO2)2P2O7. Dark and light grey region represent the γ- and α-(MoO2)2P2O7, respectively.
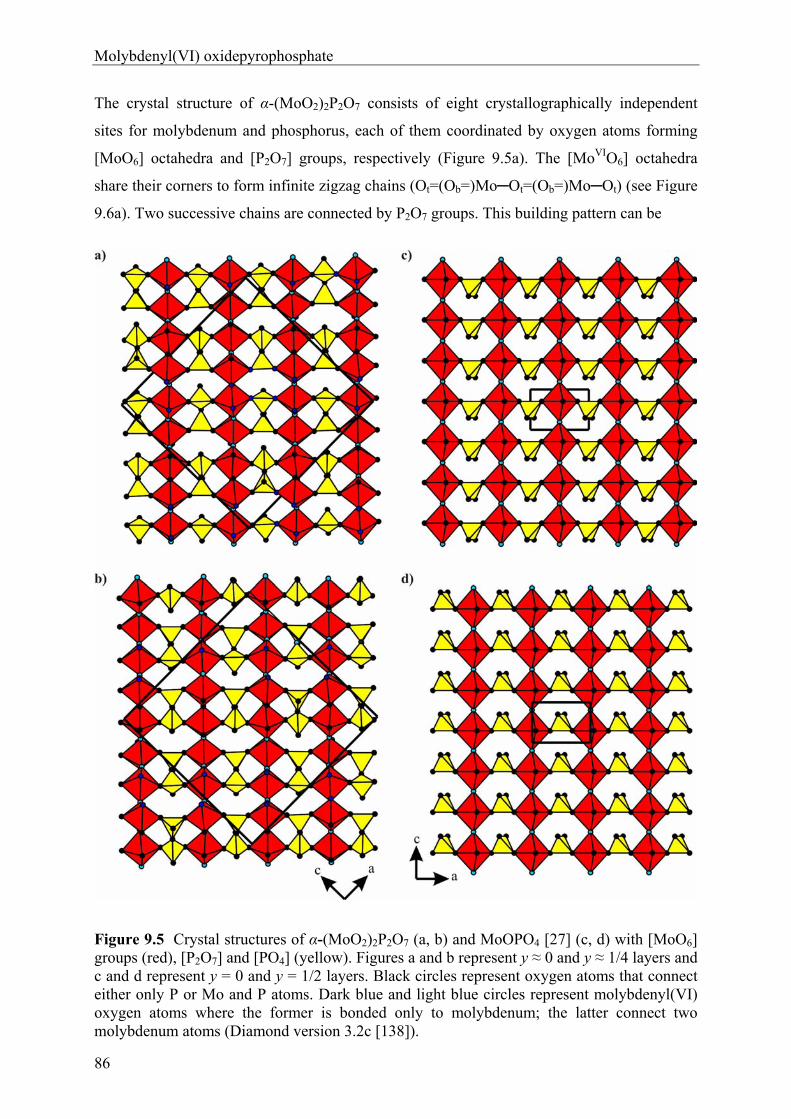
Molybdenyl(VI) oxidepyrophosphate
86
The crystal structure of α-(MoO2)2P2O7 consists of eight crystallographically independent
sites for molybdenum and phosphorus, each of them coordinated by oxygen atoms forming
[MoO6] octahedra and [P2O7] groups, respectively (Figure 9.5a). The [MoVIO6] octahedra
share their corners to form infinite zigzag chains (Ot=(Ob=)Mo─Ot=(Ob=)Mo─Ot) (see Figure
9.6a). Two successive chains are connected by P2O7 groups. This building pattern can be
Figure 9.5 Crystal structures of α-(MoO2)2P2O7 (a, b) and MoOPO4 [27] (c, d) with [MoO6] groups (red), [P2O7] and [PO4] (yellow). Figures a and b represent y ≈ 0 and y ≈ 1/4 layers and c and d represent y = 0 and y = 1/2 layers. Black circles represent oxygen atoms that connect either only P or Mo and P atoms. Dark blue and light blue circles represent molybdenyl(VI) oxygen atoms where the former is bonded only to molybdenum; the latter connect two molybdenum atoms (Diamond version 3.2c [138]).
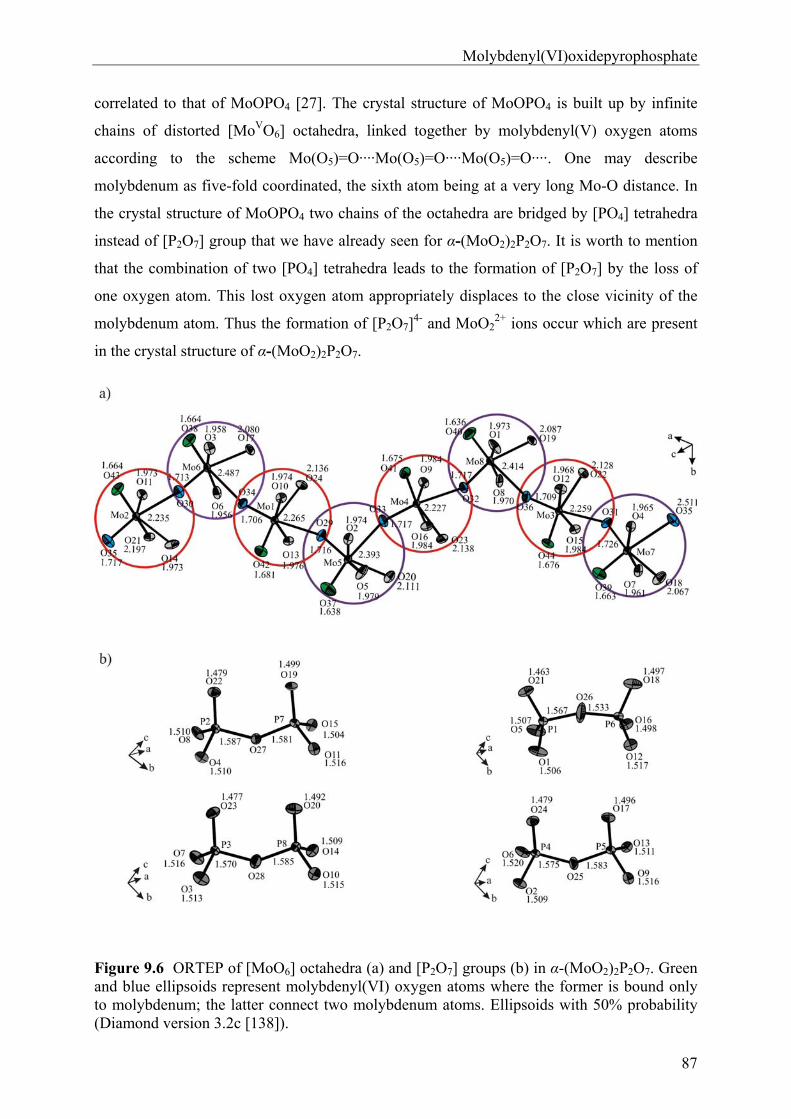
Molybdenyl(VI)oxidepyrophosphate
87
correlated to that of MoOPO4 [27]. The crystal structure of MoOPO4 is built up by infinite
chains of distorted [MoVO6] octahedra, linked together by molybdenyl(V) oxygen atoms
according to the scheme Mo(O5)=O····Mo(O5)=O····Mo(O5)=O····. One may describe
molybdenum as five-fold coordinated, the sixth atom being at a very long Mo-O distance. In
the crystal structure of MoOPO4 two chains of the octahedra are bridged by [PO4] tetrahedra
instead of [P2O7] group that we have already seen for α-(MoO2)2P2O7. It is worth to mention
that the combination of two [PO4] tetrahedra leads to the formation of [P2O7] by the loss of
one oxygen atom. This lost oxygen atom appropriately displaces to the close vicinity of the
molybdenum atom. Thus the formation of [P2O7]4- and MoO2
2+ ions occur which are present
in the crystal structure of α-(MoO2)2P2O7.
Figure 9.6 ORTEP of [MoO6] octahedra (a) and [P2O7] groups (b) in α-(MoO2)2P2O7. Green and blue ellipsoids represent molybdenyl(VI) oxygen atoms where the former is bound only to molybdenum; the latter connect two molybdenum atoms. Ellipsoids with 50% probability (Diamond version 3.2c [138]).
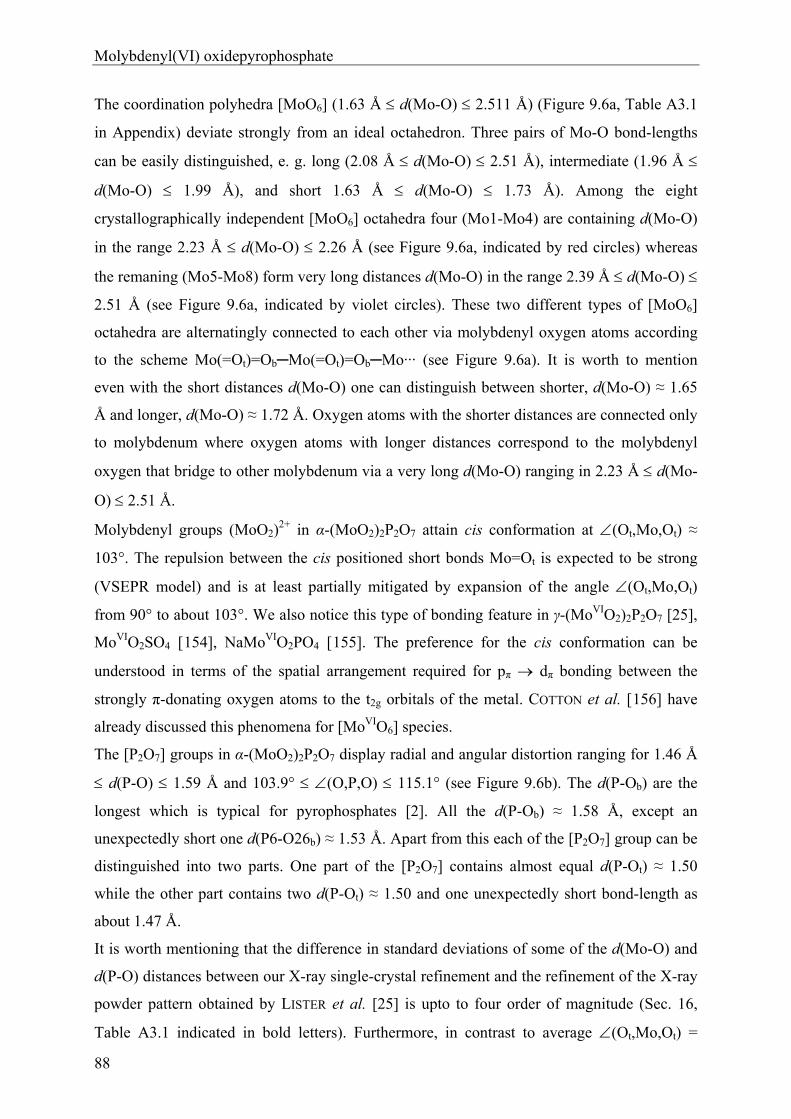
Molybdenyl(VI) oxidepyrophosphate
88
The coordination polyhedra [MoO6] (1.63 Å d(Mo-O) 2.511 Å) (Figure 9.6a, Table A3.1
in Appendix) deviate strongly from an ideal octahedron. Three pairs of Mo-O bond-lengths
can be easily distinguished, e. g. long (2.08 Å d(Mo-O) 2.51 Å), intermediate (1.96 Å
d(Mo-O) 1.99 Å), and short 1.63 Å d(Mo-O) 1.73 Å). Among the eight
crystallographically independent [MoO6] octahedra four (Mo1-Mo4) are containing d(Mo-O)
in the range 2.23 Å d(Mo-O) 2.26 Å (see Figure 9.6a, indicated by red circles) whereas
the remaning (Mo5-Mo8) form very long distances d(Mo-O) in the range 2.39 Å d(Mo-O)
2.51 Å (see Figure 9.6a, indicated by violet circles). These two different types of [MoO6]
octahedra are alternatingly connected to each other via molybdenyl oxygen atoms according
to the scheme Mo(=Ot)=Ob─Mo(=Ot)=Ob─Mo··· (see Figure 9.6a). It is worth to mention
even with the short distances d(Mo-O) one can distinguish between shorter, d(Mo-O) ≈ 1.65
Å and longer, d(Mo-O) ≈ 1.72 Å. Oxygen atoms with the shorter distances are connected only
to molybdenum where oxygen atoms with longer distances correspond to the molybdenyl
oxygen that bridge to other molybdenum via a very long d(Mo-O) ranging in 2.23 Å d(Mo-
O) 2.51 Å.
Molybdenyl groups (MoO2)2+ in α-(MoO2)2P2O7 attain cis conformation at (Ot,Mo,Ot) ≈
103°. The repulsion between the cis positioned short bonds Mo=Ot is expected to be strong
(VSEPR model) and is at least partially mitigated by expansion of the angle (Ot,Mo,Ot)
from 90° to about 103°. We also notice this type of bonding feature in γ-(MoVIO2)2P2O7 [25],
MoVIO2SO4 [154], NaMoVIO2PO4 [155]. The preference for the cis conformation can be
understood in terms of the spatial arrangement required for pπ dπ bonding between the
strongly π-donating oxygen atoms to the t2g orbitals of the metal. COTTON et al. [156] have
already discussed this phenomena for [MoVIO6] species.
The [P2O7] groups in α-(MoO2)2P2O7 display radial and angular distortion ranging for 1.46 Å
d(P-O) 1.59 Å and 103.9° (O,P,O) 115.1° (see Figure 9.6b). The d(P-Ob) are the
longest which is typical for pyrophosphates [2]. All the d(P-Ob) ≈ 1.58 Å, except an
unexpectedly short one d(P6-O26b) ≈ 1.53 Å. Apart from this each of the [P2O7] group can be
distinguished into two parts. One part of the [P2O7] contains almost equal d(P-Ot) ≈ 1.50
while the other part contains two d(P-Ot) ≈ 1.50 and one unexpectedly short bond-length as
about 1.47 Å.
It is worth mentioning that the difference in standard deviations of some of the d(Mo-O) and
d(P-O) distances between our X-ray single-crystal refinement and the refinement of the X-ray
powder pattern obtained by LISTER et al. [25] is upto to four order of magnitude (Sec. 16,
Table A3.1 indicated in bold letters). Furthermore, in contrast to average (Ot,Mo,Ot) =
Molybdenyl(VI)oxidepyrophosphate
89
100.5(4)° obtained from LISTER et al. our refinement revealed an average (Ot,Mo,Ot) =
102.8(2)° (see Sec. 16, Table A3.1).
It is worth to consider the driving forces of the phase transition from the high temperature γ-
phase to the low temperature α-phase. The structural complexity of inorganic materials with
simple composition frequently occurs in frameworks based on corner sharing polyhedra (such
as (MoVO)2P4O13 [29]) due to displacive phase transition on cooling. As with related
materials, a balance of local bonding requirements with in the coordination polyhedra and
achieving optimum intrapolyhedral angles mainly causes it. Considering this fact, P-O-P
linkage in the high temperature phase (γ-phase) has a single angle of 150.2(5)° [25] while the
low temperature phase (α-phase) shows four unique P2O7 groups with average bond angle of
146.03(1)° [159.6(5)°, 142.2(3)°, 142.2(3)°, 140.1(3)°]. This average value is about 4%
smaller than that of the high temperature phase. This lowering of the volume has been given
by LISTER et al. [25] as an explanation for the phase transition.
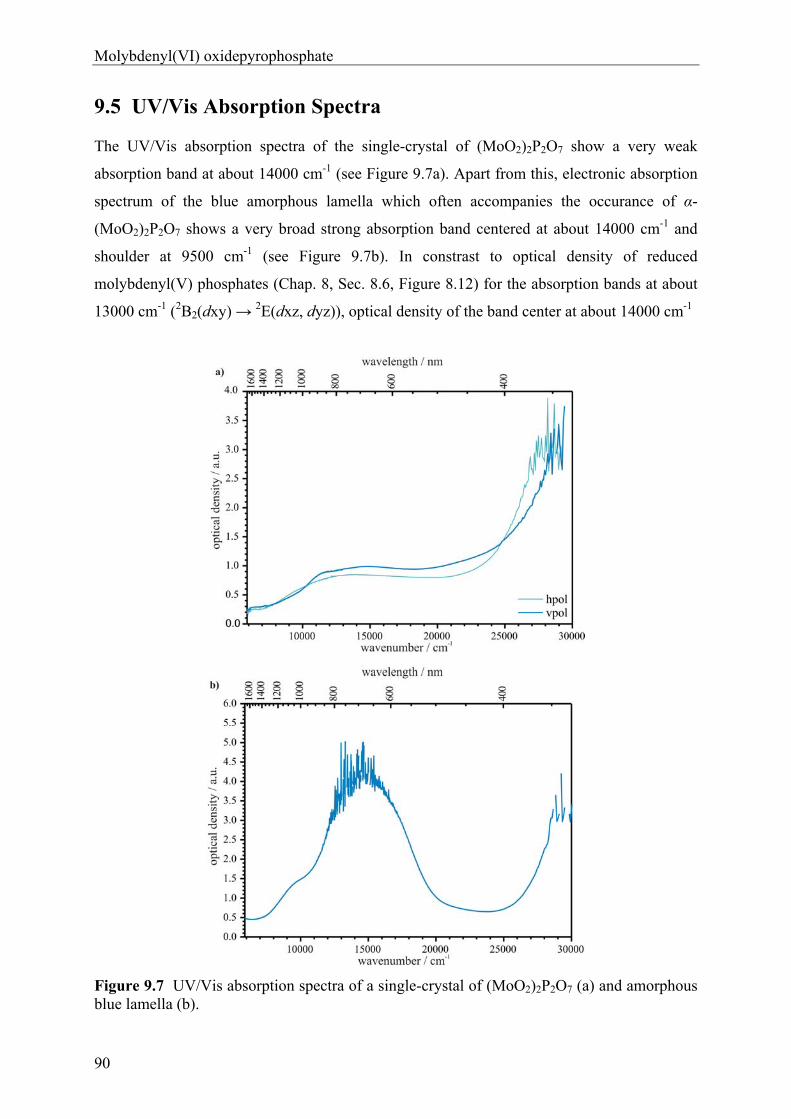
Molybdenyl(VI) oxidepyrophosphate
90
9.5 UV/Vis Absorption Spectra
The UV/Vis absorption spectra of the single-crystal of (MoO2)2P2O7 show a very weak
absorption band at about 14000 cm-1 (see Figure 9.7a). Apart from this, electronic absorption
spectrum of the blue amorphous lamella which often accompanies the occurance of α-
(MoO2)2P2O7 shows a very broad strong absorption band centered at about 14000 cm-1 and
shoulder at 9500 cm-1 (see Figure 9.7b). In constrast to optical density of reduced
molybdenyl(V) phosphates (Chap. 8, Sec. 8.6, Figure 8.12) for the absorption bands at about
13000 cm-1 (2B2(dxy) → 2E(dxz, dyz)), optical density of the band center at about 14000 cm-1
Figure 9.7 UV/Vis absorption spectra of a single-crystal of (MoO2)2P2O7 (a) and amorphous blue lamella (b).
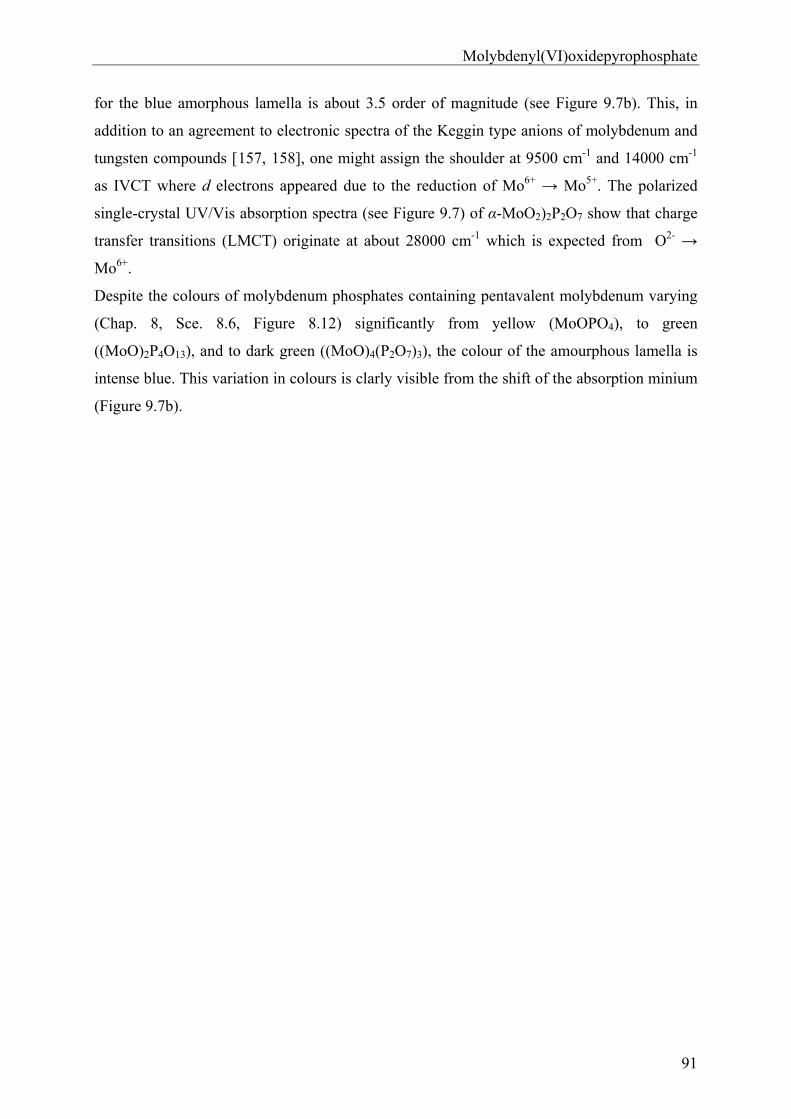
Molybdenyl(VI)oxidepyrophosphate
91
for the blue amorphous lamella is about 3.5 order of magnitude (see Figure 9.7b). This, in
addition to an agreement to electronic spectra of the Keggin type anions of molybdenum and
tungsten compounds [157, 158], one might assign the shoulder at 9500 cm-1 and 14000 cm-1
as IVCT where d electrons appeared due to the reduction of Mo6+ → Mo5+. The polarized
single-crystal UV/Vis absorption spectra (see Figure 9.7) of α-MoO2)2P2O7 show that charge
transfer transitions (LMCT) originate at about 28000 cm-1 which is expected from O2- →
Mo6+.
Despite the colours of molybdenum phosphates containing pentavalent molybdenum varying
(Chap. 8, Sce. 8.6, Figure 8.12) significantly from yellow (MoOPO4), to green
((MoO)2P4O13), and to dark green ((MoO)4(P2O7)3), the colour of the amourphous lamella is
intense blue. This variation in colours is clarly visible from the shift of the absorption minium
(Figure 9.7b).
The Ternary System Rhenium / Phosphorus / Oxygen
92
10 The Ternary System Rhenium / Phosphorus / Oxygen
10.1 Introduction
In 1962, KIERKEGAARD, who pioneered the research in systems M O3-P2O5 (M = Mo, W)
mentioned that “The structural similarity between ReO3 and WO3 is well known. Attempts
to prepare intermediate compounds in the system ReO3-P2O5 were however unsuccessful”
[159]. With the discovery of rhenium(IV)-pyrophosphate, ReIVP2O7, by BANKS [81] in
1982, rhenium entered into the family of metals forming anhydrous transition metal
phosphates. Despite the existence of a large number of rather stable and easily accessible
oxidation states of rhenium, there was no further report in rhenium phosphates in literature.
It is certainly notable that for its neighbour elements molybdenum and tungsten a large
number of phosphates has been explored. While molybdenum forms anhydrous phosphates
at its oxidation states +III, +IV, +V, and +VI, tungsten adopts in anhydrous phosphates at
the oxidation states +IV, +V, and +VI. The similarity of the redox behaviour of these two
elements is reflected via the formation of anhydrous phosphates in identical composition
(M VI2P2O11, M VIP2O8, M VPO5, M IVP2O7; M = Mo, W), however, different crystal
structures. In addition to the existence of a large number of stable oxidation states of
rhenium for its oxide, oxide halides and rhenates (as mentioned in Chapter 1), its diagonal
relationship to Mo as well as its neighbourhood to W, suggested a systematic investigation
in to the ternary system Re / P / O to search for new rhenium phosphates and to develop the
phase diagram. Such information also should allow understanding of the redox behaviour of
rhenium in comparison to its neighbouring elements V, Mo, W and Os.
In the present study, several new anhydrous rhenium phosphates ReVIIO2(PO4),
ReVI2O3(PO4)2, ReV
2O3(P2O7), and NaReIV2(PO4)3 have been synthesized, crystallized and
characterized. In addition, two new silicophosphates, ReIV3[Si2O(PO4)6],
(ReVII2O5)Si2°[Sit
2(PO4)6] were synthesized and characterized by X-ray and spectroscopic
invesitgations.
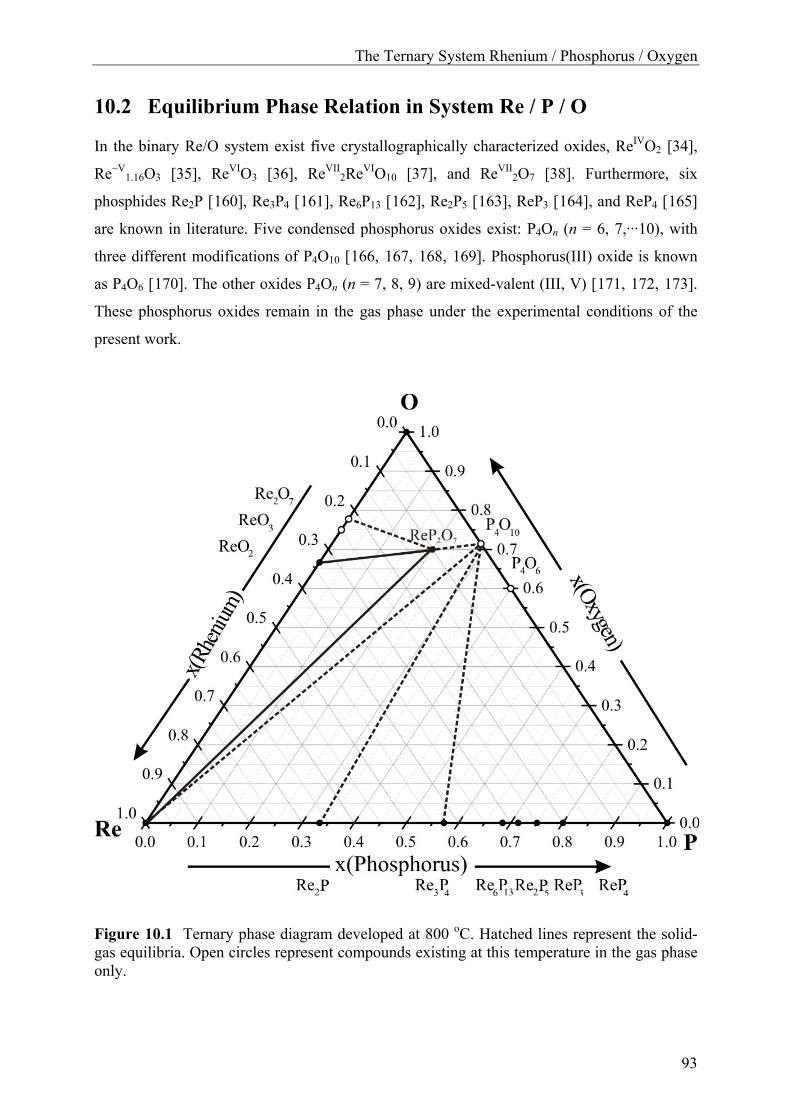
The Ternary System Rhenium / Phosphorus / Oxygen
93
10.2 Equilibrium Phase Relation in System Re / P / O
In the binary Re/O system exist five crystallographically characterized oxides, ReIVO2 [34],
Re~V1.16O3 [35], ReVIO3 [36], ReVII
2ReVIO10 [37], and ReVII2O7 [38]. Furthermore, six
phosphides Re2P [160], Re3P4 [161], Re6P13 [162], Re2P5 [163], ReP3 [164], and ReP4 [165]
are known in literature. Five condensed phosphorus oxides exist: P4On (n = 6, 7,···10), with
three different modifications of P4O10 [166, 167, 168, 169]. Phosphorus(III) oxide is known
as P4O6 [170]. The other oxides P4On (n = 7, 8, 9) are mixed-valent (III, V) [171, 172, 173].
These phosphorus oxides remain in the gas phase under the experimental conditions of the
present work.
Figure 10.1 Ternary phase diagram developed at 800 oC. Hatched lines represent the solid-gas equilibria. Open circles represent compounds existing at this temperature in the gas phase only.
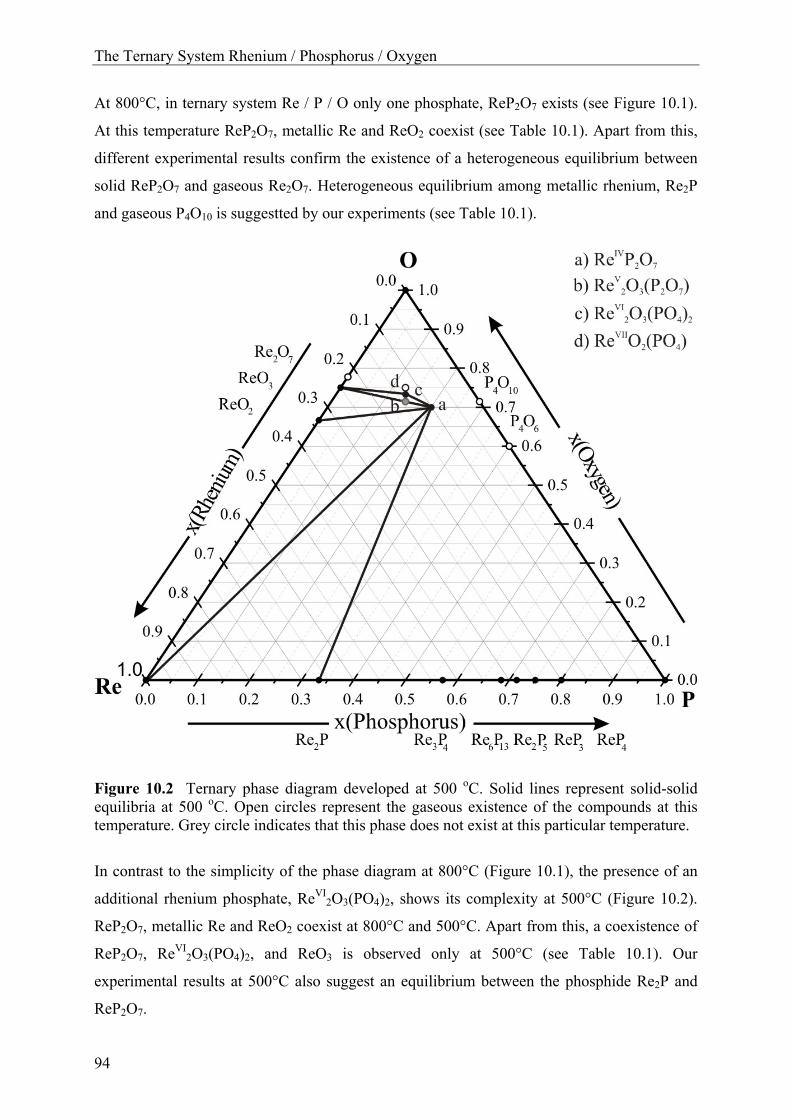
The Ternary System Rhenium / Phosphorus / Oxygen
94
At 800°C, in ternary system Re / P / O only one phosphate, ReP2O7 exists (see Figure 10.1).
At this temperature ReP2O7, metallic Re and ReO2 coexist (see Table 10.1). Apart from this,
different experimental results confirm the existence of a heterogeneous equilibrium between
solid ReP2O7 and gaseous Re2O7. Heterogeneous equilibrium among metallic rhenium, Re2P
and gaseous P4O10 is suggestted by our experiments (see Table 10.1).
Figure 10.2 Ternary phase diagram developed at 500 oC. Solid lines represent solid-solid equilibria at 500 oC. Open circles represent the gaseous existence of the compounds at this temperature. Grey circle indicates that this phase does not exist at this particular temperature.
In contrast to the simplicity of the phase diagram at 800°C (Figure 10.1), the presence of an
additional rhenium phosphate, ReVI2O3(PO4)2, shows its complexity at 500°C (Figure 10.2).
ReP2O7, metallic Re and ReO2 coexist at 800°C and 500°C. Apart from this, a coexistence of
ReP2O7, ReVI2O3(PO4)2, and ReO3 is observed only at 500°C (see Table 10.1). Our
experimental results at 500°C also suggest an equilibrium between the phosphide Re2P and
ReP2O7.
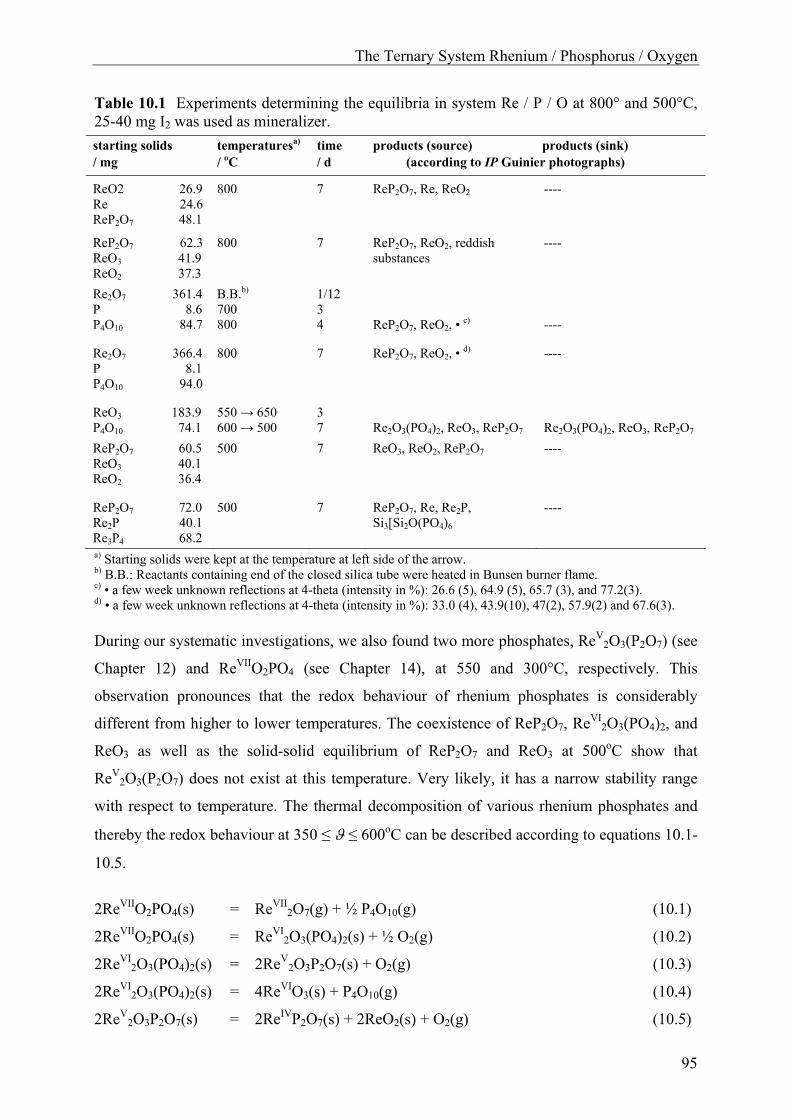
The Ternary System Rhenium / Phosphorus / Oxygen
95
Table 10.1 Experiments determining the equilibria in system Re / P / O at 800° and 500°C, 25-40 mg I2 was used as mineralizer.
starting solids / mg
temperaturesa) / oC
time / d
products (source) products (sink) (according to IP Guinier photographs)
ReO2 26.9 Re 24.6 ReP2O7
48.1
800 7 ReP2O7, Re, ReO2 ----
ReP2O7 62.3 ReO3 41.9 ReO2 37.3
800 7 ReP2O7, ReO2, reddish substances
----
Re2O7 361.4 P 8.6 P4O10 84.7
B.B.b) 700 800
1/12 3 4
ReP2O7, ReO2, •
c)
----
Re2O7 366.4 P 8.1 P4O10 94.0
800 7 ReP2O7, ReO2, • d) ----
ReO3 183.9 P4O10 74.1
550 → 650 600 → 500
3 7
Re2O3(PO4)2, ReO3, ReP2O7
Re2O3(PO4)2, ReO3, ReP2O7
ReP2O7 60.5
ReO3 40.1 ReO2 36.4
500 7 ReO3, ReO2, ReP2O7 ----
ReP2O7 72.0 Re2P 40.1 Re3P4 68.2
500 7 ReP2O7, Re, Re2P, Si3[Si2O(PO4)6
----
a) Starting solids were kept at the temperature at left side of the arrow. b) B.B.: Reactants containing end of the closed silica tube were heated in Bunsen burner flame. c) • a few week unknown reflections at 4-theta (intensity in %): 26.6 (5), 64.9 (5), 65.7 (3), and 77.2(3). d) • a few week unknown reflections at 4-theta (intensity in %): 33.0 (4), 43.9(10), 47(2), 57.9(2) and 67.6(3).
During our systematic investigations, we also found two more phosphates, ReV2O3(P2O7) (see
Chapter 12) and ReVIIO2PO4 (see Chapter 14), at 550 and 300°C, respectively. This
observation pronounces that the redox behaviour of rhenium phosphates is considerably
different from higher to lower temperatures. The coexistence of ReP2O7, ReVI2O3(PO4)2, and
ReO3 as well as the solid-solid equilibrium of ReP2O7 and ReO3 at 500oC show that
ReV2O3(P2O7) does not exist at this temperature. Very likely, it has a narrow stability range
with respect to temperature. The thermal decomposition of various rhenium phosphates and
thereby the redox behaviour at 350 ≤ ≤ 600oC can be described according to equations 10.1-
10.5.
2ReVIIO2PO4(s) = ReVII2O7(g) + ½ P4O10(g) (10.1)
2ReVIIO2PO4(s) = ReVI2O3(PO4)2(s) + ½ O2(g) (10.2)
2ReVI2O3(PO4)2(s) = 2ReV
2O3P2O7(s) + O2(g) (10.3)
2ReVI2O3(PO4)2(s) = 4ReVIO3(s) + P4O10(g) (10.4)
2ReV2O3P2O7(s) = 2ReIVP2O7(s) + 2ReO2(s) + O2(g) (10.5)
Rhenium(IV) phosphates
96
11 Rhenium(IV) phosphates
11.1 Introduction
Up to now, a large number of tetravalent metal cations either transition or main group
elements adopt the structure type of cubic S i P2O7 [174]. Several modifications are identified
for this chemical composition. The largest family of M IVP2O7 crystallizes in the cubic crystal
structure with the space group 3Pa (subcell with Z = 4 and a ~ 8 Å; Si [174], Zr [127, 175],
Mo [31], W [79], Ce [176], U [177], Sn [178], Th [179]; and the respective superstructure
with Z = 108 and a ~ 24 Å; Ti [180], Si [174], Zr [139, 140,175], Hf [139]). It is perceptible
that all the compounds in this structure type encompass a 3 × 3 × 3 superstructure. In addition
to the cubic modification, SiP2O7 crystallizes in two other crystal structures with a hexagonal
[181] and monoclinic [182] phase. OsP2O7 [3] exhibits a cubic and a triclinic modification as
well. The latter is isotypic to triclinic GeP2O7 [183]. Interestingly, triclinic GeP2O7 bears a
close relationship to the crystal structure of monoclinic PtP2O7 [184]. BANKS observed that
rhenium(IV) pyrophosphate, ReIVP2O7 [81], is isotypic to the cubic modification of M IVP2O7,
but until now its structure was not fully characterized.
Electronic absorption spectra of the Re4+ ion have already been extensively studied for
K2ReX6, (X = F, Cl, Br, I) [185, 186], as well as for Re4+ doped in halides A2BX6 (A = K, Cs;
B = Zr, Pt, Hf; X = Cl, Br) [187, 188, 189, 190]. Despite this wealth of investigations of the
d 3 electronic state of Re4+ ion in the chromophore [ReX6], up to now no research was
undertaken for the oxidorhenium complex. Our investigation in the electronic absorption
spectrum of ReIVP2O7 attains an intense attention due to its rather complicated features.
Detailed explanation of this spectrum demands further investigation of other rhenium(IV)-
phosphates. Apart from this, the existence of the very prominent family of tetravalent
NASICON type transition metal phosphates A IM IV2(PO4)3 (see Table 11.1) nourished our
interest to search for polynary rhenium(IV) phosphates. Furthermore, vanadates like M IVV2O7
(M IV = Zr [191], Hf [192], W [193] etc.) attracted us to search for “ReIVV2O7”.
In the present work, two new polynary rhenium(IV) phosphates, NaReIV2(PO4)3 and
ReIV3[Si2O(PO4)6] and a rhenium-vanadium oxide, (Re0.17V0.83)O2, have been synthesized and
structurally characterized. The electronic absorption spectra of tetravalent rhenium phosphates
will be discussed.
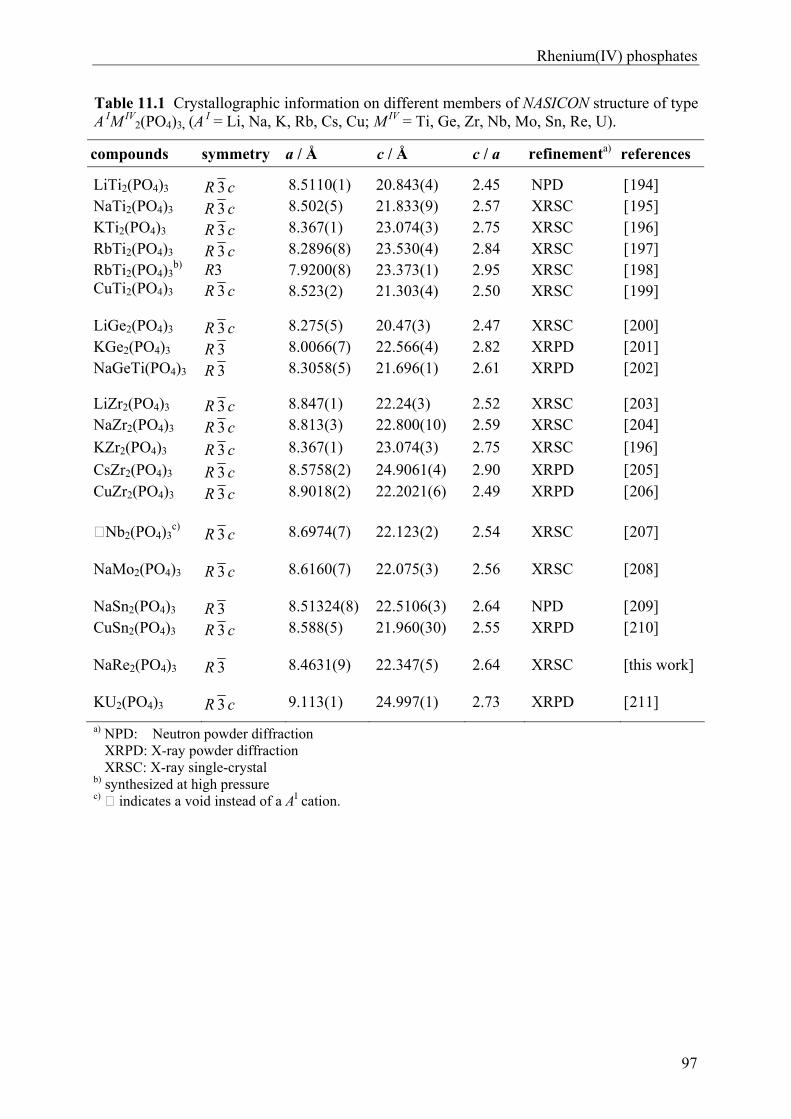
Rhenium(IV) phosphates
97
Table 11.1 Crystallographic information on different members of NASICON structure of type A IM IV
2(PO4)3, (AI = Li, Na, K, Rb, Cs, Cu; M IV = Ti, Ge, Zr, Nb, Mo, Sn, Re, U).
a) NPD: Neutron powder diffraction XRPD: X-ray powder diffraction XRSC: X-ray single-crystal b) synthesized at high pressure c) indicates a void instead of a AI cation.
compounds symmetry a / Å c / Å c / a refinementa) references
LiTi2(PO4)3 R 3 c 8.5110(1) 20.843(4) 2.45 NPD [194] NaTi2(PO4)3 R 3 c 8.502(5) 21.833(9) 2.57 XRSC [195] KTi2(PO4)3 R 3 c 8.367(1) 23.074(3) 2.75 XRSC [196] RbTi2(PO4)3 R 3 c 8.2896(8) 23.530(4) 2.84 XRSC [197] RbTi2(PO4)3
b) R3 7.9200(8) 23.373(1) 2.95 XRSC [198] CuTi2(PO4)3 R 3 c 8.523(2) 21.303(4) 2.50 XRSC [199]
LiGe2(PO4)3 R 3 c 8.275(5) 20.47(3) 2.47 XRSC [200] KGe2(PO4)3 R 3 8.0066(7) 22.566(4) 2.82 XRPD [201] NaGeTi(PO4)3 R 3 8.3058(5) 21.696(1) 2.61 XRPD [202]
LiZr2(PO4)3 R 3 c 8.847(1) 22.24(3) 2.52 XRSC [203] NaZr2(PO4)3 R 3 c 8.813(3) 22.800(10) 2.59 XRSC [204]
KZr2(PO4)3 R 3 c 8.367(1) 23.074(3) 2.75 XRSC [196]
CsZr2(PO4)3 R 3 c 8.5758(2) 24.9061(4) 2.90 XRPD [205] CuZr2(PO4)3 R 3 c 8.9018(2) 22.2021(6) 2.49 XRPD [206]
Nb2(PO4)3c) R 3 c 8.6974(7) 22.123(2) 2.54 XRSC [207]
NaMo2(PO4)3 R 3 c 8.6160(7) 22.075(3) 2.56 XRSC [208]
NaSn2(PO4)3 R 3 8.51324(8) 22.5106(3) 2.64 NPD [209] CuSn2(PO4)3 R 3 c 8.588(5) 21.960(30) 2.55 XRPD [210]
NaRe2(PO4)3 R 3 8.4631(9) 22.347(5) 2.64 XRSC [this work]
KU2(PO4)3 R 3 c 9.113(1) 24.997(1) 2.73 XRPD [211]
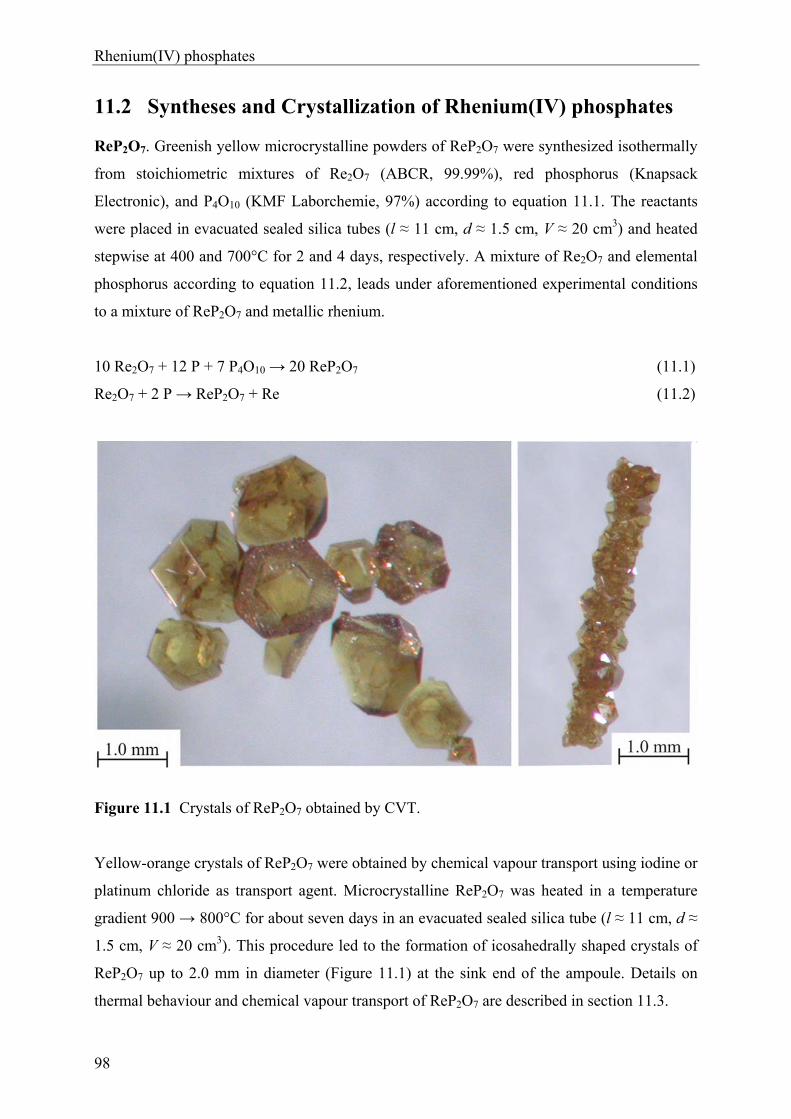
Rhenium(IV) phosphates
98
11.2 Syntheses and Crystallization of Rhenium(IV) phosphates
ReP2O7. Greenish yellow microcrystalline powders of ReP2O7 were synthesized isothermally
from stoichiometric mixtures of Re2O7 (ABCR, 99.99%), red phosphorus (Knapsack
Electronic), and P4O10 (KMF Laborchemie, 97%) according to equation 11.1. The reactants
were placed in evacuated sealed silica tubes (l ≈ 11 cm, d ≈ 1.5 cm, V ≈ 20 cm3) and heated
stepwise at 400 and 700°C for 2 and 4 days, respectively. A mixture of Re2O7 and elemental
phosphorus according to equation 11.2, leads under aforementioned experimental conditions
to a mixture of ReP2O7 and metallic rhenium.
10 Re2O7 + 12 P + 7 P4O10 → 20 ReP2O7 (11.1)
Re2O7 + 2 P → ReP2O7 + Re (11.2)
Figure 11.1 Crystals of ReP2O7 obtained by CVT.
Yellow-orange crystals of ReP2O7 were obtained by chemical vapour transport using iodine or
platinum chloride as transport agent. Microcrystalline ReP2O7 was heated in a temperature
gradient 900 → 800°C for about seven days in an evacuated sealed silica tube (l ≈ 11 cm, d ≈
1.5 cm, V ≈ 20 cm3). This procedure led to the formation of icosahedrally shaped crystals of
ReP2O7 up to 2.0 mm in diameter (Figure 11.1) at the sink end of the ampoule. Details on
thermal behaviour and chemical vapour transport of ReP2O7 are described in section 11.3.
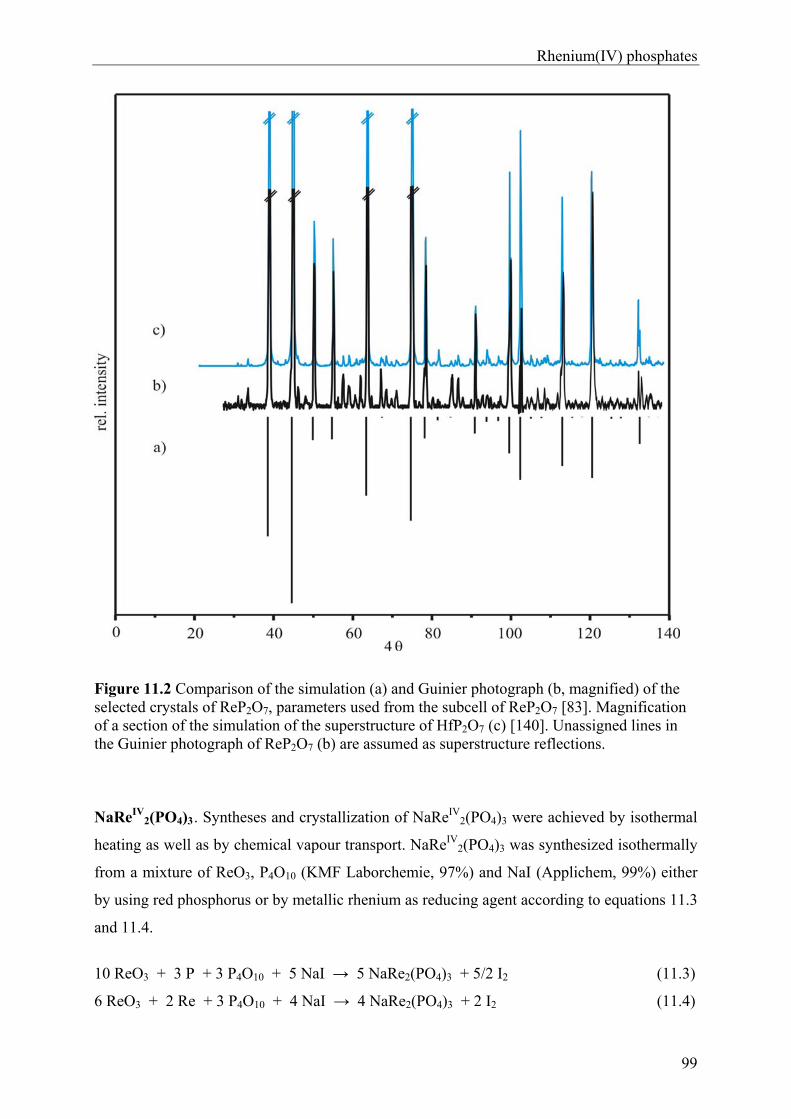
Rhenium(IV) phosphates
99
Figure 11.2 Comparison of the simulation (a) and Guinier photograph (b, magnified) of the selected crystals of ReP2O7, parameters used from the subcell of ReP2O7 [83]. Magnification of a section of the simulation of the superstructure of HfP2O7 (c) [140]. Unassigned lines in the Guinier photograph of ReP2O7 (b) are assumed as superstructure reflections.
NaReIV2(PO4)3. Syntheses and crystallization of NaReIV
2(PO4)3 were achieved by isothermal
heating as well as by chemical vapour transport. NaReIV2(PO4)3 was synthesized isothermally
from a mixture of ReO3, P4O10 (KMF Laborchemie, 97%) and NaI (Applichem, 99%) either
by using red phosphorus or by metallic rhenium as reducing agent according to equations 11.3
and 11.4.
10 ReO3 + 3 P + 3 P4O10 + 5 NaI → 5 NaRe2(PO4)3 + 5/2 I2 (11.3)
6 ReO3 + 2 Re + 3 P4O10 + 4 NaI → 4 NaRe2(PO4)3 + 2 I2 (11.4)
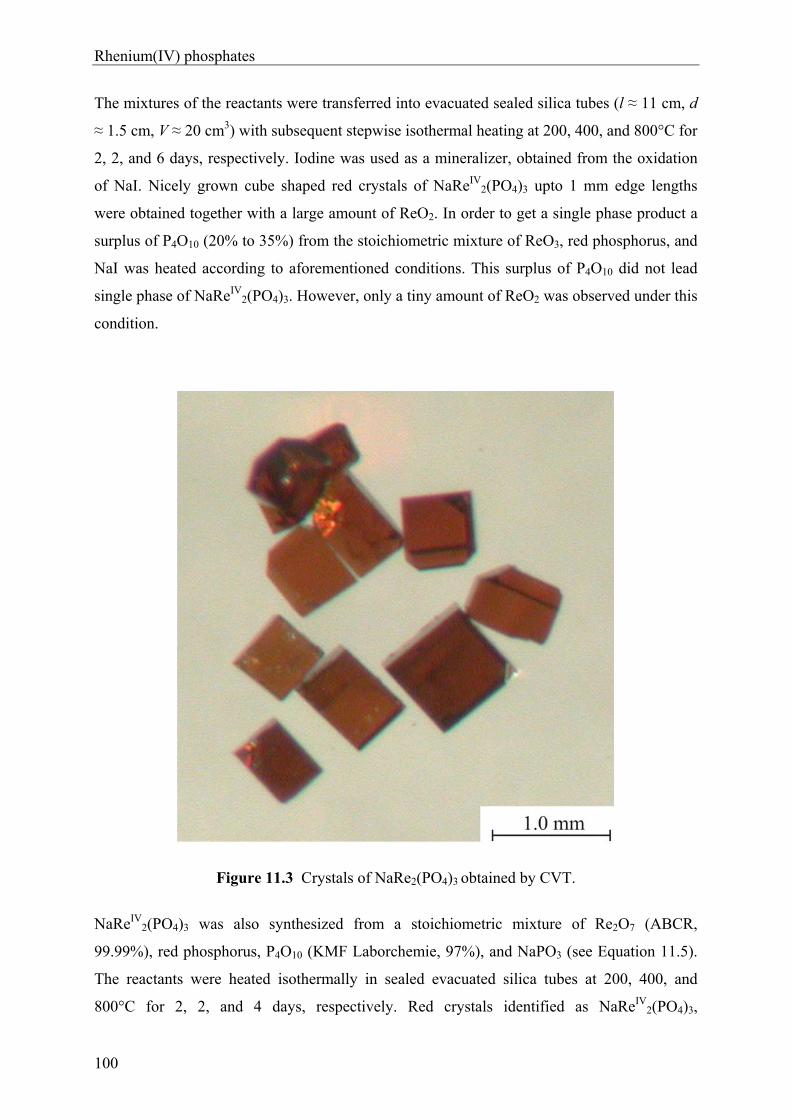
Rhenium(IV) phosphates
100
The mixtures of the reactants were transferred into evacuated sealed silica tubes (l ≈ 11 cm, d
≈ 1.5 cm, V ≈ 20 cm3) with subsequent stepwise isothermal heating at 200, 400, and 800°C for
2, 2, and 6 days, respectively. Iodine was used as a mineralizer, obtained from the oxidation
of NaI. Nicely grown cube shaped red crystals of NaReIV2(PO4)3 upto 1 mm edge lengths
were obtained together with a large amount of ReO2. In order to get a single phase product a
surplus of P4O10 (20% to 35%) from the stoichiometric mixture of ReO3, red phosphorus, and
NaI was heated according to aforementioned conditions. This surplus of P4O10 did not lead
single phase of NaReIV2(PO4)3. However, only a tiny amount of ReO2 was observed under this
condition.
Figure 11.3 Crystals of NaRe2(PO4)3 obtained by CVT.
NaReIV2(PO4)3 was also synthesized from a stoichiometric mixture of Re2O7 (ABCR,
99.99%), red phosphorus, P4O10 (KMF Laborchemie, 97%), and NaPO3 (see Equation 11.5).
The reactants were heated isothermally in sealed evacuated silica tubes at 200, 400, and
800°C for 2, 2, and 4 days, respectively. Red crystals identified as NaReIV2(PO4)3,
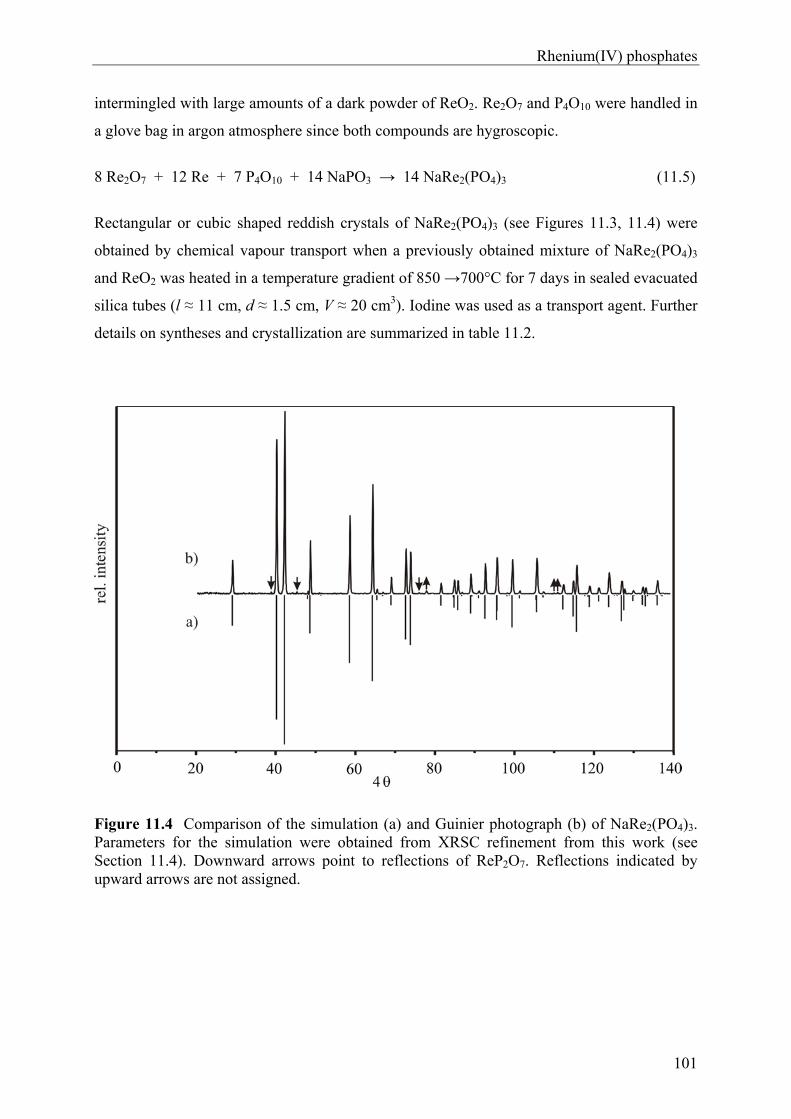
Rhenium(IV) phosphates
101
intermingled with large amounts of a dark powder of ReO2. Re2O7 and P4O10 were handled in
a glove bag in argon atmosphere since both compounds are hygroscopic.
8 Re2O7 + 12 Re + 7 P4O10 + 14 NaPO3 → 14 NaRe2(PO4)3 (11.5)
Rectangular or cubic shaped reddish crystals of NaRe2(PO4)3 (see Figures 11.3, 11.4) were
obtained by chemical vapour transport when a previously obtained mixture of NaRe2(PO4)3
and ReO2 was heated in a temperature gradient of 850 →700°C for 7 days in sealed evacuated
silica tubes (l ≈ 11 cm, d ≈ 1.5 cm, V ≈ 20 cm3). Iodine was used as a transport agent. Further
details on syntheses and crystallization are summarized in table 11.2.
Figure 11.4 Comparison of the simulation (a) and Guinier photograph (b) of NaRe2(PO4)3. Parameters for the simulation were obtained from XRSC refinement from this work (see Section 11.4). Downward arrows point to reflections of ReP2O7. Reflections indicated by upward arrows are not assigned.
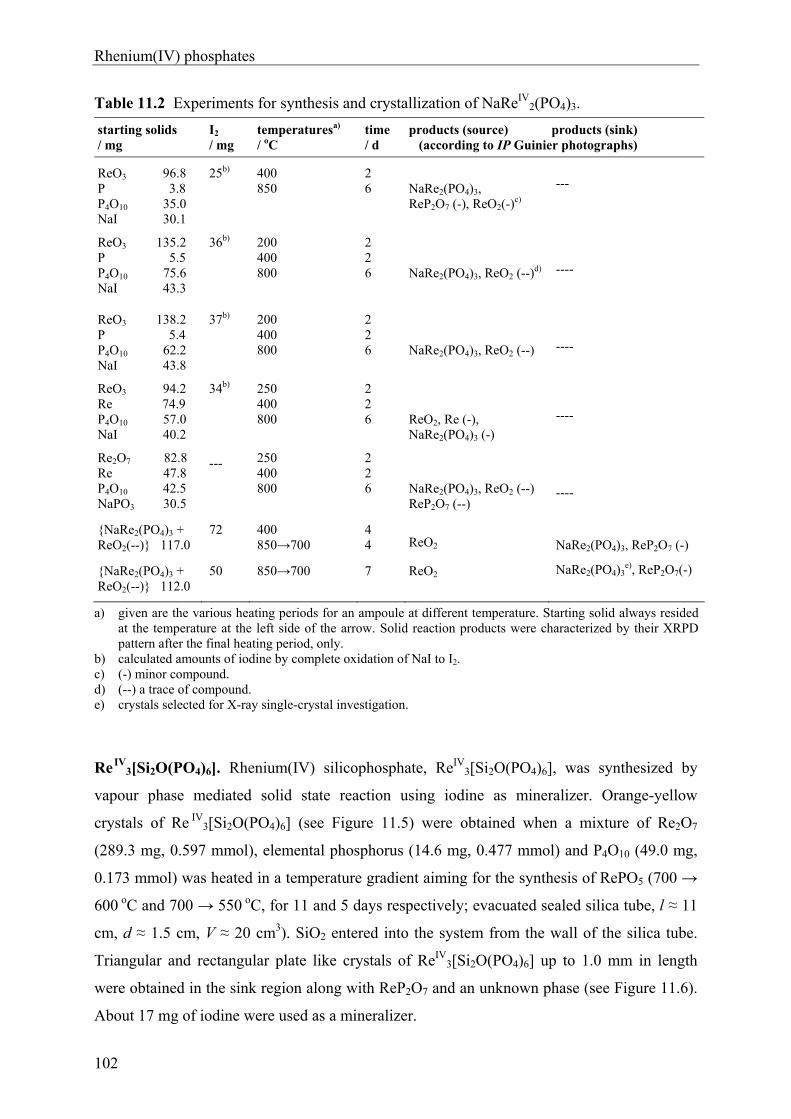
Rhenium(IV) phosphates
102
Table 11.2 Experiments for synthesis and crystallization of NaReIV2(PO4)3.
starting solids / mg
I2 / mg
temperaturesa) / oC
time / d
products (source) products (sink) (according to IP Guinier photographs)
ReO3 96.8 P 3.8 P4O10 35.0 NaI 30.1
25b) 400 850
2 6
NaRe2(PO4)3, ReP2O7 (-), ReO2(-)
c)
---
ReO3 135.2 P 5.5 P4O10 75.6 NaI 43.3
36b)
200 400 800
2 2 6
NaRe2(PO4)3, ReO2 (--)
d)
----
ReO3 138.2 P 5.4 P4O10 62.2 NaI 43.8
37b)
200 400 800
2 2 6
NaRe2(PO4)3, ReO2 (--)
----
ReO3 94.2 Re 74.9 P4O10 57.0 NaI 40.2
34b) 250 400 800
2 2 6
ReO2, Re (-), NaRe2(PO4)3 (-)
----
Re2O7 82.8 Re 47.8 P4O10 42.5 NaPO3 30.5
--- 250 400 800
2 2 6
NaRe2(PO4)3, ReO2 (--) ReP2O7 (--)
----
{NaRe2(PO4)3 + ReO2(--)} 117.0
72 400 850→700
4 4
ReO2
NaRe2(PO4)3, ReP2O7 (-)
{NaRe2(PO4)3 + ReO2(--)} 112.0
50 850→700 7
ReO2 NaRe2(PO4)3e), ReP2O7(-)
a) given are the various heating periods for an ampoule at different temperature. Starting solid always resided at the temperature at the left side of the arrow. Solid reaction products were characterized by their XRPD pattern after the final heating period, only.
b) calculated amounts of iodine by complete oxidation of NaI to I2. c) (-) minor compound. d) (--) a trace of compound. e) crystals selected for X-ray single-crystal investigation.
ReIV3[Si2O(PO4)6]. Rhenium(IV) silicophosphate, ReIV
3[Si2O(PO4)6], was synthesized by
vapour phase mediated solid state reaction using iodine as mineralizer. Orange-yellow
crystals of Re IV3[Si2O(PO4)6] (see Figure 11.5) were obtained when a mixture of Re2O7
(289.3 mg, 0.597 mmol), elemental phosphorus (14.6 mg, 0.477 mmol) and P4O10 (49.0 mg,
0.173 mmol) was heated in a temperature gradient aiming for the synthesis of RePO5 (700 →
600 oC and 700 → 550 oC, for 11 and 5 days respectively; evacuated sealed silica tube, l ≈ 11
cm, d ≈ 1.5 cm, V ≈ 20 cm3). SiO2 entered into the system from the wall of the silica tube.
Triangular and rectangular plate like crystals of ReIV3[Si2O(PO4)6] up to 1.0 mm in length
were obtained in the sink region along with ReP2O7 and an unknown phase (see Figure 11.6).
About 17 mg of iodine were used as a mineralizer.
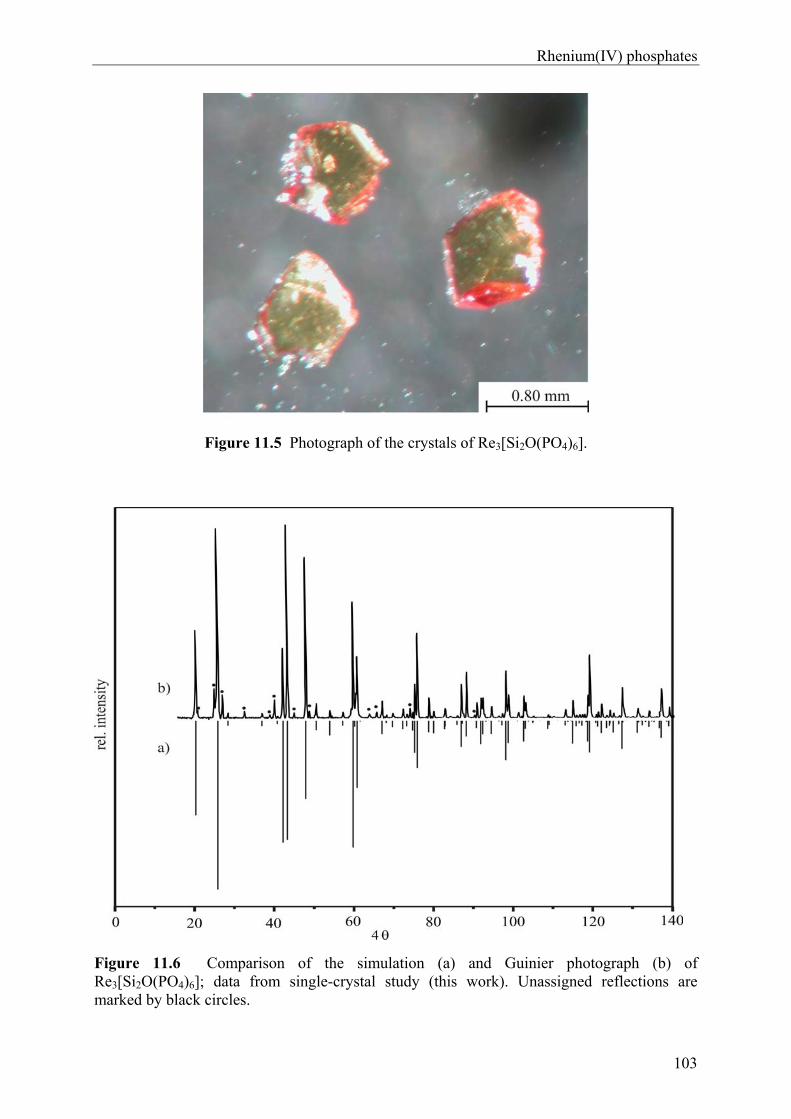
Rhenium(IV) phosphates
103
Figure 11.5 Photograph of the crystals of Re3[Si2O(PO4)6].
Figure 11.6 Comparison of the simulation (a) and Guinier photograph (b) of Re3[Si2O(PO4)6]; data from single-crystal study (this work). Unassigned reflections are marked by black circles.
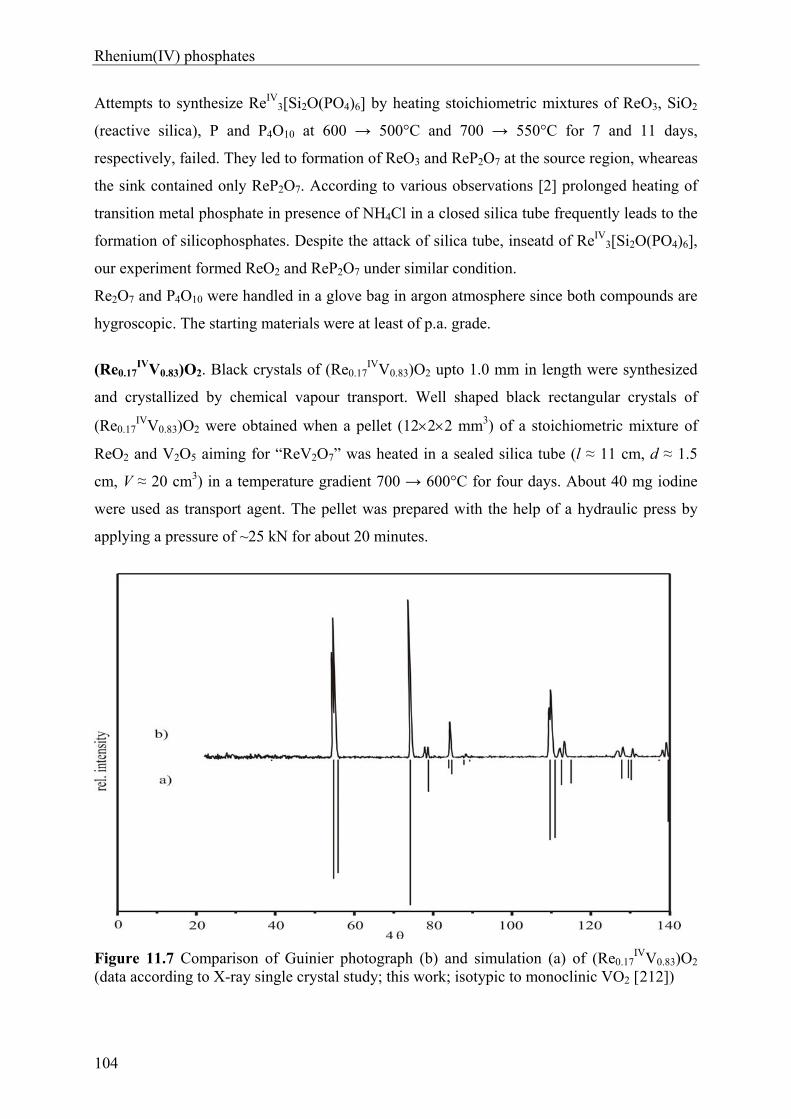
Rhenium(IV) phosphates
104
Attempts to synthesize ReIV3[Si2O(PO4)6] by heating stoichiometric mixtures of ReO3, SiO2
(reactive silica), P and P4O10 at 600 → 500°C and 700 → 550°C for 7 and 11 days,
respectively, failed. They led to formation of ReO3 and ReP2O7 at the source region, wheareas
the sink contained only ReP2O7. According to various observations [2] prolonged heating of
transition metal phosphate in presence of NH4Cl in a closed silica tube frequently leads to the
formation of silicophosphates. Despite the attack of silica tube, inseatd of ReIV3[Si2O(PO4)6],
our experiment formed ReO2 and ReP2O7 under similar condition.
Re2O7 and P4O10 were handled in a glove bag in argon atmosphere since both compounds are
hygroscopic. The starting materials were at least of p.a. grade.
(Re0.17IVV0.83)O2. Black crystals of (Re0.17
IVV0.83)O2 upto 1.0 mm in length were synthesized
and crystallized by chemical vapour transport. Well shaped black rectangular crystals of
(Re0.17IVV0.83)O2 were obtained when a pellet (1222 mm3) of a stoichiometric mixture of
ReO2 and V2O5 aiming for “ReV2O7” was heated in a sealed silica tube (l ≈ 11 cm, d ≈ 1.5
cm, V ≈ 20 cm3) in a temperature gradient 700 → 600°C for four days. About 40 mg iodine
were used as transport agent. The pellet was prepared with the help of a hydraulic press by
applying a pressure of ~25 kN for about 20 minutes.
Figure 11.7 Comparison of Guinier photograph (b) and simulation (a) of (Re0.17IVV0.83)O2
(data according to X-ray single crystal study; this work; isotypic to monoclinic VO2 [212])

Rhenium(IV) phosphates
105
11.3 Thermal Behaviour and Chemical Vapour Transport of Rhenium(IV) phosphates
Various experimental results show that ReP2O7 exists up to T = 850°C in sealed ampoule.
This observation points to the large stability of Re4+ in the diphosphate. Prolonged heating of
ReP2O7 above 850°C in sealed evacuated silica tube leads to decomposition into ReO2 and
gaseous P4O10 (Equation 11.6), while the ultimate decomposition products are metallic
rhenium and gaseous P4O10 (Equation 11.7) at about 1000°C. Thus both the thermal
decomposition and thermal reduction of ReP2O7 occur within 850 to 1000°C. In contrast to
rhenium pyrophosphate, thermal decomposition of ZrIVP2O7 [213] leads to the formation of
ZrIV2O(PO4)2 and gaseous P4O10 (Equation 11.8) at about 1250°C.
ReP2O7(s) → ReO2(s) + ½ P4O10(g) ≥ 850°C (11.6)
ReP2O7(s) → Re(s) + ½ P4O10(g) + O2(g) ≥ 1000°C (11.7)
4 ZrP2O7(s) → 2 Zr2O(PO4)2(s) + P4O10(g) ≥ 1250°C (11.8)
Sodium rhenium(IV) phosphate, NaRe2(PO4)3, was synthesized and crystallized within the
temperature range 700 to 850°C. The synthesis of this phosphate can be achieved from
different starting solids (see Reactions 11.3 to 11.5). The easy access to this compound points
to its large stability. In addition, the coexistence and the thermal stability of NaRe2(PO4)3 and
ReP2O7 at 850°C express the comparable thermal behaviour of these two phosphates.
Due to the high volatility of ReO3X(g) (X = I, Cl) and P4O10(g), the method chemical vapour
transport (CVT) [85] works nicely for the crystallization of the pyrophosphate (see Equation
11.9). Migration of the phosphate proceeds from higher to lower temperature (T2 → T1, T2 >
T1, ΔT ≈ 100 K) due to endothermic reactions. The formation of NaRe2(PO4)3 along with
ReP2O7 in the sink of the silica tube was also achieved by chemical vapour transport at 850 →
700°C for about 7 days. Iodine was used as transport agent. Phosphorus forms various volatile
oxides P4On, 6 ≤ n ≤ 10, PO2(g) and PO(g). Among them P4O10(g) seems to be the most
important species for the transport of phosphorus due to its distinct thermodynamic stability
[134] under the given conditions. In addition to this, the stability of ReO3X(g) (X = I-, Cl-, OH-
) has already been mentioned by SCHÄFER [84]. Therefore, CVT of ReP2O7 proceeds
according to equation 11.9. On the other hand, migration of sodium may occur via the
formation of NaI(g) along with ReO3I(g), P4O10(g), and O2(g). This leads to the formation of
NaRe2(PO4)3 (see Equation11.10) in the sink side of the ampoule.
Rhenium(IV) phosphates
106
ReP2O7(s) + X2(g) + ½ O2(g) = ReO3X(g) + ½ P4O10(g), (X = I-, Cl-, OH-) (11.9)
4 NaRe2(PO4)3(s) + 6 I2(g) + 3 O2(g) =
4 NaI(g) + 8 ReO3I(g) + 3 P4O10(g) (11.10)
Synthesis of anhydrous transition metal phosphates in sealed silica tubes is frequently
accompanied by formation of silicophosphates [2, 214, 215]. SiO2(s) is mobilized from the
wall of the silica ampoule. The formation of Re3[Si2O(PO4)6] is an another example for this
general observation. While synthesis and crystallization of other rhenium(IV) phosphates like
ReP2O7 and NaRe2(PO4)3 can be easily achieved, synthesis of single-phase Re3[Si2O(PO4)6]
turned out to be rather difficult.
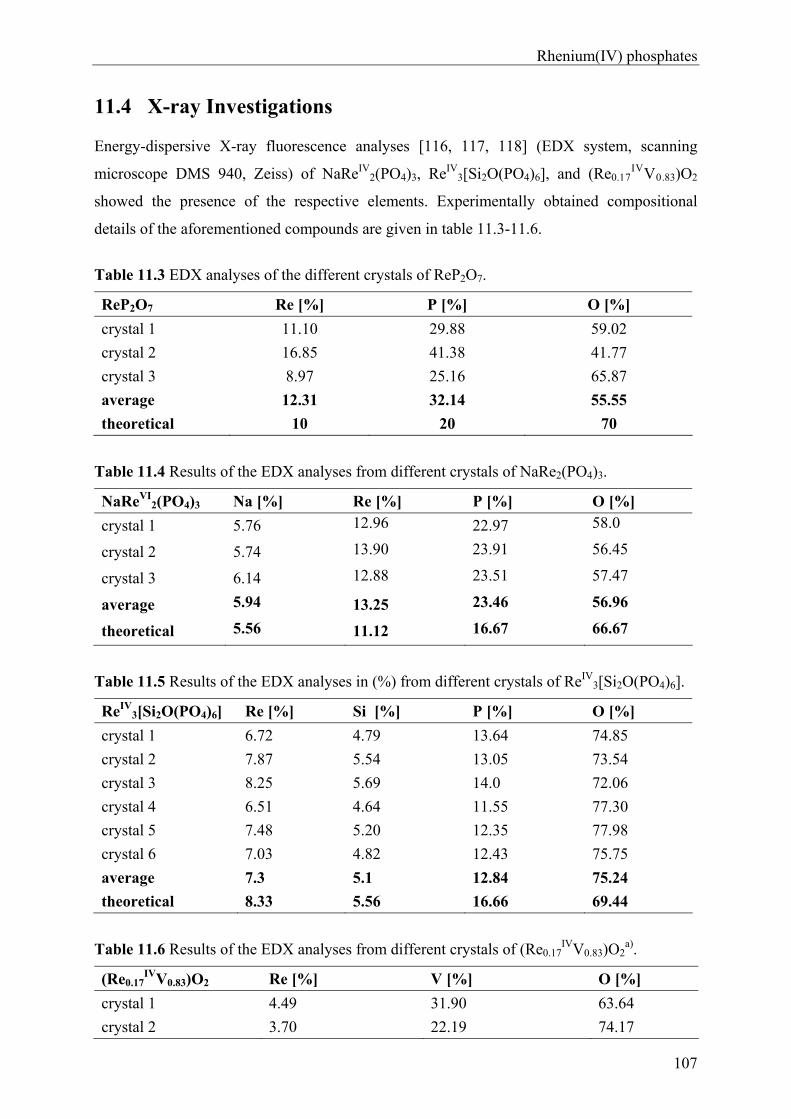
Rhenium(IV) phosphates
107
11.4 X-ray Investigations
Energy-dispersive X-ray fluorescence analyses [116, 117, 118] (EDX system, scanning
microscope DMS 940, Zeiss) of NaReIV2(PO4)3, ReIV
3[Si2O(PO4)6], and (Re0.17IVV0.83)O2
showed the presence of the respective elements. Experimentally obtained compositional
details of the aforementioned compounds are given in table 11.3-11.6.
Table 11.3 EDX analyses of the different crystals of ReP2O7.
ReP2O7 Re [%] P [%] O [%]
crystal 1 11.10 29.88 59.02
crystal 2 16.85 41.38 41.77
crystal 3 8.97 25.16 65.87
average 12.31 32.14 55.55
theoretical 10 20 70
Table 11.4 Results of the EDX analyses from different crystals of NaRe2(PO4)3.
NaReVI2(PO4)3 Na [%] Re [%] P [%] O [%]
crystal 1 5.76 12.96 22.97 58.0
crystal 2 5.74 13.90 23.91 56.45
crystal 3 6.14 12.88 23.51 57.47
average 5.94 13.25 23.46 56.96
theoretical 5.56 11.12 16.67 66.67
Table 11.5 Results of the EDX analyses in (%) from different crystals of ReIV3[Si2O(PO4)6].
ReIV3[Si2O(PO4)6] Re [%] Si [%] P [%] O [%]
crystal 1 6.72 4.79 13.64 74.85
crystal 2 7.87 5.54 13.05 73.54
crystal 3 8.25 5.69 14.0 72.06
crystal 4 6.51 4.64 11.55 77.30
crystal 5 7.48 5.20 12.35 77.98
crystal 6 7.03 4.82 12.43 75.75
average 7.3 5.1 12.84 75.24
theoretical 8.33 5.56 16.66 69.44
Table 11.6 Results of the EDX analyses from different crystals of (Re0.17IVV0.83)O2
a).
(Re0.17IVV0.83)O2 Re [%] V [%] O [%]
crystal 1 4.49 31.90 63.64
crystal 2 3.70 22.19 74.17
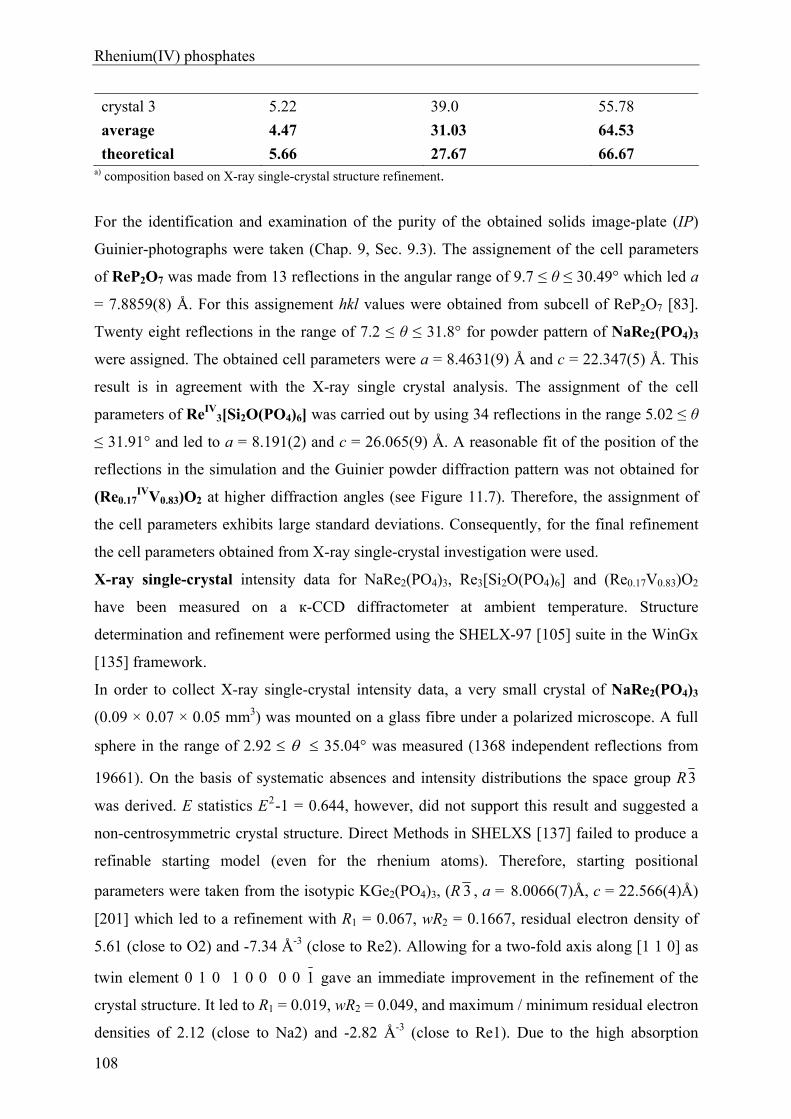
Rhenium(IV) phosphates
108
crystal 3 5.22 39.0 55.78
average 4.47 31.03 64.53
theoretical 5.66 27.67 66.67 a) composition based on X-ray single-crystal structure refinement.
For the identification and examination of the purity of the obtained solids image-plate (IP)
Guinier-photographs were taken (Chap. 9, Sec. 9.3). The assignement of the cell parameters
of ReP2O7 was made from 13 reflections in the angular range of 9.7 ≤ θ ≤ 30.49° which led a
= 7.8859(8) Å. For this assignement hkl values were obtained from subcell of ReP2O7 [83].
Twenty eight reflections in the range of 7.2 ≤ θ ≤ 31.8° for powder pattern of NaRe2(PO4)3
were assigned. The obtained cell parameters were a = 8.4631(9) Å and c = 22.347(5) Å. This
result is in agreement with the X-ray single crystal analysis. The assignment of the cell
parameters of ReIV3[Si2O(PO4)6] was carried out by using 34 reflections in the range 5.02 ≤ θ
≤ 31.91° and led to a = 8.191(2) and c = 26.065(9) Å. A reasonable fit of the position of the
reflections in the simulation and the Guinier powder diffraction pattern was not obtained for
(Re0.17IVV0.83)O2 at higher diffraction angles (see Figure 11.7). Therefore, the assignment of
the cell parameters exhibits large standard deviations. Consequently, for the final refinement
the cell parameters obtained from X-ray single-crystal investigation were used.
X-ray single-crystal intensity data for NaRe2(PO4)3, Re3[Si2O(PO4)6] and (Re0.17V0.83)O2
have been measured on a к-CCD diffractometer at ambient temperature. Structure
determination and refinement were performed using the SHELX-97 [105] suite in the WinGx
[135] framework.
In order to collect X-ray single-crystal intensity data, a very small crystal of NaRe2(PO4)3
(0.09 × 0.07 × 0.05 mm3) was mounted on a glass fibre under a polarized microscope. A full
sphere in the range of 2.92 35.04° was measured (1368 independent reflections from
19661). On the basis of systematic absences and intensity distributions the space group R3
was derived. E statistics E2-1 = 0.644, however, did not support this result and suggested a
non-centrosymmetric crystal structure. Direct Methods in SHELXS [137] failed to produce a
refinable starting model (even for the rhenium atoms). Therefore, starting positional
parameters were taken from the isotypic KGe2(PO4)3, (R 3 , a = 8.0066(7)Å, c = 22.566(4)Å)
[201] which led to a refinement with R1 = 0.067, wR2 = 0.1667, residual electron density of
5.61 (close to O2) and -7.34 Å-3 (close to Re2). Allowing for a two-fold axis along [1 1 0] as
twin element 0 1 0 1 0 0 0 0 1 gave an immediate improvement in the refinement of the
crystal structure. It led to R1 = 0.019, wR2 = 0.049, and maximum / minimum residual electron
densities of 2.12 (close to Na2) and -2.82 Å-3 (close to Re1). Due to the high absorption
Rhenium(IV) phosphates
109
coeffient, µ = 26.809 mm-1, an empirical absorption correction with multi-scans [115] was
applied and eventually the structure refinement converged at R1 = 0.015, wR2 = 0.033, and
thus the residual electron density dropped to 1.55 (close to Re2) and -1.27 Å-3 (close to Re1).
For data collection, a yellow prismatic crystal of Re3[Si2O(PO4)6] with dimensions 0.05 ×
0.04 × 0.01 mm3 was used. A full sphere in the range 2.98 35.06° was measured (from
11479 reflections 1482 were independent). On the basis of systematic absences and intensity
distributions the space group R3 was derived. Starting parameters for the single crystal
structure refinement were obtained by Direct Methods in SHELXS [137]. Thus rhenium,
silicon and phosphorus positions were revealed. Subsequent ∆-Fourier syntheses allowed the
localization of the oxygen atoms. An empirical absoprtion correction with multi-scan [115]
was applied. The anisotropic displacement parameters of O1 (the bridging oxygen of two
silicon atoms) showed a very large displacement only along the Si-O-Si axis. Therefore, final
refinement was carried out leaving O1 isotropically. Despite the reasonable bond-lengths and
angles, the structure refinement converged rather high residuals R1 = 0.059, wR2 = 0.157 and
residual electron densities of 19.25 Å-3 (close to O1) and -3.37 Å-3 (close to Re2). These
higher residuals might related either to the poor quality of the X-ray single crystal data set or
to the twining problem. A combination of the two can not be completey ruled out. Attempts to
refine the crystal structure by using the lower symmetry space group R3, P31 and P3 failed.
For the data collection, a rectangular black crystal of (Re0.17IVV0.83)O2 with dimensions 0.05 ×
0.04 × 0.01 mm3 was used. The full sphere in the range 0.998 40.25° was measured
(from 2240 reflections 371 were independent). On the basis of systematic absences and
intensity statistics the space group P2/m was derived. Starting parameters for the single
crystal structure refinement were obtained by Direct Methods in SHELXS [137]. Thus the
metals positions were revealed. Subsequent ∆-Fourier syntheses allowed the localization of
the oxygen atoms. The restraints EXYZ and EADP were used for mixed occupancy of
vanadium and rhenium. The introduction of the twin law 1 0 0 0 1 0 0 0 1 avoided non
positive definitive displacement parameters for O1 as well as reduced the residuals from R1 =
0.09 (wR2 = 0.30) to R1 = 0.065 (wR2 = 0.17). An empirical absorption correction with
multiscan [115] led to the final residual values R1 = 0.044 (wR2 = 0.122).
Details on crystal data, data collections as well as on the structure refinements are given in
table 11.7. Atomic positions and isotropic displacement parameters are given in tables 11.8 to
11.10. Selected interatomic distances and angles are summarized in tables 11.12 and 11.13.
Indexing of the Guinier photograph and anisotropic displacement parameters are given in
Appendix B1 (Table B1.1.1-Table B1.1.3 and Table B1.2.1-Table B1.2.3).
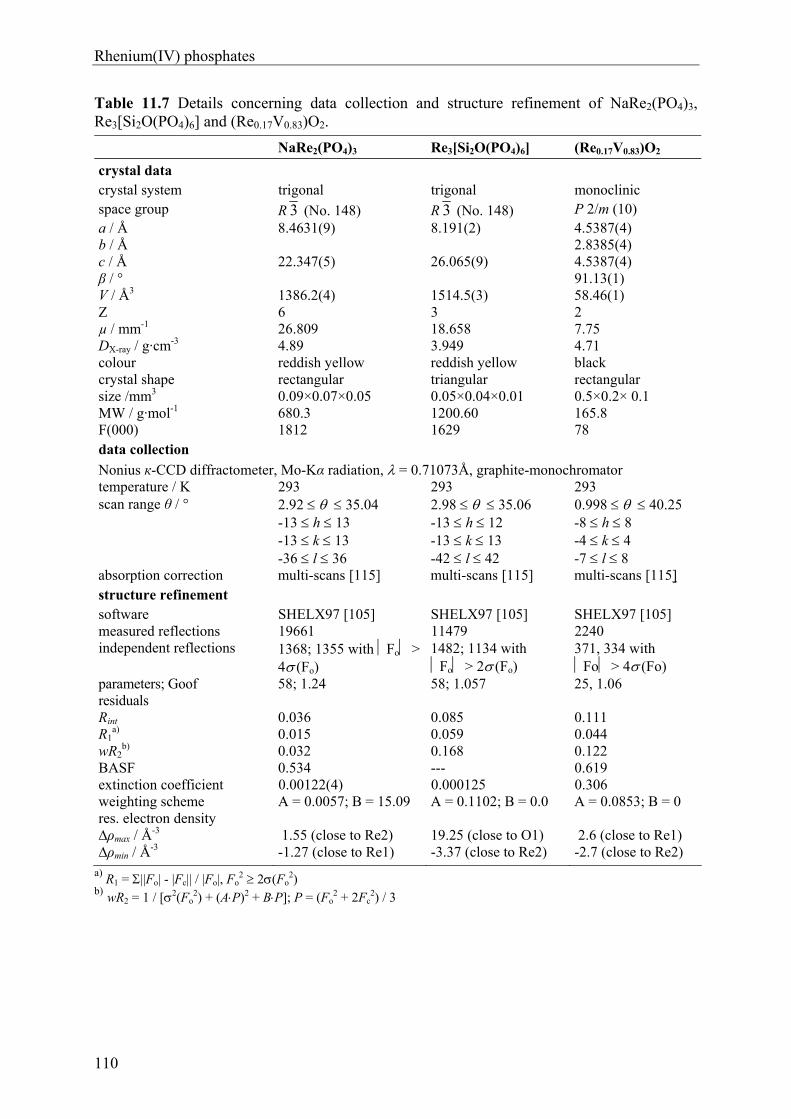
Rhenium(IV) phosphates
110
Table 11.7 Details concerning data collection and structure refinement of NaRe2(PO4)3, Re3[Si2O(PO4)6] and (Re0.17V0.83)O2.
NaRe2(PO4)3 Re3[Si2O(PO4)6] (Re0.17V0.83)O2
crystal data crystal system trigonal trigonal monoclinic space group R 3 (No. 148) R 3 (No. 148) P 2/m (10) a / Å b / Å c / Å β / °
8.4631(9) 22.347(5)
8.191(2) 26.065(9)
4.5387(4) 2.8385(4) 4.5387(4) 91.13(1)
V / Å3 1386.2(4) 1514.5(3) 58.46(1) Z 6 3 2 µ / mm-1 26.809 18.658 7.75 DX-ray / g·cm-3 4.89 3.949 4.71 colour reddish yellow reddish yellow black crystal shape size /mm3
rectangular 0.09×0.07×0.05
triangular 0.05×0.04×0.01
rectangular 0.5×0.2× 0.1
MW / g·mol-1 680.3 1200.60 165.8 F(000) 1812 1629 78 data collection
Nonius к-CCD diffractometer, Mo-Kα radiation, = 0.71073Å, graphite-monochromator temperature / K 293 293 293 scan range θ / ° 2.92 35.04 2.98 35.06 0.998 40.25
-13 h 13 -13 k 13 -36 l 36
-13 h 12 -13 k 13 -42 l 42
-8 h 8 -4 k 4 -7 l 8
absorption correction multi-scans [115] multi-scans [115] multi-scans [115] structure refinement software SHELX97 [105] SHELX97 [105] SHELX97 [105] measured reflections 19661 11479 2240 independent reflections 1368; 1355 with Fo >
4 (Fo) 1482; 1134 with Fo > 2 (Fo)
371, 334 with Fo > 4 (Fo)
parameters; Goof 58; 1.24 58; 1.057 25, 1.06 residuals Rint R1
a) wR2
b)
0.036 0.015 0.032
0.085 0.059 0.168
0.111 0.044 0.122
BASF 0.534 --- 0.619 extinction coefficient 0.00122(4) 0.000125 0.306 weighting scheme A = 0.0057; B = 15.09 A = 0.1102; B = 0.0 A = 0.0853; B = 0 res. electron density ∆ρmax / Å
-3 ∆ρmin / Å
-3
1.55 (close to Re2) -1.27 (close to Re1)
19.25 (close to O1) -3.37 (close to Re2)
2.6 (close to Re1) -2.7 (close to Re2)
a) R1 = ||Fo| - |Fc|| / |Fo|, Fo2 2(Fo
2) b) wR2 = 1 / [2(Fo
2) + (AP)2 + BP]; P = (Fo2 + 2Fc
2) / 3
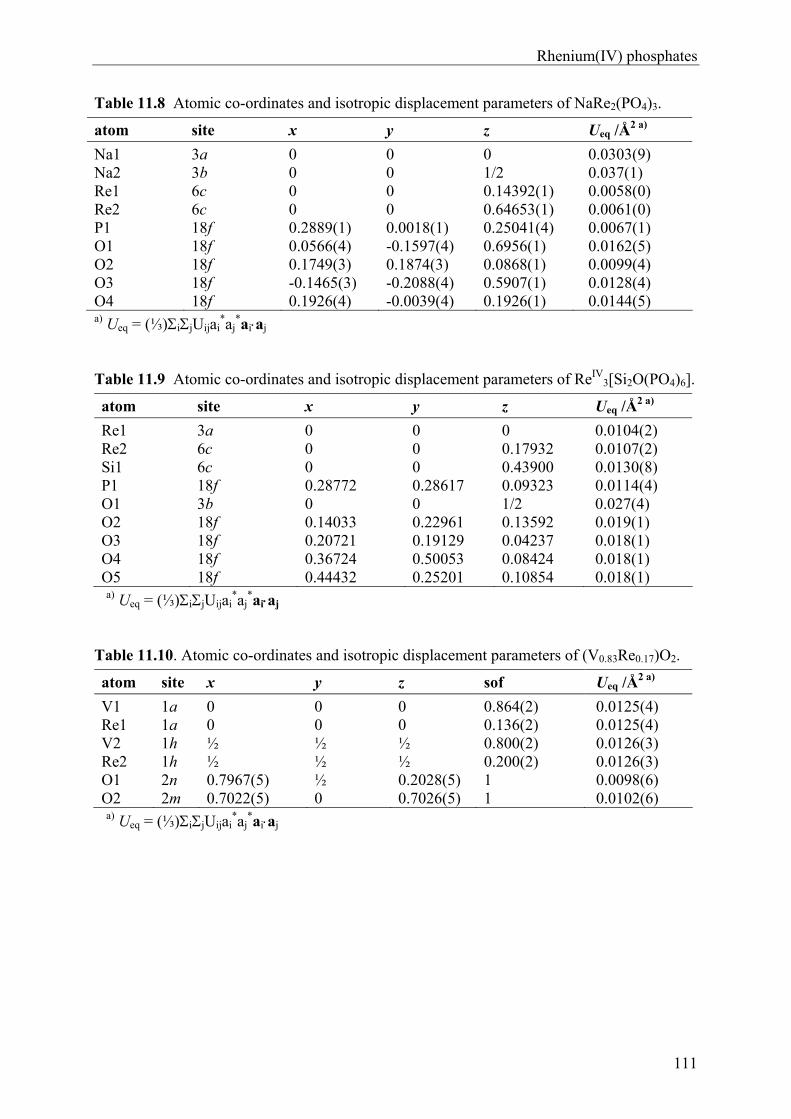
Rhenium(IV) phosphates
111
Table 11.8 Atomic co-ordinates and isotropic displacement parameters of NaRe2(PO4)3.
atom site x y z Ueq /Å2 a)
Na1 3a 0 0 0 0.0303(9) Na2 3b 0 0 1/2 0.037(1) Re1 6c 0 0 0.14392(1) 0.0058(0) Re2 6c 0 0 0.64653(1) 0.0061(0) P1 18f 0.2889(1) 0.0018(1) 0.25041(4) 0.0067(1) O1 18f 0.0566(4) -0.1597(4) 0.6956(1) 0.0162(5) O2 18f 0.1749(3) 0.1874(3) 0.0868(1) 0.0099(4) O3 18f -0.1465(3) -0.2088(4) 0.5907(1) 0.0128(4) O4 18f 0.1926(4) -0.0039(4) 0.1926(1) 0.0144(5) a) Ueq = (⅓)ijUijai
*aj*aiaj
Table 11.9 Atomic co-ordinates and isotropic displacement parameters of ReIV
3[Si2O(PO4)6].
atom site x y z Ueq /Å2 a)
Re1 3a 0 0 0 0.0104(2) Re2 6c 0 0 0.17932 0.0107(2) Si1 6c 0 0 0.43900 0.0130(8) P1 18f 0.28772 0.28617 0.09323 0.0114(4) O1 3b 0 0 1/2 0.027(4) O2 18f 0.14033 0.22961 0.13592 0.019(1) O3 18f 0.20721 0.19129 0.04237 0.018(1) O4 18f 0.36724 0.50053 0.08424 0.018(1) O5 18f 0.44432 0.25201 0.10854 0.018(1) a) Ueq = (⅓)ijUijai
*aj*aiaj
Table 11.10. Atomic co-ordinates and isotropic displacement parameters of (V0.83Re0.17)O2.
atom site x y z sof Ueq /Å2 a)
V1 1a 0 0 0 0.864(2) 0.0125(4) Re1 1a 0 0 0 0.136(2) 0.0125(4) V2 1h ½ ½ ½ 0.800(2) 0.0126(3) Re2 1h ½ ½ ½ 0.200(2) 0.0126(3) O1 2n 0.7967(5) ½ 0.2028(5) 1 0.0098(6) O2 2m 0.7022(5) 0 0.7026(5) 1 0.0102(6) a) Ueq = (⅓)ijUijai
*aj*aiaj
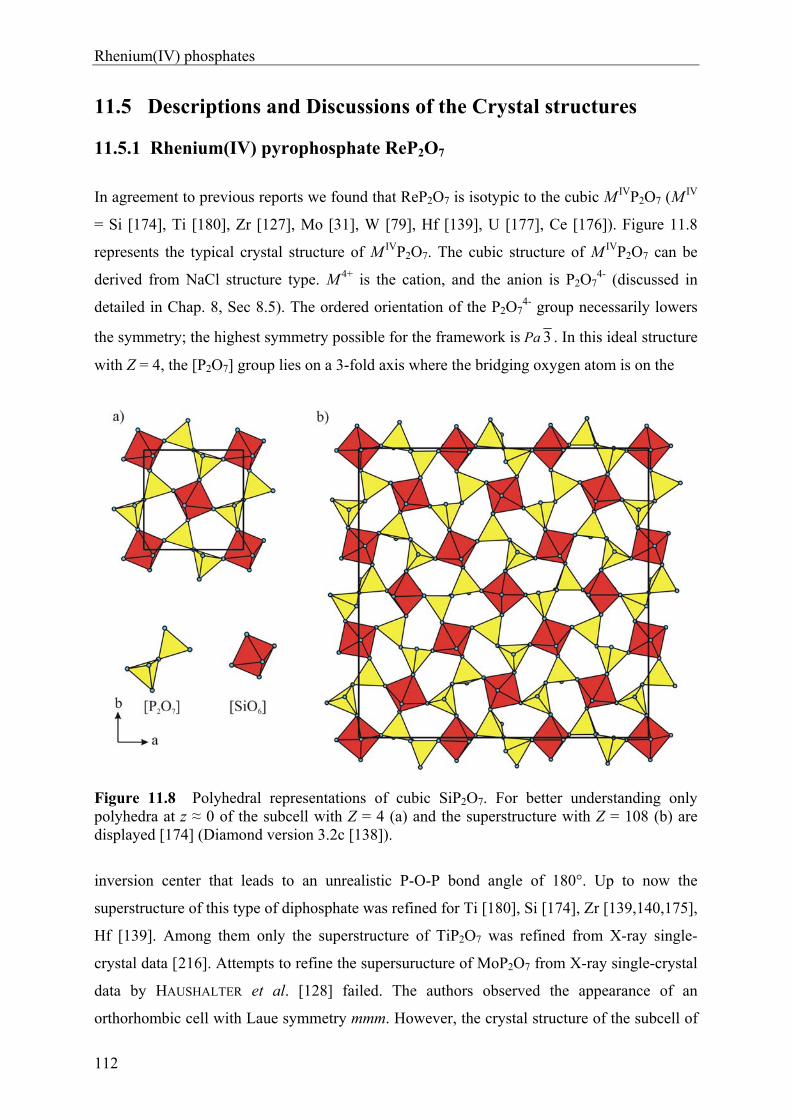
Rhenium(IV) phosphates
112
11.5 Descriptions and Discussions of the Crystal structures
11.5.1 Rhenium(IV) pyrophosphate ReP2O7
In agreement to previous reports we found that ReP2O7 is isotypic to the cubic M IVP2O7 (MIV
= Si [174], Ti [180], Zr [127], Mo [31], W [79], Hf [139], U [177], Ce [176]). Figure 11.8
represents the typical crystal structure of M IVP2O7. The cubic structure of M IVP2O7 can be
derived from NaCl structure type. M 4+ is the cation, and the anion is P2O74- (discussed in
detailed in Chap. 8, Sec 8.5). The ordered orientation of the P2O74- group necessarily lowers
the symmetry; the highest symmetry possible for the framework is Pa 3 . In this ideal structure
with Z = 4, the [P2O7] group lies on a 3-fold axis where the bridging oxygen atom is on the
Figure 11.8 Polyhedral representations of cubic SiP2O7. For better understanding only polyhedra at z ≈ 0 of the subcell with Z = 4 (a) and the superstructure with Z = 108 (b) are displayed [174] (Diamond version 3.2c [138]).
inversion center that leads to an unrealistic P-O-P bond angle of 180°. Up to now the
superstructure of this type of diphosphate was refined for Ti [180], Si [174], Zr [139,140,175],
Hf [139]. Among them only the superstructure of TiP2O7 was refined from X-ray single-
crystal data [216]. Attempts to refine the supersuructure of MoP2O7 from X-ray single-crystal
data by HAUSHALTER et al. [128] failed. The authors observed the appearance of an
orthorhombic cell with Laue symmetry mmm. However, the crystal structure of the subcell of
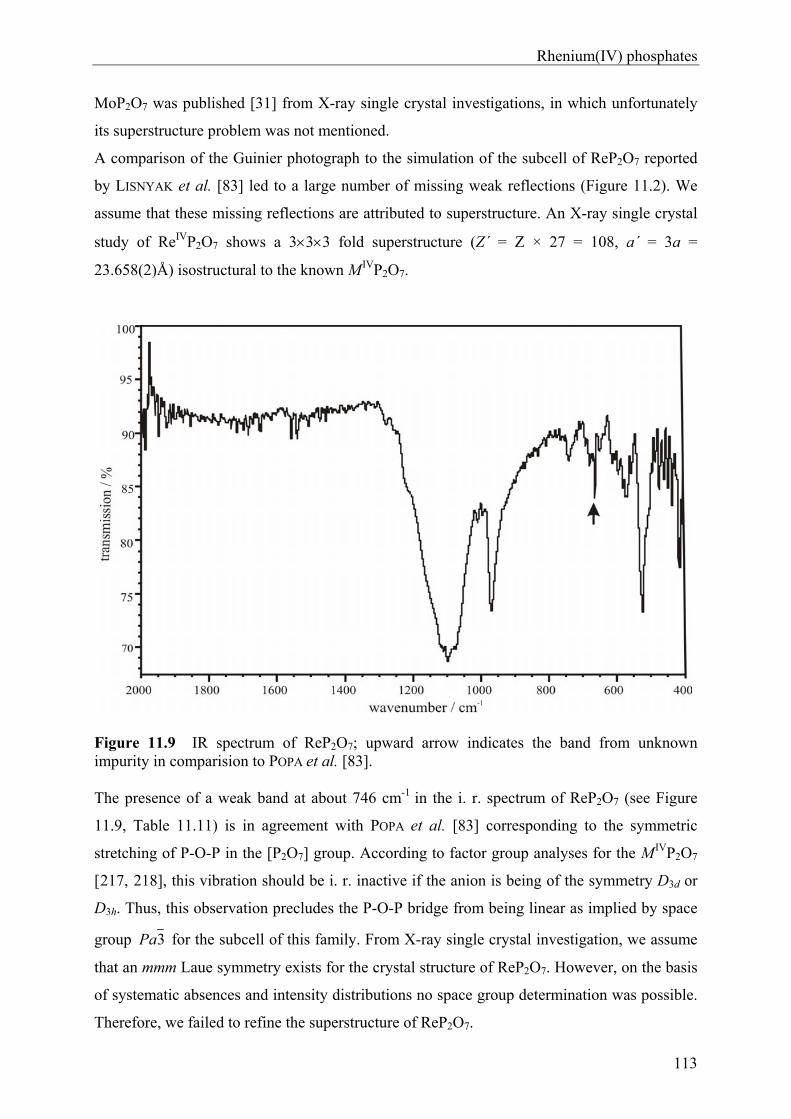
Rhenium(IV) phosphates
113
MoP2O7 was published [31] from X-ray single crystal investigations, in which unfortunately
its superstructure problem was not mentioned.
A comparison of the Guinier photograph to the simulation of the subcell of ReP2O7 reported
by LISNYAK et al. [83] led to a large number of missing weak reflections (Figure 11.2). We
assume that these missing reflections are attributed to superstructure. An X-ray single crystal
study of ReIVP2O7 shows a 333 fold superstructure (Z΄ = Z × 27 = 108, a΄ = 3a =
23.658(2)Å) isostructural to the known M IVP2O7.
Figure 11.9 IR spectrum of ReP2O7; upward arrow indicates the band from unknown impurity in comparision to POPA et al. [83].
The presence of a weak band at about 746 cm-1 in the i. r. spectrum of ReP2O7 (see Figure
11.9, Table 11.11) is in agreement with POPA et al. [83] corresponding to the symmetric
stretching of P-O-P in the [P2O7] group. According to factor group analyses for the M IVP2O7
[217, 218], this vibration should be i. r. inactive if the anion is being of the symmetry D3d or
D3h. Thus, this observation precludes the P-O-P bridge from being linear as implied by space
group 3Pa for the subcell of this family. From X-ray single crystal investigation, we assume
that an mmm Laue symmetry exists for the crystal structure of ReP2O7. However, on the basis
of systematic absences and intensity distributions no space group determination was possible.
Therefore, we failed to refine the superstructure of ReP2O7.
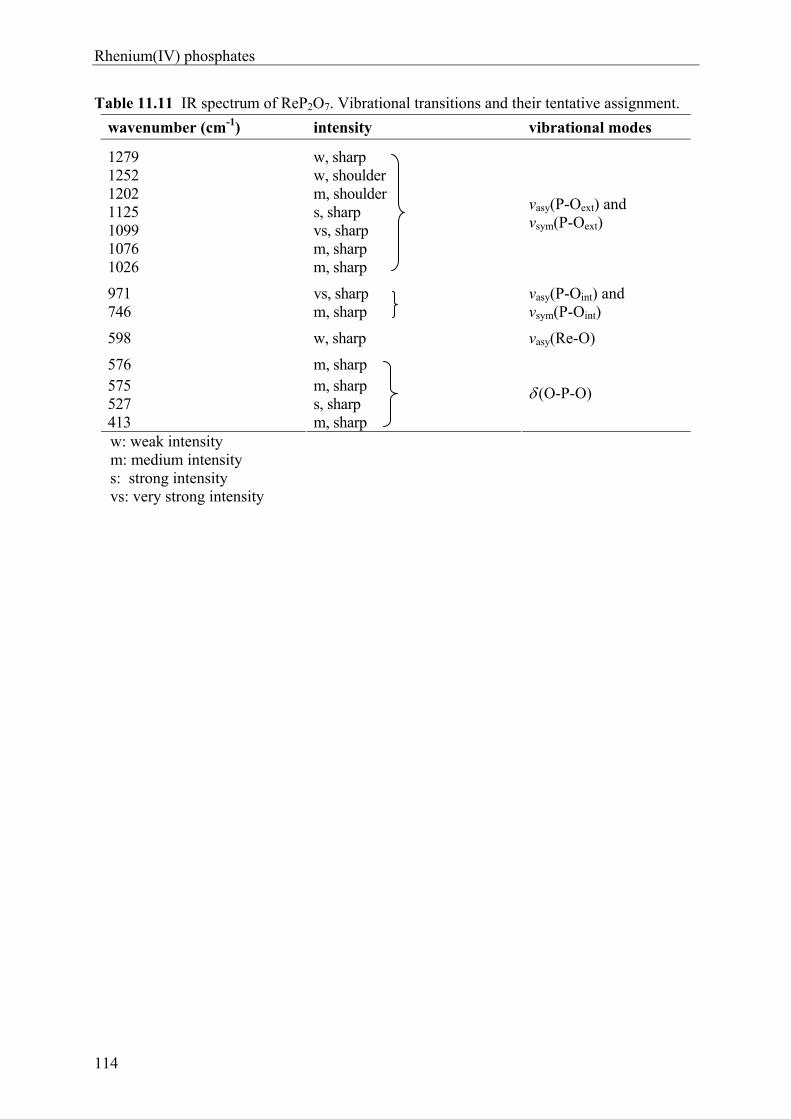
Rhenium(IV) phosphates
114
Table 11.11 IR spectrum of ReP2O7. Vibrational transitions and their tentative assignment.
wavenumber (cm-1) intensity vibrational modes
1279 w, sharp 1252 w, shoulder 1202 m, shoulder 1125 s, sharp 1099 vs, sharp 1076 m, sharp 1026 m, sharp
νasy(P-Oext) and νsym(P-Oext)
971 vs, sharp 746 m, sharp
νasy(P-Oint) and νsym(P-Oint)
598 w, sharp νasy(Re-O)
576 m, sharp 575 m, sharp 527 s, sharp 413 m, sharp
(O-P-O)
w: weak intensity m: medium intensity s: strong intensity vs: very strong intensity
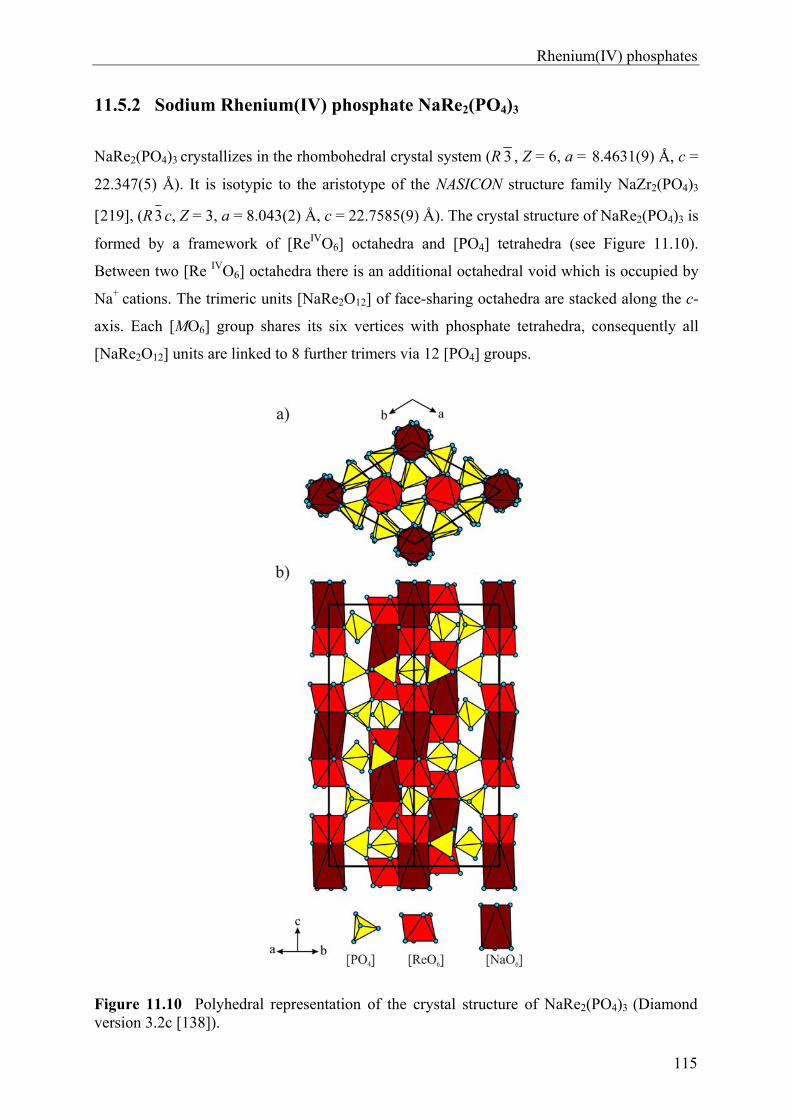
Rhenium(IV) phosphates
115
11.5.2 Sodium Rhenium(IV) phosphate NaRe2(PO4)3
NaRe2(PO4)3 crystallizes in the rhombohedral crystal system (R 3 , Z = 6, a = 8.4631(9) Å, c =
22.347(5) Å). It is isotypic to the aristotype of the NASICON structure family NaZr2(PO4)3
[219], (R3 c, Z = 3, a = 8.043(2) Å, c = 22.7585(9) Å). The crystal structure of NaRe2(PO4)3 is
formed by a framework of [ReIVO6] octahedra and [PO4] tetrahedra (see Figure 11.10).
Between two [Re IVO6] octahedra there is an additional octahedral void which is occupied by
Na+ cations. The trimeric units [NaRe2O12] of face-sharing octahedra are stacked along the c-
axis. Each [MO6] group shares its six vertices with phosphate tetrahedra, consequently all
[NaRe2O12] units are linked to 8 further trimers via 12 [PO4] groups.
Figure 11.10 Polyhedral representation of the crystal structure of NaRe2(PO4)3 (Diamond version 3.2c [138]).
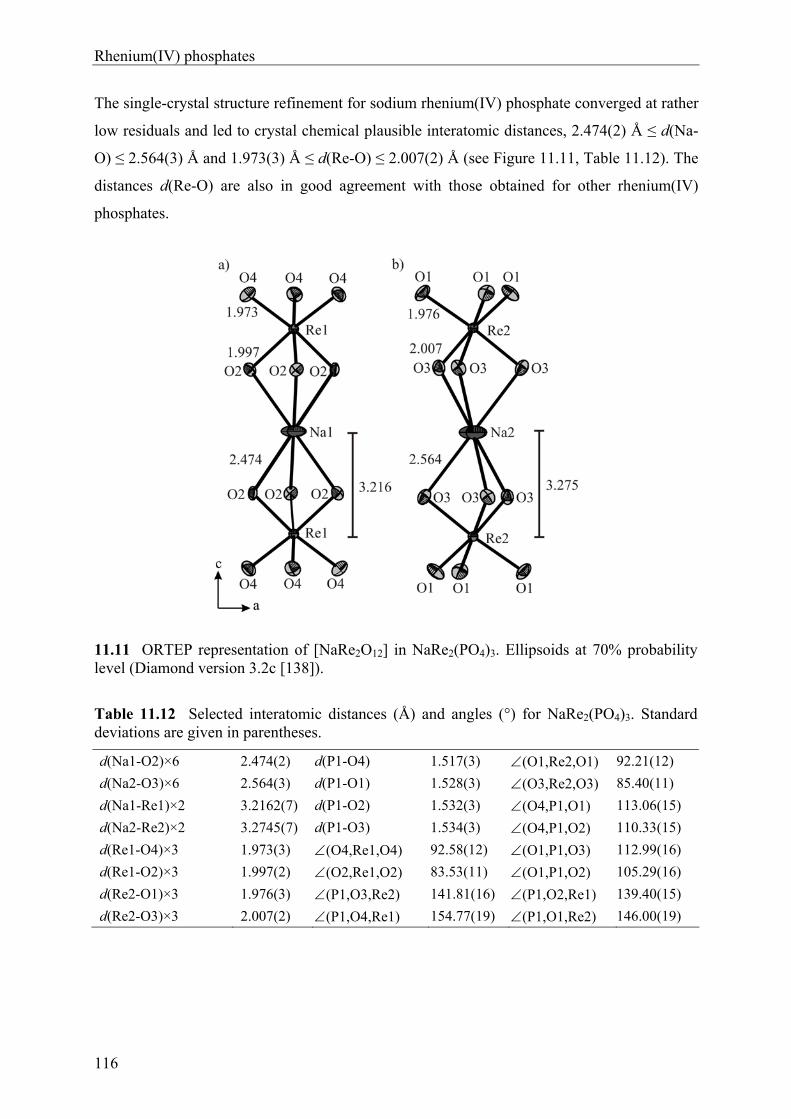
Rhenium(IV) phosphates
116
The single-crystal structure refinement for sodium rhenium(IV) phosphate converged at rather
low residuals and led to crystal chemical plausible interatomic distances, 2.474(2) Å ≤ d(Na-
O) ≤ 2.564(3) Å and 1.973(3) Å ≤ d(Re-O) ≤ 2.007(2) Å (see Figure 11.11, Table 11.12). The
distances d(Re-O) are also in good agreement with those obtained for other rhenium(IV)
phosphates.
11.11 ORTEP representation of [NaRe2O12] in NaRe2(PO4)3. Ellipsoids at 70% probability level (Diamond version 3.2c [138]).
Table 11.12 Selected interatomic distances (Å) and angles (°) for NaRe2(PO4)3. Standard deviations are given in parentheses.
d(Na1-O2)×6 2.474(2) d(P1-O4) 1.517(3) (O1,Re2,O1) 92.21(12)
d(Na2-O3)×6 2.564(3) d(P1-O1) 1.528(3) (O3,Re2,O3) 85.40(11)
d(Na1-Re1)×2 3.2162(7) d(P1-O2) 1.532(3) (O4,P1,O1) 113.06(15)
d(Na2-Re2)×2 3.2745(7) d(P1-O3) 1.534(3) (O4,P1,O2) 110.33(15)
d(Re1-O4)×3 1.973(3) (O4,Re1,O4) 92.58(12) (O1,P1,O3) 112.99(16)
d(Re1-O2)×3 1.997(2) (O2,Re1,O2) 83.53(11) (O1,P1,O2) 105.29(16)
d(Re2-O1)×3 1.976(3) (P1,O3,Re2) 141.81(16) (P1,O2,Re1) 139.40(15)
d(Re2-O3)×3 2.007(2) (P1,O4,Re1) 154.77(19) (P1,O1,Re2) 146.00(19)
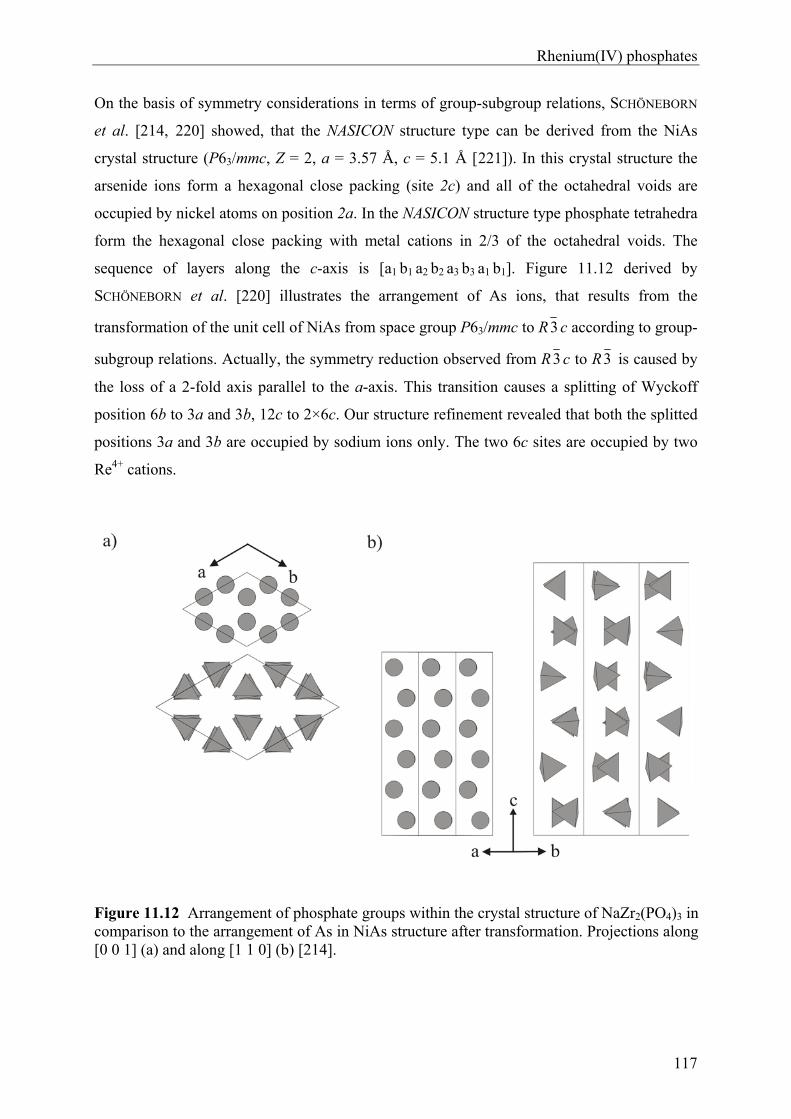
Rhenium(IV) phosphates
117
On the basis of symmetry considerations in terms of group-subgroup relations, SCHÖNEBORN
et al. [214, 220] showed, that the NASICON structure type can be derived from the NiAs
crystal structure (P63/mmc, Z = 2, a = 3.57 Å, c = 5.1 Å [221]). In this crystal structure the
arsenide ions form a hexagonal close packing (site 2c) and all of the octahedral voids are
occupied by nickel atoms on position 2a. In the NASICON structure type phosphate tetrahedra
form the hexagonal close packing with metal cations in 2/3 of the octahedral voids. The
sequence of layers along the c-axis is [a1 b1 a2 b2 a3 b3 a1 b1]. Figure 11.12 derived by
SCHÖNEBORN et al. [220] illustrates the arrangement of As ions, that results from the
transformation of the unit cell of NiAs from space group P63/mmc to R3 c according to group-
subgroup relations. Actually, the symmetry reduction observed from R3 c to R3 is caused by
the loss of a 2-fold axis parallel to the a-axis. This transition causes a splitting of Wyckoff
position 6b to 3a and 3b, 12c to 2×6c. Our structure refinement revealed that both the splitted
positions 3a and 3b are occupied by sodium ions only. The two 6c sites are occupied by two
Re4+ cations.
Figure 11.12 Arrangement of phosphate groups within the crystal structure of NaZr2(PO4)3 in comparison to the arrangement of As in NiAs structure after transformation. Projections along [0 0 1] (a) and along [1 1 0] (b) [214].
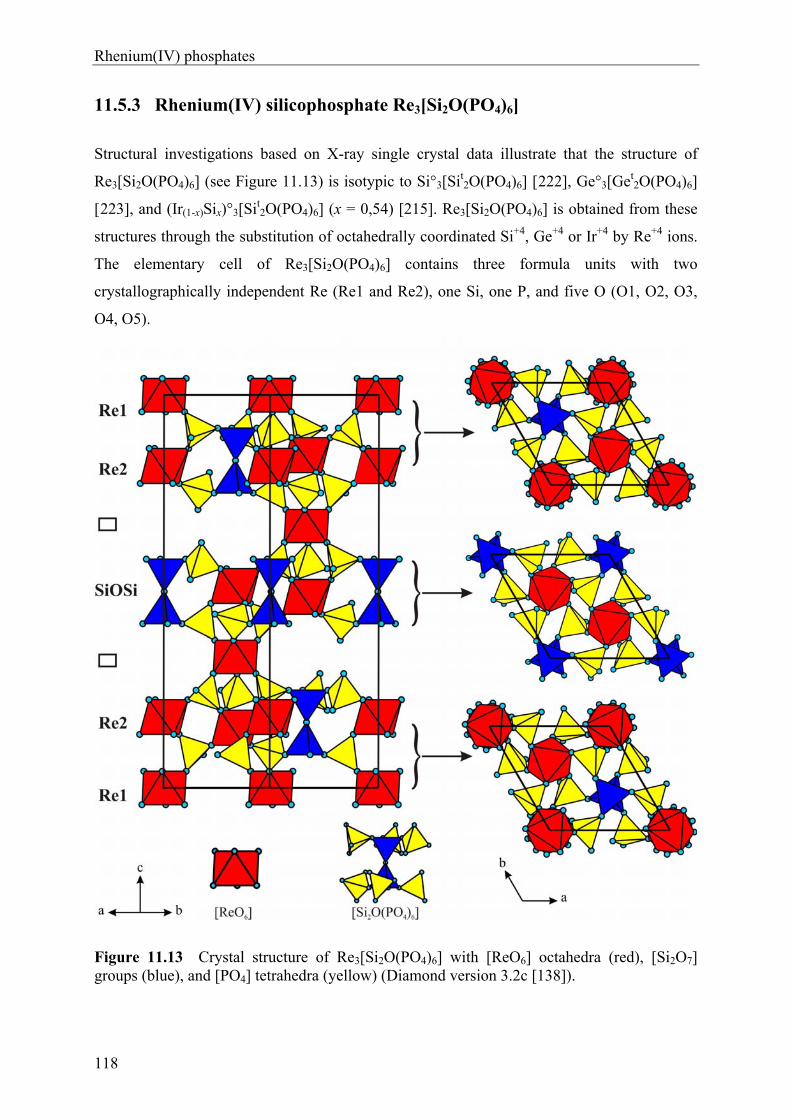
Rhenium(IV) phosphates
118
11.5.3 Rhenium(IV) silicophosphate Re3[Si2O(PO4)6]
Structural investigations based on X-ray single crystal data illustrate that the structure of
Re3[Si2O(PO4)6] (see Figure 11.13) is isotypic to Si°3[Sit2O(PO4)6] [222], Ge°3[Get
2O(PO4)6]
[223], and (Ir(1-x)Six)°3[Sit2O(PO4)6] (x = 0,54) [215]. Re3[Si2O(PO4)6] is obtained from these
structures through the substitution of octahedrally coordinated Si+4, Ge+4 or Ir+4 by Re+4 ions.
The elementary cell of Re3[Si2O(PO4)6] contains three formula units with two
crystallographically independent Re (Re1 and Re2), one Si, one P, and five O (O1, O2, O3,
O4, O5).
Figure 11.13 Crystal structure of Re3[Si2O(PO4)6] with [ReO6] octahedra (red), [Si2O7] groups (blue), and [PO4] tetrahedra (yellow) (Diamond version 3.2c [138]).
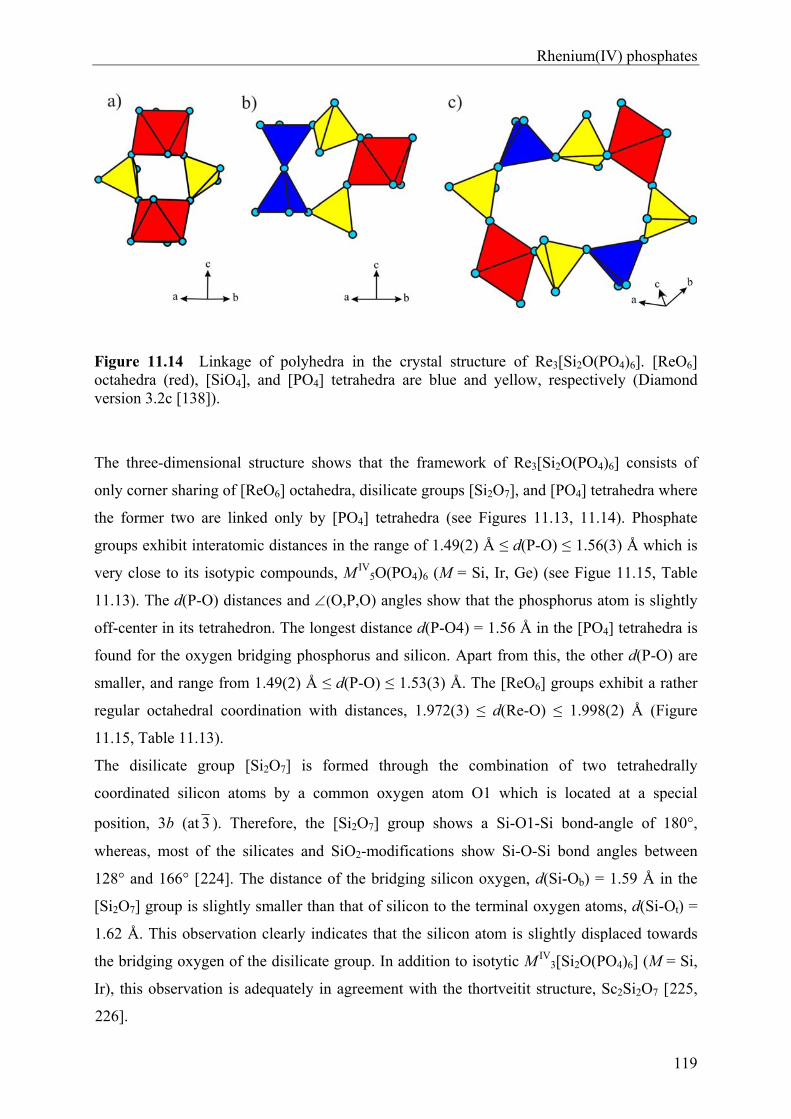
Rhenium(IV) phosphates
119
Figure 11.14 Linkage of polyhedra in the crystal structure of Re3[Si2O(PO4)6]. [ReO6] octahedra (red), [SiO4], and [PO4] tetrahedra are blue and yellow, respectively (Diamond version 3.2c [138]).
The three-dimensional structure shows that the framework of Re3[Si2O(PO4)6] consists of
only corner sharing of [ReO6] octahedra, disilicate groups [Si2O7], and [PO4] tetrahedra where
the former two are linked only by [PO4] tetrahedra (see Figures 11.13, 11.14). Phosphate
groups exhibit interatomic distances in the range of 1.49(2) Å ≤ d(P-O) ≤ 1.56(3) Å which is
very close to its isotypic compounds, M IV5O(PO4)6 (M = Si, Ir, Ge) (see Figue 11.15, Table
11.13). The d(P-O) distances and (O,P,O) angles show that the phosphorus atom is slightly
off-center in its tetrahedron. The longest distance d(P-O4) = 1.56 Å in the [PO4] tetrahedra is
found for the oxygen bridging phosphorus and silicon. Apart from this, the other d(P-O) are
smaller, and range from 1.49(2) Å ≤ d(P-O) ≤ 1.53(3) Å. The [ReO6] groups exhibit a rather
regular octahedral coordination with distances, 1.972(3) ≤ d(Re-O) ≤ 1.998(2) Å (Figure
11.15, Table 11.13).
The disilicate group [Si2O7] is formed through the combination of two tetrahedrally
coordinated silicon atoms by a common oxygen atom O1 which is located at a special
position, 3b (at 3 ). Therefore, the [Si2O7] group shows a Si-O1-Si bond-angle of 180°,
whereas, most of the silicates and SiO2-modifications show Si-O-Si bond angles between
128° and 166° [224]. The distance of the bridging silicon oxygen, d(Si-Ob) = 1.59 Å in the
[Si2O7] group is slightly smaller than that of silicon to the terminal oxygen atoms, d(Si-Ot) =
1.62 Å. This observation clearly indicates that the silicon atom is slightly displaced towards
the bridging oxygen of the disilicate group. In addition to isotytic M IV3[Si2O(PO4)6] (M = Si,
Ir), this observation is adequately in agreement with the thortveitit structure, Sc2Si2O7 [225,
226].
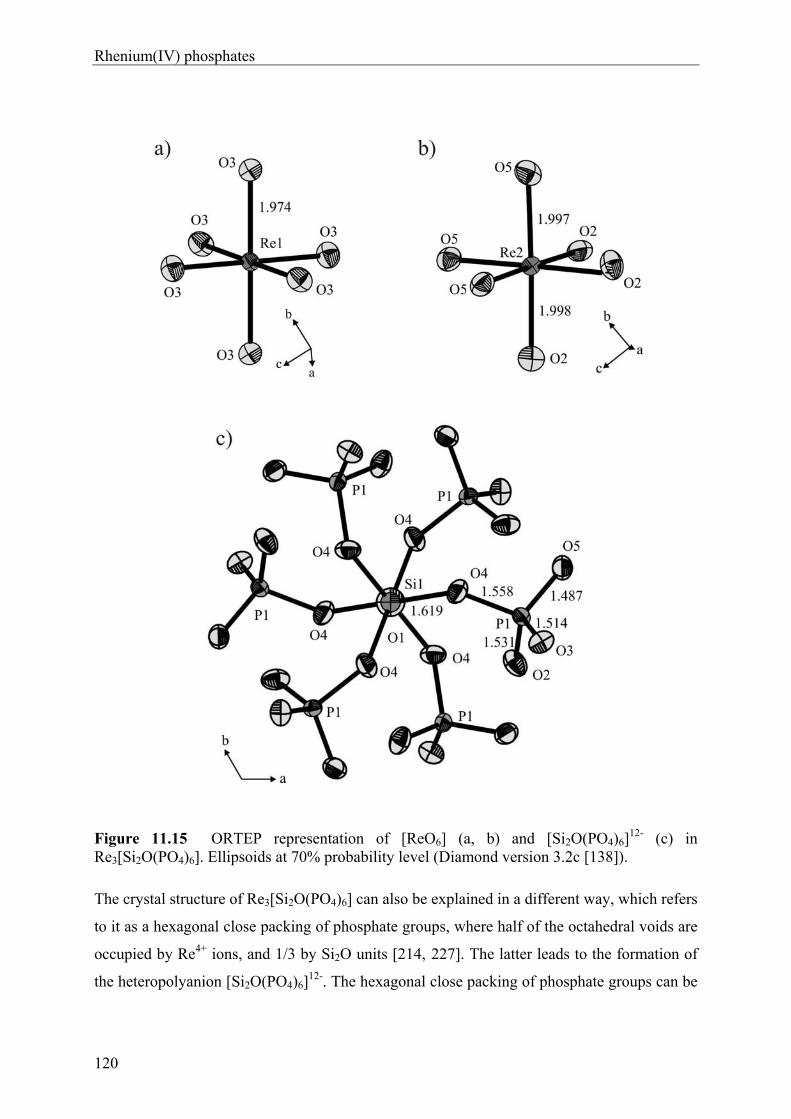
Rhenium(IV) phosphates
120
Figure 11.15 ORTEP representation of [ReO6] (a, b) and [Si2O(PO4)6]
12- (c) in Re3[Si2O(PO4)6]. Ellipsoids at 70% probability level (Diamond version 3.2c [138]).
The crystal structure of Re3[Si2O(PO4)6] can also be explained in a different way, which refers
to it as a hexagonal close packing of phosphate groups, where half of the octahedral voids are
occupied by Re4+ ions, and 1/3 by Si2O units [214, 227]. The latter leads to the formation of
the heteropolyanion [Si2O(PO4)6]12-. The hexagonal close packing of phosphate groups can be
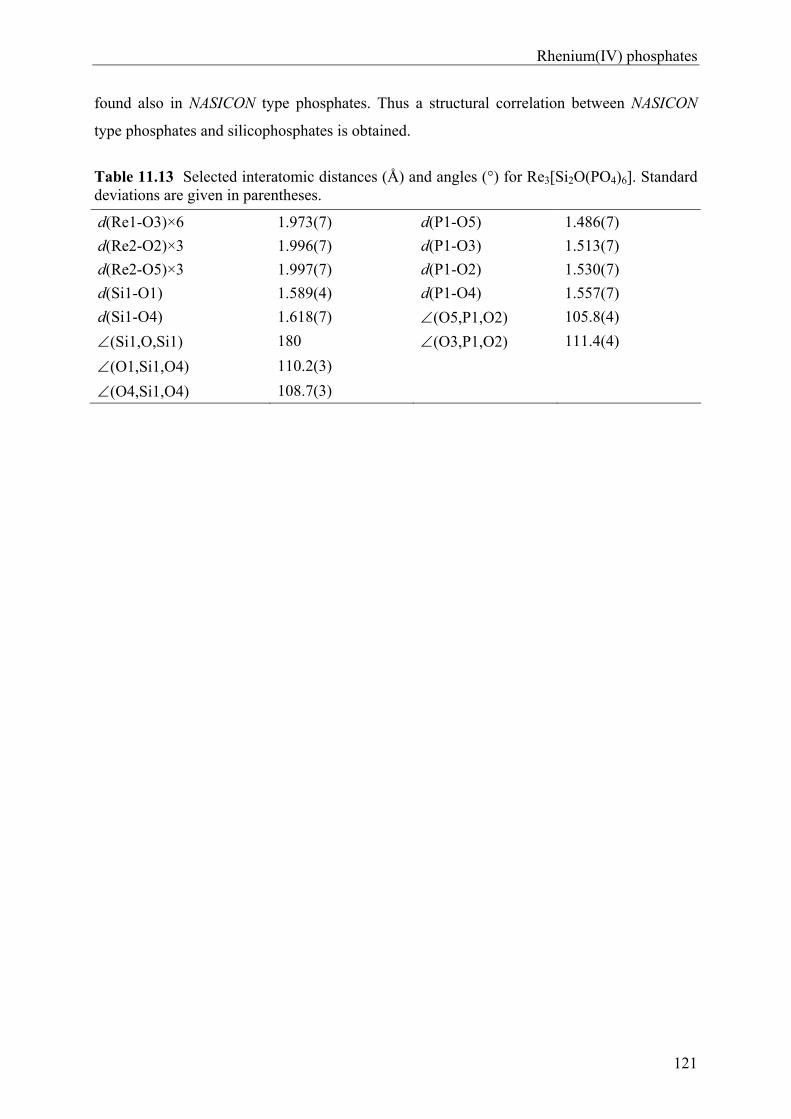
Rhenium(IV) phosphates
121
found also in NASICON type phosphates. Thus a structural correlation between NASICON
type phosphates and silicophosphates is obtained.
Table 11.13 Selected interatomic distances (Å) and angles (°) for Re3[Si2O(PO4)6]. Standard deviations are given in parentheses.
d(Re1-O3)×6 1.973(7) d(P1-O5) 1.486(7)
d(Re2-O2)×3 1.996(7) d(P1-O3) 1.513(7)
d(Re2-O5)×3 1.997(7) d(P1-O2) 1.530(7)
d(Si1-O1) 1.589(4) d(P1-O4) 1.557(7)
d(Si1-O4) 1.618(7) (O5,P1,O2) 105.8(4)
(Si1,O,Si1) 180 (O3,P1,O2) 111.4(4)
(O1,Si1,O4) 110.2(3)
(O4,Si1,O4) 108.7(3)
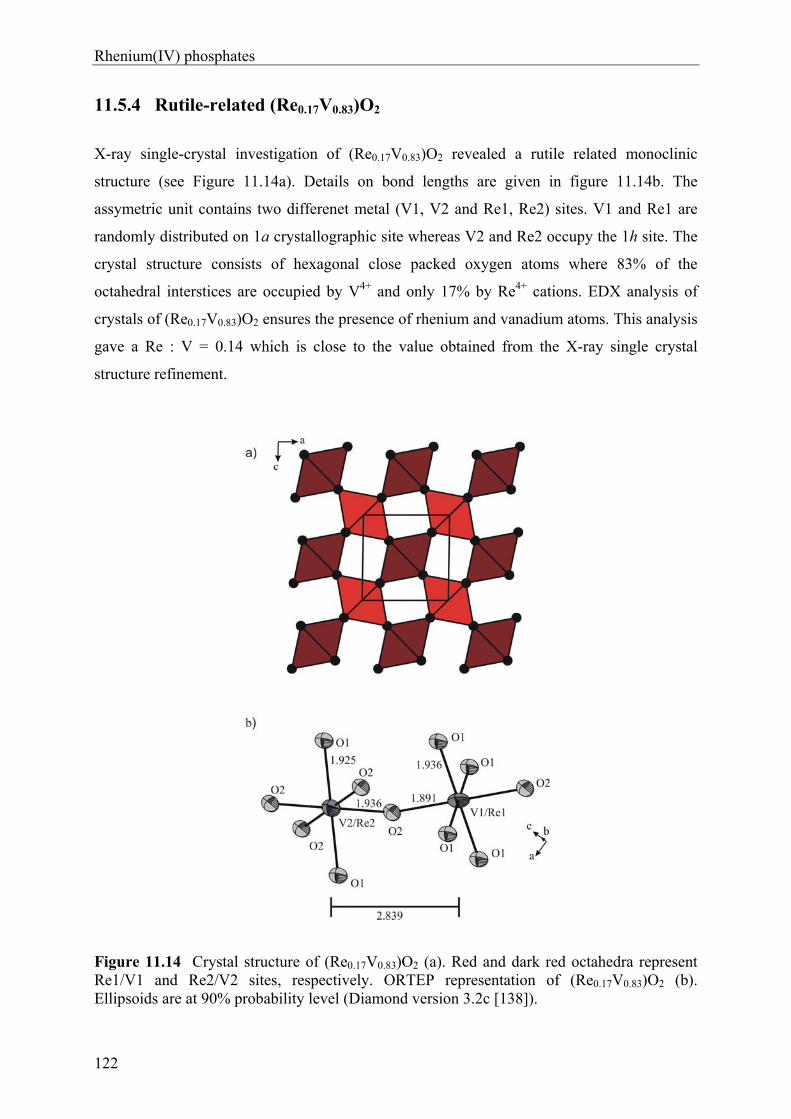
Rhenium(IV) phosphates
122
11.5.4 Rutile-related (Re0.17V0.83)O2
X-ray single-crystal investigation of (Re0.17V0.83)O2 revealed a rutile related monoclinic
structure (see Figure 11.14a). Details on bond lengths are given in figure 11.14b. The
assymetric unit contains two differenet metal (V1, V2 and Re1, Re2) sites. V1 and Re1 are
randomly distributed on 1a crystallographic site whereas V2 and Re2 occupy the 1h site. The
crystal structure consists of hexagonal close packed oxygen atoms where 83% of the
octahedral interstices are occupied by V4+ and only 17% by Re4+ cations. EDX analysis of
crystals of (Re0.17V0.83)O2 ensures the presence of rhenium and vanadium atoms. This analysis
gave a Re : V = 0.14 which is close to the value obtained from the X-ray single crystal
structure refinement.
Figure 11.14 Crystal structure of (Re0.17V0.83)O2 (a). Red and dark red octahedra represent Re1/V1 and Re2/V2 sites, respectively. ORTEP representation of (Re0.17V0.83)O2 (b). Ellipsoids are at 90% probability level (Diamond version 3.2c [138]).
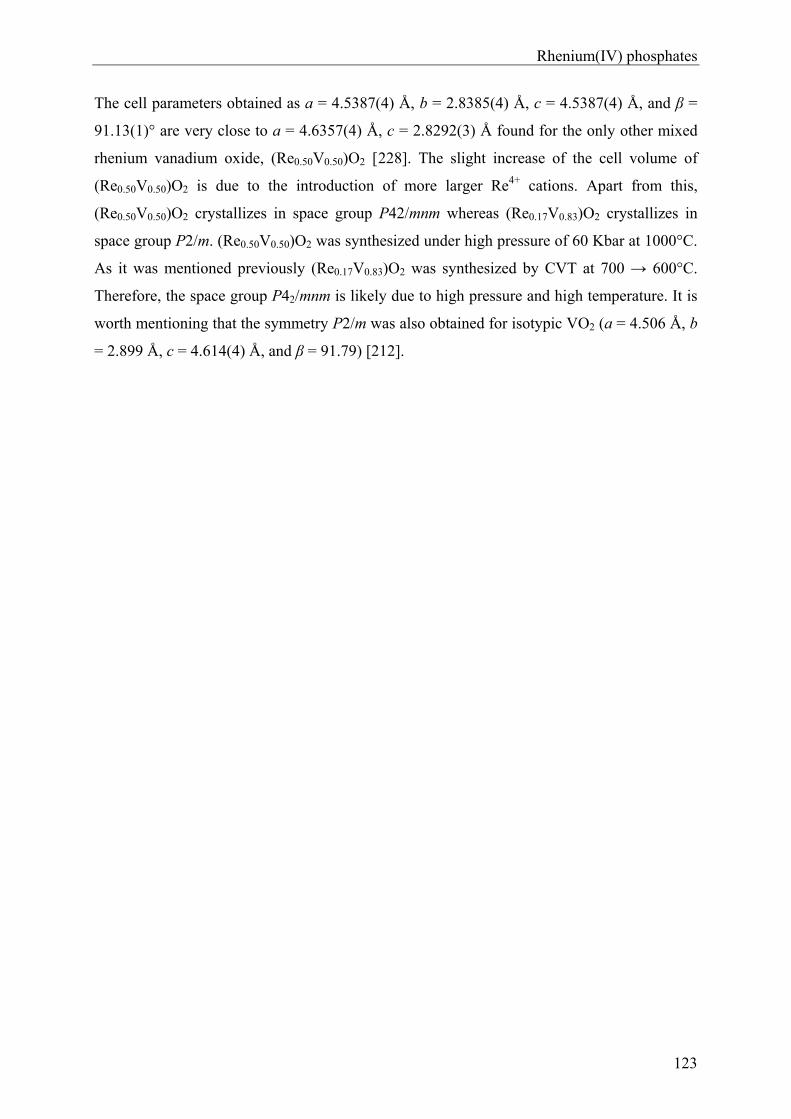
Rhenium(IV) phosphates
123
The cell parameters obtained as a = 4.5387(4) Å, b = 2.8385(4) Å, c = 4.5387(4) Å, and β =
91.13(1)° are very close to a = 4.6357(4) Å, c = 2.8292(3) Å found for the only other mixed
rhenium vanadium oxide, (Re0.50V0.50)O2 [228]. The slight increase of the cell volume of
(Re0.50V0.50)O2 is due to the introduction of more larger Re4+ cations. Apart from this,
(Re0.50V0.50)O2 crystallizes in space group P42/mnm whereas (Re0.17V0.83)O2 crystallizes in
space group P2/m. (Re0.50V0.50)O2 was synthesized under high pressure of 60 Kbar at 1000°C.
As it was mentioned previously (Re0.17V0.83)O2 was synthesized by CVT at 700 → 600°C.
Therefore, the space group P42/mnm is likely due to high pressure and high temperature. It is
worth mentioning that the symmetry P2/m was also obtained for isotypic VO2 (a = 4.506 Å, b
= 2.899 Å, c = 4.614(4) Å, and β = 91.79) [212].
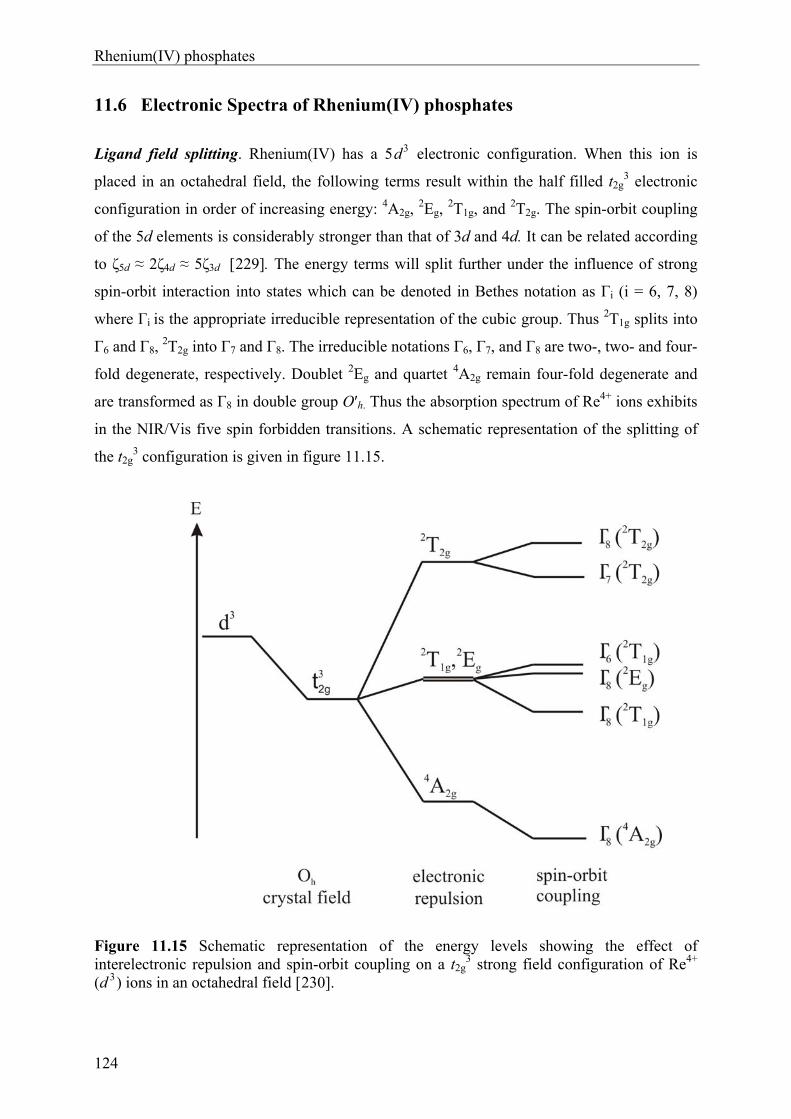
Rhenium(IV) phosphates
124
11.6 Electronic Spectra of Rhenium(IV) phosphates
Ligand field splitting. Rhenium(IV) has a 5d3 electronic configuration. When this ion is
placed in an octahedral field, the following terms result within the half filled t2g3 electronic
configuration in order of increasing energy: 4A2g, 2Eg,
2T1g, and 2T2g. The spin-orbit coupling
of the 5d elements is considerably stronger than that of 3d and 4d. It can be related according
to ζ5d ≈ 2ζ4d ≈ 5ζ3d [229]. The energy terms will split further under the influence of strong
spin-orbit interaction into states which can be denoted in Bethes notation as Γi (i = 6, 7, 8)
where Γi is the appropriate irreducible representation of the cubic group. Thus 2T1g splits into
Γ6 and Γ8, 2T2g into Γ7 and Γ8. The irreducible notations Γ6, Γ7, and Γ8 are two-, two- and four-
fold degenerate, respectively. Doublet 2Eg and quartet 4A2g remain four-fold degenerate and
are transformed as Γ8 in double group O′h. Thus the absorption spectrum of Re4+ ions exhibits
in the NIR/Vis five spin forbidden transitions. A schematic representation of the splitting of
the t2g3 configuration is given in figure 11.15.
Figure 11.15 Schematic representation of the energy levels showing the effect of interelectronic repulsion and spin-orbit coupling on a t2g
3 strong field configuration of Re4+
(d 3) ions in an octahedral field [230].
Rhenium(IV) phosphates
125
Angular overlap modelling parameters. To get an intricate knowledge for the correlation
between radial and angular distortion of the chromophores and their d-electron energies,
calculations within the framework of the angular overlap model (AOM) [231, 232, 233] were
performed. A big advantage of this model is its ability to use the chromophores with their
actual geometric structures derived from the crystal structure analysis. Instead of using global
parameters, like 10Dq or ∆, one σ- and two π-interactions (a total of 18 bonding parameters
for an octahedral complex) of each ligand with the five d-orbitals of the central ion are used
for the fitting between calculated and observed transition energies. The decomposition of the
global ligand-field parameter (10Dq or ∆) allows, in particular, for symmetry effects due to
the second-sphere ligand-field, e.g. the competition between the central ion and neighboring
cations for the p-electrons of bridging oxygen atoms, to be taken into account. In order to
reduce the number of independent bonding parameters, relations between some of the
parameters were introduced. Thus, for the energy eσ (Re-O), proportionality to the distance
d(Re-O)-5.0 was assumed [234]. The energy eπ was set to one-quarter of the corresponding
energy eσ in the case of an “undisturbed” π-interaction, [233]. Thus, for oxygen atoms with a
coordination number (CN) of 2, eπ,x and eπ,y are equal. In the simplest case, these relations
reduce the 18 interaction energies to only one independent parameter, which is recommended
to be eσ,max(Re-O) for the shortest d(Re-O).
Interelectronic repulsion is introduced into the AOM calculations via the Racah parameters B
and C (cm-1), and spin-orbit coupling is introduced by ζ (cm-1).
Chromophore geometry. While the crystal structures of ReP2O7 and Re3[Si2O(PO4)6] contain
isolated [ReO6] octahedra, NaReIV2(PO4)3 contains a trimetric unit [NaRe2O12] (see Figure
11.10) of three face sharing octahedra.
In Re3[Si2O(PO4)6] two crystallographically independent isolated [ReIVO6] (Figure 11.13)
octahedra are found. As described previously, Re1 occupies the point symmetry 3 , while the
other at 3. The angular distortion of each of these units is less than 2° with respect to the ideal
octahedra. The radial distortion, ∆d(Re2-O) = 0.001 Å (difference between the longest and
shortest Re2-O distances) is also fairly small. All oxygen ligands have a coordination number
of 2 (one Re4+ and one P5+).
In the crystal structure of NaReIV2(PO4)3, two crystallographically independent [ReO6]
octahedra are found. The angular distortion of the [Re1O6] unit is less than 7° with respect to
the ideal octahedron while the radial distortion is ∆d(Re1-O) = 0.024 Å. Whereas, the angular
and radial distortions of [Re2O6] octahedra is ∆d(Re2-O) of about 5° and 0.031 Å,
respectively. For the both cases the distortions are rather small. One half of the oxygen
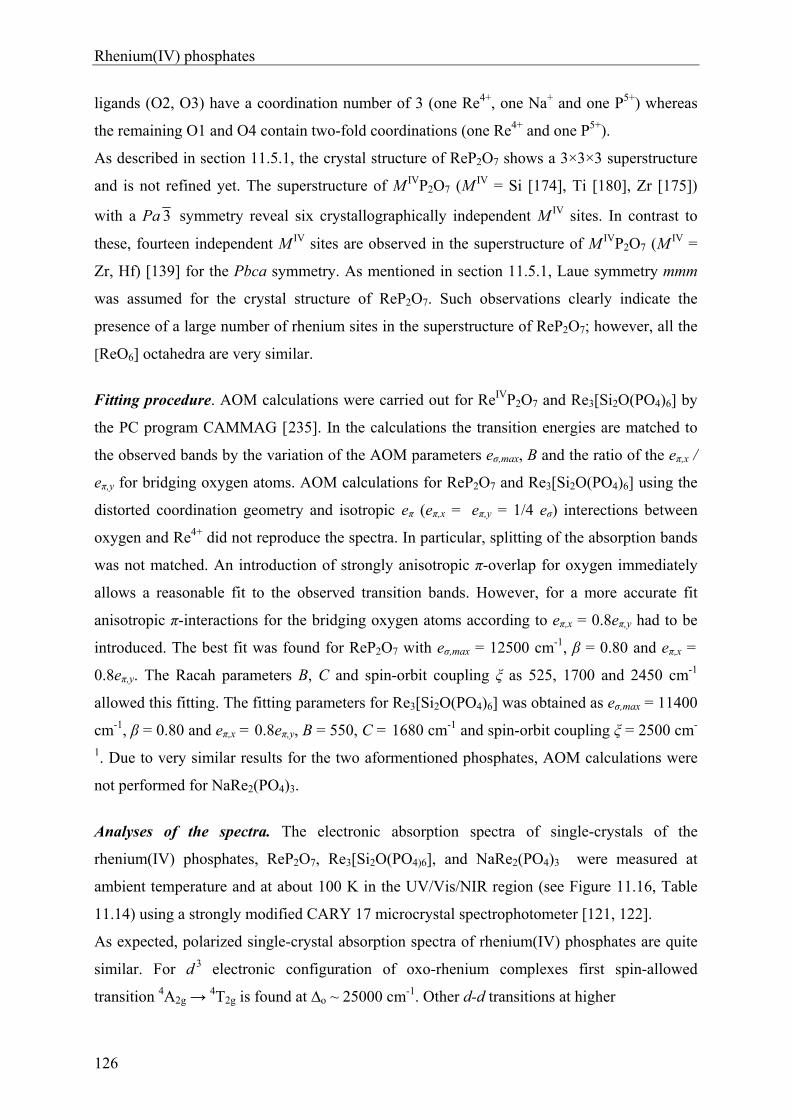
Rhenium(IV) phosphates
126
ligands (O2, O3) have a coordination number of 3 (one Re4+, one Na+ and one P5+) whereas
the remaining O1 and O4 contain two-fold coordinations (one Re4+ and one P5+).
As described in section 11.5.1, the crystal structure of ReP2O7 shows a 3×3×3 superstructure
and is not refined yet. The superstructure of M IVP2O7 (MIV = Si [174], Ti [180], Zr [175])
with a Pa 3 symmetry reveal six crystallographically independent M IV sites. In contrast to
these, fourteen independent M IV sites are observed in the superstructure of M IVP2O7 (MIV =
Zr, Hf) [139] for the Pbca symmetry. As mentioned in section 11.5.1, Laue symmetry mmm
was assumed for the crystal structure of ReP2O7. Such observations clearly indicate the
presence of a large number of rhenium sites in the superstructure of ReP2O7; however, all the
[ReO6] octahedra are very similar.
Fitting procedure. AOM calculations were carried out for ReIVP2O7 and Re3[Si2O(PO4)6] by
the PC program CAMMAG [235]. In the calculations the transition energies are matched to
the observed bands by the variation of the AOM parameters eσ,max, B and the ratio of the eπ,x /
eπ,y for bridging oxygen atoms. AOM calculations for ReP2O7 and Re3[Si2O(PO4)6] using the
distorted coordination geometry and isotropic eπ (eπ,x = eπ,y = 1/4 eσ) interections between
oxygen and Re4+ did not reproduce the spectra. In particular, splitting of the absorption bands
was not matched. An introduction of strongly anisotropic π-overlap for oxygen immediately
allows a reasonable fit to the observed transition bands. However, for a more accurate fit
anisotropic π-interactions for the bridging oxygen atoms according to eπ,x = 0.8eπ,y had to be
introduced. The best fit was found for ReP2O7 with eσ,max = 12500 cm-1, β = 0.80 and eπ,x =
0.8eπ,y. The Racah parameters B, C and spin-orbit coupling ξ as 525, 1700 and 2450 cm-1
allowed this fitting. The fitting parameters for Re3[Si2O(PO4)6] was obtained as eσ,max = 11400
cm-1, β = 0.80 and eπ,x = 0.8eπ,y, B = 550, C = 1680 cm-1 and spin-orbit coupling ξ = 2500 cm-
1. Due to very similar results for the two aformentioned phosphates, AOM calculations were
not performed for NaRe2(PO4)3.
Analyses of the spectra. The electronic absorption spectra of single-crystals of the
rhenium(IV) phosphates, ReP2O7, Re3[Si2O(PO4)6], and NaRe2(PO4)3 were measured at
ambient temperature and at about 100 K in the UV/Vis/NIR region (see Figure 11.16, Table
11.14) using a strongly modified CARY 17 microcrystal spectrophotometer [121, 122].
As expected, polarized single-crystal absorption spectra of rhenium(IV) phosphates are quite
similar. For d 3 electronic configuration of oxo-rhenium complexes first spin-allowed
transition 4A2g → 4T2g is found at ∆o ~ 25000 cm-1. Other d-d transitions at higher
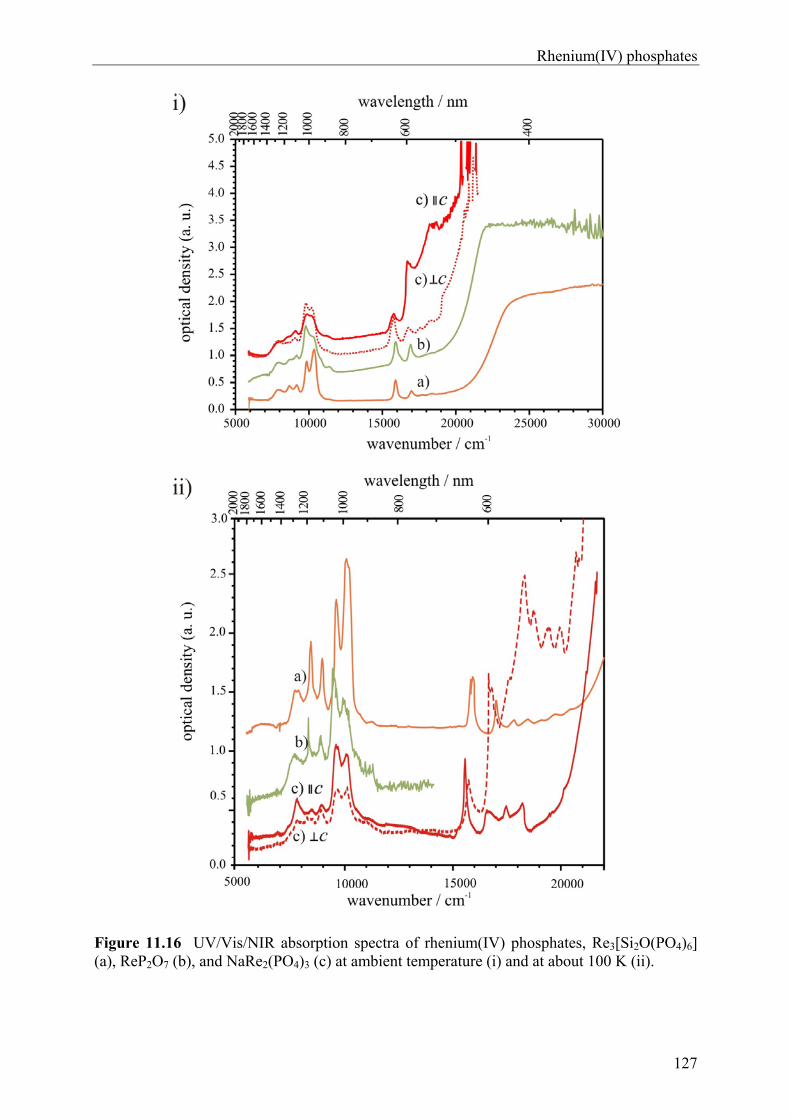
Rhenium(IV) phosphates
127
Figure 11.16 UV/Vis/NIR absorption spectra of rhenium(IV) phosphates, Re3[Si2O(PO4)6] (a), ReP2O7 (b), and NaRe2(PO4)3 (c) at ambient temperature (i) and at about 100 K (ii).
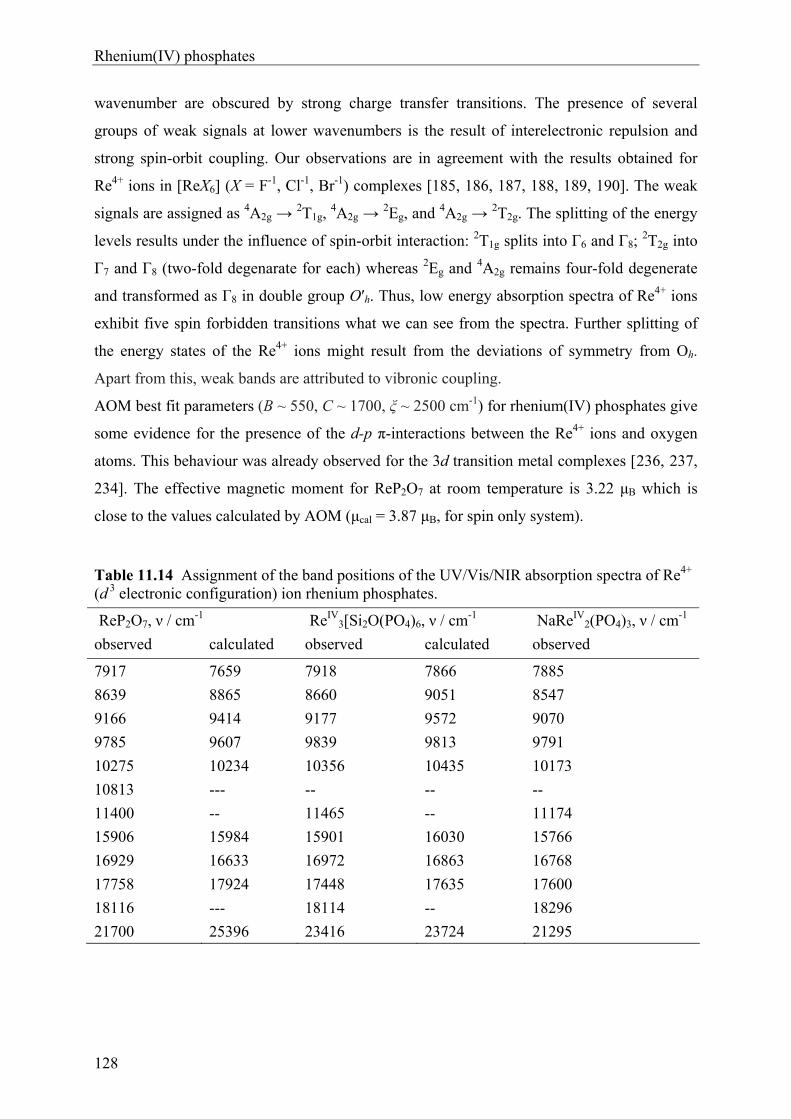
Rhenium(IV) phosphates
128
wavenumber are obscured by strong charge transfer transitions. The presence of several
groups of weak signals at lower wavenumbers is the result of interelectronic repulsion and
strong spin-orbit coupling. Our observations are in agreement with the results obtained for
Re4+ ions in [ReX6] (X = F-1, Cl-1, Br-1) complexes [185, 186, 187, 188, 189, 190]. The weak
signals are assigned as 4A2g → 2T1g, 4A2g → 2Eg, and 4A2g → 2T2g. The splitting of the energy
levels results under the influence of spin-orbit interaction: 2T1g splits into Γ6 and Γ8; 2T2g into
Γ7 and Γ8 (two-fold degenarate for each) whereas 2Eg and 4A2g remains four-fold degenerate
and transformed as Γ8 in double group O′h. Thus, low energy absorption spectra of Re4+ ions
exhibit five spin forbidden transitions what we can see from the spectra. Further splitting of
the energy states of the Re4+ ions might result from the deviations of symmetry from Oh.
Apart from this, weak bands are attributed to vibronic coupling.
AOM best fit parameters (B ~ 550, C ~ 1700, ξ ~ 2500 cm-1) for rhenium(IV) phosphates give
some evidence for the presence of the d-p π-interactions between the Re4+ ions and oxygen
atoms. This behaviour was already observed for the 3d transition metal complexes [236, 237,
234]. The effective magnetic moment for ReP2O7 at room temperature is 3.22 μB which is
close to the values calculated by AOM (μcal = 3.87 μB, for spin only system).
Table 11.14 Assignment of the band positions of the UV/Vis/NIR absorption spectra of Re4+ (d 3 electronic configuration) ion rhenium phosphates.
ReP2O7, ν / cm-1 ReIV3[Si2O(PO4)6, ν / cm-1 NaReIV
2(PO4)3, ν / cm-1
observed calculated observed calculated observed
7917 7659 7918 7866 7885
8639 8865 8660 9051 8547
9166 9414 9177 9572 9070
9785 9607 9839 9813 9791
10275 10234 10356 10435 10173
10813 --- -- -- --
11400 -- 11465 -- 11174
15906 15984 15901 16030 15766
16929 16633 16972 16863 16768
17758 17924 17448 17635 17600
18116 --- 18114 -- 18296
21700 25396 23416 23724 21295
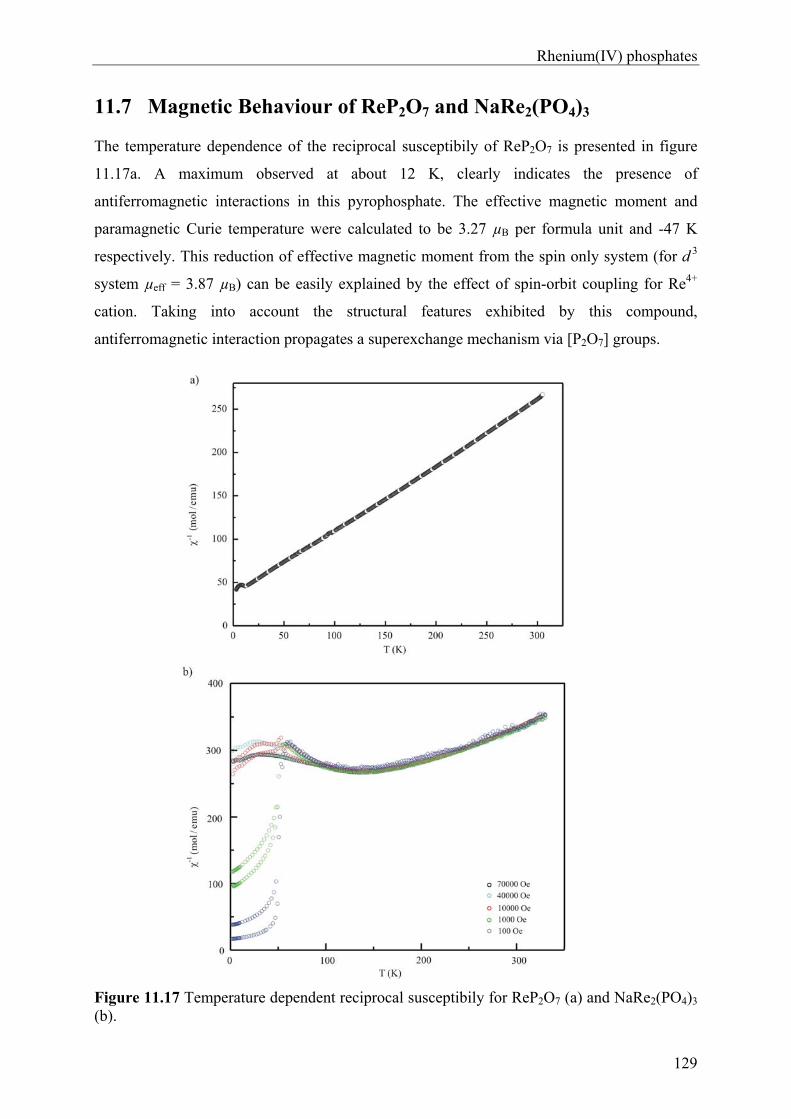
Rhenium(IV) phosphates
129
11.7 Magnetic Behaviour of ReP2O7 and NaRe2(PO4)3
The temperature dependence of the reciprocal susceptibily of ReP2O7 is presented in figure
11.17a. A maximum observed at about 12 K, clearly indicates the presence of
antiferromagnetic interactions in this pyrophosphate. The effective magnetic moment and
paramagnetic Curie temperature were calculated to be 3.27 µB per formula unit and -47 K
respectively. This reduction of effective magnetic moment from the spin only system (for d 3
system µeff = 3.87 µB) can be easily explained by the effect of spin-orbit coupling for Re4+
cation. Taking into account the structural features exhibited by this compound,
antiferromagnetic interaction propagates a superexchange mechanism via [P2O7] groups.
Figure 11.17 Temperature dependent reciprocal susceptibily for ReP2O7 (a) and NaRe2(PO4)3 (b).
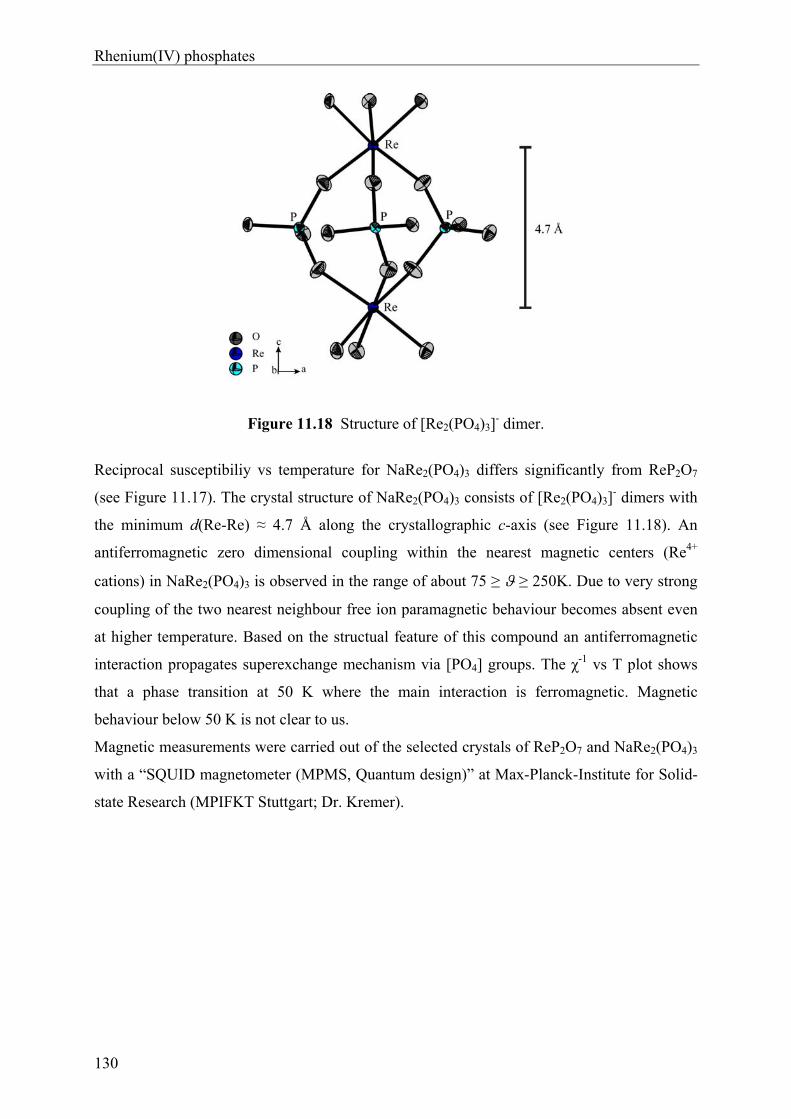
Rhenium(IV) phosphates
130
Figure 11.18 Structure of [Re2(PO4)3]- dimer.
Reciprocal susceptibiliy vs temperature for NaRe2(PO4)3 differs significantly from ReP2O7
(see Figure 11.17). The crystal structure of NaRe2(PO4)3 consists of [Re2(PO4)3]- dimers with
the minimum d(Re-Re) ≈ 4.7 Å along the crystallographic c-axis (see Figure 11.18). An
antiferromagnetic zero dimensional coupling within the nearest magnetic centers (Re4+
cations) in NaRe2(PO4)3 is observed in the range of about 75 ≥ ≥ 250K. Due to very strong
coupling of the two nearest neighbour free ion paramagnetic behaviour becomes absent even
at higher temperature. Based on the structual feature of this compound an antiferromagnetic
interaction propagates superexchange mechanism via [PO4] groups. The χ-1 vs T plot shows
that a phase transition at 50 K where the main interaction is ferromagnetic. Magnetic
behaviour below 50 K is not clear to us.
Magnetic measurements were carried out of the selected crystals of ReP2O7 and NaRe2(PO4)3
with a “SQUID magnetometer (MPMS, Quantum design)” at Max-Planck-Institute for Solid-
state Research (MPIFKT Stuttgart; Dr. Kremer).
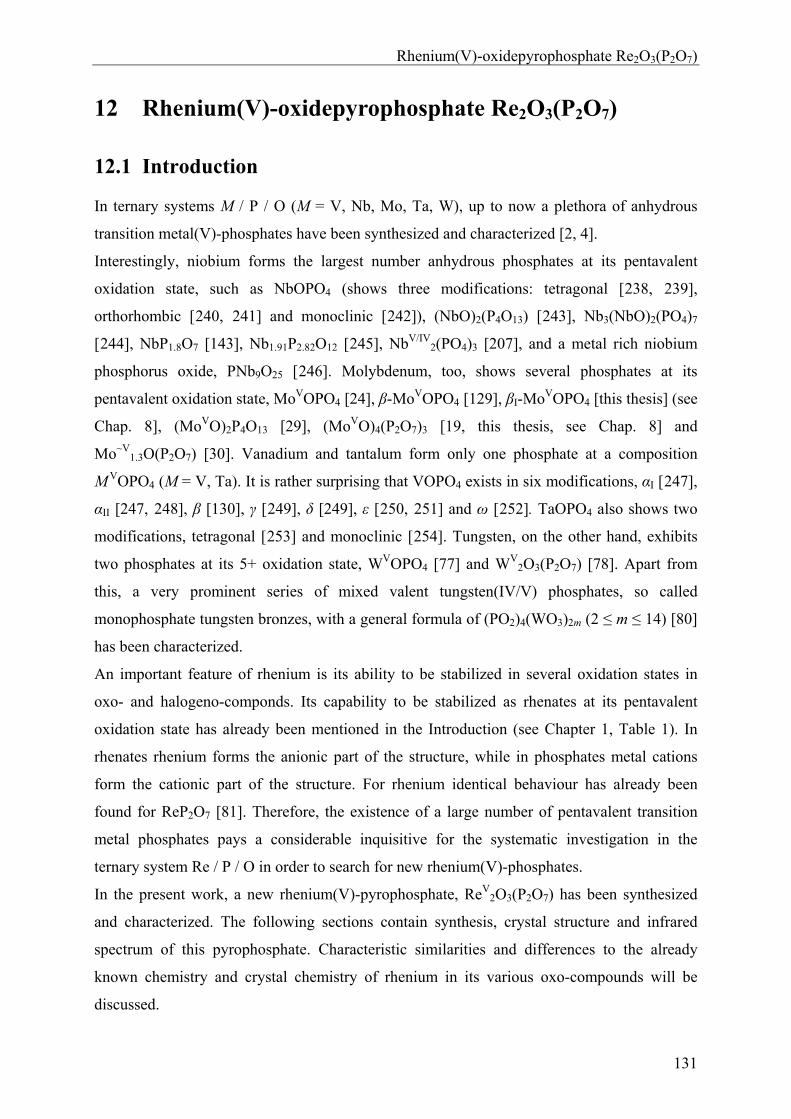
Rhenium(V)-oxidepyrophosphate Re2O3(P2O7)
131
12 Rhenium(V)-oxidepyrophosphate Re2O3(P2O7)
12.1 Introduction
In ternary systems M / P / O (M = V, Nb, Mo, Ta, W), up to now a plethora of anhydrous
transition metal(V)-phosphates have been synthesized and characterized [2, 4].
Interestingly, niobium forms the largest number anhydrous phosphates at its pentavalent
oxidation state, such as NbOPO4 (shows three modifications: tetragonal [238, 239],
orthorhombic [240, 241] and monoclinic [242]), (NbO)2(P4O13) [243], Nb3(NbO)2(PO4)7
[244], NbP1.8O7 [143], Nb1.91P2.82O12 [245], NbV/IV2(PO4)3 [207], and a metal rich niobium
phosphorus oxide, PNb9O25 [246]. Molybdenum, too, shows several phosphates at its
pentavalent oxidation state, MoVOPO4 [24], β-MoVOPO4 [129], βI-MoVOPO4 [this thesis] (see
Chap. 8], (MoVO)2P4O13 [29], (MoVO)4(P2O7)3 [19, this thesis, see Chap. 8] and
Mo~V1.3O(P2O7) [30]. Vanadium and tantalum form only one phosphate at a composition
M VOPO4 (M = V, Ta). It is rather surprising that VOPO4 exists in six modifications, αI [247],
αII [247, 248], β [130], γ [249], δ [249], ε [250, 251] and ω [252]. TaOPO4 also shows two
modifications, tetragonal [253] and monoclinic [254]. Tungsten, on the other hand, exhibits
two phosphates at its 5+ oxidation state, WVOPO4 [77] and WV2O3(P2O7) [78]. Apart from
this, a very prominent series of mixed valent tungsten(IV/V) phosphates, so called
monophosphate tungsten bronzes, with a general formula of (PO2)4(WO3)2m (2 ≤ m ≤ 14) [80]
has been characterized.
An important feature of rhenium is its ability to be stabilized in several oxidation states in
oxo- and halogeno-componds. Its capability to be stabilized as rhenates at its pentavalent
oxidation state has already been mentioned in the Introduction (see Chapter 1, Table 1). In
rhenates rhenium forms the anionic part of the structure, while in phosphates metal cations
form the cationic part of the structure. For rhenium identical behaviour has already been
found for ReP2O7 [81]. Therefore, the existence of a large number of pentavalent transition
metal phosphates pays a considerable inquisitive for the systematic investigation in the
ternary system Re / P / O in order to search for new rhenium(V)-phosphates.
In the present work, a new rhenium(V)-pyrophosphate, ReV2O3(P2O7) has been synthesized
and characterized. The following sections contain synthesis, crystal structure and infrared
spectrum of this pyrophosphate. Characteristic similarities and differences to the already
known chemistry and crystal chemistry of rhenium in its various oxo-compounds will be
discussed.
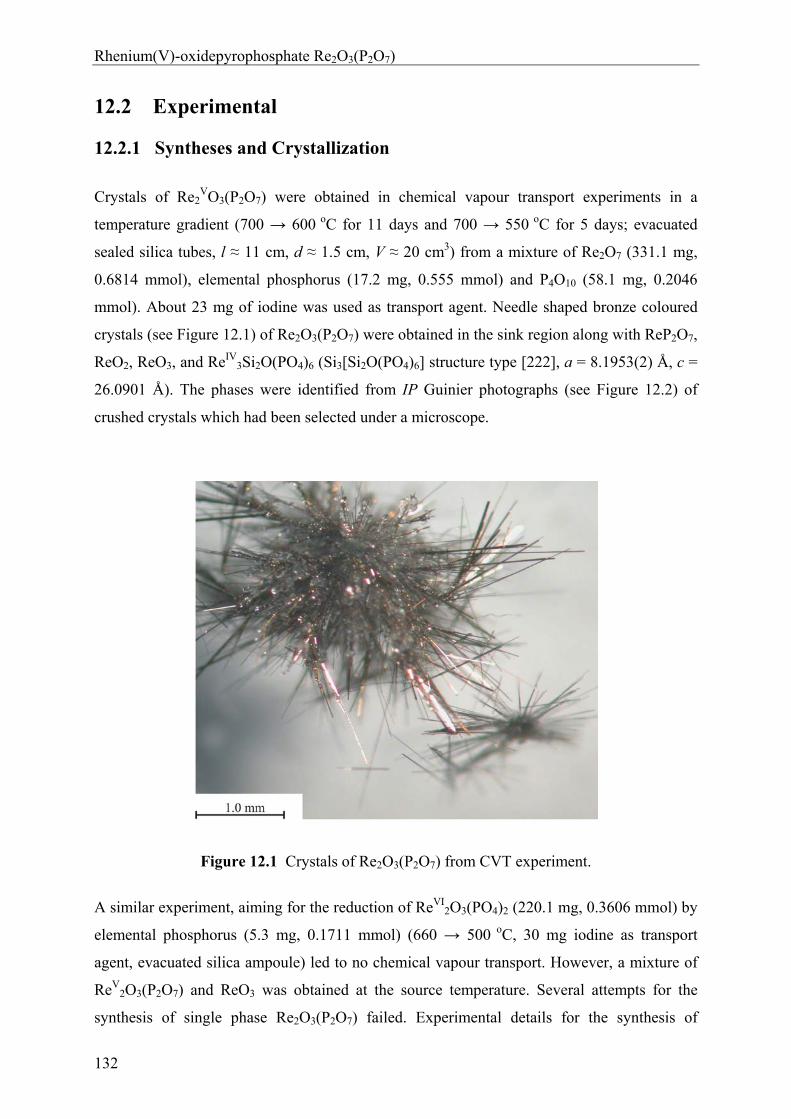
Rhenium(V)-oxidepyrophosphate Re2O3(P2O7)
132
12.2 Experimental
12.2.1 Syntheses and Crystallization
Crystals of Re2VO3(P2O7) were obtained in chemical vapour transport experiments in a
temperature gradient (700 → 600 oC for 11 days and 700 → 550 oC for 5 days; evacuated
sealed silica tubes, l ≈ 11 cm, d ≈ 1.5 cm, V ≈ 20 cm3) from a mixture of Re2O7 (331.1 mg,
0.6814 mmol), elemental phosphorus (17.2 mg, 0.555 mmol) and P4O10 (58.1 mg, 0.2046
mmol). About 23 mg of iodine was used as transport agent. Needle shaped bronze coloured
crystals (see Figure 12.1) of Re2O3(P2O7) were obtained in the sink region along with ReP2O7,
ReO2, ReO3, and ReIV3Si2O(PO4)6 (Si3[Si2O(PO4)6] structure type [222], a = 8.1953(2) Å, c =
26.0901 Å). The phases were identified from IP Guinier photographs (see Figure 12.2) of
crushed crystals which had been selected under a microscope.
Figure 12.1 Crystals of Re2O3(P2O7) from CVT experiment.
A similar experiment, aiming for the reduction of ReVI2O3(PO4)2 (220.1 mg, 0.3606 mmol) by
elemental phosphorus (5.3 mg, 0.1711 mmol) (660 → 500 oC, 30 mg iodine as transport
agent, evacuated silica ampoule) led to no chemical vapour transport. However, a mixture of
ReV2O3(P2O7) and ReO3 was obtained at the source temperature. Several attempts for the
synthesis of single phase Re2O3(P2O7) failed. Experimental details for the synthesis of
Rhenium(V)-oxidepyrophosphate Re2O3(P2O7)
133
rhenium(V) phosphates are given in table 12.1. Generally, mixtures of ReIVP2O7 and ReO3
were obtained instead. Re2O7 and P4O10 were handled in a glove bag in argon atmosphere
since both compounds are hygroscopic. The starting materials were at least of p.a. grade.
Table 12.1 Experiments aiming for the synthesis of ReV2O3(P2O7). Experiments led to
ReV2O3(P2O7) are given in bold letters.
starting solids
amount / mg
I2 / mg
temp.a)
/ oC time
/d products (source) products (sink) (according to IP Guinier photographs)
ReO3 P4O10 P
420.20 113.12 10.85
165 400→300 500→400 650→500
4 4 5
ReP2O7 / ReO3 / ReO2
thin lamella of ReO3
Re2O7 P4O10 P
316.61 55.85 16.33
174 700→600 700→500
11 7
ReP2O7 / ReO3
thin lamella of ReO3
Re2O7 P4O10 P
402.70 70.94 20.60
50 400→500 700→550
6 5
ReP2O7 / ReO3 / ReO2
ReP2O7 / thin lamella of ReO3
Re2O7 P4O10 P
349.30 80.02 15.50
60 B.B.b) 500→600 500→400 600→450
3hc) 5 7 4
ReO3 / ReP2O7
thin lamella of ReO3
ReO3 P4O10 P
204.01 56.03 4.50
60 B.B.b) 500→600 550→400 550→450
5h 5 7 4
ReO3 /ReP2O7
ReO3 / ReP2O7
Re2P2O11 P
220.12 5.30
60 500→400 600→500 660→500
4 6 6
Re2P2O10 / ReO3
thin lamella of ReO3
Re2O7 P4O10 P
279.30 49.03 14.60
20 700→600 700→550
11 5
ReO2
ReP2O7 / Re3Si2P6O25 / *
d)
ReO3 P4O10 P
161.50 39.04 4.30
---- 700
5 ReP2O7 / ReO3 / ReO2 ----
Re2O7 P4O10 P
436.90 76.60 22.60
115 600 550→500
10 9
ReO3
ReP2O7 / Re2P2O11
Re2O7 P4O10 P
331.10 58.10 17.20
23 700→600 700→550
11 5
ReO3 /ReO2
Re3Si2P6O25 / ReP2O7
ReO3 / ReO2 / Re2P2O10 / *d)
Re2O7 P4O10 P
333.80 58.71 17.05
34 B.B.b) 700 800
1h 5 2
ReO2 / ReP2O7
----
Re2O7 P4O10 P
242.92 12.70 42.56
30 410 800
3 4
ReP2O7 / ReO2 / ReO3
----
ReO3 P P4O10
117.40 3.21 35.00
60 400 700
13d 7
ReP2O7 / ReO3 / ReO2
----
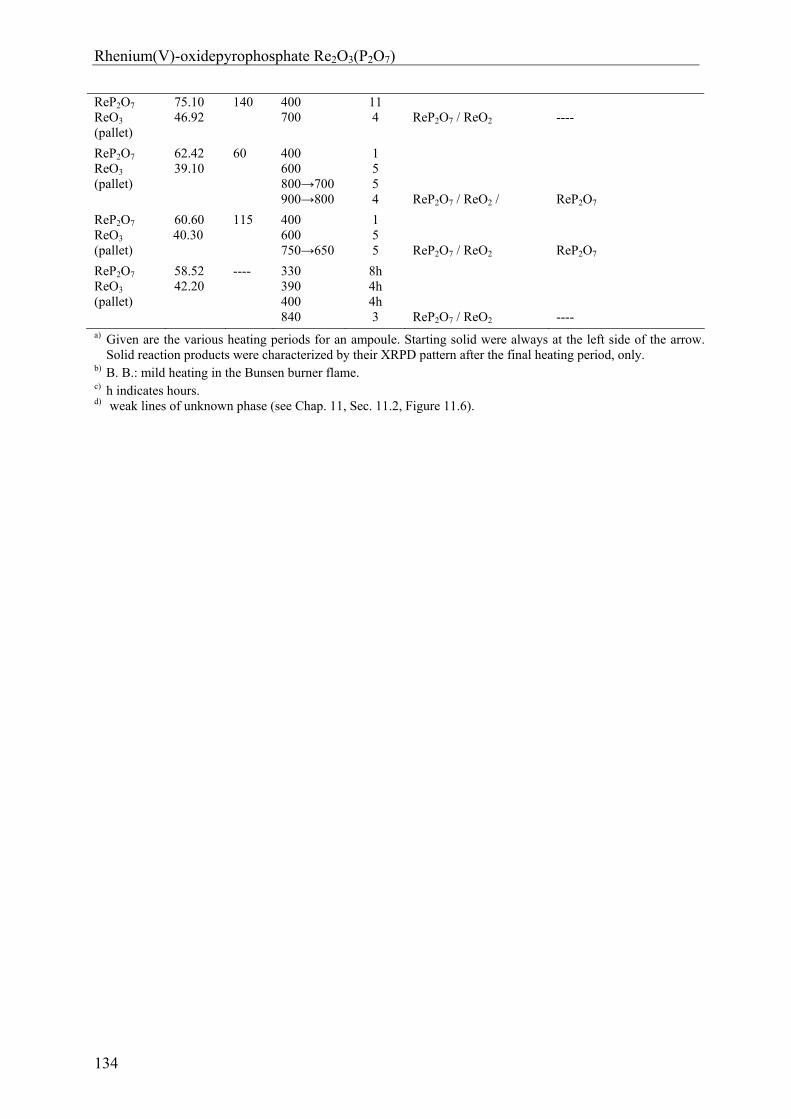
Rhenium(V)-oxidepyrophosphate Re2O3(P2O7)
134
ReP2O7 ReO3 (pallet)
75.10 46.92
140 400 700
11 4
ReP2O7 / ReO2
----
ReP2O7 ReO3 (pallet)
62.42 39.10
60 400 600 800→700 900→800
1 5 5 4
ReP2O7 / ReO2 /
ReP2O7
ReP2O7 ReO3 (pallet)
60.60 40.30
115 400 600 750→650
1 5 5
ReP2O7 / ReO2
ReP2O7
ReP2O7 ReO3 (pallet)
58.52 42.20
---- 330 390 400 840
8h 4h 4h 3
ReP2O7 / ReO2
----
a) Given are the various heating periods for an ampoule. Starting solid were always at the left side of the arrow. Solid reaction products were characterized by their XRPD pattern after the final heating period, only.
b) B. B.: mild heating in the Bunsen burner flame. c) h indicates hours. d) weak lines of unknown phase (see Chap. 11, Sec. 11.2, Figure 11.6).
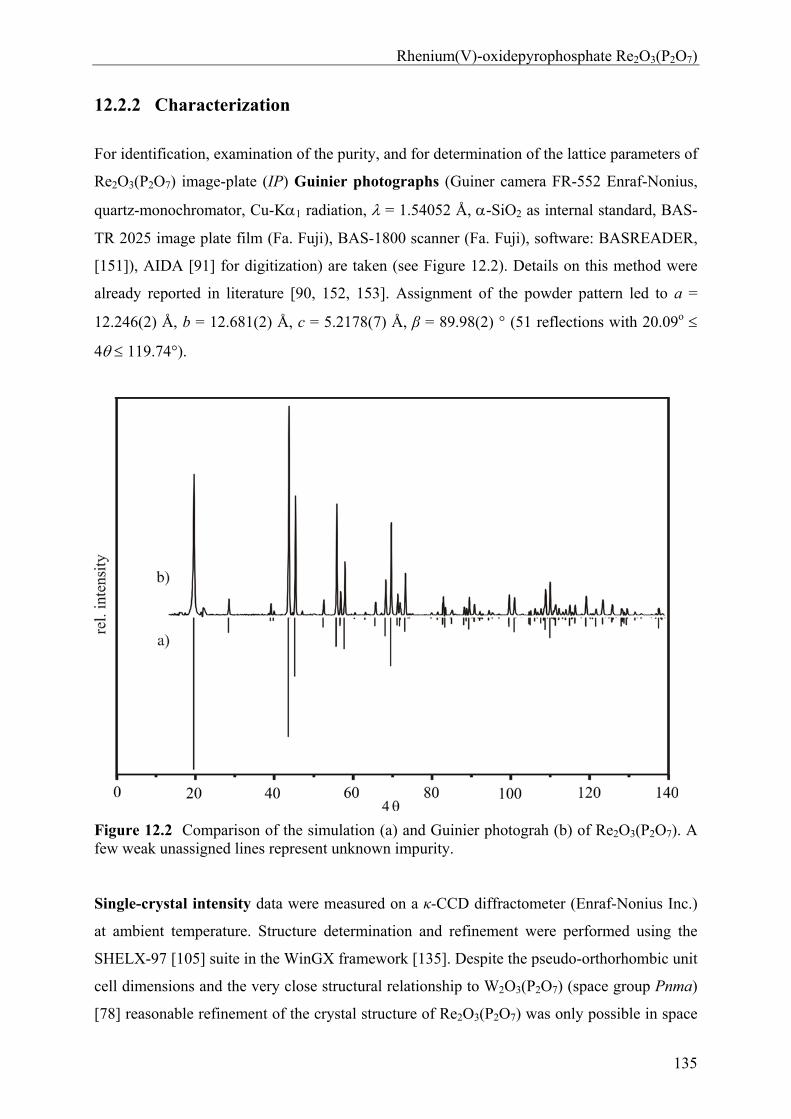
Rhenium(V)-oxidepyrophosphate Re2O3(P2O7)
135
12.2.2 Characterization
For identification, examination of the purity, and for determination of the lattice parameters of
Re2O3(P2O7) image-plate (IP) Guinier photographs (Guiner camera FR-552 Enraf-Nonius,
quartz-monochromator, Cu-K1 radiation, = 1.54052 Å, -SiO2 as internal standard, BAS-
TR 2025 image plate film (Fa. Fuji), BAS-1800 scanner (Fa. Fuji), software: BASREADER,
[151]), AIDA [91] for digitization) are taken (see Figure 12.2). Details on this method were
already reported in literature [90, 152, 153]. Assignment of the powder pattern led to a =
12.246(2) Å, b = 12.681(2) Å, c = 5.2178(7) Å, β = 89.98(2) ° (51 reflections with 20.09o
4 119.74°).
Figure 12.2 Comparison of the simulation (a) and Guinier photograh (b) of Re2O3(P2O7). A few weak unassigned lines represent unknown impurity. Single-crystal intensity data were measured on a κ-CCD diffractometer (Enraf-Nonius Inc.)
at ambient temperature. Structure determination and refinement were performed using the
SHELX-97 [105] suite in the WinGX framework [135]. Despite the pseudo-orthorhombic unit
cell dimensions and the very close structural relationship to W2O3(P2O7) (space group Pnma)
[78] reasonable refinement of the crystal structure of Re2O3(P2O7) was only possible in space
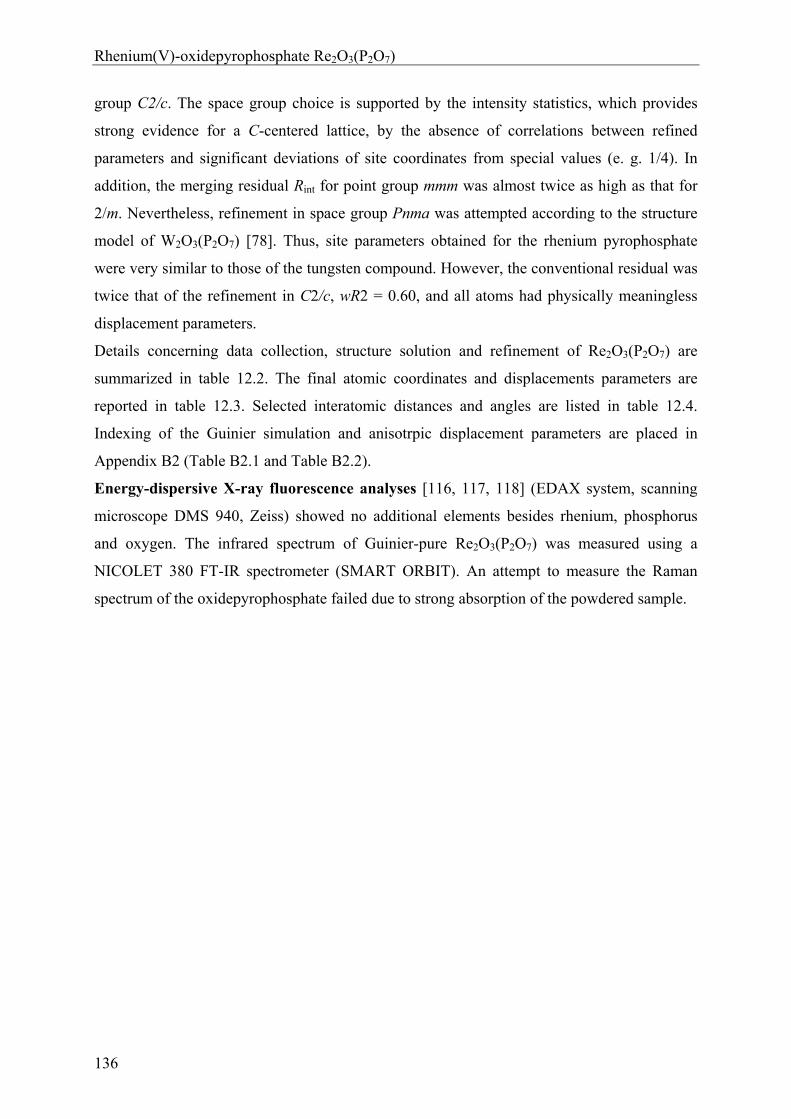
Rhenium(V)-oxidepyrophosphate Re2O3(P2O7)
136
group C2/c. The space group choice is supported by the intensity statistics, which provides
strong evidence for a C-centered lattice, by the absence of correlations between refined
parameters and significant deviations of site coordinates from special values (e. g. 1/4). In
addition, the merging residual Rint for point group mmm was almost twice as high as that for
2/m. Nevertheless, refinement in space group Pnma was attempted according to the structure
model of W2O3(P2O7) [78]. Thus, site parameters obtained for the rhenium pyrophosphate
were very similar to those of the tungsten compound. However, the conventional residual was
twice that of the refinement in C2/c, wR2 = 0.60, and all atoms had physically meaningless
displacement parameters.
Details concerning data collection, structure solution and refinement of Re2O3(P2O7) are
summarized in table 12.2. The final atomic coordinates and displacements parameters are
reported in table 12.3. Selected interatomic distances and angles are listed in table 12.4.
Indexing of the Guinier simulation and anisotrpic displacement parameters are placed in
Appendix B2 (Table B2.1 and Table B2.2).
Energy-dispersive X-ray fluorescence analyses [116, 117, 118] (EDAX system, scanning
microscope DMS 940, Zeiss) showed no additional elements besides rhenium, phosphorus
and oxygen. The infrared spectrum of Guinier-pure Re2O3(P2O7) was measured using a
NICOLET 380 FT-IR spectrometer (SMART ORBIT). An attempt to measure the Raman
spectrum of the oxidepyrophosphate failed due to strong absorption of the powdered sample.
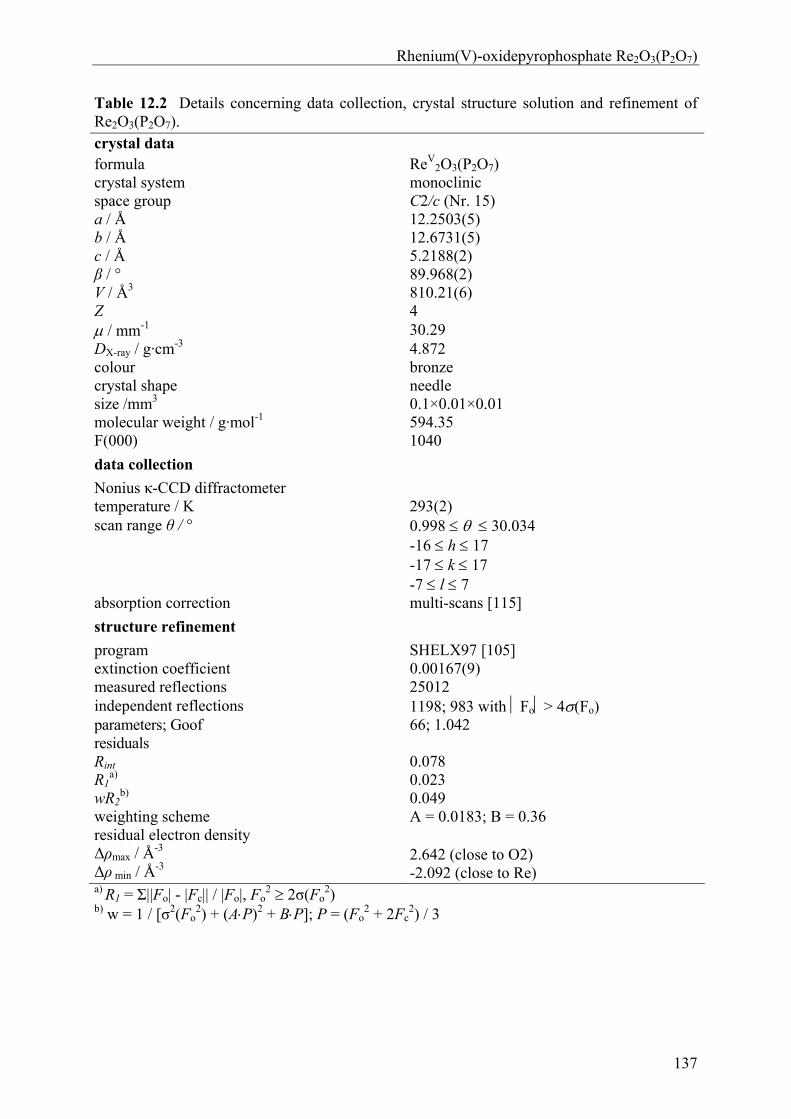
Rhenium(V)-oxidepyrophosphate Re2O3(P2O7)
137
Table 12.2 Details concerning data collection, crystal structure solution and refinement of Re2O3(P2O7). crystal data formula ReV
2O3(P2O7) crystal system monoclinic space group C2/c (Nr. 15) a / Å b / Å c / Å β / °
12.2503(5) 12.6731(5) 5.2188(2) 89.968(2)
V / Å3 810.21(6) Z 4 / mm-1 30.29 DX-ray / g·cm-3 4.872 colour bronze crystal shape size /mm3
needle 0.1×0.01×0.01
molecular weight / g·mol-1 594.35 F(000) 1040
data collection
Nonius κ-CCD diffractometer temperature / K 293(2) scan range θ / ° 0.998 30.034
-16 h 17 -17 k 17 -7 l 7
absorption correction multi-scans [115]
structure refinement
program SHELX97 [105] extinction coefficient 0.00167(9) measured reflections 25012 independent reflections 1198; 983 with Fo> 4(Fo) parameters; Goof 66; 1.042 residuals Rint R1
a) wR2
b)
0.078 0.023 0.049
weighting scheme A = 0.0183; B = 0.36 residual electron density Δρmax / Å
-3 Δρ min / Å
-3
2.642 (close to O2) -2.092 (close to Re)
a) R1 = Σ||Fo| - |Fc|| / |Fo|, Fo2 2σ(Fo
2) b) w = 1 / [σ2(Fo
2) + (AP)2 + BP]; P = (Fo2 + 2Fc
2) / 3
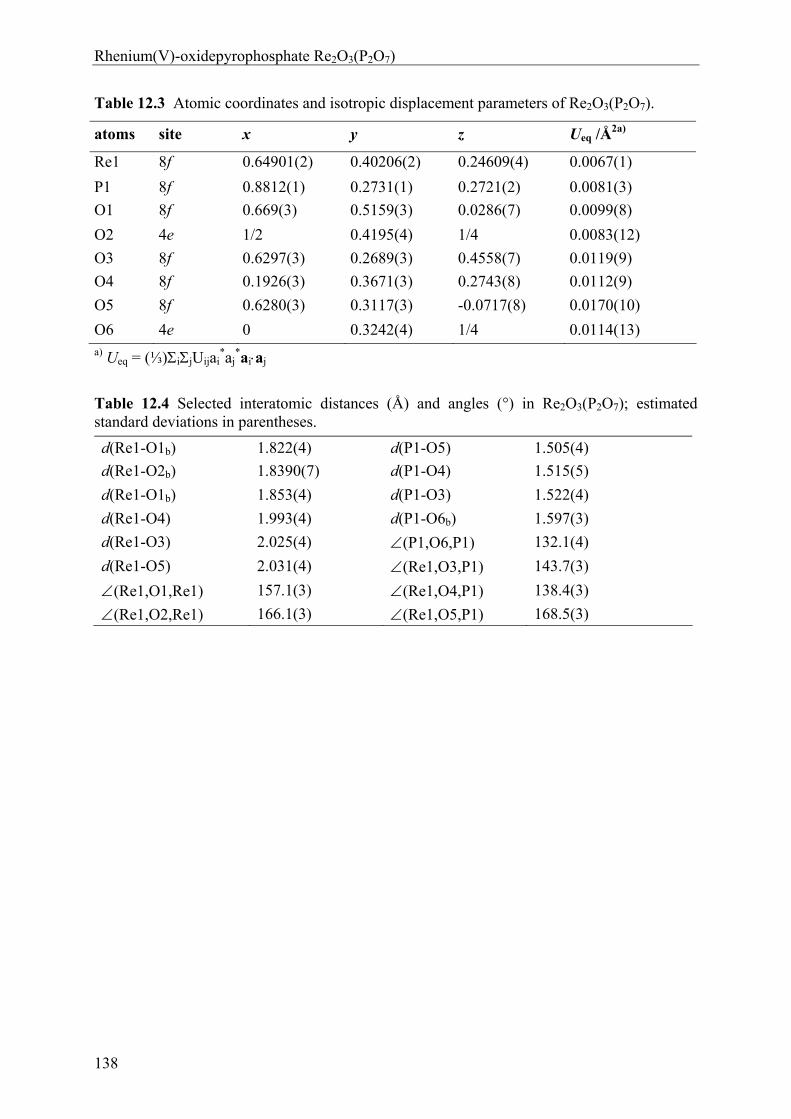
Rhenium(V)-oxidepyrophosphate Re2O3(P2O7)
138
Table 12.3 Atomic coordinates and isotropic displacement parameters of Re2O3(P2O7).
atoms site x y z Ueq /Å2a)
Re1 8f 0.64901(2) 0.40206(2) 0.24609(4) 0.0067(1)
P1 8f 0.8812(1) 0.2731(1) 0.2721(2) 0.0081(3)
O1 8f 0.669(3) 0.5159(3) 0.0286(7) 0.0099(8)
O2 4e 1/2 0.4195(4) 1/4 0.0083(12)
O3 8f 0.6297(3) 0.2689(3) 0.4558(7) 0.0119(9)
O4 8f 0.1926(3) 0.3671(3) 0.2743(8) 0.0112(9)
O5 8f 0.6280(3) 0.3117(3) -0.0717(8) 0.0170(10)
O6 4e 0 0.3242(4) 1/4 0.0114(13) a) Ueq = (⅓)ijUijai
*aj*aiaj
Table 12.4 Selected interatomic distances (Å) and angles (°) in Re2O3(P2O7); estimated standard deviations in parentheses.
d(Re1-O1b) 1.822(4) d(P1-O5) 1.505(4)
d(Re1-O2b) 1.8390(7) d(P1-O4) 1.515(5)
d(Re1-O1b) 1.853(4) d(P1-O3) 1.522(4)
d(Re1-O4) 1.993(4) d(P1-O6b) 1.597(3)
d(Re1-O3) 2.025(4) (P1,O6,P1) 132.1(4)
d(Re1-O5) 2.031(4) (Re1,O3,P1) 143.7(3)
(Re1,O1,Re1) 157.1(3) (Re1,O4,P1) 138.4(3)
(Re1,O2,Re1) 166.1(3) (Re1,O5,P1) 168.5(3)
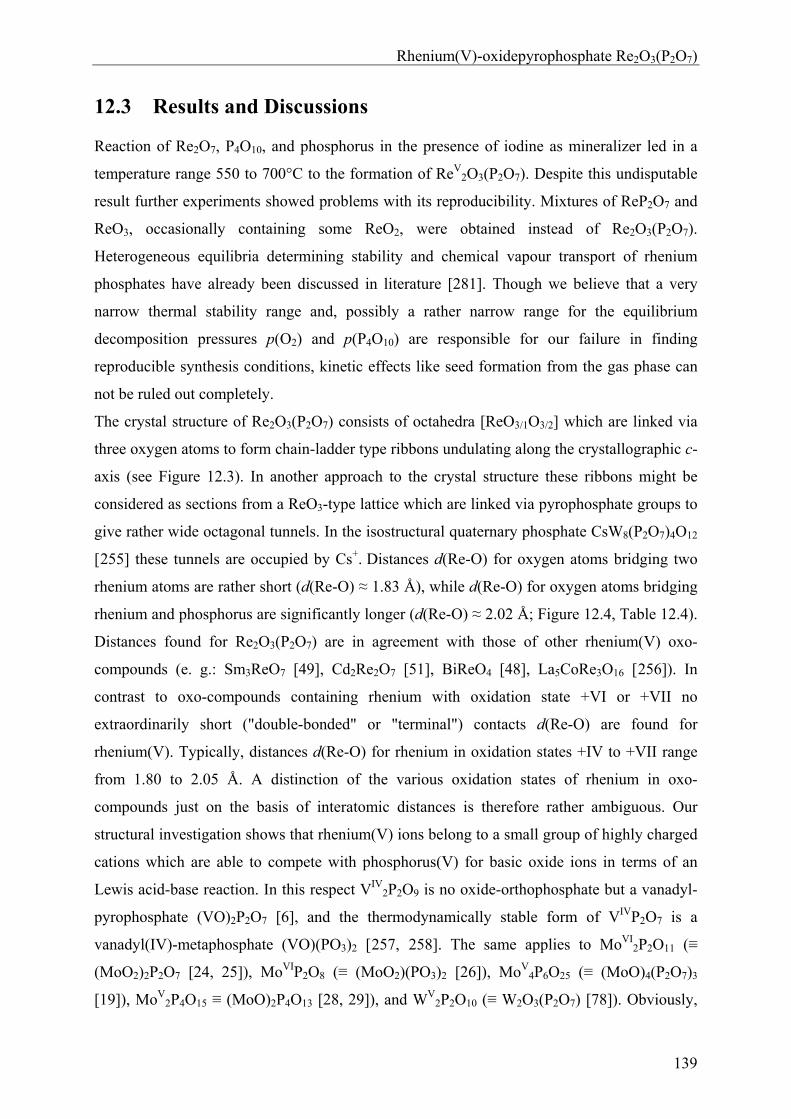
Rhenium(V)-oxidepyrophosphate Re2O3(P2O7)
139
12.3 Results and Discussions
Reaction of Re2O7, P4O10, and phosphorus in the presence of iodine as mineralizer led in a
temperature range 550 to 700°C to the formation of ReV2O3(P2O7). Despite this undisputable
result further experiments showed problems with its reproducibility. Mixtures of ReP2O7 and
ReO3, occasionally containing some ReO2, were obtained instead of Re2O3(P2O7).
Heterogeneous equilibria determining stability and chemical vapour transport of rhenium
phosphates have already been discussed in literature [281]. Though we believe that a very
narrow thermal stability range and, possibly a rather narrow range for the equilibrium
decomposition pressures p(O2) and p(P4O10) are responsible for our failure in finding
reproducible synthesis conditions, kinetic effects like seed formation from the gas phase can
not be ruled out completely.
The crystal structure of Re2O3(P2O7) consists of octahedra [ReO3/1O3/2] which are linked via
three oxygen atoms to form chain-ladder type ribbons undulating along the crystallographic c-
axis (see Figure 12.3). In another approach to the crystal structure these ribbons might be
considered as sections from a ReO3-type lattice which are linked via pyrophosphate groups to
give rather wide octagonal tunnels. In the isostructural quaternary phosphate CsW8(P2O7)4O12
[255] these tunnels are occupied by Cs+. Distances d(Re-O) for oxygen atoms bridging two
rhenium atoms are rather short (d(Re-O) ≈ 1.83 Å), while d(Re-O) for oxygen atoms bridging
rhenium and phosphorus are significantly longer (d(Re-O) ≈ 2.02 Å; Figure 12.4, Table 12.4).
Distances found for Re2O3(P2O7) are in agreement with those of other rhenium(V) oxo-
compounds (e. g.: Sm3ReO7 [49], Cd2Re2O7 [51], BiReO4 [48], La5CoRe3O16 [256]). In
contrast to oxo-compounds containing rhenium with oxidation state +VI or +VII no
extraordinarily short ("double-bonded" or "terminal") contacts d(Re-O) are found for
rhenium(V). Typically, distances d(Re-O) for rhenium in oxidation states +IV to +VII range
from 1.80 to 2.05 Å. A distinction of the various oxidation states of rhenium in oxo-
compounds just on the basis of interatomic distances is therefore rather ambiguous. Our
structural investigation shows that rhenium(V) ions belong to a small group of highly charged
cations which are able to compete with phosphorus(V) for basic oxide ions in terms of an
Lewis acid-base reaction. In this respect VIV2P2O9 is no oxide-orthophosphate but a vanadyl-
pyrophosphate (VO)2P2O7 [6], and the thermodynamically stable form of VIVP2O7 is a
vanadyl(IV)-metaphosphate (VO)(PO3)2 [257, 258]. The same applies to MoVI2P2O11 (≡
(MoO2)2P2O7 [24, 25]), MoVIP2O8 (≡ (MoO2)(PO3)2 [26]), MoV4P6O25 (≡ (MoO)4(P2O7)3
[19]), MoV2P4O15 ≡ (MoO)2P4O13 [28, 29]), and WV
2P2O10 (≡ W2O3(P2O7) [78]). Obviously,
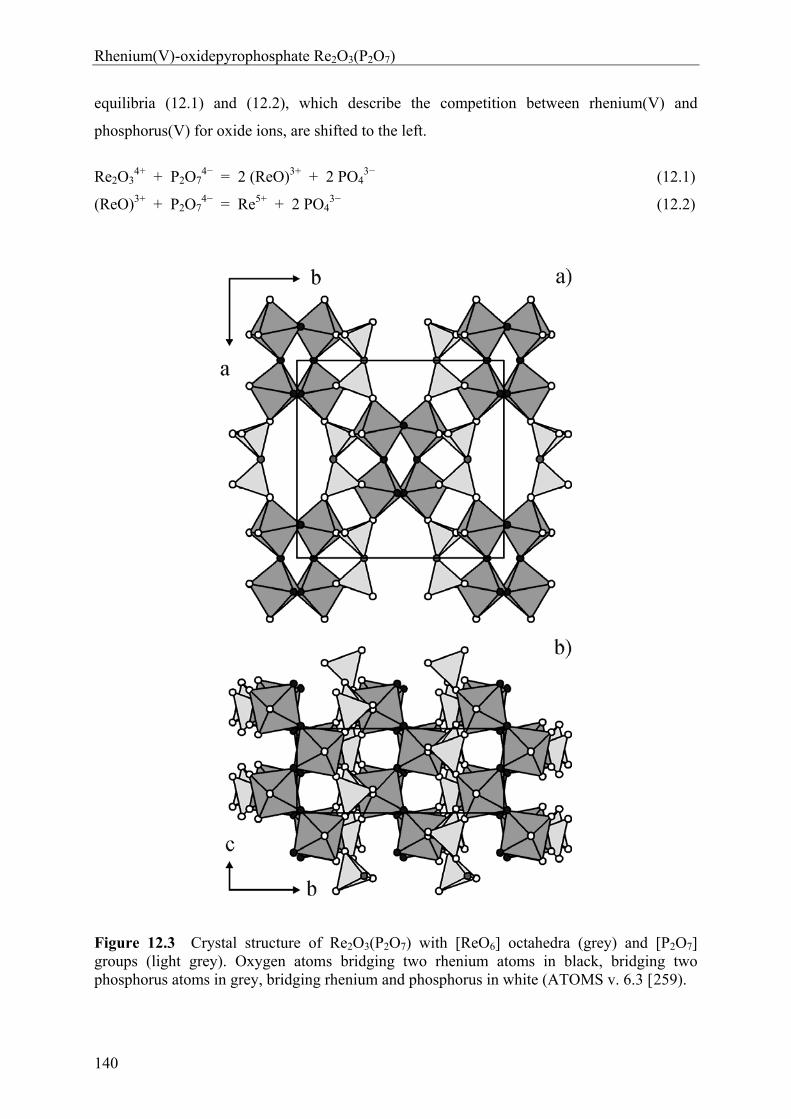
Rhenium(V)-oxidepyrophosphate Re2O3(P2O7)
140
equilibria (12.1) and (12.2), which describe the competition between rhenium(V) and
phosphorus(V) for oxide ions, are shifted to the left.
Re2O34+ + P2O7
4− = 2 (ReO)3+ + 2 PO43− (12.1)
(ReO)3+ + P2O74− = Re5+ + 2 PO4
3− (12.2)
Figure 12.3 Crystal structure of Re2O3(P2O7) with [ReO6] octahedra (grey) and [P2O7] groups (light grey). Oxygen atoms bridging two rhenium atoms in black, bridging two phosphorus atoms in grey, bridging rhenium and phosphorus in white (ATOMS v. 6.3 [259).
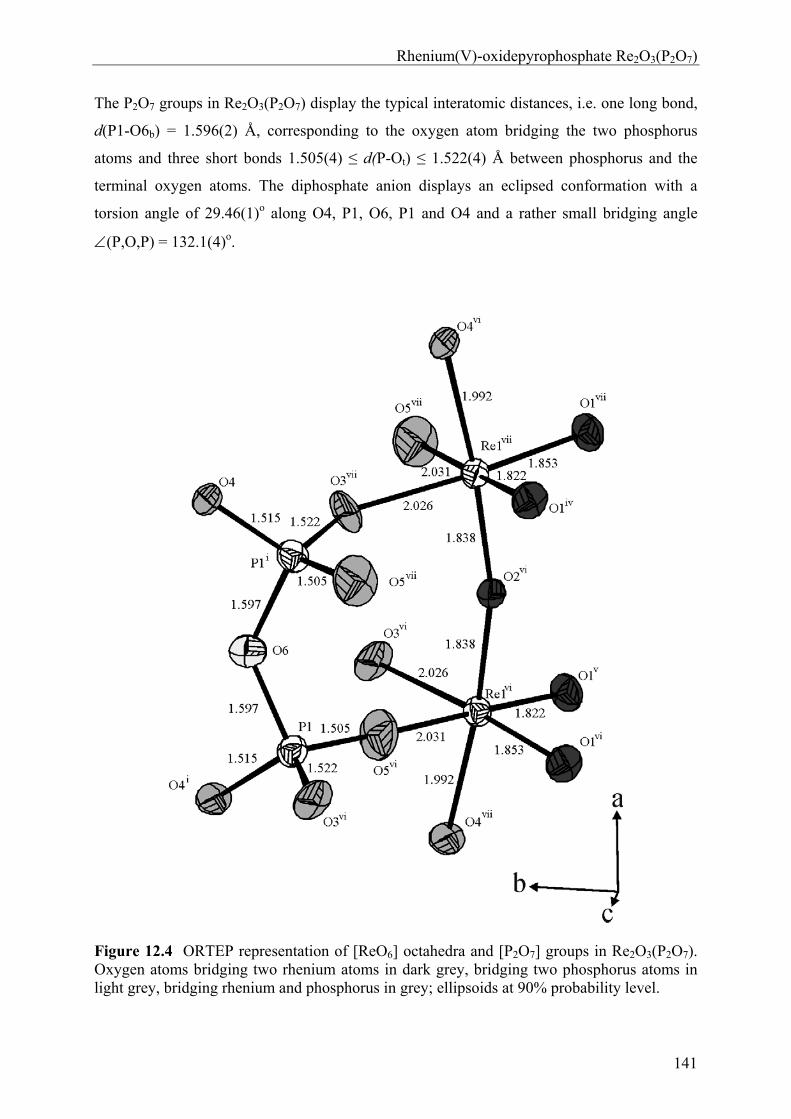
Rhenium(V)-oxidepyrophosphate Re2O3(P2O7)
141
The P2O7 groups in Re2O3(P2O7) display the typical interatomic distances, i.e. one long bond,
d(P1-O6b) = 1.596(2) Å, corresponding to the oxygen atom bridging the two phosphorus
atoms and three short bonds 1.505(4) ≤ d(P-Ot) ≤ 1.522(4) Å between phosphorus and the
terminal oxygen atoms. The diphosphate anion displays an eclipsed conformation with a
torsion angle of 29.46(1)o along O4, P1, O6, P1 and O4 and a rather small bridging angle
(P,O,P) = 132.1(4)o.
Figure 12.4 ORTEP representation of [ReO6] octahedra and [P2O7] groups in Re2O3(P2O7). Oxygen atoms bridging two rhenium atoms in dark grey, bridging two phosphorus atoms in light grey, bridging rhenium and phosphorus in grey; ellipsoids at 90% probability level.
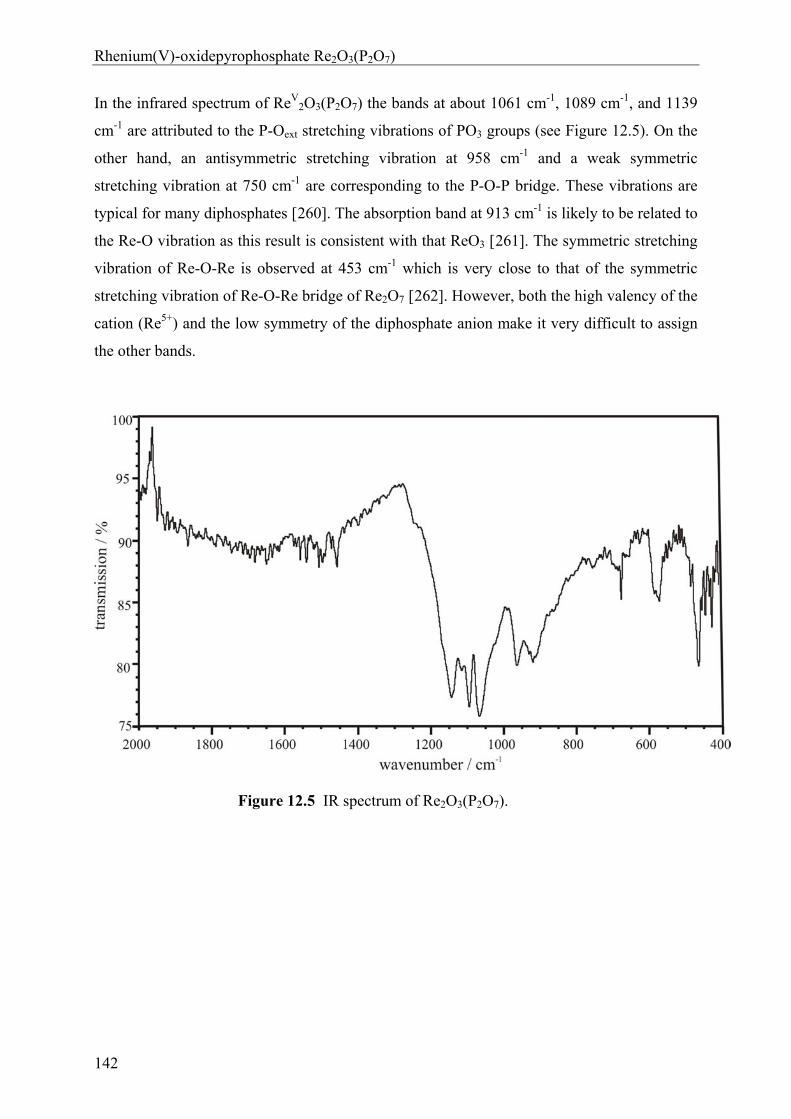
Rhenium(V)-oxidepyrophosphate Re2O3(P2O7)
142
In the infrared spectrum of ReV2O3(P2O7) the bands at about 1061 cm-1, 1089 cm-1, and 1139
cm-1 are attributed to the P-Oext stretching vibrations of PO3 groups (see Figure 12.5). On the
other hand, an antisymmetric stretching vibration at 958 cm-1 and a weak symmetric
stretching vibration at 750 cm-1 are corresponding to the P-O-P bridge. These vibrations are
typical for many diphosphates [260]. The absorption band at 913 cm-1 is likely to be related to
the Re-O vibration as this result is consistent with that ReO3 [261]. The symmetric stretching
vibration of Re-O-Re is observed at 453 cm-1 which is very close to that of the symmetric
stretching vibration of Re-O-Re bridge of Re2O7 [262]. However, both the high valency of the
cation (Re5+) and the low symmetry of the diphosphate anion make it very difficult to assign
the other bands.
Figure 12.5 IR spectrum of Re2O3(P2O7).
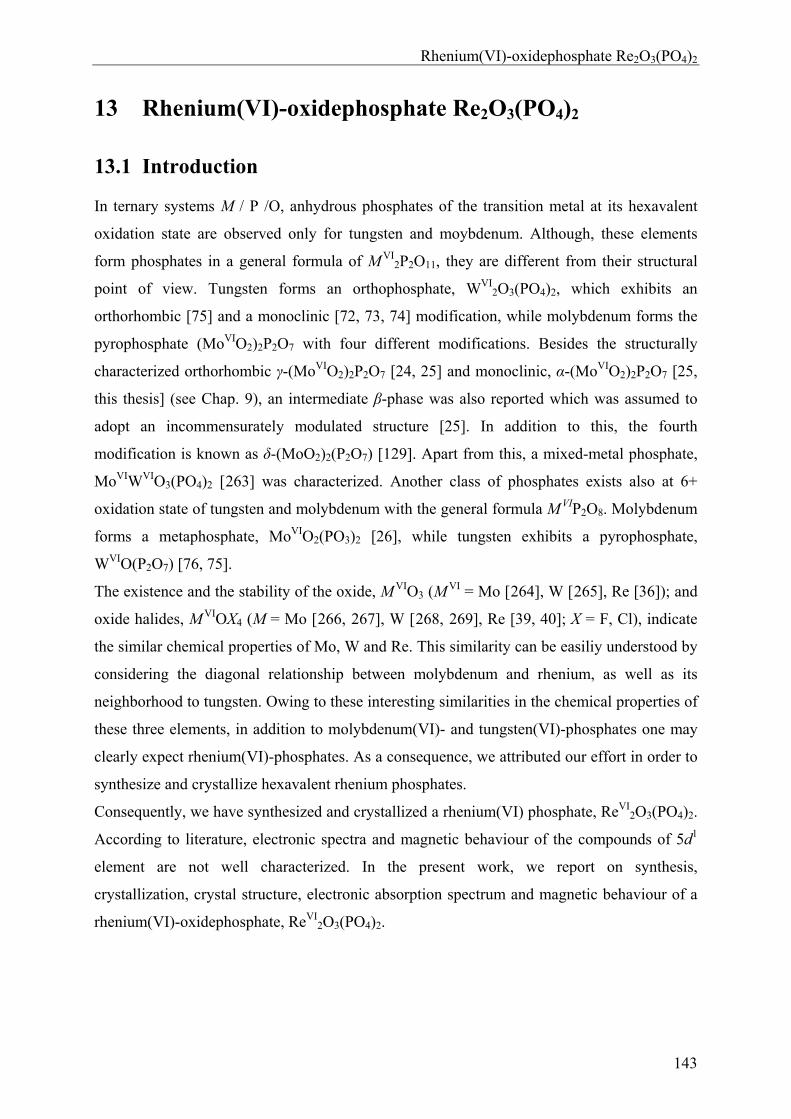
Rhenium(VI)-oxidephosphate Re2O3(PO4)2
143
13 Rhenium(VI)-oxidephosphate Re2O3(PO4)2
13.1 Introduction
In ternary systems M / P /O, anhydrous phosphates of the transition metal at its hexavalent
oxidation state are observed only for tungsten and moybdenum. Although, these elements
form phosphates in a general formula of M VI2P2O11, they are different from their structural
point of view. Tungsten forms an orthophosphate, WVI2O3(PO4)2, which exhibits an
orthorhombic [75] and a monoclinic [72, 73, 74] modification, while molybdenum forms the
pyrophosphate (MoVIO2)2P2O7 with four different modifications. Besides the structurally
characterized orthorhombic γ-(MoVIO2)2P2O7 [24, 25] and monoclinic, α-(MoVIO2)2P2O7 [25,
this thesis] (see Chap. 9), an intermediate β-phase was also reported which was assumed to
adopt an incommensurately modulated structure [25]. In addition to this, the fourth
modification is known as δ-(MoO2)2(P2O7) [129]. Apart from this, a mixed-metal phosphate,
MoVIWVIO3(PO4)2 [263] was characterized. Another class of phosphates exists also at 6+
oxidation state of tungsten and molybdenum with the general formula M VIP2O8. Molybdenum
forms a metaphosphate, MoVIO2(PO3)2 [26], while tungsten exhibits a pyrophosphate,
WVIO(P2O7) [76, 75].
The existence and the stability of the oxide, M VIO3 (MVI = Mo [264], W [265], Re [36]); and
oxide halides, M VIOX4 (M = Mo [266, 267], W [268, 269], Re [39, 40]; X = F, Cl), indicate
the similar chemical properties of Mo, W and Re. This similarity can be easiliy understood by
considering the diagonal relationship between molybdenum and rhenium, as well as its
neighborhood to tungsten. Owing to these interesting similarities in the chemical properties of
these three elements, in addition to molybdenum(VI)- and tungsten(VI)-phosphates one may
clearly expect rhenium(VI)-phosphates. As a consequence, we attributed our effort in order to
synthesize and crystallize hexavalent rhenium phosphates.
Consequently, we have synthesized and crystallized a rhenium(VI) phosphate, ReVI2O3(PO4)2.
According to literature, electronic spectra and magnetic behaviour of the compounds of 5d1
element are not well characterized. In the present work, we report on synthesis,
crystallization, crystal structure, electronic absorption spectrum and magnetic behaviour of a
rhenium(VI)-oxidephosphate, ReVI2O3(PO4)2.
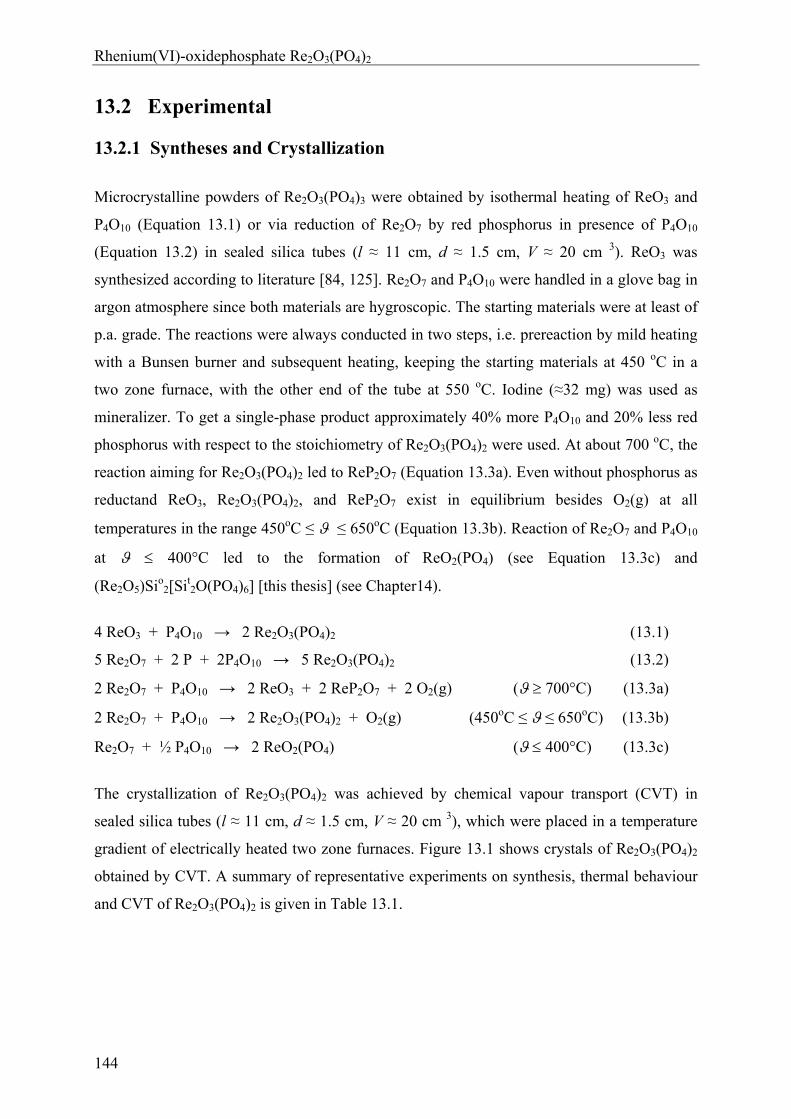
Rhenium(VI)-oxidephosphate Re2O3(PO4)2
144
13.2 Experimental
13.2.1 Syntheses and Crystallization
Microcrystalline powders of Re2O3(PO4)3 were obtained by isothermal heating of ReO3 and
P4O10 (Equation 13.1) or via reduction of Re2O7 by red phosphorus in presence of P4O10
(Equation 13.2) in sealed silica tubes (l ≈ 11 cm, d ≈ 1.5 cm, V ≈ 20 cm 3). ReO3 was
synthesized according to literature [84, 125]. Re2O7 and P4O10 were handled in a glove bag in
argon atmosphere since both materials are hygroscopic. The starting materials were at least of
p.a. grade. The reactions were always conducted in two steps, i.e. prereaction by mild heating
with a Bunsen burner and subsequent heating, keeping the starting materials at 450 oC in a
two zone furnace, with the other end of the tube at 550 oC. Iodine (≈32 mg) was used as
mineralizer. To get a single-phase product approximately 40% more P4O10 and 20% less red
phosphorus with respect to the stoichiometry of Re2O3(PO4)2 were used. At about 700 oC, the
reaction aiming for Re2O3(PO4)2 led to ReP2O7 (Equation 13.3a). Even without phosphorus as
reductand ReO3, Re2O3(PO4)2, and ReP2O7 exist in equilibrium besides O2(g) at all
temperatures in the range 450oC ≤ ≤ 650oC (Equation 13.3b). Reaction of Re2O7 and P4O10
at 400°C led to the formation of ReO2(PO4) (see Equation 13.3c) and
(Re2O5)Sio2[Sit
2O(PO4)6] [this thesis] (see Chapter14).
4 ReO3 + P4O10 → 2 Re2O3(PO4)2 (13.1)
5 Re2O7 + 2 P + 2P4O10 → 5 Re2O3(PO4)2 (13.2)
2 Re2O7 + P4O10 → 2 ReO3 + 2 ReP2O7 + 2 O2(g) ( 700°C) (13.3a)
2 Re2O7 + P4O10 → 2 Re2O3(PO4)2 + O2(g) (450oC ≤ ≤ 650oC) (13.3b)
Re2O7 + ½ P4O10 → 2 ReO2(PO4) ( 400°C) (13.3c)
The crystallization of Re2O3(PO4)2 was achieved by chemical vapour transport (CVT) in
sealed silica tubes (l ≈ 11 cm, d ≈ 1.5 cm, V ≈ 20 cm 3), which were placed in a temperature
gradient of electrically heated two zone furnaces. Figure 13.1 shows crystals of Re2O3(PO4)2
obtained by CVT. A summary of representative experiments on synthesis, thermal behaviour
and CVT of Re2O3(PO4)2 is given in Table 13.1.
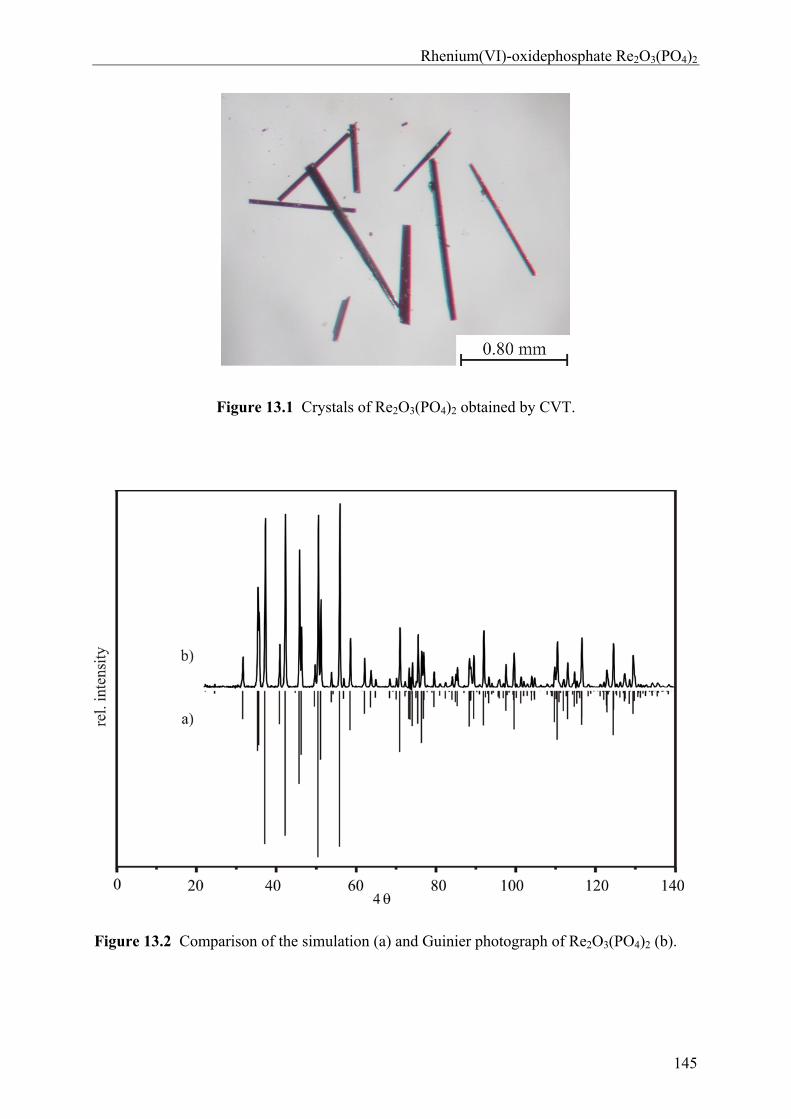
Rhenium(VI)-oxidephosphate Re2O3(PO4)2
145
Figure 13.1 Crystals of Re2O3(PO4)2 obtained by CVT.
Figure 13.2 Comparison of the simulation (a) and Guinier photograph of Re2O3(PO4)2 (b).
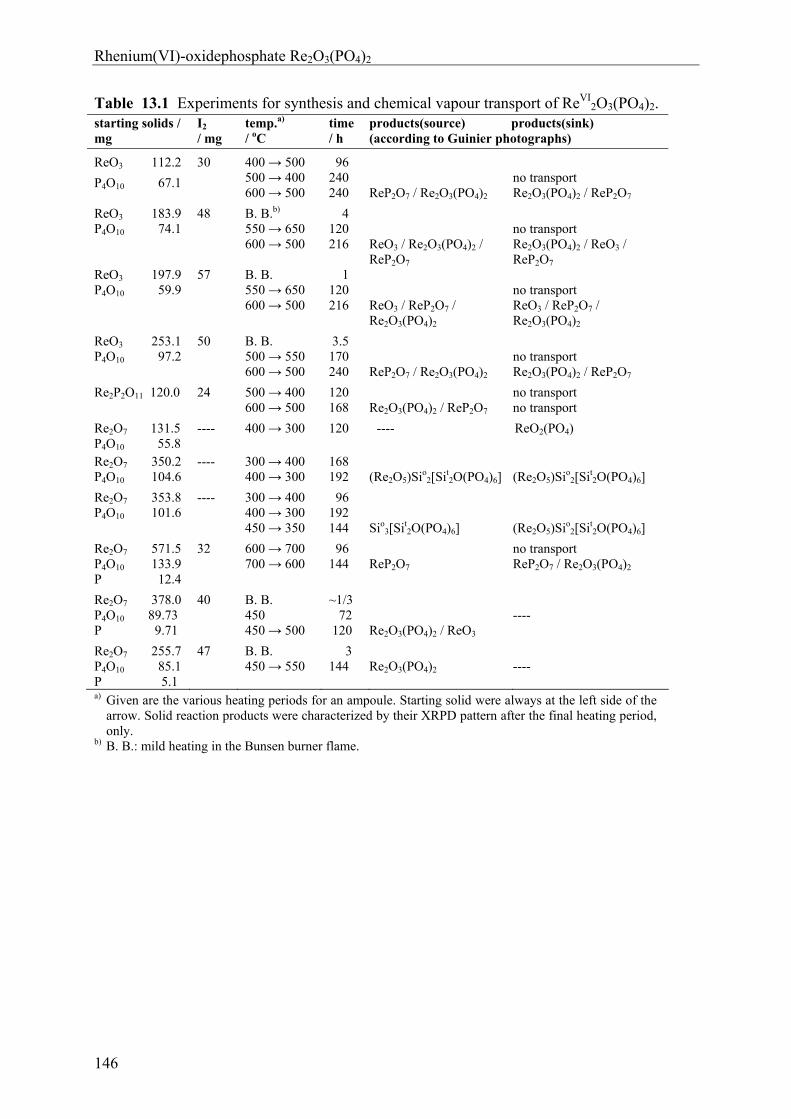
Rhenium(VI)-oxidephosphate Re2O3(PO4)2
146
Table 13.1 Experiments for synthesis and chemical vapour transport of ReVI2O3(PO4)2.
starting solids / mg
I2 / mg
temp.a) / oC
time / h
products(source) products(sink) (according to Guinier photographs)
ReO3 112.2
P4O10 67.1
30 400 → 500 500 → 400 600 → 500
96 240 240
ReP2O7 / Re2O3(PO4)2
no transport Re2O3(PO4)2 / ReP2O7
ReO3 183.9 P4O10 74.1
48 B. B.b) 550 → 650 600 → 500
4 120 216
ReO3 / Re2O3(PO4)2 / ReP2O7
no transport Re2O3(PO4)2 / ReO3 / ReP2O7
ReO3 197.9 P4O10 59.9
57 B. B. 550 → 650 600 → 500
1 120 216
ReO3 / ReP2O7 / Re2O3(PO4)2
no transport ReO3 / ReP2O7 / Re2O3(PO4)2
ReO3 253.1 P4O10 97.2
50 B. B. 500 → 550 600 → 500
3.5 170 240
ReP2O7 / Re2O3(PO4)2
no transport Re2O3(PO4)2 / ReP2O7
Re2P2O11 120.0 24 500 → 400 600 → 500
120 168
Re2O3(PO4)2 / ReP2O7
no transport no transport
Re2O7 131.5 P4O10 55.8
---- 400 → 300 120 ---- ReO2(PO4)
Re2O7 350.2 P4O10 104.6
---- 300 → 400 400 → 300
168 192
(Re2O5)Sio
2[Sit2O(PO4)6]
(Re2O5)Sio
2[Sit2O(PO4)6]
Re2O7 353.8 P4O10 101.6
---- 300 → 400 400 → 300 450 → 350
96 192 144
Sio
3[Sit2O(PO4)6]
(Re2O5)Sio
2[Sit2O(PO4)6]
Re2O7 571.5 P4O10 133.9 P 12.4
32 600 → 700 700 → 600
96 144
ReP2O7
no transport ReP2O7 / Re2O3(PO4)2
Re2O7 378.0 P4O10 89.73 P 9.71
40 B. B. 450 450 → 500
~1/3 72 120
Re2O3(PO4)2 / ReO3
----
Re2O7 255.7 P4O10 85.1 P 5.1
47 B. B. 450 → 550
3 144
Re2O3(PO4)2
----
a) Given are the various heating periods for an ampoule. Starting solid were always at the left side of the arrow. Solid reaction products were characterized by their XRPD pattern after the final heating period, only.
b) B. B.: mild heating in the Bunsen burner flame.
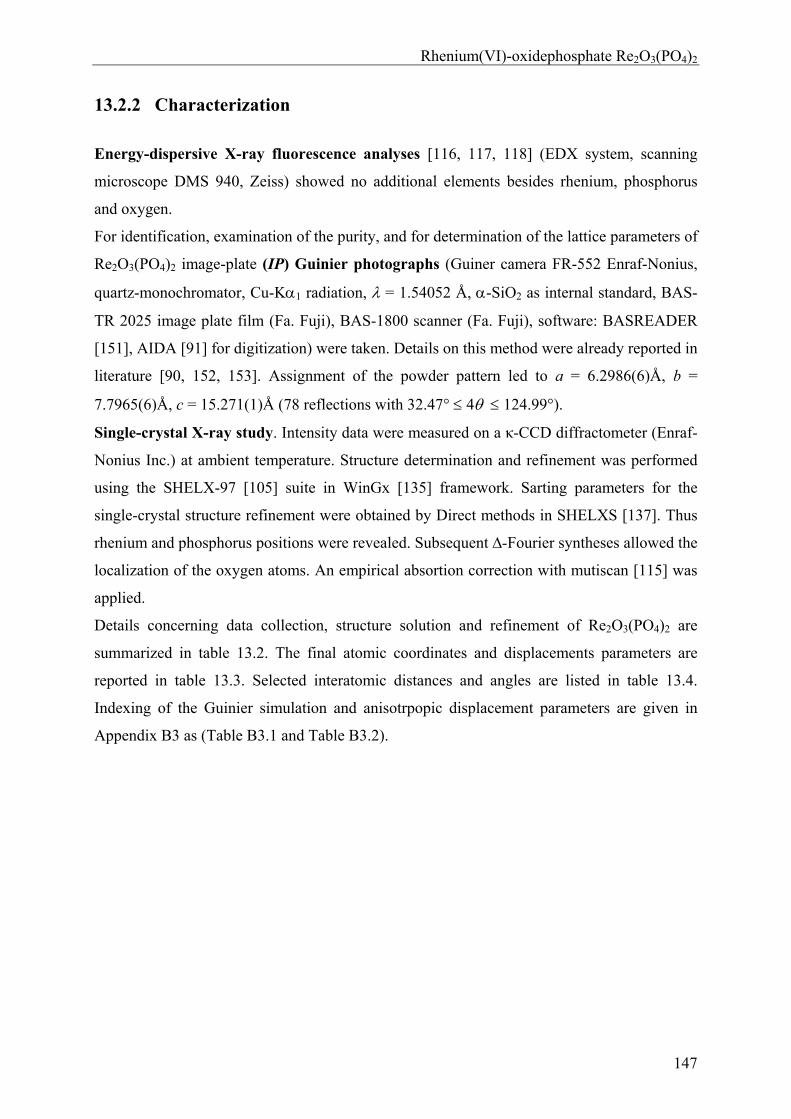
Rhenium(VI)-oxidephosphate Re2O3(PO4)2
147
13.2.2 Characterization
Energy-dispersive X-ray fluorescence analyses [116, 117, 118] (EDX system, scanning
microscope DMS 940, Zeiss) showed no additional elements besides rhenium, phosphorus
and oxygen.
For identification, examination of the purity, and for determination of the lattice parameters of
Re2O3(PO4)2 image-plate (IP) Guinier photographs (Guiner camera FR-552 Enraf-Nonius,
quartz-monochromator, Cu-K1 radiation, = 1.54052 Å, -SiO2 as internal standard, BAS-
TR 2025 image plate film (Fa. Fuji), BAS-1800 scanner (Fa. Fuji), software: BASREADER
[151], AIDA [91] for digitization) were taken. Details on this method were already reported in
literature [90, 152, 153]. Assignment of the powder pattern led to a = 6.2986(6)Å, b =
7.7965(6)Å, c = 15.271(1)Å (78 reflections with 32.47° 4 124.99°).
Single-crystal X-ray study. Intensity data were measured on a κ-CCD diffractometer (Enraf-
Nonius Inc.) at ambient temperature. Structure determination and refinement was performed
using the SHELX-97 [105] suite in WinGx [135] framework. Sarting parameters for the
single-crystal structure refinement were obtained by Direct methods in SHELXS [137]. Thus
rhenium and phosphorus positions were revealed. Subsequent ∆-Fourier syntheses allowed the
localization of the oxygen atoms. An empirical absortion correction with mutiscan [115] was
applied.
Details concerning data collection, structure solution and refinement of Re2O3(PO4)2 are
summarized in table 13.2. The final atomic coordinates and displacements parameters are
reported in table 13.3. Selected interatomic distances and angles are listed in table 13.4.
Indexing of the Guinier simulation and anisotrpopic displacement parameters are given in
Appendix B3 as (Table B3.1 and Table B3.2).
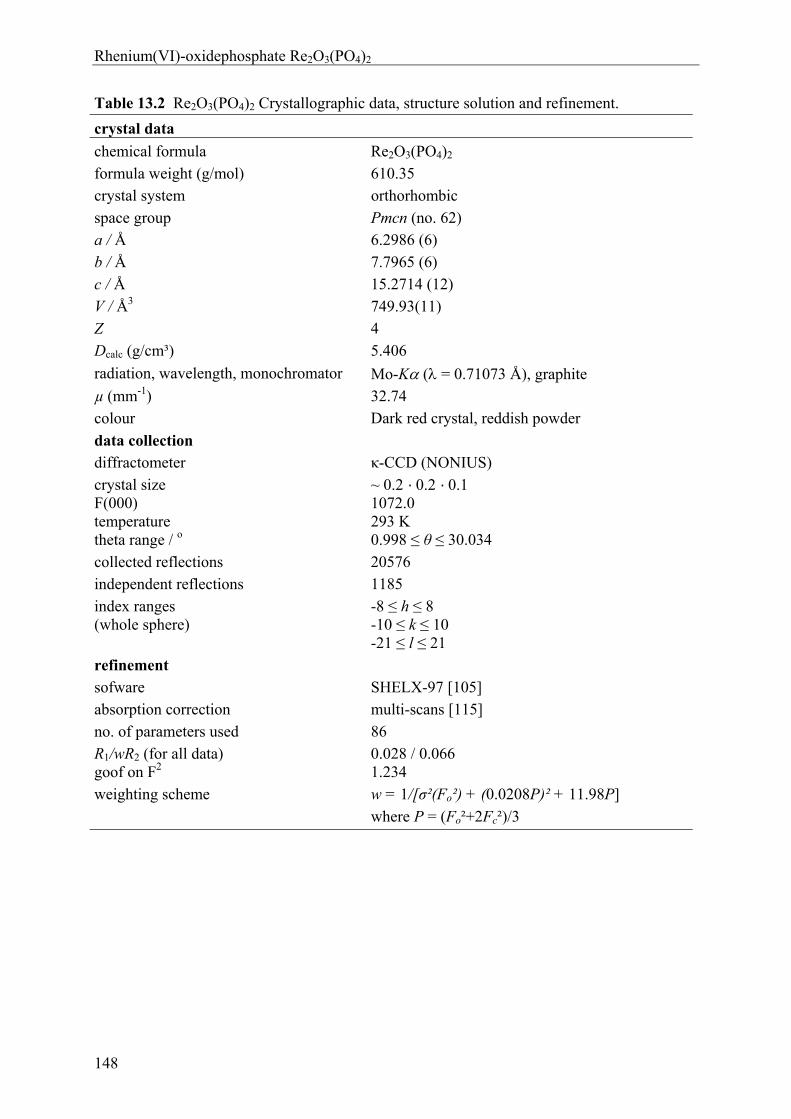
Rhenium(VI)-oxidephosphate Re2O3(PO4)2
148
Table 13.2 Re2O3(PO4)2 Crystallographic data, structure solution and refinement.
crystal data
chemical formula Re2O3(PO4)2
formula weight (g/mol) 610.35 crystal system orthorhombic
space group Pmcn (no. 62) a / Å 6.2986 (6)
b / Å 7.7965 (6) c / Å 15.2714 (12)
V / Å3 749.93(11)
Z 4
Dcalc (g/cm³) 5.406
radiation, wavelength, monochromator Mo-K ( = 0.71073 Å), graphite µ (mm-1) 32.74 colour Dark red crystal, reddish powder
data collection diffractometer κ-CCD (NONIUS)
crystal size F(000) temperature theta range / o
~ 0.2 · 0.2 · 0.1 1072.0 293 K 0.998 ≤ θ ≤ 30.034
collected reflections 20576 independent reflections 1185
index ranges (whole sphere)
-8 ≤ h ≤ 8 -10 ≤ k ≤ 10 -21 ≤ l ≤ 21
refinement
sofware SHELX-97 [105] absorption correction multi-scans [115]
no. of parameters used 86 R1/wR2 (for all data) goof on F2
0.028 / 0.066 1.234
weighting scheme w = 1/[σ²(Fo²) + (0.0208P)² + 11.98P]
where P = (Fo²+2Fc²)/3
Rhenium(VI)-oxidephosphate Re2O3(PO4)2
149
Table 13.3 Re2O3(PO4)2. Atomic coordinates and displacement parameters. Standard deviations are given in parentheses. atom x y z Ueq [Å
2] a
Re1 1/4 0.5522(4) 0.2865(2) 0.0084(1) Re2 1/4 0.2430(0) -0.0292(2) 0.0068(1) P1 1/4 0.3765(2) -0.2387(1) 0.0076(3) P2 1/4 0.6406(2) 0.0665(1) 0.0064(3) O1 1/4 0.7543(8) -0.1675(4) 0.0206(16) O2 1/4 0.4343(7) 0.3908(4) 0.0097(11) O3 1/4 0.3099(8) 0.2311(4) 0.0122(12) O4 1/4 0.3941(7) -0.1393(3) 0.0135(13) O5 1/4 0.1163(8) 0.0587(4 0.0146(13) O6 1/4 0.6386(8) 0.1657(4) 0.0157(13) O7 1/4 0.4574(9) 0.0346(5) 0.0400(28) O8 0.4416(8) 0.4725(6) -0.2774(3) 0.0142(9) O9 0.0606(10) 0.7396(8) 0.0324(3) 0.0297(15)
Ueq = (⅓)ijUijai*aj
*aiaj
Table 13.4 Selected interatomic distances (Å) and angles (°) for Re2O3(PO4)2. Standard deviations are given in parentheses.
d(Re1-O1t) 1.662(6) d(Re2-O5t) 1.667(6) d(Re1-O2b) 1.838(6) d(Re2-O2b) 1.844(5)
d(Re1-O8) 2x 1.957(5) d(Re2-O7) 1.935(7)
d(Re1-O6) 1.964(6) d(Re2-O9) 2x 1.961(6) d(Re1-O3) 2.070(6) d(Re2-O4) 2.053(6)
(Re1,O2,Re2) 161.4(4)
d(P1-O3) 1.524(6) d(P2-O7) 1.508(7) d(P1-O4) 1.525(6) d(P2-O9) 2x 1.513(5) d(P1-O8) 2x 1.537(5) d(P2-O6) 1.515(6)
(Re1,O6,P2) 160.5(4) (Re2,O4,P1) 139.8(4)
(Re1,O8,P1) 139.3(3) (Re2,O7,P2) 168.6(6)
(Re1,O3,P1) 138.3(4) (Re2,O9,P2) 146.1(4)
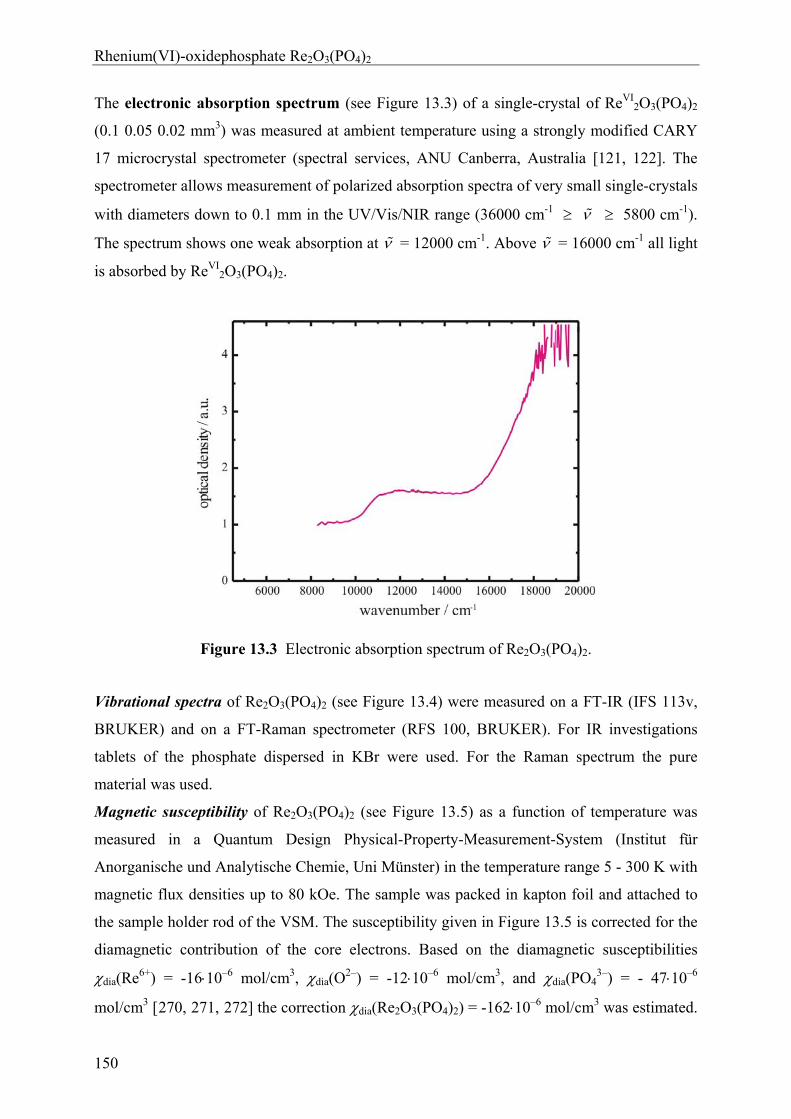
Rhenium(VI)-oxidephosphate Re2O3(PO4)2
150
The electronic absorption spectrum (see Figure 13.3) of a single-crystal of ReVI2O3(PO4)2
(0.1 0.05 0.02 mm3) was measured at ambient temperature using a strongly modified CARY
17 microcrystal spectrometer (spectral services, ANU Canberra, Australia [121, 122]. The
spectrometer allows measurement of polarized absorption spectra of very small single-crystals
with diameters down to 0.1 mm in the UV/Vis/NIR range (36000 cm-1 5800 cm-1).
The spectrum shows one weak absorption at = 12000 cm-1. Above = 16000 cm-1 all light
is absorbed by ReVI2O3(PO4)2.
Figure 13.3 Electronic absorption spectrum of Re2O3(PO4)2.
Vibrational spectra of Re2O3(PO4)2 (see Figure 13.4) were measured on a FT-IR (IFS 113v,
BRUKER) and on a FT-Raman spectrometer (RFS 100, BRUKER). For IR investigations
tablets of the phosphate dispersed in KBr were used. For the Raman spectrum the pure
material was used.
Magnetic susceptibility of Re2O3(PO4)2 (see Figure 13.5) as a function of temperature was
measured in a Quantum Design Physical-Property-Measurement-System (Institut für
Anorganische und Analytische Chemie, Uni Münster) in the temperature range 5 - 300 K with
magnetic flux densities up to 80 kOe. The sample was packed in kapton foil and attached to
the sample holder rod of the VSM. The susceptibility given in Figure 13.5 is corrected for the
diamagnetic contribution of the core electrons. Based on the diamagnetic susceptibilities
dia(Re6+) = -1610–6 mol/cm3, dia(O2–) = -1210–6 mol/cm3, and dia(PO4
3–) = - 4710–6
mol/cm3 [270, 271, 272] the correction dia(Re2O3(PO4)2) = -16210–6 mol/cm3 was estimated.
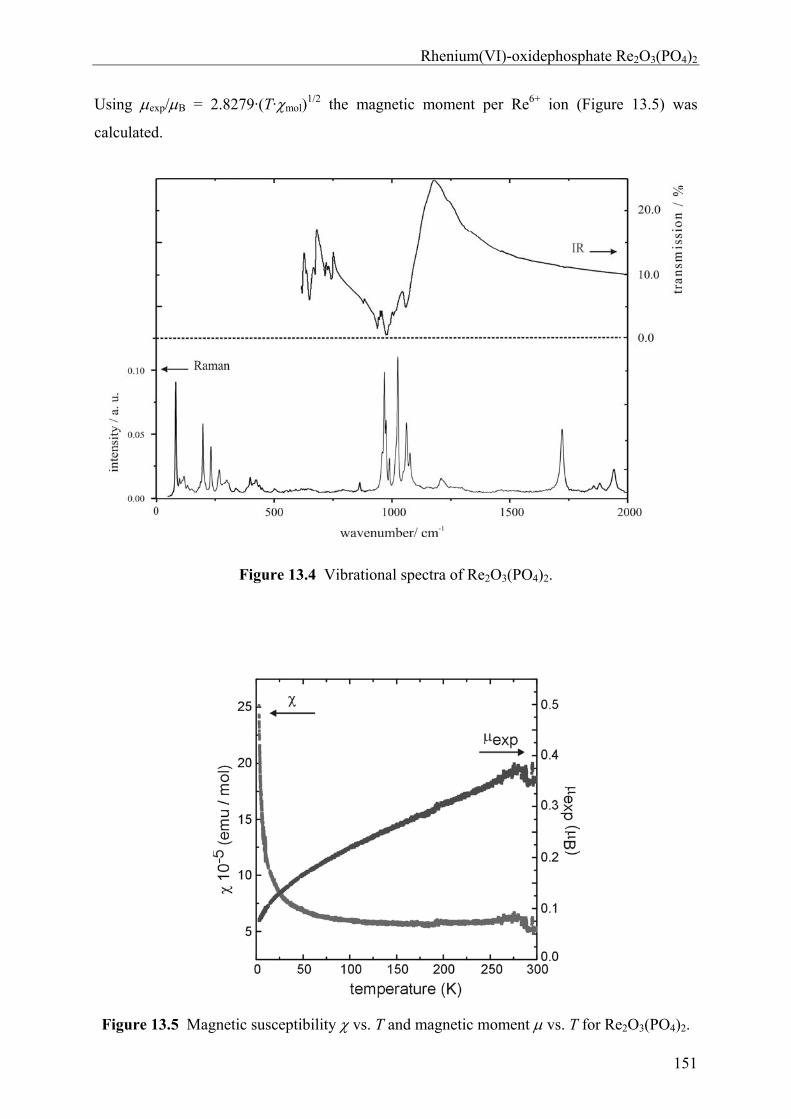
Rhenium(VI)-oxidephosphate Re2O3(PO4)2
151
Using exp/B = 2.8279·(T·mol)1/2 the magnetic moment per Re6+ ion (Figure 13.5) was
calculated.
Figure 13.4 Vibrational spectra of Re2O3(PO4)2.
Figure 13.5 Magnetic susceptibility vs. T and magnetic moment vs. T for Re2O3(PO4)2.
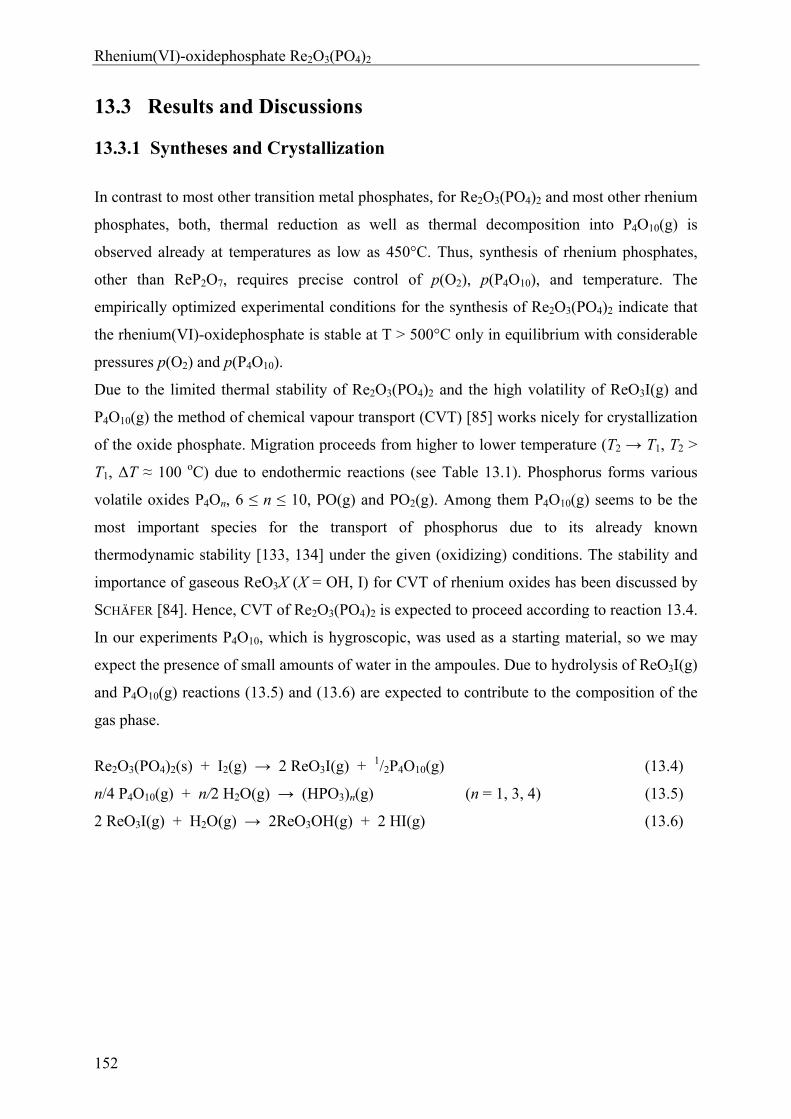
Rhenium(VI)-oxidephosphate Re2O3(PO4)2
152
13.3 Results and Discussions
13.3.1 Syntheses and Crystallization
In contrast to most other transition metal phosphates, for Re2O3(PO4)2 and most other rhenium
phosphates, both, thermal reduction as well as thermal decomposition into P4O10(g) is
observed already at temperatures as low as 450°C. Thus, synthesis of rhenium phosphates,
other than ReP2O7, requires precise control of p(O2), p(P4O10), and temperature. The
empirically optimized experimental conditions for the synthesis of Re2O3(PO4)2 indicate that
the rhenium(VI)-oxidephosphate is stable at T > 500°C only in equilibrium with considerable
pressures p(O2) and p(P4O10).
Due to the limited thermal stability of Re2O3(PO4)2 and the high volatility of ReO3I(g) and
P4O10(g) the method of chemical vapour transport (CVT) [85] works nicely for crystallization
of the oxide phosphate. Migration proceeds from higher to lower temperature (T2 → T1, T2 >
T1, ΔT ≈ 100 oC) due to endothermic reactions (see Table 13.1). Phosphorus forms various
volatile oxides P4On, 6 ≤ n ≤ 10, PO(g) and PO2(g). Among them P4O10(g) seems to be the
most important species for the transport of phosphorus due to its already known
thermodynamic stability [133, 134] under the given (oxidizing) conditions. The stability and
importance of gaseous ReO3X (X = OH, I) for CVT of rhenium oxides has been discussed by
SCHÄFER [84]. Hence, CVT of Re2O3(PO4)2 is expected to proceed according to reaction 13.4.
In our experiments P4O10, which is hygroscopic, was used as a starting material, so we may
expect the presence of small amounts of water in the ampoules. Due to hydrolysis of ReO3I(g)
and P4O10(g) reactions (13.5) and (13.6) are expected to contribute to the composition of the
gas phase.
Re2O3(PO4)2(s) + I2(g) → 2 ReO3I(g) + 1/2P4O10(g) (13.4)
n/4 P4O10(g) + n/2 H2O(g) → (HPO3)n(g) (n = 1, 3, 4) (13.5)
2 ReO3I(g) + H2O(g) → 2ReO3OH(g) + 2 HI(g) (13.6)
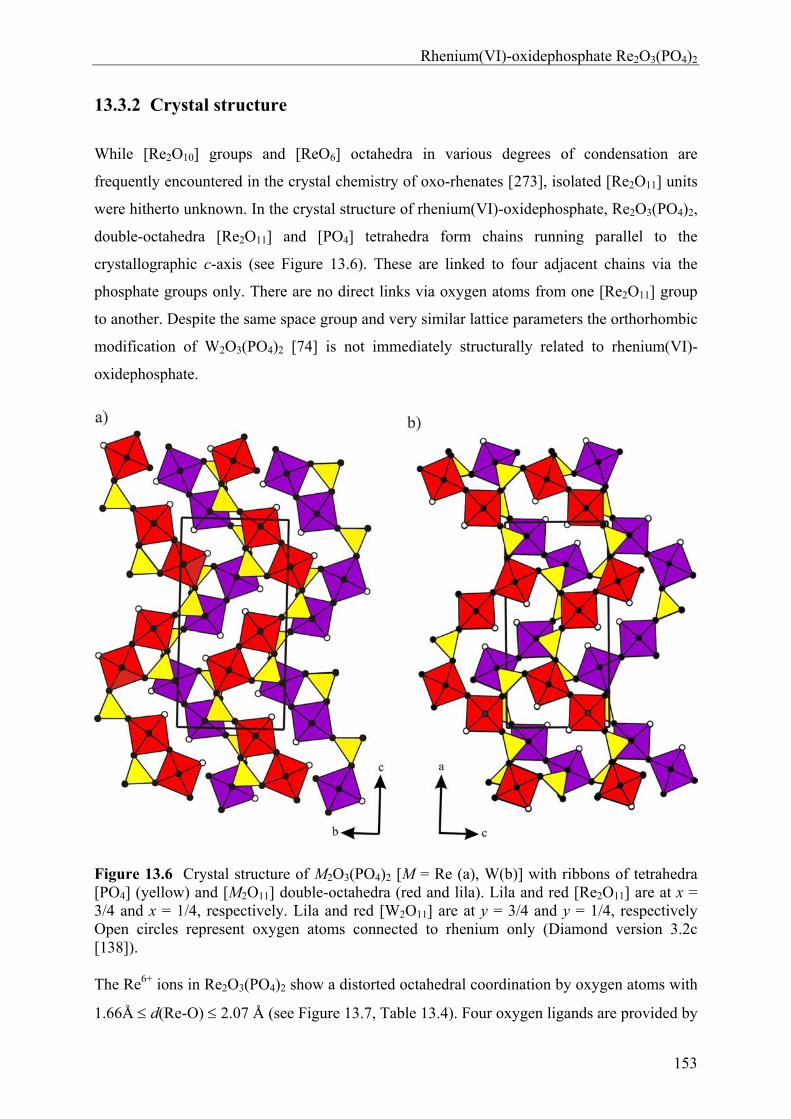
Rhenium(VI)-oxidephosphate Re2O3(PO4)2
153
13.3.2 Crystal structure
While [Re2O10] groups and [ReO6] octahedra in various degrees of condensation are
frequently encountered in the crystal chemistry of oxo-rhenates [273], isolated [Re2O11] units
were hitherto unknown. In the crystal structure of rhenium(VI)-oxidephosphate, Re2O3(PO4)2,
double-octahedra [Re2O11] and [PO4] tetrahedra form chains running parallel to the
crystallographic c-axis (see Figure 13.6). These are linked to four adjacent chains via the
phosphate groups only. There are no direct links via oxygen atoms from one [Re2O11] group
to another. Despite the same space group and very similar lattice parameters the orthorhombic
modification of W2O3(PO4)2 [74] is not immediately structurally related to rhenium(VI)-
oxidephosphate.
Figure 13.6 Crystal structure of M2O3(PO4)2 [M = Re (a), W(b)] with ribbons of tetrahedra [PO4] (yellow) and [M2O11] double-octahedra (red and lila). Lila and red [Re2O11] are at x = 3/4 and x = 1/4, respectively. Lila and red [W2O11] are at y = 3/4 and y = 1/4, respectively Open circles represent oxygen atoms connected to rhenium only (Diamond version 3.2c [138]).
The Re6+ ions in Re2O3(PO4)2 show a distorted octahedral coordination by oxygen atoms with
1.66Å d(Re-O) 2.07 Å (see Figure 13.7, Table 13.4). Four oxygen ligands are provided by
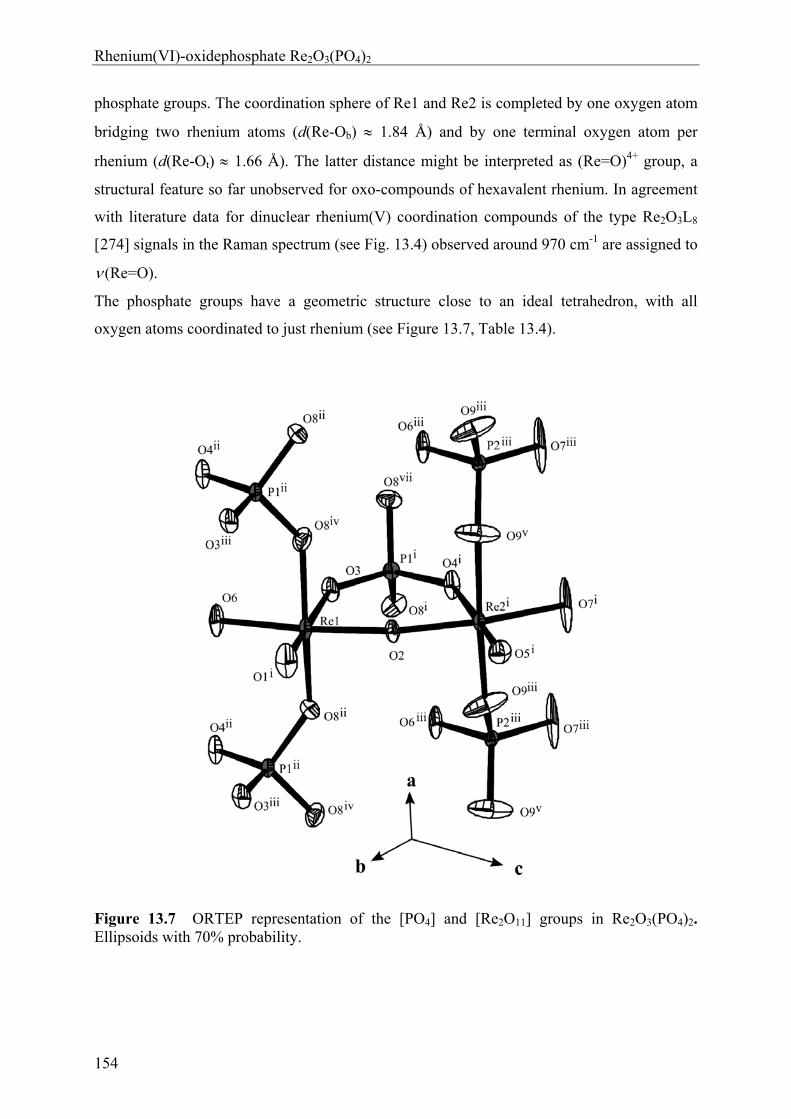
Rhenium(VI)-oxidephosphate Re2O3(PO4)2
154
phosphate groups. The coordination sphere of Re1 and Re2 is completed by one oxygen atom
bridging two rhenium atoms (d(Re-Ob) 1.84 Å) and by one terminal oxygen atom per
rhenium (d(Re-Ot) 1.66 Å). The latter distance might be interpreted as (Re=O)4+ group, a
structural feature so far unobserved for oxo-compounds of hexavalent rhenium. In agreement
with literature data for dinuclear rhenium(V) coordination compounds of the type Re2O3L8
[274] signals in the Raman spectrum (see Fig. 13.4) observed around 970 cm-1 are assigned to
(Re=O).
The phosphate groups have a geometric structure close to an ideal tetrahedron, with all
oxygen atoms coordinated to just rhenium (see Figure 13.7, Table 13.4).
Figure 13.7 ORTEP representation of the [PO4] and [Re2O11] groups in Re2O3(PO4)2. Ellipsoids with 70% probability.
Rhenium(VI)-oxidephosphate Re2O3(PO4)2
155
13.3.3 Electronic structure
Due to the low symmetry of the ligand-field around the Re6+ ions and the strong interaction
between rhenium and the double-bonded oxygen a quantitative treatment of the Re6+ d-
electron states was not attempted. The rather low magnetic moment observed for Re6+ in
Re2O3(PO4)2 (0.07 µexp/µB 0.38; 1.4 K T 300 K; Figure 13.5) and its strong
temperature dependence is indicative for strong spin-orbit coupling, as expected for a 5d1
system [229]. In addition, the temperature dependence might be a consequence of the low-
symmetry ligand field. We relate the absorption band observed around = 12000 cm-1 (see
Figure 13.3) to a d-d electronic transition, due to its rather low absorbance. The strong
absorption at > 16000 cm-1 is likely to originate from a charge transfer transition O2
Re6+. Whether additional d-d transitions at higher wavenumbers are thus obscured remains
unclear.
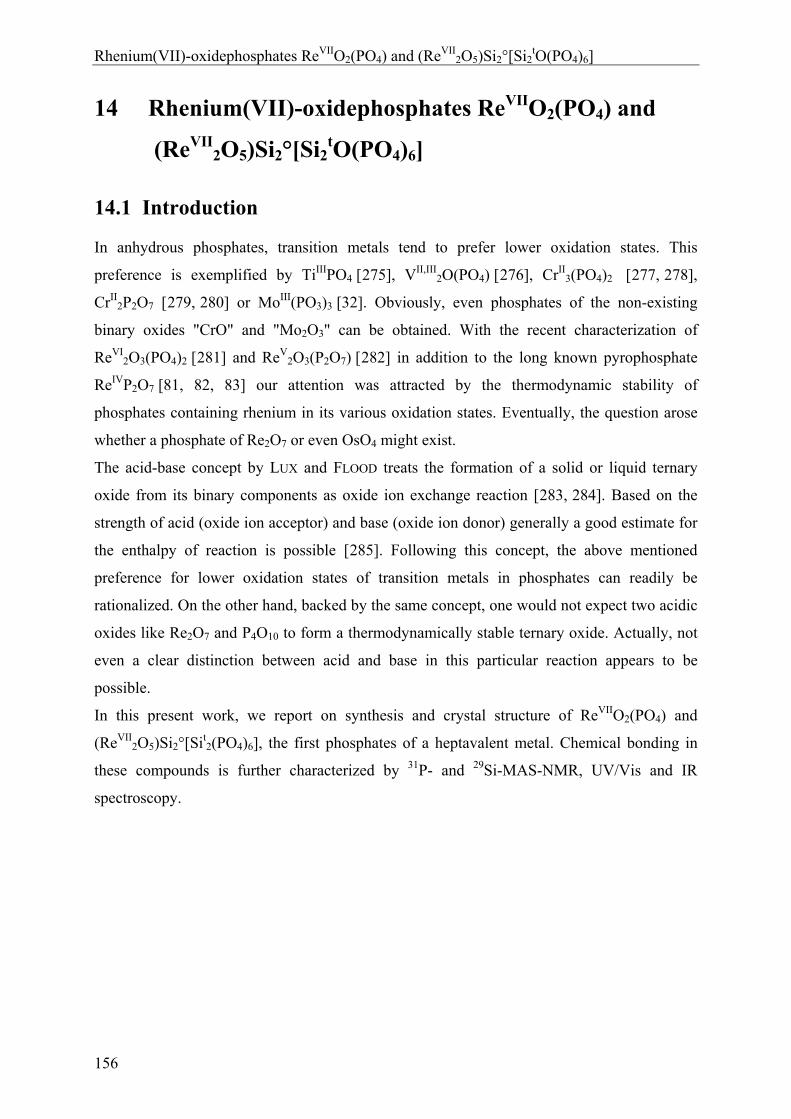
Rhenium(VII)-oxidephosphates ReVIIO2(PO4) and (ReVII2O5)Si2°[Si2
tO(PO4)6]
156
14 Rhenium(VII)-oxidephosphates ReVIIO2(PO4) and
(ReVII2O5)Si2°[Si2
tO(PO4)6]
14.1 Introduction
In anhydrous phosphates, transition metals tend to prefer lower oxidation states. This
preference is exemplified by TiIIIPO4 [275], VII,III2O(PO4) [276], CrII
3(PO4)2 [277, 278],
CrII2P2O7 [279, 280] or MoIII(PO3)3 [32]. Obviously, even phosphates of the non-existing
binary oxides "CrO" and "Mo2O3" can be obtained. With the recent characterization of
ReVI2O3(PO4)2 [281] and ReV
2O3(P2O7) [282] in addition to the long known pyrophosphate
ReIVP2O7 [81, 82, 83] our attention was attracted by the thermodynamic stability of
phosphates containing rhenium in its various oxidation states. Eventually, the question arose
whether a phosphate of Re2O7 or even OsO4 might exist.
The acid-base concept by LUX and FLOOD treats the formation of a solid or liquid ternary
oxide from its binary components as oxide ion exchange reaction [283, 284]. Based on the
strength of acid (oxide ion acceptor) and base (oxide ion donor) generally a good estimate for
the enthalpy of reaction is possible [285]. Following this concept, the above mentioned
preference for lower oxidation states of transition metals in phosphates can readily be
rationalized. On the other hand, backed by the same concept, one would not expect two acidic
oxides like Re2O7 and P4O10 to form a thermodynamically stable ternary oxide. Actually, not
even a clear distinction between acid and base in this particular reaction appears to be
possible.
In this present work, we report on synthesis and crystal structure of ReVIIO2(PO4) and
(ReVII2O5)Si2°[Sit
2(PO4)6], the first phosphates of a heptavalent metal. Chemical bonding in
these compounds is further characterized by 31P- and 29Si-MAS-NMR, UV/Vis and IR
spectroscopy.
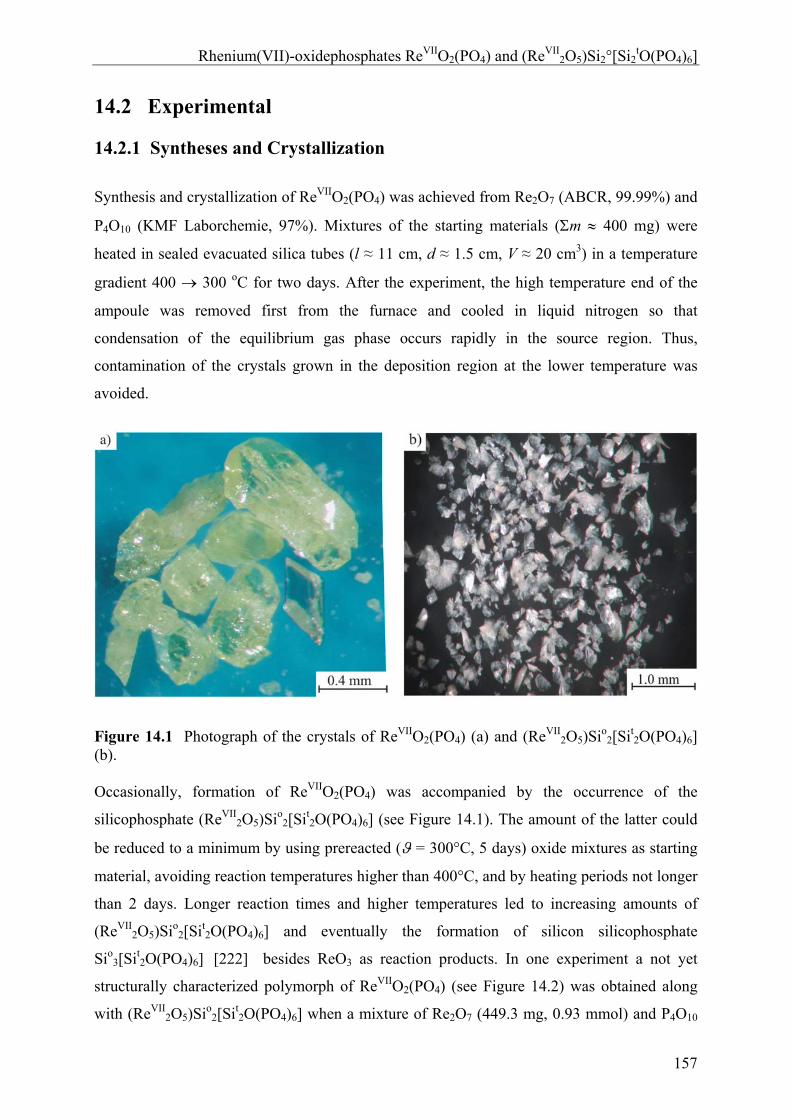
Rhenium(VII)-oxidephosphates ReVIIO2(PO4) and (ReVII2O5)Si2°[Si2
tO(PO4)6]
157
14.2 Experimental
14.2.1 Syntheses and Crystallization
Synthesis and crystallization of ReVIIO2(PO4) was achieved from Re2O7 (ABCR, 99.99%) and
P4O10 (KMF Laborchemie, 97%). Mixtures of the starting materials (m 400 mg) were
heated in sealed evacuated silica tubes (l ≈ 11 cm, d ≈ 1.5 cm, V ≈ 20 cm3) in a temperature
gradient 400 300 oC for two days. After the experiment, the high temperature end of the
ampoule was removed first from the furnace and cooled in liquid nitrogen so that
condensation of the equilibrium gas phase occurs rapidly in the source region. Thus,
contamination of the crystals grown in the deposition region at the lower temperature was
avoided.
Figure 14.1 Photograph of the crystals of ReVIIO2(PO4) (a) and (ReVII2O5)Sio
2[Sit2O(PO4)6]
(b).
Occasionally, formation of ReVIIO2(PO4) was accompanied by the occurrence of the
silicophosphate (ReVII2O5)Sio
2[Sit2O(PO4)6] (see Figure 14.1). The amount of the latter could
be reduced to a minimum by using prereacted ( = 300°C, 5 days) oxide mixtures as starting
material, avoiding reaction temperatures higher than 400°C, and by heating periods not longer
than 2 days. Longer reaction times and higher temperatures led to increasing amounts of
(ReVII2O5)Sio
2[Sit2O(PO4)6] and eventually the formation of silicon silicophosphate
Sio3[Sit
2O(PO4)6] [222] besides ReO3 as reaction products. In one experiment a not yet
structurally characterized polymorph of ReVIIO2(PO4) (see Figure 14.2) was obtained along
with (ReVII2O5)Sio
2[Sit2O(PO4)6] when a mixture of Re2O7 (449.3 mg, 0.93 mmol) and P4O10
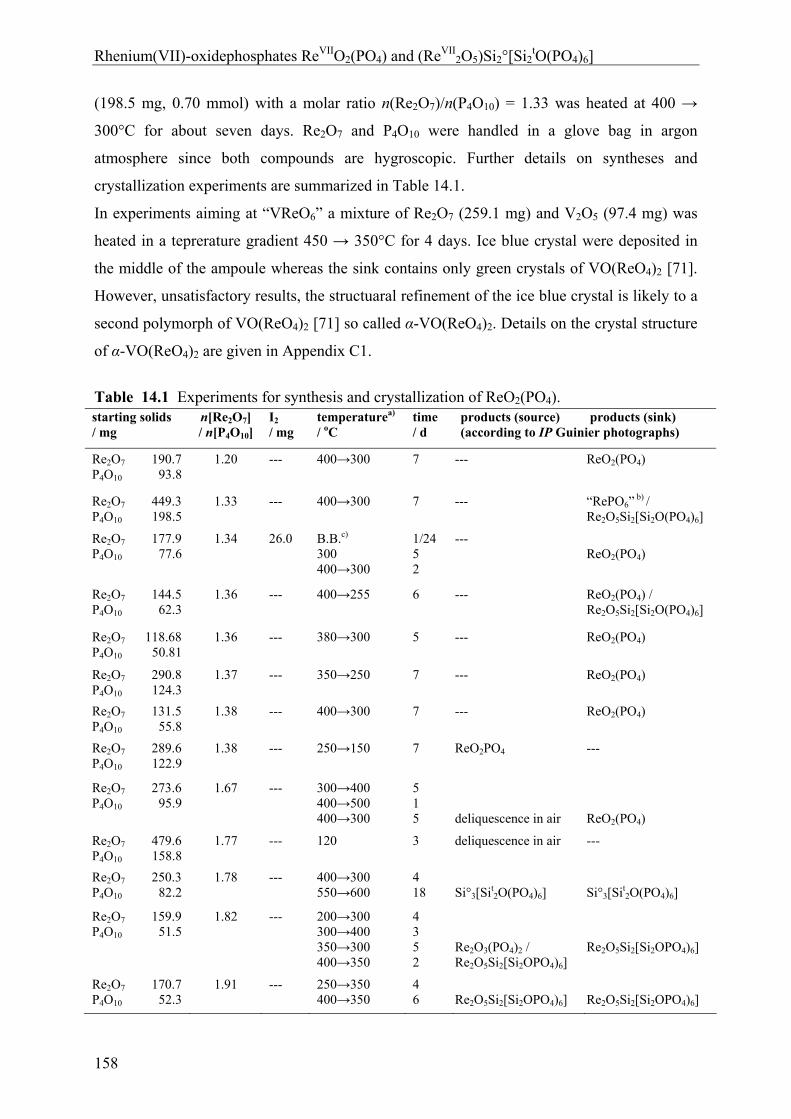
Rhenium(VII)-oxidephosphates ReVIIO2(PO4) and (ReVII2O5)Si2°[Si2
tO(PO4)6]
158
(198.5 mg, 0.70 mmol) with a molar ratio n(Re2O7)/n(P4O10) = 1.33 was heated at 400 →
300°C for about seven days. Re2O7 and P4O10 were handled in a glove bag in argon
atmosphere since both compounds are hygroscopic. Further details on syntheses and
crystallization experiments are summarized in Table 14.1.
In experiments aiming at “VReO6” a mixture of Re2O7 (259.1 mg) and V2O5 (97.4 mg) was
heated in a teprerature gradient 450 → 350°C for 4 days. Ice blue crystal were deposited in
the middle of the ampoule whereas the sink contains only green crystals of VO(ReO4)2 [71].
However, unsatisfactory results, the structuaral refinement of the ice blue crystal is likely to a
second polymorph of VO(ReO4)2 [71] so called α-VO(ReO4)2. Details on the crystal structure
of α-VO(ReO4)2 are given in Appendix C1.
Table 14.1 Experiments for synthesis and crystallization of ReO2(PO4). starting solids / mg
n[Re2O7] / n[P4O10]
I2
/ mg temperaturea) / oC
time / d
products (source) products (sink) (according to IP Guinier photographs)
Re2O7 190.7 P4O10 93.8
1.20 --- 400→300 7 --- ReO2(PO4)
Re2O7 449.3 P4O10 198.5
1.33 --- 400→300 7 --- “RePO6” b) /
Re2O5Si2[Si2O(PO4)6]
Re2O7 177.9 P4O10 77.6
1.34 26.0 B.B.c) 300 400→300
1/24 5 2
---
ReO2(PO4)
Re2O7 144.5 P4O10 62.3
1.36 --- 400→255 6 --- ReO2(PO4) / Re2O5Si2[Si2O(PO4)6]
Re2O7 118.68 P4O10 50.81
1.36 --- 380→300 5 --- ReO2(PO4)
Re2O7 290.8 P4O10 124.3
1.37 --- 350→250 7 --- ReO2(PO4)
Re2O7 131.5 P4O10 55.8
1.38 --- 400→300 7 --- ReO2(PO4)
Re2O7 289.6 P4O10 122.9
1.38 --- 250→150 7 ReO2PO4 ---
Re2O7 273.6 P4O10 95.9
1.67 --- 300→400 400→500 400→300
5 1 5
deliquescence in air
ReO2(PO4)
Re2O7 479.6 P4O10 158.8
1.77 --- 120
3 deliquescence in air ---
Re2O7 250.3 P4O10 82.2
1.78 --- 400→300 550→600
4 18
Si°3[Sit
2O(PO4)6] Si°3[Sit
2O(PO4)6]
Re2O7 159.9 P4O10 51.5
1.82 --- 200→300 300→400 350→300 400→350
4 3 5 2
Re2O3(PO4)2 / Re2O5Si2[Si2OPO4)6]
Re2O5Si2[Si2OPO4)6]
Re2O7 170.7 P4O10 52.3
1.91 --- 250→350 400→350
4 6
Re2O5Si2[Si2OPO4)6]
Re2O5Si2[Si2OPO4)6]
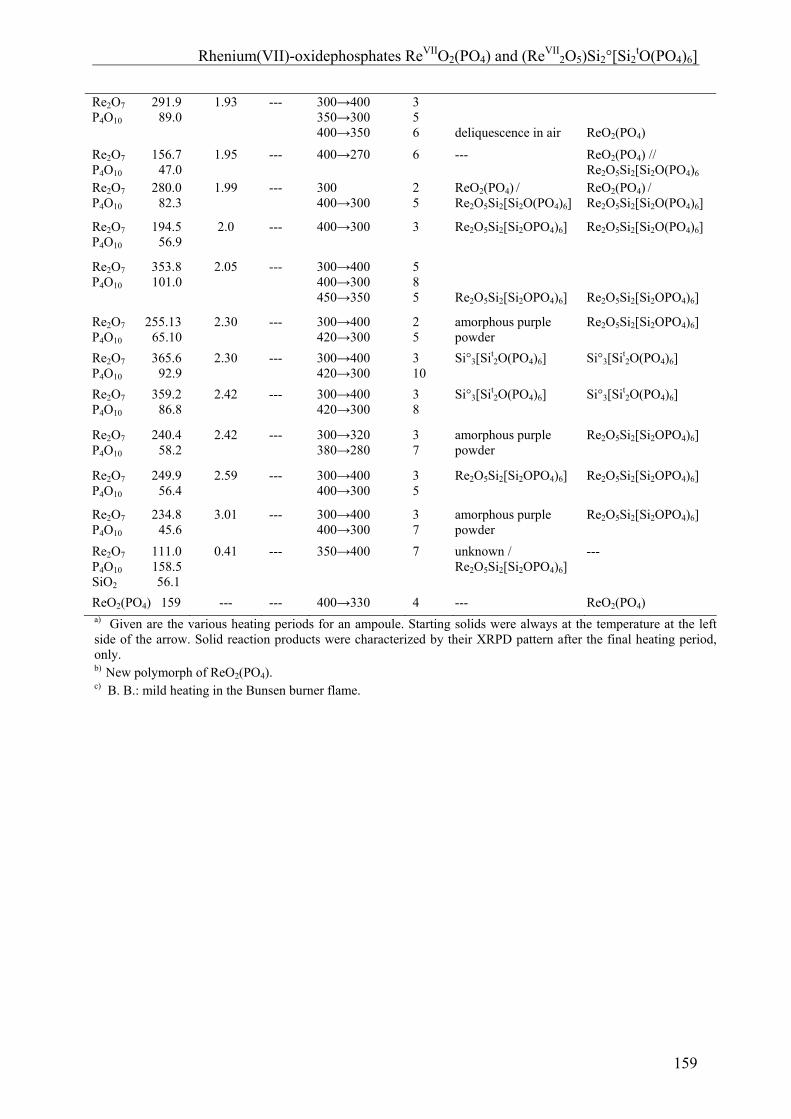
Rhenium(VII)-oxidephosphates ReVIIO2(PO4) and (ReVII2O5)Si2°[Si2
tO(PO4)6]
159
Re2O7 291.9 P4O10 89.0
1.93 --- 300→400 350→300 400→350
3 5 6
deliquescence in air
ReO2(PO4)
Re2O7 156.7 P4O10 47.0
1.95 --- 400→270 6 --- ReO2(PO4) // Re2O5Si2[Si2O(PO4)6
Re2O7 280.0 P4O10 82.3
1.99 --- 300 400→300
2 5
ReO2(PO4) /
Re2O5Si2[Si2O(PO4)6]
ReO2(PO4) / Re2O5Si2[Si2O(PO4)6]
Re2O7 194.5 P4O10 56.9
2.0 --- 400→300 3 Re2O5Si2[Si2OPO4)6] Re2O5Si2[Si2O(PO4)6]
Re2O7 353.8 P4O10 101.0
2.05 --- 300→400 400→300 450→350
5 8 5
Re2O5Si2[Si2OPO4)6]
Re2O5Si2[Si2OPO4)6]
Re2O7 255.13 P4O10 65.10
2.30 --- 300→400 420→300
2 5
amorphous purple powder
Re2O5Si2[Si2OPO4)6]
Re2O7 365.6 P4O10 92.9
2.30 --- 300→400 420→300
3 10
Si°3[Sit2O(PO4)6] Si°3[Sit
2O(PO4)6]
Re2O7 359.2 P4O10 86.8
2.42 --- 300→400 420→300
3 8
Si°3[Sit2O(PO4)6] Si°3[Sit
2O(PO4)6]
Re2O7 240.4 P4O10 58.2
2.42 --- 300→320 380→280
3 7
amorphous purple powder
Re2O5Si2[Si2OPO4)6]
Re2O7 249.9 P4O10 56.4
2.59 --- 300→400 400→300
3 5
Re2O5Si2[Si2OPO4)6] Re2O5Si2[Si2OPO4)6]
Re2O7 234.8 P4O10 45.6
3.01 --- 300→400 400→300
3 7
amorphous purple powder
Re2O5Si2[Si2OPO4)6]
Re2O7 111.0 P4O10 158.5 SiO2 56.1
0.41 --- 350→400 7 unknown / Re2O5Si2[Si2OPO4)6]
---
ReO2(PO4) 159 --- --- 400→330 4 --- ReO2(PO4) a) Given are the various heating periods for an ampoule. Starting solids were always at the temperature at the left side of the arrow. Solid reaction products were characterized by their XRPD pattern after the final heating period, only. b) New polymorph of ReO2(PO4). c) B. B.: mild heating in the Bunsen burner flame.
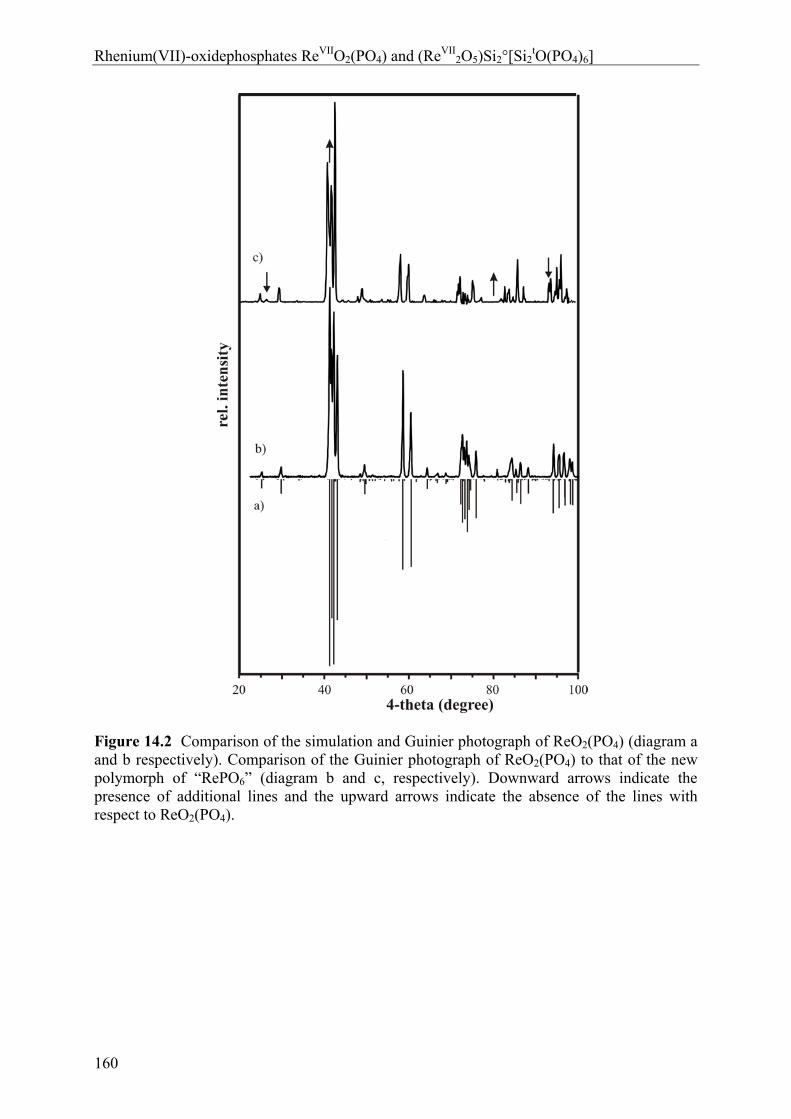
Rhenium(VII)-oxidephosphates ReVIIO2(PO4) and (ReVII2O5)Si2°[Si2
tO(PO4)6]
160
Figure 14.2 Comparison of the simulation and Guinier photograph of ReO2(PO4) (diagram a and b respectively). Comparison of the Guinier photograph of ReO2(PO4) to that of the new polymorph of “RePO6” (diagram b and c, respectively). Downward arrows indicate the presence of additional lines and the upward arrows indicate the absence of the lines with respect to ReO2(PO4).
Rhenium(VII)-oxidephosphates ReVIIO2(PO4) and (ReVII2O5)Si2°[Si2
tO(PO4)6]
161
14.2.2 Characterizations
For identification and examination of the purity of the obtained solids image-plate (IP)
Guinier-photographs (Guinier camera FR-552 Enraf-Nonius, quartz-monochromator, Cu-
K1 radiation, = 1.54052 Å, BAS-TR 2025 image plate film (Fuji), BAS-1800 scanner
(Fuji), software: BASREADER, [151], AIDA [91] for digitization) were taken. Details on this
method were already reported in literature [90, 152, 153]. During X-ray exposure the samples
were protected from air by scotch tape. Assignment of the powder pattern of
(ReVII2O5)Sio
2[Sit2O(PO4)6] led to a = 7.862(9) Å, b = 7.868(8) Å, c = 10.813(11) Å, α =
85.22(10)°, β = 73.071(10)°, and γ = 60.06(9)° (83 reflections with 27.05° 4θ 99.92°)
which is close to the values from the X-ray single-crystal measurement. Rather high standard
deviations of the derived cell parameters for this triclinic unit cell might be a consequence of
the overlapping of many reflections in the powder pattern. Therefore, the final refinement was
restricted to the cell parameters obtained from the X-ray single-crystal study.
In a first attempt single-crystal intensity data of ReVIIO2(PO4) were measured on a κ-CCD
diffractometer (Enraf-Nonius Inc.) up to 2θ = 70° at ambient temperature. Solution of the
crystal structure with Direct Methods (SHELX-97 [105] suite in the WinGX [137]
framework) led to a monoclinic structure model with space group C2/c. Though crystal
chemically reasonable, refinement of the model converged only at high residuals R1 = 0.16,
wR2 = 0.47. An attempt to obtain better starting parameters for the structure refinement with
SUPERPFLIP [114] failed.
In a second attempt another single-crystal data set was measured up to 2θ = 90° at 123 K.
These data were initially indexed on the basis of a triclinic cell (P1, a = 8.323(1) Å, b =
8.356(6) Å, c = 20.6474(2) Å, α = 87.32(0)°, β = 87.21(1)°, γ = 60.58(0)°). A triclinic
structure model was obtained by SUPERFLIP [114] and refined using SHELX-97 [105] in the
WinGX [137] framework. Refinement of this model led to R1 = 0.075, wR2 = 0.23 and
residual electron density maxima at 21.2 Å-3 (close to one Re) and -18.9Å-3 (close to another
Re). Program KPLOT [137] was used, in order to search for higher symmetry. Thus, on the
basis of the Re and P positions of the triclinic model, a monoclinic unit cell and space group
C2/c was suggested. The monoclinic unit cell (a = 14.403(1) Å, b = 8.412(1) Å, c = 20.647(3)
Å, β = 93.16(8)°) is related to the triclinic cell by the transformation matrix [1 1 0 1 1 0 0 0
1 ]. Eventually, the starting parameters for the refinement of the monoclinic model were
obtained by SUPERFLIP [114]. The refinement with SHELX-97 [105] converged at R1 =
0.04 and wR2 = 0.10 leaving a residual electron density of 6.42 Å-3 (close to Re3) and -10.02
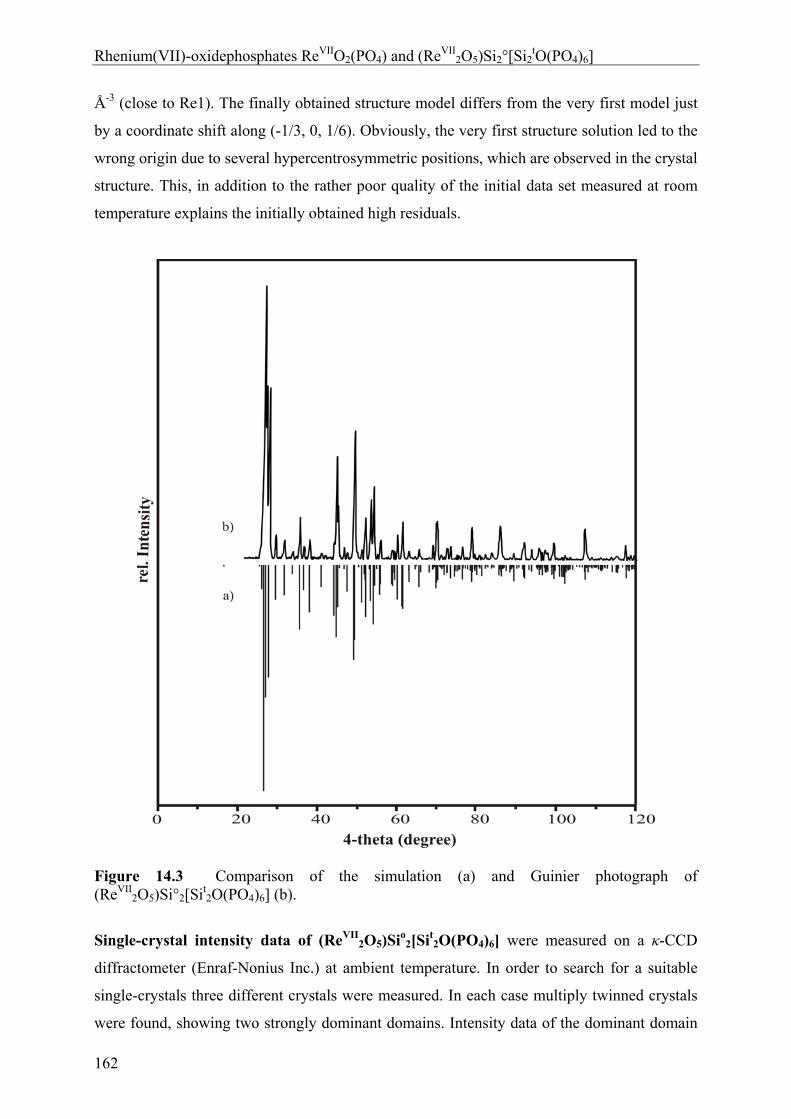
Rhenium(VII)-oxidephosphates ReVIIO2(PO4) and (ReVII2O5)Si2°[Si2
tO(PO4)6]
162
Å-3 (close to Re1). The finally obtained structure model differs from the very first model just
by a coordinate shift along (-1/3, 0, 1/6). Obviously, the very first structure solution led to the
wrong origin due to several hypercentrosymmetric positions, which are observed in the crystal
structure. This, in addition to the rather poor quality of the initial data set measured at room
temperature explains the initially obtained high residuals.
Figure 14.3 Comparison of the simulation (a) and Guinier photograph of (ReVII
2O5)Si°2[Sit2O(PO4)6] (b).
Single-crystal intensity data of (ReVII2O5)Sio
2[Sit2O(PO4)6] were measured on a κ-CCD
diffractometer (Enraf-Nonius Inc.) at ambient temperature. In order to search for a suitable
single-crystals three different crystals were measured. In each case multiply twinned crystals
were found, showing two strongly dominant domains. Intensity data of the dominant domain
Rhenium(VII)-oxidephosphates ReVIIO2(PO4) and (ReVII2O5)Si2°[Si2
tO(PO4)6]
163
were indexed and integrated. For structure determination and refinement SHELX-97 [105]
and WinGX [137] were used. Despite the relatively small residuals and reasonable
interatomic distances, two oxygen atoms (O1 and O12) showed “non positive definitive”
displacement parameters. We relate this problem to the limited quality of the data set obtained
from a multiply twinned crystal. Therefore, the structure was refined allowing for O1 and O12
isotropic displacement parameters only.
Details concerning data collection, structure solution and refinement of ReVIIO2(PO4) and
(ReVII2O5)Sio
2[Sit2O(PO4)6] are summarized in Table 14.2. The final atomic coordinates,
selected interatomic distances and angles for both compounds are given in table 14.3 - 14.6.
Indexing of the Guinier simulation and anisotropic displacement parameters are given in
Appendix B4 (Table B4.1, B4.3 and Table B4.2-B4.4).
Single-crystal X-ray study of α-vanadyl(V) rhenate. Intensity data were measured on a κ-
CCD diffractometer (Enraf-Nonius Inc.) at 123 K. Structure determination and refinement
was performed using the SHELX-97 [105] suite in WinGx [135] framework. Sarting
parameters for the single crystal structure refinement of α-(VO)(ReO4)2 were obtained by
direct methods in SHELXS [137]. Thus rhenium and vanadium positions were revealed.
Subsequent ∆-Fourier syntheses allowed the localization of the oxygen atoms. An empirical
absorption correction with mutiscan [115] was applied.
Details concerning the structure solution and the refinement, starting positional parameters,
interatomic distances and angles as well as anisotropic displacement parameters of α-
(VO)(ReO4)2 are given in Appendix as C1.
Energy-dispersive X-ray fluorescence analyses [116, 117, 118] (EDXS system, Thermo
NIS7 with a germanium detector) for ReVIIO2(PO4) and (ReVII2O5)Sio
2[Sit2O(PO4)6]) (EDAX
system, scanning microscope DMS 940, Zeiss) were performed. For both compounds the
results were in agreement with the composition from the structure determination. No additional
elements were detected.
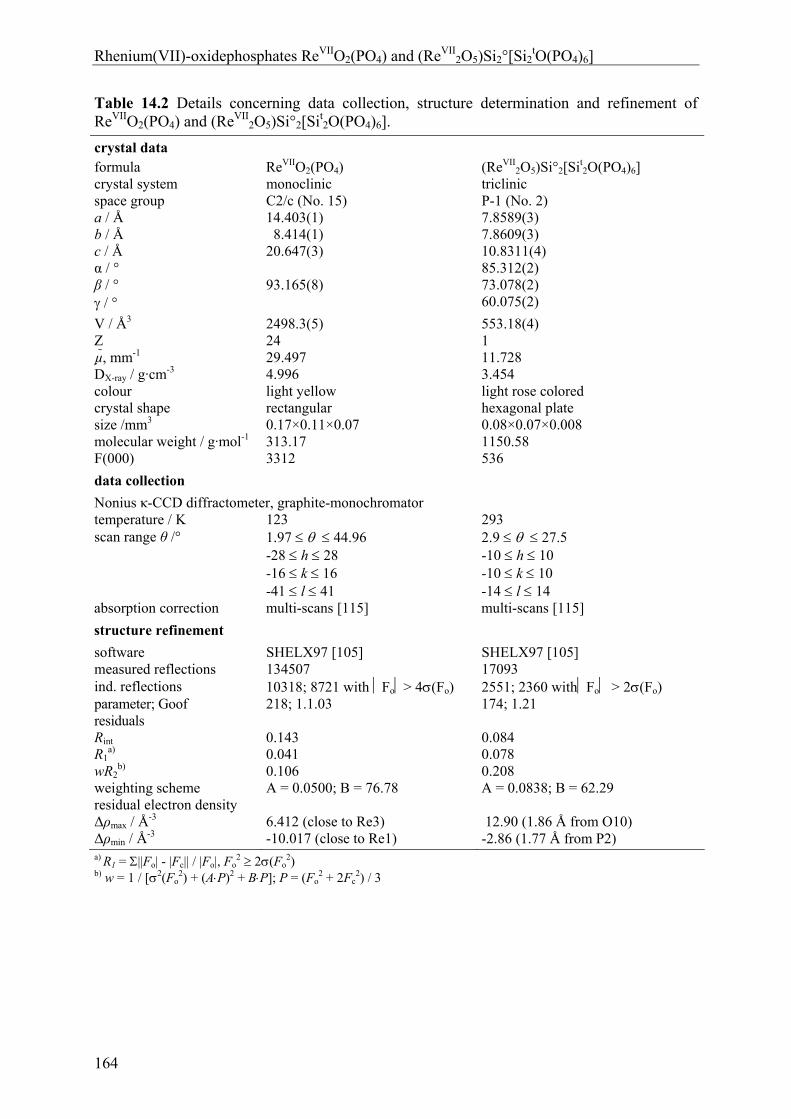
Rhenium(VII)-oxidephosphates ReVIIO2(PO4) and (ReVII2O5)Si2°[Si2
tO(PO4)6]
164
Table 14.2 Details concerning data collection, structure determination and refinement of ReVIIO2(PO4) and (ReVII
2O5)Si°2[Sit2O(PO4)6].
crystal data formula ReVIIO2(PO4) (ReVII
2O5)Si°2[Sit2O(PO4)6]
crystal system monoclinic triclinic space group C2/c (No. 15) P-1 (No. 2) a / Å b / Å c / Å α / ° β / ° / °
14.403(1) 8.414(1) 20.647(3) 93.165(8)
7.8589(3) 7.8609(3) 10.8311(4) 85.312(2) 73.078(2) 60.075(2)
V / Å3 2498.3(5) 553.18(4) Z 24 1 µ, mm-1 29.497 11.728 DX-ray / g·cm-3 4.996 3.454 colour light yellow light rose colored crystal shape size /mm3
rectangular 0.17×0.11×0.07
hexagonal plate 0.08×0.07×0.008
molecular weight / g·mol-1 313.17 1150.58 F(000) 3312 536
data collection
Nonius κ-CCD diffractometer, graphite-monochromator temperature / K 123 293 scan range θ /° 1.97 44.96 2.9 27.5
-28 h 28 -16 k 16 -41 l 41
-10 h 10 -10 k 10 -14 l 14
absorption correction multi-scans [115] multi-scans [115]
structure refinement
software SHELX97 [105] SHELX97 [105] measured reflections 134507 17093 ind. reflections 10318; 8721 with Fo> 4(Fo) 2551; 2360 withFo > 2(Fo) parameter; Goof 218; 1.1.03 174; 1.21 residuals Rint R1
a) wR2
b)
0.143 0.041 0.106
0.084 0.078 0.208
weighting scheme A = 0.0500; B = 76.78 A = 0.0838; B = 62.29 residual electron density Δρmax / Å
-3 Δρmin / Å
-3
6.412 (close to Re3) -10.017 (close to Re1)
12.90 (1.86 Å from O10) -2.86 (1.77 Å from P2)
a) R1 = ||Fo| - |Fc|| / |Fo|, Fo2 2(Fo
2) b) w = 1 / [2(Fo
2) + (AP)2 + BP]; P = (Fo2 + 2Fc
2) / 3
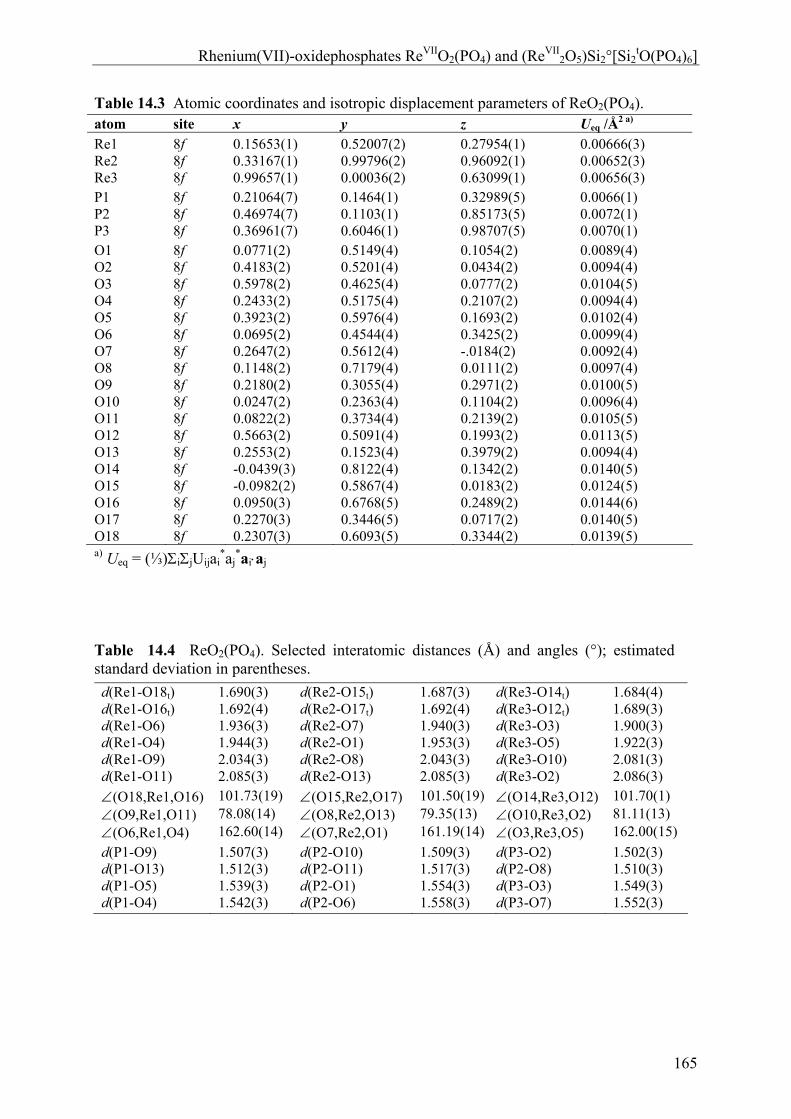
Rhenium(VII)-oxidephosphates ReVIIO2(PO4) and (ReVII2O5)Si2°[Si2
tO(PO4)6]
165
Table 14.3 Atomic coordinates and isotropic displacement parameters of ReO2(PO4). atom site x y z Ueq /Å2 a) Re1 8f 0.15653(1) 0.52007(2) 0.27954(1) 0.00666(3) Re2 8f 0.33167(1) 0.99796(2) 0.96092(1) 0.00652(3) Re3 8f 0.99657(1) 0.00036(2) 0.63099(1) 0.00656(3) P1 8f 0.21064(7) 0.1464(1) 0.32989(5) 0.0066(1) P2 8f 0.46974(7) 0.1103(1) 0.85173(5) 0.0072(1) P3 8f 0.36961(7) 0.6046(1) 0.98707(5) 0.0070(1) O1 8f 0.0771(2) 0.5149(4) 0.1054(2) 0.0089(4) O2 8f 0.4183(2) 0.5201(4) 0.0434(2) 0.0094(4) O3 8f 0.5978(2) 0.4625(4) 0.0777(2) 0.0104(5) O4 8f 0.2433(2) 0.5175(4) 0.2107(2) 0.0094(4) O5 8f 0.3923(2) 0.5976(4) 0.1693(2) 0.0102(4) O6 8f 0.0695(2) 0.4544(4) 0.3425(2) 0.0099(4) O7 8f 0.2647(2) 0.5612(4) -.0184(2) 0.0092(4) O8 8f 0.1148(2) 0.7179(4) 0.0111(2) 0.0097(4) O9 8f 0.2180(2) 0.3055(4) 0.2971(2) 0.0100(5) O10 8f 0.0247(2) 0.2363(4) 0.1104(2) 0.0096(4) O11 8f 0.0822(2) 0.3734(4) 0.2139(2) 0.0105(5) O12 8f 0.5663(2) 0.5091(4) 0.1993(2) 0.0113(5) O13 8f 0.2553(2) 0.1523(4) 0.3979(2) 0.0094(4) O14 8f -0.0439(3) 0.8122(4) 0.1342(2) 0.0140(5) O15 8f -0.0982(2) 0.5867(4) 0.0183(2) 0.0124(5) O16 8f 0.0950(3) 0.6768(5) 0.2489(2) 0.0144(6) O17 8f 0.2270(3) 0.3446(5) 0.0717(2) 0.0140(5) O18 8f 0.2307(3) 0.6093(5) 0.3344(2) 0.0139(5) a) Ueq = (⅓)ijUijai
*aj*aiaj
Table 14.4 ReO2(PO4). Selected interatomic distances (Å) and angles (°); estimated standard deviation in parentheses.
d(Re1-O18t) 1.690(3) d(Re2-O15t) 1.687(3) d(Re3-O14t) 1.684(4) d(Re1-O16t) 1.692(4) d(Re2-O17t) 1.692(4) d(Re3-O12t) 1.689(3) d(Re1-O6) 1.936(3) d(Re2-O7) 1.940(3) d(Re3-O3) 1.900(3) d(Re1-O4) 1.944(3) d(Re2-O1) 1.953(3) d(Re3-O5) 1.922(3) d(Re1-O9) 2.034(3) d(Re2-O8) 2.043(3) d(Re3-O10) 2.081(3) d(Re1-O11) 2.085(3) d(Re2-O13) 2.085(3) d(Re3-O2) 2.086(3)
(O18,Re1,O16) 101.73(19) (O15,Re2,O17) 101.50(19) (O14,Re3,O12) 101.70(1) (O9,Re1,O11) 78.08(14) (O8,Re2,O13) 79.35(13) (O10,Re3,O2) 81.11(13) (O6,Re1,O4) 162.60(14) (O7,Re2,O1) 161.19(14) (O3,Re3,O5) 162.00(15)
d(P1-O9) 1.507(3) d(P2-O10) 1.509(3) d(P3-O2) 1.502(3) d(P1-O13) 1.512(3) d(P2-O11) 1.517(3) d(P2-O8) 1.510(3) d(P1-O5) 1.539(3) d(P2-O1) 1.554(3) d(P3-O3) 1.549(3) d(P1-O4) 1.542(3) d(P2-O6) 1.558(3) d(P3-O7) 1.552(3)
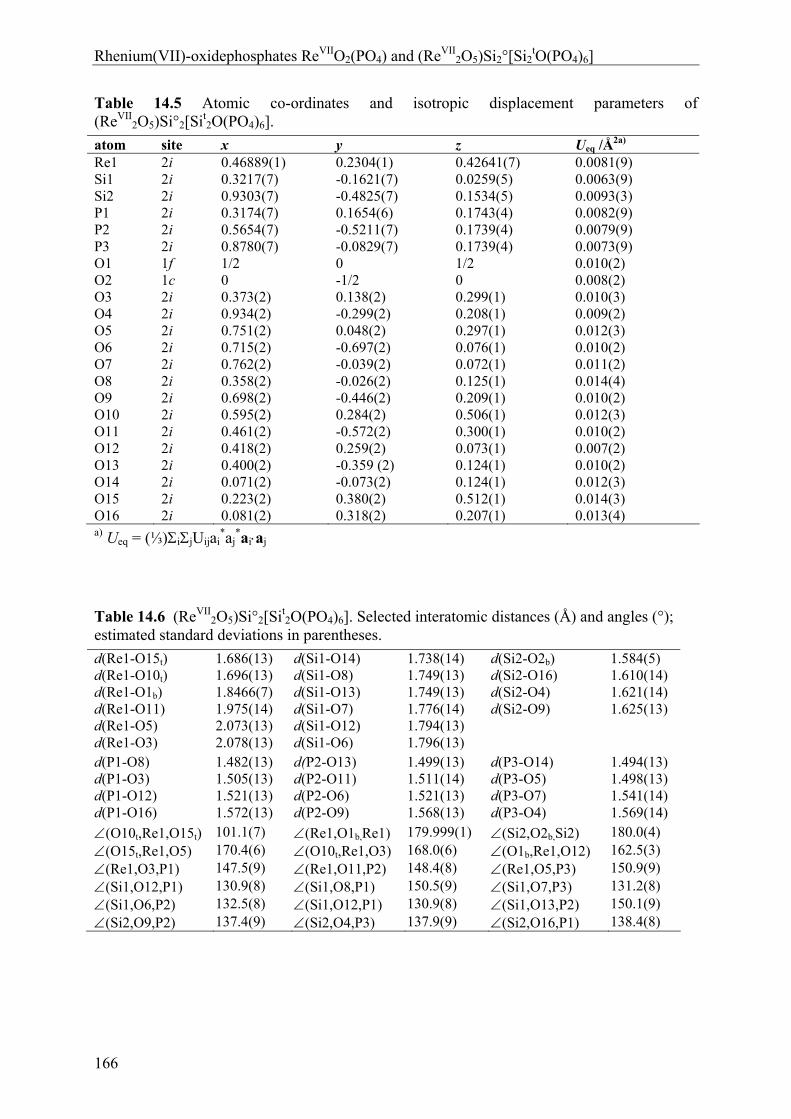
Rhenium(VII)-oxidephosphates ReVIIO2(PO4) and (ReVII2O5)Si2°[Si2
tO(PO4)6]
166
Table 14.5 Atomic co-ordinates and isotropic displacement parameters of (ReVII
2O5)Si°2[Sit2O(PO4)6].
atom site x y z Ueq /Å2a) Re1 2i 0.46889(1) 0.2304(1) 0.42641(7) 0.0081(9) Si1 2i 0.3217(7) -0.1621(7) 0.0259(5) 0.0063(9) Si2 2i 0.9303(7) -0.4825(7) 0.1534(5) 0.0093(3) P1 2i 0.3174(7) 0.1654(6) 0.1743(4) 0.0082(9) P2 2i 0.5654(7) -0.5211(7) 0.1739(4) 0.0079(9) P3 2i 0.8780(7) -0.0829(7) 0.1739(4) 0.0073(9) O1 1f 1/2 0 1/2 0.010(2) O2 1c 0 -1/2 0 0.008(2) O3 2i 0.373(2) 0.138(2) 0.299(1) 0.010(3) O4 2i 0.934(2) -0.299(2) 0.208(1) 0.009(2) O5 2i 0.751(2) 0.048(2) 0.297(1) 0.012(3) O6 2i 0.715(2) -0.697(2) 0.076(1) 0.010(2) O7 2i 0.762(2) -0.039(2) 0.072(1) 0.011(2) O8 2i 0.358(2) -0.026(2) 0.125(1) 0.014(4) O9 2i 0.698(2) -0.446(2) 0.209(1) 0.010(2) O10 2i 0.595(2) 0.284(2) 0.506(1) 0.012(3) O11 2i 0.461(2) -0.572(2) 0.300(1) 0.010(2) O12 2i 0.418(2) 0.259(2) 0.073(1) 0.007(2) O13 2i 0.400(2) -0.359 (2) 0.124(1) 0.010(2) O14 2i 0.071(2) -0.073(2) 0.124(1) 0.012(3) O15 2i 0.223(2) 0.380(2) 0.512(1) 0.014(3) O16 2i 0.081(2) 0.318(2) 0.207(1) 0.013(4) a) Ueq = (⅓)ijUijai
*aj*aiaj
Table 14.6 (ReVII
2O5)Si°2[Sit2O(PO4)6]. Selected interatomic distances (Å) and angles (°);
estimated standard deviations in parentheses.
d(Re1-O15t) 1.686(13) d(Si1-O14) 1.738(14) d(Si2-O2b) 1.584(5) d(Re1-O10t) 1.696(13) d(Si1-O8) 1.749(13) d(Si2-O16) 1.610(14) d(Re1-O1b) 1.8466(7) d(Si1-O13) 1.749(13) d(Si2-O4) 1.621(14) d(Re1-O11) 1.975(14) d(Si1-O7) 1.776(14) d(Si2-O9) 1.625(13) d(Re1-O5) 2.073(13) d(Si1-O12) 1.794(13) d(Re1-O3) 2.078(13) d(Si1-O6) 1.796(13) d(P1-O8) 1.482(13) d(P2-O13) 1.499(13) d(P3-O14) 1.494(13) d(P1-O3) 1.505(13) d(P2-O11) 1.511(14) d(P3-O5) 1.498(13) d(P1-O12) 1.521(13) d(P2-O6) 1.521(13) d(P3-O7) 1.541(14) d(P1-O16) 1.572(13) d(P2-O9) 1.568(13) d(P3-O4) 1.569(14)
(O10t,Re1,O15t) 101.1(7) (Re1,O1b,Re1) 179.999(1) (Si2,O2b,Si2) 180.0(4) (O15t,Re1,O5) 170.4(6) (O10t,Re1,O3) 168.0(6) (O1b,Re1,O12) 162.5(3) (Re1,O3,P1) 147.5(9) (Re1,O11,P2) 148.4(8) (Re1,O5,P3) 150.9(9) (Si1,O12,P1) 130.9(8) (Si1,O8,P1) 150.5(9) (Si1,O7,P3) 131.2(8) (Si1,O6,P2) 132.5(8) (Si1,O12,P1) 130.9(8) (Si1,O13,P2) 150.1(9) (Si2,O9,P2) 137.4(9) (Si2,O4,P3) 137.9(9) (Si2,O16,P1) 138.4(8)
Rhenium(VII)-oxidephosphates ReVIIO2(PO4) and (ReVII2O5)Si2°[Si2
tO(PO4)6]
167
MAS-NMR experiments (31P, 29Si) were carried out on a Varian Infinity+ spectrometer
equipped with a commercial 2.5 mm MAS double-resonance probe (Chemagnetics)
operating at 162.534 and 79,769 MHz, respectively. The 31P-MAS spectra are the average of
up to 64 transients acquired with a repetition delay up to 120 s (ca. 5 times T1), a 90° pulse
duration of 1.8 µ s, and 10 Hz line broadening during data processing. The spin lattice
relaxation times T1 were determined. For the measurement the magnetization was
extinguished by a train of pulses followed by a rectangular pulse with different delay. 29Si-
MAS spectrum was obtained with a repetition rate of 600 s and 800 transients, a 90° pulse
duration of 3.5 µ s, and no line broadening during data processing. Magic angle adjustment
was carefully performed by the maximum numbers of “spikes” in FID of a KBr sample. The
chemical shifts are reported in parts per million (ppm) from an external standard of 85%
H3PO4 and tetramethylsilane for the 31P- and 29Si-MAS-NMR spectra, respectively.
The electronic absorption spectra of single-crystals of ReVIIO2(PO4) and
(ReVII2O5)Sio
2[Sit2O(PO4)6] were measured at ambient temperature using a strongly modified
CARY 17 microcrystal spectrophotometer (Spectra Services, ANU Canberra, Australia) [121,
122]. Two different crystals were chosen for the absorption spectra. A single-crystal of
ReVIIO2(PO4) (≈ 0.2, 0.15, 0.08 mm3) was measured just after recovering the crystal from the
ampoule. The spectrum shows a very strong absorption above = 22000 cm-1. The first crystal
was collected directly from the ampoule, whereas the second crystal (≈ 0.15, 0.10, 0.07 mm3)
crystal was soaked in acetone for about 20 minutes in order to remove it from the wall of the
quartz tube. It was measured twice; three and six days after opening of the crystal growth
ampoule. The former shows a very broad absorption band centered at about = 13000 cm-1 in
addition to the transition at = 22000 cm-1. A hexagonal plate like crystal (≈ 0.4, 0.3, 0.05
mm3) of (ReVII2O5)Sio
2[Sit2O(PO4)6] was measured after one day since opening the tube had
passed. The spectrum shows a very strong absorption band at about = 26500 cm-1.
The infrared spectrum of Guinier-pure ReVIIO2(PO4) was measured using a NICOLET 380
FT-IR spectrometer (SMART ORBIT).
Rhenium(VII)-oxidephosphates ReVIIO2(PO4) and (ReVII2O5)Si2°[Si2
tO(PO4)6]
168
14.3 Results and Discussions
14.3.1 Syntheses and Crystallization
Rhenium(VII)-oxidephosphate ReO2(PO4) can be obtained by reaction of Re2O7 and P4O10 in
sealed silica tubes in the temperature range 250 ≤ ≤ 400°C. The phosphate migrates in a
temperature gradient 400 300°C from the higher to the lower temperature. Thus, pale
yellow rectangular shaped crystals were obtained. According to mass spectrometric studies
[149] the gas phase over solid ReO2(PO4) contains under perfectly dry conditions only
Re2O7(g) and P4O10(g). The migration in the temperature gradient has to be regarded as
dissociative sublimation (see Equation. 14.1).
2ReVIIO2(PO4)(s) = Re2O7(g) + ½ P4O10(g) (14.1)
Small amounts of moisture, however, give rise to the occurrence of gaseous ReO3(OH) and in
the presence of even more water to gaseous H3PO4 [149]. Therefore, traces of water present in
the reaction tubes might lead to chemical vapour transport of ReO2(PO4) according to eq. 14.2
and 14.3, respectively. It is known [286, 287] that Re2O7 shows increased volatility in the
presence of even tiny amounts of water. The stability and importance of gaseous ReO3(OH),
for chemical vapor transport of rhenium oxides has been discussed in detail [84].
2 ReVIIO2(PO4)(s) + H2O(g) = 2 ReO3(OH)(g) + ½ P4O10(g) (14.2)
ReVIIO2(PO4)(s) + 2 H2O(g) = ReO3(OH)(g) + H3PO4(g) (14.3)
From its thermal stability and the observed sublimation rates of up to 10 mg·h1 a stabilization
of ReVIIO2(PO4) by –10 to –40 kJ·mol1 with respect to decomposition into 1/2 Re2O7(s) and
1/4 P4O10(s) is estimated. This rather small stabilization extends nicely the series of heats of
neutralization observed for Na3PO4 (–544 kJ·mol–1) [288], LaPO4 (–360 kJ·mol–1) [289], and
AlPO4 (–145 kJ·mol–1) [290] and reflects the rather low basicity (oxide donor strength) of
Re2O7.
The experiments (see Table 14.1) indicate that reaction of gaseous Re2O7 and P4O10 with the
wall of the silica tube becomes dominant at temperatures slightly above 400°C and extended
reactions times. Thus, (Re2O5)Sio2[Sit
2O(PO4)6] is formed. Well above 400°C, neither
ReO2(PO4) nor (Re2O5)Sio2[Sit
2O(PO4)6] were observed as reaction products. Instead, silicon-
silicophosphate, Sio3[Sit
2O(PO4)6] [222] did occur, with the release of Re2O7 into the gas
phase and occasional formation of ReO3 and/or ReP2O7.
Rhenium(VII)-oxidephosphates ReVIIO2(PO4) and (ReVII2O5)Si2°[Si2
tO(PO4)6]
169
In one experiment, alongside (Re2O5)Sio2[Sit
2O(PO4)6], light yellow rectangular crystals were
obtained which gave an XRPD pattern similar, however distinctly different to that of
ReO2(PO4) from the other experiments (see Figure 14.2). The crystal quality did so far not
allow a single crystal study. We assume that a second polymorph of ReO2(PO4) had been
formed. Experiments to reproduce this result failed so far.
The chemical stability of rhenium(VII)-phosphate and -silicophosphate at room temperature
depends on the particle size, homogeneity of the surface of the crystals as well as the
surrounding atmosphere. While finely powdered material is hydrolyzed in a couple of
minutes, well developed crystals can persist up to several days. Light-yellow crystals of
ReO2(PO4) start to turn greenish once they are removed from the ampoule, indicating
reduction of Re7+.
14.3.2 Crystal structure
ReVIIO2(PO4). The crystal structure of ReO2(PO4) can be regarded as a superstructure of the
ReO3 structure type [36]. The crystal chemical transition from the cubic ReO3 structure type
to the monoclinic structure of ReO2(PO4) is visualized in figure 14.4. In a first step there is
heterovalent substitution of two Re6+ by Re7+ and P5+. Due to the different coordination
requirements of Re7+ and P5+ in comparison to Re6+ the ideal octahedral coordination around
the cations in the cubic ReO3 structure type is relaxed by small shifts of some oxygen atoms
and P5+. Thus, the coordination number of phosphorus is reduced to four (as is typical for
phosphates), leaving two oxygen atoms exclusively bound to rhenium. In this way two short
Re=Ot bonds per [ReO6] octahedron are generated with d(Re-Ot) ≈ 1.69 Å and (Ot,Re,Ot) ≈
101.6° (see Figure 14.5). The relationship between the structures of ReO2(PO4) and ReO3 is
also described by figure 14.4 and the transformation matrix eq. (14.4).
6 3
6 3
6 3
RePO ReO
RePO ReO
RePO ReO
2 4 0
0 0 2
4 4 0
a a
b b
c c
(14.4)
The structure of ReO2(PO4) is closely related to that of the monoclinic modification of
MoO2(SO4) [154] (see Figure 14.6) where a three dimensional framework is formed by corner
sharing [MoO6] octahedra and [SO4] tetrahedra. For MoO2(SO4) hints on at least two further
polymorphs, yet not structurally characterized in detail, are reported [154]. We believe, that
the XRPD for ReO2(PO4) in figure 14.2c points in this direction, too.
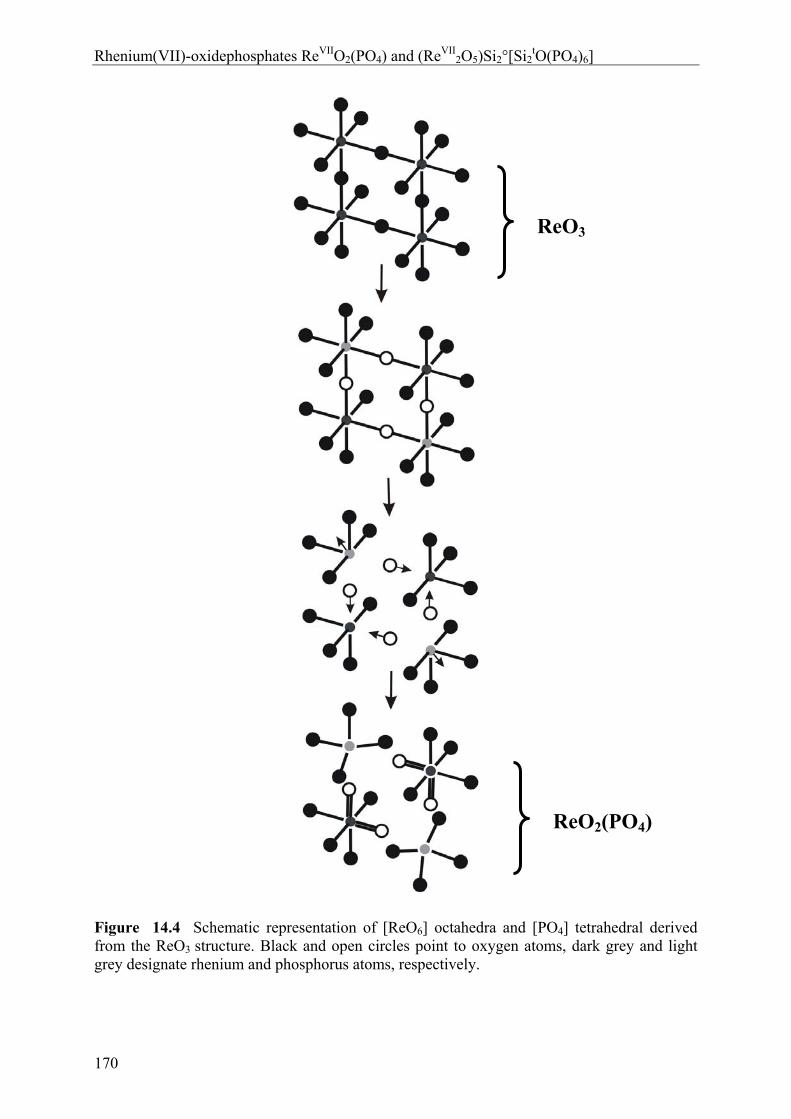
Rhenium(VII)-oxidephosphates ReVIIO2(PO4) and (ReVII2O5)Si2°[Si2
tO(PO4)6]
170
Figure 14.4 Schematic representation of [ReO6] octahedra and [PO4] tetrahedral derived from the ReO3 structure. Black and open circles point to oxygen atoms, dark grey and light grey designate rhenium and phosphorus atoms, respectively.
ReO3
ReO2(PO4)
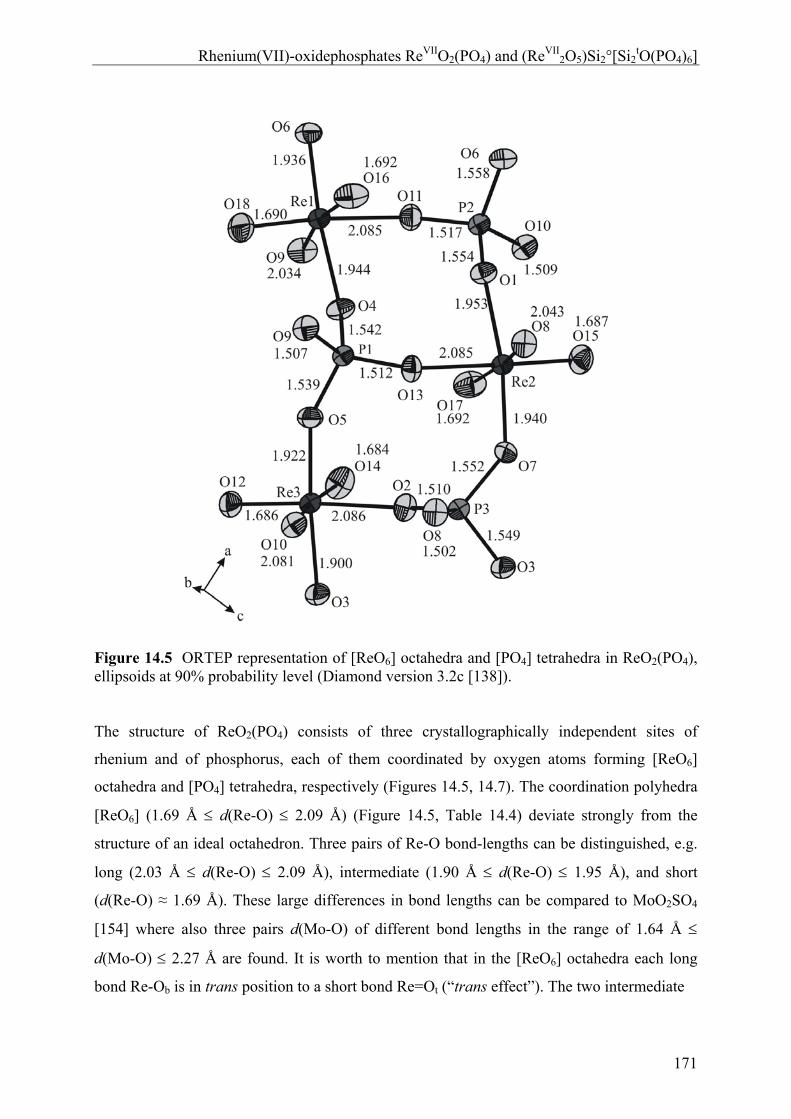
Rhenium(VII)-oxidephosphates ReVIIO2(PO4) and (ReVII2O5)Si2°[Si2
tO(PO4)6]
171
Figure 14.5 ORTEP representation of [ReO6] octahedra and [PO4] tetrahedra in ReO2(PO4), ellipsoids at 90% probability level (Diamond version 3.2c [138]).
The structure of ReO2(PO4) consists of three crystallographically independent sites of
rhenium and of phosphorus, each of them coordinated by oxygen atoms forming [ReO6]
octahedra and [PO4] tetrahedra, respectively (Figures 14.5, 14.7). The coordination polyhedra
[ReO6] (1.69 Å d(Re-O) 2.09 Å) (Figure 14.5, Table 14.4) deviate strongly from the
structure of an ideal octahedron. Three pairs of Re-O bond-lengths can be distinguished, e.g.
long (2.03 Å d(Re-O) 2.09 Å), intermediate (1.90 Å d(Re-O) 1.95 Å), and short
(d(Re-O) ≈ 1.69 Å). These large differences in bond lengths can be compared to MoO2SO4
[154] where also three pairs d(Mo-O) of different bond lengths in the range of 1.64 Å
d(Mo-O) 2.27 Å are found. It is worth to mention that in the [ReO6] octahedra each long
bond Re-Ob is in trans position to a short bond Re=Ot (“trans effect”). The two intermediate
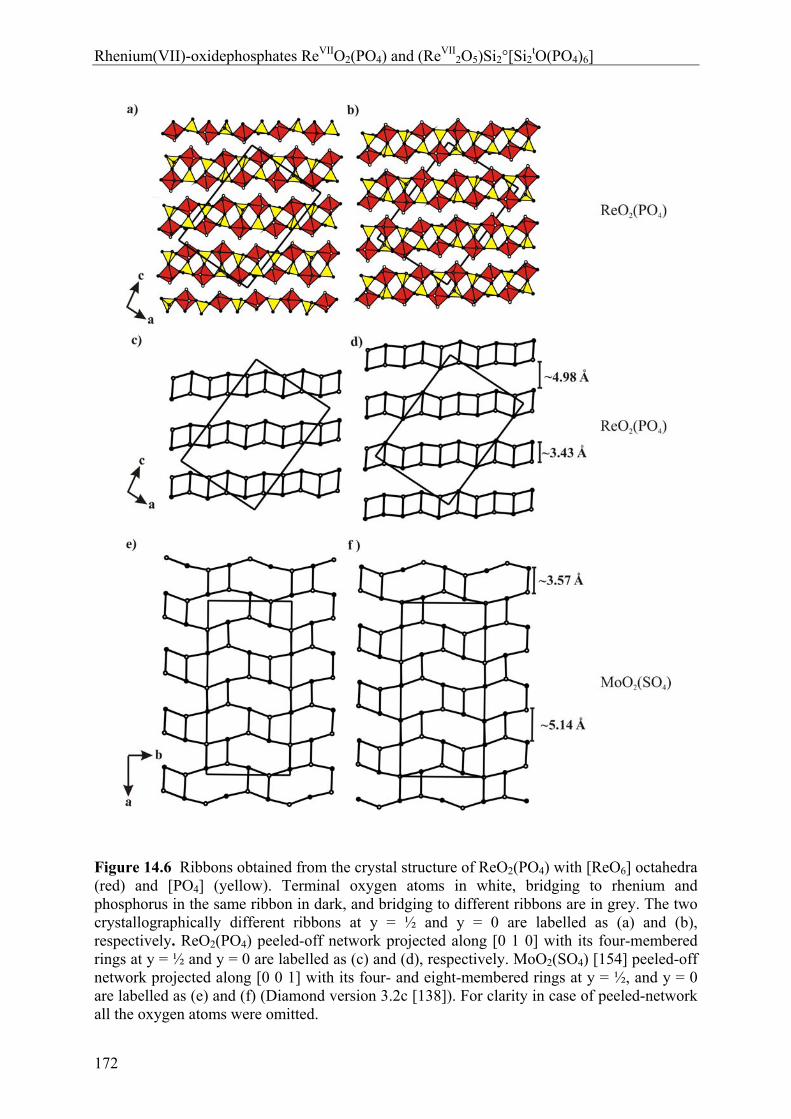
Rhenium(VII)-oxidephosphates ReVIIO2(PO4) and (ReVII2O5)Si2°[Si2
tO(PO4)6]
172
Figure 14.6 Ribbons obtained from the crystal structure of ReO2(PO4) with [ReO6] octahedra (red) and [PO4] (yellow). Terminal oxygen atoms in white, bridging to rhenium and phosphorus in the same ribbon in dark, and bridging to different ribbons are in grey. The two crystallographically different ribbons at y = ½ and y = 0 are labelled as (a) and (b), respectively. ReO2(PO4) peeled-off network projected along [0 1 0] with its four-membered rings at y = ½ and y = 0 are labelled as (c) and (d), respectively. MoO2(SO4) [154] peeled-off network projected along [0 0 1] with its four- and eight-membered rings at y = ½, and y = 0 are labelled as (e) and (f) (Diamond version 3.2c [138]). For clarity in case of peeled-network all the oxygen atoms were omitted.
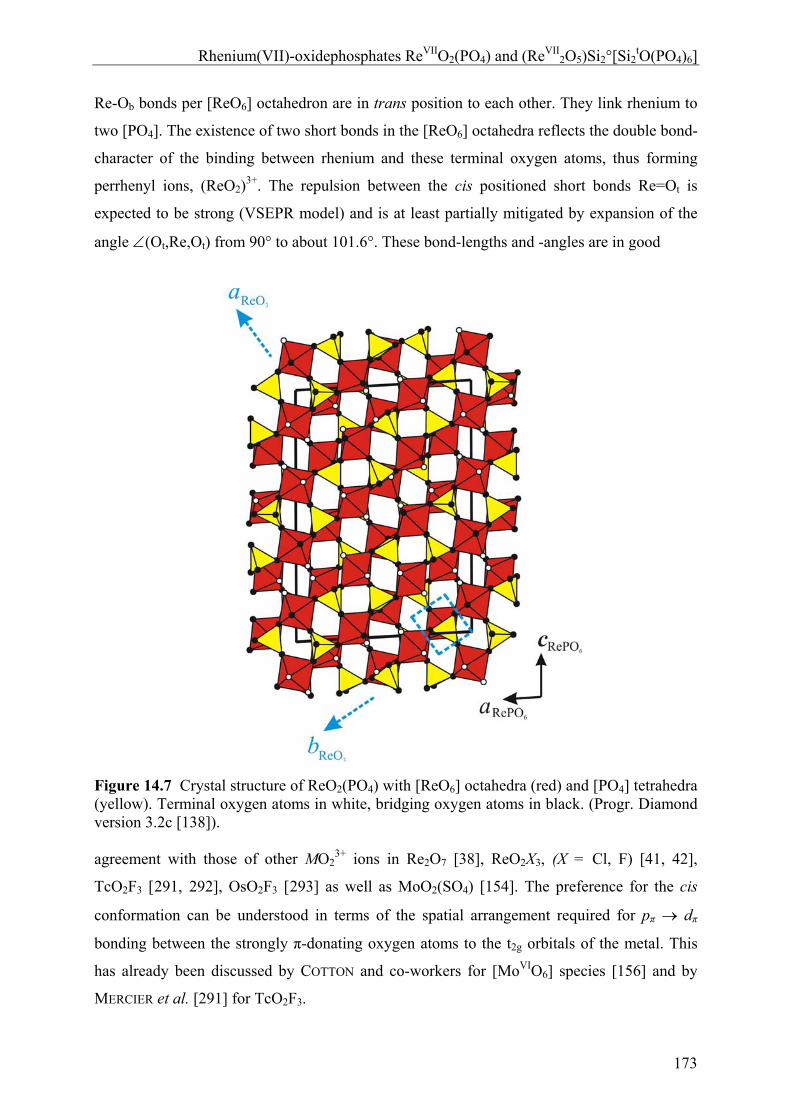
Rhenium(VII)-oxidephosphates ReVIIO2(PO4) and (ReVII2O5)Si2°[Si2
tO(PO4)6]
173
Re-Ob bonds per [ReO6] octahedron are in trans position to each other. They link rhenium to
two [PO4]. The existence of two short bonds in the [ReO6] octahedra reflects the double bond-
character of the binding between rhenium and these terminal oxygen atoms, thus forming
perrhenyl ions, (ReO2)3+. The repulsion between the cis positioned short bonds Re=Ot is
expected to be strong (VSEPR model) and is at least partially mitigated by expansion of the
angle (Ot,Re,Ot) from 90° to about 101.6°. These bond-lengths and -angles are in good
Figure 14.7 Crystal structure of ReO2(PO4) with [ReO6] octahedra (red) and [PO4] tetrahedra (yellow). Terminal oxygen atoms in white, bridging oxygen atoms in black. (Progr. Diamond version 3.2c [138]). agreement with those of other MO2
3+ ions in Re2O7 [38], ReO2X3, (X = Cl, F) [41, 42],
TcO2F3 [291, 292], OsO2F3 [293] as well as MoO2(SO4) [154]. The preference for the cis
conformation can be understood in terms of the spatial arrangement required for pπ dπ
bonding between the strongly π-donating oxygen atoms to the t2g orbitals of the metal. This
has already been discussed by COTTON and co-workers for [MoVIO6] species [156] and by
MERCIER et al. [291] for TcO2F3.
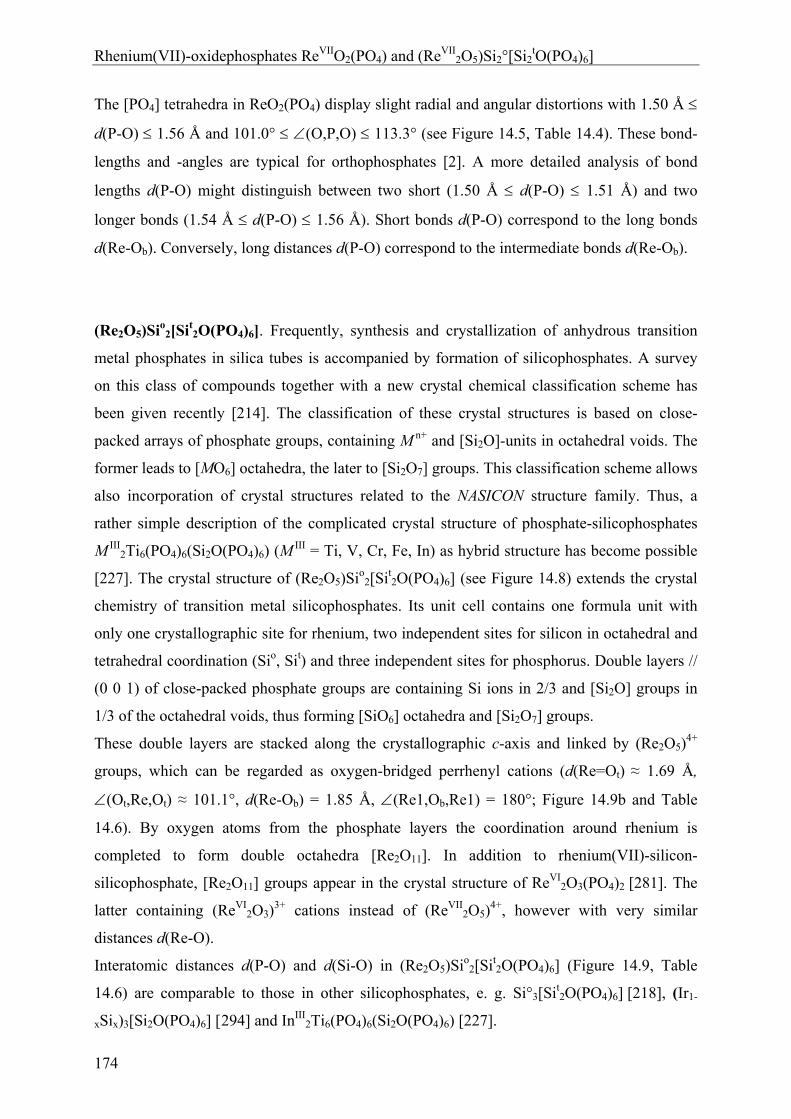
Rhenium(VII)-oxidephosphates ReVIIO2(PO4) and (ReVII2O5)Si2°[Si2
tO(PO4)6]
174
The [PO4] tetrahedra in ReO2(PO4) display slight radial and angular distortions with 1.50 Å
d(P-O) 1.56 Å and 101.0° (O,P,O) 113.3° (see Figure 14.5, Table 14.4). These bond-
lengths and -angles are typical for orthophosphates [2]. A more detailed analysis of bond
lengths d(P-O) might distinguish between two short (1.50 Å d(P-O) 1.51 Å) and two
longer bonds (1.54 Å d(P-O) 1.56 Å). Short bonds d(P-O) correspond to the long bonds
d(Re-Ob). Conversely, long distances d(P-O) correspond to the intermediate bonds d(Re-Ob).
(Re2O5)Sio2[Sit
2O(PO4)6]. Frequently, synthesis and crystallization of anhydrous transition
metal phosphates in silica tubes is accompanied by formation of silicophosphates. A survey
on this class of compounds together with a new crystal chemical classification scheme has
been given recently [214]. The classification of these crystal structures is based on close-
packed arrays of phosphate groups, containing M n+ and [Si2O]-units in octahedral voids. The
former leads to [MO6] octahedra, the later to [Si2O7] groups. This classification scheme allows
also incorporation of crystal structures related to the NASICON structure family. Thus, a
rather simple description of the complicated crystal structure of phosphate-silicophosphates
M III2Ti6(PO4)6(Si2O(PO4)6) (M
III = Ti, V, Cr, Fe, In) as hybrid structure has become possible
[227]. The crystal structure of (Re2O5)Sio2[Sit
2O(PO4)6] (see Figure 14.8) extends the crystal
chemistry of transition metal silicophosphates. Its unit cell contains one formula unit with
only one crystallographic site for rhenium, two independent sites for silicon in octahedral and
tetrahedral coordination (Sio, Sit) and three independent sites for phosphorus. Double layers //
(0 0 1) of close-packed phosphate groups are containing Si ions in 2/3 and [Si2O] groups in
1/3 of the octahedral voids, thus forming [SiO6] octahedra and [Si2O7] groups.
These double layers are stacked along the crystallographic c-axis and linked by (Re2O5)4+
groups, which can be regarded as oxygen-bridged perrhenyl cations (d(Re=Ot) ≈ 1.69 Å,
(Ot,Re,Ot) ≈ 101.1°, d(Re-Ob) = 1.85 Å, (Re1,Ob,Re1) = 180°; Figure 14.9b and Table
14.6). By oxygen atoms from the phosphate layers the coordination around rhenium is
completed to form double octahedra [Re2O11]. In addition to rhenium(VII)-silicon-
silicophosphate, [Re2O11] groups appear in the crystal structure of ReVI2O3(PO4)2 [281]. The
latter containing (ReVI2O3)
3+ cations instead of (ReVII2O5)
4+, however with very similar
distances d(Re-O).
Interatomic distances d(P-O) and d(Si-O) in (Re2O5)Sio2[Sit
2O(PO4)6] (Figure 14.9, Table
14.6) are comparable to those in other silicophosphates, e. g. Si°3[Sit2O(PO4)6] [218], (Ir1-
xSix)3[Si2O(PO4)6] [294] and InIII2Ti6(PO4)6(Si2O(PO4)6) [227].
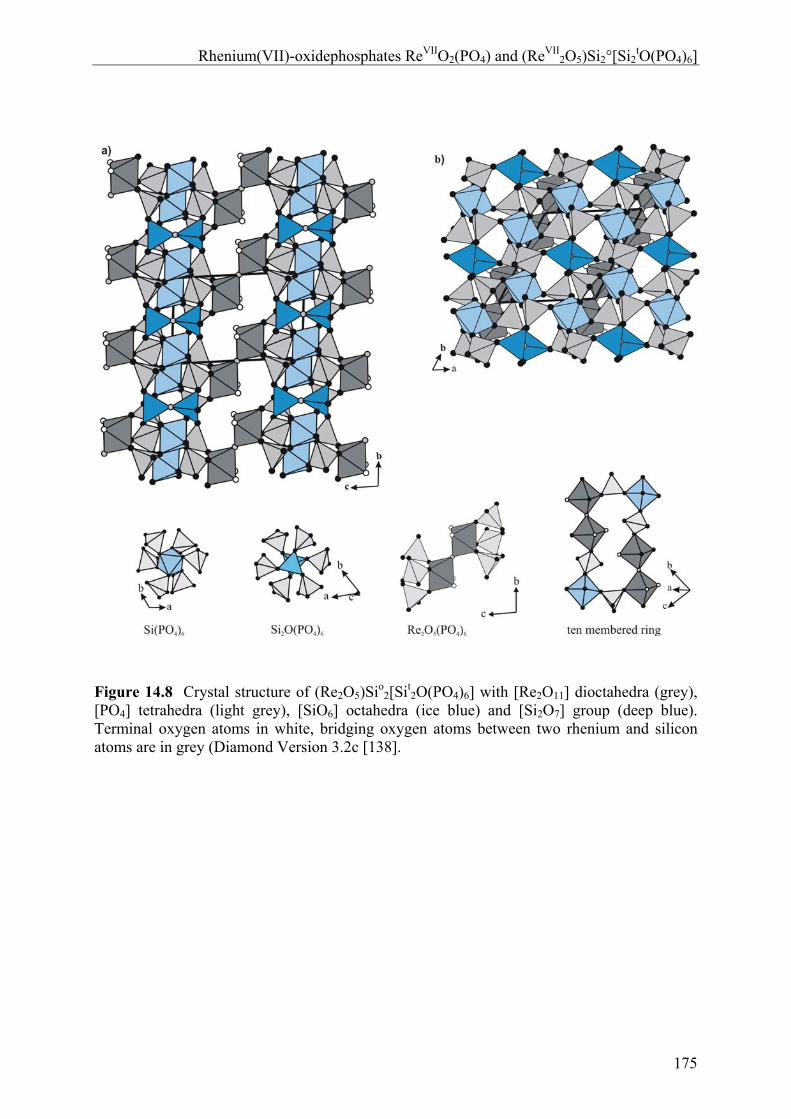
Rhenium(VII)-oxidephosphates ReVIIO2(PO4) and (ReVII2O5)Si2°[Si2
tO(PO4)6]
175
Figure 14.8 Crystal structure of (Re2O5)Sio
2[Sit2O(PO4)6] with [Re2O11] dioctahedra (grey),
[PO4] tetrahedra (light grey), [SiO6] octahedra (ice blue) and [Si2O7] group (deep blue). Terminal oxygen atoms in white, bridging oxygen atoms between two rhenium and silicon atoms are in grey (Diamond Version 3.2c [138].
Rhenium(VII)-oxidephosphates ReVIIO2(PO4) and (ReVII2O5)Si2°[Si2
tO(PO4)6]
176
Figure 14.9 ORTEP representation of [Re2O11], [SiO6] octahedra, and [Si2O(PO4)6] in (Re2O5)Sio
2(Sit2O(PO4)6] are labelled as in Fig. a, b and c, respectively. Ellipsoids at 70%
probability level (Diamond version 3.2c [138]).
Rhenium(VII)-oxidephosphates ReVIIO2(PO4) and (ReVII2O5)Si2°[Si2
tO(PO4)6]
177
14.3.3 Spectroscopic Investigations
31P-and 29Si-MAS-NMR spectroscopy. The isotropic chemical shift parameters of
ReVIIO2(PO4) and (ReVII2O5)Sio
2[Sit2O(PO4)6] were determined from 31P-MAS-NMR
measurements at different rotation frequencies using a deconvolution routine provided by the
spectrometer software. Thus, the 31P-MAS-NMR spectrum of ReVIIO2(PO4) (Figure 14.10a)
can be decomposed into three equally intense signals. The isotropic chemical shift parameters
were obtained as δIiso = -6.8, δIIiso = -11.4 and δIIIiso = -13.8 ppm in accordance with the crystal
structure of ReO2(PO4) containing three independent sites for phosphorus atoms in the ratio
1:1:1. Assignment of the strong signal around -12.6 ppm to two overlapping Gaussians is
backed by the very similar chemical environment of all phosphorus atoms as it is found from
the structure refinement. Isotropic chemical shifts obtained for ReO2(PO4) are close to those
of other orthophosphates like GaPO4 (δiso = -9.8 ppm) [295], Be3(PO4)2 (δiso = -9.2 ppm) [295]
and Cs3PO4 (δiso = -3.1, -5.1, -6.4, -7.1 ppm) [296]. It should be noted that spin lattice
relaxation times T1 for the three phosphorus sites amount to 19 s and that they are equal
within the error of the estimation.
The 31P-MAS-NMR spectrum of (ReVII2O5)Sio
2[Sit2O(PO4)6] (see Fig. 14.10b) shows three
isotropic chemical shift parameters at δIiso = -33.3, δIIiso = -34.8, and δIIIiso = -36.7 ppm.
Relaxation times T1 of each phosphorus site are equal to 10.0(5) s. There is no change in line
shape by increasing the rotation frequency up to 24 kHz. It is necessary to state that the
integrals of the different resonance peaks in the 31P-MAS-NMR spectrum of the
silicophosphate show a ratio of about 1:2:2, which does not agree with the ratio 1:1:1
expected from the crystal structure of the silicophosphate (see Table 14.5). We attribute this
deviation to a possibly larger unit cell than it was used for the refinement so far. Actaually to
accommodate the appropriate amount of phosphorus atoms the unit cell has to have 5.n (n = 1,
2, 3, 4…..) volume of our triclinic ce1l. The isotropic chemical shift parameters are close to
those of other silicophosphates like In2Ti6(PO4)6[Si2O(PO4)6] [227] (δiso = -27.2 ppm for
phosphorus within the [Si2O(PO4)6]12- group) and Sio
3[Sit2O(PO4)6] (δiso = -44.1 ppm) [297].
The 29Si-MAS-NMR spectrum (see Figure 14.10c) of (ReVII2O5)Sio
2[Sit2O(PO4)6] (rotation
frequency = 10.0 kHz) reveals two isotropic chemical shifts at δIiso = -119.0 and δIiso = -213.5
ppm. These correspond to the two independent crystallographic sites for silicon. The more
shielded resonance corresponds to [SiO6], the less shielded to [SiO4].
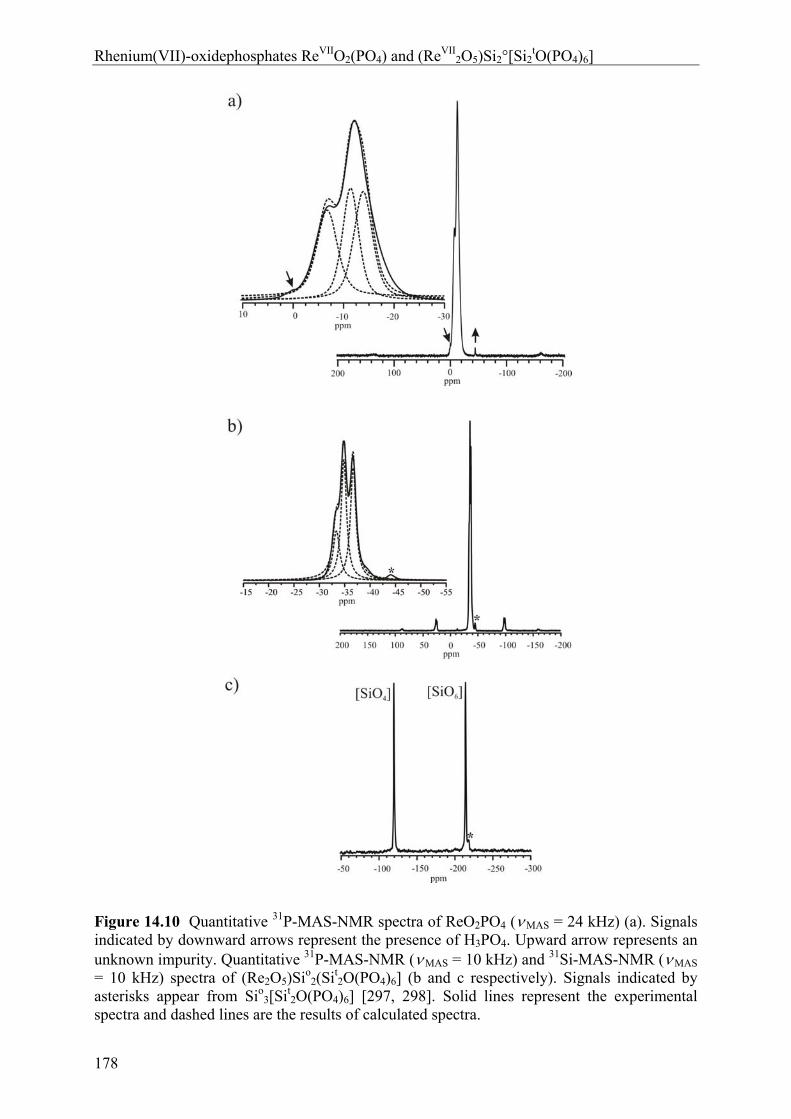
Rhenium(VII)-oxidephosphates ReVIIO2(PO4) and (ReVII2O5)Si2°[Si2
tO(PO4)6]
178
Figure 14.10 Quantitative 31P-MAS-NMR spectra of ReO2PO4 (MAS = 24 kHz) (a). Signals indicated by downward arrows represent the presence of H3PO4. Upward arrow represents an unknown impurity. Quantitative 31P-MAS-NMR (MAS = 10 kHz) and 31Si-MAS-NMR (MAS = 10 kHz) spectra of (Re2O5)Sio
2(Sit2O(PO4)6] (b and c respectively). Signals indicated by
asterisks appear from Sio3[Sit
2O(PO4)6] [297, 298]. Solid lines represent the experimental spectra and dashed lines are the results of calculated spectra.
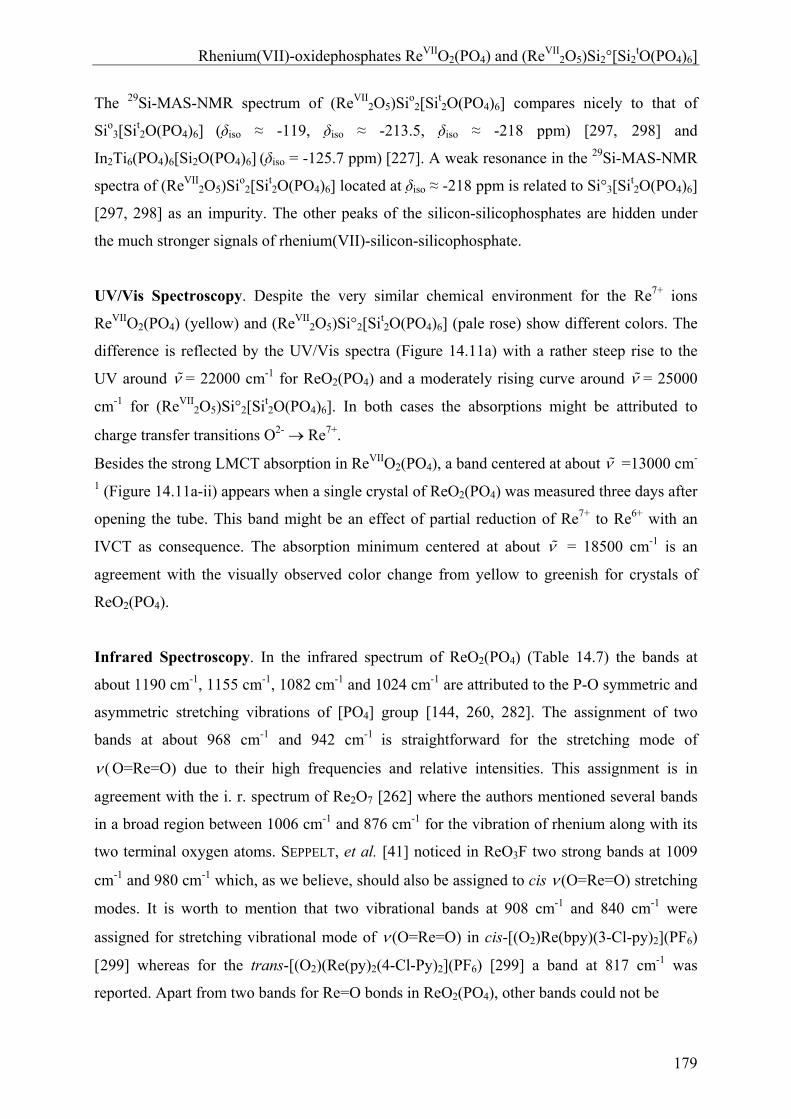
Rhenium(VII)-oxidephosphates ReVIIO2(PO4) and (ReVII2O5)Si2°[Si2
tO(PO4)6]
179
The 29Si-MAS-NMR spectrum of (ReVII2O5)Sio
2[Sit2O(PO4)6] compares nicely to that of
Sio3[Sit
2O(PO4)6] (δiso ≈ -119, δiso ≈ -213.5, δiso ≈ -218 ppm) [297, 298] and
In2Ti6(PO4)6[Si2O(PO4)6] (δiso = -125.7 ppm) [227]. A weak resonance in the 29Si-MAS-NMR
spectra of (ReVII2O5)Sio
2[Sit2O(PO4)6] located at δiso ≈ -218 ppm is related to Si°3[Sit
2O(PO4)6]
[297, 298] as an impurity. The other peaks of the silicon-silicophosphates are hidden under
the much stronger signals of rhenium(VII)-silicon-silicophosphate.
UV/Vis Spectroscopy. Despite the very similar chemical environment for the Re7+ ions
ReVIIO2(PO4) (yellow) and (ReVII2O5)Si°2[Sit
2O(PO4)6] (pale rose) show different colors. The
difference is reflected by the UV/Vis spectra (Figure 14.11a) with a rather steep rise to the
UV around = 22000 cm-1 for ReO2(PO4) and a moderately rising curve around = 25000
cm-1 for (ReVII2O5)Si°2[Sit
2O(PO4)6]. In both cases the absorptions might be attributed to
charge transfer transitions O2- Re7+.
Besides the strong LMCT absorption in ReVIIO2(PO4), a band centered at about =13000 cm-
1 (Figure 14.11a-ii) appears when a single crystal of ReO2(PO4) was measured three days after
opening the tube. This band might be an effect of partial reduction of Re7+ to Re6+ with an
IVCT as consequence. The absorption minimum centered at about = 18500 cm-1 is an
agreement with the visually observed color change from yellow to greenish for crystals of
ReO2(PO4).
Infrared Spectroscopy. In the infrared spectrum of ReO2(PO4) (Table 14.7) the bands at
about 1190 cm-1, 1155 cm-1, 1082 cm-1 and 1024 cm-1 are attributed to the P-O symmetric and
asymmetric stretching vibrations of [PO4] group [144, 260, 282]. The assignment of two
bands at about 968 cm-1 and 942 cm-1 is straightforward for the stretching mode of
( O=Re=O) due to their high frequencies and relative intensities. This assignment is in
agreement with the i. r. spectrum of Re2O7 [262] where the authors mentioned several bands
in a broad region between 1006 cm-1 and 876 cm-1 for the vibration of rhenium along with its
two terminal oxygen atoms. SEPPELT, et al. [41] noticed in ReO3F two strong bands at 1009
cm-1 and 980 cm-1 which, as we believe, should also be assigned to cis (O=Re=O) stretching
modes. It is worth to mention that two vibrational bands at 908 cm-1 and 840 cm-1 were
assigned for stretching vibrational mode of (O=Re=O) in cis-[(O2)Re(bpy)(3-Cl-py)2](PF6)
[299] whereas for the trans-[(O2)(Re(py)2(4-Cl-Py)2](PF6) [299] a band at 817 cm-1 was
reported. Apart from two bands for Re=O bonds in ReO2(PO4), other bands could not be
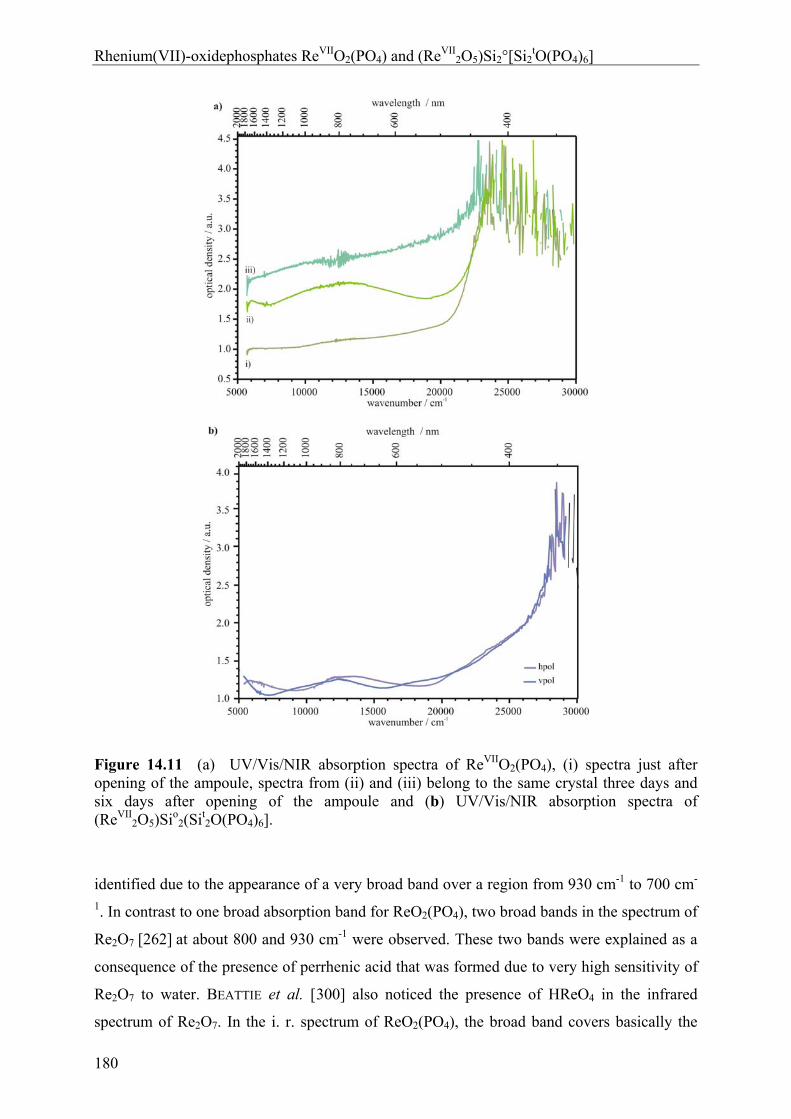
Rhenium(VII)-oxidephosphates ReVIIO2(PO4) and (ReVII2O5)Si2°[Si2
tO(PO4)6]
180
Figure 14.11 (a) UV/Vis/NIR absorption spectra of ReVIIO2(PO4), (i) spectra just after opening of the ampoule, spectra from (ii) and (iii) belong to the same crystal three days and six days after opening of the ampoule and (b) UV/Vis/NIR absorption spectra of (ReVII
2O5)Sio2(Sit
2O(PO4)6].
identified due to the appearance of a very broad band over a region from 930 cm-1 to 700 cm-
1. In contrast to one broad absorption band for ReO2(PO4), two broad bands in the spectrum of
Re2O7 [262] at about 800 and 930 cm-1 were observed. These two bands were explained as a
consequence of the presence of perrhenic acid that was formed due to very high sensitivity of
Re2O7 to water. BEATTIE et al. [300] also noticed the presence of HReO4 in the infrared
spectrum of Re2O7. In the i. r. spectrum of ReO2(PO4), the broad band covers basically the
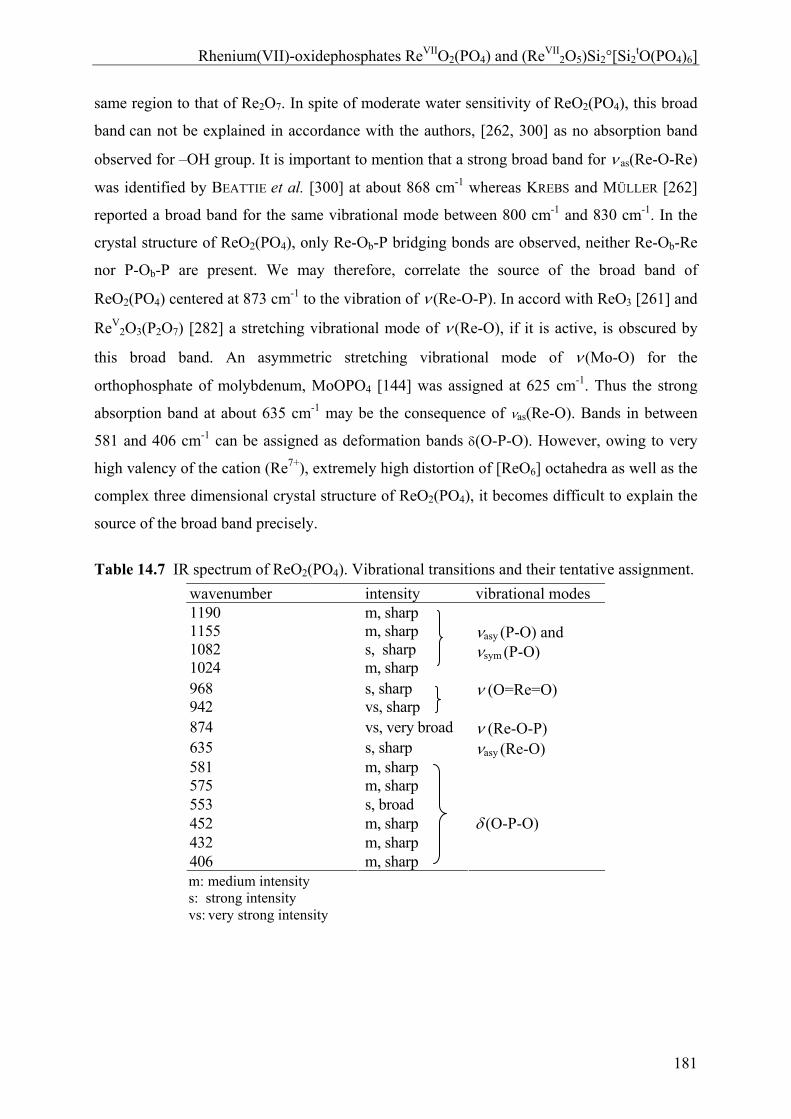
Rhenium(VII)-oxidephosphates ReVIIO2(PO4) and (ReVII2O5)Si2°[Si2
tO(PO4)6]
181
same region to that of Re2O7. In spite of moderate water sensitivity of ReO2(PO4), this broad
band can not be explained in accordance with the authors, [262, 300] as no absorption band
observed for –OH group. It is important to mention that a strong broad band for as(Re-O-Re)
was identified by BEATTIE et al. [300] at about 868 cm-1 whereas KREBS and MÜLLER [262]
reported a broad band for the same vibrational mode between 800 cm-1 and 830 cm-1. In the
crystal structure of ReO2(PO4), only Re-Ob-P bridging bonds are observed, neither Re-Ob-Re
nor P-Ob-P are present. We may therefore, correlate the source of the broad band of
ReO2(PO4) centered at 873 cm-1 to the vibration of (Re-O-P). In accord with ReO3 [261] and
ReV2O3(P2O7) [282] a stretching vibrational mode of (Re-O), if it is active, is obscured by
this broad band. An asymmetric stretching vibrational mode of (Mo-O) for the
orthophosphate of molybdenum, MoOPO4 [144] was assigned at 625 cm-1. Thus the strong
absorption band at about 635 cm-1 may be the consequence of as(Re-O). Bands in between
581 and 406 cm-1 can be assigned as deformation bands (O-P-O). However, owing to very
high valency of the cation (Re7+), extremely high distortion of [ReO6] octahedra as well as the
complex three dimensional crystal structure of ReO2(PO4), it becomes difficult to explain the
source of the broad band precisely.
Table 14.7 IR spectrum of ReO2(PO4). Vibrational transitions and their tentative assignment.
wavenumber intensity vibrational modes 1190 m, sharp 1155 m, sharp 1082 s, sharp 1024 m, sharp
asy (P-O) and sym (P-O)
968 s, sharp 942 vs, sharp
(O=Re=O)
874 vs, very broad (Re-O-P) 635 s, sharp asy (Re-O) 581 m, sharp 575 m, sharp 553 s, broad 452 m, sharp 432 m, sharp 406 m, sharp
(O-P-O)
m: medium intensity s: strong intensity
vs: very strong intensity
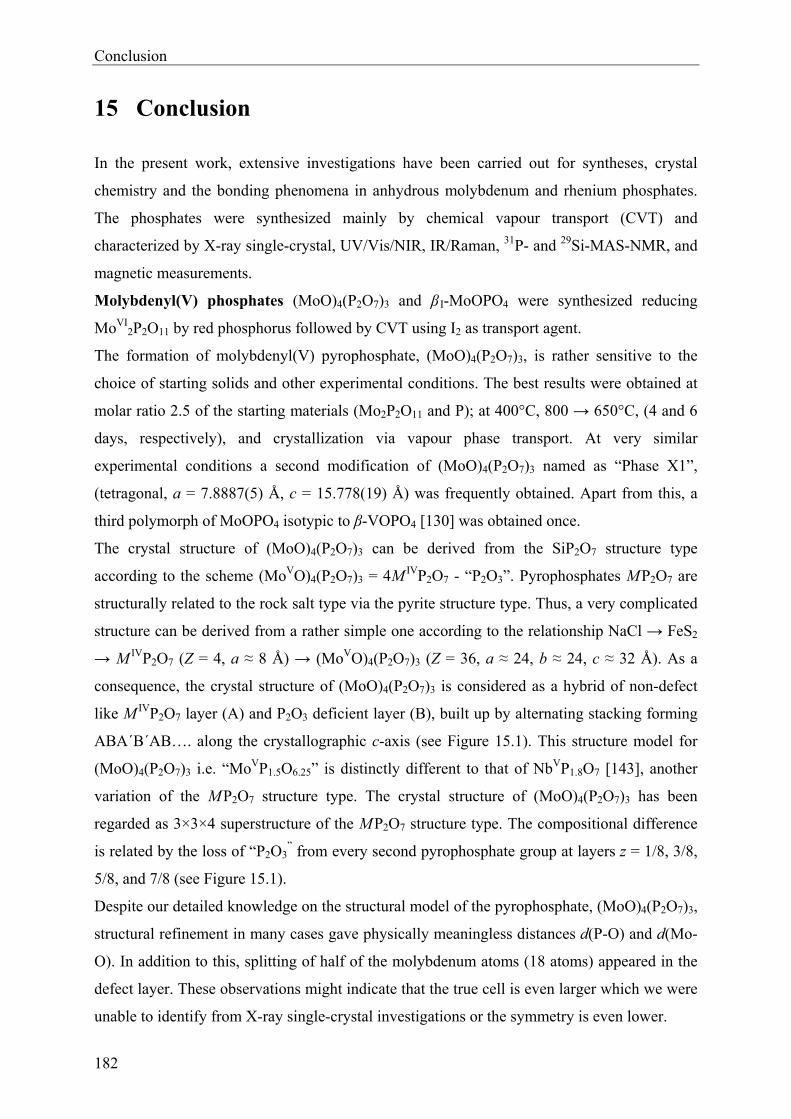
Conclusion
182
15 Conclusion
In the present work, extensive investigations have been carried out for syntheses, crystal
chemistry and the bonding phenomena in anhydrous molybdenum and rhenium phosphates.
The phosphates were synthesized mainly by chemical vapour transport (CVT) and
characterized by X-ray single-crystal, UV/Vis/NIR, IR/Raman, 31P- and 29Si-MAS-NMR, and
magnetic measurements.
Molybdenyl(V) phosphates (MoO)4(P2O7)3 and β I-MoOPO4 were synthesized reducing
MoVI2P2O11 by red phosphorus followed by CVT using I2 as transport agent.
The formation of molybdenyl(V) pyrophosphate, (MoO)4(P2O7)3, is rather sensitive to the
choice of starting solids and other experimental conditions. The best results were obtained at
molar ratio 2.5 of the starting materials (Mo2P2O11 and P); at 400°C, 800 → 650°C, (4 and 6
days, respectively), and crystallization via vapour phase transport. At very similar
experimental conditions a second modification of (MoO)4(P2O7)3 named as “Phase X1”,
(tetragonal, a = 7.8887(5) Å, c = 15.778(19) Å) was frequently obtained. Apart from this, a
third polymorph of MoOPO4 isotypic to β-VOPO4 [130] was obtained once.
The crystal structure of (MoO)4(P2O7)3 can be derived from the SiP2O7 structure type
according to the scheme (MoVO)4(P2O7)3 = 4M IVP2O7 - “P2O3”. Pyrophosphates M P2O7 are
structurally related to the rock salt type via the pyrite structure type. Thus, a very complicated
structure can be derived from a rather simple one according to the relationship NaCl → FeS2
→ M IVP2O7 (Z = 4, a ≈ 8 Å) → (MoVO)4(P2O7)3 (Z = 36, a ≈ 24, b ≈ 24, c ≈ 32 Å). As a
consequence, the crystal structure of (MoO)4(P2O7)3 is considered as a hybrid of non-defect
like M IVP2O7 layer (A) and P2O3 deficient layer (B), built up by alternating stacking forming
ABA΄B΄AB…. along the crystallographic c-axis (see Figure 15.1). This structure model for
(MoO)4(P2O7)3 i.e. “MoVP1.5O6.25” is distinctly different to that of NbVP1.8O7 [143], another
variation of the M P2O7 structure type. The crystal structure of (MoO)4(P2O7)3 has been
regarded as 3×3×4 superstructure of the M P2O7 structure type. The compositional difference
is related by the loss of “P2O3” from every second pyrophosphate group at layers z = 1/8, 3/8,
5/8, and 7/8 (see Figure 15.1).
Despite our detailed knowledge on the structural model of the pyrophosphate, (MoO)4(P2O7)3,
structural refinement in many cases gave physically meaningless distances d(P-O) and d(Mo-
O). In addition to this, splitting of half of the molybdenum atoms (18 atoms) appeared in the
defect layer. These observations might indicate that the true cell is even larger which we were
unable to identify from X-ray single-crystal investigations or the symmetry is even lower.
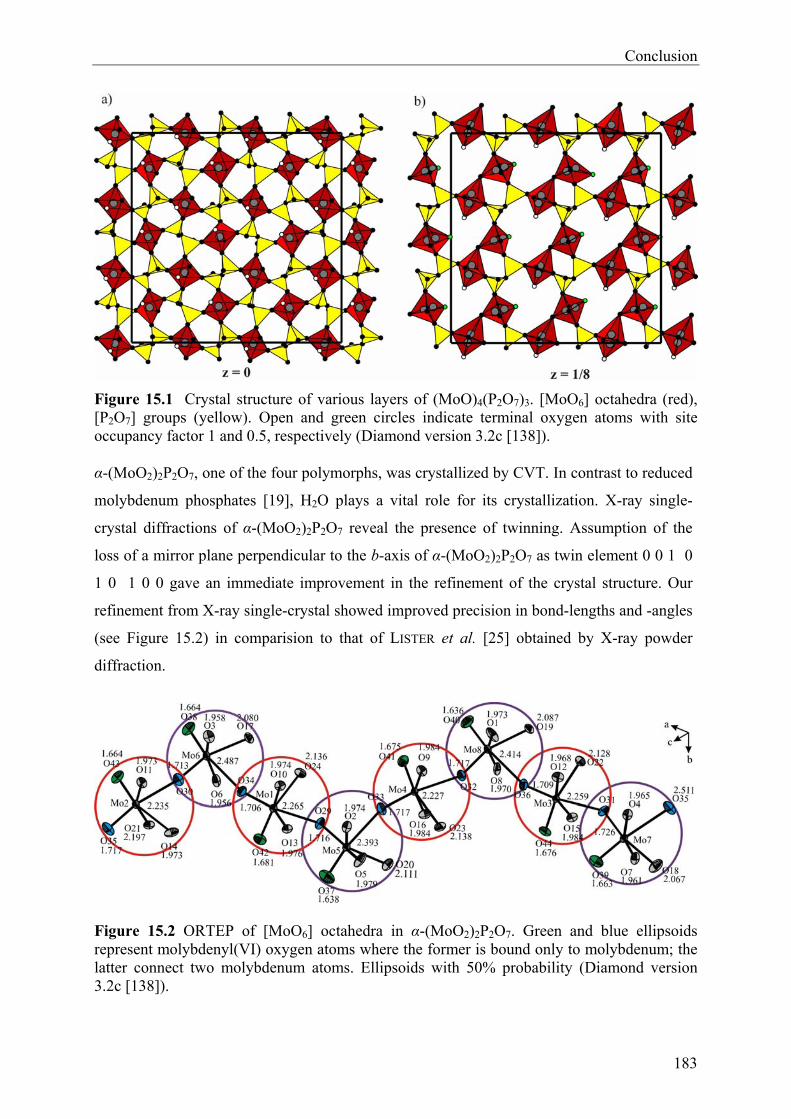
Conclusion
183
Figure 15.1 Crystal structure of various layers of (MoO)4(P2O7)3. [MoO6] octahedra (red), [P2O7] groups (yellow). Open and green circles indicate terminal oxygen atoms with site occupancy factor 1 and 0.5, respectively (Diamond version 3.2c [138]).
α-(MoO2)2P2O7, one of the four polymorphs, was crystallized by CVT. In contrast to reduced
molybdenum phosphates [19], H2O plays a vital role for its crystallization. X-ray single-
crystal diffractions of α-(MoO2)2P2O7 reveal the presence of twinning. Assumption of the
loss of a mirror plane perpendicular to the b-axis of α-(MoO2)2P2O7 as twin element 0 0 1 0
1 0 1 0 0 gave an immediate improvement in the refinement of the crystal structure. Our
refinement from X-ray single-crystal showed improved precision in bond-lengths and -angles
(see Figure 15.2) in comparision to that of LISTER et al. [25] obtained by X-ray powder
diffraction.
Figure 15.2 ORTEP of [MoO6] octahedra in α-(MoO2)2P2O7. Green and blue ellipsoids represent molybdenyl(VI) oxygen atoms where the former is bound only to molybdenum; the latter connect two molybdenum atoms. Ellipsoids with 50% probability (Diamond version 3.2c [138]).
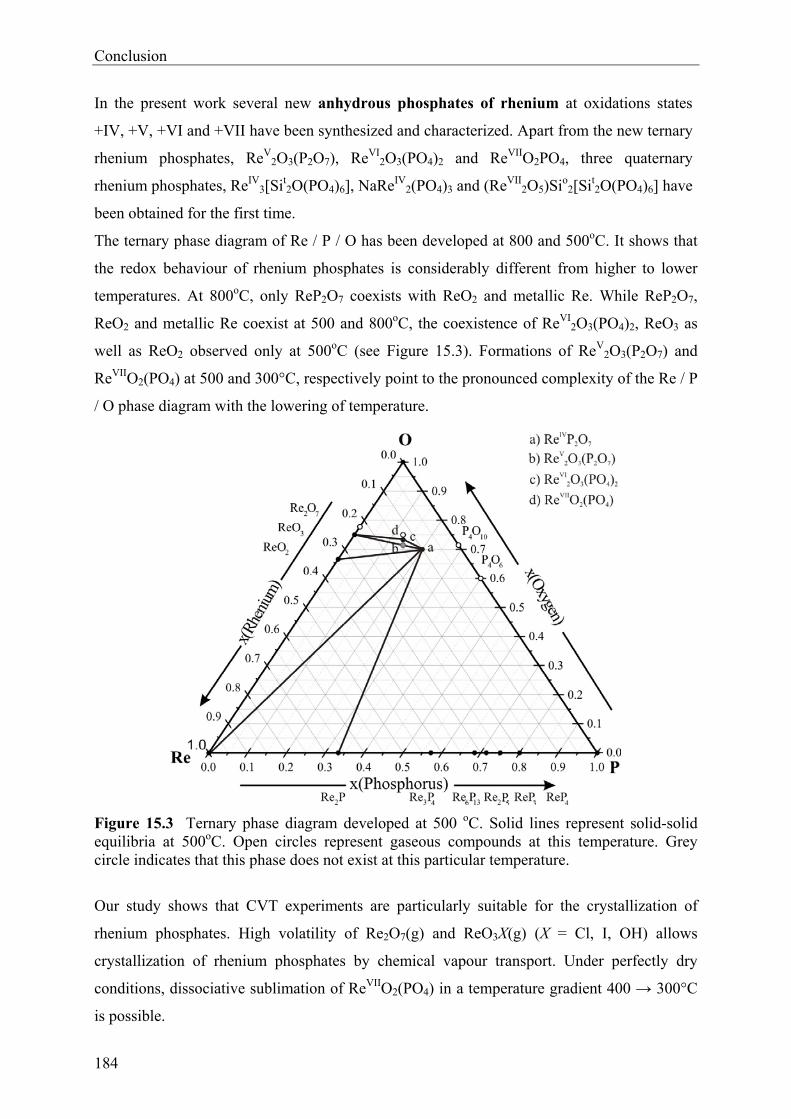
Conclusion
184
In the present work several new anhydrous phosphates of rhenium at oxidations states
+IV, +V, +VI and +VII have been synthesized and characterized. Apart from the new ternary
rhenium phosphates, ReV2O3(P2O7), ReVI
2O3(PO4)2 and ReVIIO2PO4, three quaternary
rhenium phosphates, ReIV3[Sit
2O(PO4)6], NaReIV2(PO4)3 and (ReVII
2O5)Sio2[Sit
2O(PO4)6] have
been obtained for the first time.
The ternary phase diagram of Re / P / O has been developed at 800 and 500oC. It shows that
the redox behaviour of rhenium phosphates is considerably different from higher to lower
temperatures. At 800oC, only ReP2O7 coexists with ReO2 and metallic Re. While ReP2O7,
ReO2 and metallic Re coexist at 500 and 800oC, the coexistence of ReVI2O3(PO4)2, ReO3 as
well as ReO2 observed only at 500oC (see Figure 15.3). Formations of ReV2O3(P2O7) and
ReVIIO2(PO4) at 500 and 300°C, respectively point to the pronounced complexity of the Re / P
/ O phase diagram with the lowering of temperature.
Figure 15.3 Ternary phase diagram developed at 500 oC. Solid lines represent solid-solid equilibria at 500oC. Open circles represent gaseous compounds at this temperature. Grey circle indicates that this phase does not exist at this particular temperature.
Our study shows that CVT experiments are particularly suitable for the crystallization of
rhenium phosphates. High volatility of Re2O7(g) and ReO3X(g) (X = Cl, I, OH) allows
crystallization of rhenium phosphates by chemical vapour transport. Under perfectly dry
conditions, dissociative sublimation of ReVIIO2(PO4) in a temperature gradient 400 → 300°C
is possible.
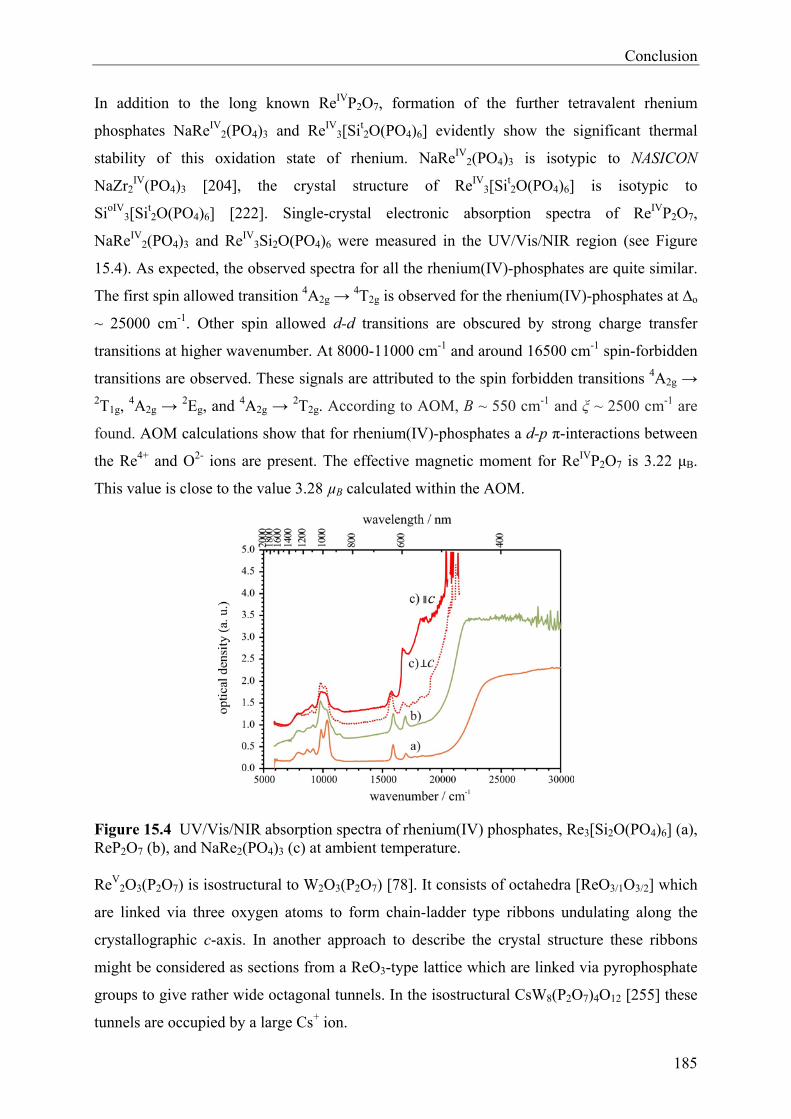
Conclusion
185
In addition to the long known ReIVP2O7, formation of the further tetravalent rhenium
phosphates NaReIV2(PO4)3 and ReIV
3[Sit2O(PO4)6] evidently show the significant thermal
stability of this oxidation state of rhenium. NaReIV2(PO4)3 is isotypic to NASICON
NaZr2IV(PO4)3 [204], the crystal structure of ReIV
3[Sit2O(PO4)6] is isotypic to
SioIV3[Sit
2O(PO4)6] [222]. Single-crystal electronic absorption spectra of ReIVP2O7,
NaReIV2(PO4)3 and ReIV
3Si2O(PO4)6 were measured in the UV/Vis/NIR region (see Figure
15.4). As expected, the observed spectra for all the rhenium(IV)-phosphates are quite similar.
The first spin allowed transition 4A2g → 4T2g is observed for the rhenium(IV)-phosphates at ∆o
~ 25000 cm-1. Other spin allowed d-d transitions are obscured by strong charge transfer
transitions at higher wavenumber. At 8000-11000 cm-1 and around 16500 cm-1 spin-forbidden
transitions are observed. These signals are attributed to the spin forbidden transitions 4A2g → 2T1g,
4A2g → 2Eg, and 4A2g → 2T2g. According to AOM, B ~ 550 cm-1 and ξ ~ 2500 cm-1 are
found. AOM calculations show that for rhenium(IV)-phosphates a d-p π-interactions between
the Re4+ and O2- ions are present. The effective magnetic moment for ReIVP2O7 is 3.22 μB.
This value is close to the value 3.28 µB calculated within the AOM.
Figure 15.4 UV/Vis/NIR absorption spectra of rhenium(IV) phosphates, Re3[Si2O(PO4)6] (a), ReP2O7 (b), and NaRe2(PO4)3 (c) at ambient temperature.
ReV2O3(P2O7) is isostructural to W2O3(P2O7) [78]. It consists of octahedra [ReO3/1O3/2] which
are linked via three oxygen atoms to form chain-ladder type ribbons undulating along the
crystallographic c-axis. In another approach to describe the crystal structure these ribbons
might be considered as sections from a ReO3-type lattice which are linked via pyrophosphate
groups to give rather wide octagonal tunnels. In the isostructural CsW8(P2O7)4O12 [255] these
tunnels are occupied by a large Cs+ ion.
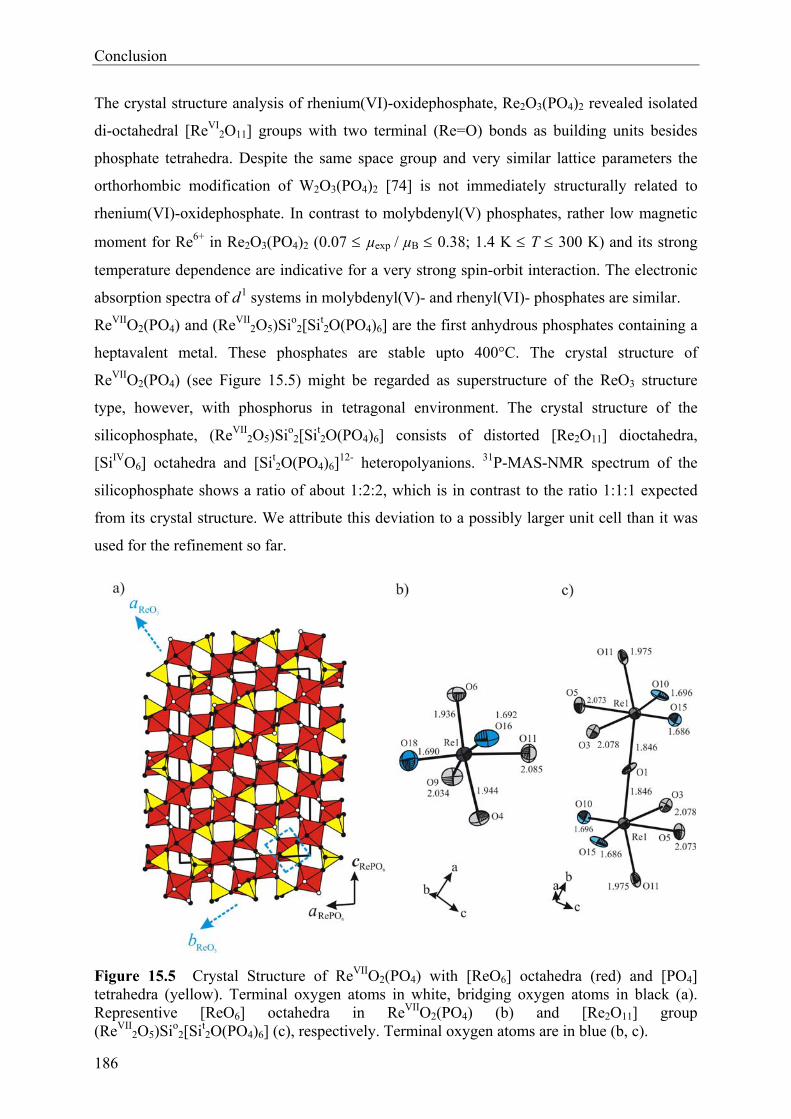
Conclusion
186
The crystal structure analysis of rhenium(VI)-oxidephosphate, Re2O3(PO4)2 revealed isolated
di-octahedral [ReVI2O11] groups with two terminal (Re=O) bonds as building units besides
phosphate tetrahedra. Despite the same space group and very similar lattice parameters the
orthorhombic modification of W2O3(PO4)2 [74] is not immediately structurally related to
rhenium(VI)-oxidephosphate. In contrast to molybdenyl(V) phosphates, rather low magnetic
moment for Re6+ in Re2O3(PO4)2 (0.07 µexp / µB 0.38; 1.4 K T 300 K) and its strong
temperature dependence are indicative for a very strong spin-orbit interaction. The electronic
absorption spectra of d1 systems in molybdenyl(V)- and rhenyl(VI)- phosphates are similar.
ReVIIO2(PO4) and (ReVII2O5)Sio
2[Sit2O(PO4)6] are the first anhydrous phosphates containing a
heptavalent metal. These phosphates are stable upto 400°C. The crystal structure of
ReVIIO2(PO4) (see Figure 15.5) might be regarded as superstructure of the ReO3 structure
type, however, with phosphorus in tetragonal environment. The crystal structure of the
silicophosphate, (ReVII2O5)Sio
2[Sit2O(PO4)6] consists of distorted [Re2O11] dioctahedra,
[SiIVO6] octahedra and [Sit2O(PO4)6]
12- heteropolyanions. 31P-MAS-NMR spectrum of the
silicophosphate shows a ratio of about 1:2:2, which is in contrast to the ratio 1:1:1 expected
from its crystal structure. We attribute this deviation to a possibly larger unit cell than it was
used for the refinement so far.
Figure 15.5 Crystal Structure of ReVIIO2(PO4) with [ReO6] octahedra (red) and [PO4] tetrahedra (yellow). Terminal oxygen atoms in white, bridging oxygen atoms in black (a). Representive [ReO6] octahedra in ReVIIO2(PO4) (b) and [Re2O11] group (ReVII
2O5)Sio2[Sit
2O(PO4)6] (c), respectively. Terminal oxygen atoms are in blue (b, c).
Conclusion
187
It is quite remarkable that the observed range of distances 1.66 ≤ d(ReVII-O) ≤ 2.10 Å in the
phosphates is very similar to that found in many other oxide compounds containing rhenium
in oxidation states 4+, 5+, 6+ and 7+. Therefore, assignment of oxidation states for rhenium
on the basis of distances d(Re-O) has to be treated with great care.
As in several coordination compounds of Re7+ the formation of the perrhenyl cations (ReO2)3+
and (Re2O5)4+ are observed in the phosphate and the silico-phosphate, respectively. The
presence of two distinctly different types of oxygen atoms (terminal in the perrhenyl-groups
and bridging between Re and P) is comparable to oxides and in particular phosphates of V4+,
V5+, and Mo6+, which are all active catalysts for selective oxidation of hydrocarbons [301].
These observations might emphasize the catalytic activity of rhenium phosphates.
Chemically and crystal chemically ReVIIO2(PO4) is very similar to oxide compounds of V4+,
V5+ and Mo6+, thus providing support for the diagonal relation among V5+, Mo6+, and Re7+.
This relation is further expressed by the closely related crystal structures of ReVIIO2(PO4) and
MoVIO2(SO4) [154]. There is even evidence for polymorphism in ReVIIO2(PO4) as it was
observed for MoVIO2(SO4). Phosphates of rhenium in the lower oxidation states +IV, +V, and
+VI (ReIVP2O7 [81], ReV2O3(P2O7) [282], ReVI
2O3(PO4)2 [281]) are closely related to the
corresponding tungsten compounds WIVP2O7, WV
2O3(P2O7), and WVI2O3(PO4)2.
Finally, it might be concluded that with the syntheses of anhydrous rhenium phosphates at
+IV, +V, +VI, and +VII oxidation states of rhenium, the crystal chemistry of anhydrous
transition metal phosphates have been considerably extended. Our study shows that the redox
behaviour of rhenium is comparable to that of its neighbour elements; i. e. molybdenum,
vanadium. In addition to formation of a large number of ternary phosphates of these elements,
up to now a plethora of quaternary phosphates have been synthesized and characterized. The
main reason for the formation of such a large number of phosphates is the existence of various
oxidation states and their stability in a phosphate matrix. Therefore, it is evident that an
enormous research field for polynary rhenium phosphates have been opened by the present
work.
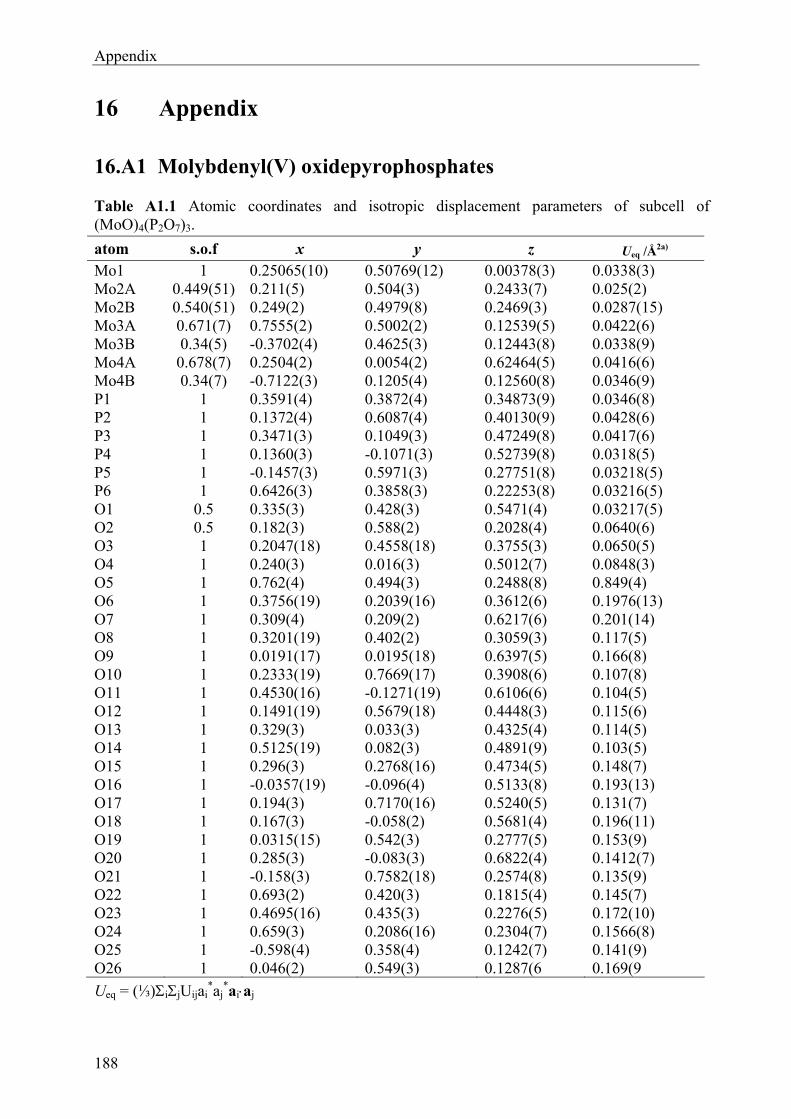
Appendix
188
16 Appendix
16.A1 Molybdenyl(V) oxidepyrophosphates
Table A1.1 Atomic coordinates and isotropic displacement parameters of subcell of (MoO)4(P2O7)3.
atom s.o.f x y z Ueq /Å2a) Mo1 1 0.25065(10) 0.50769(12) 0.00378(3) 0.0338(3) Mo2A 0.449(51) 0.211(5) 0.504(3) 0.2433(7) 0.025(2) Mo2B 0.540(51) 0.249(2) 0.4979(8) 0.2469(3) 0.0287(15) Mo3A 0.671(7) 0.7555(2) 0.5002(2) 0.12539(5) 0.0422(6) Mo3B 0.34(5) -0.3702(4) 0.4625(3) 0.12443(8) 0.0338(9) Mo4A 0.678(7) 0.2504(2) 0.0054(2) 0.62464(5) 0.0416(6) Mo4B 0.34(7) -0.7122(3) 0.1205(4) 0.12560(8) 0.0346(9) P1 1 0.3591(4) 0.3872(4) 0.34873(9) 0.0346(8) P2 1 0.1372(4) 0.6087(4) 0.40130(9) 0.0428(6) P3 1 0.3471(3) 0.1049(3) 0.47249(8) 0.0417(6) P4 1 0.1360(3) -0.1071(3) 0.52739(8) 0.0318(5) P5 1 -0.1457(3) 0.5971(3) 0.27751(8) 0.03218(5) P6 1 0.6426(3) 0.3858(3) 0.22253(8) 0.03216(5) O1 0.5 0.335(3) 0.428(3) 0.5471(4) 0.03217(5) O2 0.5 0.182(3) 0.588(2) 0.2028(4) 0.0640(6) O3 1 0.2047(18) 0.4558(18) 0.3755(3) 0.0650(5) O4 1 0.240(3) 0.016(3) 0.5012(7) 0.0848(3) O5 1 0.762(4) 0.494(3) 0.2488(8) 0.849(4) O6 1 0.3756(19) 0.2039(16) 0.3612(6) 0.1976(13) O7 1 0.309(4) 0.209(2) 0.6217(6) 0.201(14) O8 1 0.3201(19) 0.402(2) 0.3059(3) 0.117(5) O9 1 0.0191(17) 0.0195(18) 0.6397(5) 0.166(8) O10 1 0.2333(19) 0.7669(17) 0.3908(6) 0.107(8) O11 1 0.4530(16) -0.1271(19) 0.6106(6) 0.104(5) O12 1 0.1491(19) 0.5679(18) 0.4448(3) 0.115(6) O13 1 0.329(3) 0.033(3) 0.4325(4) 0.114(5) O14 1 0.5125(19) 0.082(3) 0.4891(9) 0.103(5) O15 1 0.296(3) 0.2768(16) 0.4734(5) 0.148(7) O16 1 -0.0357(19) -0.096(4) 0.5133(8) 0.193(13) O17 1 0.194(3) 0.7170(16) 0.5240(5) 0.131(7) O18 1 0.167(3) -0.058(2) 0.5681(4) 0.196(11) O19 1 0.0315(15) 0.542(3) 0.2777(5) 0.153(9) O20 1 0.285(3) -0.083(3) 0.6822(4) 0.1412(7) O21 1 -0.158(3) 0.7582(18) 0.2574(8) 0.135(9) O22 1 0.693(2) 0.420(3) 0.1815(4) 0.145(7) O23 1 0.4695(16) 0.435(3) 0.2276(5) 0.172(10) O24 1 0.659(3) 0.2086(16) 0.2304(7) 0.1566(8) O25 1 -0.598(4) 0.358(4) 0.1242(7) 0.141(9) O26 1 0.046(2) 0.549(3) 0.1287(6 0.169(9
Ueq = (⅓)ijUijai*aj
*aiaj
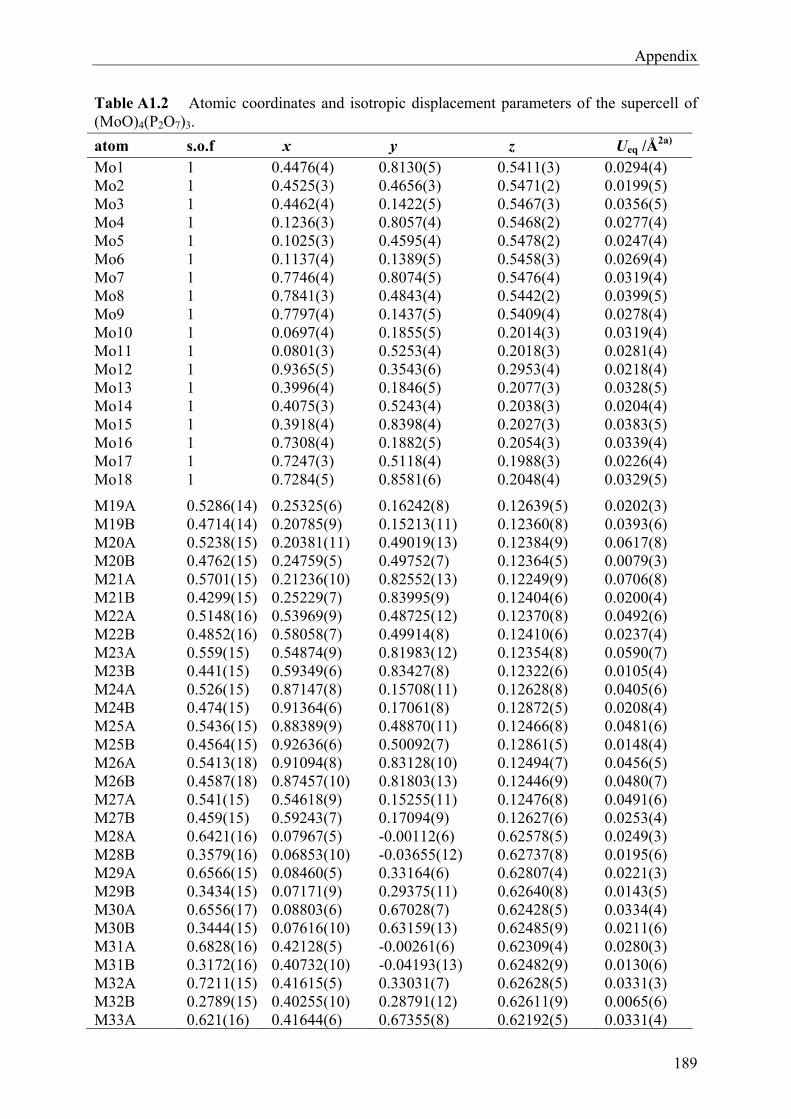
Appendix
189
Table A1.2 Atomic coordinates and isotropic displacement parameters of the supercell of (MoO)4(P2O7)3.
atom s.o.f x y z Ueq /Å2a) Mo1 1 0.4476(4) 0.8130(5) 0.5411(3) 0.0294(4) Mo2 1 0.4525(3) 0.4656(3) 0.5471(2) 0.0199(5) Mo3 1 0.4462(4) 0.1422(5) 0.5467(3) 0.0356(5) Mo4 1 0.1236(3) 0.8057(4) 0.5468(2) 0.0277(4) Mo5 1 0.1025(3) 0.4595(4) 0.5478(2) 0.0247(4) Mo6 1 0.1137(4) 0.1389(5) 0.5458(3) 0.0269(4) Mo7 1 0.7746(4) 0.8074(5) 0.5476(4) 0.0319(4) Mo8 1 0.7841(3) 0.4843(4) 0.5442(2) 0.0399(5) Mo9 1 0.7797(4) 0.1437(5) 0.5409(4) 0.0278(4) Mo10 1 0.0697(4) 0.1855(5) 0.2014(3) 0.0319(4) Mo11 1 0.0801(3) 0.5253(4) 0.2018(3) 0.0281(4) Mo12 1 0.9365(5) 0.3543(6) 0.2953(4) 0.0218(4) Mo13 1 0.3996(4) 0.1846(5) 0.2077(3) 0.0328(5) Mo14 1 0.4075(3) 0.5243(4) 0.2038(3) 0.0204(4) Mo15 1 0.3918(4) 0.8398(4) 0.2027(3) 0.0383(5) Mo16 1 0.7308(4) 0.1882(5) 0.2054(3) 0.0339(4) Mo17 1 0.7247(3) 0.5118(4) 0.1988(3) 0.0226(4) Mo18 1 0.7284(5) 0.8581(6) 0.2048(4) 0.0329(5)
M19A 0.5286(14) 0.25325(6) 0.16242(8) 0.12639(5) 0.0202(3) M19B 0.4714(14) 0.20785(9) 0.15213(11) 0.12360(8) 0.0393(6) M20A 0.5238(15) 0.20381(11) 0.49019(13) 0.12384(9) 0.0617(8) M20B 0.4762(15) 0.24759(5) 0.49752(7) 0.12364(5) 0.0079(3) M21A 0.5701(15) 0.21236(10) 0.82552(13) 0.12249(9) 0.0706(8) M21B 0.4299(15) 0.25229(7) 0.83995(9) 0.12404(6) 0.0200(4) M22A 0.5148(16) 0.53969(9) 0.48725(12) 0.12370(8) 0.0492(6) M22B 0.4852(16) 0.58058(7) 0.49914(8) 0.12410(6) 0.0237(4) M23A 0.559(15) 0.54874(9) 0.81983(12) 0.12354(8) 0.0590(7) M23B 0.441(15) 0.59349(6) 0.83427(8) 0.12322(6) 0.0105(4) M24A 0.526(15) 0.87147(8) 0.15708(11) 0.12628(8) 0.0405(6) M24B 0.474(15) 0.91364(6) 0.17061(8) 0.12872(5) 0.0208(4) M25A 0.5436(15) 0.88389(9) 0.48870(11) 0.12466(8) 0.0481(6) M25B 0.4564(15) 0.92636(6) 0.50092(7) 0.12861(5) 0.0148(4) M26A 0.5413(18) 0.91094(8) 0.83128(10) 0.12494(7) 0.0456(5) M26B 0.4587(18) 0.87457(10) 0.81803(13) 0.12446(9) 0.0480(7) M27A 0.541(15) 0.54618(9) 0.15255(11) 0.12476(8) 0.0491(6) M27B 0.459(15) 0.59243(7) 0.17094(9) 0.12627(6) 0.0253(4) M28A 0.6421(16) 0.07967(5) -0.00112(6) 0.62578(5) 0.0249(3) M28B 0.3579(16) 0.06853(10) -0.03655(12) 0.62737(8) 0.0195(6) M29A 0.6566(15) 0.08460(5) 0.33164(6) 0.62807(4) 0.0221(3) M29B 0.3434(15) 0.07171(9) 0.29375(11) 0.62640(8) 0.0143(5) M30A 0.6556(17) 0.08803(6) 0.67028(7) 0.62428(5) 0.0334(4) M30B 0.3444(15) 0.07616(10) 0.63159(13) 0.62485(9) 0.0211(6) M31A 0.6828(16) 0.42128(5) -0.00261(6) 0.62309(4) 0.0280(3) M31B 0.3172(16) 0.40732(10) -0.04193(13) 0.62482(9) 0.0130(6) M32A 0.7211(15) 0.41615(5) 0.33031(7) 0.62628(5) 0.0331(3) M32B 0.2789(15) 0.40255(10) 0.28791(12) 0.62611(9) 0.0065(6) M33A 0.621(16) 0.41644(6) 0.67355(8) 0.62192(5) 0.0331(4)
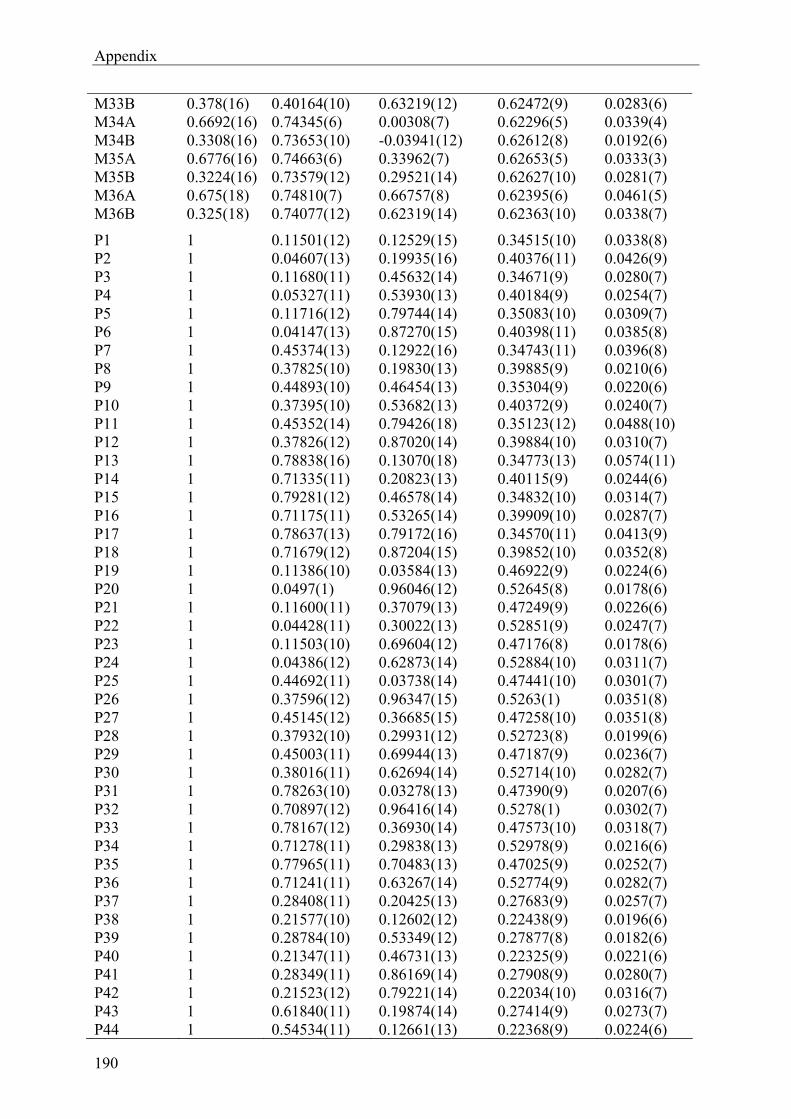
Appendix
190
M33B 0.378(16) 0.40164(10) 0.63219(12) 0.62472(9) 0.0283(6) M34A 0.6692(16) 0.74345(6) 0.00308(7) 0.62296(5) 0.0339(4) M34B 0.3308(16) 0.73653(10) -0.03941(12) 0.62612(8) 0.0192(6) M35A 0.6776(16) 0.74663(6) 0.33962(7) 0.62653(5) 0.0333(3) M35B 0.3224(16) 0.73579(12) 0.29521(14) 0.62627(10) 0.0281(7) M36A 0.675(18) 0.74810(7) 0.66757(8) 0.62395(6) 0.0461(5) M36B 0.325(18) 0.74077(12) 0.62319(14) 0.62363(10) 0.0338(7)
P1 1 0.11501(12) 0.12529(15) 0.34515(10) 0.0338(8) P2 1 0.04607(13) 0.19935(16) 0.40376(11) 0.0426(9) P3 1 0.11680(11) 0.45632(14) 0.34671(9) 0.0280(7) P4 1 0.05327(11) 0.53930(13) 0.40184(9) 0.0254(7) P5 1 0.11716(12) 0.79744(14) 0.35083(10) 0.0309(7) P6 1 0.04147(13) 0.87270(15) 0.40398(11) 0.0385(8) P7 1 0.45374(13) 0.12922(16) 0.34743(11) 0.0396(8) P8 1 0.37825(10) 0.19830(13) 0.39885(9) 0.0210(6) P9 1 0.44893(10) 0.46454(13) 0.35304(9) 0.0220(6) P10 1 0.37395(10) 0.53682(13) 0.40372(9) 0.0240(7) P11 1 0.45352(14) 0.79426(18) 0.35123(12) 0.0488(10) P12 1 0.37826(12) 0.87020(14) 0.39884(10) 0.0310(7) P13 1 0.78838(16) 0.13070(18) 0.34773(13) 0.0574(11) P14 1 0.71335(11) 0.20823(13) 0.40115(9) 0.0244(6) P15 1 0.79281(12) 0.46578(14) 0.34832(10) 0.0314(7) P16 1 0.71175(11) 0.53265(14) 0.39909(10) 0.0287(7) P17 1 0.78637(13) 0.79172(16) 0.34570(11) 0.0413(9) P18 1 0.71679(12) 0.87204(15) 0.39852(10) 0.0352(8) P19 1 0.11386(10) 0.03584(13) 0.46922(9) 0.0224(6) P20 1 0.0497(1) 0.96046(12) 0.52645(8) 0.0178(6) P21 1 0.11600(11) 0.37079(13) 0.47249(9) 0.0226(6) P22 1 0.04428(11) 0.30022(13) 0.52851(9) 0.0247(7) P23 1 0.11503(10) 0.69604(12) 0.47176(8) 0.0178(6) P24 1 0.04386(12) 0.62873(14) 0.52884(10) 0.0311(7) P25 1 0.44692(11) 0.03738(14) 0.47441(10) 0.0301(7) P26 1 0.37596(12) 0.96347(15) 0.5263(1) 0.0351(8) P27 1 0.45145(12) 0.36685(15) 0.47258(10) 0.0351(8) P28 1 0.37932(10) 0.29931(12) 0.52723(8) 0.0199(6) P29 1 0.45003(11) 0.69944(13) 0.47187(9) 0.0236(7) P30 1 0.38016(11) 0.62694(14) 0.52714(10) 0.0282(7) P31 1 0.78263(10) 0.03278(13) 0.47390(9) 0.0207(6) P32 1 0.70897(12) 0.96416(14) 0.5278(1) 0.0302(7) P33 1 0.78167(12) 0.36930(14) 0.47573(10) 0.0318(7) P34 1 0.71278(11) 0.29838(13) 0.52978(9) 0.0216(6) P35 1 0.77965(11) 0.70483(13) 0.47025(9) 0.0252(7) P36 1 0.71241(11) 0.63267(14) 0.52774(9) 0.0282(7) P37 1 0.28408(11) 0.20425(13) 0.27683(9) 0.0257(7) P38 1 0.21577(10) 0.12602(12) 0.22438(9) 0.0196(6) P39 1 0.28784(10) 0.53349(12) 0.27877(8) 0.0182(6) P40 1 0.21347(11) 0.46731(13) 0.22325(9) 0.0221(6) P41 1 0.28349(11) 0.86169(14) 0.27908(9) 0.0280(7) P42 1 0.21523(12) 0.79221(14) 0.22034(10) 0.0316(7) P43 1 0.61840(11) 0.19874(14) 0.27414(9) 0.0273(7) P44 1 0.54534(11) 0.12661(13) 0.22368(9) 0.0224(6)
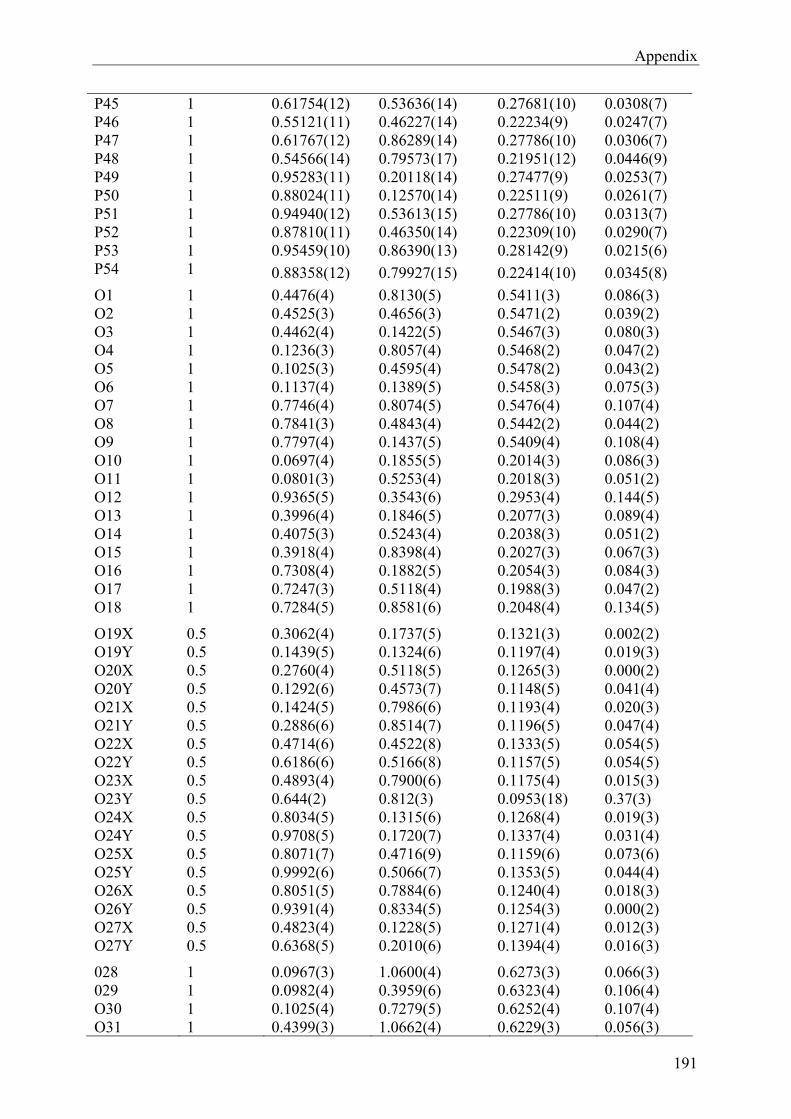
Appendix
191
P45 1 0.61754(12) 0.53636(14) 0.27681(10) 0.0308(7) P46 1 0.55121(11) 0.46227(14) 0.22234(9) 0.0247(7) P47 1 0.61767(12) 0.86289(14) 0.27786(10) 0.0306(7) P48 1 0.54566(14) 0.79573(17) 0.21951(12) 0.0446(9) P49 1 0.95283(11) 0.20118(14) 0.27477(9) 0.0253(7) P50 1 0.88024(11) 0.12570(14) 0.22511(9) 0.0261(7) P51 1 0.94940(12) 0.53613(15) 0.27786(10) 0.0313(7) P52 1 0.87810(11) 0.46350(14) 0.22309(10) 0.0290(7) P53 1 0.95459(10) 0.86390(13) 0.28142(9) 0.0215(6) P54 1 0.88358(12) 0.79927(15) 0.22414(10) 0.0345(8)
O1 1 0.4476(4) 0.8130(5) 0.5411(3) 0.086(3) O2 1 0.4525(3) 0.4656(3) 0.5471(2) 0.039(2) O3 1 0.4462(4) 0.1422(5) 0.5467(3) 0.080(3) O4 1 0.1236(3) 0.8057(4) 0.5468(2) 0.047(2) O5 1 0.1025(3) 0.4595(4) 0.5478(2) 0.043(2) O6 1 0.1137(4) 0.1389(5) 0.5458(3) 0.075(3) O7 1 0.7746(4) 0.8074(5) 0.5476(4) 0.107(4) O8 1 0.7841(3) 0.4843(4) 0.5442(2) 0.044(2) O9 1 0.7797(4) 0.1437(5) 0.5409(4) 0.108(4) O10 1 0.0697(4) 0.1855(5) 0.2014(3) 0.086(3) O11 1 0.0801(3) 0.5253(4) 0.2018(3) 0.051(2) O12 1 0.9365(5) 0.3543(6) 0.2953(4) 0.144(5) O13 1 0.3996(4) 0.1846(5) 0.2077(3) 0.089(4) O14 1 0.4075(3) 0.5243(4) 0.2038(3) 0.051(2) O15 1 0.3918(4) 0.8398(4) 0.2027(3) 0.067(3) O16 1 0.7308(4) 0.1882(5) 0.2054(3) 0.084(3) O17 1 0.7247(3) 0.5118(4) 0.1988(3) 0.047(2) O18 1 0.7284(5) 0.8581(6) 0.2048(4) 0.134(5)
O19X 0.5 0.3062(4) 0.1737(5) 0.1321(3) 0.002(2) O19Y 0.5 0.1439(5) 0.1324(6) 0.1197(4) 0.019(3) O20X 0.5 0.2760(4) 0.5118(5) 0.1265(3) 0.000(2) O20Y 0.5 0.1292(6) 0.4573(7) 0.1148(5) 0.041(4) O21X 0.5 0.1424(5) 0.7986(6) 0.1193(4) 0.020(3) O21Y 0.5 0.2886(6) 0.8514(7) 0.1196(5) 0.047(4) O22X 0.5 0.4714(6) 0.4522(8) 0.1333(5) 0.054(5) O22Y 0.5 0.6186(6) 0.5166(8) 0.1157(5) 0.054(5) O23X 0.5 0.4893(4) 0.7900(6) 0.1175(4) 0.015(3) O23Y 0.5 0.644(2) 0.812(3) 0.0953(18) 0.37(3) O24X 0.5 0.8034(5) 0.1315(6) 0.1268(4) 0.019(3) O24Y 0.5 0.9708(5) 0.1720(7) 0.1337(4) 0.031(4) O25X 0.5 0.8071(7) 0.4716(9) 0.1159(6) 0.073(6) O25Y 0.5 0.9992(6) 0.5066(7) 0.1353(5) 0.044(4) O26X 0.5 0.8051(5) 0.7884(6) 0.1240(4) 0.018(3) O26Y 0.5 0.9391(4) 0.8334(5) 0.1254(3) 0.000(2) O27X 0.5 0.4823(4) 0.1228(5) 0.1271(4) 0.012(3) O27Y 0.5 0.6368(5) 0.2010(6) 0.1394(4) 0.016(3)
028 1 0.0967(3) 1.0600(4) 0.6273(3) 0.066(3) 029 1 0.0982(4) 0.3959(6) 0.6323(4) 0.106(4) O30 1 0.1025(4) 0.7279(5) 0.6252(4) 0.107(4) O31 1 0.4399(3) 1.0662(4) 0.6229(3) 0.056(3)
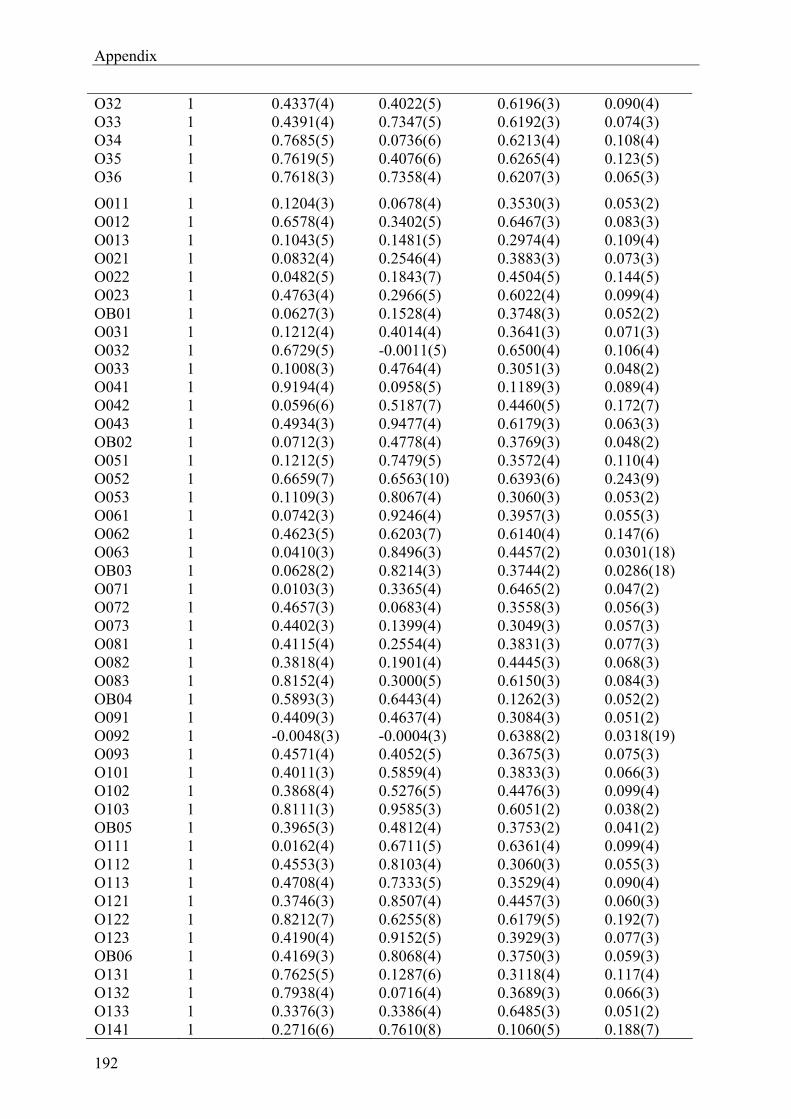
Appendix
192
O32 1 0.4337(4) 0.4022(5) 0.6196(3) 0.090(4) O33 1 0.4391(4) 0.7347(5) 0.6192(3) 0.074(3) O34 1 0.7685(5) 0.0736(6) 0.6213(4) 0.108(4) O35 1 0.7619(5) 0.4076(6) 0.6265(4) 0.123(5) O36 1 0.7618(3) 0.7358(4) 0.6207(3) 0.065(3)
O011 1 0.1204(3) 0.0678(4) 0.3530(3) 0.053(2) O012 1 0.6578(4) 0.3402(5) 0.6467(3) 0.083(3) O013 1 0.1043(5) 0.1481(5) 0.2974(4) 0.109(4) O021 1 0.0832(4) 0.2546(4) 0.3883(3) 0.073(3) O022 1 0.0482(5) 0.1843(7) 0.4504(5) 0.144(5) O023 1 0.4763(4) 0.2966(5) 0.6022(4) 0.099(4) OB01 1 0.0627(3) 0.1528(4) 0.3748(3) 0.052(2) O031 1 0.1212(4) 0.4014(4) 0.3641(3) 0.071(3) O032 1 0.6729(5) -0.0011(5) 0.6500(4) 0.106(4) O033 1 0.1008(3) 0.4764(4) 0.3051(3) 0.048(2) O041 1 0.9194(4) 0.0958(5) 0.1189(3) 0.089(4) O042 1 0.0596(6) 0.5187(7) 0.4460(5) 0.172(7) O043 1 0.4934(3) 0.9477(4) 0.6179(3) 0.063(3) OB02 1 0.0712(3) 0.4778(4) 0.3769(3) 0.048(2) O051 1 0.1212(5) 0.7479(5) 0.3572(4) 0.110(4) O052 1 0.6659(7) 0.6563(10) 0.6393(6) 0.243(9) O053 1 0.1109(3) 0.8067(4) 0.3060(3) 0.053(2) O061 1 0.0742(3) 0.9246(4) 0.3957(3) 0.055(3) O062 1 0.4623(5) 0.6203(7) 0.6140(4) 0.147(6) O063 1 0.0410(3) 0.8496(3) 0.4457(2) 0.0301(18) OB03 1 0.0628(2) 0.8214(3) 0.3744(2) 0.0286(18) O071 1 0.0103(3) 0.3365(4) 0.6465(2) 0.047(2) O072 1 0.4657(3) 0.0683(4) 0.3558(3) 0.056(3) O073 1 0.4402(3) 0.1399(4) 0.3049(3) 0.057(3) O081 1 0.4115(4) 0.2554(4) 0.3831(3) 0.077(3) O082 1 0.3818(4) 0.1901(4) 0.4445(3) 0.068(3) O083 1 0.8152(4) 0.3000(5) 0.6150(3) 0.084(3) OB04 1 0.5893(3) 0.6443(4) 0.1262(3) 0.052(2) O091 1 0.4409(3) 0.4637(4) 0.3084(3) 0.051(2) O092 1 -0.0048(3) -0.0004(3) 0.6388(2) 0.0318(19) O093 1 0.4571(4) 0.4052(5) 0.3675(3) 0.075(3) O101 1 0.4011(3) 0.5859(4) 0.3833(3) 0.066(3) O102 1 0.3868(4) 0.5276(5) 0.4476(3) 0.099(4) O103 1 0.8111(3) 0.9585(3) 0.6051(2) 0.038(2) OB05 1 0.3965(3) 0.4812(4) 0.3753(2) 0.041(2) O111 1 0.0162(4) 0.6711(5) 0.6361(4) 0.099(4) O112 1 0.4553(3) 0.8103(4) 0.3060(3) 0.055(3) O113 1 0.4708(4) 0.7333(5) 0.3529(4) 0.090(4) O121 1 0.3746(3) 0.8507(4) 0.4457(3) 0.060(3) O122 1 0.8212(7) 0.6255(8) 0.6179(5) 0.192(7) O123 1 0.4190(4) 0.9152(5) 0.3929(3) 0.077(3) OB06 1 0.4169(3) 0.8068(4) 0.3750(3) 0.059(3) O131 1 0.7625(5) 0.1287(6) 0.3118(4) 0.117(4) O132 1 0.7938(4) 0.0716(4) 0.3689(3) 0.066(3) O133 1 0.3376(3) 0.3386(4) 0.6485(3) 0.051(2) O141 1 0.2716(6) 0.7610(8) 0.1060(5) 0.188(7)
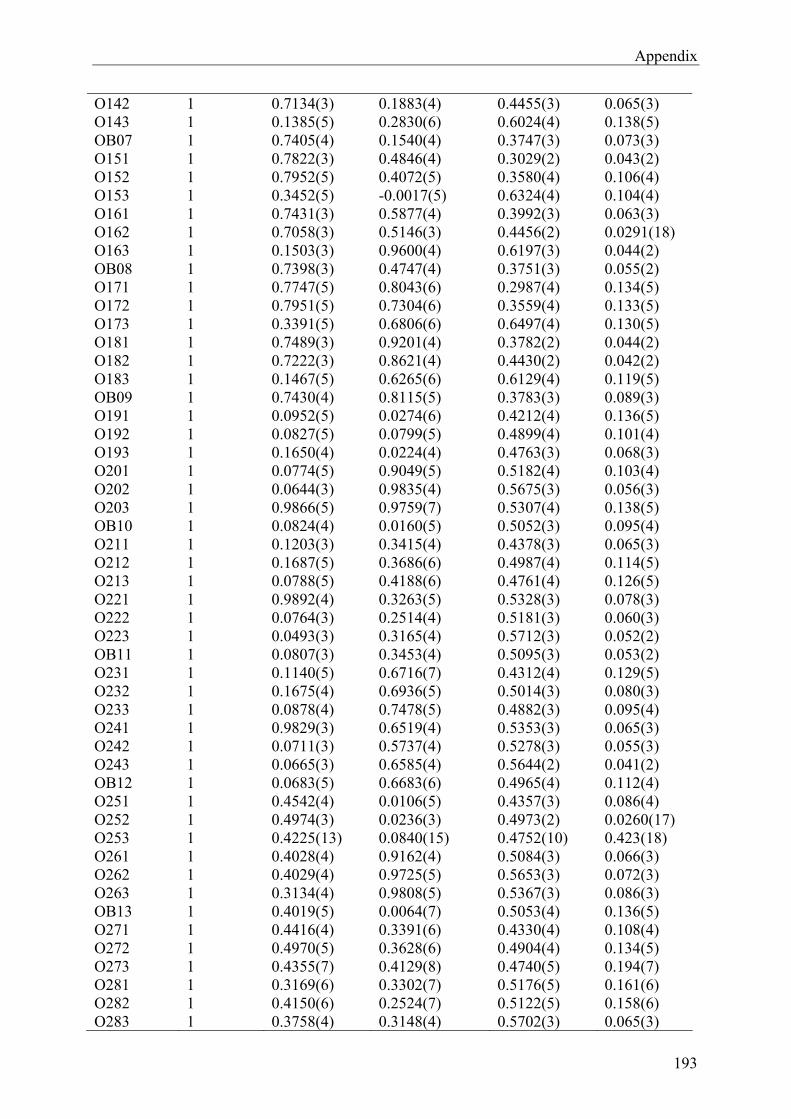
Appendix
193
O142 1 0.7134(3) 0.1883(4) 0.4455(3) 0.065(3) O143 1 0.1385(5) 0.2830(6) 0.6024(4) 0.138(5) OB07 1 0.7405(4) 0.1540(4) 0.3747(3) 0.073(3) O151 1 0.7822(3) 0.4846(4) 0.3029(2) 0.043(2) O152 1 0.7952(5) 0.4072(5) 0.3580(4) 0.106(4) O153 1 0.3452(5) -0.0017(5) 0.6324(4) 0.104(4) O161 1 0.7431(3) 0.5877(4) 0.3992(3) 0.063(3) O162 1 0.7058(3) 0.5146(3) 0.4456(2) 0.0291(18) O163 1 0.1503(3) 0.9600(4) 0.6197(3) 0.044(2) OB08 1 0.7398(3) 0.4747(4) 0.3751(3) 0.055(2) O171 1 0.7747(5) 0.8043(6) 0.2987(4) 0.134(5) O172 1 0.7951(5) 0.7304(6) 0.3559(4) 0.133(5) O173 1 0.3391(5) 0.6806(6) 0.6497(4) 0.130(5) O181 1 0.7489(3) 0.9201(4) 0.3782(2) 0.044(2) O182 1 0.7222(3) 0.8621(4) 0.4430(2) 0.042(2) O183 1 0.1467(5) 0.6265(6) 0.6129(4) 0.119(5) OB09 1 0.7430(4) 0.8115(5) 0.3783(3) 0.089(3) O191 1 0.0952(5) 0.0274(6) 0.4212(4) 0.136(5) O192 1 0.0827(5) 0.0799(5) 0.4899(4) 0.101(4) O193 1 0.1650(4) 0.0224(4) 0.4763(3) 0.068(3) O201 1 0.0774(5) 0.9049(5) 0.5182(4) 0.103(4) O202 1 0.0644(3) 0.9835(4) 0.5675(3) 0.056(3) O203 1 0.9866(5) 0.9759(7) 0.5307(4) 0.138(5) OB10 1 0.0824(4) 0.0160(5) 0.5052(3) 0.095(4) O211 1 0.1203(3) 0.3415(4) 0.4378(3) 0.065(3) O212 1 0.1687(5) 0.3686(6) 0.4987(4) 0.114(5) O213 1 0.0788(5) 0.4188(6) 0.4761(4) 0.126(5) O221 1 0.9892(4) 0.3263(5) 0.5328(3) 0.078(3) O222 1 0.0764(3) 0.2514(4) 0.5181(3) 0.060(3) O223 1 0.0493(3) 0.3165(4) 0.5712(3) 0.052(2) OB11 1 0.0807(3) 0.3453(4) 0.5095(3) 0.053(2) O231 1 0.1140(5) 0.6716(7) 0.4312(4) 0.129(5) O232 1 0.1675(4) 0.6936(5) 0.5014(3) 0.080(3) O233 1 0.0878(4) 0.7478(5) 0.4882(3) 0.095(4) O241 1 0.9829(3) 0.6519(4) 0.5353(3) 0.065(3) O242 1 0.0711(3) 0.5737(4) 0.5278(3) 0.055(3) O243 1 0.0665(3) 0.6585(4) 0.5644(2) 0.041(2) OB12 1 0.0683(5) 0.6683(6) 0.4965(4) 0.112(4) O251 1 0.4542(4) 0.0106(5) 0.4357(3) 0.086(4) O252 1 0.4974(3) 0.0236(3) 0.4973(2) 0.0260(17) O253 1 0.4225(13) 0.0840(15) 0.4752(10) 0.423(18) O261 1 0.4028(4) 0.9162(4) 0.5084(3) 0.066(3) O262 1 0.4029(4) 0.9725(5) 0.5653(3) 0.072(3) O263 1 0.3134(4) 0.9808(5) 0.5367(3) 0.086(3) OB13 1 0.4019(5) 0.0064(7) 0.5053(4) 0.136(5) O271 1 0.4416(4) 0.3391(6) 0.4330(4) 0.108(4) O272 1 0.4970(5) 0.3628(6) 0.4904(4) 0.134(5) O273 1 0.4355(7) 0.4129(8) 0.4740(5) 0.194(7) O281 1 0.3169(6) 0.3302(7) 0.5176(5) 0.161(6) O282 1 0.4150(6) 0.2524(7) 0.5122(5) 0.158(6) O283 1 0.3758(4) 0.3148(4) 0.5702(3) 0.065(3)
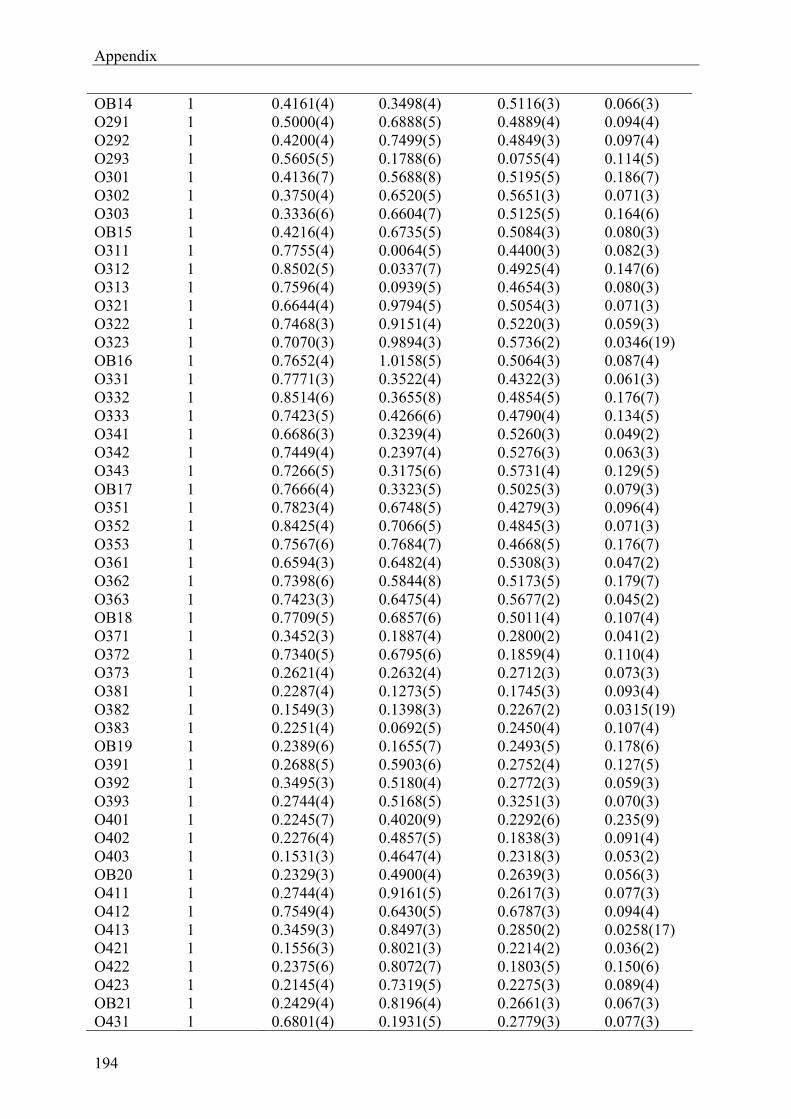
Appendix
194
OB14 1 0.4161(4) 0.3498(4) 0.5116(3) 0.066(3) O291 1 0.5000(4) 0.6888(5) 0.4889(4) 0.094(4) O292 1 0.4200(4) 0.7499(5) 0.4849(3) 0.097(4) O293 1 0.5605(5) 0.1788(6) 0.0755(4) 0.114(5) O301 1 0.4136(7) 0.5688(8) 0.5195(5) 0.186(7) O302 1 0.3750(4) 0.6520(5) 0.5651(3) 0.071(3) O303 1 0.3336(6) 0.6604(7) 0.5125(5) 0.164(6) OB15 1 0.4216(4) 0.6735(5) 0.5084(3) 0.080(3) O311 1 0.7755(4) 0.0064(5) 0.4400(3) 0.082(3) O312 1 0.8502(5) 0.0337(7) 0.4925(4) 0.147(6) O313 1 0.7596(4) 0.0939(5) 0.4654(3) 0.080(3) O321 1 0.6644(4) 0.9794(5) 0.5054(3) 0.071(3) O322 1 0.7468(3) 0.9151(4) 0.5220(3) 0.059(3) O323 1 0.7070(3) 0.9894(3) 0.5736(2) 0.0346(19) OB16 1 0.7652(4) 1.0158(5) 0.5064(3) 0.087(4) O331 1 0.7771(3) 0.3522(4) 0.4322(3) 0.061(3) O332 1 0.8514(6) 0.3655(8) 0.4854(5) 0.176(7) O333 1 0.7423(5) 0.4266(6) 0.4790(4) 0.134(5) O341 1 0.6686(3) 0.3239(4) 0.5260(3) 0.049(2) O342 1 0.7449(4) 0.2397(4) 0.5276(3) 0.063(3) O343 1 0.7266(5) 0.3175(6) 0.5731(4) 0.129(5) OB17 1 0.7666(4) 0.3323(5) 0.5025(3) 0.079(3) O351 1 0.7823(4) 0.6748(5) 0.4279(3) 0.096(4) O352 1 0.8425(4) 0.7066(5) 0.4845(3) 0.071(3) O353 1 0.7567(6) 0.7684(7) 0.4668(5) 0.176(7) O361 1 0.6594(3) 0.6482(4) 0.5308(3) 0.047(2) O362 1 0.7398(6) 0.5844(8) 0.5173(5) 0.179(7) O363 1 0.7423(3) 0.6475(4) 0.5677(2) 0.045(2) OB18 1 0.7709(5) 0.6857(6) 0.5011(4) 0.107(4) O371 1 0.3452(3) 0.1887(4) 0.2800(2) 0.041(2) O372 1 0.7340(5) 0.6795(6) 0.1859(4) 0.110(4) O373 1 0.2621(4) 0.2632(4) 0.2712(3) 0.073(3) O381 1 0.2287(4) 0.1273(5) 0.1745(3) 0.093(4) O382 1 0.1549(3) 0.1398(3) 0.2267(2) 0.0315(19) O383 1 0.2251(4) 0.0692(5) 0.2450(4) 0.107(4) OB19 1 0.2389(6) 0.1655(7) 0.2493(5) 0.178(6) O391 1 0.2688(5) 0.5903(6) 0.2752(4) 0.127(5) O392 1 0.3495(3) 0.5180(4) 0.2772(3) 0.059(3) O393 1 0.2744(4) 0.5168(5) 0.3251(3) 0.070(3) O401 1 0.2245(7) 0.4020(9) 0.2292(6) 0.235(9) O402 1 0.2276(4) 0.4857(5) 0.1838(3) 0.091(4) O403 1 0.1531(3) 0.4647(4) 0.2318(3) 0.053(2) OB20 1 0.2329(3) 0.4900(4) 0.2639(3) 0.056(3) O411 1 0.2744(4) 0.9161(5) 0.2617(3) 0.077(3) O412 1 0.7549(4) 0.6430(5) 0.6787(3) 0.094(4) O413 1 0.3459(3) 0.8497(3) 0.2850(2) 0.0258(17) O421 1 0.1556(3) 0.8021(3) 0.2214(2) 0.036(2) O422 1 0.2375(6) 0.8072(7) 0.1803(5) 0.150(6) O423 1 0.2145(4) 0.7319(5) 0.2275(3) 0.089(4) OB21 1 0.2429(4) 0.8196(4) 0.2661(3) 0.067(3) O431 1 0.6801(4) 0.1931(5) 0.2779(3) 0.077(3)
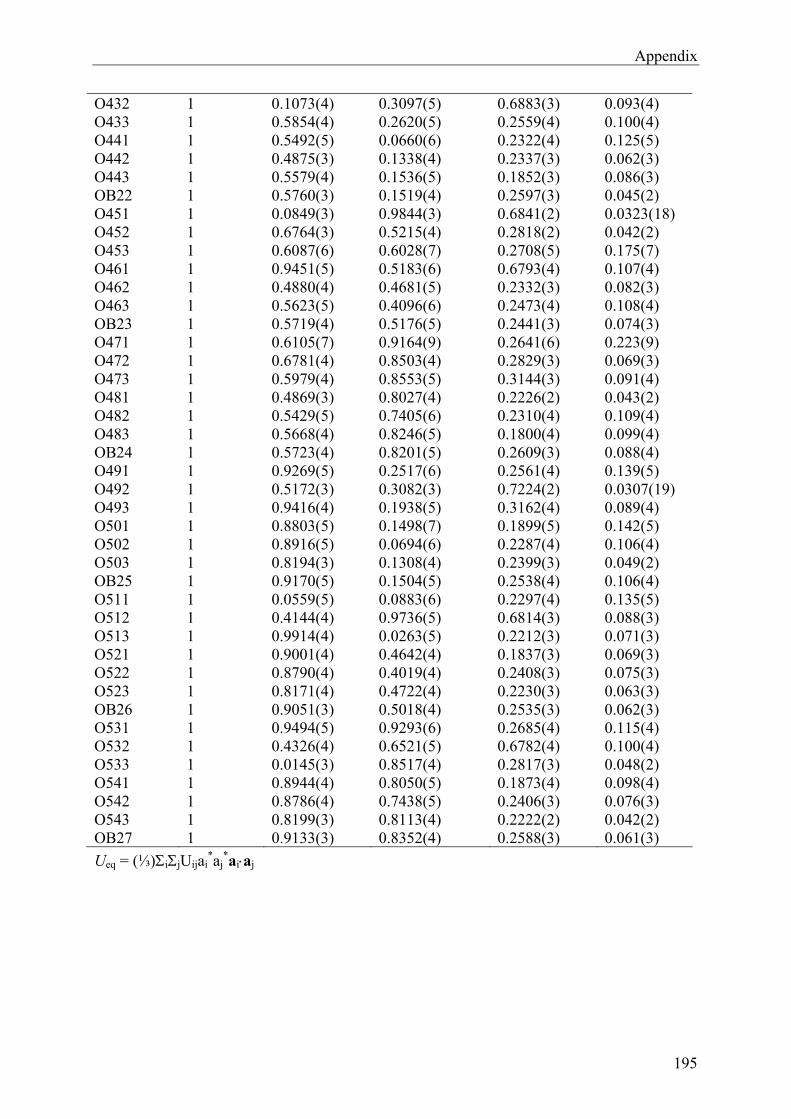
Appendix
195
O432 1 0.1073(4) 0.3097(5) 0.6883(3) 0.093(4) O433 1 0.5854(4) 0.2620(5) 0.2559(4) 0.100(4) O441 1 0.5492(5) 0.0660(6) 0.2322(4) 0.125(5) O442 1 0.4875(3) 0.1338(4) 0.2337(3) 0.062(3) O443 1 0.5579(4) 0.1536(5) 0.1852(3) 0.086(3) OB22 1 0.5760(3) 0.1519(4) 0.2597(3) 0.045(2) O451 1 0.0849(3) 0.9844(3) 0.6841(2) 0.0323(18) O452 1 0.6764(3) 0.5215(4) 0.2818(2) 0.042(2) O453 1 0.6087(6) 0.6028(7) 0.2708(5) 0.175(7) O461 1 0.9451(5) 0.5183(6) 0.6793(4) 0.107(4) O462 1 0.4880(4) 0.4681(5) 0.2332(3) 0.082(3) O463 1 0.5623(5) 0.4096(6) 0.2473(4) 0.108(4) OB23 1 0.5719(4) 0.5176(5) 0.2441(3) 0.074(3) O471 1 0.6105(7) 0.9164(9) 0.2641(6) 0.223(9) O472 1 0.6781(4) 0.8503(4) 0.2829(3) 0.069(3) O473 1 0.5979(4) 0.8553(5) 0.3144(3) 0.091(4) O481 1 0.4869(3) 0.8027(4) 0.2226(2) 0.043(2) O482 1 0.5429(5) 0.7405(6) 0.2310(4) 0.109(4) O483 1 0.5668(4) 0.8246(5) 0.1800(4) 0.099(4) OB24 1 0.5723(4) 0.8201(5) 0.2609(3) 0.088(4) O491 1 0.9269(5) 0.2517(6) 0.2561(4) 0.139(5) O492 1 0.5172(3) 0.3082(3) 0.7224(2) 0.0307(19) O493 1 0.9416(4) 0.1938(5) 0.3162(4) 0.089(4) O501 1 0.8803(5) 0.1498(7) 0.1899(5) 0.142(5) O502 1 0.8916(5) 0.0694(6) 0.2287(4) 0.106(4) O503 1 0.8194(3) 0.1308(4) 0.2399(3) 0.049(2) OB25 1 0.9170(5) 0.1504(5) 0.2538(4) 0.106(4) O511 1 0.0559(5) 0.0883(6) 0.2297(4) 0.135(5) O512 1 0.4144(4) 0.9736(5) 0.6814(3) 0.088(3) O513 1 0.9914(4) 0.0263(5) 0.2212(3) 0.071(3) O521 1 0.9001(4) 0.4642(4) 0.1837(3) 0.069(3) O522 1 0.8790(4) 0.4019(4) 0.2408(3) 0.075(3) O523 1 0.8171(4) 0.4722(4) 0.2230(3) 0.063(3) OB26 1 0.9051(3) 0.5018(4) 0.2535(3) 0.062(3) O531 1 0.9494(5) 0.9293(6) 0.2685(4) 0.115(4) O532 1 0.4326(4) 0.6521(5) 0.6782(4) 0.100(4) O533 1 0.0145(3) 0.8517(4) 0.2817(3) 0.048(2) O541 1 0.8944(4) 0.8050(5) 0.1873(4) 0.098(4) O542 1 0.8786(4) 0.7438(5) 0.2406(3) 0.076(3) O543 1 0.8199(3) 0.8113(4) 0.2222(2) 0.042(2) OB27 1 0.9133(3) 0.8352(4) 0.2588(3) 0.061(3)
Ueq = (⅓)ijUijai*aj
*aiaj
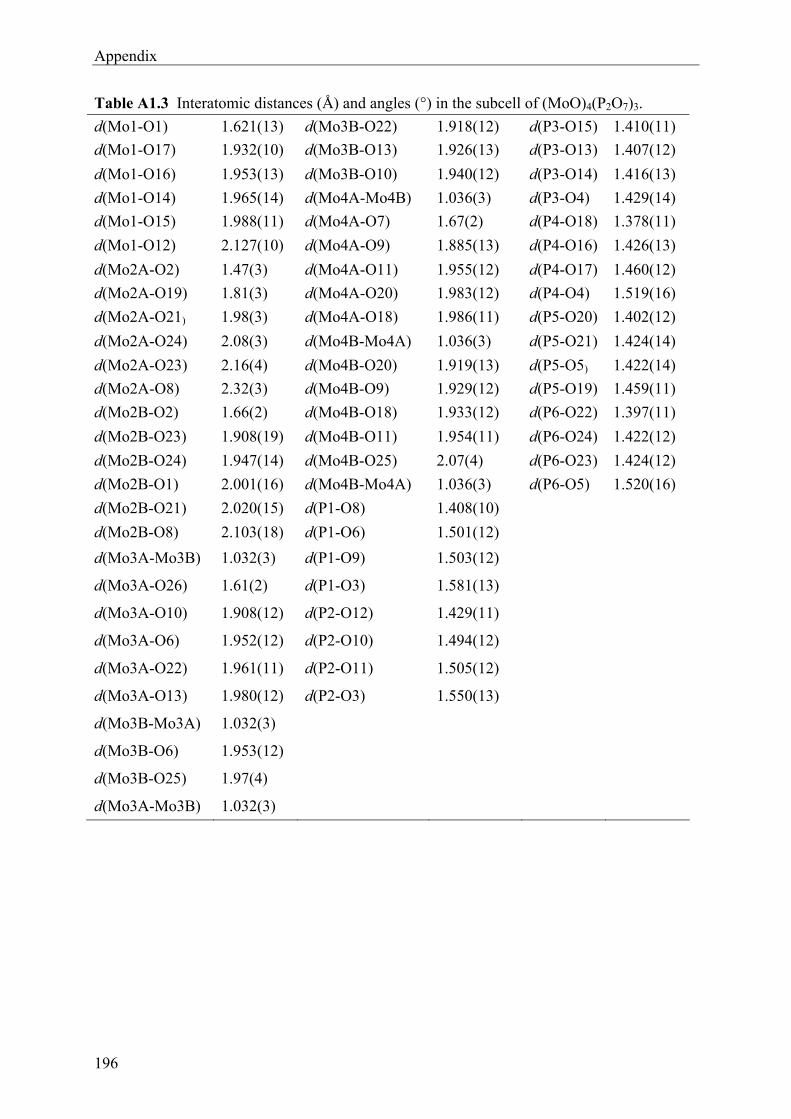
Appendix
196
Table A1.3 Interatomic distances (Å) and angles (°) in the subcell of (MoO)4(P2O7)3.
d(Mo1-O1) 1.621(13) d(Mo3B-O22) 1.918(12) d(P3-O15) 1.410(11)
d(Mo1-O17) 1.932(10) d(Mo3B-O13) 1.926(13) d(P3-O13) 1.407(12)
d(Mo1-O16) 1.953(13) d(Mo3B-O10) 1.940(12) d(P3-O14) 1.416(13)
d(Mo1-O14) 1.965(14) d(Mo4A-Mo4B) 1.036(3) d(P3-O4) 1.429(14)
d(Mo1-O15) 1.988(11) d(Mo4A-O7) 1.67(2) d(P4-O18) 1.378(11)
d(Mo1-O12) 2.127(10) d(Mo4A-O9) 1.885(13) d(P4-O16) 1.426(13)
d(Mo2A-O2) 1.47(3) d(Mo4A-O11) 1.955(12) d(P4-O17) 1.460(12)
d(Mo2A-O19) 1.81(3) d(Mo4A-O20) 1.983(12) d(P4-O4) 1.519(16)
d(Mo2A-O21) 1.98(3) d(Mo4A-O18) 1.986(11) d(P5-O20) 1.402(12)
d(Mo2A-O24) 2.08(3) d(Mo4B-Mo4A) 1.036(3) d(P5-O21) 1.424(14)
d(Mo2A-O23) 2.16(4) d(Mo4B-O20) 1.919(13) d(P5-O5) 1.422(14)
d(Mo2A-O8) 2.32(3) d(Mo4B-O9) 1.929(12) d(P5-O19) 1.459(11)
d(Mo2B-O2) 1.66(2) d(Mo4B-O18) 1.933(12) d(P6-O22) 1.397(11)
d(Mo2B-O23) 1.908(19) d(Mo4B-O11) 1.954(11) d(P6-O24) 1.422(12)
d(Mo2B-O24) 1.947(14) d(Mo4B-O25) 2.07(4) d(P6-O23) 1.424(12)
d(Mo2B-O1) 2.001(16) d(Mo4B-Mo4A) 1.036(3) d(P6-O5) 1.520(16)
d(Mo2B-O21) 2.020(15) d(P1-O8) 1.408(10)
d(Mo2B-O8) 2.103(18) d(P1-O6) 1.501(12)
d(Mo3A-Mo3B) 1.032(3) d(P1-O9) 1.503(12)
d(Mo3A-O26) 1.61(2) d(P1-O3) 1.581(13)
d(Mo3A-O10) 1.908(12) d(P2-O12) 1.429(11)
d(Mo3A-O6) 1.952(12) d(P2-O10) 1.494(12)
d(Mo3A-O22) 1.961(11) d(P2-O11) 1.505(12)
d(Mo3A-O13) 1.980(12) d(P2-O3) 1.550(13)
d(Mo3B-Mo3A) 1.032(3)
d(Mo3B-O6) 1.953(12)
d(Mo3B-O25) 1.97(4)
d(Mo3A-Mo3B) 1.032(3)
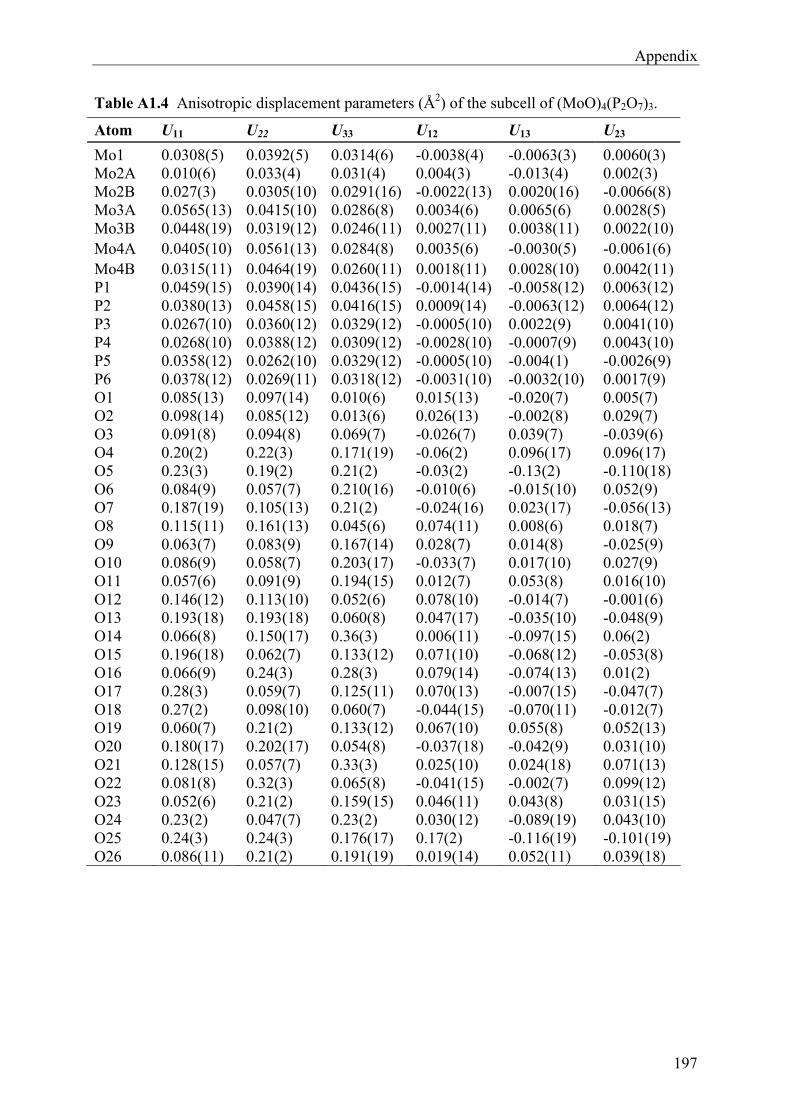
Appendix
197
Table A1.4 Anisotropic displacement parameters (Å2) of the subcell of (MoO)4(P2O7)3.
Atom U11 U22 U33 U12 U13 U23
Mo1 0.0308(5) 0.0392(5) 0.0314(6) -0.0038(4) -0.0063(3) 0.0060(3) Mo2A 0.010(6) 0.033(4) 0.031(4) 0.004(3) -0.013(4) 0.002(3) Mo2B 0.027(3) 0.0305(10) 0.0291(16) -0.0022(13) 0.0020(16) -0.0066(8) Mo3A 0.0565(13) 0.0415(10) 0.0286(8) 0.0034(6) 0.0065(6) 0.0028(5) Mo3B 0.0448(19) 0.0319(12) 0.0246(11) 0.0027(11) 0.0038(11) 0.0022(10)Mo4A 0.0405(10) 0.0561(13) 0.0284(8) 0.0035(6) -0.0030(5) -0.0061(6) Mo4B 0.0315(11) 0.0464(19) 0.0260(11) 0.0018(11) 0.0028(10) 0.0042(11)P1 0.0459(15) 0.0390(14) 0.0436(15) -0.0014(14) -0.0058(12) 0.0063(12)P2 0.0380(13) 0.0458(15) 0.0416(15) 0.0009(14) -0.0063(12) 0.0064(12)P3 0.0267(10) 0.0360(12) 0.0329(12) -0.0005(10) 0.0022(9) 0.0041(10)P4 0.0268(10) 0.0388(12) 0.0309(12) -0.0028(10) -0.0007(9) 0.0043(10)P5 0.0358(12) 0.0262(10) 0.0329(12) -0.0005(10) -0.004(1) -0.0026(9) P6 0.0378(12) 0.0269(11) 0.0318(12) -0.0031(10) -0.0032(10) 0.0017(9) O1 0.085(13) 0.097(14) 0.010(6) 0.015(13) -0.020(7) 0.005(7) O2 0.098(14) 0.085(12) 0.013(6) 0.026(13) -0.002(8) 0.029(7) O3 0.091(8) 0.094(8) 0.069(7) -0.026(7) 0.039(7) -0.039(6) O4 0.20(2) 0.22(3) 0.171(19) -0.06(2) 0.096(17) 0.096(17) O5 0.23(3) 0.19(2) 0.21(2) -0.03(2) -0.13(2) -0.110(18) O6 0.084(9) 0.057(7) 0.210(16) -0.010(6) -0.015(10) 0.052(9) O7 0.187(19) 0.105(13) 0.21(2) -0.024(16) 0.023(17) -0.056(13) O8 0.115(11) 0.161(13) 0.045(6) 0.074(11) 0.008(6) 0.018(7) O9 0.063(7) 0.083(9) 0.167(14) 0.028(7) 0.014(8) -0.025(9) O10 0.086(9) 0.058(7) 0.203(17) -0.033(7) 0.017(10) 0.027(9) O11 0.057(6) 0.091(9) 0.194(15) 0.012(7) 0.053(8) 0.016(10) O12 0.146(12) 0.113(10) 0.052(6) 0.078(10) -0.014(7) -0.001(6) O13 0.193(18) 0.193(18) 0.060(8) 0.047(17) -0.035(10) -0.048(9) O14 0.066(8) 0.150(17) 0.36(3) 0.006(11) -0.097(15) 0.06(2) O15 0.196(18) 0.062(7) 0.133(12) 0.071(10) -0.068(12) -0.053(8) O16 0.066(9) 0.24(3) 0.28(3) 0.079(14) -0.074(13) 0.01(2) O17 0.28(3) 0.059(7) 0.125(11) 0.070(13) -0.007(15) -0.047(7) O18 0.27(2) 0.098(10) 0.060(7) -0.044(15) -0.070(11) -0.012(7) O19 0.060(7) 0.21(2) 0.133(12) 0.067(10) 0.055(8) 0.052(13) O20 0.180(17) 0.202(17) 0.054(8) -0.037(18) -0.042(9) 0.031(10) O21 0.128(15) 0.057(7) 0.33(3) 0.025(10) 0.024(18) 0.071(13) O22 0.081(8) 0.32(3) 0.065(8) -0.041(15) -0.002(7) 0.099(12) O23 0.052(6) 0.21(2) 0.159(15) 0.046(11) 0.043(8) 0.031(15) O24 0.23(2) 0.047(7) 0.23(2) 0.030(12) -0.089(19) 0.043(10) O25 0.24(3) 0.24(3) 0.176(17) 0.17(2) -0.116(19) -0.101(19) O26 0.086(11) 0.21(2) 0.191(19) 0.019(14) 0.052(11) 0.039(18)
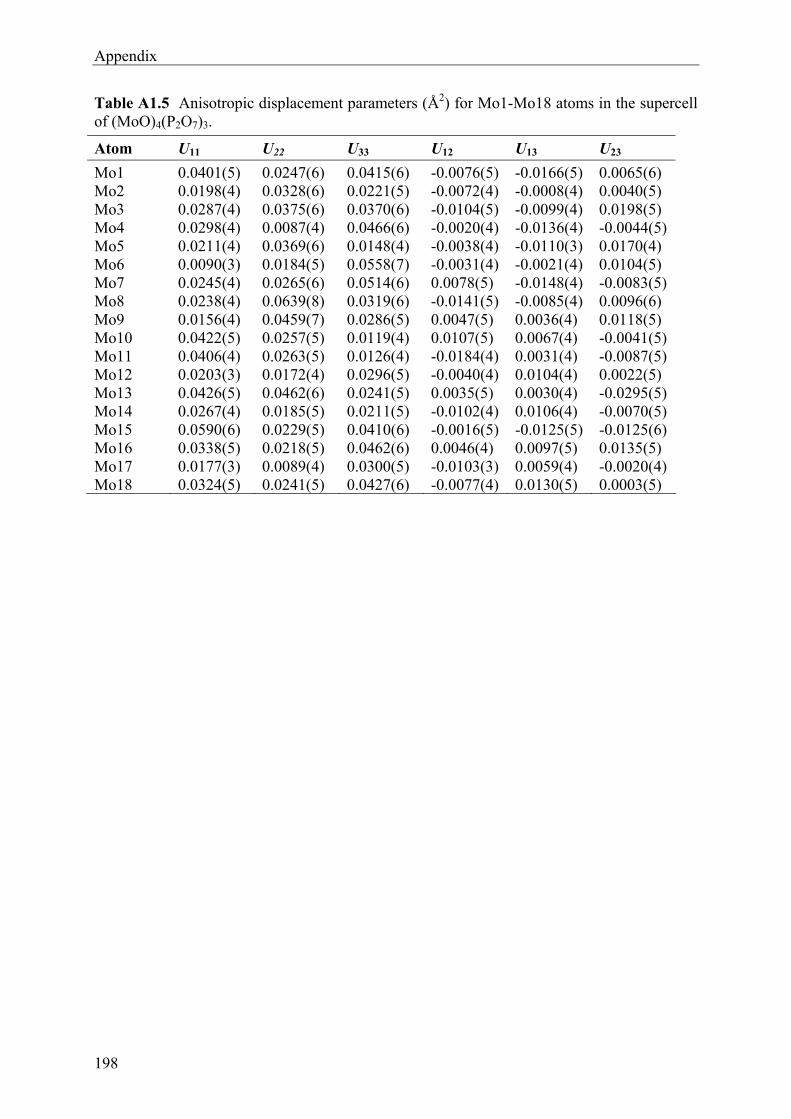
Appendix
198
Table A1.5 Anisotropic displacement parameters (Å2) for Mo1-Mo18 atoms in the supercell of (MoO)4(P2O7)3.
Atom U11 U22 U33 U12 U13 U23
Mo1 0.0401(5) 0.0247(6) 0.0415(6) -0.0076(5) -0.0166(5) 0.0065(6) Mo2 0.0198(4) 0.0328(6) 0.0221(5) -0.0072(4) -0.0008(4) 0.0040(5) Mo3 0.0287(4) 0.0375(6) 0.0370(6) -0.0104(5) -0.0099(4) 0.0198(5) Mo4 0.0298(4) 0.0087(4) 0.0466(6) -0.0020(4) -0.0136(4) -0.0044(5) Mo5 0.0211(4) 0.0369(6) 0.0148(4) -0.0038(4) -0.0110(3) 0.0170(4) Mo6 0.0090(3) 0.0184(5) 0.0558(7) -0.0031(4) -0.0021(4) 0.0104(5) Mo7 0.0245(4) 0.0265(6) 0.0514(6) 0.0078(5) -0.0148(4) -0.0083(5) Mo8 0.0238(4) 0.0639(8) 0.0319(6) -0.0141(5) -0.0085(4) 0.0096(6) Mo9 0.0156(4) 0.0459(7) 0.0286(5) 0.0047(5) 0.0036(4) 0.0118(5) Mo10 0.0422(5) 0.0257(5) 0.0119(4) 0.0107(5) 0.0067(4) -0.0041(5) Mo11 0.0406(4) 0.0263(5) 0.0126(4) -0.0184(4) 0.0031(4) -0.0087(5) Mo12 0.0203(3) 0.0172(4) 0.0296(5) -0.0040(4) 0.0104(4) 0.0022(5) Mo13 0.0426(5) 0.0462(6) 0.0241(5) 0.0035(5) 0.0030(4) -0.0295(5) Mo14 0.0267(4) 0.0185(5) 0.0211(5) -0.0102(4) 0.0106(4) -0.0070(5) Mo15 0.0590(6) 0.0229(5) 0.0410(6) -0.0016(5) -0.0125(5) -0.0125(6) Mo16 0.0338(5) 0.0218(5) 0.0462(6) 0.0046(4) 0.0097(5) 0.0135(5) Mo17 0.0177(3) 0.0089(4) 0.0300(5) -0.0103(3) 0.0059(4) -0.0020(4) Mo18 0.0324(5) 0.0241(5) 0.0427(6) -0.0077(4) 0.0130(5) 0.0003(5)
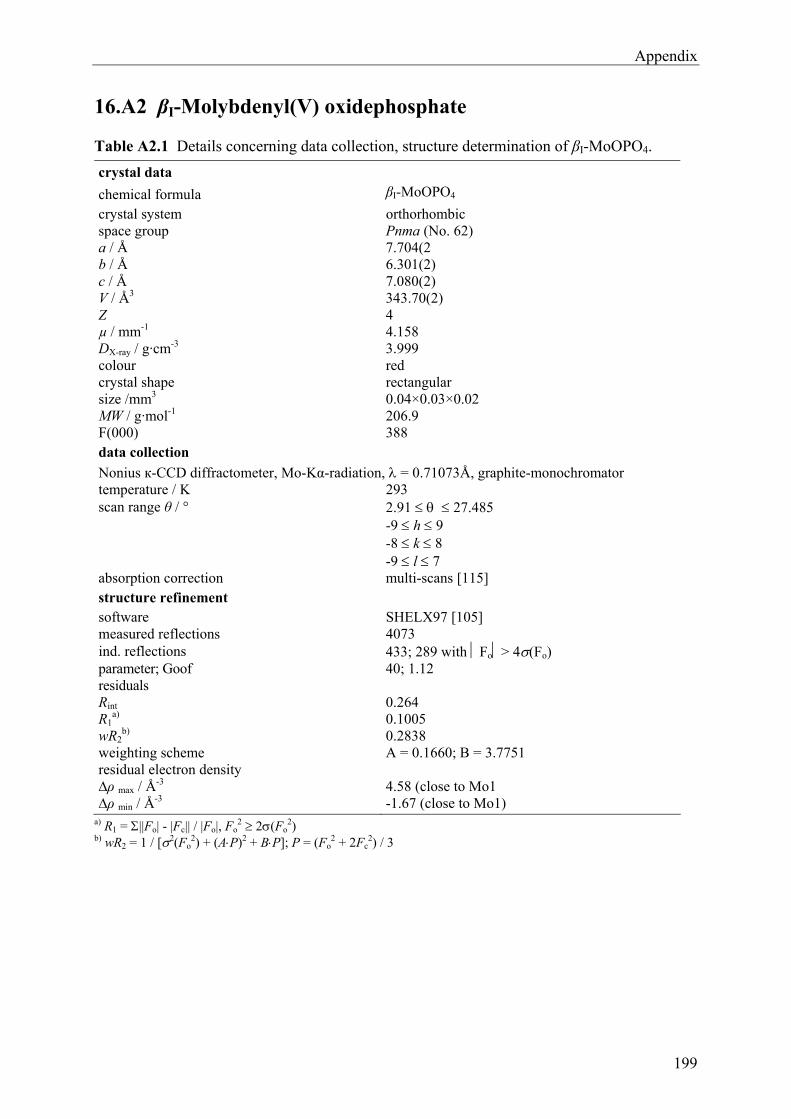
Appendix
199
16.A2 βI-Molybdenyl(V) oxidephosphate
Table A2.1 Details concerning data collection, structure determination of βI-MoOPO4.
crystal data
chemical formula βI-MoOPO4
crystal system orthorhombic space group Pnma (No. 62) a / Å b / Å c / Å
7.704(2 6.301(2) 7.080(2)
V / Å3 343.70(2) Z 4 µ / mm-1 4.158 DX-ray / g·cm-3 3.999 colour red crystal shape size /mm3
rectangular 0.04×0.03×0.02
MW / g·mol-1 206.9 F(000) 388 data collection
Nonius к-CCD diffractometer, Mo-Kα-radiation, = 0.71073Å, graphite-monochromator temperature / K 293 scan range θ / ° 2.91 27.485
-9 h 9 -8 k 8 -9 l 7
absorption correction multi-scans [115] structure refinement software SHELX97 [105] measured reflections 4073 ind. reflections 433; 289 with Fo> 4(Fo) parameter; Goof 40; 1.12 residuals Rint R1
a) wR2
b)
0.264 0.1005 0.2838
weighting scheme A = 0.1660; B = 3.7751 residual electron density ∆ρ max / Å
-3 ∆ρ min / Å
-3
4.58 (close to Mo1 -1.67 (close to Mo1)
a) R1 = ||Fo| - |Fc|| / |Fo|, Fo2 2(Fo
2) b) wR2 = 1 / [2(Fo
2) + (AP)2 + BP]; P = (Fo2 + 2Fc
2) / 3
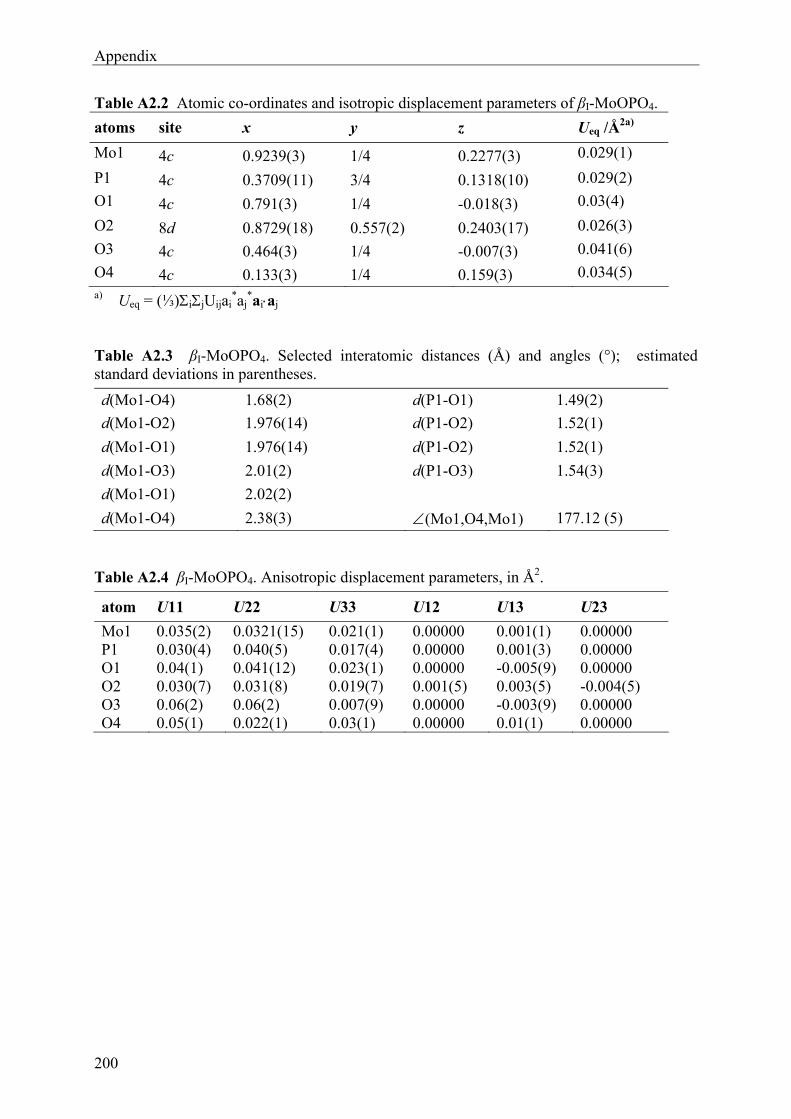
Appendix
200
Table A2.2 Atomic co-ordinates and isotropic displacement parameters of βI-MoOPO4.
atoms site x y z Ueq /Å2a)
Mo1 4c 0.9239(3) 1/4 0.2277(3) 0.029(1)
P1 4c 0.3709(11) 3/4 0.1318(10) 0.029(2)
O1 4c 0.791(3) 1/4 -0.018(3) 0.03(4)
O2 8d 0.8729(18) 0.557(2) 0.2403(17) 0.026(3)
O3 4c 0.464(3) 1/4 -0.007(3) 0.041(6)
O4 4c 0.133(3) 1/4 0.159(3) 0.034(5) a) Ueq = (⅓)ijUijai
*aj*aiaj
Table A2.3 βI-MoOPO4. Selected interatomic distances (Å) and angles (°); estimated standard deviations in parentheses.
d(Mo1-O4) 1.68(2) d(P1-O1) 1.49(2)
d(Mo1-O2) 1.976(14) d(P1-O2) 1.52(1)
d(Mo1-O1) 1.976(14) d(P1-O2) 1.52(1)
d(Mo1-O3) 2.01(2) d(P1-O3) 1.54(3)
d(Mo1-O1) 2.02(2)
d(Mo1-O4) 2.38(3) (Mo1,O4,Mo1) 177.12 (5)
Table A2.4 βI-MoOPO4. Anisotropic displacement parameters, in Å2.
atom U11 U22 U33 U12 U13 U23
Mo1 0.035(2) 0.0321(15) 0.021(1) 0.00000 0.001(1) 0.00000 P1 0.030(4) 0.040(5) 0.017(4) 0.00000 0.001(3) 0.00000 O1 0.04(1) 0.041(12) 0.023(1) 0.00000 -0.005(9) 0.00000 O2 0.030(7) 0.031(8) 0.019(7) 0.001(5) 0.003(5) -0.004(5) O3 0.06(2) 0.06(2) 0.007(9) 0.00000 -0.003(9) 0.00000 O4 0.05(1) 0.022(1) 0.03(1) 0.00000 0.01(1) 0.00000
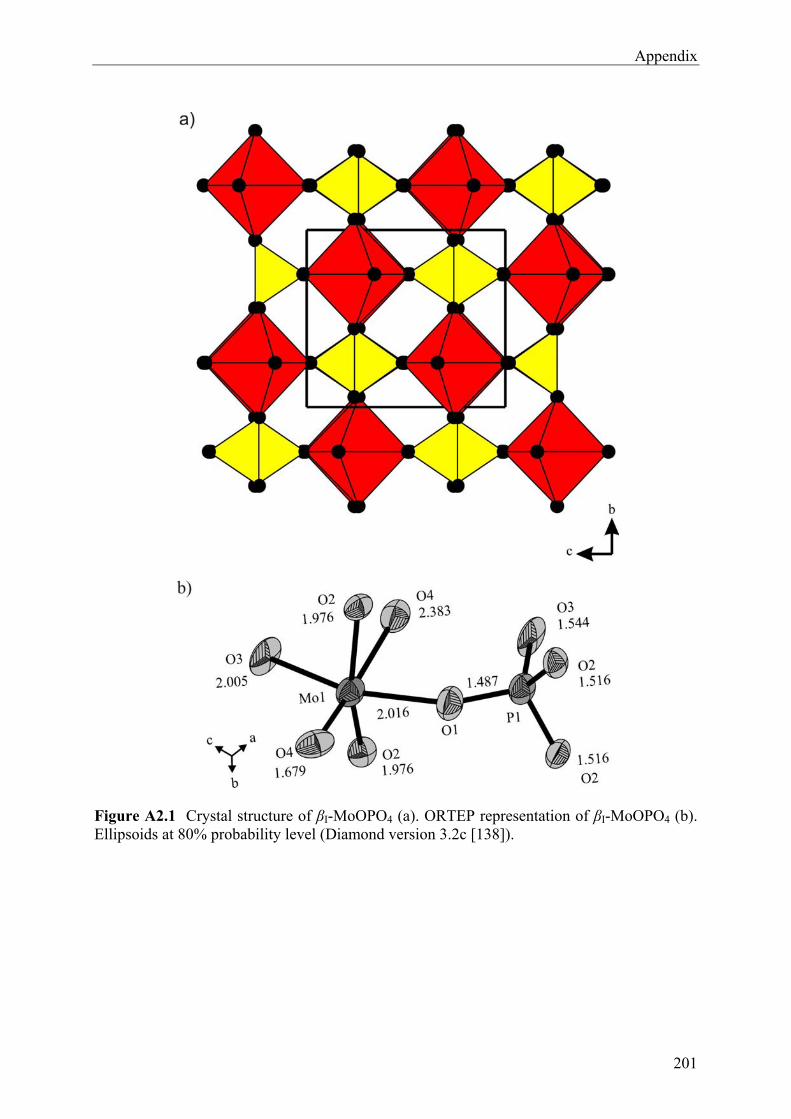
Appendix
201
Figure A2.1 Crystal structure of βI-MoOPO4 (a). ORTEP representation of βI-MoOPO4 (b). Ellipsoids at 80% probability level (Diamond version 3.2c [138]).
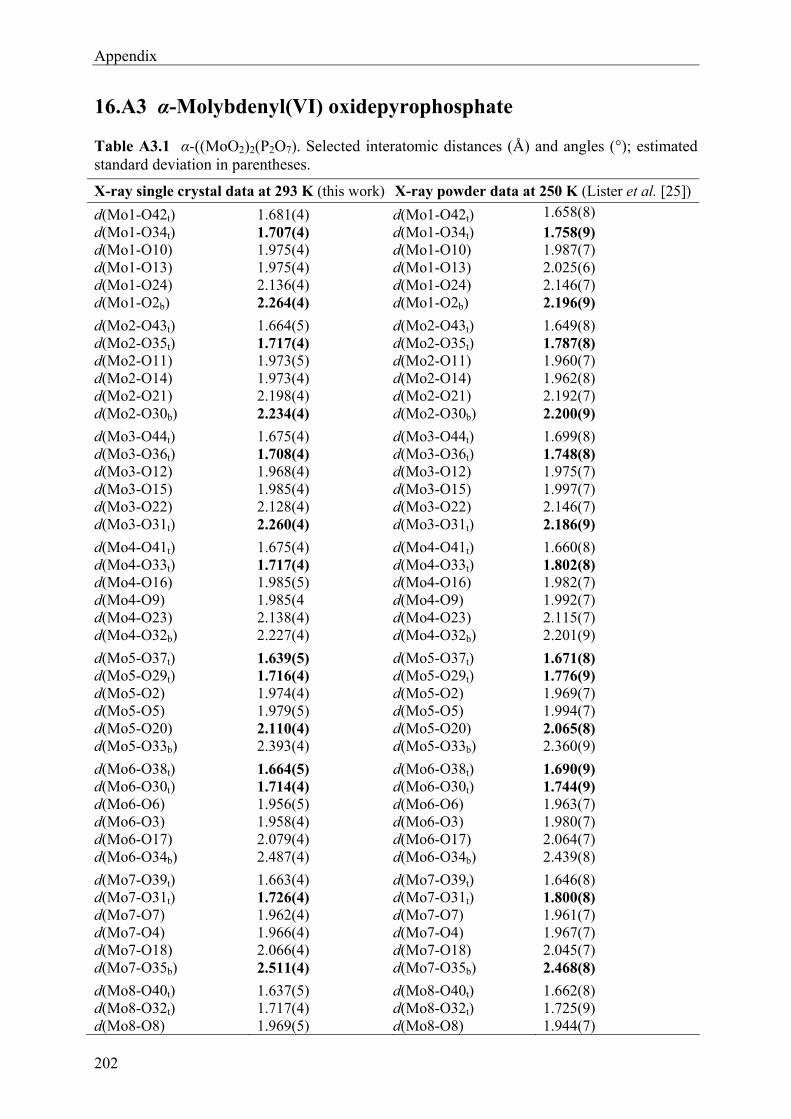
Appendix
202
16.A3 α-Molybdenyl(VI) oxidepyrophosphate
Table A3.1 α-((MoO2)2(P2O7). Selected interatomic distances (Å) and angles (°); estimated standard deviation in parentheses.
X-ray single crystal data at 293 K (this work) X-ray powder data at 250 K (Lister et al. [25])
d(Mo1-O42t) 1.681(4) d(Mo1-O42t) 1.658(8) d(Mo1-O34t) 1.707(4) d(Mo1-O34t) 1.758(9) d(Mo1-O10) 1.975(4) d(Mo1-O10) 1.987(7) d(Mo1-O13) 1.975(4) d(Mo1-O13) 2.025(6) d(Mo1-O24) 2.136(4) d(Mo1-O24) 2.146(7) d(Mo1-O2b) 2.264(4) d(Mo1-O2b) 2.196(9)
d(Mo2-O43t) 1.664(5) d(Mo2-O43t) 1.649(8) d(Mo2-O35t) 1.717(4) d(Mo2-O35t) 1.787(8) d(Mo2-O11) 1.973(5) d(Mo2-O11) 1.960(7) d(Mo2-O14) 1.973(4) d(Mo2-O14) 1.962(8) d(Mo2-O21) 2.198(4) d(Mo2-O21) 2.192(7) d(Mo2-O30b) 2.234(4) d(Mo2-O30b) 2.200(9)
d(Mo3-O44t) 1.675(4) d(Mo3-O44t) 1.699(8) d(Mo3-O36t) 1.708(4) d(Mo3-O36t) 1.748(8) d(Mo3-O12) 1.968(4) d(Mo3-O12) 1.975(7) d(Mo3-O15) 1.985(4) d(Mo3-O15) 1.997(7) d(Mo3-O22) 2.128(4) d(Mo3-O22) 2.146(7) d(Mo3-O31t) 2.260(4) d(Mo3-O31t) 2.186(9)
d(Mo4-O41t) 1.675(4) d(Mo4-O41t) 1.660(8) d(Mo4-O33t) 1.717(4) d(Mo4-O33t) 1.802(8) d(Mo4-O16) 1.985(5) d(Mo4-O16) 1.982(7) d(Mo4-O9) 1.985(4 d(Mo4-O9) 1.992(7) d(Mo4-O23) 2.138(4) d(Mo4-O23) 2.115(7) d(Mo4-O32b) 2.227(4) d(Mo4-O32b) 2.201(9)
d(Mo5-O37t) 1.639(5) d(Mo5-O37t) 1.671(8) d(Mo5-O29t) 1.716(4) d(Mo5-O29t) 1.776(9) d(Mo5-O2) 1.974(4) d(Mo5-O2) 1.969(7) d(Mo5-O5) 1.979(5) d(Mo5-O5) 1.994(7) d(Mo5-O20) 2.110(4) d(Mo5-O20) 2.065(8) d(Mo5-O33b) 2.393(4) d(Mo5-O33b) 2.360(9)
d(Mo6-O38t) 1.664(5) d(Mo6-O38t) 1.690(9) d(Mo6-O30t) 1.714(4) d(Mo6-O30t) 1.744(9) d(Mo6-O6) 1.956(5) d(Mo6-O6) 1.963(7) d(Mo6-O3) 1.958(4) d(Mo6-O3) 1.980(7) d(Mo6-O17) 2.079(4) d(Mo6-O17) 2.064(7) d(Mo6-O34b) 2.487(4) d(Mo6-O34b) 2.439(8)
d(Mo7-O39t) 1.663(4) d(Mo7-O39t) 1.646(8) d(Mo7-O31t) 1.726(4) d(Mo7-O31t) 1.800(8) d(Mo7-O7) 1.962(4) d(Mo7-O7) 1.961(7) d(Mo7-O4) 1.966(4) d(Mo7-O4) 1.967(7) d(Mo7-O18) 2.066(4) d(Mo7-O18) 2.045(7) d(Mo7-O35b) 2.511(4) d(Mo7-O35b) 2.468(8)
d(Mo8-O40t) 1.637(5) d(Mo8-O40t) 1.662(8) d(Mo8-O32t) 1.717(4) d(Mo8-O32t) 1.725(9) d(Mo8-O8) 1.969(5) d(Mo8-O8) 1.944(7)
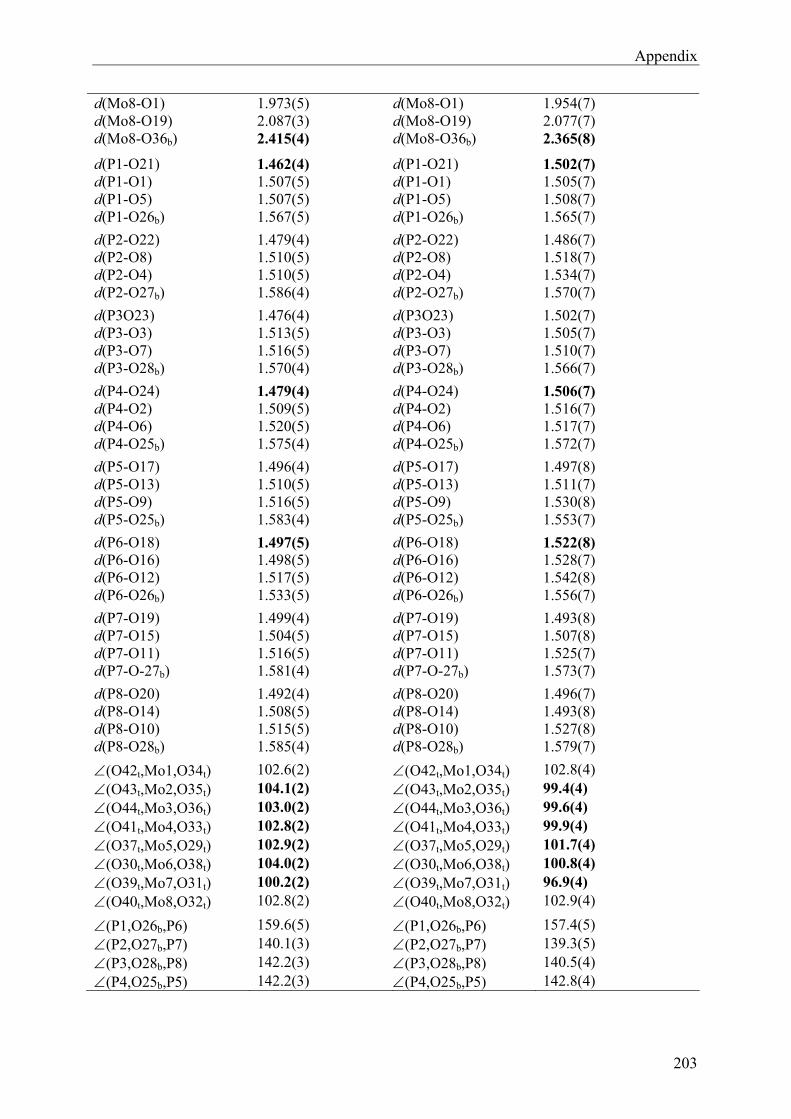
Appendix
203
d(Mo8-O1) 1.973(5) d(Mo8-O1) 1.954(7) d(Mo8-O19) 2.087(3) d(Mo8-O19) 2.077(7) d(Mo8-O36b) 2.415(4) d(Mo8-O36b) 2.365(8)
d(P1-O21) 1.462(4) d(P1-O21) 1.502(7) d(P1-O1) 1.507(5) d(P1-O1) 1.505(7) d(P1-O5) 1.507(5) d(P1-O5) 1.508(7) d(P1-O26b) 1.567(5) d(P1-O26b) 1.565(7)
d(P2-O22) 1.479(4) d(P2-O22) 1.486(7) d(P2-O8) 1.510(5) d(P2-O8) 1.518(7) d(P2-O4) 1.510(5) d(P2-O4) 1.534(7) d(P2-O27b) 1.586(4) d(P2-O27b) 1.570(7)
d(P3O23) 1.476(4) d(P3O23) 1.502(7) d(P3-O3) 1.513(5) d(P3-O3) 1.505(7) d(P3-O7) 1.516(5) d(P3-O7) 1.510(7) d(P3-O28b) 1.570(4) d(P3-O28b) 1.566(7)
d(P4-O24) 1.479(4) d(P4-O24) 1.506(7) d(P4-O2) 1.509(5) d(P4-O2) 1.516(7) d(P4-O6) 1.520(5) d(P4-O6) 1.517(7) d(P4-O25b) 1.575(4) d(P4-O25b) 1.572(7)
d(P5-O17) 1.496(4) d(P5-O17) 1.497(8) d(P5-O13) 1.510(5) d(P5-O13) 1.511(7) d(P5-O9) 1.516(5) d(P5-O9) 1.530(8) d(P5-O25b) 1.583(4) d(P5-O25b) 1.553(7)
d(P6-O18) 1.497(5) d(P6-O18) 1.522(8) d(P6-O16) 1.498(5) d(P6-O16) 1.528(7) d(P6-O12) 1.517(5) d(P6-O12) 1.542(8) d(P6-O26b) 1.533(5) d(P6-O26b) 1.556(7)
d(P7-O19) 1.499(4) d(P7-O19) 1.493(8) d(P7-O15) 1.504(5) d(P7-O15) 1.507(8) d(P7-O11) 1.516(5) d(P7-O11) 1.525(7) d(P7-O-27b) 1.581(4) d(P7-O-27b) 1.573(7)
d(P8-O20) 1.492(4) d(P8-O20) 1.496(7) d(P8-O14) 1.508(5) d(P8-O14) 1.493(8) d(P8-O10) 1.515(5) d(P8-O10) 1.527(8) d(P8-O28b) 1.585(4) d(P8-O28b) 1.579(7)
(O42t,Mo1,O34t) 102.6(2) (O42t,Mo1,O34t) 102.8(4) (O43t,Mo2,O35t) 104.1(2) (O43t,Mo2,O35t) 99.4(4) (O44t,Mo3,O36t) 103.0(2) (O44t,Mo3,O36t) 99.6(4) (O41t,Mo4,O33t) 102.8(2) (O41t,Mo4,O33t) 99.9(4) (O37t,Mo5,O29t) 102.9(2) (O37t,Mo5,O29t) 101.7(4) (O30t,Mo6,O38t) 104.0(2) (O30t,Mo6,O38t) 100.8(4) (O39t,Mo7,O31t) 100.2(2) (O39t,Mo7,O31t) 96.9(4) (O40t,Mo8,O32t) 102.8(2) (O40t,Mo8,O32t) 102.9(4)
(P1,O26b,P6) 159.6(5) (P1,O26b,P6) 157.4(5) (P2,O27b,P7) 140.1(3) (P2,O27b,P7) 139.3(5) (P3,O28b,P8) 142.2(3) (P3,O28b,P8) 140.5(4) (P4,O25b,P5) 142.2(3) (P4,O25b,P5) 142.8(4)
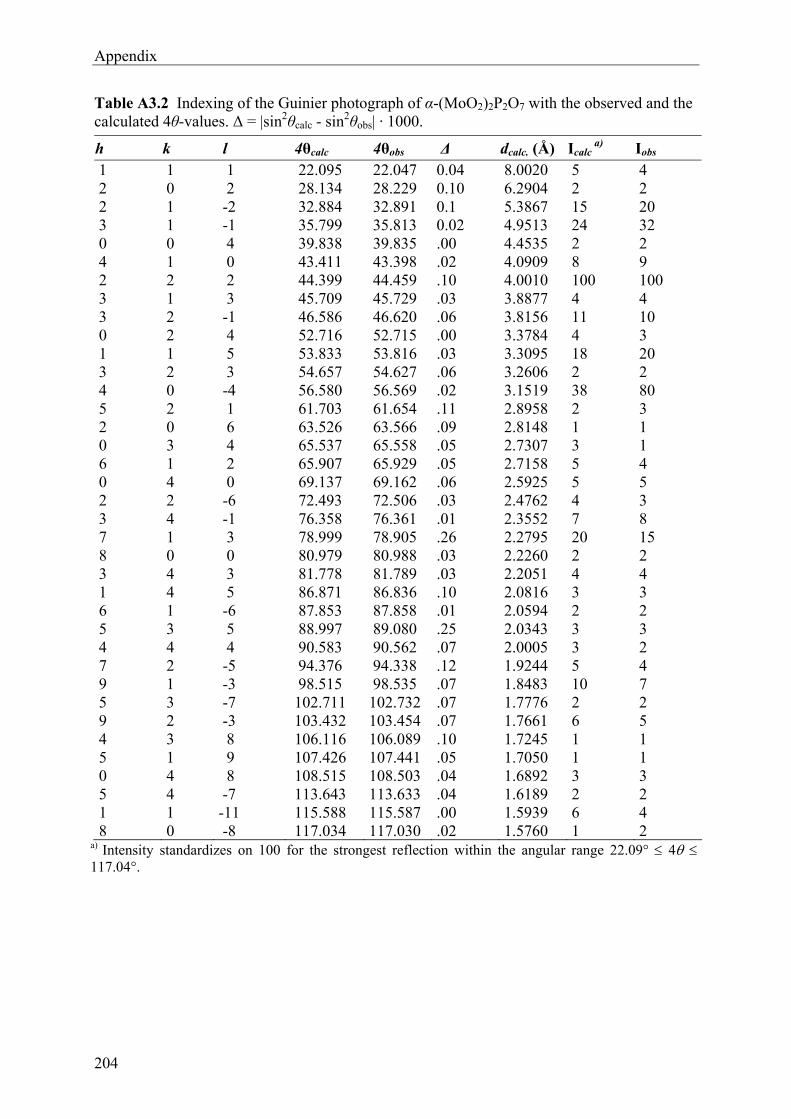
Appendix
204
Table A3.2 Indexing of the Guinier photograph of α-(MoO2)2P2O7 with the observed and the calculated 4θ-values. Δ = |sin2θcalc - sin2θobs| · 1000.
h k l 4θcalc 4θobs Δ dcalc. (Å) Icalc a) Iobs
1 1 1 22.095 22.047 0.04 8.0020 5 4 2 0 2 28.134 28.229 0.10 6.2904 2 2 2 1 -2 32.884 32.891 0.1 5.3867 15 20 3 1 -1 35.799 35.813 0.02 4.9513 24 32 0 0 4 39.838 39.835 .00 4.4535 2 2 4 1 0 43.411 43.398 .02 4.0909 8 9 2 2 2 44.399 44.459 .10 4.0010 100 100 3 1 3 45.709 45.729 .03 3.8877 4 4 3 2 -1 46.586 46.620 .06 3.8156 11 10 0 2 4 52.716 52.715 .00 3.3784 4 3 1 1 5 53.833 53.816 .03 3.3095 18 20 3 2 3 54.657 54.627 .06 3.2606 2 2 4 0 -4 56.580 56.569 .02 3.1519 38 80 5 2 1 61.703 61.654 .11 2.8958 2 3 2 0 6 63.526 63.566 .09 2.8148 1 1 0 3 4 65.537 65.558 .05 2.7307 3 1 6 1 2 65.907 65.929 .05 2.7158 5 4 0 4 0 69.137 69.162 .06 2.5925 5 5 2 2 -6 72.493 72.506 .03 2.4762 4 3 3 4 -1 76.358 76.361 .01 2.3552 7 8 7 1 3 78.999 78.905 .26 2.2795 20 15 8 0 0 80.979 80.988 .03 2.2260 2 2 3 4 3 81.778 81.789 .03 2.2051 4 4 1 4 5 86.871 86.836 .10 2.0816 3 3 6 1 -6 87.853 87.858 .01 2.0594 2 2 5 3 5 88.997 89.080 .25 2.0343 3 3 4 4 4 90.583 90.562 .07 2.0005 3 2 7 2 -5 94.376 94.338 .12 1.9244 5 4 9 1 -3 98.515 98.535 .07 1.8483 10 7 5 3 -7 102.711 102.732 .07 1.7776 2 2 9 2 -3 103.432 103.454 .07 1.7661 6 5 4 3 8 106.116 106.089 .10 1.7245 1 1 5 1 9 107.426 107.441 .05 1.7050 1 1 0 4 8 108.515 108.503 .04 1.6892 3 3 5 4 -7 113.643 113.633 .04 1.6189 2 2 1 1 -11 115.588 115.587 .00 1.5939 6 4 8 0 -8 117.034 117.030 .02 1.5760 1 2
a) Intensity standardizes on 100 for the strongest reflection within the angular range 22.09° 4 117.04°.
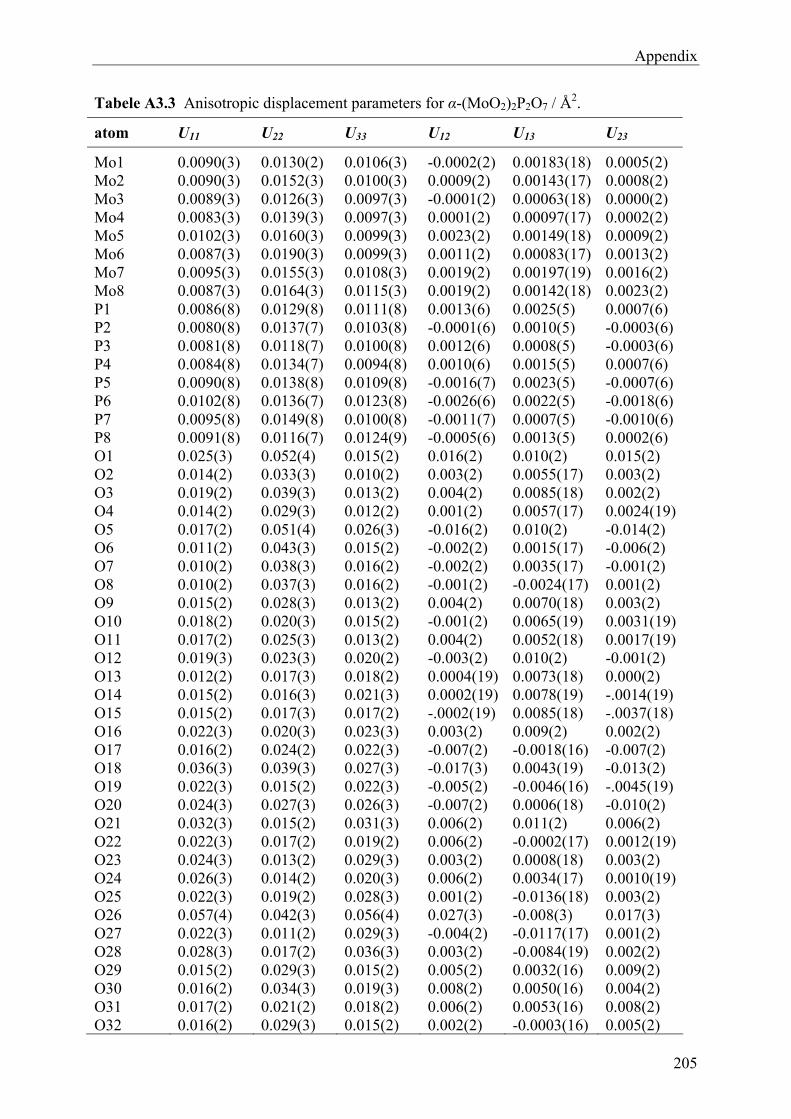
Appendix
205
Tabele A3.3 Anisotropic displacement parameters for α-(MoO2)2P2O7 / Å2.
atom U11 U22 U33 U12 U13 U23
Mo1 0.0090(3) 0.0130(2) 0.0106(3) -0.0002(2) 0.00183(18) 0.0005(2) Mo2 0.0090(3) 0.0152(3) 0.0100(3) 0.0009(2) 0.00143(17) 0.0008(2) Mo3 0.0089(3) 0.0126(3) 0.0097(3) -0.0001(2) 0.00063(18) 0.0000(2) Mo4 0.0083(3) 0.0139(3) 0.0097(3) 0.0001(2) 0.00097(17) 0.0002(2) Mo5 0.0102(3) 0.0160(3) 0.0099(3) 0.0023(2) 0.00149(18) 0.0009(2) Mo6 0.0087(3) 0.0190(3) 0.0099(3) 0.0011(2) 0.00083(17) 0.0013(2) Mo7 0.0095(3) 0.0155(3) 0.0108(3) 0.0019(2) 0.00197(19) 0.0016(2) Mo8 0.0087(3) 0.0164(3) 0.0115(3) 0.0019(2) 0.00142(18) 0.0023(2) P1 0.0086(8) 0.0129(8) 0.0111(8) 0.0013(6) 0.0025(5) 0.0007(6) P2 0.0080(8) 0.0137(7) 0.0103(8) -0.0001(6) 0.0010(5) -0.0003(6) P3 0.0081(8) 0.0118(7) 0.0100(8) 0.0012(6) 0.0008(5) -0.0003(6) P4 0.0084(8) 0.0134(7) 0.0094(8) 0.0010(6) 0.0015(5) 0.0007(6) P5 0.0090(8) 0.0138(8) 0.0109(8) -0.0016(7) 0.0023(5) -0.0007(6) P6 0.0102(8) 0.0136(7) 0.0123(8) -0.0026(6) 0.0022(5) -0.0018(6) P7 0.0095(8) 0.0149(8) 0.0100(8) -0.0011(7) 0.0007(5) -0.0010(6) P8 0.0091(8) 0.0116(7) 0.0124(9) -0.0005(6) 0.0013(5) 0.0002(6) O1 0.025(3) 0.052(4) 0.015(2) 0.016(2) 0.010(2) 0.015(2) O2 0.014(2) 0.033(3) 0.010(2) 0.003(2) 0.0055(17) 0.003(2) O3 0.019(2) 0.039(3) 0.013(2) 0.004(2) 0.0085(18) 0.002(2) O4 0.014(2) 0.029(3) 0.012(2) 0.001(2) 0.0057(17) 0.0024(19)O5 0.017(2) 0.051(4) 0.026(3) -0.016(2) 0.010(2) -0.014(2) O6 0.011(2) 0.043(3) 0.015(2) -0.002(2) 0.0015(17) -0.006(2) O7 0.010(2) 0.038(3) 0.016(2) -0.002(2) 0.0035(17) -0.001(2) O8 0.010(2) 0.037(3) 0.016(2) -0.001(2) -0.0024(17) 0.001(2) O9 0.015(2) 0.028(3) 0.013(2) 0.004(2) 0.0070(18) 0.003(2) O10 0.018(2) 0.020(3) 0.015(2) -0.001(2) 0.0065(19) 0.0031(19)O11 0.017(2) 0.025(3) 0.013(2) 0.004(2) 0.0052(18) 0.0017(19)O12 0.019(3) 0.023(3) 0.020(2) -0.003(2) 0.010(2) -0.001(2) O13 0.012(2) 0.017(3) 0.018(2) 0.0004(19) 0.0073(18) 0.000(2) O14 0.015(2) 0.016(3) 0.021(3) 0.0002(19) 0.0078(19) -.0014(19) O15 0.015(2) 0.017(3) 0.017(2) -.0002(19) 0.0085(18) -.0037(18) O16 0.022(3) 0.020(3) 0.023(3) 0.003(2) 0.009(2) 0.002(2) O17 0.016(2) 0.024(2) 0.022(3) -0.007(2) -0.0018(16) -0.007(2) O18 0.036(3) 0.039(3) 0.027(3) -0.017(3) 0.0043(19) -0.013(2) O19 0.022(3) 0.015(2) 0.022(3) -0.005(2) -0.0046(16) -.0045(19) O20 0.024(3) 0.027(3) 0.026(3) -0.007(2) 0.0006(18) -0.010(2) O21 0.032(3) 0.015(2) 0.031(3) 0.006(2) 0.011(2) 0.006(2) O22 0.022(3) 0.017(2) 0.019(2) 0.006(2) -0.0002(17) 0.0012(19)O23 0.024(3) 0.013(2) 0.029(3) 0.003(2) 0.0008(18) 0.003(2) O24 0.026(3) 0.014(2) 0.020(3) 0.006(2) 0.0034(17) 0.0010(19)O25 0.022(3) 0.019(2) 0.028(3) 0.001(2) -0.0136(18) 0.003(2) O26 0.057(4) 0.042(3) 0.056(4) 0.027(3) -0.008(3) 0.017(3) O27 0.022(3) 0.011(2) 0.029(3) -0.004(2) -0.0117(17) 0.001(2) O28 0.028(3) 0.017(2) 0.036(3) 0.003(2) -0.0084(19) 0.002(2) O29 0.015(2) 0.029(3) 0.015(2) 0.005(2) 0.0032(16) 0.009(2) O30 0.016(2) 0.034(3) 0.019(3) 0.008(2) 0.0050(16) 0.004(2) O31 0.017(2) 0.021(2) 0.018(2) 0.006(2) 0.0053(16) 0.008(2) O32 0.016(2) 0.029(3) 0.015(2) 0.002(2) -0.0003(16) 0.005(2)
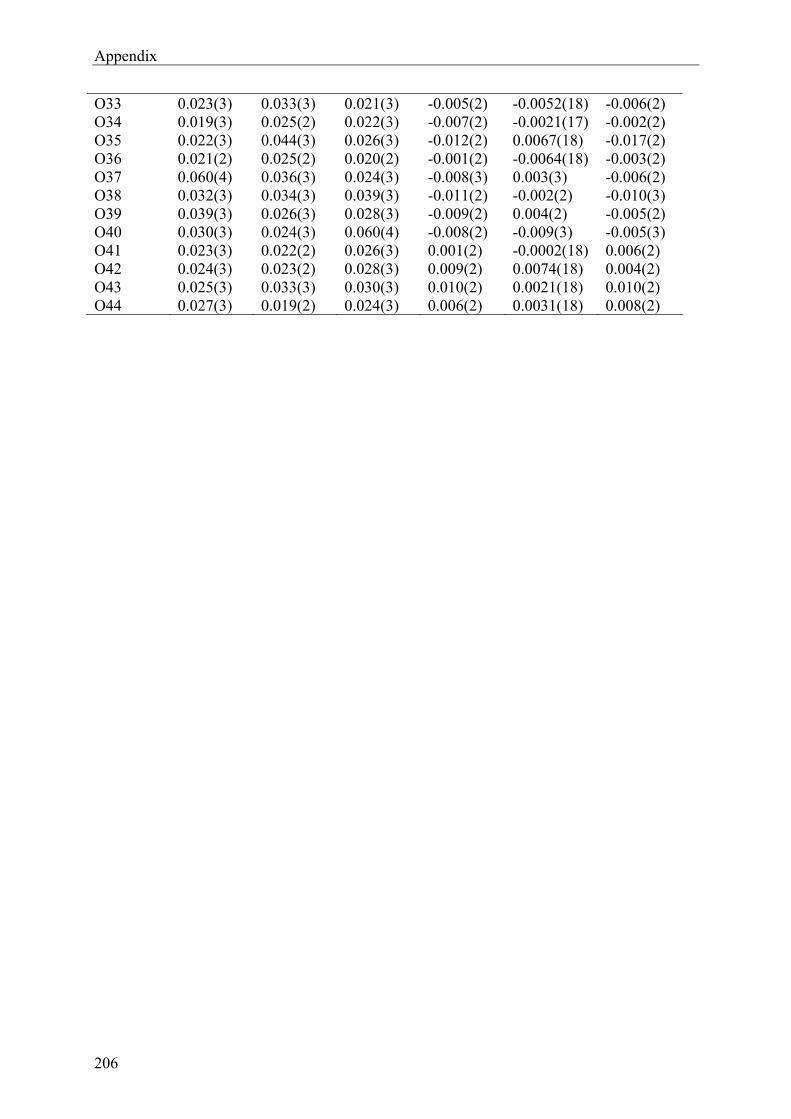
Appendix
206
O33 0.023(3) 0.033(3) 0.021(3) -0.005(2) -0.0052(18) -0.006(2) O34 0.019(3) 0.025(2) 0.022(3) -0.007(2) -0.0021(17) -0.002(2) O35 0.022(3) 0.044(3) 0.026(3) -0.012(2) 0.0067(18) -0.017(2) O36 0.021(2) 0.025(2) 0.020(2) -0.001(2) -0.0064(18) -0.003(2) O37 0.060(4) 0.036(3) 0.024(3) -0.008(3) 0.003(3) -0.006(2) O38 0.032(3) 0.034(3) 0.039(3) -0.011(2) -0.002(2) -0.010(3) O39 0.039(3) 0.026(3) 0.028(3) -0.009(2) 0.004(2) -0.005(2) O40 0.030(3) 0.024(3) 0.060(4) -0.008(2) -0.009(3) -0.005(3) O41 0.023(3) 0.022(2) 0.026(3) 0.001(2) -0.0002(18) 0.006(2) O42 0.024(3) 0.023(2) 0.028(3) 0.009(2) 0.0074(18) 0.004(2) O43 0.025(3) 0.033(3) 0.030(3) 0.010(2) 0.0021(18) 0.010(2) O44 0.027(3) 0.019(2) 0.024(3) 0.006(2) 0.0031(18) 0.008(2)
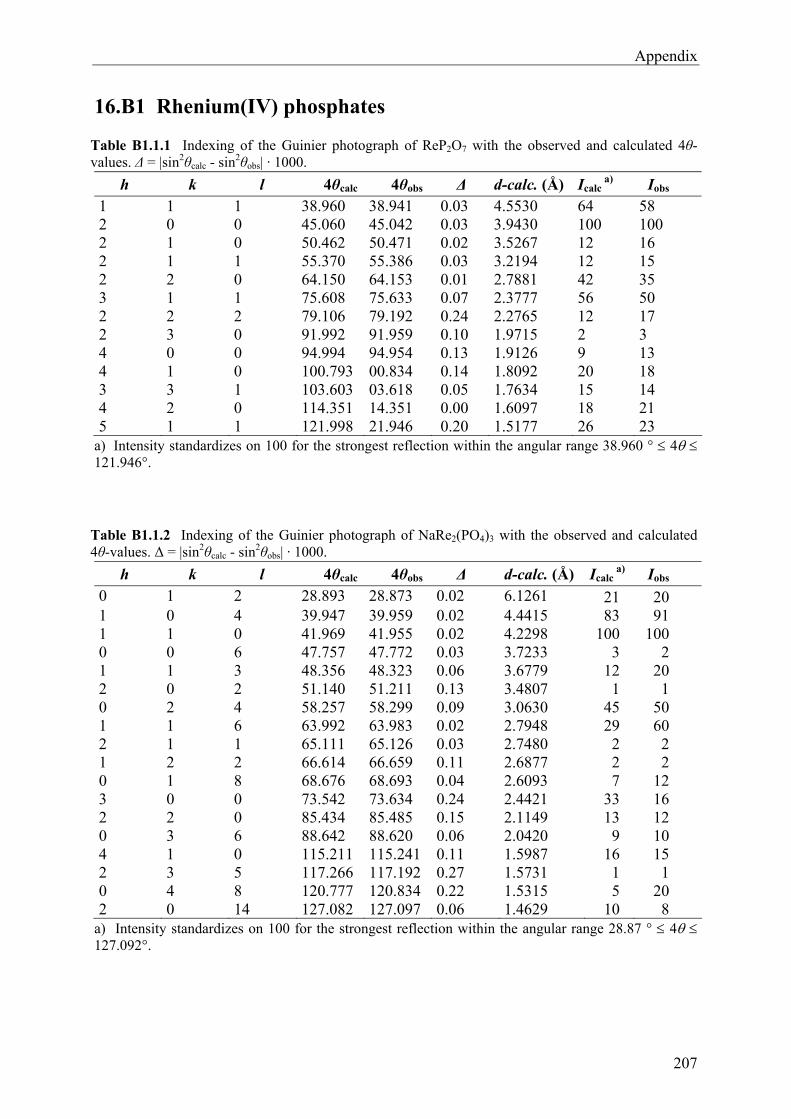
Appendix
207
16.B1 Rhenium(IV) phosphates
Table B1.1.1 Indexing of the Guinier photograph of ReP2O7 with the observed and calculated 4θ-values. Δ = |sin2θcalc - sin2θobs| · 1000.
h k l 4θcalc 4θobs Δ d-calc. (Å) Icalc a) Iobs
1 1 1 38.960 38.941 0.03 4.5530 64 58 2 0 0 45.060 45.042 0.03 3.9430 100 100 2 1 0 50.462 50.471 0.02 3.5267 12 16 2 1 1 55.370 55.386 0.03 3.2194 12 15 2 2 0 64.150 64.153 0.01 2.7881 42 35 3 1 1 75.608 75.633 0.07 2.3777 56 50 2 2 2 79.106 79.192 0.24 2.2765 12 17 2 3 0 91.992 91.959 0.10 1.9715 2 3 4 0 0 94.994 94.954 0.13 1.9126 9 13 4 1 0 100.793 00.834 0.14 1.8092 20 18 3 3 1 103.603 03.618 0.05 1.7634 15 14 4 2 0 114.351 14.351 0.00 1.6097 18 21 5 1 1 121.998 21.946 0.20 1.5177 26 23
a) Intensity standardizes on 100 for the strongest reflection within the angular range 38.960 ° 4 121.946°.
Table B1.1.2 Indexing of the Guinier photograph of NaRe2(PO4)3 with the observed and calculated 4θ-values. Δ = |sin2θcalc - sin2θobs| · 1000.
h k l 4θcalc 4θobs Δ d-calc. (Å) Icalc a) Iobs
0 1 2 28.893 28.873 0.02 6.1261 21 20 1 0 4 39.947 39.959 0.02 4.4415 83 91 1 1 0 41.969 41.955 0.02 4.2298 100 100 0 0 6 47.757 47.772 0.03 3.7233 3 2 1 1 3 48.356 48.323 0.06 3.6779 12 20 2 0 2 51.140 51.211 0.13 3.4807 1 1 0 2 4 58.257 58.299 0.09 3.0630 45 50 1 1 6 63.992 63.983 0.02 2.7948 29 60 2 1 1 65.111 65.126 0.03 2.7480 2 2 1 2 2 66.614 66.659 0.11 2.6877 2 2 0 1 8 68.676 68.693 0.04 2.6093 7 12 3 0 0 73.542 73.634 0.24 2.4421 33 16 2 2 0 85.434 85.485 0.15 2.1149 13 12 0 3 6 88.642 88.620 0.06 2.0420 9 10 4 1 0 115.211 115.241 0.11 1.5987 16 15 2 3 5 117.266 117.192 0.27 1.5731 1 1 0 4 8 120.777 120.834 0.22 1.5315 5 20 2 0 14 127.082 127.097 0.06 1.4629 10 8
a) Intensity standardizes on 100 for the strongest reflection within the angular range 28.87 ° 4 127.092°.
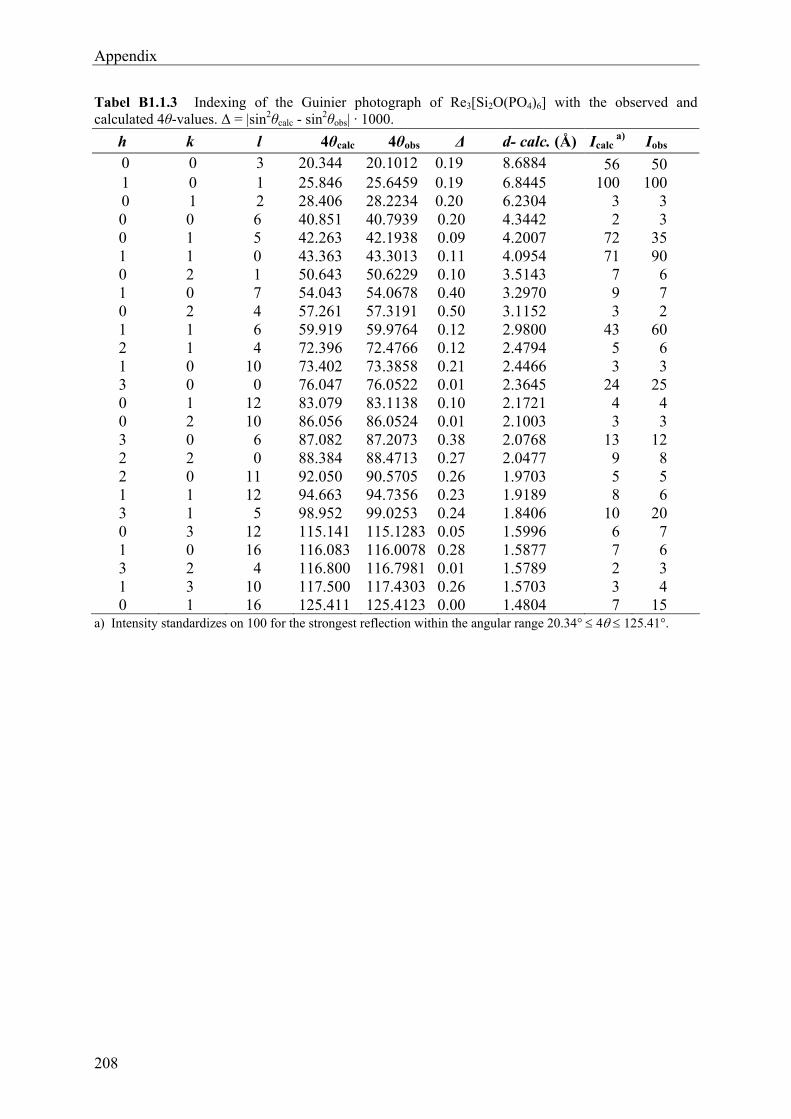
Appendix
208
Tabel B1.1.3 Indexing of the Guinier photograph of Re3[Si2O(PO4)6] with the observed and calculated 4θ-values. Δ = |sin2θcalc - sin2θobs| · 1000.
h k l 4θcalc 4θobs Δ d- calc. (Å) Icalc a) Iobs
0 0 3 20.344 20.1012 0.19 8.6884 56 50 1 0 1 25.846 25.6459 0.19 6.8445 100 100 0 1 2 28.406 28.2234 0.20 6.2304 3 3 0 0 6 40.851 40.7939 0.20 4.3442 2 3 0 1 5 42.263 42.1938 0.09 4.2007 72 35 1 1 0 43.363 43.3013 0.11 4.0954 71 90 0 2 1 50.643 50.6229 0.10 3.5143 7 6 1 0 7 54.043 54.0678 0.40 3.2970 9 7 0 2 4 57.261 57.3191 0.50 3.1152 3 2 1 1 6 59.919 59.9764 0.12 2.9800 43 60 2 1 4 72.396 72.4766 0.12 2.4794 5 6 1 0 10 73.402 73.3858 0.21 2.4466 3 3 3 0 0 76.047 76.0522 0.01 2.3645 24 25 0 1 12 83.079 83.1138 0.10 2.1721 4 4 0 2 10 86.056 86.0524 0.01 2.1003 3 3 3 0 6 87.082 87.2073 0.38 2.0768 13 12 2 2 0 88.384 88.4713 0.27 2.0477 9 8 2 0 11 92.050 90.5705 0.26 1.9703 5 5 1 1 12 94.663 94.7356 0.23 1.9189 8 6 3 1 5 98.952 99.0253 0.24 1.8406 10 20 0 3 12 115.141 115.1283 0.05 1.5996 6 7 1 0 16 116.083 116.0078 0.28 1.5877 7 6 3 2 4 116.800 116.7981 0.01 1.5789 2 3 1 3 10 117.500 117.4303 0.26 1.5703 3 4 0 1 16 125.411 125.4123 0.00 1.4804 7 15
a) Intensity standardizes on 100 for the strongest reflection within the angular range 20.34° 4 125.41°.
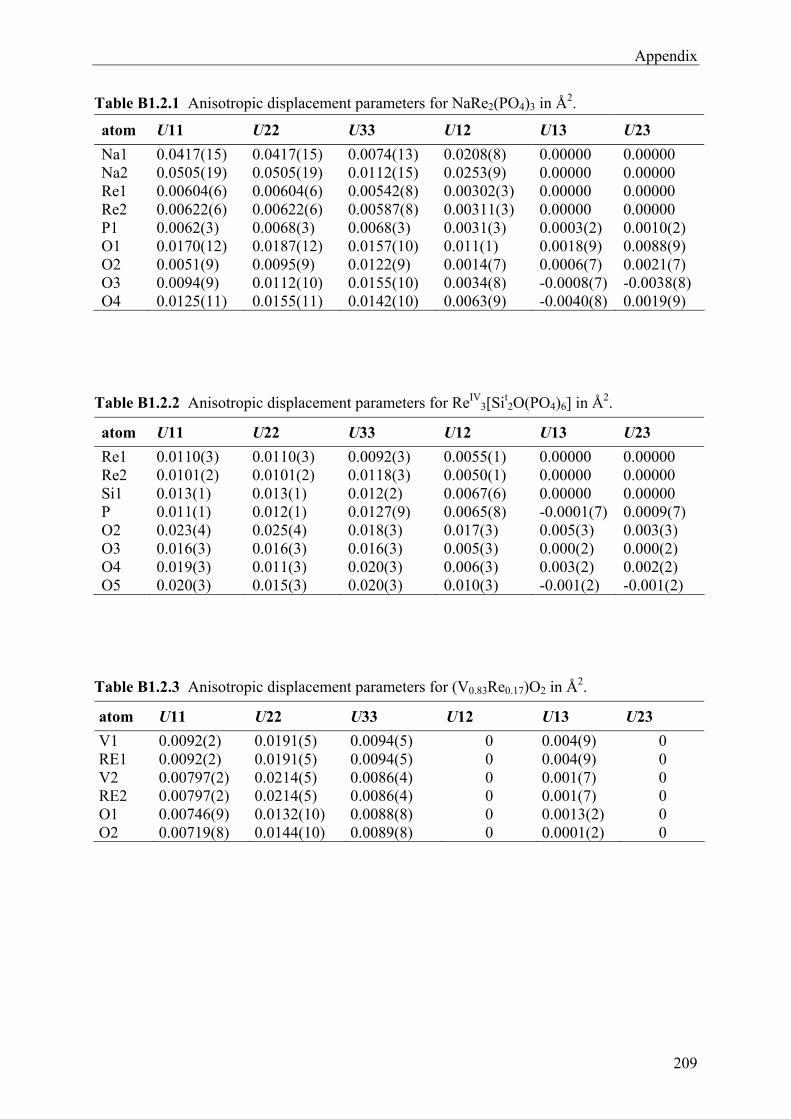
Appendix
209
Table B1.2.1 Anisotropic displacement parameters for NaRe2(PO4)3 in Å2.
atom U11 U22 U33 U12 U13 U23
Na1 0.0417(15) 0.0417(15) 0.0074(13) 0.0208(8) 0.00000 0.00000 Na2 0.0505(19) 0.0505(19) 0.0112(15) 0.0253(9) 0.00000 0.00000 Re1 0.00604(6) 0.00604(6) 0.00542(8) 0.00302(3) 0.00000 0.00000 Re2 0.00622(6) 0.00622(6) 0.00587(8) 0.00311(3) 0.00000 0.00000 P1 0.0062(3) 0.0068(3) 0.0068(3) 0.0031(3) 0.0003(2) 0.0010(2) O1 0.0170(12) 0.0187(12) 0.0157(10) 0.011(1) 0.0018(9) 0.0088(9) O2 0.0051(9) 0.0095(9) 0.0122(9) 0.0014(7) 0.0006(7) 0.0021(7) O3 0.0094(9) 0.0112(10) 0.0155(10) 0.0034(8) -0.0008(7) -0.0038(8) O4 0.0125(11) 0.0155(11) 0.0142(10) 0.0063(9) -0.0040(8) 0.0019(9)
Table B1.2.2 Anisotropic displacement parameters for ReIV3[Sit
2O(PO4)6] in Å2.
atom U11 U22 U33 U12 U13 U23
Re1 0.0110(3) 0.0110(3) 0.0092(3) 0.0055(1) 0.00000 0.00000 Re2 0.0101(2) 0.0101(2) 0.0118(3) 0.0050(1) 0.00000 0.00000 Si1 0.013(1) 0.013(1) 0.012(2) 0.0067(6) 0.00000 0.00000 P 0.011(1) 0.012(1) 0.0127(9) 0.0065(8) -0.0001(7) 0.0009(7) O2 0.023(4) 0.025(4) 0.018(3) 0.017(3) 0.005(3) 0.003(3) O3 0.016(3) 0.016(3) 0.016(3) 0.005(3) 0.000(2) 0.000(2) O4 0.019(3) 0.011(3) 0.020(3) 0.006(3) 0.003(2) 0.002(2) O5 0.020(3) 0.015(3) 0.020(3) 0.010(3) -0.001(2) -0.001(2)
Table B1.2.3 Anisotropic displacement parameters for (V0.83Re0.17)O2 in Å2.
atom U11 U22 U33 U12 U13 U23
V1 0.0092(2) 0.0191(5) 0.0094(5) 0 0.004(9) 0 RE1 0.0092(2) 0.0191(5) 0.0094(5) 0 0.004(9) 0 V2 0.00797(2) 0.0214(5) 0.0086(4) 0 0.001(7) 0 RE2 0.00797(2) 0.0214(5) 0.0086(4) 0 0.001(7) 0 O1 0.00746(9) 0.0132(10) 0.0088(8) 0 0.0013(2) 0 O2 0.00719(8) 0.0144(10) 0.0089(8) 0 0.0001(2) 0
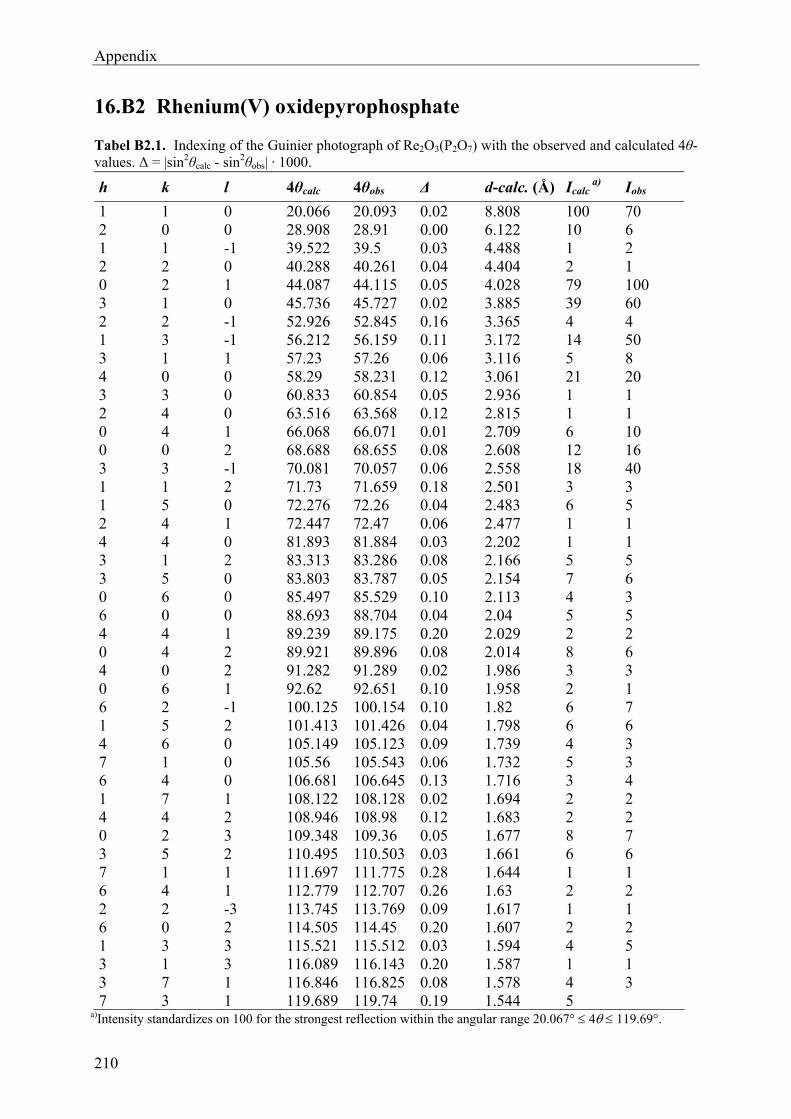
Appendix
210
16.B2 Rhenium(V) oxidepyrophosphate
Tabel B2.1. Indexing of the Guinier photograph of Re2O3(P2O7) with the observed and calculated 4θ-values. Δ = |sin2θcalc - sin2θobs| · 1000.
h k l 4θcalc 4θobs Δ d-calc. (Å) Icalc a) Iobs
1 1 0 20.066 20.093 0.02 8.808 100 70 2 0 0 28.908 28.91 0.00 6.122 10 6 1 1 -1 39.522 39.5 0.03 4.488 1 2 2 2 0 40.288 40.261 0.04 4.404 2 1 0 2 1 44.087 44.115 0.05 4.028 79 100 3 1 0 45.736 45.727 0.02 3.885 39 60 2 2 -1 52.926 52.845 0.16 3.365 4 4 1 3 -1 56.212 56.159 0.11 3.172 14 50 3 1 1 57.23 57.26 0.06 3.116 5 8 4 0 0 58.29 58.231 0.12 3.061 21 20 3 3 0 60.833 60.854 0.05 2.936 1 1 2 4 0 63.516 63.568 0.12 2.815 1 1 0 4 1 66.068 66.071 0.01 2.709 6 10 0 0 2 68.688 68.655 0.08 2.608 12 16 3 3 -1 70.081 70.057 0.06 2.558 18 40 1 1 2 71.73 71.659 0.18 2.501 3 3 1 5 0 72.276 72.26 0.04 2.483 6 5 2 4 1 72.447 72.47 0.06 2.477 1 1 4 4 0 81.893 81.884 0.03 2.202 1 1 3 1 2 83.313 83.286 0.08 2.166 5 5 3 5 0 83.803 83.787 0.05 2.154 7 6 0 6 0 85.497 85.529 0.10 2.113 4 3 6 0 0 88.693 88.704 0.04 2.04 5 5 4 4 1 89.239 89.175 0.20 2.029 2 2 0 4 2 89.921 89.896 0.08 2.014 8 6 4 0 2 91.282 91.289 0.02 1.986 3 3 0 6 1 92.62 92.651 0.10 1.958 2 1 6 2 -1 100.125 100.154 0.10 1.82 6 7 1 5 2 101.413 101.426 0.04 1.798 6 6 4 6 0 105.149 105.123 0.09 1.739 4 3 7 1 0 105.56 105.543 0.06 1.732 5 3 6 4 0 106.681 106.645 0.13 1.716 3 4 1 7 1 108.122 108.128 0.02 1.694 2 2 4 4 2 108.946 108.98 0.12 1.683 2 2 0 2 3 109.348 109.36 0.05 1.677 8 7 3 5 2 110.495 110.503 0.03 1.661 6 6 7 1 1 111.697 111.775 0.28 1.644 1 1 6 4 1 112.779 112.707 0.26 1.63 2 2 2 2 -3 113.745 113.769 0.09 1.617 1 1 6 0 2 114.505 114.45 0.20 1.607 2 2 1 3 3 115.521 115.512 0.03 1.594 4 5 3 1 3 116.089 116.143 0.20 1.587 1 1 3 7 1 116.846 116.825 0.08 1.578 4 3 7 3 1 119.689 119.74 0.19 1.544 5
a)Intensity standardizes on 100 for the strongest reflection within the angular range 20.067° 4 119.69°.
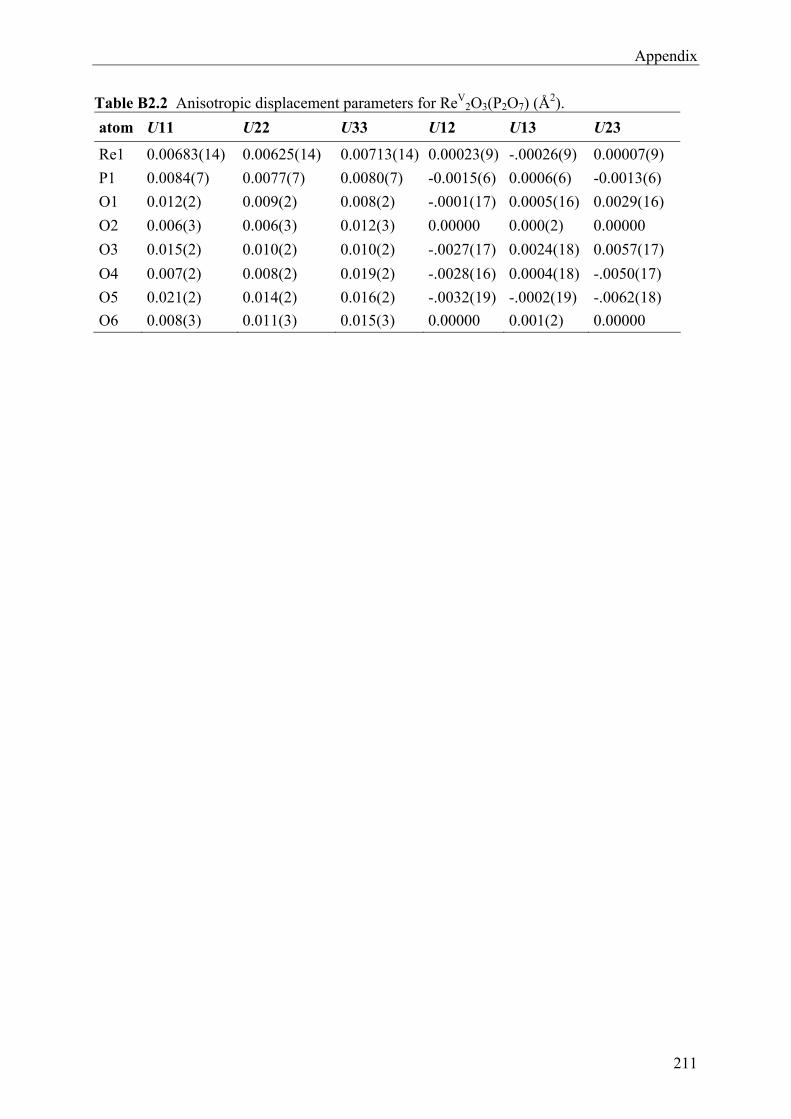
Appendix
211
Table B2.2 Anisotropic displacement parameters for ReV2O3(P2O7) (Å
2).
atom U11 U22 U33 U12 U13 U23
Re1 0.00683(14) 0.00625(14) 0.00713(14) 0.00023(9) -.00026(9) 0.00007(9)
P1 0.0084(7) 0.0077(7) 0.0080(7) -0.0015(6) 0.0006(6) -0.0013(6)
O1 0.012(2) 0.009(2) 0.008(2) -.0001(17) 0.0005(16) 0.0029(16)
O2 0.006(3) 0.006(3) 0.012(3) 0.00000 0.000(2) 0.00000
O3 0.015(2) 0.010(2) 0.010(2) -.0027(17) 0.0024(18) 0.0057(17)
O4 0.007(2) 0.008(2) 0.019(2) -.0028(16) 0.0004(18) -.0050(17)
O5 0.021(2) 0.014(2) 0.016(2) -.0032(19) -.0002(19) -.0062(18)
O6 0.008(3) 0.011(3) 0.015(3) 0.00000 0.001(2) 0.00000
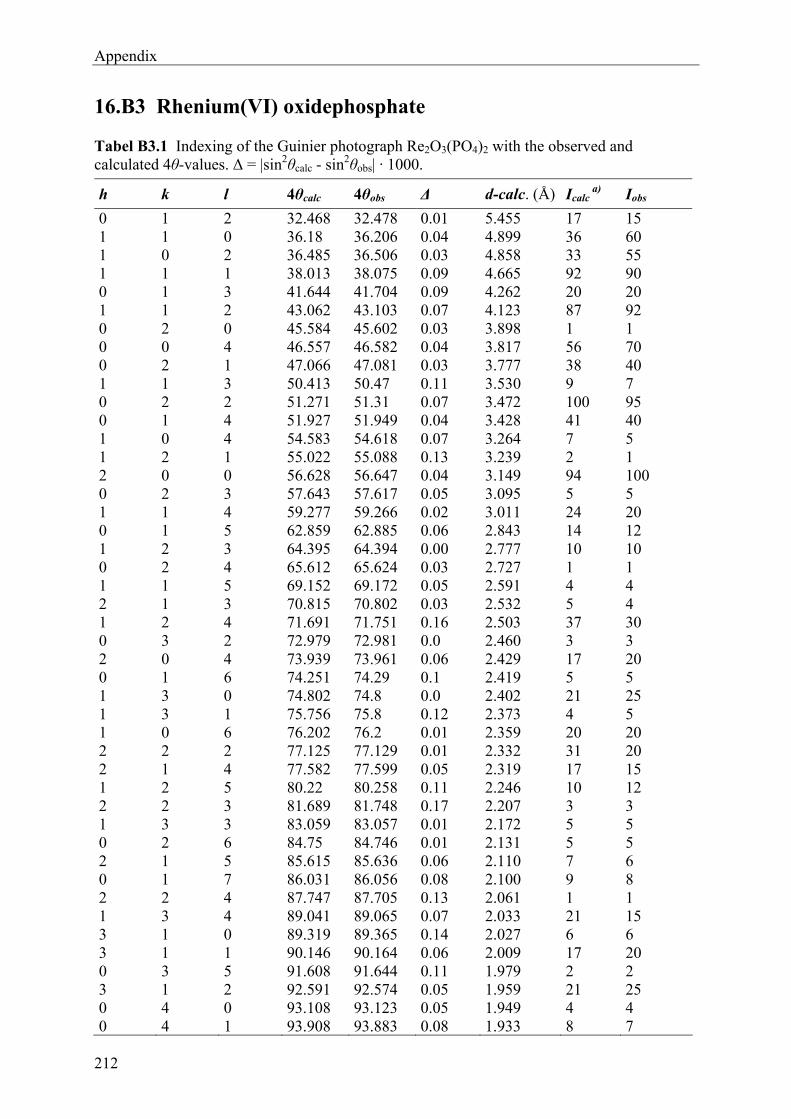
Appendix
212
16.B3 Rhenium(VI) oxidephosphate
Tabel B3.1 Indexing of the Guinier photograph Re2O3(PO4)2 with the observed and calculated 4θ-values. Δ = |sin2θcalc - sin2θobs| · 1000.
h k l 4θcalc 4θobs Δ d-calc. (Å) Icalc a) Iobs
0 1 2 32.468 32.478 0.01 5.455 17 15 1 1 0 36.18 36.206 0.04 4.899 36 60 1 0 2 36.485 36.506 0.03 4.858 33 55 1 1 1 38.013 38.075 0.09 4.665 92 90 0 1 3 41.644 41.704 0.09 4.262 20 20 1 1 2 43.062 43.103 0.07 4.123 87 92 0 2 0 45.584 45.602 0.03 3.898 1 1 0 0 4 46.557 46.582 0.04 3.817 56 70 0 2 1 47.066 47.081 0.03 3.777 38 40 1 1 3 50.413 50.47 0.11 3.530 9 7 0 2 2 51.271 51.31 0.07 3.472 100 95 0 1 4 51.927 51.949 0.04 3.428 41 40 1 0 4 54.583 54.618 0.07 3.264 7 5 1 2 1 55.022 55.088 0.13 3.239 2 1 2 0 0 56.628 56.647 0.04 3.149 94 100 0 2 3 57.643 57.617 0.05 3.095 5 5 1 1 4 59.277 59.266 0.02 3.011 24 20 0 1 5 62.859 62.885 0.06 2.843 14 12 1 2 3 64.395 64.394 0.00 2.777 10 10 0 2 4 65.612 65.624 0.03 2.727 1 1 1 1 5 69.152 69.172 0.05 2.591 4 4 2 1 3 70.815 70.802 0.03 2.532 5 4 1 2 4 71.691 71.751 0.16 2.503 37 30 0 3 2 72.979 72.981 0.0 2.460 3 3 2 0 4 73.939 73.961 0.06 2.429 17 20 0 1 6 74.251 74.29 0.1 2.419 5 5 1 3 0 74.802 74.8 0.0 2.402 21 25 1 3 1 75.756 75.8 0.12 2.373 4 5 1 0 6 76.202 76.2 0.01 2.359 20 20 2 2 2 77.125 77.129 0.01 2.332 31 20 2 1 4 77.582 77.599 0.05 2.319 17 15 1 2 5 80.22 80.258 0.11 2.246 10 12 2 2 3 81.689 81.748 0.17 2.207 3 3 1 3 3 83.059 83.057 0.01 2.172 5 5 0 2 6 84.75 84.746 0.01 2.131 5 5 2 1 5 85.615 85.636 0.06 2.110 7 6 0 1 7 86.031 86.056 0.08 2.100 9 8 2 2 4 87.747 87.705 0.13 2.061 1 1 1 3 4 89.041 89.065 0.07 2.033 21 15 3 1 0 89.319 89.365 0.14 2.027 6 6 3 1 1 90.146 90.164 0.06 2.009 17 20 0 3 5 91.608 91.644 0.11 1.979 2 2 3 1 2 92.591 92.574 0.05 1.959 21 25 0 4 0 93.108 93.123 0.05 1.949 4 4 0 4 1 93.908 93.883 0.08 1.933 8 7
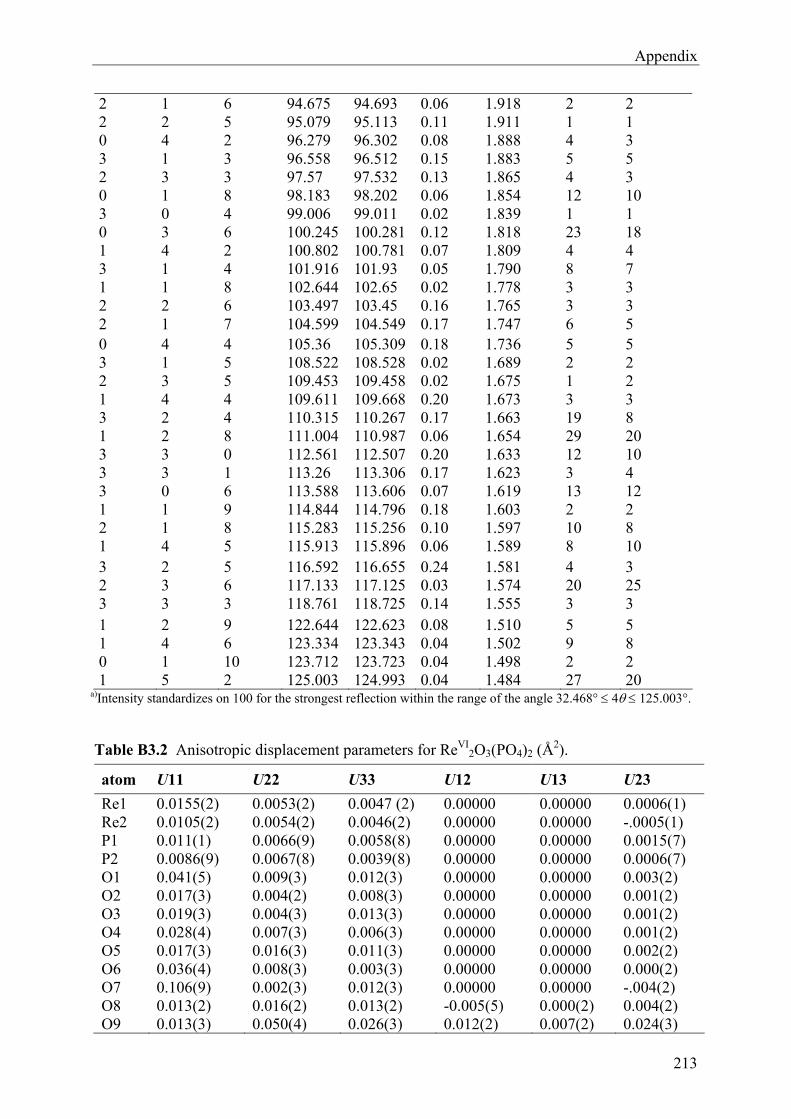
Appendix
213
2 1 6 94.675 94.693 0.06 1.918 2 2 2 2 5 95.079 95.113 0.11 1.911 1 1 0 4 2 96.279 96.302 0.08 1.888 4 3 3 1 3 96.558 96.512 0.15 1.883 5 5 2 3 3 97.57 97.532 0.13 1.865 4 3 0 1 8 98.183 98.202 0.06 1.854 12 10 3 0 4 99.006 99.011 0.02 1.839 1 1 0 3 6 100.245 100.281 0.12 1.818 23 18 1 4 2 100.802 100.781 0.07 1.809 4 4 3 1 4 101.916 101.93 0.05 1.790 8 7 1 1 8 102.644 102.65 0.02 1.778 3 3 2 2 6 103.497 103.45 0.16 1.765 3 3 2 1 7 104.599 104.549 0.17 1.747 6 5 0 4 4 105.36 105.309 0.18 1.736 5 5 3 1 5 108.522 108.528 0.02 1.689 2 2 2 3 5 109.453 109.458 0.02 1.675 1 2 1 4 4 109.611 109.668 0.20 1.673 3 3 3 2 4 110.315 110.267 0.17 1.663 19 8 1 2 8 111.004 110.987 0.06 1.654 29 20 3 3 0 112.561 112.507 0.20 1.633 12 10 3 3 1 113.26 113.306 0.17 1.623 3 4 3 0 6 113.588 113.606 0.07 1.619 13 12 1 1 9 114.844 114.796 0.18 1.603 2 2 2 1 8 115.283 115.256 0.10 1.597 10 8 1 4 5 115.913 115.896 0.06 1.589 8 10 3 2 5 116.592 116.655 0.24 1.581 4 3 2 3 6 117.133 117.125 0.03 1.574 20 25 3 3 3 118.761 118.725 0.14 1.555 3 3 1 2 9 122.644 122.623 0.08 1.510 5 5 1 4 6 123.334 123.343 0.04 1.502 9 8 0 1 10 123.712 123.723 0.04 1.498 2 2 1 5 2 125.003 124.993 0.04 1.484 27 20
a)Intensity standardizes on 100 for the strongest reflection within the range of the angle 32.468° 4 125.003°.
Table B3.2 Anisotropic displacement parameters for ReVI2O3(PO4)2 (Å
2).
atom U11 U22 U33 U12 U13 U23
Re1 0.0155(2) 0.0053(2) 0.0047 (2) 0.00000 0.00000 0.0006(1) Re2 0.0105(2) 0.0054(2) 0.0046(2) 0.00000 0.00000 -.0005(1) P1 0.011(1) 0.0066(9) 0.0058(8) 0.00000 0.00000 0.0015(7) P2 0.0086(9) 0.0067(8) 0.0039(8) 0.00000 0.00000 0.0006(7) O1 0.041(5) 0.009(3) 0.012(3) 0.00000 0.00000 0.003(2) O2 0.017(3) 0.004(2) 0.008(3) 0.00000 0.00000 0.001(2) O3 0.019(3) 0.004(3) 0.013(3) 0.00000 0.00000 0.001(2) O4 0.028(4) 0.007(3) 0.006(3) 0.00000 0.00000 0.001(2) O5 0.017(3) 0.016(3) 0.011(3) 0.00000 0.00000 0.002(2) O6 0.036(4) 0.008(3) 0.003(3) 0.00000 0.00000 0.000(2) O7 0.106(9) 0.002(3) 0.012(3) 0.00000 0.00000 -.004(2) O8 0.013(2) 0.016(2) 0.013(2) -0.005(5) 0.000(2) 0.004(2) O9 0.013(3) 0.050(4) 0.026(3) 0.012(2) 0.007(2) 0.024(3)
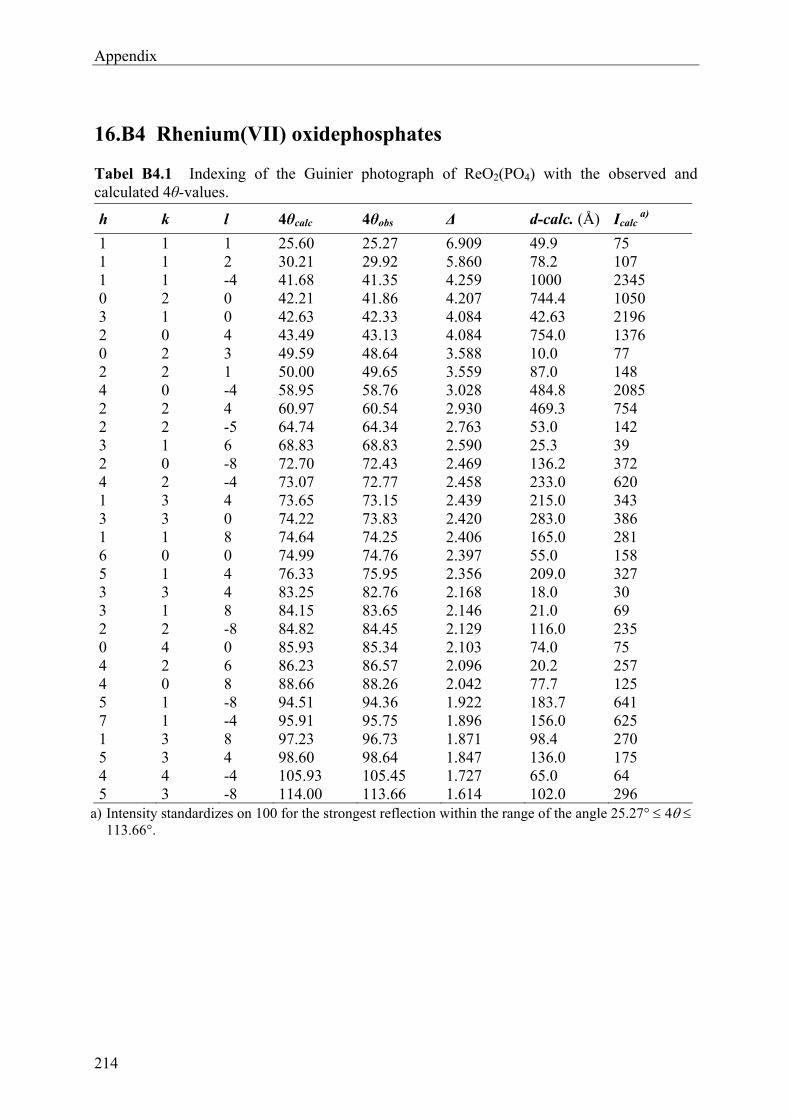
Appendix
214
16.B4 Rhenium(VII) oxidephosphates
Tabel B4.1 Indexing of the Guinier photograph of ReO2(PO4) with the observed and calculated 4θ-values.
h k l 4θcalc 4θobs Δ d-calc. (Å) Icalc a)
1 1 1 25.60 25.27 6.909 49.9 75 1 1 2 30.21 29.92 5.860 78.2 107 1 1 -4 41.68 41.35 4.259 1000 2345 0 2 0 42.21 41.86 4.207 744.4 1050 3 1 0 42.63 42.33 4.084 42.63 2196 2 0 4 43.49 43.13 4.084 754.0 1376 0 2 3 49.59 48.64 3.588 10.0 77 2 2 1 50.00 49.65 3.559 87.0 148 4 0 -4 58.95 58.76 3.028 484.8 2085 2 2 4 60.97 60.54 2.930 469.3 754 2 2 -5 64.74 64.34 2.763 53.0 142 3 1 6 68.83 68.83 2.590 25.3 39 2 0 -8 72.70 72.43 2.469 136.2 372 4 2 -4 73.07 72.77 2.458 233.0 620 1 3 4 73.65 73.15 2.439 215.0 343 3 3 0 74.22 73.83 2.420 283.0 386 1 1 8 74.64 74.25 2.406 165.0 281 6 0 0 74.99 74.76 2.397 55.0 158 5 1 4 76.33 75.95 2.356 209.0 327 3 3 4 83.25 82.76 2.168 18.0 30 3 1 8 84.15 83.65 2.146 21.0 69 2 2 -8 84.82 84.45 2.129 116.0 235 0 4 0 85.93 85.34 2.103 74.0 75 4 2 6 86.23 86.57 2.096 20.2 257 4 0 8 88.66 88.26 2.042 77.7 125 5 1 -8 94.51 94.36 1.922 183.7 641 7 1 -4 95.91 95.75 1.896 156.0 625 1 3 8 97.23 96.73 1.871 98.4 270 5 3 4 98.60 98.64 1.847 136.0 175 4 4 -4 105.93 105.45 1.727 65.0 64 5 3 -8 114.00 113.66 1.614 102.0 296
a) Intensity standardizes on 100 for the strongest reflection within the range of the angle 25.27° 4 113.66°.
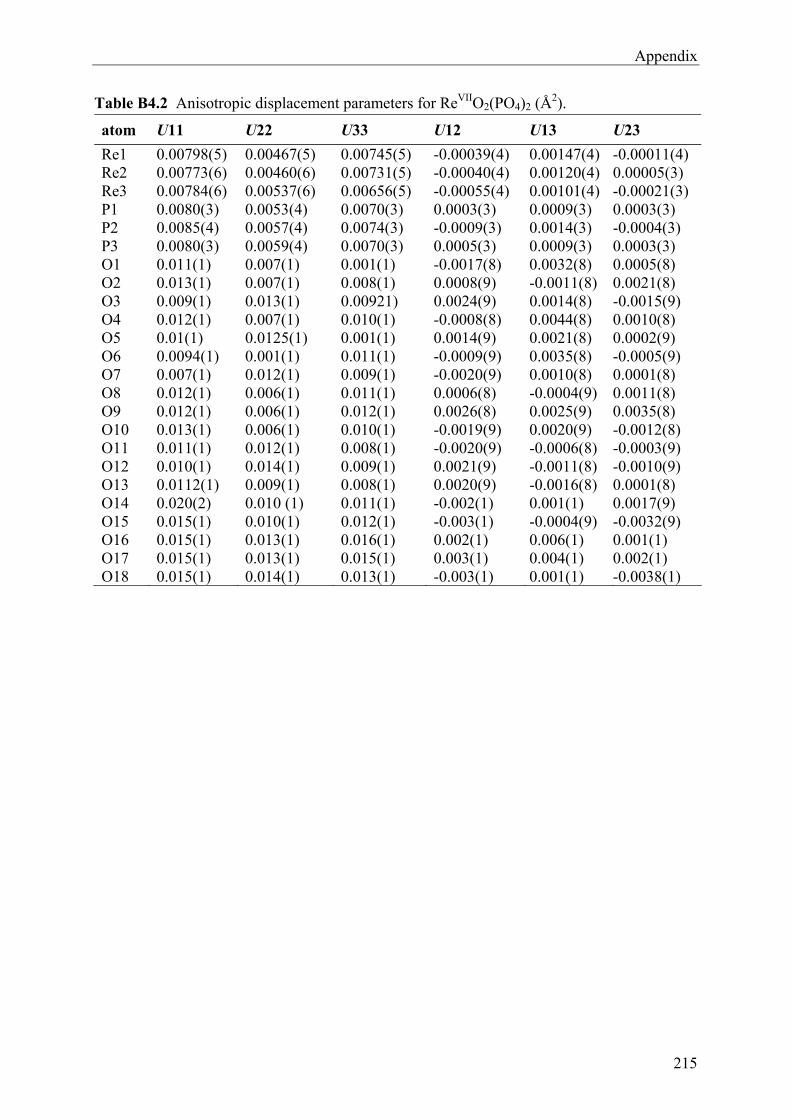
Appendix
215
Table B4.2 Anisotropic displacement parameters for ReVIIO2(PO4)2 (Å2).
atom U11 U22 U33 U12 U13 U23
Re1 0.00798(5) 0.00467(5) 0.00745(5) -0.00039(4) 0.00147(4) -0.00011(4) Re2 0.00773(6) 0.00460(6) 0.00731(5) -0.00040(4) 0.00120(4) 0.00005(3) Re3 0.00784(6) 0.00537(6) 0.00656(5) -0.00055(4) 0.00101(4) -0.00021(3) P1 0.0080(3) 0.0053(4) 0.0070(3) 0.0003(3) 0.0009(3) 0.0003(3) P2 0.0085(4) 0.0057(4) 0.0074(3) -0.0009(3) 0.0014(3) -0.0004(3) P3 0.0080(3) 0.0059(4) 0.0070(3) 0.0005(3) 0.0009(3) 0.0003(3) O1 0.011(1) 0.007(1) 0.001(1) -0.0017(8) 0.0032(8) 0.0005(8) O2 0.013(1) 0.007(1) 0.008(1) 0.0008(9) -0.0011(8) 0.0021(8) O3 0.009(1) 0.013(1) 0.00921) 0.0024(9) 0.0014(8) -0.0015(9) O4 0.012(1) 0.007(1) 0.010(1) -0.0008(8) 0.0044(8) 0.0010(8) O5 0.01(1) 0.0125(1) 0.001(1) 0.0014(9) 0.0021(8) 0.0002(9) O6 0.0094(1) 0.001(1) 0.011(1) -0.0009(9) 0.0035(8) -0.0005(9) O7 0.007(1) 0.012(1) 0.009(1) -0.0020(9) 0.0010(8) 0.0001(8) O8 0.012(1) 0.006(1) 0.011(1) 0.0006(8) -0.0004(9) 0.0011(8) O9 0.012(1) 0.006(1) 0.012(1) 0.0026(8) 0.0025(9) 0.0035(8) O10 0.013(1) 0.006(1) 0.010(1) -0.0019(9) 0.0020(9) -0.0012(8) O11 0.011(1) 0.012(1) 0.008(1) -0.0020(9) -0.0006(8) -0.0003(9) O12 0.010(1) 0.014(1) 0.009(1) 0.0021(9) -0.0011(8) -0.0010(9) O13 0.0112(1) 0.009(1) 0.008(1) 0.0020(9) -0.0016(8) 0.0001(8) O14 0.020(2) 0.010 (1) 0.011(1) -0.002(1) 0.001(1) 0.0017(9) O15 0.015(1) 0.010(1) 0.012(1) -0.003(1) -0.0004(9) -0.0032(9) O16 0.015(1) 0.013(1) 0.016(1) 0.002(1) 0.006(1) 0.001(1) O17 0.015(1) 0.013(1) 0.015(1) 0.003(1) 0.004(1) 0.002(1) O18 0.015(1) 0.014(1) 0.013(1) -0.003(1) 0.001(1) -0.0038(1)
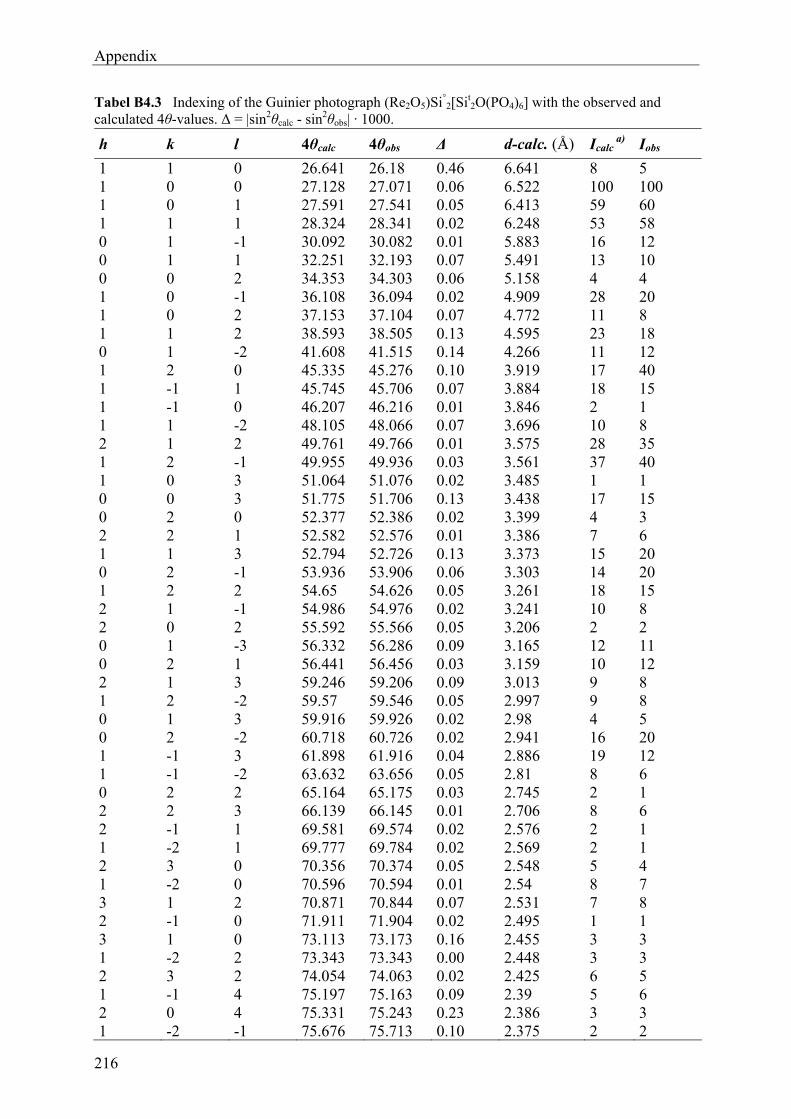
Appendix
216
Tabel B4.3 Indexing of the Guinier photograph (Re2O5)Si°2[Sit
2O(PO4)6] with the observed and calculated 4θ-values. Δ = |sin2θcalc - sin2θobs| · 1000.
h k l 4θcalc 4θobs Δ d-calc. (Å) Icalc a) Iobs
1 1 0 26.641 26.18 0.46 6.641 8 5 1 0 0 27.128 27.071 0.06 6.522 100 100 1 0 1 27.591 27.541 0.05 6.413 59 60 1 1 1 28.324 28.341 0.02 6.248 53 58 0 1 -1 30.092 30.082 0.01 5.883 16 12 0 1 1 32.251 32.193 0.07 5.491 13 10 0 0 2 34.353 34.303 0.06 5.158 4 4 1 0 -1 36.108 36.094 0.02 4.909 28 20 1 0 2 37.153 37.104 0.07 4.772 11 8 1 1 2 38.593 38.505 0.13 4.595 23 18 0 1 -2 41.608 41.515 0.14 4.266 11 12 1 2 0 45.335 45.276 0.10 3.919 17 40 1 -1 1 45.745 45.706 0.07 3.884 18 15 1 -1 0 46.207 46.216 0.01 3.846 2 1 1 1 -2 48.105 48.066 0.07 3.696 10 8 2 1 2 49.761 49.766 0.01 3.575 28 35 1 2 -1 49.955 49.936 0.03 3.561 37 40 1 0 3 51.064 51.076 0.02 3.485 1 1 0 0 3 51.775 51.706 0.13 3.438 17 15 0 2 0 52.377 52.386 0.02 3.399 4 3 2 2 1 52.582 52.576 0.01 3.386 7 6 1 1 3 52.794 52.726 0.13 3.373 15 20 0 2 -1 53.936 53.906 0.06 3.303 14 20 1 2 2 54.65 54.626 0.05 3.261 18 15 2 1 -1 54.986 54.976 0.02 3.241 10 8 2 0 2 55.592 55.566 0.05 3.206 2 2 0 1 -3 56.332 56.286 0.09 3.165 12 11 0 2 1 56.441 56.456 0.03 3.159 10 12 2 1 3 59.246 59.206 0.09 3.013 9 8 1 2 -2 59.57 59.546 0.05 2.997 9 8 0 1 3 59.916 59.926 0.02 2.98 4 5 0 2 -2 60.718 60.726 0.02 2.941 16 20 1 -1 3 61.898 61.916 0.04 2.886 19 12 1 -1 -2 63.632 63.656 0.05 2.81 8 6 0 2 2 65.164 65.175 0.03 2.745 2 1 2 2 3 66.139 66.145 0.01 2.706 8 6 2 -1 1 69.581 69.574 0.02 2.576 2 1 1 -2 1 69.777 69.784 0.02 2.569 2 1 2 3 0 70.356 70.374 0.05 2.548 5 4 1 -2 0 70.596 70.594 0.01 2.54 8 7 3 1 2 70.871 70.844 0.07 2.531 7 8 2 -1 0 71.911 71.904 0.02 2.495 1 1 3 1 0 73.113 73.173 0.16 2.455 3 3 1 -2 2 73.343 73.343 0.00 2.448 3 3 2 3 2 74.054 74.063 0.02 2.425 6 5 1 -1 4 75.197 75.163 0.09 2.39 5 6 2 0 4 75.331 75.243 0.23 2.386 3 3 1 -2 -1 75.676 75.713 0.10 2.375 2 2
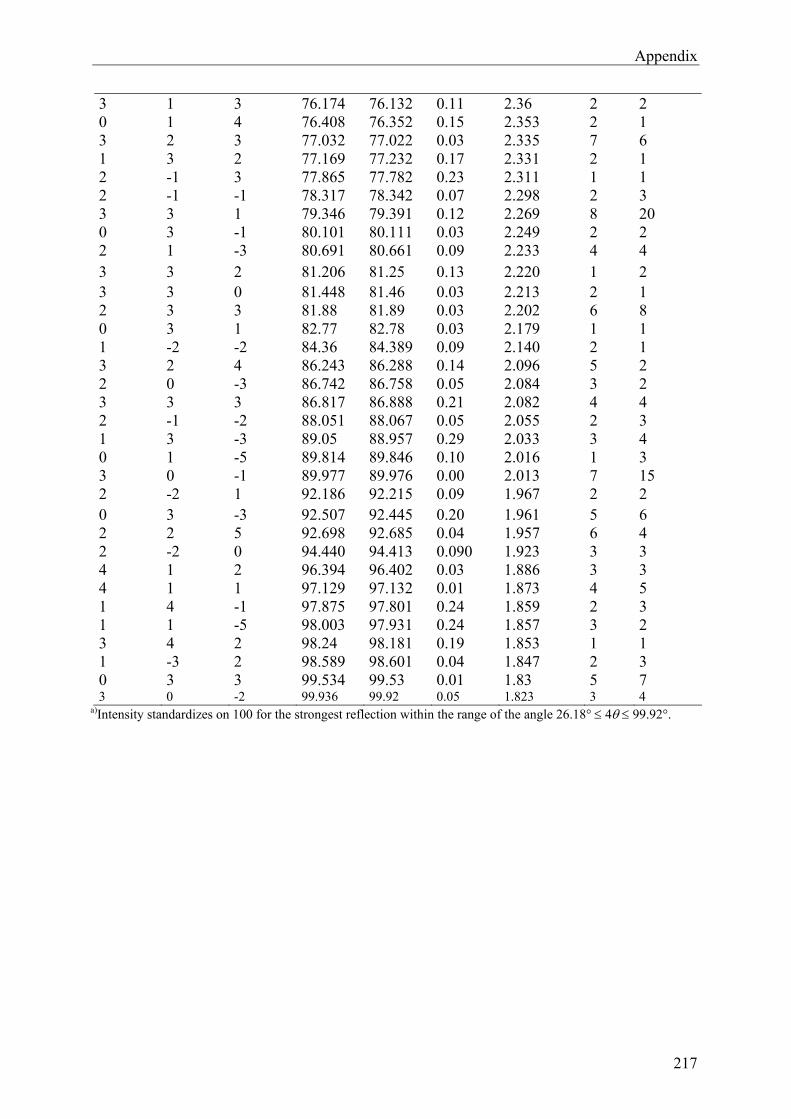
Appendix
217
3 1 3 76.174 76.132 0.11 2.36 2 2 0 1 4 76.408 76.352 0.15 2.353 2 1 3 2 3 77.032 77.022 0.03 2.335 7 6 1 3 2 77.169 77.232 0.17 2.331 2 1 2 -1 3 77.865 77.782 0.23 2.311 1 1 2 -1 -1 78.317 78.342 0.07 2.298 2 3 3 3 1 79.346 79.391 0.12 2.269 8 20 0 3 -1 80.101 80.111 0.03 2.249 2 2 2 1 -3 80.691 80.661 0.09 2.233 4 4 3 3 2 81.206 81.25 0.13 2.220 1 2 3 3 0 81.448 81.46 0.03 2.213 2 1 2 3 3 81.88 81.89 0.03 2.202 6 8 0 3 1 82.77 82.78 0.03 2.179 1 1 1 -2 -2 84.36 84.389 0.09 2.140 2 1 3 2 4 86.243 86.288 0.14 2.096 5 2 2 0 -3 86.742 86.758 0.05 2.084 3 2 3 3 3 86.817 86.888 0.21 2.082 4 4 2 -1 -2 88.051 88.067 0.05 2.055 2 3 1 3 -3 89.05 88.957 0.29 2.033 3 4 0 1 -5 89.814 89.846 0.10 2.016 1 3 3 0 -1 89.977 89.976 0.00 2.013 7 15 2 -2 1 92.186 92.215 0.09 1.967 2 2 0 3 -3 92.507 92.445 0.20 1.961 5 6 2 2 5 92.698 92.685 0.04 1.957 6 4 2 -2 0 94.440 94.413 0.090 1.923 3 3 4 1 2 96.394 96.402 0.03 1.886 3 3 4 1 1 97.129 97.132 0.01 1.873 4 5 1 4 -1 97.875 97.801 0.24 1.859 2 3 1 1 -5 98.003 97.931 0.24 1.857 3 2 3 4 2 98.24 98.181 0.19 1.853 1 1 1 -3 2 98.589 98.601 0.04 1.847 2 3 0 3 3 99.534 99.53 0.01 1.83 5 7 3 0 -2 99.936 99.92 0.05 1.823 3 4
a)Intensity standardizes on 100 for the strongest reflection within the range of the angle 26.18° 4 99.92°.
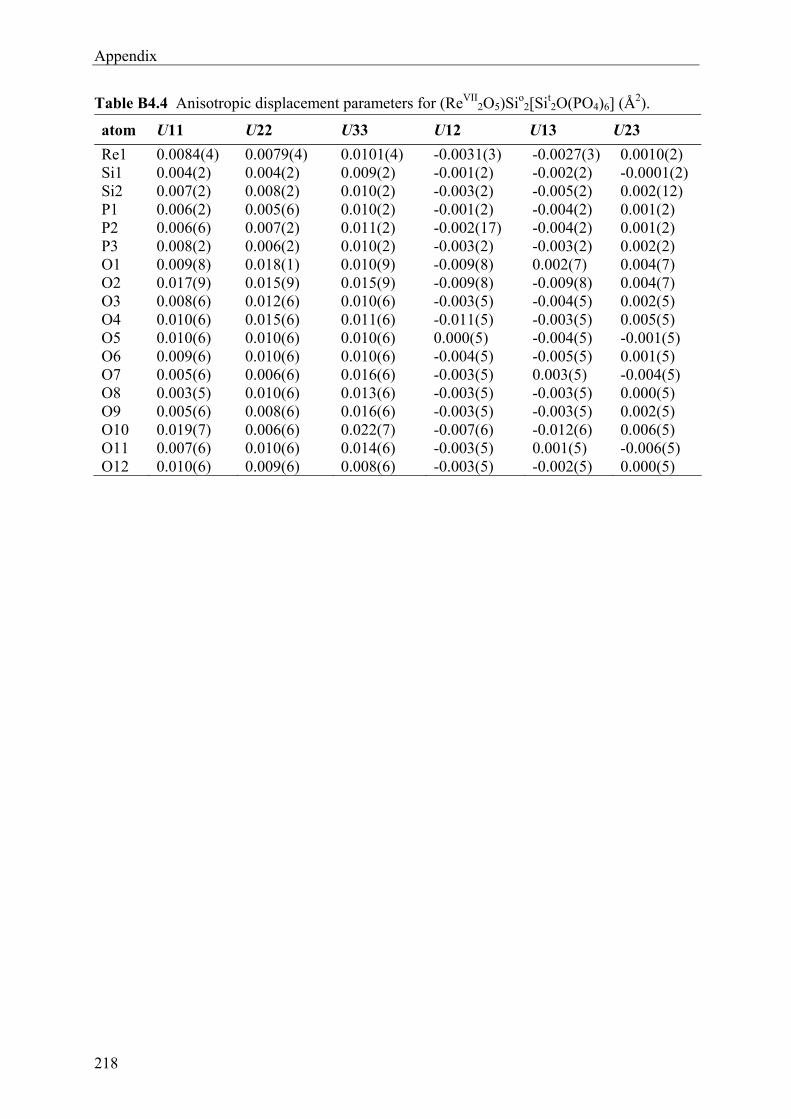
Appendix
218
Table B4.4 Anisotropic displacement parameters for (ReVII2O5)Sio
2[Sit2O(PO4)6] (Å
2).
atom U11 U22 U33 U12 U13 U23
Re1 0.0084(4) 0.0079(4) 0.0101(4) -0.0031(3) -0.0027(3) 0.0010(2) Si1 0.004(2) 0.004(2) 0.009(2) -0.001(2) -0.002(2) -0.0001(2) Si2 0.007(2) 0.008(2) 0.010(2) -0.003(2) -0.005(2) 0.002(12) P1 0.006(2) 0.005(6) 0.010(2) -0.001(2) -0.004(2) 0.001(2) P2 0.006(6) 0.007(2) 0.011(2) -0.002(17) -0.004(2) 0.001(2) P3 0.008(2) 0.006(2) 0.010(2) -0.003(2) -0.003(2) 0.002(2) O1 0.009(8) 0.018(1) 0.010(9) -0.009(8) 0.002(7) 0.004(7) O2 0.017(9) 0.015(9) 0.015(9) -0.009(8) -0.009(8) 0.004(7) O3 0.008(6) 0.012(6) 0.010(6) -0.003(5) -0.004(5) 0.002(5) O4 0.010(6) 0.015(6) 0.011(6) -0.011(5) -0.003(5) 0.005(5) O5 0.010(6) 0.010(6) 0.010(6) 0.000(5) -0.004(5) -0.001(5) O6 0.009(6) 0.010(6) 0.010(6) -0.004(5) -0.005(5) 0.001(5) O7 0.005(6) 0.006(6) 0.016(6) -0.003(5) 0.003(5) -0.004(5) O8 0.003(5) 0.010(6) 0.013(6) -0.003(5) -0.003(5) 0.000(5) O9 0.005(6) 0.008(6) 0.016(6) -0.003(5) -0.003(5) 0.002(5) O10 0.019(7) 0.006(6) 0.022(7) -0.007(6) -0.012(6) 0.006(5) O11 0.007(6) 0.010(6) 0.014(6) -0.003(5) 0.001(5) -0.006(5) O12 0.010(6) 0.009(6) 0.008(6) -0.003(5) -0.002(5) 0.000(5)
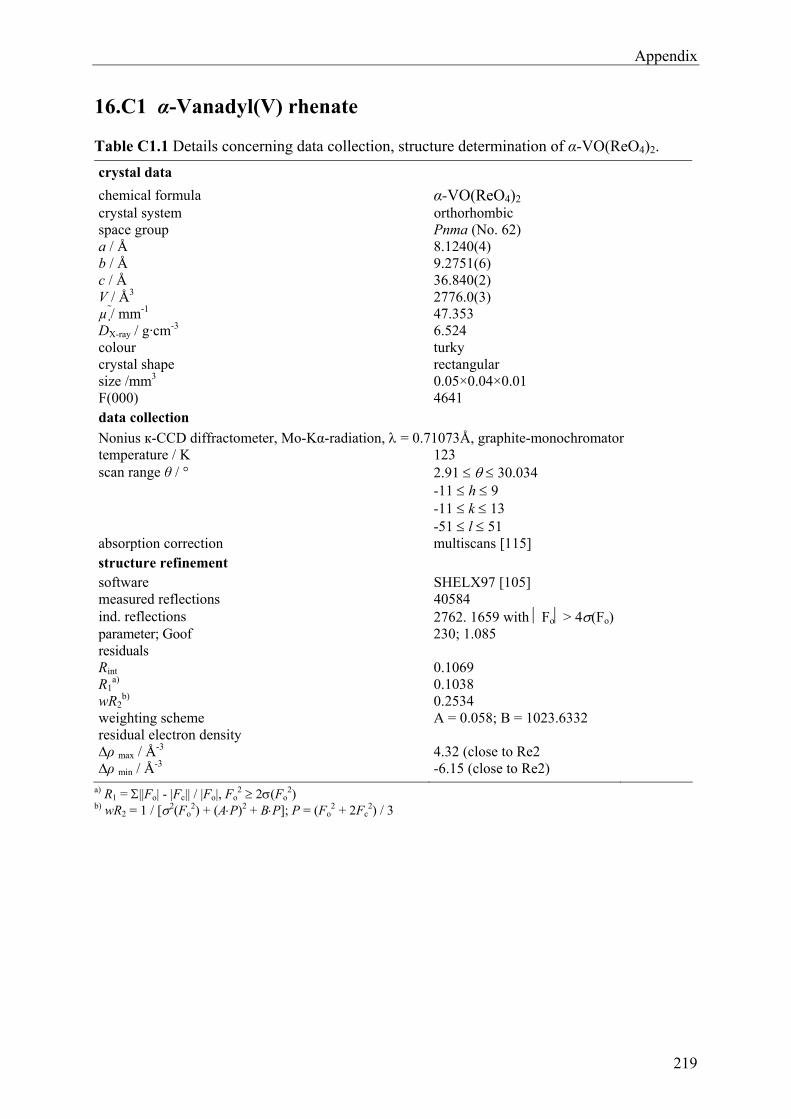
Appendix
219
16.C1 α-Vanadyl(V) rhenate
Table C1.1 Details concerning data collection, structure determination of α-VO(ReO4)2.
crystal data
chemical formula α-VO(ReO4)2 crystal system orthorhombic space group Pnma (No. 62) a / Å b / Å c / Å
8.1240(4) 9.2751(6) 36.840(2)
V / Å3 2776.0(3) µ / mm-1 47.353 DX-ray / g·cm-3 6.524 colour turky crystal shape size /mm3
rectangular 0.05×0.04×0.01
F(000) 4641 data collection
Nonius к-CCD diffractometer, Mo-Kα-radiation, = 0.71073Å, graphite-monochromator temperature / K 123 scan range θ / ° 2.91 30.034
-11 h 9 -11 k 13 -51 l 51
absorption correction multiscans [115] structure refinement software SHELX97 [105] measured reflections 40584 ind. reflections 2762. 1659 with Fo> 4(Fo) parameter; Goof 230; 1.085 residuals Rint R1
a) wR2
b)
0.1069 0.1038 0.2534
weighting scheme A = 0.058; B = 1023.6332 residual electron density ∆ρ max / Å
-3 ∆ρ min / Å
-3
4.32 (close to Re2 -6.15 (close to Re2)
a) R1 = ||Fo| - |Fc|| / |Fo|, Fo2 2(Fo
2) b) wR2 = 1 / [2(Fo
2) + (AP)2 + BP]; P = (Fo2 + 2Fc
2) / 3
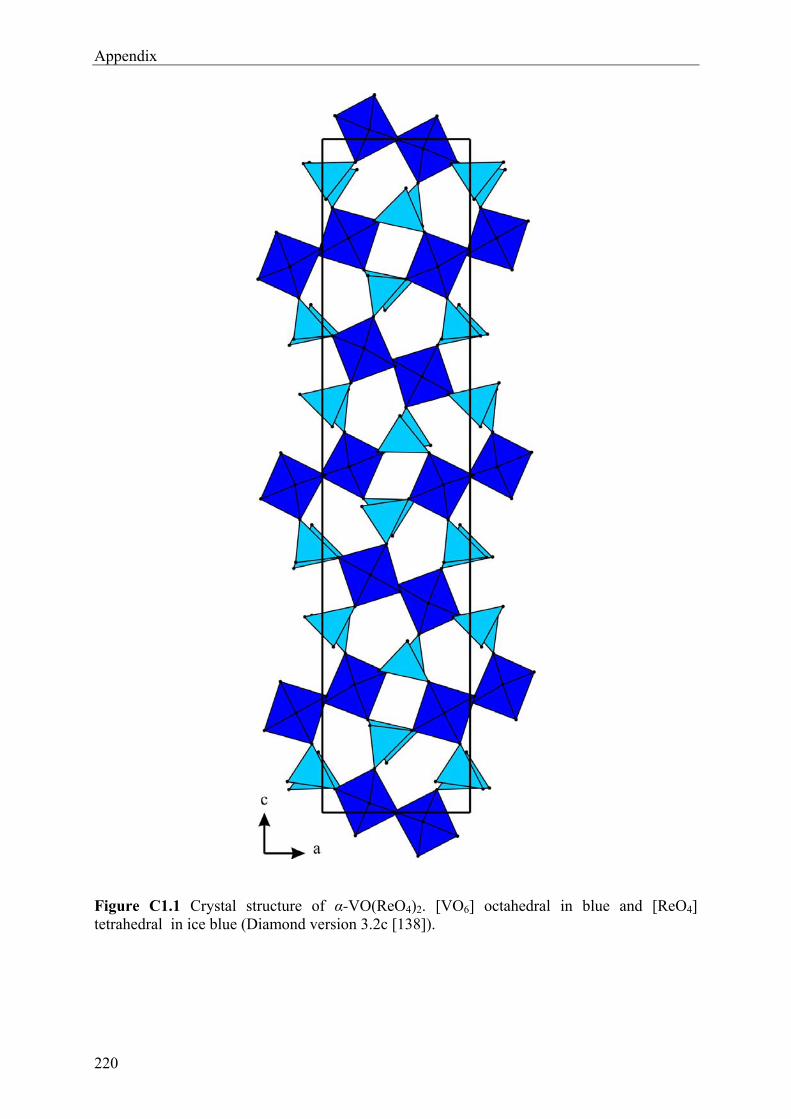
Appendix
220
Figure C1.1 Crystal structure of α-VO(ReO4)2. [VO6] octahedral in blue and [ReO4] tetrahedral in ice blue (Diamond version 3.2c [138]).
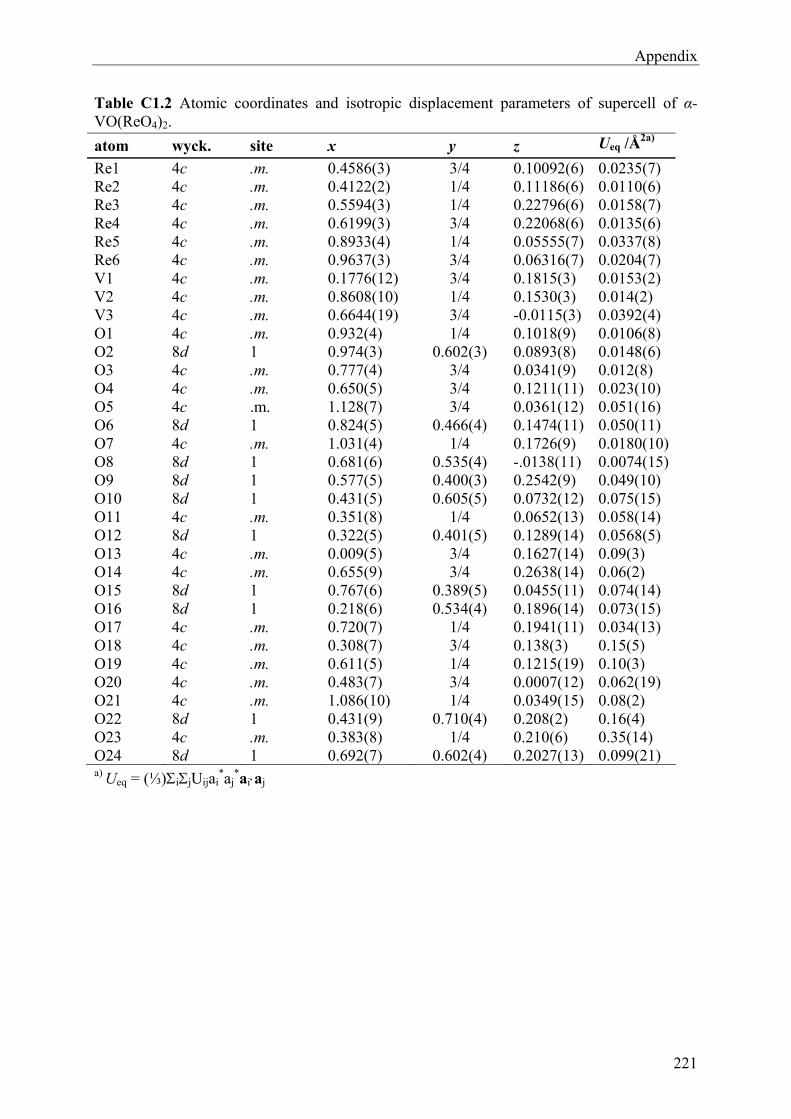
Appendix
221
Table C1.2 Atomic coordinates and isotropic displacement parameters of supercell of α- VO(ReO4)2.
atom wyck. site x y z Ueq /Å2a)
Re1 4c .m. 0.4586(3) 3/4 0.10092(6) 0.0235(7) Re2 4c .m. 0.4122(2) 1/4 0.11186(6) 0.0110(6) Re3 4c .m. 0.5594(3) 1/4 0.22796(6) 0.0158(7) Re4 4c .m. 0.6199(3) 3/4 0.22068(6) 0.0135(6) Re5 4c .m. 0.8933(4) 1/4 0.05555(7) 0.0337(8) Re6 4c .m. 0.9637(3) 3/4 0.06316(7) 0.0204(7) V1 4c .m. 0.1776(12) 3/4 0.1815(3) 0.0153(2) V2 4c .m. 0.8608(10) 1/4 0.1530(3) 0.014(2) V3 4c .m. 0.6644(19) 3/4 -0.0115(3) 0.0392(4) O1 4c .m. 0.932(4) 1/4 0.1018(9) 0.0106(8) O2 8d 1 0.974(3) 0.602(3) 0.0893(8) 0.0148(6) O3 4c .m. 0.777(4) 3/4 0.0341(9) 0.012(8) O4 4c .m. 0.650(5) 3/4 0.1211(11) 0.023(10) O5 4c .m. 1.128(7) 3/4 0.0361(12) 0.051(16) O6 8d 1 0.824(5) 0.466(4) 0.1474(11) 0.050(11) O7 4c .m. 1.031(4) 1/4 0.1726(9) 0.0180(10)O8 8d 1 0.681(6) 0.535(4) -.0138(11) 0.0074(15)O9 8d 1 0.577(5) 0.400(3) 0.2542(9) 0.049(10) O10 8d 1 0.431(5) 0.605(5) 0.0732(12) 0.075(15) O11 4c .m. 0.351(8) 1/4 0.0652(13) 0.058(14) O12 8d 1 0.322(5) 0.401(5) 0.1289(14) 0.0568(5) O13 4c .m. 0.009(5) 3/4 0.1627(14) 0.09(3) O14 4c .m. 0.655(9) 3/4 0.2638(14) 0.06(2) O15 8d 1 0.767(6) 0.389(5) 0.0455(11) 0.074(14) O16 8d 1 0.218(6) 0.534(4) 0.1896(14) 0.073(15) O17 4c .m. 0.720(7) 1/4 0.1941(11) 0.034(13) O18 4c .m. 0.308(7) 3/4 0.138(3) 0.15(5) O19 4c .m. 0.611(5) 1/4 0.1215(19) 0.10(3) O20 4c .m. 0.483(7) 3/4 0.0007(12) 0.062(19) O21 4c .m. 1.086(10) 1/4 0.0349(15) 0.08(2) O22 8d 1 0.431(9) 0.710(4) 0.208(2) 0.16(4) O23 4c .m. 0.383(8) 1/4 0.210(6) 0.35(14) O24 8d 1 0.692(7) 0.602(4) 0.2027(13) 0.099(21) a) Ueq = (⅓)ijUijai
*aj*aiaj
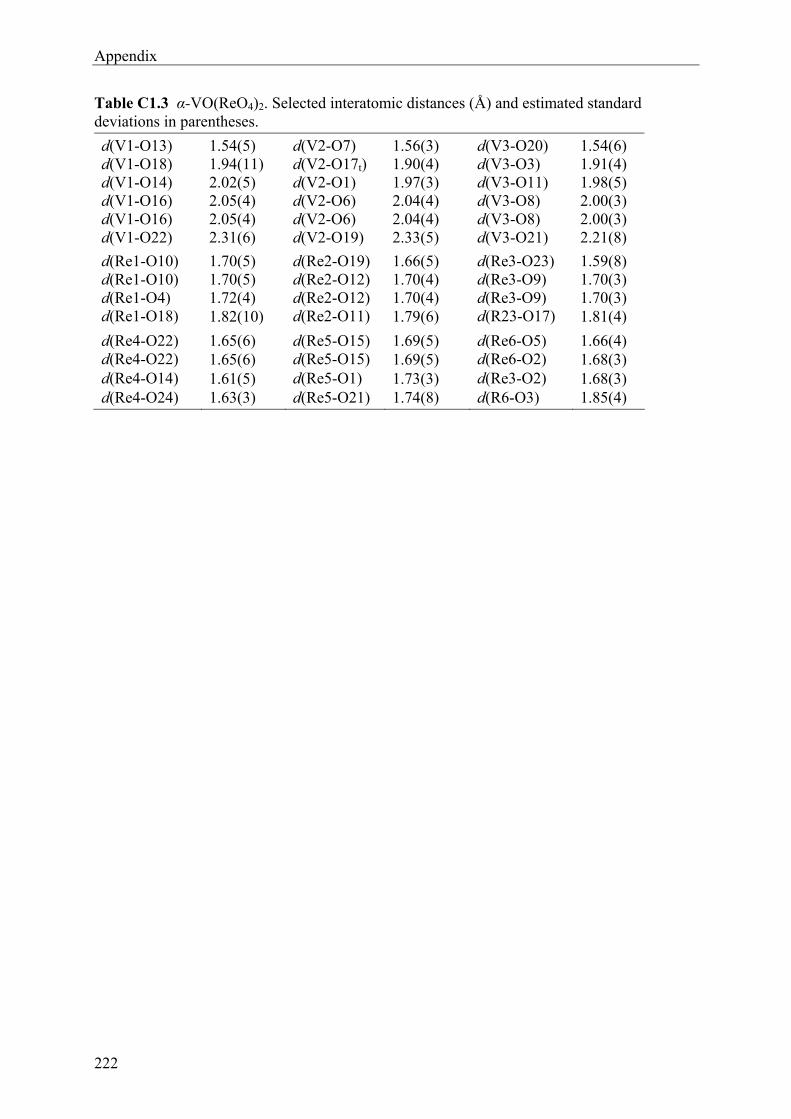
Appendix
222
Table C1.3 α-VO(ReO4)2. Selected interatomic distances (Å) and estimated standard deviations in parentheses.
d(V1-O13) 1.54(5) d(V2-O7) 1.56(3) d(V3-O20) 1.54(6) d(V1-O18) 1.94(11) d(V2-O17t) 1.90(4) d(V3-O3) 1.91(4) d(V1-O14) 2.02(5) d(V2-O1) 1.97(3) d(V3-O11) 1.98(5) d(V1-O16) 2.05(4) d(V2-O6) 2.04(4) d(V3-O8) 2.00(3) d(V1-O16) 2.05(4) d(V2-O6) 2.04(4) d(V3-O8) 2.00(3) d(V1-O22) 2.31(6) d(V2-O19) 2.33(5) d(V3-O21) 2.21(8)
d(Re1-O10) 1.70(5) d(Re2-O19) 1.66(5) d(Re3-O23) 1.59(8) d(Re1-O10) 1.70(5) d(Re2-O12) 1.70(4) d(Re3-O9) 1.70(3) d(Re1-O4) 1.72(4) d(Re2-O12) 1.70(4) d(Re3-O9) 1.70(3) d(Re1-O18) 1.82(10) d(Re2-O11) 1.79(6) d(R23-O17) 1.81(4)
d(Re4-O22) 1.65(6) d(Re5-O15) 1.69(5) d(Re6-O5) 1.66(4) d(Re4-O22) 1.65(6) d(Re5-O15) 1.69(5) d(Re6-O2) 1.68(3) d(Re4-O14) 1.61(5) d(Re5-O1) 1.73(3) d(Re3-O2) 1.68(3) d(Re4-O24) 1.63(3) d(Re5-O21) 1.74(8) d(R6-O3) 1.85(4)
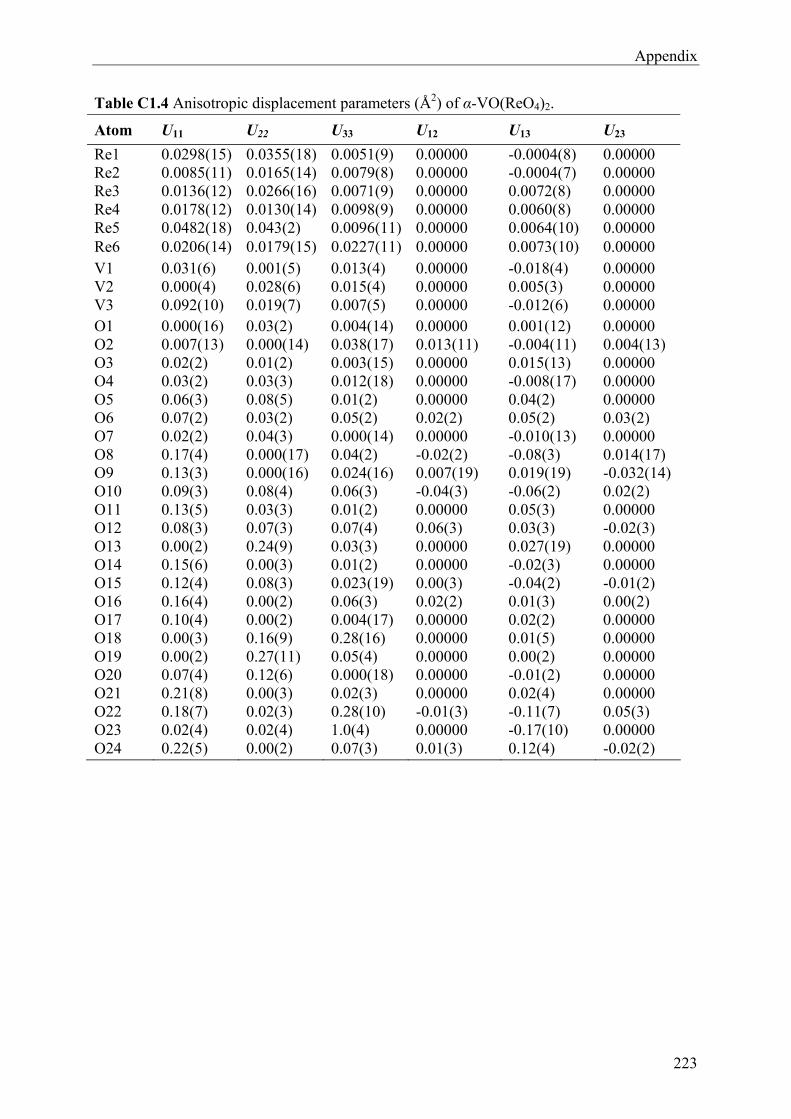
Appendix
223
Table C1.4 Anisotropic displacement parameters (Å2) of α-VO(ReO4)2.
Atom U11 U22 U33 U12 U13 U23
Re1 0.0298(15) 0.0355(18) 0.0051(9) 0.00000 -0.0004(8) 0.00000 Re2 0.0085(11) 0.0165(14) 0.0079(8) 0.00000 -0.0004(7) 0.00000 Re3 0.0136(12) 0.0266(16) 0.0071(9) 0.00000 0.0072(8) 0.00000 Re4 0.0178(12) 0.0130(14) 0.0098(9) 0.00000 0.0060(8) 0.00000 Re5 0.0482(18) 0.043(2) 0.0096(11) 0.00000 0.0064(10) 0.00000 Re6 0.0206(14) 0.0179(15) 0.0227(11) 0.00000 0.0073(10) 0.00000 V1 0.031(6) 0.001(5) 0.013(4) 0.00000 -0.018(4) 0.00000 V2 0.000(4) 0.028(6) 0.015(4) 0.00000 0.005(3) 0.00000 V3 0.092(10) 0.019(7) 0.007(5) 0.00000 -0.012(6) 0.00000 O1 0.000(16) 0.03(2) 0.004(14) 0.00000 0.001(12) 0.00000 O2 0.007(13) 0.000(14) 0.038(17) 0.013(11) -0.004(11) 0.004(13) O3 0.02(2) 0.01(2) 0.003(15) 0.00000 0.015(13) 0.00000 O4 0.03(2) 0.03(3) 0.012(18) 0.00000 -0.008(17) 0.00000 O5 0.06(3) 0.08(5) 0.01(2) 0.00000 0.04(2) 0.00000 O6 0.07(2) 0.03(2) 0.05(2) 0.02(2) 0.05(2) 0.03(2) O7 0.02(2) 0.04(3) 0.000(14) 0.00000 -0.010(13) 0.00000 O8 0.17(4) 0.000(17) 0.04(2) -0.02(2) -0.08(3) 0.014(17) O9 0.13(3) 0.000(16) 0.024(16) 0.007(19) 0.019(19) -0.032(14) O10 0.09(3) 0.08(4) 0.06(3) -0.04(3) -0.06(2) 0.02(2) O11 0.13(5) 0.03(3) 0.01(2) 0.00000 0.05(3) 0.00000 O12 0.08(3) 0.07(3) 0.07(4) 0.06(3) 0.03(3) -0.02(3) O13 0.00(2) 0.24(9) 0.03(3) 0.00000 0.027(19) 0.00000 O14 0.15(6) 0.00(3) 0.01(2) 0.00000 -0.02(3) 0.00000 O15 0.12(4) 0.08(3) 0.023(19) 0.00(3) -0.04(2) -0.01(2) O16 0.16(4) 0.00(2) 0.06(3) 0.02(2) 0.01(3) 0.00(2) O17 0.10(4) 0.00(2) 0.004(17) 0.00000 0.02(2) 0.00000 O18 0.00(3) 0.16(9) 0.28(16) 0.00000 0.01(5) 0.00000 O19 0.00(2) 0.27(11) 0.05(4) 0.00000 0.00(2) 0.00000 O20 0.07(4) 0.12(6) 0.000(18) 0.00000 -0.01(2) 0.00000 O21 0.21(8) 0.00(3) 0.02(3) 0.00000 0.02(4) 0.00000 O22 0.18(7) 0.02(3) 0.28(10) -0.01(3) -0.11(7) 0.05(3) O23 0.02(4) 0.02(4) 1.0(4) 0.00000 -0.17(10) 0.00000 O24 0.22(5) 0.00(2) 0.07(3) 0.01(3) 0.12(4) -0.02(2)
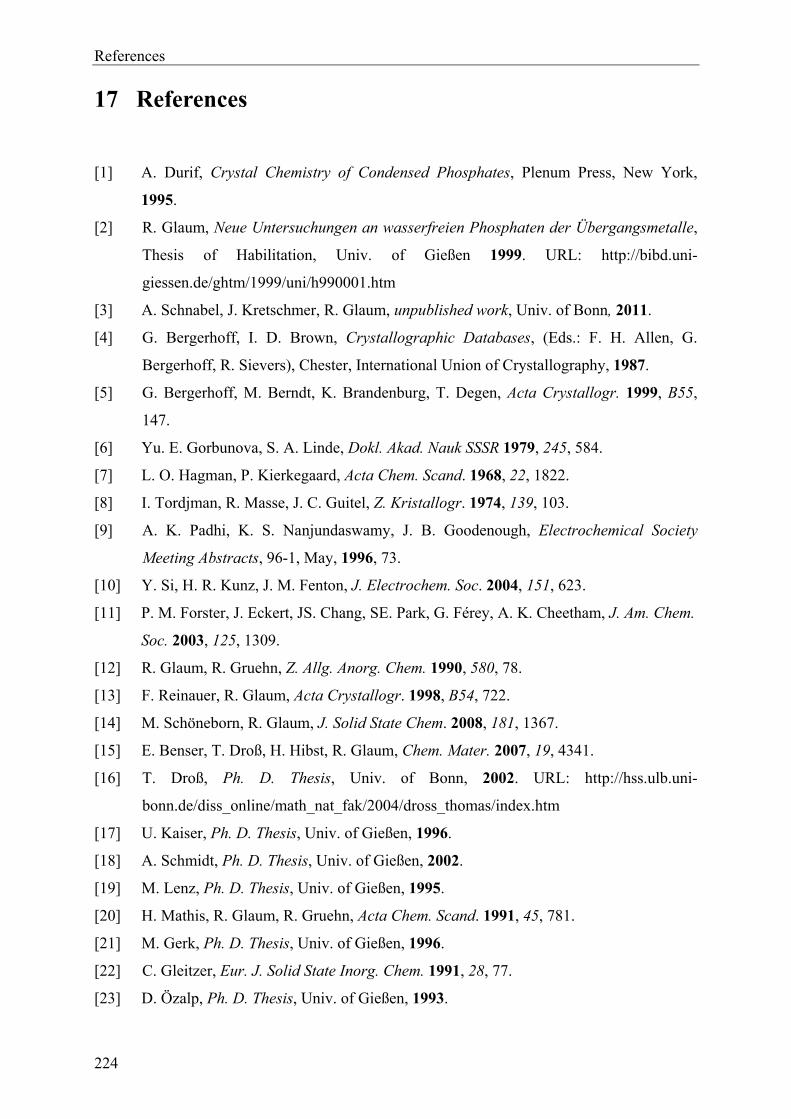
References
224
17 References
[1] A. Durif, Crystal Chemistry of Condensed Phosphates, Plenum Press, New York,
1995.
[2] R. Glaum, Neue Untersuchungen an wasserfreien Phosphaten der Übergangsmetalle,
Thesis of Habilitation, Univ. of Gießen 1999. URL: http://bibd.uni-
giessen.de/ghtm/1999/uni/h990001.htm
[3] A. Schnabel, J. Kretschmer, R. Glaum, unpublished work, Univ. of Bonn, 2011.
[4] G. Bergerhoff, I. D. Brown, Crystallographic Databases, (Eds.: F. H. Allen, G.
Bergerhoff, R. Sievers), Chester, International Union of Crystallography, 1987.
[5] G. Bergerhoff, M. Berndt, K. Brandenburg, T. Degen, Acta Crystallogr. 1999, B55,
147.
[6] Yu. E. Gorbunova, S. A. Linde, Dokl. Akad. Nauk SSSR 1979, 245, 584.
[7] L. O. Hagman, P. Kierkegaard, Acta Chem. Scand. 1968, 22, 1822.
[8] I. Tordjman, R. Masse, J. C. Guitel, Z. Kristallogr. 1974, 139, 103.
[9] A. K. Padhi, K. S. Nanjundaswamy, J. B. Goodenough, Electrochemical Society
Meeting Abstracts, 96-1, May, 1996, 73.
[10] Y. Si, H. R. Kunz, J. M. Fenton, J. Electrochem. Soc. 2004, 151, 623.
[11] P. M. Forster, J. Eckert, JS. Chang, SE. Park, G. Férey, A. K. Cheetham, J. Am. Chem.
Soc. 2003, 125, 1309.
[12] R. Glaum, R. Gruehn, Z. Allg. Anorg. Chem. 1990, 580, 78.
[13] F. Reinauer, R. Glaum, Acta Crystallogr. 1998, B54, 722.
[14] M. Schöneborn, R. Glaum, J. Solid State Chem. 2008, 181, 1367.
[15] E. Benser, T. Droß, H. Hibst, R. Glaum, Chem. Mater. 2007, 19, 4341.
[16] T. Droß, Ph. D. Thesis, Univ. of Bonn, 2002. URL: http://hss.ulb.uni-
bonn.de/diss_online/math_nat_fak/2004/dross_thomas/index.htm
[17] U. Kaiser, Ph. D. Thesis, Univ. of Gießen, 1996.
[18] A. Schmidt, Ph. D. Thesis, Univ. of Gießen, 2002.
[19] M. Lenz, Ph. D. Thesis, Univ. of Gießen, 1995.
[20] H. Mathis, R. Glaum, R. Gruehn, Acta Chem. Scand. 1991, 45, 781.
[21] M. Gerk, Ph. D. Thesis, Univ. of Gießen, 1996.
[22] C. Gleitzer, Eur. J. Solid State Inorg. Chem. 1991, 28, 77.
[23] D. Özalp, Ph. D. Thesis, Univ. of Gießen, 1993.
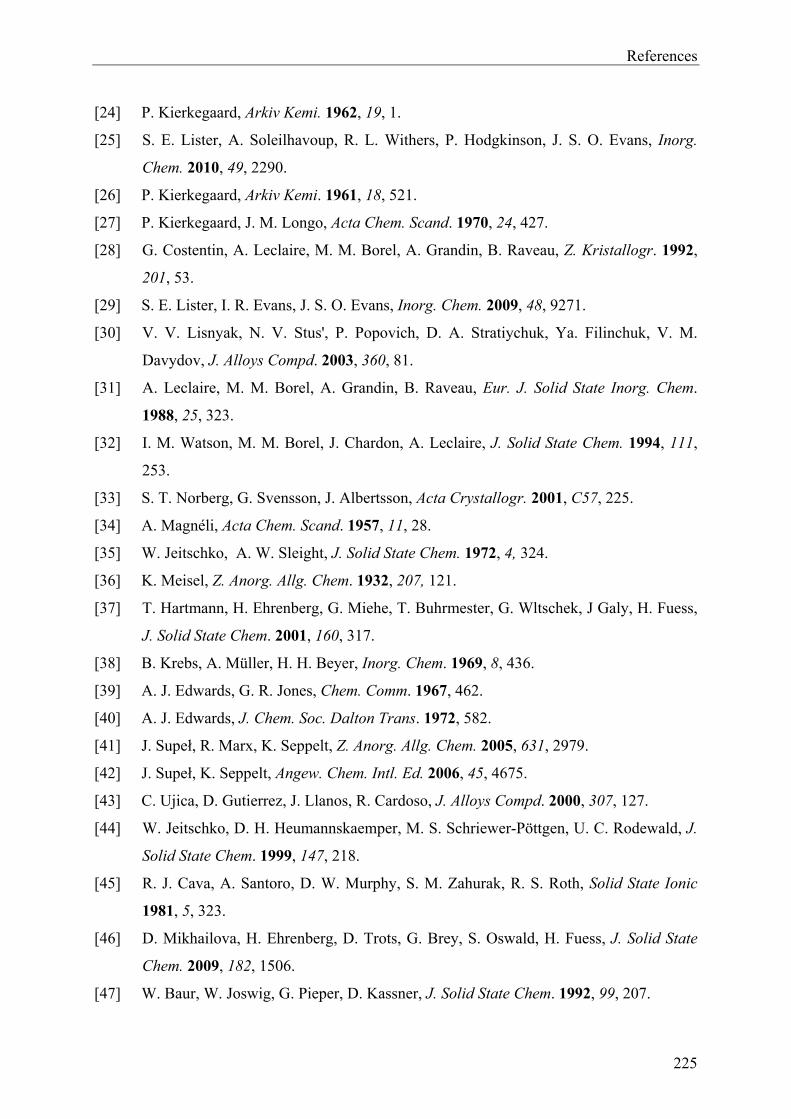
References
225
[24] P. Kierkegaard, Arkiv Kemi. 1962, 19, 1.
[25] S. E. Lister, A. Soleilhavoup, R. L. Withers, P. Hodgkinson, J. S. O. Evans, Inorg.
Chem. 2010, 49, 2290.
[26] P. Kierkegaard, Arkiv Kemi. 1961, 18, 521.
[27] P. Kierkegaard, J. M. Longo, Acta Chem. Scand. 1970, 24, 427.
[28] G. Costentin, A. Leclaire, M. M. Borel, A. Grandin, B. Raveau, Z. Kristallogr. 1992,
201, 53.
[29] S. E. Lister, I. R. Evans, J. S. O. Evans, Inorg. Chem. 2009, 48, 9271.
[30] V. V. Lisnyak, N. V. Stus', P. Popovich, D. A. Stratiychuk, Ya. Filinchuk, V. M.
Davydov, J. Alloys Compd. 2003, 360, 81.
[31] A. Leclaire, M. M. Borel, A. Grandin, B. Raveau, Eur. J. Solid State Inorg. Chem.
1988, 25, 323.
[32] I. M. Watson, M. M. Borel, J. Chardon, A. Leclaire, J. Solid State Chem. 1994, 111,
253.
[33] S. T. Norberg, G. Svensson, J. Albertsson, Acta Crystallogr. 2001, C57, 225.
[34] A. Magnéli, Acta Chem. Scand. 1957, 11, 28.
[35] W. Jeitschko, A. W. Sleight, J. Solid State Chem. 1972, 4, 324.
[36] K. Meisel, Z. Anorg. Allg. Chem. 1932, 207, 121.
[37] T. Hartmann, H. Ehrenberg, G. Miehe, T. Buhrmester, G. Wltschek, J Galy, H. Fuess,
J. Solid State Chem. 2001, 160, 317.
[38] B. Krebs, A. Müller, H. H. Beyer, Inorg. Chem. 1969, 8, 436.
[39] A. J. Edwards, G. R. Jones, Chem. Comm. 1967, 462.
[40] A. J. Edwards, J. Chem. Soc. Dalton Trans. 1972, 582.
[41] J. Supeł, R. Marx, K. Seppelt, Z. Anorg. Allg. Chem. 2005, 631, 2979.
[42] J. Supeł, K. Seppelt, Angew. Chem. Intl. Ed. 2006, 45, 4675.
[43] C. Ujica, D. Gutierrez, J. Llanos, R. Cardoso, J. Alloys Compd. 2000, 307, 127.
[44] W. Jeitschko, D. H. Heumannskaemper, M. S. Schriewer-Pöttgen, U. C. Rodewald, J.
Solid State Chem. 1999, 147, 218.
[45] R. J. Cava, A. Santoro, D. W. Murphy, S. M. Zahurak, R. S. Roth, Solid State Ionic
1981, 5, 323.
[46] D. Mikhailova, H. Ehrenberg, D. Trots, G. Brey, S. Oswald, H. Fuess, J. Solid State
Chem. 2009, 182, 1506.
[47] W. Baur, W. Joswig, G. Pieper, D. Kassner, J. Solid State Chem. 1992, 99, 207.
References
226
[48] A. R. P. Smith, A. K. Cheetham, J. Solid State Chem. 1979, 30, 345.
[49] M. Wakeshima, Y. Hinatsu, J. Solid State Chem. 2006, 179, 3575.
[50] R. J. Cava, A. Santoro, D. W. Murphy, S. M. Zahurak, R. S. Roth, J. Solid State
Chem. 1982, 42, 251.
[51] P. C. Donohue, J. M. Longo, R. D. Rosenstein, L. Katz, Inorg. Chem. 1965, 4, 1152.
[52] K. G. Bramnik, H. Ehrenberg, S. Buhre, H. Fuess, Acta Crystallogr. 2005, B61, 246.
[53] A. K. Cheetham, D. M. Thomas, J. Solid State Chem. 1987, 71, 61.
[54] G. J. Kruger, E. C. Reynhardt, Acta Crystallogr. 1978, B34, 259.
[55] T. Betz, R. Hoppe, Z. Anorg. Allg. Chem. 1983, 500, 23.
[56] A. Atzesdorfer, K. J. Range, Z. Naturforsch. 1995, B50, 1417.
[57] B. Krebs, K. Hasse, Acta Crystallogr. 1976, 32, 1334.
[58] P. Roegner, K. J. Range, Z. Naturforsch. 1993, B48, 233.
[59] P. Roegner, K. J. Range, Z. Naturforsch. 1993, B48, 685.
[60] D. Mikhailova, H. Ehrenberg, H. Fuess, J. Solid State Chem. 2006, 179, 2004.
[61] J. Beintema, Z. Kristallogr. 1937, 97, 300.
[62] D. Yu. Naumov, A. V. Virovets, S. V. Korenev, A. I. Gubanov, Acta Crystallogr.
1999, C55, 1.
[63] A. Butz, G. Miehe, H. Paulus, P. Strauss, H. Fuess, J. Solid State Chem. 1998, 138,
232.
[64] J. P. Picard, G. Baud, J. P. Besse, R. Chevalier, M. Gasperin, J. Less-Comm. Met.
1984, 96, 171.
[65] H. A. Mons, M. S. Schriewer, W. Jeitschko, J. Solid State Chem. 1992, 99, 149.
[66] G. Baud, J. Besse, R. Chevalier, M. Gasperin, J. Solid State Chem. 1979, 29, 267.
[67] W. Jeitschko, D. H. Heumannskaemper, U. C. Rodewald, M. S. Schriewer-Pöttgen, Z.
Anorg. Allg. Chem. 2000, 626, 80.
[68] J. P. Besse, M. Bolte, G. Baud, R. Chevalier, Acta Crystallogr. 1976, B32, 3045.
[69] C. Mujica, K. Peters, E. M. Peters, H. G. Z. Schnering, Z. Kristallogr. 2000, 215, 3.
[70] W. Freundlich, M.-R. Lee, C. R. Acad. Sci. Paris 1967, 264, 704.
[71] B. Bastide, R. Enjalbert, H. Fuess, J. Galy, Solid State Sci. 2000, 2, 545.
[72] I. Schulz, Z. Allg. Anorg. Chem. 1955, 281, 99.
[73] P. Kierkegaard, Acta Chem. Scand. 1960, 14, 657.
[74] P. Kierkegaard, S. Asbrink, Acta Chem. Scand. 1964, 18, 2329.
[75] M. Hanawa, H. Imoto, J. Solid State Chem. 1999, 144, 325.
References
227
[76] P. Kierkegaard, Acta Chem. Scand. 1958, 12, 1715.
[77] S. L. Wang, C. C. Wang, K. H. Lii, J. Solid State Chem. 1989, 82, 298.
[78] A. Leclaire, J. Chardon, B. Raveau, J. Solid State Chem. 2000, 155, 112.
[79] V. V. Lisnyak, N. V. Stus', N. S. Slobodyanik, N. M. Belyavina, V. Ya. Markiv,
J. Alloys Compd. 2000, 309, 83.
[80] P. Roussel, P. Labbé, D. Groult, Acta Crystallogr. 2000, B56, 317.
[81] E. Banks, R. Sacks, Mater. Res. Bull. 1982, 17, 1053.
[82] K. Popa, V. Brandel, A. Cecal, Rev. Roumaine de Chem. 2001, 46, 509.
[83] V. V. Lisnyak, N. V. Stus, D. A. Stratiichuk, N. M. Belyavina, V. Ya. Markiv,
Phosphorus, Sulfur Silicon Relat. Elem. 2008, 183, 2248.
[84] H. Schäfer, Z. Anorg. Allg. Chem. 1973, 400, 253.
[85] H. Schäfer, Chemische Transportreaktionen, Verlag Chemie, Weinheim, 1962.
[86] P. W. Atkins, Physikalische Chemie, 3. Auflage, Spektrum Akademischer Verlag,
1993.
[87] I. Müller, A History of Thermodynamics - the Doctrine of Energy and Entropy,
Springer-Verlag, 2007.
[88] G. Schmidt, R. Gruehn, J. Crystal Growth. 1982, 57, 585.
[89] W. H. Bragg, W. L. Bragg. Proc. Royal Soc. (London), 1913, A88, 428.
[90] Y. Amemiya, J. Miyahara, Nature 1988, 336, 89.
[91] Programm AIDA: Advanced Image Data Analyser (AIDA). Version 2,2, Raytest-
Isotopenmeßgeräte GmbH, 1999.
[92] Origin 6.1G, OriginLab Corporation, 1991 – 2000.
[93] ICSD-Database FIZ/NIST; Fachinformationszentrum Karlsruhe, National Institute of
Standards and Technology, Geithersburg, USA, Vers. 1.4.4, 2008.
[94] K. Yvon, W. Jeitschko, E. Parté, J. Appl. Crystallogr. 1977, 10, 73.
[95] G. Meyer, J. Soose: „SOS-Programme zur Auswertung von Guinier-Aufnahmen“,
Staatsexamensarbeit, Univ. of Gießen, 1980.
[96] P. E. Werner, Z. Kristallogr. 1964, 120, 375.
[97] P. E. Werner, L. Eriksson, M. Westdahl, J. Appl. Cryst. 1985, 18, 367.
[98] A. Boutlif, D. Louěr, J. Appl. Cryst. 1991, 24, 987.
[99] J. Visser, J. Appl. Cryst. 1966, 2, 89.
References
228
[100] J. R. Carvajal, T. Roisnel: „FullProf98 and WinPLOTR: New Windows 95/NT
Applications for Diffraction, Commission For Powder Diffraction”, International
Union for Crystallography, Newsletter N°20, 1998.
[101] P. M. de Wolf, J. Appl. Cryst. 1957, 10, 590.
[102] W. Massa, Kristallstrukturbestimmung, 3. Auflage, Teubner Verlag, 2002.
[103] G. M. Sheldrick: “SHELXS-97: Program for Crystal Structure Solution”, Univ. of
Göttingen, 1997.
[104] L. Palatinus and G. Chapuis, J. Appl. Cryst. 2007, 40, 786.
[105] G. M. Sheldrick, SHELXl-97-A Program for crystal structure refinement, Univ. of
Goettingen, 1997.
[106] A. L. Patterson, Phys. Rev. 1934, 46, 372.
[107] A. L. Patterson, Z. Kristallogr. 1935, A90, 517.
[108] D. Sayre, Acta Crystallogr. 1952, 5, 60.
[109] H. Hauptman, J. Acta Crystallogr. 1950, 3, 181.
[110] J. Karlé, H. Hauptmann, Acta Crystallogr. 1952, 10, 267”.
[111] G. Oszla´nyi, A. Su¨to, Acta Cryst. 2004, A60, 134.
[112] L. Palatinus, Acta Cryst. 2004, A60, 604.
[113] J. Karle, H. Hauptman, Acta Crystallogr. 1956, 9, 635.
[114] L. Palatinus and G. Chapuis, J. Appl. Cryst. 2007, 40, 786.
[115] R. H. Blessing, Acta Crystallogr. 1995, A51, 33.
[116] L. Reimer, Scanning Electron Microscop, Springer-Verlag, Berlin, 1983.
[117] D. Newbury, Advanced Scanning Electron Microscopy and X-ray Microanalysis,
Plenum Press, New York, 1987.
[118] Bedienungsanleitung, PVSUPQ (EDAX-Analysensystem), Philips, Eindhoven,
Netherland, 1986.
[119] E. R. Andrew, E. Szczesniak, Prog. Nucl. Magn. Reson. Spectrosc. 1995, 28, 11.
[120] B. Wrackmeyer, Chem. unserer Zeit, 1988, 22, 100.
[121] E. Krausz, Aust. J. Chem. 1993, 46, 1041.
[122] E. Krausz, AOS news 1998, 12, 21.
[123] J. Weidlein, U. Müller, K. Dehnike, Schwingungsspektroskopie, 2. überarbeitete
Auflage, Georg Thieme Verlag, Stuttgart, 1988.
References
229
[124] K. Nakamoto, Infrared and Raman Spectra of Inorganic and Coordination Com-
pounds, Third Edition, Wiley Interscience, John Wiley & Sons, New York, USA,
1978.
[125] H. Oppermann, Z. Anorg. Allg. Chem. 1985, 523, 135.
[126] M. Binnewies, R. Glaum, M. Schmidt, P. Schmidt, Chemische Transportreaktionen,
2011.
[127] G. R. Levi, G. Peyronel, Z. Kristallogr. Kristallgeom. Kristallphys. Kristallchem.
1935, 92, 190.
[128] R. C. Haushalter, L. A. Mundi, Chem. Mater. 1992, 4, 31.
[129] S. E. Lister, V. J. Rixom, J. S. O. Evans, Chem. Mater. 2010, 22, 5279.
[130] R. Gopal, C. Calvo, J. Solid State Chem. 1972, 5, 432.
[131] H. Schäfer, J. Cryst. Growth 1971, 9, 17.
[132] H. Oppermann, Z. Allg. Anorg. Chem. 1971, 383, 285.
[133] D. W. Muenow, O. M. Uy, J. L. Margrave, J. Inorg. Nucl. Chem. 1970, 32, 3459.
[134] R, Gruehn, R. Glaum, Angew. Chem. 2000, 112, 706; Angew. Chem. Intl. Ed. 2000,
39, 692.
[135] L. J. Farrugia, J. Appl. Cryst. 1990, 70, 837.
(136) R. Hundt, “KPLOT”, Version 9.0, Univ. of Bonn, 2005.
[137] G. M. sheldrick, Acta Crystallogr. 1990, A46, 467.
[138] K. Brandenburg, DIAMOND - Crystal and Molecular Structure Visualization.
Crystal Impact, GbR, Bonn, Vers. 3.2c, 2009.
[139] G. W. Stinton, M. R. Hampson, J. S. O. Evans, Inorg. Chem. 2006, 45, 4352.
[140] H. Birkedal, A. M. K. Andersen, A. Arakcheeva, G. Chapuis, P. Norby, P. Pattison,
Inorg. Chem. 2006, 45, 4346.
[141] A. Guesdon, A. Leclaire, M. M. Borel, A. Grandin, B. Raveau, Acta Crystallogr.
1994, C50, 1852.
[142] A. Guesdon, M. M. Borel, A. Grandin, A. Leclaire, B. Raveau, Acta Crystallogr.
1993, C49, 1877.
[143] J. J. Zah-Letho, S. Oyetola, A. Verbaere, F. Taulelle, Y. Piffard, Eur. J. Solid State
Inorg. Chem. 1994, 31, 1009.
[144] L. Lezama, J. M. Rojo, J. L. Pizarro, M. I. Arriortua, T. Rojo, Solid State Ionics, 1993,
63, 657.
[145] H. B. Gray, C. R. Hare, Inorg. Chem. 1962, 1, 363.
References
230
[146] C. J. Ballhausen, H. B. Gray, Inorg. Chem. 1962, 1, 111.
[147] R. Glaum, W. Hoffbauer, J. Schmidt auf der Grünne, unpublished result, Univ. Bonn.
2005.
[148] H. Schäfer, T. Grofe, M. Trenkel, J. Solid. State Chem. 1973, 8, 14.
[149] E. Milke, M. Binnewies, M. S. Islam, R. Glaum, unpublished results, 2010.
[150] P. Kierkegaard, Arkiv Kemi. 1962, 19, 51.
[151] BASREADER V. 2.26, Program for Windows, Raytest Isotopenmessgeräte GmbH,
Straubenhard/Germany, 1999.
[152] I. Tanaka, M. Yao, M. Suzuki, K. Hikichi, J. Appl. Cryst. 1990, 23, 334.
[153] K. Maaß, R. Glaum, R. Gruehn, Z. Anorg. Allg. Chem. 2002, 628, 1663.
[154] A. F. Christiansen, H. Fjellvag, A. Kjekshus, B. Klewe, J. Chem. Soc., Dalton Trans.
2001, 806.
[155] P. Kierkegaard, Arkiv. Kemi. 1962, 18, 553.
[156] F. A. Cotton, S. M. Morehouse, J. S. Wood, Inorg. Chem. 1964, 3, 1603.
[157] C. Sanchez, J. Livage, J. P. Launay, M. Fournier, Y. Jeannin, J. Am. Chem. Soc. 1982,
104, 3194.
[158] J. M. Fruchart, G. Herve, J. P. Launay, R. Massart, J. Inorg. Nucl. Chem. 1976, 38,
127.
[159] P. Kierkegaard, Arkiv. Kemi. 1962, 19, 4.
[160] R. Rühl, U. Flörke, W. Jeitschko, J. Solid State Chem. 1984, 53, 55.
[161] S. V. Orishchin, V. S. Babizhet'sky, Yu. B. Kuz'ma, Neorg. Mater. 1998, 34, 1455.
[162] R. Rühl, W. Jeitschko, Z. Anorg. Allg. Chem. 1980, 466, 171.
[163] R. Rühl, W. Jeitschko, Inorg. Chem. 1982, 21, 1886.
[164] R. Rühl, W. Jeitschko, Acta Crystallogr. 1982, B38, 2784.
[165] W. Jeitschko, R. Ruehl, Acta Crystallogr. 1979, B35, 1953.
[166] F. A. Cotton, G. Wilkinson, Advanced Inorganic Chemistry, Intersceince, New York,
1980.
[167] W. L. Hill, G. Faust, S. B. Hendricks, J. Am. Chem. Soc. 1943, 65, 794.
[168] J. R. van Wazer, Phosphorus and its compounds, Interscience, New York, 1988.
[169] B. D. sharma, Inorg. Chem. 1987, 26, 454.
[170] M. Jansen, M. Möbs, Inorg. Chem. 1984, 23, 4486.
[171] M. Jansen, M. Voss, Angew. Chem. 1981, 93.120.
[172] K. H. Jost, Acta Crystallogr. 1966, 21, 34.
References
231
[173] K. H. Jost, Acta Crystallogr. 1964, 17, 1593.
[174] E. Tillmanns, W. Gebert, W. H. Baur, J. Solid State Chem. 1973, 7, 69.
[175] N. Khosrovani, V. C. Korthuis, A.W. Sleight, T. Vogt, Inorg. Chem. 1996, 35, 485.
[176] K. M. White, P. L. Lee, P. J. Chupas, K. W. Chapman, E. A. Payzant, Chem. Mater.
2008, 20, 3728.
[177] A. Cabeza, M. A. G. Aranda, F. M. Cantero, D. Lozano, M. Martinez-Lara, S. Bruque,
J. Solid State Chem. 1996, 121, 181.
[178] C. H. Huang, O. Knop, D. A. Othen, F. W. D. Woodhams, R. A. Howie, Canad. J.
Chem. 1975, 53, 79.
[179] A. Burdese, M. L. Borlera, Ricerca Scientifica, 1960, 30, 1343.
[180] S. T. Norberg, G. Svensson, J. Albertsson, Acta Crystallogr. 2001, C57, 225.
[181] D. M. Poojary, R. B. Borade, F. L. Campbell, A. Clearfield, J. Solid State Chem.
1994, 112, 106.
[182] K. F. Hesse, Acta Crystallogr. 1979, B35, 724.
[183] U. Kaiser, R. Glaum, Z. Anorg. Allg. Chem. 1994, 620, 1755.
[184] B. Wellmann, F. Liebau, J. Less-Common Met. 1981, 77, 31.
[185] J. C. Eisenstein, J. Chem. Phys. 1961, 34, 1628.
[186] Chr. K, Jørgensen, Z. Naturforsch. 1965, 20a, 65.
[187] P. B. Dorain, R, G. Wheeler, J. Chem. Phys. 1966, 45, 1172.
[188] A. R. Reinberg, S. G. Parker, Phys. Rev. 1970, B1, 2085.
[189] J. C. Collingwood, S. B. Piepho, R. W. Schwartz, P. A. Dobosh, J. R. Dickinson, P.
N. Schatz, Molec. Phys. 1975, 29, 793.
[190] D. R. Gamelin, H. U. Güdel, Inorg. Chem. 1999, 38, 5154.
[191] N. Khosrovani, A. W. Sleight, T. Vogt, J. Solid State Chem. 1997, 132, 355.
[192] C. Turquat, C. Muller, E. Nigrelli, C. Leroux, J. L. Soubeyroux, G. Nihoul, Eur. Phys.
J. Appl. Phys. 2000, 10, 15.
[193] S. Mondet, A. Rimsky, J. Borene, W. Freundlich, Comptes rendus, Serie C, 1968, 266,
1145.
[194] A. Aatiq, M. Menetrier, L. Croguennec, E. Suard, C. Delmas, J. Mater. Chem. 2002,
12, 2971.
[195] Yu. A. Ivanov, E. L. Belokoneva, Yu. K. Egorov-Tismenko, N. V. Simonov, Dokl.
Akad. Nauk SSSR 1980, 252, 1122.
[196] E. S. Lunezheva, B. A. Maksimov, O. K. Mel'nikov, Kristallografiya 1989, 34, 1119.
References
232
[197] R. Duhlev, Acta Crystallogr. 1994, C50, 1525.
[198] R. M. Hazen, D. C. Palmer, L. W. Finger, G. D. Stucky, W. T. A. Harrison, T. E. Gier,
J. Phys. Condens. Matter. 1994, 6, 1333.
[199] E. M. McCarron, J. C. Calabrese, M. A. Subramanian, Mater. Res. Bull. 1987, 22,
1421.
[200] M. Alami, R. Brochu, J. L.Soubeyroux, G. le Flem Gravereau, P. Hagenmuller, J.
Solid State Chem. 1991, 90, 185.
[201] R. Brochu, M. Louer, M. Alami, M. Alqaraoui, D. Louer, Mater. Res. Bull. 1997, 32,
113.
[202] M. P. Carrasco, M. C. Guillem, J. Alamo, Mater. Res. Bull. 1993, 28, 793.
[203] D. Petit, P. Colomban, G. Collin, J. P. Boilot, Mater. Res. Bull. 1986, 21, 365.
[204] H. Kohler, H. Schulz, Mater. Res. Bull. 1986, 21, 23.
[205] E. R. Gobechiya, Yu. K. Kabalov, V. I. Pet'kov, M. V. Sukhanov, Kristallografiya
2004, 49(N), 829.
[206] I. Bussereau, M. S. Belkhiria, P. Gravereau, A. Boireau, J. L. Soubeyroux, R.
Olazcuaga, G. Le. Flem, Acta Crystallogr. 1992, C48, 1741.
[207] A. Leclaire, M. M. Borel, A. Grandin, B. Raveau, Acta Crystallogr. 1989, C45, 699.
[208] K.-H. Lii, J. J. Chen, S. -L. Wang, J. Solid State Chem. 1989, 78, 93.
[209] J. Alamo, J. L. Rodrigo, Mater. Res. Bull. 1992, 27, 1091.
[210] A. Serghini, R. Brochu, R. Olazcuaga, P. Gravereau, Mater. Lett. 1995, 22, 149.
[211] E. R. Gobechiya, Yu. K. Kabalov, S. V. Tomilin, A. N. Lukinykh, A. A. Lizin, A. I.
Orlova, Crystallogr. Rep. 2005, 50, 374.
[212] J. Galy, G. Miehe, Solid State Sci. 1999, 1, 433.
[213] F. Chen, Q. Shen, J. M. Schoenung, L. Zhang, J. Am. Ceram. Soc. 2008, 91, 3173.
[214] M. Schöneborn, Ph. D. Thesis, University of Bonn, 2008. URL:http://hss.ulb.uni-
bonn.de/diss_online/math_nat_fak/2008/schoeneborn_marcos/index.htm
[215] K. Panagiotidis , R. Glaum, W. Hoffbauer, J. Weber, J. Schmedt auf der Günne, Z.
Anorg. Allg. Chem. 2008, 634, 2922.
[216] A. Kostencki, Ph. D. thesis, Univ. of Gießen, 1997.
[217] A. N. Lazarev, V. S. Aksel’rod, Opt. Spektrosk, 1960, 9, 360.
[218] C. H. Huang, O. Knop, D. A. Othen, F. W. D. Woodhams, R. A. Howie, Can. J.
Chem. 1975, 53, 79.
[219] L. O. Hagman, P. Kierkegaard, Acta Chem. Scand. 1968, 22, 1822.
References
233
[220] M. Schöneborn, R. Glaum, Z. Anorg. Allg. Chem. 2008, 634, 1843.
[221] G. Amonoff, Z. Kristallogr. 1923, 58, 203.
(222) H. Mayer, Monatsh. Chem. 1974, 46, 105.
[223] H. Mayer, H. Voellenkle, Monatsh. Chem. 1972, 103, 1560.
[224] F. Liebau, Acta. Cryst. 1961, 14, 1103.
[225] A. F. Reid, C. Li, A. E. Ringwood, J. Solid State Chem. 1977, 20, 219.
[226] W. H. Zachariasen, Z. Kristallogr. 1930, 73, 1.
[227] M. Schöneborn, W. Hoffbauer, J. Schmedt auf der Günne, R. Glaum, Z. Naturforsch.
2006, 61b, 741.
[228] K. G. Bramnik, H. Ehrenberg, R. Teissmann, H. Fuess, E. Morán, Z. Kristallogr.
2003, 218, 455.
[229] D. S. McClure, Solid State Phys. 1959, 9, 399.
[230] R. K. Yoo, S. C. Lee, B. A. Kozikowski, T. A. Keiderling, Chem. Phys. 1987, 117,
237.
[231] C. K. Jørgensen, R. Pappalardo, H. H. Schmidtke, J. Chem. Phys. 1963, 39, 1422.
[232] D. E. Richardson, J. Chem. Educ. 1993, 70, 372.
[233] B. N. Figgis, M. A. Hitchman, Ligand Field Theory and Its Applications, Wiley-VCH,
New York, 2000.
[234] R. Glaum, M. Hitchman, Aust. J. Chem. 1996, 49, 1221.
[235] M. Gerloch, Cam. Univ. Press, 1983.
[236] D. Reinen, M. Atanasov, S. L. Lee, Coord. Chem. Rev. 1998, 175, 91.
[237] H. Thauern, R. Galum, Inorg. Chem. 2007, 46, 2057.
[238] J. M. Longo, P. Kierkegaard, Acta Chem. Scand. 1966, 20, 72.
[239] T. G. Amos, A. Yokochi, A. W. Sleight, J. Solid State Chem. 1998, 141, 303.
[240] U. Kaiser, G. Schmidt, R. Glaum, R. Gruehn, Z. Anor. Allg. Chem. 1992, 607, 13.
[241] D. L. Serra, S. -J. Hwu, Acta Crystallogr. 1992, C48, 733.
[242] T. G. Amos, A. W. Sleight, J. Solid State Chem. 2001, 160, 230.
[243] V. P. Nicolaev, G. G. Sadikov, A. V. Lavrov, M. A. Porai-Koshits, Izv. Akad. Nauk
SSSR, Neorg. Mater. 1986, 22, 1364.
[244] J. J. Zah-Letho, A. Jouanneaux, A. N. Fitch, A.Verbaere, M. Tournoux, Eur. J Solid
State Inorg. Chem. 1992, 29, 1309.
[245] J. J. Zah-Letho, A. Verbaere, A. Jouanneaux, F. Taulelle, Y. Piffard, M. Tournoux, J.
Solid State Chem. 1995, 116, 335.
References
234
[246] R. S. Roth, A. D. Wadsley, S. Andersson, Acta Crystallogr. 1965, 18, 643.
[247] M. Tachez, F. Theobald, E. Bordes, J. Solid State Chem. 1981, 40, 280.
[248] B. Jordan, C. Calvo, Canad. J. Chem. 1973, 51, 2621.
[249] E. Bordes, P. Courtine, J. Chem. Soc. Chem. Commun. 1985, 294.
[250] S. C. Lim, J. T. Vaughey, W. T. A. Harrison, L. L. Dussac, A. J. Jacobson, J. W.
Johnson, Solid State Ionics 1996, 84, 219.
[251] F. Girgsdies, T. Ressler, R. Schlögl, W.-S. Dong, K. K. Bartley, G. J. Hutchings, Solid
State Sci. 2006, 8, 807.
[252] P. Amorosόs, M. D. Marcos, M. Roca, J. Alamo, A. Beltrán- Porter, D. Beltrán-
Porter, J. Phys. Chem. Solids 2001, 62, 1393.
[253] J. M. Longo, J. W. Pierce, J. A. Kafalas, Mater. Res. Bull. 1971, 6, 1157.
[254] H. Chahboun, D. Groult, M. Hervieu, B. Raveau, J. Solid State Chem. 1986, 65, 331.
[255] M. Goreaud, P. H. Labbe, B. Raveau, J. Solid State Chem. 1985, 56, 41.
[256] H. L. Cuthbert, J. E. Greedan, L. Cranswick, J. Solid State Chem. 2006, 179, 1938.
[257] E. V. Murashova, N. N. Chudinova, Kristallografiya 1994, 39, 145.
[258] S. N. Achary, S. J. Patwe, A. K. Tyagi, J. Alloys Compd. 2008, 461, 474.
[259] E. Dowty, ATOMS for Windows. V.6.3, Shape Software, Kingsport, 2007.
[260] R. Ya. Mel'nikova, V. V. Pechkovskii, E. D. Dzyuba, I. E. Malashonok, Atlas of
Infrared Spectra of Phosphates, Academy of Science SSSR, Moskow, 1985.
[261] M. Ishi, T. Tanaka, T. Akahane, N. Tsuda, J. Phys. Soc. Jpn. 1976, 41, 908.
[262] B. Krebs, A. Müller, Z. Naturforsch. 1968, 23b, 415.
[263] A. Leclaire, M. M. Borel, J. Chardon, B. Raveau, J. Solid State Chem. 1997, 128, 191.
[264] G. Andersson, A. Magneli, Acta Chem. Scand. 1950, 4, 793.
[265] E. Salje, Acta Crystallogr. 1977, B33, 574.
[266] A. J. Edwards, B. R. Steventon, J. Chem. Soc. 1968, A1968, 2503.
[267] J. C. Taylor, A. B. Waugh, J. Chem. Soc. Dalton Trans. 1980, 1980, 2006.
[268] A. J. Edwards, G. R. Jones, J. Chem. Soc. 1968, A1968, 2074.
[269] H. Hess, H. Hartung, Z. Anorg. Allg. Chem. 1966, 344, 157.
[270] W. Klemm, Magnetochemie, Akademische Verlagsgesellschaft, Leipzig, 1936.
[271] W. Klemm, Z. Anorg. Allg. Chem. 1941, 246, 347.
[272] A. Weiss, H. Witte, Magnetochemie, Verlag Chemie, Weinheim, 1973.
[273] Hk. Müller-Buschbaum, Z. Anorg. Allg. Chem. 2007, 633, 2491.
[274] A. R. Middleton, A. F. Masters, G. Wilkinson, J. Chem. Soc. Dalton trans. 1979, 542.
References
235
[275] R. Glaum, R. Gruehn, Z. Kristallogr. 1992, 198, 41.
[276] R. Glaum, R. Gruehn, Z. Kristallogr. 1989, 186, 91.
[277] R. Glaum, A. Schmidt, Z. Anorg. Allg. Chem. 1997, 623, 1672.
[278] E. Hammer, R. Glaum, W. Hermes, R. Pöttgen, Z. Anorg. Allg. Chem. 2011,
submitted.
[279] R. Glaum, M. Walter-Peter, D. Özalp, R. Gruehn, Z. Anorg. Allg. Chem. 1991, 601,
145.
[280] L. Palatinus, M. Dusek, R. Glaum, B. El Bali, Acta Crystallogr. 2006, B62, 556.
[281] M. S. Islam, R. Glaum, Z. Anorg. Allg. Chem. 2009, 635, 1008.
[282] M. S. Islam, R. Glaum, Z. Anorg. Allg. Chem. 2010, 636, 144.
[283] H. Lux, Z. Elektrochem. 1939, 45, 303.
[284] H. Flood, T. Förland, Acta Chem. Scand. 1947, 1, 592.
[285] S. Stølen, T. Grande, Chemical Thermodynamics of Materials - Macroscopic and
Microscopic Aspects, John Wiley & Sons Ltd, Chichester 2004.
[286] W. T. Smith, L. E. Line, W. A. Bell, J. Am. Chem. Soc. 1952, 74, 4964.
[287] O. S. Glemser, A. Müller, H. Schwarzkopf, Z. Allg. Anorg. Chem. 1964, 334, 21.
[288] I. Barin, Thermochemical Data of Pure Substances, 2nd ed., Verlag Chemie,
Weinheim 1992.
[289] H. Schäfer, V. P. Orlovskii, M. Wiemeyer, Z. Anorg. Allg. Chem. 1972, 390, 13.
[290] O. Knacke, O. Kubaschewski, K. Hesselmann, Thermochemical Properties of
Inorganic Substances, Springer, Berlin 1991.
[291] H. P. A. Mercier, G. J. Schrobilgen, Inorg. Chem. 1993, 32, 145.
[292] J. Supel, U. Abram, A. Hagenbach, K. Seppelt, Inorg. Chem. 2007, 46, 5591.
[293] R. Bougon, B. Buu, K. Seppelt, Chem. Ber. 1993, 126, 1331.
[294] K. Panagiotidis, R. Glaum, W. Hoffbauer, J. Weber, J. Schmedt auf der Günne, Z.
Anorg. Allg. Chem, 2008, 634, 2922.
[295] G. L. Turner, K. A. Smith, R. J. Kirkpatrick, E. Oldfield, J. Magn. Reson. 1986, 70,
408.
[296] S. Hayashi, K. Hayamizu, Bull. Chem. Soc. Jpn. 1989, 62, 3061.
[297] C. Lejeune, C. Coelho, L. Bonhhomme-Coury, T. AzÏs, J. Maquet, C. Bonhhomme,
Solid State Nucl. Magn. Reson. 2005, 27, 242.
[298] C. Coelho, T. Azaïs, L. Bonhomme-Coury, G. Laurent, C. Bonhomme, Inorg. Chem.
2007, 46, 1379.

References
236
[299] M. S. Ram, J. T. Hupp, Inorg. Chem. 1991, 30, 130.
[300] I. R. Beattie, T. R. Gilson, P. J. Jones, Inorg. Chem. 1996, 35, 1301.
[301] R. Schlögl in N. Mizuno (ed.), Modern Oxidation Catalysis, Wiley-VCH, Weinheim,
2009.
The present work has been carried out within Jun. 2007 to Sept. 2011 in the Institute of
Inorganic Chemistry in Rheinische Friedrich-Wilhelms-Universität Bonn under the
supervision of Prof. Dr. Robert Glaum.
My deepest gratitude is to my Supervisor, Prof. Dr. Robert Glaum. I have been amazingly
fortunate to have an advisor who gave me the freedom to explore on my own, and at the same
time the guidance to recover when my steps faltered. Prof. Glaum taught me how to question
thoughts and express ideas. His insightful comments and constructive criticisms at different
stages of my research were thought-provoking and they helped me focus my idea. His
patience and support helped me overcome many crisis situations and finish this dissertation.
I am profoundly grateful to German Academic Exchange Service (DAAD) for my PhD
scholarship. I am indebted to Deutsche Forschungsgemeinschaft (DFG) and UMICORE for
the financial support for chemicals.
I would be grateful to Dr. Jörg Daniels, Dipl. Chem. Axel Pelka and Dr. Gregor
Schnakenburg for X-ray single-crystal data collections. I am also thankful to Volker Dittrich
and Markus Stichnote for the single-crystal UV/Vis/NIR data collections. Miss Bärbel Knopp
and Volker Bendisch are thanked for the photographs of the crystals.
My special thanks go to Dr. Reinhard K. Kremer (Max-Planck-Institute Solid state Research,
MPIFKT Stuttgart) and Prof. Rainer Pöttgen (Institut für Anorganische und Analytische
Chemie, Uni Münster) for magnetic measurements.
I would like to thank my ACF students Ina Krieger, Tobias Dahmen and Alexander
Leiendecker for their contributions for the some experiments during their practical periods.
It is a great pleasure for me to thank my former and current colleagues, Dr. Ernst Benser, Dr.
Marcos Schöneborn, Dr. Christian Litterscheid, Dr. Kosta Panagiotidis, Dr. Eva Maria
Hammer, Michael Funke, Sven Titlbach, Emma Mosymow, Katharina Gerber, Subrata
Chandra Roy, Anke Scnabel, Anna Bronova, Tobias Freers and Prof. Dr Aftab Ali Shaikh for
their assistance and cooperation to maintain a nice working environment in the group.
I would like to thank my Master thesis supervisor Prof. Dr. Altaf Hussain (Dept. of
Chemistry, University of Dhaka), my uncle Md. Amir Hossain and unty Mrs. Akhlima
Khanam who have a great contribution to my academic career.
Most importantly, none of this would have been possible without the love and patience of my
parents, wife, brother and sisters. My immediate family to whom this dissertation is dedicated
to, has been a constant source of love, support and strength all these years.
PUBLICATIONS
1 “The First Phosphates of a Heptavalent Metal: Rhenium(VII)-oxidephosphate and Di-Rhenium(VII)-Pentaoxide-Silicon-Silicophosphate.” Saiful M. Islam, Robert Glaum, Axel Pelka, Jörg Daniels, Wilfried Hoffbauer, Inorg. Chem. 2010, submitted.
2 “Rhenium(V)-oxidepyrophosphate Re2O3(P2O7).” Saiful, M. Islam, Robert. Glaum, Z. Anorg. Allg. Chem. 2010, 636, 144.
3 “Rhenium(VI)-oxidephosphate: Chemical Vapour Transport, Crystal Structure, UV/visible Spectrum and Magnetic Behaviour.” Saiful, M. Islam, Robert Glaum, Z. Anorg. Allg. Chem. 2009, 635, 1008.
PRESENTATION (Poster)
1 New Phosphates of Rhenium, European Conference on Solid State Chemistry, 20-23.09.2009. Münster, Germany.
PRESENTATIONS (Oral)
2 New phosphates of Rhenium and Molybdenum, Department of Chemistry, University of Dhaka, Bangladesh, 8.04.2010.
3 Anhydrous Phosphates of Molybdenum and Rhenium, Institute of Inorganic Chemistry, University of Bonn, Germany, 5.02.2009.

I, Muhammad Saiful Islam declare that this research work has been done by myself and no
other outer help was taken. I also ensure that necessary references were given regarding the
compounds as well as scientific discussions.