angel top picks – august 2017web.angelbackoffice.com/research/...angeltoppicks_august2017... ·...
TRANSCRIPT
Please refer to important disclosures at the end of this report 1
Angel Top Picks – August 2017
While the markets have seen 21% returns in CY17, returns in dollar terms are even higher at 29%. We belive that current econmic enviornment is positive for domestic and foreign inflows. The big picture is that global economy is in healthy shape and in anticipation of faster growth, global markets have seen re-rating.
Current economic environment positive for inflows: As expected by the markets, RBI has cut the repo rates by 25bps in the August monetary policy. With the current inflation trajectory and normal rainfall for 2nd consecutive year, we believe there is further scope for RBI to cut the rates; however it also depends upon a few factors out of RBI’s reach. We have already seen saving rates being slashed by 25bps proactively and due to continued pressure on deposit rates, incremental household savings will flow in the equity markets through Mutual funds.
FII’s have continued to pour money: After the record inflow of `31,000cr in March-2017, FII have continued to remain positive on our economy with sustained inflows. While Indian markets are up 21% in the current calendar year, in dollar terms the returns are even better at 29%. The rupee and other major global currencies have continued to strengthen against USD which will help in bringing more inflows in the emerging markets. We believe that liquidity is likely to remain plenty going ahead in the markets. The current quarterly results have also been decent and not showing severe impact of the GST which is also likely to be taken positively by the investors. Also with GDP growth of >7%, FIIs would be willing to invest more in India which also makes India’s case strong to get the inflows.
Improving tax collection to maintain fiscal prudence: The government has set a fiscal deficit target of 3.2% for FY18E which is achievable given the strong tax collection in the current fiscal. The advance tax collection (personal) grew by 42% yoy in August-17 while overall income tax (personal and corporate) grew by 25% yoy. The 25% yoy increase in the tax payers hints at widening of tax base which is a long term positive for our economy as this can boost the public capex.
Valuations high but not expensive – Indian markets are currently valued 23.0x of its FY17 earnings and 18.3x of its 1 year forward earnings. While this valuation is at 7% premium to its 10 year average of 17.2x, it should be noted that major global markets have also seen re-rating. One must look at the big picture globally - the global economy looks in a healthy shape with US economy in nearly full employment stage and GDP growth at ~2%, European economy is also recovering from the crisis period and the same is reflected in 1QCY17 and 2QCY17 GDP growth of 0.5% and 0.6% respectively. While growth in China has stabilized at the rate of above 6%; the manufacturing and service sectors across multiple countries are showing expansion. Overall on the hope of the faster growth, global markets have seen re-rating. Indian economy with stable government, continued reforms and favorable demographics, is likely to see faster growth going ahead and hence valuation at the current rate looks justified to us.
We continue to remain positive on consumption (Maruti Suzuki, Asian Granito Blue Star) and housing theme (Mahindra Lifespace and Dewan Housing). We also remain positive on Karur Vysa Bank, Alkem laboratories, Navkar Corp, KEI Industries and Siyaram Silk Mills. We add Music Broadcast in the portfolio on the back of its attractive business model.
Top Picks Company CMP (`) TP (`)
Banking/NBFC
Dewan Housing 449 550
Karur Vysa Bank 137 160
Consumption
Asian Granito 408 493
Blue Star 683 760
Siyaram Silk Mills 2,024 2,500
Media/Automobiles
Maruti Suzuki 7,756 8,544
Music Broadcast 350 434
TV Today 235 344
Real Estate/Infra/Logistics/Power
KEI Industries 225 258
Mahindra Lifespace 421 522
Navkar Corp. 188 265
Pharma
Alkem Lab. 1,840 2,161
Source: Angel Research; Note: CMP as of August 08, 2017

Top Picks Report | August 2017
August 8, 2017 2
Top Picks
Top Picks Report | August 2017
August 8, 2017 3
Dewan Housing
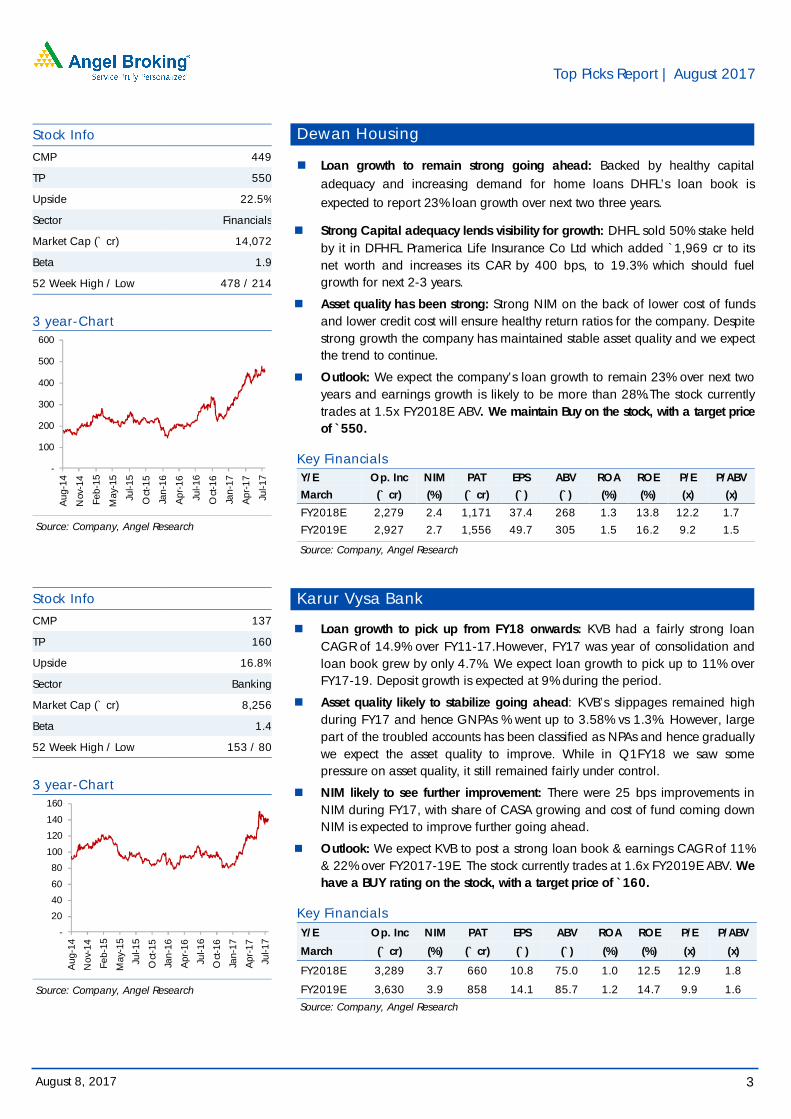
Loan growth to remain strong going ahead: Backed by healthy capital adequacy and increasing demand for home loans DHFL’s loan book is expected to report 23% loan growth over next two three years.
Strong Capital adequacy lends visibility for growth: DHFL sold 50% stake held by it in DFHFL Pramerica Life Insurance Co Ltd which added `1,969 cr to its net worth and increases its CAR by 400 bps, to 19.3% which should fuel growth for next 2-3 years.
Asset quality has been strong: Strong NIM on the back of lower cost of funds and lower credit cost will ensure healthy return ratios for the company. Despite strong growth the company has maintained stable asset quality and we expect the trend to continue.
Outlook: We expect the company’s loan growth to remain 23% over next two years and earnings growth is likely to be more than 28%.The stock currently trades at 1.5x FY2018E ABV. We maintain Buy on the stock, with a target price of `550.
Key Financials Y/E Op. Inc NIM PAT EPS ABV ROA ROE P/E P/ABV
March (` cr) (%) (` cr) (`) (`) (%) (%) (x) (x)
FY2018E 2,279 2.4 1,171 37.4 268 1.3 13.8 12.2 1.7
FY2019E 2,927 2.7 1,556 49.7 305 1.5 16.2 9.2 1.5
Source: Company, Angel Research
Karur Vysa Bank
Loan growth to pick up from FY18 onwards: KVB had a fairly strong loan CAGR of 14.9% over FY11-17.However, FY17 was year of consolidation and loan book grew by only 4.7%. We expect loan growth to pick up to 11% over FY17-19. Deposit growth is expected at 9% during the period.
Asset quality likely to stabilize going ahead: KVB’s slippages remained high during FY17 and hence GNPAs % went up to 3.58% vs 1.3%. However, large part of the troubled accounts has been classified as NPAs and hence gradually we expect the asset quality to improve. While in Q1FY18 we saw some pressure on asset quality, it still remained fairly under control.
NIM likely to see further improvement: There were 25 bps improvements in NIM during FY17, with share of CASA growing and cost of fund coming down NIM is expected to improve further going ahead.
Outlook: We expect KVB to post a strong loan book & earnings CAGR of 11% & 22% over FY2017-19E. The stock currently trades at 1.6x FY2019E ABV. We have a BUY rating on the stock, with a target price of `160.
Key Financials Y/E Op. Inc NIM PAT EPS ABV ROA ROE P/E P/ABV
March (` cr) (%) (` cr) (`) (`) (%) (%) (x) (x)
FY2018E 3,289 3.7 660 10.8 75.0 1.0 12.5 12.9 1.8
FY2019E 3,630 3.9 858 14.1 85.7 1.2 14.7 9.9 1.6
Source: Company, Angel Research
Stock Info
CMP 137
TP 160
Upside 16.8%
Sector Banking
Market Cap (` cr) 8,256
Beta 1.4
52 Week High / Low 153 / 80
3 year-Chart
Source: Company, Angel Research
-
20
40
60
80
100
120
140
160
Aug
-14
Nov
-14
Feb-
15
May
-15
Jul-1
5
Oct
-15
Jan-
16
Apr
-16
Jul-1
6
Oct
-16
Jan-
17
Apr
-17
Jul-1
7
Stock Info
CMP 449
TP 550
Upside 22.5%
Sector Financials
Market Cap (` cr) 14,072
Beta 1.9
52 Week High / Low 478 / 214
3 year-Chart
Source: Company, Angel Research
-
100
200
300
400
500
600
Aug
-14
Nov
-14
Feb-
15
May
-15
Jul-1
5
Oct
-15
Jan-
16
Apr
-16
Jul-1
6
Oct
-16
Jan-
17
Apr
-17
Jul-1
7
Top Picks Report | August 2017
August 8, 2017 4
Asian Granito
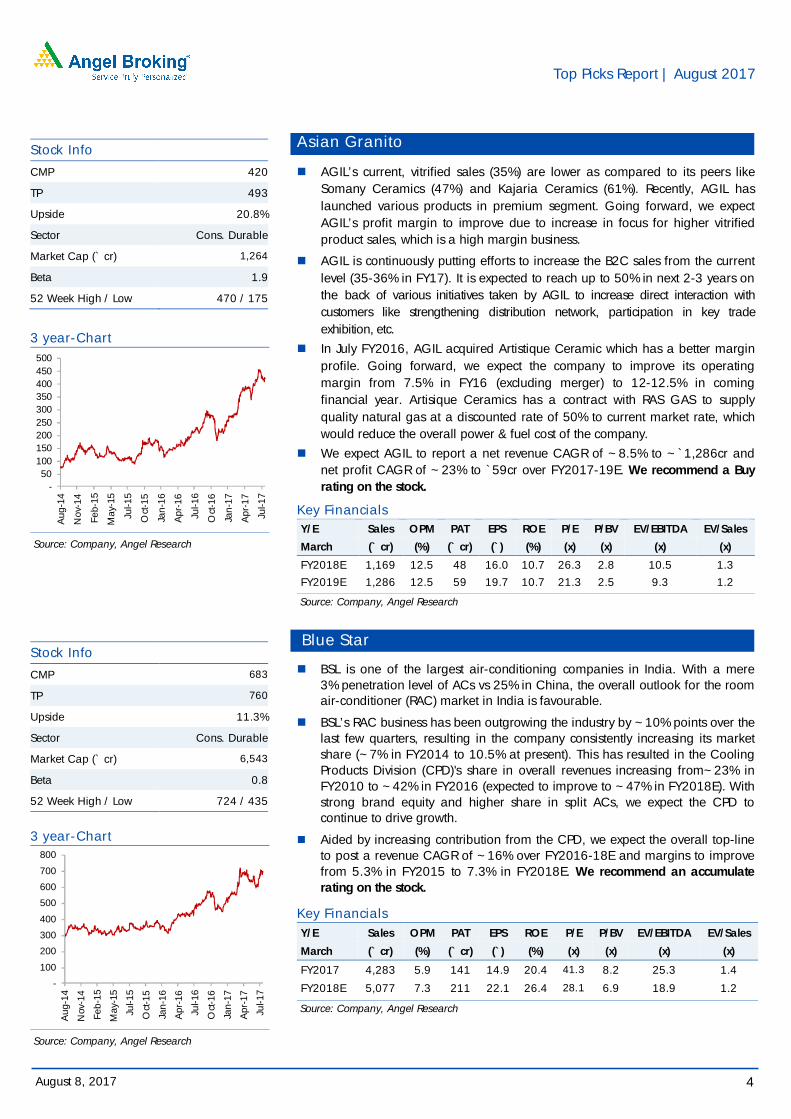
AGIL’s current, vitrified sales (35%) are lower as compared to its peers like Somany Ceramics (47%) and Kajaria Ceramics (61%). Recently, AGIL has launched various products in premium segment. Going forward, we expect AGIL’s profit margin to improve due to increase in focus for higher vitrified product sales, which is a high margin business.
AGIL is continuously putting efforts to increase the B2C sales from the current level (35-36% in FY17). It is expected to reach up to 50% in next 2-3 years on the back of various initiatives taken by AGIL to increase direct interaction with customers like strengthening distribution network, participation in key trade exhibition, etc.
In July FY2016, AGIL acquired Artistique Ceramic which has a better margin profile. Going forward, we expect the company to improve its operating margin from 7.5% in FY16 (excluding merger) to 12-12.5% in coming financial year. Artisique Ceramics has a contract with RAS GAS to supply quality natural gas at a discounted rate of 50% to current market rate, which would reduce the overall power & fuel cost of the company.
We expect AGIL to report a net revenue CAGR of ~8.5% to ~`1,286cr and net profit CAGR of ~23% to `59cr over FY2017-19E. We recommend a Buy rating on the stock.
Key Financials Y/E Sales OPM PAT EPS ROE P/E P/BV EV/EBITDA EV/Sales
March (` cr) (%) (` cr) (`) (%) (x) (x) (x) (x)
FY2018E 1,169 12.5 48 16.0 10.7 26.3 2.8 10.5 1.3
FY2019E 1,286 12.5 59 19.7 10.7 21.3 2.5 9.3 1.2
Source: Company, Angel Research
Blue Star
BSL is one of the largest air-conditioning companies in India. With a mere 3% penetration level of ACs vs 25% in China, the overall outlook for the room air-conditioner (RAC) market in India is favourable.
BSL’s RAC business has been outgrowing the industry by ~10% points over the last few quarters, resulting in the company consistently increasing its market share (~7% in FY2014 to 10.5% at present). This has resulted in the Cooling Products Division (CPD)'s share in overall revenues increasing from~23% in FY2010 to ~42% in FY2016 (expected to improve to ~47% in FY2018E). With strong brand equity and higher share in split ACs, we expect the CPD to continue to drive growth.
Aided by increasing contribution from the CPD, we expect the overall top-line to post a revenue CAGR of ~16% over FY2016-18E and margins to improve from 5.3% in FY2015 to 7.3% in FY2018E. We recommend an accumulate rating on the stock.
Key Financials Y/E Sales OPM PAT EPS ROE P/E P/BV EV/EBITDA EV/Sales
March (` cr) (%) (` cr) (`) (%) (x) (x) (x) (x)
FY2017 4,283 5.9 141 14.9 20.4 41.3 8.2 25.3 1.4
FY2018E 5,077 7.3 211 22.1 26.4 28.1 6.9 18.9 1.2
Source: Company, Angel Research
Stock Info
CMP 683
TP 760
Upside 11.3%
Sector Cons. Durable
Market Cap (` cr) 6,543
Beta 0.8
52 Week High / Low 724 / 435
3 year-Chart
Source: Company, Angel Research
-
100
200
300
400
500
600
700
800
Aug
-14
Nov
-14
Feb-
15
May
-15
Jul-1
5
Oct
-15
Jan-
16
Apr
-16
Jul-1
6
Oct
-16
Jan-
17
Apr
-17
Jul-1
7
Stock Info
CMP 420
TP 493
Upside 20.8%
Sector Cons. Durable
Market Cap (` cr) 1,264
Beta 1.9
52 Week High / Low 470 / 175
3 year-Chart
Source: Company, Angel Research
-50
100150200250300350400450500
Aug
-14
Nov
-14
Feb-
15
May
-15
Jul-1
5
Oct
-15
Jan-
16
Apr
-16
Jul-1
6
Oct
-16
Jan-
17
Apr
-17
Jul-1
7
Top Picks Report | August 2017
August 8, 2017 5
Siyaram Silk Mills
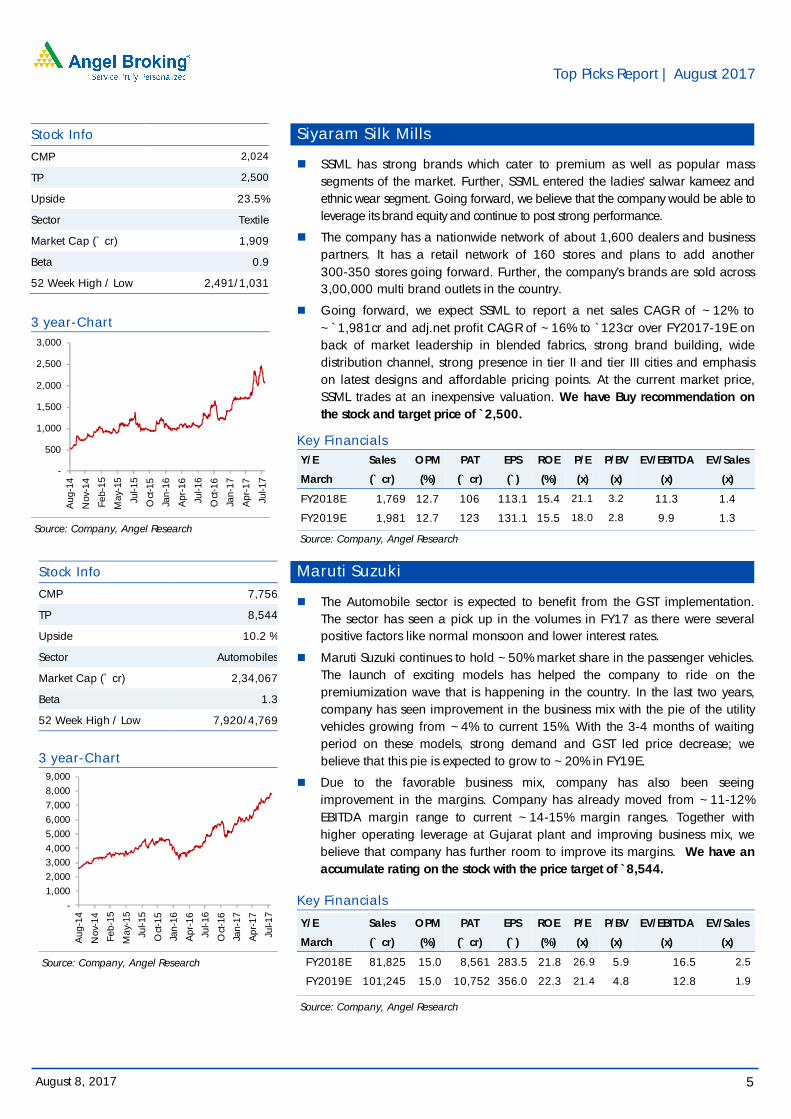
SSML has strong brands which cater to premium as well as popular mass segments of the market. Further, SSML entered the ladies' salwar kameez and ethnic wear segment. Going forward, we believe that the company would be able to leverage its brand equity and continue to post strong performance.
The company has a nationwide network of about 1,600 dealers and business partners. It has a retail network of 160 stores and plans to add another 300-350 stores going forward. Further, the company's brands are sold across 3,00,000 multi brand outlets in the country.
Going forward, we expect SSML to report a net sales CAGR of ~12% to ~`1,981cr and adj.net profit CAGR of ~16% to `123cr over FY2017-19E on back of market leadership in blended fabrics, strong brand building, wide distribution channel, strong presence in tier II and tier III cities and emphasis on latest designs and affordable pricing points. At the current market price, SSML trades at an inexpensive valuation. We have Buy recommendation on the stock and target price of `2,500.
Key Financials Y/E Sales OPM PAT EPS ROE P/E P/BV EV/EBITDA EV/Sales
March (` cr) (%) (` cr) (`) (%) (x) (x) (x) (x)
FY2018E 1,769 12.7 106 113.1 15.4 21.1 3.2 11.3 1.4
FY2019E 1,981 12.7 123 131.1 15.5 18.0 2.8 9.9 1.3
Source: Company, Angel Research
Maruti Suzuki
The Automobile sector is expected to benefit from the GST implementation. The sector has seen a pick up in the volumes in FY17 as there were several positive factors like normal monsoon and lower interest rates.
Maruti Suzuki continues to hold ~50% market share in the passenger vehicles. The launch of exciting models has helped the company to ride on the premiumization wave that is happening in the country. In the last two years, company has seen improvement in the business mix with the pie of the utility vehicles growing from ~4% to current 15%. With the 3-4 months of waiting period on these models, strong demand and GST led price decrease; we believe that this pie is expected to grow to ~20% in FY19E.
Due to the favorable business mix, company has also been seeing improvement in the margins. Company has already moved from ~11-12% EBITDA margin range to current ~14-15% margin ranges. Together with higher operating leverage at Gujarat plant and improving business mix, we believe that company has further room to improve its margins. We have an accumulate rating on the stock with the price target of `8,544.
Key Financials
Y/E Sales OPM PAT EPS ROE P/E P/BV EV/EBITDA EV/Sales
March (` cr) (%) (` cr) (`) (%) (x) (x) (x) (x)
FY2018E 81,825 15.0 8,561 283.5 21.8 26.9 5.9 16.5 2.5
FY2019E 101,245 15.0 10,752 356.0 22.3 21.4 4.8 12.8 1.9
Source: Company, Angel Research
Stock Info
CMP 7,756
TP 8,544
Upside 10.2 %
Sector Automobiles
Market Cap (` cr) 2,34,067
Beta 1.3
52 Week High / Low 7,920/4,769
3 year-Chart
Source: Company, Angel Research
-1,0002,0003,0004,0005,0006,0007,0008,0009,000
Aug
-14
Nov
-14
Feb-
15
May
-15
Jul-1
5
Oct
-15
Jan-
16
Apr
-16
Jul-1
6
Oct
-16
Jan-
17
Apr
-17
Jul-1
7
Stock Info
CMP 2,024
TP 2,500
Upside 23.5%
Sector Textile
Market Cap (` cr) 1,909
Beta 0.9
52 Week High / Low 2,491/1,031
3 year-Chart
Source: Company, Angel Research
-
500
1,000
1,500
2,000
2,500
3,000
Aug
-14
Nov
-14
Feb-
15
May
-15
Jul-1
5
Oct
-15
Jan-
16
Apr
-16
Jul-1
6
Oct
-16
Jan-
17
Apr
-17
Jul-1
7
Top Picks Report | August 2017
August 8, 2017 6
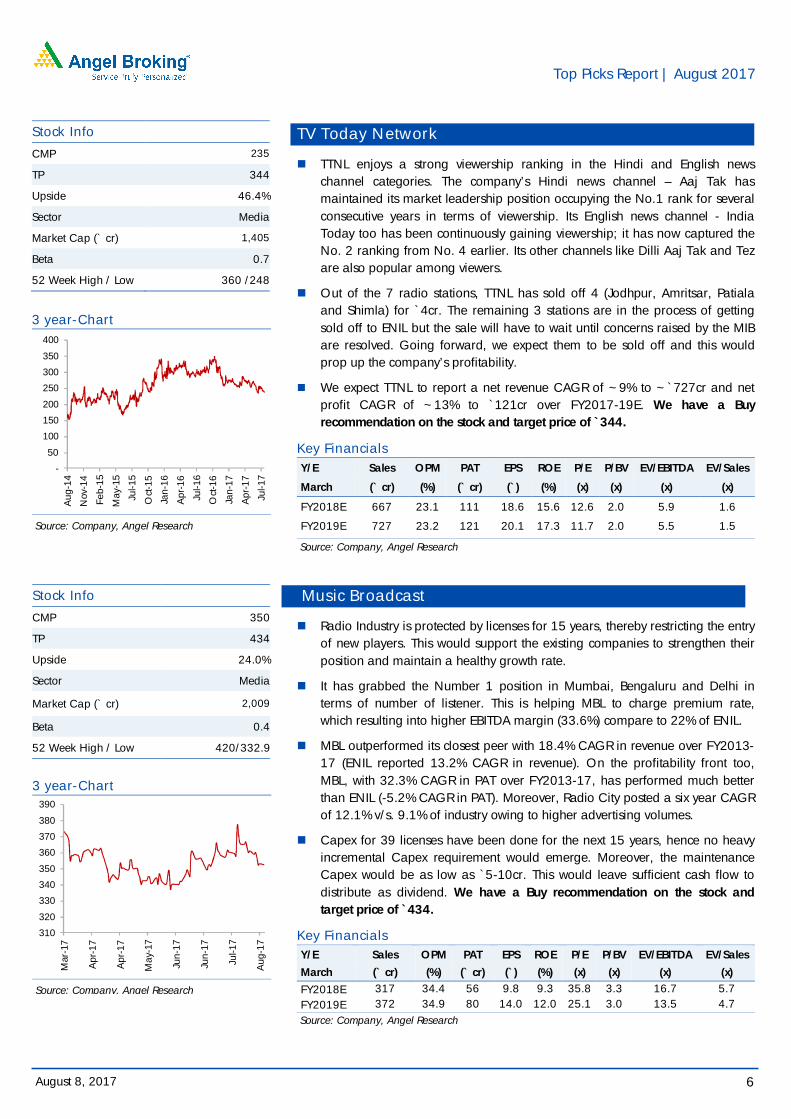
TV Today Network
TTNL enjoys a strong viewership ranking in the Hindi and English news channel categories. The company’s Hindi news channel – Aaj Tak has maintained its market leadership position occupying the No.1 rank for several consecutive years in terms of viewership. Its English news channel - India Today too has been continuously gaining viewership; it has now captured the No. 2 ranking from No. 4 earlier. Its other channels like Dilli Aaj Tak and Tez are also popular among viewers.
Out of the 7 radio stations, TTNL has sold off 4 (Jodhpur, Amritsar, Patiala and Shimla) for `4cr. The remaining 3 stations are in the process of getting sold off to ENIL but the sale will have to wait until concerns raised by the MIB are resolved. Going forward, we expect them to be sold off and this would prop up the company’s profitability.
We expect TTNL to report a net revenue CAGR of ~9% to ~`727cr and net profit CAGR of ~13% to `121cr over FY2017-19E. We have a Buy recommendation on the stock and target price of `344.
Key Financials Y/E Sales OPM PAT EPS ROE P/E P/BV EV/EBITDA EV/Sales
March (` cr) (%) (` cr) (`) (%) (x) (x) (x) (x)
FY2018E 667 23.1 111 18.6 15.6 12.6 2.0 5.9 1.6
FY2019E 727 23.2 121 20.1 17.3 11.7 2.0 5.5 1.5
Source: Company, Angel Research
Music Broadcast
Radio Industry is protected by licenses for 15 years, thereby restricting the entry of new players. This would support the existing companies to strengthen their position and maintain a healthy growth rate.
It has grabbed the Number 1 position in Mumbai, Bengaluru and Delhi in terms of number of listener. This is helping MBL to charge premium rate, which resulting into higher EBITDA margin (33.6%) compare to 22% of ENIL.
MBL outperformed its closest peer with 18.4% CAGR in revenue over FY2013-17 (ENIL reported 13.2% CAGR in revenue). On the profitability front too, MBL, with 32.3% CAGR in PAT over FY2013-17, has performed much better than ENIL (-5.2% CAGR in PAT). Moreover, Radio City posted a six year CAGR of 12.1% v/s. 9.1% of industry owing to higher advertising volumes.
Capex for 39 licenses have been done for the next 15 years, hence no heavy incremental Capex requirement would emerge. Moreover, the maintenance Capex would be as low as `5-10cr. This would leave sufficient cash flow to distribute as dividend. We have a Buy recommendation on the stock and target price of `434.
Key Financials Y/E Sales OPM PAT EPS ROE P/E P/BV EV/EBITDA EV/Sales
March (` cr) (%) (` cr) (`) (%) (x) (x) (x) (x)
FY2018E 317 34.4 56 9.8 9.3 35.8 3.3 16.7 5.7 FY2019E 372 34.9 80 14.0 12.0 25.1 3.0 13.5 4.7
Source: Company, Angel Research
Stock Info
CMP 350
TP 434
Upside 24.0%
Sector Media
Market Cap (` cr) 2,009
Beta 0.4
52 Week High / Low 420/332.9
3 year-Chart
Source: Company, Angel Research
310
320
330
340
350
360
370
380
390
Mar
-17
Apr
-17
Apr
-17
May
-17
Jun-
17
Jun-
17
Jul-1
7
Aug
-17
Stock Info
CMP 235
TP 344
Upside 46.4%
Sector Media
Market Cap (` cr) 1,405
Beta 0.7
52 Week High / Low 360 /248
3 year-Chart
Source: Company, Angel Research
-
50
100
150
200
250
300
350
400
Aug
-14
Nov
-14
Feb-
15
May
-15
Jul-1
5
Oct
-15
Jan-
16
Apr
-16
Jul-1
6
Oct
-16
Jan-
17
Apr
-17
Jul-1
7
Top Picks Report | August 2017
August 8, 2017 7
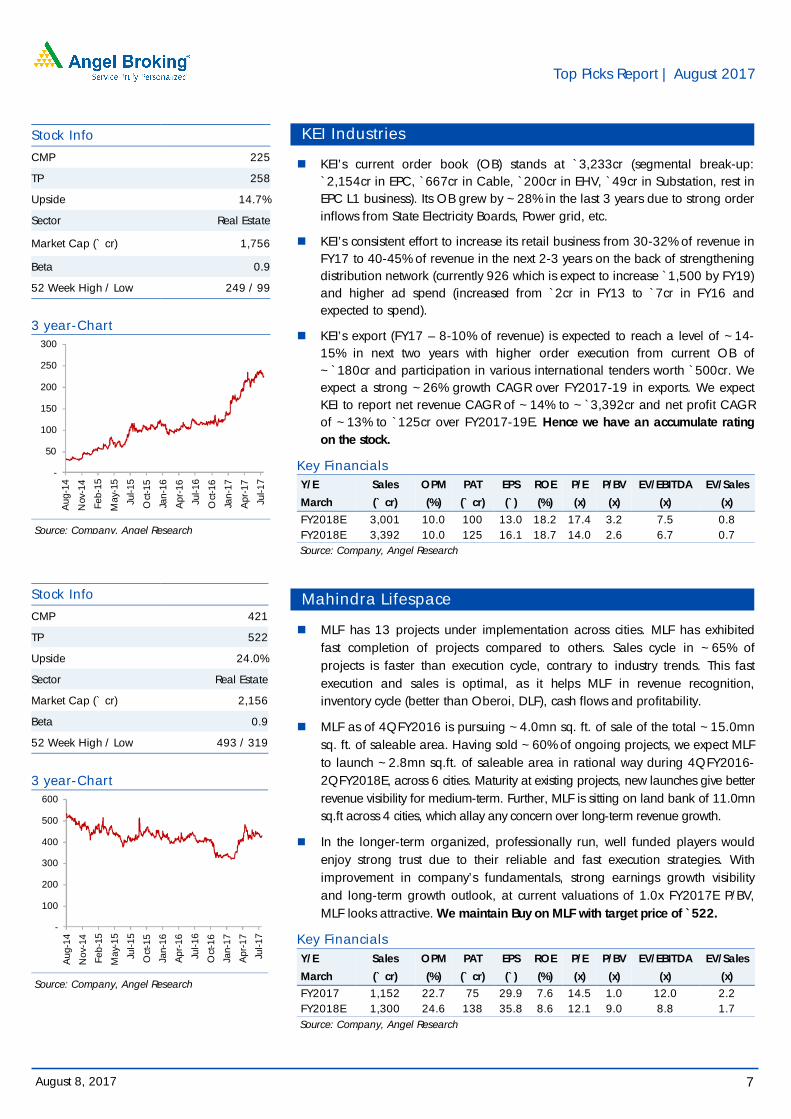
KEI Industries
KEI’s current order book (OB) stands at `3,233cr (segmental break-up: `2,154cr in EPC, `667cr in Cable, `200cr in EHV, `49cr in Substation, rest in EPC L1 business). Its OB grew by ~28% in the last 3 years due to strong order inflows from State Electricity Boards, Power grid, etc.
KEI’s consistent effort to increase its retail business from 30-32% of revenue in FY17 to 40-45% of revenue in the next 2-3 years on the back of strengthening distribution network (currently 926 which is expect to increase `1,500 by FY19) and higher ad spend (increased from `2cr in FY13 to `7cr in FY16 and expected to spend).
KEI’s export (FY17 – 8-10% of revenue) is expected to reach a level of ~14-15% in next two years with higher order execution from current OB of ~`180cr and participation in various international tenders worth `500cr. We expect a strong ~26% growth CAGR over FY2017-19 in exports. We expect KEI to report net revenue CAGR of ~14% to ~`3,392cr and net profit CAGR of ~13% to `125cr over FY2017-19E. Hence we have an accumulate rating on the stock.
Key Financials Y/E Sales OPM PAT EPS ROE P/E P/BV EV/EBITDA EV/Sales
March (` cr) (%) (` cr) (`) (%) (x) (x) (x) (x)
FY2018E 3,001 10.0 100 13.0 18.2 17.4 3.2 7.5 0.8 FY2018E 3,392 10.0 125 16.1 18.7 14.0 2.6 6.7 0.7
Source: Company, Angel Research
Mahindra Lifespace
MLF has 13 projects under implementation across cities. MLF has exhibited fast completion of projects compared to others. Sales cycle in ~65% of projects is faster than execution cycle, contrary to industry trends. This fast execution and sales is optimal, as it helps MLF in revenue recognition, inventory cycle (better than Oberoi, DLF), cash flows and profitability.
MLF as of 4QFY2016 is pursuing ~4.0mn sq. ft. of sale of the total ~15.0mn sq. ft. of saleable area. Having sold ~60% of ongoing projects, we expect MLF to launch ~2.8mn sq.ft. of saleable area in rational way during 4QFY2016-2QFY2018E, across 6 cities. Maturity at existing projects, new launches give better revenue visibility for medium-term. Further, MLF is sitting on land bank of 11.0mn sq.ft across 4 cities, which allay any concern over long-term revenue growth.
In the longer-term organized, professionally run, well funded players would enjoy strong trust due to their reliable and fast execution strategies. With improvement in company’s fundamentals, strong earnings growth visibility and long-term growth outlook, at current valuations of 1.0x FY2017E P/BV, MLF looks attractive. We maintain Buy on MLF with target price of `522.
Key Financials Y/E Sales OPM PAT EPS ROE P/E P/BV EV/EBITDA EV/Sales
March (` cr) (%) (` cr) (`) (%) (x) (x) (x) (x)
FY2017 1,152 22.7 75 29.9 7.6 14.5 1.0 12.0 2.2 FY2018E 1,300 24.6 138 35.8 8.6 12.1 9.0 8.8 1.7
Source: Company, Angel Research
Stock Info
CMP 225
TP 258
Upside 14.7%
Sector Real Estate
Market Cap (` cr) 1,756
Beta 0.9
52 Week High / Low 249 / 99
3 year-Chart
Source: Company, Angel Research
-
50
100
150
200
250
300
Aug
-14
Nov
-14
Feb-
15
May
-15
Jul-1
5
Oct
-15
Jan-
16
Apr
-16
Jul-1
6
Oct
-16
Jan-
17
Apr
-17
Jul-1
7
Stock Info
CMP 421
TP 522
Upside 24.0%
Sector Real Estate
Market Cap (` cr) 2,156
Beta 0.9
52 Week High / Low 493 / 319
3 year-Chart
Source: Company, Angel Research
-
100
200
300
400
500
600
Aug
-14
Nov
-14
Feb-
15
May
-15
Jul-1
5
Oct
-15
Jan-
16
Apr
-16
Jul-1
6
Oct
-16
Jan-
17
Apr
-17
Jul-1
7
Top Picks Report | August 2017
August 8, 2017 8
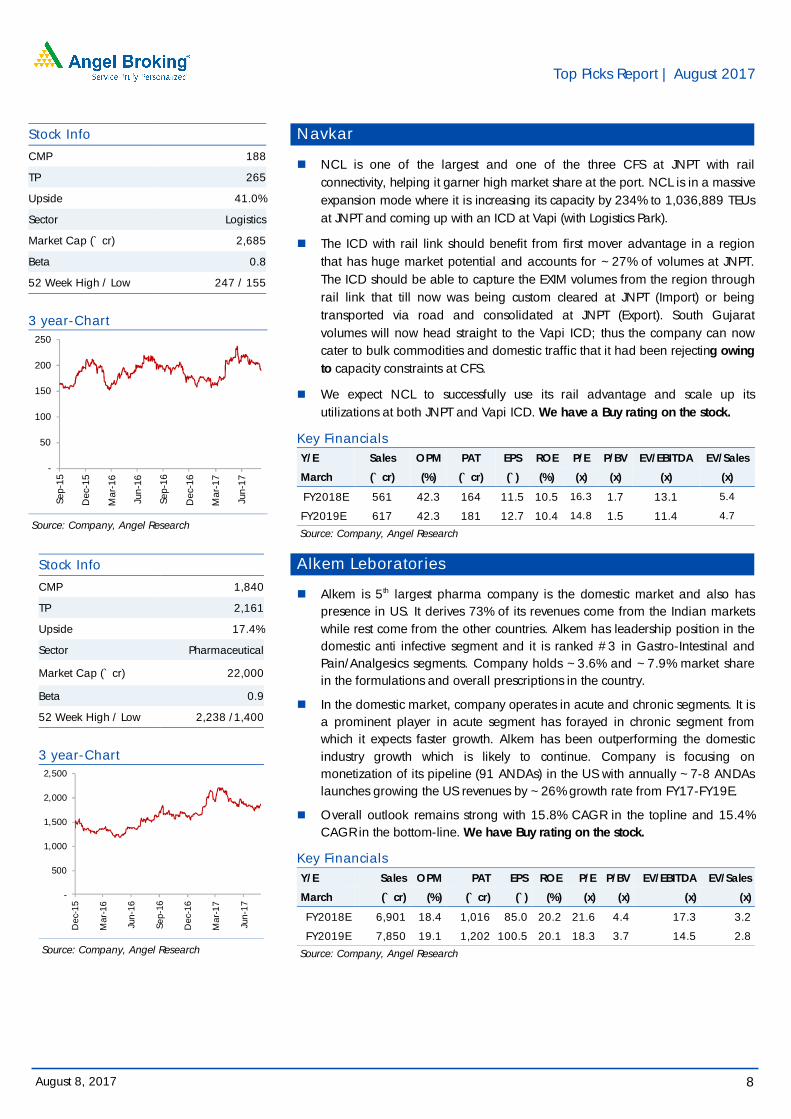
Navkar
NCL is one of the largest and one of the three CFS at JNPT with rail connectivity, helping it garner high market share at the port. NCL is in a massive expansion mode where it is increasing its capacity by 234% to 1,036,889 TEUs at JNPT and coming up with an ICD at Vapi (with Logistics Park).
The ICD with rail link should benefit from first mover advantage in a region that has huge market potential and accounts for ~27% of volumes at JNPT. The ICD should be able to capture the EXIM volumes from the region through rail link that till now was being custom cleared at JNPT (Import) or being transported via road and consolidated at JNPT (Export). South Gujarat volumes will now head straight to the Vapi ICD; thus the company can now cater to bulk commodities and domestic traffic that it had been rejecting owing to capacity constraints at CFS.
We expect NCL to successfully use its rail advantage and scale up its utilizations at both JNPT and Vapi ICD. We have a Buy rating on the stock.
Key Financials Y/E Sales OPM PAT EPS ROE P/E P/BV EV/EBITDA EV/Sales
March (` cr) (%) (` cr) (`) (%) (x) (x) (x) (x)
FY2018E 561 42.3 164 11.5 10.5 16.3 1.7 13.1 5.4
FY2019E 617 42.3 181 12.7 10.4 14.8 1.5 11.4 4.7
Source: Company, Angel Research
Alkem Leboratories
Alkem is 5th largest pharma company is the domestic market and also has presence in US. It derives 73% of its revenues come from the Indian markets while rest come from the other countries. Alkem has leadership position in the domestic anti infective segment and it is ranked #3 in Gastro-Intestinal and Pain/Analgesics segments. Company holds ~3.6% and ~7.9% market share in the formulations and overall prescriptions in the country.
In the domestic market, company operates in acute and chronic segments. It is a prominent player in acute segment has forayed in chronic segment from which it expects faster growth. Alkem has been outperforming the domestic industry growth which is likely to continue. Company is focusing on monetization of its pipeline (91 ANDAs) in the US with annually ~7-8 ANDAs launches growing the US revenues by ~26% growth rate from FY17-FY19E.
Overall outlook remains strong with 15.8% CAGR in the topline and 15.4% CAGR in the bottom-line. We have Buy rating on the stock.
Key Financials Y/E Sales OPM PAT EPS ROE P/E P/BV EV/EBITDA EV/Sales
March (` cr) (%) (` cr) (`) (%) (x) (x) (x) (x)
FY2018E 6,901 18.4 1,016 85.0 20.2 21.6 4.4 17.3 3.2
FY2019E 7,850 19.1 1,202 100.5 20.1 18.3 3.7 14.5 2.8
Source: Company, Angel Research
Stock Info
CMP 188
TP 265
Upside 41.0%
Sector Logistics
Market Cap (` cr) 2,685
Beta 0.8
52 Week High / Low 247 / 155
3 year-Chart
Source: Company, Angel Research
-
50
100
150
200
250
Sep-
15
Dec
-15
Mar
-16
Jun-
16
Sep-
16
Dec
-16
Mar
-17
Jun-
17
Stock Info
CMP 1,840
TP 2,161
Upside 17.4%
Sector Pharmaceutical
Market Cap (` cr) 22,000
Beta 0.9
52 Week High / Low 2,238 /1,400
3 year-Chart
Source: Company, Angel Research
-
500
1,000
1,500
2,000
2,500
Dec
-15
Mar
-16
Jun-
16
Sep-
16
Dec
-16
Mar
-17
Jun-
17
Top Picks Report | August 2017
August 8, 2017 9
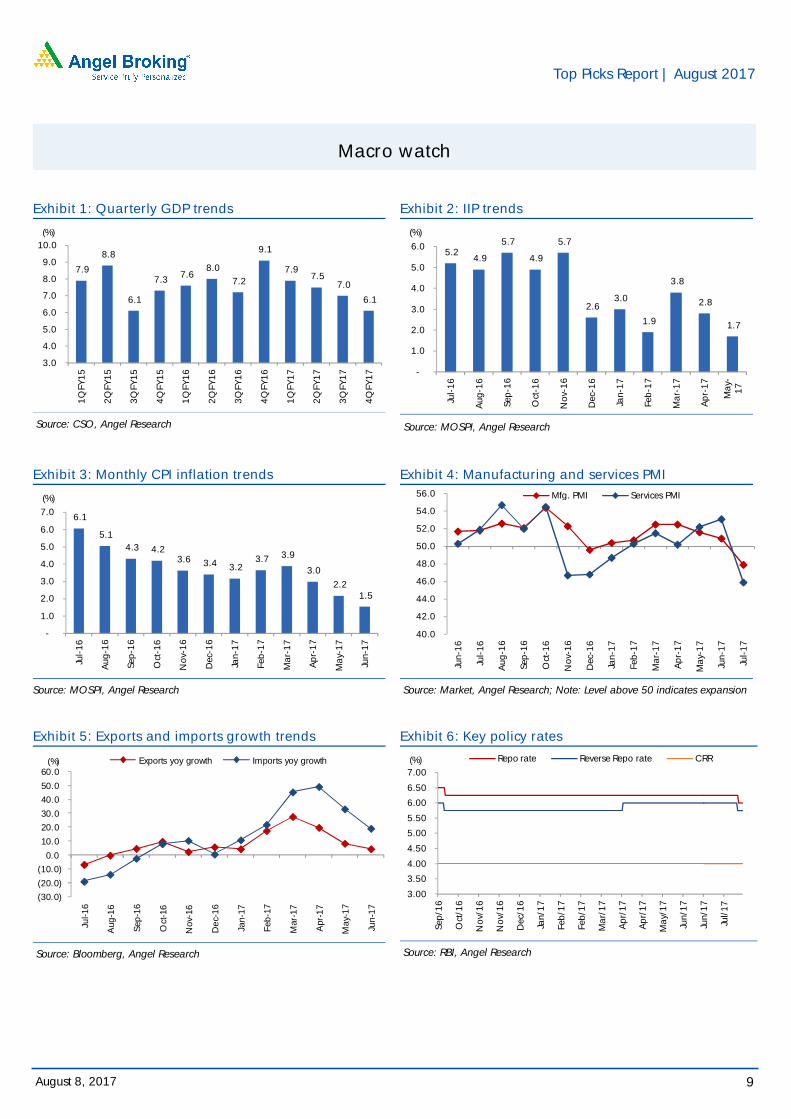
Macro watch
Exhibit 1: Quarterly GDP trends
Source: CSO, Angel Research
Exhibit 2: IIP trends
Source: MOSPI, Angel Research
Exhibit 3: Monthly CPI inflation trends
Source: MOSPI, Angel Research
Exhibit 4: Manufacturing and services PMI
Source: Market, Angel Research; Note: Level above 50 indicates expansion
Exhibit 5: Exports and imports growth trends
Source: Bloomberg, Angel Research
Exhibit 6: Key policy rates
Source: RBI, Angel Research
7.9
8.8
6.1
7.3 7.6 8.0
7.2
9.1
7.9 7.5
7.0
6.1
3.0
4.0
5.0
6.0
7.0
8.0
9.0
10.0
1QFY
15
2QFY
15
3QFY
15
4QFY
15
1QFY
16
2QFY
16
3QFY
16
4QFY
16
1QFY
17
2QFY
17
3QFY
17
4QFY
17
(%)
5.2 4.9
5.7
4.9
5.7
2.6 3.0
1.9
3.8
2.8
1.7
-
1.0
2.0
3.0
4.0
5.0
6.0
Jul-
16
Aug
-16
Sep-
16
Oct
-16
Nov
-16
Dec
-16
Jan-
17
Feb-
17
Mar
-17
Apr
-17
May
-17
(%)
6.1
5.1 4.3 4.2
3.6 3.4 3.2 3.7 3.9
3.0
2.2 1.5
-
1.0
2.0
3.0
4.0
5.0
6.0
7.0
Jul-
16
Aug
-16
Sep-
16
Oct
-16
Nov
-16
Dec
-16
Jan-
17
Feb-
17
Mar
-17
Apr
-17
May
-17
Jun-
17
(%)
40.0
42.0
44.0
46.0
48.0
50.0
52.0
54.0
56.0
Jun-
16
Jul-
16
Aug
-16
Sep-
16
Oct
-16
Nov
-16
Dec
-16
Jan-
17
Feb-
17
Mar
-17
Apr
-17
May
-17
Jun-
17
Jul-
17
Mfg. PMI Services PMI
(30.0)
(20.0)
(10.0)
0.0
10.0
20.0
30.0
40.0
50.0
60.0
Jul-1
6
Aug
-16
Sep-
16
Oct
-16
Nov
-16
Dec
-16
Jan-
17
Feb-
17
Mar
-17
Apr
-17
May
-17
Jun-
17
Exports yoy growth Imports yoy growth(%)
3.00
3.50
4.00
4.50
5.00
5.50
6.00
6.50
7.00
Sep/
16
Oct
/16
Nov
/16
Nov
/16
Dec
/16
Jan/
17
Feb/
17
Feb/
17
Mar
/17
Apr
/17
Apr
/17
May
/17
Jun/
17
Jun/
17
Jul/
17
Repo rate Reverse Repo rate CRR (%)
Top Picks Report | August 2017
August 8, 2017 10
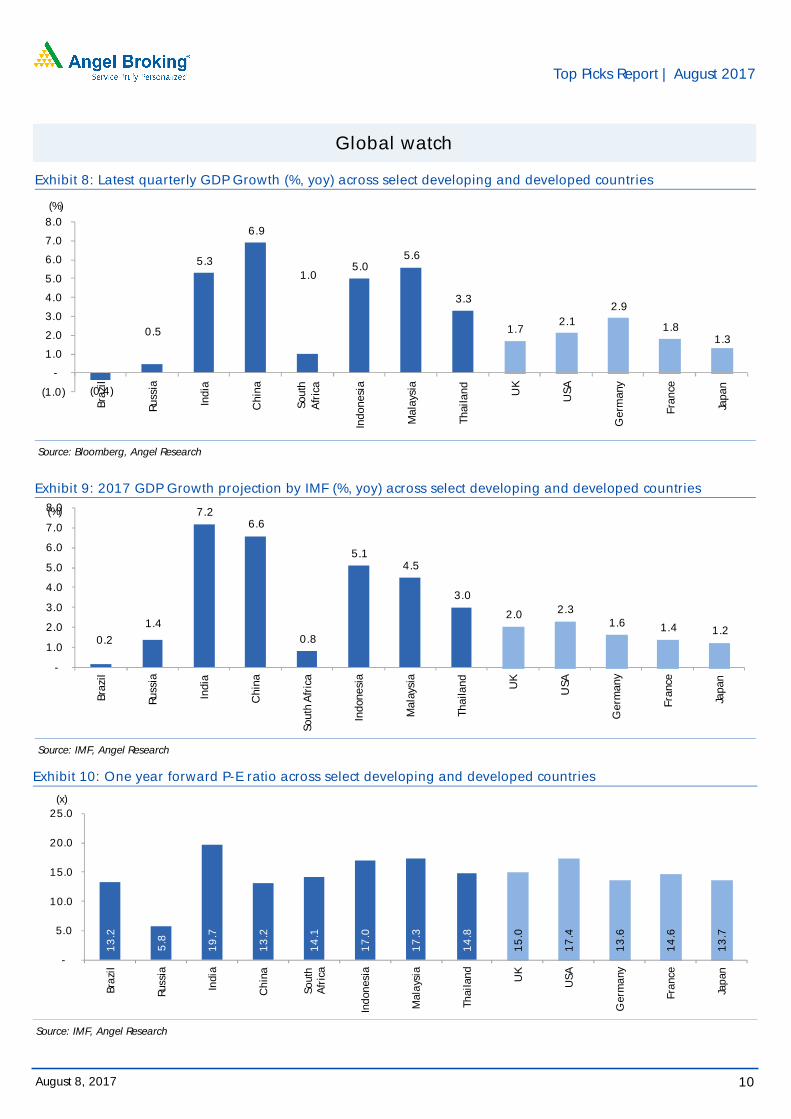
Global watch
Exhibit 8: Latest quarterly GDP Growth (%, yoy) across select developing and developed countries
Source: Bloomberg, Angel Research
Exhibit 9: 2017 GDP Growth projection by IMF (%, yoy) across select developing and developed countries
Source: IMF, Angel Research
Exhibit 10: One year forward P-E ratio across select developing and developed countries
Source: IMF, Angel Research
(0.4)
0.5
5.3
6.9
1.0 5.0
5.6
3.3
1.7 2.1
2.9
1.8 1.3
(1.0)
-
1.0
2.0
3.0
4.0
5.0
6.0
7.0
8.0
Braz
il
Russ
ia
Indi
a
Chi
na
Sout
h A
fric
a
Indo
nesi
a
Mal
aysi
a
Thai
land UK
USA
Ger
man
y
Fran
ce
Japa
n
(%)
0.2
1.4
7.2 6.6
0.8
5.1 4.5
3.0
2.0 2.3 1.6 1.4 1.2
-
1.0
2.0
3.0
4.0
5.0
6.0
7.0
8.0
Braz
il
Russ
ia
Indi
a
Chi
na
Sout
h A
fric
a
Indo
nesi
a
Mal
aysi
a
Thai
land UK
USA
Ger
man
y
Fran
ce
Japa
n
(%)
13
.2
5.8
19
.7
13
.2
14
.1
17
.0
17
.3
14
.8
15
.0
17
.4
13
.6
14
.6
13
.7
-
5.0
10.0
15.0
20.0
25.0
Braz
il
Russ
ia
Indi
a
Chi
na
Sout
h A
fric
a
Indo
nesi
a
Mal
aysi
a
Thai
land UK
USA
Ger
man
y
Fran
ce
Japa
n
(x)
Top Picks Report | August 2017
August 8, 2017 11
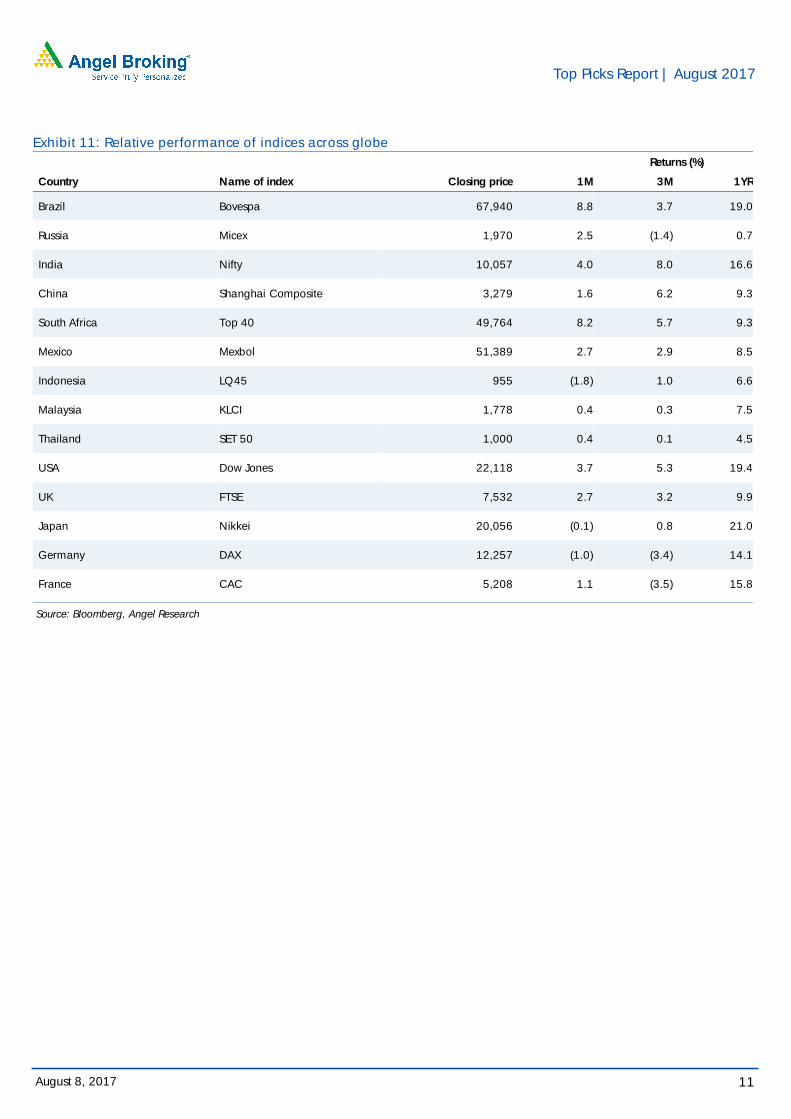
Exhibit 11: Relative performance of indices across globe
Returns (%)
Country Name of index Closing price 1M 3M 1YR
Brazil Bovespa 67,940 8.8 3.7 19.0
Russia Micex 1,970 2.5 (1.4) 0.7
India Nifty 10,057 4.0 8.0 16.6
China Shanghai Composite 3,279 1.6 6.2 9.3
South Africa Top 40 49,764 8.2 5.7 9.3
Mexico Mexbol 51,389 2.7 2.9 8.5
Indonesia LQ45 955 (1.8) 1.0 6.6
Malaysia KLCI 1,778 0.4 0.3 7.5
Thailand SET 50 1,000 0.4 0.1 4.5
USA Dow Jones 22,118 3.7 5.3 19.4
UK FTSE 7,532 2.7 3.2 9.9
Japan Nikkei 20,056 (0.1) 0.8 21.0
Germany DAX 12,257 (1.0) (3.4) 14.1
France CAC 5,208 1.1 (3.5) 15.8
Source: Bloomberg, Angel Research

Top Picks Report | August 2017
August 8, 2017 12
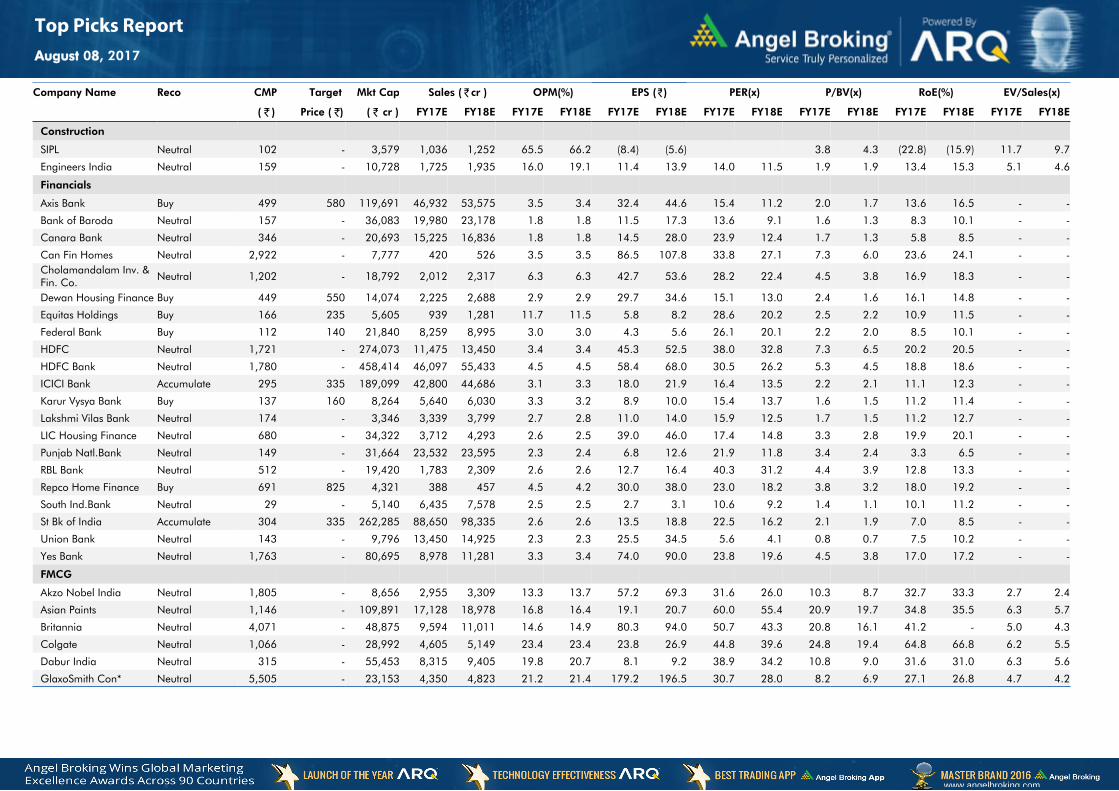
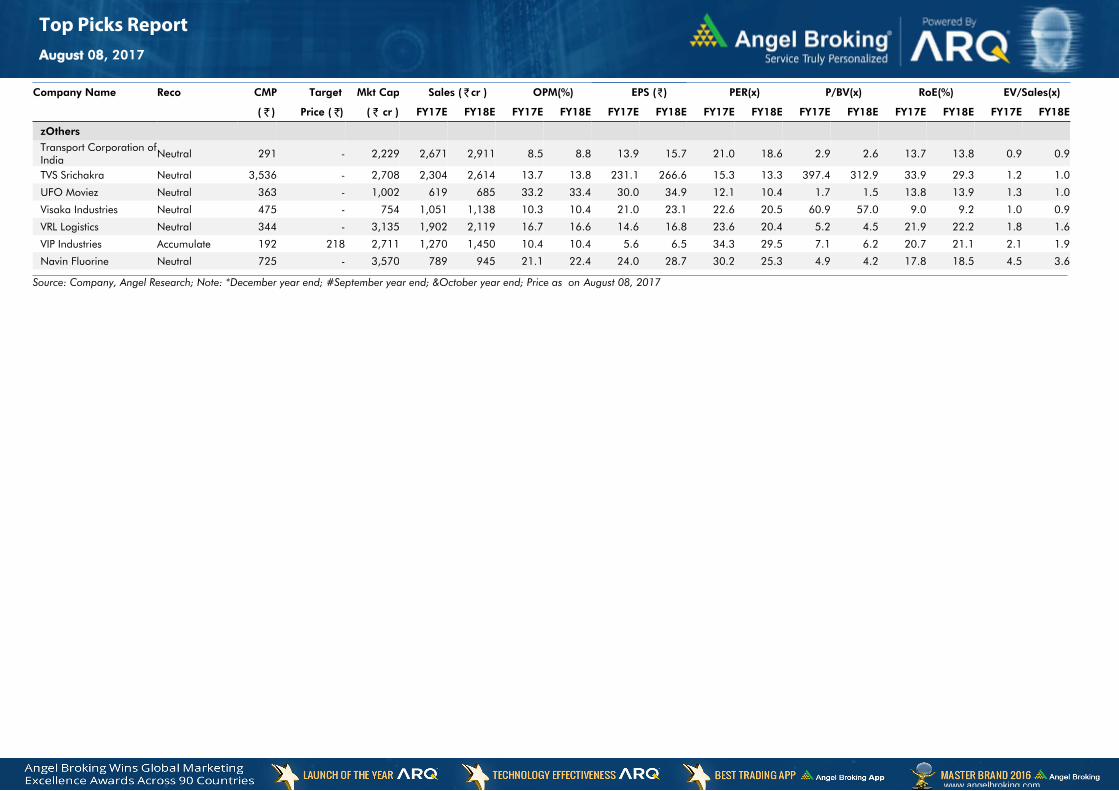
Stock Watch
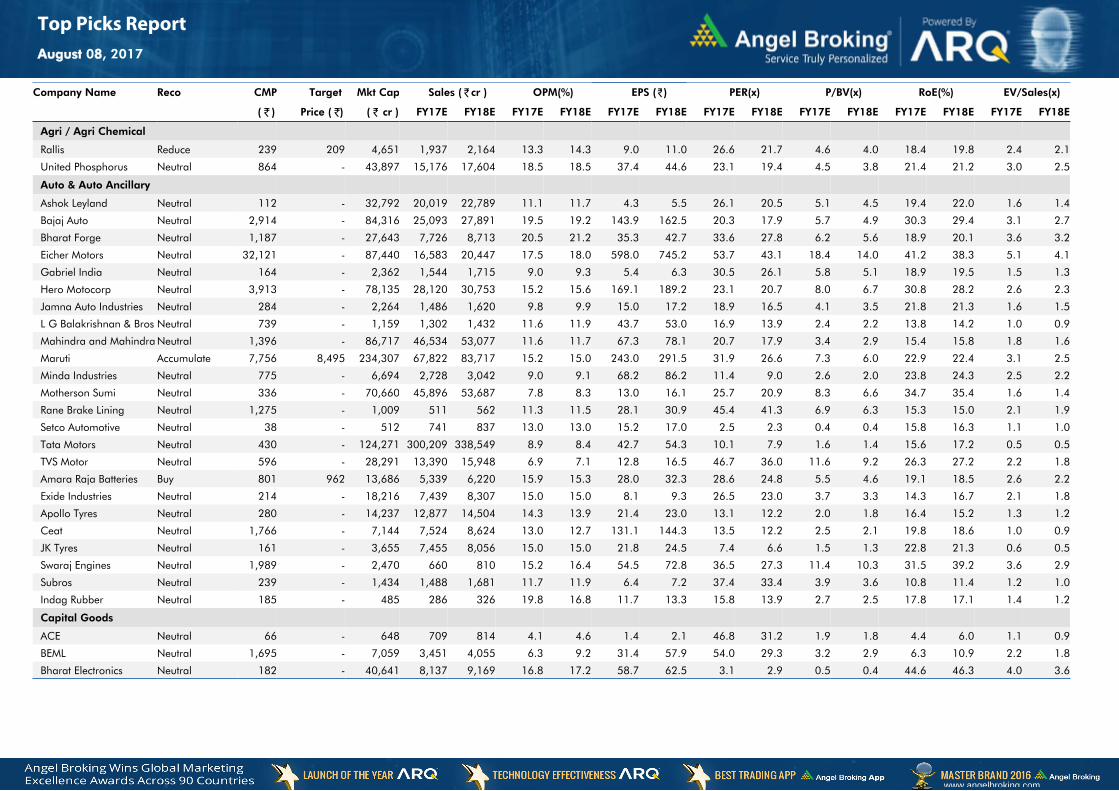
Company Name Reco CMP Target Mkt Cap Sales ( ₹cr ) OPM(%) EPS (₹) PER(x) P/BV(x) RoE(%) EV/Sales(x)
( ₹ ) Price ( ₹) ( ₹ cr ) FY17E FY18E FY17E FY18E FY17E FY18E FY17E FY18E FY17E FY18E FY17E FY18E FY17E FY18E
Agri / Agri Chemical
Rallis Reduce 239 209 4,651 1,937 2,164 13.3 14.3 9.0 11.0 26.6 21.7 4.6 4.0 18.4 19.8 2.4 2.1
United Phosphorus Neutral 864 - 43,897 15,176 17,604 18.5 18.5 37.4 44.6 23.1 19.4 4.5 3.8 21.4 21.2 3.0 2.5
Auto & Auto Ancillary
Ashok Leyland Neutral 112 - 32,792 20,019 22,789 11.1 11.7 4.3 5.5 26.1 20.5 5.1 4.5 19.4 22.0 1.6 1.4
Bajaj Auto Neutral 2,914 - 84,316 25,093 27,891 19.5 19.2 143.9 162.5 20.3 17.9 5.7 4.9 30.3 29.4 3.1 2.7
Bharat Forge Neutral 1,187 - 27,643 7,726 8,713 20.5 21.2 35.3 42.7 33.6 27.8 6.2 5.6 18.9 20.1 3.6 3.2
Eicher Motors Neutral 32,121 - 87,440 16,583 20,447 17.5 18.0 598.0 745.2 53.7 43.1 18.4 14.0 41.2 38.3 5.1 4.1
Gabriel India Neutral 164 - 2,362 1,544 1,715 9.0 9.3 5.4 6.3 30.5 26.1 5.8 5.1 18.9 19.5 1.5 1.3
Hero Motocorp Neutral 3,913 - 78,135 28,120 30,753 15.2 15.6 169.1 189.2 23.1 20.7 8.0 6.7 30.8 28.2 2.6 2.3
Jamna Auto Industries Neutral 284 - 2,264 1,486 1,620 9.8 9.9 15.0 17.2 18.9 16.5 4.1 3.5 21.8 21.3 1.6 1.5
L G Balakrishnan & Bros Neutral 739 - 1,159 1,302 1,432 11.6 11.9 43.7 53.0 16.9 13.9 2.4 2.2 13.8 14.2 1.0 0.9
Mahindra and Mahindra Neutral 1,396 - 86,717 46,534 53,077 11.6 11.7 67.3 78.1 20.7 17.9 3.4 2.9 15.4 15.8 1.8 1.6
Maruti Accumulate 7,756 8,495 234,307 67,822 83,717 15.2 15.0 243.0 291.5 31.9 26.6 7.3 6.0 22.9 22.4 3.1 2.5
Minda Industries Neutral 775 - 6,694 2,728 3,042 9.0 9.1 68.2 86.2 11.4 9.0 2.6 2.0 23.8 24.3 2.5 2.2
Motherson Sumi Neutral 336 - 70,660 45,896 53,687 7.8 8.3 13.0 16.1 25.7 20.9 8.3 6.6 34.7 35.4 1.6 1.4
Rane Brake Lining Neutral 1,275 - 1,009 511 562 11.3 11.5 28.1 30.9 45.4 41.3 6.9 6.3 15.3 15.0 2.1 1.9
Setco Automotive Neutral 38 - 512 741 837 13.0 13.0 15.2 17.0 2.5 2.3 0.4 0.4 15.8 16.3 1.1 1.0
Tata Motors Neutral 430 - 124,271 300,209 338,549 8.9 8.4 42.7 54.3 10.1 7.9 1.6 1.4 15.6 17.2 0.5 0.5
TVS Motor Neutral 596 - 28,291 13,390 15,948 6.9 7.1 12.8 16.5 46.7 36.0 11.6 9.2 26.3 27.2 2.2 1.8
Amara Raja Batteries Buy 801 962 13,686 5,339 6,220 15.9 15.3 28.0 32.3 28.6 24.8 5.5 4.6 19.1 18.5 2.6 2.2
Exide Industries Neutral 214 - 18,216 7,439 8,307 15.0 15.0 8.1 9.3 26.5 23.0 3.7 3.3 14.3 16.7 2.1 1.8
Apollo Tyres Neutral 280 - 14,237 12,877 14,504 14.3 13.9 21.4 23.0 13.1 12.2 2.0 1.8 16.4 15.2 1.3 1.2
Ceat Neutral 1,766 - 7,144 7,524 8,624 13.0 12.7 131.1 144.3 13.5 12.2 2.5 2.1 19.8 18.6 1.0 0.9
JK Tyres Neutral 161 - 3,655 7,455 8,056 15.0 15.0 21.8 24.5 7.4 6.6 1.5 1.3 22.8 21.3 0.6 0.5
Swaraj Engines Neutral 1,989 - 2,470 660 810 15.2 16.4 54.5 72.8 36.5 27.3 11.4 10.3 31.5 39.2 3.6 2.9
Subros Neutral 239 - 1,434 1,488 1,681 11.7 11.9 6.4 7.2 37.4 33.4 3.9 3.6 10.8 11.4 1.2 1.0
Indag Rubber Neutral 185 - 485 286 326 19.8 16.8 11.7 13.3 15.8 13.9 2.7 2.5 17.8 17.1 1.4 1.2
Capital Goods
ACE Neutral 66 - 648 709 814 4.1 4.6 1.4 2.1 46.8 31.2 1.9 1.8 4.4 6.0 1.1 0.9
BEML Neutral 1,695 - 7,059 3,451 4,055 6.3 9.2 31.4 57.9 54.0 29.3 3.2 2.9 6.3 10.9 2.2 1.8
Bharat Electronics Neutral 182 - 40,641 8,137 9,169 16.8 17.2 58.7 62.5 3.1 2.9 0.5 0.4 44.6 46.3 4.0 3.6
www.angelbroking.com
Top Picks ReportAugust 08, 2017
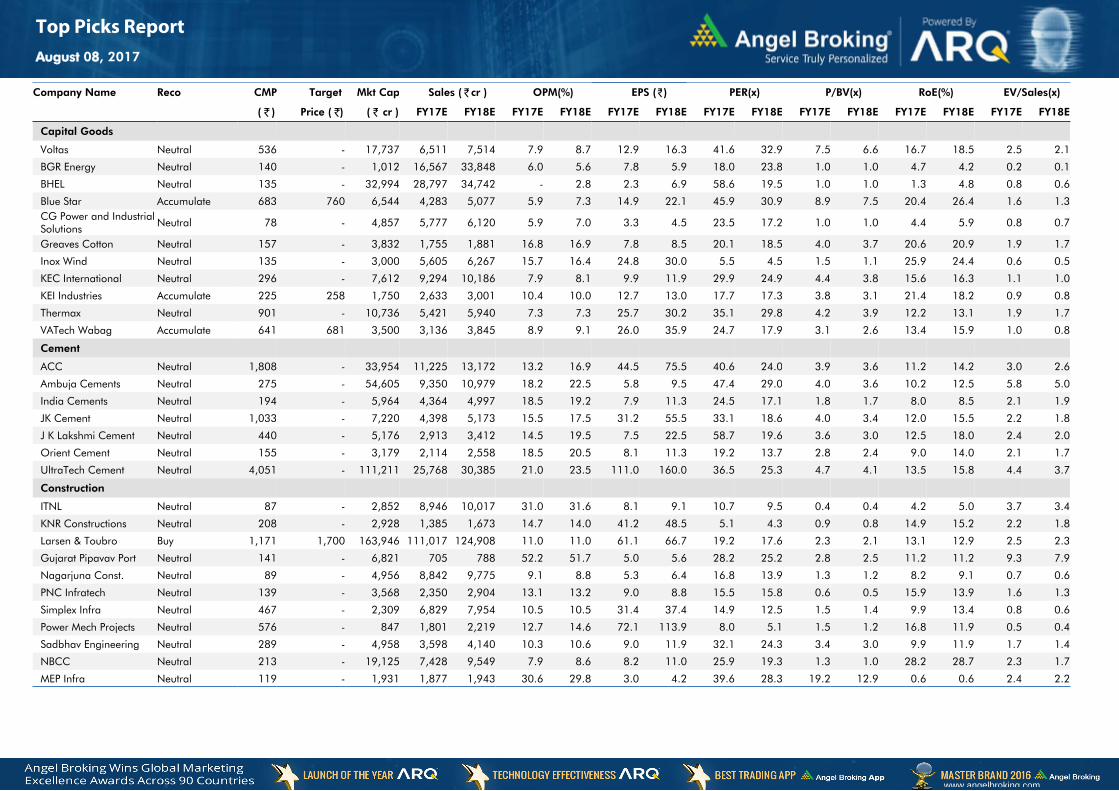
Company Name Reco CMP Target Mkt Cap Sales ( ₹cr ) OPM(%) EPS (₹) PER(x) P/BV(x) RoE(%) EV/Sales(x)
( ₹ ) Price ( ₹) ( ₹ cr ) FY17E FY18E FY17E FY18E FY17E FY18E FY17E FY18E FY17E FY18E FY17E FY18E FY17E FY18E
Capital Goods
Voltas Neutral 536 - 17,737 6,511 7,514 7.9 8.7 12.9 16.3 41.6 32.9 7.5 6.6 16.7 18.5 2.5 2.1
BGR Energy Neutral 140 - 1,012 16,567 33,848 6.0 5.6 7.8 5.9 18.0 23.8 1.0 1.0 4.7 4.2 0.2 0.1
BHEL Neutral 135 - 32,994 28,797 34,742 - 2.8 2.3 6.9 58.6 19.5 1.0 1.0 1.3 4.8 0.8 0.6
Blue Star Accumulate 683 760 6,544 4,283 5,077 5.9 7.3 14.9 22.1 45.9 30.9 8.9 7.5 20.4 26.4 1.6 1.3CG Power and Industrial Solutions Neutral 78 - 4,857 5,777 6,120 5.9 7.0 3.3 4.5 23.5 17.2 1.0 1.0 4.4 5.9 0.8 0.7
Greaves Cotton Neutral 157 - 3,832 1,755 1,881 16.8 16.9 7.8 8.5 20.1 18.5 4.0 3.7 20.6 20.9 1.9 1.7
Inox Wind Neutral 135 - 3,000 5,605 6,267 15.7 16.4 24.8 30.0 5.5 4.5 1.5 1.1 25.9 24.4 0.6 0.5
KEC International Neutral 296 - 7,612 9,294 10,186 7.9 8.1 9.9 11.9 29.9 24.9 4.4 3.8 15.6 16.3 1.1 1.0
KEI Industries Accumulate 225 258 1,750 2,633 3,001 10.4 10.0 12.7 13.0 17.7 17.3 3.8 3.1 21.4 18.2 0.9 0.8
Thermax Neutral 901 - 10,736 5,421 5,940 7.3 7.3 25.7 30.2 35.1 29.8 4.2 3.9 12.2 13.1 1.9 1.7
VATech Wabag Accumulate 641 681 3,500 3,136 3,845 8.9 9.1 26.0 35.9 24.7 17.9 3.1 2.6 13.4 15.9 1.0 0.8
Cement
ACC Neutral 1,808 - 33,954 11,225 13,172 13.2 16.9 44.5 75.5 40.6 24.0 3.9 3.6 11.2 14.2 3.0 2.6
Ambuja Cements Neutral 275 - 54,605 9,350 10,979 18.2 22.5 5.8 9.5 47.4 29.0 4.0 3.6 10.2 12.5 5.8 5.0
India Cements Neutral 194 - 5,964 4,364 4,997 18.5 19.2 7.9 11.3 24.5 17.1 1.8 1.7 8.0 8.5 2.1 1.9
JK Cement Neutral 1,033 - 7,220 4,398 5,173 15.5 17.5 31.2 55.5 33.1 18.6 4.0 3.4 12.0 15.5 2.2 1.8
J K Lakshmi Cement Neutral 440 - 5,176 2,913 3,412 14.5 19.5 7.5 22.5 58.7 19.6 3.6 3.0 12.5 18.0 2.4 2.0
Orient Cement Neutral 155 - 3,179 2,114 2,558 18.5 20.5 8.1 11.3 19.2 13.7 2.8 2.4 9.0 14.0 2.1 1.7
UltraTech Cement Neutral 4,051 - 111,211 25,768 30,385 21.0 23.5 111.0 160.0 36.5 25.3 4.7 4.1 13.5 15.8 4.4 3.7
Construction
ITNL Neutral 87 - 2,852 8,946 10,017 31.0 31.6 8.1 9.1 10.7 9.5 0.4 0.4 4.2 5.0 3.7 3.4
KNR Constructions Neutral 208 - 2,928 1,385 1,673 14.7 14.0 41.2 48.5 5.1 4.3 0.9 0.8 14.9 15.2 2.2 1.8
Larsen & Toubro Buy 1,171 1,700 163,946 111,017 124,908 11.0 11.0 61.1 66.7 19.2 17.6 2.3 2.1 13.1 12.9 2.5 2.3
Gujarat Pipavav Port Neutral 141 - 6,821 705 788 52.2 51.7 5.0 5.6 28.2 25.2 2.8 2.5 11.2 11.2 9.3 7.9
Nagarjuna Const. Neutral 89 - 4,956 8,842 9,775 9.1 8.8 5.3 6.4 16.8 13.9 1.3 1.2 8.2 9.1 0.7 0.6
PNC Infratech Neutral 139 - 3,568 2,350 2,904 13.1 13.2 9.0 8.8 15.5 15.8 0.6 0.5 15.9 13.9 1.6 1.3
Simplex Infra Neutral 467 - 2,309 6,829 7,954 10.5 10.5 31.4 37.4 14.9 12.5 1.5 1.4 9.9 13.4 0.8 0.6
Power Mech Projects Neutral 576 - 847 1,801 2,219 12.7 14.6 72.1 113.9 8.0 5.1 1.5 1.2 16.8 11.9 0.5 0.4
Sadbhav Engineering Neutral 289 - 4,958 3,598 4,140 10.3 10.6 9.0 11.9 32.1 24.3 3.4 3.0 9.9 11.9 1.7 1.4
NBCC Neutral 213 - 19,125 7,428 9,549 7.9 8.6 8.2 11.0 25.9 19.3 1.3 1.0 28.2 28.7 2.3 1.7
MEP Infra Neutral 119 - 1,931 1,877 1,943 30.6 29.8 3.0 4.2 39.6 28.3 19.2 12.9 0.6 0.6 2.4 2.2
www.angelbroking.com
Top Picks ReportAugust 08, 2017
Company Name Reco CMP Target Mkt Cap Sales ( ₹cr ) OPM(%) EPS (₹) PER(x) P/BV(x) RoE(%) EV/Sales(x)
( ₹ ) Price ( ₹) ( ₹ cr ) FY17E FY18E FY17E FY18E FY17E FY18E FY17E FY18E FY17E FY18E FY17E FY18E FY17E FY18E
Construction
SIPL Neutral 102 - 3,579 1,036 1,252 65.5 66.2 (8.4) (5.6) 3.8 4.3 (22.8) (15.9) 11.7 9.7
Engineers India Neutral 159 - 10,728 1,725 1,935 16.0 19.1 11.4 13.9 14.0 11.5 1.9 1.9 13.4 15.3 5.1 4.6
Financials
Axis Bank Buy 499 580 119,691 46,932 53,575 3.5 3.4 32.4 44.6 15.4 11.2 2.0 1.7 13.6 16.5 - -
Bank of Baroda Neutral 157 - 36,083 19,980 23,178 1.8 1.8 11.5 17.3 13.6 9.1 1.6 1.3 8.3 10.1 - -
Canara Bank Neutral 346 - 20,693 15,225 16,836 1.8 1.8 14.5 28.0 23.9 12.4 1.7 1.3 5.8 8.5 - -
Can Fin Homes Neutral 2,922 - 7,777 420 526 3.5 3.5 86.5 107.8 33.8 27.1 7.3 6.0 23.6 24.1 - -Cholamandalam Inv. & Fin. Co. Neutral 1,202 - 18,792 2,012 2,317 6.3 6.3 42.7 53.6 28.2 22.4 4.5 3.8 16.9 18.3 - -
Dewan Housing Finance Buy 449 550 14,074 2,225 2,688 2.9 2.9 29.7 34.6 15.1 13.0 2.4 1.6 16.1 14.8 - -
Equitas Holdings Buy 166 235 5,605 939 1,281 11.7 11.5 5.8 8.2 28.6 20.2 2.5 2.2 10.9 11.5 - -
Federal Bank Buy 112 140 21,840 8,259 8,995 3.0 3.0 4.3 5.6 26.1 20.1 2.2 2.0 8.5 10.1 - -
HDFC Neutral 1,721 - 274,073 11,475 13,450 3.4 3.4 45.3 52.5 38.0 32.8 7.3 6.5 20.2 20.5 - -
HDFC Bank Neutral 1,780 - 458,414 46,097 55,433 4.5 4.5 58.4 68.0 30.5 26.2 5.3 4.5 18.8 18.6 - -
ICICI Bank Accumulate 295 335 189,099 42,800 44,686 3.1 3.3 18.0 21.9 16.4 13.5 2.2 2.1 11.1 12.3 - -
Karur Vysya Bank Buy 137 160 8,264 5,640 6,030 3.3 3.2 8.9 10.0 15.4 13.7 1.6 1.5 11.2 11.4 - -
Lakshmi Vilas Bank Neutral 174 - 3,346 3,339 3,799 2.7 2.8 11.0 14.0 15.9 12.5 1.7 1.5 11.2 12.7 - -
LIC Housing Finance Neutral 680 - 34,322 3,712 4,293 2.6 2.5 39.0 46.0 17.4 14.8 3.3 2.8 19.9 20.1 - -
Punjab Natl.Bank Neutral 149 - 31,664 23,532 23,595 2.3 2.4 6.8 12.6 21.9 11.8 3.4 2.4 3.3 6.5 - -
RBL Bank Neutral 512 - 19,420 1,783 2,309 2.6 2.6 12.7 16.4 40.3 31.2 4.4 3.9 12.8 13.3 - -
Repco Home Finance Buy 691 825 4,321 388 457 4.5 4.2 30.0 38.0 23.0 18.2 3.8 3.2 18.0 19.2 - -
South Ind.Bank Neutral 29 - 5,140 6,435 7,578 2.5 2.5 2.7 3.1 10.6 9.2 1.4 1.1 10.1 11.2 - -
St Bk of India Accumulate 304 335 262,285 88,650 98,335 2.6 2.6 13.5 18.8 22.5 16.2 2.1 1.9 7.0 8.5 - -
Union Bank Neutral 143 - 9,796 13,450 14,925 2.3 2.3 25.5 34.5 5.6 4.1 0.8 0.7 7.5 10.2 - -
Yes Bank Neutral 1,763 - 80,695 8,978 11,281 3.3 3.4 74.0 90.0 23.8 19.6 4.5 3.8 17.0 17.2 - -
FMCG
Akzo Nobel India Neutral 1,805 - 8,656 2,955 3,309 13.3 13.7 57.2 69.3 31.6 26.0 10.3 8.7 32.7 33.3 2.7 2.4
Asian Paints Neutral 1,146 - 109,891 17,128 18,978 16.8 16.4 19.1 20.7 60.0 55.4 20.9 19.7 34.8 35.5 6.3 5.7
Britannia Neutral 4,071 - 48,875 9,594 11,011 14.6 14.9 80.3 94.0 50.7 43.3 20.8 16.1 41.2 - 5.0 4.3
Colgate Neutral 1,066 - 28,992 4,605 5,149 23.4 23.4 23.8 26.9 44.8 39.6 24.8 19.4 64.8 66.8 6.2 5.5
Dabur India Neutral 315 - 55,453 8,315 9,405 19.8 20.7 8.1 9.2 38.9 34.2 10.8 9.0 31.6 31.0 6.3 5.6
GlaxoSmith Con* Neutral 5,505 - 23,153 4,350 4,823 21.2 21.4 179.2 196.5 30.7 28.0 8.2 6.9 27.1 26.8 4.7 4.2
www.angelbroking.com
Top Picks ReportAugust 08, 2017
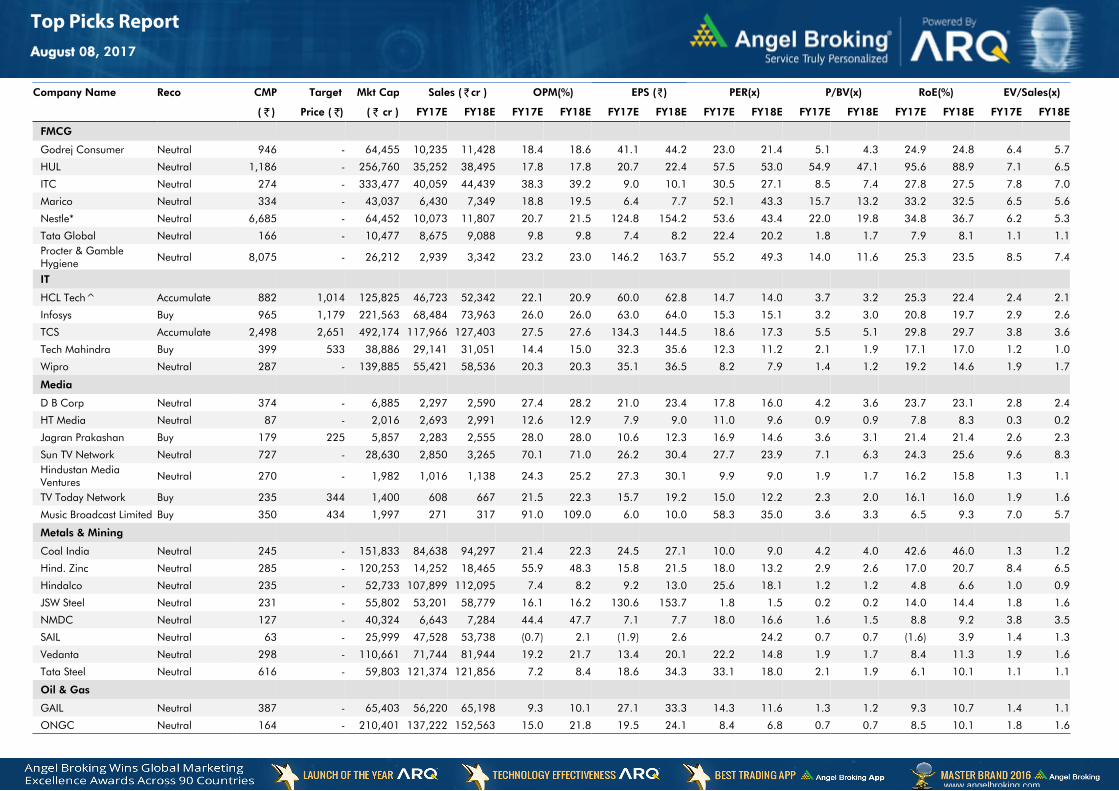
Company Name Reco CMP Target Mkt Cap Sales ( ₹cr ) OPM(%) EPS (₹) PER(x) P/BV(x) RoE(%) EV/Sales(x)
( ₹ ) Price ( ₹) ( ₹ cr ) FY17E FY18E FY17E FY18E FY17E FY18E FY17E FY18E FY17E FY18E FY17E FY18E FY17E FY18E
FMCG
Godrej Consumer Neutral 946 - 64,455 10,235 11,428 18.4 18.6 41.1 44.2 23.0 21.4 5.1 4.3 24.9 24.8 6.4 5.7
HUL Neutral 1,186 - 256,760 35,252 38,495 17.8 17.8 20.7 22.4 57.5 53.0 54.9 47.1 95.6 88.9 7.1 6.5
ITC Neutral 274 - 333,477 40,059 44,439 38.3 39.2 9.0 10.1 30.5 27.1 8.5 7.4 27.8 27.5 7.8 7.0
Marico Neutral 334 - 43,037 6,430 7,349 18.8 19.5 6.4 7.7 52.1 43.3 15.7 13.2 33.2 32.5 6.5 5.6
Nestle* Neutral 6,685 - 64,452 10,073 11,807 20.7 21.5 124.8 154.2 53.6 43.4 22.0 19.8 34.8 36.7 6.2 5.3
Tata Global Neutral 166 - 10,477 8,675 9,088 9.8 9.8 7.4 8.2 22.4 20.2 1.8 1.7 7.9 8.1 1.1 1.1Procter & Gamble Hygiene Neutral 8,075 - 26,212 2,939 3,342 23.2 23.0 146.2 163.7 55.2 49.3 14.0 11.6 25.3 23.5 8.5 7.4
IT
HCL Tech^ Accumulate 882 1,014 125,825 46,723 52,342 22.1 20.9 60.0 62.8 14.7 14.0 3.7 3.2 25.3 22.4 2.4 2.1
Infosys Buy 965 1,179 221,563 68,484 73,963 26.0 26.0 63.0 64.0 15.3 15.1 3.2 3.0 20.8 19.7 2.9 2.6
TCS Accumulate 2,498 2,651 492,174 117,966 127,403 27.5 27.6 134.3 144.5 18.6 17.3 5.5 5.1 29.8 29.7 3.8 3.6
Tech Mahindra Buy 399 533 38,886 29,141 31,051 14.4 15.0 32.3 35.6 12.3 11.2 2.1 1.9 17.1 17.0 1.2 1.0
Wipro Neutral 287 - 139,885 55,421 58,536 20.3 20.3 35.1 36.5 8.2 7.9 1.4 1.2 19.2 14.6 1.9 1.7
Media
D B Corp Neutral 374 - 6,885 2,297 2,590 27.4 28.2 21.0 23.4 17.8 16.0 4.2 3.6 23.7 23.1 2.8 2.4
HT Media Neutral 87 - 2,016 2,693 2,991 12.6 12.9 7.9 9.0 11.0 9.6 0.9 0.9 7.8 8.3 0.3 0.2
Jagran Prakashan Buy 179 225 5,857 2,283 2,555 28.0 28.0 10.6 12.3 16.9 14.6 3.6 3.1 21.4 21.4 2.6 2.3
Sun TV Network Neutral 727 - 28,630 2,850 3,265 70.1 71.0 26.2 30.4 27.7 23.9 7.1 6.3 24.3 25.6 9.6 8.3Hindustan Media Ventures Neutral 270 - 1,982 1,016 1,138 24.3 25.2 27.3 30.1 9.9 9.0 1.9 1.7 16.2 15.8 1.3 1.1
TV Today Network Buy 235 344 1,400 608 667 21.5 22.3 15.7 19.2 15.0 12.2 2.3 2.0 16.1 16.0 1.9 1.6
Music Broadcast Limited Buy 350 434 1,997 271 317 91.0 109.0 6.0 10.0 58.3 35.0 3.6 3.3 6.5 9.3 7.0 5.7
Metals & Mining
Coal India Neutral 245 - 151,833 84,638 94,297 21.4 22.3 24.5 27.1 10.0 9.0 4.2 4.0 42.6 46.0 1.3 1.2
Hind. Zinc Neutral 285 - 120,253 14,252 18,465 55.9 48.3 15.8 21.5 18.0 13.2 2.9 2.6 17.0 20.7 8.4 6.5
Hindalco Neutral 235 - 52,733 107,899 112,095 7.4 8.2 9.2 13.0 25.6 18.1 1.2 1.2 4.8 6.6 1.0 0.9
JSW Steel Neutral 231 - 55,802 53,201 58,779 16.1 16.2 130.6 153.7 1.8 1.5 0.2 0.2 14.0 14.4 1.8 1.6
NMDC Neutral 127 - 40,324 6,643 7,284 44.4 47.7 7.1 7.7 18.0 16.6 1.6 1.5 8.8 9.2 3.8 3.5
SAIL Neutral 63 - 25,999 47,528 53,738 (0.7) 2.1 (1.9) 2.6 24.2 0.7 0.7 (1.6) 3.9 1.4 1.3
Vedanta Neutral 298 - 110,661 71,744 81,944 19.2 21.7 13.4 20.1 22.2 14.8 1.9 1.7 8.4 11.3 1.9 1.6
Tata Steel Neutral 616 - 59,803 121,374 121,856 7.2 8.4 18.6 34.3 33.1 18.0 2.1 1.9 6.1 10.1 1.1 1.1
Oil & Gas
GAIL Neutral 387 - 65,403 56,220 65,198 9.3 10.1 27.1 33.3 14.3 11.6 1.3 1.2 9.3 10.7 1.4 1.1
ONGC Neutral 164 - 210,401 137,222 152,563 15.0 21.8 19.5 24.1 8.4 6.8 0.7 0.7 8.5 10.1 1.8 1.6
www.angelbroking.com
Top Picks ReportAugust 08, 2017
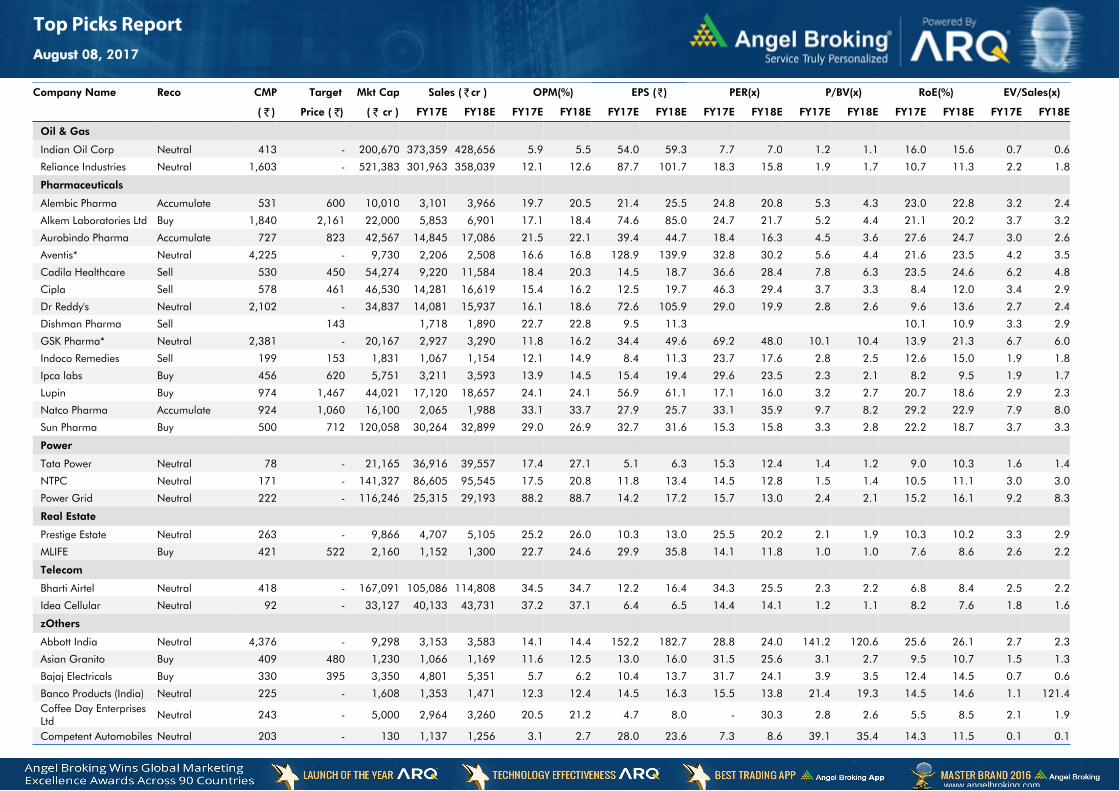
Company Name Reco CMP Target Mkt Cap Sales ( ₹cr ) OPM(%) EPS (₹) PER(x) P/BV(x) RoE(%) EV/Sales(x)
( ₹ ) Price ( ₹) ( ₹ cr ) FY17E FY18E FY17E FY18E FY17E FY18E FY17E FY18E FY17E FY18E FY17E FY18E FY17E FY18E
Oil & Gas
Indian Oil Corp Neutral 413 - 200,670 373,359 428,656 5.9 5.5 54.0 59.3 7.7 7.0 1.2 1.1 16.0 15.6 0.7 0.6
Reliance Industries Neutral 1,603 - 521,383 301,963 358,039 12.1 12.6 87.7 101.7 18.3 15.8 1.9 1.7 10.7 11.3 2.2 1.8
Pharmaceuticals
Alembic Pharma Accumulate 531 600 10,010 3,101 3,966 19.7 20.5 21.4 25.5 24.8 20.8 5.3 4.3 23.0 22.8 3.2 2.4
Alkem Laboratories Ltd Buy 1,840 2,161 22,000 5,853 6,901 17.1 18.4 74.6 85.0 24.7 21.7 5.2 4.4 21.1 20.2 3.7 3.2
Aurobindo Pharma Accumulate 727 823 42,567 14,845 17,086 21.5 22.1 39.4 44.7 18.4 16.3 4.5 3.6 27.6 24.7 3.0 2.6
Aventis* Neutral 4,225 - 9,730 2,206 2,508 16.6 16.8 128.9 139.9 32.8 30.2 5.6 4.4 21.6 23.5 4.2 3.5
Cadila Healthcare Sell 530 450 54,274 9,220 11,584 18.4 20.3 14.5 18.7 36.6 28.4 7.8 6.3 23.5 24.6 6.2 4.8
Cipla Sell 578 461 46,530 14,281 16,619 15.4 16.2 12.5 19.7 46.3 29.4 3.7 3.3 8.4 12.0 3.4 2.9
Dr Reddy's Neutral 2,102 - 34,837 14,081 15,937 16.1 18.6 72.6 105.9 29.0 19.9 2.8 2.6 9.6 13.6 2.7 2.4
Dishman Pharma Sell 143 1,718 1,890 22.7 22.8 9.5 11.3 10.1 10.9 3.3 2.9
GSK Pharma* Neutral 2,381 - 20,167 2,927 3,290 11.8 16.2 34.4 49.6 69.2 48.0 10.1 10.4 13.9 21.3 6.7 6.0
Indoco Remedies Sell 199 153 1,831 1,067 1,154 12.1 14.9 8.4 11.3 23.7 17.6 2.8 2.5 12.6 15.0 1.9 1.8
Ipca labs Buy 456 620 5,751 3,211 3,593 13.9 14.5 15.4 19.4 29.6 23.5 2.3 2.1 8.2 9.5 1.9 1.7
Lupin Buy 974 1,467 44,021 17,120 18,657 24.1 24.1 56.9 61.1 17.1 16.0 3.2 2.7 20.7 18.6 2.9 2.3
Natco Pharma Accumulate 924 1,060 16,100 2,065 1,988 33.1 33.7 27.9 25.7 33.1 35.9 9.7 8.2 29.2 22.9 7.9 8.0
Sun Pharma Buy 500 712 120,058 30,264 32,899 29.0 26.9 32.7 31.6 15.3 15.8 3.3 2.8 22.2 18.7 3.7 3.3
Power
Tata Power Neutral 78 - 21,165 36,916 39,557 17.4 27.1 5.1 6.3 15.3 12.4 1.4 1.2 9.0 10.3 1.6 1.4
NTPC Neutral 171 - 141,327 86,605 95,545 17.5 20.8 11.8 13.4 14.5 12.8 1.5 1.4 10.5 11.1 3.0 3.0
Power Grid Neutral 222 - 116,246 25,315 29,193 88.2 88.7 14.2 17.2 15.7 13.0 2.4 2.1 15.2 16.1 9.2 8.3
Real Estate
Prestige Estate Neutral 263 - 9,866 4,707 5,105 25.2 26.0 10.3 13.0 25.5 20.2 2.1 1.9 10.3 10.2 3.3 2.9
MLIFE Buy 421 522 2,160 1,152 1,300 22.7 24.6 29.9 35.8 14.1 11.8 1.0 1.0 7.6 8.6 2.6 2.2
Telecom
Bharti Airtel Neutral 418 - 167,091 105,086 114,808 34.5 34.7 12.2 16.4 34.3 25.5 2.3 2.2 6.8 8.4 2.5 2.2
Idea Cellular Neutral 92 - 33,127 40,133 43,731 37.2 37.1 6.4 6.5 14.4 14.1 1.2 1.1 8.2 7.6 1.8 1.6
zOthers
Abbott India Neutral 4,376 - 9,298 3,153 3,583 14.1 14.4 152.2 182.7 28.8 24.0 141.2 120.6 25.6 26.1 2.7 2.3
Asian Granito Buy 409 480 1,230 1,066 1,169 11.6 12.5 13.0 16.0 31.5 25.6 3.1 2.7 9.5 10.7 1.5 1.3
Bajaj Electricals Buy 330 395 3,350 4,801 5,351 5.7 6.2 10.4 13.7 31.7 24.1 3.9 3.5 12.4 14.5 0.7 0.6
Banco Products (India) Neutral 225 - 1,608 1,353 1,471 12.3 12.4 14.5 16.3 15.5 13.8 21.4 19.3 14.5 14.6 1.1 121.4Coffee Day Enterprises Ltd Neutral 243 - 5,000 2,964 3,260 20.5 21.2 4.7 8.0 - 30.3 2.8 2.6 5.5 8.5 2.1 1.9
Competent Automobiles Neutral 203 - 130 1,137 1,256 3.1 2.7 28.0 23.6 7.3 8.6 39.1 35.4 14.3 11.5 0.1 0.1
www.angelbroking.com
Top Picks ReportAugust 08, 2017
Company Name Reco CMP Target Mkt Cap Sales ( ₹cr ) OPM(%) EPS (₹) PER(x) P/BV(x) RoE(%) EV/Sales(x)
( ₹ ) Price ( ₹) ( ₹ cr ) FY17E FY18E FY17E FY18E FY17E FY18E FY17E FY18E FY17E FY18E FY17E FY18E FY17E FY18E
zOthers
Elecon Engineering Neutral 49 - 548 1,482 1,660 13.7 14.5 3.9 5.8 12.5 8.4 2.9 2.7 7.8 10.9 0.7 0.6
Finolex Cables Neutral 490 - 7,489 2,883 3,115 12.0 12.1 14.2 18.6 34.5 26.3 18.3 16.0 15.8 14.6 2.3 2.1
Garware Wall Ropes Neutral 900 - 1,970 863 928 15.1 15.2 36.4 39.4 24.7 22.9 4.5 3.8 17.5 15.9 2.2 2.0
Goodyear India* Neutral 871 - 2,010 1,598 1,704 10.4 10.2 49.4 52.6 17.6 16.6 81.4 71.4 18.2 17.0 0.9 134.3
Hitachi Neutral 2,030 - 5,521 2,081 2,433 8.8 8.9 33.4 39.9 60.8 50.9 49.0 40.9 22.1 21.4 2.6 2.2
HSIL Neutral 363 - 2,623 2,384 2,515 15.8 16.3 15.3 19.4 23.7 18.7 23.6 20.3 7.8 9.3 1.3 1.2
Interglobe Aviation Neutral 1,296 - 46,856 21,122 26,005 14.5 27.6 110.7 132.1 11.7 9.8 70.0 50.0 168.5 201.1 2.2 1.7
Jyothy Laboratories Neutral 382 - 6,934 1,440 2,052 11.5 13.0 8.5 10.0 44.9 38.2 10.9 10.1 18.6 19.3 5.1 3.6Kirloskar Engines India Ltd Neutral 395 - 5,712 2,554 2,800 9.9 10.0 10.5 12.1 37.6 32.6 15.7 14.9 10.7 11.7 1.9 1.7
Linc Pen & Plastics Neutral 259 - 383 382 420 9.3 9.5 13.5 15.7 19.2 16.5 3.3 2.9 17.1 17.3 1.1 1.0
M M Forgings Neutral 595 - 718 546 608 20.4 20.7 41.3 48.7 14.4 12.2 81.5 72.1 16.6 17.0 1.2 1.0
Manpasand Bever. Neutral 774 - 4,426 836 1,087 19.6 19.4 16.9 23.8 45.8 32.5 5.5 4.8 12.0 14.8 5.0 3.8
Mirza International Neutral 155 - 1,868 963 1,069 17.2 18.0 6.1 7.5 25.3 20.7 3.9 3.3 15.0 15.7 2.2 1.9
MT Educare Neutral 65 - 260 366 417 17.7 18.2 9.4 10.8 7.0 6.0 1.5 1.3 22.2 22.3 0.6 0.5
Narayana Hrudaya Neutral 301 - 6,147 1,873 2,166 11.5 11.7 2.6 4.0 113.7 75.9 7.0 6.3 6.1 8.3 3.4 2.9
Navkar Corporation Buy 188 265 2,685 347 371 43.2 37.3 6.7 6.0 28.2 31.4 1.9 1.7 6.2 10.6 8.9 8.3
Navneet Education Neutral 162 - 3,774 1,062 1,147 24.0 24.0 6.1 6.6 26.5 24.4 5.5 4.8 20.6 19.8 3.6 3.4
Nilkamal Neutral 1,679 - 2,506 1,995 2,165 10.7 10.4 69.8 80.6 24.1 20.8 96.0 83.3 16.6 16.5 1.3 1.1
Page Industries Neutral 16,227 - 18,099 2,450 3,124 20.1 17.6 299.0 310.0 54.3 52.3 361.4 275.9 47.1 87.5 7.4 5.9
Parag Milk Foods Neutral 247 - 2,074 1,919 2,231 9.3 9.6 9.5 12.9 26.1 19.1 4.1 3.3 15.5 17.5 1.2 1.1
Quick Heal Neutral 209 - 1,465 408 495 27.3 27.0 7.7 8.8 27.0 23.7 2.5 2.5 9.3 10.6 2.7 2.3
Radico Khaitan Neutral 148 - 1,965 1,667 1,824 13.0 13.2 6.7 8.2 22.2 18.0 2.0 1.8 9.0 10.2 1.6 1.4
Relaxo Footwears Neutral 497 - 5,974 2,085 2,469 9.2 8.2 7.6 8.0 65.8 62.6 25.5 21.8 17.9 18.8 3.0 2.5
S H Kelkar & Co. Neutral 260 - 3,754 1,036 1,160 15.1 15.0 6.1 7.2 42.5 36.2 4.5 4.2 10.7 11.5 3.5 3.1
Siyaram Silk Mills Buy 2,024 2,500 1,897 1,574 1,769 12.5 12.7 97.1 113.1 20.8 17.9 3.2 2.8 15.4 15.5 1.4 1.3
Styrolution ABS India* Neutral 975 - 1,715 1,440 1,537 9.2 9.0 40.6 42.6 24.0 22.9 61.3 55.8 12.3 11.6 1.2 1.0
Surya Roshni Neutral 271 - 1,187 3,342 3,625 7.8 7.5 17.3 19.8 15.7 13.7 29.8 23.9 10.5 10.8 0.6 0.6
Team Lease Serv. Neutral 1,423 - 2,432 3,229 4,001 1.5 1.8 22.8 32.8 62.5 43.3 6.7 5.8 10.7 13.4 0.7 0.5
The Byke Hospitality Neutral 197 - 790 287 384 20.5 20.5 7.6 10.7 25.9 18.4 5.4 4.4 20.7 23.5 2.8 2.1
www.angelbroking.com
Top Picks ReportAugust 08, 2017
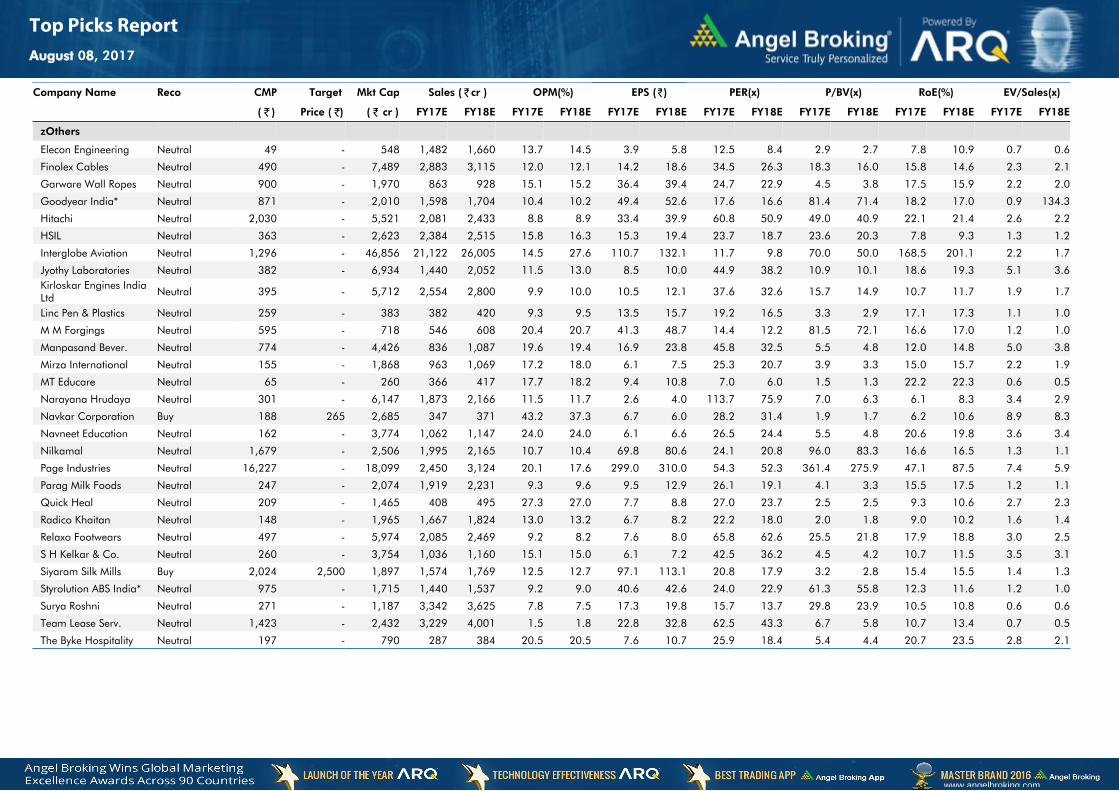
Company Name Reco CMP Target Mkt Cap Sales ( ₹cr ) OPM(%) EPS (₹) PER(x) P/BV(x) RoE(%) EV/Sales(x)
( ₹ ) Price ( ₹) ( ₹ cr ) FY17E FY18E FY17E FY18E FY17E FY18E FY17E FY18E FY17E FY18E FY17E FY18E FY17E FY18E
zOthers
Transport Corporation of India Neutral 291 - 2,229 2,671 2,911 8.5 8.8 13.9 15.7 21.0 18.6 2.9 2.6 13.7 13.8 0.9 0.9
TVS Srichakra Neutral 3,536 - 2,708 2,304 2,614 13.7 13.8 231.1 266.6 15.3 13.3 397.4 312.9 33.9 29.3 1.2 1.0
UFO Moviez Neutral 363 - 1,002 619 685 33.2 33.4 30.0 34.9 12.1 10.4 1.7 1.5 13.8 13.9 1.3 1.0
Visaka Industries Neutral 475 - 754 1,051 1,138 10.3 10.4 21.0 23.1 22.6 20.5 60.9 57.0 9.0 9.2 1.0 0.9
VRL Logistics Neutral 344 - 3,135 1,902 2,119 16.7 16.6 14.6 16.8 23.6 20.4 5.2 4.5 21.9 22.2 1.8 1.6
VIP Industries Accumulate 192 218 2,711 1,270 1,450 10.4 10.4 5.6 6.5 34.3 29.5 7.1 6.2 20.7 21.1 2.1 1.9
Navin Fluorine Neutral 725 - 3,570 789 945 21.1 22.4 24.0 28.7 30.2 25.3 4.9 4.2 17.8 18.5 4.5 3.6
Source: Company, Angel Research; Note: *December year end; #September year end; &October year end; Price as on August 08, 2017
www.angelbroking.com
Top Picks ReportAugust 08, 2017
Top Picks Report | August 2017
August 8, 2017 18
Research Team Tel: 022 - 39357800 E-mail: [email protected] Website: www.angelbroking.com
DISCLAIMER
Angel Broking Private Limited (hereinafter referred to as “Angel”) is a registered Member of National Stock Exchange of India Limited, Bombay Stock Exchange Limited and Metropolitan Stock Exchange Limited. It is also registered as a Depository Participant with CDSL and Portfolio Manager with SEBI. It also has registration with AMFI as a Mutual Fund Distributor. Angel Broking Private Limited is a registered entity with SEBI for Research Analyst in terms of SEBI (Research Analyst) Regulations, 2014 vide registration number INH000000164. Angel or its associates has not been debarred/ suspended by SEBI or any other regulatory authority for accessing /dealing in securities Market. Angel or its associates/analyst has not received any compensation / managed or co-managed public offering of securities of the company covered by Analyst during the past twelve months.
This document is solely for the personal information of the recipient, and must not be singularly used as the basis of any investment decision. Nothing in this document should be construed as investment or financial advice. Each recipient of this document should make such investigations as they deem necessary to arrive at an independent evaluation of an investment in the securities of the companies referred to in this document (including the merits and risks involved), and should consult their own advisors to determine the merits and risks of such an investment.
Reports based on technical and derivative analysis center on studying charts of a stock's price movement, outstanding positions and trading volume, as opposed to focusing on a company's fundamentals and, as such, may not match with a report on a company's fundamentals. Investors are advised to refer the Fundamental and Technical Research Reports available on our website to evaluate the contrary view, if any.
The information in this document has been printed on the basis of publicly available information, internal data and other reliable sources believed to be true, but we do not represent that it is accurate or complete and it should not be relied on as such, as this document is for general guidance only. Angel Broking Pvt. Limited or any of its affiliates/ group companies shall not be in any way responsible for any loss or damage that may arise to any person from any inadvertent error in the information contained in this report. Angel Broking Pvt. Limited has not independently verified all the information contained within this document. Accordingly, we cannot testify, nor make any representation or warranty, express or implied, to the accuracy, contents or data contained within this document. While Angel Broking Pvt. Limited endeavors to update on a reasonable basis the information discussed in this material, there may be regulatory, compliance, or other reasons that prevent us from doing so.
This document is being supplied to you solely for your information, and its contents, information or data may not be reproduced, redistributed or passed on, directly or indirectly.
Neither Angel Broking Pvt. Limited, nor its directors, employees or affiliates shall be liable for any loss or damage that may arise from or in connection with the use of this information.
Ratings (Based on expected returns Buy (> 15%) Accumulate (5% to 15%) Neutral (-5 to 5%) over 12 months investment period): Reduce (-5% to -15%) Sell (< -15)