and physics chemistry atmospheric ... - atmos-chem-phys.net · atmos. chem. phys., 3, 1131–1145,...
TRANSCRIPT
Atmos. Chem. Phys., 3, 1131–1145, 2003www.atmos-chem-phys.org/acp/3/1131/ Atmospheric
Chemistryand Physics
The rate of water vapor evaporation from ice substrates in thepresence of HCl and HBr: implications for the lifetime ofatmospheric ice particles
C. Delval, B. Fluckiger, and M. J. Rossi
Laboratory of Air and Soil Pollution Studies (LPAS), Swiss Federal Institute of Technology (EPFL), CH-1015 Lausanne,Switzerland
Received: 4 March 2003 – Published in Atmos. Chem. Phys. Discuss.: 9 May 2003Revised: 10 July 2003 – Accepted: 24 July 2003 – Published: 21 August 2003
Abstract. Using a multidiagnostic approach the rateRev [molec cm−3 s−1
] or flux Jev [molec cm−2 s−1] of evap-
oration of H2O and its corresponding rate constant for con-densation, kcond[s−1], on a 1µm thick ice film have beenstudied in the temperature range 190 to 240 K as well asin the presence of small amounts of HCl and HBr thatleft the vapor pressure of H2O on ice unchanged. Theresulting Arrhenius expressions for pure ice areJev =
1.6 · 1028±1· exp
(−10.3±1.2
RT
)[molec cm−2 s−1
], kcond =
1.7 · 10−2±1· exp
(+1.6±1.5
RT
)[s−1], in the presence of a
HCl mole fraction in the range 3.2 · 10−5− 6.4 · 10−3:
Jev = 6.4 · 1026±1· exp
(−9.7±1.2
RT
)[molec cm−2 s−1
],
kcond = 2.8 · 10−3±1· exp
(+1.5±1.6
RT
)[s−1], and a HBr
mole fraction smaller than 6.4 · 10−3: Jev = 7.4 · 1025±1·
exp(
−9.1±1.2RT
)[molec cm−2 s−1
], kcond = 7.1 · 10−5±1·
exp(
+2.6±1.5RT
)[s−1]. The small negative activation en-
ergy for H2O condensation on ice points to a precursormechanism. The corresponding enthalpy of sublimation is1Hsubl = Eev − Econd = 11.9 ± 2.7 kcal mol−1, 1Hsubl =
11.2 ± 2.8 kcal mol−1, and1Hsubl = 11.7 ± 2.8 kcal mol−1
whose values are identical within experimental uncertaintyto the accepted literature value of 12.3 kcal mol−1. Inter-ferometric data at 633 nm and FTIR absorption spectra intransmission support the kinetic results. The data are con-sistent with a significant lifetime enhancement for HCl- andHBr-contaminated ice particles by a factor of 3–6 and 10–20, respectively, for submonolayer coverages of HX once thefraction of the ice not contaminated by HX has evaporated.
Correspondence to:M. J. Rossi ([email protected])
1 Introduction
Heterogeneous reactions occurring on the surface of polarstratospheric clouds (PSC’s) are known to play an importantrole in controlling the abundance of O3 in the polar strato-sphere by converting hydrogen halide reservoir species HX(X = Br,Cl) into photolytically active halogens (Solomon etal., 1986; Tolbert et al., 1987; Wennberg et al., 1997; WMOReport, 2002). In addition, recent studies indicate that Cirruscloud ice particles near the tropopause may act as substratesfor heterogeneous reactions akin to PSC’s with a similarlyhigh efficiency (Borrmann et al., 1996; Solomon et al., 1997).Contrary to the polar stratosphere where the persistence ofPSC’s is sufficient for complete heterogeneous processing ofhalogen containing reservoir molecules, the situation in themidlatitude upper troposphere is quite different. Natural oraviation-induced Cirrus clouds have a limited lifetime dur-ing which heterogeneous processing may occur. Borrmannet al. have assumed an average cloud lifetime of only 20 minwhich nevertheless led to a significant predicted impact onatmospheric chemistry. Therefore, the evaporative lifetimeof Cirrus ice particles and the impact of atmospheric tracegas adsorbates such as HX on this lifetime are important pa-rameters controlling the extent of heterogeneous processes.
For several years, a considerable number of studies on thekinetics of evaporation of H2O on ice has been performed.Some of these studies have focused on the temperature de-pendence of the rates of evaporation and condensation ofH2O on pure ice using different techniques (Haynes et al.,1992; Brown et al., 1996; Chaix et al., 1998; Fraser et al.,2001). Others have mainly revealed the impact of trace gasesof atmospheric importance on the evaporation rates, such asHNO3 (Diehl et al., 1998; Warshawsky et al., 1999), HCl or
c© European Geosciences Union 2003
1132 C. Delval et al.: Rate of water vapor evaporation from ice substrates in the presence of HCl and HBr
HBr (Hudson et al., 2001). The main result of these studiesis the observation of the decrease of the rate of evaporationof H2O (Rev) on doped ice compared to Rev on pure ice tovariable extents. In this work both the kinetics of conden-sation (kc) and evaporation (Rev) have been measured underthe same experimental conditions which has to our knowl-edge not been done before. The emphasis of the present worklies in the experimental separation of kc and Rev in order toobtain thermochemical closure with the H2O vapor pressureover ice which imposes a powerful constraint on the separa-tion of the rate of condensation and evaporation.
Several studies address the direct investigation of the con-densed phase of H2O in order to characterize the ice sub-strate using FTIR spectroscopy. Thus, the investigation ofthe IR absorption spectrum of pure ice has been undertaken(Schriver-Mazzuoli et al., 2000) in order to spectroscopicallycharacterize the ice structure, as well as the impact of HNO3,HCl and HBr deposition (Ritzhaupt et al., 1990; Delzeit etal., 1993; Koehler et al., 1993; Horn et al., 1997; Domine etal., 2001; Zondlo et al., 2000; Hudson et al., 2001). This ledto the discovery of different surface species owing either tothe formation of stoichiometric hydrates or amorphous mix-tures. Because most of the aforementioned experiments havebeen performed under UHV conditions, they have been lim-ited to temperatures well below 220 K which is the charac-teristic temperature of the tropopause and is of interest here.Therefore, we have extended the temperature range to 240 Kin the present work in order to address atmospheric condi-tions of the upper troposphere/lower stratosphere region.
2 Experimental apparatus
The present experiment is a stirred flow reactor equippedwith triple diagnostics. It allows FTIR spectroscopic char-acterization of the ice substrate in transmission as well asobservation of the changes of the condensed phase thicknessbased on HeNe interferometry at 632.8 nm. In addition, aresidual gas mass spectrometer enables the monitoring of thepartial pressures above the HX/Ice condensate. The experi-mental apparatus consists of a stainless steel cylindrical reac-tor of volume Vr = 1750 or 2450 cm3, equipped with variousinlets and electrical and optical feedthroughs including two2′′ diameter NaCl windows to enable FTIR monitoring of theHX/Ice condensate. The reactor is pumped at the bottom bya turbomolecular-pump (VARIAN Turbo-300VHT, 250 l s−1
N2) through a 6′′ diameter gate valve that is closed during ex-periment, thus isolating the upper (reactor) and lower cham-ber, the latter of which is monitored by a residual gas massspectrometer (BALZERS Prisma QMS200). The liquid ni-trogen cryostat, mounted on top of the reactor and externallyheated using electrical cartridge heaters allows for accuratetemperature control of the NaCl or Si optical window serv-ing as the substrate for ice deposited from the vapor phase inthe range 100≤T/K≤250 (±1 K). The ice temperature is pe-
2
7
6
4
5
1
3
10
9
8
11
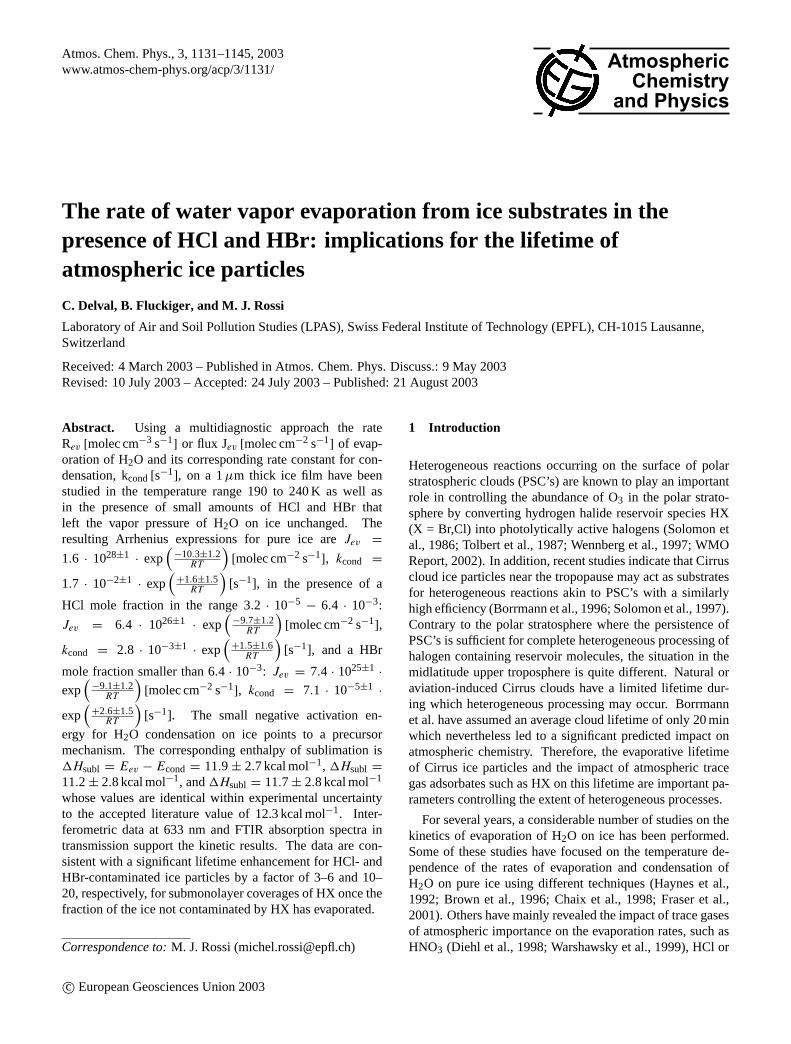
Fig. 1. Schematic drawing of the experiment:1 Liquid nitrogenreservoir,2 Evacuated Dewar vessel,3 Silicon window of 0.78cm2 area used as a substrate for H2O deposition,4 Calibrated leakequipped with a valve allowingstatic(valve closed) andstirred flow(valve open) experiments,5 6”diameter gate valve,6 Flange forTurbo Pump,7 Quadrupole Mass spectrometer,8 PTFE thermal in-sulation isolating the whole cryostat but the Silicon window whichis the only low temperature part exposed to the gas phase,9 Reactorchamber,10 Solid copper finger with cartridge heaters for heatingused to control the temperature of the Silicon Substrate,11 Abso-lute pressure gauge (Baratron). Several type T thermocouples (notshown here) are located throughout the vacuum side of the cryo-stat in order to measure the temperature in different areas (Siliconwindow, PTFE Insulation, Reactor and Calibrated Leak walls,...).In addition, two 2′′ diameter NaCl windows allow the FTIR moni-toring of the condensed phase, and two inlets allow the injection ofH2O as well as HX into the reactor. The hollow arrows describe theimportant kinetic processes taking place, such as adsorption, des-orption and effusion of H2O vapor.
riodically checked against the vapor pressure of H2O over ice(Marti et al., 1993) using a type T thermocouple and a Bara-tron absolute pressure gauge (220-AHS). We would like tostress that in contrast to most other cryostats presently in usethe Si window of 0.78 cm2 cross section used as the substratefor the ice films is the only cold part of the chamber exposedto the gas phase (see Fig. 1). This has been checked in nu-merous experiments by correlating the loss of H2O vapor bymonitoring the pressure change in a Teflon (FEP)-coated cal-ibrated volume used as a reservoir for the injection of H2Omolecules into the reactor with the number of molecules de-posited on the Si window by monitoring the optical density inthe IR spectral region and the integrated MS signal resultingfrom the evaporation of the ice film.
Three types of measurements have been performed in thepresent experiment. The first is based on the use of a resid-ual gas MS which is connected to the upper chamber bothby a 6” diameter gate valve and a calibrated leak whose rateconstant for effusion of H2O and HCl at ambient tempera-ture are kesc(H2O) = 0.055 s−1 and kesc(HCl) = 0.043 s−1,
Atmos. Chem. Phys., 3, 1131–1145, 2003 www.atmos-chem-phys.org/acp/3/1131/
C. Delval et al.: Rate of water vapor evaporation from ice substrates in the presence of HCl and HBr 1133
respectively. These values have been obtained from the eval-uation of the exponential decrease of the pressure in the reac-tor measured using a 1 mbar full scale Baratron gauge (MKSBaratron pressure transducer Type 220AHS) when it is setfrom static to stirred flow condition by opening the calibratedleak valve. This leak allows the use of the reactor either un-der static conditions with the calibrated leak closed or as astirred flow reactor with the leak valve open (see Fig. 1). Itoperates from the free molecular flow regime to the transitionregion up to a mbar or so of total pressure. In this latter con-figuration the range of water partial pressures (PH2O) in theupper chamber ranges from 10−4 to 1 mbar and is measuredusing the 1 mbar full scale Baratron gauge. For the remainderof this paper pressure units of Torr will be used throughout.The conversion of Torr to mbar may be performed using therelation 1 mbar = 0.75 Torr. The gas composition during anexperiment is continuously monitored using the MS with thecalibrated leak valve open.
The second diagnostic is based on a Fourier Transform In-frared Spectrometer (BIORAD FTS-575C) used in transmis-sion across the Si window. It characterizes the compositionchanges of the condensed phase, which corresponds 1:1 tochanges of the gas phase composition as the optical windowis the coldest point of the whole reactor owing to extensivethermal insulation of the cryostat but the optical window. Itwas achieved using a tightly fitted PTFE sleeve whose tem-perature never got lower than approximately 260K for all ex-periments. Therefore, any change in the optical density ofthe deposited film due to evaporation or condensation in thestatic cryostat system is accompanied by a change in PH2Owhich can be monitored using either the partial pressure(MS) or the absolute pressure gauge. All the FTIR scans pre-sented in this work have been recorded on a cryogenic mer-cury cadmium telluride detector using a resolution of 1 cm−1
and correspond to averaging of 4 consecutive scans.The third diagnostic technique is based on He-Ne interfer-
ometry used to monitor changes of the thickness of the icedeposit with time. In such a configuration described else-where (Berland et al., 1994), the change of the thicknessdi
is given by the relation
di = Ni
λ
2
1√n2
i − sin2 θ
(1)
wheredi is the total change in thickness of the ice film, Ni
the number of observed fringes,λ = 632.8nm the wave-length of the He-Ne laser, ni the refractive index of vapordeposited ice set to ni=1.3 and independent of T in the range180–220 K (Berland et al., 1995), andθ = 12◦, the anglebetween the normal to the ice surface and the incident He-Ne beam. Using the appropriate parameters for the presentcryostat one obtainsdi = 246× Ni nm which indicates adifferencedi in ice thickness of 246 nm between the homol-ogous points of two adjacent interference fringes. This leadsto the number of water molecules deposited on the substrate
HCl H2O
Dosing gas inlets
Silicon window
Copper finger
PTFE insulation
Infrared beam
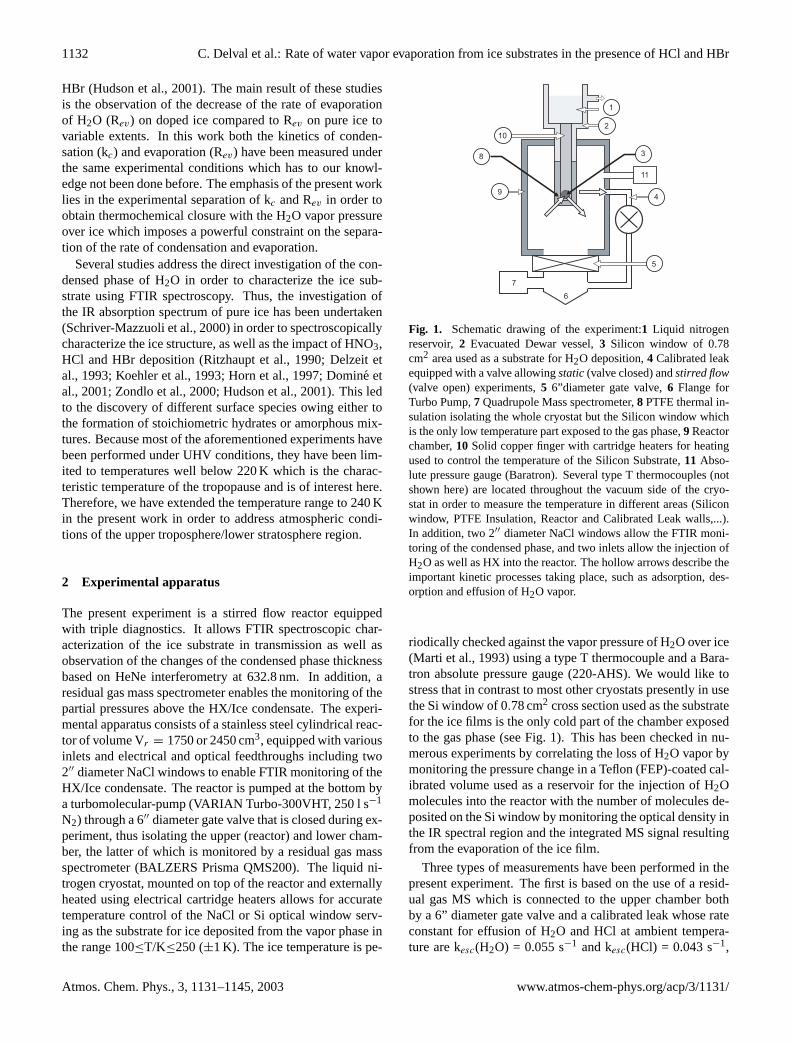
Fig. 2. Horizontal cut through dosing tubes and IR beam transmit-ted across the Si window. The PTFE-insulated copper finger of thecryostat is arranged perpendicularly to the reference plane.
of NH2O = 6.2×10¹⁷×Ni with the density of ice assumed to
be constant and equal to 0.93 g cm−3 (Berland et al., 1995)in the range 180 to 220 K. The ice film is grown under staticconditions by deposition from water vapor using bidistilledwater at a typical rate of 1017 molecule s−1 by flowing H2Ovapor across a gas dosing tube directed towards the opticalsubstrate. The mean ice thickness is approximately 1µm be-fore HCl deposition starts.
Figure 2 presents a horizontal cut of the dosing arrange-ment whose plane contains the two dosing tubes as well asthe IR beam transmitted across the Si window. The flat faceof the Si window mounted at the lower end of the cryostat isperpendicular to the reference (paper) plane.
The measurement of the dose of HCl or HBr dispensed onthe deposited ice film follows a two-pronged strategy whichconsists of (1) establishing the absolute flow rate of HX ad-mitted into the cryostat chamber using MS signals understirred flow conditions, and (2) integrating the amount of HCllost by adsorption from the gas phase to the ice film, both bymonitoring the gas phase using the residual gas MS as wellas the condensed phase using FTIR transmission. Step (1)involves monitoring the MS signal atm/e = 36 for HCl andm/e = 82 for HBr, with the gate valve closed and the cali-brated leak open thus enabling gas phase monitoring on-lineunder stirred flow condition. Previously, the MS signal in-tensities for HCl had been calibrated thus leading to a 1:1 re-lationship between the MS signals and the HCl concentrationin the chamber. Using the known values of kesc for HCl, themeasurement of the partial pressure of the trace gas using the
www.atmos-chem-phys.org/acp/3/1131/ Atmos. Chem. Phys., 3, 1131–1145, 2003
1134 C. Delval et al.: Rate of water vapor evaporation from ice substrates in the presence of HCl and HBr
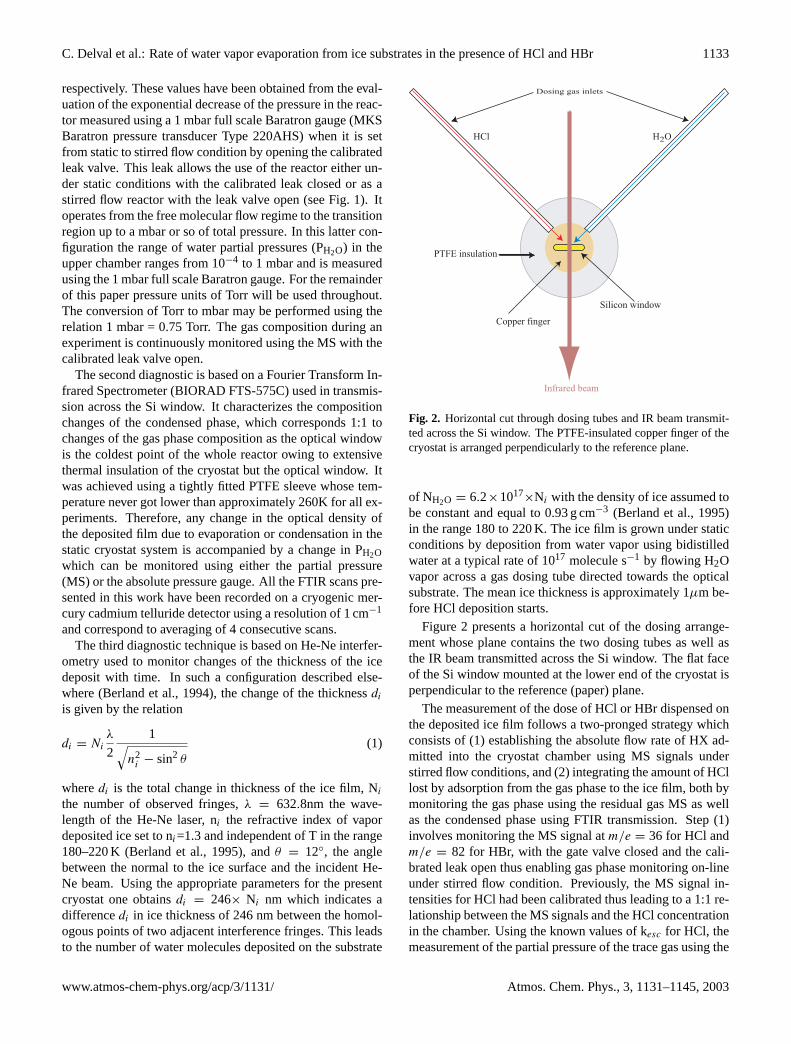
Table 1. Data on experimental hardware configuration and results of calibrations. The sample surface area is As=0.78 cm2
Experiment Reactor Reactor Collision Rate of effusion Calculated HeNe Thickness Thickness [nm] MS CalibrationTemperature Volume frequency on for calibrated escape angle for one for factor
configuration [K] [cm3] ice [s−1] leak [s−1] orifice [mm2] [degree] HeNe fringe [nm] FTIR OD=1.08 [molec s−1 A−1]H2O HCl H2O HCl H2O HCl
1 300 1750 6.52 4.62 0.2 0.13 2.4 12 246 1000 5.80 · 1024 6.31 · 1024
2 330 2450 4.89 3.46 0.055 0.043 0.8 12 246 1000 5.70 · 1023 6.25 · 1023
Baratron gauge in the cryostat chamber or the correspondingMS signal of HCl leads to the absolute flow rate in molec s−1
according to Eq. (2):
FlowRate=PV
RTkesc = [HCl] V kesc = CV kescPHCl (2)
whereC is the conversion factor between partial pressure ofHCl and HCl concentration in molec Torr−1 cm−3 (3.2·1016
and 2.9 · 1016 for configurations 1 and 2, respectively, dis-played in Table 1), PHCl the pressure of HCl in Torr,V thevolume of the reactor and kesc the rate of effusion of HClthrough the calibrated leak in s−1 (see Table 1 for detailedinformation). The same technique has been used for all gasesthroughout this work. Moreover, the inlet made out of glasstubing and used for trace gas injection into the upper chamberis equipped with a micrometer dosing valve (Swagelok dou-ble pattern low-pressure metering valve with Vernier handleof type SS-SS2-D-TVVH) and is located between the cali-brated volume used as a reservoir for HX and the inlet dosingtube, we have calibrated this valve by establishing the corre-spondence between the size of its aperture and the resultingMS signal, thus leading to an absolute calibration of the flowrate of HX molecules injected versus the aperture size of themicrometer dosing valve. Step (2) consists of integrating theabsolute flow of HCl that was condensed onto the ice filmin order to determine the HCl dose. As the window of thecryostat exposed to the gas is known to be the only part thatis at low temperature during the experiment, the differenceof the integrals of the MS signal of HX with the optical sub-strate at ambient temperature (no ice) and in the presence ofan ice film, enables the evaluation of the absolute number ofmolecules deposited onto the ice.
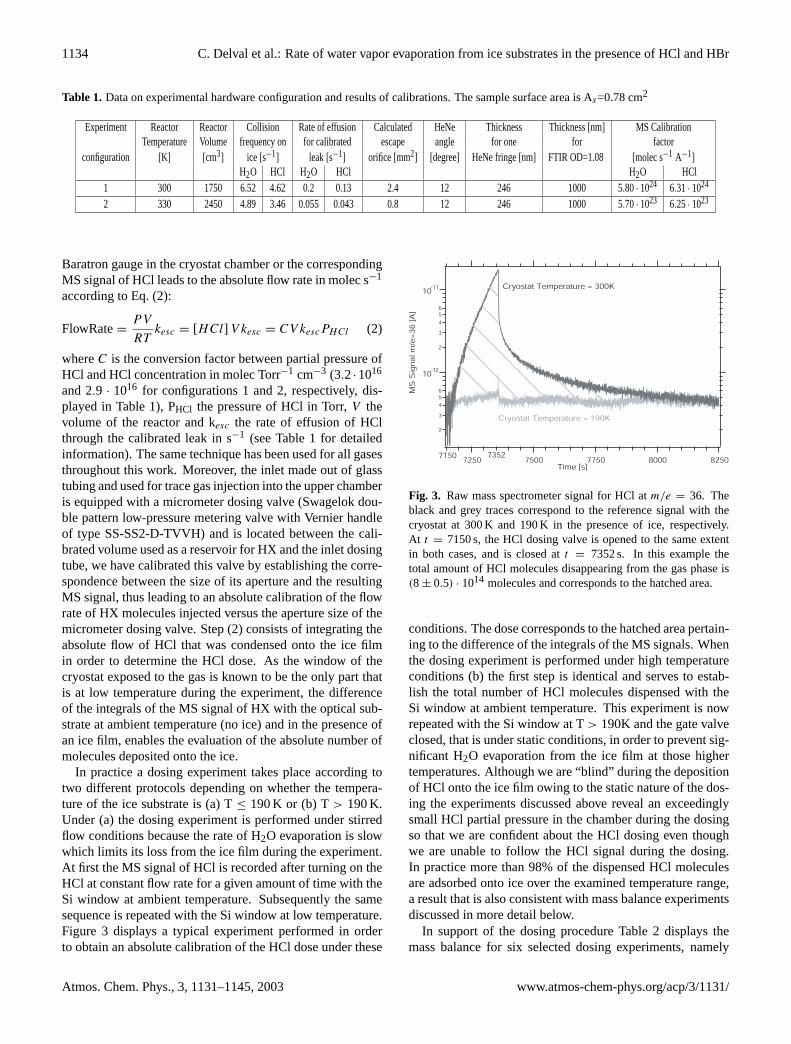
In practice a dosing experiment takes place according totwo different protocols depending on whether the tempera-ture of the ice substrate is (a) T≤ 190 K or (b) T> 190 K.Under (a) the dosing experiment is performed under stirredflow conditions because the rate of H2O evaporation is slowwhich limits its loss from the ice film during the experiment.At first the MS signal of HCl is recorded after turning on theHCl at constant flow rate for a given amount of time with theSi window at ambient temperature. Subsequently the samesequence is repeated with the Si window at low temperature.Figure 3 displays a typical experiment performed in orderto obtain an absolute calibration of the HCl dose under these
2
3
4
56
10-12
2
3
4
56
10-11
82508000775075007250Time [s]
MS
Sig
na
l m/e
=3
6 [
A]
Cryostat Temperature = 300K
7150 7352
Cryostat Temperature = 190K
Fig. 3. Raw mass spectrometer signal for HCl atm/e = 36. Theblack and grey traces correspond to the reference signal with thecryostat at 300 K and 190 K in the presence of ice, respectively.At t = 7150 s, the HCl dosing valve is opened to the same extentin both cases, and is closed att = 7352 s. In this example thetotal amount of HCl molecules disappearing from the gas phase is(8 ± 0.5) · 1014 molecules and corresponds to the hatched area.
conditions. The dose corresponds to the hatched area pertain-ing to the difference of the integrals of the MS signals. Whenthe dosing experiment is performed under high temperatureconditions (b) the first step is identical and serves to estab-lish the total number of HCl molecules dispensed with theSi window at ambient temperature. This experiment is nowrepeated with the Si window at T> 190K and the gate valveclosed, that is under static conditions, in order to prevent sig-nificant H2O evaporation from the ice film at those highertemperatures. Although we are “blind” during the depositionof HCl onto the ice film owing to the static nature of the dos-ing the experiments discussed above reveal an exceedinglysmall HCl partial pressure in the chamber during the dosingso that we are confident about the HCl dosing even thoughwe are unable to follow the HCl signal during the dosing.In practice more than 98% of the dispensed HCl moleculesare adsorbed onto ice over the examined temperature range,a result that is also consistent with mass balance experimentsdiscussed in more detail below.
In support of the dosing procedure Table 2 displays themass balance for six selected dosing experiments, namely
Atmos. Chem. Phys., 3, 1131–1145, 2003 www.atmos-chem-phys.org/acp/3/1131/
C. Delval et al.: Rate of water vapor evaporation from ice substrates in the presence of HCl and HBr 1135
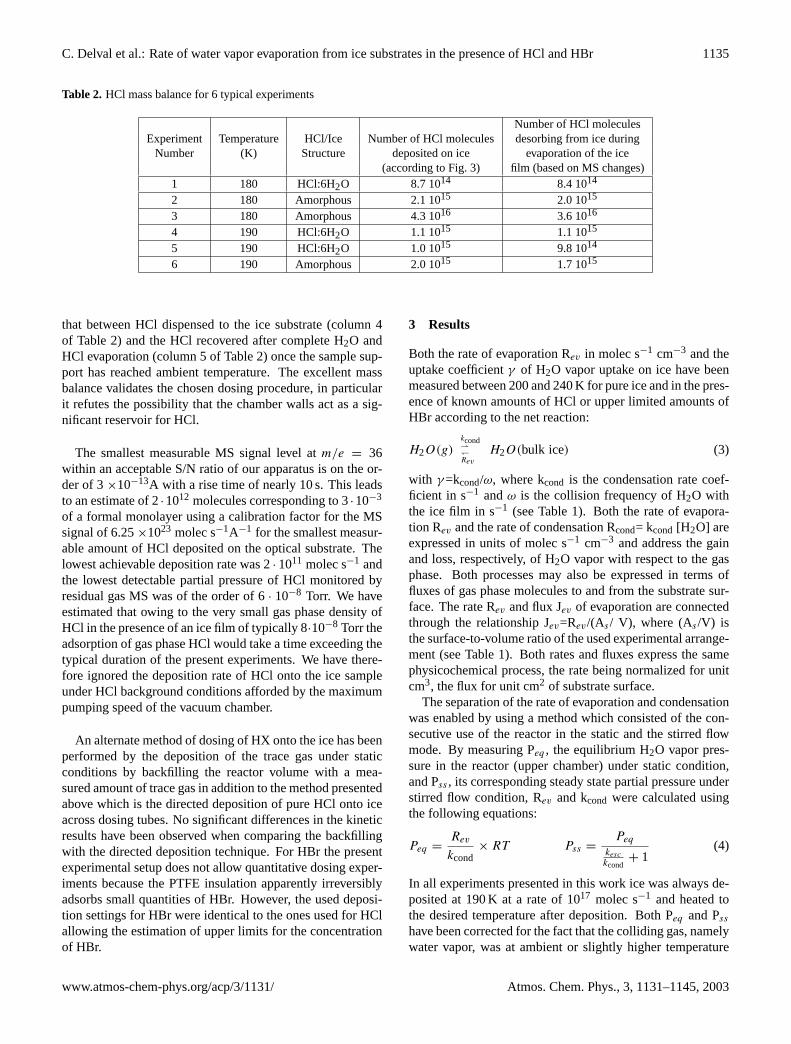
Table 2. HCl mass balance for 6 typical experiments
Number of HCl moleculesExperiment Temperature HCl/Ice Number of HCl molecules desorbing from ice during
Number (K) Structure deposited on ice evaporation of the ice(according to Fig. 3) film (based on MS changes)
1 180 HCl:6H2O 8.7 1014 8.4 1014
2 180 Amorphous 2.1 1015 2.0 1015
3 180 Amorphous 4.3 1016 3.6 1016
4 190 HCl:6H2O 1.1 1015 1.1 1015
5 190 HCl:6H2O 1.0 1015 9.8 1014
6 190 Amorphous 2.0 1015 1.7 1015
that between HCl dispensed to the ice substrate (column 4of Table 2) and the HCl recovered after complete H2O andHCl evaporation (column 5 of Table 2) once the sample sup-port has reached ambient temperature. The excellent massbalance validates the chosen dosing procedure, in particularit refutes the possibility that the chamber walls act as a sig-nificant reservoir for HCl.
The smallest measurable MS signal level atm/e = 36within an acceptable S/N ratio of our apparatus is on the or-der of 3×10⁻¹³A with a rise time of nearly 10 s. This leadsto an estimate of 2·1012 molecules corresponding to 3·10−3
of a formal monolayer using a calibration factor for the MSsignal of 6.25×10²³ molec s−1A−1 for the smallest measur-able amount of HCl deposited on the optical substrate. Thelowest achievable deposition rate was 2· 1011 molec s−1 andthe lowest detectable partial pressure of HCl monitored byresidual gas MS was of the order of 6· 10−8 Torr. We haveestimated that owing to the very small gas phase density ofHCl in the presence of an ice film of typically 8·10−8 Torr theadsorption of gas phase HCl would take a time exceeding thetypical duration of the present experiments. We have there-fore ignored the deposition rate of HCl onto the ice sampleunder HCl background conditions afforded by the maximumpumping speed of the vacuum chamber.
An alternate method of dosing of HX onto the ice has beenperformed by the deposition of the trace gas under staticconditions by backfilling the reactor volume with a mea-sured amount of trace gas in addition to the method presentedabove which is the directed deposition of pure HCl onto iceacross dosing tubes. No significant differences in the kineticresults have been observed when comparing the backfillingwith the directed deposition technique. For HBr the presentexperimental setup does not allow quantitative dosing exper-iments because the PTFE insulation apparently irreversiblyadsorbs small quantities of HBr. However, the used deposi-tion settings for HBr were identical to the ones used for HClallowing the estimation of upper limits for the concentrationof HBr.
3 Results
Both the rate of evaporation Rev in molec s−1 cm−3 and theuptake coefficientγ of H2O vapor uptake on ice have beenmeasured between 200 and 240 K for pure ice and in the pres-ence of known amounts of HCl or upper limited amounts ofHBr according to the net reaction:
H2O(g)kcond⇀↽Rev
H2O(bulk ice) (3)
with γ =kcond/ω, where kcond is the condensation rate coef-ficient in s−1 andω is the collision frequency of H2O withthe ice film in s−1 (see Table 1). Both the rate of evapora-tion Rev and the rate of condensation Rcond= kcond [H2O] areexpressed in units of molec s−1 cm−3 and address the gainand loss, respectively, of H2O vapor with respect to the gasphase. Both processes may also be expressed in terms offluxes of gas phase molecules to and from the substrate sur-face. The rate Rev and flux Jev of evaporation are connectedthrough the relationship Jev=Rev/(As / V), where (As /V) isthe surface-to-volume ratio of the used experimental arrange-ment (see Table 1). Both rates and fluxes express the samephysicochemical process, the rate being normalized for unitcm3, the flux for unit cm2 of substrate surface.
The separation of the rate of evaporation and condensationwas enabled by using a method which consisted of the con-secutive use of the reactor in the static and the stirred flowmode. By measuring Peq , the equilibrium H2O vapor pres-sure in the reactor (upper chamber) under static condition,and Pss , its corresponding steady state partial pressure understirred flow condition, Rev and kcond were calculated usingthe following equations:
Peq =Rev
kcond× RT Pss =
Peq
kesc
kcond+ 1
(4)
In all experiments presented in this work ice was always de-posited at 190 K at a rate of 1017 molec s−1 and heated tothe desired temperature after deposition. Both Peq and Psshave been corrected for the fact that the colliding gas, namelywater vapor, was at ambient or slightly higher temperature
www.atmos-chem-phys.org/acp/3/1131/ Atmos. Chem. Phys., 3, 1131–1145, 2003
1136 C. Delval et al.: Rate of water vapor evaporation from ice substrates in the presence of HCl and HBr
1.0
0.8
0.6
0.4
0.2
0.0
6005004003002001000
Time [s]
HeN
e s
ignal [
a.u
.]
50
A
C
E
D
B
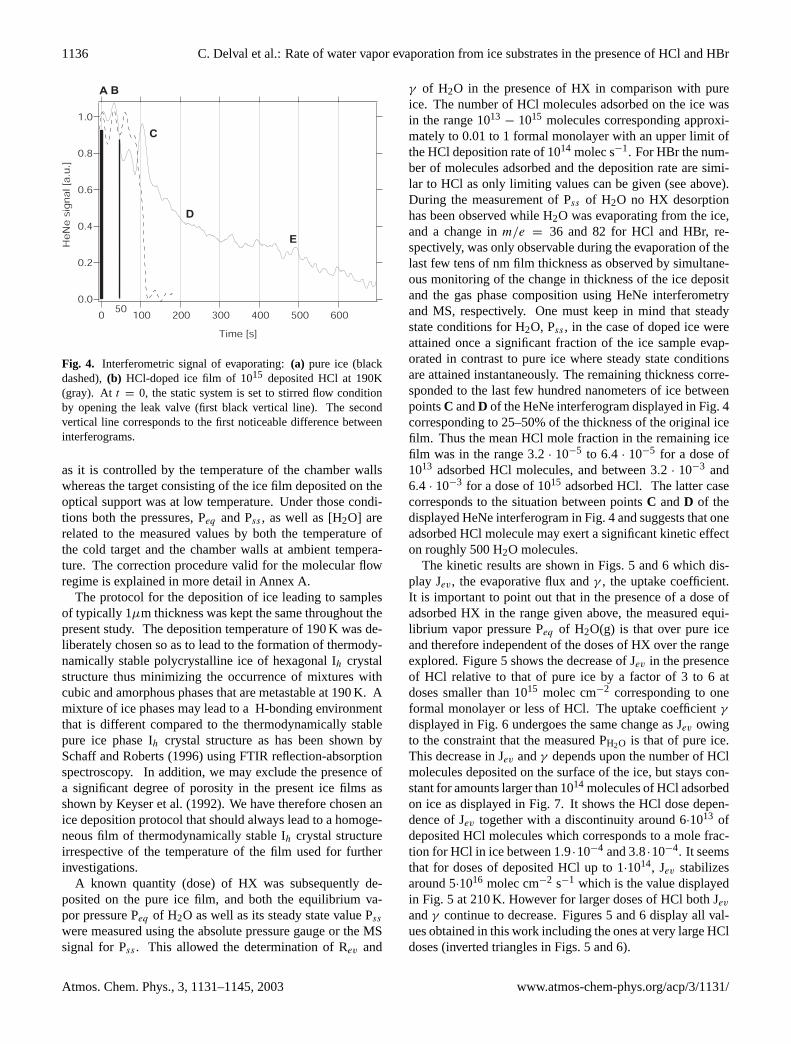
Fig. 4. Interferometric signal of evaporating:(a) pure ice (blackdashed),(b) HCl-doped ice film of 1015 deposited HCl at 190K(gray). At t = 0, the static system is set to stirred flow conditionby opening the leak valve (first black vertical line). The secondvertical line corresponds to the first noticeable difference betweeninterferograms.
as it is controlled by the temperature of the chamber wallswhereas the target consisting of the ice film deposited on theoptical support was at low temperature. Under those condi-tions both the pressures, Peq and Pss , as well as[H2O] arerelated to the measured values by both the temperature ofthe cold target and the chamber walls at ambient tempera-ture. The correction procedure valid for the molecular flowregime is explained in more detail in Annex A.
The protocol for the deposition of ice leading to samplesof typically 1µm thickness was kept the same throughout thepresent study. The deposition temperature of 190 K was de-liberately chosen so as to lead to the formation of thermody-namically stable polycrystalline ice of hexagonal Ih crystalstructure thus minimizing the occurrence of mixtures withcubic and amorphous phases that are metastable at 190 K. Amixture of ice phases may lead to a H-bonding environmentthat is different compared to the thermodynamically stablepure ice phase Ih crystal structure as has been shown bySchaff and Roberts (1996) using FTIR reflection-absorptionspectroscopy. In addition, we may exclude the presence ofa significant degree of porosity in the present ice films asshown by Keyser et al. (1992). We have therefore chosen anice deposition protocol that should always lead to a homoge-neous film of thermodynamically stable Ih crystal structureirrespective of the temperature of the film used for furtherinvestigations.
A known quantity (dose) of HX was subsequently de-posited on the pure ice film, and both the equilibrium va-por pressure Peq of H2O as well as its steady state value Pss
were measured using the absolute pressure gauge or the MSsignal for Pss . This allowed the determination of Rev and
γ of H2O in the presence of HX in comparison with pureice. The number of HCl molecules adsorbed on the ice wasin the range 1013
− 1015 molecules corresponding approxi-mately to 0.01 to 1 formal monolayer with an upper limit ofthe HCl deposition rate of 1014 molec s−1. For HBr the num-ber of molecules adsorbed and the deposition rate are simi-lar to HCl as only limiting values can be given (see above).During the measurement of Pss of H2O no HX desorptionhas been observed while H2O was evaporating from the ice,and a change inm/e = 36 and 82 for HCl and HBr, re-spectively, was only observable during the evaporation of thelast few tens of nm film thickness as observed by simultane-ous monitoring of the change in thickness of the ice depositand the gas phase composition using HeNe interferometryand MS, respectively. One must keep in mind that steadystate conditions for H2O, Pss , in the case of doped ice wereattained once a significant fraction of the ice sample evap-orated in contrast to pure ice where steady state conditionsare attained instantaneously. The remaining thickness corre-sponded to the last few hundred nanometers of ice betweenpointsC andD of the HeNe interferogram displayed in Fig. 4corresponding to 25–50% of the thickness of the original icefilm. Thus the mean HCl mole fraction in the remaining icefilm was in the range 3.2 · 10−5 to 6.4 · 10−5 for a dose of1013 adsorbed HCl molecules, and between 3.2 · 10−3 and6.4 · 10−3 for a dose of 1015 adsorbed HCl. The latter casecorresponds to the situation between pointsC andD of thedisplayed HeNe interferogram in Fig. 4 and suggests that oneadsorbed HCl molecule may exert a significant kinetic effecton roughly 500 H2O molecules.
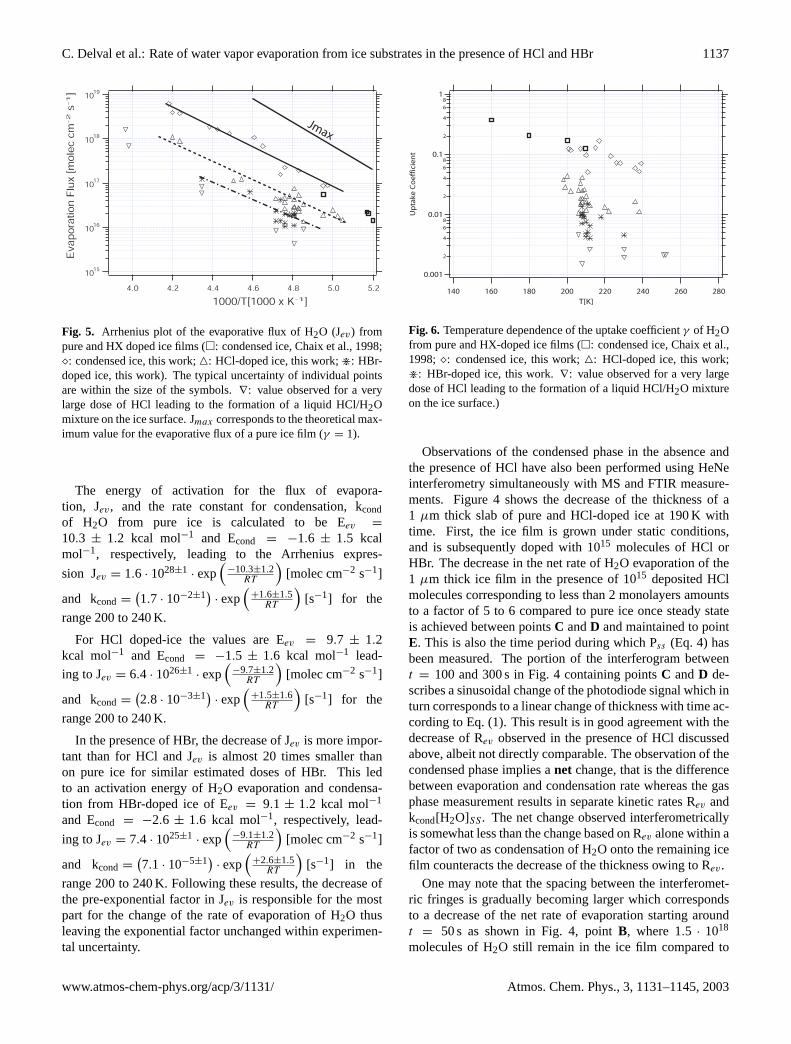
The kinetic results are shown in Figs. 5 and 6 which dis-play Jev, the evaporative flux andγ , the uptake coefficient.It is important to point out that in the presence of a dose ofadsorbed HX in the range given above, the measured equi-librium vapor pressure Peq of H2O(g) is that over pure iceand therefore independent of the doses of HX over the rangeexplored. Figure 5 shows the decrease of Jev in the presenceof HCl relative to that of pure ice by a factor of 3 to 6 atdoses smaller than 1015 molec cm−2 corresponding to oneformal monolayer or less of HCl. The uptake coefficientγ
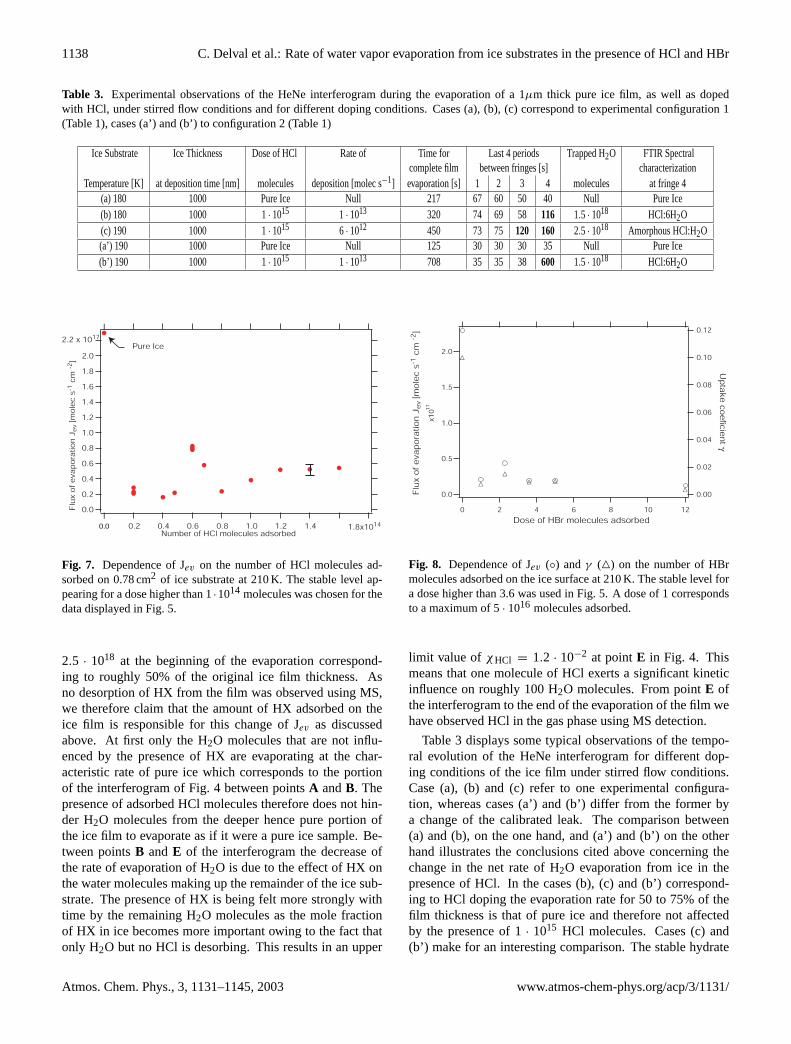
displayed in Fig. 6 undergoes the same change as Jev owingto the constraint that the measured PH2O is that of pure ice.This decrease in Jev andγ depends upon the number of HClmolecules deposited on the surface of the ice, but stays con-stant for amounts larger than 1014 molecules of HCl adsorbedon ice as displayed in Fig. 7. It shows the HCl dose depen-dence of Jev together with a discontinuity around 6·1013 ofdeposited HCl molecules which corresponds to a mole frac-tion for HCl in ice between 1.9·10−4 and 3.8·10−4. It seemsthat for doses of deposited HCl up to 1·1014, Jev stabilizesaround 5·1016 molec cm−2 s−1 which is the value displayedin Fig. 5 at 210 K. However for larger doses of HCl both Jev
andγ continue to decrease. Figures 5 and 6 display all val-ues obtained in this work including the ones at very large HCldoses (inverted triangles in Figs. 5 and 6).
Atmos. Chem. Phys., 3, 1131–1145, 2003 www.atmos-chem-phys.org/acp/3/1131/
C. Delval et al.: Rate of water vapor evaporation from ice substrates in the presence of HCl and HBr 1137
1015
1016
1017
1018
1019
Eva
pora
tion F
lux
[mole
c cm
-2 s
-1]
5.25.04.84.64.44.24.0
1000/T[1000 x K-1]
Jmax
Fig. 5. Arrhenius plot of the evaporative flux of H2O (Jev) frompure and HX doped ice films (�: condensed ice, Chaix et al., 1998;�: condensed ice, this work;4: HCl-doped ice, this work;>: HBr-doped ice, this work). The typical uncertainty of individual pointsare within the size of the symbols.∇: value observed for a verylarge dose of HCl leading to the formation of a liquid HCl/H2Omixture on the ice surface. Jmax corresponds to the theoretical max-imum value for the evaporative flux of a pure ice film (γ = 1).
The energy of activation for the flux of evapora-tion, Jev, and the rate constant for condensation, kcondof H2O from pure ice is calculated to be Eev =
10.3 ± 1.2 kcal mol−1 and Econd = −1.6 ± 1.5 kcalmol−1, respectively, leading to the Arrhenius expres-
sion Jev = 1.6 · 1028±1· exp
(−10.3±1.2
RT
)[molec cm−2 s−1]
and kcond =(1.7 · 10−2±1
)· exp
(+1.6±1.5
RT
)[s−1] for the
range 200 to 240 K.
For HCl doped-ice the values are Eev = 9.7 ± 1.2kcal mol−1 and Econd = −1.5 ± 1.6 kcal mol−1 lead-
ing to Jev = 6.4 · 1026±1· exp
(−9.7±1.2
RT
)[molec cm−2 s−1]
and kcond =(2.8 · 10−3±1
)· exp
(+1.5±1.6
RT
)[s−1] for the
range 200 to 240 K.
In the presence of HBr, the decrease of Jev is more impor-tant than for HCl and Jev is almost 20 times smaller thanon pure ice for similar estimated doses of HBr. This ledto an activation energy of H2O evaporation and condensa-tion from HBr-doped ice of Eev = 9.1 ± 1.2 kcal mol−1
and Econd = −2.6 ± 1.6 kcal mol−1, respectively, lead-
ing to Jev = 7.4 · 1025±1· exp
(−9.1±1.2
RT
)[molec cm−2 s−1]
and kcond =(7.1 · 10−5±1
)· exp
(+2.6±1.5
RT
)[s−1] in the
range 200 to 240 K. Following these results, the decrease ofthe pre-exponential factor in Jev is responsible for the mostpart for the change of the rate of evaporation of H2O thusleaving the exponential factor unchanged within experimen-tal uncertainty.
0.001
2
4
68
0.01
2
4
68
0.1
2
4
68
1
Up
take
Co
effic
ien
t
280260240220200180160140T[K]
Fig. 6. Temperature dependence of the uptake coefficientγ of H2Ofrom pure and HX-doped ice films (�: condensed ice, Chaix et al.,1998;�: condensed ice, this work;4: HCl-doped ice, this work;>: HBr-doped ice, this work.∇: value observed for a very largedose of HCl leading to the formation of a liquid HCl/H2O mixtureon the ice surface.)
Observations of the condensed phase in the absence andthe presence of HCl have also been performed using HeNeinterferometry simultaneously with MS and FTIR measure-ments. Figure 4 shows the decrease of the thickness of a1 µm thick slab of pure and HCl-doped ice at 190 K withtime. First, the ice film is grown under static conditions,and is subsequently doped with 1015 molecules of HCl orHBr. The decrease in the net rate of H2O evaporation of the1 µm thick ice film in the presence of 1015 deposited HClmolecules corresponding to less than 2 monolayers amountsto a factor of 5 to 6 compared to pure ice once steady stateis achieved between pointsC andD and maintained to pointE. This is also the time period during which Pss (Eq. 4) hasbeen measured. The portion of the interferogram betweent = 100 and 300 s in Fig. 4 containing pointsC andD de-scribes a sinusoidal change of the photodiode signal which inturn corresponds to a linear change of thickness with time ac-cording to Eq. (1). This result is in good agreement with thedecrease of Rev observed in the presence of HCl discussedabove, albeit not directly comparable. The observation of thecondensed phase implies anet change, that is the differencebetween evaporation and condensation rate whereas the gasphase measurement results in separate kinetic rates Rev andkcond[H2O]SS . The net change observed interferometricallyis somewhat less than the change based on Rev alone within afactor of two as condensation of H2O onto the remaining icefilm counteracts the decrease of the thickness owing to Rev.
One may note that the spacing between the interferomet-ric fringes is gradually becoming larger which correspondsto a decrease of the net rate of evaporation starting aroundt = 50 s as shown in Fig. 4, pointB, where 1.5 · 1018
molecules of H2O still remain in the ice film compared to
www.atmos-chem-phys.org/acp/3/1131/ Atmos. Chem. Phys., 3, 1131–1145, 2003
1138 C. Delval et al.: Rate of water vapor evaporation from ice substrates in the presence of HCl and HBr
Table 3. Experimental observations of the HeNe interferogram during the evaporation of a 1µm thick pure ice film, as well as dopedwith HCl, under stirred flow conditions and for different doping conditions. Cases (a), (b), (c) correspond to experimental configuration 1(Table 1), cases (a’) and (b’) to configuration 2 (Table 1)
Ice Substrate Ice Thickness Dose of HCl Rate of Time for Last 4 periods Trapped H2O FTIR Spectralcomplete film between fringes [s] characterization
Temperature [K] at deposition time [nm] molecules deposition [molec s−1] evaporation [s] 1 2 3 4 molecules at fringe 4(a) 180 1000 Pure Ice Null 217 67 60 50 40 Null Pure Ice(b) 180 1000 1 · 1015 1 · 1013 320 74 69 58 116 1.5 · 1018 HCl:6H2O(c) 190 1000 1 · 1015 6 · 1012 450 73 75 120 160 2.5 · 1018 Amorphous HCl:H2O(a’) 190 1000 Pure Ice Null 125 30 30 30 35 Null Pure Ice(b’) 190 1000 1 · 1015 1 · 1013 708 35 35 38 600 1.5 · 1018 HCl:6H2O
2.2 x 10¹⁷
2.0
1.8
1.6
1.4
1.2
1.0
0.8
0.6
0.4
0.2
0.0
1.8x10141.41.21.00.80.60.40.2
Pure Ice
Number of HCl molecules adsorbed
Flu
x of eva
pora
tion J
ev
[mole
c s-1
cm
-2]
Fig. 7. Dependence of Jev on the number of HCl molecules ad-sorbed on 0.78 cm2 of ice substrate at 210 K. The stable level ap-pearing for a dose higher than 1·1014 molecules was chosen for thedata displayed in Fig. 5.
2.5 · 1018 at the beginning of the evaporation correspond-ing to roughly 50% of the original ice film thickness. Asno desorption of HX from the film was observed using MS,we therefore claim that the amount of HX adsorbed on theice film is responsible for this change of Jev as discussedabove. At first only the H2O molecules that are not influ-enced by the presence of HX are evaporating at the char-acteristic rate of pure ice which corresponds to the portionof the interferogram of Fig. 4 between pointsA andB. Thepresence of adsorbed HCl molecules therefore does not hin-der H2O molecules from the deeper hence pure portion ofthe ice film to evaporate as if it were a pure ice sample. Be-tween pointsB andE of the interferogram the decrease ofthe rate of evaporation of H2O is due to the effect of HX onthe water molecules making up the remainder of the ice sub-strate. The presence of HX is being felt more strongly withtime by the remaining H2O molecules as the mole fractionof HX in ice becomes more important owing to the fact thatonly H2O but no HCl is desorbing. This results in an upper
2.0
1.5
1.0
0.5
0.0
x101
7
121086420
0.12
0.10
0.08
0.06
0.04
0.02
0.00
Dose of HBr molecules adsorbed
Flu
x of eva
pora
tion J
ev
[mole
c s-1
cm
-2]
Upta
ke co
eficie
nt γ
Fig. 8. Dependence of Jev (◦) andγ (4) on the number of HBrmolecules adsorbed on the ice surface at 210 K. The stable level fora dose higher than 3.6 was used in Fig. 5. A dose of 1 correspondsto a maximum of 5· 1016 molecules adsorbed.
limit value of χHCl = 1.2 · 10−2 at pointE in Fig. 4. Thismeans that one molecule of HCl exerts a significant kineticinfluence on roughly 100 H2O molecules. From pointE ofthe interferogram to the end of the evaporation of the film wehave observed HCl in the gas phase using MS detection.
Table 3 displays some typical observations of the tempo-ral evolution of the HeNe interferogram for different dop-ing conditions of the ice film under stirred flow conditions.Case (a), (b) and (c) refer to one experimental configura-tion, whereas cases (a’) and (b’) differ from the former bya change of the calibrated leak. The comparison between(a) and (b), on the one hand, and (a’) and (b’) on the otherhand illustrates the conclusions cited above concerning thechange in the net rate of H2O evaporation from ice in thepresence of HCl. In the cases (b), (c) and (b’) correspond-ing to HCl doping the evaporation rate for 50 to 75% of thefilm thickness is that of pure ice and therefore not affectedby the presence of 1· 1015 HCl molecules. Cases (c) and(b’) make for an interesting comparison. The stable hydrate
Atmos. Chem. Phys., 3, 1131–1145, 2003 www.atmos-chem-phys.org/acp/3/1131/
C. Delval et al.: Rate of water vapor evaporation from ice substrates in the presence of HCl and HBr 1139
H2O
1
2
3Rev(H2O) Rev(H2O)
Rev(H2O)
HCl+H2O
(HCl+H2O)
(HCl+H2O)
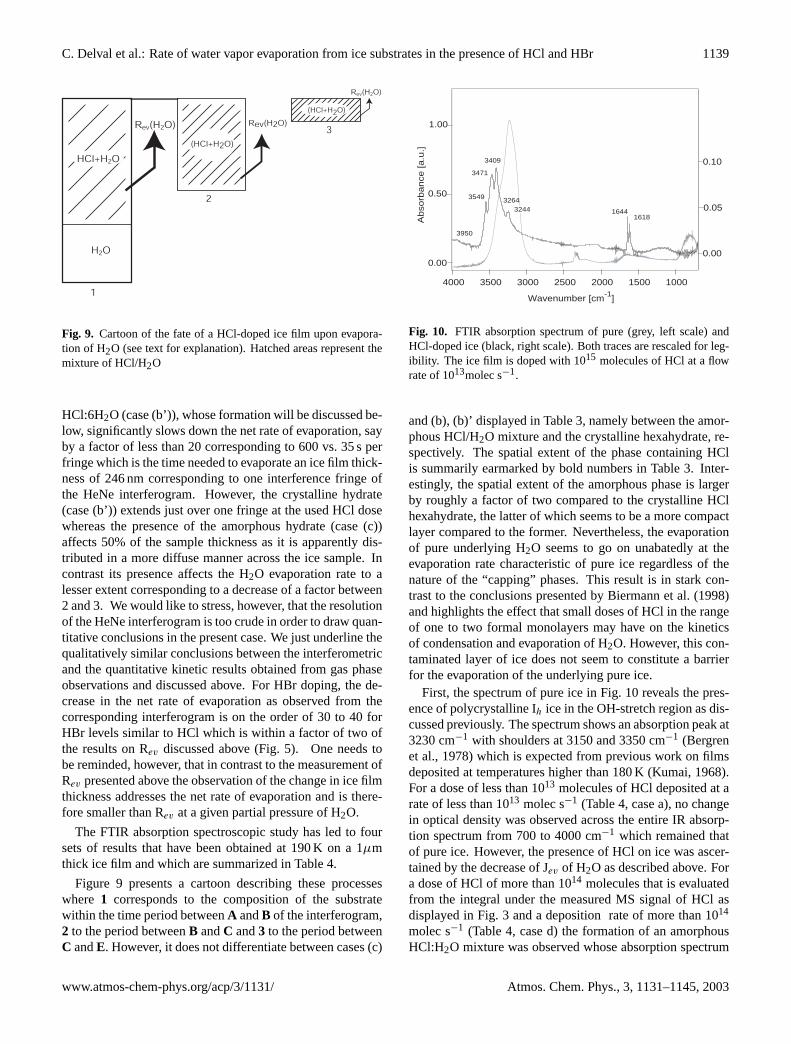
Fig. 9. Cartoon of the fate of a HCl-doped ice film upon evapora-tion of H2O (see text for explanation). Hatched areas represent themixture of HCl/H2O
HCl:6H2O (case (b’)), whose formation will be discussed be-low, significantly slows down the net rate of evaporation, sayby a factor of less than 20 corresponding to 600 vs. 35 s perfringe which is the time needed to evaporate an ice film thick-ness of 246 nm corresponding to one interference fringe ofthe HeNe interferogram. However, the crystalline hydrate(case (b’)) extends just over one fringe at the used HCl dosewhereas the presence of the amorphous hydrate (case (c))affects 50% of the sample thickness as it is apparently dis-tributed in a more diffuse manner across the ice sample. Incontrast its presence affects the H2O evaporation rate to alesser extent corresponding to a decrease of a factor between2 and 3. We would like to stress, however, that the resolutionof the HeNe interferogram is too crude in order to draw quan-titative conclusions in the present case. We just underline thequalitatively similar conclusions between the interferometricand the quantitative kinetic results obtained from gas phaseobservations and discussed above. For HBr doping, the de-crease in the net rate of evaporation as observed from thecorresponding interferogram is on the order of 30 to 40 forHBr levels similar to HCl which is within a factor of two ofthe results on Rev discussed above (Fig. 5). One needs tobe reminded, however, that in contrast to the measurement ofRev presented above the observation of the change in ice filmthickness addresses the net rate of evaporation and is there-fore smaller than Rev at a given partial pressure of H2O.
The FTIR absorption spectroscopic study has led to foursets of results that have been obtained at 190 K on a 1µmthick ice film and which are summarized in Table 4.
Figure 9 presents a cartoon describing these processeswhere 1 corresponds to the composition of the substratewithin the time period betweenA andB of the interferogram,2 to the period betweenB andC and3 to the period betweenC andE. However, it does not differentiate between cases (c)
1.00
0.50
0.00
4000 3500 3000 2500 2000 1500 1000
32443264
3409
3471
3549
3950
16441618
Wavenumber [cm-1]
Abso
rbance
[a.u
.]
0.00
0.05
0.10
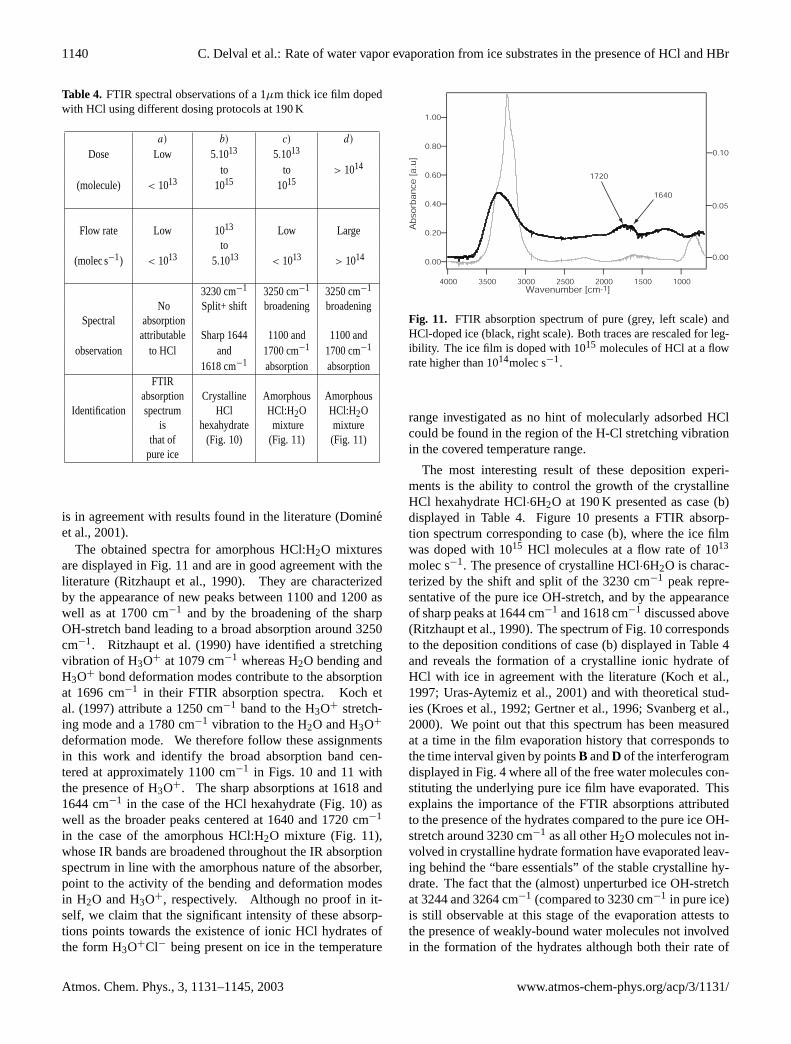
Fig. 10. FTIR absorption spectrum of pure (grey, left scale) andHCl-doped ice (black, right scale). Both traces are rescaled for leg-ibility. The ice film is doped with 1015 molecules of HCl at a flowrate of 1013molec s−1.
and (b), (b)’ displayed in Table 3, namely between the amor-phous HCl/H2O mixture and the crystalline hexahydrate, re-spectively. The spatial extent of the phase containing HClis summarily earmarked by bold numbers in Table 3. Inter-estingly, the spatial extent of the amorphous phase is largerby roughly a factor of two compared to the crystalline HClhexahydrate, the latter of which seems to be a more compactlayer compared to the former. Nevertheless, the evaporationof pure underlying H2O seems to go on unabatedly at theevaporation rate characteristic of pure ice regardless of thenature of the “capping” phases. This result is in stark con-trast to the conclusions presented by Biermann et al. (1998)and highlights the effect that small doses of HCl in the rangeof one to two formal monolayers may have on the kineticsof condensation and evaporation of H2O. However, this con-taminated layer of ice does not seem to constitute a barrierfor the evaporation of the underlying pure ice.
First, the spectrum of pure ice in Fig. 10 reveals the pres-ence of polycrystalline Ih ice in the OH-stretch region as dis-cussed previously. The spectrum shows an absorption peak at3230 cm−1 with shoulders at 3150 and 3350 cm−1 (Bergrenet al., 1978) which is expected from previous work on filmsdeposited at temperatures higher than 180 K (Kumai, 1968).For a dose of less than 1013 molecules of HCl deposited at arate of less than 1013 molec s−1 (Table 4, case a), no changein optical density was observed across the entire IR absorp-tion spectrum from 700 to 4000 cm−1 which remained thatof pure ice. However, the presence of HCl on ice was ascer-tained by the decrease of Jev of H2O as described above. Fora dose of HCl of more than 1014 molecules that is evaluatedfrom the integral under the measured MS signal of HCl asdisplayed in Fig. 3 and a deposition rate of more than 1014
molec s−1 (Table 4, case d) the formation of an amorphousHCl:H2O mixture was observed whose absorption spectrum
www.atmos-chem-phys.org/acp/3/1131/ Atmos. Chem. Phys., 3, 1131–1145, 2003
1140 C. Delval et al.: Rate of water vapor evaporation from ice substrates in the presence of HCl and HBr
Table 4. FTIR spectral observations of a 1µm thick ice film dopedwith HCl using different dosing protocols at 190 K
a) b) c) d)
Dose Low 5.1013 5.1013
to to > 1014
(molecule) < 1013 1015 1015
Flow rate Low 1013 Low Largeto
(molec s−1) < 1013 5.1013 < 1013 > 1014
3230 cm−1 3250 cm−1 3250 cm−1
No Split+ shift broadening broadeningSpectral absorption
attributable Sharp 1644 1100 and 1100 andobservation to HCl and 1700 cm−1 1700 cm−1
1618 cm−1 absorption absorptionFTIR
absorption Crystalline Amorphous AmorphousIdentification spectrum HCl HCl:H2O HCl:H2O
is hexahydrate mixture mixturethat of (Fig. 10) (Fig. 11) (Fig. 11)
pure ice
is in agreement with results found in the literature (Domineet al., 2001).
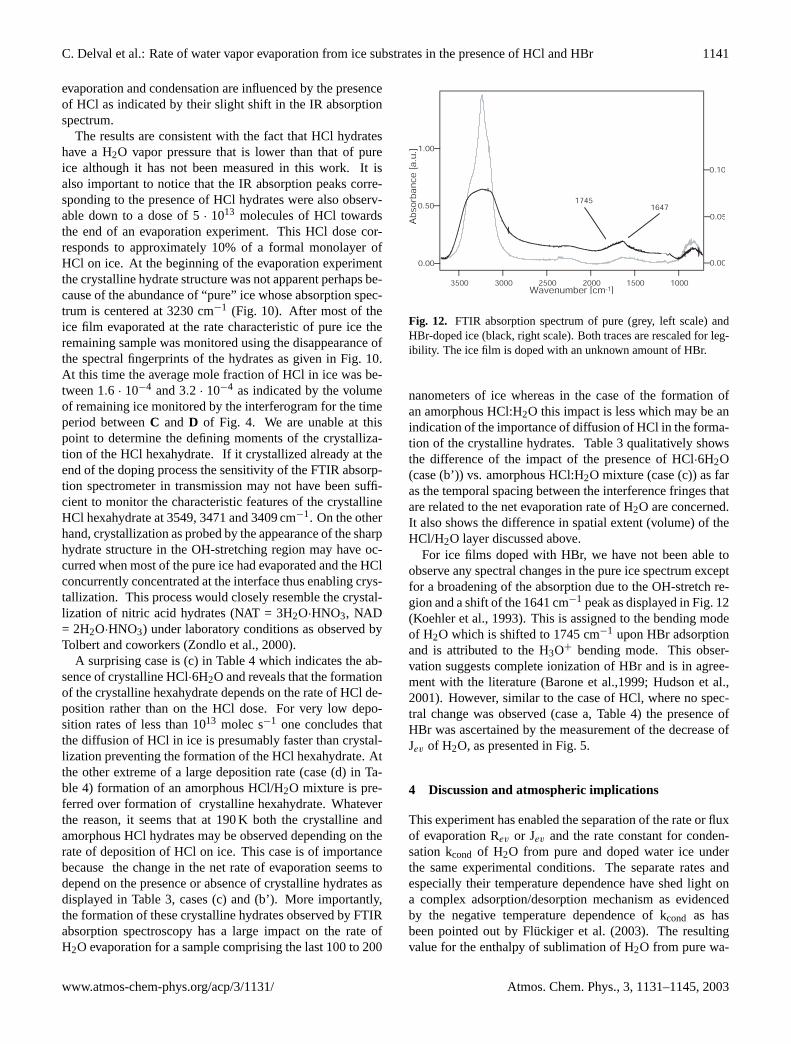
The obtained spectra for amorphous HCl:H2O mixturesare displayed in Fig. 11 and are in good agreement with theliterature (Ritzhaupt et al., 1990). They are characterizedby the appearance of new peaks between 1100 and 1200 aswell as at 1700 cm−1 and by the broadening of the sharpOH-stretch band leading to a broad absorption around 3250cm−1. Ritzhaupt et al. (1990) have identified a stretchingvibration of H3O+ at 1079 cm−1 whereas H2O bending andH3O+ bond deformation modes contribute to the absorptionat 1696 cm−1 in their FTIR absorption spectra. Koch etal. (1997) attribute a 1250 cm−1 band to the H3O+ stretch-ing mode and a 1780 cm−1 vibration to the H2O and H3O+
deformation mode. We therefore follow these assignmentsin this work and identify the broad absorption band cen-tered at approximately 1100 cm−1 in Figs. 10 and 11 withthe presence of H3O+. The sharp absorptions at 1618 and1644 cm−1 in the case of the HCl hexahydrate (Fig. 10) aswell as the broader peaks centered at 1640 and 1720 cm−1
in the case of the amorphous HCl:H2O mixture (Fig. 11),whose IR bands are broadened throughout the IR absorptionspectrum in line with the amorphous nature of the absorber,point to the activity of the bending and deformation modesin H2O and H3O+, respectively. Although no proof in it-self, we claim that the significant intensity of these absorp-tions points towards the existence of ionic HCl hydrates ofthe form H3O+Cl− being present on ice in the temperature
1.00
0.80
0.60
0.40
0.20
0.00
4000 3500 3000 2500 2000 1500 1000Wavenumber [cm-1]
Ab
sorb
an
ce [
a.u
]
1640
1720
0.00
0.05
0.10
Fig. 11. FTIR absorption spectrum of pure (grey, left scale) andHCl-doped ice (black, right scale). Both traces are rescaled for leg-ibility. The ice film is doped with 1015 molecules of HCl at a flowrate higher than 1014molec s−1.
range investigated as no hint of molecularly adsorbed HClcould be found in the region of the H-Cl stretching vibrationin the covered temperature range.
The most interesting result of these deposition experi-ments is the ability to control the growth of the crystallineHCl hexahydrate HCl·6H2O at 190 K presented as case (b)displayed in Table 4. Figure 10 presents a FTIR absorp-tion spectrum corresponding to case (b), where the ice filmwas doped with 1015 HCl molecules at a flow rate of 1013
molec s−1. The presence of crystalline HCl·6H2O is charac-terized by the shift and split of the 3230 cm−1 peak repre-sentative of the pure ice OH-stretch, and by the appearanceof sharp peaks at 1644 cm−1 and 1618 cm−1 discussed above(Ritzhaupt et al., 1990). The spectrum of Fig. 10 correspondsto the deposition conditions of case (b) displayed in Table 4and reveals the formation of a crystalline ionic hydrate ofHCl with ice in agreement with the literature (Koch et al.,1997; Uras-Aytemiz et al., 2001) and with theoretical stud-ies (Kroes et al., 1992; Gertner et al., 1996; Svanberg et al.,2000). We point out that this spectrum has been measuredat a time in the film evaporation history that corresponds tothe time interval given by pointsB andD of the interferogramdisplayed in Fig. 4 where all of the free water molecules con-stituting the underlying pure ice film have evaporated. Thisexplains the importance of the FTIR absorptions attributedto the presence of the hydrates compared to the pure ice OH-stretch around 3230 cm−1 as all other H2O molecules not in-volved in crystalline hydrate formation have evaporated leav-ing behind the “bare essentials” of the stable crystalline hy-drate. The fact that the (almost) unperturbed ice OH-stretchat 3244 and 3264 cm−1 (compared to 3230 cm−1 in pure ice)is still observable at this stage of the evaporation attests tothe presence of weakly-bound water molecules not involvedin the formation of the hydrates although both their rate of
Atmos. Chem. Phys., 3, 1131–1145, 2003 www.atmos-chem-phys.org/acp/3/1131/
C. Delval et al.: Rate of water vapor evaporation from ice substrates in the presence of HCl and HBr 1141
evaporation and condensation are influenced by the presenceof HCl as indicated by their slight shift in the IR absorptionspectrum.
The results are consistent with the fact that HCl hydrateshave a H2O vapor pressure that is lower than that of pureice although it has not been measured in this work. It isalso important to notice that the IR absorption peaks corre-sponding to the presence of HCl hydrates were also observ-able down to a dose of 5· 1013 molecules of HCl towardsthe end of an evaporation experiment. This HCl dose cor-responds to approximately 10% of a formal monolayer ofHCl on ice. At the beginning of the evaporation experimentthe crystalline hydrate structure was not apparent perhaps be-cause of the abundance of “pure” ice whose absorption spec-trum is centered at 3230 cm−1 (Fig. 10). After most of theice film evaporated at the rate characteristic of pure ice theremaining sample was monitored using the disappearance ofthe spectral fingerprints of the hydrates as given in Fig. 10.At this time the average mole fraction of HCl in ice was be-tween 1.6 · 10−4 and 3.2 · 10−4 as indicated by the volumeof remaining ice monitored by the interferogram for the timeperiod betweenC and D of Fig. 4. We are unable at thispoint to determine the defining moments of the crystalliza-tion of the HCl hexahydrate. If it crystallized already at theend of the doping process the sensitivity of the FTIR absorp-tion spectrometer in transmission may not have been suffi-cient to monitor the characteristic features of the crystallineHCl hexahydrate at 3549, 3471 and 3409 cm−1. On the otherhand, crystallization as probed by the appearance of the sharphydrate structure in the OH-stretching region may have oc-curred when most of the pure ice had evaporated and the HClconcurrently concentrated at the interface thus enabling crys-tallization. This process would closely resemble the crystal-lization of nitric acid hydrates (NAT = 3H2O·HNO3, NAD= 2H2O·HNO3) under laboratory conditions as observed byTolbert and coworkers (Zondlo et al., 2000).
A surprising case is (c) in Table 4 which indicates the ab-sence of crystalline HCl·6H2O and reveals that the formationof the crystalline hexahydrate depends on the rate of HCl de-position rather than on the HCl dose. For very low depo-sition rates of less than 1013 molec s−1 one concludes thatthe diffusion of HCl in ice is presumably faster than crystal-lization preventing the formation of the HCl hexahydrate. Atthe other extreme of a large deposition rate (case (d) in Ta-ble 4) formation of an amorphous HCl/H2O mixture is pre-ferred over formation of crystalline hexahydrate. Whateverthe reason, it seems that at 190 K both the crystalline andamorphous HCl hydrates may be observed depending on therate of deposition of HCl on ice. This case is of importancebecause the change in the net rate of evaporation seems todepend on the presence or absence of crystalline hydrates asdisplayed in Table 3, cases (c) and (b’). More importantly,the formation of these crystalline hydrates observed by FTIRabsorption spectroscopy has a large impact on the rate ofH2O evaporation for a sample comprising the last 100 to 200
1.00
0.50
0.00
3500 3000 2500 2000 1500 1000Wavenumber [cm-1]
Ab
sorb
an
ce [
a.u
.]
16471745
0.00
0.05
0.10
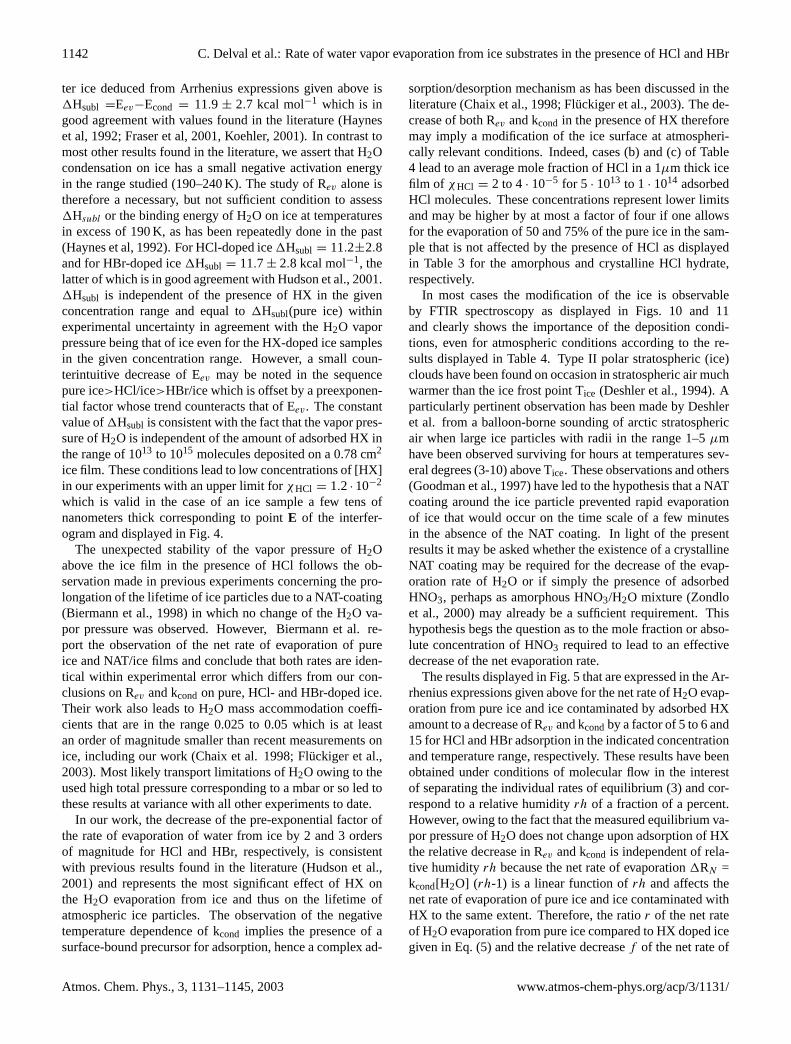
Fig. 12. FTIR absorption spectrum of pure (grey, left scale) andHBr-doped ice (black, right scale). Both traces are rescaled for leg-ibility. The ice film is doped with an unknown amount of HBr.
nanometers of ice whereas in the case of the formation ofan amorphous HCl:H2O this impact is less which may be anindication of the importance of diffusion of HCl in the forma-tion of the crystalline hydrates. Table 3 qualitatively showsthe difference of the impact of the presence of HCl·6H2O(case (b’)) vs. amorphous HCl:H2O mixture (case (c)) as faras the temporal spacing between the interference fringes thatare related to the net evaporation rate of H2O are concerned.It also shows the difference in spatial extent (volume) of theHCl/H2O layer discussed above.
For ice films doped with HBr, we have not been able toobserve any spectral changes in the pure ice spectrum exceptfor a broadening of the absorption due to the OH-stretch re-gion and a shift of the 1641 cm−1 peak as displayed in Fig. 12(Koehler et al., 1993). This is assigned to the bending modeof H2O which is shifted to 1745 cm−1 upon HBr adsorptionand is attributed to the H3O+ bending mode. This obser-vation suggests complete ionization of HBr and is in agree-ment with the literature (Barone et al.,1999; Hudson et al.,2001). However, similar to the case of HCl, where no spec-tral change was observed (case a, Table 4) the presence ofHBr was ascertained by the measurement of the decrease ofJev of H2O, as presented in Fig. 5.
4 Discussion and atmospheric implications
This experiment has enabled the separation of the rate or fluxof evaporation Rev or Jev and the rate constant for conden-sation kcond of H2O from pure and doped water ice underthe same experimental conditions. The separate rates andespecially their temperature dependence have shed light ona complex adsorption/desorption mechanism as evidencedby the negative temperature dependence of kcond as hasbeen pointed out by Fluckiger et al. (2003). The resultingvalue for the enthalpy of sublimation of H2O from pure wa-
www.atmos-chem-phys.org/acp/3/1131/ Atmos. Chem. Phys., 3, 1131–1145, 2003
1142 C. Delval et al.: Rate of water vapor evaporation from ice substrates in the presence of HCl and HBr
ter ice deduced from Arrhenius expressions given above is1Hsubl =Eev−Econd = 11.9 ± 2.7 kcal mol−1 which is ingood agreement with values found in the literature (Hayneset al, 1992; Fraser et al, 2001, Koehler, 2001). In contrast tomost other results found in the literature, we assert that H2Ocondensation on ice has a small negative activation energyin the range studied (190–240 K). The study of Rev alone istherefore a necessary, but not sufficient condition to assess1Hsubl or the binding energy of H2O on ice at temperaturesin excess of 190 K, as has been repeatedly done in the past(Haynes et al, 1992). For HCl-doped ice1Hsubl = 11.2±2.8and for HBr-doped ice1Hsubl = 11.7 ± 2.8 kcal mol−1, thelatter of which is in good agreement with Hudson et al., 2001.1Hsubl is independent of the presence of HX in the givenconcentration range and equal to1Hsubl(pure ice) withinexperimental uncertainty in agreement with the H2O vaporpressure being that of ice even for the HX-doped ice samplesin the given concentration range. However, a small coun-terintuitive decrease of Eev may be noted in the sequencepure ice>HCl/ice>HBr/ice which is offset by a preexponen-tial factor whose trend counteracts that of Eev. The constantvalue of1Hsubl is consistent with the fact that the vapor pres-sure of H2O is independent of the amount of adsorbed HX inthe range of 1013 to 1015 molecules deposited on a 0.78 cm2
ice film. These conditions lead to low concentrations of [HX]in our experiments with an upper limit forχHCl = 1.2 · 10−2
which is valid in the case of an ice sample a few tens ofnanometers thick corresponding to pointE of the interfer-ogram and displayed in Fig. 4.
The unexpected stability of the vapor pressure of H2Oabove the ice film in the presence of HCl follows the ob-servation made in previous experiments concerning the pro-longation of the lifetime of ice particles due to a NAT-coating(Biermann et al., 1998) in which no change of the H2O va-por pressure was observed. However, Biermann et al. re-port the observation of the net rate of evaporation of pureice and NAT/ice films and conclude that both rates are iden-tical within experimental error which differs from our con-clusions on Rev and kcond on pure, HCl- and HBr-doped ice.Their work also leads to H2O mass accommodation coeffi-cients that are in the range 0.025 to 0.05 which is at leastan order of magnitude smaller than recent measurements onice, including our work (Chaix et al. 1998; Fluckiger et al.,2003). Most likely transport limitations of H2O owing to theused high total pressure corresponding to a mbar or so led tothese results at variance with all other experiments to date.
In our work, the decrease of the pre-exponential factor ofthe rate of evaporation of water from ice by 2 and 3 ordersof magnitude for HCl and HBr, respectively, is consistentwith previous results found in the literature (Hudson et al.,2001) and represents the most significant effect of HX onthe H2O evaporation from ice and thus on the lifetime ofatmospheric ice particles. The observation of the negativetemperature dependence of kcond implies the presence of asurface-bound precursor for adsorption, hence a complex ad-
sorption/desorption mechanism as has been discussed in theliterature (Chaix et al., 1998; Fluckiger et al., 2003). The de-crease of both Rev and kcond in the presence of HX thereforemay imply a modification of the ice surface at atmospheri-cally relevant conditions. Indeed, cases (b) and (c) of Table4 lead to an average mole fraction of HCl in a 1µm thick icefilm of χHCl = 2 to 4· 10−5 for 5 · 1013 to 1 · 1014 adsorbedHCl molecules. These concentrations represent lower limitsand may be higher by at most a factor of four if one allowsfor the evaporation of 50 and 75% of the pure ice in the sam-ple that is not affected by the presence of HCl as displayedin Table 3 for the amorphous and crystalline HCl hydrate,respectively.
In most cases the modification of the ice is observableby FTIR spectroscopy as displayed in Figs. 10 and 11and clearly shows the importance of the deposition condi-tions, even for atmospheric conditions according to the re-sults displayed in Table 4. Type II polar stratospheric (ice)clouds have been found on occasion in stratospheric air muchwarmer than the ice frost point Tice (Deshler et al., 1994). Aparticularly pertinent observation has been made by Deshleret al. from a balloon-borne sounding of arctic stratosphericair when large ice particles with radii in the range 1–5µmhave been observed surviving for hours at temperatures sev-eral degrees (3-10) above Tice. These observations and others(Goodman et al., 1997) have led to the hypothesis that a NATcoating around the ice particle prevented rapid evaporationof ice that would occur on the time scale of a few minutesin the absence of the NAT coating. In light of the presentresults it may be asked whether the existence of a crystallineNAT coating may be required for the decrease of the evap-oration rate of H2O or if simply the presence of adsorbedHNO3, perhaps as amorphous HNO3/H2O mixture (Zondloet al., 2000) may already be a sufficient requirement. Thishypothesis begs the question as to the mole fraction or abso-lute concentration of HNO3 required to lead to an effectivedecrease of the net evaporation rate.
The results displayed in Fig. 5 that are expressed in the Ar-rhenius expressions given above for the net rate of H2O evap-oration from pure ice and ice contaminated by adsorbed HXamount to a decrease of Rev and kcondby a factor of 5 to 6 and15 for HCl and HBr adsorption in the indicated concentrationand temperature range, respectively. These results have beenobtained under conditions of molecular flow in the interestof separating the individual rates of equilibrium (3) and cor-respond to a relative humidityrh of a fraction of a percent.However, owing to the fact that the measured equilibrium va-por pressure of H2O does not change upon adsorption of HXthe relative decrease in Rev and kcond is independent of rela-tive humidityrh because the net rate of evaporation1RN =kcond[H2O] (rh-1) is a linear function ofrh and affects thenet rate of evaporation of pure ice and ice contaminated withHX to the same extent. Therefore, the ratior of the net rateof H2O evaporation from pure ice compared to HX doped icegiven in Eq. (5) and the relative decreasef of the net rate of
Atmos. Chem. Phys., 3, 1131–1145, 2003 www.atmos-chem-phys.org/acp/3/1131/
C. Delval et al.: Rate of water vapor evaporation from ice substrates in the presence of HCl and HBr 1143
H2O evaporation upon doping of ice with HX displayed inEq. (6) are independent of the relative humidityrh.
r = kHXcond/kcond = RHX
ev /Rev (5)
f = (kHXcond− kcond)/kcond = (RHX
ev − Rev)/Rev (6)
where the symbols with the superscripts correspond to thekinetic constants pertaining to HX doped ice samples.
The significant effect of HX deposition on Rev from icemay also be seen in HeNe interferograms shown in Fig. 4and summarized in Table 3, and has been observed in twoother studies of the condensed phase, one for HBr (Hudsonet al., 2001), the other for HCl (Krieger et al., 2002). Our val-ues for HBr are consistent with those in the literature (Hud-son et al., 2001) and may lead to a surprising increase of thelifetime for an ice particle. For HCl, Krieger et al. report adecrease of the net rate of evaporation of H2O from ice ofonly 30%, whereas we observe a decrease of a factor of 2to 15 depending on the structure of the HCl/ice surface ac-cording to Table 3. The increase of the lifetime of a 1µmthick ice film in the presence of HX may be extrapolated tothe case of Cirrus clouds. As Cirrus cloud particles are largethey may be approximated by bulk substrates so that the re-sults obtained in this study may be transferable to the case ofPSC’s type II such that HX-doped ice particles should havean increased lifetime in the presence of HX depending on theamount of HCl adsorbed. They should thus be more avail-able for heterogeneous reactions and so be more effectivein ozone depletion processes as discussed in Solomon et al.,1997. The importance of the decrease of the net rate of evap-oration of atmospheric ice particles will depend on the doseof adsorbed HX which in turn depends on the length of ex-posure to air masses containing HX. The HCl concentrationamounts to approximately 10% of that for HNO3 as a lowerlimit based on the inorganic halogen budget compared to anabsolute HNO3 concentration of roughly 10 ppb. The atmo-spheric HBr concentration is significantly smaller, probablyon the order of a few ppt. The present work clearly showsthat already a monolayer or two of adsorbed HCl may sig-nificantly slow down the H2O evaporation rate of ice over alarge volume corresponding to a layer thickness of 250 nm ormore. It suggests that stoichiometric formation of crystallinehydrates such as NAT or NAM requiring large amounts ofHNO3 may not be necessary in the case of HX molecules ad-sorbed on ice. For HBr the smaller atmospheric abundancemay be offset by the larger effect on the H2O evaporationrate as far as lifetimes of HBr-contaminated ice particles areconcerned.
Annex A: The partial pressure of H2O over ice measuredin a chamber at ambient temperature and under molecu-lar flow conditions
A) The partial pressure of H2O over ice, PH2O, at typically200K measured in a vessel of the same temperature T is iden-
tical to the equilibrium vapor pressure Peq. In such a systemthe one temperature of the condensed phase as well as thechamber walls control Peq. The corresponding H2O concen-tration, [H2O], is equal to the molecular density given byequations (7) and (8) when either the rate (Rev) or the flux(Jev) of condensation and evaporation of H2O in the pres-ence of ice, respectively, are expressed in terms of true chem-ical equilibrium between the H2O gas and condensed phase,namely
H2O(g)kcond⇀↽Rev
H2O(c).
Rev = γω[H2O] with ω = 〈c(T )〉As
4V(7)
Jev = γ〈c(T )〉
4[H2O] with Rev = Jev
As
V(8)
In Eqs. (7) and (8)γ , ω, 〈c(T )〉, As andV are the uptakecoefficient, the gas-surface collision frequency, the meanmolecular velocity, the geometrical area of the substrate andthe volume of the reaction system, respectively.
B) In practice, however, PH2O and [H2O] are measured inan experimental system where the condensed phase is at lowtemperature and whose walls are at ambient temperature. Inthis case the condensed phase at low temperature (TL) andthe chamber walls at ambient temperature (TH) both con-trol PH2O and [H2O], both of which do not correspond tothe equilibrium vapor pressure Peq and the equilibrium H2Oconcentration, [H2O], respectively. The former situation A)corresponds to true equilibrium between the cold target andthe cold chamber walls without ambiguity, except that thisis a hypothetical situation rarely encountered in performedexperiments. Conversely, the often encountered situation B)implies that collisions of gas at ambient temperature TH (hotgas) occur with a target (ice) at TL in which case PH2O and[H2O] are given by two temperatures TH and TL . The mea-sured partial pressure of H2O, Pmeas, and the measured con-centration of H2O, [H2O]meas, may be calculated by postu-lating that the equilibrium conditions given in Eqs. (9) and(10) hold thus implying no net growth or loss of the quantityof the condensed phase at TL .
Jev = γ〈c(TL)〉
4[H2O] = γ
〈c(TH)〉
4[H2O]meas (9)
Jev = γ〈c(TL)〉
4
Peq
RTL= γ
〈c(TH)〉
4
Pmeas
RTH(10)
This means that the constraint of no net change of thequantity of the condensed phase adjusts the measured valuesof PH2O and [H2O] according to Eqs. (11) and (12) corre-sponding to an apparent equilibrium measured under realisticexperimental conditions of steady state.
[H2O]meas= [H2O]
(TL
TH
)1/2
(11)
www.atmos-chem-phys.org/acp/3/1131/ Atmos. Chem. Phys., 3, 1131–1145, 2003
1144 C. Delval et al.: Rate of water vapor evaporation from ice substrates in the presence of HCl and HBr
Pmeas= Peq
(TH
TL
)1/2
(12)
Equations (11) and (12) show that both TL and TH controlthe measured experimental quantities Pmeasand [H2O]meas.Equations (7) and (8) imply that for TL < TH, [H2O]meas< [H2O],the equilibrium concentration of H2O at TL , andPmeas> Peq, the true equilibrium vapor pressure at TL . Inthe hypothetical case that the rate constant for H2O conden-sation,(γ )(ω), were independent of temperature, [H2O]meas= [H2O] and Pmeas= Peq•(TH/TL) would result as expected.
Acknowledgements.Generous support of this research was grantedby the Fonds National Suisse de la Recherche Scientifique undercontract 20-65299.01 and in part by OFES under the 5th frameworkproject CUTICE of the European Union under the Environnementand Climate Program.
References
Barone, S. B., Zondlo, M. A., and Tolbert, M. A.: Investigation ofthe heterogeneous reactivity of HCl, HBr and HI on ice surfaces,J. Phys. Chem, 103, 9717–9730, 1999.
Bergren, M. S., Schuh, D., Sceats, M. G., and Rice, S. A.: The OHstretching region infrared spectra of low density amorphous solidwater and polycristalline ice Ih, J. Chem. Phys., 69, 3477–3482,1978.
Berland, B. S., Haynes, D. R., Foster, K. L., Tolbert, M. A.,Georges, S. M., and Toon, O. B.: Refractive indices of amor-phous and crystalline HNO3/H2O films representative of polarstratospheric clouds, J. Phys. Chem., 98, 4358–4364, 1994.
Berland, B. S., Brown, D. E., Tolbert, M. A., and George, S. M.:Refractive index and density of vapor-deposited ice, Geophys.Res. Lett., 24, 3493–3496, 1995.
Biermann, U. M., Crowley, J. N., Huthwelker, T., Moortgat, G. K.,Crutzen, P. J., and Peter, Th.: FTIR studies of the lifetime pro-longation of stratospheric ice particles due to NAT coating, Geo-phys. Res. Lett., 25, 3939–3942, 1998.
Borrmann, S., Solomon, S., Dye, J. E., and Luo, B.: The potentialof cirrus clouds for heterogeneous chlorine activation, Geophys.Res. Lett., 23, 2133–2136, 1996.
Brown, D. E., George, S. M., Huang, C., Wong, E. K. L., Rider, K.B., Scott Smith, R., and Kay, B. D.: H2O condensation coeffi-cient and refractive index for vapor-deposited ice from molecu-lar beam and optical interference measurements, J. Phys. Chem.,100, 4988–4995, 1996.
Chaix, L., van den Bergh, H., and Rossi, M. J.: Real-time ki-netic measurements of the condensation and evaporation of D2Omolecules on ice at 140K<T<220 K, J. Phys. Chem. A, 102,10 300–10 309, 1998.
Delzeit, L., Rowland, B., and Devlin, J. P.: Infrared spectra of HClcomplexed/ionized in amorphous hydrates and at ice surfaces inthe 15–90 K range, J. Phys. Chem., 97, 10 312–10 318, 1993.
Deshler, T., Peter, Th., Muller, R., and Crutzen, P. J.: The lifetimeof leewave-induced ice particles in the Arctic stratosphere: I.Ballonborne observations, Geophys. Res. Lett., 21, 1327–1330,1994.
Diehl, K., Mitra, S. K., and Pruppacher, H. R.: A laboratory studyon the uptake of HCl, HNO3 and SO2 gas by ice crystals and the
effect of these gases on the evaporation rate of the crystals, Atm.Res., 47/48, 235–244, 1998.
Domine, F. and Xueref, I.: Evaluation of depth profiling using laserresonant desorption as a method to measure diffusion coefficientsin ice, Anal. Chem., 73, 4348–4353, 2001.
Fluckiger, B. and Rossi, M. J.: Common precursor mechanism forthe heterogeneous reaction of D2O, HCl, HBr and HOBr withwater ice in the range 170–230 K: mass accomodation coeffi-cients on ice, J. Phys. Chem. A, 106, 4103–4115, 2003.
Fraser, H. J., Collings, M. P., McCoustra, M. R. S., and Williams, D.A.: Thermal desorption of water ice in the interstellar medium,Mon. Not. Astron. Soc., 327,, 1165–1172, 2001.
Gertner, B. J. and Hynes, J. T.: Molecular dynamics simulation ofhydrochloric acid ionization at the surface of stratospheric ice,Science, 271, 1563–1565, 1996.
Goodman, J., Verma, R., Pueschel, R. F., Hamill, P., Ferry, G. V.,and Webster, D.: New evidence on size and composition of polarstratospheric cloud particles, Geophys. Res. Lett., 24, 615–618,1997.
Haynes, D. R., Tro, N. J., and George, S. M.: Condensation andevaporation of H2O on ice surfaces, J. Phys. Chem., 96, 8502–8509, 1992.
Horn, A. B. and Sully, J.: Reaction and diffusion in heterogeneousatmospheric chemistry studied by attenuated total internal reflec-tion IR spectroscopy, J. Chem. Soc., Faraday Trans., 93, 2741–2746, 1997.
Hudson, P. K., Foster, K. L., Tolbert, M. A., George, S. M., Carlo,S. R., and Grassian, V. H.: HBr uptake on ice: uptake coefi-cient, H2O/HBr hydrate formation, and H2O desorption kinetics,J. Phys. Chem. A, 105, 694–702, 2001.
Keyser, L. F. and Leu, M-T.: Surface areas and porosities of icesused to simulate stratospheric clouds, J. Colloid Interface Sci.,155, 137–145, 1992.
Koch, T. G., Banham, S. F., Sodeau, J. R., Horn, A. B., McCoustra,M. R. S., and Chesters, M. A.: Mechanism for the heterogeneoushydrolysis of hydrogen chloride, chlorine nitrate and dinitrogenpentoxide on water-rich atmospheric particle surfaces, J. Geo-phys. Res., 102, 1513–1522, 1997.
Koehler, B. G., McNeill, L. S., Middlebrook, A. M., and Tolbert, M.A.: Fourier-transform infrared studies of the interaction of HClwith model polar stratospheric cloud film, J. Geophys. Res. D,98, 10 563–10 571, 1993.
Koehler, B. G.: Desorption kinetics of model polar stratosphericcloud films measured using Fourier transform infrared spec-troscopy and temperature-programmed desorption, Int. J. Chem.Kin., 33, 295–309, 2001.
Krieger, U.K., Huthwelker, T., Daniel, C., Weers, U., Peter, T.,and Lanford, W. L.: Rutherford backscattering to study the near-surface region of volatile liquids and solids, Science, 295, 1048–1050, 2002.
Kroes, G. J. and Clary, D. C.: Adsorption of HCl on ice under strato-spheric conditions: a computational study, Geophys. Res. Lett.,19, 1355–1358, 1992.
Kumai, M.: Hexagonal and cubic ice at low temperatures, J.Glaciol., 7, 95–108, 1968.
Marti, J. and Mauersberger, K.: A survey and new measurementsof ice vapor pressure at temperatures between 170 and 250 K,Geophys. Res. Lett., 20, 363–366, 1993.
Ritzhaupt, G. and Devlin, J. P.: Infrared spectra of nitric and hy-
Atmos. Chem. Phys., 3, 1131–1145, 2003 www.atmos-chem-phys.org/acp/3/1131/
C. Delval et al.: Rate of water vapor evaporation from ice substrates in the presence of HCl and HBr 1145
drochloric acid hydrate thin film, J. Phys. Chem., 95, 90–95,1990.
Schaff, J. E. and Roberts, J. T.: Towards an understanding ofthe surface chemical properties of ice: differences between theamorphous and crystalline surfaces, J. Phys Chem, 100, 14 151–14 160, 1996.
Schriver-Mazzuoli, L., Schriver, A., and Hallou, A.: IR-reflection-absorption spectra of thin water ice films between 10 and 160 Kat low pressure, J. Mol. Struct., 554, 289–300, 2000.
Solomon, S., Garcia, R. R., Rowland, F. S., and Wuebbles, D. J.:On the depletion of antartic ozone, Nature, 321, 755–758, 1986.
Solomon, S., Borrmann, S., Garcia, R. R., Portmann, R., Thomason,L., Poole, L. R., Winker, D., and McCormick, M. P.: Heteroge-neous chlorine chemistry in the tropopause region, J. Geophys.Res., 102, 21 411–21 429, 1997.
Svanberg, M., Pettersson, J. B. C., and Bolton, K.: CoupledQM/MM molecular simulations of HCl interacting with ice sur-faces and water clusters-Evidence of rapid ionization, J. Phys.Chem. A, 104, 5787–5798, 2000.
Tolbert, M. A., Rossi, M. J., Malhotra, R., and Golden, D. M.:
Reaction of chlorine nitrate with hydrogen chloride and waterat antartic stratospheric temperatures, Science, 238, 1258–1260,1987.
Uras-Aytemiz, N., Joyce, C., and Devlin, J. P.: Kinetics of ice par-ticle conversion to the hydrates of HCl, J. Phys. Chem., 105,10 497–10 500, 2001.
Warshawsky, M. S., Zondlo, M. A., and Tolbert, M. A.: Impactof nitric acid on ice evaporation rates, Geophys. Res. Lett., 26,823–826, 1999.
Wennberg, P. O., Brault, J. W., Hanisco, T. F., Salawitch, R. J.,and Mount, G. J.: The atmospheric column abundance of IO:Implications for stratospheric ozone, J. Geophys. Res. D, 102,8887–8898, 1997.
Zondlo, M. A., Hudson, P. K., Prenni, A. J., and Tolbert, M. A.:Chemistry and microphysics of polar stratospheric clouds andcirrus clouds, Annu. Rev. Phys. Chem., 51, 473–499, 2000.
WMO (World Meteorological Organization): Scientific assessmentof ozone depletion: 2002, Global Ozone Research and Monitor-ing Project – Report no. 47, 498 pp., Geneva, 2003.
www.atmos-chem-phys.org/acp/3/1131/ Atmos. Chem. Phys., 3, 1131–1145, 2003