analytical methods for monitoring carbon monoxide · analytical methods for monitoring carbon...
TRANSCRIPT
2-1
CHAPTER 2
Analytical Methods for MonitoringCarbon Monoxide
2.1 IntroductionInvestigations into relationships between ambient carbon monoxide (CO) levels and human health
outcomes and public health warnings of potentially harmful CO levels require accurate, precise, andrepresentative measurements of CO. Reliable measurement methods also are needed to evaluate the effectsof ambient CO on overall air quality. This chapter will review methods for monitoring CO in ambient airfor conditions ranging from clean continental environments to polluted urban ones. Biological methods formonitoring the impact of ambient CO exposure on human populations also will be reviewed.
To promote uniform enforcement of the air quality standards set forth under the Clean Air Act asamended (U.S. Code, 1991), the U.S. Environmental Protection Agency (EPA) has established provisionsunder which analytical methods can be designated as “reference” or “equivalent” methods (Code of FederalRegulations, 1991a). Either a reference method or an equivalent method for air quality measurements isrequired for acceptance of measurement data for National Ambient Air Quality Standards (NAAQS)compliance. An equivalent method for monitoring CO can be so designated when the method is shown toproduce results equivalent to the approved reference monitoring method based on absorption of infraredradiation from a nondispersed beam.
The EPA-designated reference methods are automated methods utilizing the nondispersive infrared(NDIR) technique, generally accepted as being the most reliable, continuous method for the measurementof CO in ambient air. The official EPA reference methods (Code of Federal Regulations, 1991a) include11 reference methods designated for use in determining compliance for CO. Before a particular NDIRinstrument can be used in a reference method, it must be designated by the EPA as approved in terms ofmanufacturer, model number, components, operating range, etc. Several NDIR instruments have been sodesignated (Code of Federal Regulations, 1991a), including the gas filter correlation (GFC) technique,which was developed through EPA-sponsored research (Burch et al., 1976). No equivalent method usinga principle other than NDIR has been designated for measuring CO in ambient air.
2.2 Overview of Techniques for Measurement of Ambient Carbon MonoxideThe NDIR technique is an automated and continuous method that is based on the specific absorption
of infrared radiation by the CO molecule (Feldstein, 1967). Most commercially available analyzersincorporate a gas filter to minimize interferences from other gases; they operate near atmospheric pressure,and the most sensitive analyzers are able to detect minimum CO concentrations of about 0.02 ppm.Interferences because of carbon dioxide (CO2) and water vapor can be dealt with so as not to affect the dataquality; a particle filter (Teflon® or nylon composition is recommended) and desiccant in the inlet lineimprove reliability. Nondispersive infrared analyzers are relatively insensitive to flow rate, require no wetchemicals, are sensitive over wide concentration ranges, and have short response times. Nondispersive
2-2
infrared analyzers of the newer GFC type have overcome zero and span problems, as well as minorproblems caused by vibrations.
A more sensitive method for measuring low background levels is gas chromatography (GC)(Bergman et al., 1975; Bruner et al., 1973; Dagnall et al., 1973; Porter and Volman, 1962; Feldstein, 1967;Smith et al., 1975; Swinnerton et al., 1968; TesaÍík and Krej…í, 1974). This technique is an automated,semicontinuous method where CO is separated from water, CO2, and hydrocarbons other than methane(CH4) by a stripper column. Carbon monoxide and CH4 then are separated on an analytical column, andthe CO is passed through a catalytic reduction tube, where it is converted to CH4. The CO (converted toCH4) passes through a flame ionization detector (FID), and the resulting signal is proportional to theconcentration of CO in the air. Mercury liberation detectors offer greater sensitivity and ease of operationthan FIDs. (Section 2.4.4.3). These methods have no known interferences and can be used to measurelevels from 0.02 to 45 ppm.
In some environments, new technologies allow CO measurements to be made where it is difficultto install reference instruments. Methods using electrochemistry, or integrated observations usingabsorbents, allow measurements for personal monitoring exposure studies, for in-transit measurements, andin areas where sites are being investigated and permanent installations are not yet planned or available.Focused studies of these developing methods should be encouraged to determine their precision, sensitivityand stability because an understanding of the impact that CO has on human health requires the ability tomonitor under a wide variety of conditions.
Whichever method or instrument is used, it is essential that the results be evaluated by frequentcalibration with samples of known composition (Commins et al., 1977; Goldstein, 1977; National Bureauof Standards, 1975). Chemical analyses can be relied on only after the analyst has achieved acceptableaccuracy in the analysis of such standard samples through an audit program.
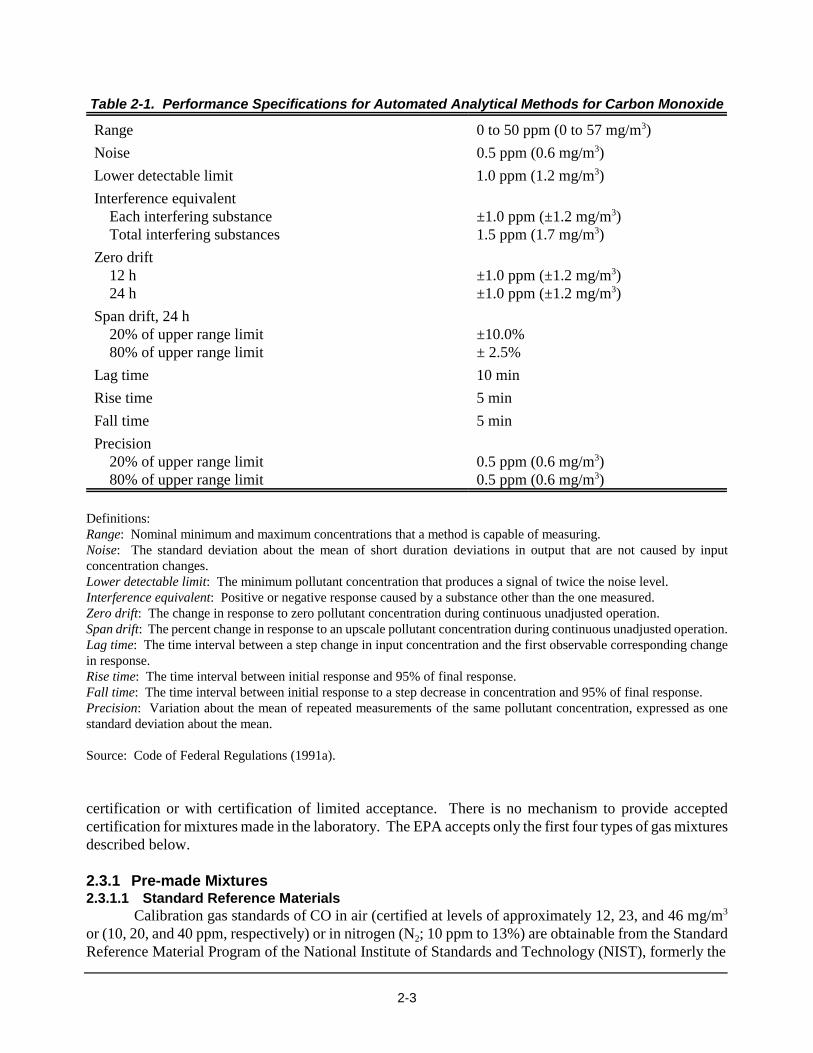
The performance specifications for automated CO analyzers currently in use are shown in Table 2-1.The normal full-scale operating range for reference methods is 0 to 50 ppm (0 to 57 mg/m3). Someinstruments offer higher ranges, typically 0 to 100 ppm (0 to 115 mg/m3), or lower ranges such as 0 to20 ppm (0 to 23 mg/m3). Higher ranges up to 1,000 ppm (1,145 mg/m3) are used to measure COconcentrations in vehicular tunnels and parking garages.
Although CO is one of the criteria pollutants, it is also a precursor to ozone and a useful tracer ofcombustion-derived pollutants (Carter, 1991; Ryan et al., 1998). These additional roles for CO make itsdetection at levels well below the NAAQS highly desirable. At many existing monitoring sites, the mixingratio is frequently below the lower detectable limit specified in Table 2-1. Chemical Transport Models(CTMs), developed to understand air pollution and often required to test abatement strategies forphotochemical smog, rely on accurate data for concentrations of source gases including nitrogen oxides,non-methane hydrocarbons, and CO. Boundary layer CO concentration ratios in urban areas are typically100s of ppb (Seinfeld and Pandis, 1998; Moy et al., 1994; Morales-Morales, 1998). A CO monitor withprecision of 500 ppb would be adequate to prove compliance with the CO standard, but would not provideadequate input data for CTMs. This chapter, therefore, will review methods for measuring CO in ambientair that provide sensitivity adequate to quantify the content of clean continental boundary layer air, that iswith uncertainty on the order of 10 ppb and having a detection limit around 50 ppb, in addition to methodsin current use. Suggested performance specifications for monitoring CO in nonurban environments areshown in Table 2-2.
2.3 Gas Standards for CalibrationThere are basically two different types of calibration gas mixtures: (1) pre-made blends and
(2) mixtures prepared in the laboratory. Certain types of pre-made blends can be purchased with recognizedand accepted certification and traceability information. Other pre-made blends can be purchased without
2-3
Table 2-1. Performance Specifications for Automated Analytical Methods for Carbon Monoxide
Range 0 to 50 ppm (0 to 57 mg/m3)
Noise 0.5 ppm (0.6 mg/m3)
Lower detectable limit 1.0 ppm (1.2 mg/m3)
Interference equivalent Each interfering substance Total interfering substances
±1.0 ppm (±1.2 mg/m3)1.5 ppm (1.7 mg/m3)
Zero drift 12 h 24 h
±1.0 ppm (±1.2 mg/m3)±1.0 ppm (±1.2 mg/m3)
Span drift, 24 h 20% of upper range limit 80% of upper range limit
±10.0%± 2.5%
Lag time 10 min
Rise time 5 min
Fall time 5 min
Precision 20% of upper range limit 80% of upper range limit
0.5 ppm (0.6 mg/m3)0.5 ppm (0.6 mg/m3)
Definitions:Range: Nominal minimum and maximum concentrations that a method is capable of measuring.Noise: The standard deviation about the mean of short duration deviations in output that are not caused by inputconcentration changes. Lower detectable limit: The minimum pollutant concentration that produces a signal of twice the noise level.Interference equivalent: Positive or negative response caused by a substance other than the one measured. Zero drift: The change in response to zero pollutant concentration during continuous unadjusted operation.Span drift: The percent change in response to an upscale pollutant concentration during continuous unadjusted operation.Lag time: The time interval between a step change in input concentration and the first observable corresponding changein response.Rise time: The time interval between initial response and 95% of final response.Fall time: The time interval between initial response to a step decrease in concentration and 95% of final response.Precision: Variation about the mean of repeated measurements of the same pollutant concentration, expressed as onestandard deviation about the mean.
Source: Code of Federal Regulations (1991a).
certification or with certification of limited acceptance. There is no mechanism to provide acceptedcertification for mixtures made in the laboratory. The EPA accepts only the first four types of gas mixturesdescribed below.
2.3.1 Pre-made Mixtures2.3.1.1 Standard Reference Materials
Calibration gas standards of CO in air (certified at levels of approximately 12, 23, and 46 mg/m3
or (10, 20, and 40 ppm, respectively) or in nitrogen (N2; 10 ppm to 13%) are obtainable from the StandardReference Material Program of the National Institute of Standards and Technology (NIST), formerly the

2-4
Table 2-2. Suggested Performance Specifications for Monitoring Carbon Monoxide inNonurban Environments
Range 0 to 50 ppm (0 to 57 mg/m3)
Noise 0.05 ppm (0.06 mg/m3)
Lower detectable limit 0.05 ppm (0.06 mg/m3)
Interference equivalent Each interfering substance Total interfering substances
±0.05 ppm (±0.06 mg/m3)0.10 ppm (0.12 mg/m3)
Zero drift 12 h 24 h
±0.1 ppm (±0.12 mg/m3)±0.1 ppm (±0.12 mg/m3)
Zero interval,a maximum 1 h
Span drift, 24 h 20% of upper range limit 80% of upper range limit
±5.0%±2%
Lag time 1 min
Rise time 5 min
Fall time 5 min
Precision 20% of upper range limit 80% of upper range limit
0.2 ppm (0.24 mg/m3)0.2 ppm (0.24 mg/m3)
aZero interval is the interval between measuring chemical zeros.
Source: Adapted from Code of Federal Regulations (1991a).
National Bureau of Standards, Gaithersburg, MD 20899. These Standard Reference Materials (SRMs) aresupplied as compressed gas mixtures at about 135 bar (1,900 psi) in high-pressure aluminum cylinderscontaining 800 L (28 ft3) of gas at standard temperature and pressure, dry (STPD) (National Bureau ofStandards, 1975; Guenther et al., 1996). Each cylinder is supplied with a certificate stating concentrationand uncertainty. The concentrations are certified to be accurate to ±1% relative to the stated values.Because of the resources required for their certification, SRMs are not intended for use as daily workingstandards, but rather as primary standards against which transfer standards can be calibrated.
2.3.1.2 National Institute of Standards and Technology Traceable Reference MaterialsCalibration gas standards of CO in air or N2, in the concentrations indicated above, are obtainable
from specialty gas companies. Information as to whether a specialty gas company supplies such mixturesis obtainable from the specific company, or the information may be obtained from the Standard ReferenceMaterial Program of NIST. These NIST Traceable Reference Materials (NTRMs) are purchased directlyfrom industry and are supplied as compressed gas mixtures at about 135 bar (1,900 psi) in high pressurealuminum cylinders containing 4,000 L (140 ft3) of gas at STPD. Each cylinder is supplied with acertificate stating concentration and uncertainty. The concentrations are certified to be accurate to within±1% of the stated values (Guenther et al., 1996).
2-5
2.3.1.3 U.S. Environmental Protection Agency Protocol GasesCalibration gas standards of CO in air or CO in N2 at approximately the same concentrations as
SRMs and NTRMs can be purchased from specialty gas companies as EPA Protocol Gases. These gasesare blended and analyzed according to an EPA protocol document and are supplied as gas mixtures in highpressure aluminum cylinders. These mixtures are supplied with certificates stating concentration anduncertainty (U.S. Environmental Protection Agency, 1997).
2.3.1.4 Dutch Bureau of StandardsCalibration gas standards of CO in air over a wide concentration range also can be purchased from
the Dutch Bureau of Standards, which is the Nederland Meetinstituut (NMi) Holland (fax 31-15-261-2971).These are Primary Reference Materials (PRMs) or Certified Reference Materials (CRMs). These ReferenceMaterials (PRMs or CRMs) are supplied as compressed gas mixtures at about 135 bar (1,900 psi) in highpressure aluminum cylinders containing 800 L of gas at STPD. Each cylinder is supplied with a certificatestating concentration and uncertainty. The NIST and EPA recognize the equivalency of specific NMistandards with NIST standards on the strength of the NIST/NMi Declaration of Equivalency Document.
2.3.1.5 Commercial BlendsCalibration gas mixtures of CO in air or N2 over a wide concentration range also can be purchased
commercially from many specialty gas companies. Some mixtures may have “certification” documentationand some may not. These mixtures can be ordered in cylinders of almost any size. Mild steel cylinders areto be avoided (U.S. Environmental Protection Agency, 1991).
The nominal values for CO concentration supplied by the vendor should be verified byintercomparison with an SRM or other validated standard sample. A three-way intercomparison has beenmade among the NIST SRM’s, commercial gas blends, and an extensive set of standard gas mixturesprepared by gravimetric blending at EPA (Paulsell, 1976). Results of the comparison showed thatcommercial gas blends are within ±2% of the true value represented by a primary standard. Another studyon commercial blends (Elwood, 1976) found poorer accuracy. To achieve compatible results in sampleanalyses, different laboratories should interchange and compare their respective working standardsfrequently.
2.3.2 Laboratory Blended MixturesMixtures of CO in almost any matrix gas can be blended in the laboratory. One can start with
gaseous CO or mixtures of CO and dilute these to any concentration desired. The three common proceduresfor blending mixtures into containers are the gravimetric (weighing) procedure, the manometric (pressure)technique, and the volumetric method. One also can use dynamic dilution to prepare standards that are notstored in containers but are used at the time of preparation. There are advantages and disadvantages to eachprocedure, and one must evaluate the application, standards requirements, and laboratory equipment beforechoosing the method of standards preparation.
Standard samples of CO in air also can be prepared by flowing gas dilution techniques. In aversatile system designed for this purpose (Hughes et al., 1973), air at a pressure of about 0.7 to 7.0 bar(about 10 to 100 psi) above ambient is first purified and dried by passage through cartridges of charcoal andsilica gel, then is passed through a sintered metal filter into a flow control and flowmeter system. The CO(or a mixture of CO in air that is to be diluted further), also under pressure, is passed through a similar flowcontrol and flowmeter system.
Dynamic dilution employed to make CO standards often relies on mass flow controllers. Whenperforming a calibration with this technique, care should be taken to control the temperature and pressureof the flow controllers. Investigations into the performance of several brands of mass flow controllers on
2-6
aircraft have revealed that, for large pressure changes, some instruments experience errors in the output wellbeyond the specifications (Weinheimer and Ridley, 1990).
2.3.3 Other MethodsPermeation tubes have been used for preparing standard mixtures of such pollutant gases as sulfur
dioxide and nitrogen dioxide (O’Keeffe and Ortman, 1966; Scaringelli et al., 1970). Permeation tubes arenot used routinely in the United States for making CO standard samples and are not recommended. In thepermeation tube techniques, a sample of the pure gas under pressure is allowed to diffuse through acalibrated partition at a defined rate into a diluent gas stream to give a standard sample of knowncomposition.
Another possible way to liberate known amounts of CO into a diluent gas is by thermaldecomposition of nickel tetracarbonyl [Ni(CO)4]. However, an attempt to use this as a gravimetriccalibration source showed that the relation between CO output and weight loss of the Ni(CO)4 isnonstoichiometric (Stedman et al., 1976).
2.3.4 Intercomparisons of StandardsInitial efforts to establish the absolute uncertainty of CO standards and to put various research
groups around the world on the same scale revealed systematic errors in some of the standards. Carefulpreparation of gas standards and repeated intercomparison of calibration gases and measurements onambient air since have led to general agreement within the international community on both a referencescale and on analytical methods. Calibration standards now generally agree to within 5%, and atmosphericmeasurements made with a variety of analytical techniques agree to 10 ppb or better.
The National Aeronautics and Space Administration (NASA), as part of the ChemicalInstrumentation Test and Evaluation Project, intercompared a tunable diode laser spectroscopy (TDLS)technique and several “grab”-sample gas chromatography-flame ionization detection (GC-FID) techniques(Hoell et al., 1984, 1985). Initial results indicated a high degree of correlation among the variousinstruments, but agreement on the absolute concentration was only about 15%; differences were as largeas 38%. When the intercomparison was repeated (Hoell et al., 1987), calibration standards agreed within95% confidence levels. Measurements of ambient air samples under actual field conditions demonstratedagreement within experimental uncertainty (on the order of 10 ppb) for CO concentration ratios from 60 to170 ppb. When data from the various instruments were regressed, however, slopes again differed fromunity by as much as 14%.
Careful intercomparisons of calibration gases indicate that accurate and consistent standards canbe made. Hughes et al. (1991) compared primary gas standards of CO in N2 produced by NIST and theNational Physical Laboratory in the United Kingdom. These standards, prepared gravimetrically, containedconcentration ratios ranging from 10 ppm to 8%. In a blind intercomparison, the mean difference was0.2%, well within the experimental uncertainty of the techniques. Novelli et al. (1991) gravimetricallyproduced CO in zero air in the range of 25 to 1,000 ppb from both pure CO and a NIST SRM; they foundagreement to within 1%. Agreement with commercially available NIST-traceable standards was within 3%.Reasonable consistency (6% or better) was found with standards used by Australian, German, Brazilian,and several American institutions. One Australian standard was found to be 22% lower, although troublewith this standard had been reported previously (Weeks et al., 1989). A reevaluation of the reference scalein the range of nonurban ambient concentrations (Novelli et al., 1994) confirmed agreement to within 5%or better for the National Oceanic and Atmospheric Administration, NASA, and German groups.
Intercomparisons of TDLS and NDIR GFC techniques (Poulida et al., 1991; Fried et al., 1991)indicated agreement within experimental uncertainty (better than 10% for typical troposphericconcentrations of 100 to 1,000 ppb), when NIST-based standards were used to calibrate both instruments.These experiments demonstrated good agreement in ambient and compressed air. These results, as well

2-7
as results from spiking tests, indicated no significant interferences in either monitor. The intercomparisonsalso established linearity for both techniques in the range from 100 ppm to 10 ppb.
Recent standards normalization and intercomparisons of TDLS, mercury liberation, GC-FID, andNDIR techniques are described by Novelli et al. (1998). For concentration ratios down to the lowestexpected in the boundary layer, about 50 ppb, agreement among groups was typically better than 10 ppb;for higher mixing ratios the typical agreement was about 5%.
2.3.5 Infrared AbsorptionThe TDLS can provide an independent measurement of the concentration of a CO standard. Fried
et al. (1991) used the high-resolution transmission molecular absorption database for the line parametersto calculate the concentration based on direct absorption. Their results agreed with a NIST-certified gasstandard to within 1.6%, well within the uncertainty of the absorption measurement.
2.4 Measurement in Ambient AirThis section discusses several important aspects of the continuous and intermittent measurement
of CO in the atmosphere, including sampling techniques and schedules and recommended analyticalmethods for CO measurement.
2.4.1 Sampling System ComponentsCarbon monoxide monitoring requires a sample introduction system, an analyzer system, and a data
recording system. A sample introduction system consists of a sampling probe, an intake manifold, tubing,and air movers. This system is needed to collect the air sample from the atmosphere and to transport it tothe analyzer without altering the original concentration. It also may be used to introduce known gasconcentrations to periodically check the reliability of the analyzer output. Construction materials for thesampling probe, intake manifold, and tubing should be tested to demonstrate that the test atmospherecomposition or concentration is not altered significantly. It is recommended that sample introductionsystems be fabricated from borosilicate glass or fluorinated ethylene propylene (Teflon®) if severalpollutants are to be monitored (Code of Federal Regulations, 1991b). However, in monitoring for CO only,it has been reported (Wohlers et al., 1967) that no measurable pollutant losses were observed at the high(>1 L/min) sampling flow rates when sampling systems were constructed of tygon, polypropylene,polyvinylchloride, aluminum, or stainless steel piping. The sample introduction system should beconstructed so that it presents no pressure drop to the analyzer. At low flow and low concentrations, suchoperation may require validation.
The analyzer system consists of the analyzer itself and any sample-preconditioning components thatmay be necessary. Sample preconditioning might require a moisture control system such as a Nafion®
drying tube to help minimize the false positive response of the analyzer (e.g., the NDIR analyzer) to watervapor and a particulate filter to help protect the analyzer from clogging and possible chemical interferencecaused by particulate buildup in the sample lines or analyzer inlet. The sample preconditioning system alsomay include a flow metering and control device to control the sampling rate to the analyzer.
2.4.2 Quality Assurance Procedures for SamplingThe accuracy and validity of data collected from a CO monitoring system must be ensured through
a quality assurance program. Such a program consists of procedures for calibration, operational andpreventive maintenance, data handling, and auditing; the procedures should be documented fully in a qualityassurance program manual maintained by the monitoring organization.
Calibration procedures consist of periodic multipoint primary calibration and secondary calibration,both of which are prescribed to minimize systematic error. Primary calibration involves the introduction
2-8
of test atmospheres of known concentration to an instrument in its normal mode of operation for the purposeof producing a calibration curve.
A calibration curve is derived from the analyzer response obtained by introducing several successivetest atmospheres of different known concentrations. One recommended method for generating CO testatmospheres is to use air containing no CO along with several known concentrations of CO in air or N2
contained in high-pressure gas cylinders and verified by NIST-certified SRMs wherever possible (Code ofFederal Regulations, 1991a). The CO can be removed from an air stream by oxidation to CO2 on a catalyst(Dickerson and Delany, 1988; Parrish et al., 1994). The number of standard gas mixtures (cylinders)necessary to establish a calibration curve depends on the nature of the analyzer output. A multipointcalibration at five or six different CO concentrations covering the operating range of the analyzer isrecommended by EPA (Code of Federal Regulations, 1991b; Federal Register, 1978). Alternatively, themultipoint calibration is accomplished by diluting a known high-concentration CO standard gas with zerogas in a calibrated flow dilution system.
Secondary calibration consists of a zero and upscale span of the analyzer. This is recommendedto be performed daily (Federal Register, 1978). If the analyzer response differs by more than 2% from thecertified concentrations, then the analyzer is adjusted accordingly. Complete records of secondarycalibrations should be kept to aid in data reduction and for use in auditing. For high-sensitivitymeasurement, hourly zeros and weekly calibrations are recommended.
Specific criteria for data selection and several instrument checks are available (Smith and Nelson,1973). Data recording involves recording in a standard format for data storage, interchange of data withother agencies, or data analysis. Data analysis and interpretation usually include a mathematical orstatistical analysis of air quality data and a subsequent effort to interpret results in terms of exposurepatterns, meteorological conditions, characteristics of emission sources, and geographic and topographicconditions.
Auditing procedures consist of several quality control checks and subsequent error analyses toestimate the accuracy and precision of air quality measurements. The quality control checks for CO includedata processing, control sample, and water vapor interference checks, all of which should be performed bya qualified individual independent of the regular operator. The error analysis is a statistical evaluation ofthe accuracy and precision of air quality data. Guidelines have been published by EPA (Smith and Nelson,1973) for calculating an overall bias and standard deviation of errors associated with data processing,measurement of control samples, and water vapor interference, from which the accuracy and precision ofCO measurements can be determined. Since January 1, 1983, all state and local agencies submitting datato EPA must provide estimates of accuracy and precision of the CO measurements based on primary andsecondary calibration records (Federal Register, 1978). The precision and accuracy audit results through1985 indicate that the 95% national probability limits for precision are ±9%, and the 95% nationalprobability limits for accuracy are within ±1.5% for all audit levels up to 85 ppm. The results (accuracy)for CO exceed comparable results for other criteria pollutants with national ambient air quality standards(Rhodes and Evans, 1987).
2.4.3 Sampling SchedulesCarbon monoxide concentrations in the atmosphere exhibit large temporal variations because of
changes in the time and rate that CO is emitted by different sources and because of changes inmeteorological conditions that govern the amounts of transport and dilution that take place. During a 1-yearperiod, an urban CO station may monitor hourly concentrations of CO ranging from below the minimumdetection limit to as high as 45 ppm (52 mg/m3). The NAAQS for CO are based on the second highest1- and 8-h average concentrations; violations represent extreme events. In order to measure the highesttwo values from the distribution of 8,760 hourly values in a year, the “best” sampling schedule to employis continuous monitoring 24 h per day, 365 days per year. Even so, continuous monitors rarely operate for
2-9
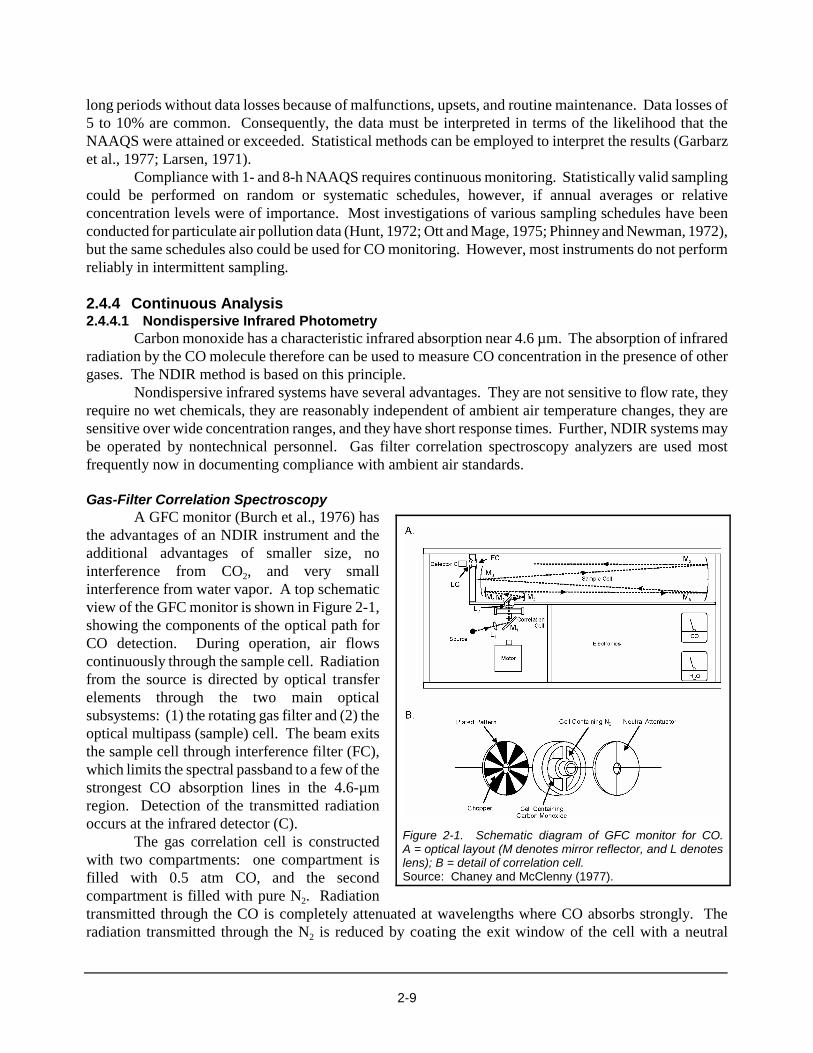
Figure 2-1. Schematic diagram of GFC monitor for CO.A = optical layout (M denotes mirror reflector, and L denoteslens); B = detail of correlation cell.Source: Chaney and McClenny (1977).
long periods without data losses because of malfunctions, upsets, and routine maintenance. Data losses of5 to 10% are common. Consequently, the data must be interpreted in terms of the likelihood that theNAAQS were attained or exceeded. Statistical methods can be employed to interpret the results (Garbarzet al., 1977; Larsen, 1971).
Compliance with 1- and 8-h NAAQS requires continuous monitoring. Statistically valid samplingcould be performed on random or systematic schedules, however, if annual averages or relativeconcentration levels were of importance. Most investigations of various sampling schedules have beenconducted for particulate air pollution data (Hunt, 1972; Ott and Mage, 1975; Phinney and Newman, 1972),but the same schedules also could be used for CO monitoring. However, most instruments do not performreliably in intermittent sampling.
2.4.4 Continuous Analysis2.4.4.1 Nondispersive Infrared Photometry
Carbon monoxide has a characteristic infrared absorption near 4.6 µm. The absorption of infraredradiation by the CO molecule therefore can be used to measure CO concentration in the presence of othergases. The NDIR method is based on this principle.
Nondispersive infrared systems have several advantages. They are not sensitive to flow rate, theyrequire no wet chemicals, they are reasonably independent of ambient air temperature changes, they aresensitive over wide concentration ranges, and they have short response times. Further, NDIR systems maybe operated by nontechnical personnel. Gas filter correlation spectroscopy analyzers are used mostfrequently now in documenting compliance with ambient air standards.
Gas-Filter Correlation SpectroscopyA GFC monitor (Burch et al., 1976) has
the advantages of an NDIR instrument and theadditional advantages of smaller size, nointerference from CO2, and very smallinterference from water vapor. A top schematicview of the GFC monitor is shown in Figure 2-1,showing the components of the optical path forCO detection. During operation, air flowscontinuously through the sample cell. Radiationfrom the source is directed by optical transferelements through the two main opticalsubsystems: (1) the rotating gas filter and (2) theoptical multipass (sample) cell. The beam exitsthe sample cell through interference filter (FC),which limits the spectral passband to a few of thestrongest CO absorption lines in the 4.6-µmregion. Detection of the transmitted radiationoccurs at the infrared detector (C).
The gas correlation cell is constructedwith two compartments: one compartment isfilled with 0.5 atm CO, and the secondcompartment is filled with pure N2. Radiationtransmitted through the CO is completely attenuated at wavelengths where CO absorbs strongly. Theradiation transmitted through the N2 is reduced by coating the exit window of the cell with a neutral
2-10
attenuator so that the amounts of radiation transmitted by the two cells are made approximately equal inthe passband that reaches the detector.
In operation, radiation passes alternately through the two cells as they are rotated to establish asignal modulation frequency. If CO is present in the sample, the radiation transmitted through the CO isnot appreciably changed, whereas that through the N2 cell is changed. This imbalance is linearly relatedto CO concentrations in ambient air.
Enhanced PerformanceAlthough commercial CO monitors were designed to meet the performance specifications shown
in Table 2-1, several instruments have the potential for much greater sensitivity. Modifications ofcommercially available NDIR monitors (Dickerson and Delany, 1988; Parrish et al., 1994) have been madeto enhance their performance, but the manufacturers have continued to improve instruments and offer“high-sensitivity” options that could meet the requirements of monitoring clean continental air (i.e., adetection limit of about 50 ppb and resolution of 10 ppb).
The principal constraints on the lower detectable limits of commercially available NDIR COmonitors are detector noise, water vapor interference, and drift in the background. Several methods havebeen developed by researchers to improve detector noise, such as cooling the preamplifier and improvingthe optics. More recent improvements made by the manufacturers, such as gold-coated mirrors and selectedinfrared (IR) radiation detectors have been effective in reducing detector noise.
Water vapor produces a negative artifact such that a volume mixing ratio of 1% would reduceapparent CO mixing ratio measurement by 50 ppb. This interference can be reduced to within tolerancesby drying the sample air with a cold trap, desiccant, or drying tube (Dickerson and Delany, 1988).Alternatively, the zero can be checked frequently enough so that changes in ambient humidity are unlikelyto produce a significant error (Parrish et al., 1994).
The greatest source of potential error in monitoring CO in the 0.1-ppm range is background drift.The stability of the instruments with respect to changes in calibration (span) is adequate, but the background(zero) drifts on time scales of minutes to hours in response to, among other factors, instrument temperature.This drift can be accounted for most easily by frequent chemical zeroing with a oxidizer that converts COto CO2.
2.4.4.2 Gas Chromatography-Flame IonizationCarbon monoxide can be measured in either ambient air samples collected every few minutes or
in air from grab samples stored under pressure in inert canisters. Carbon monoxide in air samples is dried,preconcentrated, reduced to methane, and detected by flame ionization (GC-FID) (Heidt, 1978; Greenberget al., 1984; Hoell et al., 1987). Uncertainty on the order of 10 ppb or 10% of the observation can beobtained routinely.
2.4.4.3 Mercury Liberation This technique, involving reaction with hot mercuric oxide to produce elemental mercury vapor,
was developed early this century (Moser and Schmid, 1914; Beckman et al., 1948; McCullough et al., 1947;Mueller, 1954; Palanos, 1972; Robbins et al., 1968) and is now available commercially (e.g., TraceAnalytical Inc., Menlo Park, CA). The method is temperature and pressure sensitive, and operation in thecontinuous mode requires elimination of interferences from sulfur dioxide, hydrogen, and hydrocarbons(Seiler et al., 1980). Successful continuous operation has been reported with response time on the orderof 20 s and detection limits near 20 ppb (Fishman et al., 1980; Brunke et al., 1990).
As a GC detector, mercury liberation (GC-ML) offers high sensitivity, without the interferencesinherent in continuous measurements (e.g., Novelli et al., 1991, 1998). Air samples are collected in glassbottles and injected into a gas chromatograph with two columns. The CO is then detected with a
2-11
CO ( ) + h CO ( ).1Χ Χ1∑ → ∏ν (2-1)
commercial mercuric oxide reduction detector (e.g., Trace Analytical Inc., Menlo Park, CA). The systemis linear from 10 ppb to more than 1,000 ppb, has a detection limit below 10 ppb, and the reporteduncertainty is about 2%.
2.4.4.4 Tunable Diode Laser SpectroscopyTunable diode lasers (TDLs) produce IR radiation with a line width that is narrow compared with
typical absorption lines of atmospheric trace gases. Absorption of IR radiation by a single rotational linein the 4.6-µm band can be exploited to measure CO with high precision and rapid response, and withoutinterferences; the sharp focus on a narrow spectral region provides great selectivity. Air samples aremeasured over open paths through the ambient air (Chaney et al., 1979) or by pulling air samples throughan orifice into a long-path cell maintained at a pressure well below ambient (Sachse et al., 1987; Fried et al.,1991; Roths et al., 1996). Radiation from a TDL is modulated over a very narrow wavelength region suchthat absorption by CO produces an alternating current signal. The background is measured by catalyticoxidation of CO to CO2.
Instruments based on TDLS are the fastest and most sensitive extant, with a typical detection limitof a few parts per billion and a response time of a few seconds. For long-term monitoring, the high cost andneed for a skilled operator on site are disadvantages.
2.4.4.5 Resonance FluorescenceResonance fluorescence of CO in the vacuum ultraviolet has been used for a highly sensitive and
rapidly responding instrument (Volz and Kley, 1985; Gerbig et al., 1996). Excitation is represented by thefollowing reaction:
Atmospheric CO absorbs radiation in the 150-nm range from a radio frequency discharge lamp, andfluorescence from the excited CO is detected by a photomultiplier tube. The lamp generates a plasma ina continuous flow of CO2 in argon. Limits to the sensitivity of this instrument are set by interference fromwater vapor, continuum Raman scattering by oxygen, and by drift in the lamp intensity. The pressure inthe fluorescence chamber must be maintained between 7 and 9 mbar air to balance interference fromoxygen and the signal from CO.
Recent improvements (Gerbig et al., 1999) have reduced the detection limit to 3 ppb for a responsetime as short as a few seconds. The high sensitivity and small size of the instrument are desirable formeasurements from aircraft. Before the instrument is practical for air pollution monitoring, its stabilitymust be improved. As the lamp window degrades, sensitivity is lost, such that, after about 200 h ofoperation, loss in the span of a factor of two can be expected.
2.4.5 Intercomparisons of MethodsSeveral techniques (TDLS, NDIR/GFC, GC-FID, and GC-ML) have been evaluated in rigorous
intercomparisons under field conditions. For unpolluted tropospheric air, a number of instrumentsemploying different analytical principles consistently have measured concentration ratios that agree withinexperimental uncertainty (Hoell et al., 1987; Fried et al., 1991; Poulida et al., 1991; Novelli et al., 1998).
2.4.6 Other Methods of AnalysisColor changes induced by reaction of a solid or liquid date back to Haldane (1897-1898) and were
reviewed extensively in the previous criteria document. Examples include the colored silver sol method,the NIST colorimetric indicating gel, the length-of-stain indicator tube, and frontal analysis (U.S.Environmental Protection Agency, 1991).

2-12
More recently developed electrochemical techniques show highly improved resolution andspecificity (e.g., Langan, 1992; Lee et al., 1992a; Ott et al., 1995). Electrochemical sensors operate bymeasuring the current of a small fuel cell and, because of their reduced size and power requirements, havebeen used extensively in exposure and indoor research studies (see Section 2.5). Precision of 0.2 to 2 ppmhas been reported. Further independent evaluation and intercomparison, followed by publication in thereviewed scientific literature, is called for to determine the sensitivity, stability, and selectivity ofelectrochemical methods to establish equivalency to the NDIR instrument by EPA for use in compliancemonitoring.
2.5 Measurement Using Personal and Remote Monitors2.5.1 Personal Monitors
Monitors at fixed locations provide useful information on ambient CO concentrations and theirvariability and trends, but such monitors cannot measure personal exposure. Information on personalexposure, including home, in-transit, and work-related concentrations is needed for epidemiologic studies.The previous criteria document (U.S. Environmental Protection Agency, 1991) reviewed the state of thescience of personal monitors as of about 1986. Since that time, the devices have been further developedand refined.
One technique involves an ion-exchange Y-type zeolite, with zinc ion as the adsorbent. Theadsorbent is desorbed thermally, converted to methane, and analyzed using GC-FID (e.g., Lee et al.,1992b,c; Lee and Yanagisawa, 1992, 1995). Apte (1997) reviewed several of these devices and describedpassive samplers based on transition metal compound color changes measured spectrochemically. Themethod has an interference with ethylene, inconsequential in most microenvironments, but providesadequate performance (sensitivity of 10 ppm/h and precision of ±20% or better) for health studies.Substantial work remains for most passive samplers on stability and response to change in temperature,humidity, and interferences. These passive techniques lack the response speed and sensitivity forcompliance ambient air monitoring or short time-scale personal monitoring, but they have been field testedand found adequate for occupational CO exposure studies where a longer 8-h average CO value is measuredfor comparison to an 8-h Occupational Safety and Health Administration standard (Apte et al., 1999).
Numerous field studies on personal exposure and microenvironmental sampling have beenconducted with electrochemical sensors (Akland et al., 1985; Ott et al., 1986; Wallace et al., 1988; Langan,1992; Ott et al., 1994; Klepeis et al., 1999; McBride et al., 1999); some are described in Chapters 3 and 4.Over the past 15 years, the electrochemical personal CO monitors have been much improved, and the latterstudies show the increased versatility of the electrochemical sensor for field sampling. These studiesdocumented the spatial and temporal variability of CO concentrations in an urban area at locations awayfrom a central monitoring site and showed how the effects of sources of CO in microenvironments can adda major increment to a person’s CO exposure, as estimated only from compliance measurements of CO ata central ambient monitoring station.
2.5.2 Remote MonitorCarbon monoxide emissions from vehicles can be measured rapidly with a remote sensing IR
technique (Bishop et al., 1989; Bishop and Stedman, 1996) in which CO is measured near 4.3 Fm and CO2
at 3.6 Fm; a third wavelength is used as a reference for intensity. The instrument has been evaluated in adouble blind intercomparison with on-board NDIR, and the two methods agreed well within experimentaluncertainty (Lawson et al., 1990). Surveys conducted with this technique reveal that the majority of COis emitted by a minority of vehicles. The method has been used to evaluate the efficacy of inspection andmaintenance programs and oxygenated fuels (Beaton et al., 1995; Stedman et al., 1997, 1998). The sum
2-13
of measurements indicates a general decrease in fleet-averaged CO emissions over the past decade (Bradleyet al., 1999).
2.6 Biological MonitoringA unique feature of CO exposure is that there is a biological marker for the recent dose that an
individual has received—the blood level of CO. This level may be calculated by measuring bloodcarboxyhemoglobin (COHb) or by measuring CO in end-tidal exhaled breath after a standardized breathholdmaneuver, with a required correction for the background CO inhaled prior to a breathhold (Smith, 1977;Wallace, 1983). The measurement methods for COHb and breath CO were reviewed extensively in theprevious criteria document (U.S. Environmental Protection Agency, 1991). This section provides an updateon advances in analytical methods for measuring blood COHb and breath CO that have been published inthe literature since the previous review. New studies reporting breath CO or blood COHb in populationstudies are discussed in Chapter 4, along with other new CO exposure assessments.
2.6.1 Carboxyhemoglobin MeasurementsDirect reading of COHb usually is performed in the clinical or hospital setting through the use of
a direct-reading spectrophotometer, such as a CO-Oximeter (CO-Ox). For clinical purposes, precision onthe order of ±1% COHb is not of primary importance, because of the need to differentiate betweenconditions of low levels of COHb and the much higher levels of COHb that indicate treatment for COpoisoning. The concern in this setting, for example, is to rapidly distinguish between 1 and 10% COHb,not between 1 and 2% COHb. Marshall et al. (1995) showed a wide range of threshold COHb values(measured in the blood by CO-Ox, not estimated from breath CO) used to determine treatment in a sampleof 23 Boston, MA, area laboratories. For example, eight laboratories accepted values of 5 to 6% COHb asnormal in nonsmokers, a value that cannot be supported by the modern scientific literature. The authorsrecommended the use of threshold limits of 3% COHb for nonsmokers and 10% COHb for smokers whenclassifying subjects for treatment.
The performance of the various early versions of the CO-Ox instruments for measuring blood COHbwas reviewed in Section 8.5 of the previous criteria document (U.S. Environmental Protection Agency,1991). These and later instruments, of different design from different manufacturers, used severalwavelengths of light for simultaneous measurement of hemoglobin (Hb), oxyhemoglobin (O2Hb), COHb,and methemoglobin (Freeman and Steinke, 1993; Gong, 1995; Bailey et al., 1997). Vreman et al. (1993)and Mahoney et al. (1993) confirmed that considerable difficulties were encountered for COHbconcentrations below 5% (a region with which most environmental studies of nonsmokers are concerned),and the authors concluded that the CO-Ox is unreliable for environmental studies. Some versions of theCO-Ox also were found to be influenced by bilirubin and by fetal hemoglobin (Hb), presenting difficultyin diagnosing newborn infants with jaundice (Vreman and Stevenson, 1994; Stevenson and Vreman, 1997).Shepherd and McMahan (1996) present a highly detailed analysis of the causes and effects of oximetererrors in blood gas analyses.
Recent CO-Ox developments have been a new six-wavelength instrument (InstrumentationLaboratory, 1999) used by Kimmel et al. (1999) and a 128-wavelength instrument (Krarup, 1998) both ofwhich identify and correct for possible interferences. The latter instrument is still under formal independentevaluation, and, although peer-reviewed published results of comparison testing are expected to beforthcoming shortly, the only article currently in press is in German, in a non-peer-reviewed journal(Krarup, 1999). It is possible that comparison of the results on the same sample using the new multi-wavelength instruments and older instruments with fewer wavelengths may show that the new instrumentsmeasure lower COHb if they better correct for the positive interferences of various non-COHb species inthe blood, such as varying fractions of fetal hemoglobin and sulfhemoglobin. This would be consistent with
2-14
the report that some laboratories, as cited above, accepted 5 to 6% COHb from oximeter readings as normalfor nonsmokers.
For a research study to relate health effects or breath CO to COHb, the method of choice is GCanalysis of the CO gas released from the blood when COHb is dissociated (U.S. Environmental ProtectionAgency, 1991; Van Dam and Daenens, 1994; Lloyd and Rowe, 1999). The reader, therefore, is alerted tothe difference between end-tidal breath CO to blood COHb relationships when the COHb is determined byCO-Ox or GC. A calibration curve relating exhaled end-tidal breath CO to COHb should be based on astandard breath-hold maneuver for the CO collection and the GC method of COHb analysis. It is beyondthe scope of this chapter to reanalyze the early COHb literature and estimate the effect of the possiblepositive interferences that were not accounted for by the early CO-Ox instruments because each instrumentand its on-site calibration procedure would create a different bias that cannot be known with certainty.However, in general, the levels of COHb associated with low levels of ambient CO exposure in field studiesmay have been overestimated in the past.
2.6.2 Breath Carbon Monoxide MeasurementsCarbon monoxide in the breath can be measured by all techniques used to measure ambient CO
concentrations, as described in the previous criteria document (U.S. Environmental Protection Agency,1991). A common type of instrument in use for rapidly screening large numbers of people for COexposures or measuring breath CO distributions is the electrochemical analyzer. The subject performs aninhalation-breathhold maneuver and exhales through a mouthpiece into the instrument inlet. The end-tidalbreath is retained for analysis, and the reading in parts per million of CO can be converted to COHb througha calibration curve or nomogram provided with the instrument.
Vreman et al. (1993) presented evidence to show that a serious positive interferent in theelectrochemical method (hydrogen gas) is present in the exhaled breath of some persons as a result ofmetabolism of certain foods. Because this could have affected many previous studies, including the verylarge EPA studies in Washington, DC, and Denver, CO (Akland et al., 1985), it would be desirable todetermine the fraction of the population so affected. Because of the general decline of ambient CO, thispotential interference takes on more importance in any future studies, which must account for this problemif employing electrochemical devices to measure breath CO.
Lee et al. (1991) developed a TDLS system that was well suited for measuring low levels of CO inbreath. The system also can detect the abundance of isotopic CO (13C16O), with a preliminary finding ofa slight enrichment over atmospheric abundance in breath. Lee et al. (1994) employed the instrument ina study correlating breath CO and blood COHb in people living near Boulder, CO (described in Chapter 4).
The passive CO sampler developed by Lee and Yanagisawa (1992, 1995) (see Section 2.5) has areusable sampling system that allows the collection of only the last 5 mL of a breath expelled after breathholding for 20 s, thus obtaining alveolar air undiluted by dead space air. The sampler was unaffected byhumidity; however, the rather low efficiency of collection (50%) and the resulting fairly high detection limitof 3.2 ppm may limit the utility of the sampler for environmental studies.
2.6.3 Relationships of Breath Carbon Monoxide to Blood CarboxyhemoglobinThe end-tidal breath CO versus COHb relationships reviewed in the previous criteria document (see
Table 8-14 in U.S. Environmental Protection Agency, 1991) and in studies published in the literature sincethen are often at variance because they use either a 10-, 15-, or 20-s breathhold step in the breath collection;use either GC or CO-Ox for the blood COHb measurements; or may not correct for the CO content of theinhaled air. The use of a 20-s breathhold, as recommended by Jones et al. (1958), with a correction for theCO content of the inhaled air (Smith, 1977; Wallace, 1983), would improve the reproducibility of the CObreath measurements, and the use of GC would improve the accuracy of the corresponding COHbmeasurement. The 20-s breathhold is preferable, because it maximizes the approach to equilibrium and
2-15
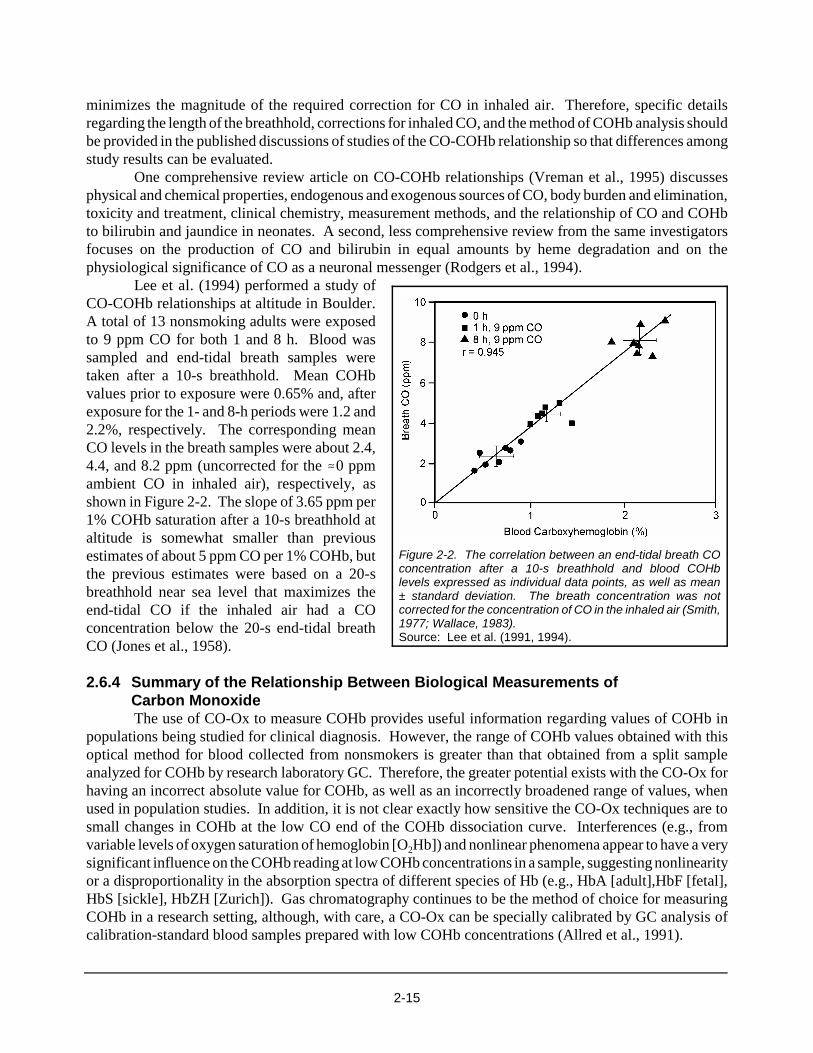
Figure 2-2. The correlation between an end-tidal breath COconcentration after a 10-s breathhold and blood COHblevels expressed as individual data points, as well as mean± standard deviation. The breath concentration was notcorrected for the concentration of CO in the inhaled air (Smith,1977; Wallace, 1983). Source: Lee et al. (1991, 1994).
minimizes the magnitude of the required correction for CO in inhaled air. Therefore, specific detailsregarding the length of the breathhold, corrections for inhaled CO, and the method of COHb analysis shouldbe provided in the published discussions of studies of the CO-COHb relationship so that differences amongstudy results can be evaluated.
One comprehensive review article on CO-COHb relationships (Vreman et al., 1995) discussesphysical and chemical properties, endogenous and exogenous sources of CO, body burden and elimination,toxicity and treatment, clinical chemistry, measurement methods, and the relationship of CO and COHbto bilirubin and jaundice in neonates. A second, less comprehensive review from the same investigatorsfocuses on the production of CO and bilirubin in equal amounts by heme degradation and on thephysiological significance of CO as a neuronal messenger (Rodgers et al., 1994).
Lee et al. (1994) performed a study ofCO-COHb relationships at altitude in Boulder.A total of 13 nonsmoking adults were exposedto 9 ppm CO for both 1 and 8 h. Blood wassampled and end-tidal breath samples weretaken after a 10-s breathhold. Mean COHbvalues prior to exposure were 0.65% and, afterexposure for the 1- and 8-h periods were 1.2 and2.2%, respectively. The corresponding meanCO levels in the breath samples were about 2.4,4.4, and 8.2 ppm (uncorrected for the .0 ppmambient CO in inhaled air), respectively, asshown in Figure 2-2. The slope of 3.65 ppm per1% COHb saturation after a 10-s breathhold ataltitude is somewhat smaller than previousestimates of about 5 ppm CO per 1% COHb, butthe previous estimates were based on a 20-sbreathhold near sea level that maximizes theend-tidal CO if the inhaled air had a COconcentration below the 20-s end-tidal breathCO (Jones et al., 1958).
2.6.4 Summary of the Relationship Between Biological Measurements ofCarbon MonoxideThe use of CO-Ox to measure COHb provides useful information regarding values of COHb in
populations being studied for clinical diagnosis. However, the range of COHb values obtained with thisoptical method for blood collected from nonsmokers is greater than that obtained from a split sampleanalyzed for COHb by research laboratory GC. Therefore, the greater potential exists with the CO-Ox forhaving an incorrect absolute value for COHb, as well as an incorrectly broadened range of values, whenused in population studies. In addition, it is not clear exactly how sensitive the CO-Ox techniques are tosmall changes in COHb at the low CO end of the COHb dissociation curve. Interferences (e.g., fromvariable levels of oxygen saturation of hemoglobin [O2Hb]) and nonlinear phenomena appear to have a verysignificant influence on the COHb reading at low COHb concentrations in a sample, suggesting nonlinearityor a disproportionality in the absorption spectra of different species of Hb (e.g., HbA [adult],HbF [fetal],HbS [sickle], HbZH [Zurich]). Gas chromatography continues to be the method of choice for measuringCOHb in a research setting, although, with care, a CO-Ox can be specially calibrated by GC analysis ofcalibration-standard blood samples prepared with low COHb concentrations (Allred et al., 1991).

2-16
The measurement of exhaled breath CO has the advantages of ease, speed, precision (provided therequired correction for CO in the inhaled air is made), and greater subject acceptance than the invasivemeasurement of blood COHb. Breath CO measurement on randomly chosen people can be related to theblood COHb by use of an empirical relationship developed by simultaneous measurements of COHb(preferably by GC) and breath CO, using the identical procedure for the breath collection that is used in thepopulation study. The empirical relationships developed with different breath holding techniques will differfrom the theoretical Haldane equilibrium relationship for the reaction CO + O2Hb ø O2 + COHb, whichdepends on the ratio of adult- to fetal-hemoglobin (HbA:HbF). This is because the Haldane relationshipis for in vitro static equilibrium, and the empirical end-tidal breath CO-blood COHb relationship is for anin vivo dynamic equilibrium that depends on how long the breath is held and on the correction for the COin inhaled air.
2.7 SummaryThe review of the state of the science for this criteria document yields several major points
concerning analytical techniques for CO measurement.Several adequate techniques exist for highly reliable monitoring of CO to ensure compliance with
the NAAQS. Determination of the actual mean ambient air concentration requires substantially betterperformance than does the minimum required to demonstrate compliance with the NAAQS. Commercialinstruments, sometimes with minor modifications, can meet the measurement needs for supplying usefuldata on the emission, distribution, and trends of ambient CO and for modeling photochemical smog.
Use of enhanced instruments for monitoring of actual CO concentrations with reasonable precisionis needed if CO levels in clean continental air outside of urban environments are to be quantifiedadequately. Commonly used calibration standards and measurement techniques have in the past failed tomeet the criteria of precise measurement, but there is now general agreement on procedures for generatingstandards with absolute accuracy better than about 2% in the parts per million range and about 10% in therange of mixing ratios found in the clean troposphere. Compressed air mixtures, traceable to NIST or NMi,provide reliable means of precise calibration.
The NDIR, GC-ML, GC-FID, and TDL techniques have undergone careful evaluation with syntheticair mixtures and ambient air, and are deemed reliable. The methods were intercompared in both open andblind studies with designated “disinterested, third-party” referees. Early problems were identified andcorrected, and the most recent intercomparisons indicate general agreement on calibration standards andambient air measurements over a broad range of concentrations. New techniques should undergo the samerigorous evaluation.
Several new electrochemical and passive sampling methods have become available. Thesetechniques are not yet equivalent to the NDIR method for compliance monitoring or precise enough for COmeasurements in background ambient air (<0.5 ppm CO) for inputs to CTM, but they are very useful forpersonal exposure and indoor research studies. Further work on the stability and specificity of theelectrochemical methods to obtain EPA equivalency is warranted.
The level of COHb in the blood may be determined directly by blood analysis or indirectly bymeasuring CO in exhaled breath. The use of CO-Ox to measure COHb can provide useful informationregarding mean values in populations being studied or as an aid in clinical diagnosis. It has been shown,however, that the range of values obtained with this optical method will be greater than that obtained withother more accurate methods, especially at COHb levels <5%. Gas chromatography continues to be themethod of choice for measuring COHb.

2-17
The measurement of exhaled breath has the advantages of ease, speed, precision, and greater subjectacceptance than measurement of blood COHb. However, the accuracy of the breath measurementprocedure and the validity of the in vitro Haldane relationship between breath and blood still remains inquestion, especially at low environmental CO concentrations.
ReferencesAkland, G. G.; Hartwell, T. D.; Johnson, T. R.; Whitmore, R. W. (1985) Measuring human exposure to carbon monoxide in
Washington, D.C., and Denver, Colorado, during the winter of 1982-1983. Environ. Sci. Technol. 19: 911-918.Allred, E. N.; Bleecker, E. R.; Chaitman, B. R.; Dahms, T. E.; Gottlieb, S. O.; Hackney, J. D.; Pagano, M.; Selvester, R. H.;
Walden, S. M.; Warren, J. (1991) Effects of carbon monoxide on myocardial ischemia. Environ. Health Perspect.91: 89-132.
Apte, M. G. (1997) A population-based exposure assessment methodology for carbon monoxide: development of a carbonmonoxide passive sampler and occupational dosimeter [dissertation]. Berkeley, CA: U.S. Department of Energy, LawrenceBerkeley National Laboratory, Environmental Energy Technologies Division; LBNL-40838.
Apte, M. G.; Cox, D. D.; Hammond, S. K.; Gundel, L. A. (1999) A new carbon monoxide occupational dosimeter: results froma worker exposure assessment survey. J. Exposure Anal. Environ. Epidemiol. 9: 546-559.
Bailey, S. R.; Russell, E. L.; Martinez, A. (1997) Evaluation of the AVOXimeter: precision, long-term stability, linearity, and usewithout heparin. J. Clin. Monit. 13: 191-198.
Beaton, S. P.; Bishop, G. A.; Zhang, Y.; Ashbaugh, L. L.; Lawson, D. R.; Stedman, D. H. (1995) On-road vehicle emissions:regulations, costs, and benefits. Science (Washington, DC) 268: 991-993.
Beckman, A. O.; McCullough, J. D.; Crane, R. A. (1948) Microdetermination of carbon monoxide in air: a portable instrument.Anal. Chem. 20: 674-677.
Bergman, I.; Coleman, J. E.; Evans, D. (1975) A simple gas chromatograph with an electrochemical detector for the measurementof hydrogen and carbon monoxide in the parts per million range, applied to exhaled air. Chromatographia 8: 581-583.
Bishop, G. A.; Stedman, D. H. (1996) Measuring the emissions of passing cars. Acc. Chem. Res. 29: 489-495.Bishop, G. A.; Starkey, J. R.; Ihlenfeldt, A.; Williams, W. J.; Stedman, D. H. (1989) IR long-path photometry: a remote sensing
tool for automobile emissions. Anal. Chem. 61: 671A-677A.Bradley, K. S.; Stedman, D. H.; Bishop, G. A. (1999) A global inventory of carbon monoxide emissions from motor vehicles.
In: Khalil, M. A. K.; Pinto, J. P.; Shearer, M. J., eds. Carbon monoxide [special issue of papers from an internationalconference; December 1997; Portland, OR]. Chemosphere Global Change Sci. 1: 65-72.
Bruner, F.; Ciccioli, P.; Rastelli, R. (1973) The determination of carbon monoxide in air in the parts per billion range by meansof a helium detector. J. Chromatogr. 77: 125-129.
Brunke, E.-G.; Scheel, H. E.; Seiler, W. (1990) Trends of tropospheric CO, N2O, and CH4 as observed at Cape Point, South Africa.Atmos. Environ. 24A: 585-595.
Burch, D. E.; Gates, F. J.; Pembrook, J. D. (1976) Ambient carbon monoxide monitor. Research Triangle Park, NC: U.S.Environmental Protection Agency, Environmental Sciences Research Laboratory; report no. EPA-600/2-76-210.
Carter, W. P. L. (1991) Development of ozone reactivity scales for volatile organic compounds. Research Triangle Park, NC: U.S.Environmental Protection Agency, Atmospheric Research and Exposure Assessment Laboratory; report no.EPA/600/3-91/050.
Chaney, L. W.; McClenny, W. A. (1977) Unique ambient carbon monoxide monitor based on gas filter correlation: performanceand application. Environ. Sci. Technol. 11: 1186-1190.
Chaney, L. W.; Rickel, D. G.; Russwurm, G. M.; McClenny, W. A. (1979) Long-path laser monitor of carbon monoxide: systemimprovements. Appl. Opt. 18: 3004-3009.
Code of Federal Regulations. (1991a) Ambient air monitoring reference and equivalent methods. C. F. R. 40: §53.Code of Federal Regulations. (1991b) National primary and secondary ambient air quality standards. C. F. R. 40: §50.Commins, B. T.; Berlin, A.; Langevin, M.; Peal, J. A. (1977) Intercomparison of measurement of carboxyhaemoglobin in different
European laboratories and establishment of the methodology for the assessment of COHb levels in exposed populations.Luxembourg, Sweden: Commission of the European Communities, Health and Safety Directorate; doc. no. V/F/1315/77e.
Dagnall, R. M.; Johnson, D. J.; West, T. S. (1973) A method for the determination of carbon monoxide, carbon dioxide, nitrousoxide and sulphur dioxide in air by gas chromatography using an emissive helium plasma detector. Spectrosc. Lett.6: 87-95.
Dickerson, R. R.; Delany, A. C. (1988) Modification of a commercial gas filter correlation CO detector for enhanced sensitivity.J. Atmos. Oceanic Technol. 5: 424-431.
Elwood, J. H. (1976) A calibration procedural system and facility for gas turbine engine exhaust emission analysis. In: Calibrationin air monitoring: a symposium; August 1975; Boulder, CO. Philadelphia, PA: American Society for Testing and Materials;pp. 255-272; ASTM special technical publication no. 598.
2-18
Federal Register. (1978) Air quality surveillance and data reporting: proposed regulatory revisions. F. R. (August 7)43: 34892-34934.
Feldstein, M. (1967) Methods for the determination of carbon monoxide. Prog. Chem. Toxicol. 3: 99-119.Fishman, J.; Seiler, W.; Haagenson, P. (1980) Simultaneous presence of O3 and CO bands in the troposphere. Tellus 32: 456-463.Freeman, G. L.; Steinke, J. M. (1993) Evaluation of two oximeters for use in cardiac catheterization laboratories. Catheterization
Cardiovasc. Diagn. 30: 51-57.Fried, A.; Henry, B.; Parrish, D. D.; Carpenter, J. R.; Buhr, M. P. (1991) Intercomparison of tunable diode laser and gas filter
correlation measurements of ambient carbon monoxide. Atmos. Environ. 25A: 2277-2284.Garbarz, J.-J.; Sperling, R. B.; Peache, M. A. (1977) Time-integrated urban carbon monoxide measurements. San Francisco, CA:
Environmental Measurements, Inc.Gerbig, C.; Kley, D.; Volz-Thomas, A.; Kent, J.; Dewey, K.; McKenna, D. S. (1996) Fast response resonance fluorescence CO
measurements aboard the C-130: instrument characterization and measurements made during North Atlantic RegionalExperiment 1993. J. Geophys. Res. [Atmos.] 101: 29,229-29,238.
Gerbig, C.; Schmitgen, S.; Kley, D.; Volz-Thomas, A.; Dewey, K.; Haaks, D. (1999) An improved fast-response vacuum-UVresonance fluorescence CO instrument. J. Geophys. Res. [Atmos.] 104: 1699-1704.
Goldstein, G. M. (1977) COHb measurements, results of discussion between Drs. A. Berlin, CEC and G. Goldstein, EPA on ECEdoc V/F/1315/77e [letter to Mr. Jack Thompson]. Research Triangle Park, NC: U.S. Environmental Protection Agency;September 23.
Gong, A. K. (1995) Near-patient measurements of methemoglobin, oxygen saturation, and total hemoglobin: evaluation of a newinstrument for adult and neonatal intensive care. Crit. Care Med. 23: 193-201.
Greenberg, J. P.; Zimmerman, P. R.; Heidt, L.; Pollock, W. (1984) Hydrocarbon and carbon monoxide emissions from biomassburning in Brazil. J. Geophys. Res. [Atmos.] 89: 1350-1354.
Guenther, F. R.; Dorko, W. D.; Miller, W. R.; Rhoderick, G. C. (1996) The NIST traceable reference material program for gasstandards. Washington, DC: U.S. Department of Commerce, National Institute of Standards and Technology; NIST specialpublication 260-126.
Haldane, J. (1897-1898) Some improved methods of gas analysis. J. Physiol. (London) 22: 465-480.Heidt, L. E. (1978) Whole air collection and analysis. Atmos. Technol. (9): 3-8.Hoell, J. M.; Gregory, G. L.; Carroll, M. A.; McFarland, M.; Ridley, B. A.; Davis, D. D.; Bradshaw, J.; Rodgers, M. O.; Torres,
A. L.; Sachse, G. W.; Hill, G. F.; Condon, E. P.; Rasmussen, R. A.; Campbell, M. C.; Farmer, J. C.; Sheppard, J. C.; Wang,C. C.; Davis, L. I. (1984) An intercomparison of carbon monoxide, nitric oxide, and hydroxyl measurement techniques:overview of results. J. Geophys. Res. [Atmos.] 89: 11,819-11,825.
Hoell, J. M., Jr.; Gregory, G. L.; McDougal, D. S.; Sachse, G. W.; Hill, G. F.; Condon, E. P.; Rasmussen, R. A. (1985)An intercomparison of carbon monoxide measurement techniques. J. Geophys. Res. [Atmos.] 90: 12,881-12,889.
Hoell, J. M., Jr.; Gregory, G. L.; McDougal, D. S.; Sachse, G. W.; Hill, G. F.; Condon, E. P.; Rasmussen, R. A. (1987) Airborneintercomparison of carbon monoxide measurement techniques. J. Geophys. Res. [Atmos.] 92: 2009-2019.
Hughes, E. E.; Dorko, W. D.; Scheide, E. P.; Hall, L. C.; Beilby, A. L.; Taylor, J. K. (1973) Gas generation systems for theevaluation of gas detecting devices. Washington, DC: U.S. Department of Commerce, National Bureau of Standards; reportno. NBSIR 73-292.
Hughes, E. E.; Davenport, A. J.; Woods, P. T.; Zielinski, W. L., Jr. (1991) Intercomparison of a range of primary gas standardsof carbon monoxide in nitrogen and carbon dioxide in nitrogen prepared by the National Institute of Standards andTechnology and the National Physical Laboratory. Environ. Sci. Technol. 25: 671-676.
Hunt, W. F., Jr. (1972) The precision associated with the sampling frequency of log-normally distributed air pollutantmeasurements. J. Air Pollut. Control Assoc. 22: 687-691.
Instrumentation Laboratory. (1999) IL 682 CO-Oximeter: ready when you are. Lexington, MA: Instrumentation Laboratory,Critical Care Technical Support Group.
Jones, R. H.; Ellicott, M. F.; Cadigan, J. B.; Gaensler, E. A. (1958) The relationship between alveolar and blood carbon monoxideconcentrations during breathholding. J. Lab. Clin. Med. 51: 553-564.
Kimmel, E. C.; Carpenter, R. L.; Reboulet, J. E.; Still, K. R. (1999) A physiological model for predicting carboxyhemoglobinformation from exposure to carbon monoxide in rats. J. Appl. Physiol. 86: 1977-1983.
Klepeis, N. E.; Ott, W. R.; Repace, J. L. (1999) The effect of cigar smoking on indoor levels of carbon monoxide and particles.J. Exposure Anal. Environ. Epidemiol. 9: 622-635.
Krarup, T. (1998) The ABLTM700 Oximeter: new standards in interference detection. Copenhagen, Denmark: Radiometer Medical;bulletin no. 3.
Krarup, T. (1999) ABL 700 series [email to D. Mage]. Denmark, Copenhagen: Radiometer Medical; September 2.Langan, L. (1992) Portability in measuring exposure to carbon monoxide. In: Measuring, understanding, and predicting exposures
in the 21st century: proceedings of the conference; November 1991; Atlanta, GA. J. Exposure Anal. Environ. Epidemiol.1(suppl. 1): 223-239.
2-19
Larsen, R. I. (1971) A mathematical model for relating air quality measurements to air quality standards. Research Triangle Park,NC: U.S. Environmental Protection Agency, Office of Air Programs; report no. AP-89.
Lawson, D. R.; Groblicki, P. J.; Stedman, D. H.; Bishop, G. A.; Guenther, P. L. (1990) Emissions from in-use motor vehicles inLos Angeles: a pilot study of remote sensing and the inspection and maintainence program. J. Air Waste Manage. Assoc.40: 1096-1105.
Lee, K.; Yanagisawa, Y. (1992) Development of a sampler for carbon monoxide in expired air. Presented at: 85th annual meetingand exhibition of the Air & Waste Management Association; June; Kansas City, MO. Pittsburgh, PA: Air & WasteManagement Association; paper no. 92-145.03.
Lee, K.; Yanagisawa, Y. (1995) Sampler for measurement of alveolar carbon monoxide. Environ. Sci. Technol. 29:104-107.Lee, P. S.; Majkowski, R. F.; Perry, T. A. (1991) Tunable diode laser spectroscopy for isotope analysis - detection of isotopic
carbon monoxide in exhaled breath. IEEE Trans. Biomed. Eng. 38: 966-973.Lee, K.; Yanagisawa, Y.; Spengler, J. D. (1992a) Comparison of carbon monoxide measurement methods. Presented at: 85th
annual meeting & exhibition of the Air & Waste Management Association; June; Kansas City, MO; paper no. 92-80.04.Lee, K.; Yanagisawa, Y.; Hishinuma, M.; Spengler, J. D.; Billick, I. H. (1992b) A passive sampler for measurement of carbon
monoxide using a solid adsorbent. Environ. Sci. Technol. 26: 697-702.Lee, K.; Yanagisawa, Y.; Spengler, J. D.; Billick, I. H. (1992c) Measurement of personal carbon monoxide exposures by mailed
passive sampler. J. Air Waste Manage. Assoc. 42: 1212-1213.Lee, P. S.; Schreck, R. M.; Hare, B. A.; McGrath, J. J. (1994) Biomedical applications of tunable diode laser spectrometry:
correlation between breath carbon monoxide and low level blood carboxyhemoglobin saturation. Ann. Biomed. Eng.22: 120-125.
Lloyd, W. G.; Rowe, D. R. (1999) Estimation of carboxyhemoglobin. Environ. Sci. Technol. 33: 782-785.Mahoney, J. J.; Vreman, H. J.; Stevenson, D. K.; Van Kessel, A. L. (1993) Measurement of carboxyhemoglobin and total
hemoglobin by five specialized spectrophotometers (CO-oximeters) in comparison with reference methods. Clin. Chem.(Washington, DC) 39: 1693-1700.
Marshall, M. D.; Kales, S. N.; Christiani, D. C.; Goldman, R. H. (1995) Are reference intervals for carboxyhemoglobinappropriate? A survey of Boston area laboratories. Clin. Chem. (Washington, DC) 41: 1434-1438.
McBride, S. J.; Ferro, A. R.; Ott, W. R; Switzer, P.; Hildemann, L. M. (1999) Investigations of the proximity effect for pollutantsin the indoor environment. J. Exposure Anal. Environ. Epidemiol. 9: 602-621.
McCullough, J. D.; Crane, R. A.; Beckman, A. O. (1947) Determination of carbon monoxide in air by use of red mercuric oxide.Anal. Chem. 19: 999-1002.
Morales-Morales, R. (1998) Carbon monoxide, ozone, and hydrocarbons in the Baltimore metropolitan area [dissertation]. CollegePark, MD: University of Maryland. Available from: University Microfilms International, Ann Arbor, MI; publication no.9908993.
Moser, L.; Schmid, O. (1914) Die Bestimmung des Kohlenoxyds durch gelbes quecksilberoxyd [The determination of carbonmonoxide through yellow mercury oxide]. Z. Anal. Chem. 53: 217-233.
Moy, L. A.; Dickerson, R. R.; Ryan, W. F. (1994) Relationship between back trajectories and tropospheric trace gas concentrationsin rural Virginia. Atmos. Environ. 28: 2789-2800.
Mueller, R. H. (1954) A supersensitive gas detector permits accurate detection of toxic or combustible gases in extremely lowconcentrations. Anal. Chem. 26: 39A-42A.
National Bureau of Standards. (1975) Catalog of NBS standard reference materials, 1975-76 edition. Washington, DC: U.S.Department of Commerce, National Bureau of Standards; NBS special publication no. 260.
Novelli, P. C.; Elkins, J. W.; Steele, L. P. (1991) The development and evaluation of a gravimetric reference scale formeasurements of atmospheric carbon monoxide. J. Geophys. Res. [Atmos.] 96: 13,109-13,121.
Novelli, P. C.; Collins, J. E., Jr.; Myers, R. C.; Sachse, G. W.; Scheel, H. E. (1994) Reevaluation of the NOAA/CMDL carbonmonoxide reference scale and comparisons with CO reference gases at NASA-Langley and the Fraunhofer Institut.J. Geophys. Res. [Atmos.] 99: 12,833-12,839.
Novelli, P. C.; Connors, V. S.; Reichle, H. G., Jr.; Anderson, B. E.; Brenninkmeijer, C. A. M.; Brunke, E. G.; Doddridge, B. G.;Kirchhoff, V. W. J. H.; Lam, K. S.; Masarie, K. A.; Matsuo, T.; Parrish, D. D.; Scheel, H. E.; Steele, L. P. (1998) Aninternally consistent set of globally distributed atmospheric carbon monoxide mixing ratios developed using results froman intercomparison of measurements. J. Geophys. Res. [Atmos.] 103: 19,285-19,293.
O'Keeffe, A. E.; Ortman, G. C. (1966) Primary standards for trace gas analysis. Anal. Chem. 38: 760-763.Ott, W. R.; Mage, D. T. (1975) Random sampling as an inexpensive means for measuring average annual air pollutant
concentrations in urban areas. Presented at: 68th annual meeting of the Air Pollution Control Association; June; Boston,MA. Pittsburgh, PA: Air Pollution Control Association; paper no. 75-14.3.
Ott, W. R.; Rodes, C. E.; Drago, R. J.; Williams, C.; Burmann, F. J. (1986) Automated data-logging personal exposure monitorsfor carbon monoxide. J. Air Pollut. Control Assoc. 36: 883-887.
Ott, W.; Switzer, P.; Willits, N. (1994) Carbon monoxide exposures inside an automobile traveling on an urban arterial highway.J. Air Waste Manage. Assoc. 44: 1010-1018.
2-20
Ott, W. R.; Vreman, H. J.; Switzer, P.; Stevenson, D. K. (1995) Evaluation of electrochemical monitors for measuring carbonmonoxide concentrations in indoor, in-transit, and outdoor microenvironments. In: Measurement of toxic and related airpollutants: proceedings of an international symposium; May; Research Triangle Park, NC. Pittsburgh, PA: Air & WasteManagement Association; pp. 172-177. (A&WMA publication VIP-50).
Palanos, P. N. (1972) A practical design for an ambient carbon monoxide mercury replacement analyzer. Anal. Instrum.10: 117-125.
Parrish, D. D.; Holloway, J. S.; Fehsenfeld, F. C. (1994) Routine, continuous measurement of carbon monoxide with parts perbillion precision. Environ. Sci. Technol. 28: 1615-1618.
Paulsell, C. D. (1976) Use of the National Bureau of Standards standard reference gases in mobile source emissions testing.In: Calibration in air monitoring: a symposium; August 1975; Boulder, CO. Philadelphia, PA: American Society forTesting and Materials; pp. 232-245. (ASTM special technical publication 598).
Phinney, D. E.; Newman, J. E. (1972) The precision associated with the sampling frequencies of total particulate at Indianapolis,Indiana. J. Air Pollut. Control Assoc. 22: 692-695.
Porter, K.; Volman, D. H. (1962) Flame ionization detection of carbon monoxide for gas chromatographic analysis. Anal. Chem.34: 748-749.
Poulida, O.; Dickerson, R. R.; Doddridge, B. G.; Holland, J. Z.; Wardell, R. G.; Watkins, J. G. (1991) Trace gas concentrationsand meteorology in rural Virginia. 1. Ozone and carbon monoxide. J. Geophys. Res. [Atmos.] 96: 22,461-22,475.
Rhodes, R. C.; Evans, E. G. (1987) Precision and accuracy assessments for state and local air monitoring networks 1985. ResearchTriangle Park, NC: U.S. Environmental Protection Agency, Environmental Monitoring Systems Laboratory; report no.EPA-600/4-87-003.
Robbins, R. C.; Borg, K. M.; Robinson, E. (1968) Carbon monoxide in the atmosphere. J. Air Pollut. Control Assoc. 18: 106-110.Rodgers, P. A.; Vreman, H. J.; Dennery, P. A.; Stevenson, D. K. (1994) Sources of carbon monoxide (CO) in biological systems
and applications of CO detection technologies. Semin. Perinatol. 18: 2-10.Roths, J.; Zenker, T.; Parchatka, U.; Wienhold, F. G.; Harris, G. W. (1996) Four-laser airborne infrared spectrometer for
atmospheric trace gas measurements. Appl. Opt. 35: 7075-7084.Ryan, W. F.; Doddridge, B. G.; Dickerson, R. R.; Morales, R. M.; Hallock, K. A.; Roberts, P. T.; Blumenthal, D. L.; Anderson,
J. A.; Civerolo, K. (1998) Pollutant transport during a regional O3 episode in the mid-Atlantic states. J. Air Waste Manage.Assoc. 48: 786-797.
Sachse, G. W.; Hill, G. F.; Wade, L. O.; Perry, M. G. (1987) Fast-response, high-precision carbon monoxide sensor using a tunablediode laser absorption technique. J. Geophys. Res. [Atmos.] 92: 2071-2081.
Scaringelli, F. P.; Rosenberg, E.; Rehme, K. A. (1970) Comparison of permeation devices and nitrite ion as standards for thecolorimetric determination of nitrogen dioxide. Environ. Sci. Technol. 4: 924-929.
Seiler, W.; Giehl, H.; Roggendorf, P. (1980) Detection of carbon monoxide and hydrogen by conversion of mercury oxide tomercury vapor. Atmos. Technol. (12): 40-45.
Seinfeld, J. H.; Pandis, S. N. (1998) Atmospheric chemistry and physics: from air pollution to climate change. New York, NY:John Wiley & Sons, Inc.
Shepherd, A. P.; McMahan, C. A. (1996) Role of oximeter error in the diagnosis of shunts. Catheterization Cardiovasc. Diagn.37: 435-446.
Smith, N. J. (1977) End-expired air technic for determining occupational carbon monoxide exposure. J. Occup. Med. 19: 766-769.Smith, F.; Nelson, A. C., Jr. (1973) Guidelines for development of a quality assurance program: reference method for the
continuous measurement of carbon monoxide in the atmosphere. Research Triangle Park, NC: U.S. EnvironmentalProtection Agency, Quality Assurance and Environmental Monitoring Laboratory; report no. EPA-R4-73-028a.
Smith, R. G.; Bryan, R. J.; Feldstein, M.; Locke, D. C.; Warner, P. O. (1975) Tentative method for constant pressure volumetricgas analysis for O2, CO2, CO, N2, hydrocarbons (ORSAT). Health Lab. Sci. 12: 177-181.
Stedman, D. H.; Kok, G.; Delumyea, R.; Alvord, H. H. (1976) Redundant calibration of nitric oxide, carbon monoxide, nitrogendioxide, and ozone air pollution monitors by chemical and gravimetric techniques. In: Calibration in air monitoring: asymposium; August 1975; Boulder, CO. Philadelphia, PA: American Society for Testing and Materials; pp. 337-344.(ASTM special technical publication 598).
Stedman, D. H.; Bishop, G. A.; Aldrete, P.; Slott, R. S. (1997) On-road evaluation of an automobile emission test program.Environ. Sci. Technol. 31: 927-931.
Stedman, D. H.; Bishop, G. A.; Slott, R. S. (1998) Repair avoidance and evaluating inspection and maintenance programs.Environ. Sci. Technol. 32: 1544-1545.
Stevenson, D. K.; Vreman, H. J. (1997) Carbon monoxide and bilirubin production in neonates. Pediatrics 100: 252-254.Swinnerton, J. W.; Linnenbom, V. J.; Cheek, C. H. (1968) A sensitive gas chromatographic method for determining carbon
monoxide in seawater. Limnol. Oceanogr. 13: 193-195.TesaÍík, K.; Krej…í, M. (1974) Chromatographic determination of carbon monoxide below the 1 ppm level. J. Chromatogr.
91: 539-544.
2-21
U.S. Code. (1991) Clean Air Act, §108, air quality criteria and control techniques, §109, national ambient air quality standards.U. S. C. 42: §§7408-7409.
U.S. Environmental Protection Agency. (1991) Air quality criteria for carbon monoxide. Research Triangle Park, NC: Office ofHealth and Environmental Assessment, Environmental Criteria and Assessment Office; report no. EPA/600/8-90/045F.
U.S. Environmental Protection Agency. (1997) EPA traceability protocol for assay and certification of gaseous calibrationstandards. Washington, DC: National Center for Environmental Research and Quality Assurance; report no.EPA/600/R-97/121.
Van Dam, J.; Daenens, P. (1994) Microanalysis of carbon monoxide in blood by head-space capillary gas chromatography.J. Forensic Sci. 39: 473-478.
Volz, A.; Kley, D. (1985) A resonance-fluorescence instrument for the in-situ measurement of atmospheric carbon monoxide.J. Atmos. Chem. 2: 345-357.
Vreman, H. J.; Stevenson, D. K. (1994) Carboxyhemoglobin determined in neonatal blood with a CO-oximeter unaffected by fetaloxyhemoglobin. Clin. Chem. (Washington, DC) 40: 1522-1527.
Vreman, H. J.; Mahoney, J. J.; Stevenson, D. K. (1993) Electrochemical measurement of carbon monoxide in breath: interferenceby hydrogen. Atmos. Environ. Part A 27: 2193-2198.
Vreman, H. J.; Mahoney, J. J.; Stevenson, D. K. (1995) Carbon monoxide and carboxyhemoglobin. Adv. Pediatr. 42: 303-334.Wallace, L. A. (1983) Carbon monoxide in air and breath of employees in an underground office. J. Air Pollut. Control Assoc.
33: 678-682.Wallace, L.; Thomas, J.; Mage, D.; Ott, W. (1988) Comparison of breath CO, CO exposure, and Coburn model predictions in the
U.S. EPA Washington-Denver (CO) study. Atmos. Environ. 22: 2183-2193.Weeks, I. A.; Galbally, I. E.; Fraser, P. J.; Matthews, G. (1989) Comparison of the carbon monoxide standards used at Cape Grim
and Aspendale. In: Forgan, B. W.; Ayres, G. P., eds. Baseline Atmosheric Program (Australia) 1987. Canberra, New SouthWales: Department of Administrative Services, Bureau of Meteorology; pp. 21-25.
Weinheimer, A. J.; Ridley, B. A. (1990) A cautionary note on the use of some mass flow controllers. J. Geophys. Res. [Atmos.]95: 9817-9821.
Wohlers, H. C.; Newstein, H.; Daunis, D. (1967) Carbon monoxide and sulfur dioxide adsorption on- and desorption from glass,plastic, and metal tubings. J. Air Pollut. Control Assoc. 17: 753-756.