analysis of the provo-orem, utah housing market · pdf fileanalysis of the provo-orem, utah...
TRANSCRIPT

US Department of Housing and Urban Development
COMPREHENSIVE MARKET ANALYSIS REPORTS
Policy Development amp Research
Analysis of the
Provo-Orem Utah
Housing MarketAs of October 1 2005
ECONOMIC RESEARCH
Analysis of the Provo-Orem Utah Housing Market as of October 1 2005
Foreword
This analysis has been prepared for the assistance and guidance of the US Department of Housing and Urban Development (HUD) in its operations The factual information findings and conclusions may also be useful to builders mortgagees and others concerned with local housing market conditions and trends The analysis does not purport to make determinations regarding the acceptability of any mortgage insurance proposals that may be under consideration by the Department
The factual framework for this analysis follows the guidelines and methods developed by HUDrsquos Economic and Market Analysis Division The analysis and findings are as thorough and current as possible based on information available on the ldquoas-ofrdquo date from local and national sources As such findings or conclusions may be modified by subsequent developments HUD wishes to express its appreciation to those industry sources and state and local government officials who provided data and information on local economic and housing market conditions
This analysis takes into consideration changes in the economic demographic and housing inventory characteristics of the market area during three periods from 1990 to 2000 from 2000 to the as-of date of the analysismdashOctober 1 2005 (Current date)mdashand from the Current date to a Forecast datemdashOctober 1 2008 In the analysis 1990 and 2000 refer to the dates of the decennial censusmdashApril 1 unless specified otherwise This analysis presents counts and estimates of employment population households and housing inventory as of the 1990 Census 2000 Census Current date and Forecast date For purposes of this analysis the forecast period is 36 months
The prospective demand expressed in the analysis should not be construed as a forecast of building activity rather it presents the prospective housing production that would maintain a reasonable balance in the demand-supply relationship given the market conditions on the as-of date of the analysis This analysis was prepared by George Antoine the Divisionrsquos supervisory economist in HUDrsquos Denver Office based on fieldwork conducted in September 2005 Questions regarding the findings and conclusions of the analysis may be addressed to Mr Antoine at 303ndash672ndash5060 and at george_h_antoinehudgov
2
Analysis of the Provo-Orem Utah Housing Market as of October 1 2005
Housing Market Area
The Provo-Orem Utah Housing Market Area (HMA) defined as Utah County is located 45 miles south of Salt Lake City Provo and Orem are the two largest cities in the HMA and the locations of the leading employers in the HMAmdashBrigham Young University (BYU) and Utah Valley State College (UVSC) In addition to the attractiveness of these two large post-secondary schools the moderate climate and natural beauty of the area promote a steady supply of young educated workers and families migrating to the area Natural barriers formed by Utah Lake extending south from the Salt Lake County line to the Juab County line in the county center and the Wasatch Mountains along the eastern border define the HMA Development is located along a north-south corridor of cities along this stretch of land between the lake and the mountains Provo and Orem are bordered by the smaller cities of Lehi Lindon Pleasant Grove American Fork Eagle Mountain and Saratoga Springs to the north and Springville and Spanish Fork to the south
Summary
The rate of growth in the economy of the Provo-Orem HMA is accelerating after a slowdown in employment that began in 2000 because of plant closures and layoffs in manufacturing and information services Employment grew at an increasing rate over the past 2 years as a result of new high-technology businesses moving to the area and support services increasing to fulfill the needs of a growing population Total employment is expected to increase by close to 4 percent annually in each of the next 3 years or an average of 7200 a year
New residents have been drawn to the HMA due to job growth relatively affordable home prices compared with other western states and the presence of BYU and UVSC Since 2000 the population has increased at an average annual rate of 3 percent approximately 25 percent of which was attributable to net in-migration Net in-migration is expected to increase over the forecast period because of a growing economy and the continued relocation of young families and retirees from high-cost areas particularly California As of October 1 2005 the population of the HMA is estimated to be 434200
Mostly lackluster since 2000 the home sales market has improved during the past year because of increased household growth and low interest rates The average sales price for an existing single-family home is $210900 up 11 percent for the 12-month period ending September 2005 compared with the previous year Strong sales market conditions are expected to continue during the forecast period The forecast for new sales housing is estimated to be 10950 homes over the next 3 years
Rental market conditions are improving but remain soft Affordable sale prices and a large number of new sales units entering the market have contributed to a weakness in the rental market since 2002 The market is slightly more balanced for newer general-occupancy rental housing while the older inventory especially single-student rental housing requires move-in specials and rent concessions to fill its units Absorption of rental housing is forecast at 1920 units over a 3-year period Because of excess vacancies
3
Analysis of the Provo-Orem Utah Housing Market as of October 1 2005
in the current market demand will support construction of 1420 new units in the last 2 years of the forecast period
Economy of the Area
The Provo-Orem economy is largely based on the presence of two large post-secondary schools and the trade services and construction needed to support a fast-growing population BYU and UVSC contribute to the stability of the HMA Together these two schools account for more than 57000 full- and part-time students and 6000 faculty and staff Since 2000 enrollment at BYU has held steady while enrollment at UVSC increased by 3000 students The economic impact of the two schools is estimated at $750 million annually The existence of research facilities at BYU and the availability of an educated workforce have helped in the development of a significant high-technology sector Population-driven growth primarily a result of net natural increases (resident births minus resident deaths) but also including some net in-migration of families and retirees contributed to expanding trade service and construction employment
The largest employment sectors in the economy of the HMA are education and healthcare services professional and business services retail trade and manufacturing With 34700 jobs education and healthcare services is the largest sector accounting for more than 20 percent of total nonfarm employment in the HMA during the past 12 months Other major sectorsmdashprofessional and business services retail trade and manufacturingmdash account for less than 20000 jobs each Major private sector employers are BYU Novell Intermountain Healthcare Convergys Corporation Nestle USA Food Group Nu Skin Enterprises Sento Technical Innovations and the Wal-Mart district office
During the 1990s the economy of the HMA grew rapidly stimulated by an expanding high-technology sector and enrollment growth at BYU and UVSC Total resident employment increased by 41 percent annually Information services and manufacturing together gained 10000 jobs during the decade many were in high-technology industries Expansion at Novell helped attract other related companies that established the area as a high-technology center The annual unemployment rate decreased from 45 percent in 1990 to 30 percent in 1999 Beginning in 2001 the economy slowed due to layoffs in the high-technology sector and the closure of Geneva Steel From 2000 to 2003 information services and manufacturing employment together declined by more than 5000 jobs Helping to stabilize the impact of these losses was the employment generated from increasing university expenditures continued population growth and the greater role of self-employment in the economy Since 2000 total employment growth averaged 22 percent annually The trends in employment are presented in Tables 1 and 2
In 2005 the recovery in the high-technology sector was firmly established in the HMA Growth has been generated from small firms primarily in computer software manufacturing and services Information and manufacturing employment increases for the 12 months ending September 2005 compared with a year ago were 800 and 2100 jobs respectively An estimated 400 companies are currently employing 17000 workers in the high-technology industry The strong showing in these sectors contributed to total employment growth of 4 percent The factors that revived the economy during the past
4
Analysis of the Provo-Orem Utah Housing Market as of October 1 2005
yearmdashhigh technology and population-related growthmdashare expected to continue to affect the economy during the forecast period Resident employment growth should stabilize at close to 4 percent a year over the forecast period
Household Incomes
HUDrsquos Economic and Market Analysis Division estimates the median family income in the Provo-Orem HMA is $56350 in 2005 a 123-percent increase since the 2000 Census
Population
As of October 1 2005 the population estimate for the HMA is 434200 an average annual gain of 11900 or 3 percent annually since the 2000 Census From 1990 to 2000 the population grew by 10500 or 34 percent annually Net in-migration accounted for 40 percent of the gain in the 1990s and 25 percent of the gain since 2000 Students at BYU and UVSC and the studentsrsquo dependents currently account for an estimated 12 percent of the population in the HMA Enrollment grew by more than 1000 students a year during the 1990s Since 2000 UVSC accounted for all the enrollment growth of approximately 500 students a year
Based on the level of economic growth forecast increases in the volume of in-migration and the net natural increase in population expected during the forecast period the population is expected to increase over the forecast period by 14400 or 32 percent annually to 477400 as of October 1 2008 The rate of growth although greater than the average rate since 2000 is below the rate from 1990 to 2000 Net in-migration is expected to increase due to the relatively affordable housing market and available jobs that attract working families and retirees Many of these in-migrants are expected to be from higher cost areas especially California BYU enrollment is expected to remain constant over the forecast period while enrollment at UVSC should continue to increase at the same rate as it has since 2000 Table 3 presents population trends from 1990 to the Forecast date for the HMA
Households
The trend in growth in the number of households in the Provo-Orem HMA parallels population changes in the HMA since 1990 Currently the HMA has 118200 households an average gain of 3300 or 31 percent annually since 2000 The rate of increase is below the 34-percent annual average increase from 1990 to 2000
As with population growth the rate of household growth is expected to increase during the forecast period as a result of the stronger economy The number of households is expected to increase by an average of 4000 or a rate of 33 percent annually The number of households will grow at a slightly faster rate than population because of a small decline in household size reflecting increased in-migration of smaller families and retirees The HMA has a significantly larger household size than the national average
5
Analysis of the Provo-Orem Utah Housing Market as of October 1 2005
University Student Housing
Students at BYU are a major component of the demand for rental housing in the HMA Approximately 26000 of the 32000 students enrolled at BYU currently live off campus The 6000 students who live on campus reside in dormitories and apartments for families Students attending BYU are nearly all full time and have a higher likelihood of forming off-campus households UVSC which is largely a commuter campus for local residents has a much smaller impact on the housing market An estimated 8000 students of the 25000 enrolled at UVSC live separately from their families Students from both schools account for an estimated 12200 family and single-student households or 35 percent of the total renter households in the HMA
Future student housing demand will be increasingly met by privately financed off-campus housing BYU proposes to contract for the development of ldquocharteredrdquo housing that will accommodate students in off-campus apartments The first of the chartered developments is expected to open for the 2006ndash07 academic year and accommodate 570 single students in 200 units The move to chartered development for single students allows for the same support services that are available in on-campus dormitories without the major capital investments by the university UVSC provides no on-campus housing but promotes the private development of single-student apartments off campus The college places few occupancy restrictions for these arrangements but property managers rent units by bedroom and for the academic year Since 2000 approximately 500 units and 1800 private student bedrooms in six developments have been completed Plans are under way for construction of additional single-student housing near campus when the market has absorbed the units that are still in the lease-up stage
Housing Inventory
In response to strong population and household growth the housing inventory of the Provo-Orem HMA has grown significantly since 1990 Between 1990 and 2000 nearly 31500 units were added a 43-percent increase in the housing inventory available compared to 1990 Single-family homes represent 73 percent of all units permitted during the decade and multifamily units represent 27 percent Since 2000 additions to the inventory have increased by nearly 20700 units or approximately the same annual rate of change as during the 1990s Single-family building permits accounted for 81 percent of total permits issued since 2000 Currently the housing inventory in the HMA is estimated at 125000 units Tables 4 and 5 present housing inventory tenure vacancy trends and building activity from 1990 to the Current date for the HMA
Because of the weak home sales market going into the 1990s the decade started with a low level of single-family permit activity Stimulated by a strong economy and lower interest rates building steadily increased reaching the decade-high number of 3458 units in 1999 Since 2000 continued low mortgage interest rates and household growth encouraged single-family homebuilding to a new annual record of 3533 units in 2004 The level of single-family homebuilding activity in 2005 is well ahead of the pace set during last yearrsquos record level Through the first 9 months of 2005 permits for single-family homes are up 27 percent from the same period during the past year Because of
6
Analysis of the Provo-Orem Utah Housing Market as of October 1 2005
natural barriers and adjacent city borders developable land in Provo and Orem is scarce and costly Since 2000 more than 90 percent of the single-family homebuilding occurred in the smaller towns outside the central cities of Provo and Orem primarily in subdivisions established in the towns of Lehi Pleasant Grove Eagle Mountain and Saratoga Springs to the north
The 1990s also began with a low level of multifamily building permit activity due to earlier weak rental market conditions Although the vacancy rate was low rents had not recovered sufficiently to warrant new construction As economic conditions and rent levels improved the number of multifamily units permitted quickly increased to 1481 in 1995 the highest level of the decade From 1994 to 1996 builders added close to 3900 units accounting for 45 percent of all multifamily units permitted for the decade Because of student enrollment growth and a robust high-technology sector that brought in higher paid workers multifamily permit activity centered on the construction of apartments in Provo and Orem While general-occupancy apartments were more dispersed in the two cities apartment developments targeting student families were built near the two campuses To address demand for a more upscale product Class A apartments were introduced to the area for the first time during the decade
Since 2000 multifamily construction has shifted in emphasis from general-occupancy apartments to single-student apartments and condominiums Due to a lack of rental housing for UVSC students single-student apartment development flourished in Orem Approximately 500 units have been built next to the campus since 2000 Although condominium building was significant in Provo and Orem the smaller cities to the north received a greater portion of activity than they did during the 1990s Most new condominium homes are sold to parents of students attending BYU or UVSC or to investors as rentals although this is less of a factor in the northern cities Condominiums account for more than 70 percent of multifamily units permitted since 2000 compared with approximately 40 percent permitted during the 1990s The first large downtown mixed-use condominium development in Provo opened in 2005
The lack of available land near the Provo-Orem center has pushed development to the north along the Interstate 15 corridor Traffic along the interstate has increased as new residents commute to the employment centers located in Provo and Orem To help ease some of the traffic a high-occupancy vehicle lane from American Fork to the Salt Lake County border is under construction Under discussion is a proposed east-west causeway across Utah Lake to relieve the potential traffic congestion that is expected to result as available land west of the lake is developed The former Geneva Steel plant in Vineyard located next to Orem will open up approximately 1700 acres of land for development Preliminary plans call for residential and commercial development to start within the next 3 years
Housing Vacancy
Since 1990 the sales vacancy rate has been mostly in a balanced state The extremely low rate in 1990 of 11 percent was more a reflection of limited activity in the sales market than a shortage of homes As the economy improved and confidence in the
7
Analysis of the Provo-Orem Utah Housing Market as of October 1 2005
housing market was restored building of new homes increased significantly and existing owners were more likely to place their homes on the market In 2000 as the supply of homes increased the owner vacancy rate increased to a more balanced 16 percent Since 2000 the market has remained in a healthy balance of supply and demand Currently the owner vacancy rate is estimated at the same balanced level of 16 percent
The renter vacancy rate has increased considerably since 1990 The very-low vacancy rate in 1990 of 21 percent reflects the presence of insufficient rents to support additional new construction Beginning in the early 1990s market conditions improved stimulating construction of rental units Although the vacancy rate increased to 33 percent in 2000 demand still exceeded supply Since 2000 construction of new units and the shift of renters to homeownership weakened the rental market the average rental vacancy rate increased to an estimated 8 percent as of the Current date
Sales Market Conditions
Between 2000 and 2004 the sales market was restrained due to a slowdown in employment growth and a continued high level of homebuilding The average sales price of an existing single-family home increased by a modest 3 percent a year The volume of home sales increased annually by approximately 10 percent a year but home price increases were modest due to increased homebuilding and some economic setbacks In 2005 the sales market in the Provo-Orem HMA strengthened considerably throughout most price ranges According to the Utah County Association of REALTORSreg the average price of an existing single-family home increased by 11 percent and the number of homes sold increased by 18 percent for the 12-month period ending September 2005 The average sales price is $211500 The improvement is the result of stronger household growth and relatively low interest rates The market is strongest for existing single-family homes priced under $180000 or the beginning of the price range for new single-family homes
According to the Utah Valley Homebuilders Association new homes make up 50 percent of the single-family sales market The bulk of single-family homes are priced in the $180000-to-$220000 range for the first-time buyer For the 9 months ending September 2005 the average sales price was $272000 up by 8 percent from the past year The market was active in the northern cities of the HMA because of the availability of land and access to new employment centers Because of lower land costs homes priced for first-time buyers are generally located in Lehi Eagle Mountain and Saratoga Springs to the north and west Homes priced from $220000 to $400000 are focused in subdivisions located in Alpine and Highland Homes on infill lots along the east bench of Provo and Orem generally command the highest prices in the HMA at more than $400000
The market for townhomes and condominiums is not as strong because of the soft rental market and the ability of builders to keep single-family home prices affordable The average sales price for existing townhomes and condominiums is up a modest 3 percent to $137300 during the past 12 months compared with the annual rate of price appreciation since 2000 Sales activity has increased substantially since 2000 but at the same time homebuilding has added many new units to the inventory The inventory of
8
Analysis of the Provo-Orem Utah Housing Market as of October 1 2005
unsold homes has increased by nearly 70 percent from 2000 to 2004 In 2005 however the market has shown some signs of improving because of the higher priced single-family sales market and the relative affordability of townhomes and condominiums The inventory of unsold homes has declined by 20 percent from a year ago indicating that future price increases are likely
Prices for newly constructed townhomes and condominiums range from $120000 to $150000 in the northern cities of Pleasant Grove and Lehi to $220000 and more near BYU in Provo The lower priced markets in the northern cities target the affordable owner market while the higher priced market near BYU appeals to parents of students who purchase condominiums to save on housing costs In downtown Provo the first large mixed-use high-rise condominium development opened earlier in the year With 60 units priced from $200000 to $600000 the development sold out quickly to retirees and professional workers
The sales market is expected to strengthen throughout the forecast period The townhome and condominium market should improve because it offers an affordable alternative to the pricier single-family market Household growth is expected to remain strong along with a continued shift to homeownership
Rental Market Conditions
Conditions in the rental market of the HMA have changed from an extremely tight market in 2000 to soft conditions as of the Current date The tight market in 2000 was the result of growing rental demand as the economy expanded and population increased during the 1990s The current soft market resulted from increased construction of rental units competition from homeownership and slower growth of renter households Newer general-occupancy apartments are reported to have higher occupancy rates than older developments
In 2005 market conditions have improved somewhat from a year ago Vacancies are slightly fewer and for the first time in 3 years small rent increases were possible for newer apartments Rents for new market-rate apartments entering the market are $700 for a one-bedroom unit $800 for a two-bedroomtwo-bath unit and $1000 for a three-bedroom unit 60-percent tax credit rents are about $100 lower For older properties the market has shown little improvement In response property managers have continued to upgrade their units or lower rents and are willing to lease units to students without doubling up bedrooms New condominium rentals are comparable in rent to new apartments coming on line Rents are generally lower the greater the distance from Provo and Orem
Approximately 800 low-income housing tax credit (LIHTC) units for families and the elderly have been built in the HMA since 1990 Rents are mostly below market although the maximum 60-percent rent under the program is close to the market rents for older rental units Because of the low asking rents on LIHTC units most of these units are affordable to households earning less than 50 percent of the area median income As of the Current date the average vacancy rate in these rent-restricted developments is less
9
Analysis of the Provo-Orem Utah Housing Market as of October 1 2005
than 6 percent The market for federally assisted rent-subsidized units has strengthened Since 2000 waiting lists for HUD-subsidized units in the HMA have doubled to more than 3000 households
The outlook is for improvement in the market Stronger employment and household growth will help the market come into balance Condominiums used as rentals are more likely to be converted to owner units as they become a more affordable alternative to single-family homes The number of large apartment developments in the planning stages is very small The single-student market is weaker than the general-occupancy market and will likely require a relatively longer period to recover
Forecast Housing Demand
Based on anticipated household growth replacement needs and current market conditions it is estimated that there will be a demand for 10950 sales units during the 3-year forecast period or an average of 3650 units a year The majority of the demand is expected to be met by single-family detached homes Demand for townhomes and condominiums is expected to increase due to the increase in sales prices for single-family detached homes and rising interest rates Most of the demand is expected to be for homes priced at $200000 or less As in the recent past homebuilding will center in the northern cities due to the availability of land Table 6 presents sales demand by price range for townhomes condominiums and single-family homes
Demand for additional rental housing during the forecast period is expected to total 1920 units or 640 a year Currently approximately 500 excess vacancies are in the market thus the need for additional new rental units is expected to start in the second year of the 3-year forecast period Approximately 600 units currently under construction will be completed during the next 12 months Any delays in construction to meet prospective demand will give the market time to absorb these surpluses during the first year Table 7 presents a summary of total rental demand by rent level It is estimated that there will be demand for both affordable rentals financed by LIHTC and general-occupancy market-rate units
10
Analysis of the Provo-Orem Utah Housing Market as of October 1 2005
Table 1
Labor Force and Employment
Provo-Orem HMA
1990 to October 1 2005
1990 1991 1992 1993 1994 1995 1996 1997 1998 1999
Labor Force 116900 123700 128300 135400 144300 149300 154100 157900 165400 170200
Employment 111700 118200 122800 130400 139700 145000 149500 153700 160300 165100
Unemployment 5200 5500 5400 5000 4600 4300 4500 4200 5100 5100
Rate () 45 44 42 37 32 29 29 26 31 30
Previous Current 2000 2001 2002 2003 2004 12 Mosa 12 Mosb
Labor Force 179800 181800 184300 186500 191760 190300 197000
Employment 174500 174400 173900 176800 182500 181000 188300
Unemployment 5300 7400 10400 8500 9200 9300 8700
Rate () 30 41 57 47 48 49 44
a Ending September 2004b Ending September 2005Notes Numbers may not add to totals due to rounding Includes Utah County onlySource US Department of Labor Bureau of Labor Statistics
11
Analysis of the Provo-Orem Utah Housing Market as of October 1 2005
Table 2
Nonfarm Employment by Industry
Provo-Orem HMA
1990 to October 1 2005 (1 of 2)
Employment Sector 1990 1991 1992 1993 1994 1995 1996 1997 1998 1999
Total Nonfarm 97800 103900 106100 112100 119700 127000 133000 138400 144700 149000
Goods-Producing 17400 19300 19500 20600 23400 26900 28800 29300 30400 29800
Construction 3800 5200 6000 6500 7500 9800 10400 10200 11100 11300
Manufacturing 13600 14100 13500 14100 15800 17000 18400 19200 19300 18500
Service-Providing 80300 84600 86600 91500 96300 11200 104100 109100 114300 119200
Trade 17600 18300 18600 19000 20300 21700 23100 24500 24500 25900
Wholesale Trade 3400 3500 3600 3600 3700 3900 4900 4100 4200 4200
Retail Trade 12100 12900 13200 13700 14800 16000 17000 18200 18600 19400
Transport amp Utilities 2100 1900 1800 1700 1800 1900 2000 2200 1700 2200
Information 2700 3200 4600 5600 6200 6400 5900 5600 6400 7500
Financial Activities 2800 2700 2900 3300 3800 3700 4100 4100 4500 4800
Prof amp Bus Svcs 15100 15800 15100 15800 16400 16100 16100 16900 17900 18700
Edu amp Health Svcs 18800 20400 20400 22000 22900 23700 25100 26500 28100 28600
Leisure amp Hospitality 6600 7000 7300 7500 8100 8900 9700 10100 10500 10800
Government 15200 15500 15800 16300 16400 17200 17600 18700 19400 19700
Federal 1000 900 900 900 900 900 1000 1000 1000 1100
State 4400 4600 4700 4700 4500 4600 4700 4900 5100 5200
Local 9800 10000 10100 10700 11000 11600 11900 12800 13300 13500
Notes Numbers may not add to totals due to rounding Includes Utah and Juab Counties Source US Department of Labor Bureau of Labor StatisticsmdashNorth American Industry Classification System (NAICS)
12
Analysis of the Provo-Orem Utah Housing Market as of October 1 2005
Table 2
Nonfarm Employment by Industry
Provo-Orem HMA
1990 to October 1 2005 (2 of 2)
Previous Current Employment Sector 2000 2001 2002 2003 2004 12 Mosa 12 Mosb
Total Nonfarm 155400 156700 154500 155600 162900 161000 167900
Goods-Producing 30800 31000 28400 27700 29500 29000 30800
Nat Res Minamp Con 11600 11100 11000 10900 11900 11700 12900
Manufacturing 19200 19900 17300 16800 17500 17300 19400
Service-Providing 124700 125700 126200 128000 133400 132100 137200
Trade 26300 25900 25300 25300 26300 24000 24200
Wholesale Trade 4200 4200 3900 3900 4100 4000 4400
Retail Trade 19600 19600 19400 19600 20100 19900 19900
Transport amp Utilities 2400 2000 1900 1900 2000 2000 2000
Information 8600 7400 6600 6700 7100 6900 7700
Financial Activities 4700 5100 5400 5800 6100 6000 6200
Prof amp Bus Svcs 19800 18700 18000 18200 19600 19400 20100
Edu amp Health Svcs 29300 30700 31800 32800 33900 33600 34700
Leisure amp Hospitality 11500 12500 12400 12300 12800 12600 13300
Government 20800 21900 22700 23000 23700 23500 24300
Federal 1200 1100 1100 1100 1100 1100 1000
State 5400 5600 5700 5700 5900 5800 6100
Local 14200 15200 15900 16200 16700 16600 17100
a Ending September 2004b Ending September 2005Notes Numbers may not add to totals due to rounding Includes Utah and Juab CountiesSource US Department of Labor Bureau of Labor StatisticsmdashNAICS
13
Analysis of the Provo-Orem Utah Housing Market as of October 1 2005
Table 3
Population and Household Trends
Provo-Orem HMA
April 1 1990 to October 1 2008
April 11990
April 12000
Current Date
Forecast Date
1990 to 2000
Number Rate ()
Average Annual Change
2000 to Current
Number Rate ()
Current to Forecast
Number Rate ()
Population
Provo-Orem HMA 263590 368590 434200 477400 10500 34 11900 30 14400 32
Households Provo-Orem HMA 71249 99937 118200 130300 2870 34 3300 31 4000 33
Notes Rate of change is calculated on a compound basis Averages may not add to HMA total due to rounding
Sources 1990 and 2000mdashUS Census Bureau Current and ForecastmdashEstimates by analyst
14
Analysis of the Provo-Orem Utah Housing Market as of October 1 2005
Table 4
Housing Inventory Tenure and Vacancy
Provo-Orem HMA
1990 2000 and October 1 2005
Provo-Orem HMA
1990 2000 Current
Total Housing Inventory 72821 104315 125000
Occupied Units 71249 99937 118200
Owners 44493 66786 83700
624 668 708
Renters 26756 33151 34500
376 332 292
Vacant Units 2653 4378 6900
For Sale 503 1200 1360
Rate () 11 16 16
For Rent 578 1142 3000
Rate () 21 33 80
Other Vacant 1572 2145 2500
Note Numbers may not add to totals due to rounding Sources 1990 and 2000mdashUS Census Bureau
CurrentmdashEstimates by analyst
15
Analysis of the Provo-Orem Utah Housing Market as of October 1 2005
Table 5
Residential Building Permit Activity
Provo-Orem HMA
1990 to October 1 2005
1990 1991 1992 1993 1994 1995 1996 1997 1998 1999
Provo-Orem HMA Total 1303 1655 2656 3423 3765 4395 3955 3258 4099 4143
Single-family 982 1312 1985 2646 2736 2914 2584 2386 3008 3458
Multifamily 321 343 671 777 1029 1481 1371 872 1091 685
2000 2001 2002 2003 2004 2005
Provo-Orem HMA Total 3731 3829 3725 4271 4492 4017
Single-family 3193 3082 2920 3254 3533 3452
Multifamily 538 747 805 1017 959 565
Note 2005 data through SeptemberSource US Census Bureau Building Permits Survey
16
Analysis of the Provo-Orem Utah Housing Market as of October 1 2005
Table 6
Estimated Qualitative Demand for New Market-Rate Sales Housing
Provo-Orem HMA
October 1 2005 through October 1 2008
Price Range ($) Units of
From To Demand
120000 179999 3830
180000 199999 2740
200000 299999 1750
300000 399000 1090
400000 499000 880
500000 699000 550
700000 and higher 110
Source Estimates by analyst
17
Analysis of the Provo-Orem Utah Housing Market as of October 1 2005
Table 7
Estimated Qualitative Demand for New Market-Rate Rental Housing
Provo-Orem HMA
October 1 2005 to October 1 2008
One Bedroom Two Bedrooms Three Bedrooms
Monthly Monthly Monthly Gross Units of Gross Units of Gross Units of
Rent ($) Demand Rent ($) Demand Rent ($) Demand
650 300 750 570 850 550
700 270 800 470 900 500
750 250 850 430 950 450
800 220 900 390 1000 390
850 190 950 340 1050 320
900 160 1000 280 1100 290
950 140 1050 240 1150 250
1050 110 1150 190 1250 180
1150 90 1250 130 1350 130
1250 70 1350 90 1450 100
1350 60 1450 60 1550 80
1450 40 1550 40 1650 60
1550 30 1650 30 1750 50
1650 20 1750 10 1850 30
and higher and higher and higher
Notes Distribution above is noncumulative Demand shown at any rent represents demand at that level and higher
Source Estimates by analyst
18

Analysis of the Provo-Orem Utah Housing Market as of October 1 2005
yearmdashhigh technology and population-related growthmdashare expected to continue to affect the economy during the forecast period Resident employment growth should stabilize at close to 4 percent a year over the forecast period
Household Incomes
HUDrsquos Economic and Market Analysis Division estimates the median family income in the Provo-Orem HMA is $56350 in 2005 a 123-percent increase since the 2000 Census
Population
As of October 1 2005 the population estimate for the HMA is 434200 an average annual gain of 11900 or 3 percent annually since the 2000 Census From 1990 to 2000 the population grew by 10500 or 34 percent annually Net in-migration accounted for 40 percent of the gain in the 1990s and 25 percent of the gain since 2000 Students at BYU and UVSC and the studentsrsquo dependents currently account for an estimated 12 percent of the population in the HMA Enrollment grew by more than 1000 students a year during the 1990s Since 2000 UVSC accounted for all the enrollment growth of approximately 500 students a year
Based on the level of economic growth forecast increases in the volume of in-migration and the net natural increase in population expected during the forecast period the population is expected to increase over the forecast period by 14400 or 32 percent annually to 477400 as of October 1 2008 The rate of growth although greater than the average rate since 2000 is below the rate from 1990 to 2000 Net in-migration is expected to increase due to the relatively affordable housing market and available jobs that attract working families and retirees Many of these in-migrants are expected to be from higher cost areas especially California BYU enrollment is expected to remain constant over the forecast period while enrollment at UVSC should continue to increase at the same rate as it has since 2000 Table 3 presents population trends from 1990 to the Forecast date for the HMA
Households
The trend in growth in the number of households in the Provo-Orem HMA parallels population changes in the HMA since 1990 Currently the HMA has 118200 households an average gain of 3300 or 31 percent annually since 2000 The rate of increase is below the 34-percent annual average increase from 1990 to 2000
As with population growth the rate of household growth is expected to increase during the forecast period as a result of the stronger economy The number of households is expected to increase by an average of 4000 or a rate of 33 percent annually The number of households will grow at a slightly faster rate than population because of a small decline in household size reflecting increased in-migration of smaller families and retirees The HMA has a significantly larger household size than the national average
5
Analysis of the Provo-Orem Utah Housing Market as of October 1 2005
University Student Housing
Students at BYU are a major component of the demand for rental housing in the HMA Approximately 26000 of the 32000 students enrolled at BYU currently live off campus The 6000 students who live on campus reside in dormitories and apartments for families Students attending BYU are nearly all full time and have a higher likelihood of forming off-campus households UVSC which is largely a commuter campus for local residents has a much smaller impact on the housing market An estimated 8000 students of the 25000 enrolled at UVSC live separately from their families Students from both schools account for an estimated 12200 family and single-student households or 35 percent of the total renter households in the HMA
Future student housing demand will be increasingly met by privately financed off-campus housing BYU proposes to contract for the development of ldquocharteredrdquo housing that will accommodate students in off-campus apartments The first of the chartered developments is expected to open for the 2006ndash07 academic year and accommodate 570 single students in 200 units The move to chartered development for single students allows for the same support services that are available in on-campus dormitories without the major capital investments by the university UVSC provides no on-campus housing but promotes the private development of single-student apartments off campus The college places few occupancy restrictions for these arrangements but property managers rent units by bedroom and for the academic year Since 2000 approximately 500 units and 1800 private student bedrooms in six developments have been completed Plans are under way for construction of additional single-student housing near campus when the market has absorbed the units that are still in the lease-up stage
Housing Inventory
In response to strong population and household growth the housing inventory of the Provo-Orem HMA has grown significantly since 1990 Between 1990 and 2000 nearly 31500 units were added a 43-percent increase in the housing inventory available compared to 1990 Single-family homes represent 73 percent of all units permitted during the decade and multifamily units represent 27 percent Since 2000 additions to the inventory have increased by nearly 20700 units or approximately the same annual rate of change as during the 1990s Single-family building permits accounted for 81 percent of total permits issued since 2000 Currently the housing inventory in the HMA is estimated at 125000 units Tables 4 and 5 present housing inventory tenure vacancy trends and building activity from 1990 to the Current date for the HMA
Because of the weak home sales market going into the 1990s the decade started with a low level of single-family permit activity Stimulated by a strong economy and lower interest rates building steadily increased reaching the decade-high number of 3458 units in 1999 Since 2000 continued low mortgage interest rates and household growth encouraged single-family homebuilding to a new annual record of 3533 units in 2004 The level of single-family homebuilding activity in 2005 is well ahead of the pace set during last yearrsquos record level Through the first 9 months of 2005 permits for single-family homes are up 27 percent from the same period during the past year Because of
6
Analysis of the Provo-Orem Utah Housing Market as of October 1 2005
natural barriers and adjacent city borders developable land in Provo and Orem is scarce and costly Since 2000 more than 90 percent of the single-family homebuilding occurred in the smaller towns outside the central cities of Provo and Orem primarily in subdivisions established in the towns of Lehi Pleasant Grove Eagle Mountain and Saratoga Springs to the north
The 1990s also began with a low level of multifamily building permit activity due to earlier weak rental market conditions Although the vacancy rate was low rents had not recovered sufficiently to warrant new construction As economic conditions and rent levels improved the number of multifamily units permitted quickly increased to 1481 in 1995 the highest level of the decade From 1994 to 1996 builders added close to 3900 units accounting for 45 percent of all multifamily units permitted for the decade Because of student enrollment growth and a robust high-technology sector that brought in higher paid workers multifamily permit activity centered on the construction of apartments in Provo and Orem While general-occupancy apartments were more dispersed in the two cities apartment developments targeting student families were built near the two campuses To address demand for a more upscale product Class A apartments were introduced to the area for the first time during the decade
Since 2000 multifamily construction has shifted in emphasis from general-occupancy apartments to single-student apartments and condominiums Due to a lack of rental housing for UVSC students single-student apartment development flourished in Orem Approximately 500 units have been built next to the campus since 2000 Although condominium building was significant in Provo and Orem the smaller cities to the north received a greater portion of activity than they did during the 1990s Most new condominium homes are sold to parents of students attending BYU or UVSC or to investors as rentals although this is less of a factor in the northern cities Condominiums account for more than 70 percent of multifamily units permitted since 2000 compared with approximately 40 percent permitted during the 1990s The first large downtown mixed-use condominium development in Provo opened in 2005
The lack of available land near the Provo-Orem center has pushed development to the north along the Interstate 15 corridor Traffic along the interstate has increased as new residents commute to the employment centers located in Provo and Orem To help ease some of the traffic a high-occupancy vehicle lane from American Fork to the Salt Lake County border is under construction Under discussion is a proposed east-west causeway across Utah Lake to relieve the potential traffic congestion that is expected to result as available land west of the lake is developed The former Geneva Steel plant in Vineyard located next to Orem will open up approximately 1700 acres of land for development Preliminary plans call for residential and commercial development to start within the next 3 years
Housing Vacancy
Since 1990 the sales vacancy rate has been mostly in a balanced state The extremely low rate in 1990 of 11 percent was more a reflection of limited activity in the sales market than a shortage of homes As the economy improved and confidence in the
7
Analysis of the Provo-Orem Utah Housing Market as of October 1 2005
housing market was restored building of new homes increased significantly and existing owners were more likely to place their homes on the market In 2000 as the supply of homes increased the owner vacancy rate increased to a more balanced 16 percent Since 2000 the market has remained in a healthy balance of supply and demand Currently the owner vacancy rate is estimated at the same balanced level of 16 percent
The renter vacancy rate has increased considerably since 1990 The very-low vacancy rate in 1990 of 21 percent reflects the presence of insufficient rents to support additional new construction Beginning in the early 1990s market conditions improved stimulating construction of rental units Although the vacancy rate increased to 33 percent in 2000 demand still exceeded supply Since 2000 construction of new units and the shift of renters to homeownership weakened the rental market the average rental vacancy rate increased to an estimated 8 percent as of the Current date
Sales Market Conditions
Between 2000 and 2004 the sales market was restrained due to a slowdown in employment growth and a continued high level of homebuilding The average sales price of an existing single-family home increased by a modest 3 percent a year The volume of home sales increased annually by approximately 10 percent a year but home price increases were modest due to increased homebuilding and some economic setbacks In 2005 the sales market in the Provo-Orem HMA strengthened considerably throughout most price ranges According to the Utah County Association of REALTORSreg the average price of an existing single-family home increased by 11 percent and the number of homes sold increased by 18 percent for the 12-month period ending September 2005 The average sales price is $211500 The improvement is the result of stronger household growth and relatively low interest rates The market is strongest for existing single-family homes priced under $180000 or the beginning of the price range for new single-family homes
According to the Utah Valley Homebuilders Association new homes make up 50 percent of the single-family sales market The bulk of single-family homes are priced in the $180000-to-$220000 range for the first-time buyer For the 9 months ending September 2005 the average sales price was $272000 up by 8 percent from the past year The market was active in the northern cities of the HMA because of the availability of land and access to new employment centers Because of lower land costs homes priced for first-time buyers are generally located in Lehi Eagle Mountain and Saratoga Springs to the north and west Homes priced from $220000 to $400000 are focused in subdivisions located in Alpine and Highland Homes on infill lots along the east bench of Provo and Orem generally command the highest prices in the HMA at more than $400000
The market for townhomes and condominiums is not as strong because of the soft rental market and the ability of builders to keep single-family home prices affordable The average sales price for existing townhomes and condominiums is up a modest 3 percent to $137300 during the past 12 months compared with the annual rate of price appreciation since 2000 Sales activity has increased substantially since 2000 but at the same time homebuilding has added many new units to the inventory The inventory of
8
Analysis of the Provo-Orem Utah Housing Market as of October 1 2005
unsold homes has increased by nearly 70 percent from 2000 to 2004 In 2005 however the market has shown some signs of improving because of the higher priced single-family sales market and the relative affordability of townhomes and condominiums The inventory of unsold homes has declined by 20 percent from a year ago indicating that future price increases are likely
Prices for newly constructed townhomes and condominiums range from $120000 to $150000 in the northern cities of Pleasant Grove and Lehi to $220000 and more near BYU in Provo The lower priced markets in the northern cities target the affordable owner market while the higher priced market near BYU appeals to parents of students who purchase condominiums to save on housing costs In downtown Provo the first large mixed-use high-rise condominium development opened earlier in the year With 60 units priced from $200000 to $600000 the development sold out quickly to retirees and professional workers
The sales market is expected to strengthen throughout the forecast period The townhome and condominium market should improve because it offers an affordable alternative to the pricier single-family market Household growth is expected to remain strong along with a continued shift to homeownership
Rental Market Conditions
Conditions in the rental market of the HMA have changed from an extremely tight market in 2000 to soft conditions as of the Current date The tight market in 2000 was the result of growing rental demand as the economy expanded and population increased during the 1990s The current soft market resulted from increased construction of rental units competition from homeownership and slower growth of renter households Newer general-occupancy apartments are reported to have higher occupancy rates than older developments
In 2005 market conditions have improved somewhat from a year ago Vacancies are slightly fewer and for the first time in 3 years small rent increases were possible for newer apartments Rents for new market-rate apartments entering the market are $700 for a one-bedroom unit $800 for a two-bedroomtwo-bath unit and $1000 for a three-bedroom unit 60-percent tax credit rents are about $100 lower For older properties the market has shown little improvement In response property managers have continued to upgrade their units or lower rents and are willing to lease units to students without doubling up bedrooms New condominium rentals are comparable in rent to new apartments coming on line Rents are generally lower the greater the distance from Provo and Orem
Approximately 800 low-income housing tax credit (LIHTC) units for families and the elderly have been built in the HMA since 1990 Rents are mostly below market although the maximum 60-percent rent under the program is close to the market rents for older rental units Because of the low asking rents on LIHTC units most of these units are affordable to households earning less than 50 percent of the area median income As of the Current date the average vacancy rate in these rent-restricted developments is less
9
Analysis of the Provo-Orem Utah Housing Market as of October 1 2005
than 6 percent The market for federally assisted rent-subsidized units has strengthened Since 2000 waiting lists for HUD-subsidized units in the HMA have doubled to more than 3000 households
The outlook is for improvement in the market Stronger employment and household growth will help the market come into balance Condominiums used as rentals are more likely to be converted to owner units as they become a more affordable alternative to single-family homes The number of large apartment developments in the planning stages is very small The single-student market is weaker than the general-occupancy market and will likely require a relatively longer period to recover
Forecast Housing Demand
Based on anticipated household growth replacement needs and current market conditions it is estimated that there will be a demand for 10950 sales units during the 3-year forecast period or an average of 3650 units a year The majority of the demand is expected to be met by single-family detached homes Demand for townhomes and condominiums is expected to increase due to the increase in sales prices for single-family detached homes and rising interest rates Most of the demand is expected to be for homes priced at $200000 or less As in the recent past homebuilding will center in the northern cities due to the availability of land Table 6 presents sales demand by price range for townhomes condominiums and single-family homes
Demand for additional rental housing during the forecast period is expected to total 1920 units or 640 a year Currently approximately 500 excess vacancies are in the market thus the need for additional new rental units is expected to start in the second year of the 3-year forecast period Approximately 600 units currently under construction will be completed during the next 12 months Any delays in construction to meet prospective demand will give the market time to absorb these surpluses during the first year Table 7 presents a summary of total rental demand by rent level It is estimated that there will be demand for both affordable rentals financed by LIHTC and general-occupancy market-rate units
10
Analysis of the Provo-Orem Utah Housing Market as of October 1 2005
Table 1
Labor Force and Employment
Provo-Orem HMA
1990 to October 1 2005
1990 1991 1992 1993 1994 1995 1996 1997 1998 1999
Labor Force 116900 123700 128300 135400 144300 149300 154100 157900 165400 170200
Employment 111700 118200 122800 130400 139700 145000 149500 153700 160300 165100
Unemployment 5200 5500 5400 5000 4600 4300 4500 4200 5100 5100
Rate () 45 44 42 37 32 29 29 26 31 30
Previous Current 2000 2001 2002 2003 2004 12 Mosa 12 Mosb
Labor Force 179800 181800 184300 186500 191760 190300 197000
Employment 174500 174400 173900 176800 182500 181000 188300
Unemployment 5300 7400 10400 8500 9200 9300 8700
Rate () 30 41 57 47 48 49 44
a Ending September 2004b Ending September 2005Notes Numbers may not add to totals due to rounding Includes Utah County onlySource US Department of Labor Bureau of Labor Statistics
11
Analysis of the Provo-Orem Utah Housing Market as of October 1 2005
Table 2
Nonfarm Employment by Industry
Provo-Orem HMA
1990 to October 1 2005 (1 of 2)
Employment Sector 1990 1991 1992 1993 1994 1995 1996 1997 1998 1999
Total Nonfarm 97800 103900 106100 112100 119700 127000 133000 138400 144700 149000
Goods-Producing 17400 19300 19500 20600 23400 26900 28800 29300 30400 29800
Construction 3800 5200 6000 6500 7500 9800 10400 10200 11100 11300
Manufacturing 13600 14100 13500 14100 15800 17000 18400 19200 19300 18500
Service-Providing 80300 84600 86600 91500 96300 11200 104100 109100 114300 119200
Trade 17600 18300 18600 19000 20300 21700 23100 24500 24500 25900
Wholesale Trade 3400 3500 3600 3600 3700 3900 4900 4100 4200 4200
Retail Trade 12100 12900 13200 13700 14800 16000 17000 18200 18600 19400
Transport amp Utilities 2100 1900 1800 1700 1800 1900 2000 2200 1700 2200
Information 2700 3200 4600 5600 6200 6400 5900 5600 6400 7500
Financial Activities 2800 2700 2900 3300 3800 3700 4100 4100 4500 4800
Prof amp Bus Svcs 15100 15800 15100 15800 16400 16100 16100 16900 17900 18700
Edu amp Health Svcs 18800 20400 20400 22000 22900 23700 25100 26500 28100 28600
Leisure amp Hospitality 6600 7000 7300 7500 8100 8900 9700 10100 10500 10800
Government 15200 15500 15800 16300 16400 17200 17600 18700 19400 19700
Federal 1000 900 900 900 900 900 1000 1000 1000 1100
State 4400 4600 4700 4700 4500 4600 4700 4900 5100 5200
Local 9800 10000 10100 10700 11000 11600 11900 12800 13300 13500
Notes Numbers may not add to totals due to rounding Includes Utah and Juab Counties Source US Department of Labor Bureau of Labor StatisticsmdashNorth American Industry Classification System (NAICS)
12
Analysis of the Provo-Orem Utah Housing Market as of October 1 2005
Table 2
Nonfarm Employment by Industry
Provo-Orem HMA
1990 to October 1 2005 (2 of 2)
Previous Current Employment Sector 2000 2001 2002 2003 2004 12 Mosa 12 Mosb
Total Nonfarm 155400 156700 154500 155600 162900 161000 167900
Goods-Producing 30800 31000 28400 27700 29500 29000 30800
Nat Res Minamp Con 11600 11100 11000 10900 11900 11700 12900
Manufacturing 19200 19900 17300 16800 17500 17300 19400
Service-Providing 124700 125700 126200 128000 133400 132100 137200
Trade 26300 25900 25300 25300 26300 24000 24200
Wholesale Trade 4200 4200 3900 3900 4100 4000 4400
Retail Trade 19600 19600 19400 19600 20100 19900 19900
Transport amp Utilities 2400 2000 1900 1900 2000 2000 2000
Information 8600 7400 6600 6700 7100 6900 7700
Financial Activities 4700 5100 5400 5800 6100 6000 6200
Prof amp Bus Svcs 19800 18700 18000 18200 19600 19400 20100
Edu amp Health Svcs 29300 30700 31800 32800 33900 33600 34700
Leisure amp Hospitality 11500 12500 12400 12300 12800 12600 13300
Government 20800 21900 22700 23000 23700 23500 24300
Federal 1200 1100 1100 1100 1100 1100 1000
State 5400 5600 5700 5700 5900 5800 6100
Local 14200 15200 15900 16200 16700 16600 17100
a Ending September 2004b Ending September 2005Notes Numbers may not add to totals due to rounding Includes Utah and Juab CountiesSource US Department of Labor Bureau of Labor StatisticsmdashNAICS
13
Analysis of the Provo-Orem Utah Housing Market as of October 1 2005
Table 3
Population and Household Trends
Provo-Orem HMA
April 1 1990 to October 1 2008
April 11990
April 12000
Current Date
Forecast Date
1990 to 2000
Number Rate ()
Average Annual Change
2000 to Current
Number Rate ()
Current to Forecast
Number Rate ()
Population
Provo-Orem HMA 263590 368590 434200 477400 10500 34 11900 30 14400 32
Households Provo-Orem HMA 71249 99937 118200 130300 2870 34 3300 31 4000 33
Notes Rate of change is calculated on a compound basis Averages may not add to HMA total due to rounding
Sources 1990 and 2000mdashUS Census Bureau Current and ForecastmdashEstimates by analyst
14
Analysis of the Provo-Orem Utah Housing Market as of October 1 2005
Table 4
Housing Inventory Tenure and Vacancy
Provo-Orem HMA
1990 2000 and October 1 2005
Provo-Orem HMA
1990 2000 Current
Total Housing Inventory 72821 104315 125000
Occupied Units 71249 99937 118200
Owners 44493 66786 83700
624 668 708
Renters 26756 33151 34500
376 332 292
Vacant Units 2653 4378 6900
For Sale 503 1200 1360
Rate () 11 16 16
For Rent 578 1142 3000
Rate () 21 33 80
Other Vacant 1572 2145 2500
Note Numbers may not add to totals due to rounding Sources 1990 and 2000mdashUS Census Bureau
CurrentmdashEstimates by analyst
15
Analysis of the Provo-Orem Utah Housing Market as of October 1 2005
Table 5
Residential Building Permit Activity
Provo-Orem HMA
1990 to October 1 2005
1990 1991 1992 1993 1994 1995 1996 1997 1998 1999
Provo-Orem HMA Total 1303 1655 2656 3423 3765 4395 3955 3258 4099 4143
Single-family 982 1312 1985 2646 2736 2914 2584 2386 3008 3458
Multifamily 321 343 671 777 1029 1481 1371 872 1091 685
2000 2001 2002 2003 2004 2005
Provo-Orem HMA Total 3731 3829 3725 4271 4492 4017
Single-family 3193 3082 2920 3254 3533 3452
Multifamily 538 747 805 1017 959 565
Note 2005 data through SeptemberSource US Census Bureau Building Permits Survey
16
Analysis of the Provo-Orem Utah Housing Market as of October 1 2005
Table 6
Estimated Qualitative Demand for New Market-Rate Sales Housing
Provo-Orem HMA
October 1 2005 through October 1 2008
Price Range ($) Units of
From To Demand
120000 179999 3830
180000 199999 2740
200000 299999 1750
300000 399000 1090
400000 499000 880
500000 699000 550
700000 and higher 110
Source Estimates by analyst
17
Analysis of the Provo-Orem Utah Housing Market as of October 1 2005
Table 7
Estimated Qualitative Demand for New Market-Rate Rental Housing
Provo-Orem HMA
October 1 2005 to October 1 2008
One Bedroom Two Bedrooms Three Bedrooms
Monthly Monthly Monthly Gross Units of Gross Units of Gross Units of
Rent ($) Demand Rent ($) Demand Rent ($) Demand
650 300 750 570 850 550
700 270 800 470 900 500
750 250 850 430 950 450
800 220 900 390 1000 390
850 190 950 340 1050 320
900 160 1000 280 1100 290
950 140 1050 240 1150 250
1050 110 1150 190 1250 180
1150 90 1250 130 1350 130
1250 70 1350 90 1450 100
1350 60 1450 60 1550 80
1450 40 1550 40 1650 60
1550 30 1650 30 1750 50
1650 20 1750 10 1850 30
and higher and higher and higher
Notes Distribution above is noncumulative Demand shown at any rent represents demand at that level and higher
Source Estimates by analyst
18
Analysis of the Provo-Orem Utah Housing Market as of October 1 2005
University Student Housing
Students at BYU are a major component of the demand for rental housing in the HMA Approximately 26000 of the 32000 students enrolled at BYU currently live off campus The 6000 students who live on campus reside in dormitories and apartments for families Students attending BYU are nearly all full time and have a higher likelihood of forming off-campus households UVSC which is largely a commuter campus for local residents has a much smaller impact on the housing market An estimated 8000 students of the 25000 enrolled at UVSC live separately from their families Students from both schools account for an estimated 12200 family and single-student households or 35 percent of the total renter households in the HMA
Future student housing demand will be increasingly met by privately financed off-campus housing BYU proposes to contract for the development of ldquocharteredrdquo housing that will accommodate students in off-campus apartments The first of the chartered developments is expected to open for the 2006ndash07 academic year and accommodate 570 single students in 200 units The move to chartered development for single students allows for the same support services that are available in on-campus dormitories without the major capital investments by the university UVSC provides no on-campus housing but promotes the private development of single-student apartments off campus The college places few occupancy restrictions for these arrangements but property managers rent units by bedroom and for the academic year Since 2000 approximately 500 units and 1800 private student bedrooms in six developments have been completed Plans are under way for construction of additional single-student housing near campus when the market has absorbed the units that are still in the lease-up stage
Housing Inventory
In response to strong population and household growth the housing inventory of the Provo-Orem HMA has grown significantly since 1990 Between 1990 and 2000 nearly 31500 units were added a 43-percent increase in the housing inventory available compared to 1990 Single-family homes represent 73 percent of all units permitted during the decade and multifamily units represent 27 percent Since 2000 additions to the inventory have increased by nearly 20700 units or approximately the same annual rate of change as during the 1990s Single-family building permits accounted for 81 percent of total permits issued since 2000 Currently the housing inventory in the HMA is estimated at 125000 units Tables 4 and 5 present housing inventory tenure vacancy trends and building activity from 1990 to the Current date for the HMA
Because of the weak home sales market going into the 1990s the decade started with a low level of single-family permit activity Stimulated by a strong economy and lower interest rates building steadily increased reaching the decade-high number of 3458 units in 1999 Since 2000 continued low mortgage interest rates and household growth encouraged single-family homebuilding to a new annual record of 3533 units in 2004 The level of single-family homebuilding activity in 2005 is well ahead of the pace set during last yearrsquos record level Through the first 9 months of 2005 permits for single-family homes are up 27 percent from the same period during the past year Because of
6
Analysis of the Provo-Orem Utah Housing Market as of October 1 2005
natural barriers and adjacent city borders developable land in Provo and Orem is scarce and costly Since 2000 more than 90 percent of the single-family homebuilding occurred in the smaller towns outside the central cities of Provo and Orem primarily in subdivisions established in the towns of Lehi Pleasant Grove Eagle Mountain and Saratoga Springs to the north
The 1990s also began with a low level of multifamily building permit activity due to earlier weak rental market conditions Although the vacancy rate was low rents had not recovered sufficiently to warrant new construction As economic conditions and rent levels improved the number of multifamily units permitted quickly increased to 1481 in 1995 the highest level of the decade From 1994 to 1996 builders added close to 3900 units accounting for 45 percent of all multifamily units permitted for the decade Because of student enrollment growth and a robust high-technology sector that brought in higher paid workers multifamily permit activity centered on the construction of apartments in Provo and Orem While general-occupancy apartments were more dispersed in the two cities apartment developments targeting student families were built near the two campuses To address demand for a more upscale product Class A apartments were introduced to the area for the first time during the decade
Since 2000 multifamily construction has shifted in emphasis from general-occupancy apartments to single-student apartments and condominiums Due to a lack of rental housing for UVSC students single-student apartment development flourished in Orem Approximately 500 units have been built next to the campus since 2000 Although condominium building was significant in Provo and Orem the smaller cities to the north received a greater portion of activity than they did during the 1990s Most new condominium homes are sold to parents of students attending BYU or UVSC or to investors as rentals although this is less of a factor in the northern cities Condominiums account for more than 70 percent of multifamily units permitted since 2000 compared with approximately 40 percent permitted during the 1990s The first large downtown mixed-use condominium development in Provo opened in 2005
The lack of available land near the Provo-Orem center has pushed development to the north along the Interstate 15 corridor Traffic along the interstate has increased as new residents commute to the employment centers located in Provo and Orem To help ease some of the traffic a high-occupancy vehicle lane from American Fork to the Salt Lake County border is under construction Under discussion is a proposed east-west causeway across Utah Lake to relieve the potential traffic congestion that is expected to result as available land west of the lake is developed The former Geneva Steel plant in Vineyard located next to Orem will open up approximately 1700 acres of land for development Preliminary plans call for residential and commercial development to start within the next 3 years
Housing Vacancy
Since 1990 the sales vacancy rate has been mostly in a balanced state The extremely low rate in 1990 of 11 percent was more a reflection of limited activity in the sales market than a shortage of homes As the economy improved and confidence in the
7
Analysis of the Provo-Orem Utah Housing Market as of October 1 2005
housing market was restored building of new homes increased significantly and existing owners were more likely to place their homes on the market In 2000 as the supply of homes increased the owner vacancy rate increased to a more balanced 16 percent Since 2000 the market has remained in a healthy balance of supply and demand Currently the owner vacancy rate is estimated at the same balanced level of 16 percent
The renter vacancy rate has increased considerably since 1990 The very-low vacancy rate in 1990 of 21 percent reflects the presence of insufficient rents to support additional new construction Beginning in the early 1990s market conditions improved stimulating construction of rental units Although the vacancy rate increased to 33 percent in 2000 demand still exceeded supply Since 2000 construction of new units and the shift of renters to homeownership weakened the rental market the average rental vacancy rate increased to an estimated 8 percent as of the Current date
Sales Market Conditions
Between 2000 and 2004 the sales market was restrained due to a slowdown in employment growth and a continued high level of homebuilding The average sales price of an existing single-family home increased by a modest 3 percent a year The volume of home sales increased annually by approximately 10 percent a year but home price increases were modest due to increased homebuilding and some economic setbacks In 2005 the sales market in the Provo-Orem HMA strengthened considerably throughout most price ranges According to the Utah County Association of REALTORSreg the average price of an existing single-family home increased by 11 percent and the number of homes sold increased by 18 percent for the 12-month period ending September 2005 The average sales price is $211500 The improvement is the result of stronger household growth and relatively low interest rates The market is strongest for existing single-family homes priced under $180000 or the beginning of the price range for new single-family homes
According to the Utah Valley Homebuilders Association new homes make up 50 percent of the single-family sales market The bulk of single-family homes are priced in the $180000-to-$220000 range for the first-time buyer For the 9 months ending September 2005 the average sales price was $272000 up by 8 percent from the past year The market was active in the northern cities of the HMA because of the availability of land and access to new employment centers Because of lower land costs homes priced for first-time buyers are generally located in Lehi Eagle Mountain and Saratoga Springs to the north and west Homes priced from $220000 to $400000 are focused in subdivisions located in Alpine and Highland Homes on infill lots along the east bench of Provo and Orem generally command the highest prices in the HMA at more than $400000
The market for townhomes and condominiums is not as strong because of the soft rental market and the ability of builders to keep single-family home prices affordable The average sales price for existing townhomes and condominiums is up a modest 3 percent to $137300 during the past 12 months compared with the annual rate of price appreciation since 2000 Sales activity has increased substantially since 2000 but at the same time homebuilding has added many new units to the inventory The inventory of
8
Analysis of the Provo-Orem Utah Housing Market as of October 1 2005
unsold homes has increased by nearly 70 percent from 2000 to 2004 In 2005 however the market has shown some signs of improving because of the higher priced single-family sales market and the relative affordability of townhomes and condominiums The inventory of unsold homes has declined by 20 percent from a year ago indicating that future price increases are likely
Prices for newly constructed townhomes and condominiums range from $120000 to $150000 in the northern cities of Pleasant Grove and Lehi to $220000 and more near BYU in Provo The lower priced markets in the northern cities target the affordable owner market while the higher priced market near BYU appeals to parents of students who purchase condominiums to save on housing costs In downtown Provo the first large mixed-use high-rise condominium development opened earlier in the year With 60 units priced from $200000 to $600000 the development sold out quickly to retirees and professional workers
The sales market is expected to strengthen throughout the forecast period The townhome and condominium market should improve because it offers an affordable alternative to the pricier single-family market Household growth is expected to remain strong along with a continued shift to homeownership
Rental Market Conditions
Conditions in the rental market of the HMA have changed from an extremely tight market in 2000 to soft conditions as of the Current date The tight market in 2000 was the result of growing rental demand as the economy expanded and population increased during the 1990s The current soft market resulted from increased construction of rental units competition from homeownership and slower growth of renter households Newer general-occupancy apartments are reported to have higher occupancy rates than older developments
In 2005 market conditions have improved somewhat from a year ago Vacancies are slightly fewer and for the first time in 3 years small rent increases were possible for newer apartments Rents for new market-rate apartments entering the market are $700 for a one-bedroom unit $800 for a two-bedroomtwo-bath unit and $1000 for a three-bedroom unit 60-percent tax credit rents are about $100 lower For older properties the market has shown little improvement In response property managers have continued to upgrade their units or lower rents and are willing to lease units to students without doubling up bedrooms New condominium rentals are comparable in rent to new apartments coming on line Rents are generally lower the greater the distance from Provo and Orem
Approximately 800 low-income housing tax credit (LIHTC) units for families and the elderly have been built in the HMA since 1990 Rents are mostly below market although the maximum 60-percent rent under the program is close to the market rents for older rental units Because of the low asking rents on LIHTC units most of these units are affordable to households earning less than 50 percent of the area median income As of the Current date the average vacancy rate in these rent-restricted developments is less
9
Analysis of the Provo-Orem Utah Housing Market as of October 1 2005
than 6 percent The market for federally assisted rent-subsidized units has strengthened Since 2000 waiting lists for HUD-subsidized units in the HMA have doubled to more than 3000 households
The outlook is for improvement in the market Stronger employment and household growth will help the market come into balance Condominiums used as rentals are more likely to be converted to owner units as they become a more affordable alternative to single-family homes The number of large apartment developments in the planning stages is very small The single-student market is weaker than the general-occupancy market and will likely require a relatively longer period to recover
Forecast Housing Demand
Based on anticipated household growth replacement needs and current market conditions it is estimated that there will be a demand for 10950 sales units during the 3-year forecast period or an average of 3650 units a year The majority of the demand is expected to be met by single-family detached homes Demand for townhomes and condominiums is expected to increase due to the increase in sales prices for single-family detached homes and rising interest rates Most of the demand is expected to be for homes priced at $200000 or less As in the recent past homebuilding will center in the northern cities due to the availability of land Table 6 presents sales demand by price range for townhomes condominiums and single-family homes
Demand for additional rental housing during the forecast period is expected to total 1920 units or 640 a year Currently approximately 500 excess vacancies are in the market thus the need for additional new rental units is expected to start in the second year of the 3-year forecast period Approximately 600 units currently under construction will be completed during the next 12 months Any delays in construction to meet prospective demand will give the market time to absorb these surpluses during the first year Table 7 presents a summary of total rental demand by rent level It is estimated that there will be demand for both affordable rentals financed by LIHTC and general-occupancy market-rate units
10
Analysis of the Provo-Orem Utah Housing Market as of October 1 2005
Table 1
Labor Force and Employment
Provo-Orem HMA
1990 to October 1 2005
1990 1991 1992 1993 1994 1995 1996 1997 1998 1999
Labor Force 116900 123700 128300 135400 144300 149300 154100 157900 165400 170200
Employment 111700 118200 122800 130400 139700 145000 149500 153700 160300 165100
Unemployment 5200 5500 5400 5000 4600 4300 4500 4200 5100 5100
Rate () 45 44 42 37 32 29 29 26 31 30
Previous Current 2000 2001 2002 2003 2004 12 Mosa 12 Mosb
Labor Force 179800 181800 184300 186500 191760 190300 197000
Employment 174500 174400 173900 176800 182500 181000 188300
Unemployment 5300 7400 10400 8500 9200 9300 8700
Rate () 30 41 57 47 48 49 44
a Ending September 2004b Ending September 2005Notes Numbers may not add to totals due to rounding Includes Utah County onlySource US Department of Labor Bureau of Labor Statistics
11
Analysis of the Provo-Orem Utah Housing Market as of October 1 2005
Table 2
Nonfarm Employment by Industry
Provo-Orem HMA
1990 to October 1 2005 (1 of 2)
Employment Sector 1990 1991 1992 1993 1994 1995 1996 1997 1998 1999
Total Nonfarm 97800 103900 106100 112100 119700 127000 133000 138400 144700 149000
Goods-Producing 17400 19300 19500 20600 23400 26900 28800 29300 30400 29800
Construction 3800 5200 6000 6500 7500 9800 10400 10200 11100 11300
Manufacturing 13600 14100 13500 14100 15800 17000 18400 19200 19300 18500
Service-Providing 80300 84600 86600 91500 96300 11200 104100 109100 114300 119200
Trade 17600 18300 18600 19000 20300 21700 23100 24500 24500 25900
Wholesale Trade 3400 3500 3600 3600 3700 3900 4900 4100 4200 4200
Retail Trade 12100 12900 13200 13700 14800 16000 17000 18200 18600 19400
Transport amp Utilities 2100 1900 1800 1700 1800 1900 2000 2200 1700 2200
Information 2700 3200 4600 5600 6200 6400 5900 5600 6400 7500
Financial Activities 2800 2700 2900 3300 3800 3700 4100 4100 4500 4800
Prof amp Bus Svcs 15100 15800 15100 15800 16400 16100 16100 16900 17900 18700
Edu amp Health Svcs 18800 20400 20400 22000 22900 23700 25100 26500 28100 28600
Leisure amp Hospitality 6600 7000 7300 7500 8100 8900 9700 10100 10500 10800
Government 15200 15500 15800 16300 16400 17200 17600 18700 19400 19700
Federal 1000 900 900 900 900 900 1000 1000 1000 1100
State 4400 4600 4700 4700 4500 4600 4700 4900 5100 5200
Local 9800 10000 10100 10700 11000 11600 11900 12800 13300 13500
Notes Numbers may not add to totals due to rounding Includes Utah and Juab Counties Source US Department of Labor Bureau of Labor StatisticsmdashNorth American Industry Classification System (NAICS)
12
Analysis of the Provo-Orem Utah Housing Market as of October 1 2005
Table 2
Nonfarm Employment by Industry
Provo-Orem HMA
1990 to October 1 2005 (2 of 2)
Previous Current Employment Sector 2000 2001 2002 2003 2004 12 Mosa 12 Mosb
Total Nonfarm 155400 156700 154500 155600 162900 161000 167900
Goods-Producing 30800 31000 28400 27700 29500 29000 30800
Nat Res Minamp Con 11600 11100 11000 10900 11900 11700 12900
Manufacturing 19200 19900 17300 16800 17500 17300 19400
Service-Providing 124700 125700 126200 128000 133400 132100 137200
Trade 26300 25900 25300 25300 26300 24000 24200
Wholesale Trade 4200 4200 3900 3900 4100 4000 4400
Retail Trade 19600 19600 19400 19600 20100 19900 19900
Transport amp Utilities 2400 2000 1900 1900 2000 2000 2000
Information 8600 7400 6600 6700 7100 6900 7700
Financial Activities 4700 5100 5400 5800 6100 6000 6200
Prof amp Bus Svcs 19800 18700 18000 18200 19600 19400 20100
Edu amp Health Svcs 29300 30700 31800 32800 33900 33600 34700
Leisure amp Hospitality 11500 12500 12400 12300 12800 12600 13300
Government 20800 21900 22700 23000 23700 23500 24300
Federal 1200 1100 1100 1100 1100 1100 1000
State 5400 5600 5700 5700 5900 5800 6100
Local 14200 15200 15900 16200 16700 16600 17100
a Ending September 2004b Ending September 2005Notes Numbers may not add to totals due to rounding Includes Utah and Juab CountiesSource US Department of Labor Bureau of Labor StatisticsmdashNAICS
13
Analysis of the Provo-Orem Utah Housing Market as of October 1 2005
Table 3
Population and Household Trends
Provo-Orem HMA
April 1 1990 to October 1 2008
April 11990
April 12000
Current Date
Forecast Date
1990 to 2000
Number Rate ()
Average Annual Change
2000 to Current
Number Rate ()
Current to Forecast
Number Rate ()
Population
Provo-Orem HMA 263590 368590 434200 477400 10500 34 11900 30 14400 32
Households Provo-Orem HMA 71249 99937 118200 130300 2870 34 3300 31 4000 33
Notes Rate of change is calculated on a compound basis Averages may not add to HMA total due to rounding
Sources 1990 and 2000mdashUS Census Bureau Current and ForecastmdashEstimates by analyst
14
Analysis of the Provo-Orem Utah Housing Market as of October 1 2005
Table 4
Housing Inventory Tenure and Vacancy
Provo-Orem HMA
1990 2000 and October 1 2005
Provo-Orem HMA
1990 2000 Current
Total Housing Inventory 72821 104315 125000
Occupied Units 71249 99937 118200
Owners 44493 66786 83700
624 668 708
Renters 26756 33151 34500
376 332 292
Vacant Units 2653 4378 6900
For Sale 503 1200 1360
Rate () 11 16 16
For Rent 578 1142 3000
Rate () 21 33 80
Other Vacant 1572 2145 2500
Note Numbers may not add to totals due to rounding Sources 1990 and 2000mdashUS Census Bureau
CurrentmdashEstimates by analyst
15
Analysis of the Provo-Orem Utah Housing Market as of October 1 2005
Table 5
Residential Building Permit Activity
Provo-Orem HMA
1990 to October 1 2005
1990 1991 1992 1993 1994 1995 1996 1997 1998 1999
Provo-Orem HMA Total 1303 1655 2656 3423 3765 4395 3955 3258 4099 4143
Single-family 982 1312 1985 2646 2736 2914 2584 2386 3008 3458
Multifamily 321 343 671 777 1029 1481 1371 872 1091 685
2000 2001 2002 2003 2004 2005
Provo-Orem HMA Total 3731 3829 3725 4271 4492 4017
Single-family 3193 3082 2920 3254 3533 3452
Multifamily 538 747 805 1017 959 565
Note 2005 data through SeptemberSource US Census Bureau Building Permits Survey
16
Analysis of the Provo-Orem Utah Housing Market as of October 1 2005
Table 6
Estimated Qualitative Demand for New Market-Rate Sales Housing
Provo-Orem HMA
October 1 2005 through October 1 2008
Price Range ($) Units of
From To Demand
120000 179999 3830
180000 199999 2740
200000 299999 1750
300000 399000 1090
400000 499000 880
500000 699000 550
700000 and higher 110
Source Estimates by analyst
17
Analysis of the Provo-Orem Utah Housing Market as of October 1 2005
Table 7
Estimated Qualitative Demand for New Market-Rate Rental Housing
Provo-Orem HMA
October 1 2005 to October 1 2008
One Bedroom Two Bedrooms Three Bedrooms
Monthly Monthly Monthly Gross Units of Gross Units of Gross Units of
Rent ($) Demand Rent ($) Demand Rent ($) Demand
650 300 750 570 850 550
700 270 800 470 900 500
750 250 850 430 950 450
800 220 900 390 1000 390
850 190 950 340 1050 320
900 160 1000 280 1100 290
950 140 1050 240 1150 250
1050 110 1150 190 1250 180
1150 90 1250 130 1350 130
1250 70 1350 90 1450 100
1350 60 1450 60 1550 80
1450 40 1550 40 1650 60
1550 30 1650 30 1750 50
1650 20 1750 10 1850 30
and higher and higher and higher
Notes Distribution above is noncumulative Demand shown at any rent represents demand at that level and higher
Source Estimates by analyst
18

Analysis of the Provo-Orem Utah Housing Market as of October 1 2005
natural barriers and adjacent city borders developable land in Provo and Orem is scarce and costly Since 2000 more than 90 percent of the single-family homebuilding occurred in the smaller towns outside the central cities of Provo and Orem primarily in subdivisions established in the towns of Lehi Pleasant Grove Eagle Mountain and Saratoga Springs to the north
The 1990s also began with a low level of multifamily building permit activity due to earlier weak rental market conditions Although the vacancy rate was low rents had not recovered sufficiently to warrant new construction As economic conditions and rent levels improved the number of multifamily units permitted quickly increased to 1481 in 1995 the highest level of the decade From 1994 to 1996 builders added close to 3900 units accounting for 45 percent of all multifamily units permitted for the decade Because of student enrollment growth and a robust high-technology sector that brought in higher paid workers multifamily permit activity centered on the construction of apartments in Provo and Orem While general-occupancy apartments were more dispersed in the two cities apartment developments targeting student families were built near the two campuses To address demand for a more upscale product Class A apartments were introduced to the area for the first time during the decade
Since 2000 multifamily construction has shifted in emphasis from general-occupancy apartments to single-student apartments and condominiums Due to a lack of rental housing for UVSC students single-student apartment development flourished in Orem Approximately 500 units have been built next to the campus since 2000 Although condominium building was significant in Provo and Orem the smaller cities to the north received a greater portion of activity than they did during the 1990s Most new condominium homes are sold to parents of students attending BYU or UVSC or to investors as rentals although this is less of a factor in the northern cities Condominiums account for more than 70 percent of multifamily units permitted since 2000 compared with approximately 40 percent permitted during the 1990s The first large downtown mixed-use condominium development in Provo opened in 2005
The lack of available land near the Provo-Orem center has pushed development to the north along the Interstate 15 corridor Traffic along the interstate has increased as new residents commute to the employment centers located in Provo and Orem To help ease some of the traffic a high-occupancy vehicle lane from American Fork to the Salt Lake County border is under construction Under discussion is a proposed east-west causeway across Utah Lake to relieve the potential traffic congestion that is expected to result as available land west of the lake is developed The former Geneva Steel plant in Vineyard located next to Orem will open up approximately 1700 acres of land for development Preliminary plans call for residential and commercial development to start within the next 3 years
Housing Vacancy
Since 1990 the sales vacancy rate has been mostly in a balanced state The extremely low rate in 1990 of 11 percent was more a reflection of limited activity in the sales market than a shortage of homes As the economy improved and confidence in the
7
Analysis of the Provo-Orem Utah Housing Market as of October 1 2005
housing market was restored building of new homes increased significantly and existing owners were more likely to place their homes on the market In 2000 as the supply of homes increased the owner vacancy rate increased to a more balanced 16 percent Since 2000 the market has remained in a healthy balance of supply and demand Currently the owner vacancy rate is estimated at the same balanced level of 16 percent
The renter vacancy rate has increased considerably since 1990 The very-low vacancy rate in 1990 of 21 percent reflects the presence of insufficient rents to support additional new construction Beginning in the early 1990s market conditions improved stimulating construction of rental units Although the vacancy rate increased to 33 percent in 2000 demand still exceeded supply Since 2000 construction of new units and the shift of renters to homeownership weakened the rental market the average rental vacancy rate increased to an estimated 8 percent as of the Current date
Sales Market Conditions
Between 2000 and 2004 the sales market was restrained due to a slowdown in employment growth and a continued high level of homebuilding The average sales price of an existing single-family home increased by a modest 3 percent a year The volume of home sales increased annually by approximately 10 percent a year but home price increases were modest due to increased homebuilding and some economic setbacks In 2005 the sales market in the Provo-Orem HMA strengthened considerably throughout most price ranges According to the Utah County Association of REALTORSreg the average price of an existing single-family home increased by 11 percent and the number of homes sold increased by 18 percent for the 12-month period ending September 2005 The average sales price is $211500 The improvement is the result of stronger household growth and relatively low interest rates The market is strongest for existing single-family homes priced under $180000 or the beginning of the price range for new single-family homes
According to the Utah Valley Homebuilders Association new homes make up 50 percent of the single-family sales market The bulk of single-family homes are priced in the $180000-to-$220000 range for the first-time buyer For the 9 months ending September 2005 the average sales price was $272000 up by 8 percent from the past year The market was active in the northern cities of the HMA because of the availability of land and access to new employment centers Because of lower land costs homes priced for first-time buyers are generally located in Lehi Eagle Mountain and Saratoga Springs to the north and west Homes priced from $220000 to $400000 are focused in subdivisions located in Alpine and Highland Homes on infill lots along the east bench of Provo and Orem generally command the highest prices in the HMA at more than $400000
The market for townhomes and condominiums is not as strong because of the soft rental market and the ability of builders to keep single-family home prices affordable The average sales price for existing townhomes and condominiums is up a modest 3 percent to $137300 during the past 12 months compared with the annual rate of price appreciation since 2000 Sales activity has increased substantially since 2000 but at the same time homebuilding has added many new units to the inventory The inventory of
8
Analysis of the Provo-Orem Utah Housing Market as of October 1 2005
unsold homes has increased by nearly 70 percent from 2000 to 2004 In 2005 however the market has shown some signs of improving because of the higher priced single-family sales market and the relative affordability of townhomes and condominiums The inventory of unsold homes has declined by 20 percent from a year ago indicating that future price increases are likely
Prices for newly constructed townhomes and condominiums range from $120000 to $150000 in the northern cities of Pleasant Grove and Lehi to $220000 and more near BYU in Provo The lower priced markets in the northern cities target the affordable owner market while the higher priced market near BYU appeals to parents of students who purchase condominiums to save on housing costs In downtown Provo the first large mixed-use high-rise condominium development opened earlier in the year With 60 units priced from $200000 to $600000 the development sold out quickly to retirees and professional workers
The sales market is expected to strengthen throughout the forecast period The townhome and condominium market should improve because it offers an affordable alternative to the pricier single-family market Household growth is expected to remain strong along with a continued shift to homeownership
Rental Market Conditions
Conditions in the rental market of the HMA have changed from an extremely tight market in 2000 to soft conditions as of the Current date The tight market in 2000 was the result of growing rental demand as the economy expanded and population increased during the 1990s The current soft market resulted from increased construction of rental units competition from homeownership and slower growth of renter households Newer general-occupancy apartments are reported to have higher occupancy rates than older developments
In 2005 market conditions have improved somewhat from a year ago Vacancies are slightly fewer and for the first time in 3 years small rent increases were possible for newer apartments Rents for new market-rate apartments entering the market are $700 for a one-bedroom unit $800 for a two-bedroomtwo-bath unit and $1000 for a three-bedroom unit 60-percent tax credit rents are about $100 lower For older properties the market has shown little improvement In response property managers have continued to upgrade their units or lower rents and are willing to lease units to students without doubling up bedrooms New condominium rentals are comparable in rent to new apartments coming on line Rents are generally lower the greater the distance from Provo and Orem
Approximately 800 low-income housing tax credit (LIHTC) units for families and the elderly have been built in the HMA since 1990 Rents are mostly below market although the maximum 60-percent rent under the program is close to the market rents for older rental units Because of the low asking rents on LIHTC units most of these units are affordable to households earning less than 50 percent of the area median income As of the Current date the average vacancy rate in these rent-restricted developments is less
9
Analysis of the Provo-Orem Utah Housing Market as of October 1 2005
than 6 percent The market for federally assisted rent-subsidized units has strengthened Since 2000 waiting lists for HUD-subsidized units in the HMA have doubled to more than 3000 households
The outlook is for improvement in the market Stronger employment and household growth will help the market come into balance Condominiums used as rentals are more likely to be converted to owner units as they become a more affordable alternative to single-family homes The number of large apartment developments in the planning stages is very small The single-student market is weaker than the general-occupancy market and will likely require a relatively longer period to recover
Forecast Housing Demand
Based on anticipated household growth replacement needs and current market conditions it is estimated that there will be a demand for 10950 sales units during the 3-year forecast period or an average of 3650 units a year The majority of the demand is expected to be met by single-family detached homes Demand for townhomes and condominiums is expected to increase due to the increase in sales prices for single-family detached homes and rising interest rates Most of the demand is expected to be for homes priced at $200000 or less As in the recent past homebuilding will center in the northern cities due to the availability of land Table 6 presents sales demand by price range for townhomes condominiums and single-family homes
Demand for additional rental housing during the forecast period is expected to total 1920 units or 640 a year Currently approximately 500 excess vacancies are in the market thus the need for additional new rental units is expected to start in the second year of the 3-year forecast period Approximately 600 units currently under construction will be completed during the next 12 months Any delays in construction to meet prospective demand will give the market time to absorb these surpluses during the first year Table 7 presents a summary of total rental demand by rent level It is estimated that there will be demand for both affordable rentals financed by LIHTC and general-occupancy market-rate units
10
Analysis of the Provo-Orem Utah Housing Market as of October 1 2005
Table 1
Labor Force and Employment
Provo-Orem HMA
1990 to October 1 2005
1990 1991 1992 1993 1994 1995 1996 1997 1998 1999
Labor Force 116900 123700 128300 135400 144300 149300 154100 157900 165400 170200
Employment 111700 118200 122800 130400 139700 145000 149500 153700 160300 165100
Unemployment 5200 5500 5400 5000 4600 4300 4500 4200 5100 5100
Rate () 45 44 42 37 32 29 29 26 31 30
Previous Current 2000 2001 2002 2003 2004 12 Mosa 12 Mosb
Labor Force 179800 181800 184300 186500 191760 190300 197000
Employment 174500 174400 173900 176800 182500 181000 188300
Unemployment 5300 7400 10400 8500 9200 9300 8700
Rate () 30 41 57 47 48 49 44
a Ending September 2004b Ending September 2005Notes Numbers may not add to totals due to rounding Includes Utah County onlySource US Department of Labor Bureau of Labor Statistics
11
Analysis of the Provo-Orem Utah Housing Market as of October 1 2005
Table 2
Nonfarm Employment by Industry
Provo-Orem HMA
1990 to October 1 2005 (1 of 2)
Employment Sector 1990 1991 1992 1993 1994 1995 1996 1997 1998 1999
Total Nonfarm 97800 103900 106100 112100 119700 127000 133000 138400 144700 149000
Goods-Producing 17400 19300 19500 20600 23400 26900 28800 29300 30400 29800
Construction 3800 5200 6000 6500 7500 9800 10400 10200 11100 11300
Manufacturing 13600 14100 13500 14100 15800 17000 18400 19200 19300 18500
Service-Providing 80300 84600 86600 91500 96300 11200 104100 109100 114300 119200
Trade 17600 18300 18600 19000 20300 21700 23100 24500 24500 25900
Wholesale Trade 3400 3500 3600 3600 3700 3900 4900 4100 4200 4200
Retail Trade 12100 12900 13200 13700 14800 16000 17000 18200 18600 19400
Transport amp Utilities 2100 1900 1800 1700 1800 1900 2000 2200 1700 2200
Information 2700 3200 4600 5600 6200 6400 5900 5600 6400 7500
Financial Activities 2800 2700 2900 3300 3800 3700 4100 4100 4500 4800
Prof amp Bus Svcs 15100 15800 15100 15800 16400 16100 16100 16900 17900 18700
Edu amp Health Svcs 18800 20400 20400 22000 22900 23700 25100 26500 28100 28600
Leisure amp Hospitality 6600 7000 7300 7500 8100 8900 9700 10100 10500 10800
Government 15200 15500 15800 16300 16400 17200 17600 18700 19400 19700
Federal 1000 900 900 900 900 900 1000 1000 1000 1100
State 4400 4600 4700 4700 4500 4600 4700 4900 5100 5200
Local 9800 10000 10100 10700 11000 11600 11900 12800 13300 13500
Notes Numbers may not add to totals due to rounding Includes Utah and Juab Counties Source US Department of Labor Bureau of Labor StatisticsmdashNorth American Industry Classification System (NAICS)
12
Analysis of the Provo-Orem Utah Housing Market as of October 1 2005
Table 2
Nonfarm Employment by Industry
Provo-Orem HMA
1990 to October 1 2005 (2 of 2)
Previous Current Employment Sector 2000 2001 2002 2003 2004 12 Mosa 12 Mosb
Total Nonfarm 155400 156700 154500 155600 162900 161000 167900
Goods-Producing 30800 31000 28400 27700 29500 29000 30800
Nat Res Minamp Con 11600 11100 11000 10900 11900 11700 12900
Manufacturing 19200 19900 17300 16800 17500 17300 19400
Service-Providing 124700 125700 126200 128000 133400 132100 137200
Trade 26300 25900 25300 25300 26300 24000 24200
Wholesale Trade 4200 4200 3900 3900 4100 4000 4400
Retail Trade 19600 19600 19400 19600 20100 19900 19900
Transport amp Utilities 2400 2000 1900 1900 2000 2000 2000
Information 8600 7400 6600 6700 7100 6900 7700
Financial Activities 4700 5100 5400 5800 6100 6000 6200
Prof amp Bus Svcs 19800 18700 18000 18200 19600 19400 20100
Edu amp Health Svcs 29300 30700 31800 32800 33900 33600 34700
Leisure amp Hospitality 11500 12500 12400 12300 12800 12600 13300
Government 20800 21900 22700 23000 23700 23500 24300
Federal 1200 1100 1100 1100 1100 1100 1000
State 5400 5600 5700 5700 5900 5800 6100
Local 14200 15200 15900 16200 16700 16600 17100
a Ending September 2004b Ending September 2005Notes Numbers may not add to totals due to rounding Includes Utah and Juab CountiesSource US Department of Labor Bureau of Labor StatisticsmdashNAICS
13
Analysis of the Provo-Orem Utah Housing Market as of October 1 2005
Table 3
Population and Household Trends
Provo-Orem HMA
April 1 1990 to October 1 2008
April 11990
April 12000
Current Date
Forecast Date
1990 to 2000
Number Rate ()
Average Annual Change
2000 to Current
Number Rate ()
Current to Forecast
Number Rate ()
Population
Provo-Orem HMA 263590 368590 434200 477400 10500 34 11900 30 14400 32
Households Provo-Orem HMA 71249 99937 118200 130300 2870 34 3300 31 4000 33
Notes Rate of change is calculated on a compound basis Averages may not add to HMA total due to rounding
Sources 1990 and 2000mdashUS Census Bureau Current and ForecastmdashEstimates by analyst
14
Analysis of the Provo-Orem Utah Housing Market as of October 1 2005
Table 4
Housing Inventory Tenure and Vacancy
Provo-Orem HMA
1990 2000 and October 1 2005
Provo-Orem HMA
1990 2000 Current
Total Housing Inventory 72821 104315 125000
Occupied Units 71249 99937 118200
Owners 44493 66786 83700
624 668 708
Renters 26756 33151 34500
376 332 292
Vacant Units 2653 4378 6900
For Sale 503 1200 1360
Rate () 11 16 16
For Rent 578 1142 3000
Rate () 21 33 80
Other Vacant 1572 2145 2500
Note Numbers may not add to totals due to rounding Sources 1990 and 2000mdashUS Census Bureau
CurrentmdashEstimates by analyst
15
Analysis of the Provo-Orem Utah Housing Market as of October 1 2005
Table 5
Residential Building Permit Activity
Provo-Orem HMA
1990 to October 1 2005
1990 1991 1992 1993 1994 1995 1996 1997 1998 1999
Provo-Orem HMA Total 1303 1655 2656 3423 3765 4395 3955 3258 4099 4143
Single-family 982 1312 1985 2646 2736 2914 2584 2386 3008 3458
Multifamily 321 343 671 777 1029 1481 1371 872 1091 685
2000 2001 2002 2003 2004 2005
Provo-Orem HMA Total 3731 3829 3725 4271 4492 4017
Single-family 3193 3082 2920 3254 3533 3452
Multifamily 538 747 805 1017 959 565
Note 2005 data through SeptemberSource US Census Bureau Building Permits Survey
16
Analysis of the Provo-Orem Utah Housing Market as of October 1 2005
Table 6
Estimated Qualitative Demand for New Market-Rate Sales Housing
Provo-Orem HMA
October 1 2005 through October 1 2008
Price Range ($) Units of
From To Demand
120000 179999 3830
180000 199999 2740
200000 299999 1750
300000 399000 1090
400000 499000 880
500000 699000 550
700000 and higher 110
Source Estimates by analyst
17
Analysis of the Provo-Orem Utah Housing Market as of October 1 2005
Table 7
Estimated Qualitative Demand for New Market-Rate Rental Housing
Provo-Orem HMA
October 1 2005 to October 1 2008
One Bedroom Two Bedrooms Three Bedrooms
Monthly Monthly Monthly Gross Units of Gross Units of Gross Units of
Rent ($) Demand Rent ($) Demand Rent ($) Demand
650 300 750 570 850 550
700 270 800 470 900 500
750 250 850 430 950 450
800 220 900 390 1000 390
850 190 950 340 1050 320
900 160 1000 280 1100 290
950 140 1050 240 1150 250
1050 110 1150 190 1250 180
1150 90 1250 130 1350 130
1250 70 1350 90 1450 100
1350 60 1450 60 1550 80
1450 40 1550 40 1650 60
1550 30 1650 30 1750 50
1650 20 1750 10 1850 30
and higher and higher and higher
Notes Distribution above is noncumulative Demand shown at any rent represents demand at that level and higher
Source Estimates by analyst
18
Analysis of the Provo-Orem Utah Housing Market as of October 1 2005
unsold homes has increased by nearly 70 percent from 2000 to 2004 In 2005 however the market has shown some signs of improving because of the higher priced single-family sales market and the relative affordability of townhomes and condominiums The inventory of unsold homes has declined by 20 percent from a year ago indicating that future price increases are likely
Prices for newly constructed townhomes and condominiums range from $120000 to $150000 in the northern cities of Pleasant Grove and Lehi to $220000 and more near BYU in Provo The lower priced markets in the northern cities target the affordable owner market while the higher priced market near BYU appeals to parents of students who purchase condominiums to save on housing costs In downtown Provo the first large mixed-use high-rise condominium development opened earlier in the year With 60 units priced from $200000 to $600000 the development sold out quickly to retirees and professional workers
The sales market is expected to strengthen throughout the forecast period The townhome and condominium market should improve because it offers an affordable alternative to the pricier single-family market Household growth is expected to remain strong along with a continued shift to homeownership
Rental Market Conditions
Conditions in the rental market of the HMA have changed from an extremely tight market in 2000 to soft conditions as of the Current date The tight market in 2000 was the result of growing rental demand as the economy expanded and population increased during the 1990s The current soft market resulted from increased construction of rental units competition from homeownership and slower growth of renter households Newer general-occupancy apartments are reported to have higher occupancy rates than older developments
In 2005 market conditions have improved somewhat from a year ago Vacancies are slightly fewer and for the first time in 3 years small rent increases were possible for newer apartments Rents for new market-rate apartments entering the market are $700 for a one-bedroom unit $800 for a two-bedroomtwo-bath unit and $1000 for a three-bedroom unit 60-percent tax credit rents are about $100 lower For older properties the market has shown little improvement In response property managers have continued to upgrade their units or lower rents and are willing to lease units to students without doubling up bedrooms New condominium rentals are comparable in rent to new apartments coming on line Rents are generally lower the greater the distance from Provo and Orem
Approximately 800 low-income housing tax credit (LIHTC) units for families and the elderly have been built in the HMA since 1990 Rents are mostly below market although the maximum 60-percent rent under the program is close to the market rents for older rental units Because of the low asking rents on LIHTC units most of these units are affordable to households earning less than 50 percent of the area median income As of the Current date the average vacancy rate in these rent-restricted developments is less
9
Analysis of the Provo-Orem Utah Housing Market as of October 1 2005
than 6 percent The market for federally assisted rent-subsidized units has strengthened Since 2000 waiting lists for HUD-subsidized units in the HMA have doubled to more than 3000 households
The outlook is for improvement in the market Stronger employment and household growth will help the market come into balance Condominiums used as rentals are more likely to be converted to owner units as they become a more affordable alternative to single-family homes The number of large apartment developments in the planning stages is very small The single-student market is weaker than the general-occupancy market and will likely require a relatively longer period to recover
Forecast Housing Demand
Based on anticipated household growth replacement needs and current market conditions it is estimated that there will be a demand for 10950 sales units during the 3-year forecast period or an average of 3650 units a year The majority of the demand is expected to be met by single-family detached homes Demand for townhomes and condominiums is expected to increase due to the increase in sales prices for single-family detached homes and rising interest rates Most of the demand is expected to be for homes priced at $200000 or less As in the recent past homebuilding will center in the northern cities due to the availability of land Table 6 presents sales demand by price range for townhomes condominiums and single-family homes
Demand for additional rental housing during the forecast period is expected to total 1920 units or 640 a year Currently approximately 500 excess vacancies are in the market thus the need for additional new rental units is expected to start in the second year of the 3-year forecast period Approximately 600 units currently under construction will be completed during the next 12 months Any delays in construction to meet prospective demand will give the market time to absorb these surpluses during the first year Table 7 presents a summary of total rental demand by rent level It is estimated that there will be demand for both affordable rentals financed by LIHTC and general-occupancy market-rate units
10
Analysis of the Provo-Orem Utah Housing Market as of October 1 2005
Table 1
Labor Force and Employment
Provo-Orem HMA
1990 to October 1 2005
1990 1991 1992 1993 1994 1995 1996 1997 1998 1999
Labor Force 116900 123700 128300 135400 144300 149300 154100 157900 165400 170200
Employment 111700 118200 122800 130400 139700 145000 149500 153700 160300 165100
Unemployment 5200 5500 5400 5000 4600 4300 4500 4200 5100 5100
Rate () 45 44 42 37 32 29 29 26 31 30
Previous Current 2000 2001 2002 2003 2004 12 Mosa 12 Mosb
Labor Force 179800 181800 184300 186500 191760 190300 197000
Employment 174500 174400 173900 176800 182500 181000 188300
Unemployment 5300 7400 10400 8500 9200 9300 8700
Rate () 30 41 57 47 48 49 44
a Ending September 2004b Ending September 2005Notes Numbers may not add to totals due to rounding Includes Utah County onlySource US Department of Labor Bureau of Labor Statistics
11
Analysis of the Provo-Orem Utah Housing Market as of October 1 2005
Table 2
Nonfarm Employment by Industry
Provo-Orem HMA
1990 to October 1 2005 (1 of 2)
Employment Sector 1990 1991 1992 1993 1994 1995 1996 1997 1998 1999
Total Nonfarm 97800 103900 106100 112100 119700 127000 133000 138400 144700 149000
Goods-Producing 17400 19300 19500 20600 23400 26900 28800 29300 30400 29800
Construction 3800 5200 6000 6500 7500 9800 10400 10200 11100 11300
Manufacturing 13600 14100 13500 14100 15800 17000 18400 19200 19300 18500
Service-Providing 80300 84600 86600 91500 96300 11200 104100 109100 114300 119200
Trade 17600 18300 18600 19000 20300 21700 23100 24500 24500 25900
Wholesale Trade 3400 3500 3600 3600 3700 3900 4900 4100 4200 4200
Retail Trade 12100 12900 13200 13700 14800 16000 17000 18200 18600 19400
Transport amp Utilities 2100 1900 1800 1700 1800 1900 2000 2200 1700 2200
Information 2700 3200 4600 5600 6200 6400 5900 5600 6400 7500
Financial Activities 2800 2700 2900 3300 3800 3700 4100 4100 4500 4800
Prof amp Bus Svcs 15100 15800 15100 15800 16400 16100 16100 16900 17900 18700
Edu amp Health Svcs 18800 20400 20400 22000 22900 23700 25100 26500 28100 28600
Leisure amp Hospitality 6600 7000 7300 7500 8100 8900 9700 10100 10500 10800
Government 15200 15500 15800 16300 16400 17200 17600 18700 19400 19700
Federal 1000 900 900 900 900 900 1000 1000 1000 1100
State 4400 4600 4700 4700 4500 4600 4700 4900 5100 5200
Local 9800 10000 10100 10700 11000 11600 11900 12800 13300 13500
Notes Numbers may not add to totals due to rounding Includes Utah and Juab Counties Source US Department of Labor Bureau of Labor StatisticsmdashNorth American Industry Classification System (NAICS)
12
Analysis of the Provo-Orem Utah Housing Market as of October 1 2005
Table 2
Nonfarm Employment by Industry
Provo-Orem HMA
1990 to October 1 2005 (2 of 2)
Previous Current Employment Sector 2000 2001 2002 2003 2004 12 Mosa 12 Mosb
Total Nonfarm 155400 156700 154500 155600 162900 161000 167900
Goods-Producing 30800 31000 28400 27700 29500 29000 30800
Nat Res Minamp Con 11600 11100 11000 10900 11900 11700 12900
Manufacturing 19200 19900 17300 16800 17500 17300 19400
Service-Providing 124700 125700 126200 128000 133400 132100 137200
Trade 26300 25900 25300 25300 26300 24000 24200
Wholesale Trade 4200 4200 3900 3900 4100 4000 4400
Retail Trade 19600 19600 19400 19600 20100 19900 19900
Transport amp Utilities 2400 2000 1900 1900 2000 2000 2000
Information 8600 7400 6600 6700 7100 6900 7700
Financial Activities 4700 5100 5400 5800 6100 6000 6200
Prof amp Bus Svcs 19800 18700 18000 18200 19600 19400 20100
Edu amp Health Svcs 29300 30700 31800 32800 33900 33600 34700
Leisure amp Hospitality 11500 12500 12400 12300 12800 12600 13300
Government 20800 21900 22700 23000 23700 23500 24300
Federal 1200 1100 1100 1100 1100 1100 1000
State 5400 5600 5700 5700 5900 5800 6100
Local 14200 15200 15900 16200 16700 16600 17100
a Ending September 2004b Ending September 2005Notes Numbers may not add to totals due to rounding Includes Utah and Juab CountiesSource US Department of Labor Bureau of Labor StatisticsmdashNAICS
13
Analysis of the Provo-Orem Utah Housing Market as of October 1 2005
Table 3
Population and Household Trends
Provo-Orem HMA
April 1 1990 to October 1 2008
April 11990
April 12000
Current Date
Forecast Date
1990 to 2000
Number Rate ()
Average Annual Change
2000 to Current
Number Rate ()
Current to Forecast
Number Rate ()
Population
Provo-Orem HMA 263590 368590 434200 477400 10500 34 11900 30 14400 32
Households Provo-Orem HMA 71249 99937 118200 130300 2870 34 3300 31 4000 33
Notes Rate of change is calculated on a compound basis Averages may not add to HMA total due to rounding
Sources 1990 and 2000mdashUS Census Bureau Current and ForecastmdashEstimates by analyst
14
Analysis of the Provo-Orem Utah Housing Market as of October 1 2005
Table 4
Housing Inventory Tenure and Vacancy
Provo-Orem HMA
1990 2000 and October 1 2005
Provo-Orem HMA
1990 2000 Current
Total Housing Inventory 72821 104315 125000
Occupied Units 71249 99937 118200
Owners 44493 66786 83700
624 668 708
Renters 26756 33151 34500
376 332 292
Vacant Units 2653 4378 6900
For Sale 503 1200 1360
Rate () 11 16 16
For Rent 578 1142 3000
Rate () 21 33 80
Other Vacant 1572 2145 2500
Note Numbers may not add to totals due to rounding Sources 1990 and 2000mdashUS Census Bureau
CurrentmdashEstimates by analyst
15
Analysis of the Provo-Orem Utah Housing Market as of October 1 2005
Table 5
Residential Building Permit Activity
Provo-Orem HMA
1990 to October 1 2005
1990 1991 1992 1993 1994 1995 1996 1997 1998 1999
Provo-Orem HMA Total 1303 1655 2656 3423 3765 4395 3955 3258 4099 4143
Single-family 982 1312 1985 2646 2736 2914 2584 2386 3008 3458
Multifamily 321 343 671 777 1029 1481 1371 872 1091 685
2000 2001 2002 2003 2004 2005
Provo-Orem HMA Total 3731 3829 3725 4271 4492 4017
Single-family 3193 3082 2920 3254 3533 3452
Multifamily 538 747 805 1017 959 565
Note 2005 data through SeptemberSource US Census Bureau Building Permits Survey
16
Analysis of the Provo-Orem Utah Housing Market as of October 1 2005
Table 6
Estimated Qualitative Demand for New Market-Rate Sales Housing
Provo-Orem HMA
October 1 2005 through October 1 2008
Price Range ($) Units of
From To Demand
120000 179999 3830
180000 199999 2740
200000 299999 1750
300000 399000 1090
400000 499000 880
500000 699000 550
700000 and higher 110
Source Estimates by analyst
17
Analysis of the Provo-Orem Utah Housing Market as of October 1 2005
Table 7
Estimated Qualitative Demand for New Market-Rate Rental Housing
Provo-Orem HMA
October 1 2005 to October 1 2008
One Bedroom Two Bedrooms Three Bedrooms
Monthly Monthly Monthly Gross Units of Gross Units of Gross Units of
Rent ($) Demand Rent ($) Demand Rent ($) Demand
650 300 750 570 850 550
700 270 800 470 900 500
750 250 850 430 950 450
800 220 900 390 1000 390
850 190 950 340 1050 320
900 160 1000 280 1100 290
950 140 1050 240 1150 250
1050 110 1150 190 1250 180
1150 90 1250 130 1350 130
1250 70 1350 90 1450 100
1350 60 1450 60 1550 80
1450 40 1550 40 1650 60
1550 30 1650 30 1750 50
1650 20 1750 10 1850 30
and higher and higher and higher
Notes Distribution above is noncumulative Demand shown at any rent represents demand at that level and higher
Source Estimates by analyst
18

Analysis of the Provo-Orem Utah Housing Market as of October 1 2005
Table 2
Nonfarm Employment by Industry
Provo-Orem HMA
1990 to October 1 2005 (1 of 2)
Employment Sector 1990 1991 1992 1993 1994 1995 1996 1997 1998 1999
Total Nonfarm 97800 103900 106100 112100 119700 127000 133000 138400 144700 149000
Goods-Producing 17400 19300 19500 20600 23400 26900 28800 29300 30400 29800
Construction 3800 5200 6000 6500 7500 9800 10400 10200 11100 11300
Manufacturing 13600 14100 13500 14100 15800 17000 18400 19200 19300 18500
Service-Providing 80300 84600 86600 91500 96300 11200 104100 109100 114300 119200
Trade 17600 18300 18600 19000 20300 21700 23100 24500 24500 25900
Wholesale Trade 3400 3500 3600 3600 3700 3900 4900 4100 4200 4200
Retail Trade 12100 12900 13200 13700 14800 16000 17000 18200 18600 19400
Transport amp Utilities 2100 1900 1800 1700 1800 1900 2000 2200 1700 2200
Information 2700 3200 4600 5600 6200 6400 5900 5600 6400 7500
Financial Activities 2800 2700 2900 3300 3800 3700 4100 4100 4500 4800
Prof amp Bus Svcs 15100 15800 15100 15800 16400 16100 16100 16900 17900 18700
Edu amp Health Svcs 18800 20400 20400 22000 22900 23700 25100 26500 28100 28600
Leisure amp Hospitality 6600 7000 7300 7500 8100 8900 9700 10100 10500 10800
Government 15200 15500 15800 16300 16400 17200 17600 18700 19400 19700
Federal 1000 900 900 900 900 900 1000 1000 1000 1100
State 4400 4600 4700 4700 4500 4600 4700 4900 5100 5200
Local 9800 10000 10100 10700 11000 11600 11900 12800 13300 13500
Notes Numbers may not add to totals due to rounding Includes Utah and Juab Counties Source US Department of Labor Bureau of Labor StatisticsmdashNorth American Industry Classification System (NAICS)
12
Analysis of the Provo-Orem Utah Housing Market as of October 1 2005
Table 2
Nonfarm Employment by Industry
Provo-Orem HMA
1990 to October 1 2005 (2 of 2)
Previous Current Employment Sector 2000 2001 2002 2003 2004 12 Mosa 12 Mosb
Total Nonfarm 155400 156700 154500 155600 162900 161000 167900
Goods-Producing 30800 31000 28400 27700 29500 29000 30800
Nat Res Minamp Con 11600 11100 11000 10900 11900 11700 12900
Manufacturing 19200 19900 17300 16800 17500 17300 19400
Service-Providing 124700 125700 126200 128000 133400 132100 137200
Trade 26300 25900 25300 25300 26300 24000 24200
Wholesale Trade 4200 4200 3900 3900 4100 4000 4400
Retail Trade 19600 19600 19400 19600 20100 19900 19900
Transport amp Utilities 2400 2000 1900 1900 2000 2000 2000
Information 8600 7400 6600 6700 7100 6900 7700
Financial Activities 4700 5100 5400 5800 6100 6000 6200
Prof amp Bus Svcs 19800 18700 18000 18200 19600 19400 20100
Edu amp Health Svcs 29300 30700 31800 32800 33900 33600 34700
Leisure amp Hospitality 11500 12500 12400 12300 12800 12600 13300
Government 20800 21900 22700 23000 23700 23500 24300
Federal 1200 1100 1100 1100 1100 1100 1000
State 5400 5600 5700 5700 5900 5800 6100
Local 14200 15200 15900 16200 16700 16600 17100
a Ending September 2004b Ending September 2005Notes Numbers may not add to totals due to rounding Includes Utah and Juab CountiesSource US Department of Labor Bureau of Labor StatisticsmdashNAICS
13
Analysis of the Provo-Orem Utah Housing Market as of October 1 2005
Table 3
Population and Household Trends
Provo-Orem HMA
April 1 1990 to October 1 2008
April 11990
April 12000
Current Date
Forecast Date
1990 to 2000
Number Rate ()
Average Annual Change
2000 to Current
Number Rate ()
Current to Forecast
Number Rate ()
Population
Provo-Orem HMA 263590 368590 434200 477400 10500 34 11900 30 14400 32
Households Provo-Orem HMA 71249 99937 118200 130300 2870 34 3300 31 4000 33
Notes Rate of change is calculated on a compound basis Averages may not add to HMA total due to rounding
Sources 1990 and 2000mdashUS Census Bureau Current and ForecastmdashEstimates by analyst
14
Analysis of the Provo-Orem Utah Housing Market as of October 1 2005
Table 4
Housing Inventory Tenure and Vacancy
Provo-Orem HMA
1990 2000 and October 1 2005
Provo-Orem HMA
1990 2000 Current
Total Housing Inventory 72821 104315 125000
Occupied Units 71249 99937 118200
Owners 44493 66786 83700
624 668 708
Renters 26756 33151 34500
376 332 292
Vacant Units 2653 4378 6900
For Sale 503 1200 1360
Rate () 11 16 16
For Rent 578 1142 3000
Rate () 21 33 80
Other Vacant 1572 2145 2500
Note Numbers may not add to totals due to rounding Sources 1990 and 2000mdashUS Census Bureau
CurrentmdashEstimates by analyst
15
Analysis of the Provo-Orem Utah Housing Market as of October 1 2005
Table 5
Residential Building Permit Activity
Provo-Orem HMA
1990 to October 1 2005
1990 1991 1992 1993 1994 1995 1996 1997 1998 1999
Provo-Orem HMA Total 1303 1655 2656 3423 3765 4395 3955 3258 4099 4143
Single-family 982 1312 1985 2646 2736 2914 2584 2386 3008 3458
Multifamily 321 343 671 777 1029 1481 1371 872 1091 685
2000 2001 2002 2003 2004 2005
Provo-Orem HMA Total 3731 3829 3725 4271 4492 4017
Single-family 3193 3082 2920 3254 3533 3452
Multifamily 538 747 805 1017 959 565
Note 2005 data through SeptemberSource US Census Bureau Building Permits Survey
16
Analysis of the Provo-Orem Utah Housing Market as of October 1 2005
Table 6
Estimated Qualitative Demand for New Market-Rate Sales Housing
Provo-Orem HMA
October 1 2005 through October 1 2008
Price Range ($) Units of
From To Demand
120000 179999 3830
180000 199999 2740
200000 299999 1750
300000 399000 1090
400000 499000 880
500000 699000 550
700000 and higher 110
Source Estimates by analyst
17
Analysis of the Provo-Orem Utah Housing Market as of October 1 2005
Table 7
Estimated Qualitative Demand for New Market-Rate Rental Housing
Provo-Orem HMA
October 1 2005 to October 1 2008
One Bedroom Two Bedrooms Three Bedrooms
Monthly Monthly Monthly Gross Units of Gross Units of Gross Units of
Rent ($) Demand Rent ($) Demand Rent ($) Demand
650 300 750 570 850 550
700 270 800 470 900 500
750 250 850 430 950 450
800 220 900 390 1000 390
850 190 950 340 1050 320
900 160 1000 280 1100 290
950 140 1050 240 1150 250
1050 110 1150 190 1250 180
1150 90 1250 130 1350 130
1250 70 1350 90 1450 100
1350 60 1450 60 1550 80
1450 40 1550 40 1650 60
1550 30 1650 30 1750 50
1650 20 1750 10 1850 30
and higher and higher and higher
Notes Distribution above is noncumulative Demand shown at any rent represents demand at that level and higher
Source Estimates by analyst
18
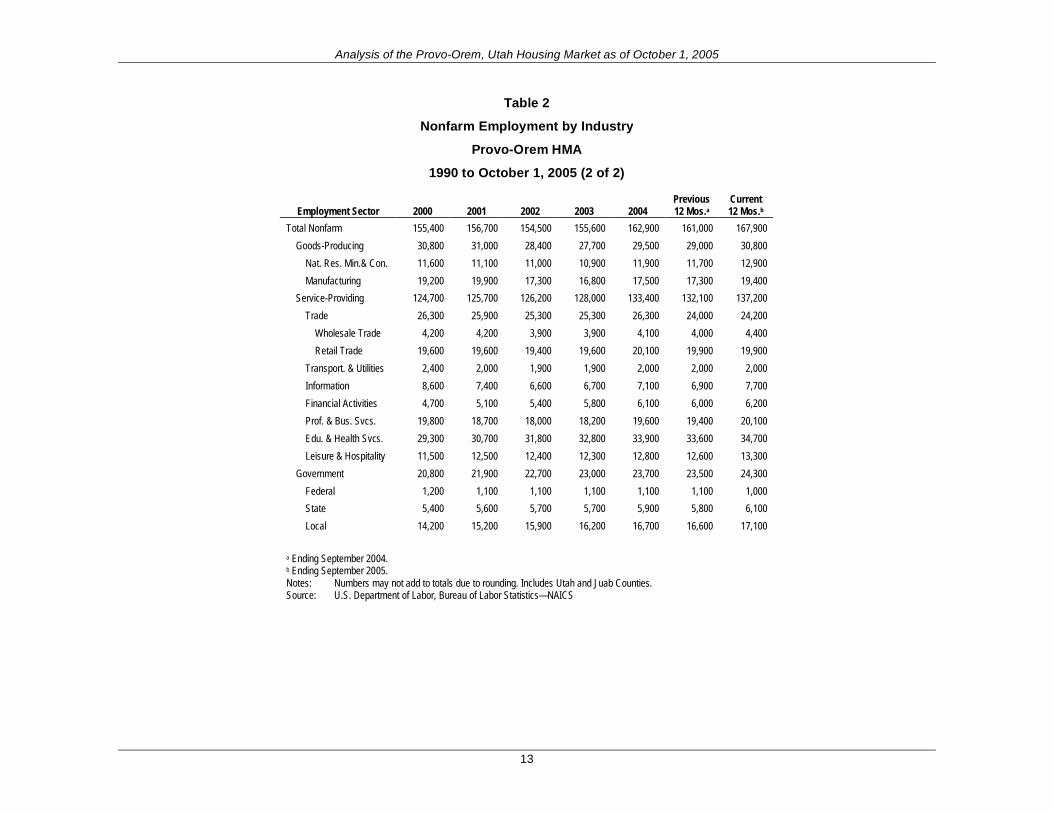
Analysis of the Provo-Orem Utah Housing Market as of October 1 2005
Table 2
Nonfarm Employment by Industry
Provo-Orem HMA
1990 to October 1 2005 (2 of 2)
Previous Current Employment Sector 2000 2001 2002 2003 2004 12 Mosa 12 Mosb
Total Nonfarm 155400 156700 154500 155600 162900 161000 167900
Goods-Producing 30800 31000 28400 27700 29500 29000 30800
Nat Res Minamp Con 11600 11100 11000 10900 11900 11700 12900
Manufacturing 19200 19900 17300 16800 17500 17300 19400
Service-Providing 124700 125700 126200 128000 133400 132100 137200
Trade 26300 25900 25300 25300 26300 24000 24200
Wholesale Trade 4200 4200 3900 3900 4100 4000 4400
Retail Trade 19600 19600 19400 19600 20100 19900 19900
Transport amp Utilities 2400 2000 1900 1900 2000 2000 2000
Information 8600 7400 6600 6700 7100 6900 7700
Financial Activities 4700 5100 5400 5800 6100 6000 6200
Prof amp Bus Svcs 19800 18700 18000 18200 19600 19400 20100
Edu amp Health Svcs 29300 30700 31800 32800 33900 33600 34700
Leisure amp Hospitality 11500 12500 12400 12300 12800 12600 13300
Government 20800 21900 22700 23000 23700 23500 24300
Federal 1200 1100 1100 1100 1100 1100 1000
State 5400 5600 5700 5700 5900 5800 6100
Local 14200 15200 15900 16200 16700 16600 17100
a Ending September 2004b Ending September 2005Notes Numbers may not add to totals due to rounding Includes Utah and Juab CountiesSource US Department of Labor Bureau of Labor StatisticsmdashNAICS
13
Analysis of the Provo-Orem Utah Housing Market as of October 1 2005
Table 3
Population and Household Trends
Provo-Orem HMA
April 1 1990 to October 1 2008
April 11990
April 12000
Current Date
Forecast Date
1990 to 2000
Number Rate ()
Average Annual Change
2000 to Current
Number Rate ()
Current to Forecast
Number Rate ()
Population
Provo-Orem HMA 263590 368590 434200 477400 10500 34 11900 30 14400 32
Households Provo-Orem HMA 71249 99937 118200 130300 2870 34 3300 31 4000 33
Notes Rate of change is calculated on a compound basis Averages may not add to HMA total due to rounding
Sources 1990 and 2000mdashUS Census Bureau Current and ForecastmdashEstimates by analyst
14
Analysis of the Provo-Orem Utah Housing Market as of October 1 2005
Table 4
Housing Inventory Tenure and Vacancy
Provo-Orem HMA
1990 2000 and October 1 2005
Provo-Orem HMA
1990 2000 Current
Total Housing Inventory 72821 104315 125000
Occupied Units 71249 99937 118200
Owners 44493 66786 83700
624 668 708
Renters 26756 33151 34500
376 332 292
Vacant Units 2653 4378 6900
For Sale 503 1200 1360
Rate () 11 16 16
For Rent 578 1142 3000
Rate () 21 33 80
Other Vacant 1572 2145 2500
Note Numbers may not add to totals due to rounding Sources 1990 and 2000mdashUS Census Bureau
CurrentmdashEstimates by analyst
15
Analysis of the Provo-Orem Utah Housing Market as of October 1 2005
Table 5
Residential Building Permit Activity
Provo-Orem HMA
1990 to October 1 2005
1990 1991 1992 1993 1994 1995 1996 1997 1998 1999
Provo-Orem HMA Total 1303 1655 2656 3423 3765 4395 3955 3258 4099 4143
Single-family 982 1312 1985 2646 2736 2914 2584 2386 3008 3458
Multifamily 321 343 671 777 1029 1481 1371 872 1091 685
2000 2001 2002 2003 2004 2005
Provo-Orem HMA Total 3731 3829 3725 4271 4492 4017
Single-family 3193 3082 2920 3254 3533 3452
Multifamily 538 747 805 1017 959 565
Note 2005 data through SeptemberSource US Census Bureau Building Permits Survey
16
Analysis of the Provo-Orem Utah Housing Market as of October 1 2005
Table 6
Estimated Qualitative Demand for New Market-Rate Sales Housing
Provo-Orem HMA
October 1 2005 through October 1 2008
Price Range ($) Units of
From To Demand
120000 179999 3830
180000 199999 2740
200000 299999 1750
300000 399000 1090
400000 499000 880
500000 699000 550
700000 and higher 110
Source Estimates by analyst
17
Analysis of the Provo-Orem Utah Housing Market as of October 1 2005
Table 7
Estimated Qualitative Demand for New Market-Rate Rental Housing
Provo-Orem HMA
October 1 2005 to October 1 2008
One Bedroom Two Bedrooms Three Bedrooms
Monthly Monthly Monthly Gross Units of Gross Units of Gross Units of
Rent ($) Demand Rent ($) Demand Rent ($) Demand
650 300 750 570 850 550
700 270 800 470 900 500
750 250 850 430 950 450
800 220 900 390 1000 390
850 190 950 340 1050 320
900 160 1000 280 1100 290
950 140 1050 240 1150 250
1050 110 1150 190 1250 180
1150 90 1250 130 1350 130
1250 70 1350 90 1450 100
1350 60 1450 60 1550 80
1450 40 1550 40 1650 60
1550 30 1650 30 1750 50
1650 20 1750 10 1850 30
and higher and higher and higher
Notes Distribution above is noncumulative Demand shown at any rent represents demand at that level and higher
Source Estimates by analyst
18

Analysis of the Provo-Orem Utah Housing Market as of October 1 2005
Table 4
Housing Inventory Tenure and Vacancy
Provo-Orem HMA
1990 2000 and October 1 2005
Provo-Orem HMA
1990 2000 Current
Total Housing Inventory 72821 104315 125000
Occupied Units 71249 99937 118200
Owners 44493 66786 83700
624 668 708
Renters 26756 33151 34500
376 332 292
Vacant Units 2653 4378 6900
For Sale 503 1200 1360
Rate () 11 16 16
For Rent 578 1142 3000
Rate () 21 33 80
Other Vacant 1572 2145 2500
Note Numbers may not add to totals due to rounding Sources 1990 and 2000mdashUS Census Bureau
CurrentmdashEstimates by analyst
15
Analysis of the Provo-Orem Utah Housing Market as of October 1 2005
Table 5
Residential Building Permit Activity
Provo-Orem HMA
1990 to October 1 2005
1990 1991 1992 1993 1994 1995 1996 1997 1998 1999
Provo-Orem HMA Total 1303 1655 2656 3423 3765 4395 3955 3258 4099 4143
Single-family 982 1312 1985 2646 2736 2914 2584 2386 3008 3458
Multifamily 321 343 671 777 1029 1481 1371 872 1091 685
2000 2001 2002 2003 2004 2005
Provo-Orem HMA Total 3731 3829 3725 4271 4492 4017
Single-family 3193 3082 2920 3254 3533 3452
Multifamily 538 747 805 1017 959 565
Note 2005 data through SeptemberSource US Census Bureau Building Permits Survey
16
Analysis of the Provo-Orem Utah Housing Market as of October 1 2005
Table 6
Estimated Qualitative Demand for New Market-Rate Sales Housing
Provo-Orem HMA
October 1 2005 through October 1 2008
Price Range ($) Units of
From To Demand
120000 179999 3830
180000 199999 2740
200000 299999 1750
300000 399000 1090
400000 499000 880
500000 699000 550
700000 and higher 110
Source Estimates by analyst
17
Analysis of the Provo-Orem Utah Housing Market as of October 1 2005
Table 7
Estimated Qualitative Demand for New Market-Rate Rental Housing
Provo-Orem HMA
October 1 2005 to October 1 2008
One Bedroom Two Bedrooms Three Bedrooms
Monthly Monthly Monthly Gross Units of Gross Units of Gross Units of
Rent ($) Demand Rent ($) Demand Rent ($) Demand
650 300 750 570 850 550
700 270 800 470 900 500
750 250 850 430 950 450
800 220 900 390 1000 390
850 190 950 340 1050 320
900 160 1000 280 1100 290
950 140 1050 240 1150 250
1050 110 1150 190 1250 180
1150 90 1250 130 1350 130
1250 70 1350 90 1450 100
1350 60 1450 60 1550 80
1450 40 1550 40 1650 60
1550 30 1650 30 1750 50
1650 20 1750 10 1850 30
and higher and higher and higher
Notes Distribution above is noncumulative Demand shown at any rent represents demand at that level and higher
Source Estimates by analyst
18
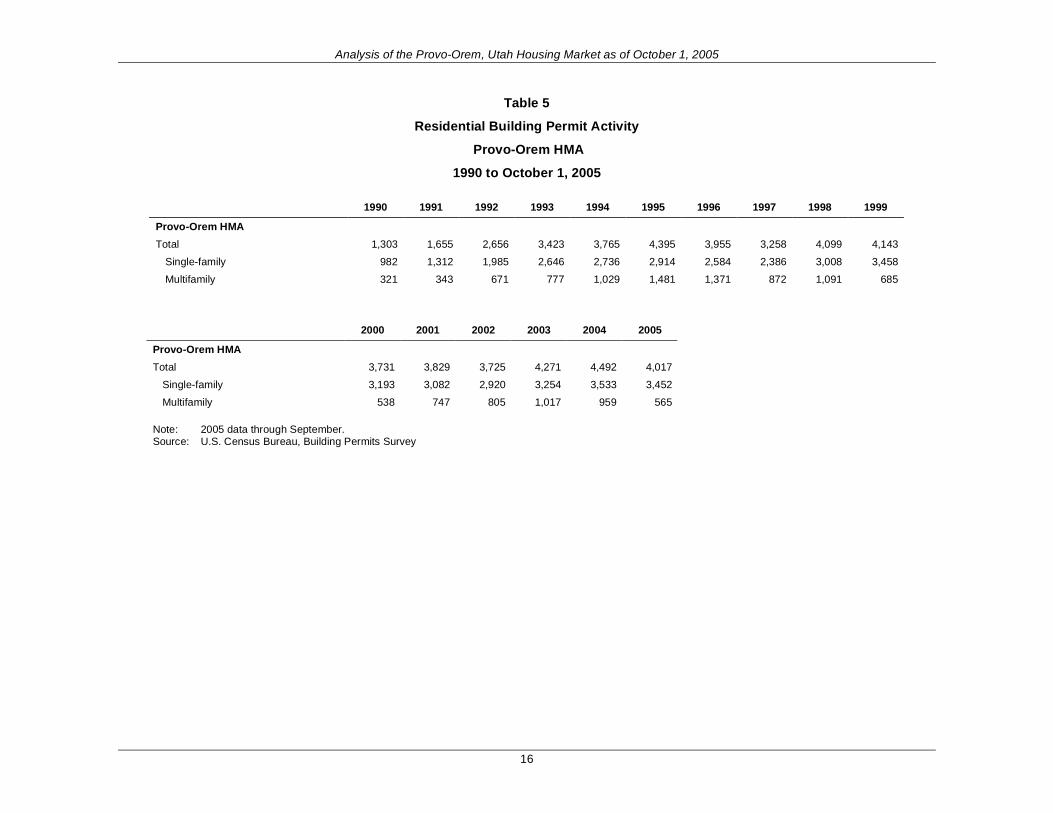
Analysis of the Provo-Orem Utah Housing Market as of October 1 2005
Table 5
Residential Building Permit Activity
Provo-Orem HMA
1990 to October 1 2005
1990 1991 1992 1993 1994 1995 1996 1997 1998 1999
Provo-Orem HMA Total 1303 1655 2656 3423 3765 4395 3955 3258 4099 4143
Single-family 982 1312 1985 2646 2736 2914 2584 2386 3008 3458
Multifamily 321 343 671 777 1029 1481 1371 872 1091 685
2000 2001 2002 2003 2004 2005
Provo-Orem HMA Total 3731 3829 3725 4271 4492 4017
Single-family 3193 3082 2920 3254 3533 3452
Multifamily 538 747 805 1017 959 565
Note 2005 data through SeptemberSource US Census Bureau Building Permits Survey
16
Analysis of the Provo-Orem Utah Housing Market as of October 1 2005
Table 6
Estimated Qualitative Demand for New Market-Rate Sales Housing
Provo-Orem HMA
October 1 2005 through October 1 2008
Price Range ($) Units of
From To Demand
120000 179999 3830
180000 199999 2740
200000 299999 1750
300000 399000 1090
400000 499000 880
500000 699000 550
700000 and higher 110
Source Estimates by analyst
17
Analysis of the Provo-Orem Utah Housing Market as of October 1 2005
Table 7
Estimated Qualitative Demand for New Market-Rate Rental Housing
Provo-Orem HMA
October 1 2005 to October 1 2008
One Bedroom Two Bedrooms Three Bedrooms
Monthly Monthly Monthly Gross Units of Gross Units of Gross Units of
Rent ($) Demand Rent ($) Demand Rent ($) Demand
650 300 750 570 850 550
700 270 800 470 900 500
750 250 850 430 950 450
800 220 900 390 1000 390
850 190 950 340 1050 320
900 160 1000 280 1100 290
950 140 1050 240 1150 250
1050 110 1150 190 1250 180
1150 90 1250 130 1350 130
1250 70 1350 90 1450 100
1350 60 1450 60 1550 80
1450 40 1550 40 1650 60
1550 30 1650 30 1750 50
1650 20 1750 10 1850 30
and higher and higher and higher
Notes Distribution above is noncumulative Demand shown at any rent represents demand at that level and higher
Source Estimates by analyst
18
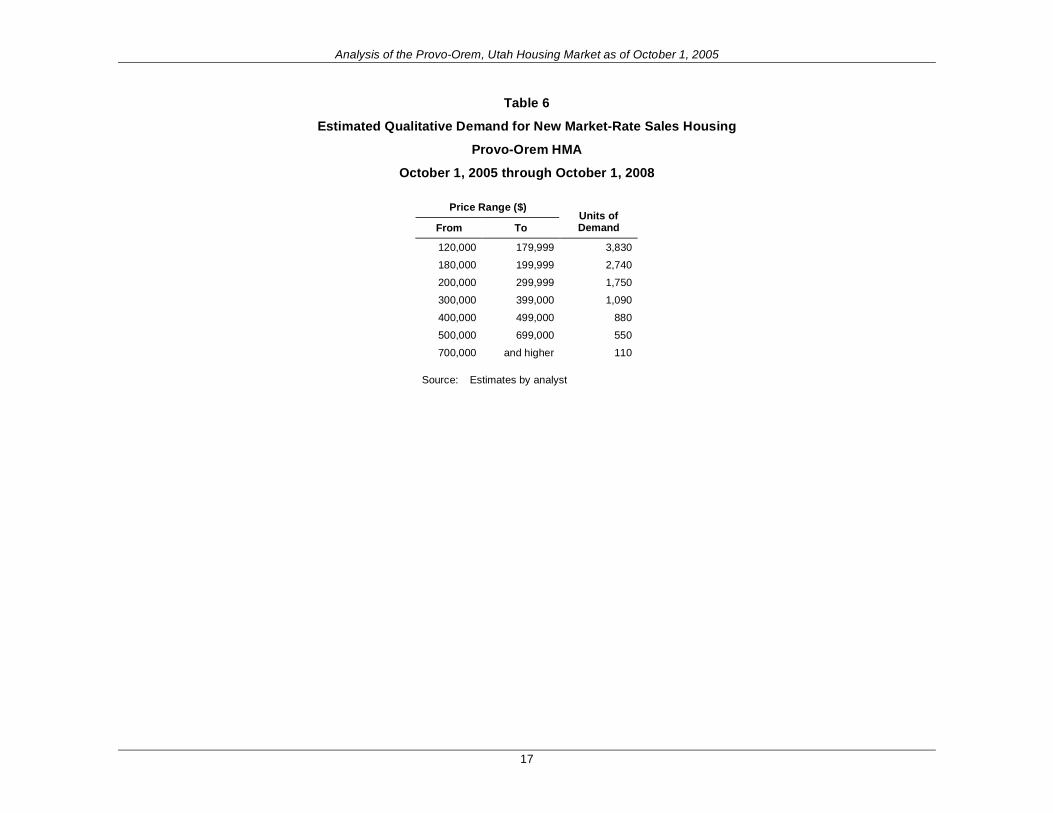
Analysis of the Provo-Orem Utah Housing Market as of October 1 2005
Table 7
Estimated Qualitative Demand for New Market-Rate Rental Housing
Provo-Orem HMA
October 1 2005 to October 1 2008
One Bedroom Two Bedrooms Three Bedrooms
Monthly Monthly Monthly Gross Units of Gross Units of Gross Units of
Rent ($) Demand Rent ($) Demand Rent ($) Demand
650 300 750 570 850 550
700 270 800 470 900 500
750 250 850 430 950 450
800 220 900 390 1000 390
850 190 950 340 1050 320
900 160 1000 280 1100 290
950 140 1050 240 1150 250
1050 110 1150 190 1250 180
1150 90 1250 130 1350 130
1250 70 1350 90 1450 100
1350 60 1450 60 1550 80
1450 40 1550 40 1650 60
1550 30 1650 30 1750 50
1650 20 1750 10 1850 30
and higher and higher and higher
Notes Distribution above is noncumulative Demand shown at any rent represents demand at that level and higher
Source Estimates by analyst
18