analysis of spr salt cavern remedial leach program 2013 · analysis of spr salt cavern remedial...
TRANSCRIPT
SANDIA REPORT SAND2013-7078 Unlimited Release Printed September 2013
Analysis of SPR Salt Cavern Remedial Leach Program 2013 Paula D. Weber, Karen A. Gutierrez, David L. Lord, David K. Rudeen Prepared by Sandia National Laboratories Albuquerque, New Mexico 87185 and Livermore, California 94550 Sandia National Laboratories is a multi-program laboratory managed and operated by Sandia Corporation, a wholly owned subsidiary of Lockheed Martin Corporation, for the U.S. Department of Energy's National Nuclear Security Administration under contract DE-AC04-94AL85000. Approved for public release; further dissemination unlimited.
2
Issued by Sandia National Laboratories, operated for the United States Department of Energy by Sandia Corporation. NOTICE: This report was prepared as an account of work sponsored by an agency of the United States Government. Neither the United States Government, nor any agency thereof, nor any of their employees, nor any of their contractors, subcontractors, or their employees, make any warranty, express or implied, or assume any legal liability or responsibility for the accuracy, completeness, or usefulness of any information, apparatus, product, or process disclosed, or represent that its use would not infringe privately owned rights. Reference herein to any specific commercial product, process, or service by trade name, trademark, manufacturer, or otherwise, does not necessarily constitute or imply its endorsement, recommendation, or favoring by the United States Government, any agency thereof, or any of their contractors or subcontractors. The views and opinions expressed herein do not necessarily state or reflect those of the United States Government, any agency thereof, or any of their contractors. Printed in the United States of America. This report has been reproduced directly from the best available copy. Available to DOE and DOE contractors from U.S. Department of Energy Office of Scientific and Technical Information P.O. Box 62 Oak Ridge, TN 37831 Telephone: (865) 576-8401 Facsimile: (865) 576-5728 E-Mail: [email protected] Online ordering: http://www.osti.gov/bridge Available to the public from U.S. Department of Commerce National Technical Information Service 5285 Port Royal Rd. Springfield, VA 22161 Telephone: (800) 553-6847 Facsimile: (703) 605-6900 E-Mail: [email protected] Online order: http://www.ntis.gov/help/ordermethods.asp?loc=7-4-0#online
3
SAND2013-7078 Unlimited Release Printed September 2013
Analysis of SPR Salt Cavern
Remedial Leach Program 2013
Paula D. Weber, Karen A. Gutierrez, David L. Lord Geotechnology & Engineering Department
Sandia National Laboratories
P.O. Box 5800 Albuquerque, NM 87185-0706
David K. Rudeen
GRAM, Inc. Albuquerque, NM 87112
Abstract
The storage caverns of the US Strategic Petroleum Reserve (SPR) exhibit creep behavior resulting in reduction of storage capacity over time. Maintenance of oil storage capacity requires periodic controlled leaching named remedial leach. The 30 MMB sale in summer 2011 provided space available to facilitate leaching operations. The objective of this report is to present the results and analyses of remedial leach activity at the SPR following the 2011 sale until mid-January 2013. This report focuses on caverns BH101, BH104, WH105 and WH106. Three of the four hanging strings were damaged resulting in deviations from normal leach patterns; however, the deviations did not affect the immediate geomechanical stability of the caverns. Significant leaching occurred in the toes of the caverns likely decreasing the number of available drawdowns until P/D ratio criteria are met. SANSMIC shows good agreement with sonar data and reasonably predicted the location and size of the enhanced leaching region resulting from string breakage.
4
ACKNOWLEDGEMENTS The authors wish to thank Lisa Eldredge (DM Petroleum Operations) for pertinent information regarding the leaching operations and techniques applicable to this study. The authors also thank Dean Checkai (DM Petroleum Operations) and Thomas Eyermann for a technical review of this report.
5
Table of Contents
1 Executive Summary ............................................................................................................................... 9
2 Introduction ........................................................................................................................................ 11
2.1 Background ................................................................................................................................. 11
2.1.1 Summer 2011 Sale and Drawdown ..................................................................................... 11
2.1.2 Capacity Maintenance Program .......................................................................................... 11
2.1.3 SANSMIC ............................................................................................................................. 12
2.1.4 Ullage .................................................................................................................................. 12
2.2 Objectives.................................................................................................................................... 12
3 Overview of Remedial Leach Activities ............................................................................................... 15
3.1 Overview of Logging Data ........................................................................................................... 18
4 BH101 Daisy Chain .............................................................................................................................. 21
4.1 Timeline ....................................................................................................................................... 21
4.2 Cavern Leach Configuration ........................................................................................................ 23
4.3 String Perforation ........................................................................................................................ 24
4.4 Results ......................................................................................................................................... 26
4.4.1 Profile Comparisons ............................................................................................................ 26
4.4.2 Leach Efficiencies ................................................................................................................ 28
4.5 Conclusions for BH101 ................................................................................................................ 29
5 BH104 Daisy Chain .............................................................................................................................. 31
5.1 Timeline ....................................................................................................................................... 31
5.2 Cavern Leach Configuration ........................................................................................................ 32
5.3 Results ......................................................................................................................................... 34
5.3.1 Profile Comparisons ............................................................................................................ 34
5.3.2 Leach Efficiencies ................................................................................................................ 36
5.4 Conclusions for BH104 ................................................................................................................ 37
6 WH105 Conversion from Sweet to Sour Crude Oil ............................................................................. 39
6.1 Timeline ....................................................................................................................................... 39
6.2 Cavern Leach Configuration ........................................................................................................ 40
6.3 Results ......................................................................................................................................... 41
6.3.1 Profile comparisons ............................................................................................................ 42
6.3.2 Leach Efficiencies ................................................................................................................ 43
6.4 Conclusions for WH105 ............................................................................................................... 44
7 WH106 ................................................................................................................................................ 45
7.1 Timeline ....................................................................................................................................... 45
6
7.2 Cavern Leach Configuration ........................................................................................................ 46
7.3 Timing of String Break During Withdrawal ................................................................................. 47
7.4 Results ......................................................................................................................................... 49
7.4.1 Profile Comparisons ............................................................................................................ 49
7.4.2 Leach Efficiencies ................................................................................................................ 51
7.4.3 Sonar Data with Speed of Sound ........................................................................................ 52
7.5 Conclusions for WH106 ............................................................................................................... 53
8 Conclusions and Recommendations ................................................................................................... 55
9 References .......................................................................................................................................... 57
Appendix A: Detailed Leaching Data ........................................................................................................... 59
7
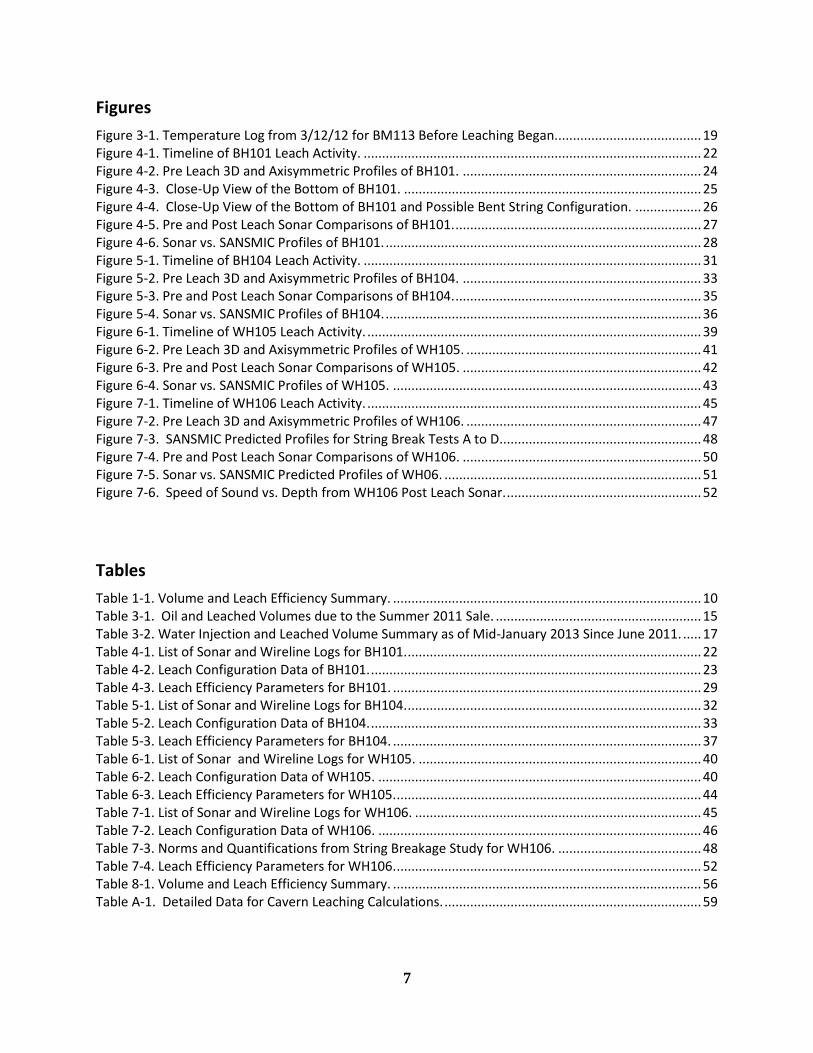
Figures
Figure 3-1. Temperature Log from 3/12/12 for BM113 Before Leaching Began. ....................................... 19 Figure 4-1. Timeline of BH101 Leach Activity. ............................................................................................ 22 Figure 4-2. Pre Leach 3D and Axisymmetric Profiles of BH101. ................................................................. 24 Figure 4-3. Close-Up View of the Bottom of BH101. ................................................................................. 25 Figure 4-4. Close-Up View of the Bottom of BH101 and Possible Bent String Configuration. .................. 26 Figure 4-5. Pre and Post Leach Sonar Comparisons of BH101. ................................................................... 27 Figure 4-6. Sonar vs. SANSMIC Profiles of BH101. ...................................................................................... 28 Figure 5-1. Timeline of BH104 Leach Activity. ............................................................................................ 31 Figure 5-2. Pre Leach 3D and Axisymmetric Profiles of BH104. ................................................................. 33 Figure 5-3. Pre and Post Leach Sonar Comparisons of BH104. ................................................................... 35 Figure 5-4. Sonar vs. SANSMIC Profiles of BH104. ...................................................................................... 36 Figure 6-1. Timeline of WH105 Leach Activity. ........................................................................................... 39 Figure 6-2. Pre Leach 3D and Axisymmetric Profiles of WH105. ................................................................ 41 Figure 6-3. Pre and Post Leach Sonar Comparisons of WH105. ................................................................. 42 Figure 6-4. Sonar vs. SANSMIC Profiles of WH105. .................................................................................... 43 Figure 7-1. Timeline of WH106 Leach Activity. ........................................................................................... 45 Figure 7-2. Pre Leach 3D and Axisymmetric Profiles of WH106. ................................................................ 47 Figure 7-3. SANSMIC Predicted Profiles for String Break Tests A to D....................................................... 48 Figure 7-4. Pre and Post Leach Sonar Comparisons of WH106. ................................................................. 50 Figure 7-5. Sonar vs. SANSMIC Predicted Profiles of WH06. ...................................................................... 51 Figure 7-6. Speed of Sound vs. Depth from WH106 Post Leach Sonar. ..................................................... 52
Tables
Table 1-1. Volume and Leach Efficiency Summary. .................................................................................... 10 Table 3-1. Oil and Leached Volumes due to the Summer 2011 Sale. ........................................................ 15 Table 3-2. Water Injection and Leached Volume Summary as of Mid-January 2013 Since June 2011. ..... 17 Table 4-1. List of Sonar and Wireline Logs for BH101. ................................................................................ 22 Table 4-2. Leach Configuration Data of BH101. .......................................................................................... 23 Table 4-3. Leach Efficiency Parameters for BH101. .................................................................................... 29 Table 5-1. List of Sonar and Wireline Logs for BH104. ................................................................................ 32 Table 5-2. Leach Configuration Data of BH104. .......................................................................................... 33 Table 5-3. Leach Efficiency Parameters for BH104. .................................................................................... 37 Table 6-1. List of Sonar and Wireline Logs for WH105. ............................................................................. 40 Table 6-2. Leach Configuration Data of WH105. ........................................................................................ 40 Table 6-3. Leach Efficiency Parameters for WH105. ................................................................................... 44 Table 7-1. List of Sonar and Wireline Logs for WH106. .............................................................................. 45 Table 7-2. Leach Configuration Data of WH106. ........................................................................................ 46 Table 7-3. Norms and Quantifications from String Breakage Study for WH106. ....................................... 48 Table 7-4. Leach Efficiency Parameters for WH106. ................................................................................... 52 Table 8-1. Volume and Leach Efficiency Summary. .................................................................................... 56 Table A-1. Detailed Data for Cavern Leaching Calculations. ...................................................................... 59
8
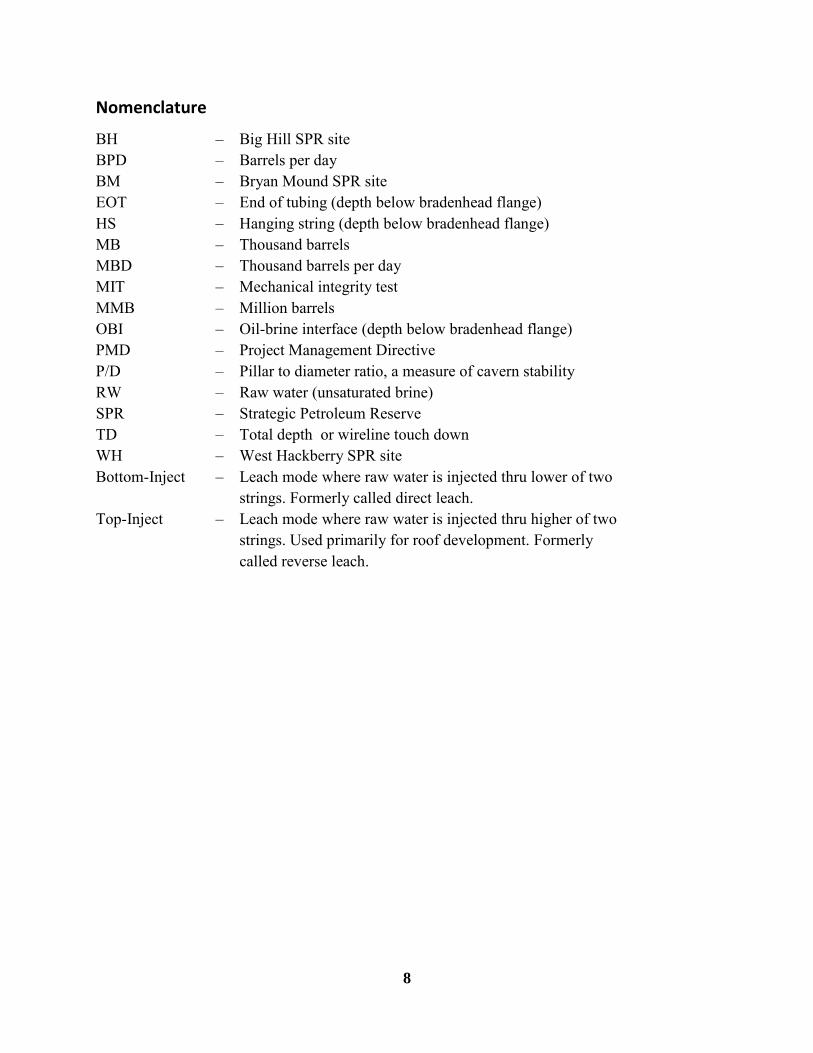
Nomenclature
BH – Big Hill SPR site BPD – Barrels per day BM – Bryan Mound SPR site EOT – End of tubing (depth below bradenhead flange) HS – Hanging string (depth below bradenhead flange) MB – Thousand barrels
MBD – Thousand barrels per day MIT – Mechanical integrity test MMB – Million barrels
OBI – Oil-brine interface (depth below bradenhead flange) PMD – Project Management Directive P/D – Pillar to diameter ratio, a measure of cavern stability RW – Raw water (unsaturated brine) SPR – Strategic Petroleum Reserve TD – Total depth or wireline touch down WH – West Hackberry SPR site Bottom-Inject – Leach mode where raw water is injected thru lower of two
strings. Formerly called direct leach. Top-Inject – Leach mode where raw water is injected thru higher of two
strings. Used primarily for roof development. Formerly called reverse leach.
9
1 Executive Summary
The U.S. Strategic Petroleum Reserve (SPR) stores over 700 MMB of crude oil in 63 storage caverns located in four large salt domes Big Hill (BH), Bryan Mound (BM), West Hackberry (WH) and Bayou Choctaw (BC). The domes are scattered across the Gulf coast between Houston, Texas and New Orleans, Louisiana. Domal salt (primarily halite) under large geologic stresses exhibits creep behavior that causes storage caverns to shrink over time, reducing their storage capacity. In order to maintain oil storage capacity and a small amount of excess working space (ullage), caverns must undergo periodic and controlled leaching called remedial leach, or else new caverns must be developed. Remedial leach activities on existing caverns at the SPR since mid-2011 are the subject of this report.
The summer 2011 drawdown and sale of approximately 30 MMB of sweet crude oil from the US Strategic Petroleum Reserve (SPR), distributed among BH (5.6 MMB), BM (13.2 MMB) and WH (12.0 MMB) provided corresponding working space, or ullage, that could be utilized for expanding the storage capacity at the SPR. Following the 30 MMB sale, the SPR established a capacity maintenance program. This program seeks to capitalize on the available cavern volume to create additional ullage immediately in order to ensure adequate storage space to offset creep loss at the SPR.
The objective of this report is to present results of the analyses of the remedial leach efforts at the SPR since the sale and drawdown in summer 2011 to mid-January 2013. Detailed analyses focus on the remedial leaching activities for BH101, BH104, WH105 and WH106. BM113 is addressed in detail in a separate report (Rudeen, Weber et al. 2013).
Perforated and severed hanging strings gave rise to small but expected deviations from normal leach patterns for three of the four remedial leached caverns discussed in this report - BH101, WH105 and WH106. BH104 did not experience a string break. The deviations from expected leach patterns were within normal leach variability and did not affect the geomechanical stability of the caverns. All leaching was performed as withdrawal leaches so the string breaks and perforation caused a double taper with a small sloping ledge near the level of the break. Largest radius increases were near the injection depths and radius-change decreased up to the ledge then increased, then tapered to zero at the highest oil-brine interface (OBI) position. The string breaks resulted in more leaching above the ullage reference depth and higher ullage leach efficiencies than would be expected from a normal withdrawal without a string break. Salt-block falls, which may have caused the string breaks, would also enhance this behavior. However, this would also raise the floor higher than would be normally expected and this may have contributed to the string damage and subsequent string perforations for BH101. Even with the string breaks, which shifted leaching upward in the cavern depths, significant leaching occurred in the toes of the cavern, which likely decreased the number of available drawdowns until the ratio of pillar-to-diameter (P/D) instability criteria are met.
10
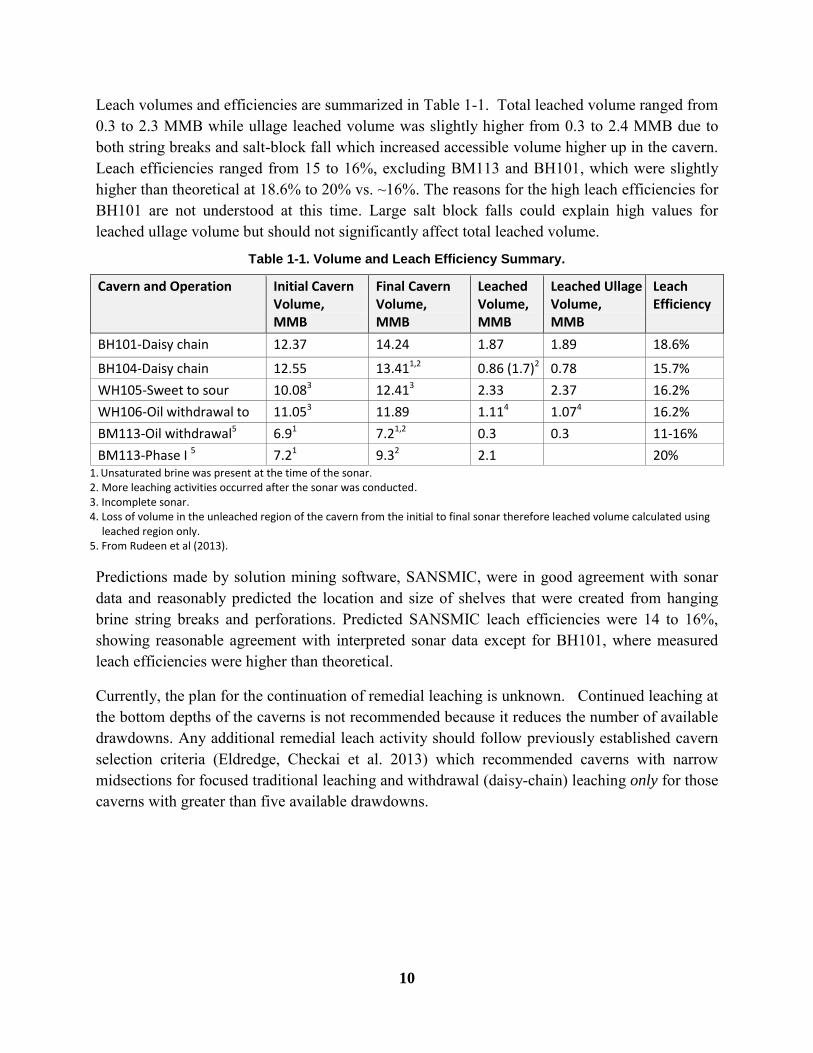
Leach volumes and efficiencies are summarized in Table 1-1. Total leached volume ranged from 0.3 to 2.3 MMB while ullage leached volume was slightly higher from 0.3 to 2.4 MMB due to both string breaks and salt-block fall which increased accessible volume higher up in the cavern. Leach efficiencies ranged from 15 to 16%, excluding BM113 and BH101, which were slightly higher than theoretical at 18.6% to 20% vs. ~16%. The reasons for the high leach efficiencies for BH101 are not understood at this time. Large salt block falls could explain high values for leached ullage volume but should not significantly affect total leached volume.
Table 1-1. Volume and Leach Efficiency Summary.
Cavern and Operation Initial Cavern Volume, MMB MMB
Final Cavern Volume, MMB
Leached Volume, MMB
Leached Ullage Volume, MMB
Leach Efficiency
BH101-Daisy chain 12.37 14.24 1.87 1.89 18.6%
BH104-Daisy chain 12.55 13.411,2 0.86 (1.7)2 0.78 15.7%
WH105-Sweet to sour conversion
10.083 12.413 2.33 2.37 16.2%
WH106-Oil withdrawal to WH106
11.053 11.89 1.114 1.074 16.2%
BM113-Oil withdrawal5 6.91 7.21,2 0.3 0.3 11-16%
BM113-Phase I 5 7.21 9.32 2.1 20% 1.
Unsaturated brine was present at the time of the sonar.
2. More leaching activities occurred after the sonar was conducted. 3. Incomplete sonar. 4. Loss of volume in the unleached region of the cavern from the initial to final sonar therefore leached volume calculated using
leached region only. 5. From Rudeen et al (2013).
Predictions made by solution mining software, SANSMIC, were in good agreement with sonar data and reasonably predicted the location and size of shelves that were created from hanging brine string breaks and perforations. Predicted SANSMIC leach efficiencies were 14 to 16%, showing reasonable agreement with interpreted sonar data except for BH101, where measured leach efficiencies were higher than theoretical.
Currently, the plan for the continuation of remedial leaching is unknown. Continued leaching at the bottom depths of the caverns is not recommended because it reduces the number of available drawdowns. Any additional remedial leach activity should follow previously established cavern selection criteria (Eldredge, Checkai et al. 2013) which recommended caverns with narrow midsections for focused traditional leaching and withdrawal (daisy-chain) leaching only for those caverns with greater than five available drawdowns.
11
2 Introduction
The U.S. Strategic Petroleum Reserve (SPR) stores over 700 MMB of crude oil in 63 storage caverns located in four large salt domes Big Hill (BH), Bryan Mound (BM), West Hackberry (WH) and Bayou Choctaw (BC). The domes are located along the Gulf coast between Houston, Texas and New Orleans, Louisiana. Domal salt (primarily halite) has proven to be an effective geologic storage medium for large volumes of petroleum products. One of the geomechanical properties of domal salt under large geologic stresses found deep underground is its tendency to flow or creep, albeit very slowly. This creep behavior causes storage caverns to shrink over time, reducing their storage capacity. In order to maintain oil storage capacity and a small amount of excess working space (ullage) over periods of decades, caverns must undergo periodic and controlled leaching or else new caverns must be developed. At the SPR, controlled leaching of storage caverns to maintain storage capacity is called remedial leach. Remedial leach activities at the SPR since mid-2011 are the subject of this report.
2.1 Background
2.1.1 Summer 2011 Sale and Drawdown
The summer 2011 drawdown resulted in removal of 30.8 MMB of sweet crude oil from the US Strategic Petroleum Reserve (SPR), distributed among BH (5.6 MMB), BM (13.2 MMB) and WH (12.0 MMB). The sale provided corresponding working space, or ullage, that could be utilized for expanding the storage capacity at SPR. The working space is required in order to focus leaching on the slender mid-sections of selected caverns and to expose the bottom half of a cavern for effective daisy-chain, withdrawal leaching. Repeated small drawdowns and resulting small leaches of the bottom sections of caverns can have a deleterious effect on cavern integrity. Spreading or focusing the leaching to the mid-section of a cavern reduces the problem.
2.1.2 Capacity Maintenance Program
Following the 30 MMB sale, the SPR established a Capacity Maintenance Program, as outlined in a November 2011 Project Management Directive (Johnson 2011). This program sought to capitalize on the available cavern volume to create additional ullage immediately in order to ensure adequate storage space for creep and future workovers at the SPR. Key objectives of this Project Management Directive (PMD) included:
Maximizing cavern capacity creation through displacement or withdrawal.
Selective leaching with adequate cavern volumes so as to not misshape caverns or
adversely impact cavern integrity.
Leach unfinished caverns BM113 and BM114 to final configuration volumes.
Utilize 24 hr/7 days per week site operations.
12
Sandia National Laboratories, geotechnical advisor to the SPR, was tasked with developing technical guidelines for maintaining cavern integrity in the ongoing remedial leach program (Lord, Ehgartner et al. 2011). DM Petroleum Operations, the maintenance and operations contractor to the SPR, was tasked with selecting caverns for remedial leach, based on the optimization of these guidelines, within the constraints of operational feasibility.
Leaching data obtained from summer 2011 operations provided relevant and timely field observations used to create expectations for how SPR caverns respond to remedial leach and also to provide modeling validation data.
2.1.3 SANSMIC
SANSMIC is a salt solution mining (leaching) code developed at Sandia in the early 1980s (Russo 1981) . It is used routinely within the SPR to analyze the effects of oil movements on cavern geometry and to plan full cavern development and ullage development using a technique called remedial leach. The code uses an axisymmetric representation of the cavern geometry to predict cavern shape and volume as a function of prescribed flow of crude oil, water, brine, and hanging string configurations used for fluid injection and production. Of particular interest to the developers was the ability to predict shape changes during concurrent injection of fresh water and oil fill and when oil is being withdrawn by fresh water displacement.
2.1.4 Ullage
The analyses provided below present leaching summary data in terms of total leached volume and leached ullage volume where ullage is excess cavern volume useable for oil storage. It is calculated as the available volume above a reference depth. During normal operations, the reference depth is 10 ft above the depth of the end of the brine string. For the analyses below the ullage reference depth was chosen as 30 ft above an estimated bottom of the cavern at the end of leaching. (Note that a typical brine string location is 20 ft above the bottom of the cavern). Leached ullage volume can be less than, greater than, or equal to total leached volume depending on the volume of insolubles deposited on the cavern floor and the volume leached below the ullage reference depth. However, any differences should be small.
2.2 Objectives
The objective of this report is to present results of the analyses of the remedial leach efforts at the SPR since the 30 MMB sale and drawdown in the summer of 2011 to mid-January 2013. Detailed analyses, presented in subsequent sections, focus on the following remedial leaching activities:
BH101 and BH104 daisy chain leach. Oil withdrawal at WH105 in preparation for its conversion from storage of sweet crude to
sour crude. Oil withdrawal at WH106 used to partially fill WH105 with sweet crude.

13
In addition to the above caverns, BM113 is being leached to completion as a significant part of the Capacity Maintenance Program. Analyses of the initial stages of the BM113 leach-to-completion is thoroughly documented in Rudeen, Weber et al. (2013) which addresses both the oil withdrawal to position the oil-brine interface (OBI) and the planned stage 1 top-leach. Thus, only a summary will be provided in this report.

14
Page intentionally left blank.
15
3 Overview of Remedial Leach Activities
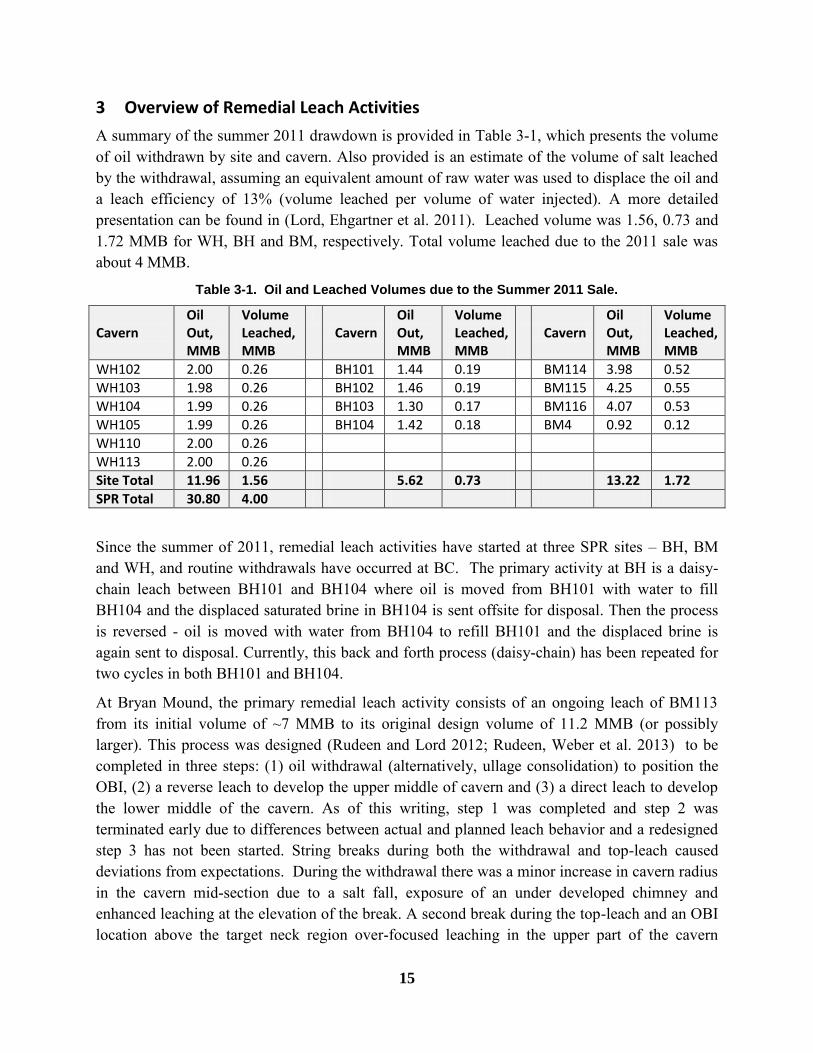
A summary of the summer 2011 drawdown is provided in Table 3-1, which presents the volume of oil withdrawn by site and cavern. Also provided is an estimate of the volume of salt leached by the withdrawal, assuming an equivalent amount of raw water was used to displace the oil and a leach efficiency of 13% (volume leached per volume of water injected). A more detailed presentation can be found in (Lord, Ehgartner et al. 2011). Leached volume was 1.56, 0.73 and 1.72 MMB for WH, BH and BM, respectively. Total volume leached due to the 2011 sale was about 4 MMB.
Table 3-1. Oil and Leached Volumes due to the Summer 2011 Sale.
Cavern Oil Out, MMB
Volume Leached, MMB
Cavern
Oil Out, MMB
Volume Leached, MMB
Cavern
Oil Out, MMB
Volume Leached, MMB
WH102 2.00 0.26 BH101 1.44 0.19 BM114 3.98 0.52
WH103 1.98 0.26 BH102 1.46 0.19 BM115 4.25 0.55
WH104 1.99 0.26 BH103 1.30 0.17 BM116 4.07 0.53
WH105 1.99 0.26 BH104 1.42 0.18 BM4 0.92 0.12
WH110 2.00 0.26
WH113 2.00 0.26
Site Total 11.96 1.56 5.62 0.73 13.22 1.72
SPR Total 30.80 4.00
Since the summer of 2011, remedial leach activities have started at three SPR sites – BH, BM and WH, and routine withdrawals have occurred at BC. The primary activity at BH is a daisy-chain leach between BH101 and BH104 where oil is moved from BH101 with water to fill BH104 and the displaced saturated brine in BH104 is sent offsite for disposal. Then the process is reversed - oil is moved with water from BH104 to refill BH101 and the displaced brine is again sent to disposal. Currently, this back and forth process (daisy-chain) has been repeated for two cycles in both BH101 and BH104.
At Bryan Mound, the primary remedial leach activity consists of an ongoing leach of BM113 from its initial volume of ~7 MMB to its original design volume of 11.2 MMB (or possibly larger). This process was designed (Rudeen and Lord 2012; Rudeen, Weber et al. 2013) to be completed in three steps: (1) oil withdrawal (alternatively, ullage consolidation) to position the OBI, (2) a reverse leach to develop the upper middle of cavern and (3) a direct leach to develop the lower middle of the cavern. As of this writing, step 1 was completed and step 2 was terminated early due to differences between actual and planned leach behavior and a redesigned step 3 has not been started. String breaks during both the withdrawal and top-leach caused deviations from expectations. During the withdrawal there was a minor increase in cavern radius in the cavern mid-section due to a salt fall, exposure of an under developed chimney and enhanced leaching at the elevation of the break. A second break during the top-leach and an OBI location above the target neck region over-focused leaching in the upper part of the cavern
16
causing an earlier than planned termination of the top-leach. Preliminary modified plans indicate that an expanded stage 2 bottom-leach can still be used to leach the cavern to its target volume of 11.2 MMB. Neither of the deviations from expectations appears to have degraded geomechanical stability of the cavern. A detailed analysis of BM113 is presented in Rudeen et al. (2013).
At West Hackberry, WH105 has been emptied by displacing oil with fresh water in order to temporarily convert the cavern from storage of sweet to sour crude. It was partially refilled with oil from WH106 then emptied a second time and then filled with Bakken crude. WH105 has two necks and a thicker mid-section, thus the complete withdrawal leached the toe and lower neck region and the second smaller withdrawal leached the upper neck region due to a string break near 3700 ft. The cavern is currently being slowly refilled with crude oil. Since WH105 had been filled with oil from WH106 and the oil was displaced with water, a significant amount of leaching also occurred in WH106.
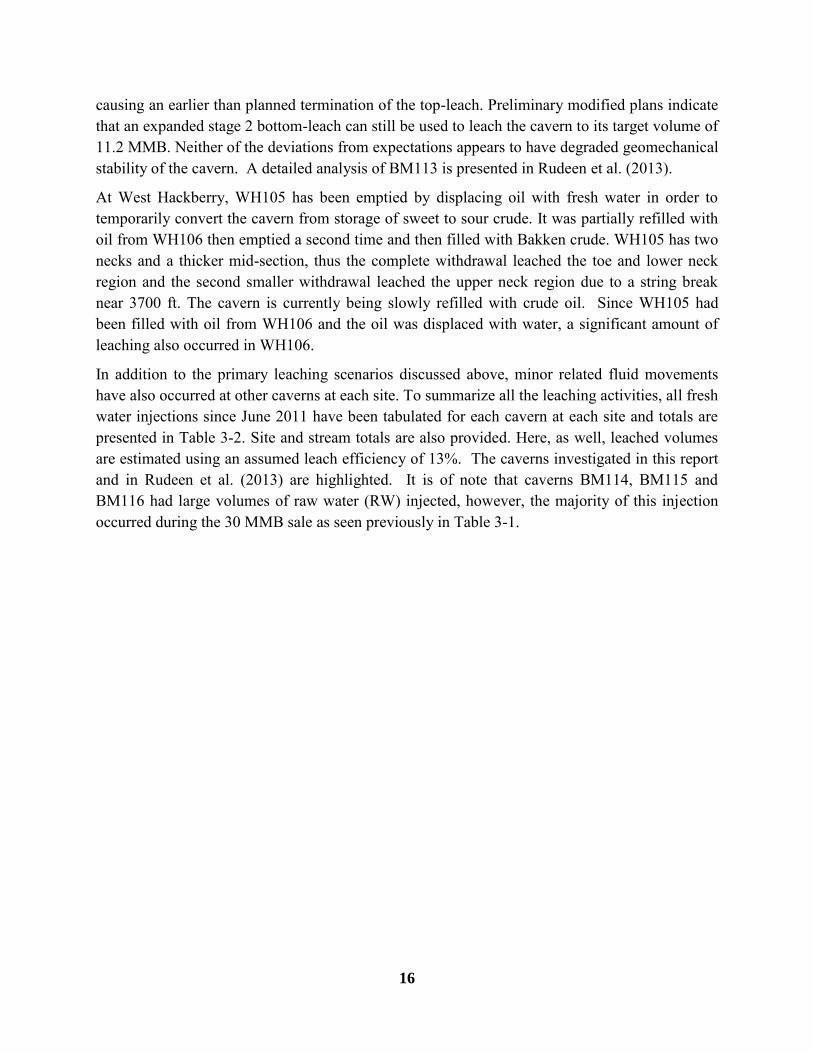
In addition to the primary leaching scenarios discussed above, minor related fluid movements have also occurred at other caverns at each site. To summarize all the leaching activities, all fresh water injections since June 2011 have been tabulated for each cavern at each site and totals are presented in Table 3-2. Site and stream totals are also provided. Here, as well, leached volumes are estimated using an assumed leach efficiency of 13%. The caverns investigated in this report and in Rudeen et al. (2013) are highlighted. It is of note that caverns BM114, BM115 and BM116 had large volumes of raw water (RW) injected, however, the majority of this injection occurred during the 30 MMB sale as seen previously in Table 3-1.
17
Table 3-2. Water Injection and Leached Volume Summary as of Mid-January 2013 Since June 2011.
BM
Injected Water Volume, BBL
Estimated Volume Leached
1,
BBL
WH
Injected Water Volume, BBL
Estimated Volume Leached
1,
BBL
BH
Injected Water Volume, BBL
Estimated Volume Leached
1,
BBL
BC
Injected Water Volume, BBL
Estimated Volume Leached
1,
BBL
101/SR 0 0
101/SW 0 0 101/SW2 11,543,880 1,500,704 15/SR 0 0
102/SR 571,987 74,358
102/SW2 1,989,453 258,629 102/SW
2 1,544,625 200,801 17/SR 0 0
103/SR 740 96
103/SW2 2,002,232 260,290 103/SW
2 1,418,967 184,466 18/SW 1,321,980 171,857.4
104/SR 1,247,879 162,224
104/SW2 1,996,231 259,510 104/SW
2 12,218,463 1,588,400 19/SR 1,714 222.82
105/SR 49,942 6,492
105/SW2,3
13,206,692 1,716,870 105/SW 9,108 1,184 20/SW 0 0
106/SW 30,671 3,987
106/SR 6,785,204 882,077 106/SR 10,975 1,427 101/SR 26,318 3421.34
107/SR 4,523 588
107/SW 0 0 107/SR 54,428 7,076 102/SW 0 0
108/SR 1,326,662 172,466
108/SW 0 0 108/SR 30,992 4,029
109/SR 50,382 6,550
109/SR 0 0 109/SR 0 0
110/SR 1,109,486 144,233
110/SW2 1,958,417 254,594 110/SR 355,887 46,265
111/SR 10,586 1,376
111/SR 1,490,022 193,703 111/SR 37,472 4,871
112/SR 30,634 3,982
112/SR 0 0 112/SR 0 0
113/SW 14,212,172 1,847,582
113/SW2 1,998,546 259,811 113/SR 14,520 1,888
114/SW2 7,500,987 975,128
114/SR 0 0 114/SW 10,665 1,386
115/SW2 4,187,895 544,426
115/SR 0 0
116/SW2 5,027,764 653,609
116/SW 0 0
1/SR 116,397 15,132
117/SR 0 0
2/SW 95,888 12,465
6/SR 1,400 182
4/SW2 918,659 119,426
7/SW 0 0
5/SR 2,674 348
8/SR 0 0
9/SR 0 0
11/SR 0 0
Totals 36,103,491 4,693,454
31,426,797 4,085,484 27,081,822 3,520,637 1,350,012 175,502
Grand
Total 95,962,122 12,475,076
1. Leach volume estimated assuming 13% leach efficiency.
2. Caverns used 30 MMB sale in summer 2011.
3. WH105 is being switched from sweet to sour oil storage
18
3.1 Overview of Logging Data
During remedial leach activities wireline log surveys are performed on a regular basis to monitor leaching behavior. Wireline log surveys include temperature, calibrated fluid density, un-calibrated density and interface surveys. Interface depths are determined through information obtained from either temperature or density surveys. Therefore, for each density or temperature log there should be an associated interface. However, this is not the case if the purpose of the density survey was a Mechanical Integrity Test (MIT) in which case the test generally does not enter the cavern and does not reach the OBI.
Interface depths are operationally important during leaching, drawdown, and refill for estimating interface proximity to critical cavern features in order to avoid getting oil in the brine string, leaching of the roof and to control the leaching region. Temperature and density curves are of value for determining how a cavern is behaving during leach. These curves can give an indication of how the injected raw water is interacting with the existing brine and whether these fluids are mixing or whether distinct layers are forming. The behavior of the fluids has a strong influence on how the cavern is leaching. A well-mixed cavern is likely to leach more evenly while a cavern that experiences layering or plume behavior is likely to experience more focused leaching in a specific region. Additionally, the rate of leaching is influenced by temperature and salinity. Having current information regarding oil and brine temperature and salinity is useful for understanding expectations for leaching.
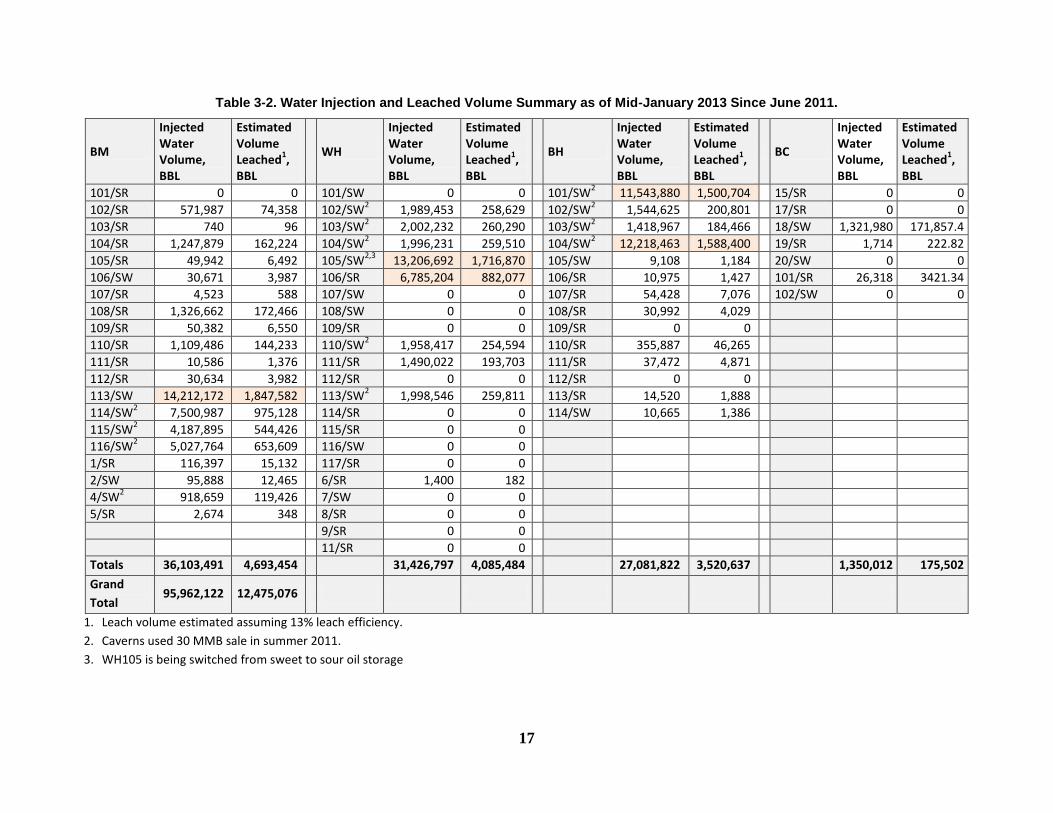
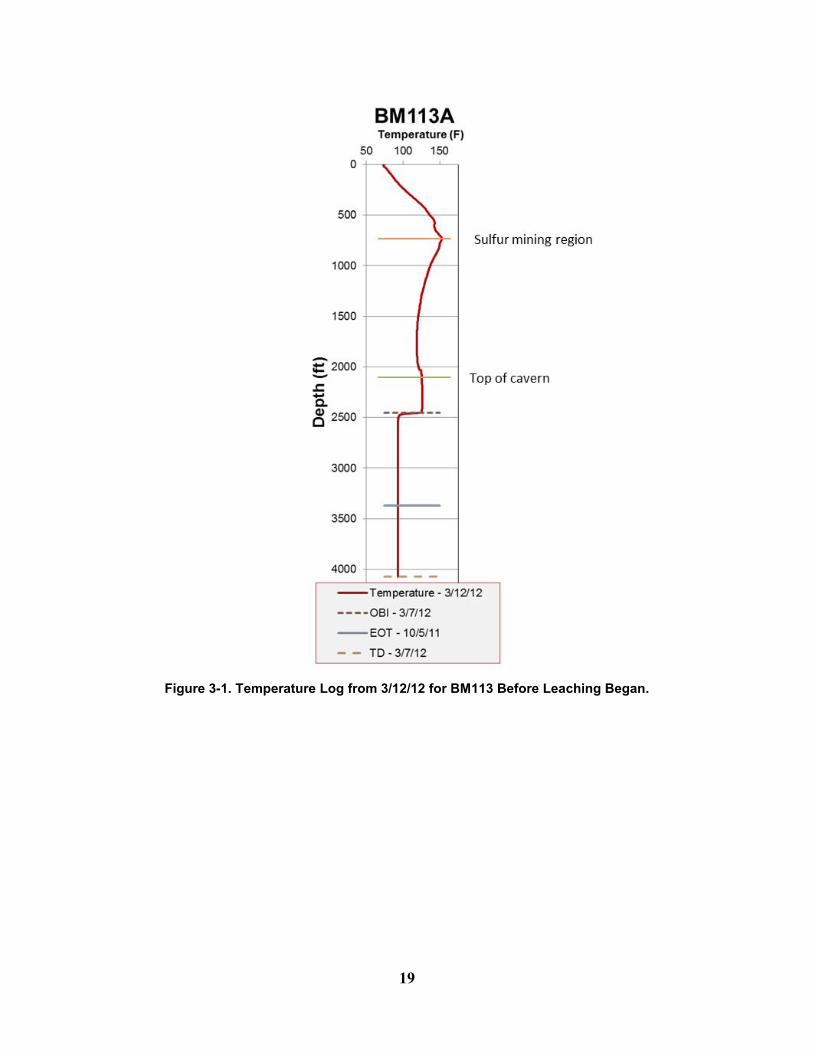
As an example, a temperature log used for locating the OBI in BM113 is shown in Figure 3-1. The depth of the OBI as well as the end of tubing (EOT) and total depth logged (TD) depths are annotated on the figure. An observable drop in temperature occurs at the OBI, since incoming raw water is usually around 80o F and has not had time to equilibrate with host salt. The top of the cavern is at a depth of approximately 2000 ft. The region above 2000 ft shows an atypical non-linear temperature gradient because of sulfur mining using steam at the Bryan Mound dome in the early 1900’s.
A table of relevant logs is provided in subsequent sections for each remedial leach cavern analyzed for this report.
19
Figure 3-1. Temperature Log from 3/12/12 for BM113 Before Leaching Began.
20
Page intentionally left blank.
21
4 BH101 Daisy Chain
BH101 and BH104 underwent serial withdrawals and oil refills. Oil was moved from BH101 with water injection to fill BH104 and the displaced saturated brine was disposed of offsite. Then the process was reversed - oil was moved with water from BH104 to refill BH101. As of this writing (data collection through January 2013), this back and forth process has been repeated for two leach-fill cycles. The term “daisy chain” is used to describe this linking of caverns in a raw water leaching and oil refill cycle. It is conceivable that this linking would not need to be relegated to the case of two caverns connected but rather could be extended to multiple caverns. Raw water would be injected into the first cavern resulting in oil displacement which is moved to a secondary cavern then raw water would be injected into the secondary cavern with oil displaced to a tertiary cavern and so on. This section summarizes the BH101 portion of the daisy chain leach between BH101 and BH104 from November of 2011 until January 2013.
4.1 Timeline
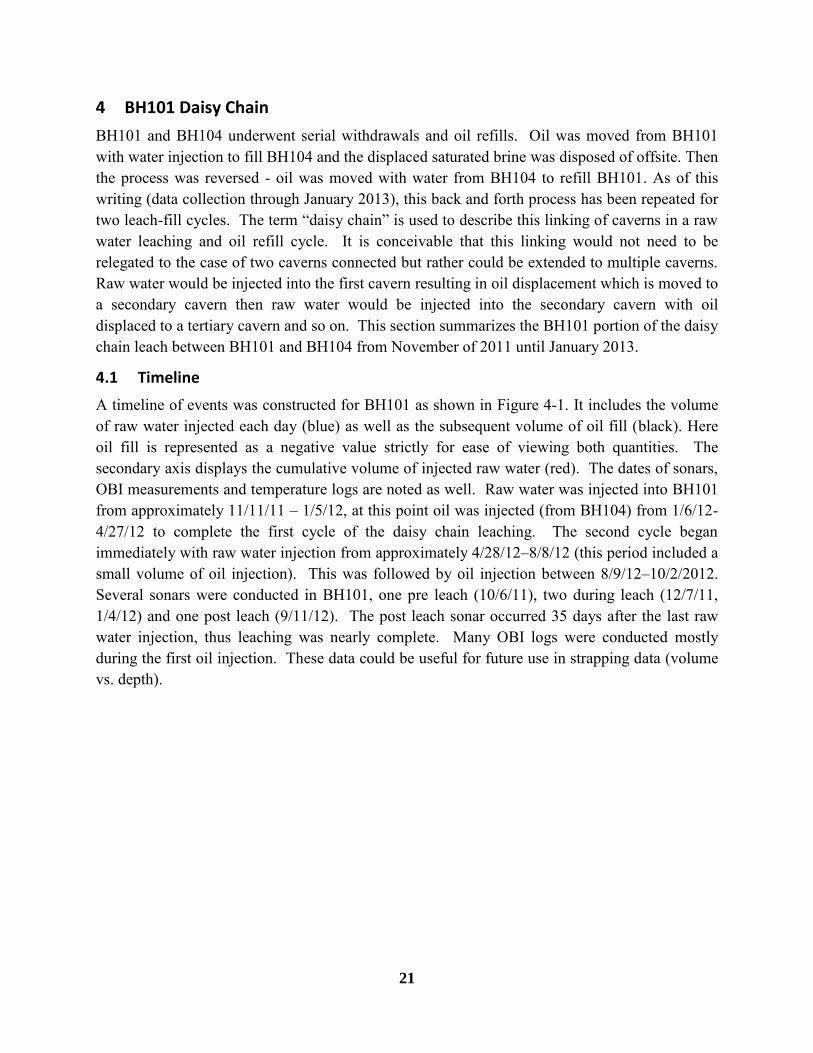
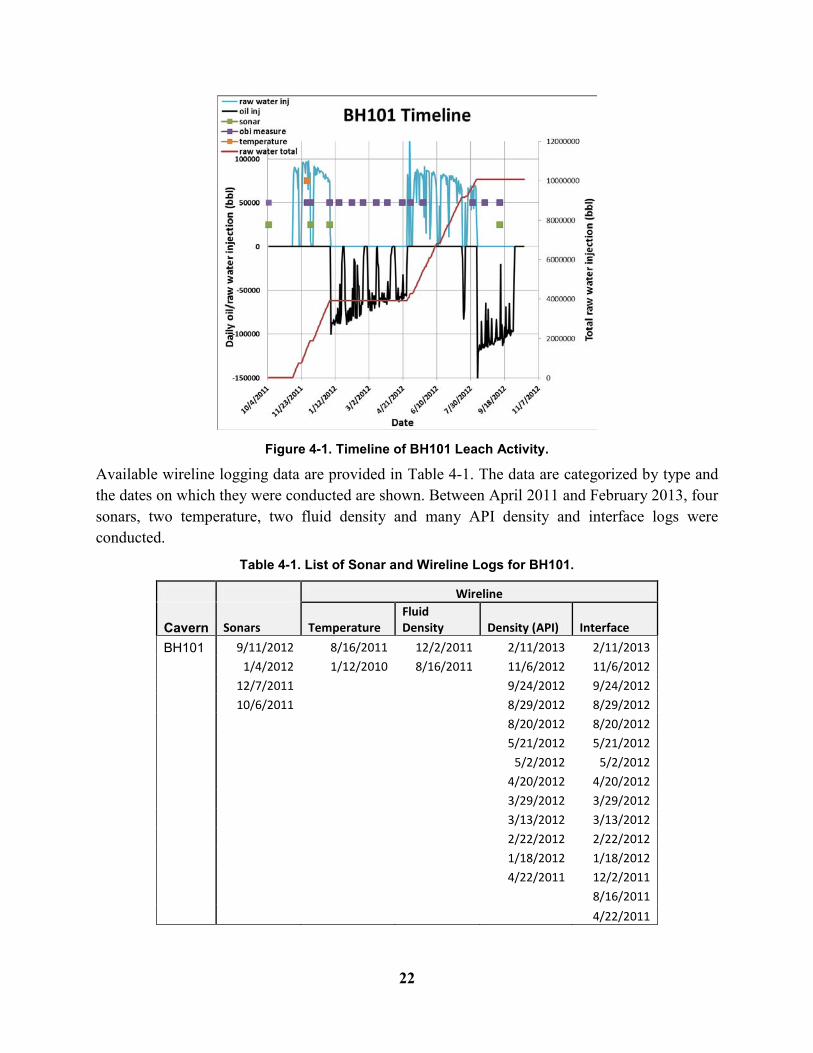
A timeline of events was constructed for BH101 as shown in Figure 4-1. It includes the volume of raw water injected each day (blue) as well as the subsequent volume of oil fill (black). Here oil fill is represented as a negative value strictly for ease of viewing both quantities. The secondary axis displays the cumulative volume of injected raw water (red). The dates of sonars, OBI measurements and temperature logs are noted as well. Raw water was injected into BH101 from approximately 11/11/11 – 1/5/12, at this point oil was injected (from BH104) from 1/6/12-4/27/12 to complete the first cycle of the daisy chain leaching. The second cycle began immediately with raw water injection from approximately 4/28/12–8/8/12 (this period included a small volume of oil injection). This was followed by oil injection between 8/9/12–10/2/2012. Several sonars were conducted in BH101, one pre leach (10/6/11), two during leach (12/7/11, 1/4/12) and one post leach (9/11/12). The post leach sonar occurred 35 days after the last raw water injection, thus leaching was nearly complete. Many OBI logs were conducted mostly during the first oil injection. These data could be useful for future use in strapping data (volume vs. depth).
22
Figure 4-1. Timeline of BH101 Leach Activity.
Available wireline logging data are provided in Table 4-1. The data are categorized by type and the dates on which they were conducted are shown. Between April 2011 and February 2013, four sonars, two temperature, two fluid density and many API density and interface logs were conducted.
Table 4-1. List of Sonar and Wireline Logs for BH101.
Wireline
Cavern Sonars Temperature Fluid Density Density (API) Interface
BH101 9/11/2012 8/16/2011 12/2/2011 2/11/2013 2/11/2013
1/4/2012 1/12/2010 8/16/2011 11/6/2012 11/6/2012
12/7/2011
9/24/2012 9/24/2012
10/6/2011
8/29/2012 8/29/2012
8/20/2012 8/20/2012
5/21/2012 5/21/2012
5/2/2012 5/2/2012
4/20/2012 4/20/2012
3/29/2012 3/29/2012
3/13/2012 3/13/2012
2/22/2012 2/22/2012
1/18/2012 1/18/2012
4/22/2011 12/2/2011
8/16/2011
4/22/2011
23
4.2 Cavern Leach Configuration
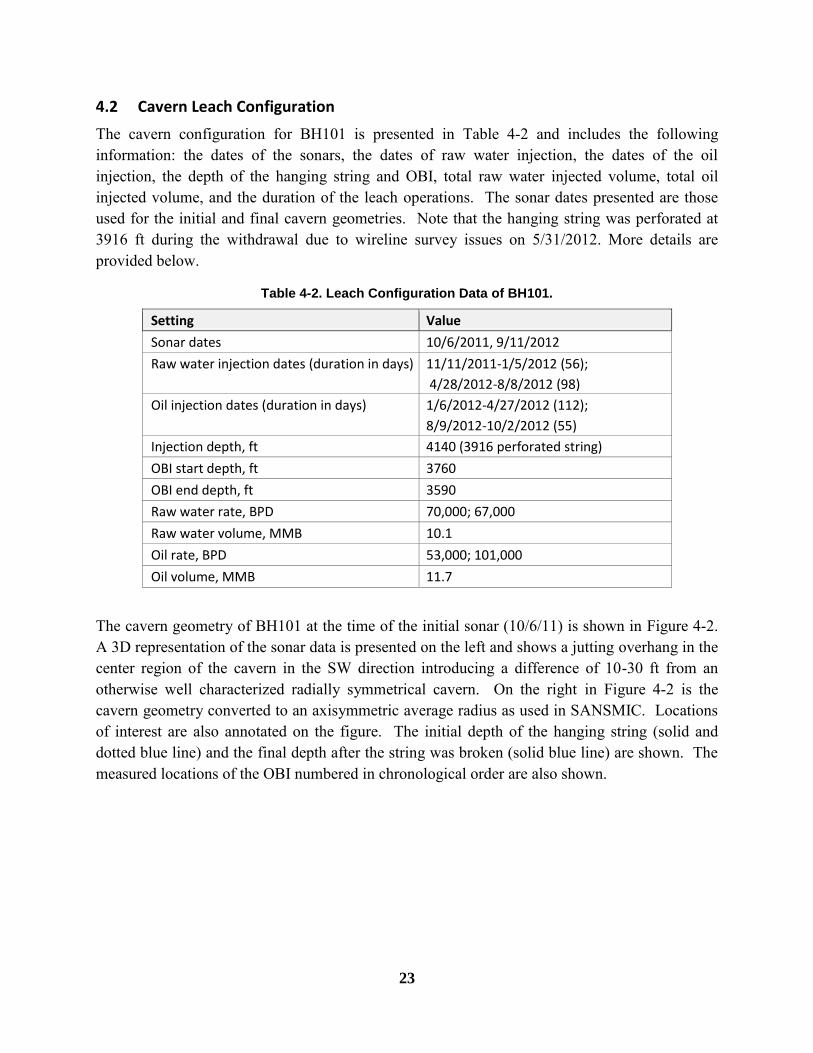
The cavern configuration for BH101 is presented in Table 4-2 and includes the following information: the dates of the sonars, the dates of raw water injection, the dates of the oil injection, the depth of the hanging string and OBI, total raw water injected volume, total oil injected volume, and the duration of the leach operations. The sonar dates presented are those used for the initial and final cavern geometries. Note that the hanging string was perforated at 3916 ft during the withdrawal due to wireline survey issues on 5/31/2012. More details are provided below.
Table 4-2. Leach Configuration Data of BH101.
Setting Value
Sonar dates 10/6/2011, 9/11/2012
Raw water injection dates (duration in days) 11/11/2011-1/5/2012 (56);
4/28/2012-8/8/2012 (98)
Oil injection dates (duration in days) 1/6/2012-4/27/2012 (112);
8/9/2012-10/2/2012 (55)
Injection depth, ft 4140 (3916 perforated string)
OBI start depth, ft 3760
OBI end depth, ft 3590
Raw water rate, BPD 70,000; 67,000
Raw water volume, MMB 10.1
Oil rate, BPD 53,000; 101,000
Oil volume, MMB 11.7
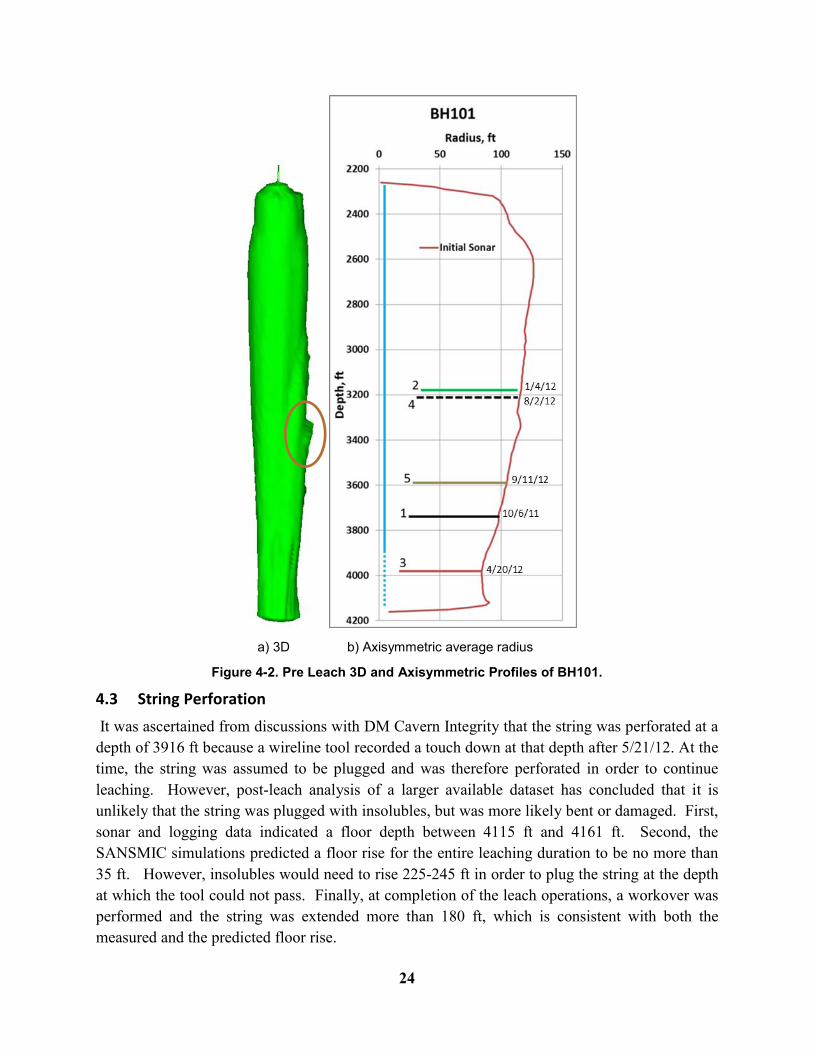
The cavern geometry of BH101 at the time of the initial sonar (10/6/11) is shown in Figure 4-2. A 3D representation of the sonar data is presented on the left and shows a jutting overhang in the center region of the cavern in the SW direction introducing a difference of 10-30 ft from an otherwise well characterized radially symmetrical cavern. On the right in Figure 4-2 is the cavern geometry converted to an axisymmetric average radius as used in SANSMIC. Locations of interest are also annotated on the figure. The initial depth of the hanging string (solid and dotted blue line) and the final depth after the string was broken (solid blue line) are shown. The measured locations of the OBI numbered in chronological order are also shown.
24
a) 3D b) Axisymmetric average radius
Figure 4-2. Pre Leach 3D and Axisymmetric Profiles of BH101.
4.3 String Perforation
It was ascertained from discussions with DM Cavern Integrity that the string was perforated at a depth of 3916 ft because a wireline tool recorded a touch down at that depth after 5/21/12. At the time, the string was assumed to be plugged and was therefore perforated in order to continue leaching. However, post-leach analysis of a larger available dataset has concluded that it is unlikely that the string was plugged with insolubles, but was more likely bent or damaged. First, sonar and logging data indicated a floor depth between 4115 ft and 4161 ft. Second, the SANSMIC simulations predicted a floor rise for the entire leaching duration to be no more than 35 ft. However, insolubles would need to rise 225-245 ft in order to plug the string at the depth at which the tool could not pass. Finally, at completion of the leach operations, a workover was performed and the string was extended more than 180 ft, which is consistent with both the measured and the predicted floor rise.
25
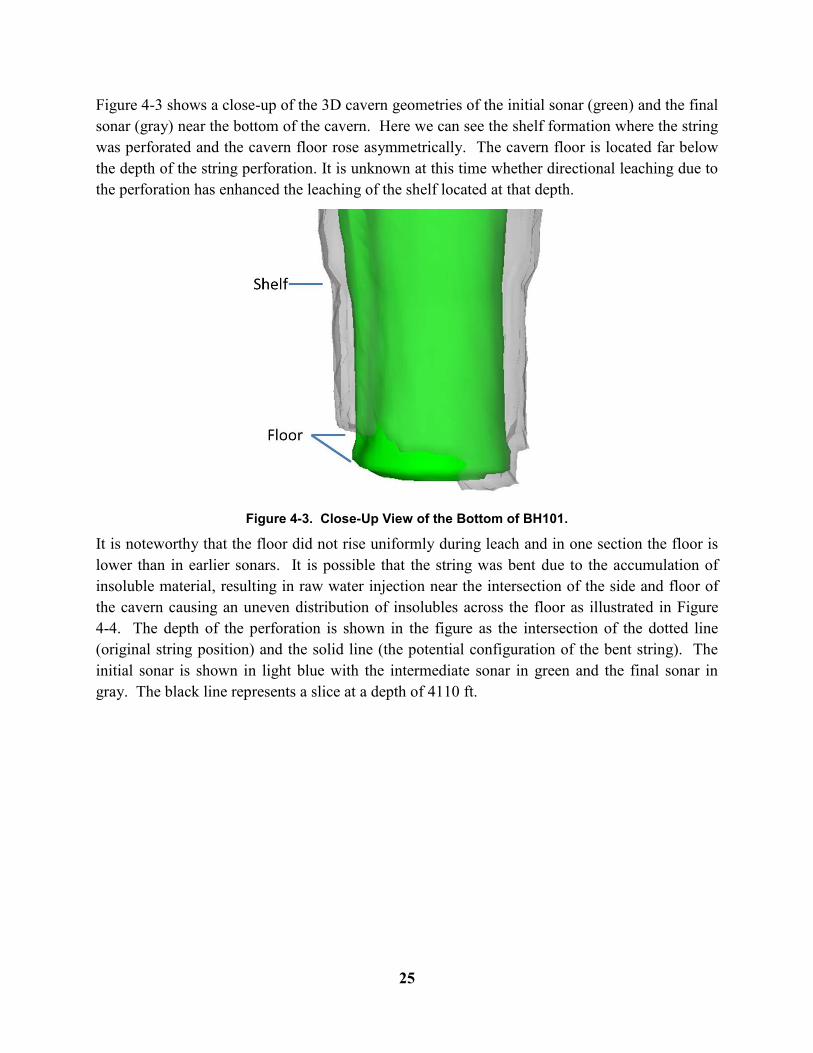
Figure 4-3 shows a close-up of the 3D cavern geometries of the initial sonar (green) and the final sonar (gray) near the bottom of the cavern. Here we can see the shelf formation where the string was perforated and the cavern floor rose asymmetrically. The cavern floor is located far below the depth of the string perforation. It is unknown at this time whether directional leaching due to the perforation has enhanced the leaching of the shelf located at that depth.
Figure 4-3. Close-Up View of the Bottom of BH101.
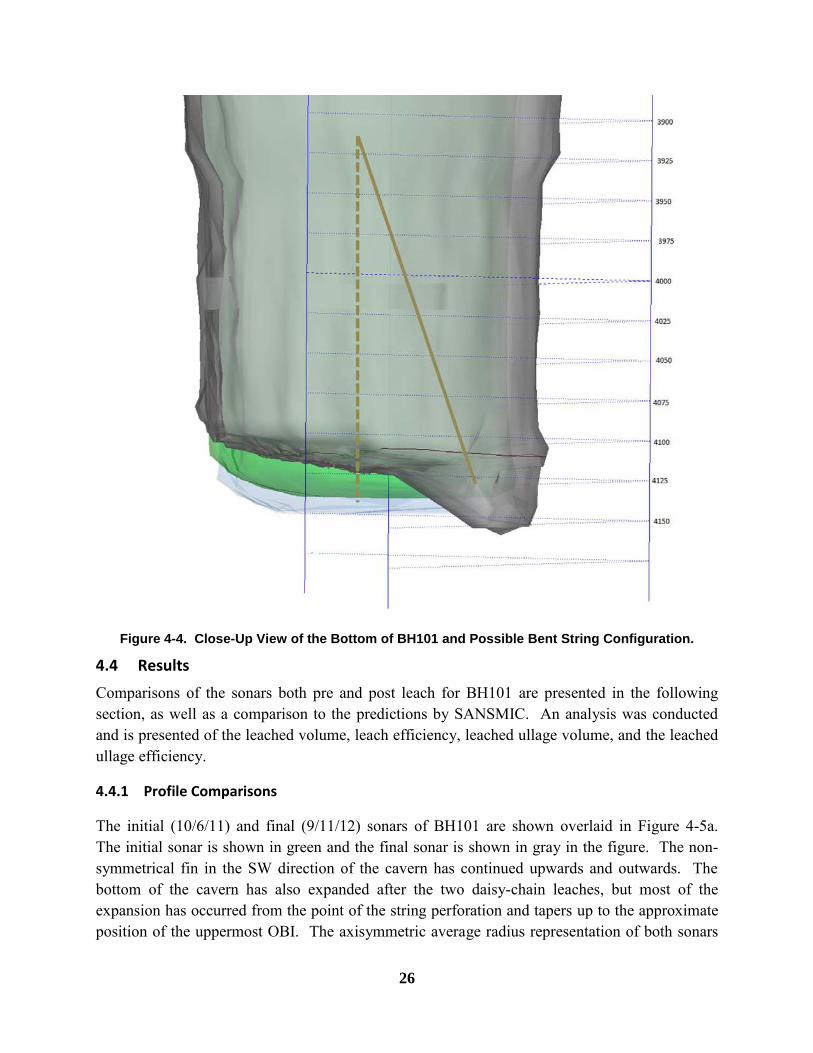
It is noteworthy that the floor did not rise uniformly during leach and in one section the floor is lower than in earlier sonars. It is possible that the string was bent due to the accumulation of insoluble material, resulting in raw water injection near the intersection of the side and floor of the cavern causing an uneven distribution of insolubles across the floor as illustrated in Figure 4-4. The depth of the perforation is shown in the figure as the intersection of the dotted line (original string position) and the solid line (the potential configuration of the bent string). The initial sonar is shown in light blue with the intermediate sonar in green and the final sonar in gray. The black line represents a slice at a depth of 4110 ft.
26
Figure 4-4. Close-Up View of the Bottom of BH101 and Possible Bent String Configuration.
4.4 Results
Comparisons of the sonars both pre and post leach for BH101 are presented in the following section, as well as a comparison to the predictions by SANSMIC. An analysis was conducted and is presented of the leached volume, leach efficiency, leached ullage volume, and the leached ullage efficiency.
4.4.1 Profile Comparisons
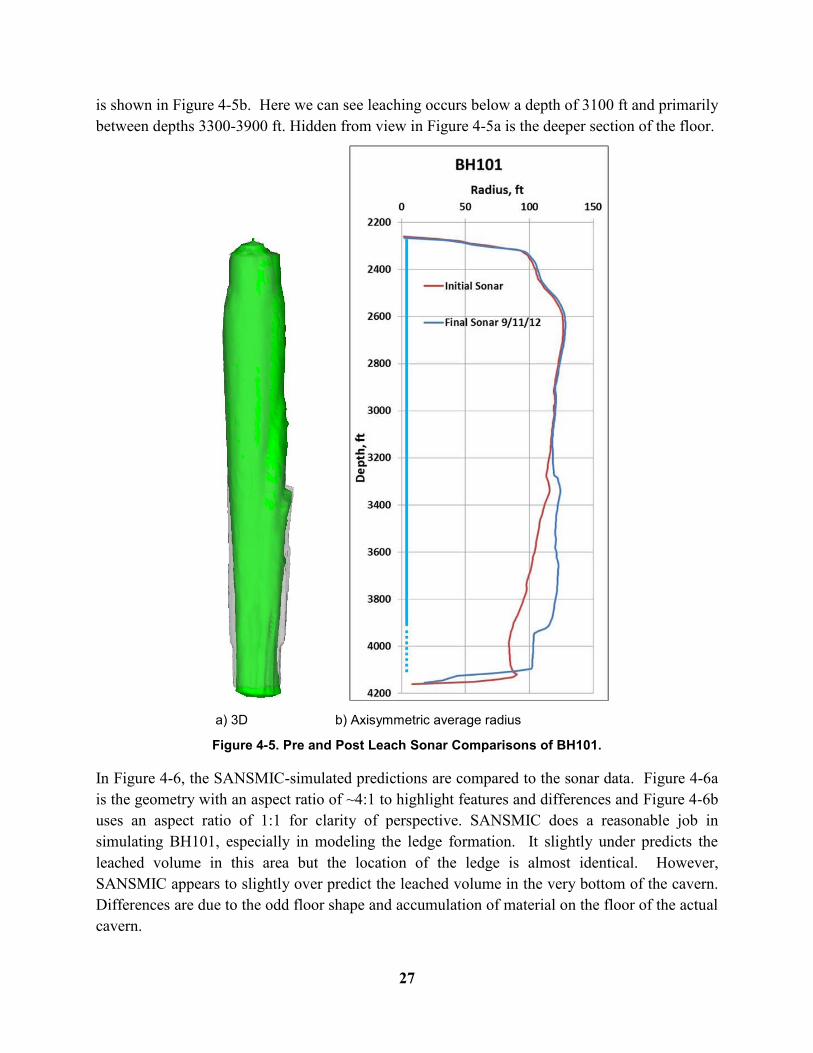
The initial (10/6/11) and final (9/11/12) sonars of BH101 are shown overlaid in Figure 4-5a. The initial sonar is shown in green and the final sonar is shown in gray in the figure. The non-symmetrical fin in the SW direction of the cavern has continued upwards and outwards. The bottom of the cavern has also expanded after the two daisy-chain leaches, but most of the expansion has occurred from the point of the string perforation and tapers up to the approximate position of the uppermost OBI. The axisymmetric average radius representation of both sonars
27
is shown in Figure 4-5b. Here we can see leaching occurs below a depth of 3100 ft and primarily between depths 3300-3900 ft. Hidden from view in Figure 4-5a is the deeper section of the floor.
a) 3D b) Axisymmetric average radius
Figure 4-5. Pre and Post Leach Sonar Comparisons of BH101.
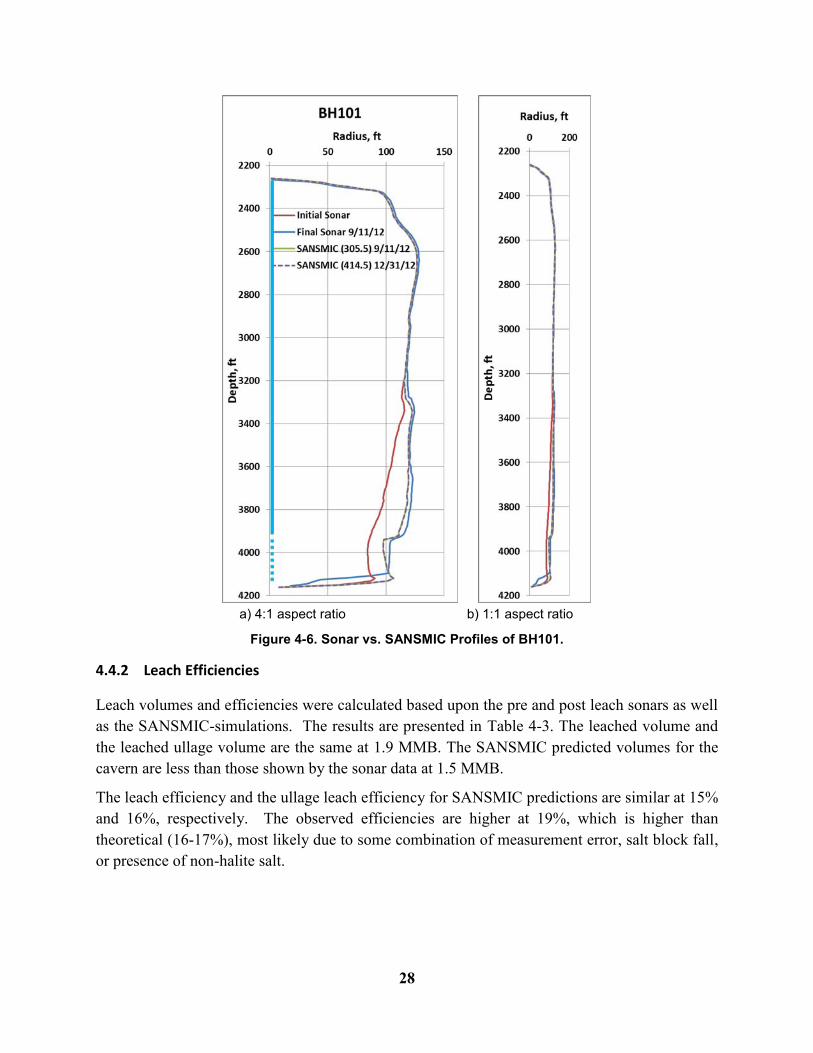
In Figure 4-6, the SANSMIC-simulated predictions are compared to the sonar data. Figure 4-6a is the geometry with an aspect ratio of ~4:1 to highlight features and differences and Figure 4-6b uses an aspect ratio of 1:1 for clarity of perspective. SANSMIC does a reasonable job in simulating BH101, especially in modeling the ledge formation. It slightly under predicts the leached volume in this area but the location of the ledge is almost identical. However, SANSMIC appears to slightly over predict the leached volume in the very bottom of the cavern. Differences are due to the odd floor shape and accumulation of material on the floor of the actual cavern.
28
a) 4:1 aspect ratio b) 1:1 aspect ratio
Figure 4-6. Sonar vs. SANSMIC Profiles of BH101.
4.4.2 Leach Efficiencies
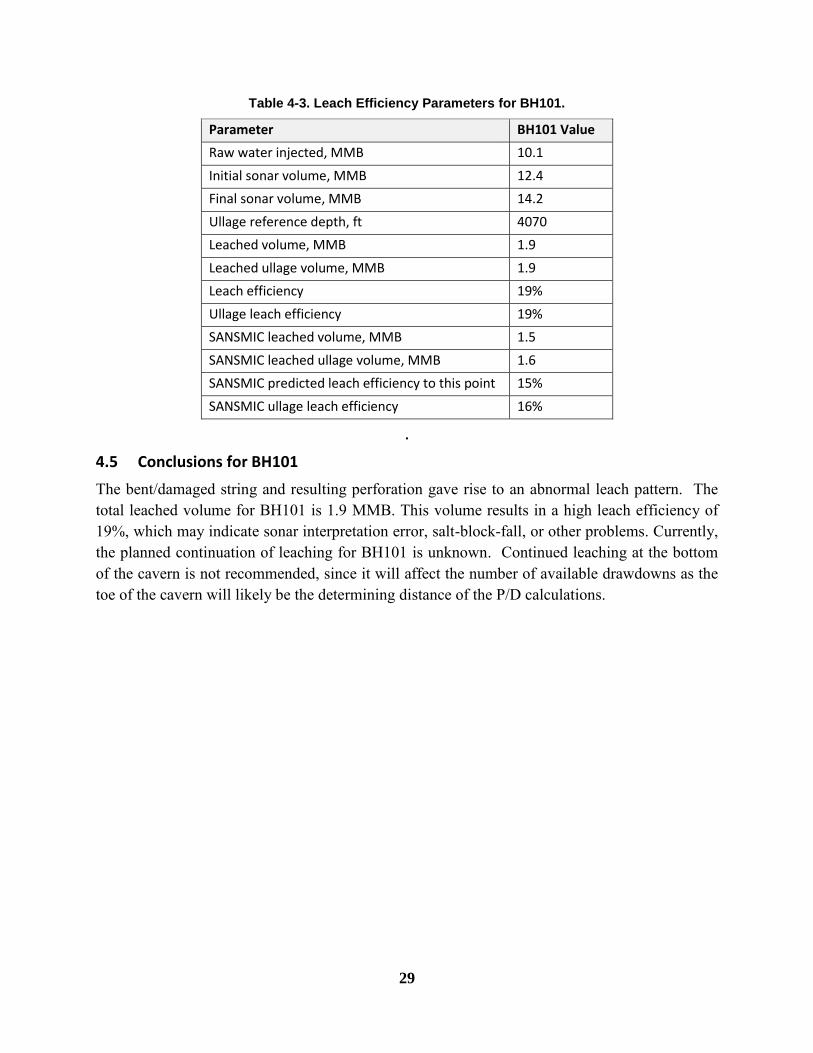
Leach volumes and efficiencies were calculated based upon the pre and post leach sonars as well as the SANSMIC-simulations. The results are presented in Table 4-3. The leached volume and the leached ullage volume are the same at 1.9 MMB. The SANSMIC predicted volumes for the cavern are less than those shown by the sonar data at 1.5 MMB.
The leach efficiency and the ullage leach efficiency for SANSMIC predictions are similar at 15% and 16%, respectively. The observed efficiencies are higher at 19%, which is higher than theoretical (16-17%), most likely due to some combination of measurement error, salt block fall, or presence of non-halite salt.
29
Table 4-3. Leach Efficiency Parameters for BH101.
Parameter BH101 Value
Raw water injected, MMB 10.1
Initial sonar volume, MMB 12.4
Final sonar volume, MMB 14.2
Ullage reference depth, ft 4070
Leached volume, MMB 1.9
Leached ullage volume, MMB 1.9
Leach efficiency 19%
Ullage leach efficiency 19%
SANSMIC leached volume, MMB 1.5
SANSMIC leached ullage volume, MMB 1.6
SANSMIC predicted leach efficiency to this point 15%
SANSMIC ullage leach efficiency 16%
.
4.5 Conclusions for BH101
The bent/damaged string and resulting perforation gave rise to an abnormal leach pattern. The total leached volume for BH101 is 1.9 MMB. This volume results in a high leach efficiency of 19%, which may indicate sonar interpretation error, salt-block-fall, or other problems. Currently, the planned continuation of leaching for BH101 is unknown. Continued leaching at the bottom of the cavern is not recommended, since it will affect the number of available drawdowns as the toe of the cavern will likely be the determining distance of the P/D calculations.

30
Page intentionally left blank.
31
5 BH104 Daisy Chain
This section summarizes the BH104 portion of the daisy-chain leach between BH101 and BH104, where oil was moved from BH101 with water injection to fill BH104 and the displaced saturated brine in BH104 was sent offsite for disposal. The process was then reversed - oil was moved with water from BH104 to refill BH101 and the displaced brine was again moved to storage tanks. As of this writing (data collection through January 2013), this back and forth process (daisy-chain) has been repeated for two leach and one fill cycle for BH104.
5.1 Timeline
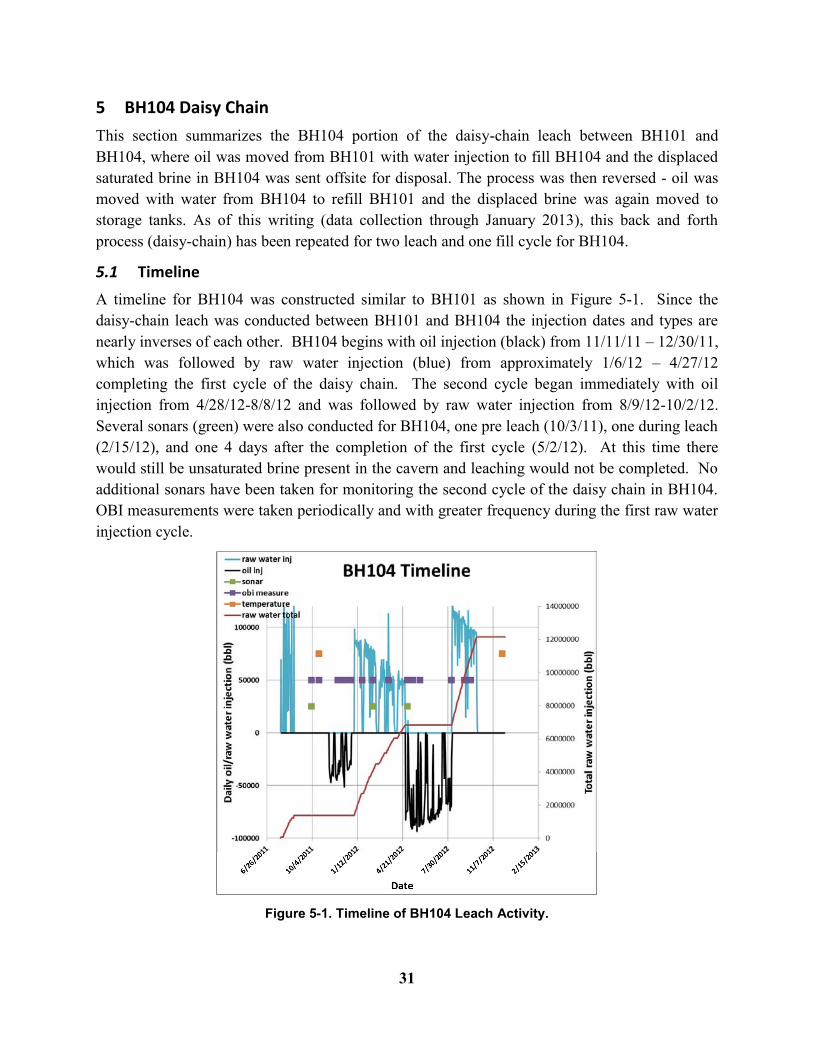
A timeline for BH104 was constructed similar to BH101 as shown in Figure 5-1. Since the daisy-chain leach was conducted between BH101 and BH104 the injection dates and types are nearly inverses of each other. BH104 begins with oil injection (black) from 11/11/11 – 12/30/11, which was followed by raw water injection (blue) from approximately 1/6/12 – 4/27/12 completing the first cycle of the daisy chain. The second cycle began immediately with oil injection from 4/28/12-8/8/12 and was followed by raw water injection from 8/9/12-10/2/12. Several sonars (green) were also conducted for BH104, one pre leach (10/3/11), one during leach (2/15/12), and one 4 days after the completion of the first cycle (5/2/12). At this time there would still be unsaturated brine present in the cavern and leaching would not be completed. No additional sonars have been taken for monitoring the second cycle of the daisy chain in BH104. OBI measurements were taken periodically and with greater frequency during the first raw water injection cycle.
Figure 5-1. Timeline of BH104 Leach Activity.
32
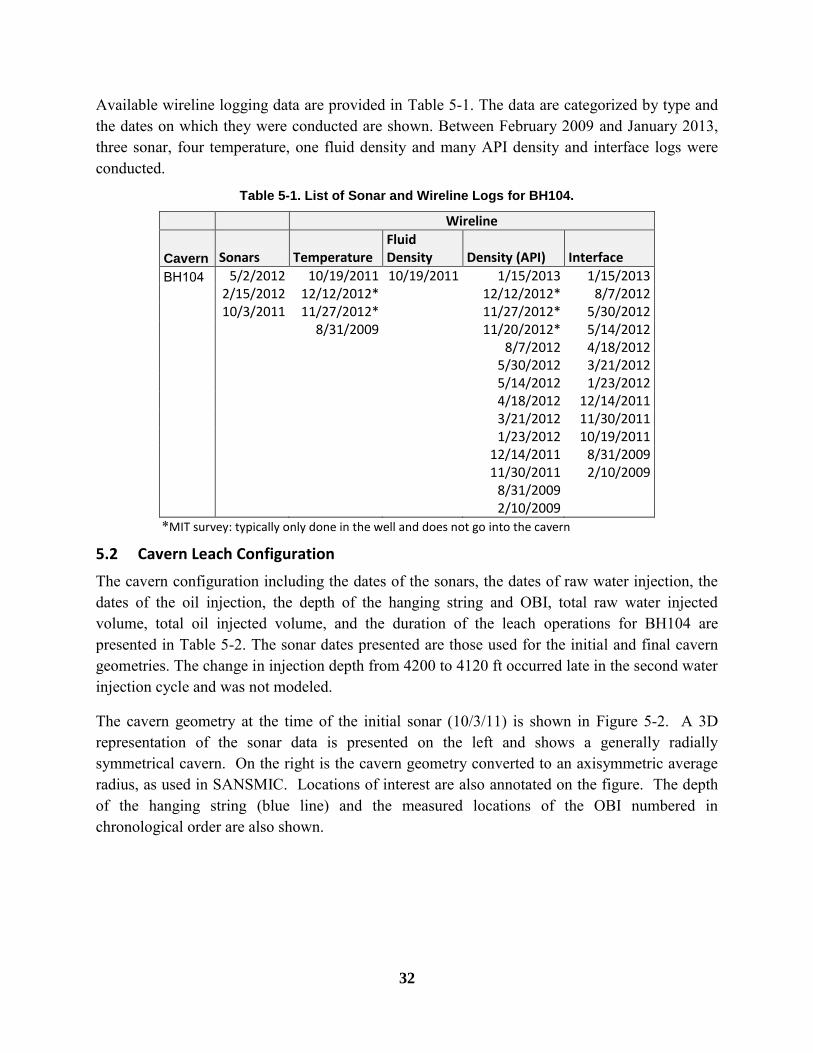
Available wireline logging data are provided in Table 5-1. The data are categorized by type and the dates on which they were conducted are shown. Between February 2009 and January 2013, three sonar, four temperature, one fluid density and many API density and interface logs were conducted.
Table 5-1. List of Sonar and Wireline Logs for BH104.
Wireline
Cavern Sonars Temperature Fluid Density Density (API) Interface
BH104 5/2/2012 10/19/2011 10/19/2011 1/15/2013 1/15/2013
2/15/2012 12/12/2012*
12/12/2012* 8/7/2012
10/3/2011 11/27/2012*
11/27/2012* 5/30/2012
8/31/2009
11/20/2012* 5/14/2012
8/7/2012 4/18/2012
5/30/2012 3/21/2012
5/14/2012 1/23/2012
4/18/2012 12/14/2011
3/21/2012 11/30/2011
1/23/2012 10/19/2011
12/14/2011 8/31/2009
11/30/2011 2/10/2009
8/31/2009
2/10/2009 *MIT survey: typically only done in the well and does not go into the cavern
5.2 Cavern Leach Configuration
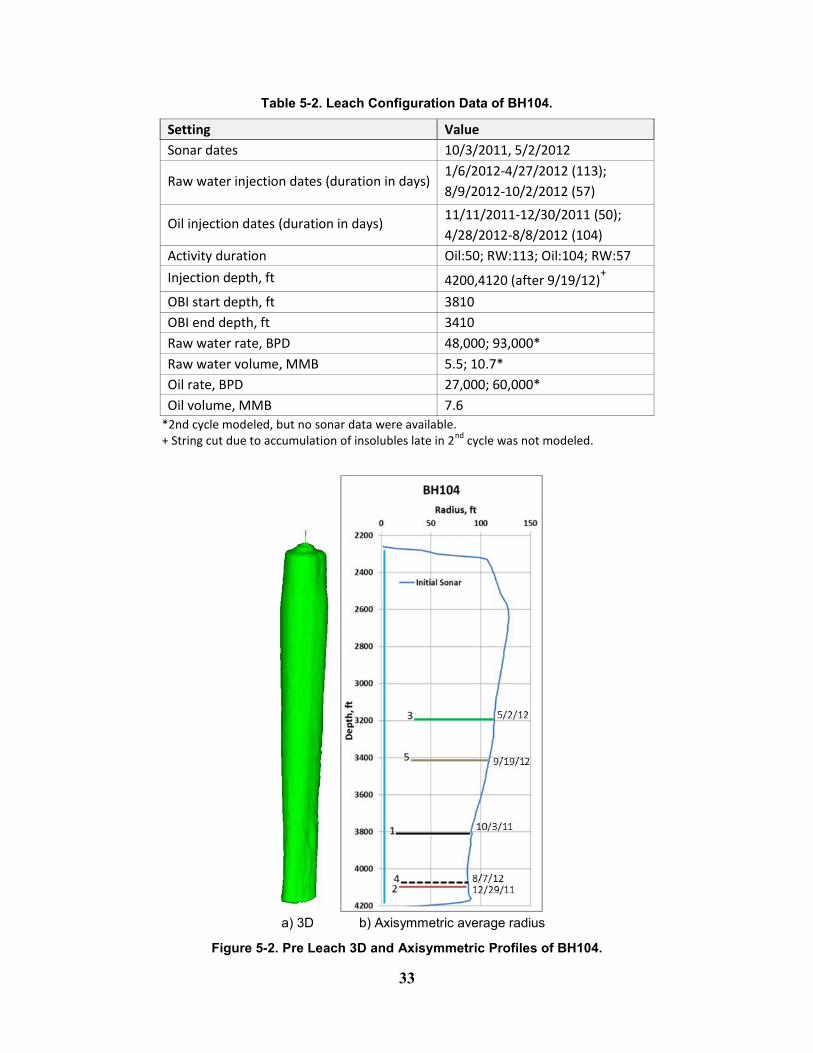
The cavern configuration including the dates of the sonars, the dates of raw water injection, the dates of the oil injection, the depth of the hanging string and OBI, total raw water injected volume, total oil injected volume, and the duration of the leach operations for BH104 are presented in Table 5-2. The sonar dates presented are those used for the initial and final cavern geometries. The change in injection depth from 4200 to 4120 ft occurred late in the second water injection cycle and was not modeled.
The cavern geometry at the time of the initial sonar (10/3/11) is shown in Figure 5-2. A 3D representation of the sonar data is presented on the left and shows a generally radially symmetrical cavern. On the right is the cavern geometry converted to an axisymmetric average radius, as used in SANSMIC. Locations of interest are also annotated on the figure. The depth of the hanging string (blue line) and the measured locations of the OBI numbered in chronological order are also shown.
33
Table 5-2. Leach Configuration Data of BH104.
Setting Value
Sonar dates 10/3/2011, 5/2/2012
Raw water injection dates (duration in days) 1/6/2012-4/27/2012 (113);
8/9/2012-10/2/2012 (57)
Oil injection dates (duration in days) 11/11/2011-12/30/2011 (50);
4/28/2012-8/8/2012 (104)
Activity duration Oil:50; RW:113; Oil:104; RW:57
Injection depth, ft 4200,4120 (after 9/19/12)+
OBI start depth, ft 3810
OBI end depth, ft 3410
Raw water rate, BPD 48,000; 93,000*
Raw water volume, MMB 5.5; 10.7*
Oil rate, BPD 27,000; 60,000*
Oil volume, MMB 7.6
*2nd cycle modeled, but no sonar data were available. + String cut due to accumulation of insolubles late in 2
nd cycle was not modeled.
a) 3D b) Axisymmetric average radius
Figure 5-2. Pre Leach 3D and Axisymmetric Profiles of BH104.
34
5.3 Results
Comparisons of the sonars both pre and post leach for BH104 are presented in the following section as well as comparisons to the predictions by SANSMIC. An analysis was conducted and is presented of the leached volume, leach efficiency, leached ullage volume, and the leached ullage efficiency.
5.3.1 Profile Comparisons
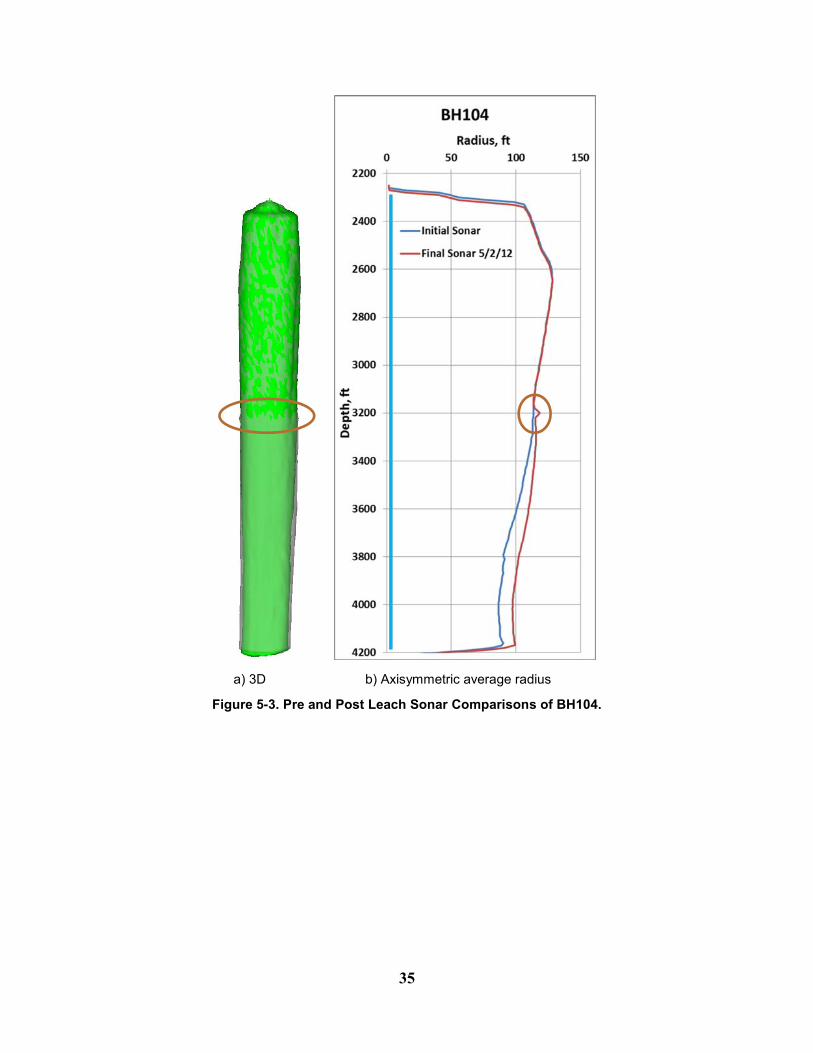
The initial (10/3/11) and final (5/2/12) sonars of BH104 are shown in Figure 5-3. On the left is a 3D representation with the initial sonar shown in green and the final sonar shown in gray. The cavern remains predominantly symmetrical with the expansion occurring in the lower region of the cavern. The axisymmetric average radius representations of both sonars are shown in the figure on the right. Here we can see leaching occurred below a depth of 3200 ft. There is an odd feature at a depth of 3200 ft which indicates an abrupt increase in radius of approximately 5 ft just below the OBI. The feature is interpreted by the authors to be due to an error in measuring or interpretation of the sound speed at the point where the sonar tool transitioned between oil and water. Enhanced leaching from the spreading of a buoyant, under-saturated plume is not expected, because at the time of the survey, the OBI was being moved downward by the injection of crude oil.
In Figure 5-4, the SANSMIC-simulated predictions are compared to the sonar data. The left figure of Figure 5-4 is the geometry with an aspect ratio of ~4:1 to highlight features and differences and the right figure is shown with an aspect ratio of ~1:1 for clarity of perspective. BH104’s final sonar was conducted in May but injection continued until August so the simulation is shown for comparison to the May sonar and for the predicted results at completion of leaching. A comparison with the May sonar shows SANSMIC is again in good agreement with the sonar. SANSMIC slightly under predicted the volume leached in the very upper region and has slightly over predicted the very bottom of the cavern.
35
a) 3D b) Axisymmetric average radius
Figure 5-3. Pre and Post Leach Sonar Comparisons of BH104.
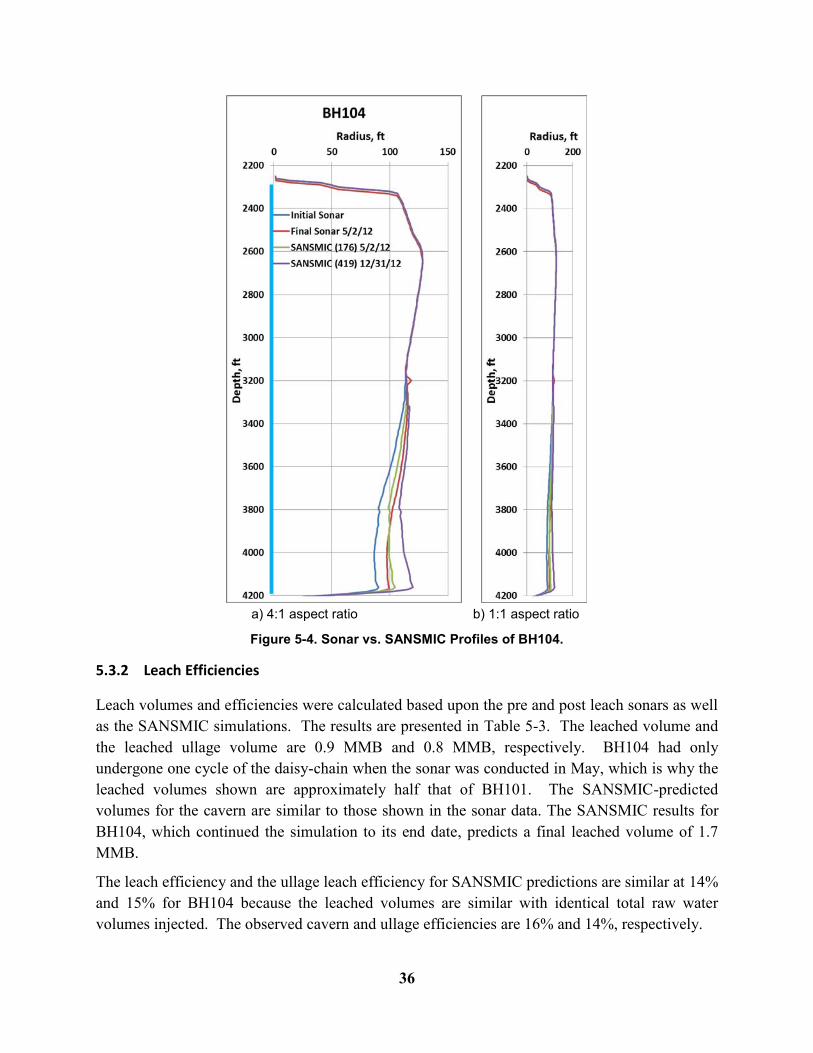
36
a) 4:1 aspect ratio b) 1:1 aspect ratio
Figure 5-4. Sonar vs. SANSMIC Profiles of BH104.
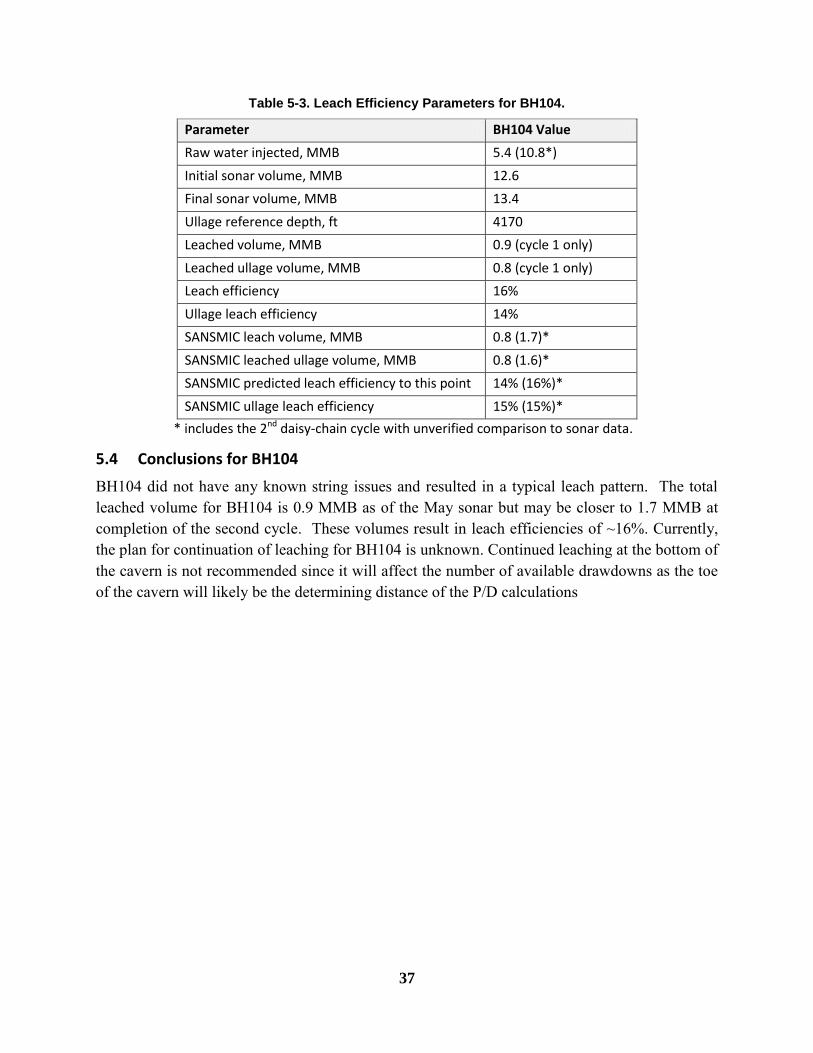
5.3.2 Leach Efficiencies
Leach volumes and efficiencies were calculated based upon the pre and post leach sonars as well as the SANSMIC simulations. The results are presented in Table 5-3. The leached volume and the leached ullage volume are 0.9 MMB and 0.8 MMB, respectively. BH104 had only undergone one cycle of the daisy-chain when the sonar was conducted in May, which is why the leached volumes shown are approximately half that of BH101. The SANSMIC-predicted volumes for the cavern are similar to those shown in the sonar data. The SANSMIC results for BH104, which continued the simulation to its end date, predicts a final leached volume of 1.7 MMB.
The leach efficiency and the ullage leach efficiency for SANSMIC predictions are similar at 14% and 15% for BH104 because the leached volumes are similar with identical total raw water volumes injected. The observed cavern and ullage efficiencies are 16% and 14%, respectively.
37
Table 5-3. Leach Efficiency Parameters for BH104.
Parameter BH104 Value
Raw water injected, MMB 5.4 (10.8*)
Initial sonar volume, MMB 12.6
Final sonar volume, MMB 13.4
Ullage reference depth, ft 4170
Leached volume, MMB 0.9 (cycle 1 only)
Leached ullage volume, MMB 0.8 (cycle 1 only)
Leach efficiency 16%
Ullage leach efficiency 14%
SANSMIC leach volume, MMB 0.8 (1.7)*
SANSMIC leached ullage volume, MMB 0.8 (1.6)*
SANSMIC predicted leach efficiency to this point 14% (16%)*
SANSMIC ullage leach efficiency 15% (15%)*
* includes the 2nd daisy-chain cycle with unverified comparison to sonar data.
5.4 Conclusions for BH104
BH104 did not have any known string issues and resulted in a typical leach pattern. The total leached volume for BH104 is 0.9 MMB as of the May sonar but may be closer to 1.7 MMB at completion of the second cycle. These volumes result in leach efficiencies of ~16%. Currently, the plan for continuation of leaching for BH104 is unknown. Continued leaching at the bottom of the cavern is not recommended since it will affect the number of available drawdowns as the toe of the cavern will likely be the determining distance of the P/D calculations

38
Page intentionally left blank.
39
6 WH105 Conversion from Sweet to Sour Crude Oil
West Hackberry cavern 105 (WH105) was selected for conversion from sweet to sour crude oil storage. This required WH105 to undergo a full withdrawal equivalent to one drawdown cycle including as much of the roof oil blanket as possible. Care had to be taken to avoid damage to the roof as discussed in Nemer and Lord 2012. A leach analysis of the withdrawal for the conversion is the subject of this section of the report.
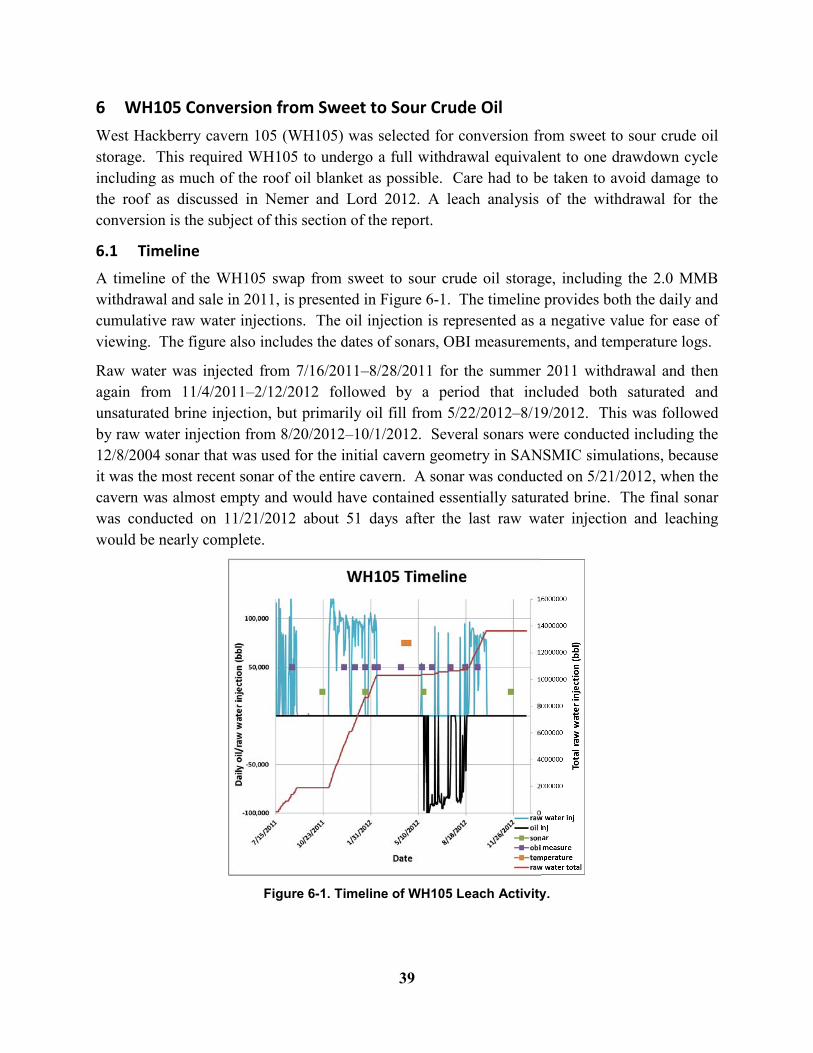
6.1 Timeline
A timeline of the WH105 swap from sweet to sour crude oil storage, including the 2.0 MMB withdrawal and sale in 2011, is presented in Figure 6-1. The timeline provides both the daily and cumulative raw water injections. The oil injection is represented as a negative value for ease of viewing. The figure also includes the dates of sonars, OBI measurements, and temperature logs.
Raw water was injected from 7/16/2011–8/28/2011 for the summer 2011 withdrawal and then again from 11/4/2011–2/12/2012 followed by a period that included both saturated and unsaturated brine injection, but primarily oil fill from 5/22/2012–8/19/2012. This was followed by raw water injection from 8/20/2012–10/1/2012. Several sonars were conducted including the 12/8/2004 sonar that was used for the initial cavern geometry in SANSMIC simulations, because it was the most recent sonar of the entire cavern. A sonar was conducted on 5/21/2012, when the cavern was almost empty and would have contained essentially saturated brine. The final sonar was conducted on 11/21/2012 about 51 days after the last raw water injection and leaching would be nearly complete.
Figure 6-1. Timeline of WH105 Leach Activity.
40
Available wireline logging surveys are provided in Table 6-1. The data are categorized by type and the dates on which they were conducted. Between December 2009 and November 2011, four sonars, three temperature, and many API density and interface logs were conducted.
Table 6-1. List of Sonar and Wireline Logs for WH105.
Wireline
Cavern Sonars Temperature Fluid Density
Density (API) Interface
WH105 11/21/2012 4/19/2012* 11/30/2012 11/30/2012
5/21/2012 4/10/2012*
5/17/2012 5/17/2012
1/19/2012 12/23/2009
4/19/2012* 4/4/2012
10/21/2011
4/10/2012* 2/15/2012
4/5/2012 2/8/2012
2/15/2012 12/29/2011
2/8/2012 11/15/2011
12/29/2011 8/19/2011
11/15/2011 6/8/2011
8/19/2011 12/23/2009
6/8/2011
12/23/2009
*MIT survey: typically only done in the well and does not go into the cavern
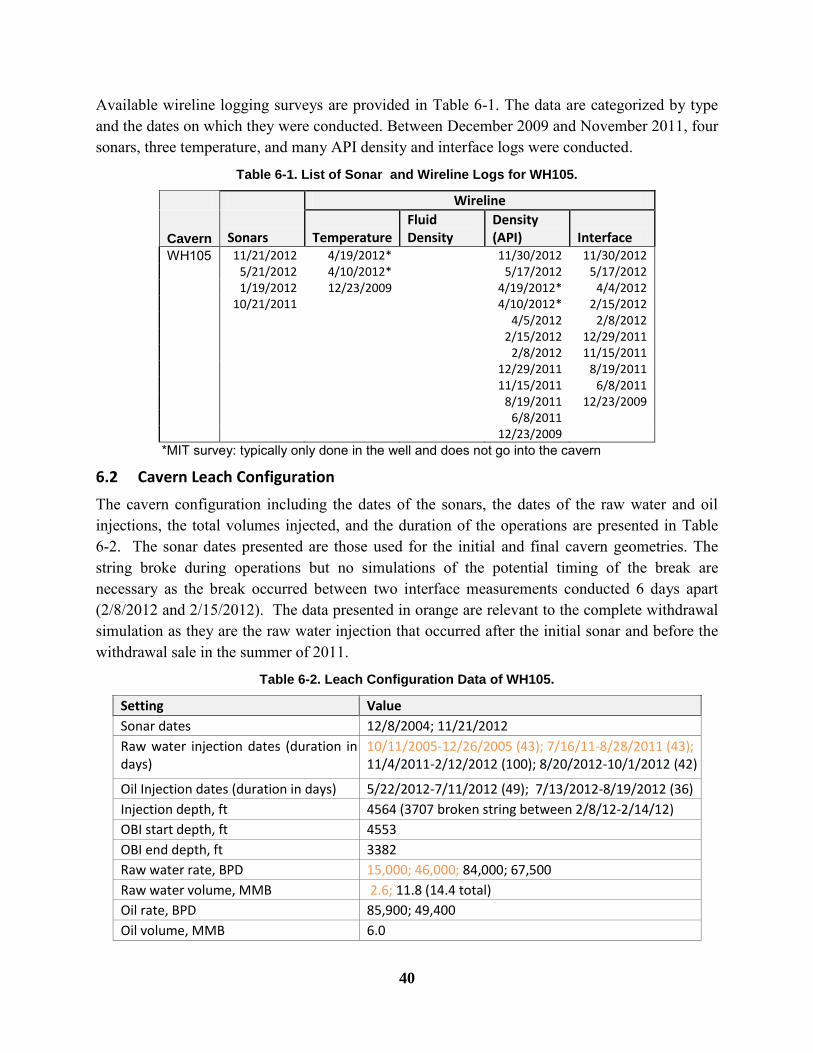
6.2 Cavern Leach Configuration
The cavern configuration including the dates of the sonars, the dates of the raw water and oil injections, the total volumes injected, and the duration of the operations are presented in Table 6-2. The sonar dates presented are those used for the initial and final cavern geometries. The string broke during operations but no simulations of the potential timing of the break are necessary as the break occurred between two interface measurements conducted 6 days apart (2/8/2012 and 2/15/2012). The data presented in orange are relevant to the complete withdrawal simulation as they are the raw water injection that occurred after the initial sonar and before the withdrawal sale in the summer of 2011.
Table 6-2. Leach Configuration Data of WH105.
Setting Value
Sonar dates 12/8/2004; 11/21/2012
Raw water injection dates (duration in days)
10/11/2005-12/26/2005 (43); 7/16/11-8/28/2011 (43); 11/4/2011-2/12/2012 (100); 8/20/2012-10/1/2012 (42)
Oil Injection dates (duration in days) 5/22/2012-7/11/2012 (49); 7/13/2012-8/19/2012 (36)
Injection depth, ft 4564 (3707 broken string between 2/8/12-2/14/12)
OBI start depth, ft 4553
OBI end depth, ft 3382
Raw water rate, BPD 15,000; 46,000; 84,000; 67,500
Raw water volume, MMB 2.6; 11.8 (14.4 total)
Oil rate, BPD 85,900; 49,400
Oil volume, MMB 6.0
41
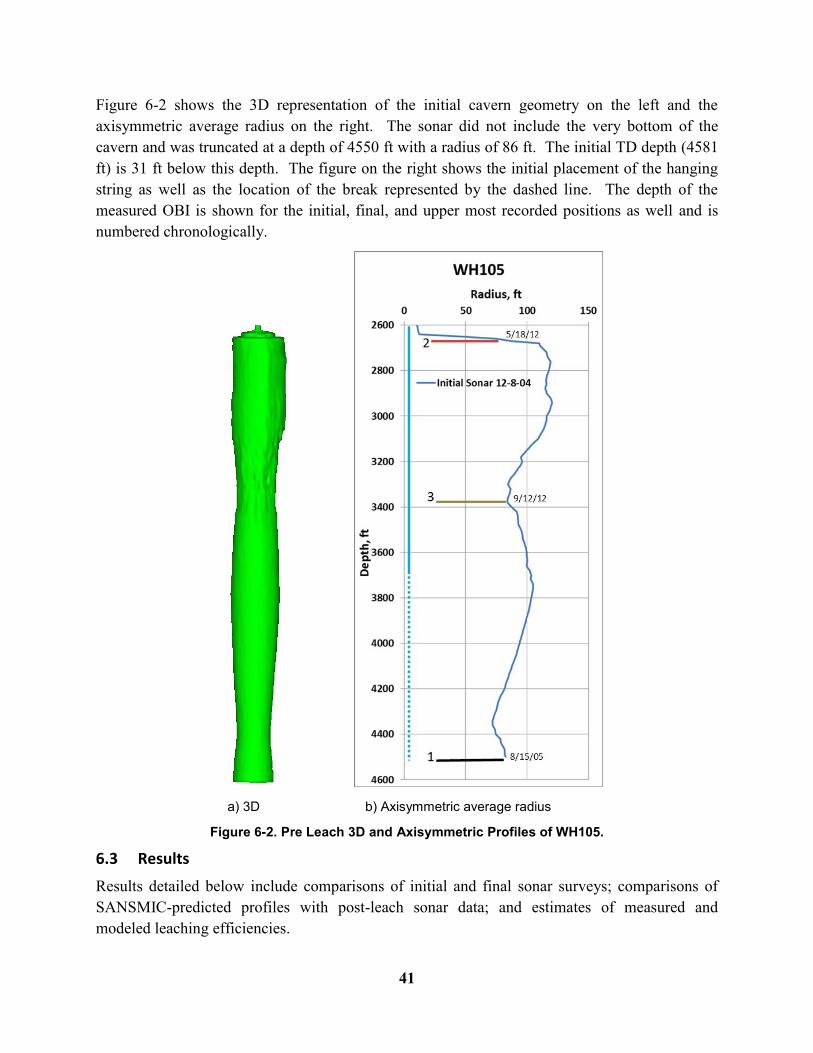
Figure 6-2 shows the 3D representation of the initial cavern geometry on the left and the axisymmetric average radius on the right. The sonar did not include the very bottom of the cavern and was truncated at a depth of 4550 ft with a radius of 86 ft. The initial TD depth (4581 ft) is 31 ft below this depth. The figure on the right shows the initial placement of the hanging string as well as the location of the break represented by the dashed line. The depth of the measured OBI is shown for the initial, final, and upper most recorded positions as well and is numbered chronologically.
a) 3D b) Axisymmetric average radius
Figure 6-2. Pre Leach 3D and Axisymmetric Profiles of WH105.
6.3 Results
Results detailed below include comparisons of initial and final sonar surveys; comparisons of SANSMIC-predicted profiles with post-leach sonar data; and estimates of measured and modeled leaching efficiencies.
42
6.3.1 Profile Comparisons
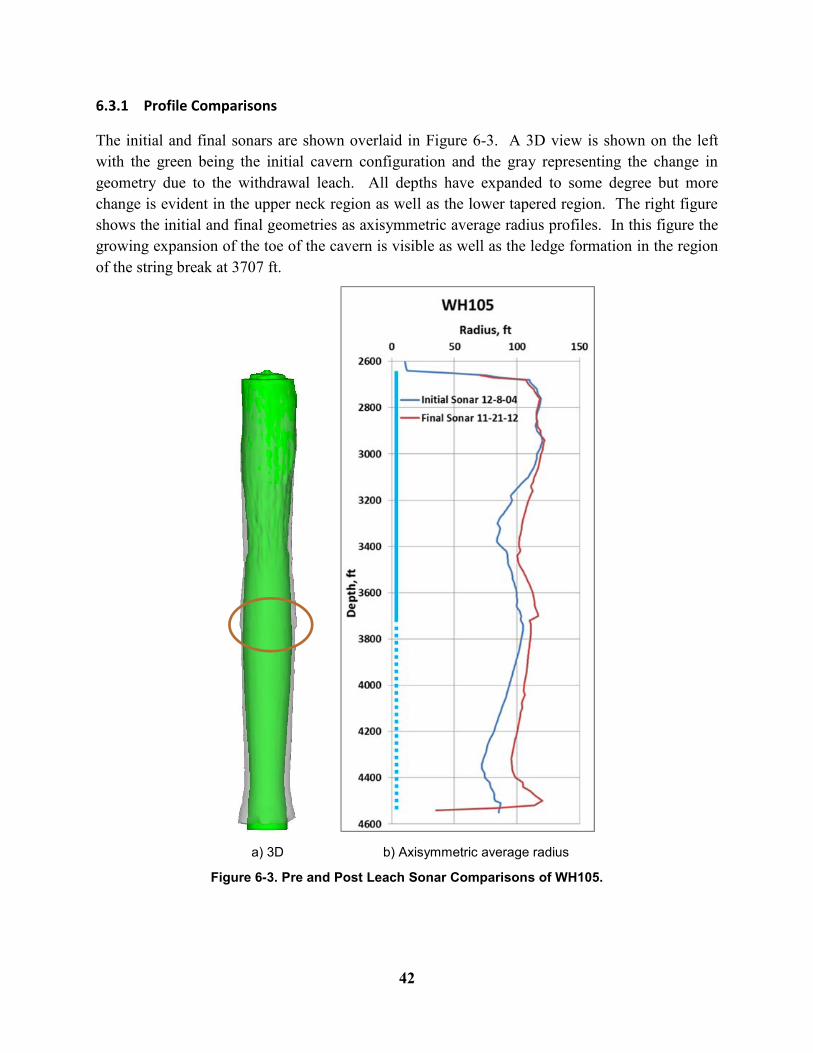
The initial and final sonars are shown overlaid in Figure 6-3. A 3D view is shown on the left with the green being the initial cavern configuration and the gray representing the change in geometry due to the withdrawal leach. All depths have expanded to some degree but more change is evident in the upper neck region as well as the lower tapered region. The right figure shows the initial and final geometries as axisymmetric average radius profiles. In this figure the growing expansion of the toe of the cavern is visible as well as the ledge formation in the region of the string break at 3707 ft.
a) 3D b) Axisymmetric average radius
Figure 6-3. Pre and Post Leach Sonar Comparisons of WH105.
43
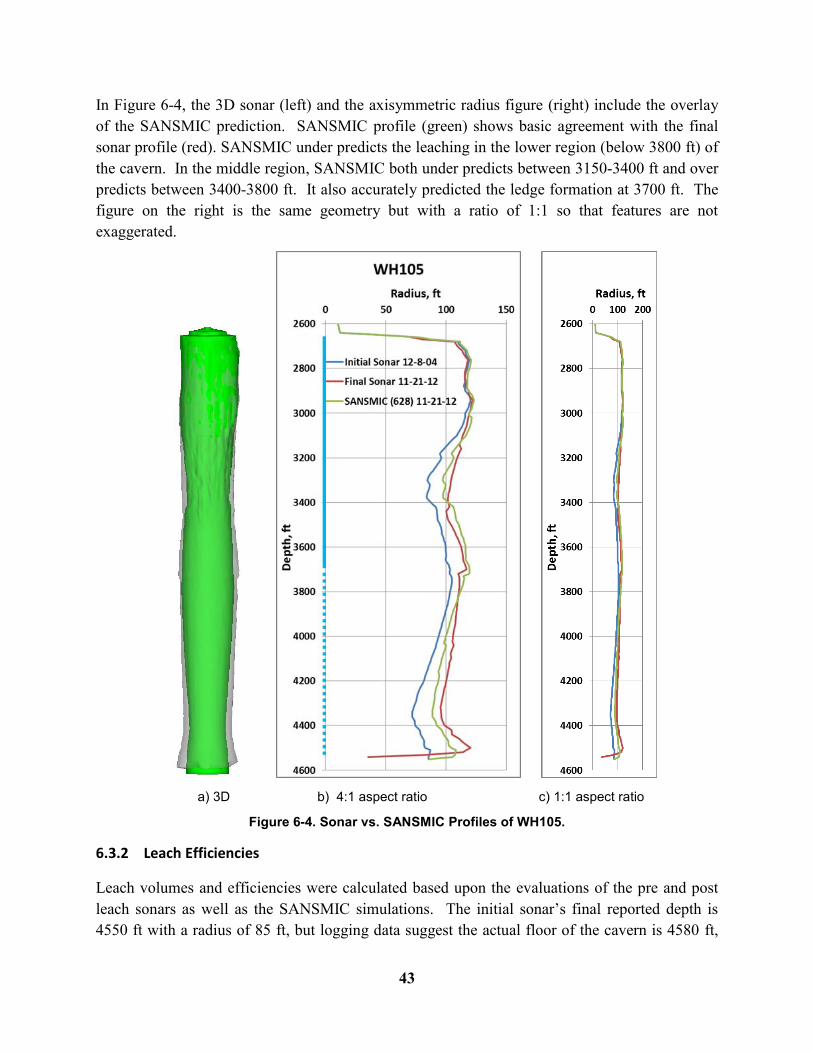
In Figure 6-4, the 3D sonar (left) and the axisymmetric radius figure (right) include the overlay of the SANSMIC prediction. SANSMIC profile (green) shows basic agreement with the final sonar profile (red). SANSMIC under predicts the leaching in the lower region (below 3800 ft) of the cavern. In the middle region, SANSMIC both under predicts between 3150-3400 ft and over predicts between 3400-3800 ft. It also accurately predicted the ledge formation at 3700 ft. The figure on the right is the same geometry but with a ratio of 1:1 so that features are not exaggerated.
a) 3D b) 4:1 aspect ratio c) 1:1 aspect ratio
Figure 6-4. Sonar vs. SANSMIC Profiles of WH105.
6.3.2 Leach Efficiencies
Leach volumes and efficiencies were calculated based upon the evaluations of the pre and post leach sonars as well as the SANSMIC simulations. The initial sonar’s final reported depth is 4550 ft with a radius of 85 ft, but logging data suggest the actual floor of the cavern is 4580 ft,
44
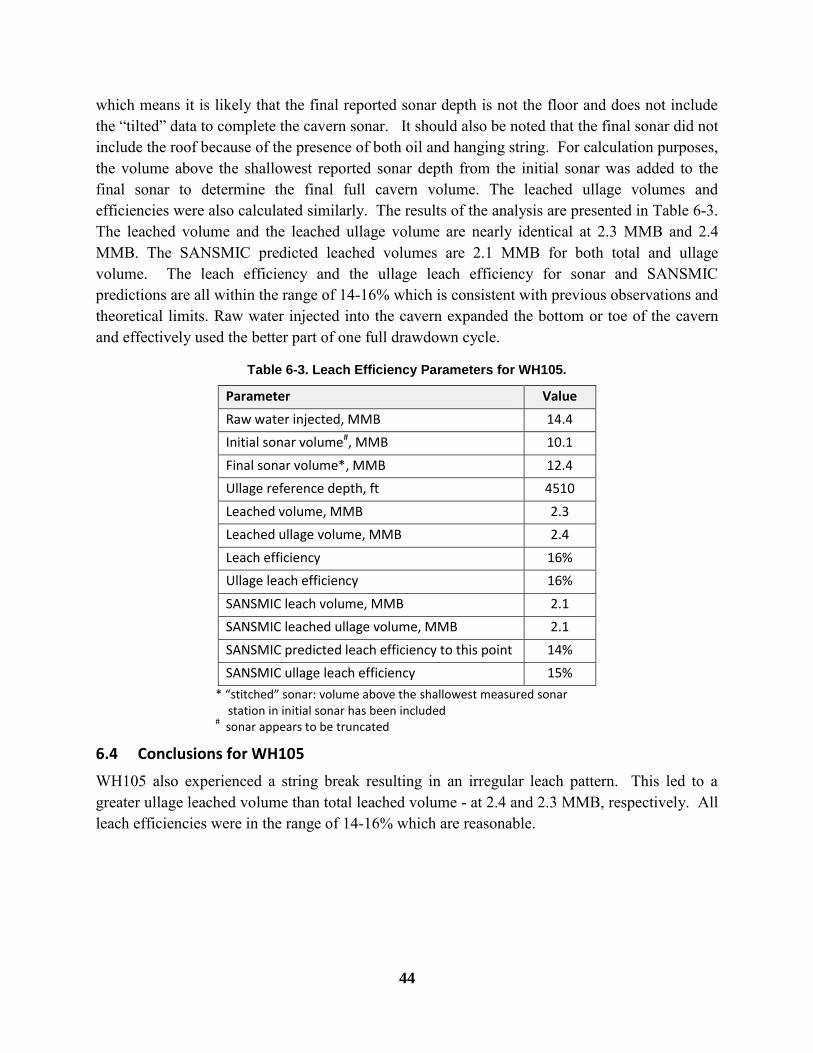
which means it is likely that the final reported sonar depth is not the floor and does not include the “tilted” data to complete the cavern sonar. It should also be noted that the final sonar did not include the roof because of the presence of both oil and hanging string. For calculation purposes, the volume above the shallowest reported sonar depth from the initial sonar was added to the final sonar to determine the final full cavern volume. The leached ullage volumes and efficiencies were also calculated similarly. The results of the analysis are presented in Table 6-3. The leached volume and the leached ullage volume are nearly identical at 2.3 MMB and 2.4 MMB. The SANSMIC predicted leached volumes are 2.1 MMB for both total and ullage volume. The leach efficiency and the ullage leach efficiency for sonar and SANSMIC predictions are all within the range of 14-16% which is consistent with previous observations and theoretical limits. Raw water injected into the cavern expanded the bottom or toe of the cavern and effectively used the better part of one full drawdown cycle.
Table 6-3. Leach Efficiency Parameters for WH105.
Parameter Value
Raw water injected, MMB 14.4
Initial sonar volume#, MMB 10.1
Final sonar volume*, MMB 12.4
Ullage reference depth, ft 4510
Leached volume, MMB 2.3
Leached ullage volume, MMB 2.4
Leach efficiency 16%
Ullage leach efficiency 16%
SANSMIC leach volume, MMB 2.1
SANSMIC leached ullage volume, MMB 2.1
SANSMIC predicted leach efficiency to this point 14%
SANSMIC ullage leach efficiency 15%
* “stitched” sonar: volume above the shallowest measured sonar station in initial sonar has been included
# sonar appears to be truncated
6.4 Conclusions for WH105
WH105 also experienced a string break resulting in an irregular leach pattern. This led to a greater ullage leached volume than total leached volume - at 2.4 and 2.3 MMB, respectively. All leach efficiencies were in the range of 14-16% which are reasonable.
45
7 WH106
The oil injected into WH105 was displaced from WH106 using raw water. This section of the report presents an analysis of the leaching of WH106 during that oil withdrawal.
7.1 Timeline
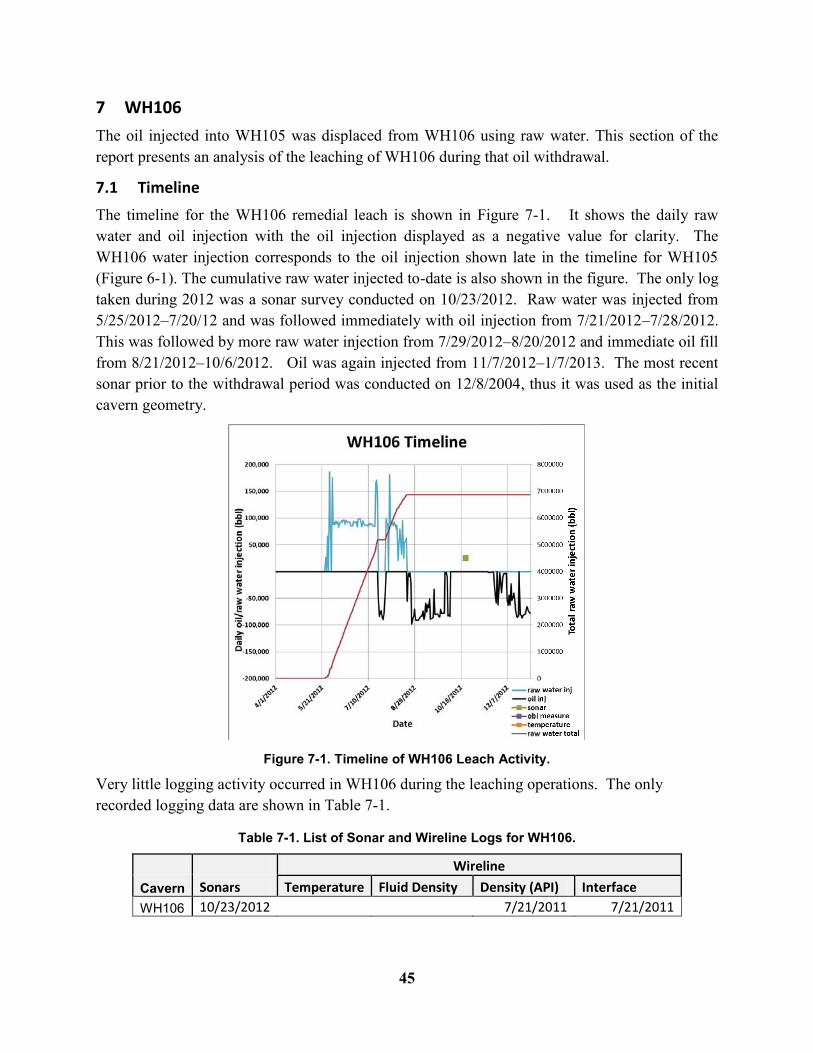
The timeline for the WH106 remedial leach is shown in Figure 7-1. It shows the daily raw water and oil injection with the oil injection displayed as a negative value for clarity. The WH106 water injection corresponds to the oil injection shown late in the timeline for WH105 (Figure 6-1). The cumulative raw water injected to-date is also shown in the figure. The only log taken during 2012 was a sonar survey conducted on 10/23/2012. Raw water was injected from 5/25/2012–7/20/12 and was followed immediately with oil injection from 7/21/2012–7/28/2012. This was followed by more raw water injection from 7/29/2012–8/20/2012 and immediate oil fill from 8/21/2012–10/6/2012. Oil was again injected from 11/7/2012–1/7/2013. The most recent sonar prior to the withdrawal period was conducted on 12/8/2004, thus it was used as the initial cavern geometry.
Figure 7-1. Timeline of WH106 Leach Activity.
Very little logging activity occurred in WH106 during the leaching operations. The only recorded logging data are shown in Table 7-1.
Table 7-1. List of Sonar and Wireline Logs for WH106.
Wireline
Cavern Sonars Temperature Fluid Density Density (API) Interface
WH106 10/23/2012
7/21/2011 7/21/2011
46
7.2 Cavern Leach Configuration
The cavern configuration including the dates of the sonars, the dates of the raw water and oil injections, the depth of the hanging string and OBI, total raw water and oil injected volumes, and the duration of the activities are shown in Table 7-2. The string broke during the leaching activities and the depth of the break is noted. As no logging data are found, an examination of the timing of the string breakage was conducted and is presented in Section 7.3.
Table 7-2. Leach Configuration Data of WH106.
Setting Value
Sonar dates
12/8/2004; 10/23/2012
Raw water injection dates (duration in days) 5/25/12-7/20/12 (57); 7/29/12-8/20/12 (23)
Oil injection dates (duration in days) 7/21/12-7/28/12 (8); 8/21/12-10/6/12 (47)
Injection depth, ft 4290 Broken string: 3917
OBI start depth, ft 4267
OBI end depth, ft unknown
Raw water rate, BPD 90,776 and 73,228
Raw water volume, MMB 5.17; 1.68
Oil rate, BPD 73,473; 68,223
Oil volume, MMB 0.59; 3.2
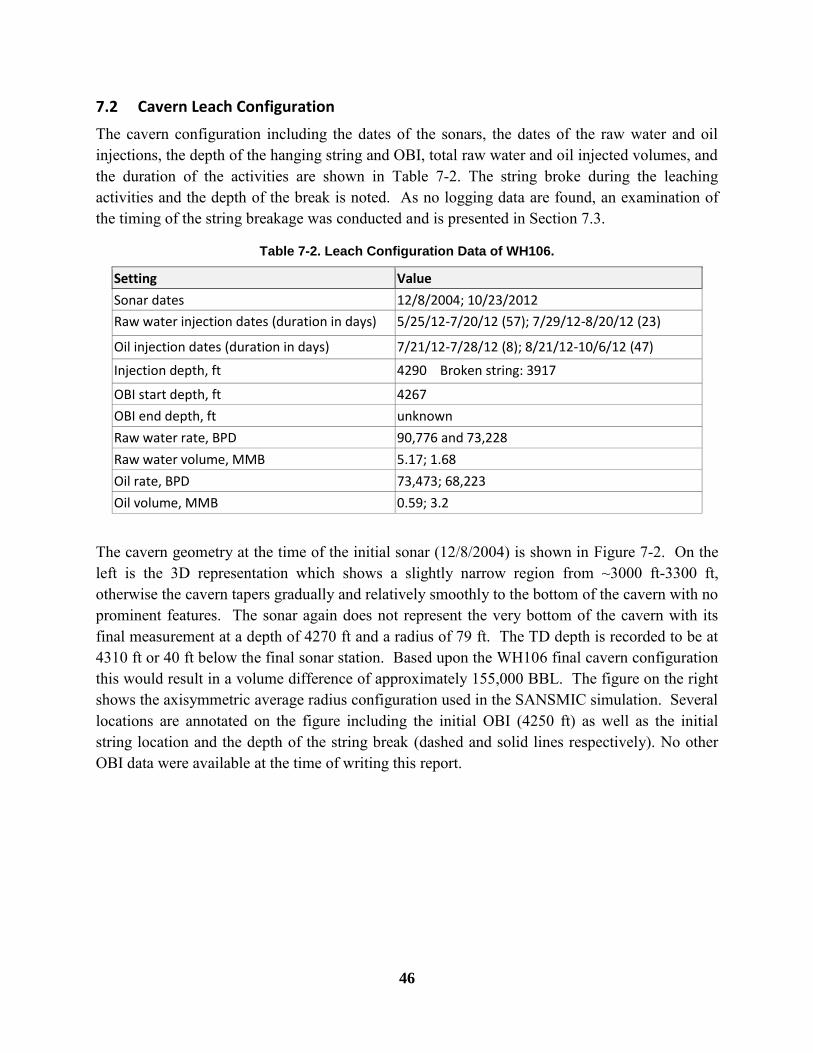
The cavern geometry at the time of the initial sonar (12/8/2004) is shown in Figure 7-2. On the left is the 3D representation which shows a slightly narrow region from ~3000 ft-3300 ft, otherwise the cavern tapers gradually and relatively smoothly to the bottom of the cavern with no prominent features. The sonar again does not represent the very bottom of the cavern with its final measurement at a depth of 4270 ft and a radius of 79 ft. The TD depth is recorded to be at 4310 ft or 40 ft below the final sonar station. Based upon the WH106 final cavern configuration this would result in a volume difference of approximately 155,000 BBL. The figure on the right shows the axisymmetric average radius configuration used in the SANSMIC simulation. Several locations are annotated on the figure including the initial OBI (4250 ft) as well as the initial string location and the depth of the string break (dashed and solid lines respectively). No other OBI data were available at the time of writing this report.
47
a) 3D b) Axisymmetric average radius
Figure 7-2. Pre Leach 3D and Axisymmetric Profiles of WH106.
7.3 Timing of String Break During Withdrawal
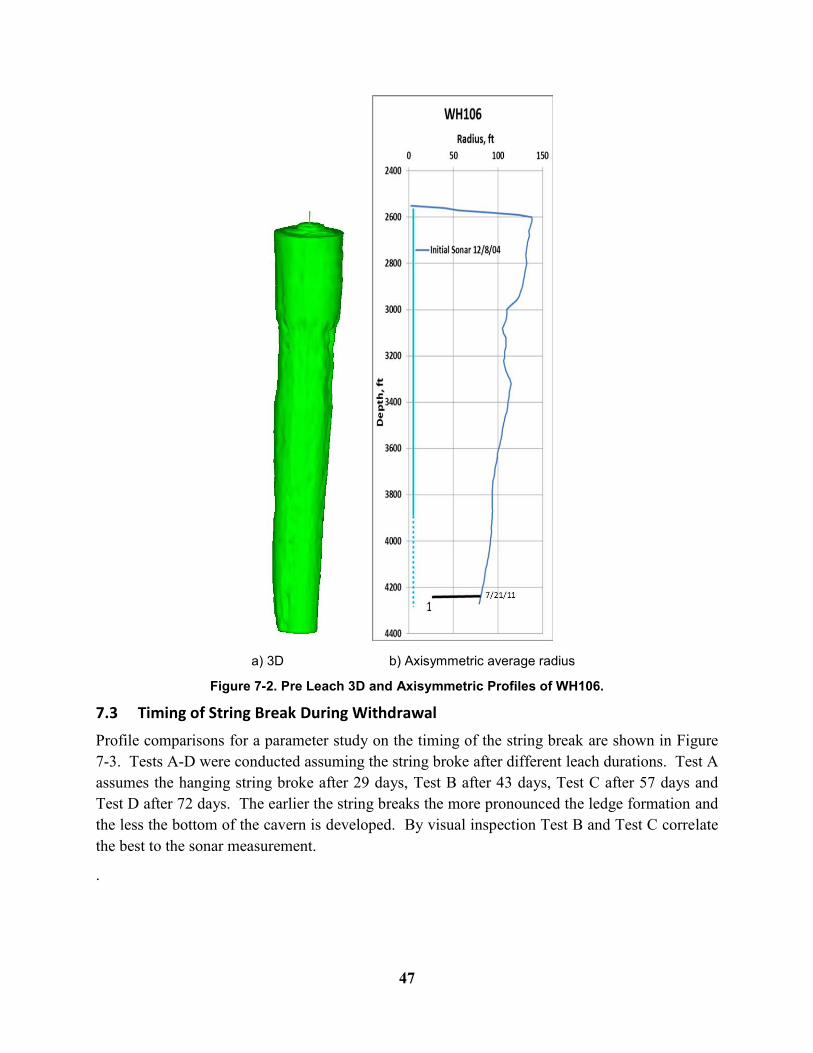
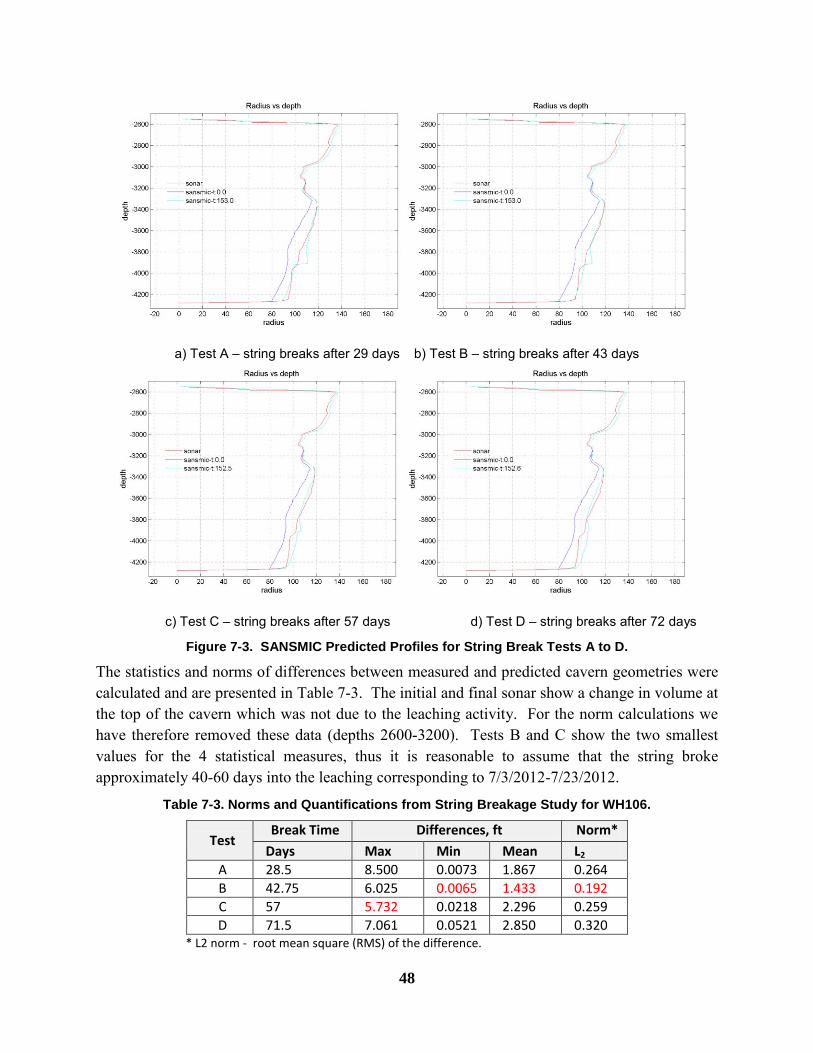
Profile comparisons for a parameter study on the timing of the string break are shown in Figure 7-3. Tests A-D were conducted assuming the string broke after different leach durations. Test A assumes the hanging string broke after 29 days, Test B after 43 days, Test C after 57 days and Test D after 72 days. The earlier the string breaks the more pronounced the ledge formation and the less the bottom of the cavern is developed. By visual inspection Test B and Test C correlate the best to the sonar measurement.
.
48
a) Test A – string breaks after 29 days b) Test B – string breaks after 43 days
c) Test C – string breaks after 57 days d) Test D – string breaks after 72 days
Figure 7-3. SANSMIC Predicted Profiles for String Break Tests A to D.
The statistics and norms of differences between measured and predicted cavern geometries were calculated and are presented in Table 7-3. The initial and final sonar show a change in volume at the top of the cavern which was not due to the leaching activity. For the norm calculations we have therefore removed these data (depths 2600-3200). Tests B and C show the two smallest values for the 4 statistical measures, thus it is reasonable to assume that the string broke approximately 40-60 days into the leaching corresponding to 7/3/2012-7/23/2012.
Table 7-3. Norms and Quantifications from String Breakage Study for WH106.
Test Break Time Differences, ft Norm*
Days Max Min Mean L2
A 28.5 8.500 0.0073 1.867 0.264
B 42.75 6.025 0.0065 1.433 0.192
C 57 5.732 0.0218 2.296 0.259
D 71.5 7.061 0.0521 2.850 0.320 * L2 norm - root mean square (RMS) of the difference.
49
7.4 Results
Results detailed below include comparisons of initial and final sonar surveys; comparisons of SANSMIC-predicted profiles with post-leach sonar data; and estimates of measured and modeled leaching efficiencies (volume leached / volume injected).
7.4.1 Profile Comparisons
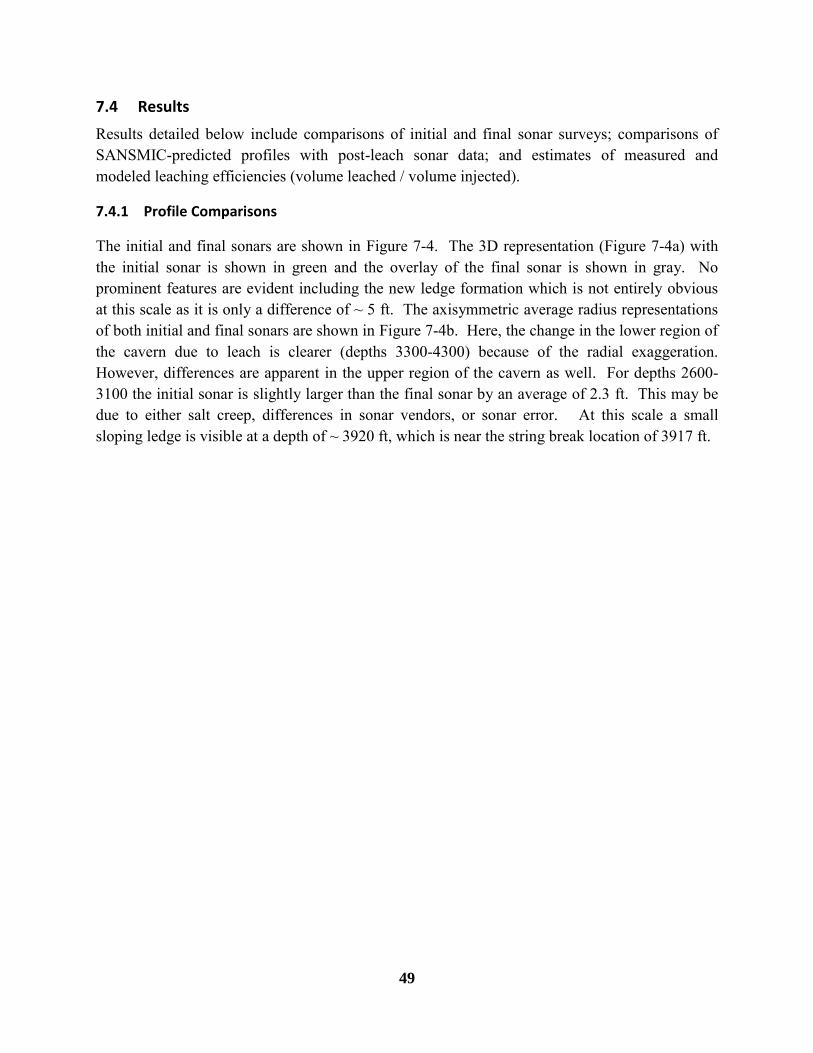
The initial and final sonars are shown in Figure 7-4. The 3D representation (Figure 7-4a) with the initial sonar is shown in green and the overlay of the final sonar is shown in gray. No prominent features are evident including the new ledge formation which is not entirely obvious at this scale as it is only a difference of ~ 5 ft. The axisymmetric average radius representations of both initial and final sonars are shown in Figure 7-4b. Here, the change in the lower region of the cavern due to leach is clearer (depths 3300-4300) because of the radial exaggeration. However, differences are apparent in the upper region of the cavern as well. For depths 2600-3100 the initial sonar is slightly larger than the final sonar by an average of 2.3 ft. This may be due to either salt creep, differences in sonar vendors, or sonar error. At this scale a small sloping ledge is visible at a depth of ~ 3920 ft, which is near the string break location of 3917 ft.
50
(a)3D (b) Axisymmetric average radius
Figure 7-4. Pre and Post Leach Sonar Comparisons of WH106.
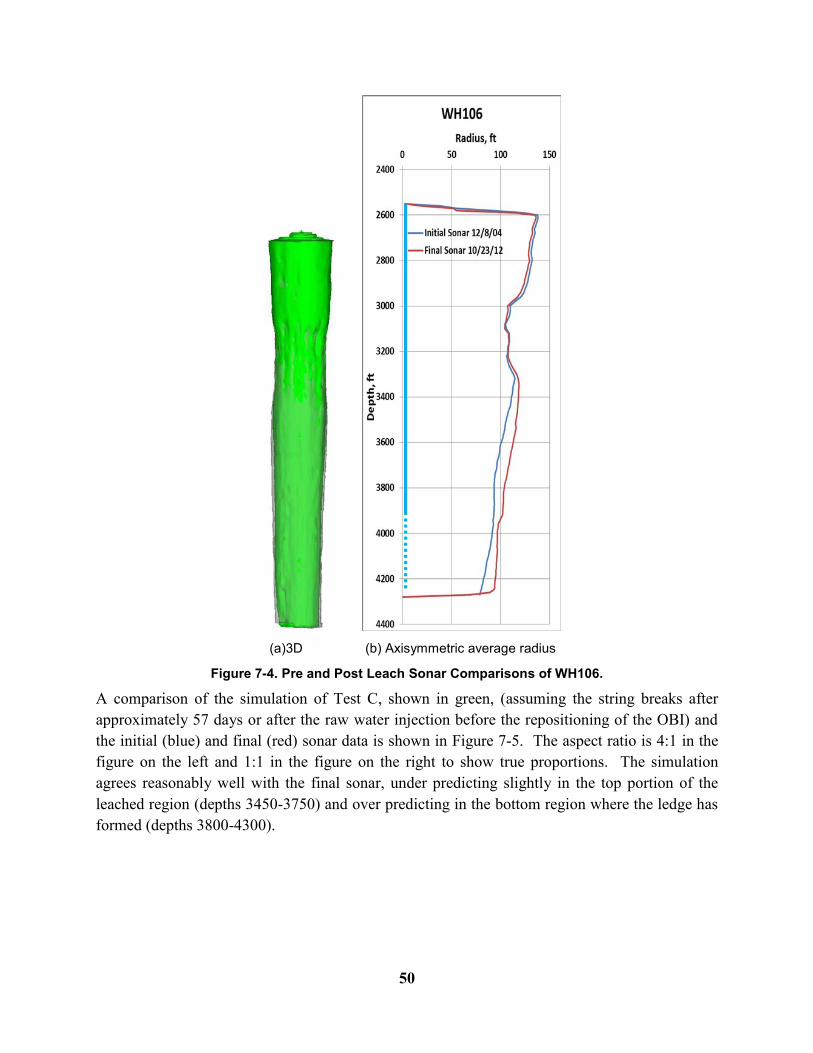
A comparison of the simulation of Test C, shown in green, (assuming the string breaks after approximately 57 days or after the raw water injection before the repositioning of the OBI) and the initial (blue) and final (red) sonar data is shown in Figure 7-5. The aspect ratio is 4:1 in the figure on the left and 1:1 in the figure on the right to show true proportions. The simulation agrees reasonably well with the final sonar, under predicting slightly in the top portion of the leached region (depths 3450-3750) and over predicting in the bottom region where the ledge has formed (depths 3800-4300).
51
Figure 7-5. Sonar vs. SANSMIC Predicted Profiles of WH06.
7.4.2 Leach Efficiencies
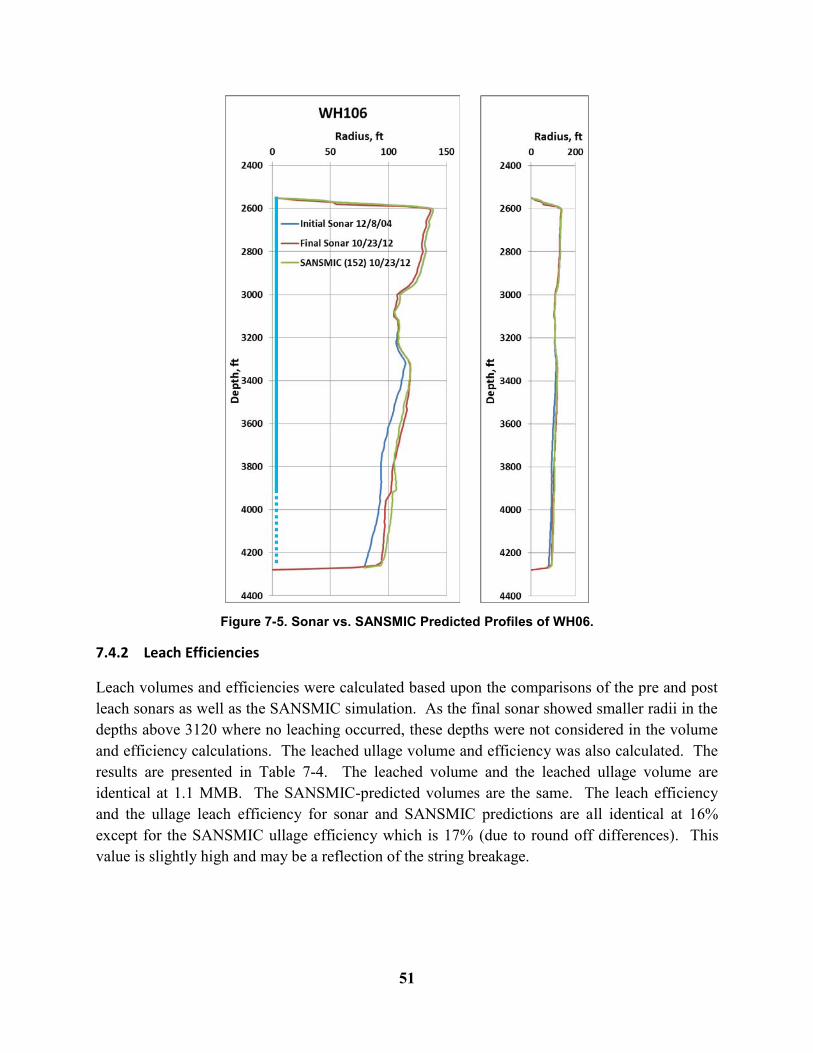
Leach volumes and efficiencies were calculated based upon the comparisons of the pre and post leach sonars as well as the SANSMIC simulation. As the final sonar showed smaller radii in the depths above 3120 where no leaching occurred, these depths were not considered in the volume and efficiency calculations. The leached ullage volume and efficiency was also calculated. The results are presented in Table 7-4. The leached volume and the leached ullage volume are identical at 1.1 MMB. The SANSMIC-predicted volumes are the same. The leach efficiency and the ullage leach efficiency for sonar and SANSMIC predictions are all identical at 16% except for the SANSMIC ullage efficiency which is 17% (due to round off differences). This value is slightly high and may be a reflection of the string breakage.
52
Table 7-4. Leach Efficiency Parameters for WH106.
Parameter Value
Raw water injected, MMB 6.9
Initial sonar volume# below z=3120, MMB 6.2
Final sonar volume below z=3120, MMB 7.3
Ullage reference depth, ft 4250
Leached volume, MMB 1.1
Leached ullage volume, MMB 1.1
Leach efficiency 16%
Ullage leach efficiency 16%
SANSMIC leach volume, MMB 1.1
SANSMIC leached ullage volume, MMB 1.1
SANSMIC predicted leach efficiency to this point 16%
SANSMIC ullage leach efficiency 17% #Final measured sonar station appears to be above actual floor. Sonar may
be truncated.
7.4.3 Sonar Data with Speed of Sound
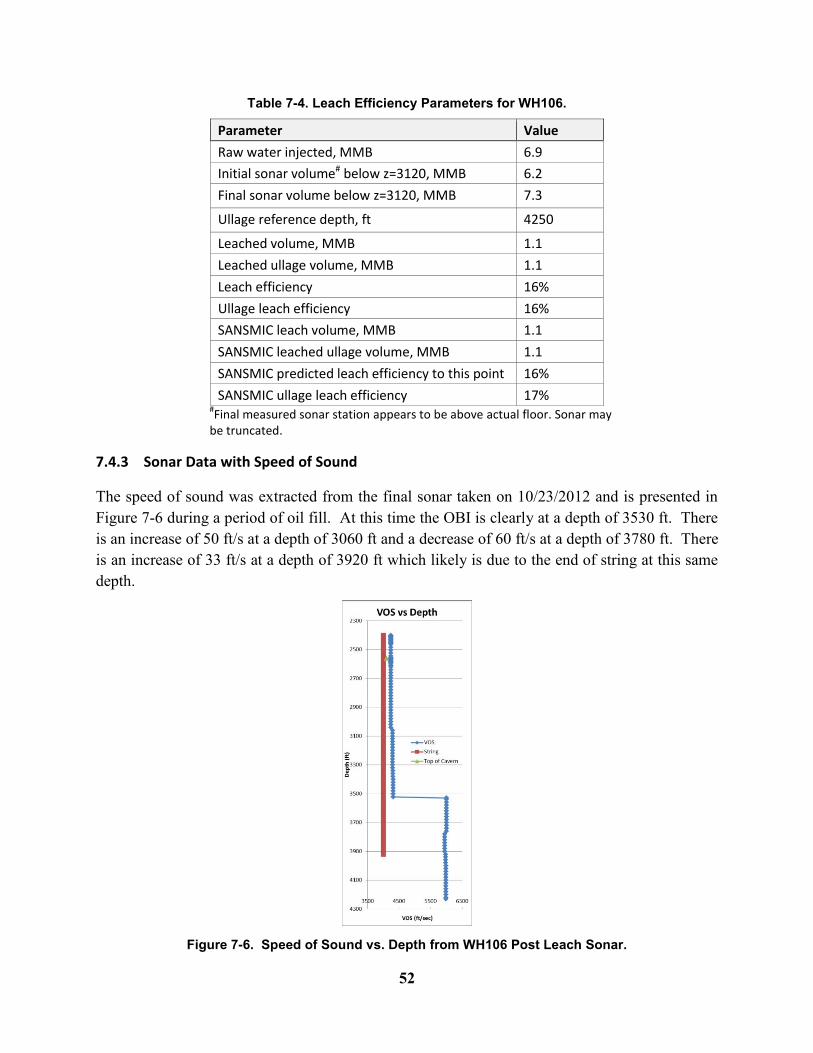
The speed of sound was extracted from the final sonar taken on 10/23/2012 and is presented in Figure 7-6 during a period of oil fill. At this time the OBI is clearly at a depth of 3530 ft. There is an increase of 50 ft/s at a depth of 3060 ft and a decrease of 60 ft/s at a depth of 3780 ft. There is an increase of 33 ft/s at a depth of 3920 ft which likely is due to the end of string at this same depth.
Figure 7-6. Speed of Sound vs. Depth from WH106 Post Leach Sonar.
53
7.5 Conclusions for WH106
WH106 also experienced a string break resulting in total and ullage volume creations that are nearly identical at 1.1 MMB and leach efficiencies that are approximately 16%. The lack of logging data makes it difficult to ascertain when the string break occurred, however a sensitivity study suggested a time of 40-60 days. Raw water injected into the cavern expanded the bottom of the cavern and effectively used most of a drawdown cycle.

54
Page intentionally left blank.
55
8 Conclusions and Recommendations
The perforated and severed hanging brine strings gave rise to small but modelable deviations from normal leach patterns for three of the four remedial leached caverns discussed in this report - BH101, WH105 and WH106. BH104 did not experience a string break. The deviations from expected leach patterns due to broken strings were within normal cavern leach variability and do not affect the near-term geomechanical stability of the caverns. All leaching was performed as withdrawal leaches so the string breaks and perforation caused a double taper with a small sloping ledge near the level of the break. Largest cavern radius increases were near the injection depths and cavern radius-change decreased up to the ledge, then increased, then tapered to zero at the highest OBI position. The string breaks resulted in more leaching above the ullage reference depth and higher ullage leach efficiencies than would be expected from a normal withdrawal without a string break. Salt-block falls, which may have caused the string breaks, would also enhance this behavior. However, this would also raise the cavern floor higher than would normally be expected. This may have contributed to the brine string damage and subsequent string perforations for BH101. Even with the string breaks, which shifted leaching up in the cavern, significant leaching occurred in the bottom or toe of the cavern, likely decreasing the number of available drawdowns until the P/D ratio criteria are met. Note that BM113 also saw string breaks during both the withdrawal to position the OBI and during the first stage top-inject leach.
Leach volumes and efficiencies are summarized in Table 8-1. Total leached volume ranged from 0.3 to 2.33 MMB while ullage leached volume was slightly higher from 0.3 to 2.4 MMB due to both string breaks and salt-block falls, which increased accessible volume higher up in the cavern. Leach efficiencies ranged from 15 to 16% excluding BM113 and BH101 which were slightly higher than theoretical at 19 to 20% vs. ~16%. BM113 issues are fairly well understood to be due to sonar surveying through pipe and non-equilibrium of the brine in the cavern (Rudeen, Weber et al. 2013). The reasons for the high leach efficiency values for BH101 are not understood at this time. Large salt block falls could explain high values for leached ullage volume, but should not significantly affect total leached volume.
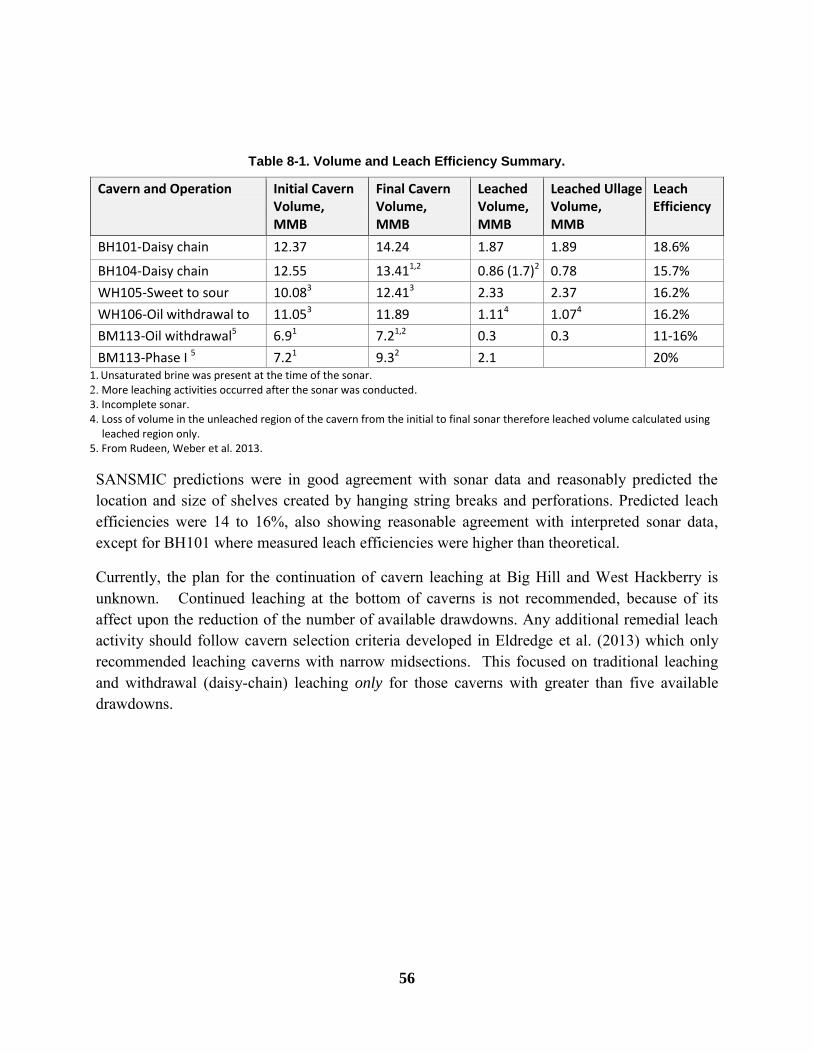
56
Table 8-1. Volume and Leach Efficiency Summary.
Cavern and Operation Initial Cavern Volume, MMB MMB
Final Cavern Volume, MMB
Leached Volume, MMB
Leached Ullage Volume, MMB
Leach Efficiency
BH101-Daisy chain 12.37 14.24 1.87 1.89 18.6%
BH104-Daisy chain 12.55 13.411,2 0.86 (1.7)2 0.78 15.7%
WH105-Sweet to sour conversion
10.083 12.413 2.33 2.37 16.2%
WH106-Oil withdrawal to WH106
11.053 11.89 1.114 1.074 16.2%
BM113-Oil withdrawal5 6.91 7.21,2 0.3 0.3 11-16%
BM113-Phase I 5 7.21 9.32 2.1 20% 1.
Unsaturated brine was present at the time of the sonar.
2. More leaching activities occurred after the sonar was conducted. 3. Incomplete sonar. 4. Loss of volume in the unleached region of the cavern from the initial to final sonar therefore leached volume calculated using
leached region only. 5. From Rudeen, Weber et al. 2013.
SANSMIC predictions were in good agreement with sonar data and reasonably predicted the location and size of shelves created by hanging string breaks and perforations. Predicted leach efficiencies were 14 to 16%, also showing reasonable agreement with interpreted sonar data, except for BH101 where measured leach efficiencies were higher than theoretical.
Currently, the plan for the continuation of cavern leaching at Big Hill and West Hackberry is unknown. Continued leaching at the bottom of caverns is not recommended, because of its affect upon the reduction of the number of available drawdowns. Any additional remedial leach activity should follow cavern selection criteria developed in Eldredge et al. (2013) which only recommended leaching caverns with narrow midsections. This focused on traditional leaching and withdrawal (daisy-chain) leaching only for those caverns with greater than five available drawdowns.
57
9 References
Eldredge, L. L., D. Checkai, G. Osborne, D. L. Lord, D. K. Rudeen, P. D. Weber and K. A.
Gutierrez (2013). "Technical Basis for 2013 SPR Remedial Leach Plan." SPR Joint Working Group on Cavern Leaching. DM Petroleum Operations, New Orleans, LA. U.S. Strategic Petroleum Reserve.
Johnson, D. (2011). "SPR Project Management Directive: SPR Capacity Maintenance Plan." PMD 11-2, U.S. Department of Energy. Washington, DC 20585. U.S. Strategic Petroleum Reserve.
Lord, D. L., B. L. Ehgartner, K. A. Gutierrez, A. S. Lord, M. B. Nemer, C. A. Rautman, B. L. Roberts, A. R. Sattler and D. K. Rudeen (2011). "Albuquerque Leaching Technical Exchange Summary Report, Sandia Contribution." Sandia National Laboratories. Geotechnology & Engineering Department, Albuquerque, NM. Strategic Petroleum Reserve.
Nemer, M. B. and D. L. Lord (2012). "Review of WH105 Emulsion Potential during FY2012 Remedial Leach." Geotechnology & Engineering Department. Sandia National Laboratories, Albuquerque, NM 87185, USA. U.S. Strategic Petroleum Reserve.
Rudeen, D. K. and D. L. Lord (2012). "2012 Leach plan for Completion of BM113 to 11.2 MMB." Geotechology & Engineering, Sandia National Laboratories, Albuquerque, NM, USA. U.S. Strategic Petroleum Reserve.
Rudeen, D. K., P. D. Weber and D. L. Lord (2013). "Bryan Mound Cavern 113 Remedial Leach Stage 1 Analysis." SAND2013-6186, Geotechnology & Engineering, Sandia National Laboratories, Albuquerque, NM 87185, USA. U.S. Strategic Petroleum Reserve.
Russo, A. J. (1981). "A Solution Mining Code for Studying Axisymmetric Salt Cavern Formation." Unlimited Release SAND81-1231, Sandia National Laboratories, Albuquerque, NM.

58
Page intentionally left blank.
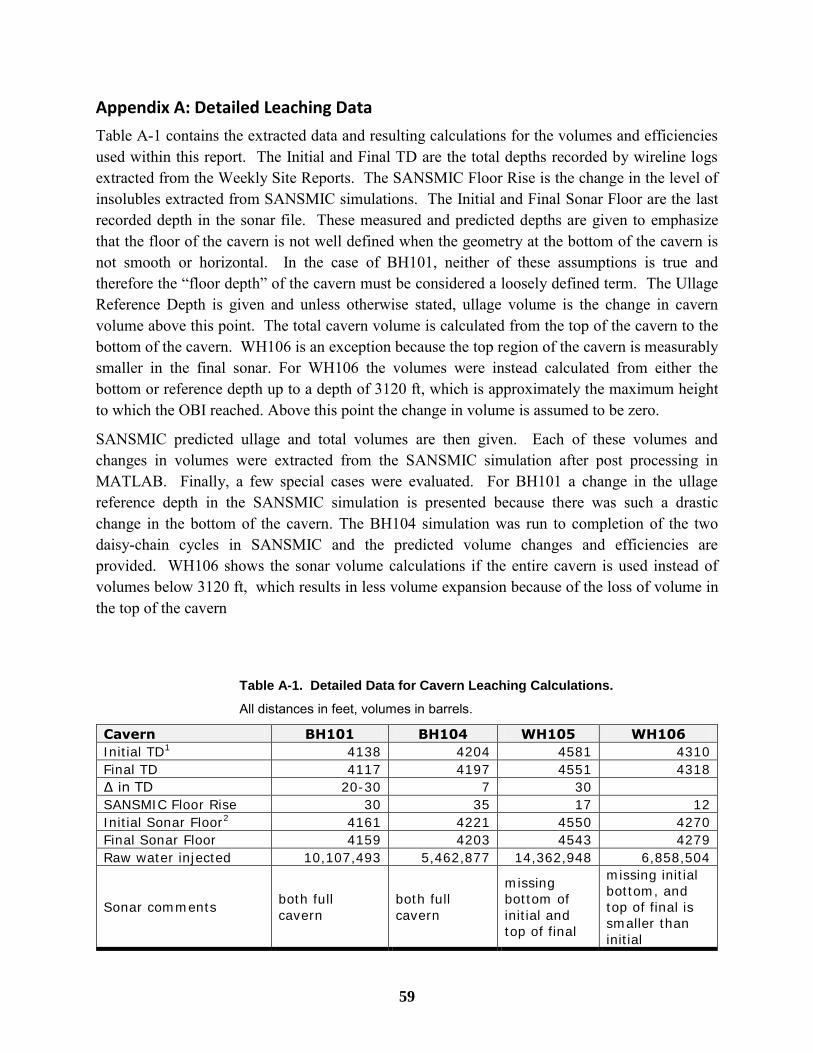
59
Appendix A: Detailed Leaching Data
Table A-1 contains the extracted data and resulting calculations for the volumes and efficiencies used within this report. The Initial and Final TD are the total depths recorded by wireline logs extracted from the Weekly Site Reports. The SANSMIC Floor Rise is the change in the level of insolubles extracted from SANSMIC simulations. The Initial and Final Sonar Floor are the last recorded depth in the sonar file. These measured and predicted depths are given to emphasize that the floor of the cavern is not well defined when the geometry at the bottom of the cavern is not smooth or horizontal. In the case of BH101, neither of these assumptions is true and therefore the “floor depth” of the cavern must be considered a loosely defined term. The Ullage Reference Depth is given and unless otherwise stated, ullage volume is the change in cavern volume above this point. The total cavern volume is calculated from the top of the cavern to the bottom of the cavern. WH106 is an exception because the top region of the cavern is measurably smaller in the final sonar. For WH106 the volumes were instead calculated from either the bottom or reference depth up to a depth of 3120 ft, which is approximately the maximum height to which the OBI reached. Above this point the change in volume is assumed to be zero.
SANSMIC predicted ullage and total volumes are then given. Each of these volumes and changes in volumes were extracted from the SANSMIC simulation after post processing in MATLAB. Finally, a few special cases were evaluated. For BH101 a change in the ullage reference depth in the SANSMIC simulation is presented because there was such a drastic change in the bottom of the cavern. The BH104 simulation was run to completion of the two daisy-chain cycles in SANSMIC and the predicted volume changes and efficiencies are provided. WH106 shows the sonar volume calculations if the entire cavern is used instead of volumes below 3120 ft, which results in less volume expansion because of the loss of volume in the top of the cavern
Table A-1. Detailed Data for Cavern Leaching Calculations.
All distances in feet, volumes in barrels.
Cavern BH101 BH104 WH105 WH106
Initial TD1 4138 4204 4581 4310
Final TD 4117 4197 4551 4318
∆ in TD 20-30 7 30
SANSMIC Floor Rise 30 35 17 12
Initial Sonar Floor2 4161 4221 4550 4270
Final Sonar Floor 4159 4203 4543 4279
Raw water injected 10,107,493 5,462,877 14,362,948 6,858,504
Sonar comments both full
cavern
both full
cavern
missing
bottom of
initial and
top of final
missing initial
bottom, and
top of final is
smaller than
initial
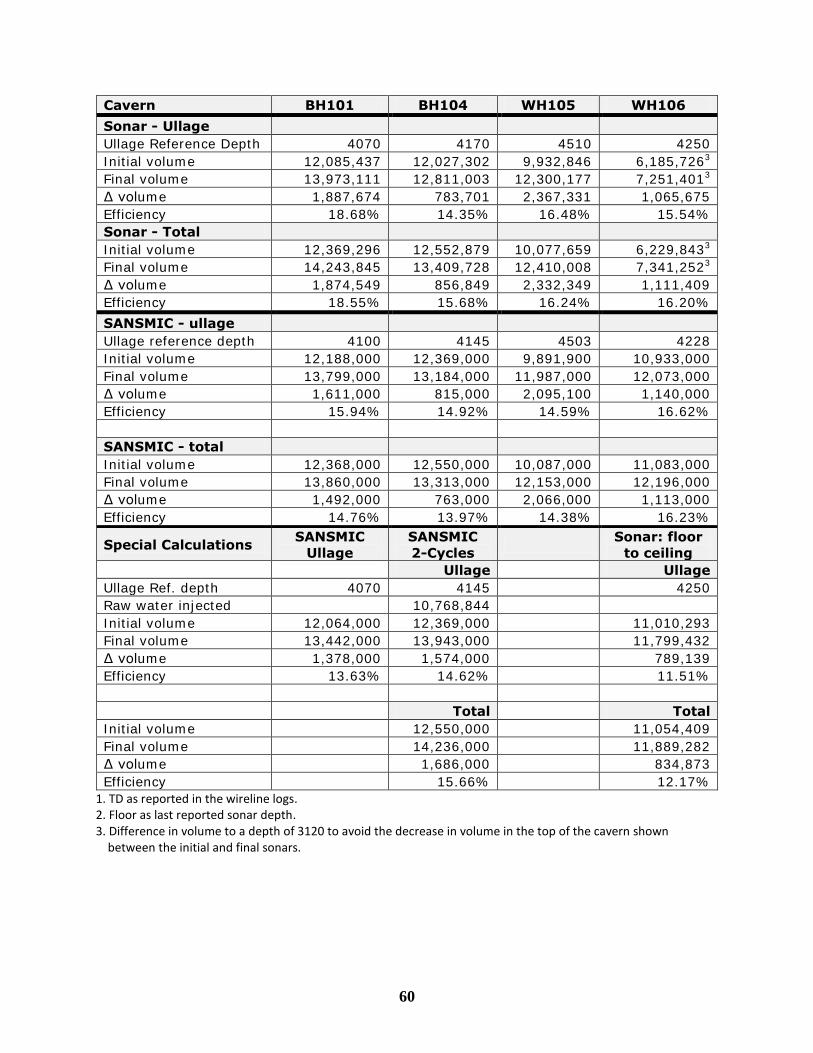
60
Cavern BH101 BH104 WH105 WH106
Sonar - Ullage
Ullage Reference Depth 4070 4170 4510 4250
Initial volume 12,085,437 12,027,302 9,932,846 6,185,7263
Final volume 13,973,111 12,811,003 12,300,177 7,251,4013
∆ volume 1,887,674 783,701 2,367,331 1,065,675
Efficiency 18.68% 14.35% 16.48% 15.54%
Sonar - Total
Initial volume 12,369,296 12,552,879 10,077,659 6,229,8433
Final volume 14,243,845 13,409,728 12,410,008 7,341,2523
∆ volume 1,874,549 856,849 2,332,349 1,111,409
Efficiency 18.55% 15.68% 16.24% 16.20%
SANSMIC - ullage
Ullage reference depth 4100 4145 4503 4228
Initial volume 12,188,000 12,369,000 9,891,900 10,933,000
Final volume 13,799,000 13,184,000 11,987,000 12,073,000
∆ volume 1,611,000 815,000 2,095,100 1,140,000
Efficiency 15.94% 14.92% 14.59% 16.62%
SANSMIC - total
Initial volume 12,368,000 12,550,000 10,087,000 11,083,000
Final volume 13,860,000 13,313,000 12,153,000 12,196,000
∆ volume 1,492,000 763,000 2,066,000 1,113,000
Efficiency 14.76% 13.97% 14.38% 16.23%
Special Calculations SANSMIC
Ullage
SANSMIC
2-Cycles
Sonar: floor
to ceiling
Ullage Ullage
Ullage Ref. depth 4070 4145 4250
Raw water injected 10,768,844
Initial volume 12,064,000 12,369,000 11,010,293
Final volume 13,442,000 13,943,000 11,799,432
∆ volume 1,378,000 1,574,000 789,139
Efficiency 13.63% 14.62% 11.51%
Total Total
Initial volume 12,550,000 11,054,409
Final volume 14,236,000 11,889,282
∆ volume 1,686,000 834,873
Efficiency 15.66% 12.17%
1. TD as reported in the wireline logs. 2. Floor as last reported sonar depth. 3. Difference in volume to a depth of 3120 to avoid the decrease in volume in the top of the cavern shown
between the initial and final sonars.
61
Distribution
External Distribution Electronic copies to:
Wayne Elias ([email protected]) for distribution to DOE SPR Program Office, 1000 Independence Ave. SW Washington, DC 20585 Diane Willard ([email protected]) for distribution to DOE and DM SPR Project Management Office, 900 Commerce Road East New Orleans, LA 70123
Sandia Distribution Print copies to: 2 MS0706 David Lord 6912 2 MS0706 Paula Weber 6912 5 MS0750 Carolyn Kirby 6913 Electronic Copies: MS0899 Technical Library, 9536 (electronic copy)

62