analysis of speeding-related fatal motor vehicle … hs 809 839 june 2005 technical report analysis...
TRANSCRIPT
DOT HS 809 839June 2005
Technical Report
Analysis of Speeding-RelatedFatal Motor Vehicle Traffic Crashes
This document is available to the public from the National Techinical Information Service, SpringÞ eld, VA 22161
This publication is distributed by the U.S. Department of Transportation, National Highway Traffic Safety Administration, in the interest of information exchange. The opinions, findings and conclusions expressed in this publication are those of the author(s) and not necessarily those of the Department of Transportation or the National Highway Traffic Safety Administration. The United States Government assumes no liability for its contents or use thereof. If trade or manufacturers’ names are mentioned, it is only because they are considered essential to the object of the publication and should not be construed as an endorsement. The United States Government does not endorse products or manufacturers.
Technical Report Documentation Page 1. Report No. DOT HS 809 839
2. Government Accession No.
3. Recipients's Catalog No.
5. Report Date
June, 2005
4. Title and Subtitle
Analysis of Speeding-Related Fatal Motor Vehicle Traffic Crashes
6. Performing Organization Code
NPO-120
7. Author(s) Cejun Liu*, Chou-Lin Chen†, Rajesh Subramanian*, and Dennis Utter†
8. Performing Organization Report No. 10. Work Unit No. (TRAIS)n code
9. Performing Organization Name and Address * Program Analysts, employed by Rainbow Technology Inc., working for the Mathematical Analysis Division, National Center for Statistics and Analysis, NHTSA. † Mathematical Statisticians, Mathematical Analysis Division, National Center for Statistics and Analysis, NHTSA.
11. Contract of Grant No.
13. Type of Report and Period Covered NHTSA Technical Report
12. Sponsoring Agency Name and Address Mathematical Analysis Division, National Center for Statistics and Analysis National Highway Traffic Safety Administration U.S. Department of Transportation NPO-120, 400 Seventh Street, S.W. Washington, DC 20590
14. Sponsoring Agency Code
15.Supplementary Notes Authors wish to thank Charlene Doyle, Earl Hardy at NHTSA, Davey Warren at FHWA and other reviewers at NHTSA for useful comments. Tom Bragan and OCCI of NHTSA for proofreading this report. 16. Abstract This study analyzes speeding-related motor vehicle traffic fatal crashes using NHTSA’s Fatality Analysis Reporting System (FARS). Of interest are characteristics of drivers that are speeding as well as the extent of this problem in the states. The analysis is presented along major categories of interest that are likely to affect speeding like environmental, behavioral and vehicle-related factors. A separate section discusses the extent of speeding-related crashes by state. 17. Key Words Speeding-Related, Fatalities
18. Distribution Statement Document is available to the public through the National Technical Information Service, Springfield, VA 22161
19. Security Classif. (of this report) Unclassified
20. Security Classif. (of this page) Unclassified
21. No of Pages 70
22. Price
Form DOT F1700.7 (8-72) Reproduction of completed page authorized

[This page intentionally left blank]
Table of Contents Executive Summary ................................................................................................ 1 1. Introduction ........................................................................................................... 2 2. Speeding-Related Fatal Crashes and Fatalities........................................ 3
2.1 Trend of Speeding-Related Fatal Crashes and Fatalities ....................................................................................3 2.2 Speeding-Related Fatal Crashes by Environmental Related Factors ..................................................................7 2.3 Speeding-Related Fatal Crashes by Driver’s Behavior Related Factors ...........................................................18 2.4 Speeding-Related Fatal Crashes by Vehicle Related Factors ...........................................................................22
3. Trend of Speeding-Related Fatalities by State........................................ 29 4. Conclusions ........................................................................................................ 33 5. References........................................................................................................... 34 6. Appendix .............................................................................................................. 35
6.1 Speeding-Related Fatal Crashes and Fatalities by Day of the Week..................................................... 35 6.2 Speeding-Related Fatalities by Speed Limit ................................................................................... 37 6.3 Speeding-Related Fatalities by Roadway Function Class .................................................................. 38 6.4 National (Total) Fatalities by Roadway Functional Class .................................................................. 39 6.5 Speeding-Related Fatalities by Roadway Functional Class ................................................................ 40 6.6 National (Total) Fatality Rate per 100 Highway Mileage by Roadway Functional Class.......................... 41 6.7 Speeding-Related Fatality Rate per 100 Highway Mileage by Roadway Functional Class ....................... 42 6.8 National (Total) Fatality Rate per 100 Million VMT by Roadway Functional Class ............................... 43 6.9 Speeding-Related Fatality Rate per 100 Million VMT by Roadway Functional Class ............................. 44 6.10 Speeding Drivers and Relative Proportion of Speeding Drivers (Number in Parenthesis) in Fatal Crashes by Age and Sex ................................................................................................................................. 45 6.11 Speeding Drivers and Relative Proportion of Speeding Drivers (Number in Parenthesis) in Fatal Crashes by Time of Day ................................................................................................................................. 46 6.12 Speeding Drivers and Relative Proportion of Speeding Drivers (Number in Parenthesis) in Fatal Crashes by Alcohol BAC ................................................................................................................................ 47 6.13 Speeding Drivers and Relative Proportion of Speeding Drivers (Number in Parenthesis) in Fatal Crashes by Vehicle Type ................................................................................................................................ 48 6.14 Speeding-Related Single-Vehicle Fatalities by Roadway Functional Class.......................................... 49 6.15 Speeding- Related Multiple-Vehicle Fatalities by Roadway Functional Class...................................... 50 6.16 Percent of Single- and Multiple-Vehicle Speeding-Related Fatalities by Roadway Functional Class ........ 51 6.17 (a) Speeding-Related Fatalities as a Percentage of Total Fatalities by State ......................................... 53 6.17 (b) Total Fatalities, Speeding-Related Fatalities and its Percent to the Total by State in US.................... 57

[This page intentionally left blank]
________________________________________________________________________ National Center for Statistics and Analysis, 400 Seventh St., S.W., Washington, DC 20590
1
Executive Summary In 2002, 13,713 fatalities -- about a third of all fatalities that occurred in motor vehicle traffic crashes were speeding-related, i.e., at least one of the drivers involved in the crash was speeding. This is the highest number of speeding-related fatalities since 1991, when 13,915 persons were killed in such crashes. The geometry of the road plays a vital role in the occurrence of speeding-related crashes. In 2002, about 40 percent of speeding-related fatal crashes occurred while negotiating a curve, while slightly less than 20 percent of non-speeding related fatal crashes occurred under similar roadway geometry. Driver impairment is highly correlated with speeding among drivers involved in fatal crashes. About 41 percent of drivers who were intoxicated (BAC=0.08+) were also speeding as compared to 14 percent for sober drivers. A major proportion of fatal, speeding-related single-vehicle crashes occur on rural roadways. There has been a recent increase in the number of fatalities in speeding-related single-vehicle crashes that occur on local roads in rural jurisdictions. Speeding-related fatalities as a proportion of total fatalities show a quantitative difference between the eastern and western halves of the United States. The western states show a higher proportion of their overall fatalities to be speeding-related as compared to the eastern states. Between 1983 and 2002, New Jersey had the lowest overall proportion of fatalities that are speeding-related while South Carolina had the highest such percentage.
________________________________________________________________________ National Center for Statistics and Analysis, 400 Seventh St., S.W., Washington, DC 20590
2
1. Introduction Motor vehicle traffic crashes are complex events that are a culmination of various driver, vehicle or environment-related factors. Driver-related factors that contribute to motor vehicle traffic crashes are mostly behavioral in nature. These include impaired driving, aggressive driving including speeding, and distracted driving, etc. This report will present analysis on speeding-related motor vehicle traffic crashes. NHTSA research has shown that crashes in which at least one driver was exceeding the legal speed limit or driving too fast for conditions cost $40.4 billion in 2000, representing about 20 percent of the total economic cost of motor vehicle traffic crashes in the United States. Annually, about 32 percent of all fatalities in motor vehicle traffic crashes were speeding-related, i.e., at least one of the drivers involved in the crash exceeded the posted speed limit or was driving too fast for the prevailing conditions. The analysis presented in this report will detail the characteristics of the speeding driver (e.g. demographic and geographic attributes) that will help identify potential avenues to target counter-measures. This report presents descriptive statistics on speeding-related crashes in two major sections. The first section will depict national trends of speeding-related crashes and speeding drivers using data from NHTSA’s Fatality Analysis Reporting System (FARS) data from 1983 to 2002 [1] (there are certain variables that could not be captured in early years). Detailed analyses are presented to identify driver, vehicle and environmental characteristics that are prevalent in speeding-related crashes in the nation as a whole. Age, gender and alcohol-involvement of the speeding driver, roadway surface condition and geometry as well as roadway function class are some of the factors analyzed in this section. The second section of this report analyzes the overall trend of speeding-related fatalities and fatal crashes by state of occurrence from 1983 to 2002 using FARS data. A companion report analyzes the effect of the National Maximum Speed Limit (NMSL) appeal on speeding-related crash fatalities in the U.S. Techniques involving direct comparisons, Chi-sq statistical analysis and a time series cross-sectional regression procedure are employed to study the effect of changing legislations on speeding-related crash fatalities by comparing states that had such a change with a control group of states where there were no changes for the corresponding period of time. To our knowledge, this is the first work to evaluate the effect of NMSL repeal on speeding-related crash fatalities. Finally, it should be noted that NHTSA recently changed its definition of speeding-related crashes (see Section 2 and [2]) and hence the data in this report may not exactly match previously published statistics on this topic.
________________________________________________________________________ National Center for Statistics and Analysis, 400 Seventh St., S.W., Washington, DC 20590
3
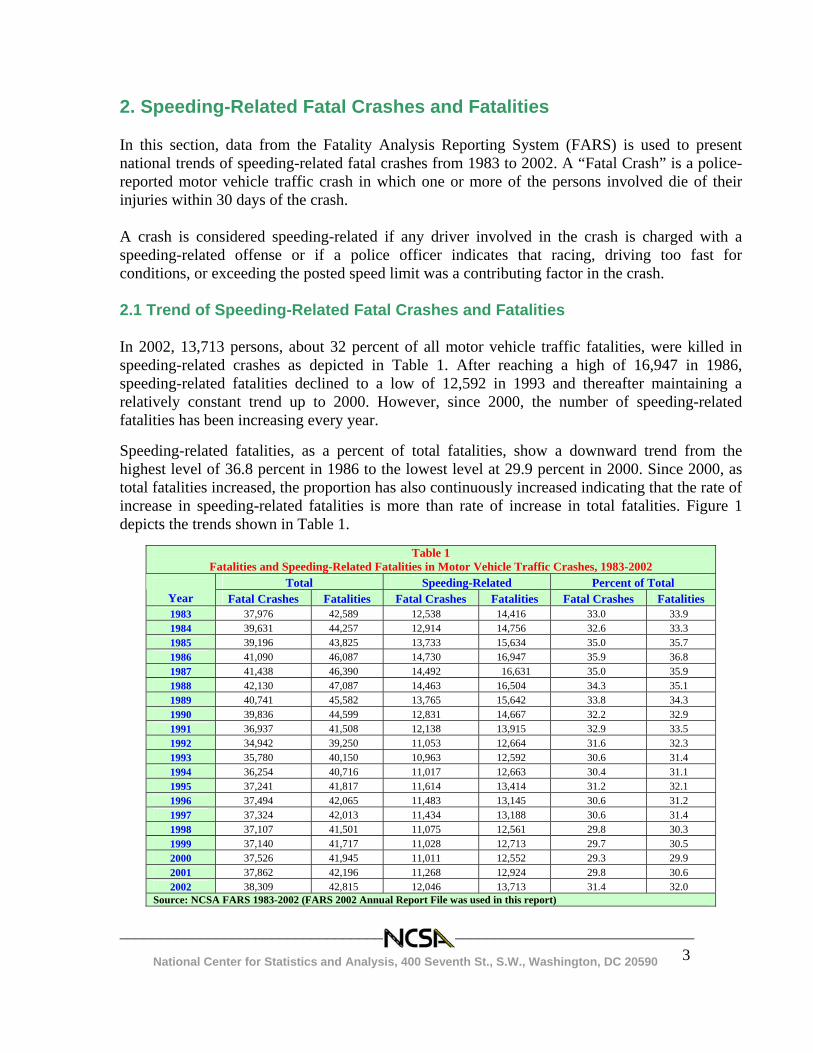
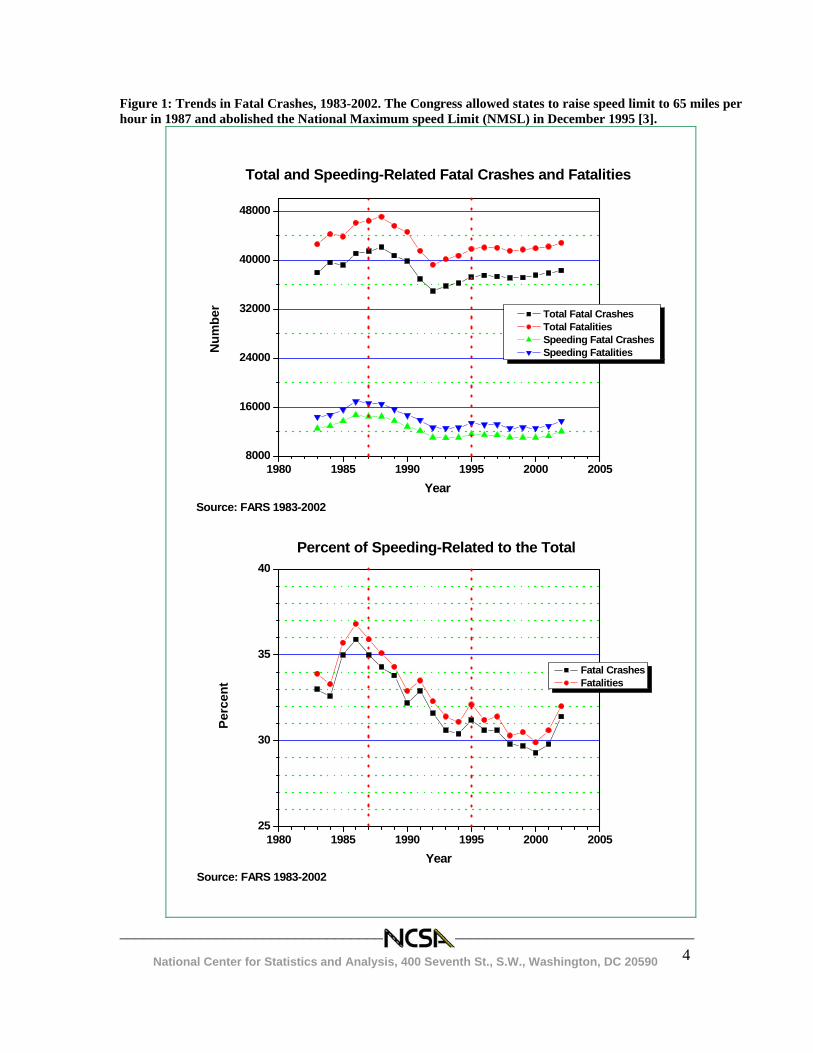
2. Speeding-Related Fatal Crashes and Fatalities In this section, data from the Fatality Analysis Reporting System (FARS) is used to present national trends of speeding-related fatal crashes from 1983 to 2002. A “Fatal Crash” is a police-reported motor vehicle traffic crash in which one or more of the persons involved die of their injuries within 30 days of the crash. A crash is considered speeding-related if any driver involved in the crash is charged with a speeding-related offense or if a police officer indicates that racing, driving too fast for conditions, or exceeding the posted speed limit was a contributing factor in the crash. 2.1 Trend of Speeding-Related Fatal Crashes and Fatalities In 2002, 13,713 persons, about 32 percent of all motor vehicle traffic fatalities, were killed in speeding-related crashes as depicted in Table 1. After reaching a high of 16,947 in 1986, speeding-related fatalities declined to a low of 12,592 in 1993 and thereafter maintaining a relatively constant trend up to 2000. However, since 2000, the number of speeding-related fatalities has been increasing every year. Speeding-related fatalities, as a percent of total fatalities, show a downward trend from the highest level of 36.8 percent in 1986 to the lowest level at 29.9 percent in 2000. Since 2000, as total fatalities increased, the proportion has also continuously increased indicating that the rate of increase in speeding-related fatalities is more than rate of increase in total fatalities. Figure 1 depicts the trends shown in Table 1.
Table 1 Fatalities and Speeding-Related Fatalities in Motor Vehicle Traffic Crashes, 1983-2002
Total Speeding-Related Percent of Total Year Fatal Crashes Fatalities Fatal Crashes Fatalities Fatal Crashes Fatalities 1983 37,976 42,589 12,538 14,416 33.0 33.9 1984 39,631 44,257 12,914 14,756 32.6 33.3 1985 39,196 43,825 13,733 15,634 35.0 35.7 1986 41,090 46,087 14,730 16,947 35.9 36.8 1987 41,438 46,390 14,492 16,631 35.0 35.9 1988 42,130 47,087 14,463 16,504 34.3 35.1 1989 40,741 45,582 13,765 15,642 33.8 34.3 1990 39,836 44,599 12,831 14,667 32.2 32.9 1991 36,937 41,508 12,138 13,915 32.9 33.5 1992 34,942 39,250 11,053 12,664 31.6 32.3 1993 35,780 40,150 10,963 12,592 30.6 31.4 1994 36,254 40,716 11,017 12,663 30.4 31.1 1995 37,241 41,817 11,614 13,414 31.2 32.1 1996 37,494 42,065 11,483 13,145 30.6 31.2 1997 37,324 42,013 11,434 13,188 30.6 31.4 1998 37,107 41,501 11,075 12,561 29.8 30.3 1999 37,140 41,717 11,028 12,713 29.7 30.5 2000 37,526 41,945 11,011 12,552 29.3 29.9 2001 37,862 42,196 11,268 12,924 29.8 30.6 2002 38,309 42,815 12,046 13,713 31.4 32.0
Source: NCSA FARS 1983-2002 (FARS 2002 Annual Report File was used in this report)
________________________________________________________________________ National Center for Statistics and Analysis, 400 Seventh St., S.W., Washington, DC 20590
4
Figure 1: Trends in Fatal Crashes, 1983-2002. The Congress allowed states to raise speed limit to 65 miles per hour in 1987 and abolished the National Maximum speed Limit (NMSL) in December 1995 [3].
1980 1985 1990 1995 2000 200525
30
35
40
Source: FARS 1983-2002Year
Percent of Speeding-Related to the Total
Fatal Crashes Fatalities
Perc
ent
1980 1985 1990 1995 2000 20058000
16000
24000
32000
40000
48000
Total and Speeding-Related Fatal Crashes and Fatalities
YearSource: FARS 1983-2002
Total Fatal Crashes Total Fatalities Speeding Fatal Crashes Speeding FatalitiesN
umbe
r
________________________________________________________________________ National Center for Statistics and Analysis, 400 Seventh St., S.W., Washington, DC 20590
5
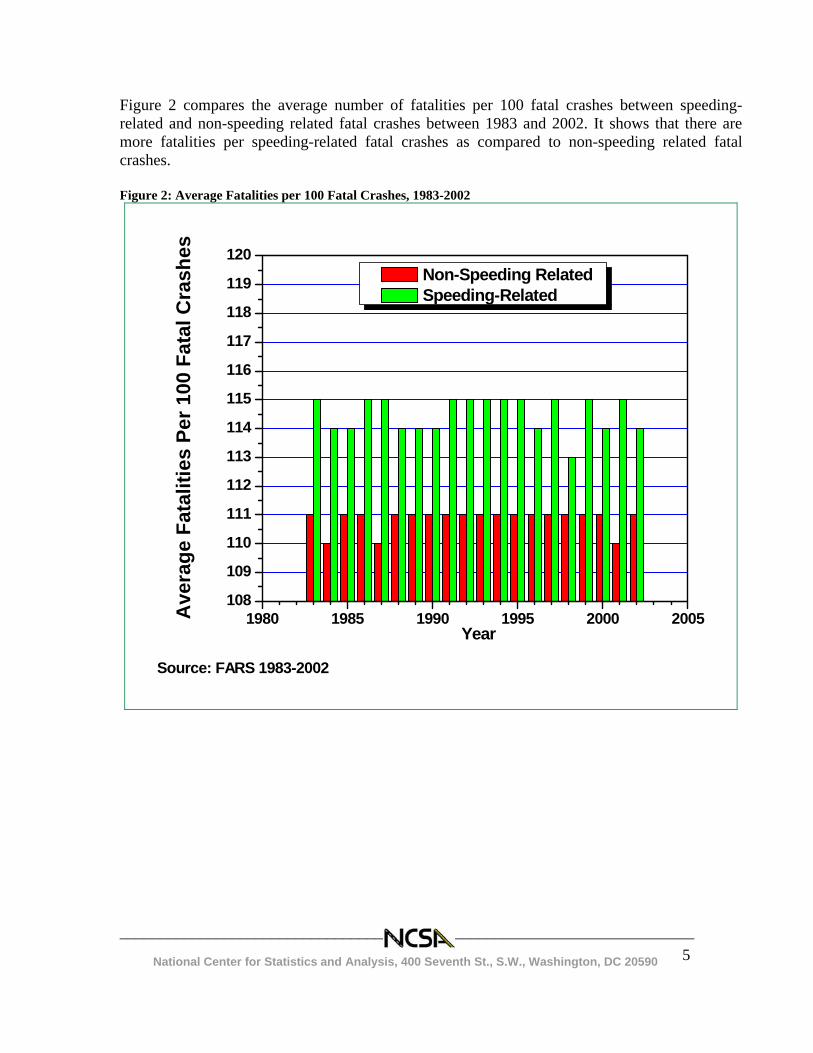
Figure 2 compares the average number of fatalities per 100 fatal crashes between speeding-related and non-speeding related fatal crashes between 1983 and 2002. It shows that there are more fatalities per speeding-related fatal crashes as compared to non-speeding related fatal crashes. Figure 2: Average Fatalities per 100 Fatal Crashes, 1983-2002
1980 1985 1990 1995 2000 2005108
109
110
111
112
113
114
115
116
117
118
119
120
Year
Source: FARS 1983-2002
Ave
rage
Fat
aliti
es P
er 1
00 F
atal
Cra
shes
Non-Speeding Related Speeding-Related
________________________________________________________________________ National Center for Statistics and Analysis, 400 Seventh St., S.W., Washington, DC 20590
6
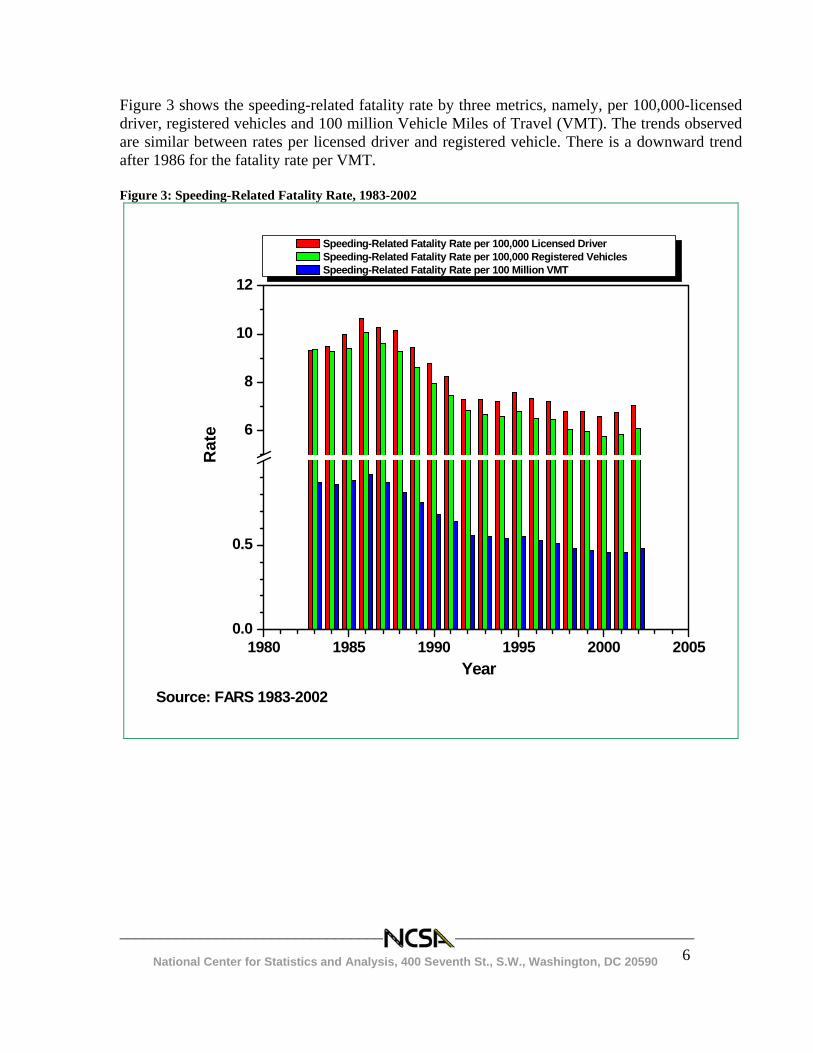
Figure 3 shows the speeding-related fatality rate by three metrics, namely, per 100,000-licensed driver, registered vehicles and 100 million Vehicle Miles of Travel (VMT). The trends observed are similar between rates per licensed driver and registered vehicle. There is a downward trend after 1986 for the fatality rate per VMT. Figure 3: Speeding-Related Fatality Rate, 1983-2002
1980 1985 1990 1995 2000 20050.0
0.5
6
8
10
12
Source: FARS 1983-2002
Year
Speeding-Related Fatality Rate per 100,000 Licensed Driver Speeding-Related Fatality Rate per 100,000 Registered Vehicles Speeding-Related Fatality Rate per 100 Million VMT
Rat
e
________________________________________________________________________ National Center for Statistics and Analysis, 400 Seventh St., S.W., Washington, DC 20590
7
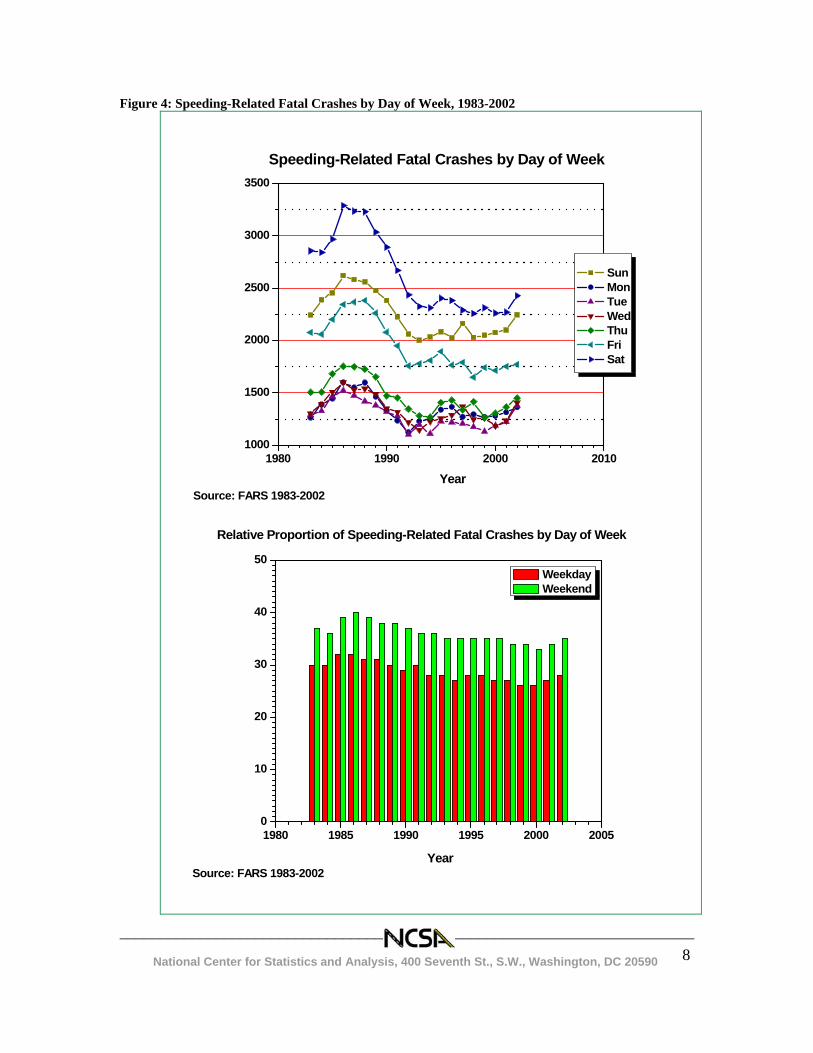
2.2 Speeding-Related Fatal Crashes by Environmental Related Factors 2.2.1 Speeding-Related Fatal Crashes by Day of the Week Figure 4 [Appendix 6.1] shows speeding-related fatal crashes and the relative proportion of speeding-related fatal crashes by the day of the week. Saturdays have the highest number of speeding-related fatal crashes, followed by Sundays and Fridays. There is no large difference in speeding-related fatal crashes among weekdays (Monday, Tuesday, Wednesday and Thursday). The relative proportion of speeding-related fatal crashes is higher on weekends (6 pm Friday to 5:59 am Monday) than on weekdays (6 am Monday to 5:59 pm Friday).
________________________________________________________________________ National Center for Statistics and Analysis, 400 Seventh St., S.W., Washington, DC 20590
8
Figure 4: Speeding-Related Fatal Crashes by Day of Week, 1983-2002
1980 1985 1990 1995 2000 20050
10
20
30
40
50
Relative Proportion of Speeding-Related Fatal Crashes by Day of Week
YearSource: FARS 1983-2002
Weekday Weekend
1980 1990 2000 20101000
1500
2000
2500
3000
3500
Speeding-Related Fatal Crashes by Day of Week
YearSource: FARS 1983-2002
Sun Mon Tue Wed Thu Fri Sat
________________________________________________________________________ National Center for Statistics and Analysis, 400 Seventh St., S.W., Washington, DC 20590
9
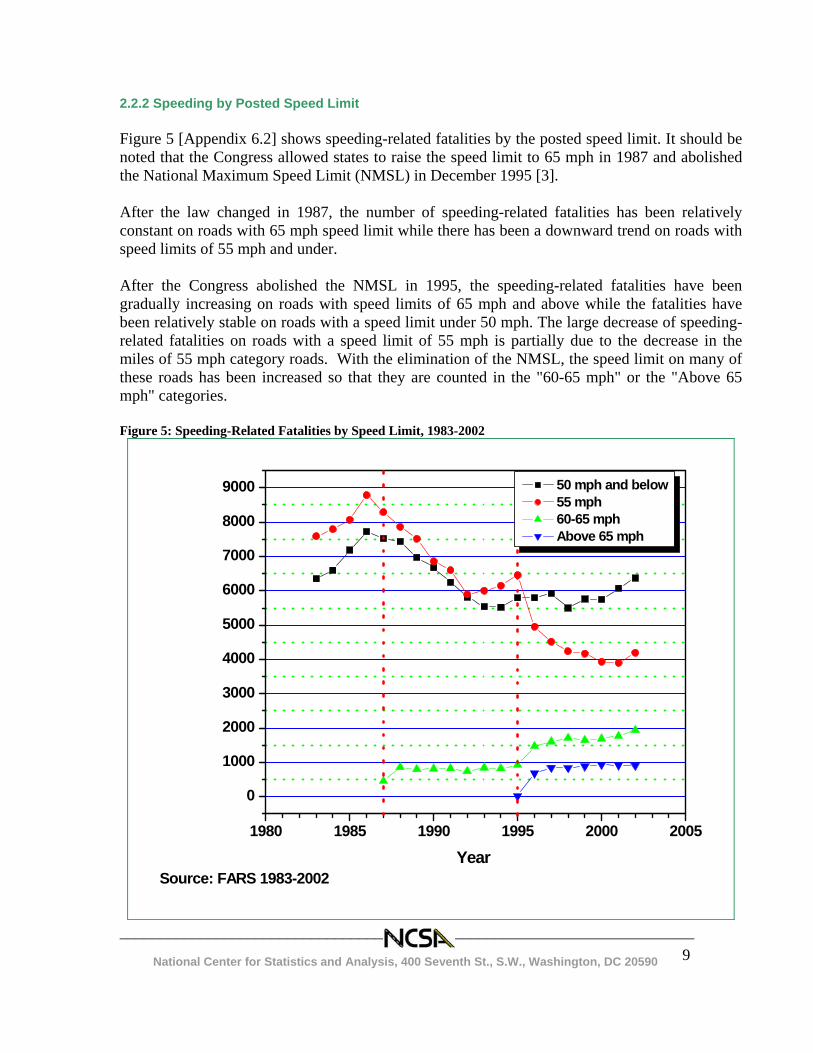
2.2.2 Speeding by Posted Speed Limit Figure 5 [Appendix 6.2] shows speeding-related fatalities by the posted speed limit. It should be noted that the Congress allowed states to raise the speed limit to 65 mph in 1987 and abolished the National Maximum Speed Limit (NMSL) in December 1995 [3]. After the law changed in 1987, the number of speeding-related fatalities has been relatively constant on roads with 65 mph speed limit while there has been a downward trend on roads with speed limits of 55 mph and under. After the Congress abolished the NMSL in 1995, the speeding-related fatalities have been gradually increasing on roads with speed limits of 65 mph and above while the fatalities have been relatively stable on roads with a speed limit under 50 mph. The large decrease of speeding-related fatalities on roads with a speed limit of 55 mph is partially due to the decrease in the miles of 55 mph category roads. With the elimination of the NMSL, the speed limit on many of these roads has been increased so that they are counted in the "60-65 mph" or the "Above 65 mph" categories. Figure 5: Speeding-Related Fatalities by Speed Limit, 1983-2002
1980 1985 1990 1995 2000 2005
0
1000
2000
3000
4000
5000
6000
7000
8000
9000
Source: FARS 1983-2002Year
50 mph and below 55 mph 60-65 mph Above 65 mph
________________________________________________________________________ National Center for Statistics and Analysis, 400 Seventh St., S.W., Washington, DC 20590
10
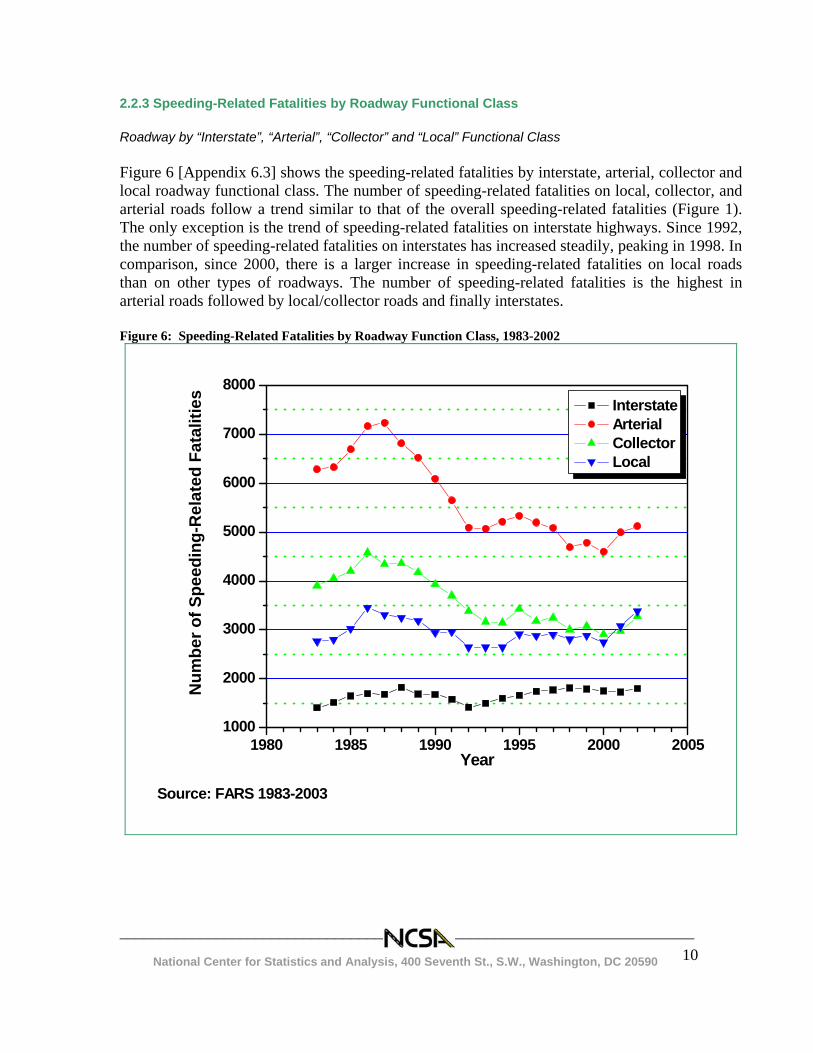
2.2.3 Speeding-Related Fatalities by Roadway Functional Class Roadway by “Interstate”, “Arterial”, “Collector” and “Local” Functional Class Figure 6 [Appendix 6.3] shows the speeding-related fatalities by interstate, arterial, collector and local roadway functional class. The number of speeding-related fatalities on local, collector, and arterial roads follow a trend similar to that of the overall speeding-related fatalities (Figure 1). The only exception is the trend of speeding-related fatalities on interstate highways. Since 1992, the number of speeding-related fatalities on interstates has increased steadily, peaking in 1998. In comparison, since 2000, there is a larger increase in speeding-related fatalities on local roads than on other types of roadways. The number of speeding-related fatalities is the highest in arterial roads followed by local/collector roads and finally interstates. Figure 6: Speeding-Related Fatalities by Roadway Function Class, 1983-2002
1980 1985 1990 1995 2000 20051000
2000
3000
4000
5000
6000
7000
8000
Year
Source: FARS 1983-2003
Interstate Arterial Collector Local
Num
ber o
f Spe
edin
g-R
elat
ed F
atal
ities
________________________________________________________________________ National Center for Statistics and Analysis, 400 Seventh St., S.W., Washington, DC 20590
11
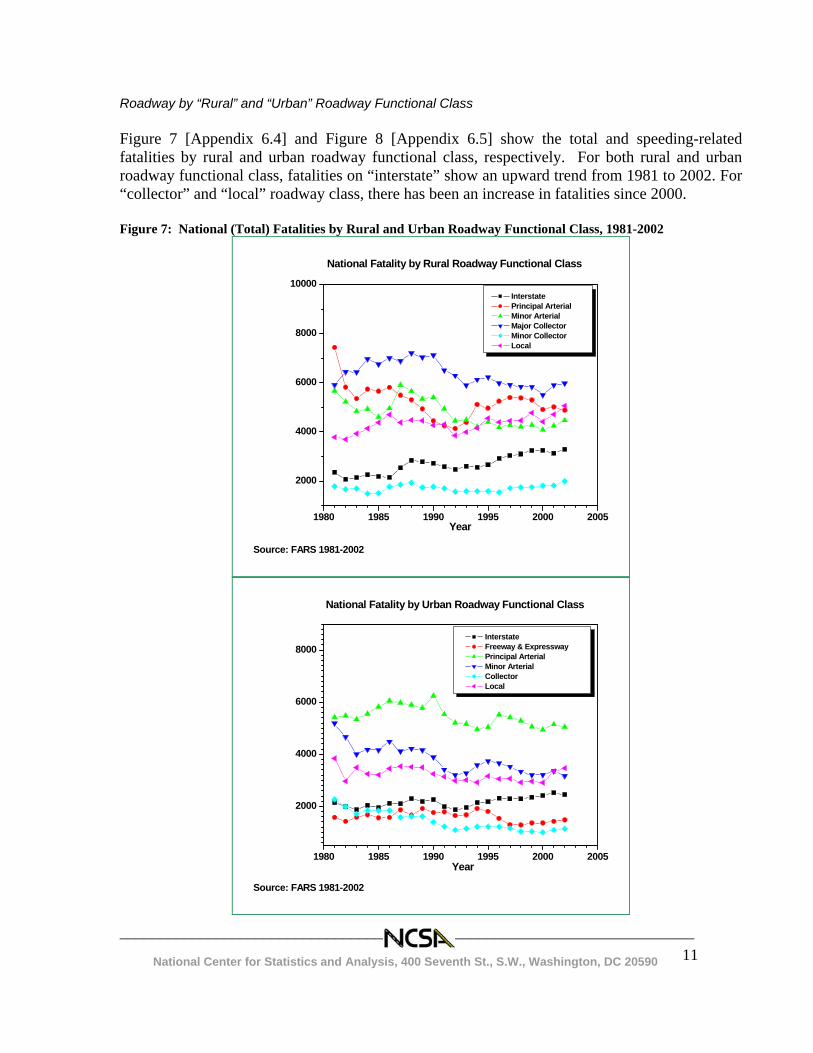
Roadway by “Rural” and “Urban” Roadway Functional Class Figure 7 [Appendix 6.4] and Figure 8 [Appendix 6.5] show the total and speeding-related fatalities by rural and urban roadway functional class, respectively. For both rural and urban roadway functional class, fatalities on “interstate” show an upward trend from 1981 to 2002. For “collector” and “local” roadway class, there has been an increase in fatalities since 2000. Figure 7: National (Total) Fatalities by Rural and Urban Roadway Functional Class, 1981-2002
1980 1985 1990 1995 2000 2005
2000
4000
6000
8000
10000
Source: FARS 1981-2002
Year
National Fatality by Rural Roadway Functional Class
Interstate Principal Arterial Minor Arterial Major Collector Minor Collector Local
1980 1985 1990 1995 2000 2005
2000
4000
6000
8000
National Fatality by Urban Roadway Functional Class
Source: FARS 1981-2002
Year
Interstate Freeway & Expressway Principal Arterial Minor Arterial Collector Local

________________________________________________________________________ National Center for Statistics and Analysis, 400 Seventh St., S.W., Washington, DC 20590
12
As shown in Figure 8, there is an increasing trend in speeding-related fatalities for most “rural” and “urban” roadway functional classes since 2000. Figure 8: Speeding-Related Fatalities by Rural and Urban Roadway Functional Class, 1982-2002
1980 1985 1990 1995 2000 2005
800
1200
1600
2000
2400
2800
3200
Source: FARS 1982-2002
Year
Speeding-Related Fatalities by Rural Roadway Functional Class
Interstate Principal Arterial Minor Arterial Major Collector Minor Collector Local
1980 1985 1990 1995 2000 2005200
400
600
800
1000
1200
1400
1600
1800
2000
Speeding-Related Fatalities by Urban Roadway Functional Class
Interstate Freeway & Expressway Principal Arterial Minor Arterial Collector Local
Source: FARS 1982-2002
Year
________________________________________________________________________ National Center for Statistics and Analysis, 400 Seventh St., S.W., Washington, DC 20590
13
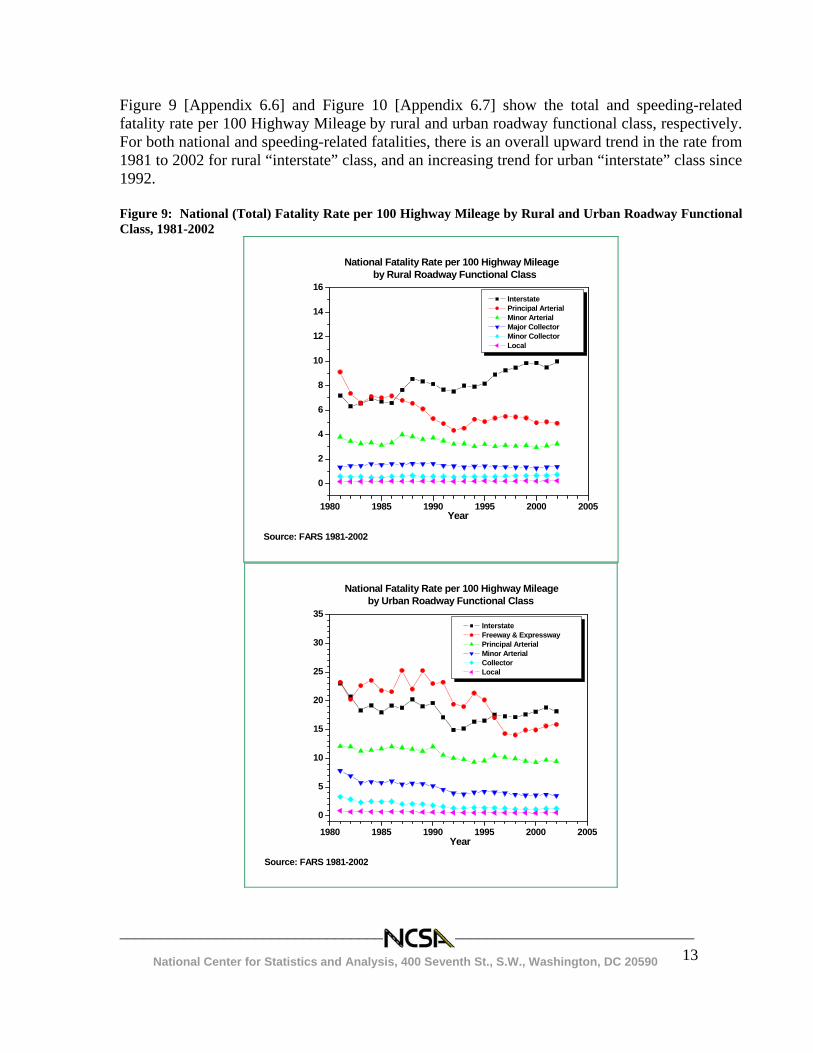
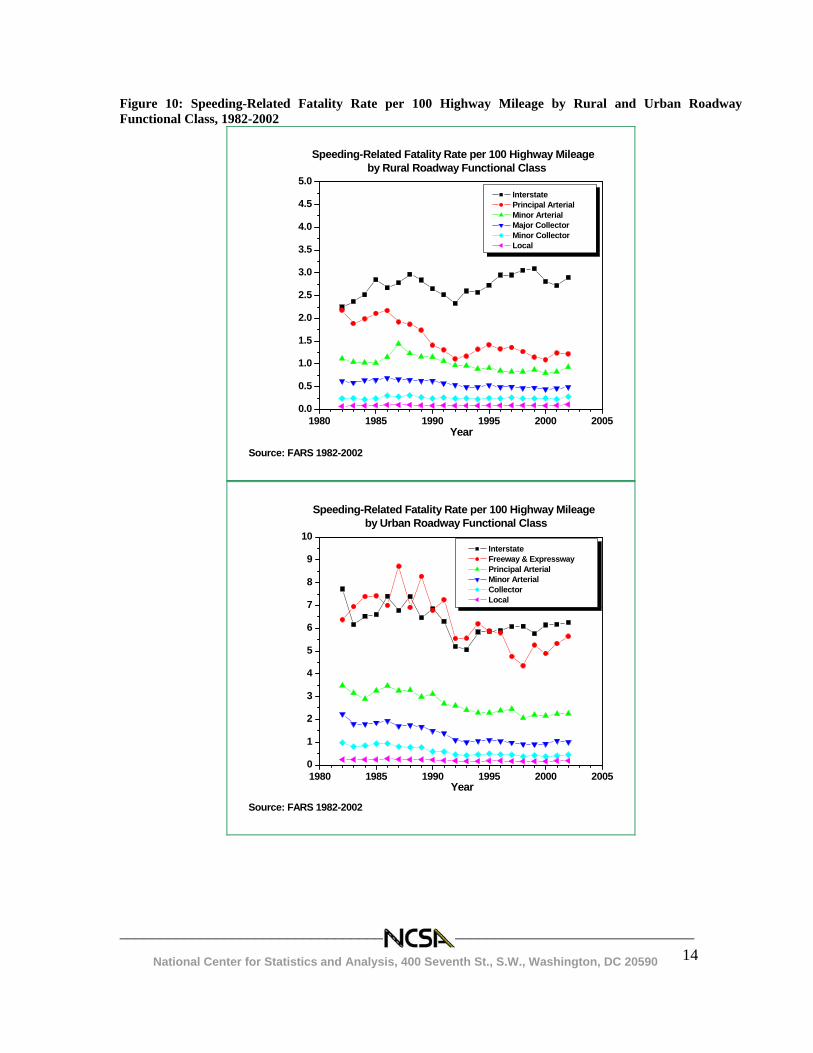
Figure 9 [Appendix 6.6] and Figure 10 [Appendix 6.7] show the total and speeding-related fatality rate per 100 Highway Mileage by rural and urban roadway functional class, respectively. For both national and speeding-related fatalities, there is an overall upward trend in the rate from 1981 to 2002 for rural “interstate” class, and an increasing trend for urban “interstate” class since 1992. Figure 9: National (Total) Fatality Rate per 100 Highway Mileage by Rural and Urban Roadway Functional Class, 1981-2002
1980 1985 1990 1995 2000 2005
0
2
4
6
8
10
12
14
16
Source: FARS 1981-2002
Year
National Fatality Rate per 100 Highway Mileage by Rural Roadway Functional Class
Interstate Principal Arterial Minor Arterial Major Collector Minor Collector Local
1980 1985 1990 1995 2000 2005
0
5
10
15
20
25
30
35
Source: FARS 1981-2002
Year
National Fatality Rate per 100 Highway Mileage by Urban Roadway Functional Class
Interstate Freeway & Expressway Principal Arterial Minor Arterial Collector Local
________________________________________________________________________ National Center for Statistics and Analysis, 400 Seventh St., S.W., Washington, DC 20590
14
Figure 10: Speeding-Related Fatality Rate per 100 Highway Mileage by Rural and Urban Roadway Functional Class, 1982-2002
1980 1985 1990 1995 2000 20050.0
0.5
1.0
1.5
2.0
2.5
3.0
3.5
4.0
4.5
5.0
Speeding-Related Fatality Rate per 100 Highway Mileage by Rural Roadway Functional Class
Source: FARS 1982-2002
Year
Interstate Principal Arterial Minor Arterial Major Collector Minor Collector Local
1980 1985 1990 1995 2000 20050
1
2
3
4
5
6
7
8
9
10
Source: FARS 1982-2002
Year
Speeding-Related Fatality Rate per 100 Highway Mileage by Urban Roadway Functional Class
Interstate Freeway & Expressway Principal Arterial Minor Arterial Collector Local
________________________________________________________________________ National Center for Statistics and Analysis, 400 Seventh St., S.W., Washington, DC 20590
15
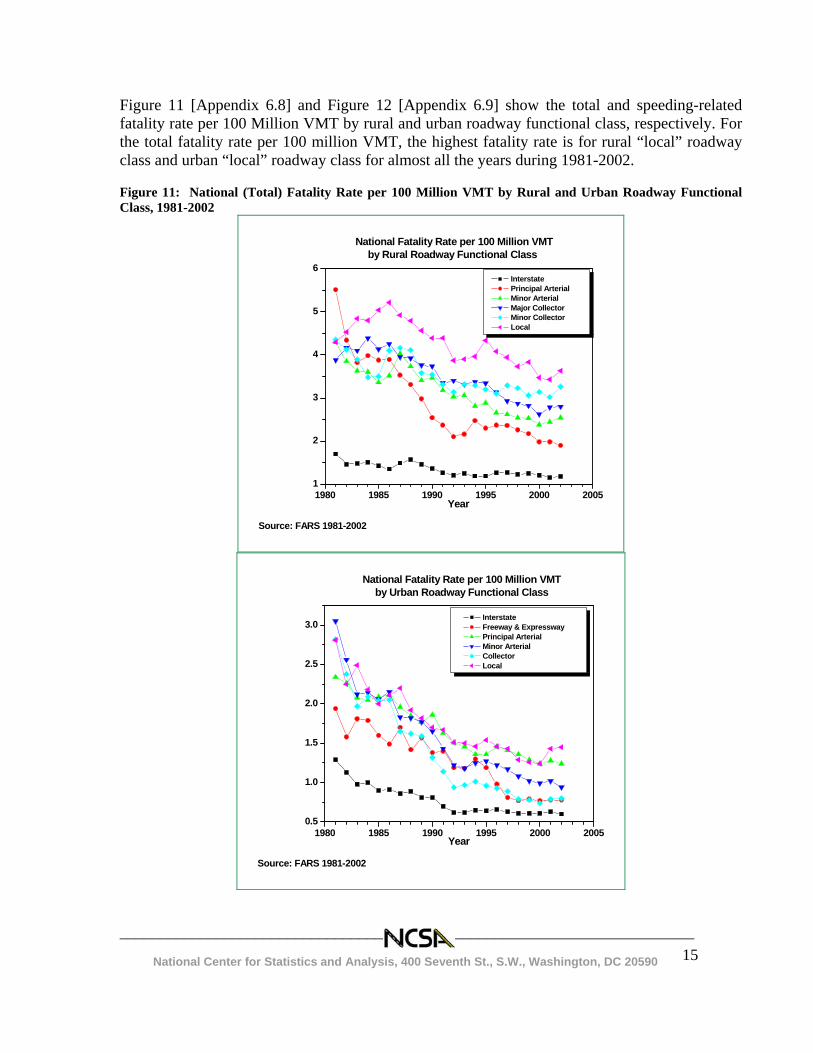
Figure 11 [Appendix 6.8] and Figure 12 [Appendix 6.9] show the total and speeding-related fatality rate per 100 Million VMT by rural and urban roadway functional class, respectively. For the total fatality rate per 100 million VMT, the highest fatality rate is for rural “local” roadway class and urban “local” roadway class for almost all the years during 1981-2002. Figure 11: National (Total) Fatality Rate per 100 Million VMT by Rural and Urban Roadway Functional Class, 1981-2002
1980 1985 1990 1995 2000 20051
2
3
4
5
6
Source: FARS 1981-2002
Year
National Fatality Rate per 100 Million VMT by Rural Roadway Functional Class
Interstate Principal Arterial Minor Arterial Major Collector Minor Collector Local
1980 1985 1990 1995 2000 20050.5
1.0
1.5
2.0
2.5
3.0
Source: FARS 1981-2002
Year
National Fatality Rate per 100 Million VMT by Urban Roadway Functional Class
Interstate Freeway & Expressway Principal Arterial Minor Arterial Collector Local
________________________________________________________________________ National Center for Statistics and Analysis, 400 Seventh St., S.W., Washington, DC 20590
16
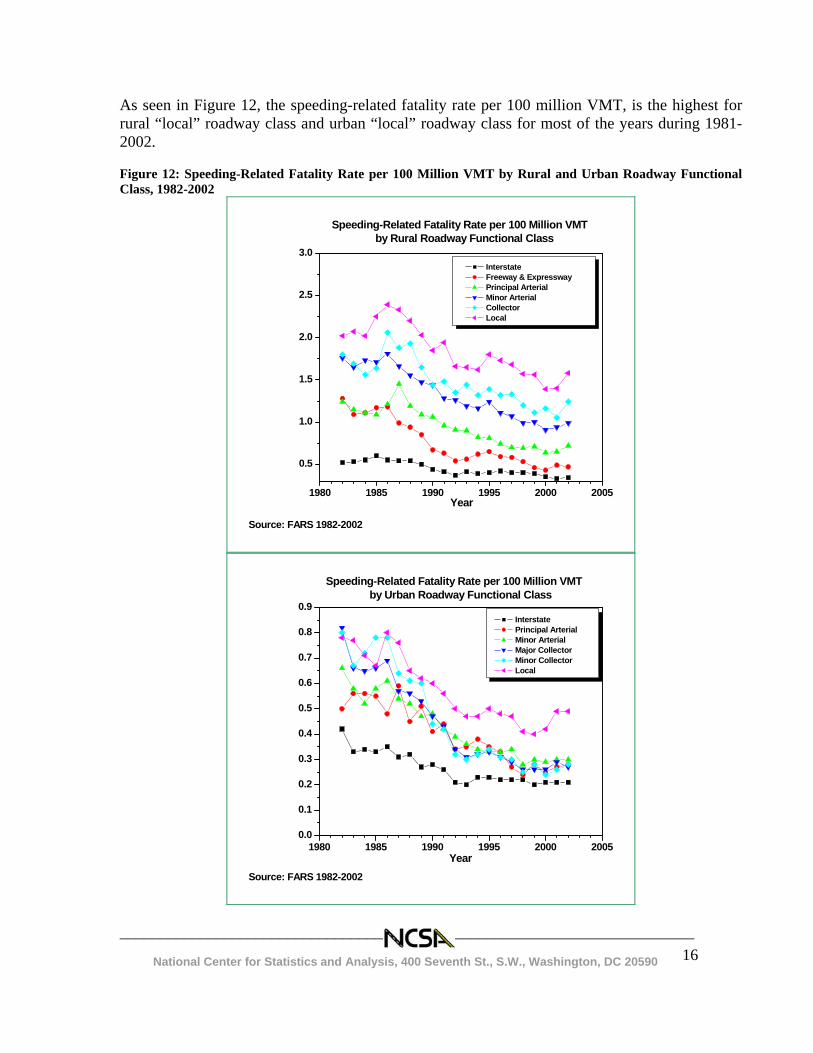
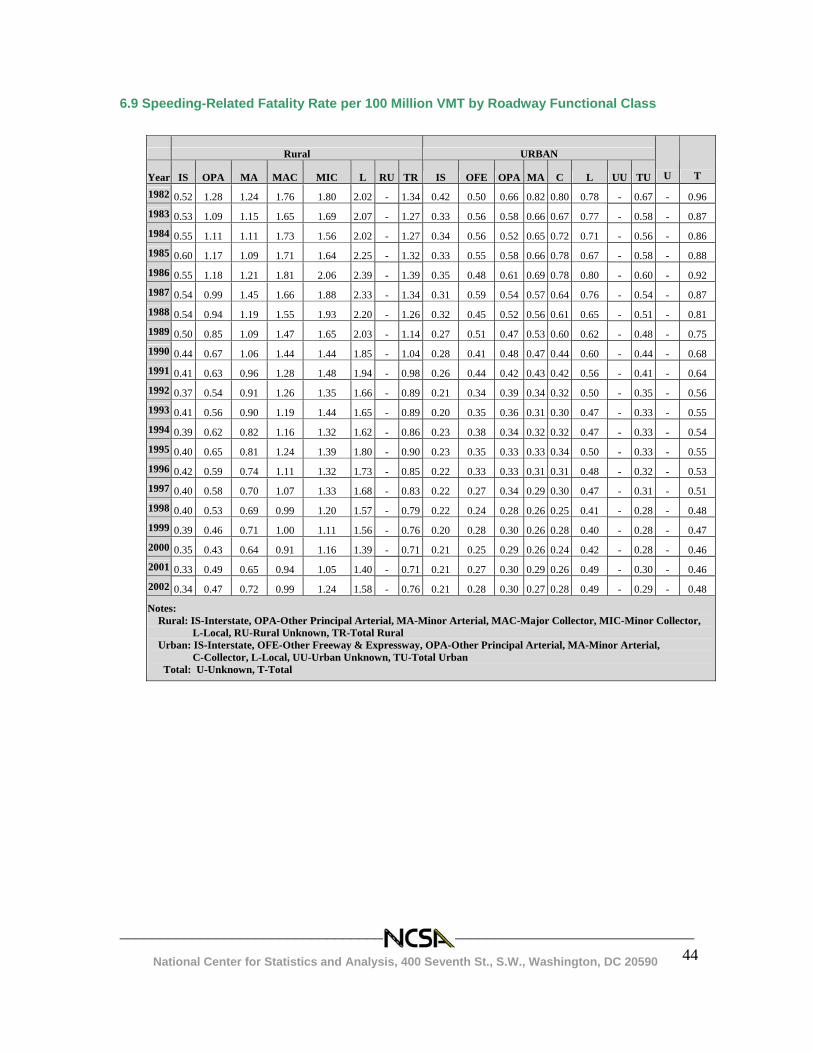
As seen in Figure 12, the speeding-related fatality rate per 100 million VMT, is the highest for rural “local” roadway class and urban “local” roadway class for most of the years during 1981-2002. Figure 12: Speeding-Related Fatality Rate per 100 Million VMT by Rural and Urban Roadway Functional Class, 1982-2002
1980 1985 1990 1995 2000 2005
0.5
1.0
1.5
2.0
2.5
3.0
Source: FARS 1982-2002
Year
Speeding-Related Fatality Rate per 100 Million VMT by Rural Roadway Functional Class
Interstate Freeway & Expressway Principal Arterial Minor Arterial Collector Local
1980 1985 1990 1995 2000 20050.0
0.1
0.2
0.3
0.4
0.5
0.6
0.7
0.8
0.9
Speeding-Related Fatality Rate per 100 Million VMT by Urban Roadway Functional Class
Interstate Principal Arterial Minor Arterial Major Collector Minor Collector Local
YearSource: FARS 1982-2002
________________________________________________________________________ National Center for Statistics and Analysis, 400 Seventh St., S.W., Washington, DC 20590
17
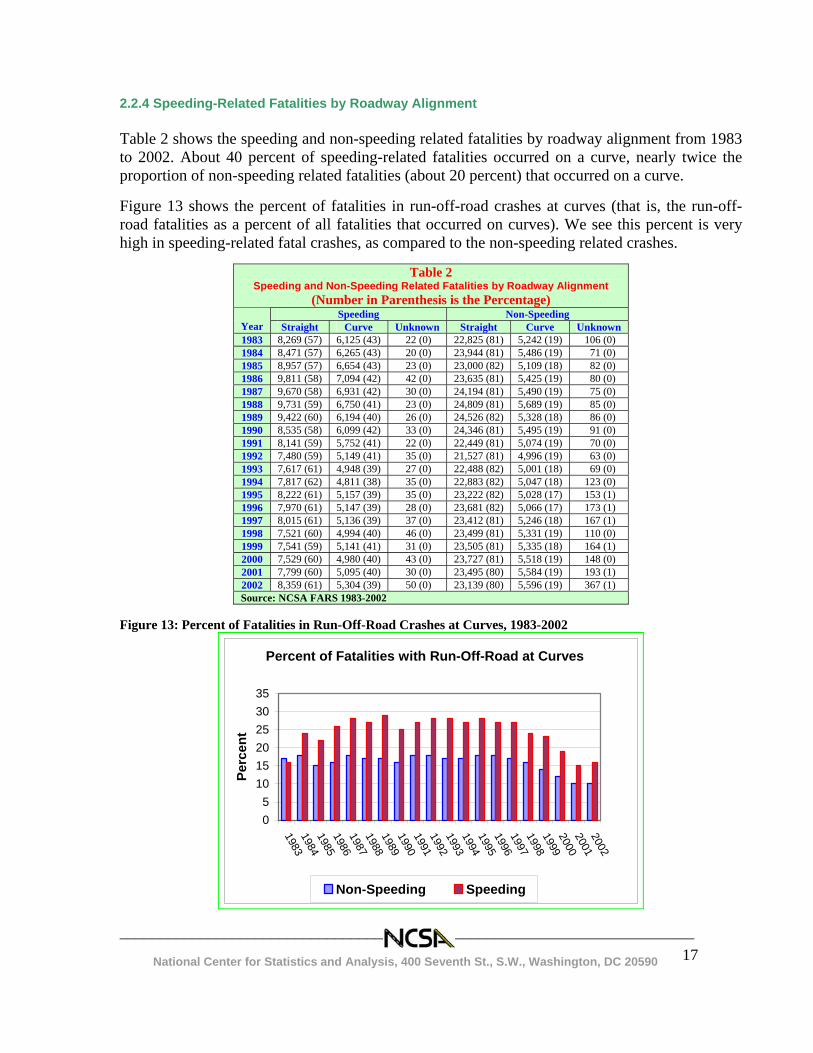
2.2.4 Speeding-Related Fatalities by Roadway Alignment Table 2 shows the speeding and non-speeding related fatalities by roadway alignment from 1983 to 2002. About 40 percent of speeding-related fatalities occurred on a curve, nearly twice the proportion of non-speeding related fatalities (about 20 percent) that occurred on a curve. Figure 13 shows the percent of fatalities in run-off-road crashes at curves (that is, the run-off-road fatalities as a percent of all fatalities that occurred on curves). We see this percent is very high in speeding-related fatal crashes, as compared to the non-speeding related crashes.
Table 2 Speeding and Non-Speeding Related Fatalities by Roadway Alignment
(Number in Parenthesis is the Percentage) Speeding Non-Speeding
Year Straight Curve Unknown Straight Curve Unknown 1983 8,269 (57) 6,125 (43) 22 (0) 22,825 (81) 5,242 (19) 106 (0) 1984 8,471 (57) 6,265 (43) 20 (0) 23,944 (81) 5,486 (19) 71 (0) 1985 8,957 (57) 6,654 (43) 23 (0) 23,000 (82) 5,109 (18) 82 (0) 1986 9,811 (58) 7,094 (42) 42 (0) 23,635 (81) 5,425 (19) 80 (0) 1987 9,670 (58) 6,931 (42) 30 (0) 24,194 (81) 5,490 (19) 75 (0) 1988 9,731 (59) 6,750 (41) 23 (0) 24,809 (81) 5,689 (19) 85 (0) 1989 9,422 (60) 6,194 (40) 26 (0) 24,526 (82) 5,328 (18) 86 (0) 1990 8,535 (58) 6,099 (42) 33 (0) 24,346 (81) 5,495 (19) 91 (0) 1991 8,141 (59) 5,752 (41) 22 (0) 22,449 (81) 5,074 (19) 70 (0) 1992 7,480 (59) 5,149 (41) 35 (0) 21,527 (81) 4,996 (19) 63 (0) 1993 7,617 (61) 4,948 (39) 27 (0) 22,488 (82) 5,001 (18) 69 (0) 1994 7,817 (62) 4,811 (38) 35 (0) 22,883 (82) 5,047 (18) 123 (0) 1995 8,222 (61) 5,157 (39) 35 (0) 23,222 (82) 5,028 (17) 153 (1) 1996 7,970 (61) 5,147 (39) 28 (0) 23,681 (82) 5,066 (17) 173 (1) 1997 8,015 (61) 5,136 (39) 37 (0) 23,412 (81) 5,246 (18) 167 (1) 1998 7,521 (60) 4,994 (40) 46 (0) 23,499 (81) 5,331 (19) 110 (0) 1999 7,541 (59) 5,141 (41) 31 (0) 23,505 (81) 5,335 (18) 164 (1) 2000 7,529 (60) 4,980 (40) 43 (0) 23,727 (81) 5,518 (19) 148 (0) 2001 7,799 (60) 5,095 (40) 30 (0) 23,495 (80) 5,584 (19) 193 (1) 2002 8,359 (61) 5,304 (39) 50 (0) 23,139 (80) 5,596 (19) 367 (1) Source: NCSA FARS 1983-2002
Figure 13: Percent of Fatalities in Run-Off-Road Crashes at Curves, 1983-2002
Percent of Fatalities with Run-Off-Road at Curves
05
101520253035
19831984198519861987198819891990199119921993199419951996199719981999200020012002
Perc
ent
Non-Speeding Speeding
________________________________________________________________________ National Center for Statistics and Analysis, 400 Seventh St., S.W., Washington, DC 20590
18
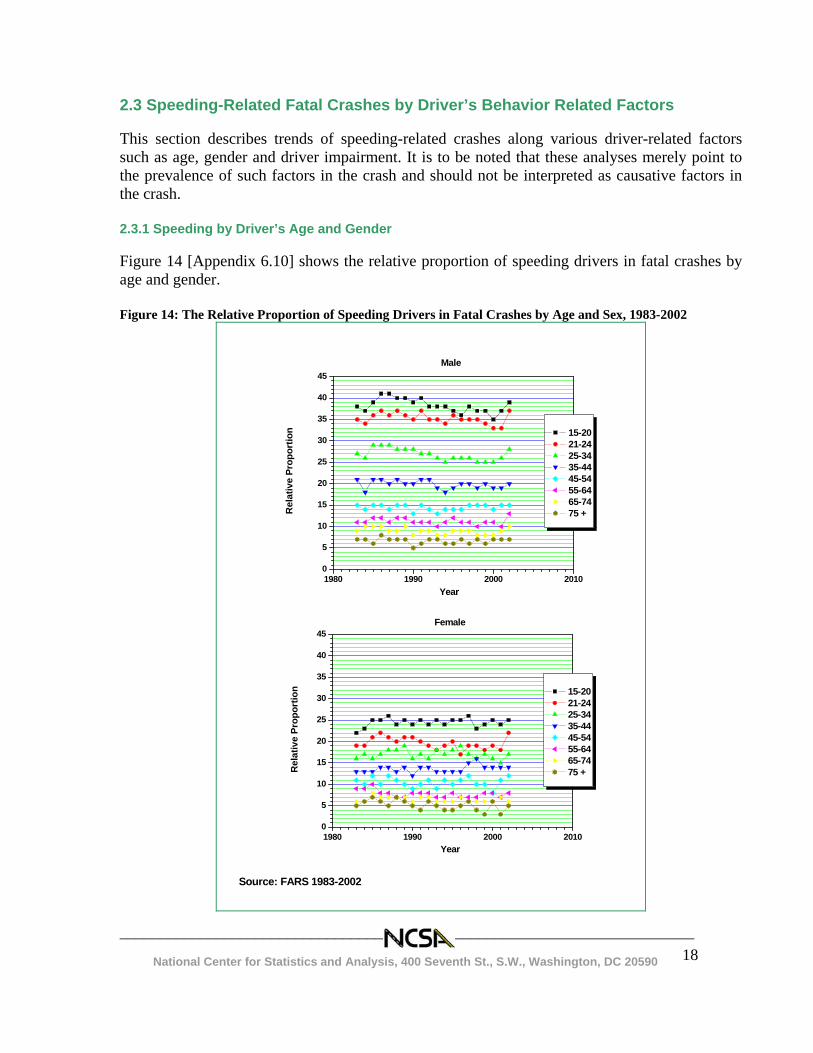
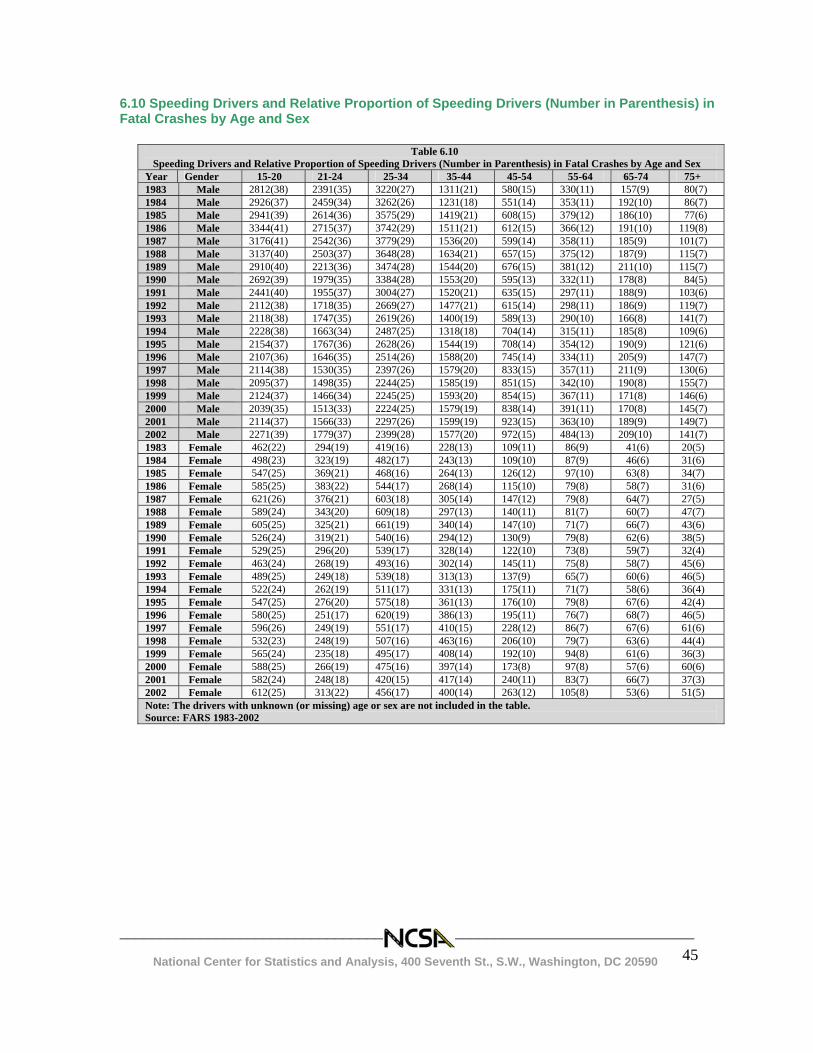
2.3 Speeding-Related Fatal Crashes by Driver’s Behavior Related Factors This section describes trends of speeding-related crashes along various driver-related factors such as age, gender and driver impairment. It is to be noted that these analyses merely point to the prevalence of such factors in the crash and should not be interpreted as causative factors in the crash. 2.3.1 Speeding by Driver’s Age and Gender Figure 14 [Appendix 6.10] shows the relative proportion of speeding drivers in fatal crashes by age and gender. Figure 14: The Relative Proportion of Speeding Drivers in Fatal Crashes by Age and Sex, 1983-2002
Source: FARS 1983-2002
1980 1990 2000 20100
5
10
15
20
25
30
35
40
45
Rel
ativ
e Pr
opor
tion
Year
Female
15-20 21-24 25-34 35-44 45-54 55-64 65-74 75 +
1980 1990 2000 20100
5
10
15
20
25
30
35
40
45
Year
15-20 21-24 25-34 35-44 45-54 55-64 65-74 75 +
Male
Rel
ativ
e Pr
opor
tion
________________________________________________________________________ National Center for Statistics and Analysis, 400 Seventh St., S.W., Washington, DC 20590
19
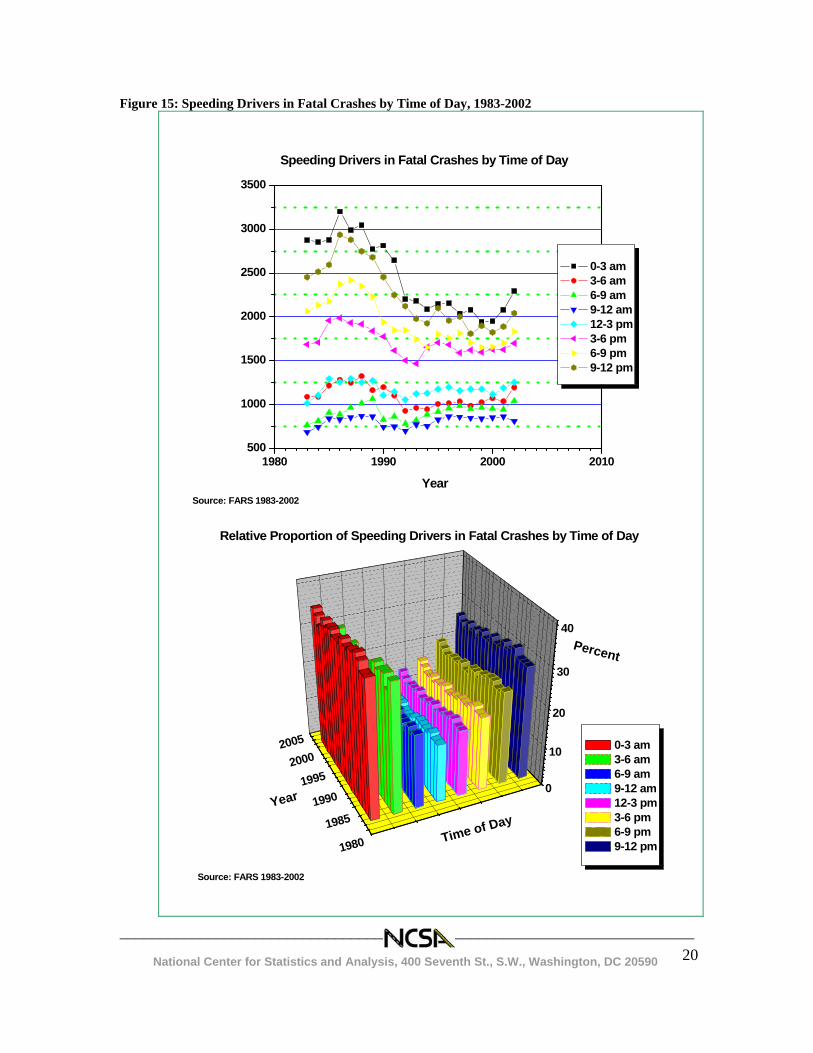
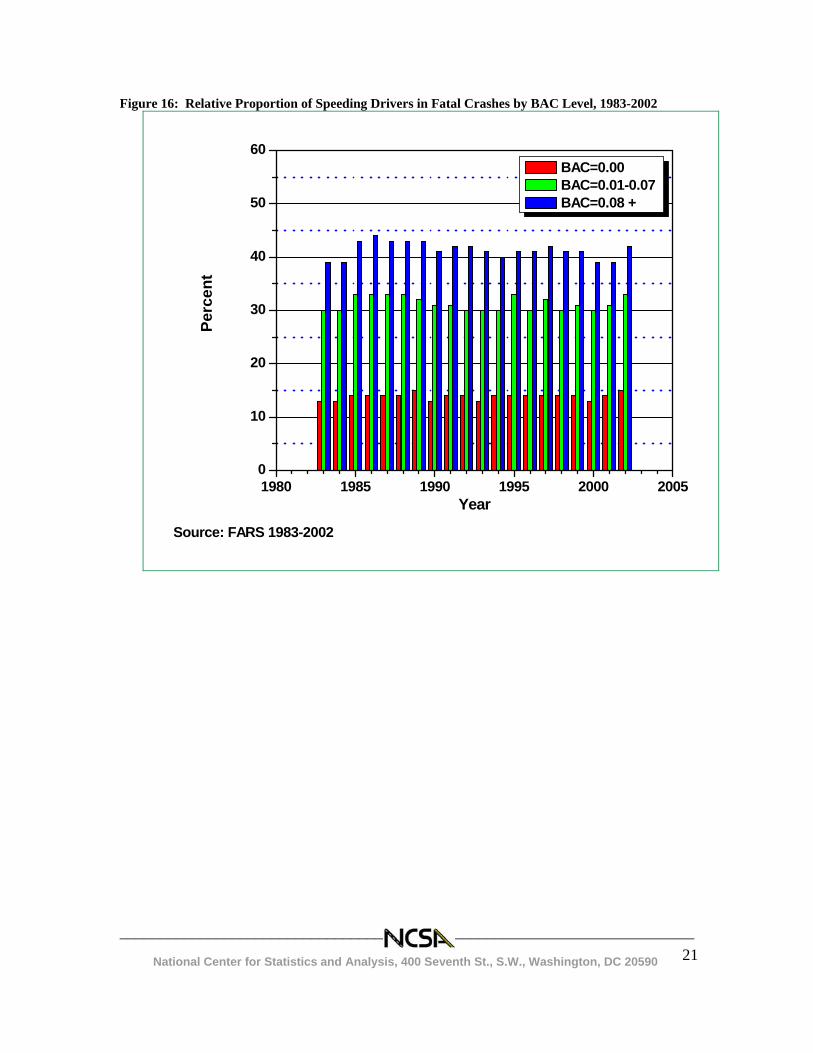
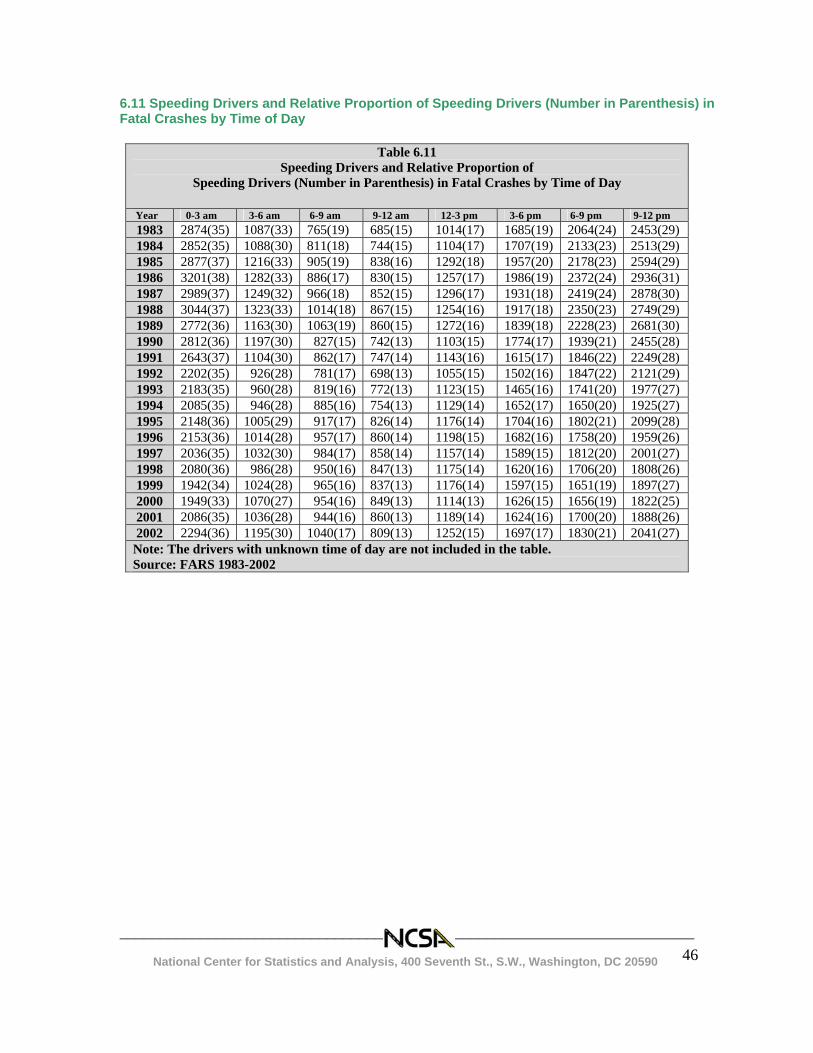
As seen in Figure 14, male drivers are more likely to be involved in speeding-related fatal crashes than female drivers among drivers of all ages. Also, the relative proportion of speeding drivers decreases with increased driver age. For most age groups, there are almost no changes in the relative proportion of speeding drivers to all drivers. The only exception is that for the young male groups (15-20, 21-24, and 25-34), where there is slight decrease in the relative proportion from 1985 to 2000. 2.3.2 Speeding Drivers by Time of Day Figure 15 [Appendix 6.11] shows the number and relative proportion of speeding drivers involved in fatal crashes by time of day. While there are more speeding drivers during evening hours (between 3pm and 3am) than the daytime hours (3am to 3pm), the relative proportion of speeding drivers for each time period has been relatively constant over the years. After a large decrease in the evening-hour speeding drivers between 1986 and 1992, the number of evening-hour speeding drivers has staggered between 1992 and 2000. The number of speeding-related fatalities during daytime has been relatively stable over the years. 2.3.3 Speeding by Driver Impairment Figure 16 [Appendix 6.12] shows the relative proportion of speeding drivers in fatal crashes by Blood Alcohol Concentration (BAC) Level. It points to some correlation between the speeding and alcohol impairment of the drivers. On an average, about 41 percent of intoxicated drivers (BAC= 0.08+) involved in fatal crashes were speeding, compared to only about 14 percent of the sober drivers. Over the years, while the percentage of intoxicated drivers who were speeding drivers has decreased slightly, the percentage sober drivers who were also speeding has been relatively constant.
________________________________________________________________________ National Center for Statistics and Analysis, 400 Seventh St., S.W., Washington, DC 20590
20
Figure 15: Speeding Drivers in Fatal Crashes by Time of Day, 1983-2002
19801985
19901995
20002005
0
10
20
30
40
Source: FARS 1983-2002
Relative Proportion of Speeding Drivers in Fatal Crashes by Time of Day
0-3 am 3-6 am 6-9 am 9-12 am 12-3 pm 3-6 pm 6-9 pm 9-12 pm
Percent
Year
Time of Day
1980 1990 2000 2010500
1000
1500
2000
2500
3000
3500
Year
0-3 am 3-6 am 6-9 am 9-12 am 12-3 pm 3-6 pm 6-9 pm 9-12 pm
Source: FARS 1983-2002
Speeding Drivers in Fatal Crashes by Time of Day
________________________________________________________________________ National Center for Statistics and Analysis, 400 Seventh St., S.W., Washington, DC 20590
21
Figure 16: Relative Proportion of Speeding Drivers in Fatal Crashes by BAC Level, 1983-2002
1980 1985 1990 1995 2000 20050
10
20
30
40
50
60
Source: FARS 1983-2002
Year
Perc
ent
BAC=0.00 BAC=0.01-0.07 BAC=0.08 +
________________________________________________________________________ National Center for Statistics and Analysis, 400 Seventh St., S.W., Washington, DC 20590
22
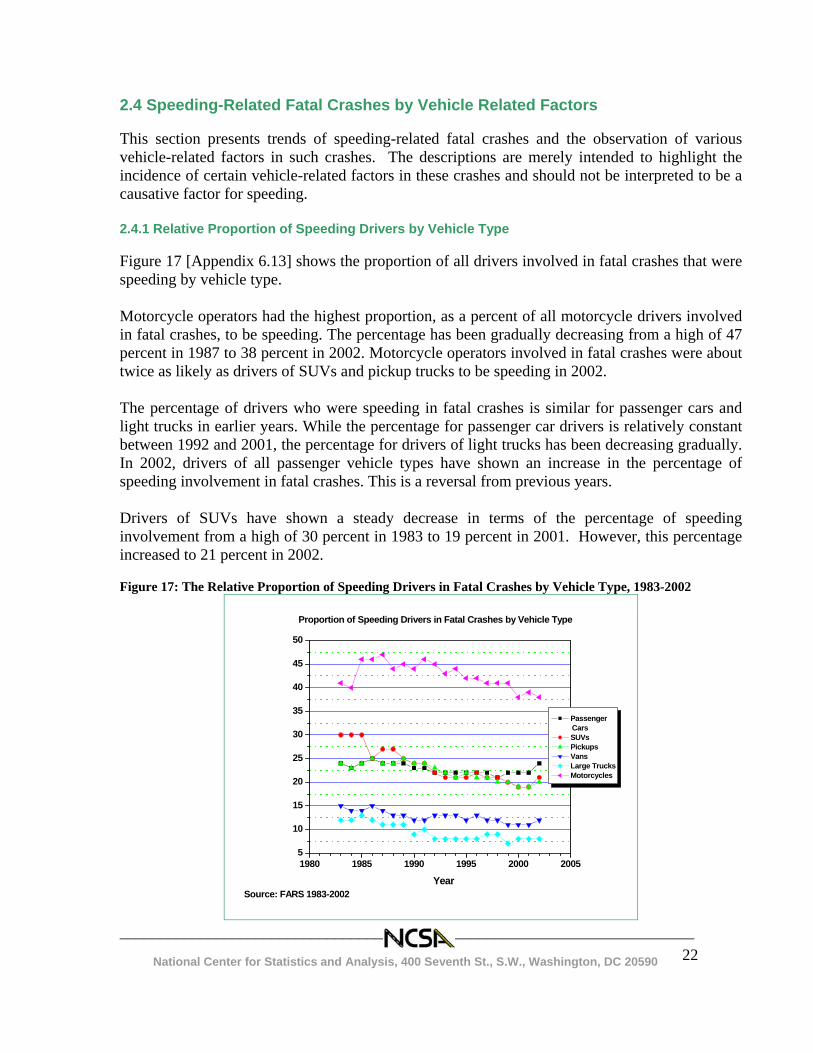
2.4 Speeding-Related Fatal Crashes by Vehicle Related Factors This section presents trends of speeding-related fatal crashes and the observation of various vehicle-related factors in such crashes. The descriptions are merely intended to highlight the incidence of certain vehicle-related factors in these crashes and should not be interpreted to be a causative factor for speeding. 2.4.1 Relative Proportion of Speeding Drivers by Vehicle Type Figure 17 [Appendix 6.13] shows the proportion of all drivers involved in fatal crashes that were speeding by vehicle type. Motorcycle operators had the highest proportion, as a percent of all motorcycle drivers involved in fatal crashes, to be speeding. The percentage has been gradually decreasing from a high of 47 percent in 1987 to 38 percent in 2002. Motorcycle operators involved in fatal crashes were about twice as likely as drivers of SUVs and pickup trucks to be speeding in 2002. The percentage of drivers who were speeding in fatal crashes is similar for passenger cars and light trucks in earlier years. While the percentage for passenger car drivers is relatively constant between 1992 and 2001, the percentage for drivers of light trucks has been decreasing gradually. In 2002, drivers of all passenger vehicle types have shown an increase in the percentage of speeding involvement in fatal crashes. This is a reversal from previous years. Drivers of SUVs have shown a steady decrease in terms of the percentage of speeding involvement from a high of 30 percent in 1983 to 19 percent in 2001. However, this percentage increased to 21 percent in 2002. Figure 17: The Relative Proportion of Speeding Drivers in Fatal Crashes by Vehicle Type, 1983-2002
1980 1985 1990 1995 2000 20055
10
15
20
25
30
35
40
45
50
Proportion of Speeding Drivers in Fatal Crashes by Vehicle Type
Source: FARS 1983-2002Year
Passenger Cars
SUVs Pickups Vans Large Trucks Motorcycles
________________________________________________________________________ National Center for Statistics and Analysis, 400 Seventh St., S.W., Washington, DC 20590
23
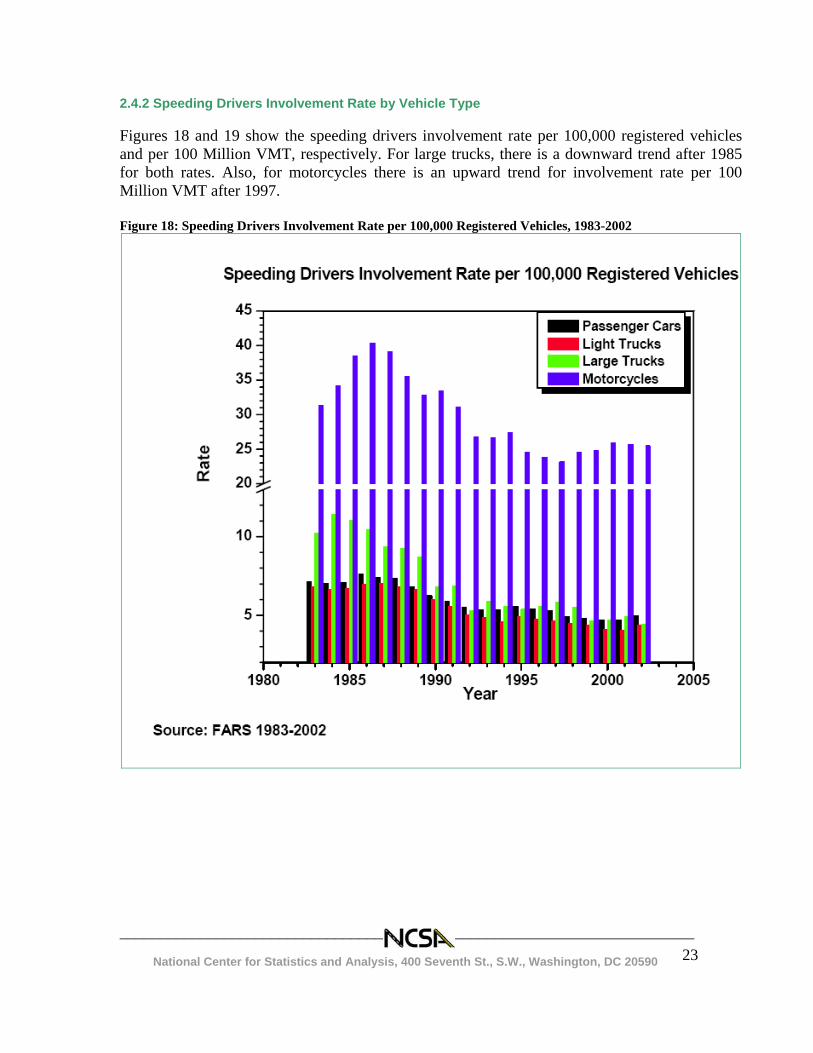
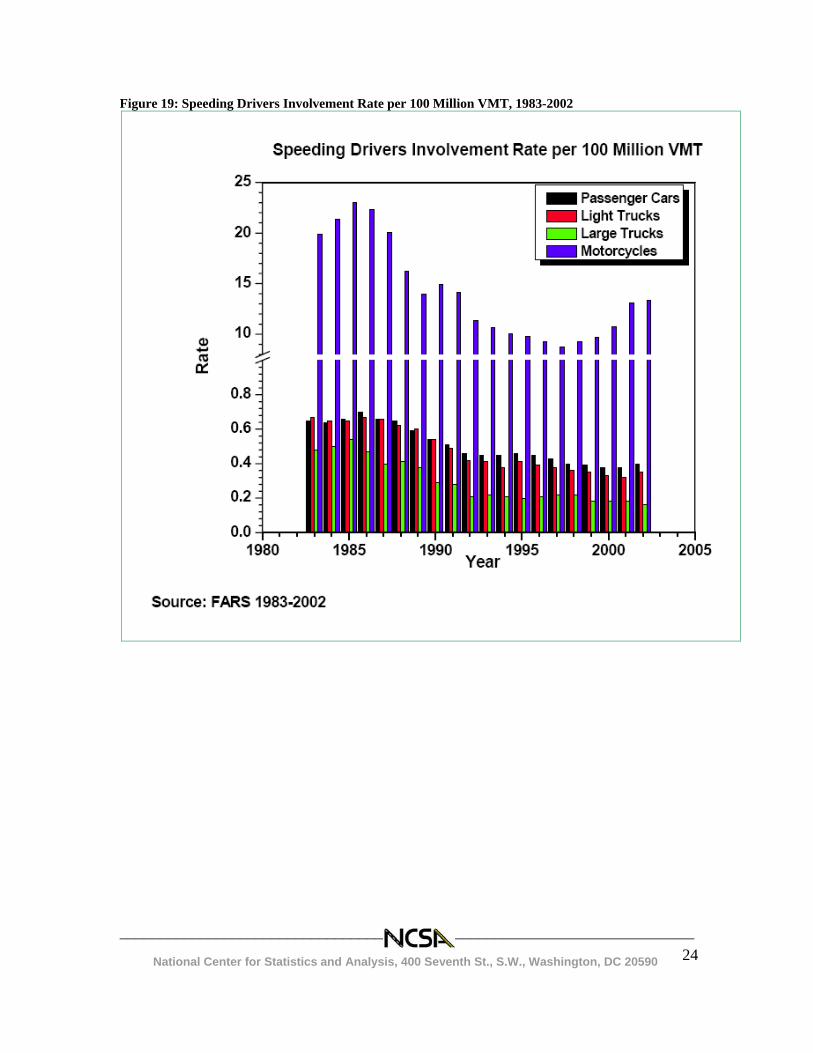
2.4.2 Speeding Drivers Involvement Rate by Vehicle Type Figures 18 and 19 show the speeding drivers involvement rate per 100,000 registered vehicles and per 100 Million VMT, respectively. For large trucks, there is a downward trend after 1985 for both rates. Also, for motorcycles there is an upward trend for involvement rate per 100 Million VMT after 1997. Figure 18: Speeding Drivers Involvement Rate per 100,000 Registered Vehicles, 1983-2002
________________________________________________________________________ National Center for Statistics and Analysis, 400 Seventh St., S.W., Washington, DC 20590
24
Figure 19: Speeding Drivers Involvement Rate per 100 Million VMT, 1983-2002
________________________________________________________________________ National Center for Statistics and Analysis, 400 Seventh St., S.W., Washington, DC 20590
25
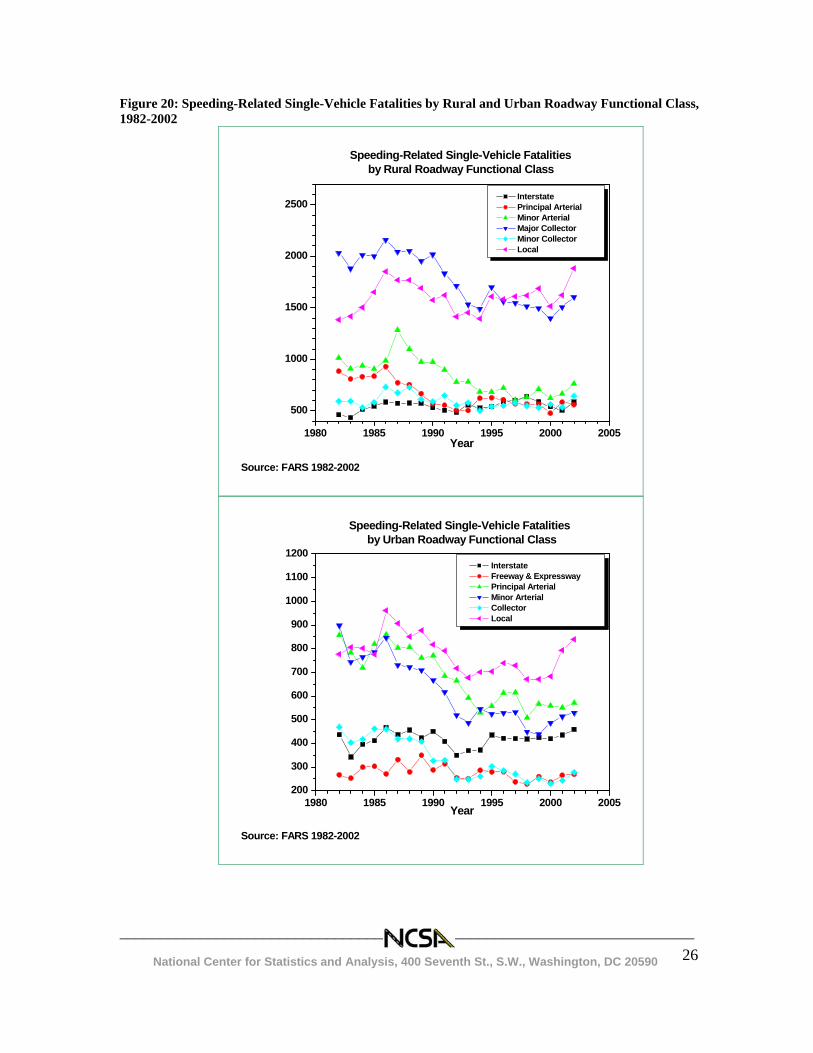
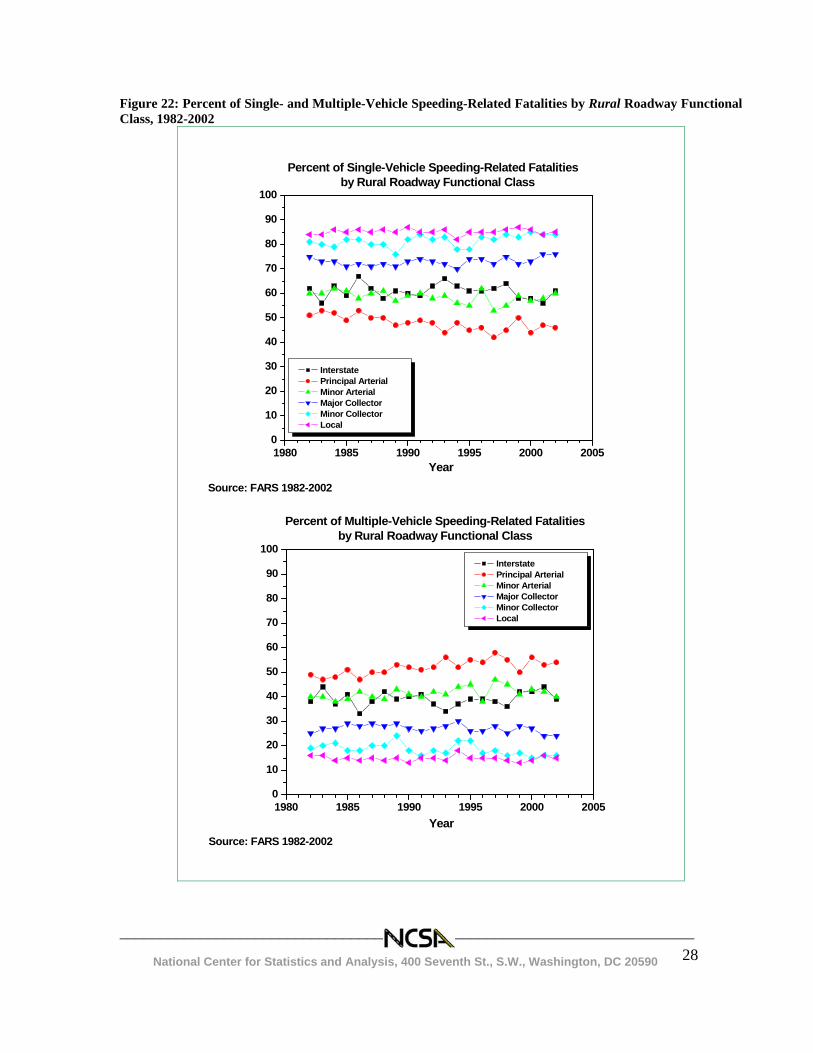
2.4.3 Speeding-Related Fatality by Crash Type (vehicle number involved) Figures 20, 21 and 22 [Appendix 6.14, 6.15, 6.16] illustrate speeding-related fatal crashes by the type of the crash, i.e., if the crash was a single-vehicle or a multiple-vehicle crash. Also presented are their relative percent by rural and urban roadways functional class, respectively. In speeding-related single-vehicle fatal crashes, most of the fatalities occur in “rural” roadway class. There is an increase in “local” roadway function class in recent years for both “rural” and “urban” roadways. For the speeding-related, multi-vehicle fatal crashes, the difference in fatalities between “rural” and “urban” is not as significant as in single-vehicle crashes. In “rural” roadways, most of the speeding-related fatalities occur in single-vehicle crashes for most types of roadways except for “principal arterial” roadways. This is observed in “urban” roadways too. For both “rural” and “urban” roadway functional class, most of the speeding-related fatalities in “local” roadway classes occur in single-vehicle crashes. Note that in Figure 22, only percents of single- and multiple-vehicle speeding-related fatalities by rural roadway functional classes are plotted. Refer to Appendix 6.16 for detailed information of this topic.
________________________________________________________________________ National Center for Statistics and Analysis, 400 Seventh St., S.W., Washington, DC 20590
26
Figure 20: Speeding-Related Single-Vehicle Fatalities by Rural and Urban Roadway Functional Class, 1982-2002
1980 1985 1990 1995 2000 2005
500
1000
1500
2000
2500
Speeding-Related Single-Vehicle Fatalities by Rural Roadway Functional Class
Source: FARS 1982-2002
Year
Interstate Principal Arterial Minor Arterial Major Collector Minor Collector Local
1980 1985 1990 1995 2000 2005200
300
400
500
600
700
800
900
1000
1100
1200
Source: FARS 1982-2002
Year
Speeding-Related Single-Vehicle Fatalities by Urban Roadway Functional Class
Interstate Freeway & Expressway Principal Arterial Minor Arterial Collector Local

________________________________________________________________________ National Center for Statistics and Analysis, 400 Seventh St., S.W., Washington, DC 20590
27
Figure 21: Speeding-Related Multiple-Vehicle Fatalities by Rural and Urban Roadway Functional Class, 1982-2002
1980 1985 1990 1995 2000 2005
100
200
300
400
500
600
700
800
900
1000
1100
1200
Source: FARS 1982-2002
Year
Speeding-Related Multiple-Vehicle Fatalities by Rural Roadway Functional Class
Interstate Principal Arterial Minor Arterial Major Collector Minor Collector Local
1980 1985 1990 1995 2000 2005
100
200
300
400
500
600
700
800
900
1000
1100
Speeding-Related Multiple-Vehicle Fatalities by Urban Roadway Functional Class
Interstate Freeway & Expressway Principal Arterial Minor Arterial Collector Local
Year
Source: FARS 1982-2002
________________________________________________________________________ National Center for Statistics and Analysis, 400 Seventh St., S.W., Washington, DC 20590
28
Figure 22: Percent of Single- and Multiple-Vehicle Speeding-Related Fatalities by Rural Roadway Functional Class, 1982-2002
1980 1985 1990 1995 2000 20050
10
20
30
40
50
60
70
80
90
100
Percent of Multiple-Vehicle Speeding-Related Fatalities by Rural Roadway Functional Class
Source: FARS 1982-2002Year
Interstate Principal Arterial Minor Arterial Major Collector Minor Collector Local
1980 1985 1990 1995 2000 20050
10
20
30
40
50
60
70
80
90
100
Percent of Single-Vehicle Speeding-Related Fatalities by Rural Roadway Functional Class
Source: FARS 1982-2002
Year
Interstate Principal Arterial Minor Arterial Major Collector Minor Collector Local
________________________________________________________________________ National Center for Statistics and Analysis, 400 Seventh St., S.W., Washington, DC 20590
29
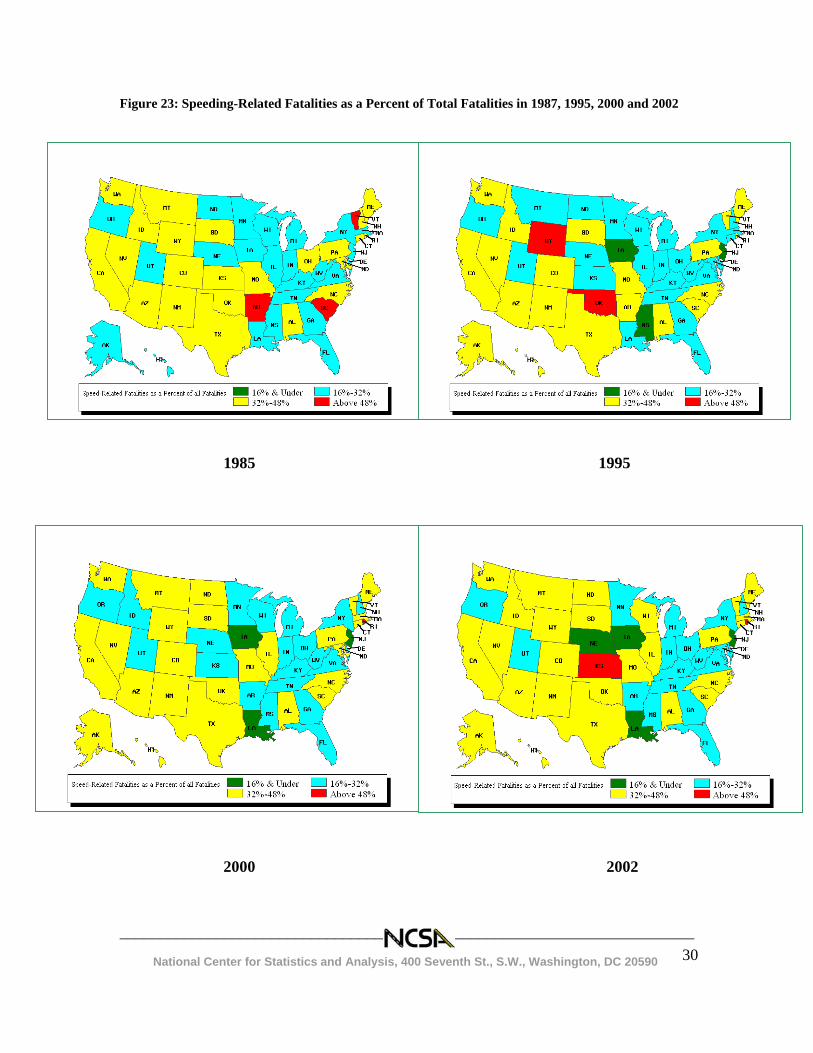
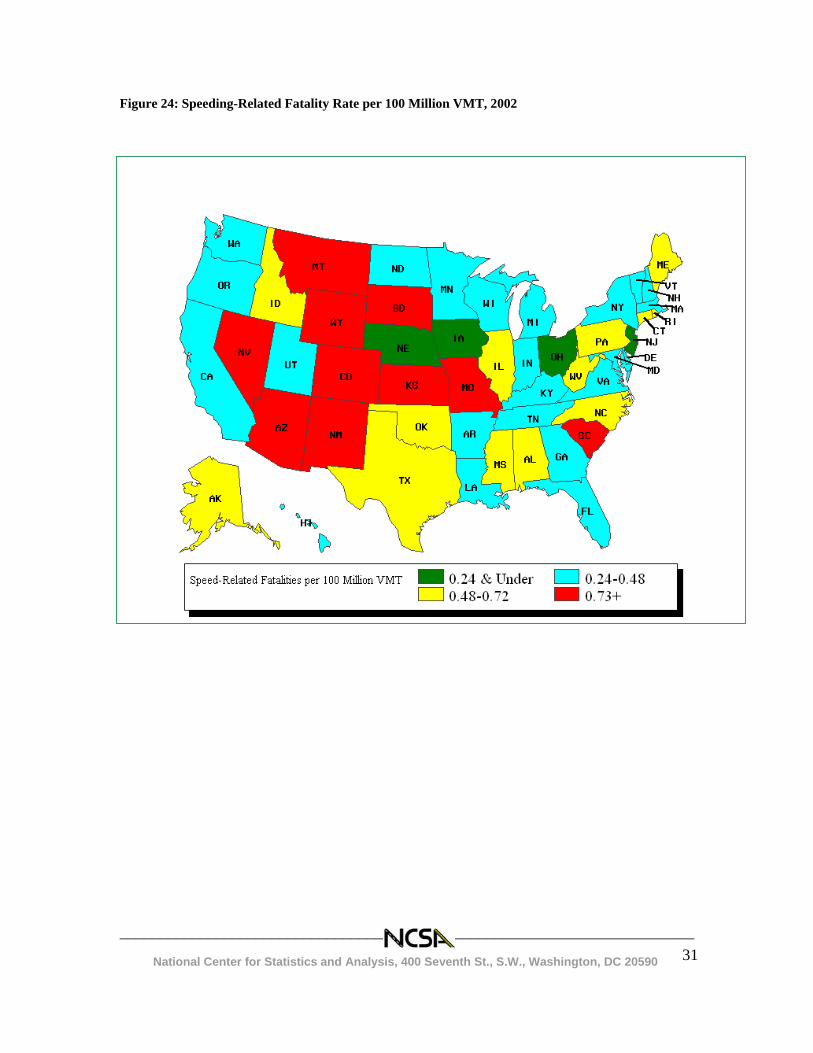
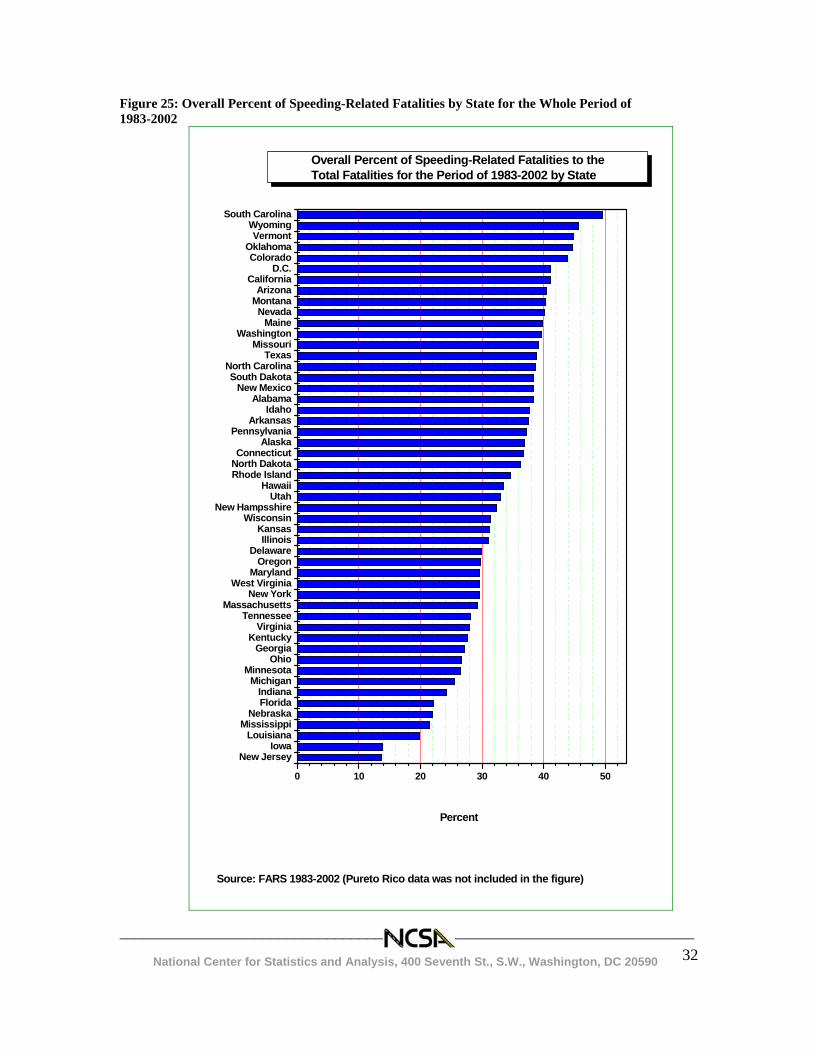
3. Trend of Speeding-Related Fatalities by State This section will focus on the trend of speeding-related fatalities by state, using data from FARS. Appendix 6.17 (6.17 (a) and 6.17 (b)) show the data and plots of the total fatalities, speeding-related fatalities and the percent of speeding-related fatalities to the total by state. Based on the trends in speeding-related fatalities (see Appendix 6.17 (b)), states can be qualitative categorized into three groups in terms of the trend of speeding-related fatalities as a proportion of total fatalities. One group of states that can be identified are those where the percent is relatively stable, such as Alabama, Indiana, Michigan, New Mexico, North Carolina and Wisconsin. The second group that emerges is the states where the percent displays an upward or a downward trend, such as Arkansas, Georgia, Illinois, Kentucky, Louisiana, New Jersey and Utah. Another group can be formed of the states where the percent shows relatively large fluctuations, such as DC (District of Columbia), Massachusetts, New Hampshire, North Dakota, Rhode Island, Vermont and Wyoming. Figure 23 shows the speeding-related fatalities as a percent of total fatalities by state in 1987, 1995, 2000 and 2002. This figure shows a qualitative difference in the percent between the eastern and the western halves of the US. It indicates that the western states have a higher percent of speeding-related fatalities as compared to the eastern half of the US. This might be due to the fact that most states in the western half of the US have a lower density of licensed drivers per mile of highway. This has been quantitatively studied in the companion speeding report. Figure 24 shows the speeding-related fatality rate per 100 Million VMT by state in 2002. This figure also indicates that the states in the western part of the US have a higher speeding-related fatality rate as compared to the eastern half of the US. Figure 25 shows the overall percent of speeding-related fatalities to the total fatalities by state from 1983 to 2002. It shows that, as a percent of all fatalities, New Jersey is the state with the lowest percent of speeding-related fatalities, and South Carolina is the state with the highest percent of speeding-related fatalities.
________________________________________________________________________ National Center for Statistics and Analysis, 400 Seventh St., S.W., Washington, DC 20590
30
Figure 23: Speeding-Related Fatalities as a Percent of Total Fatalities in 1987, 1995, 2000 and 2002
1985 1995 2000 2002
________________________________________________________________________ National Center for Statistics and Analysis, 400 Seventh St., S.W., Washington, DC 20590
31
Figure 24: Speeding-Related Fatality Rate per 100 Million VMT, 2002
________________________________________________________________________ National Center for Statistics and Analysis, 400 Seventh St., S.W., Washington, DC 20590
32
Figure 25: Overall Percent of Speeding-Related Fatalities by State for the Whole Period of 1983-2002
New JerseyIowa
LouisianaMississippi
NebraskaFloridaIndiana
MichiganMinnesota
OhioGeorgia
KentuckyVirginia
TennesseeMassachusetts
New YorkWest Virginia
MarylandOregon
DelawareIllinois
KansasWisconsin
New HampsshireUtah
HawaiiRhode IslandNorth DakotaConnecticut
AlaskaPennsylvania
ArkansasIdaho
AlabamaNew Mexico
South DakotaNorth Carolina
TexasMissouri
WashingtonMaine
NevadaMontanaArizona
CaliforniaD.C.
ColoradoOklahoma
VermontWyoming
South Carolina
0 10 20 30 40 50
Source: FARS 1983-2002 (Pureto Rico data was not included in the figure)
Overall Percent of Speeding-Related Fatalities to the Total Fatalities for the Period of 1983-2002 by State
Percent
________________________________________________________________________ National Center for Statistics and Analysis, 400 Seventh St., S.W., Washington, DC 20590
33
4. Conclusions Speeding is one of the most prevalent factors contributing to traffic crashes. Speeding reduces a driver’s ability to steer safely around curves or objects in the roadway, extends the distance necessary to stop a vehicle, and increases the distance a vehicle travels while a driver reacts to a dangerous situation. Higher crash speeds also reduce the ability of vehicle, restraint system, and roadway hardware such as guardrails, barriers, and impact attenuators to protect vehicle occupants [2-5]. Speeding is a factor in 30 percent of all fatal crashes. About 1,000 fatalities resulted from speeding-related motor vehicle traffic crashes every month. In this report, we have analyzed the trends of nationwide speeding-related fatal crashes in the US. Environmental related factors (e.g. day of week, roadway functional class, etc.), driver’s behavior related factors (e.g. driver’s age and gender, alcohol use, etc.), and vehicle related factors (e.g. vehicle type and crash type) have been investigated. Saturdays have the highest number of speeding-related fatal crashes, followed by Sundays and Fridays. The number of speeding-related fatalities is the highest in arterial roads followed by local/collector roads and finally interstates. About 40 percent of speeding-related fatalities occurred on a curve, nearly twice the proportion of non-speeding related fatalities that occurred on a curve. Male drivers are more likely to be involved in speeding-related fatal crashes than female drivers among drivers of all ages. The relative proportion of speeding drivers decreases with increased driver age. About 41 percent of intoxicated drivers (BAC= 0.08+) involved in fatal crashes were speeding, compared to only about 14 percent of the sober drivers. Over the years, while the percentage of intoxicated drivers who were speeding drivers has decreased slightly, the percentage sober drivers who were also speeding has been relatively constant. Motorcycle operators had the highest proportion, as a percent of all motorcycle drivers involved in fatal crashes, to be speeding. Motorcycle operators involved in fatal crashes were about twice as likely as drivers of SUVs and pickup trucks to be speeding in 2002. In speeding-related single-vehicle fatal crashes, most of the fatalities occur in “rural” roadway class. There is an increase of speeding-related crash fatalities in “local” roadway function class in recent years for both “rural” and “urban” roadways. Trends of individual statewide speeding-related fatal crashes were also studied. Distinct patterns of speeding-related fatal crashes have been found to be associated with specific regional grouping of states. Western states have a higher percent of speeding-related fatalities as compared to the Eastern half of the US.
________________________________________________________________________ National Center for Statistics and Analysis, 400 Seventh St., S.W., Washington, DC 20590
34
5. References [1] FARS Analytic Reference Guide 1975 to 2002. National Highway Traffic Safety Administration, U.S. Department of Transportation. DOT HS 809 463, June 2002. [2] Traffic Safety Facts 2002: Speeding. National Highway Traffic Safety Administration, U.S. Department of Transportation. DOT HS 809 616. [3] National Highway Traffic Safety Administration, The Effect of Increased Speed Limits in the Post-NMSL Era: Report to Congress, 1998. [4] US DOT Speed Management Team, Speed Management Strategic Initiative, Federal Highway Administration, Federal Motor Carrier Safety Administration, National Highway Traffic Safety Administration, US Department of Transportation, January 2005. [5] Insurance Institute for Highway Safety (IIHS), “Faster Travel and the Price We Pay”, Special issue: Speeding, 38 (10), November 2003.
________________________________________________________________________ National Center for Statistics and Analysis, 400 Seventh St., S.W., Washington, DC 20590
35
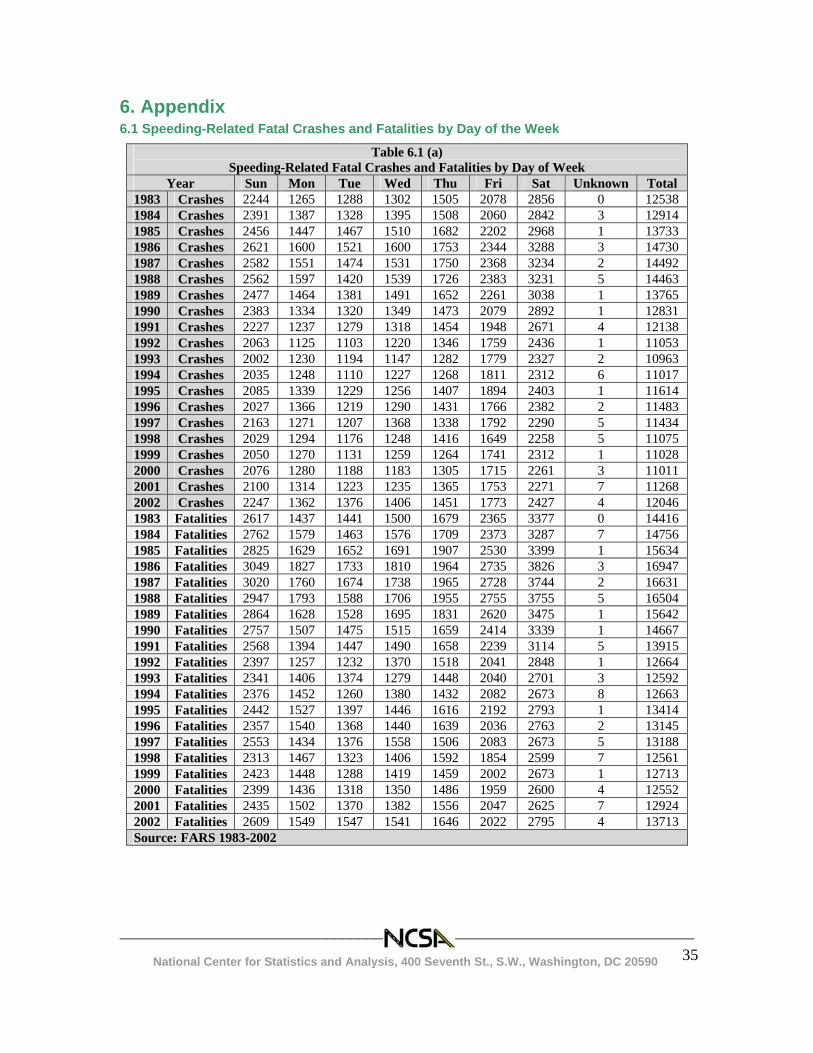
6. Appendix 6.1 Speeding-Related Fatal Crashes and Fatalities by Day of the Week
Table 6.1 (a)
Speeding-Related Fatal Crashes and Fatalities by Day of Week Year Sun Mon Tue Wed Thu Fri Sat Unknown Total
1983 Crashes 2244 1265 1288 1302 1505 2078 2856 0 12538 1984 Crashes 2391 1387 1328 1395 1508 2060 2842 3 12914 1985 Crashes 2456 1447 1467 1510 1682 2202 2968 1 13733 1986 Crashes 2621 1600 1521 1600 1753 2344 3288 3 14730 1987 Crashes 2582 1551 1474 1531 1750 2368 3234 2 14492 1988 Crashes 2562 1597 1420 1539 1726 2383 3231 5 14463 1989 Crashes 2477 1464 1381 1491 1652 2261 3038 1 13765 1990 Crashes 2383 1334 1320 1349 1473 2079 2892 1 12831 1991 Crashes 2227 1237 1279 1318 1454 1948 2671 4 12138 1992 Crashes 2063 1125 1103 1220 1346 1759 2436 1 11053 1993 Crashes 2002 1230 1194 1147 1282 1779 2327 2 10963 1994 Crashes 2035 1248 1110 1227 1268 1811 2312 6 11017 1995 Crashes 2085 1339 1229 1256 1407 1894 2403 1 11614 1996 Crashes 2027 1366 1219 1290 1431 1766 2382 2 11483 1997 Crashes 2163 1271 1207 1368 1338 1792 2290 5 11434 1998 Crashes 2029 1294 1176 1248 1416 1649 2258 5 11075 1999 Crashes 2050 1270 1131 1259 1264 1741 2312 1 11028 2000 Crashes 2076 1280 1188 1183 1305 1715 2261 3 11011 2001 Crashes 2100 1314 1223 1235 1365 1753 2271 7 11268 2002 Crashes 2247 1362 1376 1406 1451 1773 2427 4 12046 1983 Fatalities 2617 1437 1441 1500 1679 2365 3377 0 14416 1984 Fatalities 2762 1579 1463 1576 1709 2373 3287 7 14756 1985 Fatalities 2825 1629 1652 1691 1907 2530 3399 1 15634 1986 Fatalities 3049 1827 1733 1810 1964 2735 3826 3 16947 1987 Fatalities 3020 1760 1674 1738 1965 2728 3744 2 16631 1988 Fatalities 2947 1793 1588 1706 1955 2755 3755 5 16504 1989 Fatalities 2864 1628 1528 1695 1831 2620 3475 1 15642 1990 Fatalities 2757 1507 1475 1515 1659 2414 3339 1 14667 1991 Fatalities 2568 1394 1447 1490 1658 2239 3114 5 13915 1992 Fatalities 2397 1257 1232 1370 1518 2041 2848 1 12664 1993 Fatalities 2341 1406 1374 1279 1448 2040 2701 3 12592 1994 Fatalities 2376 1452 1260 1380 1432 2082 2673 8 12663 1995 Fatalities 2442 1527 1397 1446 1616 2192 2793 1 13414 1996 Fatalities 2357 1540 1368 1440 1639 2036 2763 2 13145 1997 Fatalities 2553 1434 1376 1558 1506 2083 2673 5 13188 1998 Fatalities 2313 1467 1323 1406 1592 1854 2599 7 12561 1999 Fatalities 2423 1448 1288 1419 1459 2002 2673 1 12713 2000 Fatalities 2399 1436 1318 1350 1486 1959 2600 4 12552 2001 Fatalities 2435 1502 1370 1382 1556 2047 2625 7 12924 2002 Fatalities 2609 1549 1547 1541 1646 2022 2795 4 13713 Source: FARS 1983-2002
________________________________________________________________________ National Center for Statistics and Analysis, 400 Seventh St., S.W., Washington, DC 20590
36
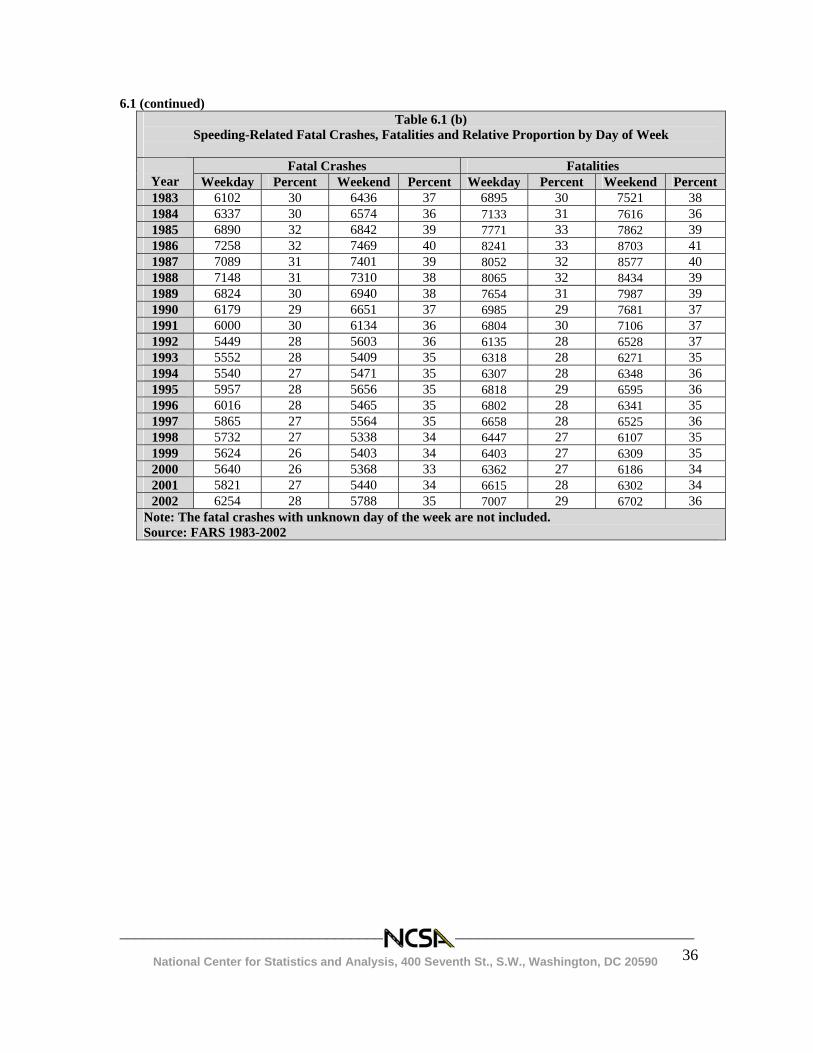
6.1 (continued) Table 6.1 (b)
Speeding-Related Fatal Crashes, Fatalities and Relative Proportion by Day of Week
Fatal Crashes Fatalities Year Weekday Percent Weekend Percent Weekday Percent Weekend Percent 1983 6102 30 6436 37 6895 30 7521 38 1984 6337 30 6574 36 7133 31 7616 36 1985 6890 32 6842 39 7771 33 7862 39 1986 7258 32 7469 40 8241 33 8703 41 1987 7089 31 7401 39 8052 32 8577 40 1988 7148 31 7310 38 8065 32 8434 39 1989 6824 30 6940 38 7654 31 7987 39 1990 6179 29 6651 37 6985 29 7681 37 1991 6000 30 6134 36 6804 30 7106 37 1992 5449 28 5603 36 6135 28 6528 37 1993 5552 28 5409 35 6318 28 6271 35 1994 5540 27 5471 35 6307 28 6348 36 1995 5957 28 5656 35 6818 29 6595 36 1996 6016 28 5465 35 6802 28 6341 35 1997 5865 27 5564 35 6658 28 6525 36 1998 5732 27 5338 34 6447 27 6107 35 1999 5624 26 5403 34 6403 27 6309 35 2000 5640 26 5368 33 6362 27 6186 34 2001 5821 27 5440 34 6615 28 6302 34 2002 6254 28 5788 35 7007 29 6702 36
Note: The fatal crashes with unknown day of the week are not included. Source: FARS 1983-2002
________________________________________________________________________ National Center for Statistics and Analysis, 400 Seventh St., S.W., Washington, DC 20590
37
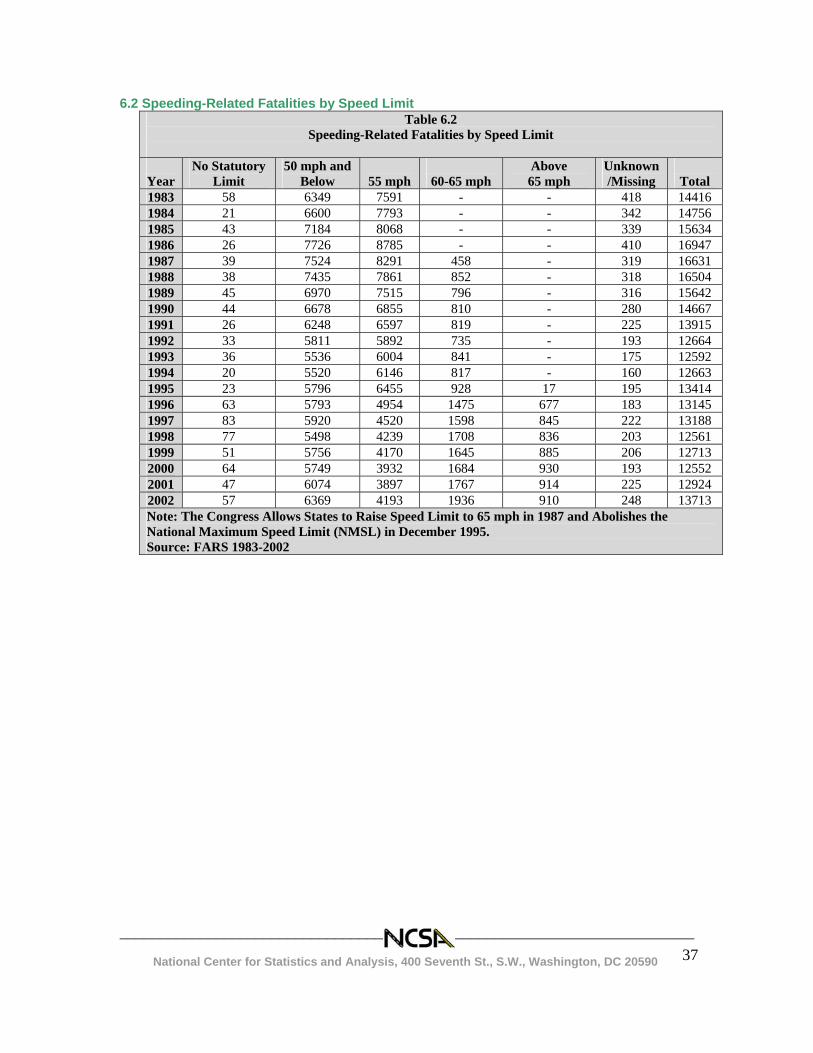
6.2 Speeding-Related Fatalities by Speed Limit Table 6.2
Speeding-Related Fatalities by Speed Limit
Year
No Statutory Limit
50 mph and Below
55 mph
60-65 mph
Above 65 mph
Unknown /Missing
Total
1983 58 6349 7591 - - 418 14416 1984 21 6600 7793 - - 342 14756 1985 43 7184 8068 - - 339 15634 1986 26 7726 8785 - - 410 16947 1987 39 7524 8291 458 - 319 16631 1988 38 7435 7861 852 - 318 16504 1989 45 6970 7515 796 - 316 15642 1990 44 6678 6855 810 - 280 14667 1991 26 6248 6597 819 - 225 13915 1992 33 5811 5892 735 - 193 12664 1993 36 5536 6004 841 - 175 12592 1994 20 5520 6146 817 - 160 12663 1995 23 5796 6455 928 17 195 13414 1996 63 5793 4954 1475 677 183 13145 1997 83 5920 4520 1598 845 222 13188 1998 77 5498 4239 1708 836 203 12561 1999 51 5756 4170 1645 885 206 12713 2000 64 5749 3932 1684 930 193 12552 2001 47 6074 3897 1767 914 225 12924 2002 57 6369 4193 1936 910 248 13713 Note: The Congress Allows States to Raise Speed Limit to 65 mph in 1987 and Abolishes the National Maximum Speed Limit (NMSL) in December 1995. Source: FARS 1983-2002
________________________________________________________________________ National Center for Statistics and Analysis, 400 Seventh St., S.W., Washington, DC 20590
38
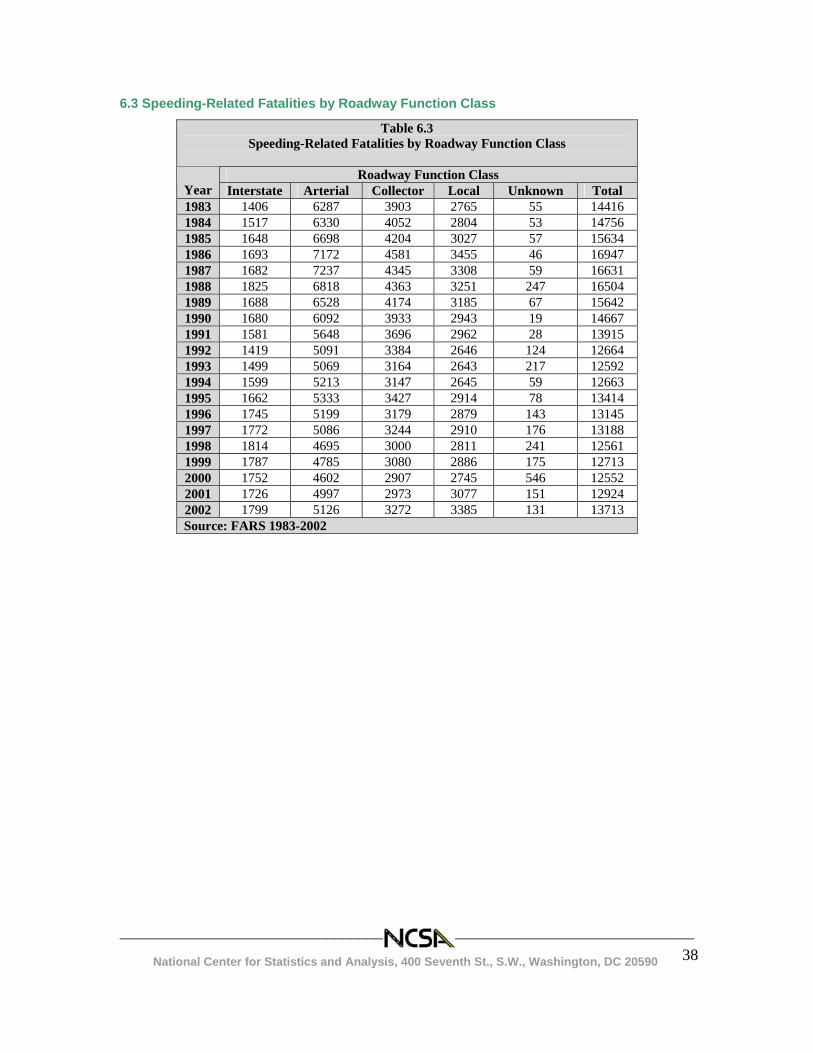
6.3 Speeding-Related Fatalities by Roadway Function Class
Table 6.3 Speeding-Related Fatalities by Roadway Function Class
Roadway Function Class
Year Interstate Arterial Collector Local Unknown Total 1983 1406 6287 3903 2765 55 14416 1984 1517 6330 4052 2804 53 14756 1985 1648 6698 4204 3027 57 15634 1986 1693 7172 4581 3455 46 16947 1987 1682 7237 4345 3308 59 16631 1988 1825 6818 4363 3251 247 16504 1989 1688 6528 4174 3185 67 15642 1990 1680 6092 3933 2943 19 14667 1991 1581 5648 3696 2962 28 13915 1992 1419 5091 3384 2646 124 12664 1993 1499 5069 3164 2643 217 12592 1994 1599 5213 3147 2645 59 12663 1995 1662 5333 3427 2914 78 13414 1996 1745 5199 3179 2879 143 13145 1997 1772 5086 3244 2910 176 13188 1998 1814 4695 3000 2811 241 12561 1999 1787 4785 3080 2886 175 12713 2000 1752 4602 2907 2745 546 12552 2001 1726 4997 2973 3077 151 12924 2002 1799 5126 3272 3385 131 13713 Source: FARS 1983-2002

________________________________________________________________________ National Center for Statistics and Analysis, 400 Seventh St., S.W., Washington, DC 20590
39
6.4 National (Total) Fatalities by Roadway Functional Class
Rural Urban
Year IS OPA MA MAC MIC L RU TR IS OFE OPA MA C L UU TU U T
1981 2369 7439 5666 5911 1788 3789 697 27659 2145 1580 5420 5187 2272 3841 318 20763 827 49249
1982 2081 5818 5230 6445 1672 3698 61 25005 1990 1425 5479 4672 1991 2968 153 18678 262 43945
1983 2151 5355 4840 6431 1700 3928 81 24486 1878 1583 5340 4000 1708 3486 32 18027 76 42589
1984 2256 5738 4924 6966 1493 4145 118 25640 2043 1678 5554 4183 1840 3248 40 18586 31 44257
1985 2197 5658 4604 6747 1517 4378 93 25194 1951 1561 5823 4165 1830 3208 66 18604 27 43825
1986 2160 5813 4956 7001 1767 4702 85 26484 2119 1573 6058 4488 1842 3448 53 19581 22 46087
1987 2533 5487 5903 6891 1854 4382 81 27131 2103 1867 5977 4107 1583 3539 41 19217 42 46390
1988 2848 5304 5655 7203 1931 4487 367 27795 2294 1664 5900 4219 1610 3511 53 19251 41 47087
1989 2787 4937 5344 7032 1746 4455 91 26392 2184 1914 5775 4159 1617 3499 12 19160 30 45582
1990 2732 4451 5408 7112 1766 4275 17 25761 2261 1763 6245 3888 1398 3245 7 18807 31 44599
1991 2584 4254 4947 6495 1709 4311 28 24328 1988 1791 5541 3415 1224 3139 28 17126 54 41508
1992 2478 4139 4458 6287 1570 3858 31 22821 1869 1648 5212 3200 1091 2985 218 16223 206 39250
1993 2612 4395 4487 5889 1599 3994 483 23459 1954 1678 5165 3268 1147 3016 201 16429 262 40150
1994 2566 5121 4212 6128 1596 4152 66 23841 2147 1919 4960 3583 1217 2921 64 16811 64 40716
1995 2658 4965 4406 6218 1598 4556 48 24449 2177 1807 5041 3732 1213 3163 30 17163 205 41817
1996 2924 5251 4184 5973 1553 4396 280 24561 2321 1538 5528 3652 1208 3052 69 17368 136 42065
1997 3040 5394 4284 5920 1723 4450 324 25135 2292 1296 5420 3523 1163 3064 71 16829 49 42013
1998 3105 5378 4216 5840 1753 4459 434 25185 2283 1282 5285 3335 1037 2921 76 16219 97 41501
1999 3244 5294 4279 5833 1762 4773 363 25548 2353 1362 5065 3201 1031 2958 88 16058 111 41717
2000 3254 4917 4090 5501 1808 4414 854 24838 2419 1364 4948 3211 1001 2912 258 16113 994 41945
2001 3142 5013 4254 5896 1818 4712 315 25150 2523 1425 5148 3355 1094 3350 93 16988 58 42196
2002 3297 4884 4474 5972 2002 5064 156 25849 2452 1481 5047 3174 1136 3469 33 16792 174 42815
Notes: Rural: IS-Interstate, OPA-Other Principal Arterial, MA-Minor Arterial, MAC-Major Collector, MIC-Minor Collector, L-Local, RU-Rural Unknown, TR-Total Rural Urban: IS-Interstate, OFE-Other Freeway & Expressway, OPA-Other Principal Arterial, MA-Minor Arterial, C-Collector, L-Local, UU-Urban Unknown, TU-Total Urban Total: U-Unknown, T-Total
________________________________________________________________________ National Center for Statistics and Analysis, 400 Seventh St., S.W., Washington, DC 20590
40
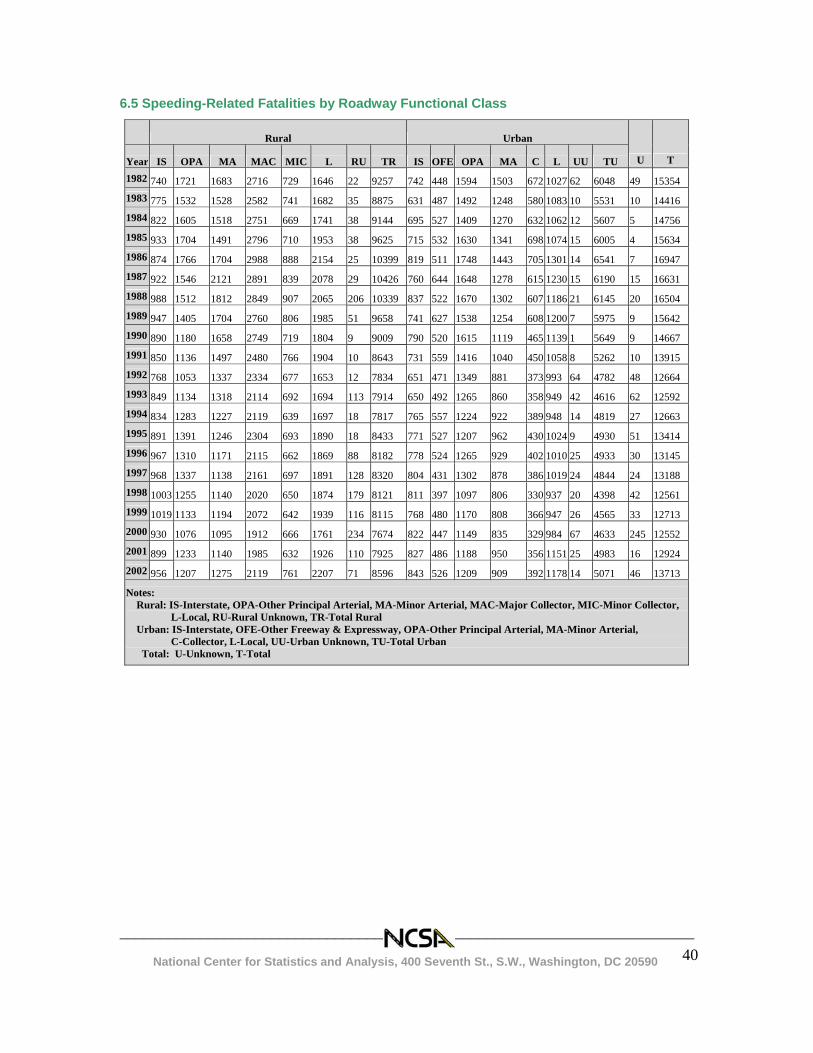
6.5 Speeding-Related Fatalities by Roadway Functional Class
Rural Urban
Year IS OPA MA MAC MIC L RU TR IS OFE OPA MA C L UU TU U T
1982 740 1721 1683 2716 729 1646 22 9257 742 448 1594 1503 672 1027 62 6048 49 15354 1983 775 1532 1528 2582 741 1682 35 8875 631 487 1492 1248 580 1083 10 5531 10 14416 1984 822 1605 1518 2751 669 1741 38 9144 695 527 1409 1270 632 1062 12 5607 5 14756 1985 933 1704 1491 2796 710 1953 38 9625 715 532 1630 1341 698 1074 15 6005 4 15634 1986 874 1766 1704 2988 888 2154 25 10399 819 511 1748 1443 705 1301 14 6541 7 16947 1987 922 1546 2121 2891 839 2078 29 10426 760 644 1648 1278 615 1230 15 6190 15 16631 1988 988 1512 1812 2849 907 2065 206 10339 837 522 1670 1302 607 1186 21 6145 20 16504 1989 947 1405 1704 2760 806 1985 51 9658 741 627 1538 1254 608 1200 7 5975 9 15642 1990 890 1180 1658 2749 719 1804 9 9009 790 520 1615 1119 465 1139 1 5649 9 14667 1991 850 1136 1497 2480 766 1904 10 8643 731 559 1416 1040 450 1058 8 5262 10 13915 1992 768 1053 1337 2334 677 1653 12 7834 651 471 1349 881 373 993 64 4782 48 12664 1993 849 1134 1318 2114 692 1694 113 7914 650 492 1265 860 358 949 42 4616 62 12592 1994 834 1283 1227 2119 639 1697 18 7817 765 557 1224 922 389 948 14 4819 27 12663 1995 891 1391 1246 2304 693 1890 18 8433 771 527 1207 962 430 1024 9 4930 51 13414 1996 967 1310 1171 2115 662 1869 88 8182 778 524 1265 929 402 1010 25 4933 30 13145 1997 968 1337 1138 2161 697 1891 128 8320 804 431 1302 878 386 1019 24 4844 24 13188 1998 1003 1255 1140 2020 650 1874 179 8121 811 397 1097 806 330 937 20 4398 42 12561 1999 1019 1133 1194 2072 642 1939 116 8115 768 480 1170 808 366 947 26 4565 33 12713 2000 930 1076 1095 1912 666 1761 234 7674 822 447 1149 835 329 984 67 4633 245 12552 2001 899 1233 1140 1985 632 1926 110 7925 827 486 1188 950 356 1151 25 4983 16 12924 2002 956 1207 1275 2119 761 2207 71 8596 843 526 1209 909 392 1178 14 5071 46 13713
Notes: Rural: IS-Interstate, OPA-Other Principal Arterial, MA-Minor Arterial, MAC-Major Collector, MIC-Minor Collector, L-Local, RU-Rural Unknown, TR-Total Rural Urban: IS-Interstate, OFE-Other Freeway & Expressway, OPA-Other Principal Arterial, MA-Minor Arterial, C-Collector, L-Local, UU-Urban Unknown, TU-Total Urban Total: U-Unknown, T-Total
________________________________________________________________________ National Center for Statistics and Analysis, 400 Seventh St., S.W., Washington, DC 20590
41
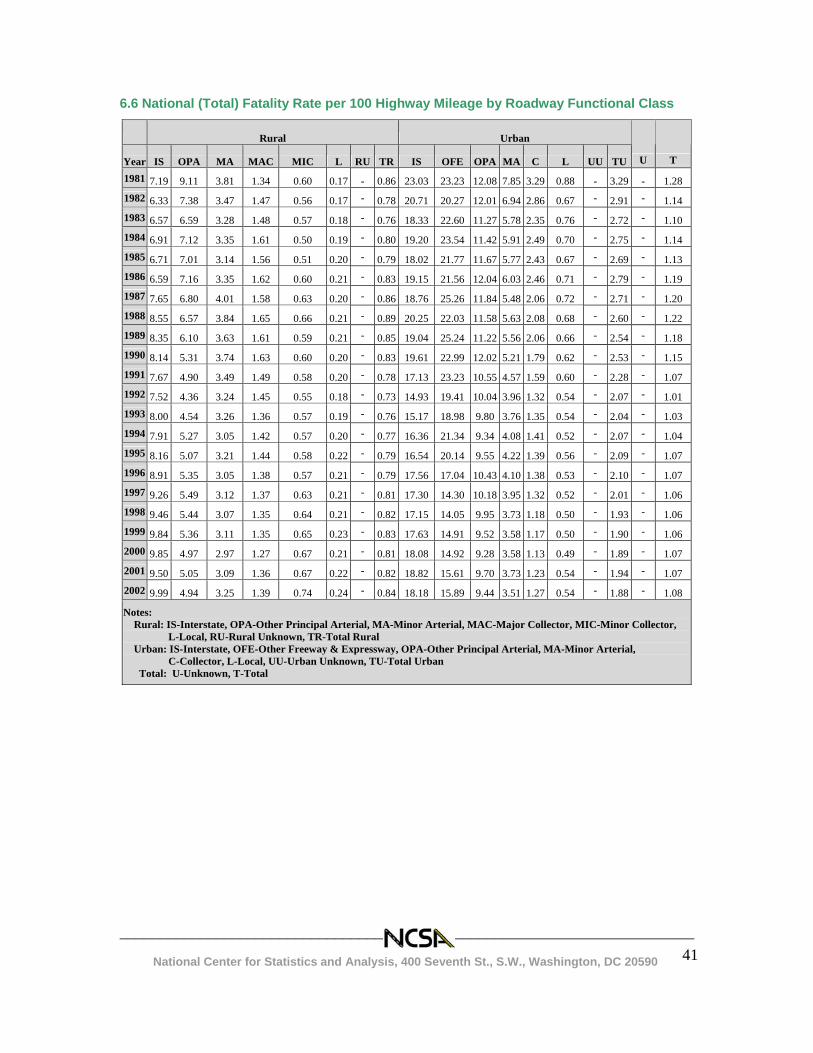
6.6 National (Total) Fatality Rate per 100 Highway Mileage by Roadway Functional Class
Rural Urban
Year IS OPA MA MAC MIC L RU TR IS OFE OPA MA C L UU TU U T
1981 7.19 9.11 3.81 1.34 0.60 0.17 - 0.86 23.03 23.23 12.08 7.85 3.29 0.88 - 3.29 - 1.28 1982 6.33 7.38 3.47 1.47 0.56 0.17 - 0.78 20.71 20.27 12.01 6.94 2.86 0.67 - 2.91 - 1.14 1983 6.57 6.59 3.28 1.48 0.57 0.18 - 0.76 18.33 22.60 11.27 5.78 2.35 0.76 - 2.72 - 1.10 1984 6.91 7.12 3.35 1.61 0.50 0.19 - 0.80 19.20 23.54 11.42 5.91 2.49 0.70 - 2.75 - 1.14 1985 6.71 7.01 3.14 1.56 0.51 0.20 - 0.79 18.02 21.77 11.67 5.77 2.43 0.67 - 2.69 - 1.13 1986 6.59 7.16 3.35 1.62 0.60 0.21 - 0.83 19.15 21.56 12.04 6.03 2.46 0.71 - 2.79 - 1.19 1987 7.65 6.80 4.01 1.58 0.63 0.20 - 0.86 18.76 25.26 11.84 5.48 2.06 0.72 - 2.71 - 1.20 1988 8.55 6.57 3.84 1.65 0.66 0.21 - 0.89 20.25 22.03 11.58 5.63 2.08 0.68 - 2.60 - 1.22 1989 8.35 6.10 3.63 1.61 0.59 0.21 - 0.85 19.04 25.24 11.22 5.56 2.06 0.66 - 2.54 - 1.18 1990 8.14 5.31 3.74 1.63 0.60 0.20 - 0.83 19.61 22.99 12.02 5.21 1.79 0.62 - 2.53 - 1.15 1991 7.67 4.90 3.49 1.49 0.58 0.20 - 0.78 17.13 23.23 10.55 4.57 1.59 0.60 - 2.28 - 1.07 1992 7.52 4.36 3.24 1.45 0.55 0.18 - 0.73 14.93 19.41 10.04 3.96 1.32 0.54 - 2.07 - 1.01 1993 8.00 4.54 3.26 1.36 0.57 0.19 - 0.76 15.17 18.98 9.80 3.76 1.35 0.54 - 2.04 - 1.03 1994 7.91 5.27 3.05 1.42 0.57 0.20 - 0.77 16.36 21.34 9.34 4.08 1.41 0.52 - 2.07 - 1.04 1995 8.16 5.07 3.21 1.44 0.58 0.22 - 0.79 16.54 20.14 9.55 4.22 1.39 0.56 - 2.09 - 1.07 1996 8.91 5.35 3.05 1.38 0.57 0.21 - 0.79 17.56 17.04 10.43 4.10 1.38 0.53 - 2.10 - 1.07 1997 9.26 5.49 3.12 1.37 0.63 0.21 - 0.81 17.30 14.30 10.18 3.95 1.32 0.52 - 2.01 - 1.06 1998 9.46 5.44 3.07 1.35 0.64 0.21 - 0.82 17.15 14.05 9.95 3.73 1.18 0.50 - 1.93 - 1.06 1999 9.84 5.36 3.11 1.35 0.65 0.23 - 0.83 17.63 14.91 9.52 3.58 1.17 0.50 - 1.90 - 1.06 2000 9.85 4.97 2.97 1.27 0.67 0.21 - 0.81 18.08 14.92 9.28 3.58 1.13 0.49 - 1.89 - 1.07 2001 9.50 5.05 3.09 1.36 0.67 0.22 - 0.82 18.82 15.61 9.70 3.73 1.23 0.54 - 1.94 - 1.07 2002 9.99 4.94 3.25 1.39 0.74 0.24 - 0.84 18.18 15.89 9.44 3.51 1.27 0.54 - 1.88 - 1.08
Notes: Rural: IS-Interstate, OPA-Other Principal Arterial, MA-Minor Arterial, MAC-Major Collector, MIC-Minor Collector, L-Local, RU-Rural Unknown, TR-Total Rural Urban: IS-Interstate, OFE-Other Freeway & Expressway, OPA-Other Principal Arterial, MA-Minor Arterial, C-Collector, L-Local, UU-Urban Unknown, TU-Total Urban Total: U-Unknown, T-Total
________________________________________________________________________ National Center for Statistics and Analysis, 400 Seventh St., S.W., Washington, DC 20590
42
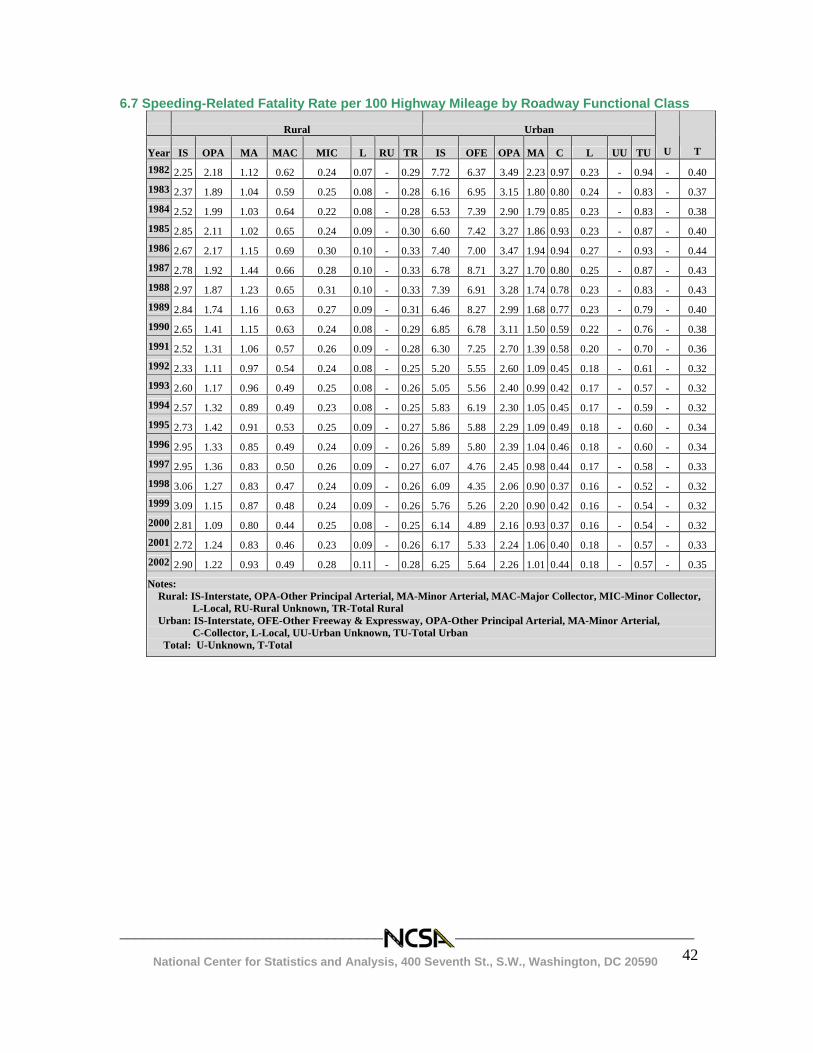
6.7 Speeding-Related Fatality Rate per 100 Highway Mileage by Roadway Functional Class
Rural Urban
Year IS OPA MA MAC MIC L RU TR IS OFE OPA MA C L UU TU U T
1982 2.25 2.18 1.12 0.62 0.24 0.07 - 0.29 7.72 6.37 3.49 2.23 0.97 0.23 - 0.94 - 0.40 1983 2.37 1.89 1.04 0.59 0.25 0.08 - 0.28 6.16 6.95 3.15 1.80 0.80 0.24 - 0.83 - 0.37 1984 2.52 1.99 1.03 0.64 0.22 0.08 - 0.28 6.53 7.39 2.90 1.79 0.85 0.23 - 0.83 - 0.38 1985 2.85 2.11 1.02 0.65 0.24 0.09 - 0.30 6.60 7.42 3.27 1.86 0.93 0.23 - 0.87 - 0.40 1986 2.67 2.17 1.15 0.69 0.30 0.10 - 0.33 7.40 7.00 3.47 1.94 0.94 0.27 - 0.93 - 0.44 1987 2.78 1.92 1.44 0.66 0.28 0.10 - 0.33 6.78 8.71 3.27 1.70 0.80 0.25 - 0.87 - 0.43 1988 2.97 1.87 1.23 0.65 0.31 0.10 - 0.33 7.39 6.91 3.28 1.74 0.78 0.23 - 0.83 - 0.43 1989 2.84 1.74 1.16 0.63 0.27 0.09 - 0.31 6.46 8.27 2.99 1.68 0.77 0.23 - 0.79 - 0.40 1990 2.65 1.41 1.15 0.63 0.24 0.08 - 0.29 6.85 6.78 3.11 1.50 0.59 0.22 - 0.76 - 0.38 1991 2.52 1.31 1.06 0.57 0.26 0.09 - 0.28 6.30 7.25 2.70 1.39 0.58 0.20 - 0.70 - 0.36 1992 2.33 1.11 0.97 0.54 0.24 0.08 - 0.25 5.20 5.55 2.60 1.09 0.45 0.18 - 0.61 - 0.32 1993 2.60 1.17 0.96 0.49 0.25 0.08 - 0.26 5.05 5.56 2.40 0.99 0.42 0.17 - 0.57 - 0.32 1994 2.57 1.32 0.89 0.49 0.23 0.08 - 0.25 5.83 6.19 2.30 1.05 0.45 0.17 - 0.59 - 0.32 1995 2.73 1.42 0.91 0.53 0.25 0.09 - 0.27 5.86 5.88 2.29 1.09 0.49 0.18 - 0.60 - 0.34 1996 2.95 1.33 0.85 0.49 0.24 0.09 - 0.26 5.89 5.80 2.39 1.04 0.46 0.18 - 0.60 - 0.34 1997 2.95 1.36 0.83 0.50 0.26 0.09 - 0.27 6.07 4.76 2.45 0.98 0.44 0.17 - 0.58 - 0.33 1998 3.06 1.27 0.83 0.47 0.24 0.09 - 0.26 6.09 4.35 2.06 0.90 0.37 0.16 - 0.52 - 0.32 1999 3.09 1.15 0.87 0.48 0.24 0.09 - 0.26 5.76 5.26 2.20 0.90 0.42 0.16 - 0.54 - 0.32 2000 2.81 1.09 0.80 0.44 0.25 0.08 - 0.25 6.14 4.89 2.16 0.93 0.37 0.16 - 0.54 - 0.32 2001 2.72 1.24 0.83 0.46 0.23 0.09 - 0.26 6.17 5.33 2.24 1.06 0.40 0.18 - 0.57 - 0.33 2002 2.90 1.22 0.93 0.49 0.28 0.11 - 0.28 6.25 5.64 2.26 1.01 0.44 0.18 - 0.57 - 0.35
Notes: Rural: IS-Interstate, OPA-Other Principal Arterial, MA-Minor Arterial, MAC-Major Collector, MIC-Minor Collector, L-Local, RU-Rural Unknown, TR-Total Rural Urban: IS-Interstate, OFE-Other Freeway & Expressway, OPA-Other Principal Arterial, MA-Minor Arterial, C-Collector, L-Local, UU-Urban Unknown, TU-Total Urban Total: U-Unknown, T-Total
________________________________________________________________________ National Center for Statistics and Analysis, 400 Seventh St., S.W., Washington, DC 20590
43
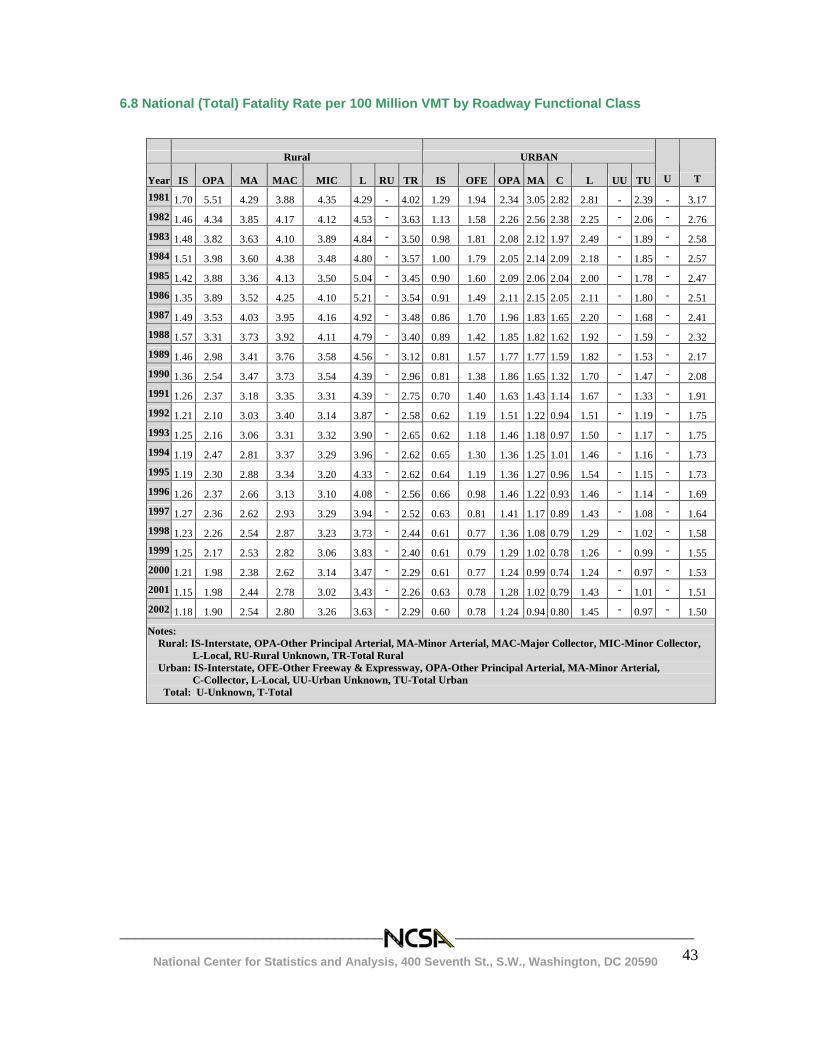
6.8 National (Total) Fatality Rate per 100 Million VMT by Roadway Functional Class
Rural URBAN
Year IS OPA MA MAC MIC L RU TR IS OFE OPA MA C L UU TU U T
1981 1.70 5.51 4.29 3.88 4.35 4.29 - 4.02 1.29 1.94 2.34 3.05 2.82 2.81 - 2.39 - 3.17 1982 1.46 4.34 3.85 4.17 4.12 4.53 - 3.63 1.13 1.58 2.26 2.56 2.38 2.25 - 2.06 - 2.76 1983 1.48 3.82 3.63 4.10 3.89 4.84 - 3.50 0.98 1.81 2.08 2.12 1.97 2.49 - 1.89 - 2.58 1984 1.51 3.98 3.60 4.38 3.48 4.80 - 3.57 1.00 1.79 2.05 2.14 2.09 2.18 - 1.85 - 2.57 1985 1.42 3.88 3.36 4.13 3.50 5.04 - 3.45 0.90 1.60 2.09 2.06 2.04 2.00 - 1.78 - 2.47 1986 1.35 3.89 3.52 4.25 4.10 5.21 - 3.54 0.91 1.49 2.11 2.15 2.05 2.11 - 1.80 - 2.51 1987 1.49 3.53 4.03 3.95 4.16 4.92 - 3.48 0.86 1.70 1.96 1.83 1.65 2.20 - 1.68 - 2.41 1988 1.57 3.31 3.73 3.92 4.11 4.79 - 3.40 0.89 1.42 1.85 1.82 1.62 1.92 - 1.59 - 2.32 1989 1.46 2.98 3.41 3.76 3.58 4.56 - 3.12 0.81 1.57 1.77 1.77 1.59 1.82 - 1.53 - 2.17 1990 1.36 2.54 3.47 3.73 3.54 4.39 - 2.96 0.81 1.38 1.86 1.65 1.32 1.70 - 1.47 - 2.08 1991 1.26 2.37 3.18 3.35 3.31 4.39 - 2.75 0.70 1.40 1.63 1.43 1.14 1.67 - 1.33 - 1.91 1992 1.21 2.10 3.03 3.40 3.14 3.87 - 2.58 0.62 1.19 1.51 1.22 0.94 1.51 - 1.19 - 1.75 1993 1.25 2.16 3.06 3.31 3.32 3.90 - 2.65 0.62 1.18 1.46 1.18 0.97 1.50 - 1.17 - 1.75 1994 1.19 2.47 2.81 3.37 3.29 3.96 - 2.62 0.65 1.30 1.36 1.25 1.01 1.46 - 1.16 - 1.73 1995 1.19 2.30 2.88 3.34 3.20 4.33 - 2.62 0.64 1.19 1.36 1.27 0.96 1.54 - 1.15 - 1.73 1996 1.26 2.37 2.66 3.13 3.10 4.08 - 2.56 0.66 0.98 1.46 1.22 0.93 1.46 - 1.14 - 1.69 1997 1.27 2.36 2.62 2.93 3.29 3.94 - 2.52 0.63 0.81 1.41 1.17 0.89 1.43 - 1.08 - 1.64 1998 1.23 2.26 2.54 2.87 3.23 3.73 - 2.44 0.61 0.77 1.36 1.08 0.79 1.29 - 1.02 - 1.58 1999 1.25 2.17 2.53 2.82 3.06 3.83 - 2.40 0.61 0.79 1.29 1.02 0.78 1.26 - 0.99 - 1.55 2000 1.21 1.98 2.38 2.62 3.14 3.47 - 2.29 0.61 0.77 1.24 0.99 0.74 1.24 - 0.97 - 1.53 2001 1.15 1.98 2.44 2.78 3.02 3.43 - 2.26 0.63 0.78 1.28 1.02 0.79 1.43 - 1.01 - 1.51 2002 1.18 1.90 2.54 2.80 3.26 3.63 - 2.29 0.60 0.78 1.24 0.94 0.80 1.45 - 0.97 - 1.50
Notes: Rural: IS-Interstate, OPA-Other Principal Arterial, MA-Minor Arterial, MAC-Major Collector, MIC-Minor Collector, L-Local, RU-Rural Unknown, TR-Total Rural Urban: IS-Interstate, OFE-Other Freeway & Expressway, OPA-Other Principal Arterial, MA-Minor Arterial, C-Collector, L-Local, UU-Urban Unknown, TU-Total Urban Total: U-Unknown, T-Total
________________________________________________________________________ National Center for Statistics and Analysis, 400 Seventh St., S.W., Washington, DC 20590
44
6.9 Speeding-Related Fatality Rate per 100 Million VMT by Roadway Functional Class
Rural URBAN
Year IS OPA MA MAC MIC L RU TR IS OFE OPA MA C L UU TU U T
1982 0.52 1.28 1.24 1.76 1.80 2.02 - 1.34 0.42 0.50 0.66 0.82 0.80 0.78 - 0.67 - 0.96 1983 0.53 1.09 1.15 1.65 1.69 2.07 - 1.27 0.33 0.56 0.58 0.66 0.67 0.77 - 0.58 - 0.87 1984 0.55 1.11 1.11 1.73 1.56 2.02 - 1.27 0.34 0.56 0.52 0.65 0.72 0.71 - 0.56 - 0.86 1985 0.60 1.17 1.09 1.71 1.64 2.25 - 1.32 0.33 0.55 0.58 0.66 0.78 0.67 - 0.58 - 0.88 1986 0.55 1.18 1.21 1.81 2.06 2.39 - 1.39 0.35 0.48 0.61 0.69 0.78 0.80 - 0.60 - 0.92 1987 0.54 0.99 1.45 1.66 1.88 2.33 - 1.34 0.31 0.59 0.54 0.57 0.64 0.76 - 0.54 - 0.87 1988 0.54 0.94 1.19 1.55 1.93 2.20 - 1.26 0.32 0.45 0.52 0.56 0.61 0.65 - 0.51 - 0.81 1989 0.50 0.85 1.09 1.47 1.65 2.03 - 1.14 0.27 0.51 0.47 0.53 0.60 0.62 - 0.48 - 0.75 1990 0.44 0.67 1.06 1.44 1.44 1.85 - 1.04 0.28 0.41 0.48 0.47 0.44 0.60 - 0.44 - 0.68 1991 0.41 0.63 0.96 1.28 1.48 1.94 - 0.98 0.26 0.44 0.42 0.43 0.42 0.56 - 0.41 - 0.64 1992 0.37 0.54 0.91 1.26 1.35 1.66 - 0.89 0.21 0.34 0.39 0.34 0.32 0.50 - 0.35 - 0.56 1993 0.41 0.56 0.90 1.19 1.44 1.65 - 0.89 0.20 0.35 0.36 0.31 0.30 0.47 - 0.33 - 0.55 1994 0.39 0.62 0.82 1.16 1.32 1.62 - 0.86 0.23 0.38 0.34 0.32 0.32 0.47 - 0.33 - 0.54 1995 0.40 0.65 0.81 1.24 1.39 1.80 - 0.90 0.23 0.35 0.33 0.33 0.34 0.50 - 0.33 - 0.55 1996 0.42 0.59 0.74 1.11 1.32 1.73 - 0.85 0.22 0.33 0.33 0.31 0.31 0.48 - 0.32 - 0.53 1997 0.40 0.58 0.70 1.07 1.33 1.68 - 0.83 0.22 0.27 0.34 0.29 0.30 0.47 - 0.31 - 0.51 1998 0.40 0.53 0.69 0.99 1.20 1.57 - 0.79 0.22 0.24 0.28 0.26 0.25 0.41 - 0.28 - 0.48 1999 0.39 0.46 0.71 1.00 1.11 1.56 - 0.76 0.20 0.28 0.30 0.26 0.28 0.40 - 0.28 - 0.47 2000 0.35 0.43 0.64 0.91 1.16 1.39 - 0.71 0.21 0.25 0.29 0.26 0.24 0.42 - 0.28 - 0.46 2001 0.33 0.49 0.65 0.94 1.05 1.40 - 0.71 0.21 0.27 0.30 0.29 0.26 0.49 - 0.30 - 0.46 2002 0.34 0.47 0.72 0.99 1.24 1.58 - 0.76 0.21 0.28 0.30 0.27 0.28 0.49 - 0.29 - 0.48
Notes: Rural: IS-Interstate, OPA-Other Principal Arterial, MA-Minor Arterial, MAC-Major Collector, MIC-Minor Collector, L-Local, RU-Rural Unknown, TR-Total Rural Urban: IS-Interstate, OFE-Other Freeway & Expressway, OPA-Other Principal Arterial, MA-Minor Arterial, C-Collector, L-Local, UU-Urban Unknown, TU-Total Urban Total: U-Unknown, T-Total
________________________________________________________________________ National Center for Statistics and Analysis, 400 Seventh St., S.W., Washington, DC 20590
45
6.10 Speeding Drivers and Relative Proportion of Speeding Drivers (Number in Parenthesis) in Fatal Crashes by Age and Sex
Table 6.10 Speeding Drivers and Relative Proportion of Speeding Drivers (Number in Parenthesis) in Fatal Crashes by Age and Sex Year Gender 15-20 21-24 25-34 35-44 45-54 55-64 65-74 75+ 1983 Male 2812(38) 2391(35) 3220(27) 1311(21) 580(15) 330(11) 157(9) 80(7) 1984 Male 2926(37) 2459(34) 3262(26) 1231(18) 551(14) 353(11) 192(10) 86(7) 1985 Male 2941(39) 2614(36) 3575(29) 1419(21) 608(15) 379(12) 186(10) 77(6) 1986 Male 3344(41) 2715(37) 3742(29) 1511(21) 612(15) 366(12) 191(10) 119(8) 1987 Male 3176(41) 2542(36) 3779(29) 1536(20) 599(14) 358(11) 185(9) 101(7) 1988 Male 3137(40) 2503(37) 3648(28) 1634(21) 657(15) 375(12) 187(9) 115(7) 1989 Male 2910(40) 2213(36) 3474(28) 1544(20) 676(15) 381(12) 211(10) 115(7) 1990 Male 2692(39) 1979(35) 3384(28) 1553(20) 595(13) 332(11) 178(8) 84(5) 1991 Male 2441(40) 1955(37) 3004(27) 1520(21) 635(15) 297(11) 188(9) 103(6) 1992 Male 2112(38) 1718(35) 2669(27) 1477(21) 615(14) 298(11) 186(9) 119(7) 1993 Male 2118(38) 1747(35) 2619(26) 1400(19) 589(13) 290(10) 166(8) 141(7) 1994 Male 2228(38) 1663(34) 2487(25) 1318(18) 704(14) 315(11) 185(8) 109(6) 1995 Male 2154(37) 1767(36) 2628(26) 1544(19) 708(14) 354(12) 190(9) 121(6) 1996 Male 2107(36) 1646(35) 2514(26) 1588(20) 745(14) 334(11) 205(9) 147(7) 1997 Male 2114(38) 1530(35) 2397(26) 1579(20) 833(15) 357(11) 211(9) 130(6) 1998 Male 2095(37) 1498(35) 2244(25) 1585(19) 851(15) 342(10) 190(8) 155(7) 1999 Male 2124(37) 1466(34) 2245(25) 1593(20) 854(15) 367(11) 171(8) 146(6) 2000 Male 2039(35) 1513(33) 2224(25) 1579(19) 838(14) 391(11) 170(8) 145(7) 2001 Male 2114(37) 1566(33) 2297(26) 1599(19) 923(15) 363(10) 189(9) 149(7) 2002 Male 2271(39) 1779(37) 2399(28) 1577(20) 972(15) 484(13) 209(10) 141(7) 1983 Female 462(22) 294(19) 419(16) 228(13) 109(11) 86(9) 41(6) 20(5) 1984 Female 498(23) 323(19) 482(17) 243(13) 109(10) 87(9) 46(6) 31(6) 1985 Female 547(25) 369(21) 468(16) 264(13) 126(12) 97(10) 63(8) 34(7) 1986 Female 585(25) 383(22) 544(17) 268(14) 115(10) 79(8) 58(7) 31(6) 1987 Female 621(26) 376(21) 603(18) 305(14) 147(12) 79(8) 64(7) 27(5) 1988 Female 589(24) 343(20) 609(18) 297(13) 140(11) 81(7) 60(7) 47(7) 1989 Female 605(25) 325(21) 661(19) 340(14) 147(10) 71(7) 66(7) 43(6) 1990 Female 526(24) 319(21) 540(16) 294(12) 130(9) 79(8) 62(6) 38(5) 1991 Female 529(25) 296(20) 539(17) 328(14) 122(10) 73(8) 59(7) 32(4) 1992 Female 463(24) 268(19) 493(16) 302(14) 145(11) 75(8) 58(7) 45(6) 1993 Female 489(25) 249(18) 539(18) 313(13) 137(9) 65(7) 60(6) 46(5) 1994 Female 522(24) 262(19) 511(17) 331(13) 175(11) 71(7) 58(6) 36(4) 1995 Female 547(25) 276(20) 575(18) 361(13) 176(10) 79(8) 67(6) 42(4) 1996 Female 580(25) 251(17) 620(19) 386(13) 195(11) 76(7) 68(7) 46(5) 1997 Female 596(26) 249(19) 551(17) 410(15) 228(12) 86(7) 67(6) 61(6) 1998 Female 532(23) 248(19) 507(16) 463(16) 206(10) 79(7) 63(6) 44(4) 1999 Female 565(24) 235(18) 495(17) 408(14) 192(10) 94(8) 61(6) 36(3) 2000 Female 588(25) 266(19) 475(16) 397(14) 173(8) 97(8) 57(6) 60(6) 2001 Female 582(24) 248(18) 420(15) 417(14) 240(11) 83(7) 66(7) 37(3) 2002 Female 612(25) 313(22) 456(17) 400(14) 263(12) 105(8) 53(6) 51(5) Note: The drivers with unknown (or missing) age or sex are not included in the table. Source: FARS 1983-2002
________________________________________________________________________ National Center for Statistics and Analysis, 400 Seventh St., S.W., Washington, DC 20590
46
6.11 Speeding Drivers and Relative Proportion of Speeding Drivers (Number in Parenthesis) in Fatal Crashes by Time of Day
Table 6.11 Speeding Drivers and Relative Proportion of
Speeding Drivers (Number in Parenthesis) in Fatal Crashes by Time of Day Year 0-3 am 3-6 am 6-9 am 9-12 am 12-3 pm 3-6 pm 6-9 pm 9-12 pm 1983 2874(35) 1087(33) 765(19) 685(15) 1014(17) 1685(19) 2064(24) 2453(29) 1984 2852(35) 1088(30) 811(18) 744(15) 1104(17) 1707(19) 2133(23) 2513(29) 1985 2877(37) 1216(33) 905(19) 838(16) 1292(18) 1957(20) 2178(23) 2594(29) 1986 3201(38) 1282(33) 886(17) 830(15) 1257(17) 1986(19) 2372(24) 2936(31) 1987 2989(37) 1249(32) 966(18) 852(15) 1296(17) 1931(18) 2419(24) 2878(30) 1988 3044(37) 1323(33) 1014(18) 867(15) 1254(16) 1917(18) 2350(23) 2749(29) 1989 2772(36) 1163(30) 1063(19) 860(15) 1272(16) 1839(18) 2228(23) 2681(30) 1990 2812(36) 1197(30) 827(15) 742(13) 1103(15) 1774(17) 1939(21) 2455(28) 1991 2643(37) 1104(30) 862(17) 747(14) 1143(16) 1615(17) 1846(22) 2249(28) 1992 2202(35) 926(28) 781(17) 698(13) 1055(15) 1502(16) 1847(22) 2121(29) 1993 2183(35) 960(28) 819(16) 772(13) 1123(15) 1465(16) 1741(20) 1977(27) 1994 2085(35) 946(28) 885(16) 754(13) 1129(14) 1652(17) 1650(20) 1925(27) 1995 2148(36) 1005(29) 917(17) 826(14) 1176(14) 1704(16) 1802(21) 2099(28) 1996 2153(36) 1014(28) 957(17) 860(14) 1198(15) 1682(16) 1758(20) 1959(26) 1997 2036(35) 1032(30) 984(17) 858(14) 1157(14) 1589(15) 1812(20) 2001(27) 1998 2080(36) 986(28) 950(16) 847(13) 1175(14) 1620(16) 1706(20) 1808(26) 1999 1942(34) 1024(28) 965(16) 837(13) 1176(14) 1597(15) 1651(19) 1897(27) 2000 1949(33) 1070(27) 954(16) 849(13) 1114(13) 1626(15) 1656(19) 1822(25) 2001 2086(35) 1036(28) 944(16) 860(13) 1189(14) 1624(16) 1700(20) 1888(26) 2002 2294(36) 1195(30) 1040(17) 809(13) 1252(15) 1697(17) 1830(21) 2041(27) Note: The drivers with unknown time of day are not included in the table. Source: FARS 1983-2002
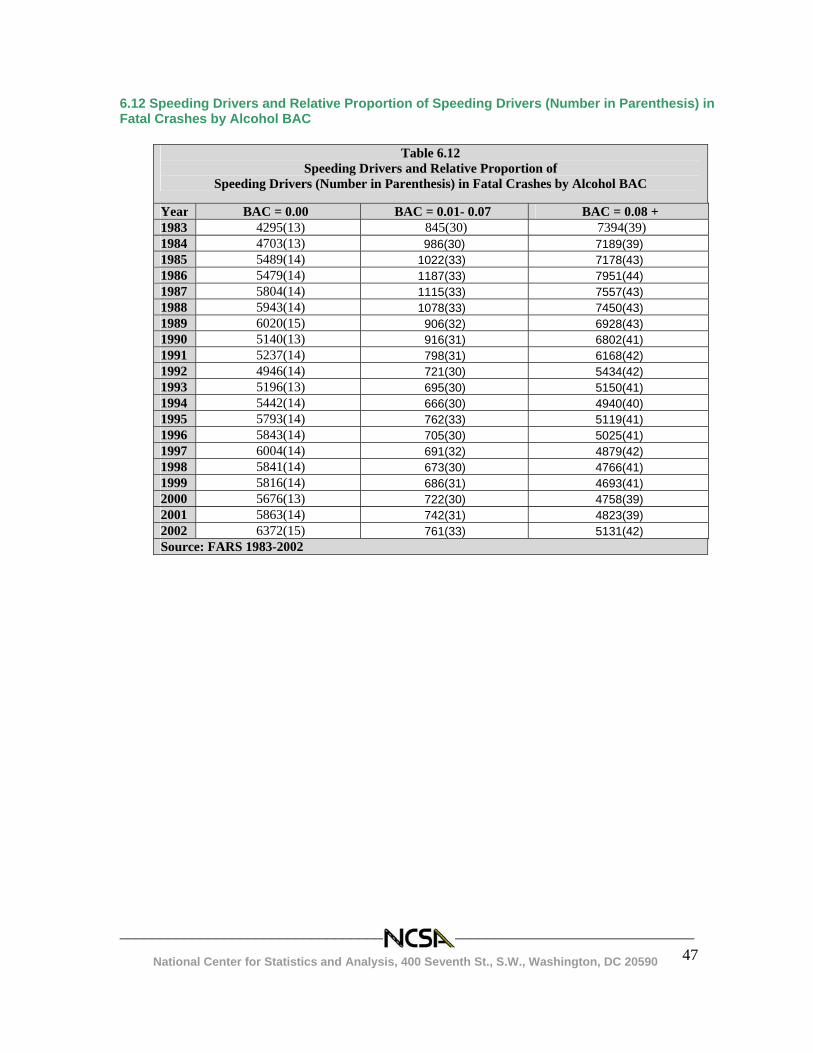
________________________________________________________________________ National Center for Statistics and Analysis, 400 Seventh St., S.W., Washington, DC 20590
47
6.12 Speeding Drivers and Relative Proportion of Speeding Drivers (Number in Parenthesis) in Fatal Crashes by Alcohol BAC
Table 6.12 Speeding Drivers and Relative Proportion of
Speeding Drivers (Number in Parenthesis) in Fatal Crashes by Alcohol BAC
Year BAC = 0.00 BAC = 0.01- 0.07 BAC = 0.08 + 1983 4295(13) 845(30) 7394(39) 1984 4703(13) 986(30) 7189(39) 1985 5489(14) 1022(33) 7178(43) 1986 5479(14) 1187(33) 7951(44) 1987 5804(14) 1115(33) 7557(43) 1988 5943(14) 1078(33) 7450(43) 1989 6020(15) 906(32) 6928(43) 1990 5140(13) 916(31) 6802(41) 1991 5237(14) 798(31) 6168(42) 1992 4946(14) 721(30) 5434(42) 1993 5196(13) 695(30) 5150(41) 1994 5442(14) 666(30) 4940(40) 1995 5793(14) 762(33) 5119(41) 1996 5843(14) 705(30) 5025(41) 1997 6004(14) 691(32) 4879(42) 1998 5841(14) 673(30) 4766(41) 1999 5816(14) 686(31) 4693(41) 2000 5676(13) 722(30) 4758(39) 2001 5863(14) 742(31) 4823(39) 2002 6372(15) 761(33) 5131(42) Source: FARS 1983-2002
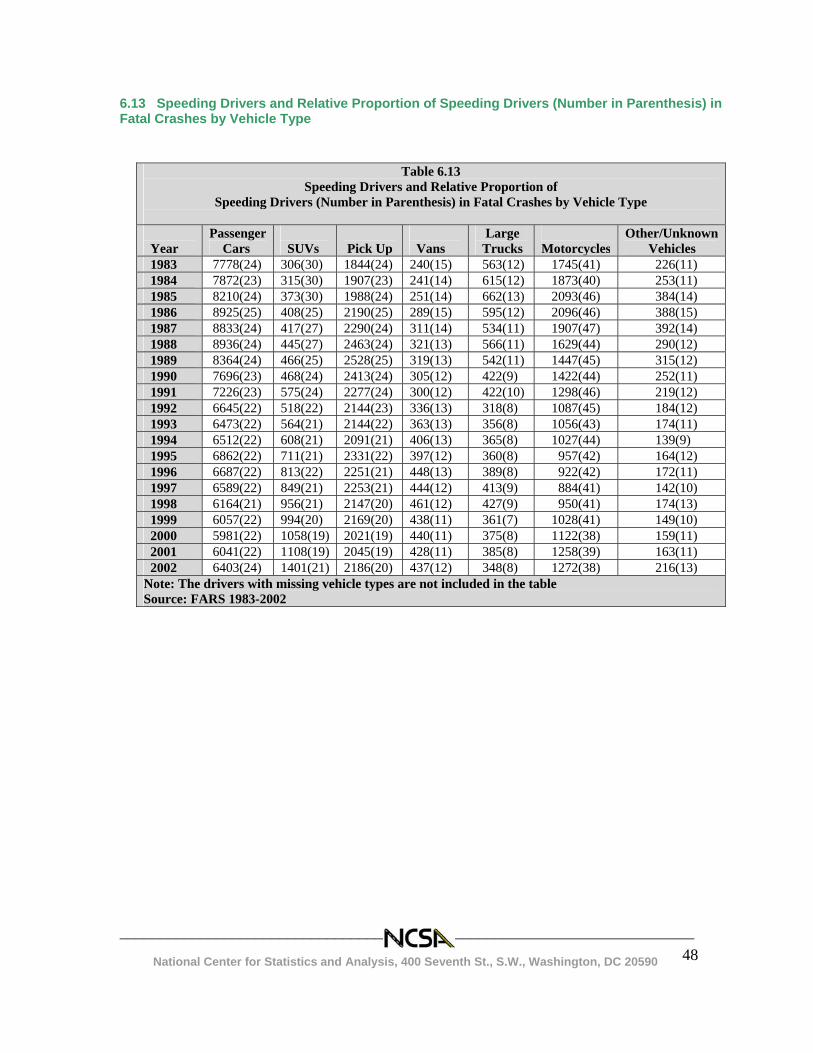
________________________________________________________________________ National Center for Statistics and Analysis, 400 Seventh St., S.W., Washington, DC 20590
48
6.13 Speeding Drivers and Relative Proportion of Speeding Drivers (Number in Parenthesis) in Fatal Crashes by Vehicle Type
Table 6.13 Speeding Drivers and Relative Proportion of
Speeding Drivers (Number in Parenthesis) in Fatal Crashes by Vehicle Type Year
Passenger Cars
SUVs
Pick Up
Vans
Large Trucks
Motorcycles
Other/Unknown Vehicles
1983 7778(24) 306(30) 1844(24) 240(15) 563(12) 1745(41) 226(11) 1984 7872(23) 315(30) 1907(23) 241(14) 615(12) 1873(40) 253(11) 1985 8210(24) 373(30) 1988(24) 251(14) 662(13) 2093(46) 384(14) 1986 8925(25) 408(25) 2190(25) 289(15) 595(12) 2096(46) 388(15) 1987 8833(24) 417(27) 2290(24) 311(14) 534(11) 1907(47) 392(14) 1988 8936(24) 445(27) 2463(24) 321(13) 566(11) 1629(44) 290(12) 1989 8364(24) 466(25) 2528(25) 319(13) 542(11) 1447(45) 315(12) 1990 7696(23) 468(24) 2413(24) 305(12) 422(9) 1422(44) 252(11) 1991 7226(23) 575(24) 2277(24) 300(12) 422(10) 1298(46) 219(12) 1992 6645(22) 518(22) 2144(23) 336(13) 318(8) 1087(45) 184(12) 1993 6473(22) 564(21) 2144(22) 363(13) 356(8) 1056(43) 174(11) 1994 6512(22) 608(21) 2091(21) 406(13) 365(8) 1027(44) 139(9) 1995 6862(22) 711(21) 2331(22) 397(12) 360(8) 957(42) 164(12) 1996 6687(22) 813(22) 2251(21) 448(13) 389(8) 922(42) 172(11) 1997 6589(22) 849(21) 2253(21) 444(12) 413(9) 884(41) 142(10) 1998 6164(21) 956(21) 2147(20) 461(12) 427(9) 950(41) 174(13) 1999 6057(22) 994(20) 2169(20) 438(11) 361(7) 1028(41) 149(10) 2000 5981(22) 1058(19) 2021(19) 440(11) 375(8) 1122(38) 159(11) 2001 6041(22) 1108(19) 2045(19) 428(11) 385(8) 1258(39) 163(11) 2002 6403(24) 1401(21) 2186(20) 437(12) 348(8) 1272(38) 216(13) Note: The drivers with missing vehicle types are not included in the table Source: FARS 1983-2002
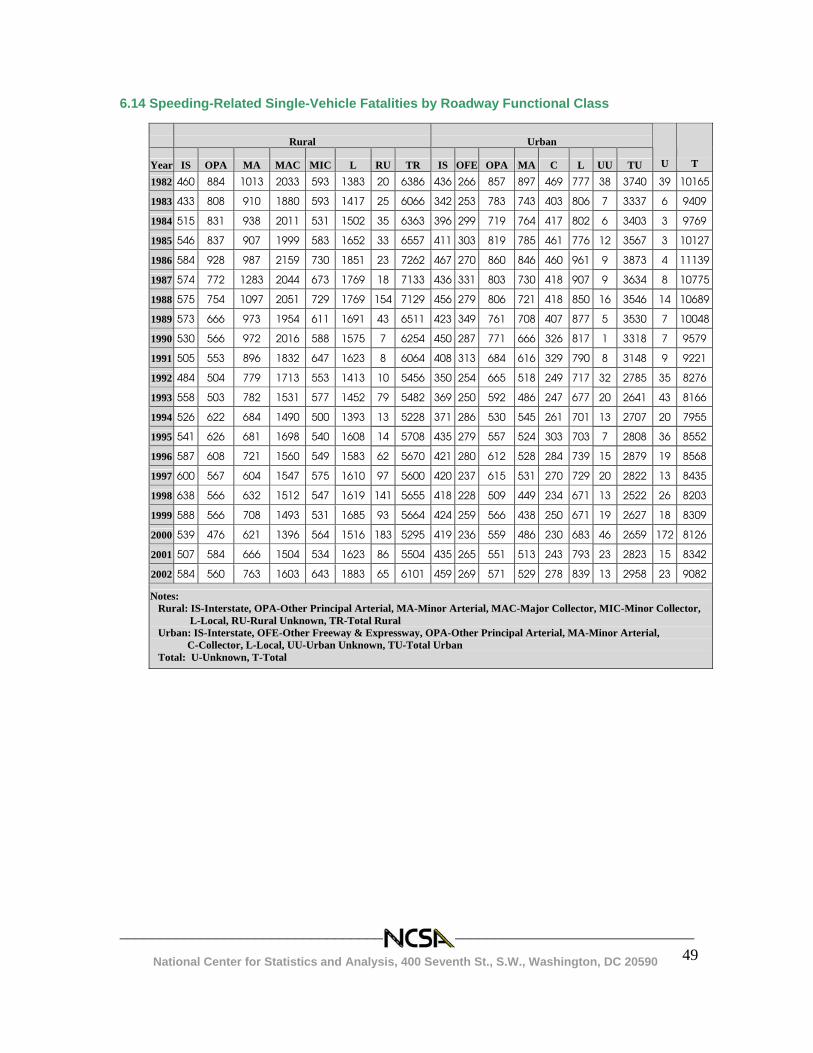
________________________________________________________________________ National Center for Statistics and Analysis, 400 Seventh St., S.W., Washington, DC 20590
49
6.14 Speeding-Related Single-Vehicle Fatalities by Roadway Functional Class
Rural Urban
Year IS OPA MA MAC MIC L RU TR IS OFE OPA MA C L UU TU U T
1982 460 884 1013 2033 593 1383 20 6386 436 266 857 897 469 777 38 3740 39 10165
1983 433 808 910 1880 593 1417 25 6066 342 253 783 743 403 806 7 3337 6 9409
1984 515 831 938 2011 531 1502 35 6363 396 299 719 764 417 802 6 3403 3 9769
1985 546 837 907 1999 583 1652 33 6557 411 303 819 785 461 776 12 3567 3 10127
1986 584 928 987 2159 730 1851 23 7262 467 270 860 846 460 961 9 3873 4 11139
1987 574 772 1283 2044 673 1769 18 7133 436 331 803 730 418 907 9 3634 8 10775
1988 575 754 1097 2051 729 1769 154 7129 456 279 806 721 418 850 16 3546 14 10689
1989 573 666 973 1954 611 1691 43 6511 423 349 761 708 407 877 5 3530 7 10048
1990 530 566 972 2016 588 1575 7 6254 450 287 771 666 326 817 1 3318 7 9579
1991 505 553 896 1832 647 1623 8 6064 408 313 684 616 329 790 8 3148 9 9221
1992 484 504 779 1713 553 1413 10 5456 350 254 665 518 249 717 32 2785 35 8276
1993 558 503 782 1531 577 1452 79 5482 369 250 592 486 247 677 20 2641 43 8166
1994 526 622 684 1490 500 1393 13 5228 371 286 530 545 261 701 13 2707 20 7955
1995 541 626 681 1698 540 1608 14 5708 435 279 557 524 303 703 7 2808 36 8552
1996 587 608 721 1560 549 1583 62 5670 421 280 612 528 284 739 15 2879 19 8568
1997 600 567 604 1547 575 1610 97 5600 420 237 615 531 270 729 20 2822 13 8435
1998 638 566 632 1512 547 1619 141 5655 418 228 509 449 234 671 13 2522 26 8203
1999 588 566 708 1493 531 1685 93 5664 424 259 566 438 250 671 19 2627 18 8309
2000 539 476 621 1396 564 1516 183 5295 419 236 559 486 230 683 46 2659 172 8126
2001 507 584 666 1504 534 1623 86 5504 435 265 551 513 243 793 23 2823 15 8342
2002 584 560 763 1603 643 1883 65 6101 459 269 571 529 278 839 13 2958 23 9082
Notes: Rural: IS-Interstate, OPA-Other Principal Arterial, MA-Minor Arterial, MAC-Major Collector, MIC-Minor Collector, L-Local, RU-Rural Unknown, TR-Total Rural Urban: IS-Interstate, OFE-Other Freeway & Expressway, OPA-Other Principal Arterial, MA-Minor Arterial, C-Collector, L-Local, UU-Urban Unknown, TU-Total Urban Total: U-Unknown, T-Total
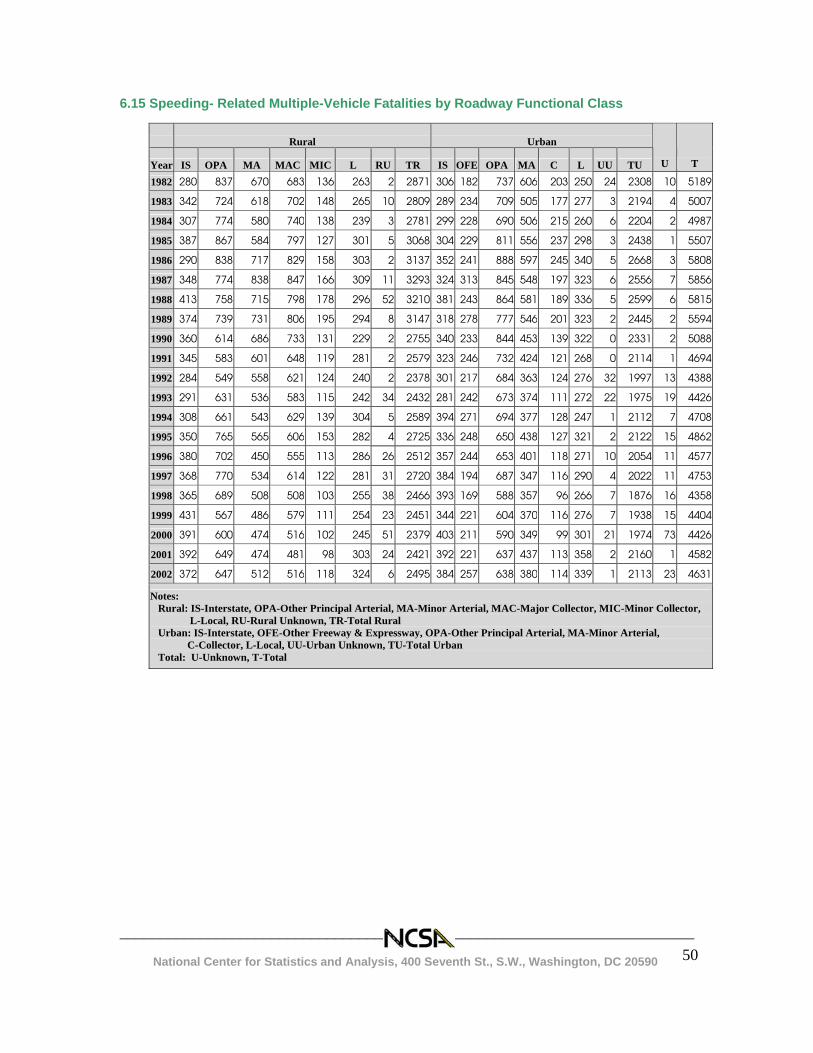
________________________________________________________________________ National Center for Statistics and Analysis, 400 Seventh St., S.W., Washington, DC 20590
50
6.15 Speeding- Related Multiple-Vehicle Fatalities by Roadway Functional Class
Rural Urban
Year IS OPA MA MAC MIC L RU TR IS OFE OPA MA C L UU TU U T
1982 280 837 670 683 136 263 2 2871 306 182 737 606 203 250 24 2308 10 5189
1983 342 724 618 702 148 265 10 2809 289 234 709 505 177 277 3 2194 4 5007
1984 307 774 580 740 138 239 3 2781 299 228 690 506 215 260 6 2204 2 4987
1985 387 867 584 797 127 301 5 3068 304 229 811 556 237 298 3 2438 1 5507
1986 290 838 717 829 158 303 2 3137 352 241 888 597 245 340 5 2668 3 5808
1987 348 774 838 847 166 309 11 3293 324 313 845 548 197 323 6 2556 7 5856
1988 413 758 715 798 178 296 52 3210 381 243 864 581 189 336 5 2599 6 5815
1989 374 739 731 806 195 294 8 3147 318 278 777 546 201 323 2 2445 2 5594
1990 360 614 686 733 131 229 2 2755 340 233 844 453 139 322 0 2331 2 5088
1991 345 583 601 648 119 281 2 2579 323 246 732 424 121 268 0 2114 1 4694
1992 284 549 558 621 124 240 2 2378 301 217 684 363 124 276 32 1997 13 4388
1993 291 631 536 583 115 242 34 2432 281 242 673 374 111 272 22 1975 19 4426
1994 308 661 543 629 139 304 5 2589 394 271 694 377 128 247 1 2112 7 4708
1995 350 765 565 606 153 282 4 2725 336 248 650 438 127 321 2 2122 15 4862
1996 380 702 450 555 113 286 26 2512 357 244 653 401 118 271 10 2054 11 4577
1997 368 770 534 614 122 281 31 2720 384 194 687 347 116 290 4 2022 11 4753
1998 365 689 508 508 103 255 38 2466 393 169 588 357 96 266 7 1876 16 4358
1999 431 567 486 579 111 254 23 2451 344 221 604 370 116 276 7 1938 15 4404
2000 391 600 474 516 102 245 51 2379 403 211 590 349 99 301 21 1974 73 4426
2001 392 649 474 481 98 303 24 2421 392 221 637 437 113 358 2 2160 1 4582
2002 372 647 512 516 118 324 6 2495 384 257 638 380 114 339 1 2113 23 4631
Notes: Rural: IS-Interstate, OPA-Other Principal Arterial, MA-Minor Arterial, MAC-Major Collector, MIC-Minor Collector, L-Local, RU-Rural Unknown, TR-Total Rural Urban: IS-Interstate, OFE-Other Freeway & Expressway, OPA-Other Principal Arterial, MA-Minor Arterial, C-Collector, L-Local, UU-Urban Unknown, TU-Total Urban Total: U-Unknown, T-Total
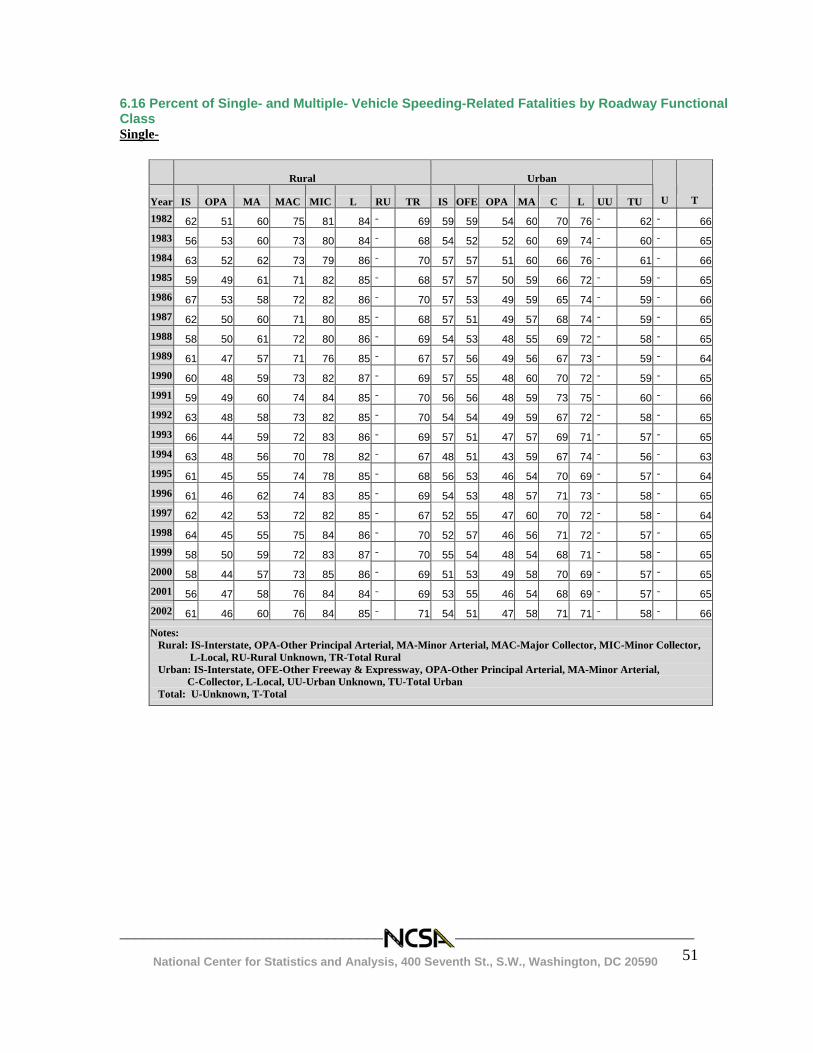
________________________________________________________________________ National Center for Statistics and Analysis, 400 Seventh St., S.W., Washington, DC 20590
51
6.16 Percent of Single- and Multiple- Vehicle Speeding-Related Fatalities by Roadway Functional Class Single-
Rural Urban
Year IS OPA MA MAC MIC L RU TR IS OFE OPA MA C L UU TU U T
1982 62 51 60 75 81 84 - 69 59 59 54 60 70 76 - 62 - 661983 56 53 60 73 80 84 - 68 54 52 52 60 69 74 - 60 - 651984 63 52 62 73 79 86 - 70 57 57 51 60 66 76 - 61 - 661985 59 49 61 71 82 85 - 68 57 57 50 59 66 72 - 59 - 651986 67 53 58 72 82 86 - 70 57 53 49 59 65 74 - 59 - 661987 62 50 60 71 80 85 - 68 57 51 49 57 68 74 - 59 - 651988 58 50 61 72 80 86 - 69 54 53 48 55 69 72 - 58 - 651989 61 47 57 71 76 85 - 67 57 56 49 56 67 73 - 59 - 641990 60 48 59 73 82 87 - 69 57 55 48 60 70 72 - 59 - 651991 59 49 60 74 84 85 - 70 56 56 48 59 73 75 - 60 - 661992 63 48 58 73 82 85 - 70 54 54 49 59 67 72 - 58 - 651993 66 44 59 72 83 86 - 69 57 51 47 57 69 71 - 57 - 651994 63 48 56 70 78 82 - 67 48 51 43 59 67 74 - 56 - 631995 61 45 55 74 78 85 - 68 56 53 46 54 70 69 - 57 - 641996 61 46 62 74 83 85 - 69 54 53 48 57 71 73 - 58 - 651997 62 42 53 72 82 85 - 67 52 55 47 60 70 72 - 58 - 641998 64 45 55 75 84 86 - 70 52 57 46 56 71 72 - 57 - 651999 58 50 59 72 83 87 - 70 55 54 48 54 68 71 - 58 - 652000 58 44 57 73 85 86 - 69 51 53 49 58 70 69 - 57 - 652001 56 47 58 76 84 84 - 69 53 55 46 54 68 69 - 57 - 652002 61 46 60 76 84 85 - 71 54 51 47 58 71 71 - 58 - 66
Notes: Rural: IS-Interstate, OPA-Other Principal Arterial, MA-Minor Arterial, MAC-Major Collector, MIC-Minor Collector, L-Local, RU-Rural Unknown, TR-Total Rural Urban: IS-Interstate, OFE-Other Freeway & Expressway, OPA-Other Principal Arterial, MA-Minor Arterial, C-Collector, L-Local, UU-Urban Unknown, TU-Total Urban Total: U-Unknown, T-Total
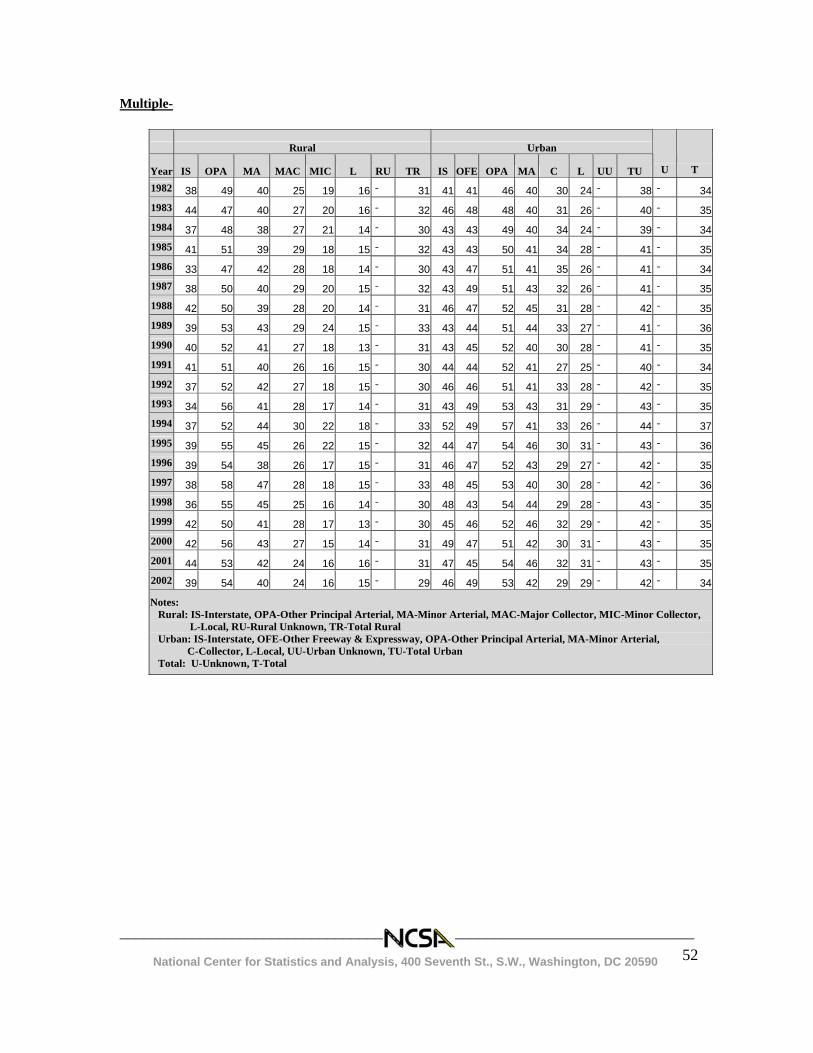
________________________________________________________________________ National Center for Statistics and Analysis, 400 Seventh St., S.W., Washington, DC 20590
52
Multiple-
Rural Urban
Year IS OPA MA MAC MIC L RU TR IS OFE OPA MA C L UU TU U T
1982 38 49 40 25 19 16 - 31 41 41 46 40 30 24 - 38 - 341983 44 47 40 27 20 16 - 32 46 48 48 40 31 26 - 40 - 351984 37 48 38 27 21 14 - 30 43 43 49 40 34 24 - 39 - 341985 41 51 39 29 18 15 - 32 43 43 50 41 34 28 - 41 - 351986 33 47 42 28 18 14 - 30 43 47 51 41 35 26 - 41 - 341987 38 50 40 29 20 15 - 32 43 49 51 43 32 26 - 41 - 351988 42 50 39 28 20 14 - 31 46 47 52 45 31 28 - 42 - 351989 39 53 43 29 24 15 - 33 43 44 51 44 33 27 - 41 - 361990 40 52 41 27 18 13 - 31 43 45 52 40 30 28 - 41 - 351991 41 51 40 26 16 15 - 30 44 44 52 41 27 25 - 40 - 341992 37 52 42 27 18 15 - 30 46 46 51 41 33 28 - 42 - 351993 34 56 41 28 17 14 - 31 43 49 53 43 31 29 - 43 - 351994 37 52 44 30 22 18 - 33 52 49 57 41 33 26 - 44 - 371995 39 55 45 26 22 15 - 32 44 47 54 46 30 31 - 43 - 361996 39 54 38 26 17 15 - 31 46 47 52 43 29 27 - 42 - 351997 38 58 47 28 18 15 - 33 48 45 53 40 30 28 - 42 - 361998 36 55 45 25 16 14 - 30 48 43 54 44 29 28 - 43 - 351999 42 50 41 28 17 13 - 30 45 46 52 46 32 29 - 42 - 352000 42 56 43 27 15 14 - 31 49 47 51 42 30 31 - 43 - 352001 44 53 42 24 16 16 - 31 47 45 54 46 32 31 - 43 - 352002 39 54 40 24 16 15 - 29 46 49 53 42 29 29 - 42 - 34
Notes: Rural: IS-Interstate, OPA-Other Principal Arterial, MA-Minor Arterial, MAC-Major Collector, MIC-Minor Collector, L-Local, RU-Rural Unknown, TR-Total Rural Urban: IS-Interstate, OFE-Other Freeway & Expressway, OPA-Other Principal Arterial, MA-Minor Arterial, C-Collector, L-Local, UU-Urban Unknown, TU-Total Urban Total: U-Unknown, T-Total
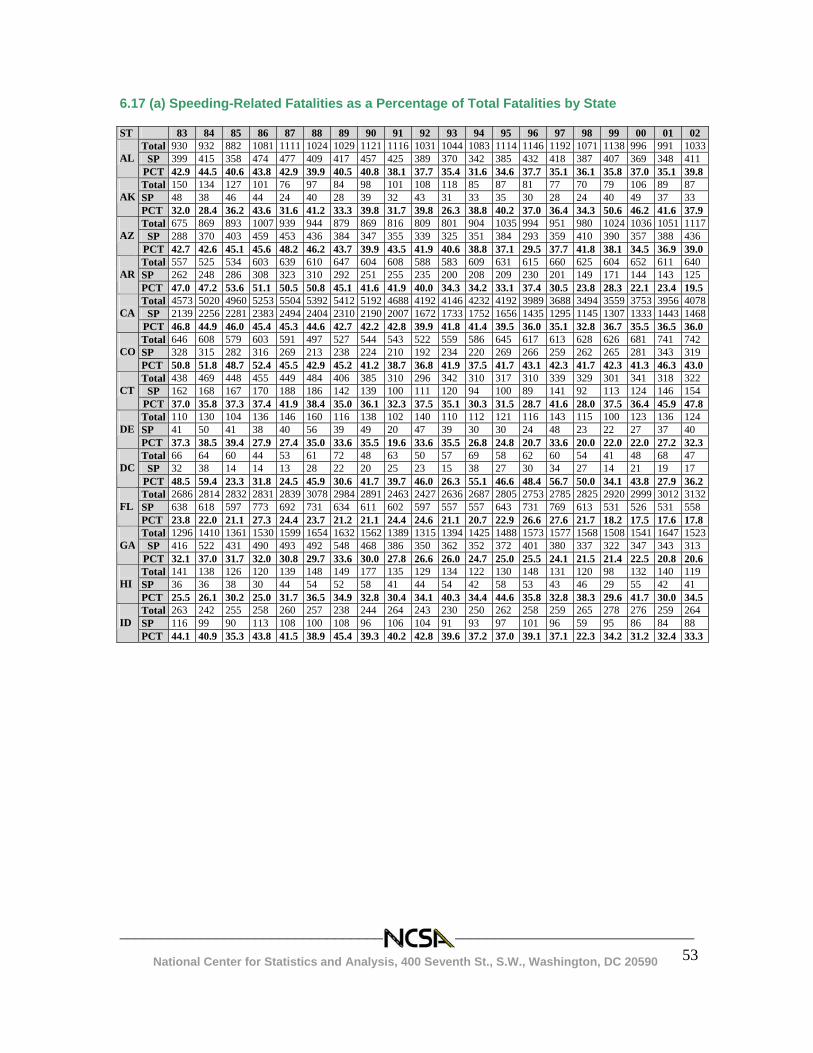
________________________________________________________________________ National Center for Statistics and Analysis, 400 Seventh St., S.W., Washington, DC 20590
53
6.17 (a) Speeding-Related Fatalities as a Percentage of Total Fatalities by State ST 83 84 85 86 87 88 89 90 91 92 93 94 95 96 97 98 99 00 01 02
Total 930 932 882 1081 1111 1024 1029 1121 1116 1031 1044 1083 1114 1146 1192 1071 1138 996 991 1033SP 399 415 358 474 477 409 417 457 425 389 370 342 385 432 418 387 407 369 348 411
AL
PCT 42.9 44.5 40.6 43.8 42.9 39.9 40.5 40.8 38.1 37.7 35.4 31.6 34.6 37.7 35.1 36.1 35.8 37.0 35.1 39.8Total 150 134 127 101 76 97 84 98 101 108 118 85 87 81 77 70 79 106 89 87 SP 48 38 46 44 24 40 28 39 32 43 31 33 35 30 28 24 40 49 37 33
AK
PCT 32.0 28.4 36.2 43.6 31.6 41.2 33.3 39.8 31.7 39.8 26.3 38.8 40.2 37.0 36.4 34.3 50.6 46.2 41.6 37.9Total 675 869 893 1007 939 944 879 869 816 809 801 904 1035 994 951 980 1024 1036 1051 1117
SP 288 370 403 459 453 436 384 347 355 339 325 351 384 293 359 410 390 357 388 436 AZ
PCT 42.7 42.6 45.1 45.6 48.2 46.2 43.7 39.9 43.5 41.9 40.6 38.8 37.1 29.5 37.7 41.8 38.1 34.5 36.9 39.0Total 557 525 534 603 639 610 647 604 608 588 583 609 631 615 660 625 604 652 611 640 SP 262 248 286 308 323 310 292 251 255 235 200 208 209 230 201 149 171 144 143 125
AR PCT 47.0 47.2 53.6 51.1 50.5 50.8 45.1 41.6 41.9 40.0 34.3 34.2 33.1 37.4 30.5 23.8 28.3 22.1 23.4 19.5
Total 4573 5020 4960 5253 5504 5392 5412 5192 4688 4192 4146 4232 4192 3989 3688 3494 3559 3753 3956 4078SP 2139 2256 2281 2383 2494 2404 2310 2190 2007 1672 1733 1752 1656 1435 1295 1145 1307 1333 1443 1468
CA
PCT 46.8 44.9 46.0 45.4 45.3 44.6 42.7 42.2 42.8 39.9 41.8 41.4 39.5 36.0 35.1 32.8 36.7 35.5 36.5 36.0Total 646 608 579 603 591 497 527 544 543 522 559 586 645 617 613 628 626 681 741 742 SP 328 315 282 316 269 213 238 224 210 192 234 220 269 266 259 262 265 281 343 319
CO
PCT 50.8 51.8 48.7 52.4 45.5 42.9 45.2 41.2 38.7 36.8 41.9 37.5 41.7 43.1 42.3 41.7 42.3 41.3 46.3 43.0Total 438 469 448 455 449 484 406 385 310 296 342 310 317 310 339 329 301 341 318 322
SP 162 168 167 170 188 186 142 139 100 111 120 94 100 89 141 92 113 124 146 154 CT
PCT 37.0 35.8 37.3 37.4 41.9 38.4 35.0 36.1 32.3 37.5 35.1 30.3 31.5 28.7 41.6 28.0 37.5 36.4 45.9 47.8Total 110 130 104 136 146 160 116 138 102 140 110 112 121 116 143 115 100 123 136 124 SP 41 50 41 38 40 56 39 49 20 47 39 30 30 24 48 23 22 27 37 40
DE
PCT 37.3 38.5 39.4 27.9 27.4 35.0 33.6 35.5 19.6 33.6 35.5 26.8 24.8 20.7 33.6 20.0 22.0 22.0 27.2 32.3Total 66 64 60 44 53 61 72 48 63 50 57 69 58 62 60 54 41 48 68 47
SP 32 38 14 14 13 28 22 20 25 23 15 38 27 30 34 27 14 21 19 17 DC
PCT 48.5 59.4 23.3 31.8 24.5 45.9 30.6 41.7 39.7 46.0 26.3 55.1 46.6 48.4 56.7 50.0 34.1 43.8 27.9 36.2Total 2686 2814 2832 2831 2839 3078 2984 2891 2463 2427 2636 2687 2805 2753 2785 2825 2920 2999 3012 3132SP 638 618 597 773 692 731 634 611 602 597 557 557 643 731 769 613 531 526 531 558
FL
PCT 23.8 22.0 21.1 27.3 24.4 23.7 21.2 21.1 24.4 24.6 21.1 20.7 22.9 26.6 27.6 21.7 18.2 17.5 17.6 17.8Total 1296 1410 1361 1530 1599 1654 1632 1562 1389 1315 1394 1425 1488 1573 1577 1568 1508 1541 1647 1523
SP 416 522 431 490 493 492 548 468 386 350 362 352 372 401 380 337 322 347 343 313 GA
PCT 32.1 37.0 31.7 32.0 30.8 29.7 33.6 30.0 27.8 26.6 26.0 24.7 25.0 25.5 24.1 21.5 21.4 22.5 20.8 20.6Total 141 138 126 120 139 148 149 177 135 129 134 122 130 148 131 120 98 132 140 119 SP 36 36 38 30 44 54 52 58 41 44 54 42 58 53 43 46 29 55 42 41
HI
PCT 25.5 26.1 30.2 25.0 31.7 36.5 34.9 32.8 30.4 34.1 40.3 34.4 44.6 35.8 32.8 38.3 29.6 41.7 30.0 34.5Total 263 242 255 258 260 257 238 244 264 243 230 250 262 258 259 265 278 276 259 264 SP 116 99 90 113 108 100 108 96 106 104 91 93 97 101 96 59 95 86 84 88
ID
PCT 44.1 40.9 35.3 43.8 41.5 38.9 45.4 39.3 40.2 42.8 39.6 37.2 37.0 39.1 37.1 22.3 34.2 31.2 32.4 33.3
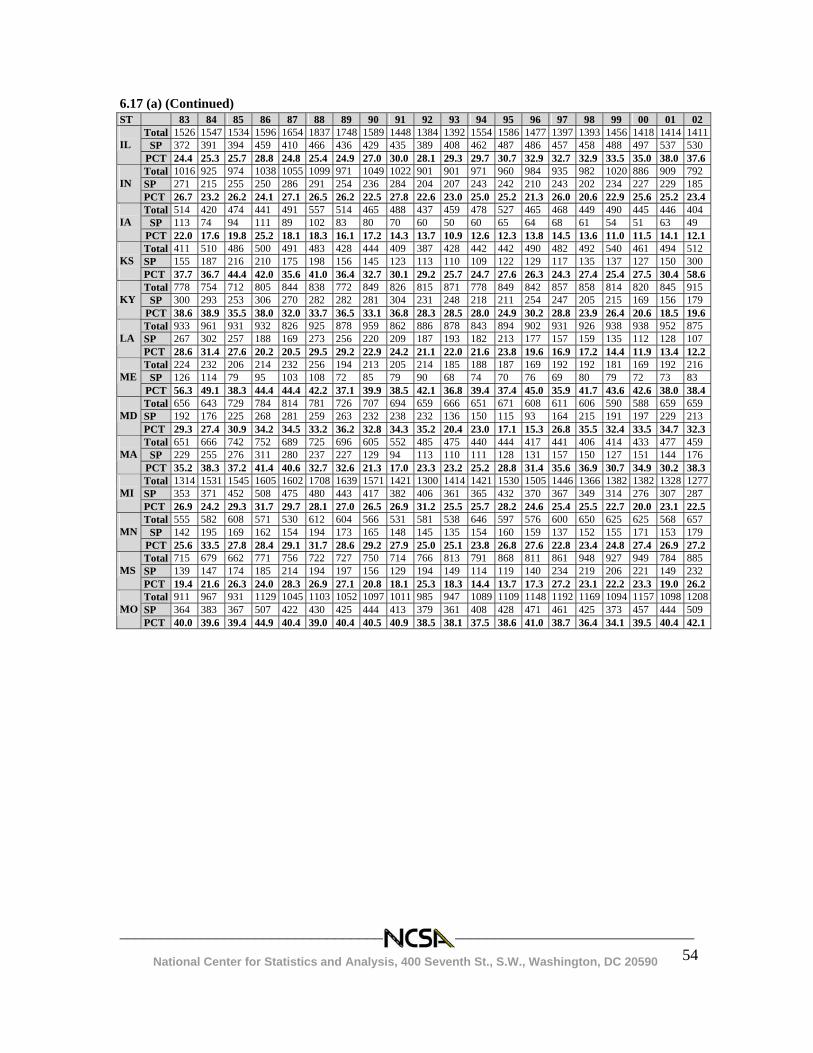
________________________________________________________________________ National Center for Statistics and Analysis, 400 Seventh St., S.W., Washington, DC 20590
54
6.17 (a) (Continued)
ST 83 84 85 86 87 88 89 90 91 92 93 94 95 96 97 98 99 00 01 02 Total 1526 1547 1534 1596 1654 1837 1748 1589 1448 1384 1392 1554 1586 1477 1397 1393 1456 1418 1414 1411
SP 372 391 394 459 410 466 436 429 435 389 408 462 487 486 457 458 488 497 537 530 IL
PCT 24.4 25.3 25.7 28.8 24.8 25.4 24.9 27.0 30.0 28.1 29.3 29.7 30.7 32.9 32.7 32.9 33.5 35.0 38.0 37.6Total 1016 925 974 1038 1055 1099 971 1049 1022 901 901 971 960 984 935 982 1020 886 909 792 SP 271 215 255 250 286 291 254 236 284 204 207 243 242 210 243 202 234 227 229 185
IN
PCT 26.7 23.2 26.2 24.1 27.1 26.5 26.2 22.5 27.8 22.6 23.0 25.0 25.2 21.3 26.0 20.6 22.9 25.6 25.2 23.4Total 514 420 474 441 491 557 514 465 488 437 459 478 527 465 468 449 490 445 446 404
SP 113 74 94 111 89 102 83 80 70 60 50 60 65 64 68 61 54 51 63 49 IA
PCT 22.0 17.6 19.8 25.2 18.1 18.3 16.1 17.2 14.3 13.7 10.9 12.6 12.3 13.8 14.5 13.6 11.0 11.5 14.1 12.1Total 411 510 486 500 491 483 428 444 409 387 428 442 442 490 482 492 540 461 494 512 SP 155 187 216 210 175 198 156 145 123 113 110 109 122 129 117 135 137 127 150 300
KS PCT 37.7 36.7 44.4 42.0 35.6 41.0 36.4 32.7 30.1 29.2 25.7 24.7 27.6 26.3 24.3 27.4 25.4 27.5 30.4 58.6
Total 778 754 712 805 844 838 772 849 826 815 871 778 849 842 857 858 814 820 845 915 SP 300 293 253 306 270 282 282 281 304 231 248 218 211 254 247 205 215 169 156 179
KY
PCT 38.6 38.9 35.5 38.0 32.0 33.7 36.5 33.1 36.8 28.3 28.5 28.0 24.9 30.2 28.8 23.9 26.4 20.6 18.5 19.6Total 933 961 931 932 826 925 878 959 862 886 878 843 894 902 931 926 938 938 952 875 SP 267 302 257 188 169 273 256 220 209 187 193 182 213 177 157 159 135 112 128 107
LA
PCT 28.6 31.4 27.6 20.2 20.5 29.5 29.2 22.9 24.2 21.1 22.0 21.6 23.8 19.6 16.9 17.2 14.4 11.9 13.4 12.2Total 224 232 206 214 232 256 194 213 205 214 185 188 187 169 192 192 181 169 192 216
SP 126 114 79 95 103 108 72 85 79 90 68 74 70 76 69 80 79 72 73 83 ME
PCT 56.3 49.1 38.3 44.4 44.4 42.2 37.1 39.9 38.5 42.1 36.8 39.4 37.4 45.0 35.9 41.7 43.6 42.6 38.0 38.4Total 656 643 729 784 814 781 726 707 694 659 666 651 671 608 611 606 590 588 659 659 SP 192 176 225 268 281 259 263 232 238 232 136 150 115 93 164 215 191 197 229 213
MD
PCT 29.3 27.4 30.9 34.2 34.5 33.2 36.2 32.8 34.3 35.2 20.4 23.0 17.1 15.3 26.8 35.5 32.4 33.5 34.7 32.3Total 651 666 742 752 689 725 696 605 552 485 475 440 444 417 441 406 414 433 477 459
SP 229 255 276 311 280 237 227 129 94 113 110 111 128 131 157 150 127 151 144 176 MA
PCT 35.2 38.3 37.2 41.4 40.6 32.7 32.6 21.3 17.0 23.3 23.2 25.2 28.8 31.4 35.6 36.9 30.7 34.9 30.2 38.3Total 1314 1531 1545 1605 1602 1708 1639 1571 1421 1300 1414 1421 1530 1505 1446 1366 1382 1382 1328 1277SP 353 371 452 508 475 480 443 417 382 406 361 365 432 370 367 349 314 276 307 287
MI
PCT 26.9 24.2 29.3 31.7 29.7 28.1 27.0 26.5 26.9 31.2 25.5 25.7 28.2 24.6 25.4 25.5 22.7 20.0 23.1 22.5Total 555 582 608 571 530 612 604 566 531 581 538 646 597 576 600 650 625 625 568 657
SP 142 195 169 162 154 194 173 165 148 145 135 154 160 159 137 152 155 171 153 179 MN
PCT 25.6 33.5 27.8 28.4 29.1 31.7 28.6 29.2 27.9 25.0 25.1 23.8 26.8 27.6 22.8 23.4 24.8 27.4 26.9 27.2Total 715 679 662 771 756 722 727 750 714 766 813 791 868 811 861 948 927 949 784 885 SP 139 147 174 185 214 194 197 156 129 194 149 114 119 140 234 219 206 221 149 232
MS
PCT 19.4 21.6 26.3 24.0 28.3 26.9 27.1 20.8 18.1 25.3 18.3 14.4 13.7 17.3 27.2 23.1 22.2 23.3 19.0 26.2Total 911 967 931 1129 1045 1103 1052 1097 1011 985 947 1089 1109 1148 1192 1169 1094 1157 1098 1208SP 364 383 367 507 422 430 425 444 413 379 361 408 428 471 461 425 373 457 444 509
MO
PCT 40.0 39.6 39.4 44.9 40.4 39.0 40.4 40.5 40.9 38.5 38.1 37.5 38.6 41.0 38.7 36.4 34.1 39.5 40.4 42.1
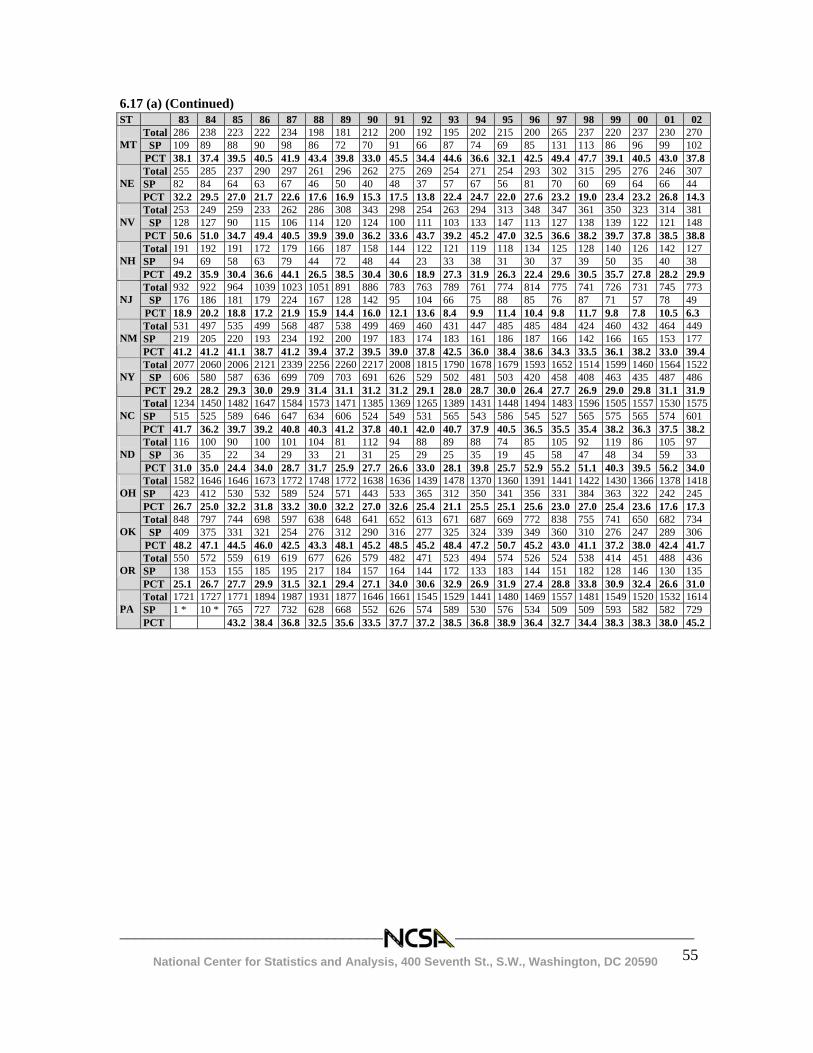
________________________________________________________________________ National Center for Statistics and Analysis, 400 Seventh St., S.W., Washington, DC 20590
55
6.17 (a) (Continued)
ST 83 84 85 86 87 88 89 90 91 92 93 94 95 96 97 98 99 00 01 02 Total 286 238 223 222 234 198 181 212 200 192 195 202 215 200 265 237 220 237 230 270
SP 109 89 88 90 98 86 72 70 91 66 87 74 69 85 131 113 86 96 99 102 MT
PCT 38.1 37.4 39.5 40.5 41.9 43.4 39.8 33.0 45.5 34.4 44.6 36.6 32.1 42.5 49.4 47.7 39.1 40.5 43.0 37.8Total 255 285 237 290 297 261 296 262 275 269 254 271 254 293 302 315 295 276 246 307 SP 82 84 64 63 67 46 50 40 48 37 57 67 56 81 70 60 69 64 66 44
NE
PCT 32.2 29.5 27.0 21.7 22.6 17.6 16.9 15.3 17.5 13.8 22.4 24.7 22.0 27.6 23.2 19.0 23.4 23.2 26.8 14.3Total 253 249 259 233 262 286 308 343 298 254 263 294 313 348 347 361 350 323 314 381
SP 128 127 90 115 106 114 120 124 100 111 103 133 147 113 127 138 139 122 121 148 NV
PCT 50.6 51.0 34.7 49.4 40.5 39.9 39.0 36.2 33.6 43.7 39.2 45.2 47.0 32.5 36.6 38.2 39.7 37.8 38.5 38.8Total 191 192 191 172 179 166 187 158 144 122 121 119 118 134 125 128 140 126 142 127 SP 94 69 58 63 79 44 72 48 44 23 33 38 31 30 37 39 50 35 40 38
NH PCT 49.2 35.9 30.4 36.6 44.1 26.5 38.5 30.4 30.6 18.9 27.3 31.9 26.3 22.4 29.6 30.5 35.7 27.8 28.2 29.9
Total 932 922 964 1039 1023 1051 891 886 783 763 789 761 774 814 775 741 726 731 745 773 SP 176 186 181 179 224 167 128 142 95 104 66 75 88 85 76 87 71 57 78 49
NJ
PCT 18.9 20.2 18.8 17.2 21.9 15.9 14.4 16.0 12.1 13.6 8.4 9.9 11.4 10.4 9.8 11.7 9.8 7.8 10.5 6.3 Total 531 497 535 499 568 487 538 499 469 460 431 447 485 485 484 424 460 432 464 449 SP 219 205 220 193 234 192 200 197 183 174 183 161 186 187 166 142 166 165 153 177
NM
PCT 41.2 41.2 41.1 38.7 41.2 39.4 37.2 39.5 39.0 37.8 42.5 36.0 38.4 38.6 34.3 33.5 36.1 38.2 33.0 39.4Total 2077 2060 2006 2121 2339 2256 2260 2217 2008 1815 1790 1678 1679 1593 1652 1514 1599 1460 1564 1522
SP 606 580 587 636 699 709 703 691 626 529 502 481 503 420 458 408 463 435 487 486 NY
PCT 29.2 28.2 29.3 30.0 29.9 31.4 31.1 31.2 31.2 29.1 28.0 28.7 30.0 26.4 27.7 26.9 29.0 29.8 31.1 31.9Total 1234 1450 1482 1647 1584 1573 1471 1385 1369 1265 1389 1431 1448 1494 1483 1596 1505 1557 1530 1575SP 515 525 589 646 647 634 606 524 549 531 565 543 586 545 527 565 575 565 574 601
NC
PCT 41.7 36.2 39.7 39.2 40.8 40.3 41.2 37.8 40.1 42.0 40.7 37.9 40.5 36.5 35.5 35.4 38.2 36.3 37.5 38.2Total 116 100 90 100 101 104 81 112 94 88 89 88 74 85 105 92 119 86 105 97
SP 36 35 22 34 29 33 21 31 25 29 25 35 19 45 58 47 48 34 59 33 ND
PCT 31.0 35.0 24.4 34.0 28.7 31.7 25.9 27.7 26.6 33.0 28.1 39.8 25.7 52.9 55.2 51.1 40.3 39.5 56.2 34.0Total 1582 1646 1646 1673 1772 1748 1772 1638 1636 1439 1478 1370 1360 1391 1441 1422 1430 1366 1378 1418SP 423 412 530 532 589 524 571 443 533 365 312 350 341 356 331 384 363 322 242 245
OH
PCT 26.7 25.0 32.2 31.8 33.2 30.0 32.2 27.0 32.6 25.4 21.1 25.5 25.1 25.6 23.0 27.0 25.4 23.6 17.6 17.3Total 848 797 744 698 597 638 648 641 652 613 671 687 669 772 838 755 741 650 682 734
SP 409 375 331 321 254 276 312 290 316 277 325 324 339 349 360 310 276 247 289 306 OK
PCT 48.2 47.1 44.5 46.0 42.5 43.3 48.1 45.2 48.5 45.2 48.4 47.2 50.7 45.2 43.0 41.1 37.2 38.0 42.4 41.7Total 550 572 559 619 619 677 626 579 482 471 523 494 574 526 524 538 414 451 488 436 SP 138 153 155 185 195 217 184 157 164 144 172 133 183 144 151 182 128 146 130 135
OR
PCT 25.1 26.7 27.7 29.9 31.5 32.1 29.4 27.1 34.0 30.6 32.9 26.9 31.9 27.4 28.8 33.8 30.9 32.4 26.6 31.0Total 1721 1727 1771 1894 1987 1931 1877 1646 1661 1545 1529 1441 1480 1469 1557 1481 1549 1520 1532 1614SP 1 * 10 * 765 727 732 628 668 552 626 574 589 530 576 534 509 509 593 582 582 729
PA
PCT 43.2 38.4 36.8 32.5 35.6 33.5 37.7 37.2 38.5 36.8 38.9 36.4 32.7 34.4 38.3 38.3 38.0 45.2
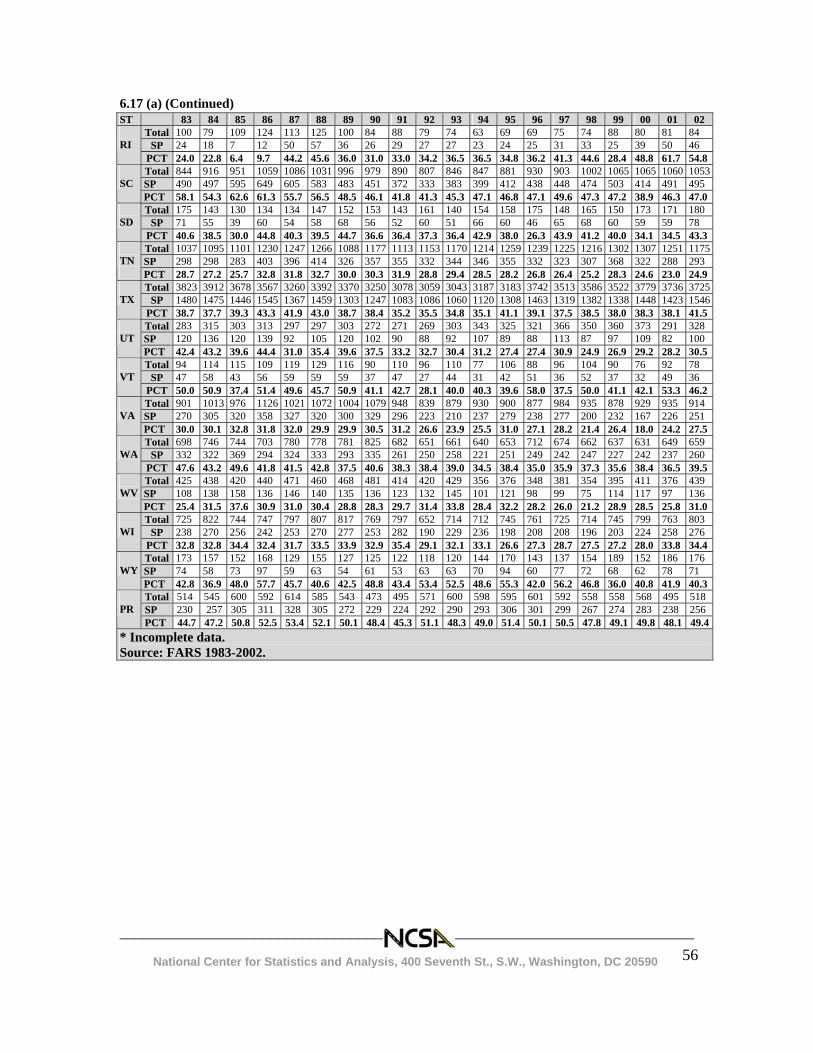
________________________________________________________________________ National Center for Statistics and Analysis, 400 Seventh St., S.W., Washington, DC 20590
56
6.17 (a) (Continued)
ST 83 84 85 86 87 88 89 90 91 92 93 94 95 96 97 98 99 00 01 02 Total 100 79 109 124 113 125 100 84 88 79 74 63 69 69 75 74 88 80 81 84
SP 24 18 7 12 50 57 36 26 29 27 27 23 24 25 31 33 25 39 50 46 RI
PCT 24.0 22.8 6.4 9.7 44.2 45.6 36.0 31.0 33.0 34.2 36.5 36.5 34.8 36.2 41.3 44.6 28.4 48.8 61.7 54.8Total 844 916 951 1059 1086 1031 996 979 890 807 846 847 881 930 903 1002 1065 1065 1060 1053SP 490 497 595 649 605 583 483 451 372 333 383 399 412 438 448 474 503 414 491 495
SC
PCT 58.1 54.3 62.6 61.3 55.7 56.5 48.5 46.1 41.8 41.3 45.3 47.1 46.8 47.1 49.6 47.3 47.2 38.9 46.3 47.0Total 175 143 130 134 134 147 152 153 143 161 140 154 158 175 148 165 150 173 171 180
SP 71 55 39 60 54 58 68 56 52 60 51 66 60 46 65 68 60 59 59 78 SD
PCT 40.6 38.5 30.0 44.8 40.3 39.5 44.7 36.6 36.4 37.3 36.4 42.9 38.0 26.3 43.9 41.2 40.0 34.1 34.5 43.3Total 1037 1095 1101 1230 1247 1266 1088 1177 1113 1153 1170 1214 1259 1239 1225 1216 1302 1307 1251 1175SP 298 298 283 403 396 414 326 357 355 332 344 346 355 332 323 307 368 322 288 293
TN PCT 28.7 27.2 25.7 32.8 31.8 32.7 30.0 30.3 31.9 28.8 29.4 28.5 28.2 26.8 26.4 25.2 28.3 24.6 23.0 24.9
Total 3823 3912 3678 3567 3260 3392 3370 3250 3078 3059 3043 3187 3183 3742 3513 3586 3522 3779 3736 3725SP 1480 1475 1446 1545 1367 1459 1303 1247 1083 1086 1060 1120 1308 1463 1319 1382 1338 1448 1423 1546
TX
PCT 38.7 37.7 39.3 43.3 41.9 43.0 38.7 38.4 35.2 35.5 34.8 35.1 41.1 39.1 37.5 38.5 38.0 38.3 38.1 41.5Total 283 315 303 313 297 297 303 272 271 269 303 343 325 321 366 350 360 373 291 328 SP 120 136 120 139 92 105 120 102 90 88 92 107 89 88 113 87 97 109 82 100
UT
PCT 42.4 43.2 39.6 44.4 31.0 35.4 39.6 37.5 33.2 32.7 30.4 31.2 27.4 27.4 30.9 24.9 26.9 29.2 28.2 30.5Total 94 114 115 109 119 129 116 90 110 96 110 77 106 88 96 104 90 76 92 78
SP 47 58 43 56 59 59 59 37 47 27 44 31 42 51 36 52 37 32 49 36 VT
PCT 50.0 50.9 37.4 51.4 49.6 45.7 50.9 41.1 42.7 28.1 40.0 40.3 39.6 58.0 37.5 50.0 41.1 42.1 53.3 46.2Total 901 1013 976 1126 1021 1072 1004 1079 948 839 879 930 900 877 984 935 878 929 935 914 SP 270 305 320 358 327 320 300 329 296 223 210 237 279 238 277 200 232 167 226 251
VA
PCT 30.0 30.1 32.8 31.8 32.0 29.9 29.9 30.5 31.2 26.6 23.9 25.5 31.0 27.1 28.2 21.4 26.4 18.0 24.2 27.5Total 698 746 744 703 780 778 781 825 682 651 661 640 653 712 674 662 637 631 649 659
SP 332 322 369 294 324 333 293 335 261 250 258 221 251 249 242 247 227 242 237 260 WA
PCT 47.6 43.2 49.6 41.8 41.5 42.8 37.5 40.6 38.3 38.4 39.0 34.5 38.4 35.0 35.9 37.3 35.6 38.4 36.5 39.5Total 425 438 420 440 471 460 468 481 414 420 429 356 376 348 381 354 395 411 376 439 SP 108 138 158 136 146 140 135 136 123 132 145 101 121 98 99 75 114 117 97 136
WV
PCT 25.4 31.5 37.6 30.9 31.0 30.4 28.8 28.3 29.7 31.4 33.8 28.4 32.2 28.2 26.0 21.2 28.9 28.5 25.8 31.0Total 725 822 744 747 797 807 817 769 797 652 714 712 745 761 725 714 745 799 763 803
SP 238 270 256 242 253 270 277 253 282 190 229 236 198 208 208 196 203 224 258 276 WI
PCT 32.8 32.8 34.4 32.4 31.7 33.5 33.9 32.9 35.4 29.1 32.1 33.1 26.6 27.3 28.7 27.5 27.2 28.0 33.8 34.4Total 173 157 152 168 129 155 127 125 122 118 120 144 170 143 137 154 189 152 186 176 SP 74 58 73 97 59 63 54 61 53 63 63 70 94 60 77 72 68 62 78 71
WY
PCT 42.8 36.9 48.0 57.7 45.7 40.6 42.5 48.8 43.4 53.4 52.5 48.6 55.3 42.0 56.2 46.8 36.0 40.8 41.9 40.3Total 514 545 600 592 614 585 543 473 495 571 600 598 595 601 592 558 558 568 495 518 SP 230 257 305 311 328 305 272 229 224 292 290 293 306 301 299 267 274 283 238 256
PR
PCT 44.7 47.2 50.8 52.5 53.4 52.1 50.1 48.4 45.3 51.1 48.3 49.0 51.4 50.1 50.5 47.8 49.1 49.8 48.1 49.4* Incomplete data. Source: FARS 1983-2002.
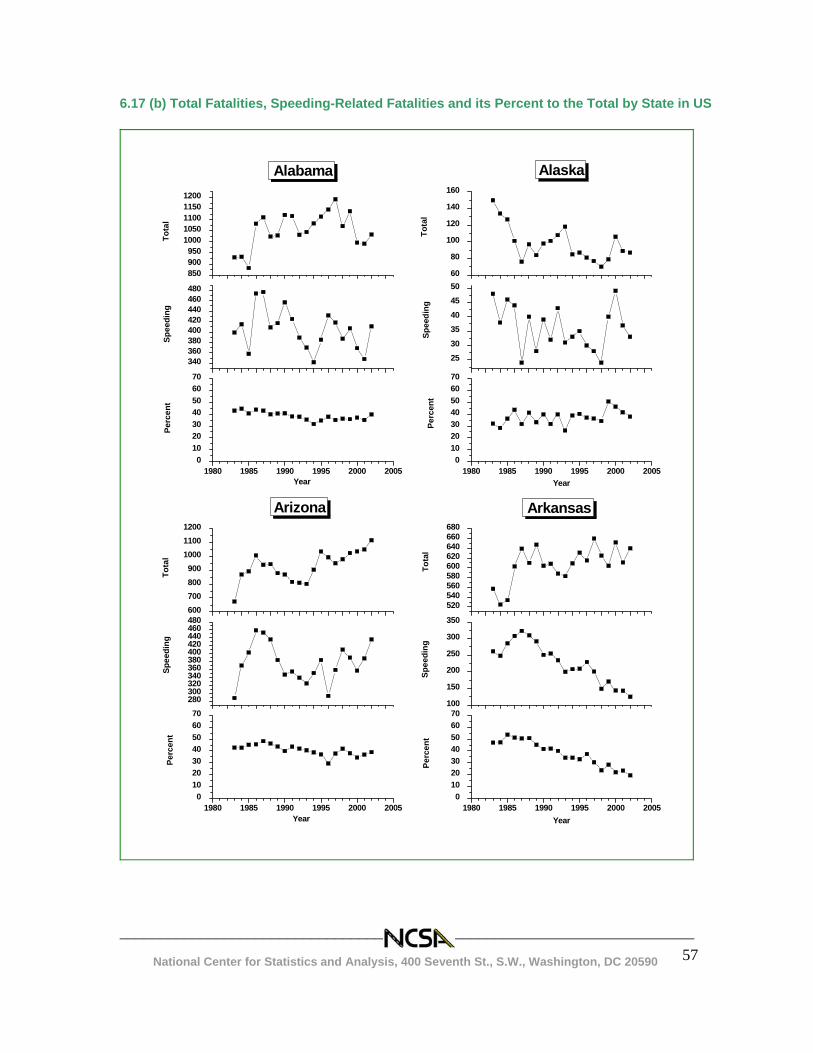
________________________________________________________________________ National Center for Statistics and Analysis, 400 Seventh St., S.W., Washington, DC 20590
57
6.17 (b) Total Fatalities, Speeding-Related Fatalities and its Percent to the Total by State in US
1980 1985 1990 1995 2000 20050
10203040506070
Year
Tota
l
Arkansas
Perc
ent
Spee
ding
100
150
200
250
300
350
520540560580600620640660680
1980 1985 1990 1995 2000 20050
10203040506070
Arizona
280300320340360380400420440460480600700800900
100011001200
Year
Tota
lPe
rcen
tSp
eedi
ng
1980 1985 1990 1995 2000 20050
10203040506070
Alaska
25303540455060
80
100
120
140
160
Year
Tota
lPe
rcen
tSp
eedi
ng
1980 1985 1990 1995 2000 20050
10203040506070
Alabama
Year
Perc
ent
340360380400420440460480
Spee
ding
850900950
10001050110011501200
Tota
l
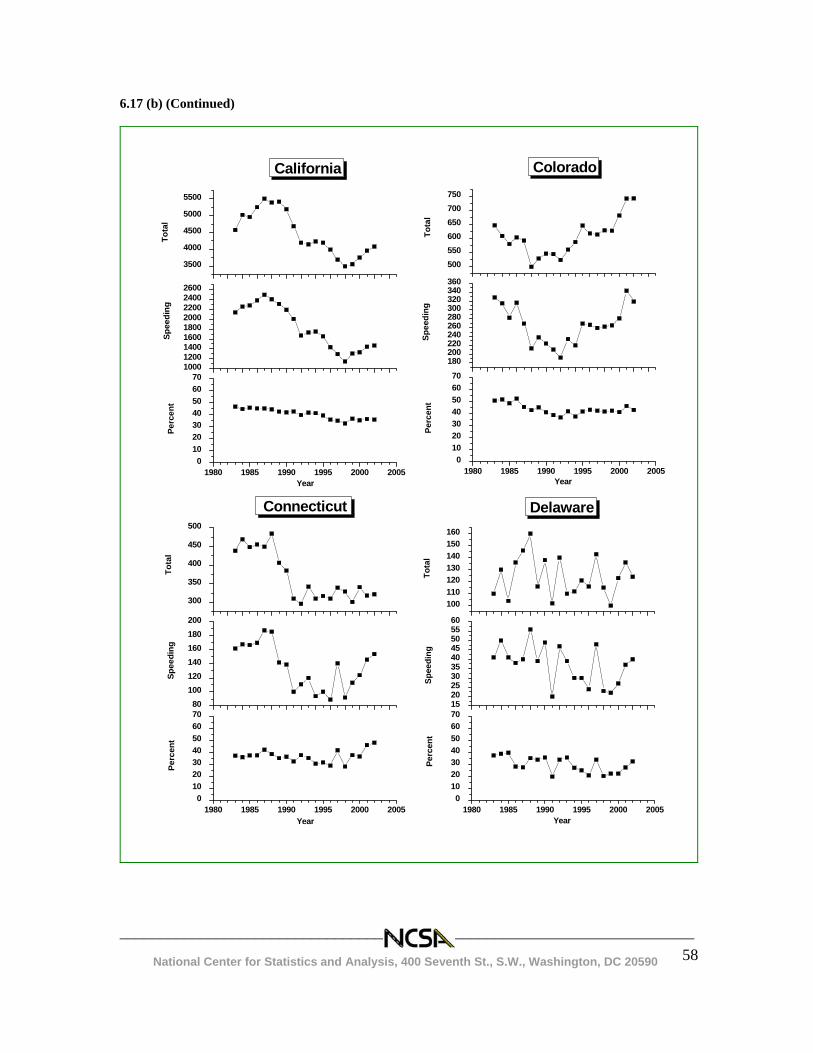
________________________________________________________________________ National Center for Statistics and Analysis, 400 Seventh St., S.W., Washington, DC 20590
58
6.17 (b) (Continued)
1980 1985 1990 1995 2000 20050
10203040506070
Year
Tota
l
Delaware
Perc
ent
Spee
ding
15202530354045505560
100110120130140150160
1980 1985 1990 1995 2000 20050
10203040506070
Year
Tota
l
Connecticut
Perc
ent
Spee
ding
80100120140160180200
300
350
400
450
500
1980 1985 1990 1995 2000 20050
10203040506070
Year
Tota
l
Colorado
Perc
ent
Spee
ding
180200220240260280300320340360
500550600650700750
1980 1985 1990 1995 2000 20050
10203040506070
100012001400160018002000220024002600
Year
Tota
lCalifornia
Perc
ent
Spee
ding
3500
4000
4500
5000
5500
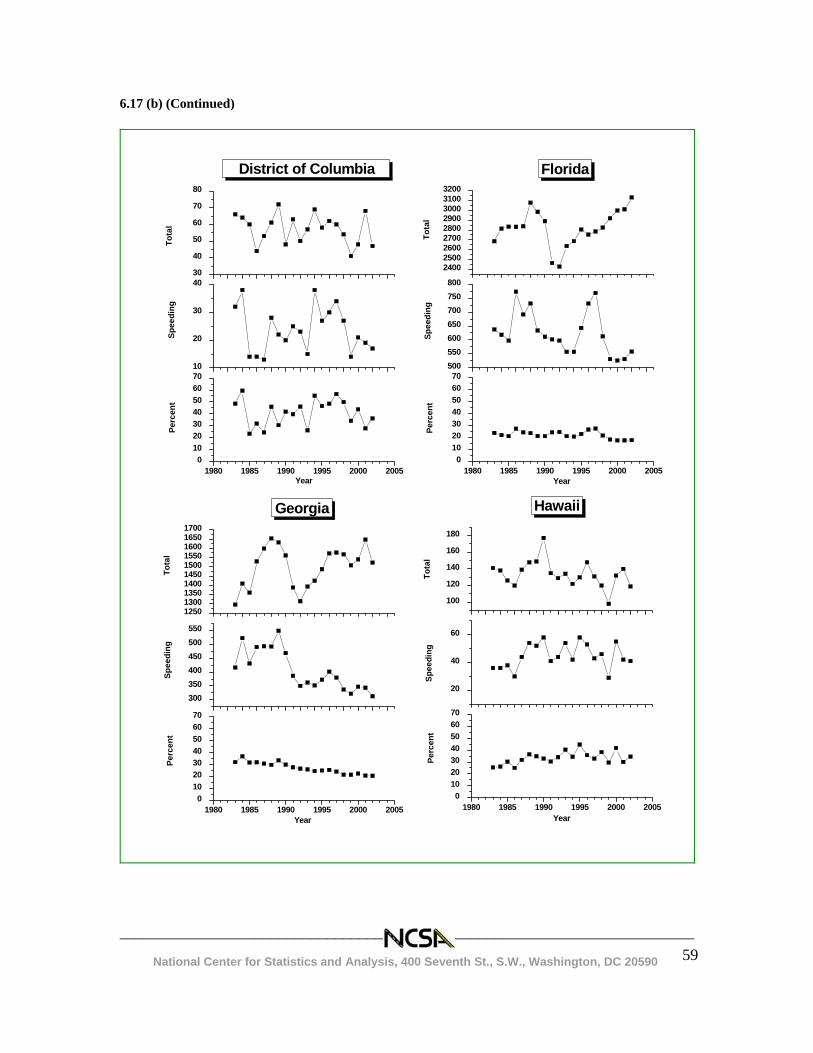
________________________________________________________________________ National Center for Statistics and Analysis, 400 Seventh St., S.W., Washington, DC 20590
59
6.17 (b) (Continued)
1980 1985 1990 1995 2000 20050
10203040506070
Hawaii
20
40
60
100
120
140
160
180
Year
Tota
lPe
rcen
tSp
eedi
ng
1980 1985 1990 1995 2000 20050
10203040506070
300350400450500550
1250130013501400145015001550160016501700
Year
Tota
l
Georgia
Perc
ent
Spee
ding
1980 1985 1990 1995 2000 20050
10203040506070
Year
500550600650700750800
240025002600270028002900300031003200
Tota
l
Florida
Perc
ent
Spee
ding
1980 1985 1990 1995 2000 20050
10203040506070
Year
Tota
lDistrict of Columbia
Perc
ent
Spee
ding
10
20
30
4030
40
50
60
70
80
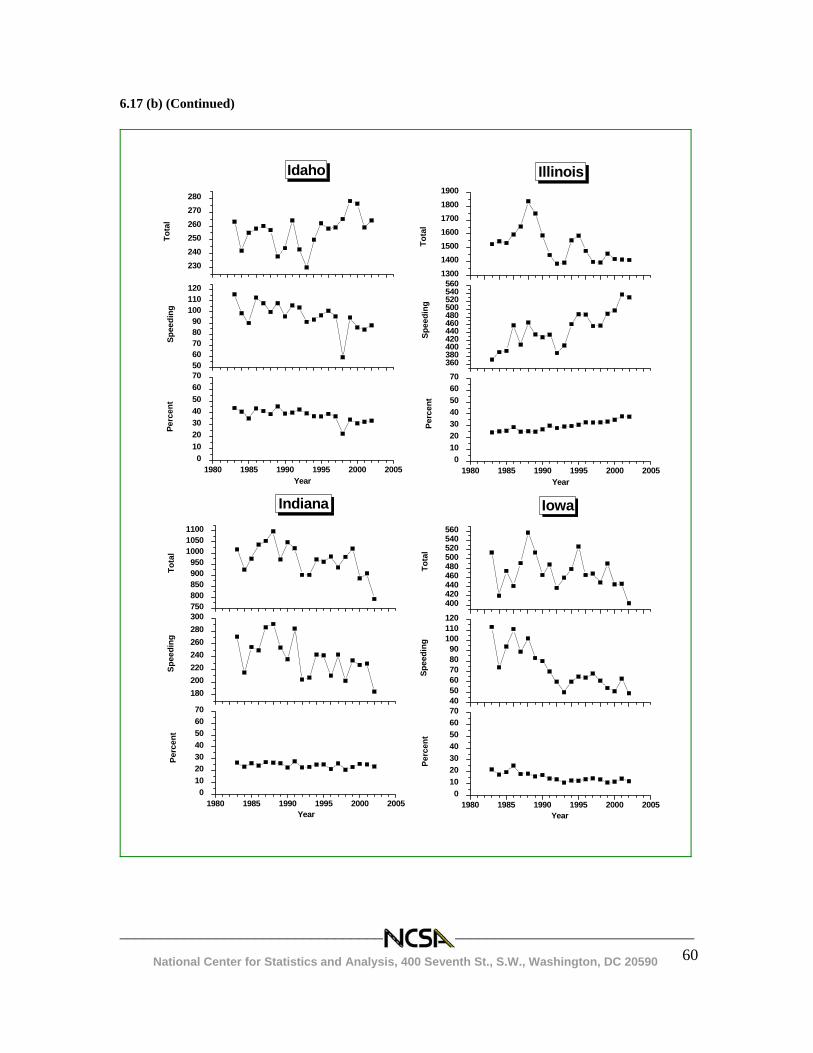
________________________________________________________________________ National Center for Statistics and Analysis, 400 Seventh St., S.W., Washington, DC 20590
60
6.17 (b) (Continued)
1980 1985 1990 1995 2000 20050
10203040506070
Year
Tota
l
Iowa
Perc
ent
Spee
ding
405060708090
100110120
400420440460480500520540560
1980 1985 1990 1995 2000 20050
10203040506070
Year
Tota
l
Indiana
Perc
ent
Spee
ding
180200220240260280300750800850900950
100010501100
1980 1985 1990 1995 2000 20050
10203040506070
Illinois
360380400420440460480500520540560
1300140015001600170018001900
Year
Tota
lPe
rcen
tSp
eedi
ng
1980 1985 1990 1995 2000 20050
10203040506070
Year
Tota
lIdaho
Perc
ent
Spee
ding
5060708090
100110120
230240250260270280
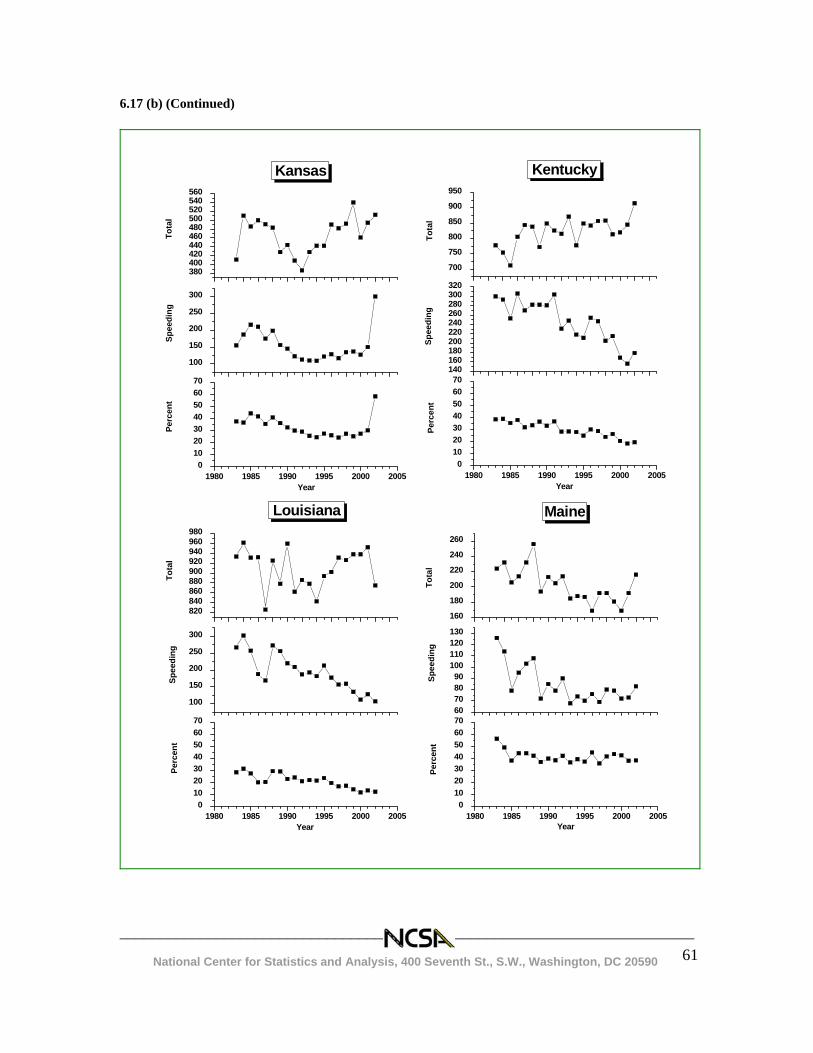
________________________________________________________________________ National Center for Statistics and Analysis, 400 Seventh St., S.W., Washington, DC 20590
61
6.17 (b) (Continued)
1980 1985 1990 1995 2000 20050
10203040506070
Year
Tota
l
Maine
Perc
ent
Spee
ding
60708090
100110120130
160
180
200
220
240
260
1980 1985 1990 1995 2000 20050
10203040506070
100
150
200
250
300
820840860880900920940960980
Year
Tota
l
Louisiana
Perc
ent
Spee
ding
1980 1985 1990 1995 2000 20050
10203040506070
Year
Tota
l
Kentucky
Perc
ent
Spee
ding
140160180200220240260280300320
700
750
800
850
900
950
1980 1985 1990 1995 2000 20050
10203040506070
Year
Tota
lKansas
Perc
ent
Spee
ding
100
150
200
250
300
380400420440460480500520540560
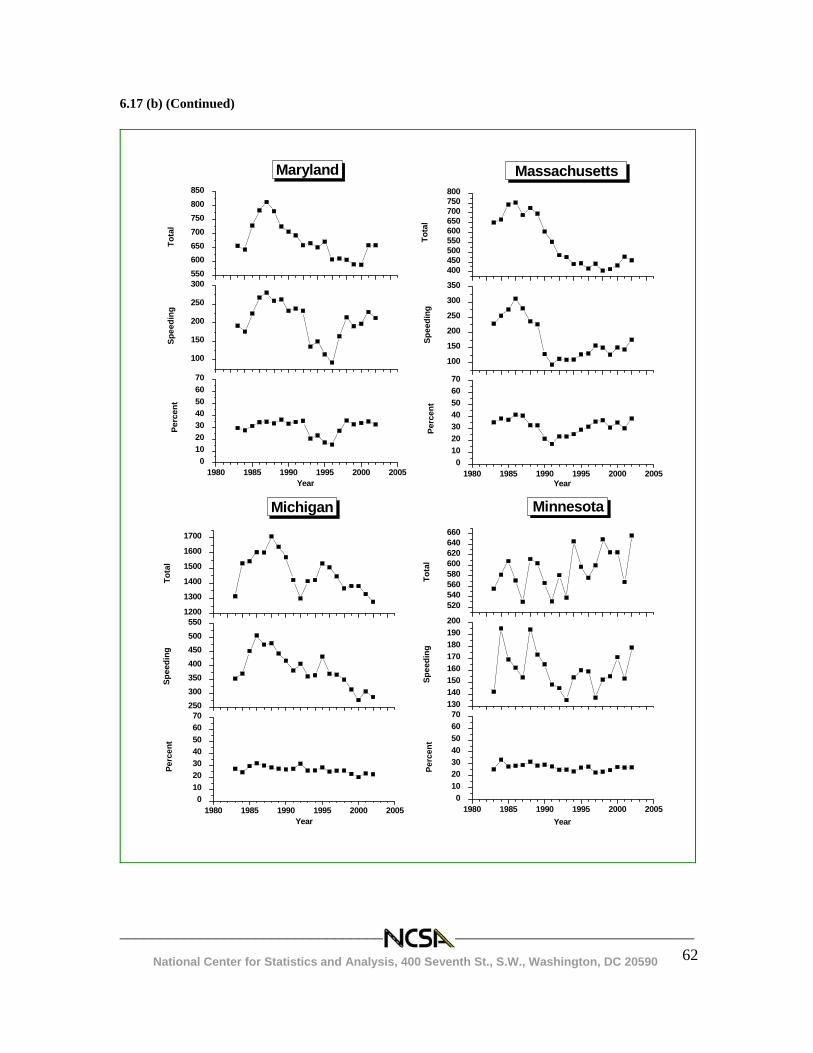
________________________________________________________________________ National Center for Statistics and Analysis, 400 Seventh St., S.W., Washington, DC 20590
62
6.17 (b) (Continued)
1980 1985 1990 1995 2000 20050
10203040506070
Year
Tota
l
Minnesota
Perc
ent
Spee
ding
130140150160170180190200
520540560580600620640660
1980 1985 1990 1995 2000 20050
10203040506070
Tota
l
Michigan
Perc
ent
Spee
ding
250300350400450500550
1200
1300
1400
1500
1600
1700
Year
1980 1985 1990 1995 2000 20050
10203040506070
Year
Tota
l
Massachusetts
Perc
ent
Spee
ding
100
150
200
250
300
350
400450500550600650700750800
1980 1985 1990 1995 2000 20050
10203040506070
Maryland
100
150
200
250
300550600650700750800850
Year
Tota
lPe
rcen
tSp
eedi
ng
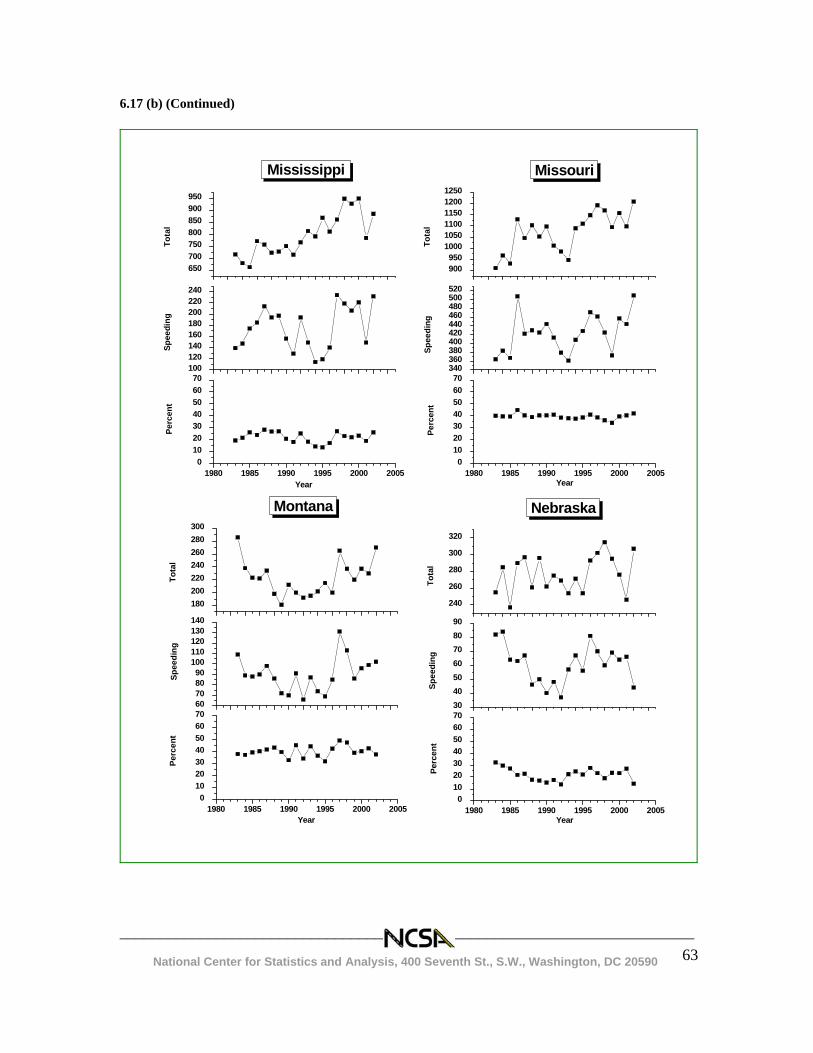
________________________________________________________________________ National Center for Statistics and Analysis, 400 Seventh St., S.W., Washington, DC 20590
63
6.17 (b) (Continued)
1980 1985 1990 1995 2000 20050
10203040506070
Nebraska
30405060708090
240
260
280
300
320
Year
Tota
lPe
rcen
tSp
eedi
ng
1980 1985 1990 1995 2000 20050
10203040506070
Montana
60708090
100110120130140
180200220240260280300
Year
Tota
lPe
rcen
tSp
eedi
ng
1980 1985 1990 1995 2000 20050
10203040506070
Missouri
340360380400420440460480500520
900950
100010501100115012001250
Year
Tota
lPe
rcen
tSp
eedi
ng
1980 1985 1990 1995 2000 20050
10203040506070
100120140160180200220240
650700750800850900950
Mississippi
Year
Tota
lPe
rcen
tSp
eedi
ng
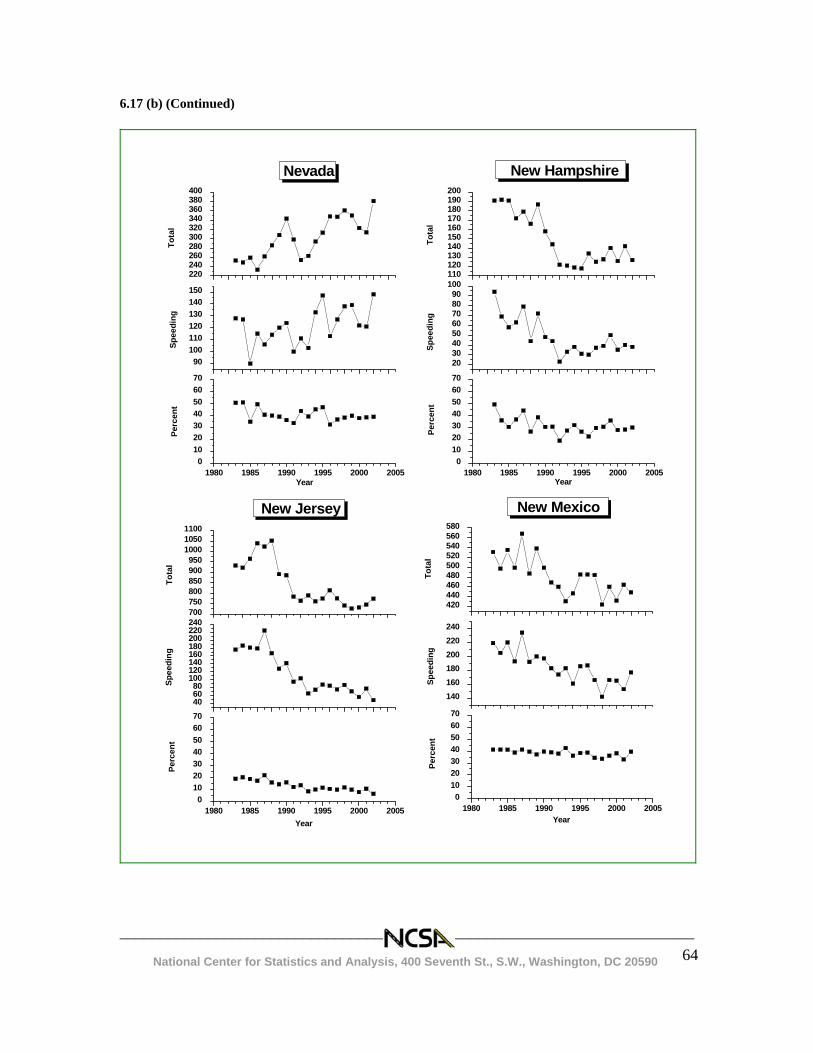
________________________________________________________________________ National Center for Statistics and Analysis, 400 Seventh St., S.W., Washington, DC 20590
64
6.17 (b) (Continued)
1980 1985 1990 1995 2000 20050
10203040506070
New Mexico
140160180200220240
420440460480500520540560580
Year
Tota
lPe
rcen
tSp
eedi
ng
1980 1985 1990 1995 2000 20050
10203040506070
New Jersey
406080
100120140160180200220240700750800850900950
100010501100
Year
Tota
lPe
rcen
tSp
eedi
ng
1980 1985 1990 1995 2000 20050
10203040506070
New Hampshire
2030405060708090
100110120130140150160170180190200
Year
Tota
lPe
rcen
tSp
eedi
ng
1980 1985 1990 1995 2000 20050
10203040506070
Nevada
90100110120130140150
220240260280300320340360380400
Year
Tota
lPe
rcen
tSp
eedi
ng
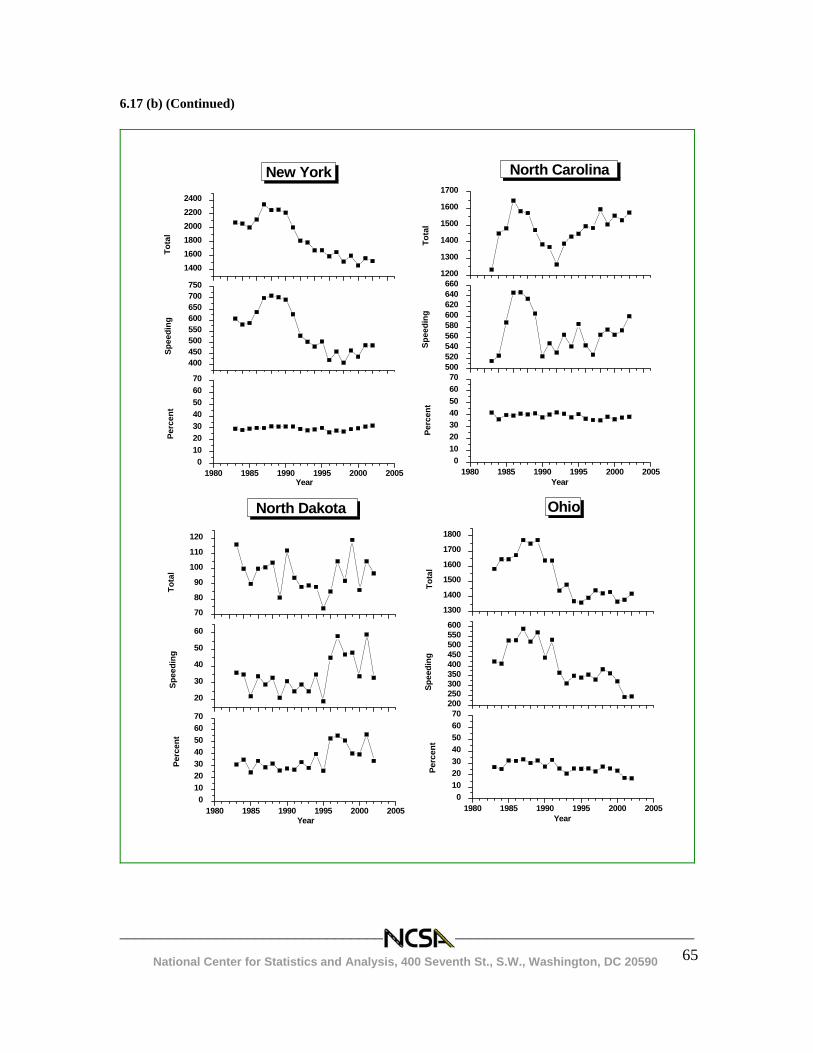
________________________________________________________________________ National Center for Statistics and Analysis, 400 Seventh St., S.W., Washington, DC 20590
65
6.17 (b) (Continued)
1980 1985 1990 1995 2000 20050
10203040506070
North Dakota
20
30
40
50
60
70
80
90
100
110
120
Year
Tota
lPe
rcen
tSp
eedi
ng
1980 1985 1990 1995 2000 20050
10203040506070
North Carolina
500520540560580600620640660
1200
1300
1400
1500
1600
1700
Year
Tota
lPe
rcen
tSp
eedi
ng
1980 1985 1990 1995 2000 20050
10203040506070
New York
400450500550600650700750
140016001800200022002400
Year
Tota
lPe
rcen
tSp
eedi
ng
1980 1985 1990 1995 2000 20050
10203040506070
Ohio
200250300350400450500550600
1300
1400
1500
1600
1700
1800
Year
Tota
lPe
rcen
tSp
eedi
ng
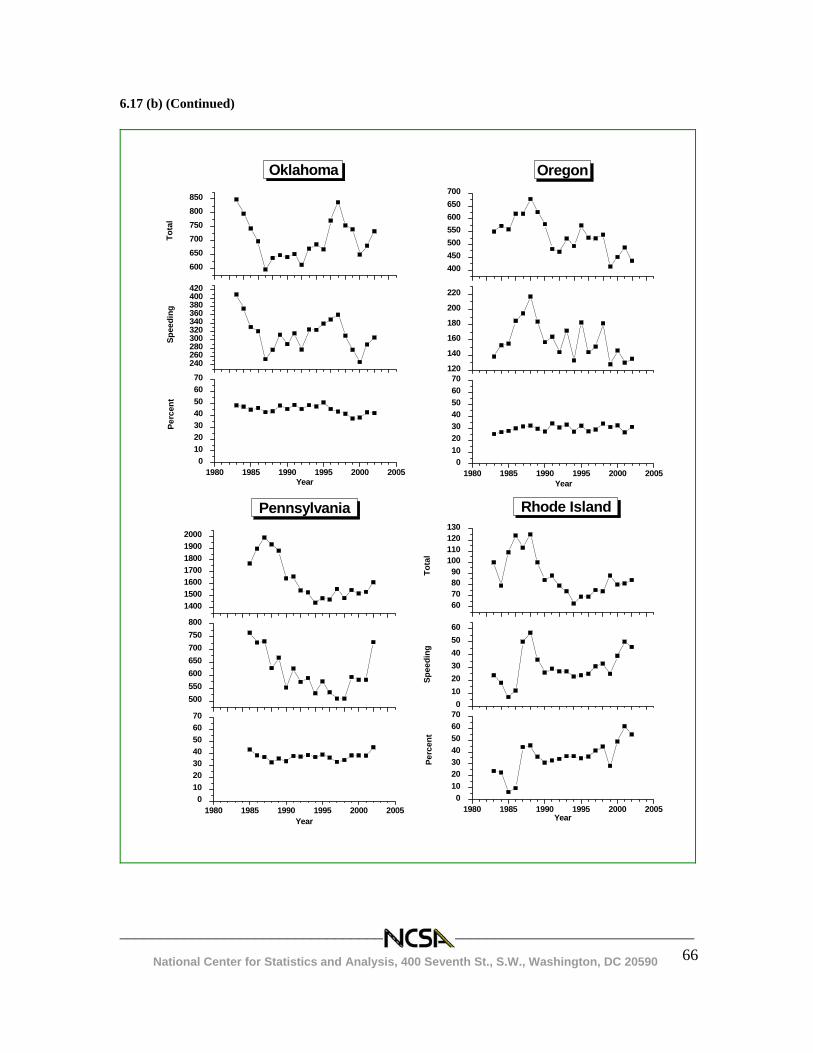
________________________________________________________________________ National Center for Statistics and Analysis, 400 Seventh St., S.W., Washington, DC 20590
66
6.17 (b) (Continued)
1980 1985 1990 1995 2000 20050
10203040506070
Year
Rhode Island
Tota
lPe
rcen
tSp
eedi
ng
0102030405060
60708090
100110120130
1980 1985 1990 1995 2000 20050
10203040506070
500550600650700750800
1400150016001700180019002000
Year
Pennsylvania
1980 1985 1990 1995 2000 20050
10203040506070
Year
Oregon
120
140
160
180
200
220
400450500550600650700
1980 1985 1990 1995 2000 20050
10203040506070
Year
OklahomaTo
tal
Perc
ent
Spee
ding
240260280300320340360380400420
600650700750800850
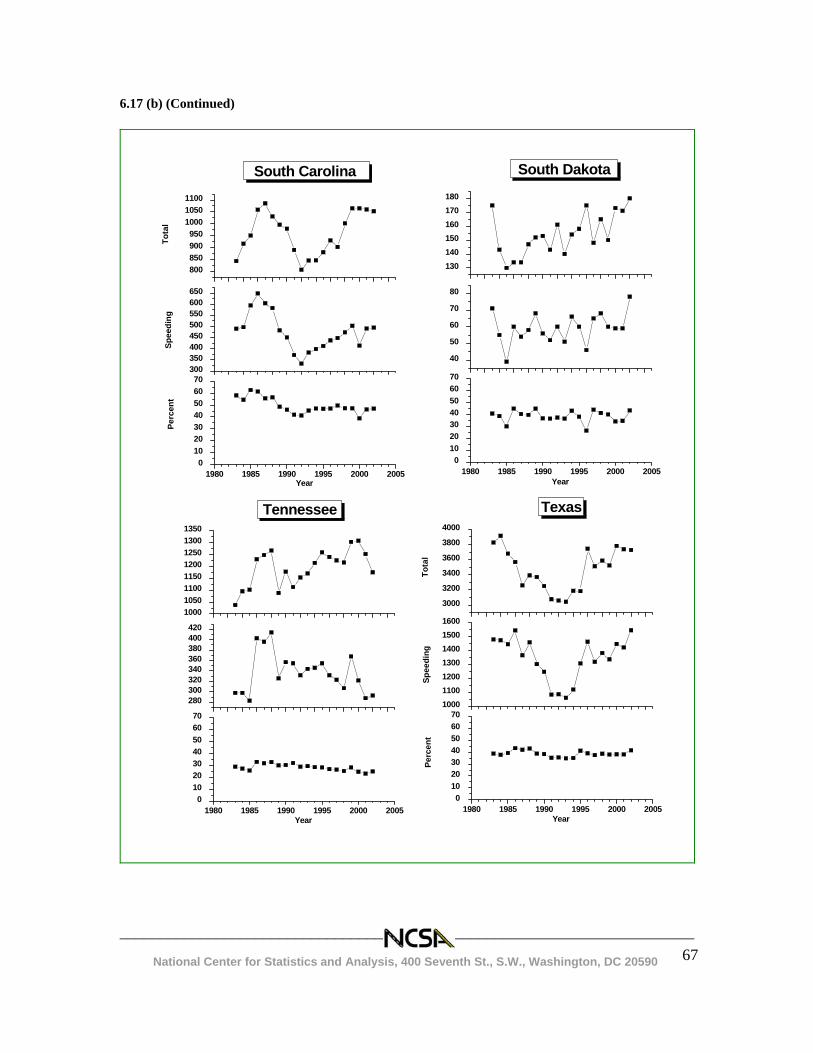
________________________________________________________________________ National Center for Statistics and Analysis, 400 Seventh St., S.W., Washington, DC 20590
67
6.17 (b) (Continued)
1980 1985 1990 1995 2000 20050
10203040506070
Year
Texas
Tota
lPe
rcen
tSp
eedi
ng
1000110012001300140015001600
3000
3200
3400
3600
3800
4000
1980 1985 1990 1995 2000 20050
10203040506070
Tennessee
280300320340360380400420
10001050110011501200125013001350
Year
1980 1985 1990 1995 2000 20050
10203040506070
Year
South Dakota
40
50
60
70
80
130140150160170180
1980 1985 1990 1995 2000 20050
10203040506070
Year
South Carolina To
tal
Perc
ent
Spee
ding
300350400450500550600650
800850900950
100010501100
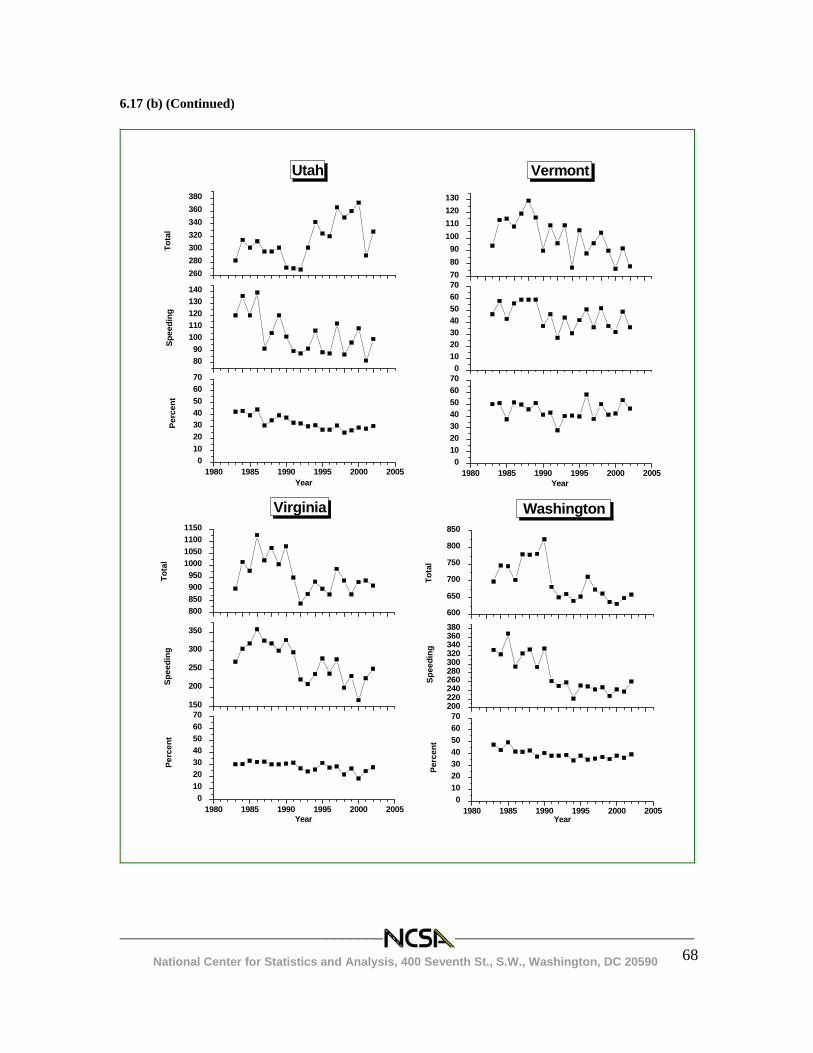
________________________________________________________________________ National Center for Statistics and Analysis, 400 Seventh St., S.W., Washington, DC 20590
68
6.17 (b) (Continued)
1980 1985 1990 1995 2000 20050
10203040506070
Year
Washington
Tota
lPe
rcen
tSp
eedi
ng
200220240260280300320340360380
600
650
700
750
800
850
1980 1985 1990 1995 2000 20050
10203040506070
150
200
250
300
350
800850900950
1000105011001150
Year
Virginia
Tota
lPe
rcen
tSp
eedi
ng
1980 1985 1990 1995 2000 20050
10203040506070
Year
Vermont
010203040506070708090
100110120130
1980 1985 1990 1995 2000 20050
10203040506070
Year
UtahTo
tal
Perc
ent
Spee
ding
8090
100110120130140
260280300320340360380
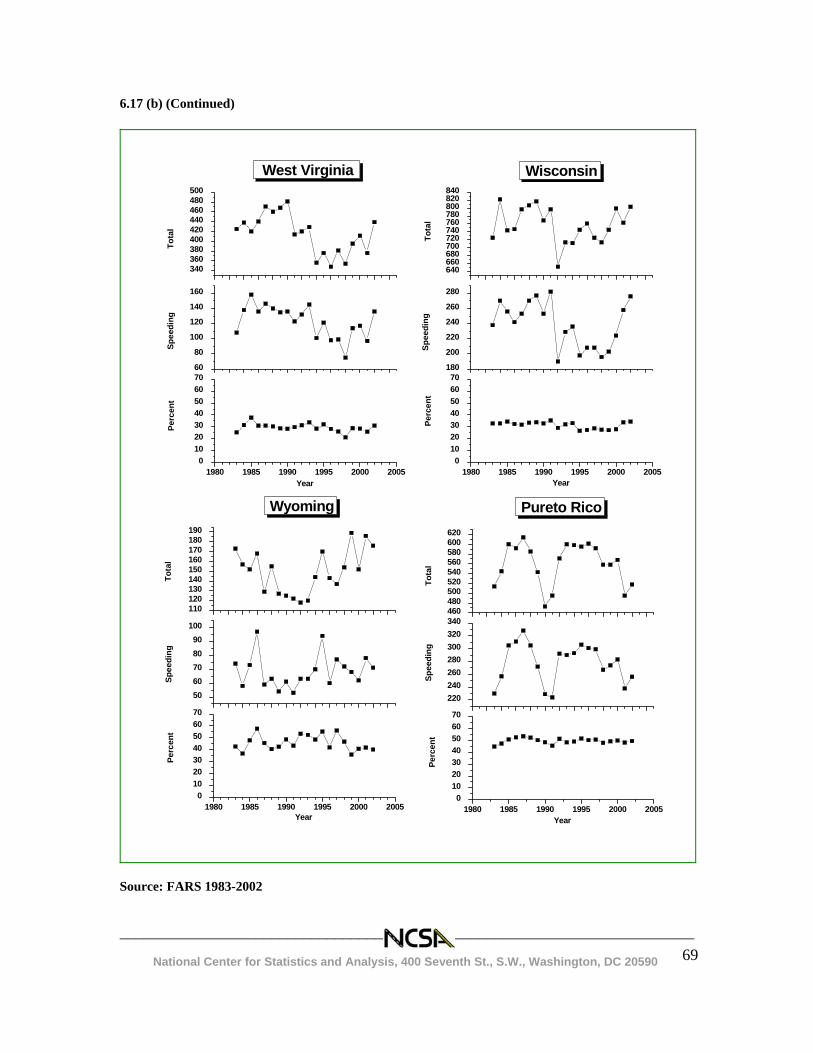
________________________________________________________________________ National Center for Statistics and Analysis, 400 Seventh St., S.W., Washington, DC 20590
69
6.17 (b) (Continued)
1980 1985 1990 1995 2000 20050
10203040506070
Pureto Rico
Perc
ent
Spee
ding
Tota
l
Year
220240260280300320340460480500520540560580600620
1980 1985 1990 1995 2000 20050
10203040506070
Year
Wyoming
Tota
lPe
rcen
tSp
eedi
ng
5060708090
100
110120130140150160170180190
1980 1985 1990 1995 2000 20050
10203040506070
Year
Wisconsin
Tota
lPe
rcen
tSp
eedi
ng
180
200
220
240
260
280
640660680700720740760780800820840
1980 1985 1990 1995 2000 20050
10203040506070
Year
West VirginiaTo
tal
Perc
ent
Spee
ding
60
80
100
120
140
160
340360380400420440460480500
Source: FARS 1983-2002
________________________________________________________________________ National Center for Statistics and Analysis, 400 Seventh St., S.W., Washington, DC 20590
70
DOT HS 809 839 June 2005