analysis of phosphine in dried foodstuffs via...
TRANSCRIPT


Page 2 / 17
Analysis of Phosphine in Dried Foodstuffs via
Headspace-GC-MSD
Roland Perz, Anne Benkenstein, Helmut Köbler, Ellen Scherbaum, Dieter Köhl, Anja Barth and Michelangelo Anastassiades
Chemisches und Veterinäruntersuchungsamt Stuttgart
Schaflandstraße 3/2
70736 Fellbach, Germany
fon: +49 711 3426 1941
fax: +49 711 3426 1149
email: [email protected]
Keywords:
Phosphine, Headspace GC MS, fumigant, fumigation, environmental
Abstract
Phosphine is one of the most widely used, cost-effective and rapidly acting
fumigants. In EU legislation, maximum residue limits for the sum of phos-
phine and phosphides in foodstuff are set to within a range of 0.01 and
0.1 mg kg-1, depending on the commodity. A highly sensitive headspace-
GC-MSD method was developed achieving limits of quantitation as low as
0.1 µg kg-1; this enabled not only the monitoring of MRLs, but also the ex-
posure of improper applications. In all, 115 samples of dried foodstuff from
the local market such as cereals, nuts, and legumes were analyzed for
phosphine residues. Of these, 35 samples contained phosphine in
amounts exceeding 0.1 µg kg-1, while 14 samples (12 % of all) exceeded
1 µg kg-1. Interestingly, seven of these 14 samples were labeled as being
from organic production, where phosphine application is not allowed. Mon-
itoring activities will be continued.

Page 3 / 17
Introduction
Globalization has led to an increased trade of goods between countries
from different continents. In 2011 maritime trade was estimated at 500
million containers, transporting goods from all parts of the world [1]. How-
ever, stowaways such as pests are inevitably carried along with the goods
as well. Fumigation of containers is common practice in the export and
import of foods, both in order to preserve the foods during the long trip and
to eliminate any pests that could be brought into a country with the food.
Methyl bromide was previously among the most widely used fumigants but
its production and use was restricted by the Montreal Protocol due to its
role in ozone depletion [2]. Nowadays phosphine (PH3) is one of the most
widely used, cost-effective and rapidly acting fumigants not expected to
leave higher residues on treated products. Cases of pests developing re-
sistance to phosphine, however, have been reported from different parts
of the world.
Properties of Phosphine and Phosphides
Phosphine is a colorless and odorless, flammable gas. Typical impurities
(e.g. diphosphane P2H4) cause an odor of garlic or decaying fish. Fur-
thermore, traces of diphosphane increase the risk of self-ignition. Phos-
phine affects the central nervous system and irritates the lungs. It is also
considered very toxic for fish. Overexposure of humans to phosphine
leads to symptoms such as nausea, vomiting, numbness and spasms.
Lethal intoxications have also been reported. Chronic poisonings are not
noted, however, because minor doses are constantly detoxicated in the
blood [3].
In dry conditions aluminum, magnesium and zinc phosphide are stable
crystals, but when they come in contact with moisture from crops, soil or
air they gradually release phosphine.

Page 4 / 17
Legal Aspects
In Germany several products containing phosphine and its salts aluminum
phosphide and magnesium phosphide are registered for use on coffee,
cocoa, oily seeds, dried fruit, legumes and stored cereals (Federal Office
of Consumer Protection and Food Safety, BVL). Zinc phosphide is permit-
ted, furthermore, as a rodenticide in the form of pellets.
In EU legislation, maximum residue limits for phosphine and phosphides in
foodstuff range from 0.01 to 0.1 mg kg-1, depending on the commodity
(Reg. (EC) No 149/2008) [4].
Annex 2 of Commission Regulation (EC) 889/2008 [5] contains a restrict-
ed list of products and substances which may be used in organic farming
for various purposes including plant protection, cleaning and disinfection
(see Article 16 of Council Regulation (EC) No 834/2007 [6]). Phosphine
and phosphides are not listed. Article 26 of Commission Regulation (EC)
889/2008 stipulates that every measure be taken to avoid cross contami-
nation of organically grown products with conventional products, prescrib-
ing the separate storage and suitable cleaning of production equipment.
Therefore, phosphine residues should not principally be contained in or-
ganic food.
Analytical Approaches
Due to its high volatility phosphine is not amenable to common multi-
residue methods for pesticide residue analysis in food; thus, special single
residue methods have to be applied.
The earliest attempts at determining phosphine used derivatization with
titrimetric or photometric methods [7, 8]. As instrumental analysis tech-
niques became more sensitive and reliable, however, phosphine, and fu-
migants in general, were preferably analyzed by GC, following the injec-
tion of liquid extracts into packed columns initially connected to thermal
conductivity detectors [9]. Later on, the more sensitive and selective flame
photometric [10-12], thermionic [12, 13] and mass spectrometric detectors
[14] were used. With the introduction of new techniques enabling highly
reproducible sampling in the gas phase, new methods were developed.
Page 5 / 17
These employ the purge and trap approach, which involves offline analyte
enrichment [11, 15-17], the automated headspace sampling approach
[18], or the headspace-SPME approach [19]. An overview of these meth-
ods is given in the review of Desmarchelier [20].
In 2003 Amstutz et al. published a gas chromatographic method for the
analysis of phosphine in dry commodities involving the addition of aque-
ous sulfuric acid to the sample, a preconditioning at 80 °C in a closed ves-
sel, and a headspace sampling of the gas-phase above the sample. De-
tection was accomplished with a flame photometric detector [21]. The lim-
its of quantitation (LOQs) achieved were very low, with reported concen-
trations in real samples varying between 0.3 µg kg-1 and 2.5 µg kg-1.
Based on this published method, we have set up a new method also in-
volving headspace sampling and GC-analysis, but employing a mass
spectrometric instead of a flame photometric detector to obtain additional
diagnostic information.
Experimental
Chemicals and Standards
Sulfuric acid (concentrated) analysis grade was purchased from Merck
(Darmstadt, Germany). The analytical standard phosphine (puri-
ty ≥ 99.9 %, 100 ppm and 10 ppm dilution in nitrogen) was obtained from
Linde AG.
Apparatus
Samples were ground at room temperature using a Grindomix GM 200
knife mill by Retsch (Haan, Germany). For safe handling of calibration
gases, Tedlar gas sampling bags Nr. 24633 from Supelco (Sigma-Aldrich,
Germany) and gas tight syringes PN 1710 100 µL and PN 1001 1000 µL
from Hamilton (Martinsried, Germany) were used. Analytical balances
capable of weighing units down to 0.1 mg or 0.01 g were from Mettler-
Toledo (Greifensee, Switzerland).
Page 6 / 17
An Agilent GC-MSD system (Waldbronn, Germany), consisting of a 6890
GC and a 5973 MSD was used for analysis.
The system was equipped with a MPS2 sampler from Gerstel (Mül-
heim/Ruhr, Germany) with a headspace agitator unit and a 2.5 mL sy-
ringe. Further, a KAS 4 PTV with a cryo unit to be run with liquid nitrogen
and capable of maintaining -80 °C served as the injection port. Suitable
liners filled with Tenax were from Gerstel. Chromatographic separation
took place on a Rt-Q-Bond PLOT column (30 m × 0.32 mm × 10 µm) from
Restek (Bad Homburg, Germany). To prevent single, loose particles of the
stationary phase from entering the ion source of the MSD, a restriction
capillary (5 m × 0.25 mm) from Agilent (Waldbronn, Germany) was insert-
ed between the PLOT column and the MSD using an appropriate column
connector (Agilent, Waldbronn).
Sample Preparation
Coarse-granular commodities, such as nut kernels or legumes, were
ground with a knife mill. Heat development was minimized by intervallic
grinding. An amount of 1 g of the powdery homogenate was weighed into
a headspace vial, 7 mL of water were added and the vial was closed with
a rubber stopper and vigorously shaken. Subsequently, the vial was filled
to a level of 15 mL with sulfuric acid 10 % and immediately sealed. In the
case of granular commodities (e.g. whole grains), up to 3 g were weighed
into the headspace vial and 5 % sulfuric acid solution was rapidly poured
into the vials up to a level of 15 mL (using a small beaker). The vials were
immediately closed and shaken.
Headspace-GC-MSD Analysis
The following injection settings were used for GC-MSD analysis: the agita-
tor temperature was set at 80 °C, incubation time was 10 min, shaking
speed was 500 rpm, and the shaking interval 5 s, followed by a 2 s break.
The syringe temperature was set at 85 °C, the injection volume at 2000 µL,
the draw speed at 200 µL s-1 and the injection speed at 500 µL s-1. PTV condi-
tions were as follows:

Page 7 / 17
-80 °C initial temperature with 1.0 min initial time, heating ramp to 150 °C
with a rate of 12.0 °C min-1, hold time 2 min. Carrier gas flow (helium) was
set at 2.2 mL min-1 in constant flow mode, split ratio was 5:1. The oven
temperature program started at 35 °C with 3 min initial time, followed by
two heating ramps (10 °C min-1 to 100 °C, then 35 °C min-1 to 200 °C) and
a final time of 4 min, resulting in a total run time of 16.4 min. The transfer
line temperature was set at 240 °C. The mass selective detector (ioniza-
tion in EI mode, 70 eV) worked in SIM mode recording the ions m/z 31, 33
and 34 after a solvent delay of 4 min with a dwell time of 100 ms for each
ion. To gain sufficient detector sensitivity, it was essential to use a tune file
especially for very low masses.
Method validation
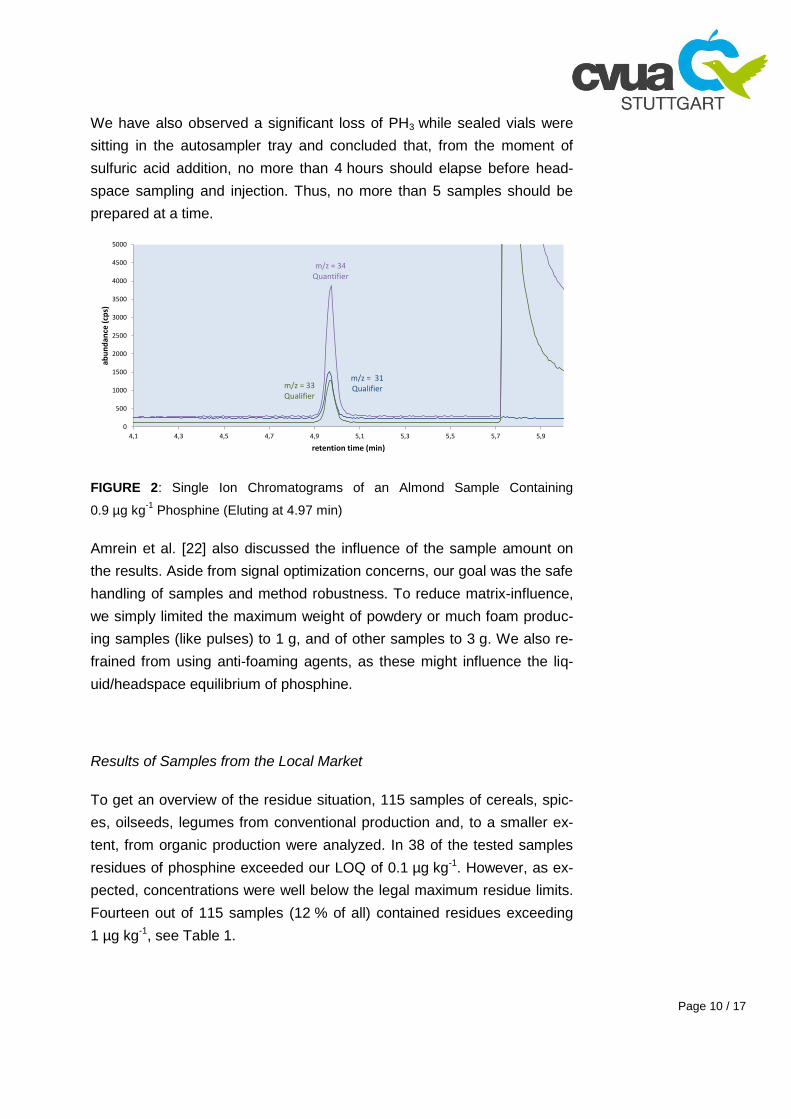
The chromatographic separation employed was shown to be selective
enough to largely exclude any disturbances by oxygen, hydrogen sulfide
or other small molecules in the same m/z range. The acceptable retention
of phosphine (capacity factor near 3) and the stable retention times, com-
bined with a good chromatographic resolution and the presence of two
diagnostic ions, provided a high degree of certainty in the identification
and quantification of phosphine in all tested sample types (see Fig. 2).
Calibration curves of procedural calibration standards were linear up to at
least 50 µg kg-1, with good correlation coefficients (R2 > 0.99). Due to ma-
trix-dependent signal quenching effects (see Fig. 1), external non-matrix-
matched calibrations are not recommended for final quantification. They
are suitable for screening purposes, however. For accurate quantification,
positive samples have to be re-analyzed by the standard additions ap-
proach or at least calibrated against procedural calibration standards pre-
pared on a similar matrix.
Relative standard deviation of replicate analyses (n = 10) of spiked matrix
(unground millet, 1 g per vial) at one level (42 ng g-1) was 5.8 %, thus
showing good repeatability of the procedure.
By moderately milling dry pulses with incurred residues we observed sin-
gle cases of phosphine signals that were up to twice as high as those for

Page 8 / 17
unground samples (data not shown). In the case of cereals with aged res-
idues we did not observe this effect. Moderate grinding of dried samples is
thus recommended, as long as temperatures are kept low. This improves
the homogeneity of the material (and therefore the reproducibility and ac-
curacy of results) and leads in some cases to higher (and more correct)
results.
Since spiking a blank matrix to achieve aged residues at a known level is
impossible, the evaluation of result trueness (deviation from the real value)
by means of common recovery experiments was not possible. We were,
however, able to check our method in a ring test, organized by Amrein et
al. [22], and obtained good results (absolute z-score < 2) for real samples
in all but one case.
FIGURE 1: Calibration Curves With and Without Matrix in the Range 0 to
28 ng/vial Showing Strong Matrix Effects
y = 60270xR² = 0,9963
y = 26525xR² = 0,9993
y = 17376xR² = 0,9982
-50000
150000
350000
550000
750000
950000
1150000
1350000
1550000
1750000
0 5 10 15 20 25 30
Re
sp
on
se
/Pe
ak
are
a (
co
un
ts)
Absolute amount of PH3 (ng/vial)
without matrix
on lentils 1g/vial
on walnuts 1g/vial

Page 9 / 17
Results and Discussion
Analytical Results and Method Adaptation
As discussed by Amrein et al. [22], there are several critical factors that
have to be accounted for when implementing the method. Sample prepa-
ration is of core importance.
Grinding of the sample helps to improve homogeneity, but the decision to
do so or not depends on the properties and condition of the commodities
to be analyzed. In our milling experiments we have noticed single cases
with remarkably higher signals following grinding. This might be due to
better accessibility of the analyte, which probably penetrated the matrix
over time. On the other hand, excessive grinding was intentionally used by
Brockwell [10] to achieve complete PH3 release, so excessive grinding
should be avoided. Interestingly, samples that were even older than 2
years having been stored in paper bags, which are definitely not gas tight,
showed remarkable PH3 findings. The fact that PH3 signals are not sensi-
tive to careful grinding and that residues of this very volatile analyte exist a
long time leads to the assumption of tightly, but reversibly bound residues,
which interact with matrix-components via either strong, non-covalent ad-
sorption or covalent bonding. Covalent irreversible bonding has already
been described by Berck for cereal samples [23].
Some fluffy commodities such as dried herbs and bran tend to enclose air
bubbles, thus causing a bias in the headspace volume within the vial. In-
stead of stirring to remove bubbles as proposed by Amrein [22], shaking
with water and subsequent volume adjustment with higher concentrated
acid was shown to be a good alternative. Reduced wettability, especially
of powdery samples, can be overcome with this procedure, too.
Aside from sample homogeneity, reproducibility of results strongly de-
pends on fast and experienced handling of liquid. The use of pipettes for
filling the vials with acid was shown to be too slow, and lead to substantial
losses of PH3.
Page 10 / 17
We have also observed a significant loss of PH3 while sealed vials were
sitting in the autosampler tray and concluded that, from the moment of
sulfuric acid addition, no more than 4 hours should elapse before head-
space sampling and injection. Thus, no more than 5 samples should be
prepared at a time.
FIGURE 2: Single Ion Chromatograms of an Almond Sample Containing
0.9 µg kg-1
Phosphine (Eluting at 4.97 min)
Amrein et al. [22] also discussed the influence of the sample amount on
the results. Aside from signal optimization concerns, our goal was the safe
handling of samples and method robustness. To reduce matrix-influence,
we simply limited the maximum weight of powdery or much foam produc-
ing samples (like pulses) to 1 g, and of other samples to 3 g. We also re-
frained from using anti-foaming agents, as these might influence the liq-
uid/headspace equilibrium of phosphine.
Results of Samples from the Local Market
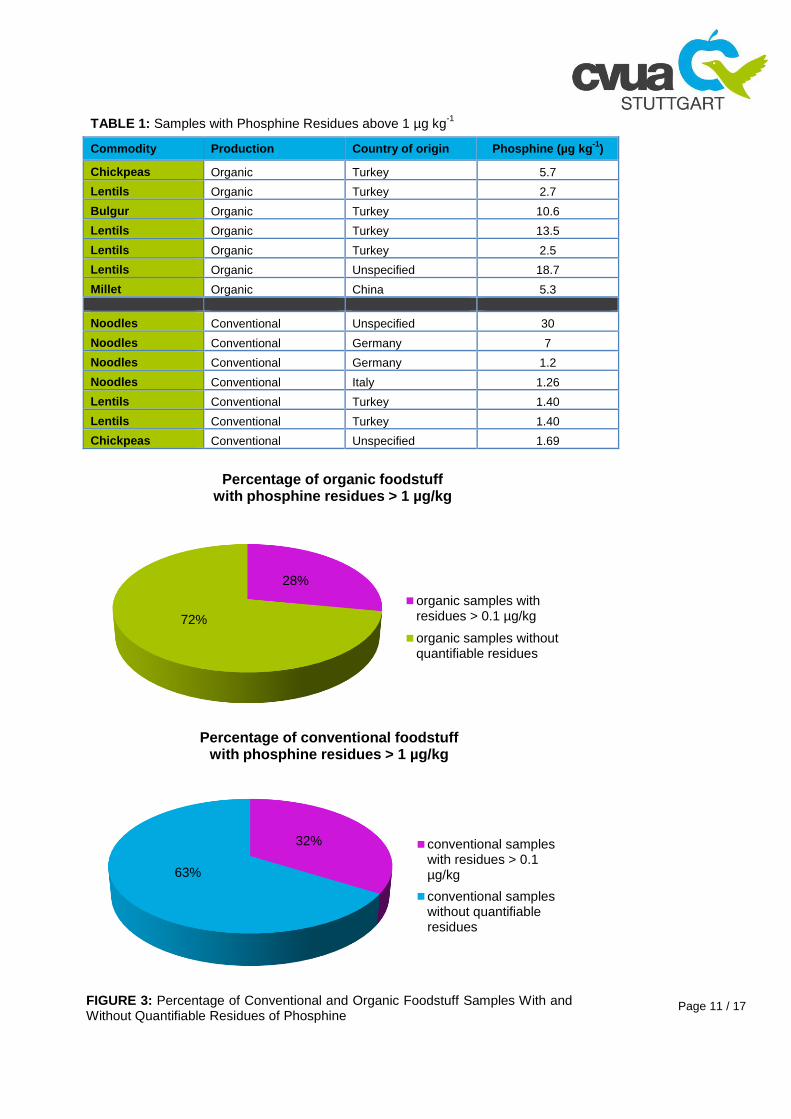
To get an overview of the residue situation, 115 samples of cereals, spic-
es, oilseeds, legumes from conventional production and, to a smaller ex-
tent, from organic production were analyzed. In 38 of the tested samples
residues of phosphine exceeded our LOQ of 0.1 µg kg-1. However, as ex-
pected, concentrations were well below the legal maximum residue limits.
Fourteen out of 115 samples (12 % of all) contained residues exceeding
1 µg kg-1, see Table 1.
m/z = 31Qualifier
m/z = 34Quantifier
m/z = 33Qualifier
0
500
1000
1500
2000
2500
3000
3500
4000
4500
5000
4,1 4,3 4,5 4,7 4,9 5,1 5,3 5,5 5,7 5,9
abu
nd
ance
(cp
s)
retention time (min)
Page 11 / 17
28%
72%
Percentage of organic foodstuff with phosphine residues > 1 µg/kg
organic samples withresidues > 0.1 µg/kg
organic samples withoutquantifiable residues
32%
63%
Percentage of conventional foodstuff with phosphine residues > 1 µg/kg
conventional sampleswith residues > 0.1µg/kg
conventional sampleswithout quantifiableresidues
FIGURE 3: Percentage of Conventional and Organic Foodstuff Samples With and Without Quantifiable Residues of Phosphine
TABLE 1: Samples with Phosphine Residues above 1 µg kg-1
Commodity Production Country of origin Phosphine (µg kg-1
)
Chickpeas Organic Turkey 5.7
Lentils Organic Turkey 2.7
Bulgur Organic Turkey 10.6
Lentils Organic Turkey 13.5
Lentils Organic Turkey 2.5
Lentils Organic Unspecified 18.7
Millet Organic China 5.3
Noodles Conventional Unspecified 30
Noodles Conventional Germany 7
Noodles Conventional Germany 1.2
Noodles Conventional Italy 1.26
Lentils Conventional Turkey 1.40
Lentils Conventional Turkey 1.40
Chickpeas Conventional Unspecified 1.69

Page 12 / 17
A detailed presentation of the results for conventional foodstuffs is found
in Table 2 and, for organic foodstuffs, in Table 3.
TABLE 2: Results for Phosphine in Conventional Foodstuffs
Commodity Country of
Origin No.
Samples
No. Positive Samples
Minimum (µg kg
-1)
Maximum (µg kg
-1)
Mean Value (µg kg
-1)
Cereals China 1 0
Germany 10 1 0.45
Greece 1 0
Italy 1 0
Canada 1 0
The Netherlands 1 0
Unspecified 4 0
Total Cereals 19 1 0.45 0.45
Cereal Prod-ucts
France 2 1 0.2
Turkey 1 1 0.4
Total Cereal Products 3 2 0.2 0.4 0.30
Spices Germany 1 0
Total Spices 1
Legumes Italy 1 0
unspecified 7 1 1.69
Turkey 7 5 1.4 0.14 0.76
Total Legumes 15 6 0.14 1.69 0.92
Oil seeds Germany 1 0
Total Oil Seeds 1 0
Nuts Argentina 1 0
China 1 1 0.1
Germany 1 1 0.91
France 1 0
Iran 1 1 0.56
Italy 2 0
Turkey 2 0
USA 3 1 0.18
Total Nuts 12 4 0.1 0.91 0.37
Tea China 1 0
Total Tea 1 0
Noodles China 1 1 0.35 0.35
Germany 9 5 0.1 7 1.50
Italy 1 1 1.26
unspecified 1 1 30
Taiwan 1 0
Total Noodles 13 8 0.1 30 4.51
Total Conventional Goods 65 21 0.1 30 2.04

Page 13 / 17
From the 21 conventional samples containing phosphine at levels exceed-
ing our LOQ of 0.1 µg kg-1 7 were from Germany (thereof 5 noodle sam-
ples), 6 from Turkey, 2 from China, USA or not specified, respectively.
One sample each originated in France, Italy, Iran and the USA. This indi-
cates a widespread use of phosphine in many countries.
In contrast to fruits and vegetables, many other products do not require
information regarding the country of origin on the packaging or price tag.
Thus, in many cases, the country of origin for the samples analyzed was
“unspecified”.
TABLE 3: Results for Phosphine in Organic Foodstuffs
Commodity Country of
Origin
No.
Samples
No. Positive Samples
Minimum (µg kg
-1)
Maximum (µg kg
-1)
Mean Val-ue (µg kg
-1)
Cereals China 2 2 0.9 5.3 3.10
Germany 4 0
Unspecified 6 1 0.16
Austria 1 0
Total Cereals 13 3 0.16 5.3 2.12
Cereal Products Italy 1 0
Unspecified 1 1 0.1
Turkey 1 1 10.6
Total Cereal Products 3 2 0.1 10.6 5.35
Legumes China 2 0
Germany 1 0
Canada 3 0
Unspecified 4 3 0.5 18.7 6.72
Turkey 7 5 0.83 13.5 5.05
Total Legumes 17 8 0.5 18.7 5.67
Oil seeds Germany 1 0
Kazakhstan 1 0
Unspecified 3 0
Total Oil seeds 5 0
Nuts France 3 0
India 1 0
Unspecified 3 1 0.9
Turkey 3 0
Vietnam 1 0
Total Nuts 11 1 0.9
Noodles Germany 1 0
Total Noodles 1 0
Total Organic goods 50 14 0.1 18.7 4.52
Page 14 / 17
From the 14 organic samples containing quantifiable phosphine residues,
6 were from Turkey, 6 had an unknown origin and 2 originated in China.
Interestingly, processed foods such as noodles also frequently showed
residues exceeding the LOQ. In these cases, the phosphine may have
come from either the original ingredients (e.g. wheat, eggs) or from pest
control measures taken during transport or storage of the finished prod-
ucts. In one case, we cooked a positive noodle sample to prepare the
product as one would for a meal, and found afterwards that nearly half of
the residual phosphine was still there. This indicates that, to some extent,
phosphine residues can even survive exposure to boiling water.
Conclusions
Quantifiable concentrations of phosphine were found in 32 % of the con-
ventional foodstuff samples, and in 28 % of the organic foodstuffs. As
phosphine is not permitted for use in organic production and cross con-
tamination should be minimized by appropriate measures, no residues
should actually occur in organic products. The phosphine concentrations
detected in conventional and organic products were in the same range.
More research is needed to elucidate the reasons for the findings in or-
ganic products, potential options being cross-contamination, mingling of
organic and conventional products and illegal applications. .
Residual phosphine can be bound tightly to the matrix and survive ex-
tended food storage or processing. Therefore, phosphine may occasional-
ly occur in a broad variety of processed foods that have not yet been the
focus of analytical chemists so far.
Acknowledgement:
We would like to thank Mr. Thomas Amrein from Coop Swiss for his sup-
port and exchange of knowledge, as well as for the possibility to partici-
pate last-minute in a method validation ring test.

Page 15 / 17
References
1. [Website] 2014; Available from
http://www.hafen-hamburg.de/content/weltcontainerumschlag.
2. Montréal Protokol on Substances that Deplete the Ozone Layer. United Nations
Environment Programme, 1995. Nairobi (Kenia).
3. [Website] 2013; Available from: http://www.umweltlexikon-
online.de/RUBwerkstoffmaterialsubstanz/Phosphorwasserstoff.php.
4. COMMISSION REGULATION (EC) No 149/2008 of 29 January 2008 amending Regulation
(EC) No 396/2005 of the European Parliament and of theCouncil by establishing Annexes II,
III and IV setting maximum residue levels for products covered by Annex I thereto, in Official
Journal of the European Union L58/1-3982008: Official Journal of the European Union. p.
398.
5. COMMISSION REGULATION (EC) No 889/2008 of 5 September 2008 laying down detailed
rules for the implementation of Council Regulation (EC) No 834/2007 on organic production
and labelling of organic products with regard to organic production, labelling and control, in
Official Journal of the European Union L250/1, T.C.O.T.E. COMMUNITIES, Editor 2008.
6. Council Regulation (EC) No 834/2007 of 28 June 2007 on organic production and labelling
of organic products and repealing Regulation (EEC) No 2092/91, in Official Journal of the
European Union L189/1–23, T.C.O.T.E. UNION, Editor 2007: Official Journal of the
European Union. p. 23.
7. Bruce, R.B., A.J. Robbins, and T.O. Tuft, Fumigant Residues, Phosphine Residues from
Phostoxin-Treated Grain. Journal of Agricultural and Food Chemistry, 1962. 10(1): p. 18–21.
8. Kroeller, E., Determination of residual phosphine in foods. Deutsche Lebensmittel-
Rundschau, 1968. 64(1): p. 6–9.
9. Berck, B., Determination of fumigant gases by gas chromatography. Journal of Agricultural
and Food Chemistry, 1965. 113(4): p. 373–7.
10. Brockwell, C.A., Determination of phosphine in wheat by headspace gas-liquid
chromatography. Journal of agricultural and food chemistry, 1978. 26(4): p. 962–4.
11. Nowicki, T.W., Gas-liquid chromatography and flame photometric detection of phosphine in
wheat. Journal - Association of Official Analytical Chemists, 1978. 61(4): p. 829–36.
12. Berck, B., W.E. Westlake, and F.A. Gunther, Microdetermination of phosphine by gas-liquid
chromatography with microcoulometric, thermionic, and flame photometric detection.
Journal of Agricultural and Food Chemistry, 1970. 18(1): p. 143–7.
13. Longobardi, F., et al., Rapid Method for Determination of Phosphine Residues in Wheat.
Food Analytical Methods, 2008. 1(3): p. 220–225.
14. Norman, K.N. and K. Leonard, Gas chromatography-mass spectrometry determination of
phosphine residues in stored products and processed foods. Journal of agricultural and food
chemistry, 2000. 48(9): p. 4066–70.
Page 16 / 17
15. Robison, W.H. and H.W. Hilton, Gas Chromatography of Phosphine Derived from Zinc
Phosphide in sugarcane. Journal of agricultural and food chemistry, 1971. 19(5): p. 875–
878.
16. Martens-Menzel, R. and C. Reichmuth, Determination of phosphine in fumigated vegetables
and in the air by headspace technique and GC. Gesunde Pflanzen, 1997. 49(6): p. 183–
188.
17. Corley, J., et al., Rapid Zinc Phosphide Trace Analysis in Agricultural Commodities by
Phosphine Generation, Toluene Trapping, and Gas Chromatography. Journal of Agricultural
and Food Chemistry, 1998. 46(3): p. 999–1004.
18. Allen, S.E., Y.-L. Ren, and J.M. Desmarchelier, Comparison of six methods for determining
aged phosphine residues in wheat. Journal of AOAC International, 1998. 81(3): p. 633–637.
19. Ren, Y.L., B. Padovan, and J.M. Desmarchelier, Evaluation of headspace solid-phase
microextraction for analysis of phosphine residues in wheat. Journal of AOAC International,
2012. 95(2): p. 549–553.
20. Desmarchelier, J.M. and Y.L. Ren, Analysis of fumigant residues - A critical review. Journal
of AOAC International, 1999. 82(6): p. 1261–1280.
21. Amstutz, R., A. Knecht, and D. Andrey, Detection of phosphine residues in organic cereals.
Mitteilungen aus Lebensmitteluntersuchung und Hygiene, 2003. 94(6): p. 603–608.
22. Amrein, T., et al., Determination of phosphine in plant materials: Method optimization and
validation in inter-laboratory comparison tests. Journal of agricultural and food chemistry. in
print.
23. Berck, B., Sorption of Phosphine by Cereal Products. Journal of agricultural and food
chemistry, 1968. 16(3): p. 419–425.
Page 17 / 17
Impressum / Editorial Board
Aspects of food control and animal health
Free eJournal
ISSN: 2196-3460
Volume 2014 Issue 02
Published March 2014
Publisher:
Chemisches und Veterinäruntersuchungsamt Stuttgart
70702 Fellbach
Postfach 12 06
GERMANY
Phone: +49 711 3426 1234
Email: [email protected]
Internet: www.cvuas.de
Images:
Cover: Neatly stacked cargo containers in a variety of colors,
Marcus Lindström, Getty Images, Image-ID: 185208080
V.i.S.d.P: Maria Roth
Editor in Chief: Stefan Böttcher
Layout and Production: Stefan Böttcher, Alexander Scheck
Corporate Design: Maja Lindemann
License: This work is licensed under a Creative Com-
mons Attribution-NonCommercial-NoDerivs 3.0 Un-
ported License.