analysis of liquid droplet erosion for steam turbine blades of composite · pdf...
TRANSCRIPT

214
Int. J. Mech. Eng. & Rob. Res. 2012 Sandeep Soni, 2012
ANALYSIS OF LIQUID DROPLET EROSIONFOR STEAM TURBINE BLADES OF COMPOSITE
MATERIAL
Sandeep Soni1*
*Corresponding Author: Sandeep Soni, [email protected]
The moisture content in steam of low pressure stages of a turbine for a turbo-alternator cancause erosion of the moving blades and the rate of erosion is believed to increase rapidly withincreasing velocity of impact of water droplets on blades. Liquid droplet erosion is one of majorconcerns in the design of modern large fossil steam turbines because it causes seriousoperational problems such as performance degradation and reduction of service life. An erosionmodel has been used to analyze the erosion behavior of Co-Cr alloy coated steam turbineblades of composite material. Various relations have been used to find parameters like: incubationperiod, mass loss rate under changing conditions of steam quality, steam temperature, coatingthickness and diameter of the water droplets. Results have been plotted and discussed, showinga distinct improvement in the erosion characteristics like: incubation period and mass loss ratedue to the application of coating on the turbine blades. Accordingly suitable operational parametershave been defined to obtain the best possible performance of the steam turbine.
Keywords: Steam, Erosion, Turbine blades, Coating thickness
INTRODUCTIONPower shortage in the country due to thetremendous pressure on power generationengineers for generating the cheaper powerwhich leads to the design and development ofmodern large power stations (more than500 MW onwards). These power stations arerun by large steam turbines which require hugequantities of steam. In low pressure stage of
ISSN 2278 – 0149 www.ijmerr.comVol. 1, No. 3, October 2012
© 2012 IJMERR. All Rights Reserved
Int. J. Mech. Eng. & Rob. Res. 2012
1 Mechanical Engineering Department, S.V.N.I.T., Surat 395007, Gujarat, India.
these turbines the steam flows in wetconditions. The water particles thus formedcauses erosion of the blades (Krzyzanowski,1974; and Krzyzanowski and Szperngiel,1978).
A number of investigators have worked bothexperimentally as well as theoretically to finda solution for controlling and curbing the badeffects of erosion. The paper emphasizes the
Research Paper

215
Int. J. Mech. Eng. & Rob. Res. 2012 Sandeep Soni, 2012
use of following parameters like-density, wetsteam quality, impact velocity, size of thedroplet, ultimate tensile strength, thickness ofthe material, impact-pressure, temperatureand viscosity which plays a vital role as far aserosion is concerned (Ansari, 1986; andLeyzerovich, 2008).
On the other hand in the last row of theblades of large steam turbines about 6% ofthe total heat drop of the steam flowing throughthe turbine is converted into mechanicalenergy.
Since these two factors-high output andquality of energy conversion—are alsoinfluenced by the last stage, particular attentionhas been paid to these blades during the fewyears. The steam in last stage bladesbecomes wet and the water particles thusformed can cause pits, cracks in the surfaceor subsurface, or the mass loss of the material.The damage called erosion, weakens thematerial significantly and renders componentsexposed to liquid impingement inefficient oreven useless (Springer, 1976; and Field,1999). Erosion becomes more severe as thelengths and hence tip speeds or the last stageblades increase. It is very important tounderstand the mechanism of erosion and todevelop improved means for controlling it(Adler, 1995).
The production cost of the last stage bladesfor large turbines is very high. Therefore theturbine manufacturers make all the efforts tomanufacture and market a product which willgive a trouble free service for long time. Thus,when designing and manufacturing the L.P.stage blades alone, the factor of erosion isstrongly considered (Moore et al., 1967; andStanisa and Ivusic, 1995).
MECHANISM OF EROSIONIn the low pressure stages of a condensingsteam turbine, steam expands below thesaturation line. Moisture gets precipitated inthe form of drops. It is always desirable topermit as high a degree of wetness aspossible at the exhaust, in order to get morework from steam but pressure of water dropsin the steam gives rise to certain losses whichare most undesirable. Hence, there is apractical limit of wetness in exhaust steam. Themain detrimental effects due to the presenceof water drops in steam are:
1. Reduction of thermodynamic efficiency dueto drag of water drops at high relativespeeds.
2. Erosion of moving blades due toimpingement of water drops at high relativespeeds.
In these two, erosion is more detrimentalsince it not only reduces the life of movingblades but is also deteriorates the efficiencyof the stage (Gillette, 1992).
Water drops present in the steam hit themoving blades with high relative velocitythereby causing impact erosion of movingblades. This erosion is very severe and has avery detrimental effect on the stage efficiency.It is almost universally established that a filmof water exists on the surface of fixed blades.The deposition rate will depend on dropletsizes.
The water on the fixed blades flow to thetrailing edge under the influence of threefactors, force produced by the steam drag, theimpulse of the fog deposition and the pressuredrop along the blade (Ruml and Straka, 1995;and Schofield, 1997). Water, on reaching the

216
Int. J. Mech. Eng. & Rob. Res. 2012 Sandeep Soni, 2012
trailing edge of fixed blades collects into largedrops and those are sprayed off by steam flow.Some of these drops may be too large in sizeto be stable. Drops of size 500 to 1000 m willcome under this category. They do not remainstable and hence, under the influence ofaerodynamic forces and internal flashing theydisintegrate quickly. These drops of twodifferent diameters—one with smallerdiameter, which probably contain much of thegreater weight of water and have samevelocity as that of steam and other with largediameter 100-200 micron or even more up to500 micron and with high relative velocityapproach the moving blades. The drops oflarge diameter will go straight and hit themoving blade, thereby causing erosion ofblades. It is the normal components of impactvelocity against the blade which causeserosion and the tangential component can beignored (Curtis and Dorey, 1989).
EROSION BY LIQUIDDROPLETExperimental evidence indicates that undera wide range of conditions the weight lossof a material subjected to repeatedimpingements of liquid droplets varies withtime as shown in Figure 1. It is shown in thatfor some period of time the weight loss isinsignif icant, this region is known as‘incubation period’. For some time after theincubation period the rate of weight loss isnearly constant and the weight loss varieslinearly with time, this region is designatedas the ‘linear rate erosion’ region. Past thisregion the relationship between the weightloss and the exposure time becomes morecomplex and this region is referred as ‘finalerosion region’. In the present work only theincubation period and the steady rateerosion region has been considered(Byeong et al., 2003).
Figure 1: Erosion Model Showing Different Erosion Region
Number of Impacts per Unit Area, n
Ma
ss
Lo
ss
pe
r U
nit
Are
a, m

217
Int. J. Mech. Eng. & Rob. Res. 2012 Sandeep Soni, 2012
The number of impacts per unit area at theend of incubation period is designated by n
i
and at the end of linear rate erosion region byn
f. For convenience, we assume that the
erosion is uniform across the entire surfacearea and replace the total weight loss of thematerial with the mass loss per unit area ‘m’and ‘n’ as the time parameter. The parameters‘m’ and ‘n’ are represented in Figure 1.According to this the mass loss is specifiedby the expressions:
m = 0, n < ni
m = (n – ni), n
i < n < n
f
The material loss ‘m’ produced by a certainnumber of impacts ‘n’ can be calculated oncethe incubation period n
i and the rate of
subsequent mass loss (as characterized bythe slope ) are known. The Figure 1 shows,the different regimes of erosion, which areimportant for analysis of steam turbine blades.Therefore, the problem is to determine theparameters n
i, and n
f.
EROSION OF COMPOSITEMATERIALSComposite materials have been receivingever-wider application due to their highstrength-to-weight ratio, good magnetic andoptical properties and satisfactoryperformance at elevated temperatures. Inorder to utilize the full capability of compositematerials, the response of compositematerials to liquid droplet erosion is analyzedby using mathematical relations. Fiber-reinforced composite material composed ofunidirectional filaments embedded in a matrixas shown in Figure 2, which is covered by acoating made of a homogeneous material.
Wave reflections will be neglected inuncoated composites and in the substrate ofcoated composites. Composite materials,which are unable to withstand the damagecaused by rain impact, can frequently beprotected and their usefulness extended by aprotective layer of homogeneous materialcoating. However, the coating cannot beselected randomly. Coatings provide optimumprotection only if they are made of the propermaterial and are of the proper thickness.
The material to be studied is a fiberreinforced substrate h
s (Boron-Epoxy) covered
by a single layer of coating (Co-Cr alloy) of thecoating thickness h
c, as shown in Figure 3.
Figure 2: Droplet Impingementson Uncoated Composite Material
Figure 3: Droplet Impingementson Coated Composite Material

218
Int. J. Mech. Eng. & Rob. Res. 2012 Sandeep Soni, 2012
Composite materials may be constructedin different ways. The erosion of compositesunder study in which:
• Fibers are randomly distributed.
• Fibers are not continuous.
• Fibers are parallel to the surface.
• There is a perfect bond between the matrixand the fibers and, in case of coatedcomposites, between the coating and thesubstrate.
In this the composite as homogeneous, weare neglecting the effect of microstructure onthe erosion phenomenon.
Most uncoated composites have relativelypoor resistance to erosion and must be coatedfor protection (Springer and Yang, 1975; andStanisa, 2003).
RELATIONS USED INANALYSIS
Relations Used for UncoatedComposite Material (Matrix-Epoxy,Fiber-Boron)
Following relationships are used for uncoatedcomposite materials to calculate the requiredincubation time and mass loss for the substratematerial (Springer, 1976).
Strength of the uncoated composite materialsubstrate is given by:
11
12
122211
21
8
111
8
314
EGEEE
bS
m
mumr
11
122211
12
11
12 1121
4
12
GEEE
…(1)
Impact pressure at surface of substrate isgiven by:
SSLL
LL
CC
VCP
1
cos1000 …(2)
Velocity of steam turbine blade is given by:
sec/60
mDN
V
…(3)
Number of droplets per unit volume ofsteam is given by
steammdrpletsd
q 33
9
/106
…(4)
Number of impacts per unit area during theincubation period on the surface of substratematerial is given by:
27.5
2/
9.8mimpacts
P
S
dn r
i
…(5)
Incubation time is given by:
seccosVq
nt i
i …(6)
Rate of mass loss of the substrate materialis given by:
impactskgS
Pd
rs /103.73
4
36
…(7)
Mass loss of the substrate material is givenby:
2/ mimpactVqtn it …(8)
2/ mkgnnm it …(9)
Relations Used for CoatingMaterial (Co-Cr alloy)
Following relationships are used for coatingmaterial to calculate the required incubation

219
Int. J. Mech. Eng. & Rob. Res. 2012 Sandeep Soni, 2012
time and mass loss for the coating material(Springer, 1976).
Impedance of the coating material is given by:
sec/ 2cmgCZ …(10)
Stress at the liquid-coat interface at theinstant of impact is given by:
2/1
cos1000 mN
CC
VCP
CCLL
LL
…(11)
Strength of the coating material is given by:
2/21
1
21
14mN
k
bS
SCc
cucec
…(12)
Number of impacts per unit area during theincubation period on the surface of coatingmaterial is given by:
2
7.5
02/
9.8mimpacts
S
dn ec
ic
…(13)
Incubation time is given by:
seccosVq
nt ic
ic …(14)
Rate of Mass loss of coating material isgiven by:
impactkgS
dec
cc /103.730
36
…(15)
Mass loss of coating material is given by:
2/ mimpactVqtn ictc …(16)
2/ mkgnnm ictccc …(17)
DATA USED IN ANALYTICALSTUDYThe following data’s are used in calculation oferosion parameters for steam turbine bladesof composite material. The values in Table 1.
are the inputs for computer program for theprediction of erosion behavior of steam turbineblades.
Parameters Values
Speed of turbine (N) 3000 r.p.m.
Size of LP stage blades (D) 0.35, 0.40, 0.45, 0.50,0.55 m
Velocity of blades (V) 109.9, 125.66, 141.37,157.08, 172.79 m/s
Steam quality (x) 0.96, 0.97, 0.98
Steam temperature (T) 140 ºC, 150 ºC, 160 ºC
Size of water droplets (d) 0.05, 0.075, 0.10, 0.125,0.15 mm
Thickness of Co-Cr alloycoating (h
c) 0.2, 0.3, 0.4 mm
Table 1: Data Used in Analysis
Properties of Coating andSubstrate
The material properties of coating (Co-Cr alloy)and substrate (Boron-Epoxy) are listed inTables 2 and 3 respectively.
Ultimate tensile strength uc
= 9.65 108 N/m2
Endurance limit I = 4.83 108 N/m2
Poisson’s ratio c = 0.3
Density c = 8230 kg/m3
L = 1000 kg/m3
Speed of sound Cc = 5100 m/s
CL = 1463 m/s
Modulus of elasticity E = 2.07 1011 N/m2
Constant bc = 20.9
Table 2: Material Propertiesof Co-Cr Alloy (Coating)
Ultimate tensile strength ofmatrix
um = 5.79 107 N/m2
Poisson’s ratio 12
= 0.22
Fiber content f = 0.63
Table 3: Material Propertiesof Boron-Epoxy (Substrate)

220
Int. J. Mech. Eng. & Rob. Res. 2012 Sandeep Soni, 2012
RESULTS AND DISCUSSIONThe computer program has been made byusing the above mentioned relationships foruncoated and coated blades of boron-epoxy.By using the value of properties of boron-epoxy(as substrate) and cobalt-chromium alloy (ascoating material), results have been computedin form of tables and graphs. In the present
analysis the computed results have beenplotted between various erosion parameterslike mass loss, incubation time, dropletdiameter, coating thickness of blade materialand dryness fraction of steam. The curves havebeen drawn for the uncoated and coatedblades of boron-epoxy. For a realisticapproach to meet the latest trend in the powerindustry, boron-epoxy has been selected assubstrate material while the coating materialselected as cobalt-chromium alloy on boron-epoxy. The results have been presented ingraphs from Figures 4 to 9 for the selectedsubstrate and coating material. The selectedvalues of water droplet diameters (d) are 0.05,0.075, 0.10, 0.125 and 0.15 mm. Thetemperature of steam (T) is taken as 140 °C,150 °C and 160 °C. The dryness fraction ofsteam (x) is taken as 96%, 97% and 98%. Forthe coated blades, the coating thickness (h
c)
Density s = 2190 kg/m3
L = 1000 kg/m3
Speed of sound CS = 3327 m/s
CL = 1463 m/s
Modulus of elasticity Em = 2.21 1010 N/m2
E11
= 2.07 1011 N/m2
E22
= 2.07 1010 N/m2
Modulus of rigidity G12
= 6.89 1009 N/m2
G23
= 5.52 1009 N/m2
Constant bm = 20.9
Table 3 (Cont.)
Figure 4: Mass Loss vs. Incubation Time for Uncoated B-E Blades
Incubation Time (sec)
Ma
ss
Lo
ss
(k
g)
Boron-Epoxy (Uncoated)
Note: T = 140 °C, x = 0.96, d = 0.05 mm and V = 109.96 m/s.

221
Int. J. Mech. Eng. & Rob. Res. 2012 Sandeep Soni, 2012
values are 0.2, 0.3, 0.4 mm. The Figure 4shows the variation of mass loss andincubation time for uncoated boron-epoxyblades, with an increase in the velocity ofblades from 109.96 m/sec to 172.79 m/sec,the incubation time is reduced and the massloss of substrate material increases linearlywith an increase in incubation time.
The Figure 5 shows the variation of massloss and incubation time for boron-epoxyblades coated with Co-Cr alloy. There is asubstantial increase in the incubation timeand also the mass loss is much less, forcoated blades. The incubation time alsoincreases with an increase in the coatingthickness.
The Figure 6 shows the variation ofincubation time and droplet diameter at T =140 °C, x = 0.96 for coated boron-epoxy blade
material. As the droplet diameter increasesfrom 0.05 mm to 0.15 mm, the incubation timealso increases as velocity of blade changesfrom 109.96 to 172.79 m/sec.
The Figure 7 shows the variation ofincubation time and coating thickness at T =140 °C, x = 0.98, V = 125.66 m/sec, theincubation time increases with an increase inthe coating thickness. This figure clearly showsthat as we are increasing the coating thicknessfrom 0.2 mm to 0.4 mm there is a very muchreduction in the mass loss of the material.
The Figure 8 shows the variation ofincubation time and dryness fraction foruncoated and Co-Cr alloy coated boron-epoxyblades at T = 140 °C, d = 0.05 mm, V = 109.96m/sec. The incubation time increases with anincrease in dryness fraction from 96% to 98%and the rate of increase of incubation time is
Figure 5: Mass Loss vs. Incubation Time for Co-Cr Alloy Coated B-E Blades
Incubation Time (sec)
Ma
ss
Lo
ss
(k
g)
Boron-Epoxy-CoCr (Coated)
Note: T = 140 °C, x = 0.96, d = 0.05 mm, V = 109.96 m/s and hc = 0.2 mm.

222
Int. J. Mech. Eng. & Rob. Res. 2012 Sandeep Soni, 2012
Figure 6: Incubation Time vs. Droplet Diameter for Co-Cr Alloy Coated B-E Blades
Droplet Diameter (mm)
Inc
ub
ati
on
Tim
e (s
ec
)
Incubation Time vs. Droplet Diameter B-E-CoCr-02 (Coated)
Note: T = 140 °C and x = 0.96.
Figure 7: Incubation Time vs. Coating Thickness Co-Cr Coated B-E Blades
Coating Thickness hc (mm)
Inc
ub
ati
on
Tim
e (s
ec
)
Incubation Time vs. Coating Thickness (B-E-CoCr)
Note: T = 140 °C and x = 0.98.

223
Int. J. Mech. Eng. & Rob. Res. 2012 Sandeep Soni, 2012
Figure 8: Incubation Time vs. Dryness Fraction for Uncoated and Coated B-E Blades
Dryness Fraction (x)
Inc
ub
ati
on
Tim
e (s
ec
)
Incubation Time vs. Dryness Fraction (B-E, B-E-CoCr)
Note: T = 140 °C, d = 0.05 mm and V = 109.96 m/s.
Figure 9: Mass Loss vs. Incubation Time for Uncoated and Coated B-E Blades
Incubation Time (sec)
Ma
ss
Lo
ss
(k
g)
Incubation Time vs. Coating Thickness (B-E-CoCr)
Note: T = 140 °C, x = 0.96, d = 0.05 mm and V = 109.96 m/s.
224
Int. J. Mech. Eng. & Rob. Res. 2012 Sandeep Soni, 2012
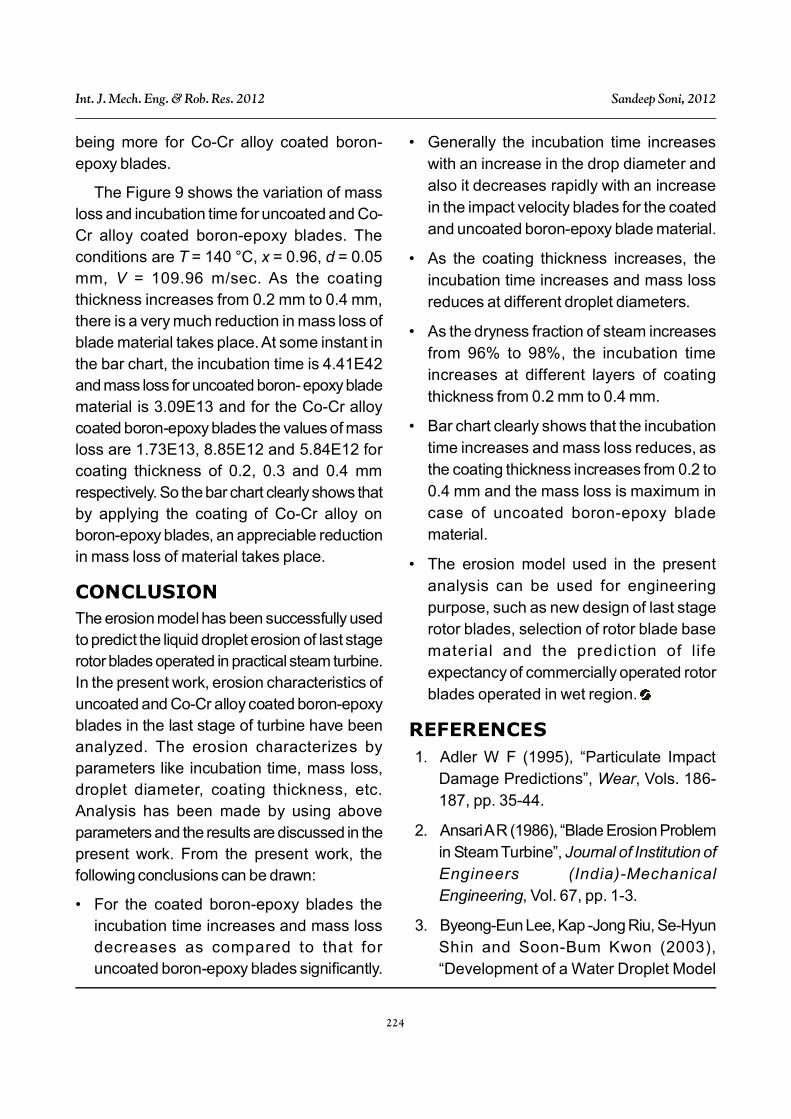
being more for Co-Cr alloy coated boron-epoxy blades.
The Figure 9 shows the variation of massloss and incubation time for uncoated and Co-Cr alloy coated boron-epoxy blades. Theconditions are T = 140 °C, x = 0.96, d = 0.05mm, V = 109.96 m/sec. As the coatingthickness increases from 0.2 mm to 0.4 mm,there is a very much reduction in mass loss ofblade material takes place. At some instant inthe bar chart, the incubation time is 4.41E42and mass loss for uncoated boron- epoxy bladematerial is 3.09E13 and for the Co-Cr alloycoated boron-epoxy blades the values of massloss are 1.73E13, 8.85E12 and 5.84E12 forcoating thickness of 0.2, 0.3 and 0.4 mmrespectively. So the bar chart clearly shows thatby applying the coating of Co-Cr alloy onboron-epoxy blades, an appreciable reductionin mass loss of material takes place.
CONCLUSIONThe erosion model has been successfully usedto predict the liquid droplet erosion of last stagerotor blades operated in practical steam turbine.In the present work, erosion characteristics ofuncoated and Co-Cr alloy coated boron-epoxyblades in the last stage of turbine have beenanalyzed. The erosion characterizes byparameters like incubation time, mass loss,droplet diameter, coating thickness, etc.Analysis has been made by using aboveparameters and the results are discussed in thepresent work. From the present work, thefollowing conclusions can be drawn:
• For the coated boron-epoxy blades theincubation time increases and mass lossdecreases as compared to that foruncoated boron-epoxy blades significantly.
• Generally the incubation time increaseswith an increase in the drop diameter andalso it decreases rapidly with an increasein the impact velocity blades for the coatedand uncoated boron-epoxy blade material.
• As the coating thickness increases, theincubation time increases and mass lossreduces at different droplet diameters.
• As the dryness fraction of steam increasesfrom 96% to 98%, the incubation timeincreases at different layers of coatingthickness from 0.2 mm to 0.4 mm.
• Bar chart clearly shows that the incubationtime increases and mass loss reduces, asthe coating thickness increases from 0.2 to0.4 mm and the mass loss is maximum incase of uncoated boron-epoxy bladematerial.
• The erosion model used in the presentanalysis can be used for engineeringpurpose, such as new design of last stagerotor blades, selection of rotor blade basematerial and the prediction of lifeexpectancy of commercially operated rotorblades operated in wet region.
REFERENCES1. Adler W F (1995), “Particulate Impact
Damage Predictions”, Wear, Vols. 186-187, pp. 35-44.
2. Ansari A R (1986), “Blade Erosion Problemin Steam Turbine”, Journal of Institution ofEngineers (India)-MechanicalEngineering, Vol. 67, pp. 1-3.
3. Byeong-Eun Lee, Kap -Jong Riu, Se-HyunShin and Soon-Bum Kwon (2003),“Development of a Water Droplet Model

225
Int. J. Mech. Eng. & Rob. Res. 2012 Sandeep Soni, 2012
for Large Steam Turbine Blades”, KSMEInternational Journal, Vol. 17, No. 1,pp. 114-121.
4. Curt is P T and Dorey G (1989),“Fatigue of Composite Materials”,Proc. Instn. of Mech. Engrs., Vol. 203,No. G1, pp. 31-37.
5. Field J E (1999), “Liquid Impact: Theory,Experiment, Applications”, Wear, Vols.233-235, pp. 1-12.
6. Gillette S M (1992), “End-UseApplications for Coated Fabrics”, Journalof Coated Fabrics, p. 22.
7. Krzyzanowski J (1974), “CorrelationBetween Droplets Steam Structure andSteam Turbine Blading Erosion”, ASMEJournal of Engineering for Power,Vol. 96, pp. 256-266.
8. Krzyzanowski J and Szperngiel Z (1978),“The Influence of Droplet Size on TurbineBlading Erosion Hazard”, ASME Journalof Engineering for Power, Vol. 100,pp. 561-565.
9. Leyzerovich A S (2008), Steam Turbinesfor Modern Fossil Fuel Power Plant, TheFairmont Press Inc., Georgia, USA.
10. Moore M J, Langford R W and Tipping JC (1967), “Research at C E R L on TurbineBlade Erosion”, Proc. Instn. Mech.Engrs., Vol. 182, No. 3H, pp. 61-68.
11. Ruml Z and Straka F (1995), “A New Modelfor Steam Turbine Blade Materials Erosion”,Wear, Vols. 186-187, pp. 421-424.
12. Schofield P (1997), “Steam TurbineSustained Efficiency”, GER- 375 °C,Technical Report of GE Power Systems.
13. Springer G S (1976), Erosion by LiquidImpact, John Wiley & Sons, New York,USA.
14. Springer G S and Yang C I (1975), “AModel for the Rain Erosion of FiberReinforced Composites”, AIAA Journal,Vol. 13, pp. 877-883.
15. Stanisa B and Ivusic V (1995), “ErosionBehavior and Mechanism for SteamTurbine Rotor Blades”, Wear, Vols. 186-187, pp. 395-400.
16. Stanisa B, Schauperl Z and Grilec K(2003), “Erosion Behavior of TurbineRotor Blades Installed in the KrskoNuclear Power Plant”, Wear, Vol. 254,pp. 735-741.

226
Int. J. Mech. Eng. & Rob. Res. 2012 Sandeep Soni, 2012
A – Area of the surface [m2]
b – Constant for substrate material [–]
Cs
– Velocity of sound in substrate material [ms–1]
CL
– Velocity of sound in liquid material [ms–1]
Cc
– Velocity of sound in coating material [ms–1]
d – Droplet diameter [mm]
D – Rotor blade dia. [m]
E – Young’s modulus [Nm–1]
E11
– Longitudinal young’s modulus [Nm–2]
E22
– Transverse young’s modulus [Nm–2]
G12
– Longitudinal shear modulus [Nm–2]
G23
– Transverse shear modulus [Nm–2]
hc
– Thickness of coating material [mm]
m – Mass loss/unit area [kg m–2]
n – Number of impacts per unit area [impact m–2]
ni
– Number of impacts per unit area during the incubation period [impact m–2]
nf
– Number of impacts per unit area prior to final erosion region [impact m–2]
P – Impact pressure [Nm–2]
q – Number of droplets per unit volume of steam [droplets m–3]
Sr
– Strength for uncoated composite [Nm–2]
Sec
– Strength for the coating [Nm–2]
ti
– Incubation time [sec]
u
– Ultimate tensile strength for substrate material [Nm–2]
I
– Endurance limit [Nm–2]
V – Relative velocity between surface and impacting droplet [ms–1]
x – Steam quality [%]
Z – Impedance [g.s cm–2]
– Rate of mass loss [kg impact–1]
– Poisson’s ratio for substrate material [–]
– Angle of impact [0]
L
– Density of liquid [kg m–3]
s
– Density of substrate material [kg m–3]
c
– Density of coating material [kg m–3]
APPENDIX
Nomenclature