analysis of academy school performance in 2015 · analysis of academy school performance in 2015...
TRANSCRIPT
Report
Analysis of Academy School Performance in 2015
National Foundation for Educational Research (NFER)

Analysis of Academy School Performance in 2015
Jack Worth
Published in June 2016 By the National Foundation for Educational Research, The Mere, Upton Park, Slough, Berkshire SL1 2DQ www.nfer.ac.uk © 2016 National Foundation for Educational Research Registered Charity No. 313392 ISBN 978-1-911039-15-0
How to cite this publication: Worth, J. (2016). Analysis of Academy School Performance in 2015 (LGA Research Report). Slough: NFER.
Contents
Executive summary v
1 Introduction 1
1.1 Policy context 1 1.2 Previous research 2 1.3 Aims of this research 3
2 Methodology and data 5
2.1 Methodology 5 2.2 Data sources 10
3 Secondary sponsored academies 12
3.1 Key findings 12 3.2 Findings 12
4 Secondary converter academies 19
4.2 Key findings 19 4.2 Findings 19
5 Primary sponsored academies 27
5.1 Key findings 27 5.2 Findings 27
6 Primary converter academies 31
6.1 Key findings 31 6.2 Findings 31
7 Discussion 36
References 37
Appendix A 39
Methodology 39 Matching analysis 43

Analysis of Academy School Performance in 2015 v
Executive summary
Academy schools are independent primary and secondary schools that are directly funded
by the Department for Education (DfE) rather than local authorities. Academies have the
ability to teach a different curriculum than the national curriculum, are not bound by the
school teachers’ pay and conditions document and set their own admissions policy. Many
obligations still apply to academies such as statutory testing, regular inspection by Ofsted,
providing a broad and balanced curriculum including English, maths and science, and
compliance with the school admissions code.
The number of academy schools has grown rapidly since 2010 to 4,922 schools in February
2016, comprising 65 per cent of secondary schools and 18 per cent of primaries (see Figure
1). The first academies in the mid to late 2000s were sponsored academies, under-
performing schools whose running is taken over by a sponsor. Now 65 per cent of
academies are converter academies, maintained schools deemed to be high-performing1
that chose to become academies.
Figure 1 Number of academies open in England 2002/03 – 2015/16
Note: *2015/16 figures cover September 2015 - February 2016.
Source: DfE, 2016a
The Government has announced an ambition for every school to become an academy,
which would end the funding relationship between schools and local authorities (DfE, 2016d
& 2016e). A national funding formula, to be fully introduced from 2020, will also remove local
1 “Schools that want to convert to an academy will need to demonstrate that they are in a strong
enough position to do so. [The Department for Education] will look at: your school’s exam results from the last 3 years; the progress your pupils have been making over the last 3 years; your most recent Ofsted inspections; your school’s finances.” DfE (2016c)
0
1,000
2,000
3,000
4,000
5,000
6,000
Nu
mb
er
of
acad
em
y s
ch
oo
ls i
n E
ng
lan
d
Year of academy opening
Primary converter
Primary sponsored
Secondary converter
Secondary sponsored

vi Analysis of Academy School Performance in GCSEs 2014
authorities’ role in distributing schools block funding to each maintained school. Measures in
the 2016 Education and Adoption Act (England. Statutes, 2016) extend the programme of
sponsored academy conversions by placing an ‘academy order’ on all maintained schools
that are inadequate, and ‘coasting’2 schools will be eligible for intervention, including the
discretionary power to make an academy order on maintained schools.
Research has found that pupil performance in the early sponsored academies significantly
improved after changing their status, compared with a group of maintained schools with
similar characteristics (Machin and Vernoit, 2011). More recent research has found that
short-term improvements in attainment progress made by pupils in academies opened since
2010 has been more modest compared with similar maintained schools (Worth, 2015).
There is, at present, no convincing evidence of the impact of academy status on attainment
in primary schools (GB. Parliament. HoC. Education Select Committee, 2015). This report
contributes to this research gap, measuring the impact that academy status has had on pupil
attainment in primary schools using a ‘like-with-like’ methodology which compares similar
schools.
This report explores the association between academy status for primary and secondary
schools and the attainment of pupils in 2015 Key Stage 2 (KS2) statutory assessment and
GCSE exams. It compares academies that have been open for between two and five years
with a group of schools that are still local authority-maintained schools in 2015 and had
similar characteristics at the time the schools became academies. The analysis compares
average school performance using several attainment measures, differences according to
the length of time the school has been an academy, and the average performance of
disadvantaged pupils. It also compares the most recent Ofsted ratings of academies with
those of similar maintained schools.
Findings – secondary schools
The differences between secondary academies and similar maintained secondary schools,
after taking account of the characteristics of pupils sitting GCSEs in 2015, are summarised in
Table 1.
The differences in school GCSE performance between secondary sponsored academies
that have been open for between two and five years and a group of similar maintained
schools are generally small and mostly not statistically significant.
The average Key Stage 4 (KS4) point score from pupils’ best eight GCSEs is two-thirds of a
GCSE grade per pupil higher in sponsored academies than in similar maintained schools,
although the difference is not statistically significant.
The proportion of pupils achieving five or more A*-C grade GCSEs including English and
maths is 2.7 percentage points higher in secondary sponsored academies than in similar
maintained schools. This is statistically significant and equivalent to around five additional
pupils out of a typical secondary school cohort of 180 pupils achieving the five A*-C
threshold.
2 Definition of coasting for primary and secondary schools in DfE (2015a).

Analysis of Academy School Performance in 2015 vii
The average Key Stage 4 point score excluding equivalent qualifications is no different in
sponsored academies than in similar maintained schools, which suggests that sponsored
academies make slightly more use of equivalent qualifications3.
Although there is tentative evidence of a trend towards greater improvement the longer a
sponsored academy is open, there could be several explanations for this. It could, for
example, reflect academy status taking time to ‘bed in’ before having an effect on pupil
attainment. The amount of DfE funding available to sponsors when a school became a
sponsored academy also reduced by 83 per cent between 2010 and 2014 (NAO, 2014). This
could have reduced the ability of sponsors to drive substantial school improvement.
The differences in school GCSE performance between secondary converter academies
that have been open for between two and five years and a group of similar maintained
schools are statistically significant in favour of academies, although the differences are
small. The average Key Stage 4 point score from pupils’ best eight GCSEs is one-third of a
GCSE grade per pupil higher in converter academies than in similar maintained schools.4
The average differences in attainment between sponsored and converter academies and
similar maintained schools seem very small compared with how much attainment varies
between schools. Academy status explains very little of the between-school variation in pupil
progress.
Both sponsored and converter academies are significantly more likely to be rated by Ofsted
as outstanding, or as good or outstanding and sponsored academies are significantly less
likely to be rated as inadequate, than similar maintained schools. However, this analysis is
based only on those schools that have been re-inspected since 2012, which means many
(307 out of 979) converter academies are excluded. Analysis of missing Ofsted inspection
data suggest that this introduces some bias to the comparisons, but confirms that converter
academies are significantly more likely to be rated by Ofsted as good or outstanding.
There is no compelling evidence of academy status being associated with an improvement
in the performance of pupils eligible for free school meals (FSM) in secondary schools.
3 This result is also consistent with pupils in sponsored academies having better attainment in their
equivalent qualifications. 4 The size of the average difference in Key Stage 4 point score between sponsored academies and
similar maintained schools is larger than that between converter academies and similar maintained schools, although the former is not statistically significant and the latter is statistically significant. The number of converter academies analysed was much larger so the differences were estimated with a greater amount of precision.

viii Analysis of Academy School Performance in GCSEs 2014
Table 1 Summary of secondary school academy analysis findings
Sponsored academies vs similar
maintained schools Converter academies vs similar
maintained schools
Average capped point score Two thirds of a GCSE grade per pupil higher in academies
One third of a GCSE grade per pupil higher in academies
Proportion of pupils achieving 5+A*-C (incl. English & maths)
2.7 percentage points higher in academies
1.1 percentage points higher in academies
Average capped point score (GCSE only) Negligible difference Negligible difference
Value-added (KS2-KS4) Two thirds of a GCSE grade per pupil higher in academies
One third of a GCSE grade per pupil higher in academies
Average capped point score (FSM pupils) One GCSE grade per pupil higher in academies
One third of a GCSE grade per pupil higher in academies
Average capped point score (FSM gap) Gap two-thirds of a GCSE grade per pupil narrower in academies
Negligible difference
Number of schools analysed 151 sponsored academies
252 similar maintained schools
979 converter academies
996 similar maintained schools
Proportion of schools Ofsted outstanding 5.4 percentage points higher in academies
4.9 percentage points higher in academies
Proportion of schools good or outstanding 13 percentage points higher in academies
6.4 percentage points higher in academies
Proportion of schools inadequate 11.6 percentage points lower in academies
0.8 percentage points higher in academies
Number of schools analysed 150 sponsored academies
243 similar maintained schools
672 converter academies
832 similar maintained schools
Cells highlighted in blue indicate where, after taking account of pupil characteristics such as prior attainment and the proportion of pupils eligible for free school meals, the difference between academies and a group of similar maintained schools is statistically significant.
Findings – primary schools
The differences between primary academies and similar maintained primary schools, after
taking account of the characteristics of pupils taking Key Stage 2 tests in 2015, are
summarised in Table 2.
The differences in school Key Stage 2 (KS2) performance between primary sponsored and
converter academies that have been open for between two and three years and a group of
similar maintained schools are small and not statistically significant.
The average Key Stage 2 point score is 0.12 points per pupil higher in primary sponsored
academies than in similar maintained schools. The difference is not statistically significant.
One key stage level equates to six points, so an increase of 0.12 points is equivalent to one
additional pupil out of every 50 pupils achieving an extra level at Key Stage 2. The average
proportion of pupils eligible for free school meals who achieve National Curriculum (NC)
level 4 (the expected standard for most pupils) in sponsored academies is 2.1 percentage
points higher than in similar maintained schools, although the difference is also not
statistically significant.
The average Key Stage 2 point score is 0.06 points per pupil higher in primary converter
academies than in similar maintained schools, and the average proportion of pupils eligible
for free school meals who achieve level 4 in converter academies is 0.4 percentage points

Analysis of Academy School Performance in 2015 ix
higher than in similar maintained schools. However, neither of these differences is
statistically significant.
Both sponsored and converter primary academies are more likely than similar maintained
schools to be rated by Ofsted as outstanding and this difference is statistically significant. By
contrast, although both sponsored and converter academies are slightly more likely to be
rated as good or outstanding, and rated as inadequate, than similar maintained schools, the
differences are not statistically significant. This analysis is based only on those schools that
have been re-inspected since 2012, which means many converter academies are excluded.
Analysis of missing Ofsted inspection data suggests that this introduces some bias to the
comparisons and that while converter academies are more likely to be rated by Ofsted as
outstanding, the difference is not statistically significant.
There is no compelling evidence of academy status being associated with an improvement
in the performance of pupils eligible for free school meals in primary schools.
Table 2 Summary of primary school academy analysis findings
Sponsored academies vs
similar maintained schools Converter academies vs similar
maintained schools
Average point score One extra pupil per 50 achieving one NC level higher in academies
One extra pupil per 100 achieving one NC level higher in academies
Proportion of pupils achieving NC level 4 1.2 percentage points per pupil higher in academies
0.9 percentage points per pupil higher in academies
Proportion of pupils achieving NC level 4b 1.7 percentage points per pupil higher in academies
1 percentage point per pupil higher in academies
Value-added (KS1-KS2) One extra pupil per 50 achieving one NC level higher in academies
One extra pupil per 100 achieving one NC level higher in academies
Proportion of pupils achieving NC level 4 (FSM pupils) 2.1 percentage points per pupil higher in academies
0.4 percentage points per pupil higher in academies
Proportion of pupils achieving NC level 4 (FSM gap) Gap 1.6 percentage points per pupil narrower in academies
Gap 0.7 percentage points per pupil wider in academies
Number of schools analysed 362 sponsored academies
849 similar maintained schools
807 converter academies
3208 similar maintained schools
Proportion of schools Ofsted outstanding 5.5 percentage points higher in academies
5.2 percentage points higher in academies
Proportion of schools good or outstanding 4.4 percentage points higher in academies
3.5 percentage points higher in academies
Proportion of schools inadequate 3.6 percentage points higher in academies
0.4 percentage points higher in academies
Number of schools analysed 344 sponsored academies
822 similar maintained schools
487 converter academies
2360 similar maintained schools
Cells highlighted in blue indicate where, after taking account of pupil characteristics such as prior attainment and the proportion of pupils eligible for free school meals, the difference between academies and a group of similar maintained schools is statistically significant.

x Analysis of Academy School Performance in GCSEs 2014
Conclusions
This analysis has found no evidence that, in the short term, academies of any phase or type
are performing at a lower level of pupil performance than similar maintained schools. Most of
the attainment measures analysed are, on average, slightly higher in academies than in
similar maintained schools, but the differences are generally small and many are not
statistically significant.
This analysis has found an association between academy status and subsequent Ofsted
ratings. Academies of both phases and types are significantly more likely to be rated as
outstanding, although this finding is less robust for converter academies because many have
not been re-inspected since becoming an academy. This may reflect an improvement in
teaching and leadership practices in academies, which may lead to improvements in pupil
attainment over the longer term. However, previous research has found that a school’s
Ofsted rating is not a good predictor of future improvements in pupil attainment (Education
Datalab, 2016).
Based on the performance of existing academies, this evidence suggests that making all
remaining local authority-maintained schools into academies is likely to make little difference
to pupil performance, at least in the first few years. Indeed, the vast majority of new
academies would be primary schools, and this analysis has found no compelling evidence
that academy status in primary schools is associated with improved pupil performance in the
short term. This raises questions about whether all schools becoming academies is the best
use of resources.
The average differences in attainment between academies and similar maintained schools
are very small when compared with how much attainment varies between all schools.
Academy status explains very little of the between-school variation in pupil progress.
Therefore, research that explores the reasons why pupil progress differs between schools,
whether they are academies or maintained schools, will continue to be important for
understanding what leads to school improvement.

Analysis of Academy School Performance in GCSEs 2014 1
1 Introduction
1.1 Policy context
Academy schools are independent primary and secondary schools that are directly funded
by the Department for Education (DfE) rather than local authorities. Some academy schools
are run by sponsors, which manage a number of academy schools and usually delegate
some management functions to a board of governors. As of February 2016, there are 4922
academies in England5 (DfE, 2016a). Academies comprise 65 per cent of secondary schools
and 18 per cent of primaries.
Academies have the ability to teach a different curriculum than the national curriculum, are
not bound by the school teachers’ pay and conditions document and set their own
admissions policy. Many obligations still apply to academies such as statutory testing,
regular inspection by Ofsted, providing a broad and balanced curriculum including English,
maths and science, and compliance with the school admissions code. Academies receive
funding for central services that local authorities provide to maintained schools, such as
school improvement, audit and asset management services, directly from central
government through the education services grant (DfE, 2014a).
Academy schools have been part of the school landscape in England for more than a
decade. The academy school programme began under the Labour Government in the early
2000s. The programme involved replacing poorly performing inner city secondary schools
with an academy, aiming to increase school performance by introducing new management.
The policy broadened later in the 2000s to replace poorly performing schools beyond inner
city areas. These early academies have since become known as ‘sponsored’ academies, to
distinguish them from later, ‘converter’ academies, and because they are run by a sponsor.
Sponsors are organisations such as charities, businesses or religious organisations, which
are directly responsible for running a school or a group of schools.
Under the Coalition Government from 2010 the number of new academies increased much
more rapidly (see Figure 1.1). Schools that could demonstrate that they were high-
performing according to their school performance data and / or Ofsted rating were given the
opportunity to convert to academy status (so-called ‘converter’ academies).
The Government has announced an ambition for every school to become an academy,
which would end the funding relationship between schools and local authorities (DfE, 2016d
& 2016e). A national funding formula, to be fully introduced from 2020, will also remove local
authorities’ role in distributing schools block funding to each maintained school. Measures in
the 2016 Education and Adoption Act (England. Statutes, 2016) will place an ‘academy
order’ on all maintained schools that are inadequate, and make ‘coasting’6 schools eligible
5 Mainstream primary and secondary schools with a maintained predecessor school: excludes free
schools, studio schools, UTCs, and alternative provision and special academies. 6 DfE (2015a): “For secondary schools, a school will be ‘coasting’ if in 2014 and 2015 fewer than 60%
of children achieve 5 A* to C including English and mathematics and they are below the median level of expected progress and in 2016 they fall below a level set against the new progress 8 measure.

2 Analysis of Academy School Performance in GCSEs 2014
for intervention, including the discretionary power to make an academy order on maintained
schools.
Figure 1.1 Number of academies open in England 2002/03 – 2015/16
Note: *2015/16 figures cover September 2015 - February 2016.
Source: DfE (2016a).
1.2 Previous research
Previous research on the impact of academy schools has considered the question that is
central to this report: what impact did academy status have on the attainment of pupils in the
schools that became academies? Most of that research has concentrated on the early
academies. Machin and Vernoit (2011) found that pupil performance in early sponsored
academies significantly improved after changing their status, compared with a group of
maintained schools with similar characteristics. As would be expected with a whole-school
intervention, the effect of academy status took time to improve performance: the academies
open for longer showed the most significant improvement.
The intake of Year 7 pupils in the new secondary academies had higher average end-of-Key
Stage 2 attainment scores than the predecessor school (Wilson, 2011), although this only
explains part of the later improvement in these pupils’ GCSE attainment in academies.
Machin and Vernoit (2011) also found wider effects on neighbouring schools: despite a drop
This level will be set after 2016 results are available to ensure it is set at a suitable level. A school will have to be below those levels in all 3 years to be defined as ‘coasting’. By 2018 the definition of ‘coasting’ will be based entirely on Progress 8 and will not have an attainment element. “At primary level the definition will apply to those schools who for the first 2 years have seen fewer than 85% of children achieving level 4, the secondary-ready standard, in reading, writing and maths, and which have also seen below-average proportions of pupils making expected progress between age 7 and age 11, followed by a year below a ‘coasting’ level set against the new accountability regime which will see children being expected to achieve a new higher expected standard and schools being measured against a new measure of progress.”
0
1,000
2,000
3,000
4,000
5,000
6,000
Nu
mb
er
of
acad
em
y s
ch
oo
ls i
n E
ng
lan
d
Year of academy opening
Primary converter
Primary sponsored
Secondary converter
Secondary sponsored

Analysis of Academy School Performance in GCSEs 2014 3
in the intake ability (measured by average Key Stage 2 scores) of neighbouring schools,
GCSE results in neighbouring schools modestly improved too. Other research also found
that sponsored academies improved faster than other similar maintained schools during the
period 2002-2009 (NAO, 2010; DfE, 2012).
NFER analysis on exam performance in academy schools that have opened since 2010 has
found that attainment progress made by pupils in sponsored academies that had been open
for between two and four years was much smaller than that identified in previous research
(Worth, 2015). Although the percentage of pupils who achieved five or more A* to C grades
including English and maths was higher in sponsored academies than in similar maintained
schools, the difference was modest (three percentage points higher in academies) and the
difference in Key Stage 4 points was not statistically significant. There was no short-term
improvement in school performance associated with converter academy status.
Department for Education research found that converter academies previously rated ‘good’
by Ofsted were more likely than maintained schools to retain or improve their subsequent
rating (DfE, 2014b). However, the analysis only compared schools with the same previous
Ofsted rating and did not attempt to match other characteristics: the differences identified
may be due to underlying differences between the schools, for example the prior attainment
of the pupils, rather than the impact academy status had.
Research on academy schools has also broadened to consider how schools are using the
freedoms that academy status has given them (Cirin, 2014). An increasing number of
academies are part of a multi-academy trust (MAT), a body that holds the funding agreement
for several academies directly with the Department for Education. A recent body of research
on academies has focused on differences in school performance between academy
sponsors and MATs (Hutchings et al., 2014, 2015; DfE, 2015b).
1.3 Aims of this research
Academy status can have many impacts - on academy school funding and financial
management, the curriculum taught in academy schools, school admissions and the way
academy staff are paid – and on different stakeholders – schools that become academies,
neighbouring schools, academy chains and local authorities. Changes such as these may
also feed into impacts on pupil outcomes, such as exam results.
This research focuses on measuring the impact that academy status has had on pupil
attainment in GCSE exams at age 16 in secondary schools and in end-of-Key Stage 2 tests
at age 11 in primary schools.
Primary schools have been able to become academies since 2010, but there has been little
research on the impact academy status has had on primary academy performance. In
January 2015, the Education Select Committee (GB. Parliament. HoC. Education Select
Committee, 2015) called for evidence on the impact of academy status on primary schools.
The research presented in this report contributes to this research gap, providing a robust
assessment of the association between academy status and pupil attainment in primary
schools.
The analysis is split into four strands, analysing the association between sponsored
academy status and average outcomes and the association between converter academy

4 Analysis of Academy School Performance in GCSEs 2014
status and average outcomes, for both primary and secondary schools. It is crucial to
perform these analyses separately because schools became sponsored and converter
academies for different reasons, in different contexts and had very different characteristics.
In addition, as primary schools are generally smaller than secondary schools, the impact of
academy status is likely to be very different.
The focus of the report is sponsored and converter academies, that is existing schools that
became academies. The research does not consider free schools, that is, academy schools
that have opened as new schools.
The analysis considers the association between sponsored and converter academy status
and a number of different outcomes, and compares average achievement at KS2 and GCSE
among all the pupils in academy schools and in similar maintained schools. It also considers
the performance of pupils eligible for free school meals (FSM), and the within-school
performance gap between FSM pupils and those not eligible. The differential use of different
types of qualification by academy and similar maintained schools is also analysed.
By comparing average outcomes in academies and similar maintained schools we are
attempting to capture the effect that academy status has had on school performance,
compared with what might have happened if the school had remained a maintained school.
The context of these comparisons is that there have also been changes to the way
maintained schools have operated since 2010. Some of the freedoms that academy schools
have, such as the ability to relate teachers’ pay to performance, for example, have also been
extended to maintained schools. Local authorities have also been more active in giving
warning notices to maintained schools in recent years (NAO, 2014).
The next chapter of this report explains the sources of data used for the analysis and the
methods used to analyse the data. Chapters 3 and 4 respectively present the analysis of
secondary sponsored academies compared with similar maintained schools and secondary
converter academies compared with similar maintained schools, while chapters 5 and 6
analyse the performance of primary sponsored academies compared with similar maintained
schools and primary converter academies compared with similar maintained schools. The
final chapter discusses the implications of the findings.
Analysis of Academy School Performance in GCSEs 2014 5
2 Methodology and data
2.1 Methodology
2.1.1 Measuring the impact of academy status
A natural way to begin thinking about the impact sponsored or converter academy status
has had on the attainment progress made by pupils in those schools is to compare average
exam results, or average trends, of schools that are academies with those that are not. This
may be problematic for a number of reasons.
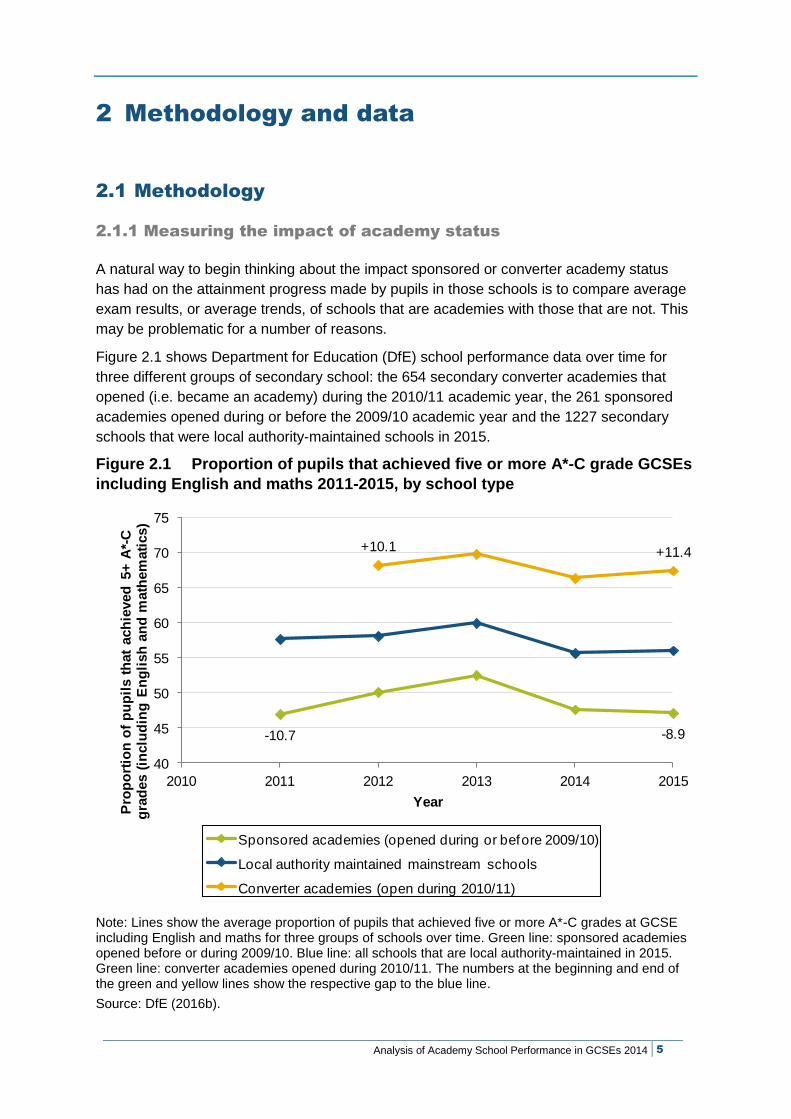
Figure 2.1 shows Department for Education (DfE) school performance data over time for
three different groups of secondary school: the 654 secondary converter academies that
opened (i.e. became an academy) during the 2010/11 academic year, the 261 sponsored
academies opened during or before the 2009/10 academic year and the 1227 secondary
schools that were local authority-maintained schools in 2015.
Figure 2.1 Proportion of pupils that achieved five or more A*-C grade GCSEs
including English and maths 2011-2015, by school type
Note: Lines show the average proportion of pupils that achieved five or more A*-C grades at GCSE including English and maths for three groups of schools over time. Green line: sponsored academies opened before or during 2009/10. Blue line: all schools that are local authority-maintained in 2015. Green line: converter academies opened during 2010/11. The numbers at the beginning and end of the green and yellow lines show the respective gap to the blue line.
Source: DfE (2016b).
-10.7 -8.9
+10.1 +11.4
40
45
50
55
60
65
70
75
2010 2011 2012 2013 2014 2015
Pro
po
rtio
n o
f p
up
ils t
hat
ach
ieved
5+
A*-
C
gra
des (
inclu
din
g E
ng
lish
an
d m
ath
em
ati
cs)
Year
Sponsored academies (opened during or before 2009/10)
Local authority maintained mainstream schools
Converter academies (open during 2010/11)

6 Analysis of Academy School Performance in GCSEs 2014
Sponsored academies have a level of performance that is below that of LA-maintained
schools, but that was the case before they became academies and is still the case
afterwards. Converters tend to be high-performing, but were already high-performing when
they became academies. Comparing levels of achievement between school types does not
reveal what impact changing the school’s type has had on school performance. Comparing
levels of achievement by school type is also problematic because it does not take into
account the ability of pupils when they enter the school.
Trends in performance, that is comparing how the gap between the average performance of
academies and the average performance of LA-maintained schools has changed over time,
may offer a more informative way of looking at the impact of academy status. However, such
a comparison of trends does not take account of a statistical effect known as ‘mean
reversion’. Mean reversion is the tendency of statistics measured over time to tend towards
the average: if a variable is above average at one point in time it is more likely to be closer to
the average the next time it is measured, and if a variable is below average at one point in
time it is more likely to be closer to the average the next time it is measured.
This is relevant for analysing academies because the two types of academies had above
and below average respective performance when they became academies. Because we
might have expected a group of schools with initially low or high performance to drift towards
the average over time even if they hadn’t become an academy, it is important to compare
performance with a group of maintained schools that were in similar circumstances at the
time, to take account of ‘mean reversion’.
A better comparison is to compare schools that became academies with schools that did not
become academies and had similar characteristics at the time. Then, if mean reversion does
occur, it will affect the subsequent results of both groups of schools. A comparison between
academies and a group of similar LA-maintained schools will take account of mean
reversion and the difference in averages is more likely to represent the difference that
academy status has made. Furthermore, we ensure the academies and similar maintained
schools we are comparing had similar characteristics, such as the proportion of pupils
eligible for free school meals, at the time they either did or did not become academies.
However, it is not possible to match schools based on factors that have not been measured,
such as the support that schools receive from their local authority or the enthusiasm of
school leaders for their school to become an academy. The estimated differences between
academies and similar LA-maintained schools in this report therefore cannot necessarily be
attributed to the causal impact of academy status on school performance.
An ‘academy order’ to become a sponsored academy is the standard recommendation if a
school was or is under-performing. Why was that standard recommendation applied to some
maintained schools (which became academies) and not to others that had similar exam
results and Ofsted ratings at the same time? It could have been parental or local authority
opposition to academy status, or the policy being applied differently to different schools in
similar circumstances. However, another reason that similar LA-maintained schools are still
maintained in 2015 could be because they have improved in the intervening years. This
factor in particular needs to be borne in mind, as it could bias the comparisons made in this
report.

Analysis of Academy School Performance in GCSEs 2014 7
Despite these issues and challenges with interpreting the findings, matching a group of LA-
maintained schools with similar characteristics to academy schools is the most robust
methodology available for making comparisons. This research uses a method for matching
schools called ‘propensity score matching’. A detailed description of this method and how it
has been applied is in Appendix A.
2.1.2 Analysis
Throughout this report, we present two analyses comparing the outcomes in academy
schools in 2015 with those in similar maintained schools: a simple comparison of averages
and the results of regression analysis. Comparing the average outcomes in academy
schools with the average outcomes in similar maintained schools represents the average
difference in outcomes that is associated with academy status.
All the academy schools analysed in this report have been academies for between two and
five years, so the pupils taking GCSEs in 2015 joined the school before it became an
academy. Therefore, because of the propensity score matching, there should be few
underlying differences in the average characteristics of pupils taking GCSE exams in 2015
between the two groups of schools.
However, there may be some differences between academies and similar maintained
schools in the particular characteristics of the pupils that took GCSE exams in 2015. For
example, the cohort of pupils in academy schools may have slightly higher average Key
Stage 2 scores, or have more pupils that are eligible for free school meals, than pupils in
similar maintained schools.
We have used regression analysis to estimate the average difference in outcomes that is
associated with academy status. Regression analysis is a statistical approach for explaining
the variation in one variable with one or more other variables simultaneously; in this case the
relationship between attainment outcomes and academy status, while controlling for the
variation in pupil characteristics in academies and maintained schools that also help explain
why attainment varies between schools.
Regression analysis acts as a cross-check to simple comparison of average outcomes, and
also has the advantages that:
1. Differences in outcomes are interpreted as the progress pupils make between
phases of education (e.g. the end of primary school and GCSEs) rather than the
levels of attainment they achieve. That is, it measures what value the school is
adding.
2. Differences in outcomes are estimated with a greater level of precision. Confidence
intervals are narrower when underlying differences in pupil characteristics are
accounted for with regression analysis.

8 Analysis of Academy School Performance in GCSEs 2014
2.1.3 Outcome measures
Secondary schools
We analyse the difference between secondary academy schools and similar maintained
schools in three main attainment measures:
average Key Stage 4 point score for the best eight GCSEs. Six points is equivalent to
one grade in one subject. An A* grade is worth 58 points, an A grade 52 points, a B
grade worth 46 points, a C grade worth 40 etc.
the percentage of pupils who achieved five or more A* to C grade GCSEs (including
equivalent qualifications), including English and maths
average value-added – the Key Stage 4 points that a pupil scores, relative to the Key
Stage 4 points of the average pupil with the same Key Stage 2 point score. A six-point
difference in value-added is the equivalent of one grade in one subject. Value-added
scores above 1000 are above the national average in terms of the amount of progress
pupils are making, whereas scores below 1000 are below the national average.
We also analyse:
average Key Stage 4 point score for the best eight GCSEs excluding equivalent
qualifications, to compare the findings with average point score including equivalents.
Previous research has shown greater use of equivalent qualifications in (particularly
sponsored) academies compared with similar maintained schools
average Key Stage 4 point score of pupils who are eligible for free school meals (FSM)
the average gap in Key Stage 4 point score between FSM-eligible and non-eligible pupils
in academy and similar maintained schools.
Primary schools
We analyse the difference between primary academy schools and similar maintained
schools in four main attainment measures:
the percentage of pupils who achieved National Curriculum level 4 in English and maths
the percentage of pupils who achieved National Curriculum level 4b in English and
maths. This measure is the new expected standard.
average Key Stage 2 point score in English and maths. Six points is equivalent to one
key stage level
average value-added – the Key Stage 2 points that a pupil scores, relative to the Key
Stage 2 points of the average pupil with the same Key Stage 1 point score. A six-point
difference in value-added is the equivalent of one National Curriculum level. Value-
added scores above 100 are above the national average in terms of the amount of
progress pupils are making, whereas scores below 100 are below the national average.
We also analyse:
the average percentage of pupils eligible for free school meals (FSM) who achieved
National Curriculum level 4 in English and maths

Analysis of Academy School Performance in GCSEs 2014 9
the average gap in the percentage of FSM-eligible and non-eligible pupils who achieved
level 4 in English and maths.
The number of schools analysed for each set of comparisons is shown in Table 2.1.
Table 2.1 Sample sizes used for analysis of attainment in academies and similar
maintained schools
Academies Similar maintained schools
Secondary sponsored academies 151 252
Secondary converter academies 979 996
Primary sponsored academies 362 849
Primary converter academies 807 3208
Ofsted ratings
We also analyse the most recent Ofsted rating of overall school effectiveness that each
school received as of August 2015. Ofsted ratings are included in this part of the analysis
where the inspection took place after 1st September 2012. This ensures that:
all ratings are determined using the same Ofsted framework – the updated framework
came into effect in September 2012
all inspection ratings of academies are based on an inspection of the schools after they
became academies, and all inspection ratings of similar maintained schools are based
on an inspection after the school was matched to an academy. 7
However, this restriction reduced the sample size of schools compared with that used in the
GCSE and KS2 results analysis because not every school had been inspected since
September 2012 or since becoming an academy. Table 2.2 shows the effect this restriction
has on the sample sizes.
Table 2.2 Sample sizes used for analysis of attainment and Ofsted ratings in
academies and similar maintained schools
GCSE / KS2
analysis
Ofsted rating
analysis
Sample size
reduction
Acad Main Acad Main Acad Main
Secondary sponsored academies 151 252 150 243 99% 96%
Secondary converter academies 979 996 672 832 69% 84%
Primary sponsored academies 362 849 344 822 95% 97%
Primary converter academies 807 3208 487 2360 60% 74%
Note: Acad = sample size for sponsored academies; Main = sample size for similar maintained schools.
7 For the same reason, academies opened during the 2012/13 academic year and maintained schools
that were matched to this group of schools are excluded from this part of the analysis if their most recent Ofsted rating was based on an inspection that took place before 1
st September 2013.

10 Analysis of Academy School Performance in GCSEs 2014
This restriction has very little effect on sponsored academies and their similar maintained
schools because they were initially more likely to be rated ‘inadequate’ or ‘requires
improvement’, which are re-inspected more regularly. Because the comparisons are
between academies and similar maintained schools, which have similar rates of missing
inspection data, they are not likely to be biased by the missing data. However, a greater
proportion of converter academies have not yet been inspected than their similar maintained
schools so, as a cross-check, we use a statistical technique known as ‘multiple imputation’
to estimate what the missing Ofsted inspection data might have been, using 2015 school
performance data.
The overall Ofsted rating of effectiveness is one of four levels for each school: outstanding,
good, requires improvement, and inadequate. We analysed three outcome measures:
whether the school is outstanding
whether the school is good or outstanding
whether the school is inadequate.
2.1.4 Pupil characteristics
In the analysis of attainment outcomes, regression analysis takes account of the association
between fixed pupil characteristics and outcomes, to control for underlying differences when
comparing academies and similar maintained schools. Those pupil characteristics are:
average Key Stage 2 point score, that is the level of attainment of the cohort of pupils
when they began secondary school (for secondary schools only)
average Key Stage 1 point score, that is the level of attainment of the cohort of pupils
when they began upper primary school / Key Stage 2 (for primary schools only)
proportion of pupils eligible for free school meals
proportion of pupils with special educational needs
proportion of pupils with English as an additional language
the number of pupils in the GCSE / KS2 cohort, that is the size of the school.
2.2 Data sources
This research combines data from a number of sources to make the comparisons between
academy schools and similar maintained schools. The sources are:
outcome measures and the characteristics of the GCSE and Key Stage 2 cohort pupils
gathered from secondary and primary school performance tables, published by the DfE
information about when the academy was opened gathered from the DfE’s list of open
academies (February 2016)
Ofsted data on historical school ratings. This was used to identify which Ofsted rating
academy schools had before they became academies, which Ofsted rating maintained
schools had at the time, and the school’s most recent Ofsted rating for comparison

Analysis of Academy School Performance in GCSEs 2014 11
School Census and LEA and School Information Service (LEASIS) data to identify the
proportion of pupils eligible for free school meals and the total number of pupils in
schools before they became academies, and to identify similar information for
maintained schools.

12 Analysis of Academy School Performance in GCSEs 2014
3 Secondary sponsored academies
3.1 Key findings
The average Key Stage 4 (KS4) point score from pupils’ best eight GCSEs is two-
thirds of a GCSE grade per pupil higher in secondary sponsored academies than in
similar maintained schools, although the difference is not statistically significant. The
average difference in value-added score, that is the progress pupils made while at
secondary school, is of the same order of magnitude as the difference in KS4 points
and also not statistically significant.
The proportion of pupils achieving five or more A*-C grade GCSEs including English
and maths is higher in secondary sponsored academies than in similar maintained
schools, and the difference is statistically significant. This is equivalent to around five
additional pupils out of a typical secondary school cohort of 180 pupils achieving the
five A*-C threshold.
There is no difference in average Key Stage 4 point scores excluding equivalent
qualifications in sponsored academies and similar maintained schools. When
compared with average Key Stage 4 points including equivalent qualifications, this
suggests that sponsored academies make slightly more use of equivalent
qualifications than similar maintained schools.
Pupils eligible for free school meals (FSM) make around one GCSE grade per pupil
more attainment progress in sponsored academies than in similar maintained schools,
although the difference is not statistically significant.
Sponsored academies are significantly more likely to be rated as outstanding, or good
or outstanding, and less likely to be rated as inadequate compared with similar
maintained schools.
3.2 Findings
3.2.1 Key Stage 4 results in 2015
Table 3.1 compares the 2015 Key Stage 4 results of sponsored academies and similar
maintained schools using three different measures. The first column compares the average
in sponsored academies with the average in similar maintained schools. The second column
compares the average GCSE results in the two groups using a regression model, which
takes account of any differences in the pupil characteristics of the GCSE cohort which affect
GCSE outcomes. The difference between the group averages is the association between
academy status and school performance.
On average, both sponsored academies and similar maintained schools are below the 2015
national average in terms of Key Stage 4 points (average = 311). Pupils score around 280
points on their best eight GCSEs, which is the equivalent of eight D grades. The percentage

Analysis of Academy School Performance in GCSEs 2014 13
of pupils achieving five A*-C grades including English and maths is also below the national
average for 2015 of 53 per cent.
Pupils’ Key Stage 4 point score was 1.5 points higher in sponsored academies than in
similar maintained schools. When the pupil characteristics of the cohort are taken into
account, pupils’ Key Stage 4 points score was 3.6 points higher in sponsored academies
than in similar maintained schools. This is the equivalent of two-thirds of a GCSE grade per
pupil. Value-added, a measure of how much progress pupils make in secondary school
since leaving primary school, was 3.5 points higher in sponsored academies than in similar
maintained schools; the equivalent of two-thirds of a GCSE grade per pupil. Neither of these
differences is statistically significant.
After taking into account pupil differences, the proportion of pupils achieving five or more
A*-C grade GCSEs including English and maths was 2.7 percentage points higher in
sponsored academies compared with similar maintained schools. This is equivalent to
around five more pupils (in a typical secondary school cohort of 180 pupils) achieving the
five or more A*-C GCSE threshold in sponsored academies. This difference is statistically
significant.
Table 3.1 Difference between sponsored academies and similar maintained
schools in average GCSE outcomes
Average Regression model
Capped Key Stage 4 point score
Sponsored academies 281.9
Similar maintained schools 280.4
Difference 1.5 3.6
95% confidence interval
(-1.1, 8.2)
Value-added
Sponsored academies 983.6
Similar maintained schools 980.4
Difference 3.2 3.5
95% confidence interval
(-1.8, 8.8)
Percentage achieving 5+ A*-C GCSEs including English and maths
Sponsored academies 44.0
Similar maintained schools 42.2
Difference 1.7 2.7
95% confidence interval
(0.5, 4.8)
Controls for prior attainment No Yes
Controls for pupil characteristics No Yes
Note: Differences may not exactly match due to rounding.
When compared with how much KS4 point scores and the proportion of pupils achieving five
or more A*-C GCSE grades vary between schools, these differences seem very small.
Figure 3.1 plots the distribution of the proportion of pupils achieving five or more A*-C grade
GCSEs including English and maths for sponsored academies and similar maintained

14 Analysis of Academy School Performance in GCSEs 2014
schools, and Figure 3.2 plots the distribution of the KS4 point score. Despite the average for
sponsored academies being slightly higher than for similar maintained schools, the variation
in performance is greater for sponsored academies. Sponsored academies are
disproportionately likely to be low-performing and high-performing, and less likely to have a
middling level of performance.
Figure 3.1 Distribution of the proportion of pupils achieving five or more A*-C
grade GCSEs including English and maths for sponsored academies
and similar maintained schools
Figure 3.2 Distribution of capped Key Stage 4 point score for sponsored
academies and similar maintained schools
0 20 40 60 80Proportion achieving 5+ A*-C GCSEs including English and maths (%)
Sponsored academies
Similar maintained schools
8 B grades8 C grades8 D grades8 E gradesBest 8 GCSE point score (including equivalent qualifications)
Sponsored academies
Similar maintained schools

Analysis of Academy School Performance in GCSEs 2014 15
3.2.2 Use of equivalent qualifications
Previous research has shown differences in the performance improvement in sponsored
academies compared with similar maintained schools, depending on whether equivalent
qualifications are included in the comparison (Worth, 2014 & 2015; DfE, 2012). The relative
performance of sponsored academies appeared to be better when equivalent qualifications
were included in the measures, suggesting sponsored academies were making greater use
of equivalent qualifications. Changes to the way school performance tables have been
calculated since 2014 have reduced the contribution that equivalent qualifications make to
the main performance measures.
Table 3.2 shows a comparison of sponsored academies and similar maintained schools
using two measures of KS4 points in 2015. The first measure includes equivalent
qualifications and the second excludes these. When equivalents are included, sponsored
academies have a higher average capped point score compared with similar maintained
schools. When equivalents are excluded, sponsored academies have a lower average
capped point score than similar maintained schools. That said, the difference is only
marginally above zero when pupil characteristics are taken into account.
The comparisons suggest that school performance in sponsored academies compared with
similar maintained schools is affected to a small extent by differences in the use of
equivalent qualifications.8
Table 3.2 Difference between sponsored academies and similar maintained
schools in average capped Key Stage 4 points including and
excluding equivalent qualifications
Average Regression model
Key Stage 4 points (including equivalents)
Sponsored academies 281.9
Similar maintained schools 280.4
Difference 1.5 3.6
95% confidence interval (-1.1, 8.2)
Key Stage 4 points (excluding equivalents)
Sponsored academies 254.3
Similar maintained schools 256.9
Difference -2.6 0.1
95% confidence interval (-5.4, 5.6)
Controls for prior attainment No Yes
Controls for pupil characteristics No Yes
Note: Differences may not exactly match due to rounding.
8 This result is also consistent with pupils in sponsored academies having better attainment in their
equivalent qualifications.

16 Analysis of Academy School Performance in GCSEs 2014
3.2.3 Earlier and later academies
Figure 3.3 compares the average capped Key Stage 4 points score of secondary sponsored
academies, split by the year they became an academy and compared with the group of
maintained schools with similar characteristics at the time. Pupils in sponsored academies
open for five years achieve one and a half GCSE grades per pupil higher than similar
maintained schools, whereas pupils in sponsored academies open for two years score
slightly lower. However, because the number of academies opened each year is small, the
confidence intervals of each estimate are wide and none of the differences are statistically
significant. Nonetheless, the analysis provides tentative evidence that the positive
association between academy status and school performance is stronger in schools that
have been sponsored academies for longer.
This finding is consistent with findings from previous research on sponsored academies
(Machin and Vernoit, 2011) and could reflect academy status taking time to ‘bed in’ before
having an effect on pupil attainment. However, the amount of Department for Education
(DfE) funding available to sponsors when a school becomes a sponsored academy has also
reduced by 83 per cent between 2010 and 2014 (NAO, 2014), which could have reduced the
ability of sponsors to drive substantial school improvement.
Figure 3.3 Difference between sponsored academies and similar maintained
schools in average capped Key Stage 4 points, split by year of opening
Note: black lines show the 95% confidence interval of the difference.
-12
-6
0
6
12
18
24
Open 5 years Open 4 years Open 3 years Open 2 years
Dif
fere
nc
e in
av
era
ge
20
15
ca
pp
ed
p
oin
t s
co
re (
sp
on
so
red
ac
ad
em
ies
vs
sim
ila
r m
ain
tain
ed
sc
ho
ols
)
Length of time academies have been open
Analysis of Academy School Performance in GCSEs 2014 17
3.2.4 Narrowing the gap
Table 3.3 compares the average capped Key Stage 4 points score of pupils eligible for free
school meals in sponsored academies and similar maintained schools, and the gap between
pupils eligible for free school meals and pupils that are not.
On average, pupils eligible for free school meals achieved a lower capped Key Stage 4 point
score than their non-eligible peers in both sponsored academies and similar maintained
schools. The gap is around 47 points nationally, which is equivalent to around eight GCSE
grades per pupil: for example, the difference between eight C grades and eight B grades.
Pupils eligible for FSM in sponsored academies had a higher GCSE point score per pupil on
average than FSM pupils in similar maintained schools. After taking account of pupil
characteristics, the average pupil progress made by FSM pupils in sponsored academies
was around one GCSE grade (5.7 points) per pupil higher than in similar maintained
schools. However, the difference is not statistically significant.
The FSM gap is also narrower in sponsored academies than in similar maintained schools,
by around half a GCSE grade (4 points) per pupil. This is equivalent to the existing FSM gap
between schools being around eight per cent narrower. The findings from regression
analysis of the FSM gap, which takes into account underlying average differences between
schools in the proportion eligible for FSM and prior attainment, are very similar. However,
this difference is also not statistically significant.
Table 3.3 Difference between sponsored academies and similar maintained
schools in the Key Stage 4 points of FSM-eligible pupils and the
gap between FSM-eligible and non-FSM pupils
Average Regression model
Average capped point score (FSM pupils)
Sponsored academies 253.7
Similar maintained schools 249.7
Difference 4.1 5.7
95% confidence interval
(-0.3, 11.7)
Gap between FSM and non-FSM pupils
Sponsored academy -47.0
Similar maintained schools -50.8
Difference 3.8 4.0
95% confidence interval
(-0.9, 8.8)
Control for prior attainment No Yes
Control for proportion of FSM pupils No Yes
Control for pupil characteristics No Yes
Note: Differences may not exactly match due to rounding.

18 Analysis of Academy School Performance in GCSEs 2014
3.2.5 Ofsted ratings
Figure 3.4 shows the proportions of sponsored academies and similar maintained schools
that received each Ofsted rating in their most recent inspection as of August 2015. 9 Table
3.4 presents the proportion of sponsored academies and similar maintained schools that are
outstanding, good or outstanding and inadequate, and the percentage point difference.
The comparisons show that sponsored academies are significantly more likely than similar
maintained schools to be rated as outstanding, and good or outstanding, and significantly
less likely to be rated as inadequate.
Figure 3.4 Most recent Ofsted rating (Sept 2012 – August 2015) of sponsored
academies and similar maintained schools
Note: Figures may not exactly sum to 100% due to rounding.
Table 3.4 Difference in Ofsted ratings between sponsored academies and
similar maintained schools
Sponsored academy
Similar maintained schools
Difference Statistically significant?
Outstanding 6.7% 1.3% 5.4 Yes
Good or outstanding 46.7% 33.7% 13.0 Yes
Inadequate 10.7% 22.3% -11.6 Yes
Number of schools 150 144
Note: Differences may not exactly match due to rounding.
9 Note: Ofsted ratings from inspections of schools between September 2012 and August 2015.
Inspections of schools that became academies in 2012/13 are excluded from this analysis if they took place before September 2013.
7%
1%
40%
32%
43%
44%
11%
22%
0% 20% 40% 60% 80% 100%
Sponsored academies
Similar maintained schools
Outstanding Good Requires Improvement Inadequate

Analysis of Academy School Performance in GCSEs 2014 19
4 Secondary converter academies
4.2 Key findings
The average Key Stage 4 point score from pupils’ best eight GCSEs is one-third of a
GCSE grade per pupil higher in secondary converter academies than in similar
maintained schools. The difference is statistically significant. The average difference
in value-added score, that is the progress pupils made while at secondary school, is
of also one-third of a GCSE grade and statistically significant.
The proportion of pupils achieving five or more A*-C grade GCSEs including English
and maths is also higher in secondary converter academies than in similar
maintained schools. This is statistically significant and equivalent to around two
additional pupils out of a typical secondary school cohort of 180 pupils achieving the
five A*-C threshold.
There is no difference in the average Key Stage 4 point score excluding equivalent
qualifications in converter academies than in similar maintained schools. When
compared with average Key Stage 4 points including equivalent qualifications, this
suggests that converter academies make slightly more use of equivalent
qualifications than similar maintained schools.
Pupils eligible for free school meals make around one-third of a GCSE grade per
pupil more attainment progress in converter academies than in similar maintained
schools, although the difference is not statistically significant.
Converter academies are significantly more likely to be rated as outstanding, or as
good or outstanding, than similar maintained schools. Converter academies are
slightly less likely to be rated as inadequate, but the difference is not statistically
significant.
4.2 Findings
4.2.1 Key Stage 4 results in 2015
Table 4.1 compares the 2015 Key Stage 4 results of converter academies and similar
maintained schools using three different measures. The first column compares the average
in converter academies with the average in similar maintained schools. The second column
compares the average GCSE results in the two groups using a regression model, which
takes account of any differences in the pupil characteristics of the GCSE cohort which
explain differences in GCSE outcomes. The difference between the group averages is the
association between academy status and school performance.
On average, both converter academies and similar maintained schools have a Key Stage 4
(KS4) point score above the 2015 national average (average = 311). Pupils score 326 points
on their best eight GCSEs, which is around eight C grades. The percentage of pupils
achieving five or more A*-C grade GCSEs including English and maths (in both converter

20 Analysis of Academy School Performance in GCSEs 2014
academies and similar maintained schools) is also above the national average (which was
53 per cent in 2015).
Simply comparing averages, pupils’ KS4 point score is the same in converter academies
and similar maintained schools. When the pupil characteristics of the cohort are taken into
account, pupils’ KS4 point score is 1.6 points higher in converter academies than in similar
maintained schools. This is the equivalent of around one-third of a GCSE grade per pupil.
Value-added, a measure of how much progress pupils make in secondary school since
leaving primary school, is 2 points higher in converter academies than in similar maintained
schools, which is the equivalent of one-third of a GCSE grade per pupil. Both of these
differences are statistically significant.
When the pupil characteristics of the cohort are taken into account, the proportion of pupils
achieving five or more A*-C grade GCSEs including English and maths is 1.1 percentage
points higher in converter academies compared with similar maintained schools. This is
equivalent to around two more pupils out of a typical secondary school cohort of 180 pupils
achieving the five A*-C threshold in converter academies and is also statistically significant.
Table 4.1 Difference between converter academies and similar maintained
schools in average GCSE outcomes
Average Regression model
Capped Key Stage 4 point score
Converter academies 326.4 Similar maintained schools 326.5 Difference -0.1 1.6
95% confidence interval
(0.3, 3.0)
Value-added
Converter academies 1006.0 Similar maintained schools 1004.2 Difference 1.7 2.0
95% confidence interval
(0.4, 3.5)
Percentage achieving 5+ A*-C including English and maths
Converter academies 61.8 Similar maintained schools 61.5 Difference 0.3 1.1
95% confidence interval
(0.4, 1.8)
Controls for prior attainment No Yes Controls for pupil characteristics No Yes
Note: Differences may not exactly match due to rounding.
When compared with how much the proportion of pupils achieving five or more A*-C grade
GCSEs and capped Key Stage 4 point scores vary between schools, these average
differences seem very small. Figure 4.1 plots the distribution of the proportion of pupils
achieving five or more A*-C grade GCSEs including English and maths for converter
academies and similar maintained schools, and Figure 4.2 plots the distributions of the KS4
point score. Despite the averages and the fact that the proportion of pupils achieving five or
more A*-C grade GCSEs is slightly higher for converter academies than for similar
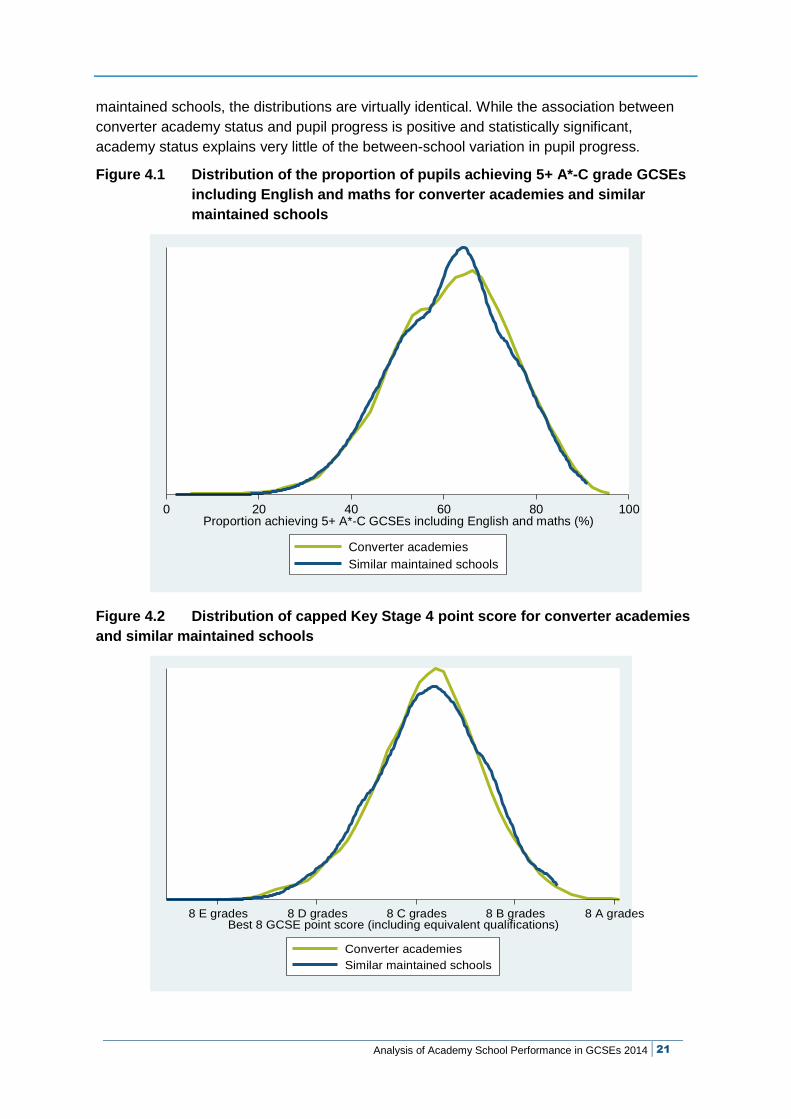
Analysis of Academy School Performance in GCSEs 2014 21
maintained schools, the distributions are virtually identical. While the association between
converter academy status and pupil progress is positive and statistically significant,
academy status explains very little of the between-school variation in pupil progress.
Figure 4.1 Distribution of the proportion of pupils achieving 5+ A*-C grade GCSEs
including English and maths for converter academies and similar
maintained schools
Figure 4.2 Distribution of capped Key Stage 4 point score for converter academies
and similar maintained schools
0 20 40 60 80 100Proportion achieving 5+ A*-C GCSEs including English and maths (%)
Converter academies
Similar maintained schools
8 A grades8 B grades8 C grades8 D grades8 E gradesBest 8 GCSE point score (including equivalent qualifications)
Converter academies
Similar maintained schools

22 Analysis of Academy School Performance in GCSEs 2014
4.2.2 Use of equivalent qualifications
Previous research has shown some small differences in the performance improvement in
converter academies compared with similar maintained schools, depending on whether
equivalent qualifications are included in the comparison (Worth, 2014 & 2015). The relative
performance of converter academies appeared to be slightly better when equivalent
qualifications were included in the measures, suggesting equivalent qualifications are used
more in converter academies. Changes to the way school performance tables have been
calculated since 2014 have reduced the contribution that equivalent qualifications make to
the main performance measures.
Table 4.2 shows a comparison of converter academies and similar maintained schools using
two measures of KS4 points. The first measure includes equivalent qualifications and the
second excludes them. When equivalents are included, converter academies have a higher
average capped point score compared with similar maintained schools. When equivalents
are excluded, the difference between converter academies and similar maintained schools is
marginally above zero.
The comparisons suggest that school performance in converter academies compared with
similar maintained schools is affected to a very small extent by differences in the use of
equivalent qualifications.10
Table 4.2 Difference between converter academies and similar maintained
schools in average capped Key Stage 4 points (including and
excluding equivalent qualifications)
Average Regression model
Key Stage 4 points (including equivalents)
Converter academies 326.4
Similar maintained schools 326.5
Difference -0.1 1.6
95% confidence interval (0.3, 3.0)
GCSE points (excluding equivalents)
Converter academies 312.4
Similar maintained schools 314.3
Difference -1.9 0.1
95% confidence interval (-1.6, 1.8)
Controls for prior attainment No Yes
Controls for pupil characteristics No Yes
Note: Differences may not exactly match due to rounding.
10
This result is also consistent with pupils in converter academies having slightly better attainment in their equivalent qualifications.

Analysis of Academy School Performance in GCSEs 2014 23
4.2.3 Earlier and later academies
Figure 4.3 compares the average capped Key Stage 4 points score of secondary converter
academies, split by the year they became an academy and compared with the group of
maintained schools with similar characteristics at the time. Pupils in converter academies
open for four years achieve one-third of a GCSE grade per pupil higher than similar
maintained schools. This difference is statistically significant, but very small. Other converter
academy school pupils score slightly lower and the differences are not statistically
significant. The analysis provides little evidence that the association between academy
status and school performance is any stronger in schools that have been converter
academies for longer.
Figure 4.3 Difference between converter academies and similar maintained
schools in average capped Key Stage 4 points, split by year of opening
Note: black lines show the 95% confidence interval of the difference.
4.2.4 Narrowing the gap
Table 4.3 compares the average capped Key Stage 4 points score of pupils eligible for free
school meals (FSM) in converter academies and similar maintained schools, and the gap
between pupils eligible for FSM and pupils that are not.
On average, pupils eligible for FSM achieve a lower capped Key Stage 4 point score than
their non-eligible peers in both converter academies and similar maintained schools. The
gap is 47 points nationally, which is equivalent to around eight GCSE grades per pupil, for
example, the difference between eight C grades and eight D grades. The gap is wider in
both converter academies and similar maintained schools, at 56 points.
-12
-6
0
6
12
18
Open 5 years Open 4 years Open 3 years Open 2 years
Dif
fere
nc
e in
av
era
ge
20
15
ca
pp
ed
p
oin
t s
co
re (
co
nv
ert
er
ac
ad
em
ies
vs
sim
ila
r m
ain
tain
ed
sc
ho
ols
)
Length of time academies have been open

24 Analysis of Academy School Performance in GCSEs 2014
Pupils eligible for FSM in converter academies have a marginally lower (0.2) GCSE point
score per pupil on average than FSM pupils in similar maintained schools. After taking
account of pupil characteristics, the average pupil progress made by FSM pupils in converter
academies is one-third of a GCSE grade (1.9 points) higher than in similar maintained
schools. However, the difference is not statistically significant.
The FSM gap is also marginally narrower in converter academies than in similar maintained
schools, by around half a GCSE grade (0.1 points) per pupil. The findings from regression
analysis of the FSM gap, which took into account underlying average differences between
schools in the proportion of pupils eligible for FSM and prior attainment, are very similar (0.5
points). The difference is also not statistically significant.
Table 4.3 Difference between converter academies and similar maintained
schools in the Key Stage 4 points of FSM-eligible pupils and the
gap between FSM-eligible and non-FSM pupils
Average Regression model
Average capped point score (FSM pupils)
Converter academies 281.9 Similar maintained schools 282.0 Difference -0.2 1.9
95% confidence interval
(-0.4, 4.2)
Gap between FSM and non-FSM pupils
Converter academies -56.0 Similar maintained schools -56.1 Difference 0.1 0.5
95% confidence interval
(-1.5, 2.4)
Control for prior attainment No Yes
Control for proportion of FSM pupils No Yes
Control for pupil characteristics No Yes
Note: Differences may not exactly match due to rounding.
4.2.5 Ofsted ratings
Figure 4.4 shows the proportions of converter academies and similar maintained schools
that received each Ofsted rating in their most recent inspection as of August 2015.11 Table
4.4 presents the proportion of converter academies and similar maintained schools that are
outstanding, good or outstanding, and inadequate, and the difference in terms of percentage
points. The comparisons show that converter academies are significantly more likely than
similar maintained schools to be rated as outstanding and good or outstanding. Converter
academies are slightly less likely to be rated as inadequate, but the difference is not
statistically significant.
11
Note: Ofsted ratings from inspections of schools between September 2012 and August 2015. Inspections of schools that became academies in 2012/13 are excluded from this analysis if they took place before September 2013.

Analysis of Academy School Performance in GCSEs 2014 25
Figure 4.4 Most recent Ofsted rating (Sept 2012 – August 2015) of converter
academies and similar maintained schools
Note: Figures may not exactly sum to 100% due to rounding.
Table 4.4 Difference in Ofsted ratings between converter academies and
similar maintained schools
Converter academy
Similar maintained schools
Difference Statistically significant?
Outstanding 19.3% 14.5% 4.9 Yes
Good or outstanding 76.2% 69.8% 6.4 Yes
Inadequate 5.2% 6.1% -0.8 No
Number of schools 672 832
Note: Differences may not exactly match due to rounding.
Not all converter academies and similar maintained schools have been inspected between
September 2012 and August 2015 because good and outstanding schools are routinely re-
inspected after five years. Converter academies that were previously rated outstanding are
exempt from inspection for five years, so more converter academies than similar maintained
schools have not been recently re-inspected (see Table 2.2). We perform multiple imputation
analysis – estimating what Ofsted rating converter academies and similar maintained
schools who have not been recently inspected might have received, based on their
performance data.
Table 4.5 presents the results of this analysis. These comparisons show that converter
academies are more likely than similar maintained schools to be rated as outstanding and
good or outstanding, but the difference is not statistically significant. It also confirms that
converter academies are significantly more likely than similar maintained schools to be rated
as good or outstanding and that converter academies are slightly less likely to be rated as
inadequate, but the difference is not statistically significant.
19%
14%
57%
55%
19%
24%
5%
6%
0% 20% 40% 60% 80% 100%
Converter academies
Similar maintained schools
Outstanding Good Requires Improvement Inadequate

26 Analysis of Academy School Performance in GCSEs 2014
Table 4.5 Difference in Ofsted ratings between converter academies and
similar maintained schools (multiple imputation analysis)
Converter academy
Similar maintained schools
Difference Statistically significant?
Outstanding 21.1% 16.9% 4.2 No
Good or outstanding 77.5% 72.4% 5.0 Yes
Inadequate 4.8% 5.6% -0.7 No
Number of schools 979 996
Note: Differences may not exactly match due to rounding.

Analysis of Academy School Performance in GCSEs 2014 27
5 Primary sponsored academies
5.1 Key findings
The proportion of pupils achieving National Curriculum level 4 in English and
maths at Key Stage 2 is higher in primary sponsored academies than in similar
maintained schools, although the difference is not statistically significant. The
difference is equivalent to one extra pupil out of every 87 achieving the level 4
threshold in sponsored academies.
The average Key Stage 2 point score is 0.12 points per pupil higher in primary
sponsored academies than in similar maintained schools, although the difference
is not statistically significant. Average differences in value-added, that is the
progress pupils made while in upper primary school / Key Stage 2, is also 0.12
points higher in academies and is not statistically significant. One key stage level
equates to six points, so an increase of 0.12 points is equivalent to one additional
pupil out of 49 achieving an extra National Curriculum attainment level at Key
Stage 2.
The average proportion of pupils eligible for free school meals who achieve level
4 in sponsored primary academies is 2.1 percentage points higher than in similar
maintained schools, although the difference is not statistically significant.
Sponsored primary academies are more likely than similar maintained schools to
be rated as outstanding and this difference is statistically significant. Sponsored
primary academies are slightly more likely to be rated as good or outstanding and
rated as inadequate, but the differences are not statistically significant.
5.2 Findings
5.2.1 Key Stage 2 results in 2015
Table 5.1 compares the 2015 Key Stage 2 (KS2) results of sponsored primary academies
and similar maintained schools using four different measures. The first column compares the
average in sponsored academies with the average in similar maintained schools. The
second column compares the average KS2 results in the two groups using a regression
model, which takes account of any differences in the pupil characteristics of the KS2 cohort
which explain differences in KS2 outcomes. The difference between the group averages is
the association between academy status and school performance.
On average, both sponsored primary academies and similar maintained schools have a
proportion of pupils achieving National Curriculum level 4 in English and maths in 2015 that
is below the national average (of 80 per cent). Around 71 per cent of pupils achieved the
expected level in both sponsored academies and similar maintained schools.
The proportion of pupils achieving level 4 in English and maths was 1.3 percentage points
higher in sponsored academies compared with similar maintained schools. When the pupil

28 Analysis of Academy School Performance in GCSEs 2014
characteristics of the cohort are taken into account, the proportion of pupils achieving level 4
in English and maths is 1.2 percentage points higher in sponsored academies compared to
similar maintained schools. This is equivalent to one extra pupil out of every 87 achieving
the level 4 threshold in sponsored primary academies.
After accounting for pupil characteristics, the proportion of pupils achieving National
Curriculum level 4b in English and maths is 1.7 percentage points higher in sponsored
academies compared with similar maintained schools. This is equivalent to one extra pupil
out of every 57 achieving the level 4b threshold in sponsored primary academies. However,
neither of these differences is statistically significant.
Pupils score 0.16 Key Stage 2 points higher in sponsored academies than in similar
maintained schools. When the pupil characteristics of the cohort are taken into account,
pupils score 0.12 Key Stage 2 points higher in sponsored academies than in similar
maintained schools. Value-added, a measure of how much progress pupils make in upper
primary school / Key Stage 2, is also 0.12 points higher in sponsored academies than in
similar maintained schools. None of these differences is, however, statistically significant.
One key stage level equates to six points, so an increase of 0.12 points is equivalent to one
additional pupil out of every 49 achieving an extra National Curriculum level at Key Stage 2.
Table 5.1 Difference between sponsored academies and similar maintained
schools in average Key Stage 2 outcomes
Average Regression model
Proportion of pupils achieving NC level 4 English & maths
Sponsored academies 72.0 Similar maintained schools 70.6 Difference 1.3 1.2
95% confidence interval
(-0.7, 3.0)
Proportion of pupils achieving NC level 4b English & maths
Sponsored academies 57.6 Similar maintained schools 55.6 Difference 2.0 1.7
95% confidence interval
(-0.3, 3.8)
Key Stage 2 average point score
Sponsored academies 27.5 Similar maintained schools 27.3 Difference 0.16 0.12
95% confidence interval
(-0.07, 0.31)
KS1 – KS2 value-added
Sponsored academies 99.9 Similar maintained schools 99.8 Difference 0.11 0.12
95% confidence interval
(-0.04, 0.28)
Controls for prior attainment No Yes
Controls for pupil characteristics No Yes
Note: Differences may not exactly match due to rounding.

Analysis of Academy School Performance in GCSEs 2014 29
5.2.2 Narrowing the gap
Table 5.2 compares the proportion of pupils who are eligible for free school meals (FSM)
that achieve level 4 in English and maths in sponsored academies and similar maintained
primary schools, and the gap between pupils eligible for FSM and pupils that are not.
On average, a smaller proportion of pupils eligible for FSM achieve level 4 in English and
maths at Key Stage 2 than their non-eligible peers in both sponsored academies and similar
maintained schools. The national average gap is around 14 percentage points.
A higher proportion of pupils eligible for FSM achieve level 4 in sponsored academies than
FSM pupils in similar maintained schools. After taking account of pupil characteristics, the
average proportion of pupils eligible for FSM that achieve level 4 in sponsored academies is
2.1 percentage points higher than in similar maintained schools. However, the difference is
not statistically significant.
The FSM gap is also narrower in sponsored academies than in similar maintained schools,
by 0.9 percentage points. The findings from regression analysis of the FSM gap, which take
into account underlying average differences between schools in the proportion of pupils
eligible for FSM and prior attainment, show the gap is 1.6 percentage points narrower in
sponsored academies than in similar maintained schools. This is equivalent to the existing
FSM gap between schools being around 11 per cent narrower. However, this difference is
also not statistically significant.
Table 5.2 Difference between sponsored academies and similar maintained
schools in the proportion of FSM-eligible pupils achieving KS2
level 4 and the gap between FSM-eligible and non-FSM pupils
Average Regression model
Proportion achieving level 4 (FSM pupils)
Sponsored academies 66.3 Similar maintained schools 64.9 Difference 1.4 2.1
95% confidence interval
(-0.4, 4.6)
Level 4 gap between FSM and non-FSM pupils
Sponsored academies -10.9 Similar maintained schools -11.8 Difference 0.9 1.6
95% confidence interval
(-1.1, 4.4)
Control for prior attainment No Yes
Control for proportion of FSM pupils No Yes
Control for pupil characteristics No Yes
Note: Differences may not exactly match due to rounding.

30 Analysis of Academy School Performance in GCSEs 2014
5.2.3 Ofsted ratings
Figure 5.1 shows the proportions of sponsored academies and similar maintained schools
that received each Ofsted rating in their most recent inspection as of August 2015.12 Table
5.3 presents the proportion of sponsored primary academies and similar maintained schools
that are outstanding, good or outstanding and inadequate, and the difference in terms of
percentage points.
The comparisons show that sponsored academies are significantly more likely than similar
maintained schools to be rated as outstanding. Sponsored academies are slightly more
likely to be rated as good or outstanding, and rated as inadequate, but the differences are
not statistically significant.
Figure 5.1 Most recent Ofsted rating (Sept 2012 – August 2015) of sponsored
academies and similar maintained schools
Note: Figures may not exactly sum to 100% due to rounding.
Table 5.3 Difference in Ofsted ratings between sponsored academies and
similar maintained schools
Sponsored academy
Similar maintained schools
Difference Statistically significant?
Outstanding 7.0% 1.4% 5.5 Yes
Good or outstanding 56.7% 52.3% 4.4 No
Inadequate 7.8% 4.2% 3.6 No
Number of schools 344 335
Note: Differences may not exactly match due to rounding.
12
Note: Ofsted ratings from inspections of schools between September 2012 and August 2015. Inspections of schools that became academies in 2012/13 are excluded from this analysis if they took place before September 2013.
7%
1%
50%
51%
35%
43%
8%
4%
0% 20% 40% 60% 80% 100%
Sponsored academies
Similar maintained schools
Outstanding Good Requires Improvement Inadequate

Analysis of Academy School Performance in GCSEs 2014 31
6 Primary converter academies
6.1 Key findings
The proportion of pupils achieving National Curriculum level 4 in English and
maths at Key Stage 2 is higher in primary converter academies than in similar
maintained schools, although the difference is not statistically significant. The
difference is equivalent to one extra pupil out of every 116 achieving the level 4
threshold in converter academies.
The average Key Stage 2 point score is 0.06 points per pupil higher in primary
converter academies than in similar maintained schools, although again the
difference is also not statistically significant. Average differences in value-added,
the progress pupils made while at upper primary school / in Key Stage 2, is also
0.06 points and is not statistically significant. One key stage level equates to six
points, so an increase of 0.06 points is equivalent to one additional pupil out of
100 pupils achieving an extra level at Key Stage 2.
The average proportion of pupils eligible for free school meals who achieve level
4 in converter academies is 0.4 percentage points higher than in similar
maintained schools, although the difference is not statistically significant.
Converter academies are significantly more likely than similar maintained schools
to be rated as outstanding. Converter academies are also slightly more likely to
be rated as good or outstanding or rated as inadequate, but the differences are
not statistically significant.
6.2 Findings
6.2.1 Key Stage 2 results in 2015
Table 6.1 compares the 2015 Key Stage 2 (KS2) results of primary converter academies
and similar maintained schools using four different measures. The first column compares the
average in converter academies with the average in similar maintained schools. The second
column compares the average KS2 results in the two groups using a regression model,
which takes account of any differences in the pupil characteristics of the KS2 cohort that
explain differences in KS2 outcomes. The difference between the group averages is the
association between academy status and school performance.
On average, both primary converter academies and similar maintained schools have a
proportion achieving National Curriculum level 4 in English and maths in 2015 that is above
the national average (of 80 per cent), with around 84 per cent of pupils achieving the
expected level.
The proportion of pupils achieving level 4 in English and maths is 0.5 percentage points
higher in primary converter academies than in similar maintained schools. When the pupil
characteristics of the cohort are taken into account, the proportion of pupils achieving level 4

32 Analysis of Academy School Performance in GCSEs 2014
in English and maths is 0.9 percentage points higher in converter academies compared with
similar maintained schools. This is equivalent to one extra pupil out of every 116 achieving
the level 4 threshold in converter academies. However, this difference is not statistically
significant.
After accounting for pupil characteristics, the proportion of pupils achieving National
Curriculum level 4b in English and maths is one percentage point higher in converter
academies than in similar maintained schools. This is equivalent to one extra pupil out of
every 100 achieving level 4b in primary converter academies. This difference is also not
statistically significant.
Pupils scored 0.01 Key Stage 2 points higher in primary converter academies than in similar
maintained schools. When the pupil characteristics of the cohort are taken into account,
pupils scored 0.06 Key Stage 2 points higher in converter academies than in similar
maintained schools. Value-added, a measure of how much progress pupils make in upper
primary school / Key Stage 2, is also 0.06 points higher in converter academies than in
similar maintained schools. None of these differences is statistically significant. One key
stage level equates to six points, so an increase of 0.06 points is equivalent to one additional
pupil out of 100 pupils achieving an extra level at Key Stage 2.
Table 6.1 Difference between converter academies and similar maintained
schools in average Key Stage 2 outcomes
Average Regression model
Proportion of pupils achieving level 4 English & maths
Converter academies 84.7 Similar maintained schools 84.2 Difference 0.5 0.9
95% confidence interval
(-0.0, 1.8)
Proportion of pupils achieving level 4b English & maths
Converter academies 74.7 Similar maintained schools 74.1 Difference 0.6 1.0
95% confidence interval
(-0.1, 2.1)
Key Stage 2 average point score
Converter academies 29.5 Similar maintained schools 29.5 Difference 0.01 0.06
95% confidence interval
(-0.04, 0.16)
KS1 – KS2 value added
Converter academies 100.2 Similar maintained schools 100.2 Difference 0.02 0.06
95% confidence interval
(-0.03, 0.15)
Controls for prior attainment No Yes
Controls for pupil characteristics No Yes
Note: Differences may not exactly match due to rounding.

Analysis of Academy School Performance in GCSEs 2014 33
6.2.2 Narrowing the gap
Table 6.2 compares the proportion of pupils who are eligible for free school meals (FSM)
that achieve level 4 in English and maths in converter academies and similar maintained
schools, and the gap between pupils eligible for FSM and pupils that are not.
On average, a smaller proportion of pupils eligible for FSM achieved level 4 in English and
maths at Key Stage 2 than their non-eligible peers in both primary converter academies and
similar maintained schools. The national average gap is around 14 percentage points.
A slightly smaller proportion of pupils eligible for FSM achieved level 4 in converter
academies than FSM pupils in similar maintained schools. After taking account of pupil
characteristics, the average pupil progress made by FSM pupils in converter academies was
0.4 percentage points higher than in similar maintained schools. However, the difference is
not statistically significant.
The FSM gap is wider in converter academies than in similar maintained primary schools, by
1.3 percentage points. The findings from regression analysis of the FSM gap, which take
into account underlying average differences between schools in the proportion of pupils
eligible for FSM and prior attainment, show the gap is 0.7 percentage points wider in
converter academies than in similar maintained schools. This is equivalent to the existing
FSM gap between schools being around five per cent wider. This difference is also not
statistically significant.
Table 6.2 Difference between converter primary academies and similar
maintained schools in the proportion of FSM-eligible pupils
achieving KS2 level 4 and the gap between FSM-eligible and non-
FSM pupils
Average Regression model
Proportion achieving level 4 (FSM pupils)
Converter academies 74.0 Similar maintained schools 74.4 Difference -0.4 0.4
95% confidence interval
(-1.4, 2.2)
Level 4 gap between FSM and non-FSM pupils
Converter academies -13.4 Similar maintained schools -12.1 Difference -1.3 -0.7
95% confidence interval
(-2.4, 1.1)
Control for prior attainment No Yes
Control for proportion of FSM pupils No Yes
Control for pupil characteristics No Yes
Note: Differences may not exactly match due to rounding.

34 Analysis of Academy School Performance in GCSEs 2014
6.2.3 Ofsted ratings
Figure 6.1 shows the proportions of primary converter academies and similar maintained
schools that received each Ofsted rating in their most recent inspection as of August 2015.13
Table 6.3 presents the proportion of converter academies and similar maintained schools
that are outstanding, good or outstanding, and inadequate, and the difference in terms of
percentage points.
The comparisons show that converter academies are significantly more likely than similar
maintained schools to be rated as outstanding. Primary converter academies are also
slightly more likely to be rated as good or outstanding, and rated as inadequate, but the
differences are not statistically significant.
Figure 6.1 Most recent Ofsted rating (Sept 2012 – August 2015) of primary
converter academies and similar maintained schools
Note: Figures may not exactly sum to 100% due to rounding.
Table 6.3 Difference in Ofsted ratings between primary converter academies
and similar maintained schools
Converter academy
Similar maintained schools
Difference Statistically significant?
Outstanding 18.1% 12.9% 5.2 Yes
Good or outstanding 82.3% 78.8% 3.5 No
Inadequate 2.3% 1.8% 0.4 No
Number of schools 487 2360
Note: Differences may not exactly match due to rounding.
13
Note: Ofsted ratings from inspections of schools between September 2012 and August 2015. Inspections of schools that became academies in 2012/13 are excluded from this analysis if they took place before September 2013.
18%
13%
64%
66%
15%
19%
2%
2%
0% 20% 40% 60% 80% 100%
Converter academies
Similar maintained schools
Outstanding Good Requires Improvement Inadequate
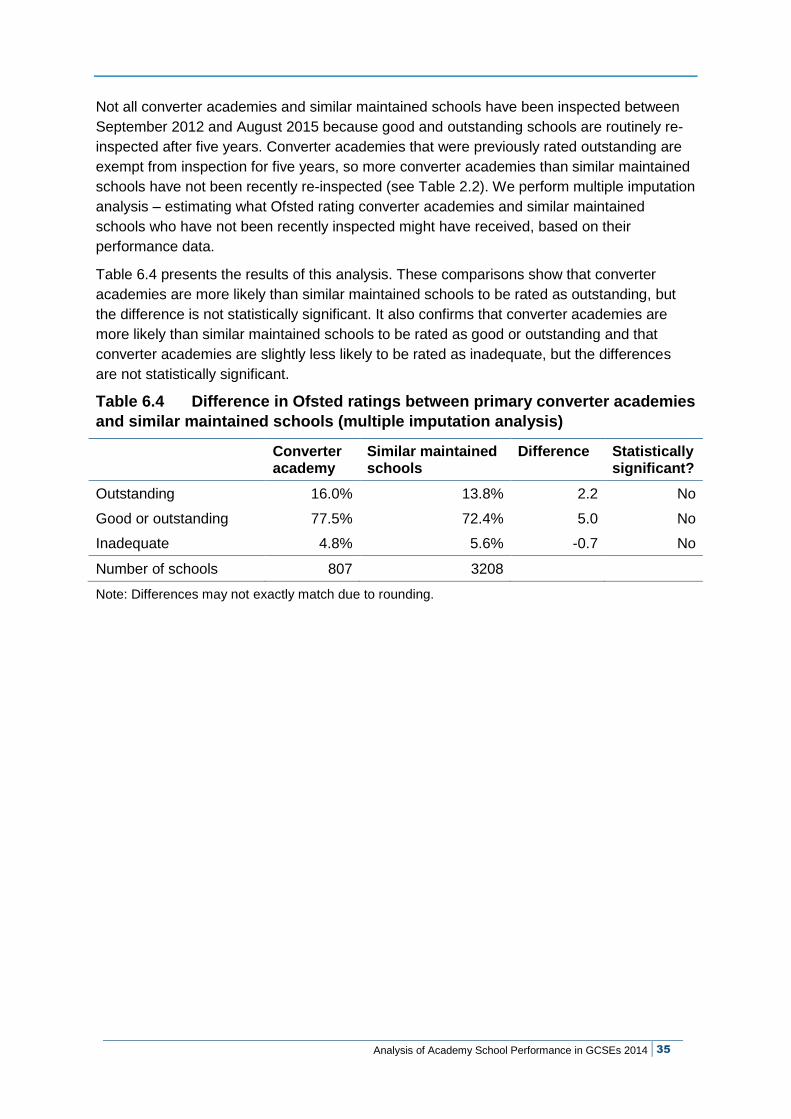
Analysis of Academy School Performance in GCSEs 2014 35
Not all converter academies and similar maintained schools have been inspected between
September 2012 and August 2015 because good and outstanding schools are routinely re-
inspected after five years. Converter academies that were previously rated outstanding are
exempt from inspection for five years, so more converter academies than similar maintained
schools have not been recently re-inspected (see Table 2.2). We perform multiple imputation
analysis – estimating what Ofsted rating converter academies and similar maintained
schools who have not been recently inspected might have received, based on their
performance data.
Table 6.4 presents the results of this analysis. These comparisons show that converter
academies are more likely than similar maintained schools to be rated as outstanding, but
the difference is not statistically significant. It also confirms that converter academies are
more likely than similar maintained schools to be rated as good or outstanding and that
converter academies are slightly less likely to be rated as inadequate, but the differences
are not statistically significant.
Table 6.4 Difference in Ofsted ratings between primary converter academies
and similar maintained schools (multiple imputation analysis)
Converter academy
Similar maintained schools
Difference Statistically significant?
Outstanding 16.0% 13.8% 2.2 No
Good or outstanding 77.5% 72.4% 5.0 No
Inadequate 4.8% 5.6% -0.7 No
Number of schools 807 3208
Note: Differences may not exactly match due to rounding.

36 Analysis of Academy School Performance in GCSEs 2014
7 Discussion
Rapid growth in the number of academy schools to 4,922 by February 2016 makes
continued evaluation of the impact structural changes are having on pupils and schools
important for informing how future policy develops. Government ambitions to make every
school an academy will make continued evaluation of the impact of changes on individual
schools increasingly difficult to assess, as the number of maintained schools gets smaller
and their potential comparability with academies deteriorates. Indeed, the measure in the
Education and Adoption Act 2016 (England. Statutes, 2016) to place an ‘academy order’ on
all schools rated as inadequate removes the possibility of forming a robust comparison
group of similar schools to assess the impact of those changes over time.
The analysis presented in this report has found no evidence that, in the short term,
academies of any phase or type are performing at a lower level of pupil performance than
similar maintained schools. Most of the attainment measures analysed are, on average,
slightly higher in academies than in similar maintained schools, but the differences are
generally small and many are not statistically significant.
This analysis has found an association between academy status and subsequent Ofsted
ratings. Academies of both phases and types are significantly more likely to be rated as
outstanding, which may reflect changes that will eventually lead to improvements in pupil
attainment over the longer term. However, previous research has found that a school’s
Ofsted rating is not a good predictor of future improvements in pupil attainment (Education
Datalab, 2016).
Based on the performance of existing academies, this evidence suggests that making all
remaining local authority-maintained schools into academies is likely to make little difference
to pupil performance, at least in the first few years. Indeed, the vast majority of new
academies would be primary schools, and this analysis has found no compelling evidence
that academy status in primary schools is associated with improved pupil performance in the
short term. This raises questions about whether all schools becoming academies is the best
use of resources.
The average differences in attainment between academies and similar maintained schools
are very small compared with how much attainment varies between all schools. Academy
status explains very little of the between-school variation in pupil progress. Therefore,
research that explores the reasons why pupil progress differs between schools, whether
they are academies or maintained schools, will continue to be important for understanding
what leads to school improvement.
Further research could also explore the impact of academy status on pupils’ later outcomes
such as progression to, and attainment at, further and higher education, subsequent
employment destinations and productivity in the labour market as adults. Although
attainment outcomes are strongly linked to improved life chances as adults, focusing only on
attainment potentially misses the wider impacts that education has on pupils’ prospects as
adults.

Analysis of Academy School Performance in GCSEs 2014 37
References
Cirin, R. (2014). Do Academies Make Use of their Autonomy? (DfE Research Report 366)
[online]. Available:
https://www.gov.uk/government/uploads/system/uploads/attachment_data/file/401455/RR36
6_-_research_report_academy_autonomy.pdf [24 March, 2016].
Department for Education (2012). Attainment at Key Stage 4 by Pupils in Academies 2011
(DfE Research Report 223) [online]. Available:
https://www.gov.uk/government/uploads/system/uploads/attachment_data/file/184062/DFE-
RR223.pdf [24 March, 2016].
Department for Education (2014a). Education Services Grant 2015 to 2016 [online].
Available: https://www.gov.uk/government/publications/education-services-grant-2015-to-
2016 [24 March, 2016].
Department for Education (2014b). Performance of Converter Academies: an Analysis of
Inspection Outcomes 2012 to 2013 (DfE Research Report 322) [online]. Available:
https://www.gov.uk/government/uploads/system/uploads/attachment_data/file/269332/DFE-
RR322_-_Converter_Academies_Ofsted.pdf [24 March, 2016].
Department for Education (2015a) Hundreds of ‘Coasting’ Schools to be Transformed (Press
Release) [online]. Available: https://www.gov.uk/government/news/hundreds-of-coasting-
schools-to-be-transformed [4 April 2016]
Department for Education (2015b). Measuring the Performance of Schools Within Academy
Chains and Local Authorities (Statistical Working Paper 09/2015) [online]. Available:
https://www.gov.uk/government/uploads/system/uploads/attachment_data/file/415659/SFR0
9_2015.pdf [24 March, 2016].
Department for Education (2016a). Open Academies and Academy Projects in
Development: February 2016 (Transparency Data) [online]. Available:
https://www.gov.uk/government/publications/open-academies-and-academy-projects-in-
development [22 February, 2016].
Department for Education (2016b). Revised GCSE and Equivalent Results in England, 2014
to 2015 (Statistical First Release 01/2016) [online]. Available:
https://www.gov.uk/government/uploads/system/uploads/attachment_data/file/494073/SFR0
1_2016.pdf [24 March, 2016].
Department for Education (2016c) Convert to an Academy: Guide for Schools [online].
Available: https://www.gov.uk/guidance/convert-to-an-academy-information-for-schools/1-
before-you-apply [4 April 2016]
Department for Education (2016d) Educational Excellence Everywhere (Policy Paper)
[online]. Available: https://www.gov.uk/government/publications/educational-excellence-
everywhere [6 May 2016]

38 Analysis of Academy School Performance in GCSEs 2014
Department for Education (2016e) Next steps to Spread Educational Excellence Everywhere
Announced (Press Release) [online]. Available: https://www.gov.uk/government/news/next-
steps-to-spread-educational-excellence-everywhere-announced [6 May 2016]
Education Datalab (2016). Floors, Tables and Coasters: Shifting the Education Furniture in
England’s Secondary Schools [online]. Available:
http://www.educationdatalab.org.uk/getattachment/Home/2015-Educationfurniture-
04.pdf.aspx [24 March, 2016].
England. Statutes (2016). Education and Adoption Act 2016. Chapter 6. London: TSO
[online]. Available: http://www.legislation.gov.uk/ukpga/2016/6/pdfs/ukpga_20160006_en.pdf
[1 April, 2016].
Great Britain. Parliament. House of Commons. Education Select Committee (2015).
Academies and Free Schools: Fourth Report of Session 2014–15 (HC 258) [online].
Available:
http://www.publications.parliament.uk/pa/cm201415/cmselect/cmeduc/258/258.pdf [24
March, 2016].
Hutchings, M., Francis, B. and De Vries, R. (2014). Chain Effects: the Impact of Academy
Chains on Low Income Students [online]. Available: http://www.suttontrust.com/wp-
content/uploads/2014/08/chain-effects-july-14-final-1.pdf [24 March, 2016].
Hutchings, M., Francis, B. and Kirby, P. (2015). Chain Effects 2015: the Impact of Academy
Chains on Low-income Students [online]. Available: http://www.suttontrust.com/wp-
content/uploads/2015/07/Chain-Effects-2015.pdf [24 March 2016].
Machin, S. and Vernoit, J. (2011). Changing School Autonomy: Academy Schools and their
Introduction to England’s Education (CEE Discussion Paper 123) [online]. Available:
http://cee.lse.ac.uk/ceedps/ceedp123.pdf [24 March, 2016].
National Audit Office (2010). Department for Education: the Academies Programme (HC
288) [online]. Available: http://www.nao.org.uk/wp-content/uploads/2010/09/1011288.pdf [24
March, 2016].
National Audit Office (2014). Department for Education: Academies and Maintained Schools:
Oversight and Intervention (HC 721) [online]. Available: http://www.nao.org.uk/wp-
content/uploads/2014/10/Academies-and-maintained-schools-Oversight-and-intervention.pdf
[24 March, 2016].
Wilson. J. (2011). Are England’s Academies More Inclusive or More ‘Exclusive’? The Impact
of Institutional Change on the Pupil Profile of Schools (CEE Discussion Paper 125) [online].
Available: http://cee.lse.ac.uk/ceedps/ceedp125.pdf [24 March, 2016].
Worth, J. (2014). Analysis of Academy School Performance in GCSEs 2013. Slough: NFER
and Local Government Association [online]. Available:
https://www.nfer.ac.uk/publications/LGGA02/LGGA02.pdf [24 March, 2016].
Worth, J. (2015). Analysis of Academy School Performance in GCSEs 2014: Final Report.
Slough: NFER and Local Government Association [online]. Available:
https://www.nfer.ac.uk/publications/LGGA03/LGGA03.pdf [24 March, 2016].

Analysis of Academy School Performance in GCSEs 2014 39
Appendix A
Methodology
Measuring the impact of academy status
Comparing levels of achievement
A natural way to begin thinking about the impact sponsored or converter academy status
has had on the attainment progress made by pupils in those schools is to compare the
average exam results of schools that are academies with those that are not. This may be
problematic for a number of reasons.
Figure A1.1 shows Department for Education (DfE) school performance data for 2011-2015
for three different groups of secondary school. The measure presented is the percentage of
pupils that achieved five or more A*-C grade GCSEs including English and maths. The
yellow line shows the average results for the 654 secondary converter academies that
opened (i.e. became an academy) during the 2010/11 academic year, and the green line
shows the average results for the 261 sponsored academies opened during or before the
2009/10 academic year. The blue line shows the average results of the 1227 secondary
schools that were local authority-maintained schools in 2015.
Figure A1.1 Proportion of pupils that achieved five or more A*-C grade GCSEs
including English and maths 2011-2015, by school type
Source: Department for Education (2016b).
-10.7 -8.9
+10.1 +11.4
40
45
50
55
60
65
70
75
2010 2011 2012 2013 2014 2015
Pro
po
rtio
n o
f p
up
ils t
hat
ach
ieved
5+
A*-
C
gra
des (
inclu
din
g E
ng
lish
an
d m
ath
em
ati
cs)
Year
Sponsored academies (opened during or before 2009/10)
Local authority maintained mainstream schools
Converter academies (open during 2010/11)

40 Analysis of Academy School Performance in GCSEs 2014
Comparing levels of achievement between school types does not reveal what impact
changing the school’s type has had on school performance. Sponsored academies have a
level of performance that is below that of LA-maintained schools, but that was the case
before they became academies and is still the case afterwards. Converters tend to be high-
performing, but were already high-performing when they became academies.
Comparing levels of achievement by school type is also problematic because it does not
take into account the ability of pupils when they enter the school. Taking account of the
intake of pupils when comparing achievement measures the progress they make between
phases of education, which is a more accurate reflection of what the school has contributed
to their education than measuring their absolute performance.
Comparing achievement trends
Trends in performance, that is comparing how the gap between the average performance of
academies and the average performance of LA-maintained schools has changed, may offer
a more informative way of looking at the impact of academy status. As an example, in
addition to showing the percentage of pupils achieving five or more A*-C grade GCSEs,
Figure 2.1 above also shows the percentage point gap between the two types of academy
schools and all LA-maintained schools. From this we can see that the performance of pre-
2009/10 sponsored academies has improved more quickly than that of maintained schools,
with the gap narrowing from 10.7 percentage points in 2011 to 8.9 percentage points in
2015. The gap between 2010/11 converter academies and maintained schools has widened
slightly over time, from 10.1 percentage points in 2011 to 11.4 percentage points in 2015.
Again, this measures levels of performance rather than the progress made by pupils
(progress is the pupils’ performance compared with those pupils with a similar level of
performance at the beginning of secondary school).
In addition, such a comparison of trends does not take account of a statistical effect known
as ‘mean reversion’. Mean reversion is the tendency of statistics measured over time to tend
towards the average: if a variable is above average at one point in time it is more likely to be
closer to the average the next time it is measured, and if a variable is below average at one
point in time it is more likely to be closer to the average the next time it is measured.
This is relevant for analysing academies because the two types of academies had above
and below average respective performance when they became academies. Schools became
sponsored academies because of perceived underperformance, which is informed by school
exam results (amongst other considerations), whereas converter academies were given the
choice of becoming academies if their school performance data (amongst other
considerations) indicated they were high-performing. The former had GCSE results below
the national average before they became academies, whereas the latter tended to have
GCSE results above the national average before they became academies. Because we
might have expected a group of schools with initially low or high performance to drift towards
the average over time even if they hadn’t become an academy, it is important to compare
performance with a group of maintained schools that were in similar circumstances at the
time, to take account of ‘mean reversion’.

Analysis of Academy School Performance in GCSEs 2014 41
Comparing schools with similar characteristics
A better comparison is to compare schools that became academies with schools that did not
become academies and had similar characteristics at the time. Then, if mean reversion does
occur, it will affect the subsequent results of both groups of schools. Furthermore, we ensure
the academies and similar maintained schools we are comparing had similar characteristics,
such as the proportion of pupils eligible for free school meals, at the time they either did or
did not become academies. A comparison between academies and a group of similar LA-
maintained schools will take account of mean reversion and the difference in averages is
more likely to represent the difference that academy status has made to schools in similar
circumstances.
An ideal comparison between types of school would be to compare two groups of schools,
where the only difference between the two groups is that one group became academies and
the other group did not. Under these circumstances, randomly allocating academy status to
willing schools and comparing their outcomes over time would give a very robust measure of
impact. But, of course, academy status was not randomly allocated to schools.
Matching a group of LA-maintained schools with similar characteristics to academy schools
can though reduce the underlying differences between the academy and maintained schools
being compared. That said, it is not possible to match schools based on factors that have
not been measured, such as the support that schools receive from their local authority or the
enthusiasm of school leaders for their school to become an academy. These represent
important underlying differences that can affect whether the school became an academy in
the first instance and might also contribute to differences in performance.
The estimated differences between academies and similar LA-maintained schools in this
report therefore cannot necessarily be attributed to the causal impact of academy status on
school performance, because the extent to which the groups differ according to unmeasured
factors that affect performance is unknown. Only under the assumption that the factors that
influenced whether otherwise similar schools became academies or not, such as the attitude
of parents or the local authority to academy status, are unrelated to later performance, can
the differences be interpreted as causal.
An ‘academy order’ to become a sponsored academy is the standard recommendation if a
school was or is under-performing. Why was that standard recommendation applied to some
maintained schools (which became academies) and not to others that had similar exam
results and Ofsted ratings at the same time? It could have been parental or local authority
opposition to academy status, or the policy being applied differently to different schools in
similar circumstances. However, another reason that similar LA-maintained schools are still
maintained in 2015 could be because they have improved in the intervening years. This
factor in particular needs to be borne in mind, as it could bias the comparisons made in this
report.
Despite these issues and challenges with interpreting the findings, matching a group of LA-
maintained schools with similar characteristics to academy schools is the most robust
methodology available for making comparisons. This research uses a method for matching
schools called ‘propensity score matching’, which is explained in the following section.
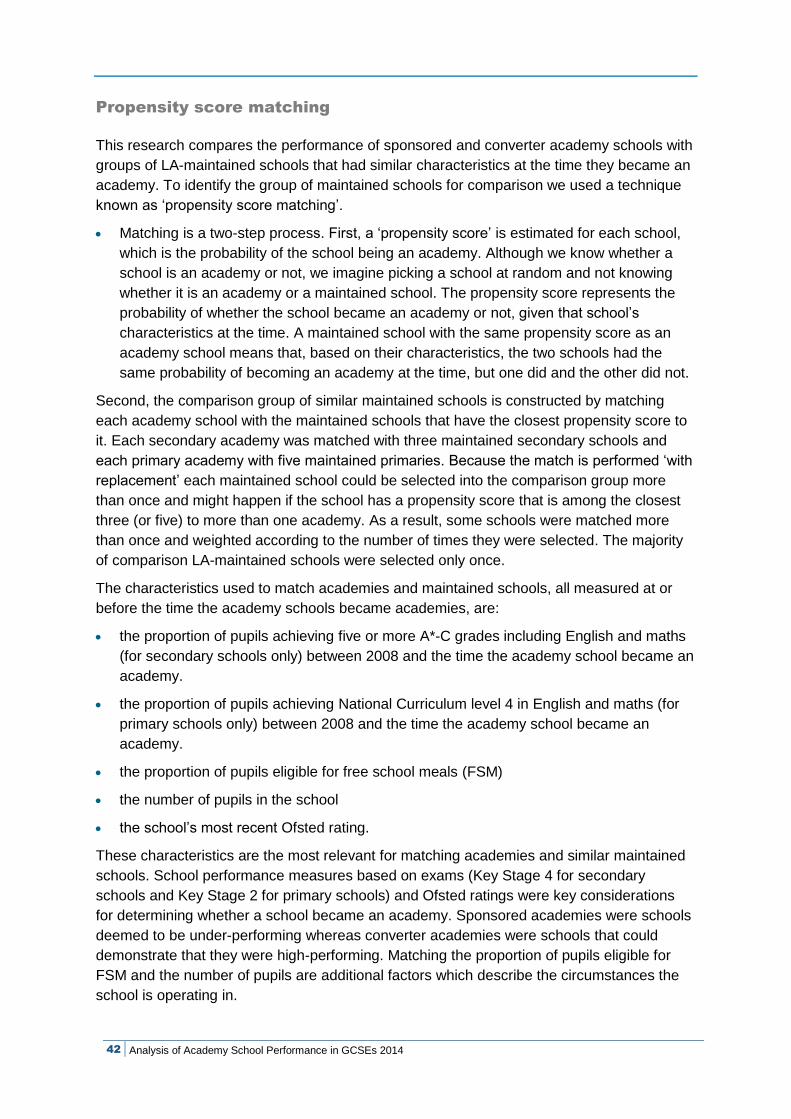
42 Analysis of Academy School Performance in GCSEs 2014
Propensity score matching
This research compares the performance of sponsored and converter academy schools with
groups of LA-maintained schools that had similar characteristics at the time they became an
academy. To identify the group of maintained schools for comparison we used a technique
known as ‘propensity score matching’.
Matching is a two-step process. First, a ‘propensity score’ is estimated for each school,
which is the probability of the school being an academy. Although we know whether a
school is an academy or not, we imagine picking a school at random and not knowing
whether it is an academy or a maintained school. The propensity score represents the
probability of whether the school became an academy or not, given that school’s
characteristics at the time. A maintained school with the same propensity score as an
academy school means that, based on their characteristics, the two schools had the
same probability of becoming an academy at the time, but one did and the other did not.
Second, the comparison group of similar maintained schools is constructed by matching
each academy school with the maintained schools that have the closest propensity score to
it. Each secondary academy was matched with three maintained secondary schools and
each primary academy with five maintained primaries. Because the match is performed ‘with
replacement’ each maintained school could be selected into the comparison group more
than once and might happen if the school has a propensity score that is among the closest
three (or five) to more than one academy. As a result, some schools were matched more
than once and weighted according to the number of times they were selected. The majority
of comparison LA-maintained schools were selected only once.
The characteristics used to match academies and maintained schools, all measured at or
before the time the academy schools became academies, are:
the proportion of pupils achieving five or more A*-C grades including English and maths
(for secondary schools only) between 2008 and the time the academy school became an
academy.
the proportion of pupils achieving National Curriculum level 4 in English and maths (for
primary schools only) between 2008 and the time the academy school became an
academy.
the proportion of pupils eligible for free school meals (FSM)
the number of pupils in the school
the school’s most recent Ofsted rating.
These characteristics are the most relevant for matching academies and similar maintained
schools. School performance measures based on exams (Key Stage 4 for secondary
schools and Key Stage 2 for primary schools) and Ofsted ratings were key considerations
for determining whether a school became an academy. Sponsored academies were schools
deemed to be under-performing whereas converter academies were schools that could
demonstrate that they were high-performing. Matching the proportion of pupils eligible for
FSM and the number of pupils are additional factors which describe the circumstances the
school is operating in.

Analysis of Academy School Performance in GCSEs 2014 43
Matching is performed separately for schools that became sponsored and converter
academies in different years. Secondary schools that became academies in 2009/10 (open
for five years in 2015), 2010/11 (four years), 2011/12 (three years) and 2012/13 (two years)
are included in the analysis. No primary schools became converter academies until 2010/11
and no primary schools became sponsored academies until 2011/12. Consequently, the
analysis includes primary schools that became converter academies in 2010/11, 2011/12
and 2012/13 and those that became sponsored primary academies in 2011/12 and 2012/13.
For the main analysis of the 2015 attainment outcomes we combine the annual samples.
This increases the sample size and therefore the precision of the analysis.
Matching analysis
Sponsored academies
Schools that became sponsored academies were schools perceived to be under-performing
according to their school performance data and / or Ofsted rating. When compared with all
secondary schools in England, sponsored academies had lower proportions of pupils
achieving five or more A*-C grade GCSEs including English and maths, higher proportions
of pupils eligible for free school meals (FSM), and were more likely to have a satisfactory /
requires improvement14 or inadequate Ofsted rating when they became academies.
Likewise, compared with all primary schools in England, sponsored academies had lower
proportions of pupils achieving National Curriculum (NC) level 4 in Key Stage 2 English and
maths when they became academies.
A good comparison group of maintained schools should also have the same characteristics.
Tables A1.1 and A1.2 summarise the average characteristics of sponsored primary and
secondary academies when they became academies and of all maintained primary and
secondary schools at the same time. The differences in characteristics are large and
statistically significant (the ‘Unmatched’ column).
The ‘Matched’ columns show the differences between primary and secondary sponsored
academies and a matched group of maintained primary and secondary schools. In contrast,
the matched maintained schools have very similar characteristics to the sponsored
academies at the time they became academies, and the average differences between
sponsored academies and the group of similar maintained schools are small and not
statistically significant.
Tables A1.1 and A1.2 compare the characteristics of the combined samples of sponsored
academies and maintained schools. Tables A1.5 – A1.10 show the differences in
characteristics between sponsored academies and unmatched and matched maintained
schools for each cohort of academies, which is how the samples were constructed.
14
In 2012, the ‘satisfactory’ Ofsted grade became known as ‘requires improvement’.

44 Analysis of Academy School Performance in GCSEs 2014
Table A1.1 Average characteristics of primary sponsored academies and
maintained primary schools, measured at the time of becoming a
sponsored academy, before and after propensity score matching
Unmatched
Sig?
Matched
Sig? Acad Main Acad Main
Proportion of pupils achieving NC level 4 61% 77% Yes 61% 61% No
Proportion of pupils achieving NC level 4 (previous year)
55% 73% Yes 55% 55% No
Proportion of pupils achieving NC level 4 (average 2008-next previous year)
51% 74% Yes 51% 50% No
Proportion of pupils eligible for FSM in school
34% 17% Yes 34% 35% No
Total number of pupils in school 316 274 Yes 316 307 No
Outstanding Ofsted rating 0% 14% - 0% 0% -
Good Ofsted rating 14% 57% Yes 14% 12% No
Satisfactory/requires improvement Ofsted rating
52% 27% Yes 52% 58% No
Inadequate Ofsted rating 35% 2% Yes 35% 30% No
Number of schools 362 11,458
362 849
Note: Acad = average for sponsored primary academies; Main = average for maintained primary schools; Sig? = is the difference in average characteristics statistically significant (p<0.05). This summary is formed from matching each cohort of academies separately using propensity score matching.
Table A1.2 Average characteristics of secondary sponsored academies and
maintained secondary schools, measured at the time of becoming
a sponsored academy, before and after propensity score
matching
Unmatched
Sig?
Matched
Sig? Acad Main Acad Main
Proportion of pupils achieving 5+ A*-C including English and maths
42% 57% Yes 42% 43% No
Proportion of pupils achieving 5+ A*-C including English and maths (previous year)
37% 55% Yes 37% 37% No
Proportion of pupils achieving 5+ A*-C including English and maths (average 2008-next previous year)
32% 50% Yes 32% 32% No
Proportion of pupils eligible for FSM in school
25% 17% Yes 25% 24% No
Total number of pupils in school 844 1007 Yes 844 844 No
Outstanding Ofsted rating 0% 15% - 0% 0% -
Good Ofsted rating 14% 45% Yes 14% 13% No
Satisfactory/requires improvement Ofsted rating
62% 36% Yes 62% 64% No
Inadequate Ofsted rating 24% 3% Yes 24% 23% No
Number of schools 151 1,137
151 252
Note: Acad = average for sponsored academies; Main = average for maintained schools; Sig? = is the difference in average characteristics statistically significant (p<0.05). This summary is formed from matching each cohort of academies separately using propensity score matching.

Analysis of Academy School Performance in GCSEs 2014 45
Converter academies
Schools that chose to become converter academies were schools able to demonstrate that
they were sufficiently high-performing according to their school performance data and / or
Ofsted rating. For example, compared with all secondary schools in England, converter
academies had higher proportions of pupils achieving five or more A*-C grade GCSEs
including English and maths, lower proportions of pupils eligible for free school meals (FSM),
and were more likely to have an outstanding Ofsted rating when they became academies.
Likewise, compared with all primary schools in England, converter academies had higher
proportions of pupils achieving National Curriculum level 4 in Key Stage 2 English and
maths when they became academies.
Tables A1.3 and A1.4 summarise the average characteristics of primary and secondary
converter academies when they became academies and of all maintained primary and
secondary schools at the same time. The differences in characteristics are large and
statistically significant (the ‘Unmatched’ column).
The ‘Matched’ columns show the differences between primary and secondary converter
academies and a matched group of maintained primary and secondary schools. In contrast,
the matched maintained schools have very similar characteristics to the converter
academies at the time they became academies, and the average differences between
converter academies and the group of similar maintained schools are small and not
statistically significant.
Tables A1.3 and A1.4 compare the characteristics of the combined samples of converter
academies and maintained schools. Tables A1.11 – A1.17 show the differences in
characteristics between converter academies and unmatched and matched maintained
schools for each cohort of academies, which is how the samples were constructed.
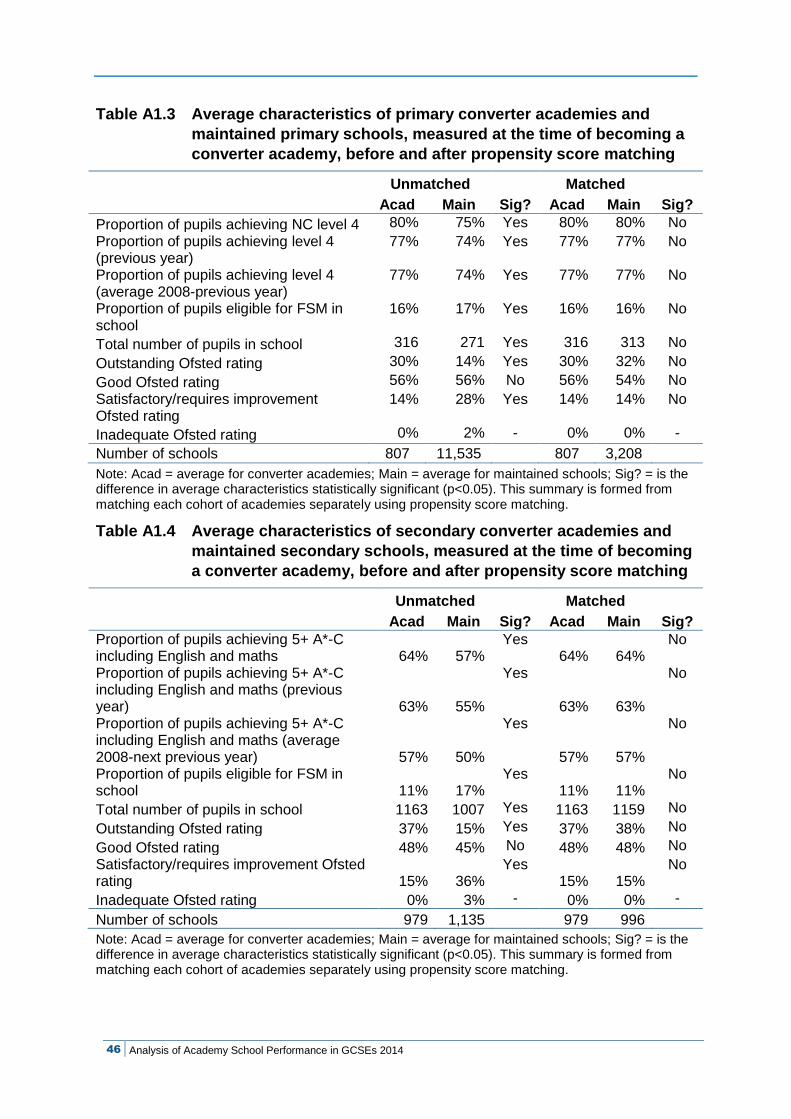
46 Analysis of Academy School Performance in GCSEs 2014
Table A1.3 Average characteristics of primary converter academies and
maintained primary schools, measured at the time of becoming a
converter academy, before and after propensity score matching
Unmatched
Sig?
Matched
Sig? Acad Main Acad Main
Proportion of pupils achieving NC level 4 80% 75% Yes 80% 80% No
Proportion of pupils achieving level 4 (previous year)
77% 74% Yes 77% 77% No
Proportion of pupils achieving level 4 (average 2008-previous year)
77% 74% Yes 77% 77% No
Proportion of pupils eligible for FSM in school
16% 17% Yes 16% 16% No
Total number of pupils in school 316 271 Yes 316 313 No
Outstanding Ofsted rating 30% 14% Yes 30% 32% No
Good Ofsted rating 56% 56% No 56% 54% No
Satisfactory/requires improvement Ofsted rating
14% 28% Yes 14% 14% No
Inadequate Ofsted rating 0% 2% - 0% 0% -
Number of schools 807 11,535
807 3,208
Note: Acad = average for converter academies; Main = average for maintained schools; Sig? = is the difference in average characteristics statistically significant (p<0.05). This summary is formed from matching each cohort of academies separately using propensity score matching.
Table A1.4 Average characteristics of secondary converter academies and
maintained secondary schools, measured at the time of becoming
a converter academy, before and after propensity score matching
Unmatched
Sig?
Matched
Sig? Acad Main Acad Main
Proportion of pupils achieving 5+ A*-C including English and maths 64% 57%
Yes 64% 64%
No
Proportion of pupils achieving 5+ A*-C including English and maths (previous year) 63% 55%
Yes
63% 63%
No
Proportion of pupils achieving 5+ A*-C including English and maths (average 2008-next previous year) 57% 50%
Yes
57% 57%
No
Proportion of pupils eligible for FSM in school 11% 17%
Yes 11% 11%
No
Total number of pupils in school 1163 1007 Yes 1163 1159 No
Outstanding Ofsted rating 37% 15% Yes 37% 38% No
Good Ofsted rating 48% 45% No 48% 48% No
Satisfactory/requires improvement Ofsted rating 15% 36%
Yes 15% 15%
No
Inadequate Ofsted rating 0% 3% - 0% 0% -
Number of schools 979 1,135 979 996
Note: Acad = average for converter academies; Main = average for maintained schools; Sig? = is the difference in average characteristics statistically significant (p<0.05). This summary is formed from matching each cohort of academies separately using propensity score matching.

Analysis of Academy School Performance in GCSEs 2014 47
Primary sponsored academies
Table A1.5 Characteristics of 2011/12 primary sponsored academies and unmatched and matched maintained schools
Unmatched Significant difference?
Matched Significant difference? Academies Maintained Academies Maintained
Proportion of pupils achieving NC level 4 (2012) 59% 77% Yes 59% 59% No
Proportion of pupils achieving NC level 4 (2011) 43% 69% Yes 43% 44% No
Proportion of pupils achieving NC level 4 (average 2008-2010) 48% 75% Yes 48% 48% No
Proportion of pupils eligible for FSM in school (2012) 37% 17% Yes 38% 39% No
Total number of pupils in school (2012) 309 259 Yes 310 300 No
Outstanding Ofsted rating (pre-2012) 0% 15% - 0% 0% -
Good Ofsted rating (pre-2012) 12% 52% Yes 10% 10% No
Satisfactory/requires improvement Ofsted rating (pre-2012) 65% 31% Yes 66% 66% No
Inadequate Ofsted rating (pre-2012) 23% 2% Yes 24% 24% No
Number of schools 106 11,069 106 345
Table A1.6 Characteristics of 2012/13 primary sponsored academies and unmatched and matched maintained schools
Unmatched Significant difference?
Matched Significant difference? Academies Maintained Academies Maintained
Proportion of pupils achieving NC level 4 (2013) 62% 77% Yes 62% 63% No
Proportion of pupils achieving NC level 4 (2012) 60% 77% Yes 60% 60% No
Proportion of pupils achieving NC level 4 (average 2008-2011) 53% 73% Yes 53% 51% No
Proportion of pupils eligible for FSM in school (2013) 32% 17% Yes 32% 33% No
Total number of pupils in school (2013) 316 264 Yes 319 310 No
Outstanding Ofsted rating (pre-2013) 0% 14% - 0% 0% -
Good Ofsted rating (pre-2013) 15% 63% Yes 15% 13% No
Satisfactory/requires improvement Ofsted rating (pre-2013) 46% 22% Yes 46% 55% Yes
Inadequate Ofsted rating (pre-2013) 40% 1% Yes 39% 32% No
Number of schools 256 11,157 256 673

48 Analysis of Academy School Performance in GCSEs 2014
Secondary sponsored academies
Table A1.7 Characteristics of 2009/10 sponsored secondary academies and unmatched and matched maintained schools
Unmatched Significant difference?
Matched Significant difference? Academies Maintained Academies Maintained
Proportion of pupils achieving 5+ A*-C incl English & maths (2010) 36% 54% Yes 36% 37% No Proportion of pupils achieving 5+ A*-C incl English & maths (2009) 31% 50%
Yes 31% 31%
No
Proportion of pupils achieving 5+ A*-C incl English & maths (2008) 27% 48%
Yes 27% 28%
No
Proportion of pupils eligible for free school meals (FSM) in school (2010) 30% 17%
Yes 30% 32%
No
Total number of pupils in school (2010) 796 1017 Yes 796 817 No
Outstanding Ofsted rating (pre-2010) 0% 14% - 0% 0% -
Good Ofsted rating (pre-2010) 21% 45% Yes 21% 18% No
Satisfactory/requires improvement Ofsted rating (pre-2010) 67% 37% Yes 67% 74% No
Inadequate Ofsted rating (pre-2010) 13% 4% Yes 13% 8% No
Number of schools 39 1,111 39 110

Analysis of Academy School Performance in GCSEs 2014 49
Table A1.8 Characteristics of 2010/11 sponsored secondary academies and unmatched and matched maintained schools
Unmatched Significant difference?
Matched Significant difference? Academies Maintained Academies Maintained
Proportion of pupils achieving 5+ A*-C incl English & maths (2011) 42% 57% Yes 42% 43%
No
Proportion of pupils achieving 5+ A*-C incl English & maths (2010) 37% 54% Yes 37% 37%
No
Proportion of pupils achieving 5+ A*-C incl English & maths (average 2008 - 2009) 32% 49% Yes 32% 32%
No
Proportion of pupils eligible for FSM in school (2011) 19% 16% No 19% 20% No
Total number of pupils in school (2011) 849 1014 Yes 855 813 No
Outstanding Ofsted rating (pre-2011) 0% 16% - 0% 0% -
Good Ofsted rating (pre-2011) 15% 44% Yes 16% 18% No
Satisfactory/requires improvement Ofsted rating (pre-2011) 79% 37% Yes 78% 74% No
Inadequate Ofsted rating (pre-2011) 6% 3% No 6% 8% No
Number of schools 32 1,113 32 91
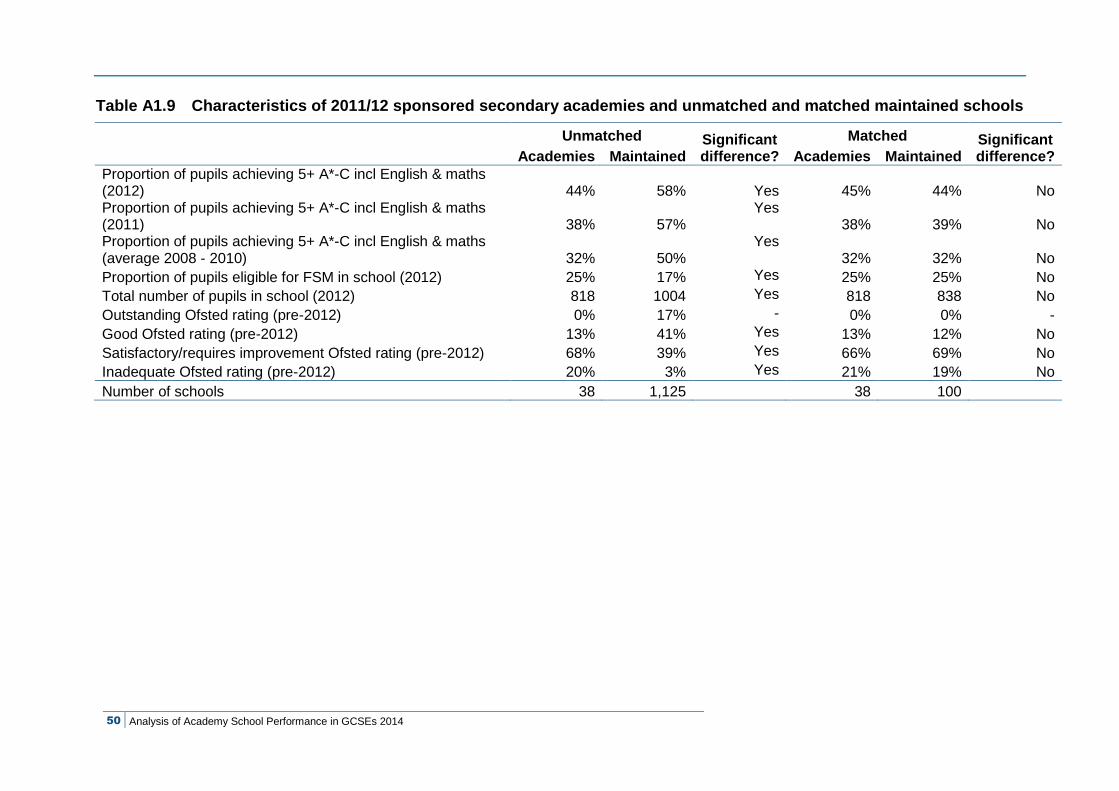
50 Analysis of Academy School Performance in GCSEs 2014
Table A1.9 Characteristics of 2011/12 sponsored secondary academies and unmatched and matched maintained schools
Unmatched Significant difference?
Matched Significant difference? Academies Maintained Academies Maintained
Proportion of pupils achieving 5+ A*-C incl English & maths (2012) 44% 58% Yes 45% 44% No Proportion of pupils achieving 5+ A*-C incl English & maths (2011) 38% 57%
Yes 38% 39% No
Proportion of pupils achieving 5+ A*-C incl English & maths (average 2008 - 2010) 32% 50%
Yes 32% 32% No
Proportion of pupils eligible for FSM in school (2012) 25% 17% Yes 25% 25% No
Total number of pupils in school (2012) 818 1004 Yes 818 838 No
Outstanding Ofsted rating (pre-2012) 0% 17% - 0% 0% -
Good Ofsted rating (pre-2012) 13% 41% Yes 13% 12% No
Satisfactory/requires improvement Ofsted rating (pre-2012) 68% 39% Yes 66% 69% No
Inadequate Ofsted rating (pre-2012) 20% 3% Yes 21% 19% No
Number of schools 38 1,125 38 100

Analysis of Academy School Performance in GCSEs 2014 51
Table A1.10 Characteristics of 2012/13 sponsored secondary academies and unmatched and matched maintained schools
Unmatched Significant difference?
Matched Significant difference? Academies Maintained Academies Maintained
Proportion of pupils achieving 5+ A*-C incl English & maths (2013) 45% 59% Yes 45 47 No Proportion of pupils achieving 5+ A*-C incl English & maths (2012) 40% 58% Yes 40 40 No Proportion of pupils achieving 5+ A*-C incl English & maths (average 2008 - 2011) 37% 52% Yes 37 38 No
Proportion of pupils eligible for FSM in school (2013) 24% 17% Yes 24% 21% No
Total number of pupils in school (2013) 892 991 No 903 897 No
Outstanding Ofsted rating (pre-2013) 0% 14% - 0% 0% -
Good Ofsted rating (pre-2013) 7% 51% Yes 7% 6% No
Satisfactory/requires improvement Ofsted rating (pre-2013) 45% 31% Yes 43% 42% No
Inadequate Ofsted rating (pre-2013) 48% 4% Yes 50% 52% No
Number of schools 42 1,134 42 99
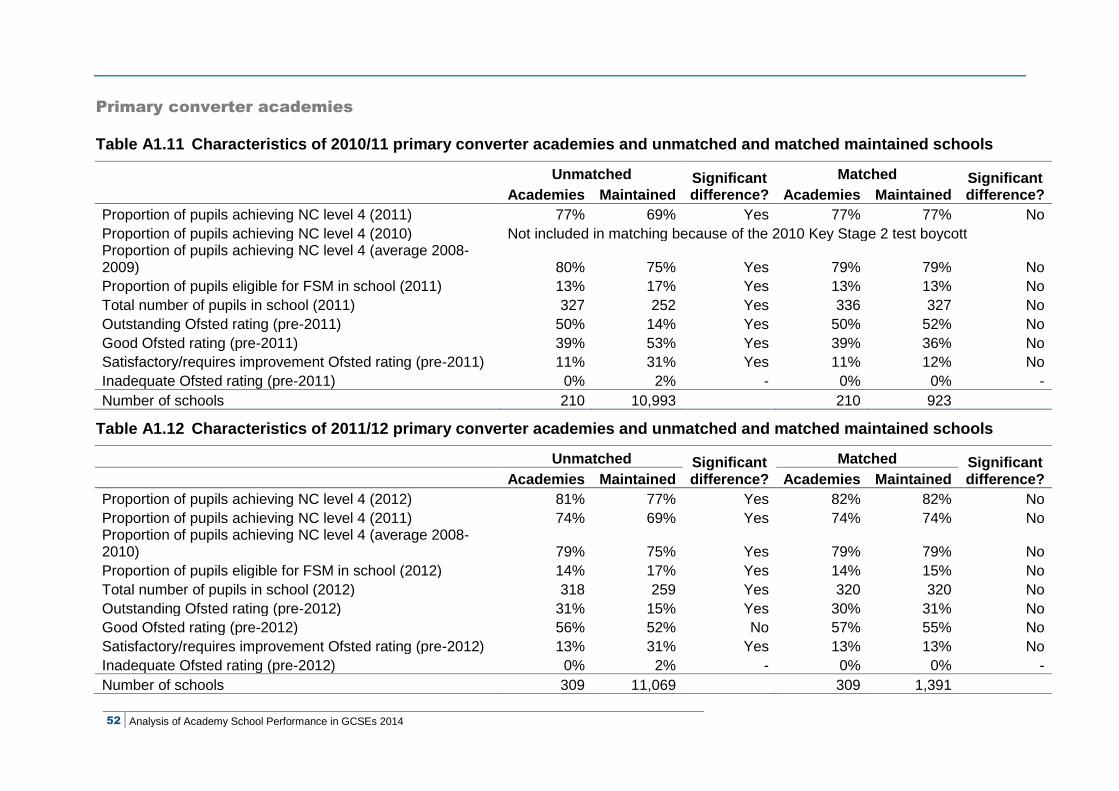
52 Analysis of Academy School Performance in GCSEs 2014
Primary converter academies
Table A1.11 Characteristics of 2010/11 primary converter academies and unmatched and matched maintained schools
Unmatched Significant difference?
Matched Significant difference? Academies Maintained Academies Maintained
Proportion of pupils achieving NC level 4 (2011) 77% 69% Yes 77% 77% No
Proportion of pupils achieving NC level 4 (2010) Not included in matching because of the 2010 Key Stage 2 test boycott Proportion of pupils achieving NC level 4 (average 2008-2009) 80% 75% Yes 79% 79% No
Proportion of pupils eligible for FSM in school (2011) 13% 17% Yes 13% 13% No
Total number of pupils in school (2011) 327 252 Yes 336 327 No
Outstanding Ofsted rating (pre-2011) 50% 14% Yes 50% 52% No
Good Ofsted rating (pre-2011) 39% 53% Yes 39% 36% No
Satisfactory/requires improvement Ofsted rating (pre-2011) 11% 31% Yes 11% 12% No
Inadequate Ofsted rating (pre-2011) 0% 2% - 0% 0% -
Number of schools 210 10,993 210 923
Table A1.12 Characteristics of 2011/12 primary converter academies and unmatched and matched maintained schools
Unmatched Significant difference?
Matched Significant difference? Academies Maintained Academies Maintained
Proportion of pupils achieving NC level 4 (2012) 81% 77% Yes 82% 82% No
Proportion of pupils achieving NC level 4 (2011) 74% 69% Yes 74% 74% No Proportion of pupils achieving NC level 4 (average 2008-2010) 79% 75% Yes 79% 79% No
Proportion of pupils eligible for FSM in school (2012) 14% 17% Yes 14% 15% No
Total number of pupils in school (2012) 318 259 Yes 320 320 No
Outstanding Ofsted rating (pre-2012) 31% 15% Yes 30% 31% No
Good Ofsted rating (pre-2012) 56% 52% No 57% 55% No
Satisfactory/requires improvement Ofsted rating (pre-2012) 13% 31% Yes 13% 13% No
Inadequate Ofsted rating (pre-2012) 0% 2% - 0% 0% -
Number of schools 309 11,069 309 1,391

Analysis of Academy School Performance in GCSEs 2014 53
Table A1.13 Characteristics of 2012/13 primary converter academies and unmatched and matched maintained schools
Unmatched Significant difference?
Matched Significant difference? Academies Maintained Academies Maintained
Proportion of pupils achieving NC level 4 (2013) 79% 77% Yes 79% 79% No
Proportion of pupils achieving NC level 4 (2012) 78% 77% Yes 78% 78% No Proportion of pupils achieving NC level 4 (average 2008-2011) 74% 73% No 73% 73% No
Proportion of pupils eligible for FSM in school (2013) 18% 17% No 18% 18% No
Total number of pupils in school (2013) 297 264 Yes 304 301 No
Outstanding Ofsted rating (pre-2013) 24% 14% Yes 22% 24% No
Good Ofsted rating (pre-2013) 62% 63% No 63% 60% No
Satisfactory/requires improvement Ofsted rating (pre-2013) 14% 22% Yes 15% 16% No
Inadequate Ofsted rating (pre-2013) 0% 1% - 0% 0% -
Number of schools 347 11,157 347 1,607

54 Analysis of Academy School Performance in GCSEs 2014
Secondary converter academies
Table A1.14 Characteristics of 2009/10 secondary converter academies and unmatched and matched maintained schools
Unmatched Significant difference?
Matched Significant difference? Academies Maintained Academies Maintained
Proportion of pupils achieving 5+ A*-C incl English & maths (2010) 73% 54% Yes 73 72 No Proportion of pupils achieving 5+ A*-C incl English & maths (2009) 70% 50% Yes 70 70 No Proportion of pupils achieving 5+ A*-C incl English & maths (2008) 69% 48% Yes 69 69 No
Proportion of pupils eligible for FSM in school (2010) 6% 17% Yes 6% 6% No
Total number of pupils in school (2010) 1272 1017 Yes 1272 1312 No
Outstanding Ofsted rating (pre-2010) 100% 14% Yes 100% 100% No
Good Ofsted rating (pre-2010) 0% 45% - 0% 0% -
Satisfactory/requires improvement Ofsted rating (pre-2010) 0% 37% - 0% 0% -
Inadequate Ofsted rating (pre-2010) 0% 4% - 0% 0% -
Number of schools 19 1,111 19 62

Analysis of Academy School Performance in GCSEs 2014 55
Table A1.15 Characteristics of 2010/11 secondary converter academies and unmatched and matched maintained schools
Unmatched Significant difference?
Matched Significant difference? Academies Maintained Academies Maintained
Proportion of pupils achieving 5+ A*-C incl English & maths (2011) 65% 57% Yes 65% 66% No Proportion of pupils achieving 5+ A*-C incl English & maths (2010) 63% 54% Yes 63% 63% No Proportion of pupils achieving 5+ A*-C incl English & maths (average 2008 - 2009) 58% 49% Yes 58% 58% No
Proportion of pupils eligible for FSM in school (2011) 10% 16% Yes 10% 10% No
Total number of pupils in school (2011) 1207 1014 Yes 1208 1196 No
Outstanding Ofsted rating (pre-2011) 47% 16% Yes 46% 48% No
Good Ofsted rating (pre-2011) 44% 44% No 44% 43% No
Satisfactory/requires improvement Ofsted rating (pre-2011) 9% 37% Yes 9% 10% No
Inadequate Ofsted rating (pre-2011) 0% 3% - 0% 0% -
Number of schools 505 1,113 505 731

56 Analysis of Academy School Performance in GCSEs 2014
Table A1.16 Characteristics of 2011/12 secondary converter academies and unmatched and matched maintained schools
Unmatched Significant difference?
Matched Significant difference? Academies Maintained Academies Maintained
Proportion of pupils achieving 5+ A*-C incl English & maths (2012) 62% 58% Yes 62% 62% No Proportion of pupils achieving 5+ A*-C incl English & maths (2011) 63% 57% Yes 63% 63% No Proportion of pupils achieving 5+ A*-C incl English & maths (average 2008 - 2010) 56% 50% Yes 56% 56% No
Proportion of pupils eligible for FSM in school (2012) 12% 17% Yes 12% 12% No
Total number of pupils in school (2012) 1133 1004 Yes 1137 1139 No
Outstanding Ofsted rating (pre-2012) 25% 17% Yes 25% 25% No
Good Ofsted rating (pre-2012) 53% 41% Yes 53% 54% No
Satisfactory/requires improvement Ofsted rating (pre-2012) 22% 39% Yes 22% 21% No
Inadequate Ofsted rating (pre-2012) 0% 3% - 0% 0% -
Number of schools 313 1,125 313 697

Analysis of Academy School Performance in GCSEs 2014 57
Table A1.17 Characteristics of 2012/13 secondary converter academies and unmatched and matched maintained schools
Unmatched Significant difference?
Matched Significant difference? Academies Maintained Academies Maintained
Proportion of pupils achieving 5+ A*-C incl English & maths (2013) 63% 59% Yes 63% 63% No Proportion of pupils achieving 5+ A*-C incl English & maths (2012) 62% 58% Yes 62% 62% No Proportion of pupils achieving 5+ A*-C incl English & maths (average 2008 - 2011) 55% 52% Yes 55% 55% No
Proportion of pupils eligible for FSM in school (2013) 15% 17% No 15% 14% No
Total number of pupils in school (2013) 1044 991 No 1048 1049 No
Outstanding Ofsted rating (pre-2013) 20% 14% No 20% 21% No
Good Ofsted rating (pre-2013) 59% 51% Yes 59% 59% No
Satisfactory/requires improvement Ofsted rating (pre-2013) 20% 31% Yes 20% 20% No
Inadequate Ofsted rating (pre-2013) 0% 4% - 0% 0% -
Number of schools 142 1,134 142 520

NFER ref. LGGG ISBN. ISBN: 978-1-911039-15-0