analysis and optimization of externally stiffened crush … · analysis and optimization of...
TRANSCRIPT

Thin-Walled Structures 49 (2011) 397–408
Contents lists available at ScienceDirect
Thin-Walled Structures
0263-82
doi:10.1
n Corr
E-m
journal homepage: www.elsevier.com/locate/tws
Analysis and optimization of externally stiffened crush tubes
S. Salehghaffari, M. Rais-Rohani n, A Najafi
Department of Aerospace Engineering, Mississippi State University, Mississippi State, MS 39762, USA
a r t i c l e i n f o
Article history:
Received 2 July 2010
Received in revised form
23 October 2010
Accepted 25 November 2010Available online 6 January 2011
Keywords:
Stiffened tubes
Energy absorbers
Axial crushing
Optimization
Collapse modes
31/$ - see front matter & 2010 Elsevier Ltd. A
016/j.tws.2010.11.010
esponding author. Tel.: +1 662 325 7294; fax
ail address: [email protected] (M. Rais-
a b s t r a c t
Nonlinear finite element analysis is used to investigate the quasi-static axial collapse response of
cylindrical tubes which are externally stiffened by multiple identical rings. The rings divide the long tube
into a series of short thin-walled tubes. It is assumed that the size and shape of integral stiffeners are
controlled through a machining process. The effects of various geometric parameters such as wall
thickness, ring spacing, ring thickness and width on the collapse response, crush force and energy
absorption of monolithic, integrally stiffened steel tubes are studied and used as a general framework for a
design optimization study. Through design and analysis of computer experiments, global metamodels are
developed for the mean crush force and energy absorption, using the radial basis function approximation
technique. Using both single- and multi-objective design optimization formulations, optimum designs for
different response characteristics are found. The crush mode in the form of progressive collapse or
buckling is found to heavily depend on the ratio of stiffener spacing to stiffener height as well as the ratio
of wall thickness to stiffener thickness. The optimization results show the viability of externally stiffened
tubes as efficient energy absorbers.
& 2010 Elsevier Ltd. All rights reserved.
1. Introduction
Energy absorption characterization of tubular components hasbeen the subject of many experimental and theoretical studies [1–4].Responses under both dynamic (crash) and quasi-static (crush) loadshave been reported. Tube models found in the literature are fairlydiverse in material (metallic or polymeric composite) and geometry,including circular, square and octagonal tubes [4–5] with single- andmulti-cell configurations [6], tapered and s-shaped tubes and tubemodels that have honeycomb or foam-filled cavities [7,8]. Amongstthem, circular tubes made of ductile materials have attracted muchmore attention, due to their plastic deformation, high stiffness- andstrength-to-weight characteristics combined with an ease of manu-facturing. These tubes can dissipate an impact energy by variousmeans, including plastic deformation, friction or tearing [5,9].
When a metallic tube is crashed into or crushed against a flatrigid wall, it undergoes an irreversible process whereby the crash/crush-induced energy is dissipated through plastic deformation orinelastic buckling. Generally, progressive plastic collapse with astable mode of deformation (tube axis remains straight) offers agreater capacity for energy absorption than inelastic buckling thatleads to an unstable response (local buckling and bending) withplastic deformation in only limited regions. As such, enhancedspecific energy absorption (SEA, the ratio of total energy absorptionto the tube mass) and stroke efficiency (SE, the ratio of deformed
ll rights reserved.
: +1 662 325 7730.
Rohani).
length to the total tube length [3]) can be achieved by triggering theprogressive collapse response.
Another means for energy dissipation is through the inversionmode of deformation when the tube is pressed against a rigid plug ordie of certain shape, which causes the inward or outward folding(peeling or tearing) of the tube [10–14]. This mode occurs within thespecific range of geometrical dimensions for the tube as well as thefriction between the contacting surfaces. The low SE and strongsensitivity to external parameters, such as the loading condition, limitthe viability of inversion mode as an energy absorption mechanism.
Axial splitting and curling of tubes against conical dies is alsoused as an energy absorption method [15–17]. In this failuremechanism, a large portion of tube length contributes to an energydissipation (i.e., high SE), and the collapsing force is relativelysteady. However, this method provides low crush load, and thecrush performance is strongly affected by such external parametersas the loading direction.
Recently, plastic expansion of circular tubes by rigid inserts hasbeen introduced as an efficient way to absorb energy without anyserious sensitivity to loading direction and other external para-meters [18]. However, this method yields low SE and SEA valueswhile it requires lower values of mean crush load to protect thestructure from damage. The combination of different methods ofenergy dissipation (inversion and axial crushing of metal tubes ina single collapsible design) was investigated for the first time byChirwa [19].
Among various methods of energy dissipation in crush tubes,progressive folding mechanism provides a relatively constant loadand fairly high SE. In comparison to other energy dissipation

Fig. 1. Externally stiffened circular tube with associated geometric design para-
meters [35].
S. Salehghaffari et al. / Thin-Walled Structures 49 (2011) 397–408398
methods, a greater percentage of tube material can contribute toplastic deformation providing high SEA. However, all of these favor-able energy absorption characteristics can be achieved when the tubecrushes progressively, and numerous experimental and theoreticalstudies [20–25] have shown that various parameters such as tubegeometry, material properties, boundary conditions and loadingconditions may affect the progressive crushing response.
Various design methods have been proposed to increase the SE andSEA of thin-walled tubes under axial crush loads. These investigationshave also aimed to improve the stabilization of the collapse processand reduce the magnitude of peak load at the initial stage of thecollapse. Abah et al. [26] investigated the effect of corner cutouts toinitiate collapse and reduce the peak load of rectangular tubes underan axial load. Lee et al. [27] introduced triggering dents and investi-gated the effect of two types of dents, full- and half-dents, with the aimof decreasing the peak load. Shakeri et al. [28] introduced plasticbuckling modes as an initial geometric imperfection in the post-buckling analysis to encourage progressive crushing and reducemaximum crush force in cylindrical tubes. Daneshi and Hosseinipour[29] showed that cutting circumferential grooves alternatively insideand outside of the tube at predetermined intervals could be aneffective tool to force the plastic deformation to form at predeterminedintervals along the tube. Using this pattern, it was possible to controlthe collapse shape of thin-walled structures. Singace and El-Sobky [30]investigated the energy absorption characteristics of corrugated tubesand showed that corrugations force plastic deformation to occur atpredetermined intervals along the tube length and improve theuniformity of the load–displacement behavior of axially crushedtubes. Moreover the corrugated design of cylindrical tubes made itpossible to predict and control the collapse mode in each corrugation,in order to optimize the energy absorption capacity of the tube.
Internal stiffening of metallic tubes with filler materials such aswood, metallic or non-metallic honeycomb and foam has also beenshown to improve an energy absorption capacity in a number ofinvestigations [31–33]. Non-compact crushing and global bucklingbehavior under axial loads are eliminated in the foam-filled tubes.Moreover in comparison with empty tubes of the same size, foam-filled tubes are less affected by loading parameters (i.e., direction anduniformity) and are more stable during the collapse process. Bycutting a tube in several portions followed by the coaxial assembly,Abdul-Latif et al. [34] found that they could encourage the axisym-metric mode in an axial crushing of circular tubes.
Recently, Salehghaffari et al. [35] developed a new design conceptto control energy absorption characteristics of thin-walled circulartubes under an axial compression. By machining wide circumferen-tial grooves from the outer surface of a thick-walled tube at specificintervals, they arrived at a general design concept for an integrallystiffened (monolithic) tube, as shown in Fig. 1. The thicker portions(rings) essentially act as external stiffeners for the enclosed thin-walled tube sections. When the stiffened tube is subjected to an axialcompression, the thin-walled sections between two adjacent ringstiffeners fold resulting in an enhanced energy absorption. This designmodel has been shown to be efficient in encouraging concertina folds,improving crushing stability, and making the component less sensitiveto loading parameters, while improving its energy absorption char-acteristics such as an SE, maximum and mean crush forces and SEA.
Structural optimization techniques have been applied recentlyto optimize energy absorption characteristics of energy absorbingcomponents. For an enhanced computational efficiency, surrogatemodels (metamodels) are often used in lieu of nonlinear finite elementanalysis (FEA) in structural design optimization studies. Responsesurface methodology (RSM) is among the commonly used metamo-deling techniques used in crashworthiness optimization [36–38].Yamazaki and Han [39], Lee [40] and Chiandussi et al. [41] haveapplied an RSM method in crashworthiness optimization of energyabsorbing devices. However, the drawback of using second-order
response surface (RS) models is that they may not be appropriate forcreating global models that are accurate over the entire design spacefor highly nonlinear problems. Although it is possible to develop higherorder RS models, they may not be effective or appropriate forcrashworthiness optimization, partly due to the high computationalcost in an extensive sampling of the design space [42]. Recent inno-vations to improve both the accuracy and efficiency of an RSM includethe development and application of the sequential local RSM [43,44]adaptive RSM [45], and trust-region-based RSM [46]. These approa-ches partition the feasible design space into multiple small regions thatcan be accurately represented by low-order RS models.
In this paper, we present results of nonlinear finite element (FE)simulations of ring-stiffened tubes for various combinations of geo-metric parameters followed by shape and sizing optimization ofsuch tubes for different choices of objective and constraint func-tions. Sampling of the design space is done using the LatinHypercube Sampling (LHS) technique, while Radial Basis Functions(RBF) are used to build response metamodels that relate SEA andpeak crush force to the geometric design variables associated withthe externally stiffened tube model. Genetic algorithms (GA) areused as the optimizer for solving both constrained single- andmulti-objective optimization problems.
2. Design and analysis of computer experiments
2.1. Description of an FE model
The basic geometry of the FE model, created according to thesuggested guidelines [47], is shown in Fig. 2. The number of ringstiffeners in Fig. 1 is defined as an N+1, where N represents thenumber of thin-walled sections along the length of the tube. Thestiffener section is defined by the geometric parameters d and w,whereas the thin-walled portions are defined by dimensions t
and S. Hence, in the thick (stiffened) sections, total wall thickness ist+d. The tube’s inner diameter Di¼52 mm and length L¼250 mmare held fixed, while its other geometric parameters are allowed tovary in the optimization process as discussed later. It should benoted that S, w and N are related as
NSþðNþ1Þw¼ L ð1Þ
Through parameterization, the FE mesh can be readily updatedfor different combinations of design variables. A rigid plate, placed

S. Salehghaffari et al. / Thin-Walled Structures 49 (2011) 397–408 399
at the bottom of the stiffened tube, is described as a moving rigidbody with all degrees of freedom, except translation along thetube’s axis set to zero. Also, all nodes at the top edge of the stiffenedtube are constrained in all degrees of freedom.
We used the explicit finite element analysis (FEA) code LS-DYNA, version 971 to perform all nonlinear axial crush simulations.The quasi-static compression was simulated by moving the rigidplate with a constant upward velocity of 0.1 m/s. In order to reducethe time steps and computational time, the mass density of thetube material (steel) was scaled up 1000 times the original density.Thus, under this loading condition, no inertial or dynamic effectswere present in the deformation process.
To define contact between the moving rigid plate and the statio-nary tube, ‘‘surface-to-surface’’ contact type was adopted with tubeand plate nodes defined as ‘‘slave’’ and ‘‘master’’ nodes, respectively.
Fig. 2. FE model of the externally stiffened tube.
Table 1Design points used in an RBF fitting.
Design # N d (mm) t (mm) S (mm) w (mm)
1 5 1.91 1.93 27.08 19.10
2 5 2.15 1.26 43.75 5.21
3 5 1.55 2.53 32.29 14.76
4 5 2.88 2 36.46 11.28
5 5 2.28 1.07 31.25 15.63
6 5 2.03 1.73 44.79 4.34
7 5 0.46 2.2 38.54 9.54
8 5 0.58 2.33 26.04 19.97
9 5 2.4 1.2 47.92 1.74
10 5 0.95 1.8 29.17 17.36
11 5 0.7 2.47 42.71 6.08
12 5 1.67 1.67 34.37 13.02
13 5 1.19 2.13 33.33 13.89
14 5 2.76 2.4 45.83 3.47
15 5 1.43 1 41.67 6.94
16 5 0.34 1.47 48.96 0.87
17 5 1.07 1.6 46.88 2.60
18 5 2.64 2.07 25.00 20.83
19 5 0.22 1.13 28.13 18.23
20 5 1.79 1.40 40.65 7.81
21 5 1.55 1.80 37.50 10.42
22 5 2.52 1.33 35.42 12.15
23 5 0.83 2.27 30.21 16.49
24 3 2.59 2.57 66.00 13.00
A ‘‘single-surface’’ interface was also selected to prevent penetrationof the contacting elements in the tube model. The friction coefficientfor surface-to-surface and single-surface contacts was set to 0.3 and0.15, respectively.
We used solid (hex8) elements in all computer simulations. Thesensitivity of the simulated results to mesh density for eachcomputer experiment was analyzed in order to choose a suitableelement size for the simulation. In some computer experiments,program termination due to the appearance of negative volume ofsolid elements was observed. This was caused mainly by theelement Jacobian calculation at geometric points of the outerboundary of highly deformed solid elements [47]. In some com-puter experiments, rapid compression of elements in the stiffenersections as well as the nearby elements in the thin-walled sectionsresulted in an occurrence of a negative volume in solid elements.Through several computer simulations, it was discovered that thefollowing factors contributed to the negative volume.
Element size: computational experiments indicated that highlydeformed areas of the stiffened tube with smaller element size contri-bute to negative volume calculation. Hence, element size was increa-sed from 1�1 (models without negative volume problem) to 2.3�2.3 (models with negative volume problem) to prevent this problemwithout sacrificing the solution accuracy. Therefore, suitable elementsize varies from 1�1 to 2.3�2.3 in different tube models. Note thatan element size of 2.3�2.3 is found to be the closest element size to1�1 that would help prevent the problem of negative volume, whilemaintaining the simulation accuracy.
Hourglass: deformation of solid elements in an hourglass modecan also result in the negative volume. Hence, we used hourglasscontrol option in LS-DYNA simulations to resolve this problem. Forhourglass control, we used Eq. (6) [47] in LS-DYNA with hourglasscoefficient of 0.1, linear bulk velocity coefficient of 1.5 andquadratic bulk velocity coefficient of 0.06.
Interior contact setting: since solid elements in the thick regionsof the tube have minimal participation in the plastic deformation,an interior contact setting was used to help alleviate the negativevolume problem.
In the quasi-static simulations of the models in Table 1, weconsidered all of the factors mentioned above and took correctiveactions to ensure the solution accuracy.
Design # N d (mm) t (mm) S (mm) w (mm)
25 3 0.51 2.37 75.00 6.25
26 3 0.93 1.57 45.00 28.75
27 3 2.17 1.46 60.00 17.5
28 3 1.76 2.49 69.00 10.75
29 3 1.55 1.8 63.00 15.25
30 3 1.14 1 54.00 22.00
31 3 1.96 1.91 78.00 4.00
32 3 2.79 1.8 42.00 31.00
33 3 0.31 1.23 57.00 19.75
34 3 1.34 2.14 51.00 24.25
35 7 0.51 1.46 29.86 5.13
36 7 1.55 2.37 26.00 8.50
37 7 2.17 1 22.14 11.88
38 7 2.79 2.14 27.29 7.38
39 7 1.96 1.57 19.57 14.13
40 7 2.59 1.69 33.71 1.75
41 7 1.55 1.8 26.00 8.50
42 7 0.93 1.91 31.14 4.00
43 7 0.1 1.34 23.43 10.75
44 7 1.76 1.23 32.43 2.88
45 7 1.14 2.26 18.29 15.25
46 7 0.31 1.80 17.00 16.38
47 7 0.72 2.49 28.57 6.25
48 7 2.38 2.03 20.86 13.00

Fig. 4. Mechanism of plastic collapse in externally stiffened cylindrical tubes under
an axial compression [48,49].
S. Salehghaffari et al. / Thin-Walled Structures 49 (2011) 397–408400
The material in the FE model is treated as an elastic–plastic with theYoung’s modulus¼210 GPa, kinematic hardening (material modeltype 3 in LS-DYNA) and von Mises yield criterion specified. The truestress–true strain curve of seamless steel, obtained by a standardtensile test as shown in Fig. 3, was used to approximate the data pointsin the plastic region of curve for all numerical simulations. Also, therigid movable plate was simulated using the material model type 20.All numerical simulations of design samples were performed on aPentium PC 3.2 GHz with a typical simulation time of 6–8 h. Compar-ison of FE results of some samples with those of experiments [35]validated the accuracy of FE model predictions.
2.2. Basic mechanism of plastic collapse
In the recent articles by Salehghaffari et al. [48,49], the results of anin-depth theoretical and experimental investigation into the collapsemechanism of ring-stiffened circular tubes were presented. Assuminga uniform and stable crush response, the general mechanism for anenergy absorption in ring-stiffened circular tubes is illustrated inFig. 4. As the axial load is increased, the thin-walled segmentssupported by the ring stiffeners undergo plastic deformation that isdominated by the formation of three plastic hinges. The so-calledconcertina folds are generated in the thin-walled sections of the tubein a fairly sequential fashion. While stiffeners help stabilize thecrushing process, they generally provide no contribution to plasticdeformation and energy absorption. The only exception is in the caseswhere dimension d and/or w (Fig. 1) are/is reduced to the level thatmakes the stiffeners less rigid and susceptible to the lateral bending.Hence, SE, SEA and crush force are generally governed by the responseof the thin-walled segments of the tube. Depending on the geometricproperties of the tube, the crush response may become non-uniformresulting in reduced energy absorption capacity [48,49].
2.3. Generation of random samples
Based on our previous experience with an analysis of externallystiffened circular tubes [35,48,49], the optimization search islimited to design samples with 4, 6 and 8 stiffeners (i.e., N+1¼4,6 and 8). For generation of random samples, it is necessary to havebounds on individual design variables. Assuming w¼0, it can beseen from Fig. 1 that the upper bound for S corresponds to Nmin¼3
Fig. 3. True stress–true strain curve for seamless steel.
and is given by
Supper ¼L
Nmin¼
250
3¼ 83:3 ð2Þ
The thin-walled portions of the tube are the principal con-tributors to plastic deformation with potential length equal toN� S. For SE¼0.5 (i.e., at least 50% of the tube length is crushed), wefind the lower bound on an S as
Slower ¼L
2Nmax¼
250
2� 7¼ 17:85 ð3Þ
It is worth noting that the tube samples may have SE valuesslightly o0.5 due to the fact that in the selected samples w40.Substituting Eqs. (2) and (3)b into Eq. (1), the bounds for w arefound to be
wlower ¼ 0 wupper ¼L
2ðNminþ1Þ¼
250
2ð3þ1Þ¼ 31:25 ð4Þ
Also, based on the previous observation of the effects of t and d
on the plastic collapse mode and the corresponding mean crushforce [35,48,49], the following bounds are imposed.
1rtr2:6 0rdr3 ð5Þ
Using an LHS technique and the selected bounds on the designvariables, we examined 48 design points. In the sampling process,the random values for w and S for each design point were put intoEq. (1) to calculate N. If the N value was found to be a non-integer, itwas modified to a number closest to 3, 5 or 7. In the second step,values of w and modified N were put into Eq. (1) to obtain themodified value of S for each sample. Geometric parameters of therandomly selected design samples with modified values of S areshown in Table 1. Among the 48 design-of-experiments (DOE)

S. Salehghaffari et al. / Thin-Walled Structures 49 (2011) 397–408 401
samples, 11, 23 and 14 of them have 4, 6 and 8 stiffeners,respectively.
2.4. Simulation results and discussion
The simulation results for different tube samples are given inTable 2. They include the values for tube weight, SEA, maximumand average crush forces (Pmax, Pmean), crush force efficiency(i.e., Pmean/Pmax), stroke or crush length, stroke efficiency and anindication of crushing stability. Here, the crush length refers to themaximum distance traveled by the moving rigid plate at the bottom ofthe tube before an unstable crushing is observed in the simulationresults. Stable crush mode refers to the progressive collapse along thetube axis, whereas an unstable mode involves buckling with orwithout the progressive collapse. In the latter case, a lateral rotationor bending of 101 in the tube axis is used as a criterion for identifyingthe mixed crush modes that are buckling dominated.
SEA is often used as an accurate measure of energy absorptioncapacity of the component [5]. On the other hand [3,5], an ideal
Table 2FEA results for the randomly selected DOE design points.
Design # Weight (kg) SEA (kJ/kg) Pmax (kN) Pmean (kN
1 0.947 11.94 142.70 88.28
2 0.507 18.17 87.74 49.83
3 1.04 19.17 190.84 138.19
4 0.942 20.79 148.40 121.09
5 0.642 6.95 76.18 34.38
6 0.643 21.85 124.77 74.74
7 0.766 22.37 166.72 105.24
8 0.872 16.22 173.40 120.20
9 0.425 12.28 81.91 35.04
10 0.730 10.11 128.92 69.28
11 0.859 18.60 188.98 115.74
12 0.730 14.92 120.14 71.61
13 0.845 17.85 156.21 105.03
14 0.882 25.59 184.71 116.01
15 0.405 18.00 68.60 39.61
16 0.483 20.16 103.69 54.20
17 0.548 16.56 113.78 58.51
18 1.160 7.05 151.42 80.6
19 0.400 10.08 70.36 33.49
20 0.573 16.85 98.23 55.86
21 0.728 17.84 132.63 84.45
22 0.691 9.01 98.18 44.05
23 0.870 18.44 169.23 120.12
24 0.945 20.00 169.01 113.27
25 0.806 26.79 179.58 120.39
26 0.662 10.46 116.67 61.17
27 0.687 13.05 103.92 60.03
28 0.939 24.97 188.98 127.15
29 0.725 15.76 134.63 75.83
30 0.460 8.52 70.25 30.04
31 0.674 16.27 137.24 79.35
32 1.087 6.71 129.73 70.32
33 0.433 10.73 83.22 38.82
34 0.892 13.64 166.26 96.30
35 0.506 21.51 117.62 58.28
36 0.939 15.96 175.58 107.23
37 0.608 7.43 69.00 33.60
38 0.947 15.15 154.84 91.73
39 0.824 6.86 110.75 51.59
40 0.603 19.40 121.38 67.4
41 0.740 15.11 130.05 73.00
42 0.672 24.69 137.82 87.89
43 0.449 14.56 116.5 51.17
44 0.452 15.85 112.23 41.01
45 0.947 13.26 170.98 123.20
46 0.648 16.29 132.25 79.39
47 0.881 23.45 184.88 118.12
48 1.025 10.09 147.81 89.53
energy-absorbing design should provide a desirable constant meancrush force–crush distance response under an axial loading. Gener-ally, the initial peak in the crush–force–crush distance responserepresents the maximum crush force (Pmax) that typically occurs soonafter the start of the crush process and is due to the initial elasticresistance. While it is desirable to increase an SEA, it is preferable todecrease Pmax in search of an optimum tube design. Moreover if tuberemains fairly straight during the crush process, its energy absorptioncapacity will be enhanced.
Figs. 5 and 6 show the collapsed shapes separated by the modeshapes. While most ring-stiffened tube designs undergo stablecrushing, others experience lateral bending resulting in crushinginstability. It is worth noting that a prismatic circular tube with thesame length-to-diameter ratio as the average among the stiffenedtube models (i.e., 4.81) would experience global buckling at theinitial stages of experiencing axial compression.
Numerical simulation of samples in Table 1 with differentgeometric properties reveals that it is possible to identify the tubecharacteristics that result in stable or unstable crush responses.Fig. 7(a) shows the plot of S/w versus t/(d+t) and it indicates that
) Crush force
efficiency
Stroke length
(mm)
Stroke
efficiency
Crushing
stability
0.62 128.09 0.51 Stable
0.57 184.92 0.74 Stable
0.72 144.26 0.58 Stable
0.82 161.75 0.64 Stable
0.45 129.85 0.52 Stable
0.60 187.99 0.75 Stable
0.63 162.80 0.65 Stable
0.69 118.39 0.47 Stable
0.43 148.93 0.60 Unstable
0.54 106.59 0.43 Stable
0.61 138.02 0.55 Unstable
0.60 152.05 0.60 Stable
0.67 143.63 0.57 Stable
0.63 194.54 0.78 Unstable
0.58 184.00 0.74 Stable
0.52 179.67 0.72 Unstable
0.51 155.13 0.62 Unstable
0.53 101.48 0.41 Stable
0.48 120.37 0.48 Unstable
0.57 172.87 0.69 Stable
0.64 153.82 0.62 Stable
0.45 141.33 0.57 Stable
0.71 133.58 0.53 Stable
0.67 166.67 0.67 Stable
0.67 179.34 0.72 Stable
0.52 113.19 0.45 Stable
0.58 149.32 0.60 Stable
0.67 184.41 0.73 Stable
0.56 150.67 0.60 Stable
0.42 130.46 0.52 Stable
0.58 138.19 0.55 Unstable
0.54 103.66 0.41 Stable
0.47 119.71 0.47 Unstable
0.58 126.3 0.51 Stable
0.50 186.78 0.57 Stable
0.61 139.74 0.56 Stable
0.49 134.43 0.54 Stable
0.59 156.38 0.63 Stable
0.47 109.50 0.44 Stable
0.56 173.57 0.69 Unstable
0.56 153.12 0.61 Stable
0.64 188.74 0.75 Stable
0.44 127.73 0.51 Unstable
0.44 174.67 0.70 Unstable
0.72 101.95 0.41 Stable
0.60 132.93 0.53 Unstable
0.64 174.90 0.7 Stable
0.61 115.57 0.59 Stable
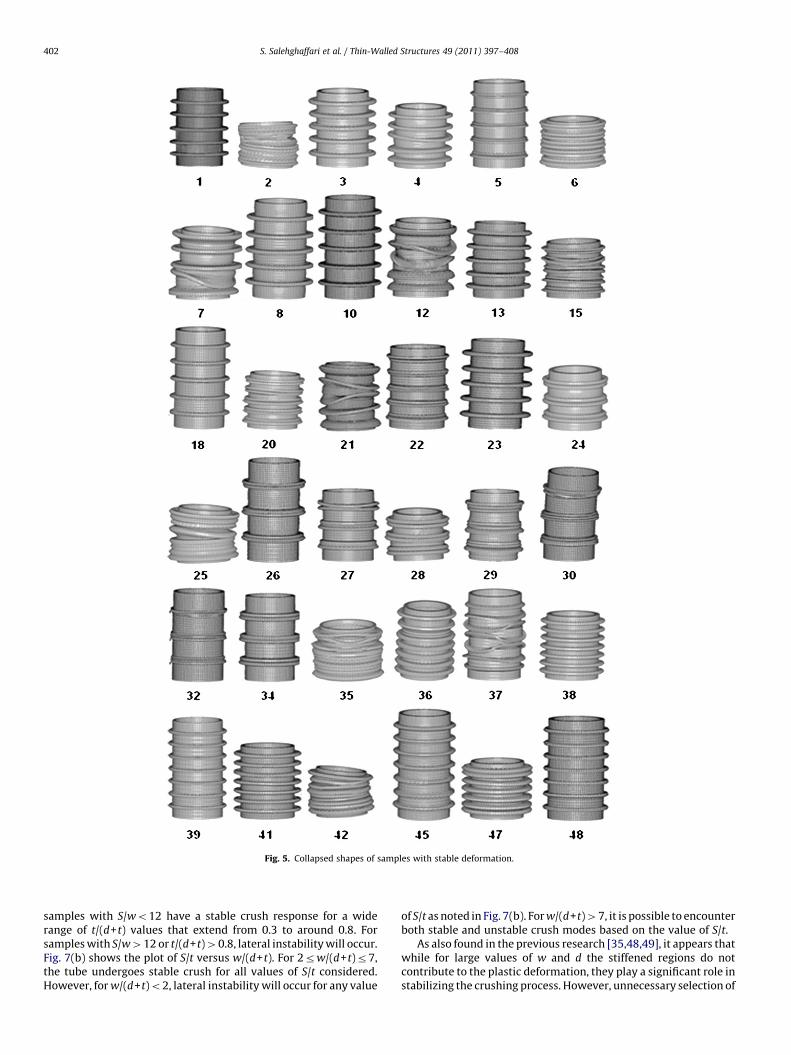
Fig. 5. Collapsed shapes of samples with stable deformation.
S. Salehghaffari et al. / Thin-Walled Structures 49 (2011) 397–408402
samples with S/wo12 have a stable crush response for a widerange of t/(d+t) values that extend from 0.3 to around 0.8. Forsamples with S/w412 or t/(d+t)40.8, lateral instability will occur.Fig. 7(b) shows the plot of S/t versus w/(d+t). For 2rw/(d+t)r7,the tube undergoes stable crush for all values of S/t considered.However, for w/(d+t)o2, lateral instability will occur for any value
of S/t as noted in Fig. 7(b). For w/(d+t)47, it is possible to encounterboth stable and unstable crush modes based on the value of S/t.
As also found in the previous research [35,48,49], it appears thatwhile for large values of w and d the stiffened regions do notcontribute to the plastic deformation, they play a significant role instabilizing the crushing process. However, unnecessary selection of
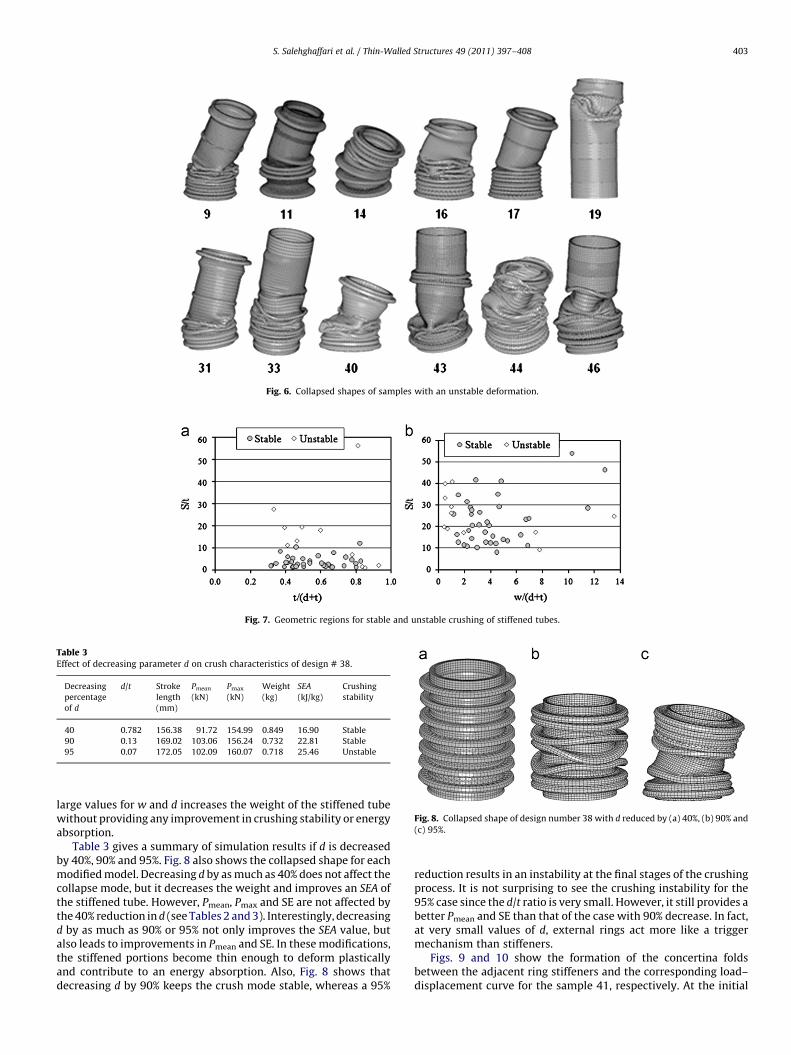
Fig. 6. Collapsed shapes of samples with an unstable deformation.
Fig. 7. Geometric regions for stable and unstable crushing of stiffened tubes.
Table 3Effect of decreasing parameter d on crush characteristics of design # 38.
Decreasing
percentage
of d
d/t Stroke
length
(mm)
Pmean
(kN)
Pmax
(kN)
Weight
(kg)
SEA
(kJ/kg)
Crushing
stability
40 0.782 156.38 91.72 154.99 0.849 16.90 Stable
90 0.13 169.02 103.06 156.24 0.732 22.81 Stable
95 0.07 172.05 102.09 160.07 0.718 25.46 Unstable
Fig. 8. Collapsed shape of design number 38 with d reduced by (a) 40%, (b) 90% and
(c) 95%.
S. Salehghaffari et al. / Thin-Walled Structures 49 (2011) 397–408 403
large values for w and d increases the weight of the stiffened tubewithout providing any improvement in crushing stability or energyabsorption.
Table 3 gives a summary of simulation results if d is decreasedby 40%, 90% and 95%. Fig. 8 also shows the collapsed shape for eachmodified model. Decreasing d by as much as 40% does not affect thecollapse mode, but it decreases the weight and improves an SEA ofthe stiffened tube. However, Pmean, Pmax and SE are not affected bythe 40% reduction in d (see Tables 2 and 3). Interestingly, decreasingd by as much as 90% or 95% not only improves the SEA value, butalso leads to improvements in Pmean and SE. In these modifications,the stiffened portions become thin enough to deform plasticallyand contribute to an energy absorption. Also, Fig. 8 shows thatdecreasing d by 90% keeps the crush mode stable, whereas a 95%
reduction results in an instability at the final stages of the crushingprocess. It is not surprising to see the crushing instability for the95% case since the d/t ratio is very small. However, it still provides abetter Pmean and SE than that of the case with 90% decrease. In fact,at very small values of d, external rings act more like a triggermechanism than stiffeners.
Figs. 9 and 10 show the formation of the concertina foldsbetween the adjacent ring stiffeners and the corresponding load–displacement curve for the sample 41, respectively. At the initial
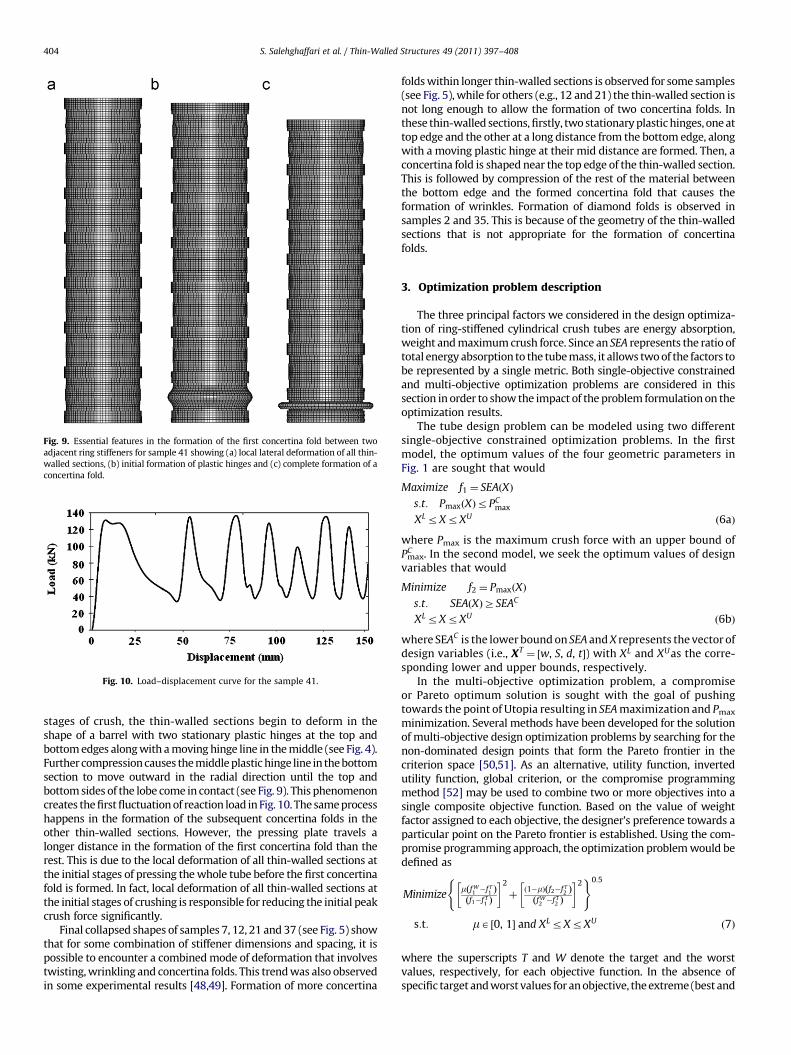
Fig. 9. Essential features in the formation of the first concertina fold between two
adjacent ring stiffeners for sample 41 showing (a) local lateral deformation of all thin-
walled sections, (b) initial formation of plastic hinges and (c) complete formation of a
concertina fold.
Fig. 10. Load–displacement curve for the sample 41.
S. Salehghaffari et al. / Thin-Walled Structures 49 (2011) 397–408404
stages of crush, the thin-walled sections begin to deform in theshape of a barrel with two stationary plastic hinges at the top andbottom edges along with a moving hinge line in the middle (see Fig. 4).Further compression causes the middle plastic hinge line in the bottomsection to move outward in the radial direction until the top andbottom sides of the lobe come in contact (see Fig. 9). This phenomenoncreates the first fluctuation of reaction load in Fig. 10. The same processhappens in the formation of the subsequent concertina folds in theother thin-walled sections. However, the pressing plate travels alonger distance in the formation of the first concertina fold than therest. This is due to the local deformation of all thin-walled sections atthe initial stages of pressing the whole tube before the first concertinafold is formed. In fact, local deformation of all thin-walled sections atthe initial stages of crushing is responsible for reducing the initial peakcrush force significantly.
Final collapsed shapes of samples 7, 12, 21 and 37 (see Fig. 5) showthat for some combination of stiffener dimensions and spacing, it ispossible to encounter a combined mode of deformation that involvestwisting, wrinkling and concertina folds. This trend was also observedin some experimental results [48,49]. Formation of more concertina
folds within longer thin-walled sections is observed for some samples(see Fig. 5), while for others (e.g., 12 and 21) the thin-walled section isnot long enough to allow the formation of two concertina folds. Inthese thin-walled sections, firstly, two stationary plastic hinges, one attop edge and the other at a long distance from the bottom edge, alongwith a moving plastic hinge at their mid distance are formed. Then, aconcertina fold is shaped near the top edge of the thin-walled section.This is followed by compression of the rest of the material betweenthe bottom edge and the formed concertina fold that causes theformation of wrinkles. Formation of diamond folds is observed insamples 2 and 35. This is because of the geometry of the thin-walledsections that is not appropriate for the formation of concertinafolds.
3. Optimization problem description
The three principal factors we considered in the design optimiza-tion of ring-stiffened cylindrical crush tubes are energy absorption,weight and maximum crush force. Since an SEA represents the ratio oftotal energy absorption to the tube mass, it allows two of the factors tobe represented by a single metric. Both single-objective constrainedand multi-objective optimization problems are considered in thissection in order to show the impact of the problem formulation on theoptimization results.
The tube design problem can be modeled using two differentsingle-objective constrained optimization problems. In the firstmodel, the optimum values of the four geometric parameters inFig. 1 are sought that would
Maximize f1 ¼ SEAðXÞ
s:t: PmaxðXÞrPCmax
XLrXrXU ð6aÞ
where Pmax is the maximum crush force with an upper bound ofPmax
C . In the second model, we seek the optimum values of designvariables that would
Minimize f2 ¼ PmaxðXÞ
s:t: SEAðXÞZSEAC
XLrXrXU ð6bÞ
where SEAC is the lower bound on SEA and X represents the vector ofdesign variables (i.e., XT
¼ ½w, S, d, t�) with XL and XUas the corre-sponding lower and upper bounds, respectively.
In the multi-objective optimization problem, a compromiseor Pareto optimum solution is sought with the goal of pushingtowards the point of Utopia resulting in SEA maximization and Pmax
minimization. Several methods have been developed for the solutionof multi-objective design optimization problems by searching for thenon-dominated design points that form the Pareto frontier in thecriterion space [50,51]. As an alternative, utility function, invertedutility function, global criterion, or the compromise programmingmethod [52] may be used to combine two or more objectives into asingle composite objective function. Based on the value of weightfactor assigned to each objective, the designer’s preference towards aparticular point on the Pareto frontier is established. Using the com-promise programming approach, the optimization problem would bedefined as
Minimizem f W
1�f T
1ð Þf1�f T
1ð Þ
� �2
þð1�mÞ f2�f T
2ð Þf W2�f T
2ð Þ
� �2( )0:5
s:t: mA ½0, 1� and XLrXrXU ð7Þ
where the superscripts T and W denote the target and the worstvalues, respectively, for each objective function. In the absence ofspecific target and worst values for an objective, the extreme (best and
Table 4Error estimation of RBF models.
Design objectives Method 1 (test points) Method 2 (design points)
R2 RMSE PRESS R2prediction
SEA 0.969 0.0699 201.23 0.8277
Pmax 0.988 0.0407 1073.69 0.9354
S. Salehghaffari et al. / Thin-Walled Structures 49 (2011) 397–408 405
worst) single-objective optimization values may be used instead. InEq. (7), m is the weight factor for assigning different levels ofimportance to each objective function.
Using the geometrical average of efficiency coefficients [53]associated with the two objectives, we would find an alternativeformulation for the multi-objective optimization problem that canbe expressed as
Maximize Fg ¼ffiffiffiffiffiffiffiffiffiffiffiffiffiffidSEAdP
ps:t: XLrXrXU ð8Þ
where dSEA and dp are efficiency coefficients of SEA and Pmax,respectively. To maximize SEA in Eq. (8), dSEA is calculated in termsof the relative distance to its worst value as
dSEA ¼f1�f W
1
f T1�f W
1
ð9Þ
To minimize Pmax, dp is calculated as
dp ¼ 1�f2�f W
2
f T2�f W
2
ð10Þ
Hence, with changes in design variables, dSEA and dp can take anyvalue in the interval [0,1]. When the overall efficiency function, Fg,reaches one, the corresponding objective function reaches theoptimal solution, whereas Fg¼0 indicates the worst solution.
4. Surrogate modeling
Radial Basis Functions (RBF) [42,44,54] are used to establishsurrogate models (metamodels) to represent the relationshipsbetween the individual objective functions (SEA and Pmax) andthe design variable vector XT
¼ ½w, S, d, t� over the entire designspace bounded by the side constraints. Given the design variablevector and response values at n arbitrary design (training) points,an RBF approximation of the response function f(X) derived from anFE simulation (‘‘exact’’ response) can be found as
~f ðYÞ ¼Xn
i ¼ 1
lif :Y�Yi:� �
ð11Þ
where Y is the vector of normalized design (input) variables with Yi
representing the normalized coordinates of the ith training point,
ri ¼ :Y�Yi:¼ffiffiffiffiffiffiffiffiffiffiffiffiffiffiffiffiffiffiffiffiffiffiffiffiffiffiffiffiffiffiffiffiðY�YiÞ
TðY�YiÞ
qis the Euclidean norm representing
the radial distance from any arbitrary design point to the ith
training point,f is a radial symmetric basis function, and li, i¼1 arethe unknown interpolation coefficients. Eq. (11) represents a linearcombination of a finite number of radial symmetric basis functions.
Commonly used RBF formulations include: thin-plate spline[f(r)¼r2 log(r)], Gaussian [fðrÞ ¼ ear2
, a40], multiquadric ½fðrÞ ¼ffiffiffiffiffiffiffiffiffiffiffiffiffiffir2þc2p
� and inverse multiquadric½fðrÞ ¼ 1=ffiffiffiffiffiffiffiffiffiffiffiffiffiffir2þc2p
�. With nor-malized input variables, r falls in the range of (0, 1) with 0ocr1.The choice of basis function and tuning parameter c is problemspecific.
Four error metrics are used for the assessment of metamodelaccuracy. Since RBF is an interpolation model, six randomlyselected design points (different from any of the training points)within the global bounds of each design variable are used as testpoints for the evaluation of R2 and RSME statistics defined as
R2 ¼ 1�SSE
SSTð12Þ
RMSE¼
ffiffiffiffiffiffiffiffiSSE
m
rð13Þ
where SSE (sum of square errors) and SST (total sum of squares) arecalculated as
SSE¼Xmj ¼ 1
fj�~f j
h i2ð14aÞ
SST ¼Xm
j ¼ 1
fj�f j
h i2ð14bÞ
where m is the number of test points, fj is the FEA-based responsevalue at the jth test point, ~f j is the corresponding approximatevalue calculated by the RBF model, and f j is the mean value of all fj00 ,j¼1, m.
The other two error statistics considered are prediction errorsum of squares (PRESS) and R2 for prediction (R2
prediction) at thetraining points calculated as
PRESS¼Xn�1
i ¼ 1
fj�~f ð1Þ
h i2ð15Þ
R2Prediction ¼ 1�
PRESS
SSTð16Þ
where ~f ð1Þis the predicted value at the ith training point, using theRBF model created by (n�1) training points that exclude theith point.
4.1. Evaluation of RBF model accuracy
For both design objectives (SEA and Pmax), we checked differentRBF models and found that multiquadric with c¼0.001 gives themost accurate metamodels. For the overall accuracy of eachmetamodel, the error metrics mentioned earlier are used.
For PRESS and R2Prediction error evaluations, we checked the
predictability of responses derived from constructed RBF modelsfor 47 design points. Although a large number of training points isused for construction of each RBF metamodel, it is possible for someof the error metrics to provide unreliable predictions. For example,Fang and Want [55] have shown that for some responses, theerror predictions based on PRESS and R2
Prediction may not provideaccurate error estimates for RBF models. For R2 and RMSE errorevaluations, 6 out of the 48 initial design points (i.e., 5, 10, 15, 20, 30and 40) are selected as test points with the remaining 42 treated astraining points for the calculation of coefficients, li.
The error estimates are given in Table 4. As it can be seen, largevalues for R2 and R2
Prediction and small values for RMSE and PRESS
indicate reasonable accuracy of the constructed RBF surrogatemodels for both design objectives.
To validate the metamodel-based optimization results, FEsimulations of the optimum designs will be performed to deter-mine the true error in the response predictions.
5. Design optimization results
Due to the availability of analytical surrogate models for SEA andPmax and a relative small set of design variables, we used GeneticAlgorithms (GA in Global Optimization toolbox of MATLAB) to
Table 6
Minimization of Pmax with constraint on SEAZ24kJ=kg.
Optimal design variables SEA (kJ/kg) Pmax (kN)
N d (mm) t (mm) S (mm) w (mm)
7 0.942 1.869 31.178 3.969 24.693 138.005
S. Salehghaffari et al. / Thin-Walled Structures 49 (2011) 397–408406
setup and solve all optimization problems. A stochastic searchapproach such as GA offers a viable strategy to explore differentregions of the design space in search of the global optimum designpoint. First, a random population of 20 design points is selectedbased on the specified bounds on the design variables. Thescattered cross-over fraction is set at 0.8, and constraint dependentoption is adopted for the mutation function.
For linearly constrained optimization problems, the GA solver inMATLAB identifies active linear constraints and bounds to generatesearch directions, or mutants for the GA. For non-linearly con-strained optimization problems, it formulates a subproblem sub-ject to linear constraints and bounds, using penalty and Lagrangeparameters. Once an approximate solution to the subproblem isfound, the penalty and Lagrange parameters are updated for a newsubproblem, and the solution process continues until convergenceat a specified accuracy is reached.
Here, the solution of constrained single-objective and uncon-strained multi-objective optimization cases for a specific weightfactor (Eq. (7)) required 6 and 53 iterations, respectively, with eachiteration of the constrained single-objective problem taking con-siderably more time than the unconstrained multi-objectiveoptimization problem.
5.1. Constrained single-objective optimization
SEA and Pmax are the main competing criteria affecting thedesign of stiffened crush tubes. With the lower and upper boundson each design variable defined, Eq. (6) can be used to formulatetwo separate but related single-objective constrained optimizationproblems formulated as
Maximize f 1 ¼ SEA S, w, t, dð Þ
s:t: PmaxðS, w, t, dÞr145kN
17:85mmrSr83:3mm
0mmrwr31:25mm
0mmrdr3mm
1mmrtr2:6mm ð17Þ
Minimize f 2 ¼ Pmax S, w, t, dð Þ
s:t: SEA S, w, t, dð ÞZ24kJ=kg
17:85 mmrSr83:3mm
0 mmrwr31:25mm
0mmrdr3mm
1mmrtr2:6mm ð18Þ
The constraint bounds for Pmax in Eq. (17) and SEA in Eq. (18) arebased on the desire to have large values for SEA and moderatevalues for Pmax. Therefore, we selected the bounds for Pmax at 75%and SEA at 90% of the corresponding maximum values in Table 2,respectively. Eqs. (17) and (18) are solved for three different valuesof N (i.e., 3, 5 and 7).
In MATLAB, the established RBF surrogate models relating Pmax
and SEA to design the variable vector are placed in separate M-files toaccount for the presence of design constraints in the optimizationproblem described in Eqs. (17) and (18), respectively. The solutions forthese optimization problems are given in Tables 5 and 6. With
Table 5Maximization of SEA with constraint on Pmaxr145 kN.
Optimal design variables SEA (kJ/kg) Pmax (kN)
N d (mm) t (mm) S (mm) w (mm)
7 0.927 1.916 31.178 3.969 24.693 138.005
consistent constraint bounds, the solutions are nearly identical. Theonly minor difference is in the values of d and t. The larger number ofstiffeners (N+1¼8) enhances the structural characteristics of thestiffened tube. It should be noted that the wall thickness in thestiffened regions is d+t.
5.2. Multi-objective optimization using compromise programming
method
Multi-objective optimization problem accounts for the inter-action between competing design criteria [52] in search of Paretooptimal solutions. Using the compromise programming method,the multi-objective optimization problem is expressed as
MinimizemSEA�
SEAðS, w, t, dÞ
� �2
þð1�mÞPmaxðS, w, t, dÞ
P�
� �2( )0:5
s:t: mA ½0, 1�17:85mmrSr83:3mm
0mmrwr31:25mm
0mmrdr3mm
1mmrtr2:6mm ð19Þ
where SEA* and P* are the normalization values for SEA and Pmax,respectively. Different combination of weight factors in Eq. (19)gives different optimum design points on the Pareto frontier in thecriterion space. The weight factor is varied in the range 0–1 at 0.1increments resulting in the Pareto frontier shown in Fig. 11. Notethat based on the formulation of Eq. (19), SEA�=SEAðS, w, t, dÞ isminimized for maximizing SEAðS, w, t, dÞ. The merit of Pareto set isthat it provides a range of optimal solutions depending on the levelof preference designer places on different objectives.
The results for different optimization problems and solutiontechniques are shown in Fig. 11. Of the eleven points correspondingto the solution of Eq. (19) with varying weight factor, some givevery close answers and are not distinguishable in the figure. Thesolutions for Eqs. (17) and (18) overlap in the criterion space. Thelocation of the multi-objective optimum point corresponding toEq. (19) and m¼0.4 (details summarized in Table 7) is also shown.For comparison, the GA based multi-objective optimization solverof Matlab is also used to generate the Pareto frontier points markedas MOGA in Fig. 11. The results from Eq. (19) are found to be in verygood agreement with those corresponding to MOGA.
5.3. Multi-objective optimization using geometrical average method
The multi-objective optimization problem is formulated as
Maximize FgðS, w, t, dÞ ¼ffiffiffiffiffiffiffiffiffiffiffiffiffiffidSEAdP
ps:t: 17:85mmrSr83:3mm
0mmrwr31:25mm
0mmrdr3mm
1mmrtr2:6mm ð20Þ
dSEA ¼SEAðS, w, t, dÞ�SEAL
SEAU�SEAL
ð21Þ

Fig. 11. Comparison of results for different optimization problems and solution
techniques.
Table 7Multi-objective minimization results using compromise programming with m¼0.4.
Optimal design variables SEA (kJ/kg) Pmax(kN)
N d (mm) t (mm) S (mm) w (mm)
7 0.864 1.836 32.210 3.060 23.9 134.3
Table 8Multi-objective optimization results using the geometrical average method.
Optimal design variables SEA
(kJ/kg)
Pmax
(kN)
Fg dSEA dp
N d (mm) t (mm) S (mm) w (mm)
5 1.428 1.001 41.713 6.906 18.000 68.720 0.656 0.672 0.640
Table 9Comparison of RBF predicted optima with FEA simulation results.
Solution for
Eq. #
SEA (kJ/kg) Pmax (kN)
RBF FEA % Error RBF FEA % Error
17 24.693 24.996 1.21 138.005 138.060 0.040
19 23.900 23.330 2.44 134.300 132.210 1.581
20 18.000 17.131 5.07 68.720 68.622 0.143
Fig. 12. Crush pattern of an optimal model found from (a) Eq. (17), (b) Eq. (19) with
weight factor of 0.4 and (c) Eq. (20).
S. Salehghaffari et al. / Thin-Walled Structures 49 (2011) 397–408 407
dp ¼ 1�PmaxðS, w, t, dÞ�PL
PU�PLð22Þ
where SEAU, SEAL and PU, PL represent the upper and lower boundson SEA and Pmax, respectively. The ideal values of efficiencycoefficients (dSEA, dp) and overall cost function,FgðS, w, t, dÞ, are 1.
The results for this problem are summarized in Table 8 with thecorresponding optimum point shown in Fig. 11. It can be seen thatthe optimization result of geometrical average method corre-sponds to a specific point on the Pareto frontier. As Table 8 shows,the values for dSEA and dp are nearly the same, indicating that theoptimal solution does not strongly favor one objective over theother. However, the method does not give the same solution asthe constrained single-objective optimization problem. The opti-mum value for N is also different than those found in the otheroptimization problems.
5.4. Verification of optimum design with FE simulations
Estimated optimal values of SEA and Pmax derived from solutionsof Eqs. (17), (19) (using weight factor of 0.4) and Eq. (20), using RBFsurrogate models given in Table 9. The corresponding exact valuesfound from FE simulations are also given in Table 9 to measure theaccuracy of RBF based designs. The optimization results are foundto have reasonably good accuracy with slight over- or under-predictions of the estimated responses, as indicated by a maximumerror of approximately 5% in SEA and 1.6% in Pmax predictions.
Collapsed shapes of optimized stiffened tubes are shown inFig. 12. It appears that the solutions from Eqs. (17), (19) and (20)result in different collapse modes of deformation. Whereas thedeformation response in Fig. 12(a) is fairly uniform; we see somelateral bending towards the final stages of the collapse in Fig. 12(b)and mixed wrinkling, twisting and concertina folds in Fig. 12(c).
6. Conclusion
The quasi-static axial collapse response of circular tubes withexternally machined stiffeners was investigated using an explicitnonlinear finite element analysis. The size and spacing of the ringstiffeners were found to play an important role in determining thecrush mode as well as the specific energy absorption and the peakcrush force of the stiffened tube. The addition of external stiffenersis effective in changing the crush mode from global buckling toprogressive plastic collapse.
Through design and analysis of computer experiments, separatesurrogate models were developed using an RBF approximation.Both single- and multi-objective optimization problem formula-tions were used to find an optimal geometric design that results inmaximum specific energy absorption and minimum peak crushforce. The results show that the externally stiffened circular tubesare considerably more efficient than a prismatic circular tube interms of energy absorption, stroke efficiency and structural weight.
Acknowledgements
The funding provided for this study by the National ScienceFoundation (Grant no. CMMI-0826547) and US Department of Energy(Grant no. DE-FC26-06NT42755) is gratefully acknowledged.
References
[1] Abramowicz W, Jones N. Dynamic axial crushing of square tubes. Int J ImpactEng 1984;2:179–208.
[2] Abramowicz W, Jones N. Transition from initial global bending to progressivebuckling of tubes loaded statically and dynamically. Int J Impact Eng1997;19:415–37.
[3] Jones N. Structural impact. Cambridge, UK: Cambridge Press; 1989.
S. Salehghaffari et al. / Thin-Walled Structures 49 (2011) 397–408408
[4] Wierzbicki T, Abramowicz W. On the crushing mechanics of thin walledstructures. J Appl Mech 1983;50:727–34.
[5] Alghamdi AAA. Collapsible impact energy absorbers: an overview. Thin-WalledStruct 2001;39:189–213.
[6] Najafi A, Rais-Rohani M. Influence of cross-sectional geometry on crushcharacteristics of multi-cell prismatic columns. In: Proceedings of the 49thAIAA/ASME/ASCE/AHS/ASC structures, structural dynamics and materialsconference. 2008.
[7] Chen W, Wierzbicki T. Relative merits of single-cell, multi-cell and foam-filledthin-walled structures in energy absorption. Thin-Walled Struct 2001;39:287–306.
[8] Kim HS, Chen W, Wierzbicki T. Weight and crash optimization of foam-filledthree-dimensional ‘‘S’’ frame. Comput Mech 2002;28:417–24.
[9] Johnson W, Reid SR. Metallic energy dissipating systems. Appl Mech Rev1978;31:277–88.
[10] Al-Hassani STS, Johnson W, Lowe WT. Characteristics of inversion tube underaxial loading. Int J Mech Sci 1972;14:370–81.
[11] Colokoglu A, Reddy TY. Strain rate and inertial effects in free external inversionof tubes. Int J Crashworthiness 1996;1:93–106.
[12] Kinkead AN. Analysis for inversion load and energy absorption of a circulartube. Int J Strain Anal 1983;18:177–88.
[13] Reddy TY. Tube inversion an experiment in plasticity. Int J Mech Eng Educ1989;17:277–91.
[14] Reid SR, Harrigan JJ. Transient effects in the quasi static and dynamic inversionand nosing of metal tubes. Int J Mech Sci 1998;40:263–80.
[15] Huang X, Lu G, Yu TX. On the axial splitting and curling of circular metal tubes.Int J Mech Sci 2002;44:2369–91.
[16] Stronge WJ, Yu TX, Johnson W. Long stroke energy dissipation in splittingtubes. Int J Mech Sci 1983;25:637–47.
[17] Reddy TY, Reid SR. Axial splitting of circular metal tubes. Int Mech Sci1986;28:111–31.
[18] Shakeri M, Salehghaffari S, Mirzaeifar R. Expansion of circular tubes by rigidtubes as impact energy absorbers: experimental and theoretical investigation.Int J Crashworthiness 2007;12:493–501.
[19] Chirwa EC. Theoretical analysis of tapered thin-walled metal inverbucktube.Int J Mech Sci 1993;35:325–51.
[20] Al Galib D, Limam A. Experimental and numerical investigation of static anddynamic axial crushing of circular tubes. Thin-Walled Struct 2004;42:1103–37.
[21] Andrews KRF, England GL, Ghani E. Classification of axial collapse of cylindertubes under quasi-static loading. Int J Mech Sci 1983;25:687–96.
[22] Guillow SR, Lu G, Grzebieta RH. Quasi-static compression of thin-walledcircular aluminum tubes. Int J Mech Sci 2001;43:2103–23.
[23] Hsu SS, Jones N. Quasi-static and dynamic axial crushing of thin-walled circularstainless steel, mild steel and aluminum alloy tubes. Int J Crashworthiness2004;9:195–217.
[24] Karagiozova D, Jones N. Dynamic elastic–plastic buckling of circular cylindricalshells under axial impact. Int J Solids Struct 2000;37:2005–34.
[25] Murase K, Wada H. Numerical study on the transition of plastic buckling modesfor circular tubes subjected to an axial impact load. Int J Impact Eng2004;30:1131–46.
[26] Abah L, Limam A, Dejeammes M. Effects of cutouts on static and dynamicbehavior of square aluminum extrusions. In: Proceedings of the Fifth inter-national conference on structures under shock and impact, (SUSI V). Computa-tional Mechanics, Southampton, UK; (1998). p. 133–42.
[27] Lee S, Hahn C, Rhee M, Oh JE. Effect of triggering on the energy absorptioncapacity of axially compressed aluminium tubes. Mater Des 1999;20:31–40.
[28] Shakeri M, Mirzaeifar R, Salehghaffari S. New insights into the collapsing ofcylindrical thin-walled tubes under axial impact load. In: Proc Int Mech EngPart C: J Mech Eng Sci 2007;221:869–85.
[29] Daneshi GH, Hosseinipour SJ. Grooves effect on crashworthiness character-istics of thin-walled tubes under axial compression. J Mater Des 2003;23:611–7.
[30] Singace AA, El-Sobky H. Behavior of axially crushed corrugated tubes. Int JMech Sci 1997;39:249–68.
[31] Hanssen AG, Langseth M, Hopperstad OS. Static and dynamic crushing ofcircular aluminum extrusions with aluminum foam filler. Int Impact Eng2000;24:475–507.
[32] Santosa S, Wierzbicki T. Crash behavior of columns filled with aluminumhoneycomb or foam. Comput Struct 1998;68:343–67.
[33] Kim HS, Chen W, Wierzbicki T. Weight and crash optimization of foam-filledthree-dimensional ‘‘S’’ frame. Comput Mech 2002;28:417–24.
[34] Abdul-Latif A, Baleh R, Aboura Z. Some improvements on the energy absorbedin axial plastic collapse of hollow cylinders. Int J Solids Struct 2006;43:1543–60.
[35] Salehghaffari S, Tajdari M, Panahi M, Mokhtarnezhad F. Attempts to improveenergy absorption characteristics of circular metal tubes subjected to axialloading. Thin-Walled Struct 2010;48:379–90.
[36] Hou S-J, Li Q, Long S-Y, Yang X-J, Li W. Design optimization of regular hexagonalthin-walled columns with crashworthiness criteria. Finite Elem Anal Des2007;43:555–65.
[37] Xiang Y-J, Wang Q, Fan Z-J, fang H-B. Optimal crashworthiness design of a spot-welded thin-walled hat section. Finite Elem Anal Des 2006;42:846–55.
[38] Acar E, Rais-Rohani M. Ensemble of metamodels with optimized weightfactors. Struct Multidisciplinary Optim 2008;37:279–94.
[39] Yamazaki K, Han J. Maximization of the crushing energy absorption ofcylindrical shells. Adv Eng Software 2000;31:425–34.
[40] Lee TH, Lee K. Multi-criteria shape optimization of a funnel in cathode ray tubesusing a response surface model. Struct Multidisciplinary Optim 2005;29:374–81.
[41] Chiandussi G, Avalle M. Maximisation of the crushing performance of a tubulardevice by shape optimization. Comput Struct 2002;80:2425–32.
[42] Fang H, Rais-Rohani M, Liu Z, Horstemeyer M. A comparative study ofmetamodeling methods for multiobjective crashworthiness optimization.Comput Struct 2005;83:2121–36.
[43] Alexandrov NM, Dennis JE, Lewis RM, Torczon VA. Trust region framework formanaging the use of approximation models in optimization. Struct Multi-disciplinary Optim 1998;15:16–23.
[44] Rais-Rohani M, Singh MN. Comparison of global and local response surfacetechniques in reliability-based optimization of composite structures. StructMultidisciplinary Optim 2003;26:333–45.
[45] Wang G, Dong Z, Aitchison P. Adaptive response surface method—a globaloptimization scheme for approximation based design problems. J Eng Optim2001;33:707–34.
[46] Rodriguez J, Renaud JE, Watson.LT. Trust region augmented Lagrangianmethods for sequential response surface approximation and optimization.In: Proceedings of the DETC_97 ASME design engineering technical conference.Sacramento, CA: Paper no. DETC97/DAC3773, ASME. 1997.
[47] Hallquist JO, LS-DYNA 3D: theoretical manual, livermore software technologycorporation. Livermore,1993.
[48] Salehghaffari S, Tajdari M, Mokhtarnezhad F. Collapse of thick-walled metaltubes with wide external grooves as controllable energy-dissipating devices.In: Proceedings of the international mechanical engineering, part C: J Mech EngSci 223 (2010). p. 2465–80.
[49] Mokhtarnezhad F, Salehghaffari S, Tajdari M. Improving the crashworthinesscharacteristics of cylindrical tubes subjected to axial compression by cuttingwide grooves from their outer surface. Int J Crashworthiness 2009;14:601–11.
[50] Messac A. Physical programming: effective optimization for computationaldesign. AIAA J 1996;34:149–58.
[51] Martinez MP, Messac A, Rais-Rohani M. Manufacturability-based optimizationof aircraft structures using physical programming. AIAA J 2001;39:517–42.
[52] Rao SS. Engineering optimization theory and practice. 3rd ed.. John Wiley &Sons; 1996.
[53] Shujuan H, Qing L, Shuyao L, Xujing Y, Wei L. Crashworthiness design for foamfilled thin-wall structures. Mater Des 2009;30:2024–32.
[54] Hardy RL. Multiquadratic equations of topography and other irregular surfaces.J Geophys 1971;76:1905–15.
[55] Fang H, Wang Q. On the effectiveness of assessing model accuracy at designpoints for radial basis functions. Commun Numer Methods Eng 2008;24:219–35.