analy high school school accountability report card ... · analy high school is located on the...
TRANSCRIPT

2015-16 School Accountability Report Card for Analy High School Page 1 of 12
Analy High School
School Accountability Report Card
Reported Using Data from the 2015-16 School Year
Published During 2016-17
By February 1 of each year, every school in California is required by state law to publish a School Accountability Report Card (SARC). The SARC contains information about the condition and performance of each California public school. Under the Local Control Funding Formula (LCFF) all local educational agencies (LEAs) are required to prepare a Local Control and Accountability Plan (LCAP), which describes how they intend to meet annual school-specific goals for all pupils, with specific activities to address state and local priorities. Additionally, data reported in an LCAP is to be consistent with data reported in the SARC. • For more information about SARC requirements, see the California Department of Education (CDE) SARC Web page at
http://www.cde.ca.gov/ta/ac/sa/. • For more information about the LCFF or LCAP, see the CDE LCFF Web page at http://www.cde.ca.gov/fg/aa/lc/. • For additional information about the school, parents/guardians and community members should contact the school principal or
the district office. DataQuest DataQuest is an online data tool located on the CDE DataQuest Web page at http://dq.cde.ca.gov/dataquest/ that contains additional information about this school and comparisons of the school to the district and the county. Specifically, DataQuest is a dynamic system that provides reports for accountability (e.g., test data, enrollment, high school graduates, dropouts, course enrollments, staffing, and data regarding English learners). Internet Access Internet access is available at public libraries and other locations that are publicly accessible (e.g., the California State Library). Access to the Internet at libraries and public locations is generally provided on a first-come, first-served basis. Other use restrictions may include the hours of operation, the length of time that a workstation may be used (depending on availability), the types of software programs available on a workstation, and the ability to print documents.
About This School Contact Information (School Year 2016-17)
School Contact Information
School Name------- Analy High School
Street------- 6950 Analy Ave.
City, State, Zip------- Sebastopol, CA 95472
Phone Number------- (707) 824-2314
Principal------- Raul Guerrero
E-mail Address------- [email protected]
Web Site------- www.analyhighschool.org
CDS Code 49 70607 4930400

2015-16 School Accountability Report Card for Analy High School Page 2 of 12
District Contact Information
District Name------- West Sonoma County Union High School District
Phone Number------- (707) 824-6403
Superintendent-------
Dr. Steven Kellner
E-mail Address------- [email protected]
Web Site------- www.wscuhsd.k12.ca.us
School Description and Mission Statement (School Year 2016-17)
Analy High School is located on the beautiful Laguna de Santa Rosa midway between the busy 101 Highway corridor and the wild woods and beaches of the Sonoma Coast. Analy is located just off the small, busy highway that cuts through the town of Sebastopol; a city of 8000 people surrounded by small farms, open space and dairy land. The town’s rural tradition is giving way to a more professional population, and many Analy parents commute to work. While the community is affluent and well educated, the population is 80% white and over 70% have a college degree, about 20.1% of Analy students are eligible for Free Lunch. Many Analy graduates stay in the community as business people who, in turn, contribute to the school. A growing population of Latino families contribute to the increasing diversity of the Analy campus. The community is fairly progressive; Analy’s drama department was one of the first high schools in the state to produce The Laramie Project. Analy is well supported by the community, parents, and business. We have an active Booster Club and Educational Foundation as well as groups serving specific needs, such as the Band Wagon. Analy is the geographic and symbolic heart and soul of Sebastopol. Analy is part of the West Sonoma County Union High School District (WSCUHSD), which is comprised of two comprehensive high schools, Analy and El Molino. Analy has three feeder elementary school districts, each with its own programs and population. Studies have been conducted by the community to consider the possibility of consolidating some districts, or at least using the same calendar in order to maximize student attendance. Analy has a unique situation. 81% of students’ parents have some college, with 21% reporting their parents have a master’s degree. Our students are high performing, with 60% proficient or above on the API, well above the state average, and in line with other schools of our type. The new CAASPP test replaced STAR testing in Spring 2014 implementing a "testing the test" format. Data will become baseline for future growth. During our previous WASC process, Analy received a 6 year accreditation with a 3 year follow up visit which took place in March of 2015.. Our Focus on Learning report was tremendously useful to us as a school, helping us design a vision for change and improvement. Analy High School is over 100 years old and rich in a tradition of academic excellence; we are proud of our students and they treat the school staff with respect. Our ESLR’s – Cooperation, Thinking and Problem Solving, Communication, Technology, Career Preparation, and Diversity and Social Personal Responsibility, are born out of a desire to make a whole student and a lifelong learner. Student Enrollment by Grade Level (School Year 2015-16)
Grade Number of
Level Students
Grade 9 310
Grade 10 302
Grade 11 337
Grade 12 324
Total Enrollment 1,273

2015-16 School Accountability Report Card for Analy High School Page 3 of 12
Student Enrollment by Group (School Year 2015-16)
Student Percent of
Group Total Enrollment
Black or African American 1.4
American Indian or Alaska Native 0.4
Asian 3.1
Filipino 0.5
Hispanic or Latino 16.7
Native Hawaiian or Pacific Islander 0.2
White 74.6
Two or More Races 3
Socioeconomically Disadvantaged 19.3
English Learners 2.4
Students with Disabilities 9.1
Foster Youth 0.5
A. Conditions of Learning
State Priority: Basic The SARC provides the following information relevant to the Basic State Priority (Priority 1): • Degree to which teachers are appropriately assigned and fully credentialed in the subject area and for the pupils they are
teaching; • Pupils have access to standards-aligned instructional materials; and • School facilities are maintained in good repair. Teacher Credentials
Teachers School District
2014-15 2015-16 2016-17 2016-17
With Full Credential 65 64 64 110
Without Full Credential 0 0 0 0
Teaching Outside Subject Area of Competence (with full credential) 8 2 2 6
Teacher Misassignments and Vacant Teacher Positions
Indicator 2014-15 2015-16 2016-17
Misassignments of Teachers of English Learners 0 0 0
Total Teacher Misassignments * 0 0 0
Vacant Teacher Positions 0 0 0 Note: “Misassignments” refers to the number of positions filled by teachers who lack legal authorization to teach that grade level, subject area, student group, etc. * Total Teacher Misassignments includes the number of Misassignments of Teachers of English Learners.

2015-16 School Accountability Report Card for Analy High School Page 4 of 12
Core Academic Classes Taught by Highly Qualified Teachers (School Year 2015-16)
Location of Classes Percent of Classes In Core Academic Subjects
Taught by Highly Qualified Teachers Not Taught by Highly Qualified Teachers
This School 100.0 0.0
All Schools in District 99.2 0.8
High-Poverty Schools in District 89.3 10.7
Low-Poverty Schools in District 100.0 0.0 Note: High-poverty schools are defined as those schools with student eligibility of approximately 40 percent or more in the free and reduced price meals program. Low-poverty schools are those with student eligibility of approximately 39 percent or less in the free and reduced price meals program. Quality, Currency, Availability of Textbooks and Instructional Materials (School Year 2016-17) Year and month in which data were collected: September 2014
Subject Textbooks and Instructional Materials/
Year of Adoption
From Most Recent
Adoption?
Percent of Students Lacking Own
Assigned Copy
Reading/Language Arts A current list of all District-adopted textbooks and instructional materials used at our school is posted on the West Sonoma County Union High School District website at: http://wscuhsd.k12.ca.us/about-wscuhsd/
Yes 0%
Mathematics A current list of all District-adopted textbooks and instructional materials used at our school is posted on the West Sonoma County Union High School District website at: http://wscuhsd.k12.ca.us/about-wscuhsd/
Yes 0%
Science A current list of all District-adopted textbooks and instructional materials used at our school is posted on the West Sonoma County Union High School District website at: http://wscuhsd.k12.ca.us/about-wscuhsd/
Yes 0%
History-Social Science A current list of all District-adopted textbooks and instructional materials used at our school is posted on the West Sonoma County Union High School District website at: http://wscuhsd.k12.ca.us/about-wscuhsd/
Yes 0%
Foreign Language A current list of all District-adopted textbooks and instructional materials used at our school is posted on the West Sonoma County Union High School District website at: http://wscuhsd.k12.ca.us/about-wscuhsd/
Yes 0%
Health A current list of all District-adopted textbooks and instructional materials used at our school is posted on the West Sonoma County Union High School District website at: http://wscuhsd.k12.ca.us/about-wscuhsd/
Yes 0%
Visual and Performing Arts A current list of all District-adopted textbooks and instructional materials used at our school is posted on the West Sonoma County Union High School District website at: http://wscuhsd.k12.ca.us/about-wscuhsd/
No

2015-16 School Accountability Report Card for Analy High School Page 5 of 12
Subject Textbooks and Instructional Materials/
Year of Adoption
From Most Recent
Adoption?
Percent of Students Lacking Own
Assigned Copy
Science Laboratory Equipment (grades 9-12)
A current list of all District-adopted textbooks and instructional materials used at our school is posted on the West Sonoma County Union High School District website at: http://wscuhsd.k12.ca.us/about-wscuhsd/
Yes 0%
School Facility Conditions and Planned Improvements (Most Recent Year)
Based on the Facility Inspection Tool, developed by the State of California Office of Public School Construction, the school facility is in “exemplary” condition. Although the school site was rated exemplary, efforts of our school district community, a bond was successfully passed in November of 2010 to modernize the West Sonoma Union High School District campuses. Projects to modernize the Analy High School campus from June 2015 to June 2016 were: • New band classroom • Modernization of stadium to synthetic turf, all weather track, new home bleachers and press box In addition the Director of Maintenance & Operations is developing a short and long term deferred maintenance program to take care of routine maintenance needs. School Facility Good Repair Status (Most Recent Year)
School Facility Good Repair Status (Most Recent Year) Year and month of the most recent FIT report: 12/5/16
System Inspected Repair Status Repair Needed and
Action Taken or Planned Good Fair Poor
Systems: Gas Leaks, Mechanical/HVAC, Sewer
X
Interior: Interior Surfaces X
Cleanliness: Overall Cleanliness, Pest/ Vermin Infestation
X
Electrical: Electrical X
Restrooms/Fountains: Restrooms, Sinks/ Fountains
X
Safety: Fire Safety, Hazardous Materials X
Structural: Structural Damage, Roofs X
External: Playground/School Grounds, Windows/ Doors/Gates/Fences
X
Overall Facility Rating (Most Recent Year)
Year and month of the most recent FIT report: 12/5/16
Overall Rating Exemplary Good Fair Poor
X

2015-16 School Accountability Report Card for Analy High School Page 6 of 12
B. Pupil Outcomes
State Priority: Pupil Achievement The SARC provides the following information relevant to the State priority: Pupil Achievement (Priority 4): • Statewide assessments (i.e., California Assessment of Student Performance and Progress [CAASPP] System, which includes the
Smarter Balanced Summative Assessments for students in the general education population and the California Alternate Assessments [CAAs] for English language arts/literacy [ELA] and mathematics given in grades three through eight and grade eleven. The CAAs have replaced the California Alternate Performance Assessment [CAPA] for ELA and mathematics, which were eliminated in 2015. Only eligible students may participate in the administration of the CAAs. CAA items are aligned with alternate achievement standards, which are linked with the Common Core State Standards [CCSS] for students with significant cognitive disabilities); and
• The percentage of students who have successfully completed courses that satisfy the requirements for entrance to the University of California and the California State University, or career technical education sequences or programs of study
CAASPP Test Results in English Language Arts/Literacy (ELA) and Mathematics for All Students
Subject
Percent of Students Meeting or Exceeding the State Standards (grades 3-8 and 11)
School District State
2014-15 2015-16 2014-15 2015-16 2014-15 2015-16
English Language Arts/Literacy 77 81 73 73 44 48
Mathematics 51 56 46 44 34 36 Note: Percentages are not calculated when the number of students tested is ten or less, either because the number of students in this category is too small for statistical accuracy or to protect student privacy.
CAASPP Test Results in ELA by Student Group Grades Three through Eight and Grade Eleven (School Year 2015-16)
Student Group Grade
Number of Students Percent of Students
Enrolled Tested Tested Standard Met or
Exceeded
All Students 11 326 308 94.5 81.2
Male 11 167 157 94.0 77.1
Female 11 159 151 95.0 85.4
Asian 11 11 11 100.0 90.9
Hispanic or Latino 11 48 45 93.8 57.8
White 11 244 229 93.8 84.3
Two or More Races 11 17 17 100.0 94.1
Socioeconomically Disadvantaged 11 58 54 93.1 64.8
Students with Disabilities 11 27 25 92.6 32.0
Note: ELA test results include the Smarter Balanced Summative Assessment and the CAA. The “Percent Met or Exceeded” is calculated by taking the total number of students who met or exceeded the standard on the Smarter Balanced Summative Assessment plus the total number of students who met the standard on the CAAs divided by the total number of students who participated in both assessments. Double dashes (--) appear in the table when the number of students is ten or less, either because the number of students in this category is too small for statistical accuracy or to protect student privacy. Note: The number of students tested includes all students who participated in the test whether they received a score or not; however, the number of students tested is not the number that was used to calculate the achievement level percentages. The achievement level percentages are calculated using only students who received scores.

2015-16 School Accountability Report Card for Analy High School Page 7 of 12
CAASPP Test Results in Mathematics by Student Group Grades Three through Eight and Grade Eleven (School Year 2015-16)
Student Group Grade
Number of Students Percent of Students
Enrolled Tested Tested Standard Met or
Exceeded
All Students 11 326 307 94.2 55.7
Male 11 167 158 94.6 57.0
Female 11 159 149 93.7 54.4
Asian 11 11 11 100.0 81.8
Hispanic or Latino 11 48 45 93.8 33.3
White 11 244 228 93.4 58.8
Two or More Races 11 17 17 100.0 70.6
Socioeconomically Disadvantaged 11 58 53 91.4 37.7
Students with Disabilities 11 27 25 92.6 16.0
Note: Mathematics test results include the Smarter Balanced Summative Assessment and the CAA. The “Percent Met or Exceeded” is calculated by taking the total number of students who met or exceeded the standard on the Smarter Balanced Summative Assessment plus the total number of students who met the standard on the CAAs divided by the total number of students who participated in both assessments. Double dashes (--) appear in the table when the number of students is ten or less, either because the number of students in this category is too small for statistical accuracy or to protect student privacy. Note: The number of students tested includes all students who participated in the test whether they received a score or not; however, the number of students tested is not the number that was used to calculate the achievement level percentages. The achievement level percentages are calculated using only students who received scores.
CAASPP Test Results in Science for All Students
Subject
Percent of Students Scoring at Proficient or Advanced (meeting or exceeding the state standards)
School District State
2013-14 2014-15 2015-16 2013-14 2014-15 2015-16 2013-14 2014-15 2015-16
Science (grades 5, 8, and 10) 68 77 73 66 71 70 60 56 54 Note: Science test results include California Standards Tests (CSTs), California Modified Assessment (CMA), and California Alternate Performance Assessment (CAPA) in grades five, eight, and ten. Note: Scores are not shown when the number of students tested is ten or less, either because the number of students in this category is too small for statistical accuracy or to protect student privacy.
2015-16 School Accountability Report Card for Analy High School Page 8 of 12
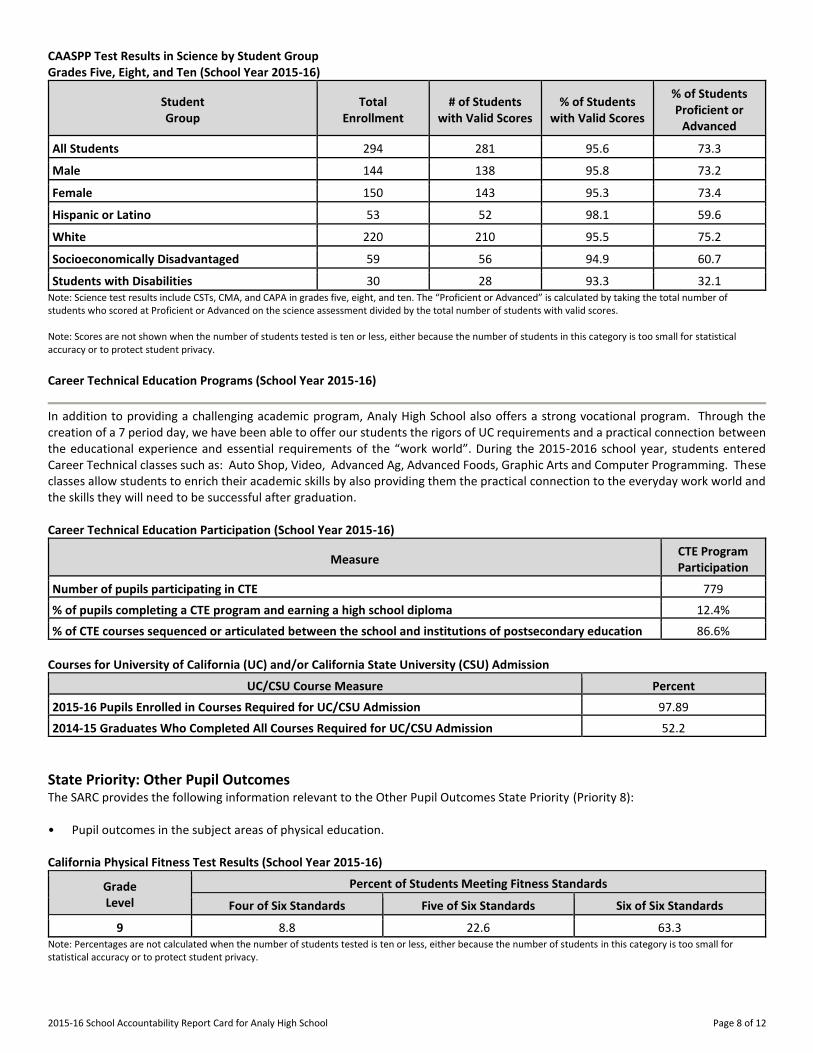
CAASPP Test Results in Science by Student Group Grades Five, Eight, and Ten (School Year 2015-16)
Student Group
Total Enrollment
# of Students with Valid Scores
% of Students with Valid Scores
% of Students Proficient or
Advanced
All Students 294 281 95.6 73.3
Male 144 138 95.8 73.2
Female 150 143 95.3 73.4
Hispanic or Latino 53 52 98.1 59.6
White 220 210 95.5 75.2
Socioeconomically Disadvantaged 59 56 94.9 60.7
Students with Disabilities 30 28 93.3 32.1 Note: Science test results include CSTs, CMA, and CAPA in grades five, eight, and ten. The “Proficient or Advanced” is calculated by taking the total number of students who scored at Proficient or Advanced on the science assessment divided by the total number of students with valid scores. Note: Scores are not shown when the number of students tested is ten or less, either because the number of students in this category is too small for statistical accuracy or to protect student privacy.
Career Technical Education Programs (School Year 2015-16)
In addition to providing a challenging academic program, Analy High School also offers a strong vocational program. Through the creation of a 7 period day, we have been able to offer our students the rigors of UC requirements and a practical connection between the educational experience and essential requirements of the “work world”. During the 2015-2016 school year, students entered Career Technical classes such as: Auto Shop, Video, Advanced Ag, Advanced Foods, Graphic Arts and Computer Programming. These classes allow students to enrich their academic skills by also providing them the practical connection to the everyday work world and the skills they will need to be successful after graduation. Career Technical Education Participation (School Year 2015-16)
Measure CTE Program Participation
Number of pupils participating in CTE 779
% of pupils completing a CTE program and earning a high school diploma 12.4%
% of CTE courses sequenced or articulated between the school and institutions of postsecondary education 86.6%
Courses for University of California (UC) and/or California State University (CSU) Admission
UC/CSU Course Measure Percent
2015-16 Pupils Enrolled in Courses Required for UC/CSU Admission 97.89
2014-15 Graduates Who Completed All Courses Required for UC/CSU Admission 52.2
State Priority: Other Pupil Outcomes The SARC provides the following information relevant to the Other Pupil Outcomes State Priority (Priority 8): • Pupil outcomes in the subject areas of physical education. California Physical Fitness Test Results (School Year 2015-16)
Grade Level
Percent of Students Meeting Fitness Standards
Four of Six Standards Five of Six Standards Six of Six Standards
---9--- 8.8 22.6 63.3 Note: Percentages are not calculated when the number of students tested is ten or less, either because the number of students in this category is too small for statistical accuracy or to protect student privacy.
2015-16 School Accountability Report Card for Analy High School Page 9 of 12
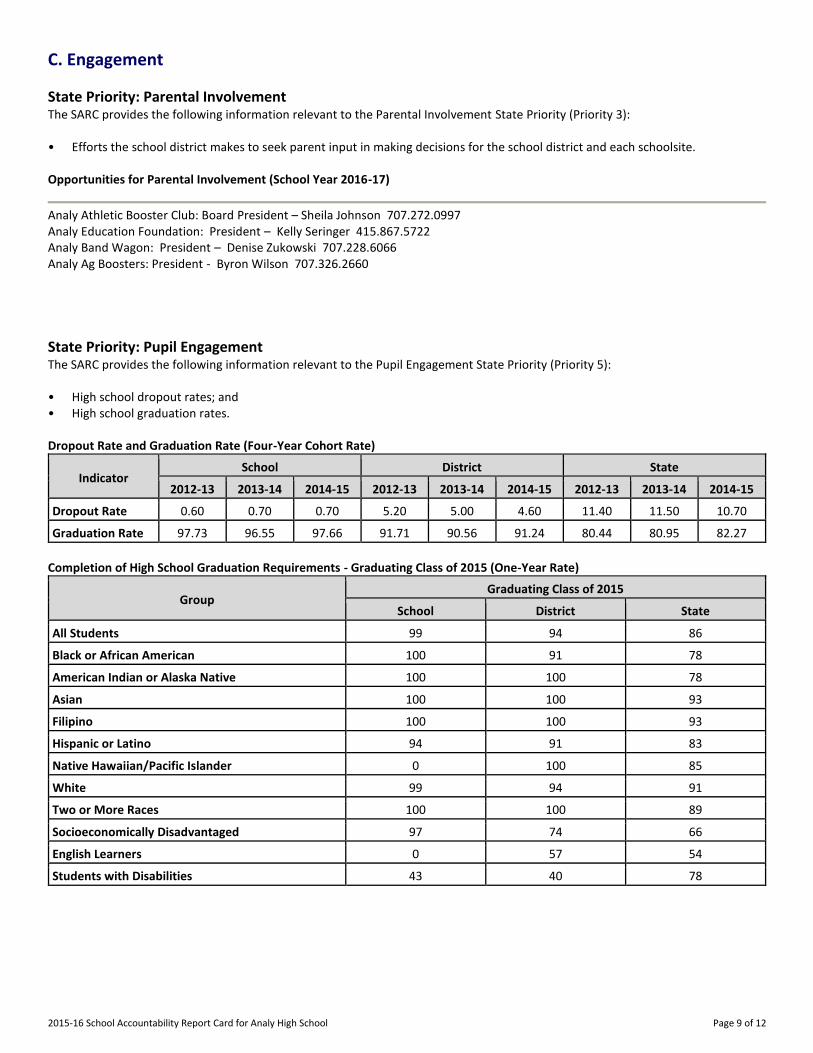
C. Engagement
State Priority: Parental Involvement The SARC provides the following information relevant to the Parental Involvement State Priority (Priority 3): • Efforts the school district makes to seek parent input in making decisions for the school district and each schoolsite. Opportunities for Parental Involvement (School Year 2016-17)
Analy Athletic Booster Club: Board President – Sheila Johnson 707.272.0997 Analy Education Foundation: President – Kelly Seringer 415.867.5722 Analy Band Wagon: President – Denise Zukowski 707.228.6066 Analy Ag Boosters: President - Byron Wilson 707.326.2660
State Priority: Pupil Engagement The SARC provides the following information relevant to the Pupil Engagement State Priority (Priority 5): • High school dropout rates; and • High school graduation rates. Dropout Rate and Graduation Rate (Four-Year Cohort Rate)
Indicator School District State
2012-13 2013-14 2014-15 2012-13 2013-14 2014-15 2012-13 2013-14 2014-15
Dropout Rate 0.60 0.70 0.70 5.20 5.00 4.60 11.40 11.50 10.70
Graduation Rate 97.73 96.55 97.66 91.71 90.56 91.24 80.44 80.95 82.27
Completion of High School Graduation Requirements - Graduating Class of 2015 (One-Year Rate)
Group Graduating Class of 2015
School District State
All Students 99 94 86
Black or African American 100 91 78
American Indian or Alaska Native 100 100 78
Asian 100 100 93
Filipino 100 100 93
Hispanic or Latino 94 91 83
Native Hawaiian/Pacific Islander 0 100 85
White 99 94 91
Two or More Races 100 100 89
Socioeconomically Disadvantaged 97 74 66
English Learners 0 57 54
Students with Disabilities 43 40 78

2015-16 School Accountability Report Card for Analy High School Page 10 of 12
State Priority: School Climate The SARC provides the following information relevant to the School Climate State Priority (Priority 6): • Pupil suspension rates; • Pupil expulsion rates; and • Other local measures on the sense of safety. Suspensions and Expulsions
Rate School District State
2013-14 2014-15 2015-16 2013-14 2014-15 2015-16 2013-14 2014-15 2015-16
Suspensions------- 3.1 2.6 4.1 3.8 3.5 4.9 4.4 3.8 3.7
Expulsions------- 0.2 0.0 0.0 0.1 0.0 0.1 0.1 0.1 0.1
School Safety Plan (School Year 2016-17)
Spring 2012 was the last update of Compliance School Safety Plan, it will be updated again the Fall of 2016. A committee of administrators, teachers, parents, classified staff and students developed this plan and the plan is reviewed every year by the police and our Site Council. • Our administration works hard to protect the safety of students on campus. We have sustained Sebastopol Police Department,
the station is nearby and they are quick to respond to our needs. • Our staff has received District provided training on how to identify students that may be "under the influence". Additionally,
AHS provides a Drug/Alcohol counselor on staff Analy is a safe campus. Gang related activity is minimal to non – existent and the administration diligently works to keep trouble off of our campus; however the Analy campus is quite spread out, so not all corners can be watched. Teachers have a rotating schedule of supervision duty. The school has taken several steps to make the campus more secure. These steps include: Utilization of security badges for faculty and staff, check in procedures for campus visitors, developing and practicing emergency procedures for “intruder on campus” (in coordination w/ the local police department) drills, fire drills, earthquake drills, and shelter in place drills. Our campus also maintains multiple security cameras.
D. Other SARC Information
The information in this section is required to be in the SARC but is not included in the state priorities for LCFF. Federal Intervention Program (School Year 2016-17)
Indicator School District
Program Improvement Status
First Year of Program Improvement
Year in Program Improvement*
Number of Schools Currently in Program Improvement N/A 0
Percent of Schools Currently in Program Improvement N/A .0 Note: Cells with N/A values do not require data.

2015-16 School Accountability Report Card for Analy High School Page 11 of 12
Average Class Size and Class Size Distribution (Secondary)
Subject
2013-14 2014-15 2015-16
Avg. Class Size
Number of Classrooms Avg. Class Size
Number of Classrooms Avg. Class Size
Number of Classrooms
1-22 23-32 33+ 1-22 23-32 33+ 1-22 23-32 33+
English------- ----------
26 10 32 10 25 13 38 3 25 13 38 3
Mathematics ----------
27 7 30 8 27 9 25 12 27 9 25 12
Science------- ----------
29 4 18 15 29 1 31 5 29 1 31 5
Social Science ----------
32 1 14 27 31 1 22 19 31 1 22 19 Note: Number of classes indicates how many classrooms fall into each size category (a range of total students per classroom). At the secondary school level, this information is reported by subject area rather than grade level. Academic Counselors and Other Support Staff (School Year 2015-16)
Title Number of FTE
Assigned to School Average Number of Students per
Academic Counselor
Academic Counselor------- 3.8 306
Counselor (Social/Behavioral or Career Development) .875 N/A
Library Media Teacher (Librarian) 1.0 N/A
Library Media Services Staff (Paraprofessional) 0 N/A
Psychologist------- .8 N/A
Social Worker------- 0 N/A
Nurse------- .16 N/A
Speech/Language/Hearing Specialist .11 N/A
Resource Specialist------- N/A
Other------- N/A Note: Cells with N/A values do not require data. *One Full Time Equivalent (FTE) equals one staff member working full time; one FTE could also represent two staff members who each work 50 percent of full time.
Expenditures per Pupil and School Site Teacher Salaries (Fiscal Year 2014-15)
Level
Expenditures Per Pupil Average Teacher Salary Total
Supplemental/ Restricted
Basic/ Unrestricted
School Site------- 6538 1054 5484 62632
District------- N/A N/A 7534 $63,813
Percent Difference: School Site and District N/A N/A -27.2 -1.9
State------- N/A N/A $5,677 $75,859
Percent Difference: School Site and State N/A N/A -3.4 -17.4 Note: Cells with N/A values do not require data.
Types of Services Funded (Fiscal Year 2015-16)
• English Language Learners Education (ELL) • LCAP Funding Grant to engage parents and students through AHS Site Council • Agricultural Grant • Grant for Drug and Alcohol Counselor • No Child Left Behind (NCLB) federal funding that includes technology and staff development • Educator Effectiveness Funding for Staff Development • CTE Grant

2015-16 School Accountability Report Card for Analy High School Page 12 of 12
Teacher and Administrative Salaries (Fiscal Year 2014-15)
Category District Amount State Average for Districts In Same Category
Beginning Teacher Salary $41,889 $45,265
Mid-Range Teacher Salary $59,622 $72,281
Highest Teacher Salary $75,654 $94,342
Average Principal Salary (Elementary)
Average Principal Salary (Middle)
Average Principal Salary (High) $107,741 $127,317
Superintendent Salary $156,148 $168,625
Percent of Budget for Teacher Salaries 31% 34%
Percent of Budget for Administrative Salaries 5% 6% For detailed information on salaries, see the CDE Certificated Salaries & Benefits Web page at http://www.cde.ca.gov/ds/fd/cs/. Advanced Placement (AP) Courses (School Year 2015-16)
Subject Number of AP Courses Offered* Percent of Students In AP Courses
Computer Science 1 N/A
English------- 2 N/A
Fine and Performing Arts 2 N/A
Foreign Language 0 N/A
Mathematics 1 N/A
Science------- 3 N/A
Social Science 4 N/A
All courses 13 17.6 Cells with N/A values do not require data. *Where there are student course enrollments of at least one student.
Professional Development (Most Recent Three Years)
The district provided two Staff Development days that did not include student participation. Additionally, our site offers two (2) Common Planning Time (CPT) days per week which allow individual departments to meet to develop curriculum, plan common lessons and assessments, and collaborate interdepartmentally. Our certificated staff is encouraged to attend conferences and various programs that are offered for which funding is made available through the Educator Effectiveness Grant.