an overview of winter 2018 sea ice conditions€¦ · an overview of winter 2018 sea ice conditions...
TRANSCRIPT

An overview of winter 2018 sea ice conditions
Bering Strait
International Arctic Research CenterUniversity of Alaska FairbanksPO Box 7573402160 Koyukuk DriveFairbanks, Alaska 99775-7340
Who are we?
This summary was made by the International Arctic Research Center (IARC) in collaboration with NOAA. IARC is one of several research facility at the University of Alaska Fairbanks. One of our goals is to help Alaskans understand, prepare for and adapt to climate change impacts in the Arctic.
Additional contributors
• National Snow and Ice Data Center
• University of California, Irvine.
Questions or comments?
Send questions or comments about this publication to Heather McFarland, [email protected] or call 907-474-6286.
International ArcticResearch Center
University of Alaska Fairbanks
Satellite image of the Bering Strait region on Feb 20 (coast outline shown in gray).
Savoonga
Gambell
Little DiomedeShishmarefWales
A winter unlike the restTypically, sea ice forms in protected waters of the southern Chukchi and northern Bering seas during October. Freeze-up in 2017/18 was exceptionally late, and in the Bering Strait, ice moved in and out of the region repeatedly. Communities were significantly impacted.
Travel between communities via boat or snowmachine was difficult and limited due to thin unstable sea ice. At times there was not enough ice to harvest marine mammals, fish, or crabs. As a result of increased open water, storm surf flooded homes and pushed ice rubble onto shore. Jumbled ice covered beaches, essential infrastructure (ex. helipad at Diomede Island), and driftwood.
As the list of impacts continues to grow, people are asking questions. Why didn’t more sea ice form? What do these changes mean? Will this be the new normal? Scientists at UAF’s International Arctic Research Center are working to answer these questions.

What did communities experience?Throughout the Bering Strait there was a lack of, or late development of, shorefast ice. With little to no sea ice, communities had limited protection from the ocean. Flooding, loss of power, damage to infrastructure, and build-up of ice on shore occurred during storms.
Community observations winter 2018
Savoonga... After February’s lack of ice, winds shifted abruptly on March 9 bringing sea ice back to Savoonga. Even as ice returned, local resident Aqef Waghiyi reported that “it is all broken up... no flat pieces and it is real rough. There are patches of open water... biggest open patch in front of town is maybe as big as a football field.”
Photo by Savoonga IRA, February 14
Gambell... Near Gambell, vast stretches of open water extended all the way to Russia until mid-March. During this time, local experts and Sea Ice for Walrus Outlook contributors reported a lack of walrus in the area.
Photo by Clarence Irrigoo Jr., February 8
Little Diomede... A large late February storm caused considerable damage on Little Diomede Island. As a result of the storm, the community lost power and ice rubble covered beaches, the helipad, and damaged the water treatment plant.
Photo by Carla Ahkvaluk, February 20
Shishmaref... Freeze-up was unusually late in Shishmaref. Even when the surrounding area appeared to have ice, there was a stretch of open water around the community into mid-January. After the ice finally formed, it repeatedly broke up during storms allowing surf to push large ice chunks onto beaches.
Photo by Sharon Nayokpuk, February 22
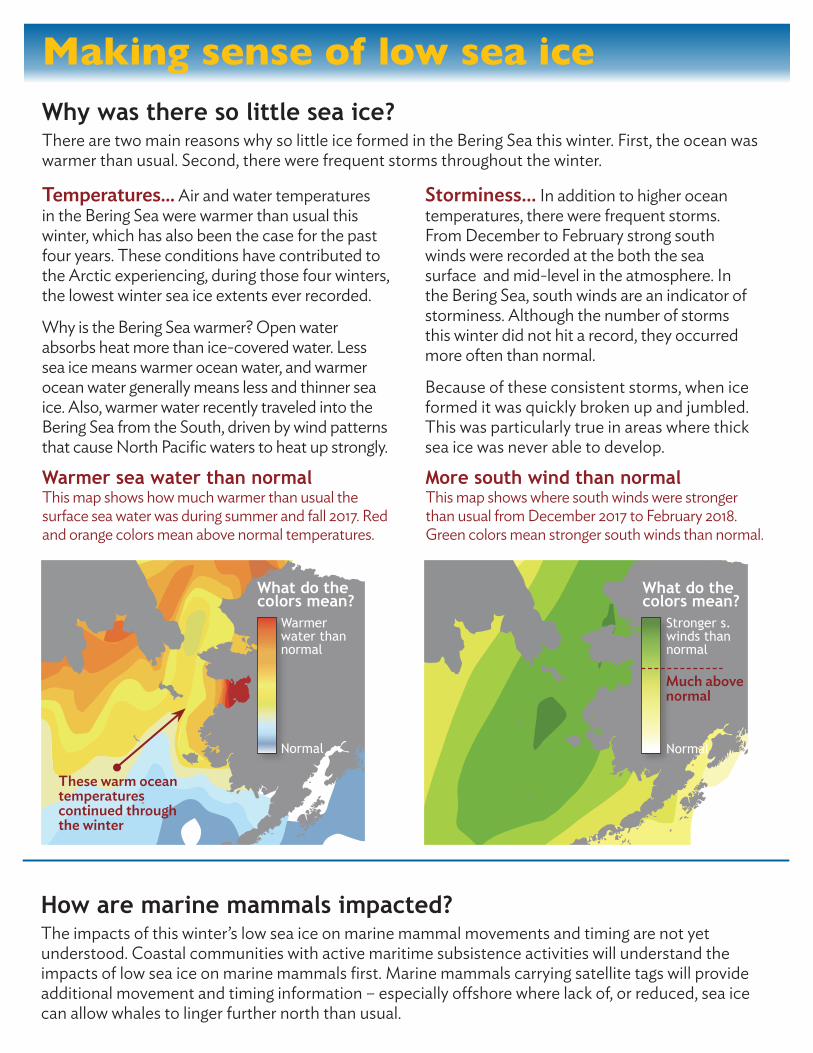
How are marine mammals impacted?The impacts of this winter’s low sea ice on marine mammal movements and timing are not yet understood. Coastal communities with active maritime subsistence activities will understand the impacts of low sea ice on marine mammals first. Marine mammals carrying satellite tags will provide additional movement and timing information – especially offshore where lack of, or reduced, sea ice can allow whales to linger further north than usual.
Storminess... In addition to higher ocean temperatures, there were frequent storms. From December to February strong south winds were recorded at the both the sea surface and mid-level in the atmosphere. In the Bering Sea, south winds are an indicator of storminess. Although the number of storms this winter did not hit a record, they occurred more often than normal.
Because of these consistent storms, when ice formed it was quickly broken up and jumbled. This was particularly true in areas where thick sea ice was never able to develop.
Temperatures... Air and water temperatures in the Bering Sea were warmer than usual this winter, which has also been the case for the past four years. These conditions have contributed to the Arctic experiencing, during those four winters, the lowest winter sea ice extents ever recorded.
Why is the Bering Sea warmer? Open water absorbs heat more than ice-covered water. Less sea ice means warmer ocean water, and warmer ocean water generally means less and thinner sea ice. Also, warmer water recently traveled into the Bering Sea from the South, driven by wind patterns that cause North Pacific waters to heat up strongly.
Why was there so little sea ice?There are two main reasons why so little ice formed in the Bering Sea this winter. First, the ocean was warmer than usual. Second, there were frequent storms throughout the winter.
Making sense of low sea ice
Normal
Much above normal
Stronger s.winds than normal
What do the colors mean?
Normal
Warmer water than normal
What do the colors mean?
These warm ocean temperatures continued through the winter
Warmer sea water than normalThis map shows how much warmer than usual the surface sea water was during summer and fall 2017. Red and orange colors mean above normal temperatures.
More south wind than normalThis map shows where south winds were stronger than usual from December 2017 to February 2018. Green colors mean stronger south winds than normal.

What’s next?There are several marine and coastal monitoring instruments in the Bering Sea (to see a map of their locations visit https://portal.aoos.org/research-assets.php). These instruments continue to collect data and will help us better understand why this winter broke records for the lack of sea ice. Bering Strait sea ice conditions will continue to change. Further reductions in sea ice will impact travel, subsistence uses, and safety. Planning and adapting to these changes is essential.
The rest of this winter... The expansion of sea ice across the Bering Sea in early March was reversed on March 21 with the return of stormy conditions from the south. As a result, sea ice will continue to be broken or thin for the rest of April. The combination of thin ice and large areas of ice with little snow insulation will cause an early sea ice break-up and very rapid ice retreat.
Winters to come... Communities need to prepare for more winters with low sea ice and stormy conditions. Although not every winter will be like this one, there will likely be similar winters in the future. Ice formation will likely remain low if warm water temperatures in the Bering Sea continue.
How did this winter compare to the past?The amount of sea ice in the Bering Sea was less this winter than any year since written records of the commercial whalers started in 1850. This February there was 51,390 square miles less ice (that’s over twice the size of the Seward Peninsula) than 2001, the previous record low.
The graph below compares the amount of sea ice this February to the past 168 years based on information gathered from recent satellites (over the last 40 years) and historic ship logs (from shipping, whaling vessels, and the U.S. Coast Guard). You can learn more about historic sea ice conditions in the Bering Sea at http://seaiceatlas.snap.uaf.edu/.
Square miles of sea ice
Past and future
UAF is an AA/EO employer and educational institution and prohibits illegal discrimination against any individual: www.alaska.edu/nondiscrimination/.
2018
1850 1875 1900 1925 1950 1975 2000
200,000
100,000
300,00
400,00
2001 previous
record low
2018
Year
Average amount of sea ice from 1979–2017= about 270,000 square miles