an-najah national university attitude_ knowledge... · human blood and blood products human blood...
TRANSCRIPT
1
An-Najah National University
FACULTY OF NURSING
NURSING ATTITUDE, KNOWLEDGE AND PRACTICE TOWARD MEDICAL WASTE MANAGEMENT: A STYDY CONDUCTED IN THE
NORTHERN AREA OF THE PALESTINIAN WEST BANK
Prepared by
Amjad Malayshi Nidal Hashem
Jamilah Salamah Tariq Al-khateeb
Supervised by
Dr. Adnan Sarhan Miss. Mahdia Al-kony
2010-2009

2
Content
I. Introduction
I.I Types of medical waste
I.II Waste Segregation
I.III Background
I.IV Significance of the study
I.V Question of the study
I.VI Aims of the study
I.VII Demographic data
II. Literature review
III. Methodology
III.I Introduction
III.II Study population
III.III Study design
III.IV Sampling
III.V Instrument
III.VI Setting of the study
III.VII Inclusion criteria for the sample and Exclusion criteria for the sample
III.IIX Period of the study
III.IX Data collection
III.X Piloting
III.XI Validity of the tool
III.XII Stability of the tool
III.XIII Statistical processing
III.XIV Reliability
IV. Results
IV.I Introduction of results
IV.II Analysis
IV.III Demographic data analysis
IV.IV Knowledge data analysis
IV.V Attitude data analysis
IV.VI Practice data analysis

3
V. Discussion
VI. Conclusion
VII. Recommendation
IIX. References

4
List of tables
Table (1): Distribution of the sample of the study as a variable of the city.
Table (2): Distribution of the sample of the study as a variable of the sex.
Table (3): Distribution of the sample of the study as a variable of the age.
Table (4): Distribution of the sample of the study as a variable of the marital status.
Table (5): Distribution of the sample of the study as a variable of the address.
Table (6): Distribution of the sample of the study as a variable of the education level.
Table (7): Distribution of the sample of the study as a variable of the experience .
Table No (8): Averages and standard deviations for the degree of knowledge, attitude of nursing
staff in government hospitals in the cities of Nablus and Jenin in the management of medical
waste.
Table No (9): Averages and standard deviations for the degree of knowledge, attitude of nursing
staff in government hospitals in the cities of Nablus and Jenin in the management of medical
waste.
Table No. (10): Test results (T) to signify the differences in knowledge and attitude of nursing
staff in government hospitals in the cities of Nablus and Jenin in the management of medical
waste by changing the city.
Table No. (11): Test results (T) to signify the differences in knowledge and attitude of nursing
staff in government hospitals in the cities of Nablus and Jenin in the management of medical
waste by changing the sex.
Table No. (12) :The results of anova of the degree of knowledge and behavior and the practice of
nursing staff in government hospitals in the cities of Nablus and Jenin in the management of
medical waste due to the variable age.
Table No. (13): he results of anova of the degree of knowledge and behavior and the practice of
nursing staff in government hospitals in the cities of Nablus and Jenin in the management of
medical waste due to the variable Social status.
Table No. (14): The results of anova of the degree of knowledge and behavior and the practice of
nursing staff in government hospitals in the cities of Nablus and Jenin in the management of
medical waste due to the variable address.
Table No. (15): The results of anova of the degree of knowledge and behavior and the practice of
nursing staff in government hospitals in the cities of Nablus and Jenin in the management of
medical waste due to the variable level of education.

5
Table No. (16): The results of anova of the degree of knowledge and behavior and the practice of
nursing staff in government hospitals in the cities of Nablus and Jenin in the management of
medical waste due to the variable experience.
Table No. (17): Shows the a posteriori LSD test comparisons to determine differences to the
variable level of education.
Table (18): show the answers of the assay question.

6
I. INTRODUCTION The Medical Waste Management Act defines “medical waste” as biohazardous or sharps
waste,which is generated or produced as a result of the diagnosis, treatment, or immunization of
human beings, research pertaining to the diagnosis, treatment, or immunization of human beings,
production/testing of biological or the accumulation of properly contained hospital-generated
sharps waste. (Handling biohazardous and medical waste, Biosafety Handbook, chapter 20).
Infectious medical wastes represent an increasing problem everywhere in the world due to
sanitary safety and costs involvement. (Chemother, 1999).
Good healthcare waste management in a hospital depends on a dedicated waste management
team, good administration, careful planning, sound organization, underpinning legislation,
adequate financing, and full participation by trained staff. Hence, waste management protocols
must be convenient and sensible. (Gehan M.A. Mostafa, et al, 2009). Sanitary staff has very poor
knowledge about the Biomedical waste management (BMW) Act and rules, but a good
percentage of this category has positive attitude and practice habits. (S. Saini, S.S. Nagarajan,
R.K. Sarma, 2005).
In 2002, the results of a WHO assessment conducted in 22 developing countries showed that
the proportion of health-care facilities that do not use proper waste disposal methods ranges from
18% to 64 %.( WHO, 2004).
Health care waste (HCW) is a by-product of health care that includes sharps, non-sharps,
blood, body parts, chemicals, pharmaceuticals, medical devices and radioactive materials. Poor
management of HCW exposes health care workers, waste handlers and the community to
infections, toxic effects and injuries.
(KH. Dhalfullah, nor)
I.I TYPES OF MEDICAL WASTE
Human Blood and Blood Products
Human blood and blood products are classified and managed as medical waste because of the
possible presence of infectious agents that cause blood-borne disease. Wastes in this category
include bulk blood and blood products as well as smaller quantities of blood samples drawn for
testing or research. Waste human blood must be treated by steam sterilization. After sterilization,
the liquid portion may be safely poured off into a sanitary sewer drain.
(Department of Risk Management and Safety Hazardous Materials Management, 2006).

7
Cultures and Stocks of Infectious Agents
Cultures and stocks of human infectious agents, regardless of storage method, must be
managed as medical waste. Cultures and stocks of zoonotic disease are not regulated as medical
waste if they have neither been intentionally exposed to a human infectious agent nor capable of
transmitting that disease to humans.
(Department of Risk Management and Safety Hazardous Materials Management, 2006).
Sharps
All hypodermic needles and syringes, intravenous needles and tubing, scalpel blades, lances,
and other such devices are regulated as medical waste. Even if these materials are unused they
are still regulated. All sharps must be placed in an approved sharps container. Sharps that have
been exposed to human disease agents must be autoclaved prior to pickup by Risk Management
and Safety.
(Department of Risk Management and Safety Hazardous Materials Management, 2006).
Glassware
Glassware exposed to a human infectious agent must be managed as a sharp until it
has been autoclaved. This includes pipettes, capillary tubes, test tubes, stir rods, and other
laboratory equipment. All glassware that has been exposed to human infectious agents must be
autoclaved prior to disposal. After the glassware has been autoclaved it can be thrown in the
trash. Glassware that has not been exposed to a human disease agent is not regulated as a sharp.
Broken glassware should be placed into a container designed for such materials and
either recycled or disposed. At a minimum, broken glassware should be disposed of in small
double lined cardboard boxes and clearly labeled as broken glassware. Small double lined boxes
minimize the potential for injury and excessive accumulation in the laboratory.
(Department of Risk Management and Safety Hazardous Materials Management, 2006).
Contaminated Equipment
This includes any equipment not mentioned above which may come into contact with human
infectious agents. Equipment that has been contaminated with human disease agents must be
treated as a medical waste and either autoclaved or shipped off-site for treatment.
(Department of Risk Management and Safety Hazardous Materials Management, 2006).

8
The concern regarding the medical waste is mainly due to the presence of pathogenic organisms
and organic substances in hospital solid wastes in significantly high concentrations. The
substantial number of organisms of human origin in solid waste suggests the presence of virulent
strains of viruses and pathogenic bacteria in undetected numbers. (Wallace L.P., Zaltzman R. and
Burchinal lC. 1972).
I.II WASTE SEGREGATION
Different color coding has to be assigned to various waste for effective segregation, as: Black:
Non-Risk waste, Red: Risk waste with Sharps, Blue: Risk Waste without sharps, Yellow:
Radioactive waste, Green: Chemicals like Mercury & Cadmium
All this segregation should be done by the individual user (WHO, 2006)
I.III BACKGROUND
Jenin and Nablus cities considered as large area and contain large amounts of medical wastes
in there hospitals, these wastes considered an important session of huge problem that health care
provider and who expose to these wastes may suffer and become with direct contact with these
contaminated wastes.
Large numbers of health care provider could lose there work or may there life as a result of
poor managing medical waste.
hospitals as jenin governmental hospital, Rafidia and Al-watane governmental hospitals do
not have a specific criteria from Palestinian ministry of health for managing medical wastes.
The study concentrates on the attitude, knowledge and practice of nurses in these governmental
hospitals for separating and managing medical waste.
I.IV SIGNIFICANCE OF THE STUDY
Its be observed As a result of lack of waste separation practices in jenin, Rafidia and Al-
watane governmental hospitals, many of these hazardous materials are represent a serious health
hazard to health workers and the public.
Regulated medical waste is a new designation for wastes that may contain pathogenic
microorganisms which can termed “infectious waste”, these waste must be managed in order to
minimize the potential of personal exposures.

9
Therefore improper handling of solid waste in the hospital may increase the airborne
pathogenic bacteria, which could adversely effect the hospital environment and community at
large. (NIOSH /Health Care Workers guidelines / Chap 6).
I.V QUESTIONS OF THE STUDY
1. What is the nursing knowledge and attitude regarding medical waste managment?
2. Is nurses practice separation of medical wastes?
I.VI AIMS OF THE STUDY
- To evaluate the practice of separating hospital medical wastes.
- To evaluate the knowledge and attitude about the importance of managing medical wastes.
I.VII DEMOGRAPHIC DATA
According to a 2007 census, Jenin city has a population of 256,000 Palestinian peoples. The
Jenin refugee camp housed approximately 20,000 refugees, according to United Nations Relief
and Works Agency (UNRWA) on 373 dunams. Some 42.3% of the population of the camp is
under the age of fifteen.
Jenin city contains four hospitals, one of them is governmental hospital and the others are
private hospitals. Jenin governmental hospital located at the center of jenin city, this hospital is
centralized for all people who came from all areas around jenin city, and this includes all
villages.
According to a 2007 census, Nablus city has a population of 321,000 Palestinian peoples, 56
villages and tow camps. Nablus contains tow governmental hospitals, Rafidia, Al-watane. And
four special hospitals.
10
II. LITRETURE REVIEW World Health Organization (WHO, 2000) sure that the unsafe disposal of health-care waste
(for example, contaminated syringes and needles) poses public health risks. Contaminated
needles and syringes represent a particular threat as the failure to dispose of them safely may
lead to dangerous recycling and repackaging which lead to unsafe reuse. Contaminated injection
equipment may be scavenged from waste areas and dumpsites and either be reused or sold to be
used again.
WHO estimated that contaminated injections with contaminated syringes caused 21 million
hepatitis B virus (HBV) infections (32% of all new infections), and two million hepatitis C virus
(HCV) infections (40% of all new infections), and at least 260 000 HIV infections (5% of all
new infections). (WHO, 2000)
In addition to the public health risks, if not managed, direct reuse of contaminated injection
equipment results in occupational hazards to health workers, waste handlers and scavengers.
Where waste is dumped into areas without restricted access, children may come into contact with
contaminated waste and play with used needles and syringes. Epidemiological studies indicate
that a person who experiences one needle stick injury from a needle used on an infected source
patient has risks of 30%, 1.8%, and 0.3% respectively of becoming infected with HBV, HCV and
HIV. (WHO,2004).
The majority of community nurses reported compliance with universal precautions, although
a small number of nurses stated that they re-sheathed needles, inappropriately stored sharps
containers, inadequately wore gloves and experienced difficulties in hand washing.
(Bennett G. & Mansell I, 2004).
Forty questionnaires were distributed to nurses with emergency department experience in
Botswana, with a response rate of 55% (n = 22). Quantitative data were analyzed using
descriptive statistics while qualitative data were subjected to thematic and content analysis. The
majority of respondents reported compliance with universal precautions at the hospital
emergency department. However, qualitative data highlighted resource constraints that may
hinder compliance with universal precautions such as a lack of appropriate facilities, a shortage
of equipment and materials, inadequate staffing and absence of sustainable in-service education
programs. (Chelenyane M, Endacott R. 2006).
In addition, Nurses at the 437-bed University Hospital handled more needles and experienced
more needle stick injuries than did nurses at the 300-bed Community Hospital. Needle-handling

11
and needle stick injuries among personnel at the two hospitals were similar, although University
Hospital interns and residents and University Hospital fourth-year students handled more needles
than did the staff at either hospital. A total of 164 (33.6%) respondents reported receiving one or
more needle stick injuries during 1983. A large proportion of respondents in each group reported
that they did nothing about the needle stick injuries they experienced. Carelessness was
perceived by all groups to be the most common reason for needle stick injuries. Most
respondents reported some knowledge of proper needle disposal techniques and perceived lack
of knowledge as the least important reason for needle stick injuries. (Marguerite M. Jackson,
Douglas C. Dechairo, Dianne F. Gardner, 1986).
The Objectives and rationale of bio-medical wastes (BMW) management are mainly to
reduce waste generation, efficient collection, handling and disposal in such a way that it controls
infection and provides safety to employees working in the system and ensure cost effectiveness
by avoiding penalties and fines imposed by regulatory authorities. Accordingly, waste is required
to be treated and disposed of in accordance with schedules prescribed. The basic elements is to
recognize the waste, identify where waste is generated and determine the cause of generation,
plan disposal of the waste in a scientific manner so as to render it environmentally non-
hazardous and eliminate the source of infection. (S. Saini, S.S. Nagarajan, R.K. Sarma, 2005)
Medical waste contains highly toxic metals, toxic chemicals, pathogenic viruses and bacteria,
which can lead to pathological dysfunction of the human body. Medical waste presents a high
risk to doctors, nurses, technicians, sweepers, hospital visitors and patients due to arbitrary
management. It is a common observation in Dhaka City that poor scavengers, women and
children collect some of the medical wastes (e.g. syringe-needles, saline bags, blood bags etc.)
for reselling despite the deadly health risks. It has long been known that the re-use of syringes
can cause the spread of infections such as AIDS and hepatitis. The collection of disposable
medical items (particularly syringes), its re-sale and potential re-use without sterilization could
cause a serious disease burden. (BMC Public Health, 2008).
The safe disposal and subsequent destruction of medical waste is a key step in the reduction
of illness or injury through contact with this potentially hazardous material, and in the prevention
of environmental contamination. The transmission of blood-borne viruses and respiratory, enteric
and soft tissue infections through improper medical waste disposal is not well described. The
management of medical waste therefore, has been of major concern due to potentially high risks
to human health and the environment. (BMC Public Health,2008).

12
III. METHODOLOGY III.I Introduction to methodology
This study was conducted in jenin, Rafedia and al-watane governmental hospital, northern area
of the Palestinian west bank. These hospitals involve deferent departments that contain nurse’s
workers and produce large amounts of medical wastes.
The tool was contributed in all department that contains nurses in these hospitals
III.II Study population The study targeted to the nurses whom work in these hospitals, and this includes all levels of
nurses.
III.III Study design The design of our study was cross-sectional descriptive design. The researcher use a semi-
constructed design for the tool of the study, and the sample taken at one time.
III.IV Sampling Our sample had chosen through heterogeneous convenient method, and we collect 198 samples.
III.V Instrument The tool was used for collection of data was a questionnaire which has semi-structured format
with a set of 30 Items, concerning the knowledge, attitude and practice on the subject. This was
further categorized in four sets, demographic data, knowledge, attitude and practice, and we use
a scale for answering the questions.
III.VI Setting of the study The study was conducted in Jenin, Rafedia and Al-watne governmental hospitals. Northern area
of the Palestinian west bank.
III.VII Inclusion criteria for the sample and Exclusion criteria for the sample
The inclusion group was all departments that contain nurse’s worker.
The exclusion group was all departments that dose not contain nurses.

13
III.IIX PERIOD OF THE STUDY
The study started in 1/2/2010, and continuo for 3 month, the study ended in 1/5/2010, the tools
was contributed in the department within three shift (A,B,C ) and collected in tow days.
III.IX DATA COLLECTION
Tow hundred samples collected from the three hospitals, the data filled through face to face
interview.
III.X PILOTING Pilot sample was taken in the three hospitals, the nurse’s opinion about the tool was good and
they give us a constructive background for our study.
III.XI VALIDITY OF THE TOOL
Verified the authenticity of the tool by offering a range of arbitrators with competence and
experience in statistical studies, and were asked to express an opinion on the paragraphs of
resolution and the deletion and amendment and propose new paragraphs and appropriate tool for
study, based on observations of the arbitrators has been modified instrument of the study became
finalized constituent of four parts (21) paragraph.
III.XII STABILITY OF THE TOOL
in order to extract the stability coefficient of the tool, the equation was used Cronbach alpha to
determine internal consistency of the paragraphs of resolution amounted to (0.826) and this value
indicates that the tool has an appropriate degree of stability and fulfill the purposes of this study.
III.XIII STATISTICAL PROCESSING
After data collection, coding, and processing of statistical methods appropriate, using the
program packages of statistical SPSS, the researchers used frequencies, averages, standard
deviations, percentages, and test (T) for independent samples, analysis of variance, and the
equation of Cronbach alpha.
III.XIV RELIABILITY
Method 1 (space saver) will be used for this analysis
R E L I A B I L I T Y A N A L Y S I S - S C A L E (A L P H A)
Statistics for Mean Variance Std Dev N of Variables
SCALE 70.0729 77.4716 8.8018 32

14
Reliability Coefficients
N of Cases = 198.0 N of Items = 32
Alpha = .8262
15
City
12
IV. RESULTS
IV.I INTRODUCTION TO RESULTS
Researchers follow the descriptive analytical method to suitability for the purposes of this study,
an approach that deals with the phenomenon as it is in fact, works to describe, analyze, and
ant to where the researchers depends on the sources of information relevlinked to other events,
which has been prepared on ,the study, analysis, and then collecting data through questionnaire
the basis of the theoretical framework and previous studies.
IV.II ANALYSIS The study population consisted of all nurses in government hospitals in the cities of Nablus and
Jenin, where the researcher selected a heterogeneous convenient sample consisting of (198)
nurses in government hospitals in the cities mentioned, with the following description of the
characteristics of the study sample according to variables:
IV.III DEMOGRAPHIC DATA ANALYSIS
Table (1): Distribution of the sample according to the city
Valid Frequency Percent Valid
Percent Cumulative
Percent 1 Nablus 134 67.7 67.7 67.7 2 Jenin 64 32.3 32.3 100.0 Total 198 100.0 100.0
16
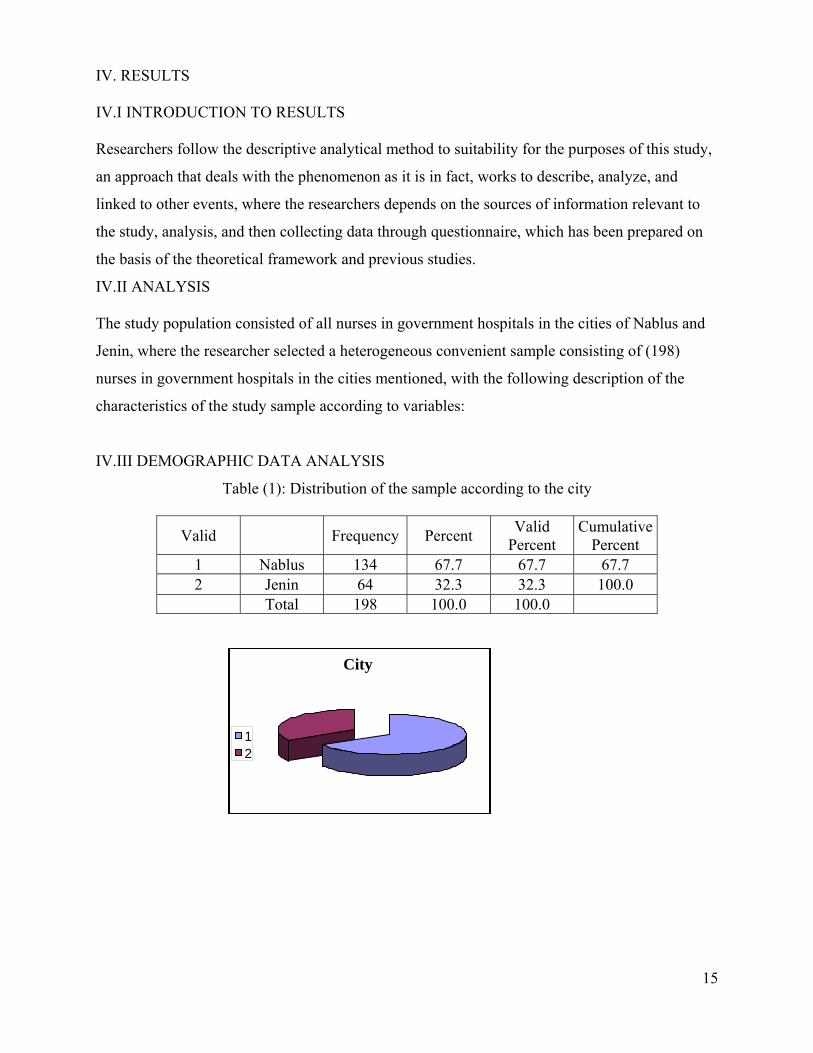
Table (2): Distribution of the sample according to the sex
Valid Frequency Percent Valid
Percent Cumulative
Percent 1 Male 88 44.4 44.4 44.4 2 Female 110 55.6 55.6 100.0 Total 198 100.0 100.0
Table (3): Distribution of the sample according to the age
Valid Frequenc
y Percent
Valid Percent
Cumulative Percent
1 20-29 95 48.0 48.0 48.0 2 30-39 66 33.3 33.3 81.3
3 more than
40 37 18.7 18.7 100.0
Total 198 100.0 100.0
Table (4): Distribution of the sample according to the martial status
Valid Frequency Percent Valid
Percent Cumulative
Percent 1 Single 61 30.8 30.8 30.8 2 Married 129 65.2 65.2 96.0 3 Divorced 8 4.0 4.0 100.0 Total 198 100.0 100.0
1 2 3
Sex
21
17
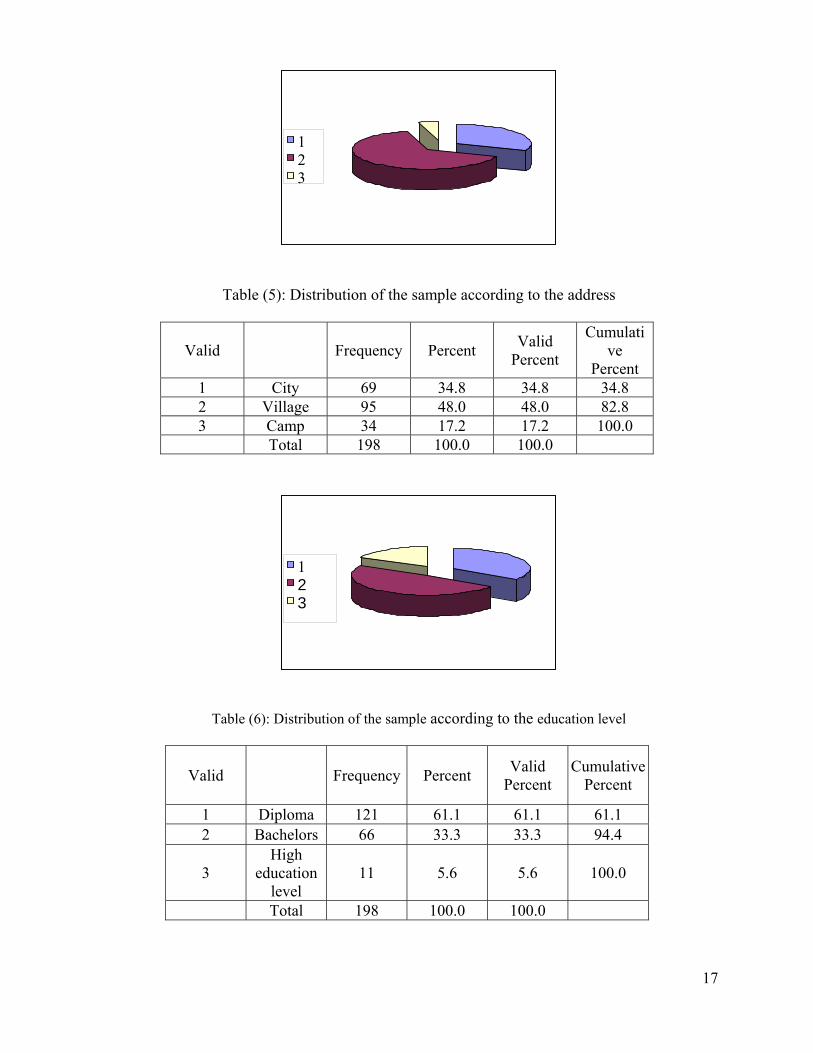
Table (5): Distribution of the sample according to the address
Valid Frequency Percent Valid
Percent
Cumulative
Percent 1 City 69 34.8 34.8 34.8 2 Village 95 48.0 48.0 82.8 3 Camp 34 17.2 17.2 100.0 Total 198 100.0 100.0
Table (6): Distribution of the sample according to the education level
Valid Frequency Percent Valid
Percent Cumulative
Percent
1 Diploma 121 61.1 61.1 61.1 2 Bachelors 66 33.3 33.3 94.4
3 High
education level
11 5.6 5.6 100.0
Total 198 100.0 100.0
123
123

18
Table (7): Distribution of the sample according to the experience
Valid Frequency Percent Valid
Percent Cumulative
Percent
1 less than 6
months 13 6.6 6.6 6.6
2 7-11
months 19 9.6 9.6 16.2
3 1-5 years 65 32.8 32.8 49.0
4 more than 5
years 101 51.0 51.0 100.0
Total 198 100.0 100.0
IV.IV KNOWLADGE DATA ANALYSIS
Q1: Frequency Percent
Valid Strongly agree 10 5.1 agree 28 14.1 disagree 122 61.6 Strongly disagree 37 18.7 5.00 1 .5 Total 198 100.0
1 2 3 4
123

19
Q2:
Frequency Percent
Valid Strongly agree 8 4.0 agree 66 33.3 disagree 90 45.5 Strongly disagree 34 17.2 Total 198 100.0
Q3:
Frequency Percent
Valid Strongly agree 32 16.2 agree 69 34.8 disagree 64 32.3 Strongly disagree 33 16.7 Total 198 100.0
Q4:
Frequency Percent Valid Strongly agree 16 8.1
agree 42 21.2 disagree 72 36.4 Strongly disagree 68 34.3 Total 198 100.0
Q5:
Frequency Percent Valid Strongly agree 10 5.1
agree 35 17.7 disagree 81 40.9 Strongly disagree 72 36.4 Total 198 100.0
Q6:
Frequency Percent Valid Strongly agree 6 3.0
agree 7 3.5 disagree 53 26.8 Strongly disagree 132 66.7 Total 198 100.0

20
Q7:
Frequency Percent
Valid Strongly agree 41 20.7 agree 68 34.3 disagree 63 31.8 Strongly disagree 26 13.1 Total 198 100.0
IV.V ATTITUDE DATA ANALYSIS
Q8:
Frequency Percent
Valid Strongly agree 7 3.5 agree 16 8.1 disagree 75 37.9 Strongly disagree 99 50.0 5.00 1 .5 Total 198 100.0
Q9:
Frequency Percent Valid Strongly agree 19 9.6
agree 74 37.4 disagree 81 40.9 Strongly disagree 24 12.1 Total 198 100.0
Q10:
Frequency Percent
Valid Strongly agree 32 16.2 agree 70 35.4 disagree 68 34.3 Strongly disagree 28 14.1 Total 198 100.0
Q11:
Frequency Percent
Valid Strongly agree 20 10.1 agree 81 40.9 disagree 77 38.9 Strongly disagree 19 9.6 5.00 1 .5 Total 198 100.0

21
Q12: Frequency Percent
Valid Strongly agree 40 20.2 agree 86 43.4 disagree 53 26.8 Strongly disagree 19 9.6 Total 198 100.0
Q13:
Frequency Percent Valid Strongly agree 46 23.2
agree 71 35.9 disagree 47 23.7 Strongly disagree 33 16.7 5.00 1 .5 Total 198 100.0
IV.VI PRACTICE DATA ANALYSIS Q14:
Frequency Percent Valid Yes 96 48.5
No 102 51.5 Total 198 100.0
Q15:
Frequency Percent Valid Yes 79 39.9
No 119 60.1 Total 198 100.0
Q16: Frequency Percent
Valid Yes 88 44.4 No 110 55.6 Total 198 100.0
Q17:
Frequency Percent Valid Yes 85 42.9
No 113 57.1
Total 198 100.0
22
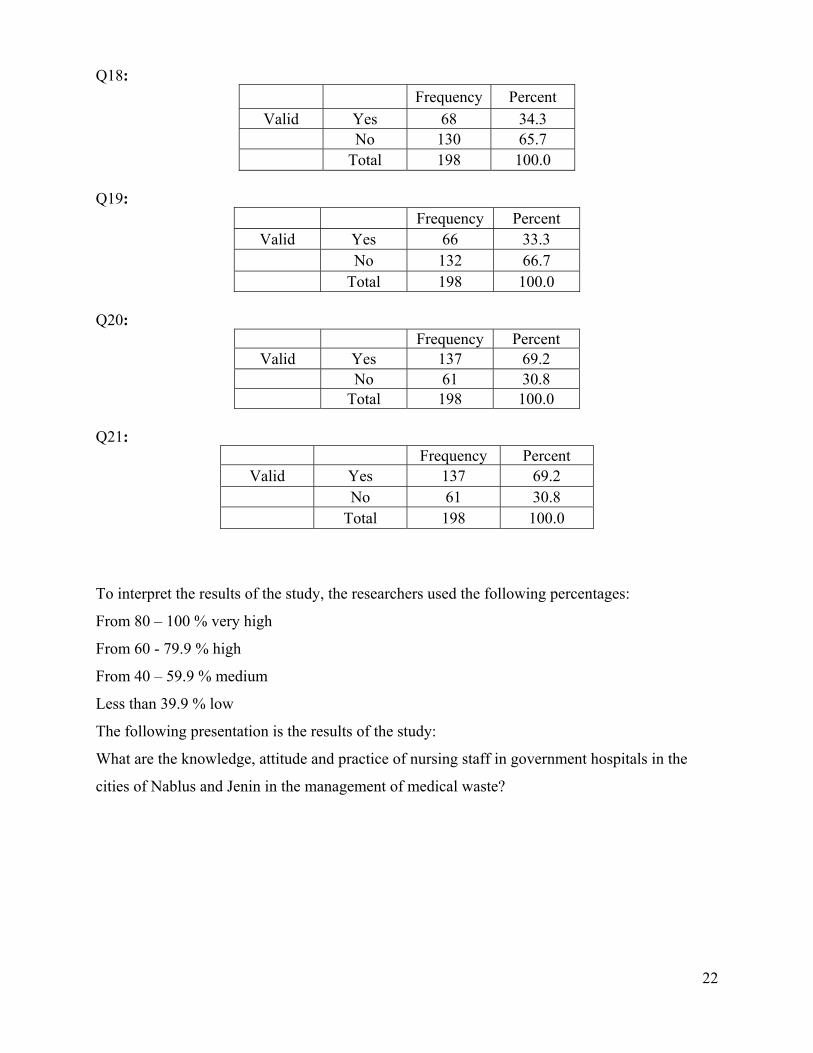
Q18: Frequency Percent
Valid Yes 68 34.3 No 130 65.7 Total 198 100.0
Q19:
Frequency Percent Valid Yes 66 33.3
No 132 66.7 Total 198 100.0
Q20:
Frequency Percent Valid Yes 137 69.2
No 61 30.8 Total 198 100.0
Q21:
Frequency Percent Valid Yes 137 69.2
No 61 30.8 Total 198 100.0
To interpret the results of the study, the researchers used the following percentages:
From 80 – 100 % very high
From 60 - 79.9 % high
From 40 – 59.9 % medium
Less than 39.9 % low
The following presentation is the results of the study:
What are the knowledge, attitude and practice of nursing staff in government hospitals in the
cities of Nablus and Jenin in the management of medical waste?

23
Table No (8): Averages and standard deviations for the degree of knowledge, attitude of nursing staff in government hospitals in the cities of Nablus and Jenin in the management of medical waste.
Paragraph
No. Paragraph Mean
standard
deviations
Percentag
es
Response
Degree
1. Medical waste is well defined in my
hospital 2.95 0.74 73.75 High
2. knowledge of medical waste management
is gained through hospital policy 2.75 0.78 68.75 High
3. Medical waste separated according to
colored bags 2.49 0.95 7375 High
4. Sharp boxes and plastic bags are available
in the department 2.96. .93 74.0 High
5. Sharps container approved model
specifications in terms of protection 3.08 0.85 77.0 High
6. Sharps container should be impervious,
rigid puncture resistance 3.57 0.70 89.25 Very High
7.
lectures, seminars or courses for medical
waste management is presented in the
hospital
2.73 0.95 68.25 High
8. medical waste management program is an
important issue in the hospital 3.35 0.78 83.75 Very High
9. My health care setting has medical waste
plan 2.55 0.82 63.75 High
10. Medical waste management is a nursing
responsibility in the hospital 2.46 0.92 61.5 High
11.
There is a clear policy describes the
mechanism to deal with hospital medical
waste
2.49 0.82 62.25 High
12. There is a full supervision for medical
waste management in the hospital 2.25 0.88 56.25 Medium
13. I'm satisfied about the process of collecting
and isolating medical waste 2.35 1.03 58.75 Medium
Total 2.73 0.49 68.25 High

24
For the areas of study, the results were as follows:
NO. Area mean S.D percentage degree
1 knowledge 2.88 0.53 72.0 high
2 Attitude 2.58 0.57 64.50 high
Table No (9): Averages and standard deviations for the degree of knowledge, attitude of nursing staff in
government hospitals in the cities of Nablus and Jenin in the management of medical waste.
(T) TEST AND THE SIGNIFICANCE LEVEL (α = 0.05)
area city N mean S.D T test Sig (2-tailed)*
knowledge nablus 134 2.98 0.51
4.023 0.000* jenin 64 2.67 0.51
attitude nablus 134 2.63 0.59
2.008 0.046* jenin 64 2.46 0.50
total nablus 134 2.81 0.49
3.316 0.001* jenin 64 2.56 0.49
Table No. (10) Test results (T) to signify the differences in knowledge and attitude of nursing staff in government hospitals in the cities of Nablus and Jenin in the management of medical
waste by changing the city. (Statistically significant at the significance level α = 0.05)
area city N mean S.D T test Sig (2-tailed)*
knowledge male 88 2.83 0.58
1.31- 0.191 female 110 2.93 0.48
attitude male 88 2.56 0.58
0.319- 0.750 female 110 2.59 0.56
total male 88 2.69 0.52
0.889- 0.375 female 110 2.76 0.46
Table No. (11) Test results (T) to signify the differences in knowledge and attitude of nursing staff in
government hospitals in the cities of Nablus and Jenin in the management of medical waste by changing the sex.
(Statistically significant at the significance level α = 0.05)

25
ANOVA TEST
Table No. (12) The results of anova of the degree of knowledge and behavior and the practice of nursing staff in government hospitals in the cities of Nablus and Jenin in the management of medical waste due
to the variable age. (Statistically significant at the significance level α = 0.05)
Table No. (13) The results of anova of the degree of knowledge and behavior and the practice of nursing staff in government hospitals in the cities of Nablus and Jenin in the management of medical waste due to
the variable Social status. (Statistically significant at the significance level α = 0.05)
area
Source of variation
Sum of squares
DF
Mean-Square
F sig
knowledge
Between groups
0.0976 2 0.0488
0.170 0.844 Within groups
55.954 195 0.287
total 56.051 197
attitude
Between groups
0.493 2 0.246
0.751 0.473 Within groups
63.992 195 0.328
total 64.485 197
total
Between groups
0.111 2 0.0555
0.224 0.800 Within groups
48.322 195 0.248
total 48.433 197
area
Source of variation
Sum of squares
DF
Mean-Square
F sig
knowledge
Between groups
0291 2 0.146
0.509 0.602 Within groups
55.760 195 0.286
total 56.051 197
Attitude
Between groups
0.777 2 0.388
1.189 0.307 Within groups
63.708 195 0.327
total 64.485 197
Total
Between groups
0.494 2 0.247
1.005 0.368 Within groups
47.939 195 0.246
total 48.433 197

26
area
Source of variation
Sum of squares
DF
Mean-Square
F Sig
knowledge
Between groups
1.305 2 0.652
2.324 0.101 Within groups
54.746 195 0.281
total 56.051 197
attitude
Between groups
1.465 2 0.733
2.267 0.106 Within groups
63.020 195 0.323
total 64.485 197
total
Between groups
1.292 2 0.646
2.672 0.072 Within groups
47.141 195 0.242
total 48.433 197
Table No. (14) The results of anova of the degree of knowledge and behavior and the practice of nursing staff in government hospitals in the cities of Nablus and Jenin in the management of medical waste due to
the variable address. (Statistically significant at the significance level α = 0.05)
area
Source of variation
Sum of squares
DF
Mean-Square
F Sig
knowledge
Between groups
1.598 2 0.799
2.862 0.060 Within groups
54.453 195 0.279
total 56.051 197
attitude
Between groups
1.582 2 0.791
2.452 0.089 Within groups
62.903 195 0.323
total 64.485 197
total
Between groups
1.557 2 0.779
3.239 0.041* Within groups
46.876 195 0.240
total 48.433 197
Table No. (15) The results of anova of the degree of knowledge and behavior and the practice of nursing staff in government hospitals in the cities of Nablus and Jenin in the management of medical waste due to
the variable level of education. (Statistically significant at the significance level α = 0.05)

27
area
Source of variation
Sum of squares
DF
Mean-Square
F sig
knowledge
Between groups
1.322 3 0.441
1.562 0.200 Within groups
54.729 194 0.282
total 56.051 197
attitude
Between groups
2.054 3 0.685
2.128 0.098 Within groups
62.430 194 0.322
total 64.485 197
total
Between groups
1.466 3 0.489
2.019 0.113 Within groups
46.967 194 0.242
total 48.433 197 Table No. (16) The results of anova of the degree of knowledge and behavior and the practice of nursing staff in government hospitals in the cities of Nablus and Jenin in the management of medical waste due to
the variable experience. (Statistically significant at the significance level α = 0.05)
LSD TEST
Level of education
Diploma Bachelor High
education level
Diploma *** 0.1828* 0.1768 Bachelor *** *** 0.00559
High education level
*** *** ***
Table No. (17) Shows the a posteriori LSD test comparisons to determine differences to the variable
level of education
Question from collage from hospital Experience
My knowledge about medical waste management acquired from?
119 38 42
total 198
Table (18): show the answers of the a say question

28
V. DISCUSSION The study sample was 132 samples from Nablus and 64 samples from jenin, the sample from
Nablus taken from tow hospitals.
Our sample had shown that the number of male nurses is closed to female nurses number and
48% of our sample was from 20-29 years old of nurses (table 2,3), the researcher attribute that
result to Tendencies of young people, especially males to the nursing profession.
The study shows that 61.1% of our sample had a diploma level of education, 33.3% had bachelor
and 5.6% had a high level of education (table 6). The researcher attributes that result to the
orientation of carrying graduate degrees to the academic edifices.
The results of questionnaire analysis show that the percentage of knowledge for nurses in our
study area is 72.0 %, the attitude percentage is 64.50 %
In the field of practice 51.25% of nurses practices there medical waste professionally
And this percentage considered as medium level of practice, for this, the researcher attribute the
high percentage of suffering between nurses from direct contact with medical waste ( sticks,
injurys) which was 48,5% (Q14).
The researcher attributes other reasons for decreased level of practice between nurses in clinical
area, first, the lack of a suitable place to dispose of medical waste. Secondary, Working Pressure.
Tertiary, Shortage of nursing staff.
In another study was done in India, the knowledge component among the nurses have shown to
be 60%, the attitude was 98.3%, and the practice was 100 %.( S. Saini, S.S. Nagarajan, R.K.
Sarma . 2005).

29
VI. CONCLUSION
The knowledge of nurses in jenin and Nablus governmental hospitals was in good level and
the attitude also in good level, but the researcher found there is a lack of practice skills in these
areas, so the practice level take an estimation medium level, with taking into account the reasons
that led up to it. The responsibility for this lack rests on the ministry of health and the hospital
and the nurse it self.
The lack of practice in the hospital leads to many problems and expose the health team and the
patients to harm, so the practice skills must be managed and improved.

30
VII. RECOMMENDATION
The researcher recommendation involve many aspects and several other institutions, for the
ministry of health (MOH), the researcher recommend that must provide the governmental
hospitals with the updated equipments that insure the safety of the nurses and the patients and
avoid them the direct contact with medical wastes, this involve the colored plastic bags and sharp
boxes with standard criteria
Also the MOH must provide the hospitals with specific protocols that describe the dealing with
medical wastes, and providing sufficient numbers of nurses for each department, and arranging
for lectures and seminars that provide the nurses with the precautions that they must followed as
considered.
For the hospital it self, the managers must keep closed supervision on the nurses through
specialized Commissions for medical waste management.
The hospital must provide a specific place for gathering medical wastes and to eliminate it in
proper way.
For the nurses, the nurse must practice his work professionally and to be a critical thinker and
creative and to be knowledge updated.

31
IIX. REFERENCES
1. Handling biohazardous and medical waste, Biosafety Handbook, chapter 20 Available at: www.ehs.uci.edu/programs/biosafety/medwasteguide.pdf . 2. KH. Dhalfullah,(nor), Healthcare waste management (HCWM); WHO Available at: http://www.healthcarewaste.org/en/115_overview.html .
3. Wallace L.P., Zaltzman R. and Burchinal lC. Where solid waste comes from; where it goes.
Modem hospitals 1972; 121(3): 92-5.
4. Guidelines for protecting the safety and health of health workers. NIOSH /Health Care Workers guidelines / Chap 6.
5. Department of Risk Management and Safety Hazardous Materials Management . Auburn University, October 2006.
Available at: http://www.auburn.edu/administration/rms/pdf/medical-waste-disposal.pdf.
6. Eleven Recommendations for Improving Medical Waste Management. The Nightingale Institute for Health and the Environment, 1997 – 2006.
Available at: http://www.nihe.org/elevreng.html .
7. Chemother. 1999 Sep 26-29; 39: 633 (abstract no. 1693).
Available at: http://gateway.nlm.nih.gov/MeetingAbstracts/ma?f=102246161.html.
8. WHO Media centre.
Available at: http://www.who.int/mediacentre/factsheets/fs281/en/index.html. 9. UNDP and Ministry of Health Seminar concludes to establish a national body to manage
medical waste. Ramallah, June 10, 2009. Available at: http://www.undp.ps/en/newsroom/pressreleasespdf/2009/15.pdf .

32
10. K. V. Radha, K. Kalaivani, R. Lavanya.2009, Case Study of Biomedical Waste Management in
Hospitals.Global Journal of Health Science, Vol 1, No 1.
11. Da Silva, A.E. Hoppe, M.M. Ravanello and N. Mello, Department of Hydraulic and Sanitation, Federal University of Santa Maria, UFSM/CT/HDS, Campus Universitário, Rua Vicente do Prado Lima, 355/201, 97105-390 Santa Maria, RS, Brazil.
12. Bennett G. & Mansell I. (2004) Universal precautions: a survey of community nurses' experience and practice. Journal of Clinical Nursing 13, 413-421. J Clin Nurs. 2004
13. Chelenyane M, Endacott R. 2006, Self-reported infection control practices and perceptions of HIV/AIDS risk amongst emergency department nurses in Botswana. Accid Emerg Nurs.
14. El-Shafie IF, Mokabel FM, Helmy FE 1995, the relationship between the knowledge of nursing
staff and their compliance to universal precautions for prevention of hepatitis B viral infection. J Egypt Public Health Assoc.
15. Marguerite M. Jackson, Douglas C. Dechairo, Dianne F. Gardner. February 1986, American Journal of Infection Control, Volume 14, Issue 1, Pages 1-10
16. Gehan M.A. Mostafa, Mona M. Shazly, Wafaa I. Sherief, January 2009, Waste Management. Pages 430-439, Volume 29, Issue 1.
17. S. Saini, S.S. Nagarajan, R.K. Sarma, (2005-01 - 2005-12) Knowledge, Attitude and Practices of Bio-Medical Waste Management amongst Staff of a Tertiary Level Hospital in India, Vol. 17, No. 2
18. BMC Public Health 2008.
Available at:
http://www.biomedcentral.com/1471 2458/8/36

33