an isee&whistler model of equatorial electron density in...
TRANSCRIPT
JOURNAL OF GEOPHYSICAL RESEARCH, VOL. 97, NO. A2, PAGES 1097-1108, FEBRUARY 1, 1992
An ISEE/Whistler Model of Equatorial Electron Density in the Magneto sphere
D. L. CARPENTER
STAR Laboratory, Stanford University, Stanford, California
R. R. ANDERSON
Department of Physics and Astronomy, University of Iowa, Iowa City
An empirical model of equatorial electron density in the magnetosphere has been developed, covering the range 2.25 < L < 8. Although the model is primarily intended for application to the local time interval ~00-15 MLT and to situations in which global magnetic conditions have been slowly varying or relatively steady in the preceding ~20 hours, a way to extend the model to the 15-24 MLT period is also described. The principal data sources for the model were (1) electron density profiles deduced from sweep frequency receiver (SFR) radio measurements made along near-equatorial ISEE 1 satellite orbits and (2) previously published results from whistlers. The model describes, in piecewise fashion, the "saturated" plasmasphere, the region of steep plasmapause gradients, and the plasma trough. Within the plasmasphere the model profile can be expressed as logne = E.vi, where xl = -0.3145L+ 3.9043 is the principal or "reference" term, and additional terms account for (1) a solar cycle variation with a peak at solar maximum, (2) an annual variation with a December maximum, and (3) a semiannual variation with equinoctial maxima. The location of the inner edge of the plasmapause (outer limit of the plasmasphere) Lppi is specified, with some qualifications, as Lppi = 5.6- 0.46KPmax, where KPmax is the maximum Kp value in the preceding 24 hours. The plasmapause density profile is described as logne =1ogne(Lppi) - (L - Lppi)/App, where App is the scale width of the plasmapause, or distance in L value over which the density drops by an order of magnitude. For modeling purposes, App is suggested to be ~0.1 (~600 km) at night and to increase across the dayside, but values no greater than ~ App=O.025 (~ 150 km), the limiting spatial resolution of the ISEE SFR, have been observed. The inner part of the plasma trough, prior to significant refilling, is described as ne = ne(Lppo) X (L/Lppo) -4'5, where Lppo is the outer limit of the plasmapause segment. The model includes the effects of a factor-of-order ~5 diumal variation in electron density in the plasma trough region, as well as a relatively abrupt transition near dusk from day to night trough levels. It also includes an approach at large L values to a limiting low density of ~ 1 el crn -3. (It is possible that the trough levels in the model are a factor of 5-10 higher than trough levels in some nightside regions during the early phases of substorms.) !SEE data indicate that for those profiles on which one or more plasmapause decreases can be identified, the mean radius of the innermost plasmapause varies only slightly with magnetic local time, exhibiting a slight bulge near 18 MLT (dusk/dawn difference ALppi of order 0.5). This is apparently due to the strong influence of the nightside plasmapause formation process, the effects of which are felt over much of the dayside following delays associated with the Earth's rotation. Structured regions of dense plasma of plasmaspheric origin are known to appear in the afternoon-evening sector at radii larger than those of the "main" plasmasphere. These are believed to be the more extended and/or outlying features of the plasmasphere bulge that have previously been reported; they are not represented by the present model.
1. INTRODUCTION
This is a progress report on the development of an empirical model of equatorial electron density in the magnetosphere. Such a model is needed in studies of propagation and wave-particle in- teracfion phenomena and of the physics of the coupling between the ionosphere and overlying regions. Useful theoretical and em- pirical models of total plasmasphere density have been developed in recent years [e.g., Chiu et al., 1979; Park et al., 1978; Gal- lagher and Craven, 1988], but only limited attempts have been made to model the plasmapause and plasma trough regions [e.g., Moore et al., 1987]. In the present work we consider the L range 2 < L < 8, thus covering the plasmasphere at L >~2 (typical plasmapause locations) and major portions of the region beyond.
The work draws upon two large, complementary data sets: the ISEE 1 electron density data acquired over a multiyear period along orbits near the magnetic equator, and whistler data acquired during various intervals since 1957. Comparisons between ISEE 1 in situ electron density measurements and the whistler probing
Copyright 1992 by the American Geophysical Union.
Paper number 91JA01548. 0148-0227/92/91JA-01548 $05.00
technique have shown good agreement in case studies involving rendezvous situations [Carpenter et al., 198!].
In the case of ISEE 1, the data consist of values of electron
density scaled at ,-,32-s intervals from information on either the local upper hybrid resonance (UHR) or the local plasma frequency, in the manner described by Mosier et al. [1973] and Gurnett et al. [1979].
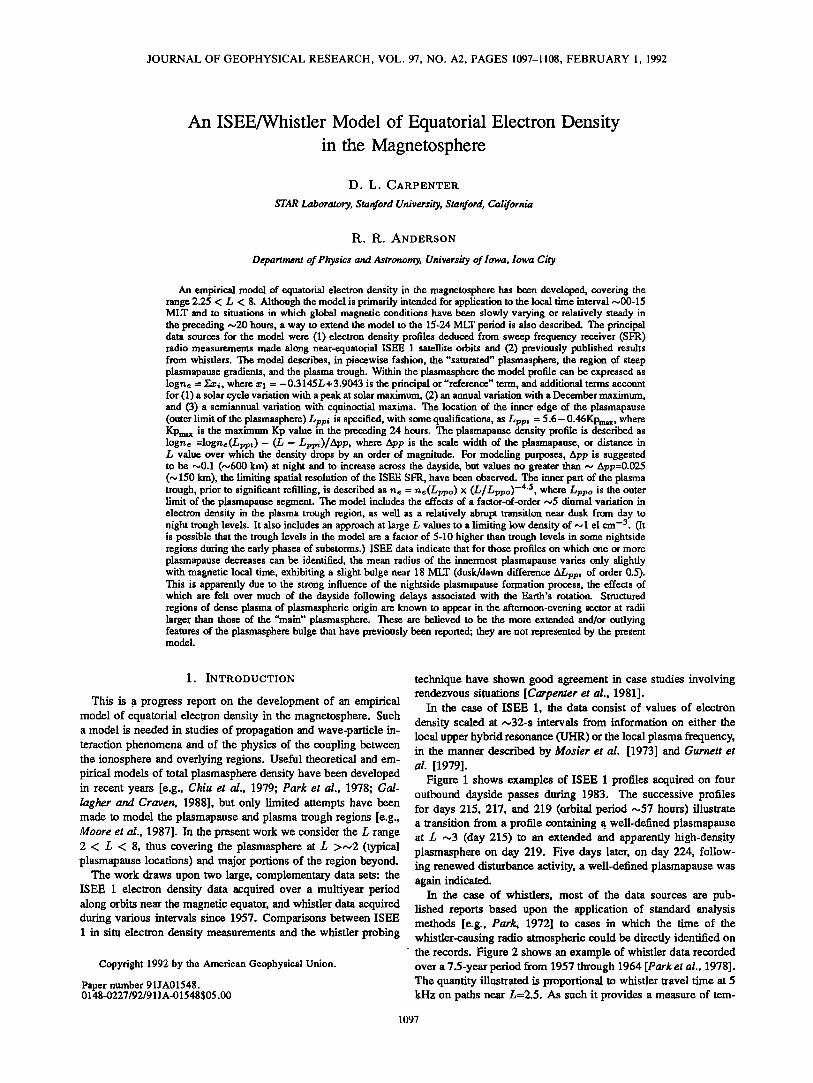
Figure 1 shows examples of ISEE 1 profiles acquired on four outbound dayside passes during 1983. The successive profiles for days 215, 217, and 219 (orbital period -,,57 hours) illustrate a transition from a profile containing a. well-defined plasmapause at L ,-,3 (day 215) to an extended and apparently high-density plasmasphere on day 219. Five days later, on day 224, follow- ing renewed disturbance activity, a well-defined plasmapause was again indicated.
In the case of whistlers, most of the data sources are pub- lished reports based upon the application of standard analysis methods [e.g., Park, 1972] to cases in which the time of the whistler-causing radio atmospheric could be directly identified on the records. Figure 2 shows an example of whistler data recorded over a 7.5-year period from 1957 through 1964 [Park et al., 1978]. The quantity illustrated is proportional to whistler travel time at 5 kHz on paths near L=2.5. As such it provides a measure of tem-
1097
1098 CARPENTER AND ANDERSON: EQUATORIAL ELECTRON DENSITY MODEL
10 4
10 3
10 2
10 o
10-1
ISEE 1 1983
:: i :: i ::224
1 2 3 4 5 6 7 8 9 10 11 L
Fig. 1. Four ISEE electron density profiles illustrating a recovery sequence beginning with a well-defined plasmapause near L=3 and ending with an extended, dense plasmasphere (days 215, 217, 219). Following renewed disturbance, a well-defined plasmapause was again established near L=3 (day 224). These were outbound passes in the period August 3-12, 1983, in a typical case spanning several hours from postdawn to postnoon.
150'
E •oo'
50'
Od D'j: DJ DJ DJ DJ DJ DJ D 1957 1958 1959 1960 1961 1962 196:5 1964
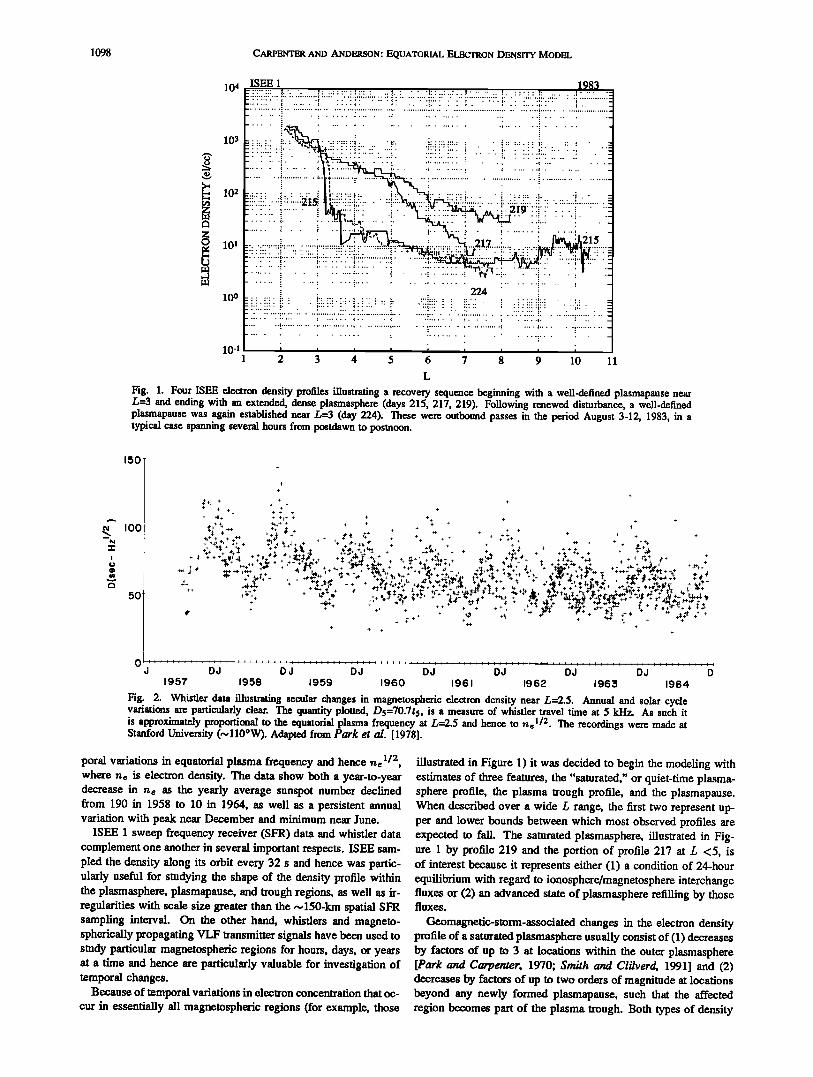
Fig. 2. Whistler data illustrating secular changes in magnetospheric electron density near/_,=2.5. Annual and solar cycle variations are particularly clear. The quantity plotted, Ds=70.7ts, is a measure of whistler travel time at 5 kHz. As such it is approximately proportional to the equatorial plasma frequency at L=2.5 and hence to n½ 1/2. The recordings were made at Stanford University (,,,110øW). Adapted from Park et al. [1978].
1/2 poral variations in equatorial plasma frequency and hence ne , where ne is electron density. The data show both a year-to-year decrease in n e as the yearly average sunspot number declined from 190 in 1958 to 10 in 1964, as well as a persistent annual variation with peak near December and minimum near June.
ISEE 1 sweep frequency receiver (SFR) data and whistler data complement one another in several important respects. ISEE sam- pled the density along its orbit every 32 s and hence was partic- ularly useful for studying the shape of the density profile within the plasmasphere, plasmapause, and trough regions, as well as ir- regularities with scale size greater than the -,, 150-km spatial SFR sampling interval. On the other hand, whistlers and magneto- spherically propagating VLF transmitter signals have been used to study particular magnetospheric regions for hours, days, or years at a time and hence are particularly valuable for investigation of temporal changes.
Because of temporal variations in electron concentration that oc- cur in essentially all magnetospheric regions (for example, those
illustrated in Figure 1) it was decided to begin the modeling with estimates of three features, the "saturated," or quiet-time plasma- sphere profile, the plasma trough profile, and the plasmapause. When described over a wide œ range, the first two represent up- per and lower bounds between which most observed profiles are expected to fall. The saturated plasmasphere, illustrated in Fig- ure I by profile 219 and the portion of profile 217 at œ <5, is of interest because it represents either (1) a condition of 24-hour equilibrium with regard to ionosphere/magnetosphere interchange fluxes or (2) an advanced state of plasmasphere refilling by those fluxes.
Geomagnetic-storm-associated changes in the electron density profile of a saturated plasmasphere usually consist of (1) decreases by factors of up to 3 at locations within the outer plasmasphere [Park and Carpenter, 1970; Smith and Clilverd, 1991] and (2) decreases by factors of up to two orders of magnitude at locations beyond any newly formed plasmapause, such that the affected region becomes part of the plasma trough. Both types of density
CARPENTER AND ANDERSON: EQUATORIAL ELECTRON DENSITY MODEL 1099
decrease tend to occur beyond some L shell, the value of which (R.A.) for purposes of documenting plasma distributions at mag- depends upon the intensity of the disturbance activity. Thus in the netic latitudes less than ,,045 ø. For purposes of studying density outer plasmasphere, the saturated profile tends to lie above any levels, a subset of the profiles or profile segments was selected empirical plasmasphere profile that is obtained from averaging for which the magnetic latitudes were less than ,,030 ø. Most of data acquired under a wide range of magnetospheric conditions. In these cases were from 1977, 1982, and 1983. For purposes of es- spite of this difference, the levels corresponding to the saturation timating plasmapause locations, all of the available profiles were condition are expected to be well defined in any large data set used. As a practical matter, only those segments of a profile such as that from ISEE 1. At low L shells, a quasi-equilibrium along which the number density dropped by a factor of 5 or more with the ionosphere, and hence saturation, is achieved relatively within AL <0.5 were considered as candidates for identification quickly after a disturbance, while at higher L, saturation levels as a plasmapause. tend to be well defined in a data set that is extensive enough to The ISEE electron density data were not adjusted downward to cover the later stages of quiet periods. At such times the daily account for expected differences between actual off-equatorial ob- increments in flux tube electron content tend to be constant or serving positions and the equator. Within the plasmasphere, most declining [Park, 1974] and thus give rise to progressively smaller such adjustments would be less than ,,020%, and in the plasma fractional changes in the total content. trough less than ,,030%. The estimated effect of full corrections
The plasma trough as we define it represents the low-density on the plasmasphere portion of our model would be a downward outer region as it is first observed at various local times following revision of the profile by less than 10% without an appreciable disturbance, and hence prior to significant recovery. It therefore change in the profile slope. In the trough region, any changes represents conditions near the beginning of a disturbed period, in would be small compared to the variations from orbit to orbit and contrast to the saturated plasmasphere, which (particularly at high to the observed diurnal variation. L values) tends to represent conditions near the end. The trough is exemplified in Figure 1 by the portions of profiles 215 and 224 The Saturated Plasmasphere: General Properties between L ~3.3 and 7.5.
The density gradients at the plasmapause (dlogne/dL at the equator) were expected to be steepest and hence most readily iden- titled in the hours following a sustained increase in disturbance activity. This expectation, while consistent with certain theoreti- cal ideas about the plasmapause [e.g., Richmond, 1973; Lemaire, 1975, 1985], was primarily based upon experience with whistler data [Carpenter, 1966; Carpenter and Park, 1973] and with satel- lite records [e.g., Carpenter et al., 1968; Chappell et al., 1970a; Corcuff et al., 1972; Gringauz and Bezrukikh, 1976; Horwitz, 1983].
The plasmapause radius as a function of MLT was not expected to be easy to model. Early in a disturbed period, the instantaneous configuration of the plasmasphere should be difficult to predict, being heavily dependent upon the initial plasmasphere shape and upon the spatial and temporal distributions of convection activity. At later stages, predictions should be easier, to the extent that the plasmasphere configuration is predominantly an integral measure of the preceding convection activity and not the result of insta- bilities acting in concert with convection, as Lemaire [1975] has suggested. During such later periods the influence of the start- ing topology should become less important, and the effects of the spatial and temporal structure in the convection fields should be reduced due to integration along the trajectories of plasma ele- ments.
An initial survey of individually plotted ISEE 1 profiles re- vealed much large-scale structure beyond the innermost identi- fiable plasmapause in the ,,o15-24 MLT sector. This was not surprising, in view of earlier work on the duskside bulge phe- nomenon [Carpenter, 1966, 1970; Higel and Wu, 1984] and on outlying dense plasma structures in the afternoon-evening sector [Chappell et al., 1971; Chappell, 1974; Taylor et al., 1970]. Thus it was decided to develop an initial model that would be primarily applicable to the period ~00-15 MLT and to discuss extension of the model to the 15-24 MLT range in a special section.
2. DEVELOPMENT OF AN EQUATORIAL ELECTRON DENSITY MODEL
Candidate profiles for the saturated plasmasphere were selected as those with data coverage at L _<3 and with electron densities at L=3 that were not more than a factor of ,,ol.5 below 1000 el crn -3, a level found from previous whistler research [e.g., Park et al., 1978] to characterize the relatively quiet plasmasphere. A portion of each profile was then accepted extending from the low-œ limit of the profile to the first point beyond which the profile became irregular or exhibited a steepened negative slope. Although vari- ously subjective, these criteria served to eliminate from considera- tion many entire profiles and segments of profiles that represented intermediate states of recovery from initial plasma trough levels. Many other profile segments not selected represented the outer plasmasphere, either in a state of irregularity or in a condition of widespread storm time depletion by a factor of up to 2 or 3 from the saturation level.
A total of 25 profile segments were thus found for dayside hours ,,o09-15 MLT, 5 for nightside hours 00-05 MLT, and 10 for the dawn sector, 05-09 MLT. Of the 25 dayside profiles, 10 rep- resented cases in which the plasmapause L value, denoted Lppi, was less than 4; four represented the range 4< Lppi <5; and 11 represented Lppi >5 (if Lppi was identifiable at all within the L range of the data).
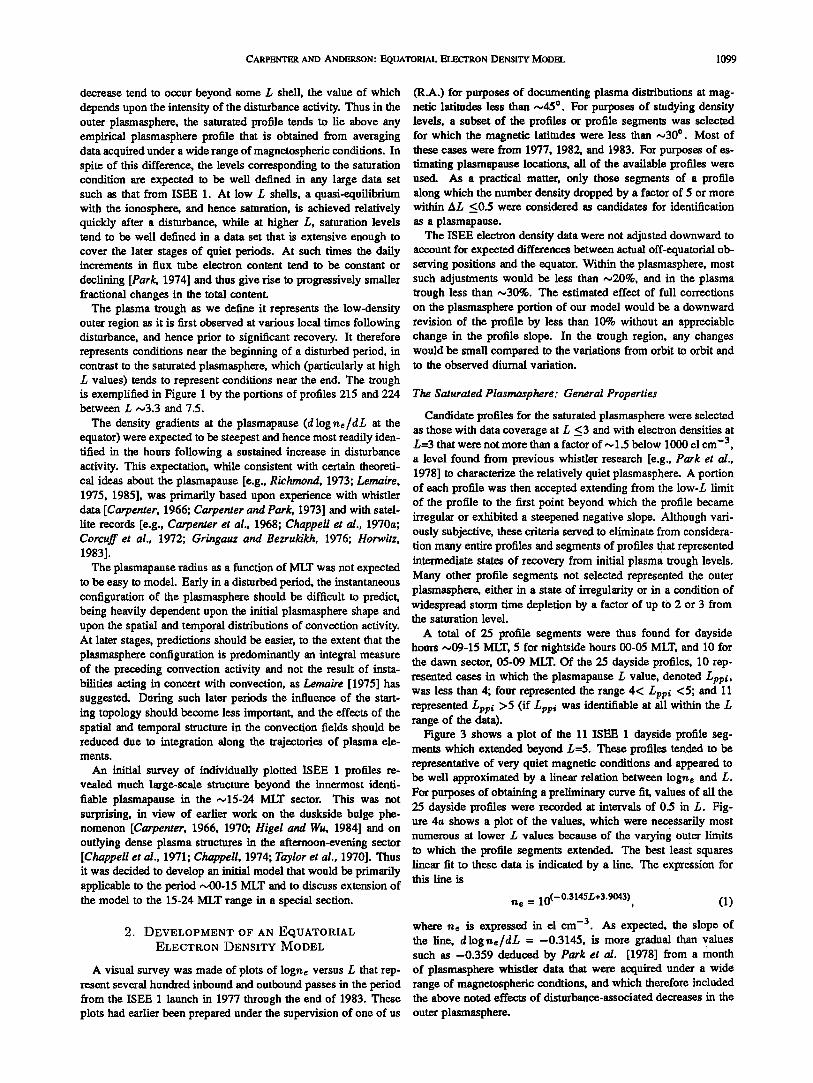
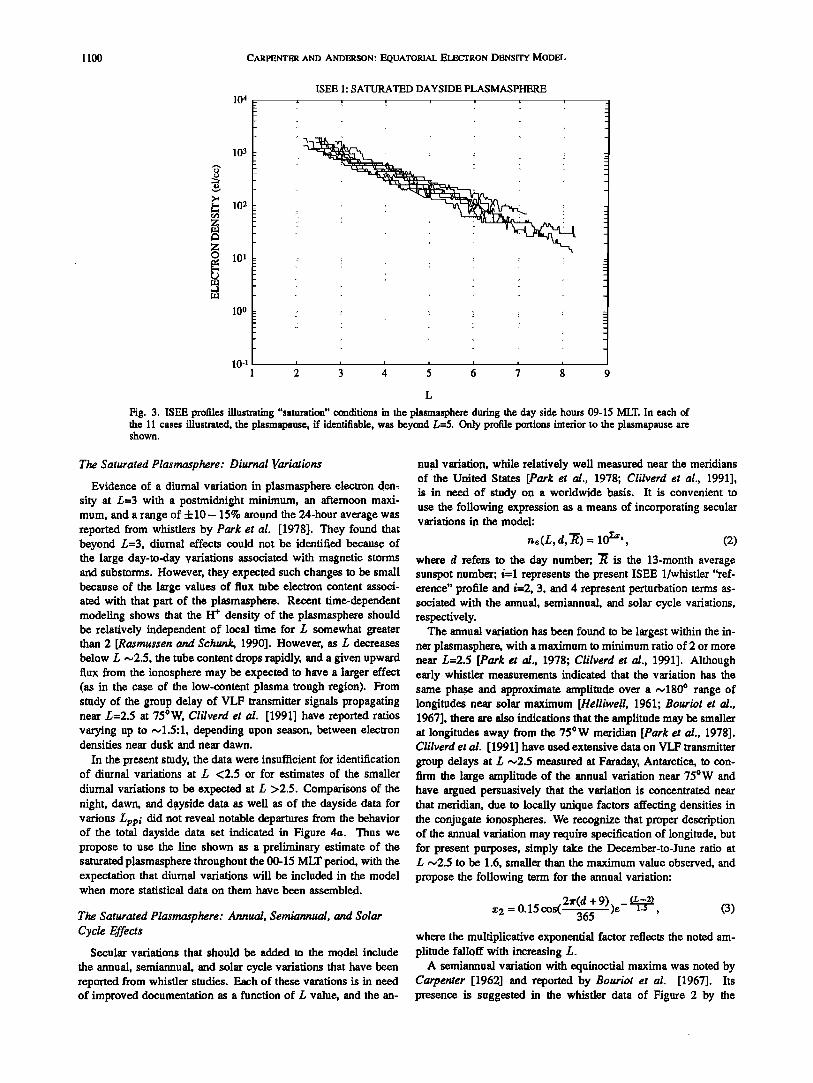
Figure 3 shows a plot of the 11 ISEE 1 dayside profile seg- ments which extended beyond L=5. These profiles tended to be representative of very quiet magnetic conditions and appeared to be well approximated by a linear relation between logne and L. For purposes of obtaining a preliminary curve fit, values of all the 25 dayside profiles were recorded at intervals of 0.5 in L. Fig- ure 4a shows a plot of the values, which were ne•ssarily most numerous at lower L values because of the varying outer limits to which the profile segments extended. The best least squares linear fit to these data is indicated by a line. The expression for this line is
ne = 10 (-0'3145L+3'9043) (1)
where ne is expressed in el cm -3. As expected, the slope of the line, dlogne/dL = -0.3145, is more gradual than values such as -0.359 deduced by Park et al. [1978] from a month
A visual survey was made of plots of logne versus L that r•p- of plasmasphere whistler data that were acquired under a wide resent several hundred inbound and outbound passes in the period range of magnetospheric condtions, and which therefore included from the ISEE 1 launch in 1977 through the end of 1983. These the above noted effects of disturbance-associated decreases in the plots had earlier been prepared under the supervision of one of us outer plasmasphere.
1100 CARPENTER AND ANDERSON: EQUATORIAL ELECTRON DENSITY MODEL
z o
10 4
10 3
10 2
10 o
10 4
ISEE 1' SATURATED DAYSIDE PLASMASPHERE
-... -:-. ::i. ..::.. :-- -: '-. .' .-.... ' ...::.:::..:..::_- ...... :.::i::: ::: ... :::; ....... ::::•::-- " " ! ! :: ..: .................... :. ...................
: _
_
_ _
= " ':::!:: '::: ::•- ""' ::::: -::: :!:' '•:: !!i!: :: ..... •:::: ß - - ß ::i:: . '"' :::'.: :::::" ::i:: " :•::::::" :'•:: :::":" "::::!!i: '::: ......
..
_
I i i i i i i
2 3 4 5 6 7 8 9
Fig. 3. ISEE profiles illustrating "saturation" conditions in the plasmasphere during the day side hours 09-15 MLT. In each of the 11 cases illustrated, the plasmapause, if identifiable, was beyond L=5. Only profile portions interior to the plasmapause are shown.
The Saturated Plasmasphere' Diurnal Variations
Evidence of a diurnal variation in plasmasphere electron den, sity at /;=3 with a postmidnight minimum, an afternoon maxi- mum, and a range of 4-10- 15% around the 24-hour average was reported from whistlers by Park eta!. [1978]. They found that beyond /5=3, diurnal effects could not be identified because of the large day-to-day variations associated with magnetic storms and substorms. However, they expected such changes to be small because of the large values of flux tube electron content associ- ated with that part of the plasmasphere. Recent time-dependent modeling shows that the H + density of the plasmasphere should be relatively independent of local time for /; somewhat greater than 2 [Rasmussen and Schunk, 1990]. However, as/5 decreases below/5 ,-,2.5, the tube content drops rapidly, and a given upward flux from the ionosphere may be expected to have a larger effect (as in the case of the low-content plasma trough region). From study of the group delay of VLF transmitter signals propagating near/5=2.5 at 75øW, Clilverd et al. [1991] have reported ratios varying up to ,.ol.5:1, depending upon season, between electron densities near dusk and near dawn.
In the present study, the data were insufficient for identification of diurnal variations at L <2.5 or for estimates of the smaller
diumal variations to be expected at/5 >2.5. Comparisons of the night, dawn, and dayside data as well as of the dayside data for various Lppi did not reveal notable departures from the behavior of the total dayside data set indicated in Figure 4a. Thus we propose to use the line shown as a preliminary estimate of the saturated plasmasphere throughout the 00-15 MLT period, with the expectation that diurnal variations will be included in the model when more statistical data on them have been assembled.
The Saturated Plasmasphere' Annual, Semiannual, and Solar Cycle Effects
Secular variations that should be added to the model include
the annual, semiannual, and solar cycle variations that have been reported from whistler studies. Each of these varations is in need of improved documentation as a function of/5 value, and the an-
nual variation, while relatively well measured near the meridians of the United States [Park et al., 1978; Clilverd et al., 1991], is in need of study on a worldwide basis. It is convenient to use the following expression as a means of incorporating secular variations in the model:
he(L, d, •) = l0 t'a/, (2) where d refers to the day number; R is the 13-month average sunspot number; i=1 represents the present ISEE 1/whistler "ref- erence" profile and i=2, 3, and 4 represent perturbation terms as- sociated with the annual, semiannual, and solar cycle variations, respectively.
The annual variation has been found to be largest within the in- ner plasmasphere, with a maximum to minimum ratio of 2 or more near L=2.5 [Park et al., 1978; Clilverd et al., 1991]. Although early whistler measurements indicated that the variation has the same ph•e and approximate amplitude over a -,,180 o range of longitudes near solar maximum [Helliwe!l, 1961; Bouriot et al., 1967], there are also indications that the amplitude may be smaller at longitudes away from the 75øW meridian [Park et al., 1978]. Clilverd et at. [1991] have used extensive data on VLF transmitter group delays at L ,.02.5 measured at Faraday, Antarctica, to con- firm the large amplitude of the annual variation near 75øW and have argued persuasively that the variation is concentrated near that meridian, due to locally unique factors affecting densities in the conjugate ionospheres. We recognize that proper description of the annual variation may require specification of longitude, but for present purposes, simply take the December-to-June ratio at L ,.02.5 to be 1.6, smaller than the maximum value observed, and propose the following term for the annual variation:
cos(2•.(d + 9))e_ •.•'.5- (3) z 2 =0.15 365 ' where the multiplicative exponential factor reflects the noted am- plitude falloff with increasing/5.
A semiannual variation with equinoctial maxima was noted by Carpenter [1962] and reported by Bouriot et al. [1967]. Its presence is suggested in the whistler data of Figure 2 by the
CARPENTER AND ANDERSON: EQUATORIAL ELECTRON DENSITY MODEL 1101
10 4
10 3
10 2
100
10-1
ISEE 1' SATURATED DAYSIDE PLASMASPHERE
•7!. ........... "•=8.':022.4"1•i'-0:•i';45•3'•0 R^2-'".96'3 ' ' -
...... i ...... • ........ :; .... ; ....... i: ........ .+ ..... : .......... : ._
:':::.: :' '::i:. ":' ::i'::: :.::... :.i:: .::. :':::".'::i: :.:::::':::: ,:..' '::+: .... '•;"':: :.:+: .... i. -
........... : ..... ;. ......... : ........ : .............. ... ......... : ............ :. .. _
........ i .... ; ....... : ........ ; .............. ; ..................... ; - ................... i.. .: .............. : ........ '. ...... ? _
..................... .. ..... .. ............. • .............
_-:::::::::::: .:;:!::::: .. :;;::;:: ::::::::::::::::::::::::::::::::::::::::::::::::::::::::::::::::::::::::::::::::::::::::::::::::::: --::":;: ß ::i:: ....... ::..'.:; :::':';'; ...... ;:•;; ": ..... ;::";::•;;;;:;;;;::;:;';;":.'..;::: .... : ......... ;;:..':.::;.;:: ":'" :;•. - -:::i.:.:.: ....... z;!;: ......... :..11...;2;:.:;:.:::;::..:;;.;!:;..;;..;..;;;:..;::!:;;::.:;:;:::; ..... ;:;:..;;..;...;; .... :::::::::::::::::::::::::: ............. ::..-
......................................... : .................... i .................... • ..................... : ..................... . .......................................
......................... ! ...... : ................ ... ..................... : : :
1 2 4 5 7 8 9
ISEE/WHISTLER PLASMASPHERE MODEL
.................. : ................... • ................... • .................... • .................. • ................... : ............. • ............
: ............ : .......... • ............................................... • ...........
ß
102 ============================================================================================================= ============================================================
.................... : ..................... • .................... ! .................... i .................... 4 ..................... : ..................... • ...................
................. : ................................. • ................. • ................... • ................ : ............. ? .....
................ ; ................................... ; ............... ; ................. ; .................. ; .......... ; ....
................ : ...................................... ; ................. : .................... i ......... • ............. i ..... : :
:
.................... : .................... • .................... ! .................... • .................... • ..................... : ..................... • ..................
.................... : ..................... : .................... : .................... : .................... • ..................... • ................. • ...................
.................... : ..................... • .................... : .................... : .................... • ..................... • .................... • ...................
................... i ................... ? .................... ! .................... ! .................... • ..................... : ............... ! ...............
................... : ..................... • .................... i .................... • ..................... : ..................... . ..................... , ...................
.................. : ................ • ........................................ i ................... • ................................................... :
10 4 • , , , • • , 1 2 3 4 5 6 7 8 9
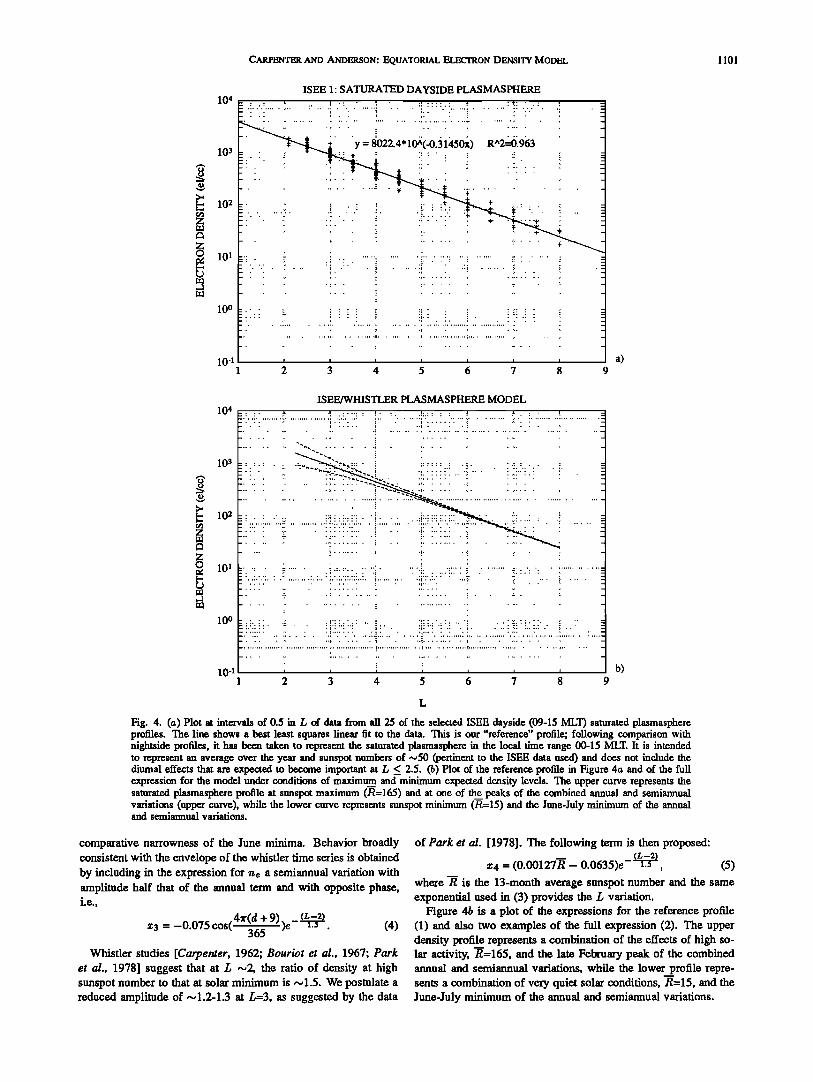
Fig. 4. (a) Plot at intervals of 0.5 in L of data from all 25 of the selected ISEE dayside (09-15 MLT) saturated plasmasphere profiles. The line shows a best least squares linear fit to the data. This is our "reference" profile; following comparison with nightside profiles, it has been taken to represent the saturated plasmasphere in the local time range 00-15 MLT. It is intended to represent an average over the year and sunspot numbers of ~50 (pertinent to the ISEE data used) and does not include the diumal effects that are expected to become important at L % 2.5. (b) Plot of the reference profile in Figure 4a and of the full expression for the model under conditions of maximum and minimum expected density levels. The upper curve represents the saturated plasmasphere profile at sunspot maximum (R=165) and at one of the peaks of the combined annual and semiannual variations (upper curve), while the lower curve represents sunspot minimum (R=15) and the June-July minimum of the annual and semiannual variations.
comparative narrowness of the June minima. Behavior broadly consistent with the envelope of the whistler time series is obtained by including in the expression for ne a semiannual variation with amplitude half that of the annual term and with opposite phase, i.e.,
(L--2) 4•r(d + 9) )e- -r:'s-' (4) :e3 = --0.075 cos( •-6• '
Whistler studies [Carpenter, 1962; Bouriot et al., 1967; Park et al., 1978] suggest that at œ ,,,,2, the ratio of density at high sunspot number to that at solar minimum is ,,, 1.5. We postulate a reduced amplitude of ,,,1.2-1.3 at œ=3, as suggested by the data
of Park et al. [1978]. The following term is then proposed:
a:4 = (0.00127• - 0.0635)e-½•.-2 (5) where R is the 13-month average sunspot number and the same exponential used in (3) provides the L variation.
Figure 4b is a plot of the expressions for the reference profile (1) and also two examples of the full expression (2). The upper density profile represents a combination of the effects of high so- lar activity, R=165, and the late February peak of the combined annual and semiannual variations, while the lower profile repre- sents a combination of very quiet solar conditions, R=15, and the June-July minimum of the annual and semiannual variations.
1102 CARPENTER AND ANDERSON: EQUATORIAL ELECTRON DENSITY MODEL
The Plasma Trough: General Features
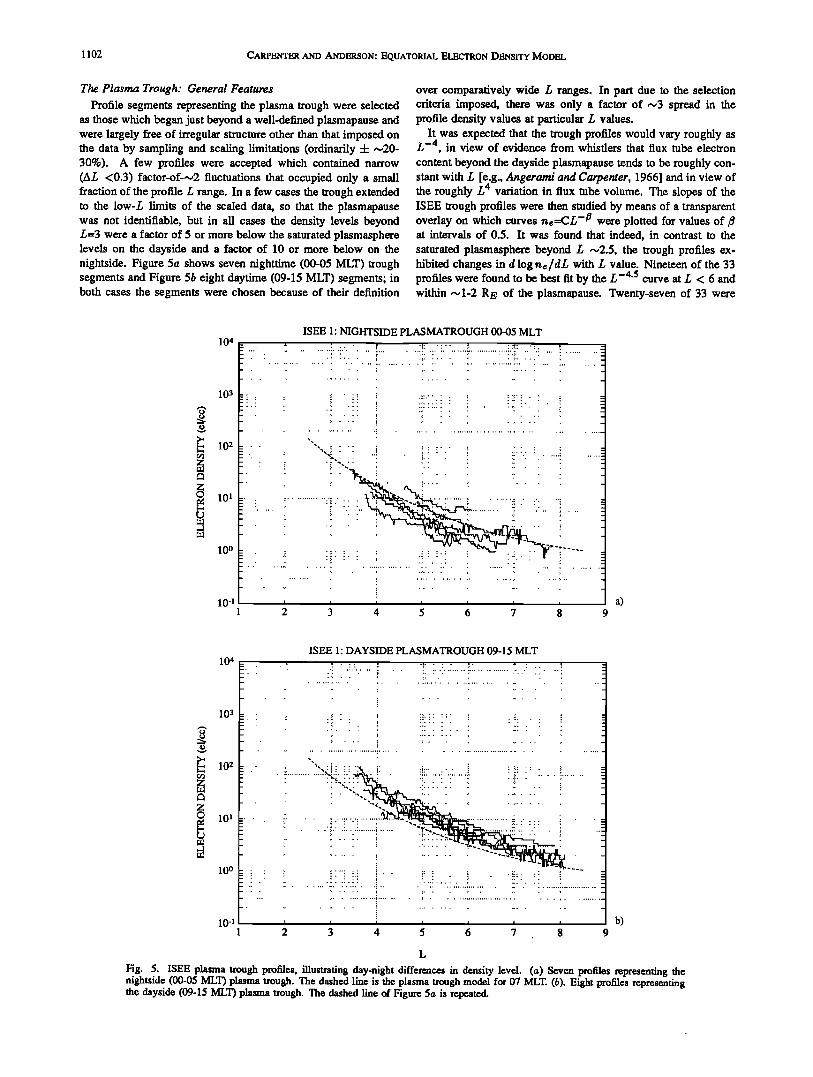
Profile segments representing the plasma trough were selected as those which began just beyond a well-defined plasmapause and were largely free of irregular structure other than that imposed on the data by sampling and scaling limitations (ordinarily 4- ~20- 30%). A few profiles were accepted which contained narrow (Aœ <0.3) factor-of-~2 fluctuations that occupied only a small fraction of the profile œ range. In a few cases the trough extended to the low-œ limits of the scaled data, so that the plasmapause was not identifiable, but in all cases the density levels beyond L=3 were a factor of 5 or more below the saturated plasmasphere levels on the dayside and a factor of 10 or more below on the nightside. Figure 5a shows seven nighttime (00-05 MLT) trough segments and Figure 5b eight daytime (09-15 MLT) segments; in both cases the segments were chosen because of their definition
over comparatively wide œ ranges. In part due to the selection criteria imposed, there was only a factor of ~3 spread in the profile density values at particular œ values.
It was expected that the trough profiles would vary roughly as œ-4 in view of evidence from whistlers that flux robe electron content beyond the dayside plasmapause tends to be roughly con- stant with œ [e.g., Angerami and Carpenter, 1966] and in view of the roughly œ4 variation in flux robe volume. The slopes of the ISEE trough profiles were then studied by means of a transparent overlay on which curves ne=CL -• were plotted for values of/• at intervals of 0.5. It was found that indeed, in contrast to the
saturated plasmasphere beyond œ ~2.5, the trough profiles ex- hibited changes in d log ne/dœ with œ value. Nineteen of the 33 profiles were found to be best fit by the œ-4.5 curve at œ < 6 and within ~1-2 RE of the plasmal•ause. Twenty-seven of 33 were
ISEE 1' NIGHTSIDE PLASMATROUGH 00-05 MLT 104
:
._
,, :
10 2 ........ i:: ':'."?•!!:i!! !'!!! !:!3:!'!!i'..! .... i ....... ß .... :" ß ' !!!!!i!!!!!! !'!.' .... !!i ........ ....... ....... :: ...... ........ :: ....... ............. ....... :!!: .............. :"---
10ø --• •.• '•i•:::::: ::::::::•i•:•:: ::::::::•:•:• ::•::::
10-1 • , 'i ......... i '"i ....... a) 1 • 3 4 5 6 7 8 9
10 4
103
10 2
101
10 o
10-1
ISEE 1: DAYSIDE PLASMATROUGH 09-15 MLT
b)
L
Fig. 5. ISEE plasma trough profiles, illustrating day-night differences in density level. (a) Seven profiles representing the nightside (00-05 MLT) plasma trough. The dashed line is the plasma trough model for 07 MLT. (b). Eight profiles representing the dayside (09-15 MLT) plasma trough. The dashed line of Figure 5a is repeated.
CARPENTER AND ANDERSON: EQUATORIAL ELECTRON DENSITY MODEL 1103
best fit for 4<_/• _<5 (the distribution was skewed toward values of 1• < 4.5). The profiles tended to decay less steeply beyond L=6, and in the cases of those defined beyond L=6 (mostly for the dayside), approached a constant value near 1 el cm -3 beyond L=8. Thus it was decided to approximate the trough profile with a variation as L -4'5 plus a term that would provide for an approach to a constant value beyond L=8.
The Plasma Trough: Diurnal Variation
Apparently because of upward flow from the ionosphere into depleted flux tubes, the trough region, like the plasmasphere near L=2, exhibits readily detectable day/night differences in density [e.g., Angerami and Carpenter, 1966; Park, 1970; Chappell et al., 1970b; Higel and Wu, 1984]. These differences are evident in a comparison of Figures 5a (00-05 MLT) and 5b (09-15 MLT). They contain a common reference curve, which varies as L -4'5 and is intended to represent conditions near 07 MLT.
The diurnal variation for 00-15 MLT was estimated by first assigning the 11 nightside profiles to the time 02 MLT (based on an average of their local time coverages), the seven dawnside segments to 07 MLT, and the 15 dayside segments to 12 MLT. Two linear variations in the scale level of the trough profiles with time were assumed, a slower one across the nightside to 06 MLT and a faster one for the period from 06 MLT onward. The parameters of the linear variation were then determined from averages at/,=4, 4.5, 5, and 5.5 of the night, dawn, and day segments.
The corresponding plasma trough model expressions are as fol- lows:
ne = (5800 + 300t)/, -4'5 + (1 -- e- ('•), 00 _< t < 06 MLT (6)
(L --2)
ne =(-800+ 1400t)L -4'5 +(1- e---r0--), 06 _< t _< 15 MLT where the small second term is intended to approximate the de- crease in decay rate and approach to a constant value beyond L = 6. Evaluated at L=6.6, these expressions are in good agree- ment with the data reported from the relaxation sounder on GEOS 2 by Higel and Wu [1984]. Their relation to the ISEE data was checked by multiplying all the data for a given profile segment by (L/5)-4'•(so as to refer the data to L=5, on the assumption of
45 L- ' behavior). Assuming that the distribution of profile scale levels at any particular local time would be skewed in the re- covery (higher density) direction, we calculated the medians and estimated the standard errors of the medians [Sachs, 1984] for the 29 night, 24 dawn, and 43 dayside density values. These were,
plasma trough segments, as in the cases of days 215 and 224 in Figure 1. Among the 1977-1983 ISEE profile plots, 208 were found in which a plasmapause could be identified according to the criterion that a drop by a factor of 5 or more occurs within AL=0.5. The L value of the plasmapause, Lppi, was in each case determined as the L value of the last measured point prior to a steep plasmapause falloff. In most cases, this point could be chosen to within 6L <0.05 with the aid of a profile plot. When multiple plasmapause effects could be identified, as in the dusk sector, only the innermost one was scaled.
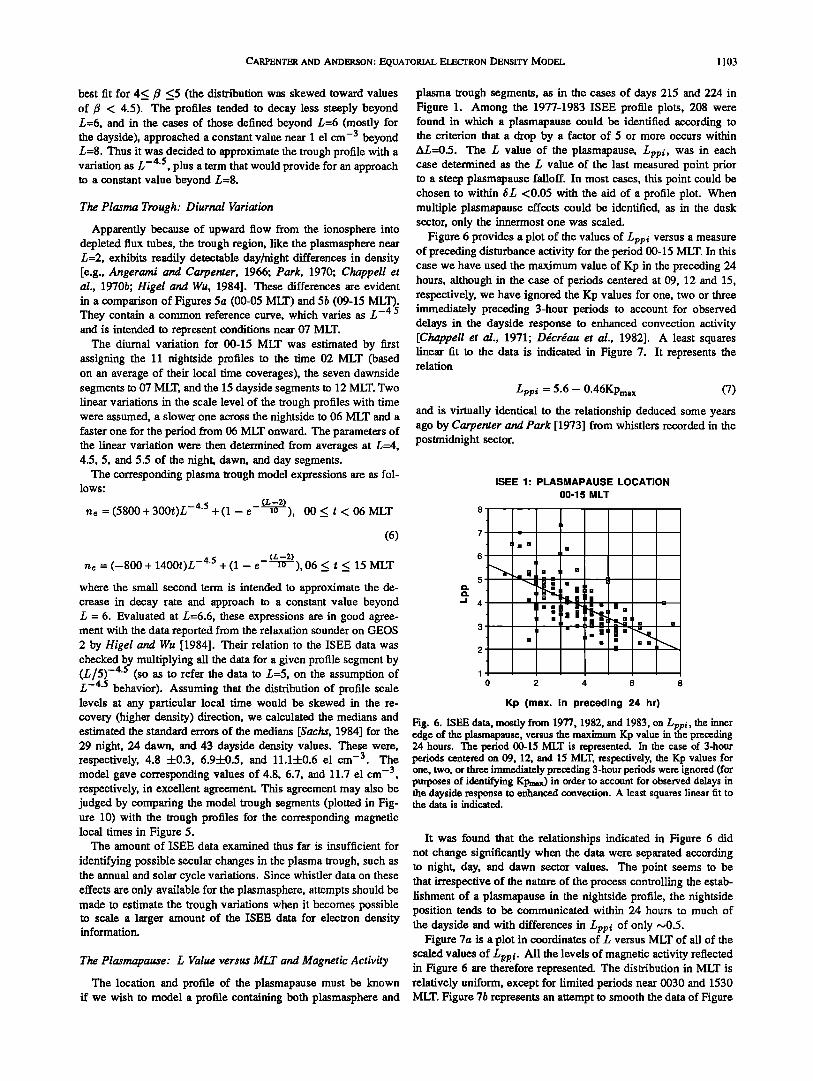
Figure 6 provides a plot of the values of Lppi versus a measure of preceding disturbance activity for the period 00-15 MLT. In this case we have used the maximum value of Kp in the preceding 24 hours, although in the case of periods centered at 09, 12 and 15, respectively, we have ignored the Kp values for one, two or three immediately preceding 3-hour periods to account for observed delays in the dayside response to enhanced convection activity [Chappell et al., 1971; Ddcrdau et al., 1982]. A least squares linear fit to the data is indicated in Figure 7. It represents the relation
Lppi = 5.6 - 0.46KPmax (7)
and is virtually identical to the relationship deduced some years ago by Carpenter and Park [ 1973] from whistlers recorded in the postmidnight sector.
5
ISEE 1' PLASMAPAUSE LOCATION
00-15 MLT
0 2 4 6 8
Kp (max. in preceding 24 hr)
Fig. 6. ISEE data, mostly from 1977, 1982, and 1983, on Lppi, the inner edge of the plasmapause, versus the maximum Kp value in the preceding 24 hours. The period 00-15 MLT is represented. In the case of 3-hour
respectively, 4.8 4-0.3, 6.94-0.5, and 11.14-0.6 el cm -3. The periods centered on 09, 12, and 15 MLT, respectively, the Kp values for model gave corresponding values of 4.8, 6.7, and 11.7 el cm -3, one, two, or three immediately preceding 3-hour periods were ignored (for respectively, in excellent agreement. This agreement may also be judged by comparing the model trough segments (plotted in Fig- ure 10) with the trough profiles for the corresponding magnetic local times in Figure 5.
The amount of ISEE data examined thus far is insufficient for
identifying possible secular changes in the plasma trough, such as the annual and solar cycle variations. Since whistler data on these effects are only available for the plasmasphere, attempts should be made to estimate the trough variations when it becomes possible to scale a larger amount of the ISEE data for electron density information.
The Plasmapause: L Value versus MLT and Magnetic Activity
The location and profile of the plasmapause must be known if we wish to model a profile containing both plasmasphere and
purposes of identifying Kpmax) in order to account for observed delays in the dayside response to enhanced convection. A least squares linear fit to the data is indicated.
It was found that the relationships indicated in Figure 6 did not change significantly when the data were separated according to night, day, and dawn sector values. The point seems to be that irrespective of the nature of the process controlling the estab- lishment of a plasmapause in the nightside profile, the nightside position tends to be communicated within 24 hours to much of
the dayside and with differences in Lppi of only ,..,0.5. Figure 7a is a plot in coordinates of L versus MLT of all of the
scaled values of Lpei. All the levels of magnetic activity reflected in Figure 6 are therefore represented. The distribution in MLT is relatively uniform, except for limited periods near 0030 and 1530 MLT. Figure 7b represents an attempt to smooth the data of Figure
1104 CARPENTER AND ANDERSON: EQUATORIAL ELECTRON DENSITY MODEL
Lpp vs. MLT 12:00
18:00 06:00
)
00:00
AVERAGED Lpp vs. MLT 12:00
18:00,-- --2--0•2 06'00
)
00:00
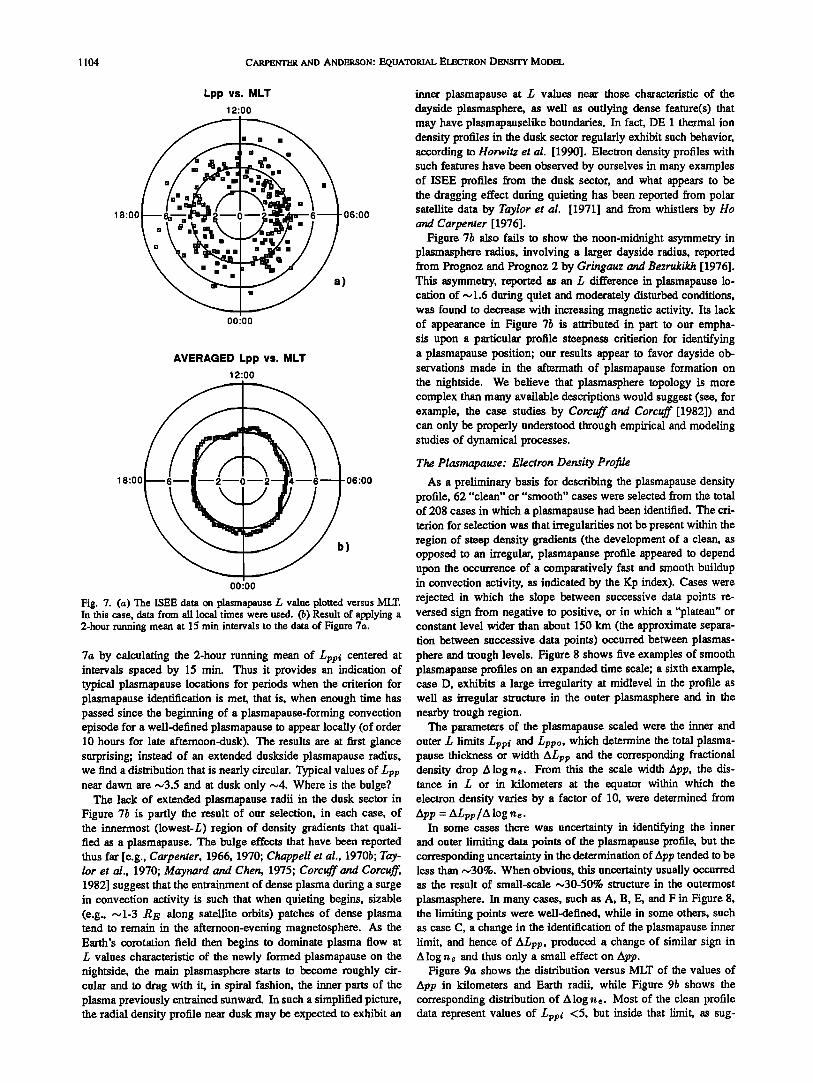
Fig. 7. (a) The ISEE data on plasmapause L value plotted versus MLT. h• this case, data from all local times were used. (b) Result of applying a 2-hour running mean at 15 min intervals to the data of Figure 7a.
7a by calculating the 2-hour running mean of Lppi centered at intervals spaced by 15 min. Thus it provides an indication of typical plasmapause locations for periods when the criterion for plasmapause identification is met, that is, when enough time has passed since the beginning of a plasmapause-forming convection episode for a well-defined plasmapause to appear locally (of order 10 hours for late aftemoon-dusk). The results are at first glance surprising; instead of an extended duskside plasmapause radius, we find a distribution that is nearly circular. Typical values of Lpp near dawn are ,,03.5 and at dusk only ,,04. Where is the bulge?
The lack of extended plasmapause radii in the dusk sector in Figure 7b is partly the result of our selection, in each case, of the innermost (lowest-L) region of density gradients that quali- fied as a plasmapause. The bulge effects that have been reported thus far [e.g., Carpenter, 1966, 1970; Chappell et al., 1970b; Tay- lor et al., 1970; Maynard and Chen, 1975; Corcuff and Corcuff, 1982] suggest that the entrainment of dense plasma during a surge in convection activity is such that when quieting begins, sizable (e.g., ,,ol-3 RE along satellite orbits) patches of dense plasma tend to remain in the afternoon-evening magnetosphere. As the Earth's corotarion field then begins to dominate plasma flow at L values characteristic of the newly formed plasmapause on the nightside, the main plasmasphere starts to become roughly cir- cular and to drag with it, in spiral fashion, the inner parts of the plasma previously entrained sunward. In such a simplified picture, the radial density profile near dusk may be expected to exhibit an
inner plasmapause at L values near those characteristic of the dayside plasmasphere, as well as outlying dense feature(s) that may have plasmapauselike boundaries. In fact, DE 1 thermal ion density profiles in the dusk sector regularly exhibit such behavior, according to Horwitz et al. [1990]. Electron density profiles with such features have been observed by ourselves in many examples of ISEE profiles from the dusk sector, and what appears to be the dragging effect during quieting has been reported from polar satellite data by Taylor et al. [1971] and from whistlers by Ho and Carpenter [ 1976].
Figure 7b also fails to show the noon-midnight asymmetry in plasmasphere radius, involving a larger dayside radius, reported from Prognoz and Prognoz 2 by Gringauz and Bezrukikh [1976]. This asymmetry, reported as an L difference in plasmapause lo- cation of ,,., 1.6 during quiet and moderately disturbed conditions, was found to decrease with increasing magnetic activity. Its lack of appearance in Figure 7b is attributed in part to our empha- sis upon a particular profile steepness critierion for identifying a plasmapause position; our results appear to favor dayside ob- servations made in the aftermath of plasmapause formation on the nightside. We believe that plasmasphere topology is more complex than many available descriptions would suggest (see, for example, the case studies by Corcuff and Corcuff [1982]) and can only be properly understood through empirical and modeling studies of dynamical processes.
The Plasmapause: Electron Density Profile
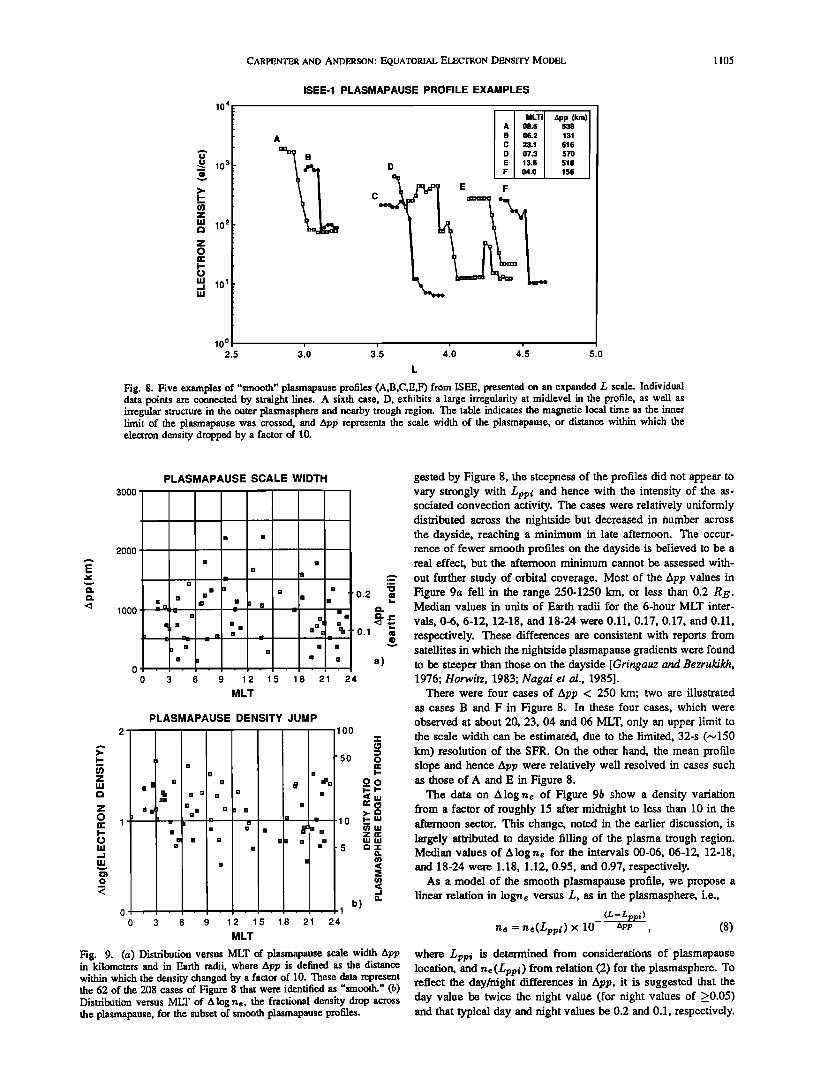
As a preliminary basis for describing the plasmapause density profile, 62 "clean" or "smooth" cases were selected from the total of 208 cases in which a plasmapause had been identified. The cri- terion for selection was that irregularities not be present within the region of steep density gradients (the development of a clean, as opposed to an irregular, plasmapause profile appeared to depend upon the occurrence of a comparatively fast and smooth buildup in convection activity, as indicated by the Kp index). Cases were rejected in which the slope between successive data points re- versed sign from negative to positive, or in which a "plateau" or constant level wider than about 150 km (the approximate separa- tion between successive data points) occurred between plasmas- phere and trough levels. Figure 8 shows five examples of smooth plasmapause profiles on an expanded time scale; a sixth example, case D, exhibits a large irregularity at midlevel in the profile as well as irregular structure in the outer plasmasphere and in the nearby trough region.
The parameters of the plasmapause scaled were the inner and outer L limits Lppi and Lppo, which determine the total plasma- pause thickness or width ALpp and the corresponding fractional density drop A log he. From this the scale width App, the dis- tance in L or in kilometers at the equator within which the electron density varies by a factor of 10, were determined from App = ALp/.,/A log n,.
In some cases there was uncertainty in identifying the inner and outer limiting data points of the plasmapause profile, but the corresponding uncertainty in the determination of App tended to be less than ~30%. When obvious, this uncertainty usually occurred as the result of small-scale ~30-50% structure in the outermost
plasmasphere. In many cases, such as A, B, E, and F in Figure 8, the limiting points were well-defined, while in some others, such as case C, a change in the identification of the plasmapause inner limit, and hence of ALpp, produced a change of similar sign in A log ne and thus only a small effect on App.
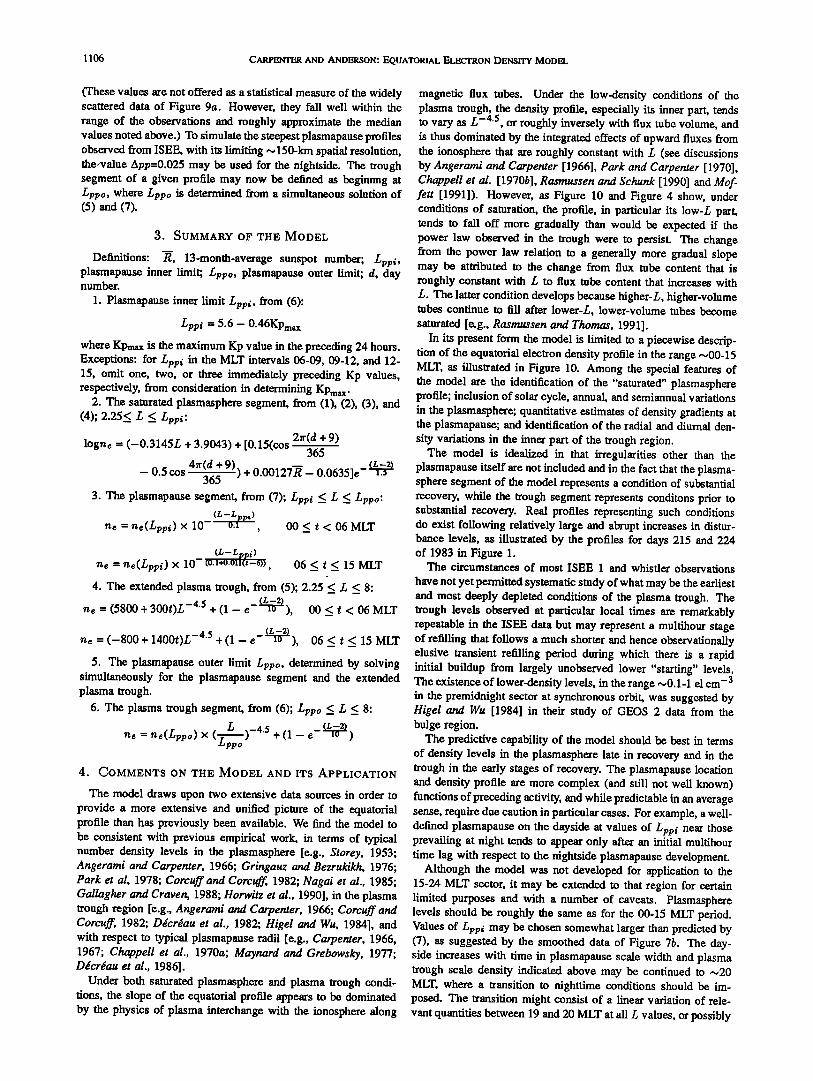
Figure 9a shows the distribution versus MLT of the values of App in kilometers and Earth radii, while Figure 9b shows the corresponding distribution of Alogne. Most of the clean profile data represent values of Lppi <5, but inside that limit, as sug-
CARPENTER AND ANDERSON: EQUATORIAL ELECTRON DENSITY MODEL 1105
10 4
• lO 3
z
m 10 2
z o
II.I 1 ..i 10
ISEE-1 PLASMAPAUSE PROFILE EXAMPLES
A
I I MLTil '•pp(km)l I A I 08.5 I s38 I I 81 06.2 I 131 I I c1'3.11 616 I I øl o7.3 I s7o I I EI 13.6 I 518 I
D I I 'ss I E F
10 0 i !
2.5 3 0 3'.5 410 4 5 5.0
Fig. 8. Five examples of "smooth" plasmapause profiles (A,B,C.,E,F) from ISEE, presented on an expanded L scale. Individual data points are connected by straight lines. A sixth case, D, exhibits a large irregularity at midlevel in the profile, as well as irregular structure in the outer plasmasphere and nearby trough region. The table indicates the magnetic local time as the inner limit of the plasmapause was crossed, and App represents the scale width of the plasmapause, or distance within which the electron density dropped by a factor of I0.
3000
2000
1000
PLASMAPAUSE SCALE WIDTH
[] [] [] []
[]
[] [] E •1% rn [] .
[] [] [] ] []
[] '3 [] [] ,
0 3 6 9 12 15 18 21 24
MLT
0.2
0.1
a)
z iI.i 1:3
,z o
o
o
PLASMAPAUSE DENSITY JUMP
[]
n [] [] • dan [] li b [] [] [] [] []
[] []
[]•1: [] [] 'l•l [] ,I :1 _ [] •pl m ........ u ;3 • ....................... [] ...........................................
[] [] [] [] BiB [] [] [] B [] [] r:
; 0 1 0 3 6 9 12 15 18 21 24
MLT
lOO
5o
lO
b)
Fig. 9. (a) Distribution versus MLT of plasmapause scale width App 'm kilometers and in Earth radii, where App is defined as the distance with'm which the density changed by a factor of 10. These data represent the 62 of the 208 cases of Figure 8 that were identified as "smooth." (b) Distribution versus MLT of A log he, the fractional density drop across the plasmapause, for the subset of smooth plasmapause profiles.
gested by Figure 8, the steepness of the profiles did not appear to vary strongly with Lppi and hence with the intensity of the as- sociated convection activity. The cases were relatively uniformly distributed across the nightside but decreased in number across the dayside, reaching a minimum in late afternoon. The occur- rence of fewer smooth profiles on the dayside is believed to be a real effect, but the afternoon minimum cannot be assessed with- out further study of orbital coverage. Most of the App values in Figure 9a fell in the range 250-1250 km, or less than 0.2 Median values in units of Earth radii for the 6-hour MLT inter-
vals, 0-6, 6-12, 12-18, and 18-24 were 0.11, 0.17, 0.17, and 0.11, respectively. These differences are consistent with reports from satellites in which the nightside plasmapause gradients were found to be steeper than those on the dayside [Gringauz and Bezrukikh, 1976; Horwitz, 1983; Nagai et al., 1985].
There were four cases of App < 250 km; two are illustrated as cases B and F in Figure 8. In these four cases, which were observed at about 20, 23, 04 and 06 MLT, only an upper limit to the scale width can be estimated, due to the limited, 32-s (~150 km) resolution of the SFR. On the other hand, the mean profile slope and hence fipp were relatively well resolved in cases such as those of A and E in Figure 8.
The data on fi log ne of Figure 9b show a density variation from a factor of roughly 15 after midnight to less than 10 in the afternoon sector. This change, noted in the earlier discussion, is largely attributed to dayside filling of the plasma trough region. Median values of A log ne for the intervals 00-06, 06-12, 12-18, and 18-24 were 1.18, 1.12, 0.95, and 0.97, respectively.
As a model of the smooth plasmapause profile, we propose a linear relation in logne versus L, as in the plasmasphere, i.e.,
(L--Lppi) ne = ne(Lppi) x 10- app , (8)
where Lppi is determined from considerations of plasmapause location, and ne(Lppi) from relation (2) for the plasmasphere. To reflect the day/night differences in App, it is suggested that the day value be teeice the night value (for night values of >_0.05) and that typical day and night values be 0.2 and 0.1, respectively.
1106 CARPENTER AND ANDERSON: EQUATORIAL ELECTRON DENSITY MODEL
(These values are not offered as a statistical measure of the widely scattered data of Figure 9a. However, they fall well within the range of the observations and roughly approximate the median values noted above.) To simulate the steepest plasmapause profiles observed from ISEE, with its limiting ~150-km spatial resolution, the-value App=0.025 may be used for the nightside. The trough segment of a given profile may now be defined as beginnng at Lppo, where Lppo is determined from a simultaneous solution of (5) and (7).
3. SUMMARY OF THE MODEL
Definitions: R, 13-month-average sunspot number; Lppi, plasmapause inner limit; Lppo, plasmapause outer limit; d, day number.
1. Plasmapause inner limit Lpp i, from (6):
Lppi = 5.6 - 0.46KPmax
where Kpmax is the maximum Kp value in the preceding 24 hours. Exceptions: for Lppi in the MLT intervals 06-09, 09-12, and 12- 15, omit one, two, or three immediately preceding Kp values, respectively, from consideration in determining rPmax.
2. The saturated plasmasphere segment, from (1), (2), (3), and (4); 2.25_< L _< Lrri:
logne = (-0.3145L + 3.9043) + [0.15(cos 2•r(d + 9) 365
4•r(d + 9)) + 0.00127• - 0.0635]e- (-• - 0.5 cos 365 3. The plasmapause segment, from (7); Lppi _< L _< Lppo'
(L -- Lpp i ) ne = ne(Lpp i) x 10- 0.• , 00 _< t < 06 MLT
(L--Lpp i) ne = ne(Lppi) x 10-(0.1+0.011(t--6)), 06 _< t _< 15 MLT
4. The extended plasma trough, from (5); 2.25 _< L _< 8: (L --2)
ne=(5800+300t)L -4'5 + (1 - e---I'ff-), 00_<t < 06 MLT (L--2)
ne = (--800 + 1400t)L -4'5 + (1 -e---I'0-), 06 _< t _< 15 MLT 5. The plasmapause outer limit Lppo, determined by solving
simultaneously for the plasmapause segment and the extended plasma trough.
6. The plasma trough segment, from (6); Lppo _< L _< 8:
(•L) -4'5 -•1• ne = n,(Lrro) x + (1 - e ) Lppo
4. COMMENTS ON THE MODEL AND ITS APPLICATION
The model draws upon two extensive data sources in order to provide a more extensive and unified picture of the equatorial profile than has previously been available. We find the model to be consistent with previous empirical work, in terms of typical number density levels in the plasmasphere [e.g., Storey, 1953; Angerami and Carpenter, 1966; Gringauz and Bezrukikh, 1976; Park et al, 1978; Corcuff and Corcuff, 1982; Nagai et al., 1985; Gallagher and Craven, 1988; Horwitz et al., 1990], in the plasma trough region [e.g., Angerarni and Carpenter, 1966; Corcuff and Corcuff, 1982; Ddcrdau et al., 1982; Higel and Wu, 1984], and with respect to typical plasmapause radii [e.g., Carpenter, 1966, 1967; Chappell et al., 1970a; Maynard and Grebowsky, 1977; Ddcrdau et al., 1986].
Under both saturated plasmasphere and plasma trough condi- tions, the slope of the equatorial profile appears to be dominated by the physics of plasma interchange with the ionosphere along
magnetic flux tubes. Under the low-density conditions of the plasma trough, the density profile, especially its inner part, tends to vary as L -4'5, or roughly inversely with flux tube volume, and is thus dominated by the integrated effects of upward fluxes from the ionosphere that are roughly constant with L (see discussions by Angerami and Carpenter [1966], Park and Carpenter [1970], Chappell et al. [1970b], Rasmussen and Schunk [1990] and Mof- fett [1991]). However, as Figure 10 and Figure 4 show, under conditions of saturation, the profile, in particular its low-L part, tends to fall off more gradually than would be expected ff the power law observed in the trough were to persist. The change from the power law relation to a generally more gradual slope may be attributed to the change from flux tube content that is roughly constant with L to flux tube content that increases with L. The latter condition develops because higher-L, higher-volume tubes continue to fill after lower-L, lower-volume tubes become saturated [e.g., Rasmussen and Thomas, 1991].
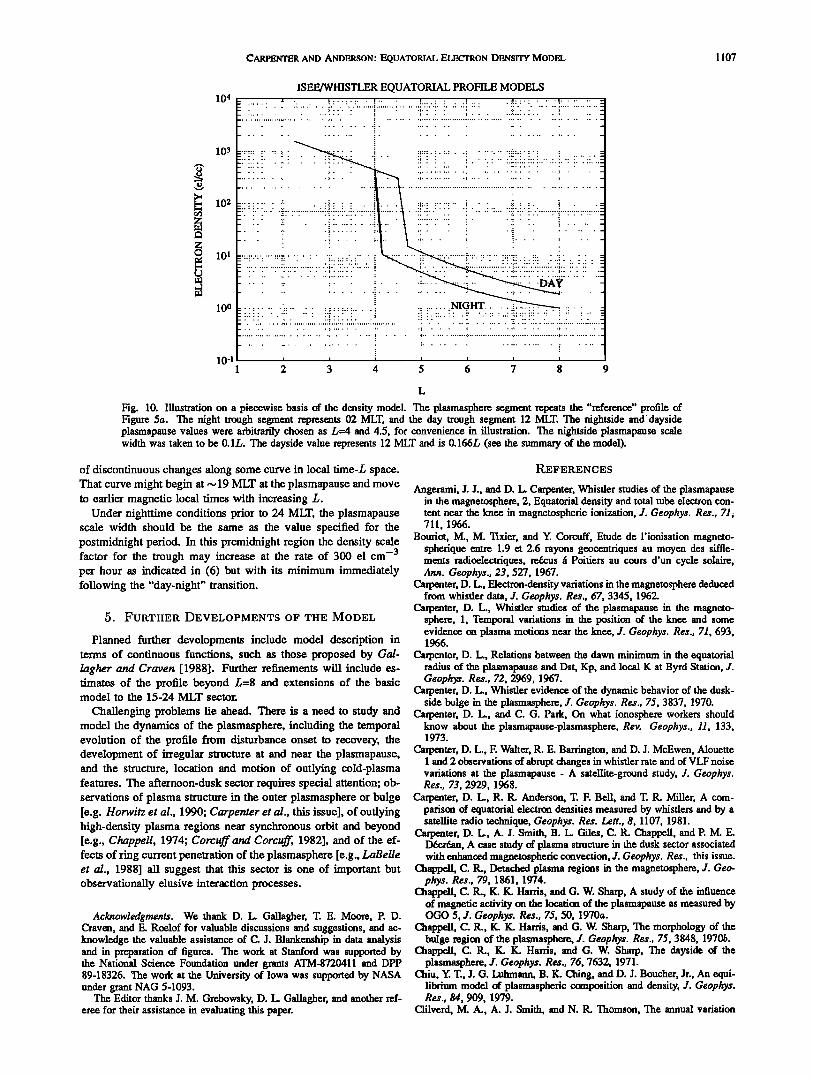
In its present form the model is limited to a piecewise descrip- tion of the equatorial electron density profile in the range •00-15 MLT, as illustrated in Figure 10. Among the special features of the model are the identification of the "saturated" plasmasphere profile; inclusion of solar cycle, annual, and semiannual variations in the plasmasphere; quantitative estimates of density gradients at the plasmapause; and identification of the radial and diurnal den- sity variations in the inner part of the trough region.
The model is idealized in that irregularities other than the plasmapause itself are not included and in the fact that the plasma- sphere segment of the model represents a condition of substantial recovery, while the trough segment represents conditons prior to substantial recovery. Real profiles representing such conditions do exist following relatively large and abrupt increases in distur- bance levels, as illustrated by the profiles for days 215 and 224 of 1983 in Figure 1.
The circumstances of most ISEE 1 and whistler observations
have not yet permitted systematic study of what may be the earliest and most deeply depleted conditions of the plasma trough. The trough levels observed at particular local times are remarkably repeatable in the ISEE data but may represent a multihour stage of refilling that follows a much shorter and hence observationally elusive transient refilling period during which there is a rapid initial buildup from largely unobserved lower "starting" levels. The existence of lower-density levels, in the range •0.1-1 el cm -3 in the premidnight sector at synchronous orbit, was suggested by Higel and Wu [1984] in their study of GEOS 2 data from the bulge region.
The predictive capability of the model should be best in terms of density levels in the plasmasphere late in recovery and in the trough in the early stages of recovery. The plasmapause location and density profile are more complex (and still not well known) functions of preceding activity, and while predictable in an average sense, require due caution in particular cases. For example, a well- defined plasmapause on the dayside at values of Lppi near those prevailing at night tends to appear only after an initial multihour time lag with respect to the nightside plasmapause development.
Although the model was not developed for application to the 15-24 MLT sector, it may be extended to that region for certain limited purposes and with a number of caveats. Plasmasphere levels should be roughly the same as for the 00-15 MLT period. Values of Lppi may be chosen somewhat larger than predicted by (7), as suggested by the smoothed data of Figure 7b. The day- side increases with time in plasmapause scale width and plasma trough scale density indicated above may be continued to •20 MLT, where a transition to nighttime conditions should be im- posed. The transition might consist of a linear variation of rele- vant quantities between 19 and 20 MLT at all L values, or possibly
CARPENTER AND ANDERSON: EQUATORIAL ELECTRON DENSITY MODEL 1107
ISEE/WHISTLER EQUATORIAL PROFILE MODELS 10 4
10 3
102
10 •
10-1 1 2 3 4 5 6 7 8 9
Fig. 10. Illustration on a piecewise basis of the density model. The plasmasphere segment repeats the "reference" profile of Figure 5a. The night trough segment represents 02 MLT, and the day trough segment 12 MLT. The nightside and' dayside plasmapause values were arbitrarily chosen as L=4 and 4.5, for convenience in illustration. The nightsir e plasmapause scale width was taken to be 0.1L. The dayside value represents 12 MLT and is 0.166L (see the summary of the model).
of discontinuous changes along some curve in local time-L space. That curve might begin at ~ 19 MLT at the plasmapause and move to earlier magnetic local times with increasing L.
Under nighttime conditions prior to 24 MLT, the plasmapause scale width should be the same as the value specified for the postmidnight period. In this premidnight region the density scale factor for the trough may increase at the rate of 300 el cm -3 per hour as indicated in (6) but with its minimum immediately following the "day-night" transition.
5. FURTHER DEVELOPMENTS OF THE MODEL
Planned further developments include model description in terms of continuous functions, such as those proposed by Gal- lagher and Craven [1988]. Further refinements will include es- timates of the profile beyond L=8 and extensions of the basic model to the 15-24 MLT sector.
Challenging problems lie ahead. There is a need to study and model the dynamics of the plasmasphere, including the temporal evolution of the profile from disturbance onset to recovery, the development of irregular structure at and near the plasmapause, and the structure, location and motion of outlying cold-plasma features. The afternoon-dusk sector requires special attention; ob-
P•EFERENCES
Angerami, J. J., and D. L. Carpenter, Whistler studies of the plasmapause in the magnetosphere, 2, Equatorial density and total tube electron con- tent near the knee in magnetospheric ionization, J. Geophys. Res., 71, 711, 1966.
Bouriot, M., M. Tixier, and Y. Cotcuff, Etude de l'ionisation magneto- spherique entre 1.9 et 2.6 rayons geocentriques au moyen des siffie- ments radioelectriques, retcus • Poitiers au cours d'un cycle solaire, Ann. Geophys., 23, 527, 1967.
Carpenter, D. L., Electron-density variations in the magnetosphere deduced from whistler data, J. Geophys. Res., 67, 3345, 1962.
Carpenter, D. L., Whistler studies of the plasmapause in the magneto- sphere, 1, Temporal variations in the position of the knee and some evidence on plasma motions near the knee, J. Geophys. Res., 71, 693, 1966.
Carpenter, D. L., Relations between the dawn minimum in the equatorial radius of the plasmapause and Dst, Kp, and local K at Byrd Station, J. Geophys. Res., 72, 2969, 1967.
Carpenter, D. L., Whistler evidence of the dynamic behavior of the dusk- side bulge in the plasmasphere, J. Geophys. Res., 75, 3837, 1970.
Carpenter, D. L., and C. G. Park, On what ionosphere workers should know about the plasmapause-plasmasphere, Rev. Geophys., 11, 133, 1973.
Carpenter, D. L., F. Walter, R. E. Barrington, and D. J. McEwen, Alouette 1 and 2 observations of abmpt changes in whistler rate and of VLF noise variations at the plasmapause - A satellite-ground study, J. Geophys. Res., 73, 2929, 1968.
servations of plasma structure in the outer plasmasphere or bulge Carpenter, D. L., R. R. Anderson, T. F. Bell, and T. R. Miller, A corn- [e.g. Horwitz et al., 1990; Carpenter et al., this issue], of outlying high-density plasma regions near synchronous orbit and beyond [e.g., Chappell, 1974; Corcuff and Corcuff, 1982], and of the ef- fects of ring current penetration of the plasmasphere [e.g., LaBelle et al., 1988] all suggest that this sector is one of important but observationally elusive interaction processes.
Acknowledgments. We thank D. L. Gallagher, T. E. Moore, P. D. Craven, and E. Roelof for valuable discussions and suggestions, and ac- knowledge the valuable assistance of C. J. Blankenship in data analysis and in preparation of figures. The work at Stanford was supported by the National Science Foundation under grants ATM-8720411 and DPP 89-18326. The work at the University of Iowa was supported by NASA under grant NAG 5-1093.
The Editor thanks J. M. Grebowsky, D. L. Gallagher, and another ref- eree for their assistance in evaluating this paper.
parson of equatorial electron densities measured by whistlers and by a satellite radio technique, Oeophys. Res. Lett., 8, 1107, 1981.
Carpenter, D. L., A. J. Smith, B. L. Giles, C. R. Chappell, and P.M. E. Dtcrtau, A case study of plasma stmcture in the dusk sector associated with enhanced magnetospheric convection, J. Geophys. Res., this issue.
Chappell, C. R., Detached plasma regions in the magnetosphere, J. Geo- phys. Res., 79, 1861, 1974.
Chappell, C. R., K. K. Harris, and G. W. Sharp, A study of the influence of magnetic activity on the location of the plasmapause as measured by OGO 5, J. Geophys. Res., 75, 50, 1970a.
Chappell, C. R., K. K. Harris, and G. W. Sharp, The morphology of the bulge region of the plasmasphere, J. Geophys. Res., 75, 3848, 1970b.
Chappell, C. R., K. K. Harris, and G. W. Sharp, The dayside of the plasmasphere, J. Geophys. Res., 76, 7632, 1971.
Chiu, Y. T., J. G. Luhmann, B. K. Ching, and D. J. Boucher, Jr., An equi- librium model of plasmaspheric composition and density, J. Geophys. Res., 84, 909, 1979.
Clilverd, M. A., A. J. Smith, and N. R. Thomson, The annual variation
1108 CARPENTER AND ANDERSON: EQUATORIAL ELECTRON DENSITY MODEL
in quiet time plasmaspheric electron density, determined from whistler mode group delays, Planet. Space Sci., 39, 1059, 1991.
Corcuff, P., Y. Corcuff, D. L. Carpenter, C. R. Chappell, J. Vigneron, and N. Kleimenova, La plasmasphere en ptriode de recouvrement magnttique. Etude combinte des donntes des satellites OGO 4, OGO 5 et des siffiements re9us au sol, Ann. Geophys., 28, 679, 1972.
Corcuff, Y., and P. Corcuff, Structure et dynamique de la plasmapause - plasmasphere les 6 et 14 juillet 1977: Etude ?• l'aide des donntes de siffiements re9us au sol at de donntes des satellites ISIS et GEOS 1, Ann. Geophys., 38, 1, 1982.
Dtcrtau, P.M. E., C. Beghin, and M. Parrot, Global characteristics of the cold plasma in the equatorial plasmapause region as deduced from the GEOS 1 mutual impedance probe, J. Geophys. Res., 87, 695, 1982.
Dtcrtau, P.M. E., J. Lemaire, C. R. Chappell, and J. H. Waite, Jr., Night- side plasmapause positions observed by DE 1 as a function of geo- magnetic indices: Comparison with whistler observations and model calculations, Adv. Space Res., 6, 209, 1986.
Gallagher, D. L., and P. D. Craven, Initial development of a new empirical model of the Earth's inner magnetosphere for density, temperature, and composition, in Modeling Magnetospheric Plasma, Geophys. Monogr. Set., vol. 44, edited by T.E. Moore and J. H. Waite, Jr. p. 61, AGU, Washington, D.C., 1988.
Gringauz, K. I., and V. V. Bezmkikh, Asymmetry of the Earth's plasmas- phere in the direction noon-midnight from Prognoz and Prognoz 2 data, J. Atmos. Terr. Phys., 38, 1071, 1976.
Gumett, D. A., R. R. Anderson, F. L. Scarf, R. W. Fredricks, and E. J. Smith, Initial results from the ISEE 1 and 2 plasma wave investigation, Space Sci. Rev., 23, 103, 1979.
Helliwell, R. A., Exospheric electron density variations deduced from whistlers, Ann. Geophys., 17, 76, 1961.
Higel, B., and L. Wu, Electron density and plasmapause characteristics at 6.6 RE: A statistical study of the GEOS 2 relaxation sounder data, J. Geophys. t•es., 89, 1583, 1984.
Ho, D., and D. L. Carpenter, Oufiying plasmasphere structure detected by whisfiers, Planet. Space Sci., 24, 987, 1976.
Horwitz, J. L., Plasmapause diffusion, J. Geophys Res., 88, 4950, 1983. Horwitz, J. L., R. H. Comfort, and C. R. Chappell, A statistical charac-
terization of plasmasphere density structure and boundary locations, J. Geophys. Res., 95, 7937, 1990.
LaBelle, J., R. A Treumann, W. Baumjohann, G. Haerendel, N. Sckopke, and G. Paschmann, The duskside plasmapause/ring current interface: Convection and plasma wave observations, J. Geophys. Res., 93, 2573, 1988.
Lemaire, J., The mechanisms of formation of the plasmapause, Ann. Geo- phys., 31,175, 1975.
Lemaire, J., Frontiers of the Plasmasphere (Theoretical Aspects), Cabay, Louvain, Belgium, 1985.
Maynard, N. C., and A. J. Chen, Isolated cold plasma regions: Observa- tions and their relation to possible production mechanisms, J. Geophys. Res., 80, 1009, 1975.
Maynard, N. C., and J. M. Grebowsky, The plasmapause revisited, J. Geophys. Res., 82, 1591, 1977.
Moffett, R. J., Numerical simulation of coupling processes between the
mid-latitude ionosphere and the plasmasphere, Adv. Space Res., in press, 1991.
Moore, T. E., D. L. Gallagher, J. L. Horwitz, and R. H. Comfort, MHD wave breaking in the outer plasmasphere, Geophys. Res. Lett., 14, 1007, 1987.
Mosier, S. R., M. L. Kaiser, and L. W. Brown, Observations of noise bands associated with the upper hybrid resonance by the IMP 6 radio astronomy experiment, J. Geophys. Res., 78, 1673, 1973.
Nagai, T., J. L. Horwitz, R. R. Anderson, and C. R. Chappell, Structure of the plasmapause from ISEE 1 low energy ion and plasma wave observations, J. Geophys. Res., 90, 6622, 1985.
Park, C. G., Whistler observations of the interchange of ionization between the ionosphere and the protonosphere, J. Geophys. Res., 75, 4249, 1970.
Park, C. G., Methods of determining electron concentrations in the mag- netosphere from nose whistlers, Tech. Rep. 3454-1, Radiosci. Lab., Stanford Univ., Stanford, Calif., 1972.
Park, C. G., Some features of plasma distribution in the plasmasphere deduced from antarctic whistlers, J. Geophys. Res., 79, 169, 1974.
Park, C. G., and D. L. Carpenter, Whistler evidence of large scale electron- density irregularities in the plasmasphere, J. Geophys. Res., 75, 3825, 1970.
Park, C. G., D. L. Carpenter, and D. B. Wiggin, Electron density in the plasmasphere: Whisfier data on solar cycle, annual, and diurnal varia- tions, J. Geophys. Res., 83, 3235, 1978.
Rasmussen, C. E., and R. W. Schunk, A three-dimensional time-dependent model of the plasmasphere, J. Geophys. Res., 95, 6133, 1990.
Rasmussen, C. E., and S. G. Thomas, A two-dimensional model of the plasmasphere: Refilling time constants (abstract), Eos Trans. AGU, 72, 234, 1991.
Richmond, A.D., Self-induced motions of thermal plasma in the mag- netosphere and the stability of the plasmapause, Radio Sci., 8, 1019, 1973.
Sachs, L., Applied Statistics, 2d ed., translated from German by Z. Rey- narowych, Springer-Verlag, New York, 1984.
Smith, A, J. and M. A. Clilverd, Magnetic storm effects on the mid-latitude plasmasphere, Planet. Space Sci., 39, 1069, 1991.
Storey, L. R. O., An investigation of whistling atmospherics, Philos Trans. R. Soc. London, Set. A, 246, 113, 1953.
Taylor, H. A., Jr., H. C. Brinton, and A. R. Deshmukh, Observations of irregular structure in thermal ion distributions in the duskside magne- tosphere, J. Geophys. Res., 75, 2481, 1970.
Taylor, H. A., Jr., J. M. Grebowsky, and W. J. Walsh, Structured variations of the plasmapause: Evidence of a corotating plasma tail, J. Geophys. Res., 76, 6806, 1971.
R. R. Anderson, Department of Physics and Astronomy, University of Iowa, Iowa City, IA 52242.
D. L. Carpenter, STAR Laboratory/EE Department, Stanford University, Stanford, CA 94305.
(Received March 11, 1991; revised May 6, 1991;
accepted June 3, 1991.)