an indoor localization system based on ble mesh …935745/fulltext01.pdf · an indoor localization...
TRANSCRIPT
Master of Science Thesis in Communication SystemsDepartment of Electrical Engineering, Linköping University, 2016
An Indoor LocalizationSystem Based on BLEMesh Network
Oscar Silver


Master of Science Thesis in Communication Systems
An Indoor Localization System Based on BLE Mesh Network
Oscar Silver
LiTH-ISY-EX--16/4948--SE
Supervisor: Hei Victor Chengisy, Linköpings universitet
Jingcheng ZhangEricsson AB
Examiner: Danyo Danevisy, Linköpings universitet
Communication SystemsDepartment of Electrical Engineering
Linköping UniversitySE-581 83 Linköping, Sweden
Copyright © 2016 Oscar Silver

Abstract
Internet of Things (iot) is a growing field enabled by many different technologies.One of these technologies is Bluetooth Low Energy (ble). It is of interest to in-vestigate the potential of ble and one interesting, currently unsupported, featureis mesh networking. This thesis work aims to investigate whether it is possibleto design and implement a mesh network protocol using ble. To verify the im-plemented mesh network protocols functionality an indoor localization systemhas been implemented upon the BLE mesh network protocol. Furthermore thisthesis work investigates if an indoor localization system can benefit from usinga mesh network. The results of the investigation is a proof of concept of a func-tional blemesh network protocol implemented on hardware and tested in a realenvironment. Tests show that the implemented localization system has similaraccuracy as other rssi based indoor localization systems. The largest advantagefound for a mesh based indoor localization is the ability to localize objects outsideof the radio propagation range of the user. This feature is enabled by multi-hopmessaging in the mesh network.
v


Acknowledgments
Firstly I would like to thank Ericsson Research in Linköping, Sweden for givingme the opportunity to work on this thesis in a motivating and inspiring envi-ronment. A special thanks goes to my supervisor, Jingcheng Zhang, for alwaysproviding support and helping me overcome whatever problems I encountered.
Another thanks goes to all my friends and course mates for making my time atthe University an amazing experience that I will remember for life.
Finally, I would like to thank my family and my wife for their support in allmatters.
Linköping, June 2016Oscar Silver
vii

Contents
List of Figures xi
List of Tables xii
Notation xiii
1 Introduction 11.1 Background . . . . . . . . . . . . . . . . . . . . . . . . . . . . . . . 11.2 Motivation . . . . . . . . . . . . . . . . . . . . . . . . . . . . . . . . 21.3 Problem Formulation . . . . . . . . . . . . . . . . . . . . . . . . . . 21.4 Delimitations . . . . . . . . . . . . . . . . . . . . . . . . . . . . . . . 31.5 Thesis Outline . . . . . . . . . . . . . . . . . . . . . . . . . . . . . . 3
2 Theoretical Background 52.1 Bluetooth Low Energy . . . . . . . . . . . . . . . . . . . . . . . . . 5
2.1.1 Protocol Architecture . . . . . . . . . . . . . . . . . . . . . . 52.1.2 RSSI . . . . . . . . . . . . . . . . . . . . . . . . . . . . . . . . 10
2.2 Mesh Network . . . . . . . . . . . . . . . . . . . . . . . . . . . . . . 122.2.1 Message Forwarding Algorithms . . . . . . . . . . . . . . . 14
2.3 Localization . . . . . . . . . . . . . . . . . . . . . . . . . . . . . . . 142.3.1 Trilateration . . . . . . . . . . . . . . . . . . . . . . . . . . . 152.3.2 Fingerprinting . . . . . . . . . . . . . . . . . . . . . . . . . . 17
3 System design 193.1 Hardware . . . . . . . . . . . . . . . . . . . . . . . . . . . . . . . . . 193.2 Network Layer . . . . . . . . . . . . . . . . . . . . . . . . . . . . . . 20
3.2.1 A BLE Mesh Protocol . . . . . . . . . . . . . . . . . . . . . . 203.2.2 Mesh Packet Format . . . . . . . . . . . . . . . . . . . . . . 223.2.3 Network Layer Limitations . . . . . . . . . . . . . . . . . . . 23
3.3 Application Layer . . . . . . . . . . . . . . . . . . . . . . . . . . . . 233.3.1 Application Layer Overview . . . . . . . . . . . . . . . . . . 243.3.2 Application Layer Components . . . . . . . . . . . . . . . . 283.3.3 Localization Algorithms . . . . . . . . . . . . . . . . . . . . 33
ix
x Contents
3.3.4 Application Layer Enhancements . . . . . . . . . . . . . . . 33
4 Results 354.1 Test Environment Setup . . . . . . . . . . . . . . . . . . . . . . . . 35
4.1.1 Test Area . . . . . . . . . . . . . . . . . . . . . . . . . . . . . 354.1.2 Calibration . . . . . . . . . . . . . . . . . . . . . . . . . . . . 37
4.2 Results . . . . . . . . . . . . . . . . . . . . . . . . . . . . . . . . . . 394.2.1 RSSI Filtering . . . . . . . . . . . . . . . . . . . . . . . . . . 394.2.2 Localization Algorithms . . . . . . . . . . . . . . . . . . . . 394.2.3 Filtering Methods . . . . . . . . . . . . . . . . . . . . . . . . 42
5 Analysis and Discussion 455.1 Evaluation Criteria . . . . . . . . . . . . . . . . . . . . . . . . . . . 455.2 RSSI Filtering . . . . . . . . . . . . . . . . . . . . . . . . . . . . . . 455.3 Localization Algorithms . . . . . . . . . . . . . . . . . . . . . . . . 51
5.3.1 Trilateration . . . . . . . . . . . . . . . . . . . . . . . . . . . 515.3.2 Fingerprinting . . . . . . . . . . . . . . . . . . . . . . . . . . 525.3.3 Comparison . . . . . . . . . . . . . . . . . . . . . . . . . . . 53
5.4 Localization Filtering . . . . . . . . . . . . . . . . . . . . . . . . . . 53
6 Conclusion 556.1 Further Work . . . . . . . . . . . . . . . . . . . . . . . . . . . . . . . 57
Bibliography 59
List of Figures
2.1 The ble Protocol Architecture . . . . . . . . . . . . . . . . . . . . . 62.2 ble Radio Channels. . . . . . . . . . . . . . . . . . . . . . . . . . . 72.3 Link Layer state machine . . . . . . . . . . . . . . . . . . . . . . . . 82.4 ble Advertising Packet Structure . . . . . . . . . . . . . . . . . . . 102.5 A star topology network . . . . . . . . . . . . . . . . . . . . . . . . 122.6 A full mesh network . . . . . . . . . . . . . . . . . . . . . . . . . . . 132.7 A partial mesh network . . . . . . . . . . . . . . . . . . . . . . . . . 132.8 Ideal trilateration . . . . . . . . . . . . . . . . . . . . . . . . . . . . 162.9 The disc trilateration method . . . . . . . . . . . . . . . . . . . . . 17
3.1 QN920 MiniDK development board . . . . . . . . . . . . . . . . . . 203.2 The relevant parts of the ble Link Layer state machine . . . . . . . 213.3 Localization message sequence chart . . . . . . . . . . . . . . . . . 263.4 Ad-hoc deployment message sequence chart . . . . . . . . . . . . . 283.5 Tag message sequence chart . . . . . . . . . . . . . . . . . . . . . . 293.6 Mesh Relay Node state machine . . . . . . . . . . . . . . . . . . . . 303.7 Central Unit passive functionality flowchart . . . . . . . . . . . . . 32
4.1 Small open office test environment . . . . . . . . . . . . . . . . . . 364.2 Large open office test environment . . . . . . . . . . . . . . . . . . 364.3 Points used for testing the fingerprinting algorithm . . . . . . . . . 38
5.1 Unfiltered RSSI at one meter distance . . . . . . . . . . . . . . . . . 465.2 Averaged RSSI at one meter distance . . . . . . . . . . . . . . . . . 475.3 Kalman filtered RSSI at one meter distance . . . . . . . . . . . . . 485.4 Comparison of rssi filters . . . . . . . . . . . . . . . . . . . . . . . 495.5 Example of grid used for fingerprinting calibration . . . . . . . . . 52
xi
List of Tables
3.1 Mesh packet structure . . . . . . . . . . . . . . . . . . . . . . . . . 223.2 Localization application layer messages . . . . . . . . . . . . . . . . 253.3 Ad-hoc deployment application layer messages . . . . . . . . . . . 273.4 Tag info table in Mesh Relay Node . . . . . . . . . . . . . . . . . . . 31
4.1 One meter rssi values for mesh nodes deployed in the test area . . 384.2 Comparison of rssimeasurements with different filters . . . . . . 394.3 Localization test results using the Trilateration Algorithm and un-
filtered rssi . . . . . . . . . . . . . . . . . . . . . . . . . . . . . . . 404.4 Localization test results using the Fingerprinting Algorithm and
unfiltered rssi . . . . . . . . . . . . . . . . . . . . . . . . . . . . . . 414.5 Localization test results using the KNN Fingerprinting Algorithm
and unfiltered rssi . . . . . . . . . . . . . . . . . . . . . . . . . . . 414.6 Localization test results using the KNN Fingerprinting Algorithm
and unfiltered rssi . . . . . . . . . . . . . . . . . . . . . . . . . . . 424.7 Localization test results using the KNN Fingerprinting Algorithm
and average-filtered rssi . . . . . . . . . . . . . . . . . . . . . . . . 434.8 Localization test results using the KNN Fingerprinting Algorithm
and Kalman-filtered rssi . . . . . . . . . . . . . . . . . . . . . . . . 43
5.1 Comparison of rssimeasurements at fixed distances . . . . . . . . 505.2 Comparison of Localization Accuracy for different filters using the
KNN Fingerprinting Algorithm . . . . . . . . . . . . . . . . . . . . 54
xii

Notation
Abbreviations
Abbreviation Definition
aoa Angle of Arrivalatt Attribute Protocolble Bluetooth Low Energygap Generic Access Profilegatt Generic Attribute Profilegfsk Gaussian Frequency Shift Keyinggps Global Positioning Systemhci Host/Controller Interfaceiot Internet of Thingsism Industrial, Scientific and Medicall2cap Logical Link Control and Adaptation Protocolll Link Layerpcb Printed Circuit Boardphy Physical Layerrf Radio Frequencyrssi Received Signal Strength Indicationsmp Security Manager Protocoltdoa Time Difference of Arrivaltoa Time of Arrival
xiii

1Introduction
The folloiwng chapter gives an introduction to the topic of the thesis, a motiva-tion of its relevance, the problem statement and delimitations assumed in thisthesis work. The chapter concludes with an outline of the thesis.
1.1 Background
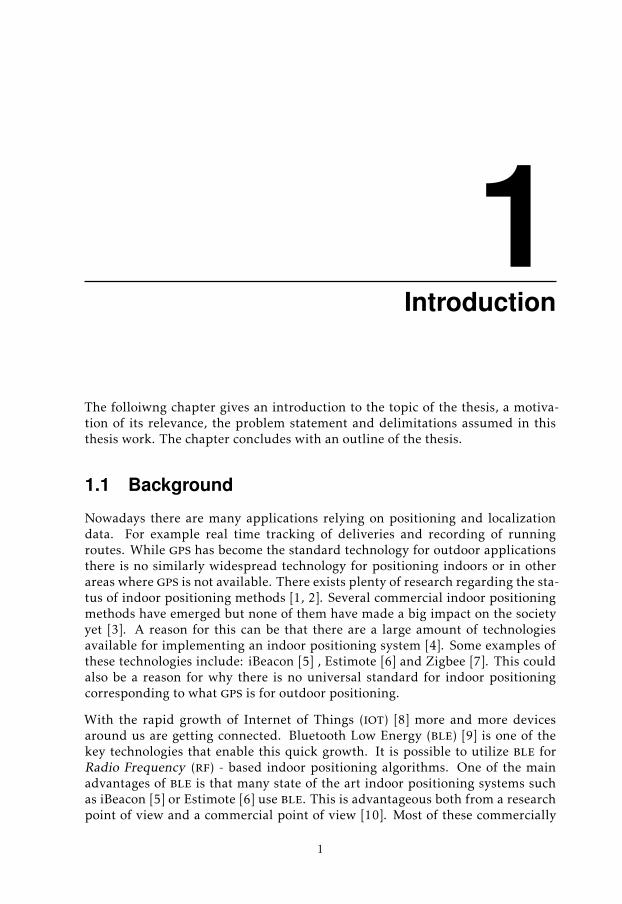
Nowadays there are many applications relying on positioning and localizationdata. For example real time tracking of deliveries and recording of runningroutes. While gps has become the standard technology for outdoor applicationsthere is no similarly widespread technology for positioning indoors or in otherareas where gps is not available. There exists plenty of research regarding the sta-tus of indoor positioning methods [1, 2]. Several commercial indoor positioningmethods have emerged but none of them have made a big impact on the societyyet [3]. A reason for this can be that there are a large amount of technologiesavailable for implementing an indoor positioning system [4]. Some examples ofthese technologies include: iBeacon [5] , Estimote [6] and Zigbee [7]. This couldalso be a reason for why there is no universal standard for indoor positioningcorresponding to what gps is for outdoor positioning.
With the rapid growth of Internet of Things (iot) [8] more and more devicesaround us are getting connected. Bluetooth Low Energy (ble) [9] is one of thekey technologies that enable this quick growth. It is possible to utilize ble forRadio Frequency (rf) - based indoor positioning algorithms. One of the mainadvantages of ble is that many state of the art indoor positioning systems suchas iBeacon [5] or Estimote [6] use ble. This is advantageous both from a researchpoint of view and a commercial point of view [10]. Most of these commercially
1
2 1 Introduction
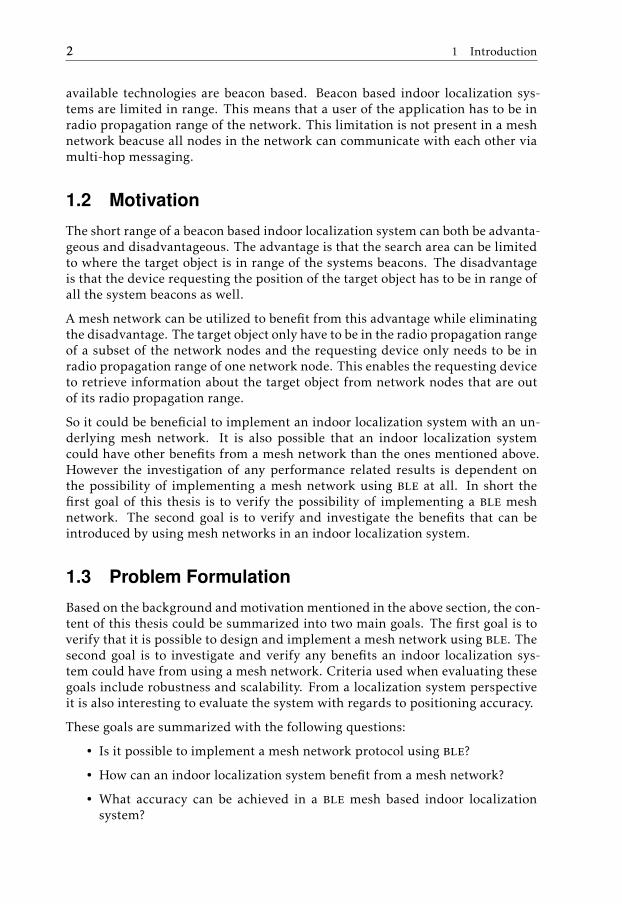
available technologies are beacon based. Beacon based indoor localization sys-tems are limited in range. This means that a user of the application has to be inradio propagation range of the network. This limitation is not present in a meshnetwork beacuse all nodes in the network can communicate with each other viamulti-hop messaging.
1.2 Motivation
The short range of a beacon based indoor localization system can both be advanta-geous and disadvantageous. The advantage is that the search area can be limitedto where the target object is in range of the systems beacons. The disadvantageis that the device requesting the position of the target object has to be in range ofall the system beacons as well.
A mesh network can be utilized to benefit from this advantage while eliminatingthe disadvantage. The target object only have to be in the radio propagation rangeof a subset of the network nodes and the requesting device only needs to be inradio propagation range of one network node. This enables the requesting deviceto retrieve information about the target object from network nodes that are outof its radio propagation range.
So it could be beneficial to implement an indoor localization system with an un-derlying mesh network. It is also possible that an indoor localization systemcould have other benefits from a mesh network than the ones mentioned above.However the investigation of any performance related results is dependent onthe possibility of implementing a mesh network using ble at all. In short thefirst goal of this thesis is to verify the possibility of implementing a ble meshnetwork. The second goal is to verify and investigate the benefits that can beintroduced by using mesh networks in an indoor localization system.
1.3 Problem Formulation
Based on the background and motivation mentioned in the above section, the con-tent of this thesis could be summarized into two main goals. The first goal is toverify that it is possible to design and implement a mesh network using ble. Thesecond goal is to investigate and verify any benefits an indoor localization sys-tem could have from using a mesh network. Criteria used when evaluating thesegoals include robustness and scalability. From a localization system perspectiveit is also interesting to evaluate the system with regards to positioning accuracy.
These goals are summarized with the following questions:
• Is it possible to implement a mesh network protocol using ble?
• How can an indoor localization system benefit from a mesh network?
• What accuracy can be achieved in a ble mesh based indoor localizationsystem?

1.4 Delimitations 3
• Can other localization related applications benefit from the mesh network?
1.4 Delimitations
The work in this thesis only consider two-dimension localization. The heightabove ground is not considered when deciding the position of a target object.The localization system designed in this thesis does not work in real-time. Alllocalization requests are on-demand.
1.5 Thesis Outline
• Chapter 1 presents the thesis introduction together with problem formula-tion and research questions.
• Chapter 2 gives the necessary background theory regarding ble, mesh net-works and localization algorithms used in this thesis.
• Chapter 3 presents the design of the ble mesh network protocol and theindoor localization application.
• Chapter 4 describes the test environment and presents the test results.
• Chapter 5 analyses and discusses the results from Chapter 4.
• Chapter 6 concludes the results of this thesis works and gives suggestionsfor possible future work.

2Theoretical Background
This chapter presents the necessary background information for this thesis re-port. Theory of the Bluetooth Low Energy architecture, Received Signal StrengthIndication (rssi), Mesh Networks and Localization Algorithms are introduced.The Bluetooth Low Energy part describes the relevant concepts of the protocolarchitecture. The rssi part describes rssi and introduces rssi distance estima-tion. The mesh network part describes core concepts regarding mesh networksand compares these concepts to star-topology networks. The localization partdescribes two localization algorithms: Fingerprinting and Trilateration.
2.1 Bluetooth Low Energy
This section gives a brief description about the fundamentals of Bluetooth LowEnergy focusing on the parts that are most relevant for this thesis work.
2.1.1 Protocol Architecture
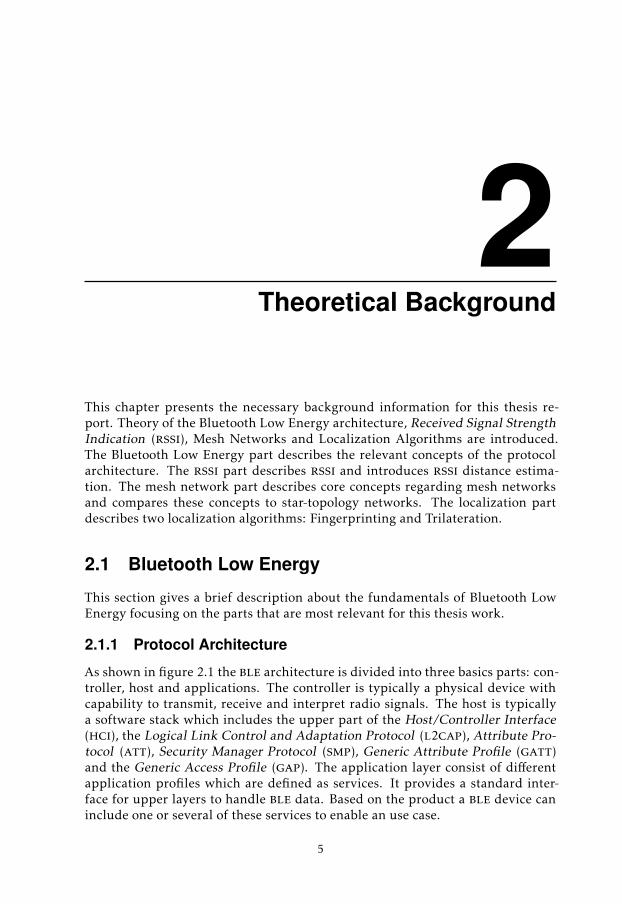
As shown in figure 2.1 the ble architecture is divided into three basics parts: con-troller, host and applications. The controller is typically a physical device withcapability to transmit, receive and interpret radio signals. The host is typicallya software stack which includes the upper part of the Host/Controller Interface(hci), the Logical Link Control and Adaptation Protocol (l2cap), Attribute Pro-tocol (att), Security Manager Protocol (smp), Generic Attribute Profile (gatt)and the Generic Access Profile (gap). The application layer consist of differentapplication profiles which are defined as services. It provides a standard inter-face for upper layers to handle ble data. Based on the product a ble device caninclude one or several of these services to enable an use case.
5
6 2 Theoretical Background
Figure 2.1: The ble Protocol Architecture
The following sections briefly describes the parts of the ble protocol architecturerelevant to this master thesis. A more detailed description of the entire protocolarchitecture can be found in [11].
Physical Layer
The bottommost layer in the ble protocol stack is the Physical Layer. It is respon-sible for using the radio antenna on the physical device to send and receive radiowaves. In ble the frequencies of the radio waves are modulated using a mod-ulation scheme called Gaussian Frequency Shift Keying (gfsk) where zero andone are represented by a positive and negative frequency deviation of 185KHzrespectively. gfsk uses Gaussian filter to make the transitions between zero andone smoother. See [11] for details about gfsk.
ble uses the 2.4GHz Industrial, Scientific and Medical frequency band for trans-mitting information. The band is divided into 40 rf channels each with a 2MHzseparation. The center frequency of channel k is given by equation (2.1).
fc = 2402 + 2k (2.1)
The rf channels are further divided into 37 data channels and three advertisingchannels. The advertising channels are used for transmitting advertising packets
2.1 Bluetooth Low Energy 7
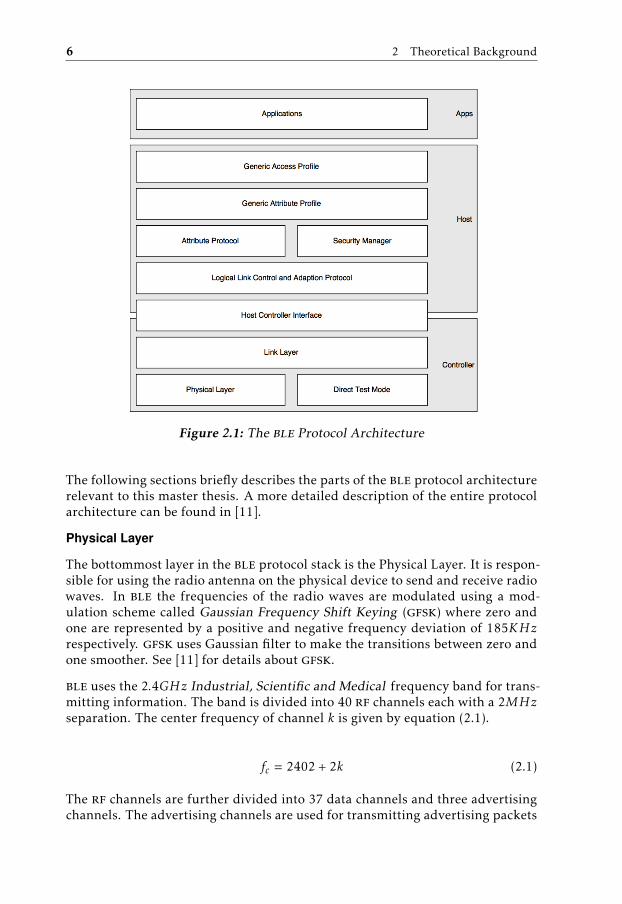
Figure 2.2: ble Radio Channels.
which allows a device to broadcast messages to all other devices within the radiopropagation range. The advertising packet is further described in section 2.1.1.The data channels are where data is transmitted once a connection between twodevices has been established.
The advertising channels are placed strategically away from significant interfer-ences such as Wi-FI access points. The selected frequencies are 2402MHz, 2426MHzand 2480MHz [11]. The data channels are placed with 2MHz intervals betweenthe advertising channels. Figure 2.2 shows the placements of of the ble rf chan-nels.
8 2 Theoretical Background
Link Layer
The Link Layer is the layer directly above the Physical Layer. It is the core of theble architecture. It is responsible for controlling the state of the radio, establish-ing and upholding connections to other devices and transmitting data.
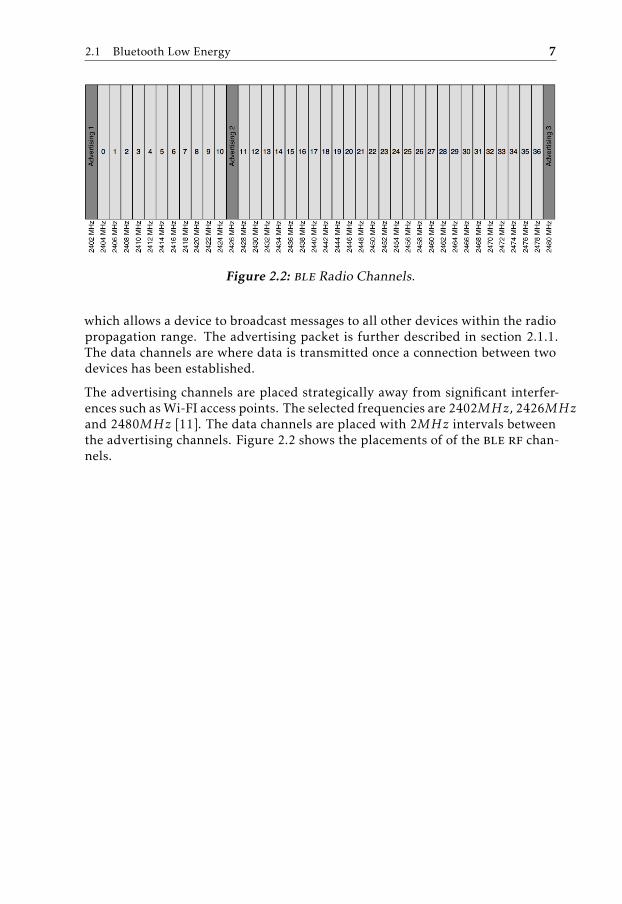
The ble Link Layer defines five states: Standby, Advertising, Scanning, Initiatingand Connected. Figure 2.3 shows how these states are related to each other. A bledevice can choose to support only a subset of the state machines. This is usefulfor example in a device which purpose is to broadcast sensor data to be treatedby other devices. This device does not need to receive any data and therefore itdoes not need to support the Scanning, Initiating and Connected states.
Figure 2.3: Link Layer state machine
The Standby state is the state when the device is idle. This state can be enteredfrom every other state.
The Advertising state is the state that allows the Link Layer to transmit advertis-ment packets. A device that wants to be discoverable or connectable is requiredto implement the Advertising state. A device in the Advertising state can moveto the Connected state if it receives a connection request packet from the a devicethat is in the Initiating state. It can also move to the Standby state if it stops ad-vertising. A device in the Advertising state can also receive and respond to scanrequests from a device in the active Scanning state. A device in the Advertisingstate is called an Advertiser.
In the Scanning state a device will receive advertising packets on the advertisingchannels. This could for example be used to listen for devices that are advertisingin the area. There are two scanning modes in the Scanning state: Active scanning
2.1 Bluetooth Low Energy 9
and passive scanning. Passive scanning only receives advertising packets. Activescanning can also send scan requests to advertising devices and receive a scanresponse with additional data. A device in the Scanning state can only move tothe Standby state if it stops scanning. A device in the scanning state is called anObserver.
To initiate a connection to another device the device needs to be in the Initiatingstate. In this state the device uses its receiver to listen for the device which itwants to establish a connection to. If it receives an advertising packet from thisdevice it will send a connection request to the Advertiser and then move into theConnected state. A device in the Initiating state is called an Initiator.
The Connected state is entered via either the Advertising state or the Initiat-ing state. This is the only state that uses the data channels. When two devicesare in the Connected state they can exchange data packets on a data channelchoosen by some pre-defined frequency hopping algorithm [11]. The initiatingdevice is the master and the advertising device is the slave in data transmissionsin theConnected state. A device can only leave the Connected state by terminat-ing the connection and moving to the Standby state.
Host/Controller Interface
Host/Controller Interface (hci) is the interface responsible for communicationbetween the controller layer and the higher layers. The host and controller can beimplemented either on separate chips or on the same chip. Large devices such asmobile phones typically communicate with a controller chip through a transportinterface such as SDIO, UART or USB. In the case of low power sensors the hciis usually not used since everything is integrated into a single chip.
Packets
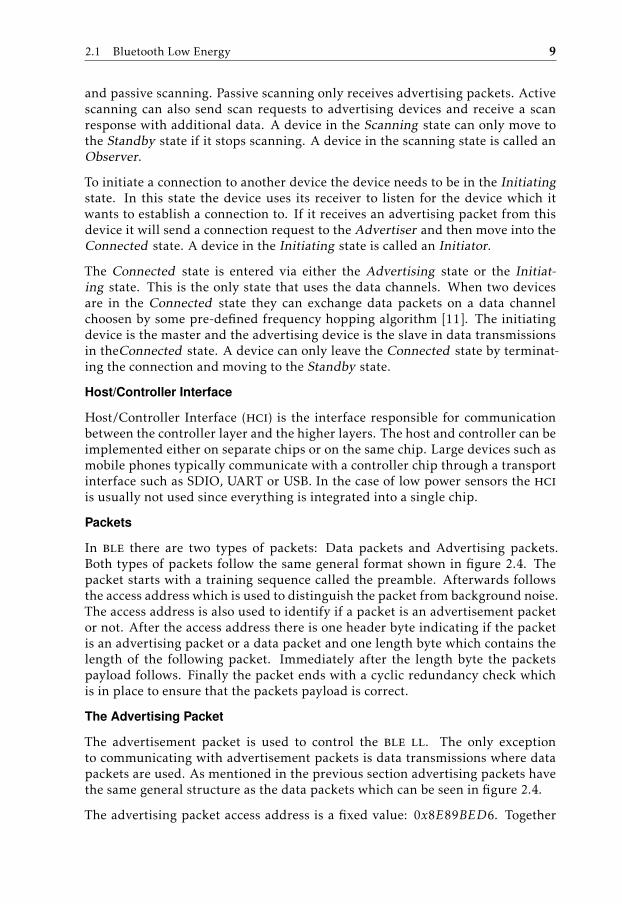
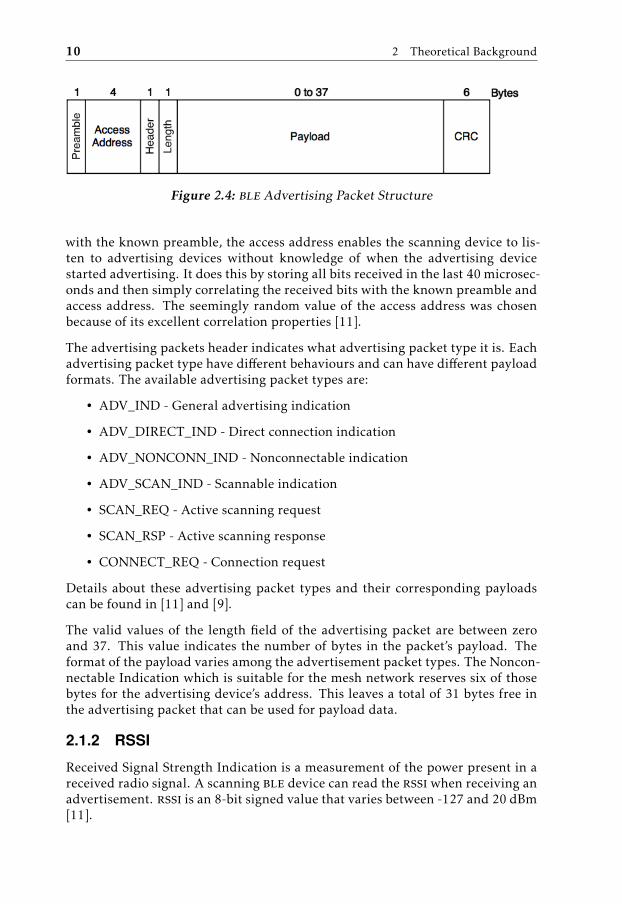
In ble there are two types of packets: Data packets and Advertising packets.Both types of packets follow the same general format shown in figure 2.4. Thepacket starts with a training sequence called the preamble. Afterwards followsthe access address which is used to distinguish the packet from background noise.The access address is also used to identify if a packet is an advertisement packetor not. After the access address there is one header byte indicating if the packetis an advertising packet or a data packet and one length byte which contains thelength of the following packet. Immediately after the length byte the packetspayload follows. Finally the packet ends with a cyclic redundancy check whichis in place to ensure that the packets payload is correct.
The Advertising Packet
The advertisement packet is used to control the ble ll. The only exceptionto communicating with advertisement packets is data transmissions where datapackets are used. As mentioned in the previous section advertising packets havethe same general structure as the data packets which can be seen in figure 2.4.
The advertising packet access address is a fixed value: 0x8E89BED6. Together
10 2 Theoretical Background
Figure 2.4: ble Advertising Packet Structure
with the known preamble, the access address enables the scanning device to lis-ten to advertising devices without knowledge of when the advertising devicestarted advertising. It does this by storing all bits received in the last 40 microsec-onds and then simply correlating the received bits with the known preamble andaccess address. The seemingly random value of the access address was chosenbecause of its excellent correlation properties [11].
The advertising packets header indicates what advertising packet type it is. Eachadvertising packet type have different behaviours and can have different payloadformats. The available advertising packet types are:
• ADV_IND - General advertising indication
• ADV_DIRECT_IND - Direct connection indication
• ADV_NONCONN_IND - Nonconnectable indication
• ADV_SCAN_IND - Scannable indication
• SCAN_REQ - Active scanning request
• SCAN_RSP - Active scanning response
• CONNECT_REQ - Connection request
Details about these advertising packet types and their corresponding payloadscan be found in [11] and [9].
The valid values of the length field of the advertising packet are between zeroand 37. This value indicates the number of bytes in the packet’s payload. Theformat of the payload varies among the advertisement packet types. The Noncon-nectable Indication which is suitable for the mesh network reserves six of thosebytes for the advertising device’s address. This leaves a total of 31 bytes free inthe advertising packet that can be used for payload data.
2.1.2 RSSI
Received Signal Strength Indication is a measurement of the power present in areceived radio signal. A scanning ble device can read the rssi when receiving anadvertisement. rssi is an 8-bit signed value that varies between -127 and 20 dBm[11].
2.1 Bluetooth Low Energy 11
The rssi decreases with increased distance from the advertising device. Thismeans that rssi can be used to estimate the distance between two devices. Therelation between the distance d and rssi can be approximated by equation (2.2)assuming a Log-pathloss model [12]. Here n is a constant depending on the en-vironment where the devices are deployed and A0 is the rssi value measured atdistance d0.
RSSI = −10n log10(dd0
) + A0 (2.2)
By taking d0 = 1 and rewriting equation (2.2) we get the expression for the dis-tance in equation 2.3.
d = 10A0−RSSI
10n (2.3)
This expression for estimating the distance requires a method to decide the valuesof A0 and n. With d0 = 1 A0 is the rssi value measured in the receiving deviceat one meter from the the advertising device. The value of n has to be decidedexperimentally. Equation 2.2 can be used to get a value for n by first measuringthe rssi at a known distance from the advertising device. Repeat this for severaldistances and take n as the average of all those solutions.
Filtering
One common problem when using rssi is that the measurements often are verynoisy with large peak values that are outliers from the rest [2]. It has also beenquestioned if rssi is too unreliable to be of any use at all in indoor localizationsystems [13]. The noisy measurements makes it very difficult to get accuratedistance estimations which in turn leads to reduced localization accuracy. Toimprove the accuracy, it is desirable to filter as much of the noise as possible. Inthis section two different methods of rssi filtering are discussed.
The simplest way to remove some of the noise is to average over several measure-ments. This neglects the effect that outliers have on the measured value. Seeequation (2.4), where N is the number of available rssi samples. If there areseveral outliers of large magnitude the average can be skewed over time. Thispossibly leads to subsequent incoming values being worse than if the rssi valueswere unfiltered.
RSSIavg =1N
N−1∑i=0
RSSIi (2.4)
Another way to filter noisy values is to use a Kalman filter. More details about theKalman filter can be found in [14]. Compared to an averaging filter the Kalmanfilter can perform better because it also takes the magnitude of the rssi samples
12 2 Theoretical Background
into consideration. The Kalman filter weighs the size of the previous samplesagainst the size of each new sample that passes the filter. rssi is one-dimensionaland not affected by any input that can be controlled by software. This means thata one dimensional simplification of the Kalman filter is sufficient for this thesis.A simple explanation of a one-dimensional Kalman filter can be found in [12].
2.2 Mesh Network
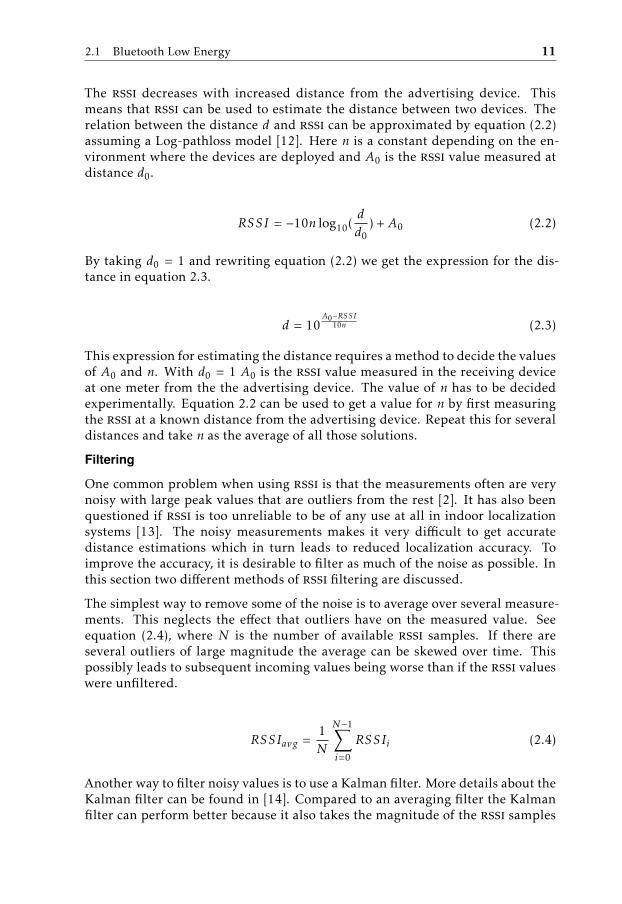
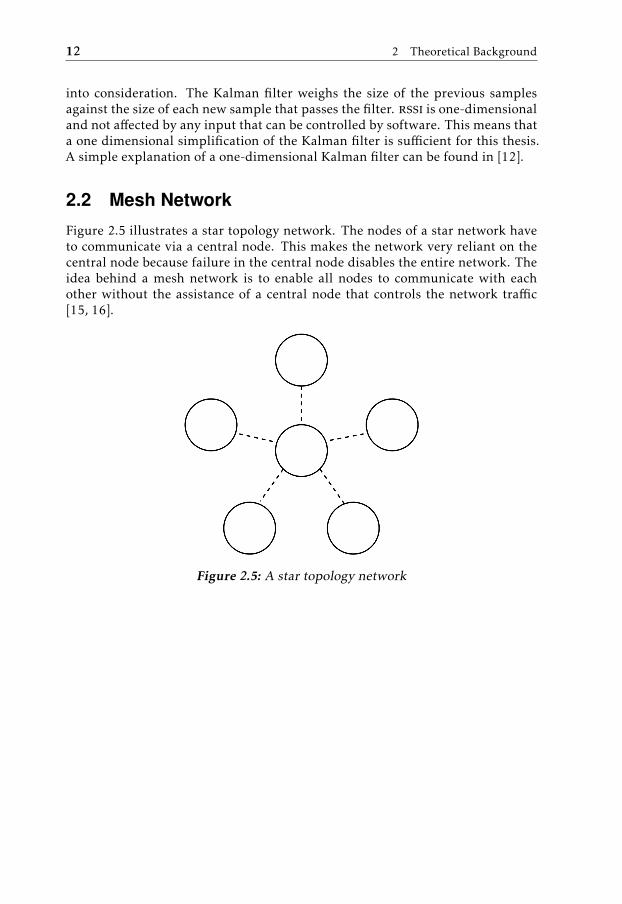
Figure 2.5 illustrates a star topology network. The nodes of a star network haveto communicate via a central node. This makes the network very reliant on thecentral node because failure in the central node disables the entire network. Theidea behind a mesh network is to enable all nodes to communicate with eachother without the assistance of a central node that controls the network traffic[15, 16].
Figure 2.5: A star topology network
2.2 Mesh Network 13
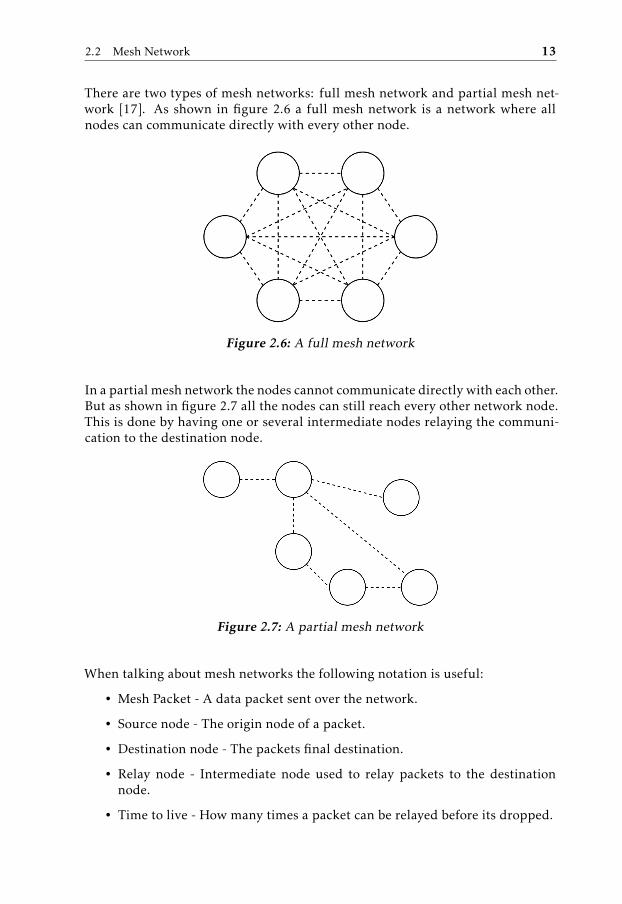
There are two types of mesh networks: full mesh network and partial mesh net-work [17]. As shown in figure 2.6 a full mesh network is a network where allnodes can communicate directly with every other node.
Figure 2.6: A full mesh network
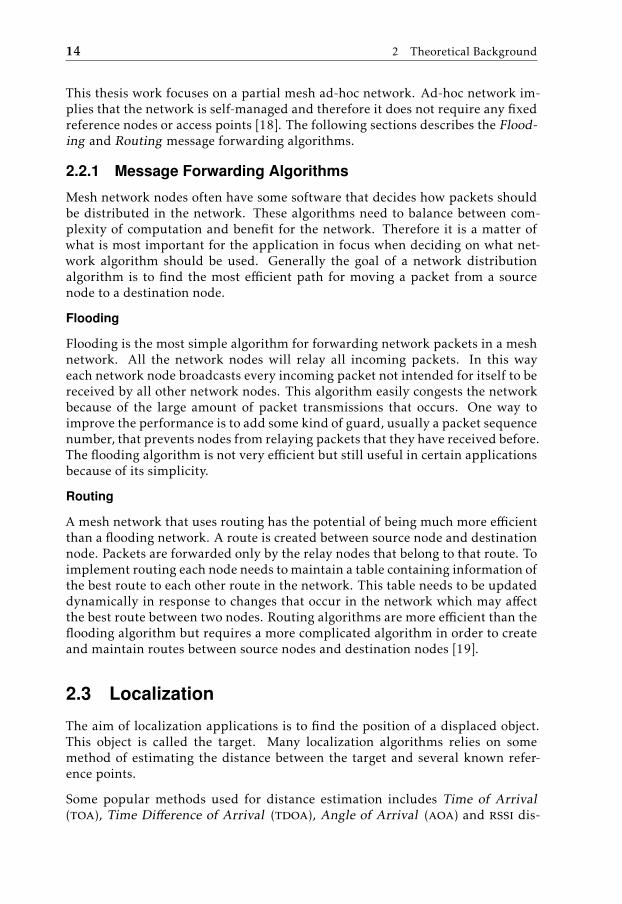
In a partial mesh network the nodes cannot communicate directly with each other.But as shown in figure 2.7 all the nodes can still reach every other network node.This is done by having one or several intermediate nodes relaying the communi-cation to the destination node.
Figure 2.7: A partial mesh network
When talking about mesh networks the following notation is useful:
• Mesh Packet - A data packet sent over the network.
• Source node - The origin node of a packet.
• Destination node - The packets final destination.
• Relay node - Intermediate node used to relay packets to the destinationnode.
• Time to live - How many times a packet can be relayed before its dropped.
14 2 Theoretical Background
This thesis work focuses on a partial mesh ad-hoc network. Ad-hoc network im-plies that the network is self-managed and therefore it does not require any fixedreference nodes or access points [18]. The following sections describes the Flood-ing and Routing message forwarding algorithms.
2.2.1 Message Forwarding Algorithms
Mesh network nodes often have some software that decides how packets shouldbe distributed in the network. These algorithms need to balance between com-plexity of computation and benefit for the network. Therefore it is a matter ofwhat is most important for the application in focus when deciding on what net-work algorithm should be used. Generally the goal of a network distributionalgorithm is to find the most efficient path for moving a packet from a sourcenode to a destination node.
Flooding
Flooding is the most simple algorithm for forwarding network packets in a meshnetwork. All the network nodes will relay all incoming packets. In this wayeach network node broadcasts every incoming packet not intended for itself to bereceived by all other network nodes. This algorithm easily congests the networkbecause of the large amount of packet transmissions that occurs. One way toimprove the performance is to add some kind of guard, usually a packet sequencenumber, that prevents nodes from relaying packets that they have received before.The flooding algorithm is not very efficient but still useful in certain applicationsbecause of its simplicity.
Routing
A mesh network that uses routing has the potential of being much more efficientthan a flooding network. A route is created between source node and destinationnode. Packets are forwarded only by the relay nodes that belong to that route. Toimplement routing each node needs to maintain a table containing information ofthe best route to each other route in the network. This table needs to be updateddynamically in response to changes that occur in the network which may affectthe best route between two nodes. Routing algorithms are more efficient than theflooding algorithm but requires a more complicated algorithm in order to createand maintain routes between source nodes and destination nodes [19].
2.3 Localization
The aim of localization applications is to find the position of a displaced object.This object is called the target. Many localization algorithms relies on somemethod of estimating the distance between the target and several known refer-ence points.
Some popular methods used for distance estimation includes Time of Arrival(toa), Time Difference of Arrival (tdoa), Angle of Arrival (aoa) and rssi dis-
2.3 Localization 15
tance estimation [20, 4]. All of these are interesting candidates for indoor local-ization. However the ble Link Layer does not support time synchronization [9]which makes toa and tdoa impossible to use in a ble localization system.
Another interesting candidate algorithm is aoa which requires the reference de-vice to know the angle from the incoming rf signal. The ble devices used inthis thesis does not support angle of arrival measurements and therefore the aoaalgorithms will also be excluded. This leaves rssi as the only quantity that canbe used for indoor localization with ble. Two algorithms which utilize rssi fromthe target object to the reference points are described in the sections below: Trilat-eration and Fingerprinting. Trilateration uses rssi distance estimation to localizethe target. See section 2.1.2 for details about rssi distance estimation. Finger-printing also relies on rssi measurements from the target object in the referencepoints but does not require distance estimation.
2.3.1 Trilateration
The trilateration algorithm needs three fixed reference points and the distancefrom the target object to these reference points [21]. In the mesh network used inthis thesis these reference points are the mesh relay nodes and the target objectis the tag.
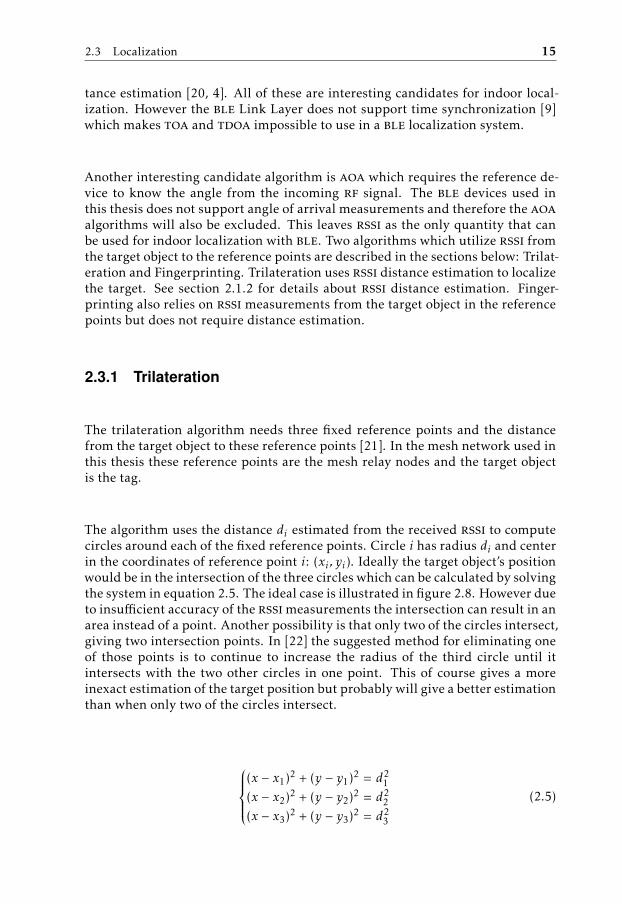
The algorithm uses the distance di estimated from the received rssi to computecircles around each of the fixed reference points. Circle i has radius di and centerin the coordinates of reference point i: (xi , yi). Ideally the target object’s positionwould be in the intersection of the three circles which can be calculated by solvingthe system in equation 2.5. The ideal case is illustrated in figure 2.8. However dueto insufficient accuracy of the rssimeasurements the intersection can result in anarea instead of a point. Another possibility is that only two of the circles intersect,giving two intersection points. In [22] the suggested method for eliminating oneof those points is to continue to increase the radius of the third circle until itintersects with the two other circles in one point. This of course gives a moreinexact estimation of the target position but probably will give a better estimationthan when only two of the circles intersect.
(x − x1)2 + (y − y1)2 = d2
1(x − x2)2 + (y − y2)2 = d2
2(x − x3)2 + (y − y3)2 = d2
3
(2.5)
16 2 Theoretical Background
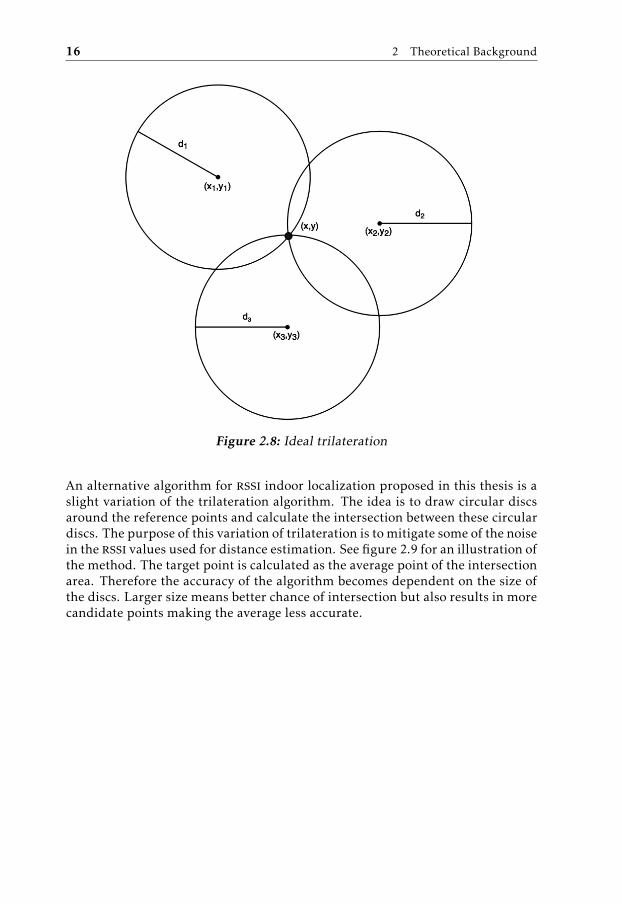
Figure 2.8: Ideal trilateration
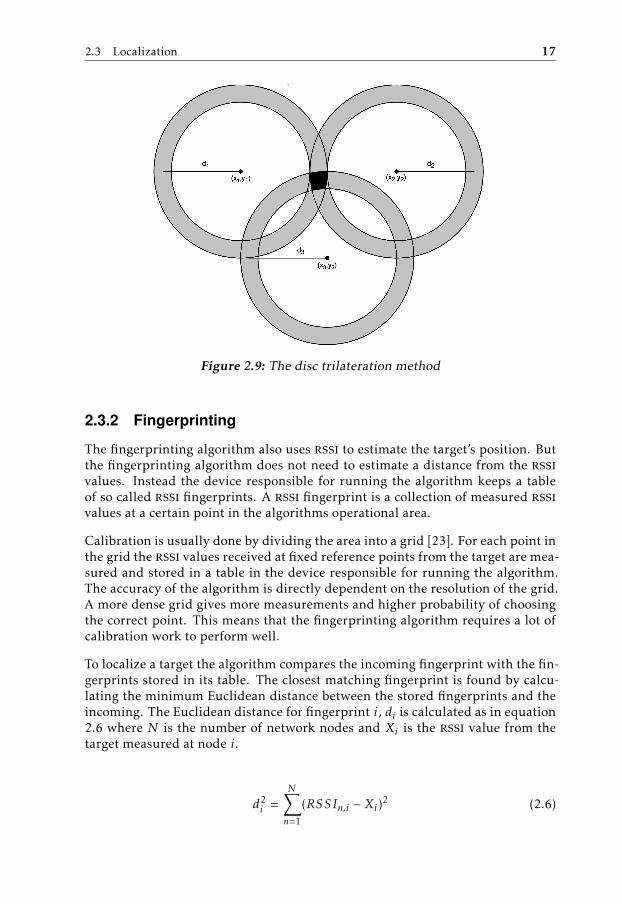
An alternative algorithm for rssi indoor localization proposed in this thesis is aslight variation of the trilateration algorithm. The idea is to draw circular discsaround the reference points and calculate the intersection between these circulardiscs. The purpose of this variation of trilateration is to mitigate some of the noisein the rssi values used for distance estimation. See figure 2.9 for an illustration ofthe method. The target point is calculated as the average point of the intersectionarea. Therefore the accuracy of the algorithm becomes dependent on the size ofthe discs. Larger size means better chance of intersection but also results in morecandidate points making the average less accurate.
2.3 Localization 17
Figure 2.9: The disc trilateration method
2.3.2 Fingerprinting
The fingerprinting algorithm also uses rssi to estimate the target’s position. Butthe fingerprinting algorithm does not need to estimate a distance from the rssivalues. Instead the device responsible for running the algorithm keeps a tableof so called rssi fingerprints. A rssi fingerprint is a collection of measured rssivalues at a certain point in the algorithms operational area.
Calibration is usually done by dividing the area into a grid [23]. For each point inthe grid the rssi values received at fixed reference points from the target are mea-sured and stored in a table in the device responsible for running the algorithm.The accuracy of the algorithm is directly dependent on the resolution of the grid.A more dense grid gives more measurements and higher probability of choosingthe correct point. This means that the fingerprinting algorithm requires a lot ofcalibration work to perform well.
To localize a target the algorithm compares the incoming fingerprint with the fin-gerprints stored in its table. The closest matching fingerprint is found by calcu-lating the minimum Euclidean distance between the stored fingerprints and theincoming. The Euclidean distance for fingerprint i, di is calculated as in equation2.6 where N is the number of network nodes and Xi is the rssi value from thetarget measured at node i.
d2i =
N∑n=1
(RSSIn,i − Xi)2 (2.6)
18 2 Theoretical Background
The resulting target fingerprint fi is given by equation 2.7 where F is the set ofstored fingerprints.
fi = arg mini∈F
di (2.7)
After deciding what fingerprint is closest to the current target’s rssi values the po-sition can be decided by mapping the fingerprint in the table to its correspondingposition.
K-Nearest Neighbours
One way to improve the fingerprinting algorithm is K-Nearest Neighbours finger-printing (KNN) as suggested in [24]. Instead of taking only the closest matchingfingerprint for getting the target position several points can be used. By usingseveral points the impact of noise is reduced, as the risk of having measurementsfailing in one position is mitigated by having several positions. The simplest ver-sion of KNN fingerprinting is to estimate the target point to be the average ofthe K closest points. The algorithm suggested in [24] further improves on this bycalculating a weighted average based on how close the fingerprint match is foreach of the K nearest neighbours. A good value for K has to be decided experi-mentally but it is often chosen to be approximately in order of the square root ofthe number of data points.
3System design
This chapter starts from a brief description of the hardware utilized in the de-veloped localization system. The implemented blemesh protocol architecture isdescribed and a blemesh packet is defined. The network layer features transmis-sion of mesh packets using flooding.
Design and implementation of two application layer use cases that rely on themesh network are described. These are indoor localization and ad-hoc deploy-ment of mesh network nodes.
3.1 Hardware
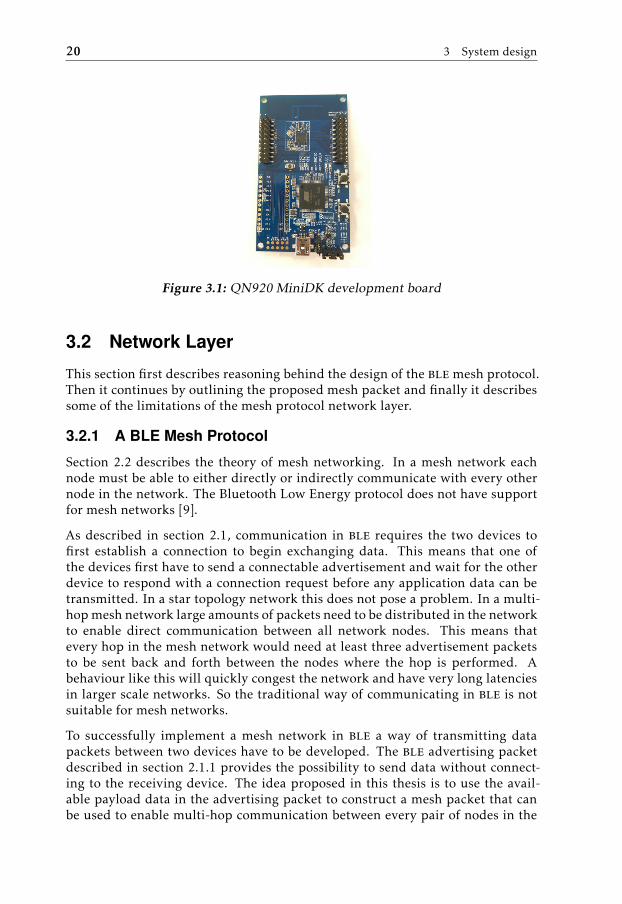
The system consists of two main hardware components. Quintic QN9020 MiniDKdevelopment boards, shown in figure 3.1, and an Android smartphone. The de-velopment boards support both the advertising and scanning states of the bleprotocol stack. The minimum required Android version is Android 5.0 which isthe earliest release that supports ble advertising [25]. The smartphone needs tosupport both ble scanning and advertising states in order to be fully functional.
19
20 3 System design
Figure 3.1: QN920 MiniDK development board
3.2 Network Layer
This section first describes reasoning behind the design of the blemesh protocol.Then it continues by outlining the proposed mesh packet and finally it describessome of the limitations of the mesh protocol network layer.
3.2.1 A BLE Mesh Protocol
Section 2.2 describes the theory of mesh networking. In a mesh network eachnode must be able to either directly or indirectly communicate with every othernode in the network. The Bluetooth Low Energy protocol does not have supportfor mesh networks [9].
As described in section 2.1, communication in ble requires the two devices tofirst establish a connection to begin exchanging data. This means that one ofthe devices first have to send a connectable advertisement and wait for the otherdevice to respond with a connection request before any application data can betransmitted. In a star topology network this does not pose a problem. In a multi-hop mesh network large amounts of packets need to be distributed in the networkto enable direct communication between all network nodes. This means thatevery hop in the mesh network would need at least three advertisement packetsto be sent back and forth between the nodes where the hop is performed. Abehaviour like this will quickly congest the network and have very long latenciesin larger scale networks. So the traditional way of communicating in ble is notsuitable for mesh networks.
To successfully implement a mesh network in ble a way of transmitting datapackets between two devices have to be developed. The ble advertising packetdescribed in section 2.1.1 provides the possibility to send data without connect-ing to the receiving device. The idea proposed in this thesis is to use the avail-able payload data in the advertising packet to construct a mesh packet that canbe used to enable multi-hop communication between every pair of nodes in the
3.2 Network Layer 21
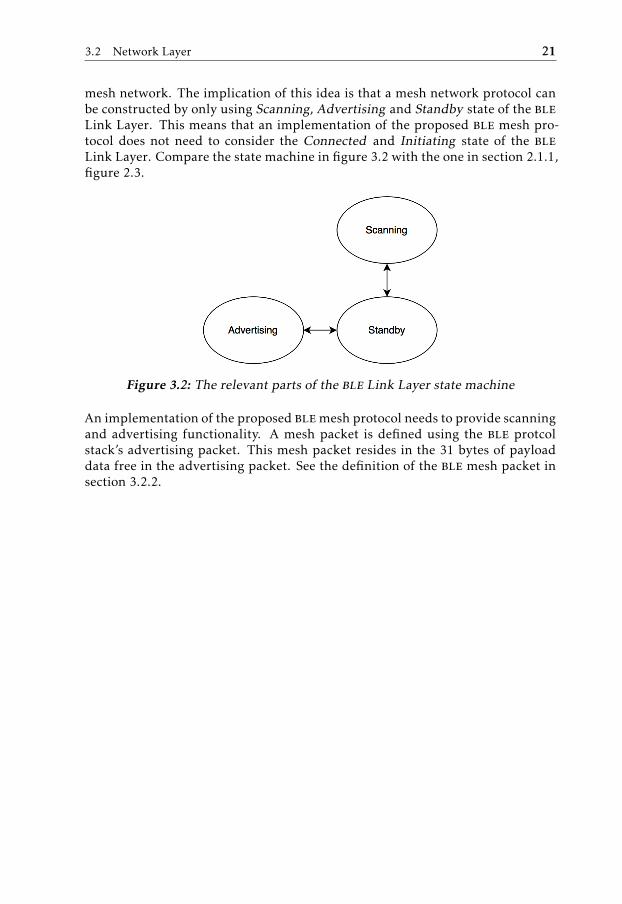
mesh network. The implication of this idea is that a mesh network protocol canbe constructed by only using Scanning, Advertising and Standby state of the bleLink Layer. This means that an implementation of the proposed ble mesh pro-tocol does not need to consider the Connected and Initiating state of the bleLink Layer. Compare the state machine in figure 3.2 with the one in section 2.1.1,figure 2.3.
Figure 3.2: The relevant parts of the ble Link Layer state machine
An implementation of the proposed blemesh protocol needs to provide scanningand advertising functionality. A mesh packet is defined using the ble protcolstack’s advertising packet. This mesh packet resides in the 31 bytes of payloaddata free in the advertising packet. See the definition of the ble mesh packet insection 3.2.2.

22 3 System design
3.2.2 Mesh Packet Format
The proposed mesh packet format uses all 31 available bytes in the ble Adver-tisement Packet and the different fields are listed in table 3.1.
Table 3.1: Mesh packet structure
Name Description Bytes
Length Packet length 1
Advertisement Type Advertisement type 1
Manufacturer ID Device specific ID 2
Sequence Number Message sequence number 3
Source Address Packet source address 2
Destination Address Packet destination address 2
Operation Code Application Layer Operation Code 2
Parameters Application parameters 0-6
Application Mac Application MAC address 5
Time to Live Number of hops the packet has left 1
Network Mac Network MAC address 4
Via address Address of last device the packet passed 2
Manufacturer ID
The Manufacturer ID is an unique company identifier that companies can acquirefrom the Bluetooth SIG. This field is of no use to the proposed blemesh protocolbut is included because it is mandatory in the Android ble advertising API whichwas used to implement the ble central device.
Sequence Number
This field is a serial number for each packet. Its purpose is to prevent the samepacket to be processed twice by a receiving device.
Operation Code
These two bytes are used as an ID identifying a specific operation in the meshprotocol stack.
Parameters
There are six bytes available for optional application layer parameters. These areparameters corresponding to the application defined by the packet’s OperationCode.
3.3 Application Layer 23
Application MAC and Network MAC
The purpose of these fields is to provide an integrity check of mesh packets inthe application layer respectively the network layer. In the current implementa-tion these fields are unused and functions as place-holders for potential futureapplications.
Time to Live
This field indicates how many hops in the network the packet has left before itstops being relayed. Each hop decreases the time to live by one.
Via Address
This is the address of the previous device that relay the packet. Its primary pur-pose is for debugging. Each mesh relay node contain a filter deciding what sourcenode it can receive mesh packet from. The via address enables the mesh relaynode to forward messages from nodes that itself can not receive messages from.
3.2.3 Network Layer Limitations
When several devices sends a packet to the same device simultaneously collisionsmight occur because the receiving device can only treat one packet at a time. Thisposes to be a problem in some applications. The suggested solution for avoid-ing collisions is to add a random delay in the transmission of application layermessages where the risk of collisions are high. For example the localization ap-plication described in section 3.3 implements a random delay in the localizationresponse function.
3.3 Application Layer
The Application Layer is built upon the Network Layer and provides the local-ization functionality. In this thesis work two different use cases that both rely onlocalization have been implemented in the application layer.
The first use case is simple tag localization. The user of the application can usea smartphone to find a ble mesh-enabled tag and display its whereabouts on amap on the phone.
The second use case is ad-hoc deployment of mesh relay nodes. The user candeploy a mesh relay node at any physical location and it will automatically col-laborate with the central unit to find its own position and install itself into thenetwork. After it has been installed it can be used for localization in the sameway as all the other mesh relay nodes.
The core localization functionality that enables both of these use cases supportstwo different localization algorithms, Trilateration and Fingerprinting. Both ofthese algorithms are based on distance estimation from rssi values measuredfrom fixed position mesh relay nodes. The algorithms are evaluated and com-
24 3 System design
pared in chapter 5. Background theory behind the different algorithms can befound in section 2.3.
The system consists of three different components, the central unit, the mesh re-lay nodes and the tag. The following sections first give an overview of the systemwith all the components together. Then it continues by detailing the functional-ity of each of the individual components. After that the implementations of thedifferent localization algorithms in the central unit are described. Finally it de-tails some of the application layer enhancements that have been made to improveapplication performance.
3.3.1 Application Layer Overview
The application layer can be divided into two main parts, the mesh network andthe central unit. The mesh network consists of the mesh relay nodes and the tagand is responsible for all mesh network messaging. The central unit acts as aninterface from where the user can communicate with the mesh network. In thisthesis project the central unit is responsible for handling most of the applicationlayer logic.
The mesh network application layer provides the following functionalities:
• Messaging that enables localization.
• Messaging that enables ad-hoc self-deployment.
• Software state machine for mesh relay node.
• Software state machine for tag.
• RSSI filtering.
The central unit application layer provides the following functionalities:
• Mesh message handler.
• Tag localization functionality.
• Ad-hoc self-deployment functionality.
• Positioning algorithm design.
The following sections describe the functionalities mentioned above.
Localization Messaging
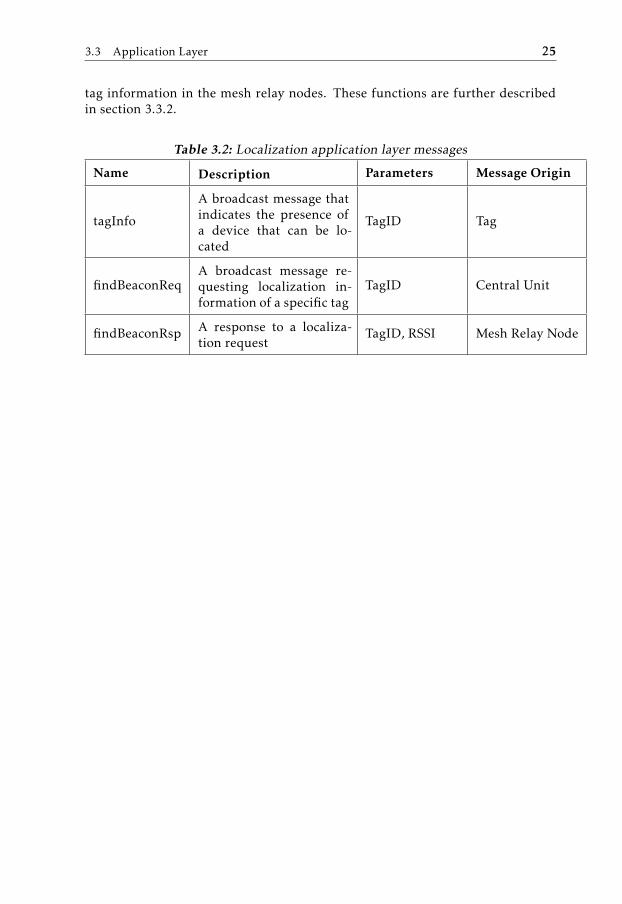
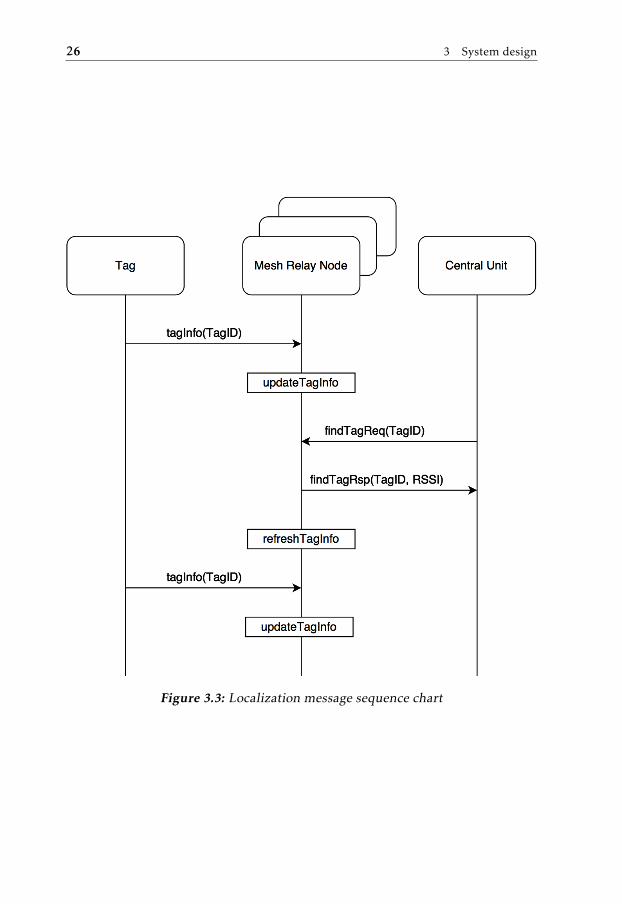
Table 3.2 lists the mesh messages that are used to implement the localizationfunctionality in the system. First the central unit broadcasts a request to all themesh relay nodes that it wants to find a certain tag. Then all mesh relay nodesthat have information about that tag sends a response to the central unit. Finallythe central unit uses that information to calculate the position of the tag. Figure3.3 shows a message sequence chart for the localization functionality. The func-tions updateBeaconInfo and refreshBeaconInfo are used to maintain a table of
3.3 Application Layer 25
tag information in the mesh relay nodes. These functions are further describedin section 3.3.2.
Table 3.2: Localization application layer messages
Name Description Parameters Message Origin
tagInfo
A broadcast message thatindicates the presence ofa device that can be lo-cated
TagID Tag
findBeaconReqA broadcast message re-questing localization in-formation of a specific tag
TagID Central Unit
findBeaconRsp A response to a localiza-tion request
TagID, RSSI Mesh Relay Node
26 3 System design
Figure 3.3: Localization message sequence chart
3.3 Application Layer 27
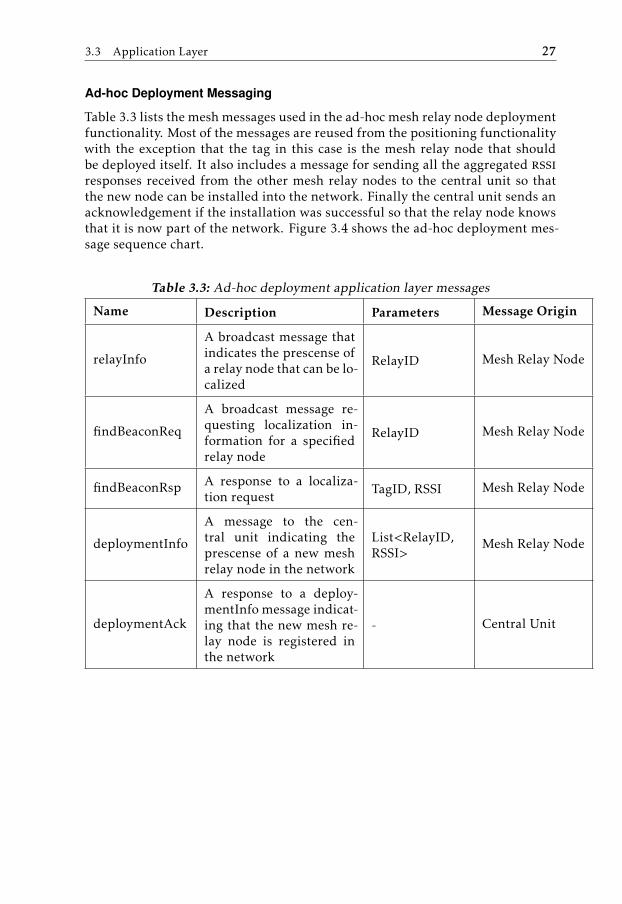
Ad-hoc Deployment Messaging
Table 3.3 lists the mesh messages used in the ad-hoc mesh relay node deploymentfunctionality. Most of the messages are reused from the positioning functionalitywith the exception that the tag in this case is the mesh relay node that shouldbe deployed itself. It also includes a message for sending all the aggregated rssiresponses received from the other mesh relay nodes to the central unit so thatthe new node can be installed into the network. Finally the central unit sends anacknowledgement if the installation was successful so that the relay node knowsthat it is now part of the network. Figure 3.4 shows the ad-hoc deployment mes-sage sequence chart.
Table 3.3: Ad-hoc deployment application layer messages
Name Description Parameters Message Origin
relayInfo
A broadcast message thatindicates the prescense ofa relay node that can be lo-calized
RelayID Mesh Relay Node
findBeaconReq
A broadcast message re-questing localization in-formation for a specifiedrelay node
RelayID Mesh Relay Node
findBeaconRsp A response to a localiza-tion request
TagID, RSSI Mesh Relay Node
deploymentInfo
A message to the cen-tral unit indicating theprescense of a new meshrelay node in the network
List<RelayID,RSSI>
Mesh Relay Node
deploymentAck
A response to a deploy-mentInfo message indicat-ing that the new mesh re-lay node is registered inthe network
- Central Unit
28 3 System design
Figure 3.4: Ad-hoc deployment message sequence chart
3.3.2 Application Layer Components
This section describes the implementation of the three different components thatare included in the system in detail.
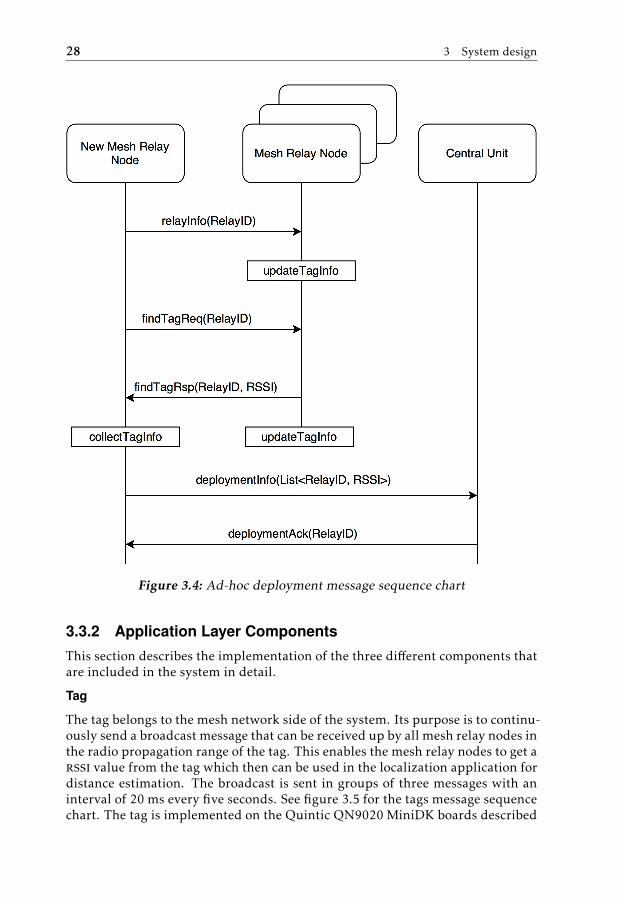
Tag
The tag belongs to the mesh network side of the system. Its purpose is to continu-ously send a broadcast message that can be received up by all mesh relay nodes inthe radio propagation range of the tag. This enables the mesh relay nodes to get arssi value from the tag which then can be used in the localization application fordistance estimation. The broadcast is sent in groups of three messages with aninterval of 20 ms every five seconds. See figure 3.5 for the tags message sequencechart. The tag is implemented on the Quintic QN9020 MiniDK boards described
3.3 Application Layer 29
in section 3.1.
Figure 3.5: Tag message sequence chart
Mesh Relay Node
The mesh relay nodes are deployed in fixed physical positions in the network.They act as reference points that can be used in localization applications. Theresponsibilities of an installed mesh relay node are:
• Listening to tag/relay information broadcast messages.
• Removing expired tag/relay information from its memory.
• Responding to localization requests.
The mesh relay node have support for rssi calibration as mentioned in section3.3.4. It also provides the ad-hoc deployment functionality described in section3.3. The mesh relay nodes are implemented on the Quintic QN9020 MiniDKboards described in section 3.1. Figure 3.6 shows the mesh relay nodes state ma-chine. State transitions are triggered by external actions in the form of incomingmesh packets or button presses on the physical device.
The Mesh Relay Node state machine
30 3 System design
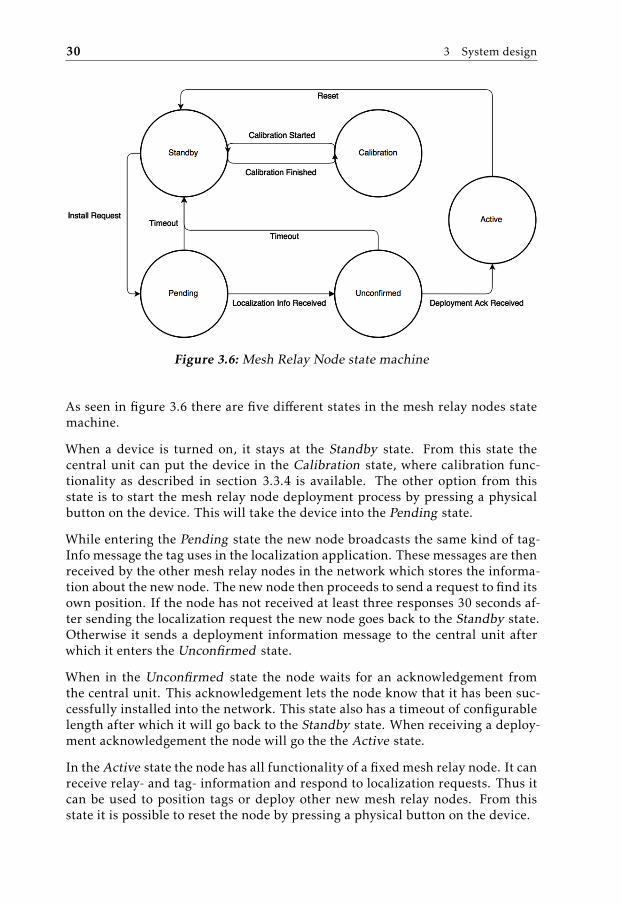
Figure 3.6: Mesh Relay Node state machine
As seen in figure 3.6 there are five different states in the mesh relay nodes statemachine.
When a device is turned on, it stays at the Standby state. From this state thecentral unit can put the device in the Calibration state, where calibration func-tionality as described in section 3.3.4 is available. The other option from thisstate is to start the mesh relay node deployment process by pressing a physicalbutton on the device. This will take the device into the Pending state.
While entering the Pending state the new node broadcasts the same kind of tag-Info message the tag uses in the localization application. These messages are thenreceived by the other mesh relay nodes in the network which stores the informa-tion about the new node. The new node then proceeds to send a request to find itsown position. If the node has not received at least three responses 30 seconds af-ter sending the localization request the new node goes back to the Standby state.Otherwise it sends a deployment information message to the central unit afterwhich it enters the Unconfirmed state.
When in the Unconfirmed state the node waits for an acknowledgement fromthe central unit. This acknowledgement lets the node know that it has been suc-cessfully installed into the network. This state also has a timeout of configurablelength after which it will go back to the Standby state. When receiving a deploy-ment acknowledgement the node will go the the Active state.
In the Active state the node has all functionality of a fixed mesh relay node. It canreceive relay- and tag- information and respond to localization requests. Thus itcan be used to position tags or deploy other new mesh relay nodes. From thisstate it is possible to reset the node by pressing a physical button on the device.
3.3 Application Layer 31
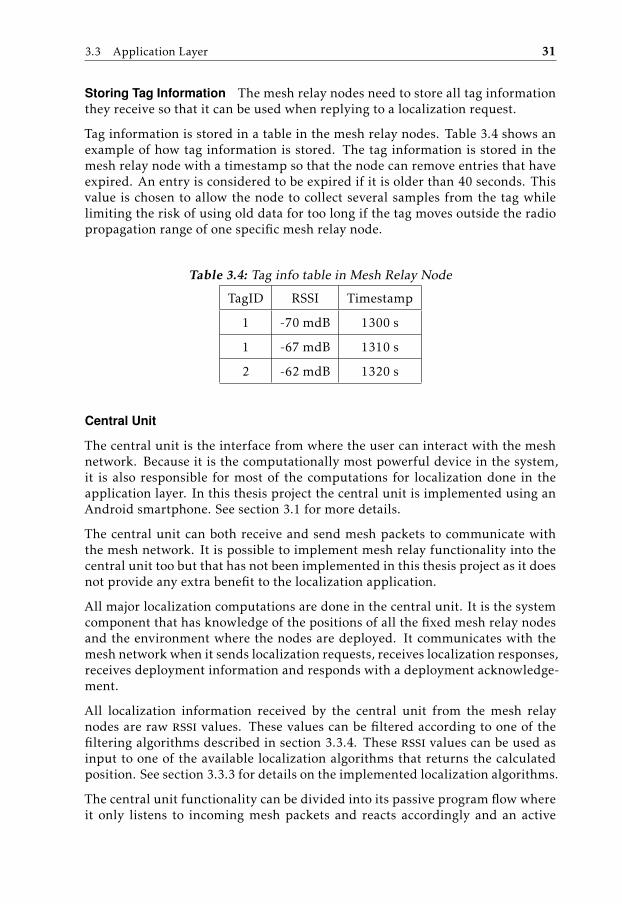
Storing Tag Information The mesh relay nodes need to store all tag informationthey receive so that it can be used when replying to a localization request.
Tag information is stored in a table in the mesh relay nodes. Table 3.4 shows anexample of how tag information is stored. The tag information is stored in themesh relay node with a timestamp so that the node can remove entries that haveexpired. An entry is considered to be expired if it is older than 40 seconds. Thisvalue is chosen to allow the node to collect several samples from the tag whilelimiting the risk of using old data for too long if the tag moves outside the radiopropagation range of one specific mesh relay node.
Table 3.4: Tag info table in Mesh Relay Node
TagID RSSI Timestamp
1 -70 mdB 1300 s
1 -67 mdB 1310 s
2 -62 mdB 1320 s
Central Unit
The central unit is the interface from where the user can interact with the meshnetwork. Because it is the computationally most powerful device in the system,it is also responsible for most of the computations for localization done in theapplication layer. In this thesis project the central unit is implemented using anAndroid smartphone. See section 3.1 for more details.
The central unit can both receive and send mesh packets to communicate withthe mesh network. It is possible to implement mesh relay functionality into thecentral unit too but that has not been implemented in this thesis project as it doesnot provide any extra benefit to the localization application.
All major localization computations are done in the central unit. It is the systemcomponent that has knowledge of the positions of all the fixed mesh relay nodesand the environment where the nodes are deployed. It communicates with themesh network when it sends localization requests, receives localization responses,receives deployment information and responds with a deployment acknowledge-ment.
All localization information received by the central unit from the mesh relaynodes are raw rssi values. These values can be filtered according to one of thefiltering algorithms described in section 3.3.4. These rssi values can be used asinput to one of the available localization algorithms that returns the calculatedposition. See section 3.3.3 for details on the implemented localization algorithms.
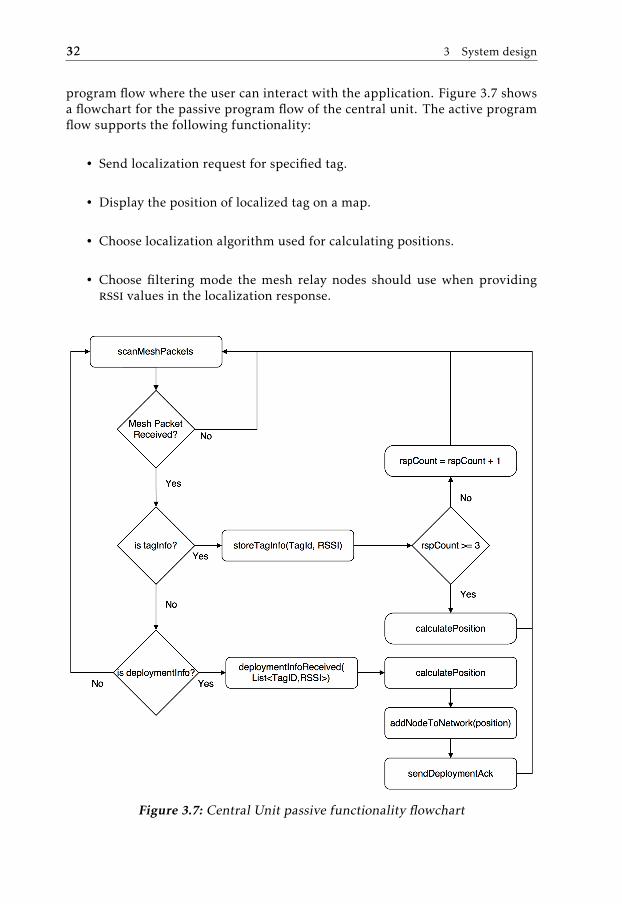
The central unit functionality can be divided into its passive program flow whereit only listens to incoming mesh packets and reacts accordingly and an active
32 3 System design
program flow where the user can interact with the application. Figure 3.7 showsa flowchart for the passive program flow of the central unit. The active programflow supports the following functionality:
• Send localization request for specified tag.
• Display the position of localized tag on a map.
• Choose localization algorithm used for calculating positions.
• Choose filtering mode the mesh relay nodes should use when providingrssi values in the localization response.
Figure 3.7: Central Unit passive functionality flowchart
3.3 Application Layer 33
3.3.3 Localization Algorithms
This section describes the implementation of two localization algorithms utilizedin the central unit. The choice of localization algorithm is completely indepen-dent of the mesh network side. Both algorithms are based on rssi values fromthe tags measured by the mesh relay nodes.
Trilateration uses knowledge of the distances from three known reference pointsto the tag that is to be localized. The central unit needs to receive at least threeresponses from different mesh relay nodes containing information about the tagit wants to localize before calculating its position. See section 2.3.1 for moredetails about the trilateration algorithm.
The fingerprinting algorithm uses a table of rssi values stored in the central unit.The minimum amount of localization responses needed before calculating the tagposition is configurable. See section 2.3.2 for more details about the fingerprint-ing algorithm.
3.3.4 Application Layer Enhancements
Filtering
As described in section 3.1 the Quintic QN9020 MiniDK boards have a pcb an-tenna which is very sensitive to interference from other devices in the ism fre-quency band and direction. This results in that all rssi measurements are noisywhich makes it difficult to get good distance estimations.
To improve application performance it is necessary to remove as much noise aspossible. Two different filtering methods have been implemented in the meshrelay nodes. These methods are averaging and Kalman filtering. See section 2.1.2for more background about these methods.
The central unit can choose which filtering method should be active at any givenmoment. When switching filters the central unit broadcasts a message to all meshrelay nodes. This packet includes information about what filtering algorithmthey should use. The mesh relay nodes change the localization response functionafter receiving the filter change requests. The rssi values will be fetched fromthe internal table according to the current filtering rule.
Calibration
Because the varying quality of the pcb antennas on the Quintic MiniDK boardsmentioned in section 3.1 it is necessary to calibrate them. This allows the centralunit to get more accurate distance estimations from the rssi values that variesless for different devices. The method used for calibration is further described insection 4.1.2. Activation and deactivation of the calibration mode is controlledby the central unit which passes on the calibration activation- and deactivationrequests to the mesh relay nodes. See figure 3.6 for the mesh relay node statemachine.
34 3 System design
Random Delay
When several devices in the mesh network try to send messages to the same des-tination simultaneously collisions might occur because the receiving device canonly handle one arriving mesh packet at a time. To combat this a random delaycan be included in the application layer for message types that are likely to oc-cur simultaneously. One example of such a message is the find beacon responsemethod in the mesh relay nodes mentioned in section 3.3.2.
The mesh relay nodes implements a uniform random delay with values between0−50ms when responding to find beacon requests. These values are large enoughto remove most of the collisions that occur without using random delay while stillkeeping the system response times at a reasonable level.
K-Nearest Neighbours
K-Nearset Neighbours is an algorithms used to improve the accuracy of finger-printing localization. See section 2.3.2 for more details. The idea is to use theaverage over several candidate points to get a better estimation. This functional-ity is implemented in the central unit.
4Results
This chapter starts by describing the test environment. The calibration steps forthe different algorithms are described. Test results regarding rssi distance esti-mation and localization accuracy are presented.
4.1 Test Environment Setup
The designed localization system is implemented on hardware as described inchapter 3. To test the performance of the designed system it has been deployedin a live area. The following sections describe the layout of the test area, how thesystem is calibrated and the criteria utilized for system performance evaluation.
4.1.1 Test Area
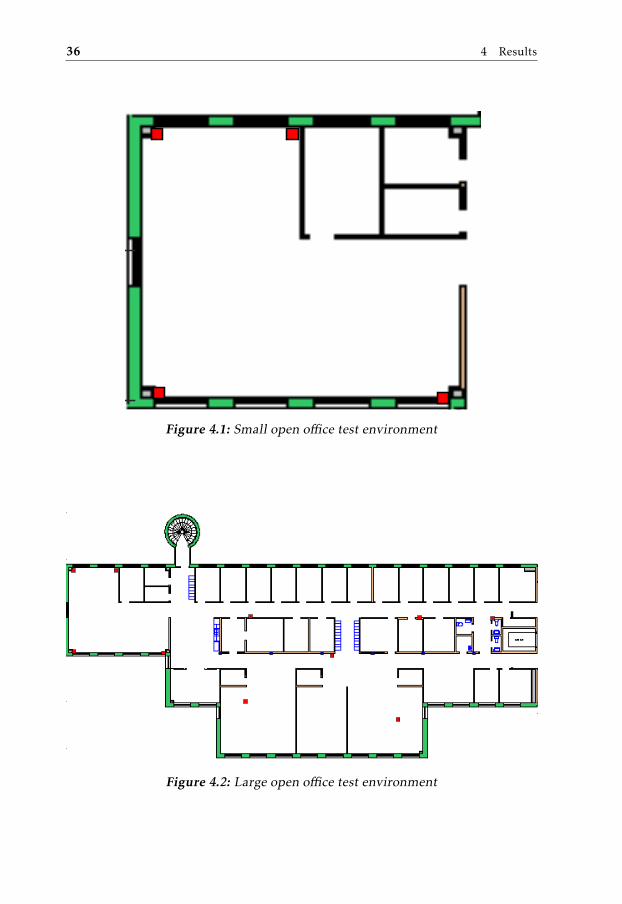
The system is tested in two areas: One smaller open office area and one largerarea with corridors and different sections blocked by walls. Maps of the smalland the large area are presented in figure 4.1 and figure 4.2 respectively.
There are in total ten mesh relay nodes deployed in the test area. The positionof these nodes are shown in both figure 4.1 for the small area and 4.2 for thelarge area. The relay nodes are numbered from one to ten corresponding to theirsource addresses in the mesh network.
Fingerprinting has only been tested in the small area due to the large amount ofcalibration work needed. Therefore all results comparing fingerprinting and tri-lateration comes from tests carried out in the small area. The purpose of extend-ing trilateration testing to include the large area as well is to test the multi-hopmesh functionality.
35
36 4 Results
0 20 40 60 80 100
Distance [m]
0
5
10
15
20
25
30
Dis
tan
ce
[m
]
Figure 4.1: Small open office test environment
0 20 40 60 80 100
Distance [m]
0
5
10
15
20
25
30
Dis
tance [m
]
Figure 4.2: Large open office test environment
4.1 Test Environment Setup 37
4.1.2 Calibration
Both of the localization algorithms implemented in the system requires someinitial calibration to work properly. The performance of the system relies deeplyon the quality and density of the calibration. The calibration procedure for eachof the two localization algorithms is described further in the following sections.
Trilateration
The trilateration algorithm is dependent on rssi distance estimation which isdescribed in section 2.1.2. The distance estimation algorithm relies on havingthe measured rssi of a mesh packet sent from the tag to the mesh relay node ata distance of one meter. The central unit maintains a table containing the onemeter rssi values for each mesh relay node. When receiving a new localizationresponse the central unit can use the rssi in the response packet together withthe one meter rssi of the source mesh relay node to estimate the distance betweenthe mesh relay node and the tag.
The required steps for calibrating a mesh relay node for trilateration are:
1. Place the mesh relay node and tag one meter apart.
2. Start tag info broadcast.
3. Store the rssi of the tag info broadcasts received by the mesh relay nodeduring 60 seconds.
4. Take the one meter rssi for this mesh relay node as the average of all storedrssi values.
The average rssi calculated using the above steps is then stored in the centralunit. The largest causes of difference in the calibration values between differentnodes are the hardware the system it is implemented on and the environmentwhere the system is deployed. The trilateration calibration used to obtain theresults presented in this section are found in table 4.1. These values indicate thatthere can be huge differences in the measured rssi values from one device toanother.
Fingerprinting
Fingerprinting requires more work during the calibration step than the trilatera-tion algorithm. Due to the large amount of calibration work required for finger-printing it is only tested in the small test area mentioned in section 4.1.1.
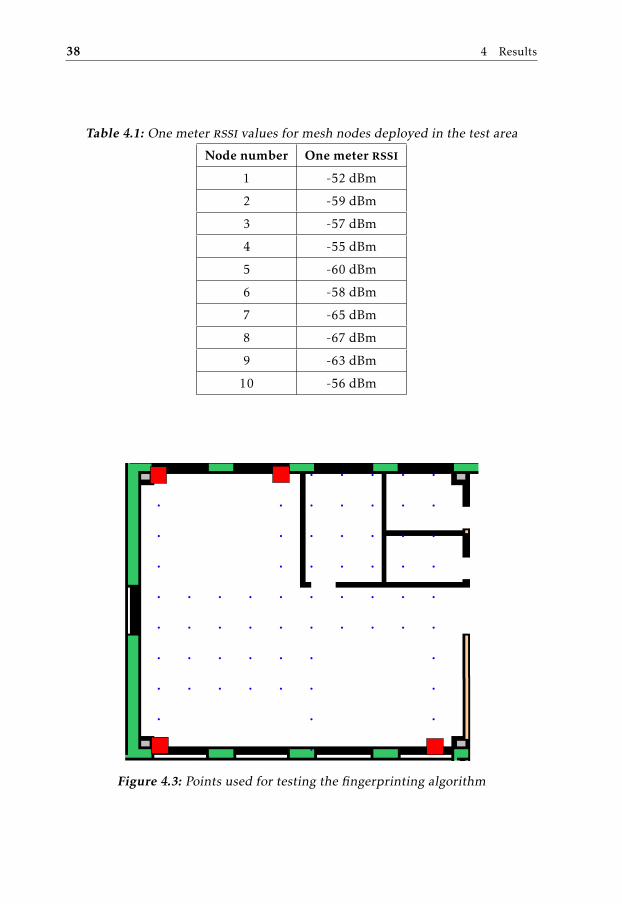
Section 2.3.2 describes the fingerprinting algorithm. It needs to know the rssifingerprint in all points of the area that should be considered by the algorithm.The central unit maintains a table containing the fingerprints for all points inthe area where the fingerprinting algorithm can operate. The points used forfingerprinting are shown in figure 4.3.
The required steps for calibrating the fingerprinting algorithm in each of pointsin the test area are:
38 4 Results
Table 4.1: One meter rssi values for mesh nodes deployed in the test area
Node number One meter rssi
1 -52 dBm
2 -59 dBm
3 -57 dBm
4 -55 dBm
5 -60 dBm
6 -58 dBm
7 -65 dBm
8 -67 dBm
9 -63 dBm
10 -56 dBm
0 5 10 15 20 25 30 35
[m]
14
16
18
20
22
24
[m]
Figure 4.3: Points used for testing the fingerprinting algorithm
4.2 Results 39
1. Start tag info broadcast.
2. Store the received rssi during 60 seconds for each mesh relay node.
3. Take the fingerprint as the average of the stored rssi values for each meshrelay node.
These fingerprints are then stored in the central unit from where it can be re-trieved and used by the fingerprinting algorithm.
4.2 Results
The following sections present the results for the tests of rssi filters, localizationaccuracy with different algorithms and localization algorithm with different fil-ters.
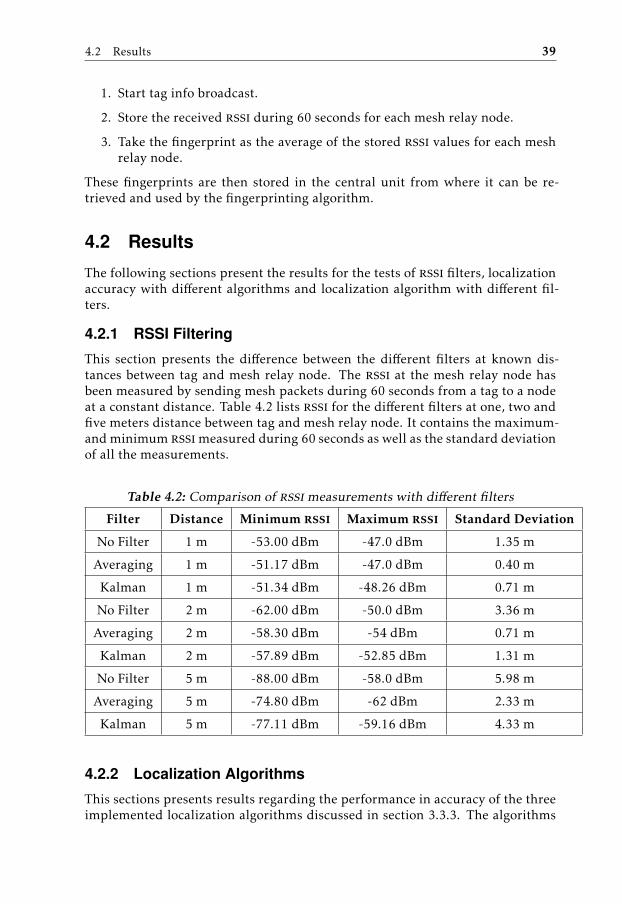
4.2.1 RSSI Filtering
This section presents the difference between the different filters at known dis-tances between tag and mesh relay node. The rssi at the mesh relay node hasbeen measured by sending mesh packets during 60 seconds from a tag to a nodeat a constant distance. Table 4.2 lists rssi for the different filters at one, two andfive meters distance between tag and mesh relay node. It contains the maximum-and minimum rssimeasured during 60 seconds as well as the standard deviationof all the measurements.
Table 4.2: Comparison of rssimeasurements with different filters
Filter Distance Minimum rssi Maximum rssi Standard Deviation
No Filter 1 m -53.00 dBm -47.0 dBm 1.35 m
Averaging 1 m -51.17 dBm -47.0 dBm 0.40 m
Kalman 1 m -51.34 dBm -48.26 dBm 0.71 m
No Filter 2 m -62.00 dBm -50.0 dBm 3.36 m
Averaging 2 m -58.30 dBm -54 dBm 0.71 m
Kalman 2 m -57.89 dBm -52.85 dBm 1.31 m
No Filter 5 m -88.00 dBm -58.0 dBm 5.98 m
Averaging 5 m -74.80 dBm -62 dBm 2.33 m
Kalman 5 m -77.11 dBm -59.16 dBm 4.33 m
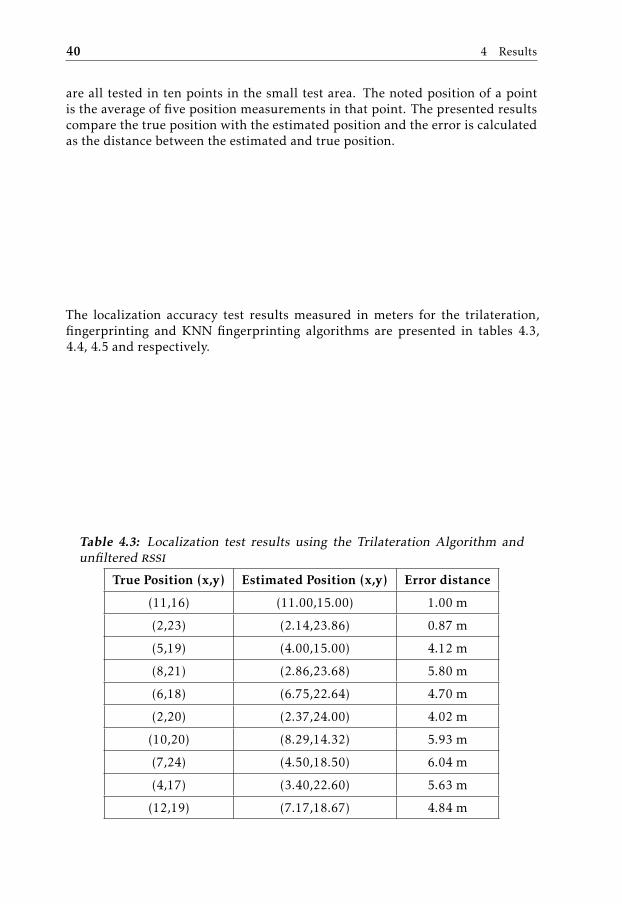
4.2.2 Localization Algorithms
This sections presents results regarding the performance in accuracy of the threeimplemented localization algorithms discussed in section 3.3.3. The algorithms
40 4 Results
are all tested in ten points in the small test area. The noted position of a pointis the average of five position measurements in that point. The presented resultscompare the true position with the estimated position and the error is calculatedas the distance between the estimated and true position.
The localization accuracy test results measured in meters for the trilateration,fingerprinting and KNN fingerprinting algorithms are presented in tables 4.3,4.4, 4.5 and respectively.
Table 4.3: Localization test results using the Trilateration Algorithm andunfiltered rssi
True Position (x,y) Estimated Position (x,y) Error distance
(11,16) (11.00,15.00) 1.00 m
(2,23) (2.14,23.86) 0.87 m
(5,19) (4.00,15.00) 4.12 m
(8,21) (2.86,23.68) 5.80 m
(6,18) (6.75,22.64) 4.70 m
(2,20) (2.37,24.00) 4.02 m
(10,20) (8.29,14.32) 5.93 m
(7,24) (4.50,18.50) 6.04 m
(4,17) (3.40,22.60) 5.63 m
(12,19) (7.17,18.67) 4.84 m
4.2 Results 41
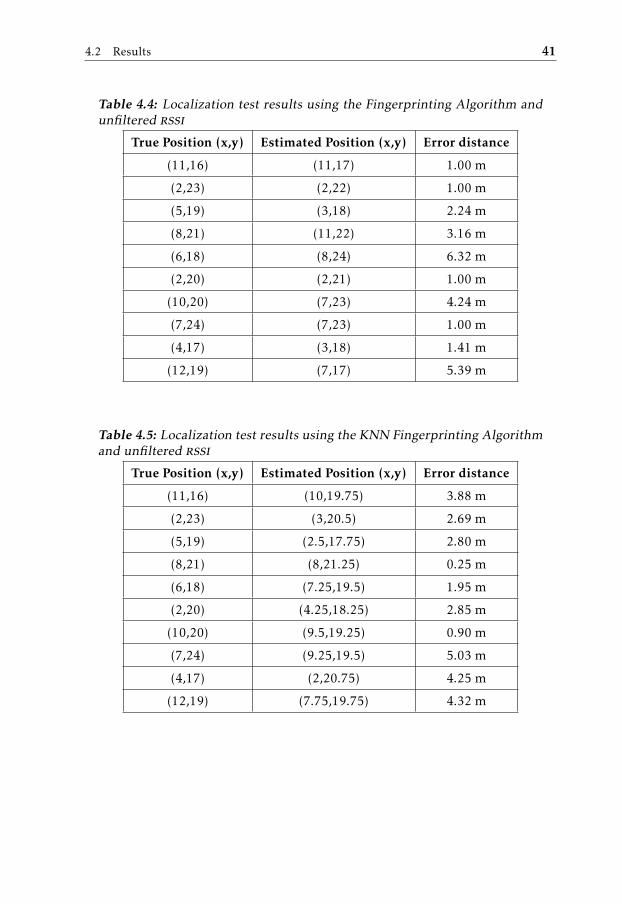
Table 4.4: Localization test results using the Fingerprinting Algorithm andunfiltered rssi
True Position (x,y) Estimated Position (x,y) Error distance
(11,16) (11,17) 1.00 m
(2,23) (2,22) 1.00 m
(5,19) (3,18) 2.24 m
(8,21) (11,22) 3.16 m
(6,18) (8,24) 6.32 m
(2,20) (2,21) 1.00 m
(10,20) (7,23) 4.24 m
(7,24) (7,23) 1.00 m
(4,17) (3,18) 1.41 m
(12,19) (7,17) 5.39 m
Table 4.5: Localization test results using the KNN Fingerprinting Algorithmand unfiltered rssi
True Position (x,y) Estimated Position (x,y) Error distance
(11,16) (10,19.75) 3.88 m
(2,23) (3,20.5) 2.69 m
(5,19) (2.5,17.75) 2.80 m
(8,21) (8,21.25) 0.25 m
(6,18) (7.25,19.5) 1.95 m
(2,20) (4.25,18.25) 2.85 m
(10,20) (9.5,19.25) 0.90 m
(7,24) (9.25,19.5) 5.03 m
(4,17) (2,20.75) 4.25 m
(12,19) (7.75,19.75) 4.32 m
42 4 Results
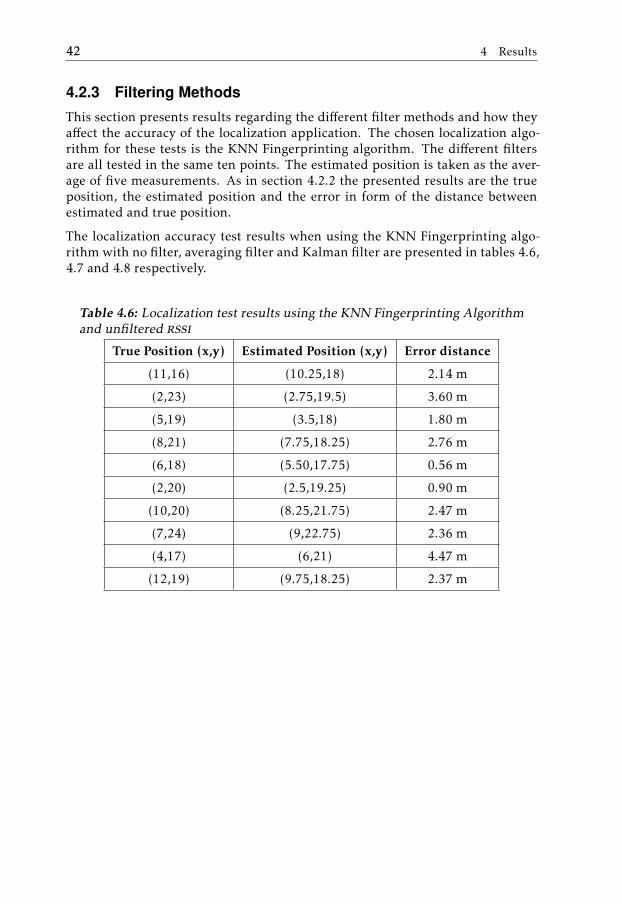
4.2.3 Filtering Methods
This section presents results regarding the different filter methods and how theyaffect the accuracy of the localization application. The chosen localization algo-rithm for these tests is the KNN Fingerprinting algorithm. The different filtersare all tested in the same ten points. The estimated position is taken as the aver-age of five measurements. As in section 4.2.2 the presented results are the trueposition, the estimated position and the error in form of the distance betweenestimated and true position.
The localization accuracy test results when using the KNN Fingerprinting algo-rithm with no filter, averaging filter and Kalman filter are presented in tables 4.6,4.7 and 4.8 respectively.
Table 4.6: Localization test results using the KNN Fingerprinting Algorithmand unfiltered rssi
True Position (x,y) Estimated Position (x,y) Error distance
(11,16) (10.25,18) 2.14 m
(2,23) (2.75,19.5) 3.60 m
(5,19) (3.5,18) 1.80 m
(8,21) (7.75,18.25) 2.76 m
(6,18) (5.50,17.75) 0.56 m
(2,20) (2.5,19.25) 0.90 m
(10,20) (8.25,21.75) 2.47 m
(7,24) (9,22.75) 2.36 m
(4,17) (6,21) 4.47 m
(12,19) (9.75,18.25) 2.37 m
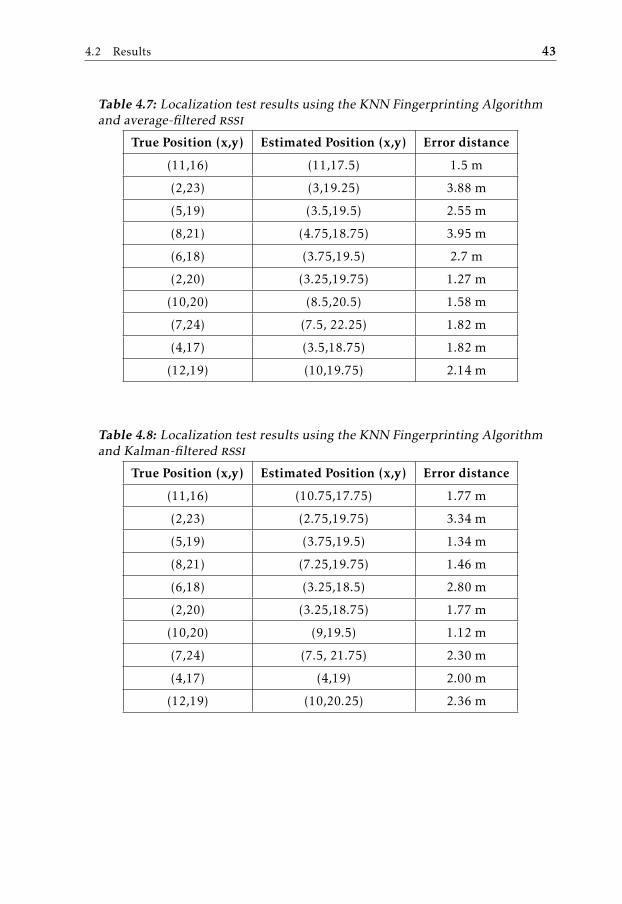
4.2 Results 43
Table 4.7: Localization test results using the KNN Fingerprinting Algorithmand average-filtered rssi
True Position (x,y) Estimated Position (x,y) Error distance
(11,16) (11,17.5) 1.5 m
(2,23) (3,19.25) 3.88 m
(5,19) (3.5,19.5) 2.55 m
(8,21) (4.75,18.75) 3.95 m
(6,18) (3.75,19.5) 2.7 m
(2,20) (3.25,19.75) 1.27 m
(10,20) (8.5,20.5) 1.58 m
(7,24) (7.5, 22.25) 1.82 m
(4,17) (3.5,18.75) 1.82 m
(12,19) (10,19.75) 2.14 m
Table 4.8: Localization test results using the KNN Fingerprinting Algorithmand Kalman-filtered rssi
True Position (x,y) Estimated Position (x,y) Error distance
(11,16) (10.75,17.75) 1.77 m
(2,23) (2.75,19.75) 3.34 m
(5,19) (3.75,19.5) 1.34 m
(8,21) (7.25,19.75) 1.46 m
(6,18) (3.25,18.5) 2.80 m
(2,20) (3.25,18.75) 1.77 m
(10,20) (9,19.5) 1.12 m
(7,24) (7.5, 21.75) 2.30 m
(4,17) (4,19) 2.00 m
(12,19) (10,20.25) 2.36 m

5Analysis and Discussion
This chapter analyses and discusses the results presented in chapter 4. It includesa discussion about rssi distance estimation and how it is affected by filtering.Three implemented localization algorithms are compared and evaluated with re-spect to their calibration complexity and accuracy.
5.1 Evaluation Criteria
In order to evaluate system performance and compare the different implementedalgorithms and filters, the following evaluation criteria has been selected:
• Accuracy - The distance between the estimated location of a tag to its reallocation.
• Calibration Complexity - The prerequisite calibration work required toimplement the algorithm.
5.2 RSSI Filtering
The results presented in section 4.2.1 indicates that the measured rssi values arevery noisy and unreliable. For example in table 4.2 the unfiltered rssi at onemeters distance takes values between −49 dBm and −53 dBm with a standarddeviation of 1.35 meters. This indicates that the environment is noisy whichmakes it difficult to use rssi for distance estimation.
45
46 5 Analysis and Discussion
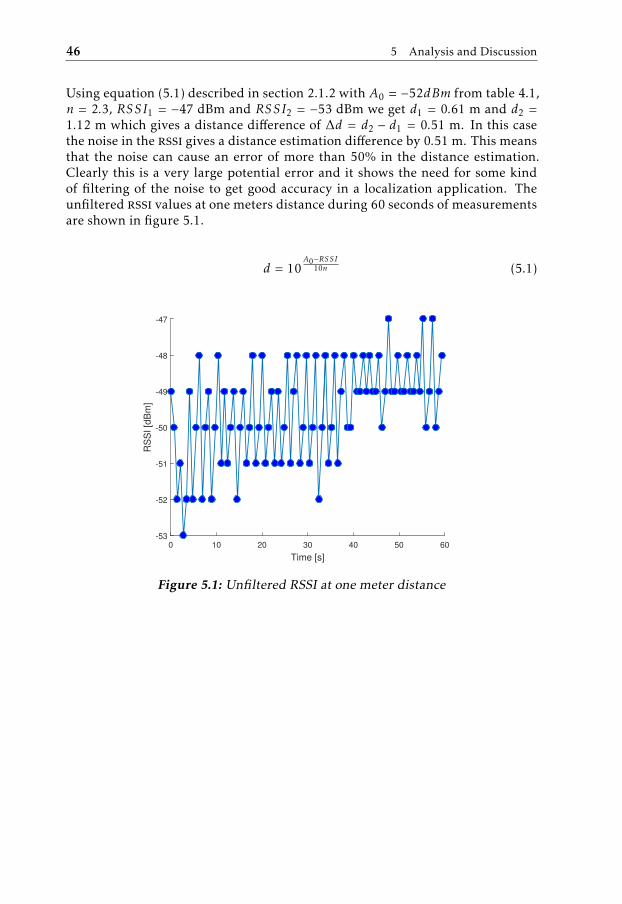
Using equation (5.1) described in section 2.1.2 with A0 = −52dBm from table 4.1,n = 2.3, RSSI1 = −47 dBm and RSSI2 = −53 dBm we get d1 = 0.61 m and d2 =1.12 m which gives a distance difference of ∆d = d2 − d1 = 0.51 m. In this casethe noise in the rssi gives a distance estimation difference by 0.51 m. This meansthat the noise can cause an error of more than 50% in the distance estimation.Clearly this is a very large potential error and it shows the need for some kindof filtering of the noise to get good accuracy in a localization application. Theunfiltered rssi values at one meters distance during 60 seconds of measurementsare shown in figure 5.1.
d = 10A0−RSSI
10n (5.1)
0 10 20 30 40 50 60
Time [s]
-53
-52
-51
-50
-49
-48
-47
RS
SI [d
Bm
]
Figure 5.1: Unfiltered RSSI at one meter distance
5.2 RSSI Filtering 47
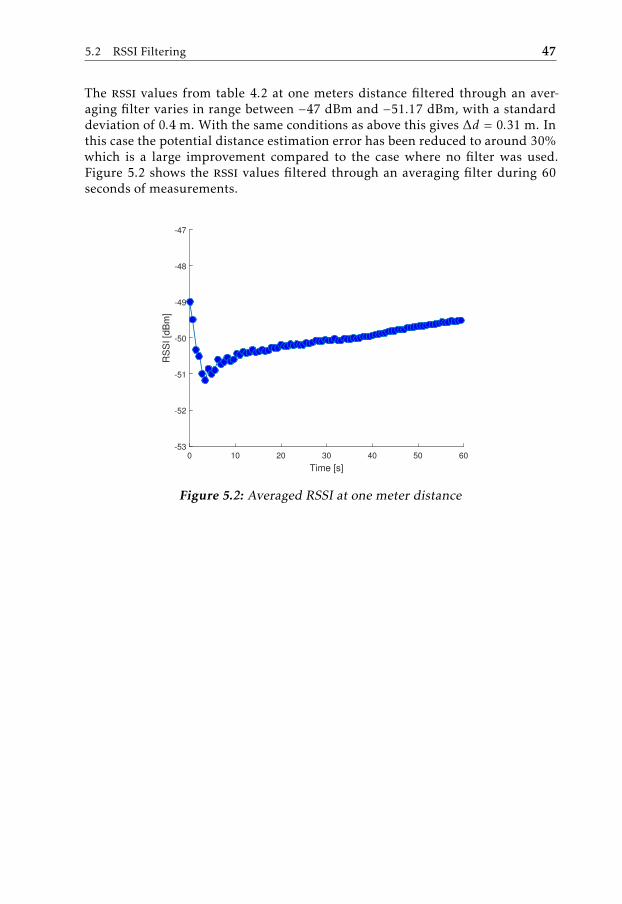
The rssi values from table 4.2 at one meters distance filtered through an aver-aging filter varies in range between −47 dBm and −51.17 dBm, with a standarddeviation of 0.4 m. With the same conditions as above this gives ∆d = 0.31 m. Inthis case the potential distance estimation error has been reduced to around 30%which is a large improvement compared to the case where no filter was used.Figure 5.2 shows the rssi values filtered through an averaging filter during 60seconds of measurements.
0 10 20 30 40 50 60
Time [s]
-53
-52
-51
-50
-49
-48
-47
RS
SI [d
Bm
]
Figure 5.2: Averaged RSSI at one meter distance
48 5 Analysis and Discussion
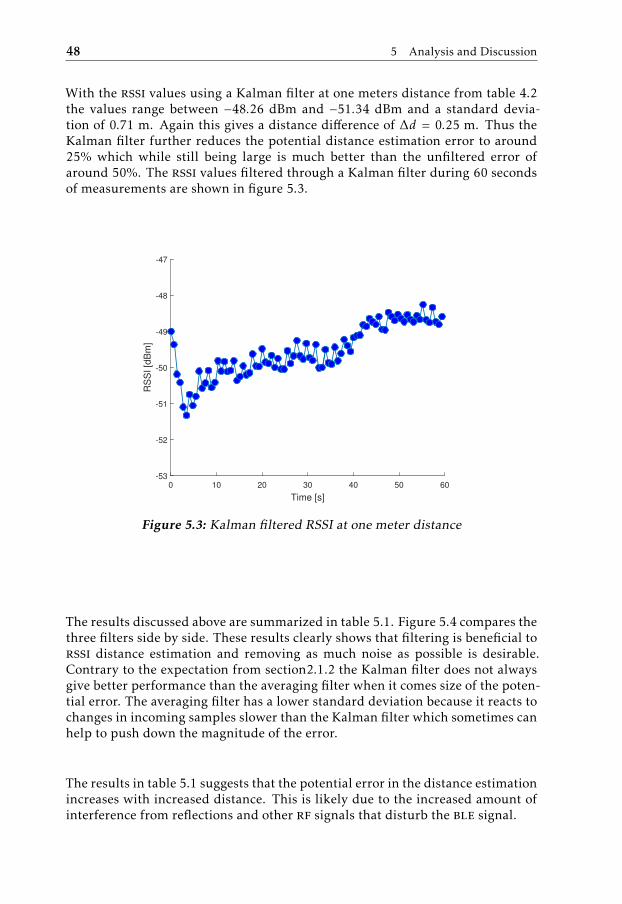
With the rssi values using a Kalman filter at one meters distance from table 4.2the values range between −48.26 dBm and −51.34 dBm and a standard devia-tion of 0.71 m. Again this gives a distance difference of ∆d = 0.25 m. Thus theKalman filter further reduces the potential distance estimation error to around25% which while still being large is much better than the unfiltered error ofaround 50%. The rssi values filtered through a Kalman filter during 60 secondsof measurements are shown in figure 5.3.
0 10 20 30 40 50 60
Time [s]
-53
-52
-51
-50
-49
-48
-47
RS
SI [d
Bm
]
Figure 5.3: Kalman filtered RSSI at one meter distance
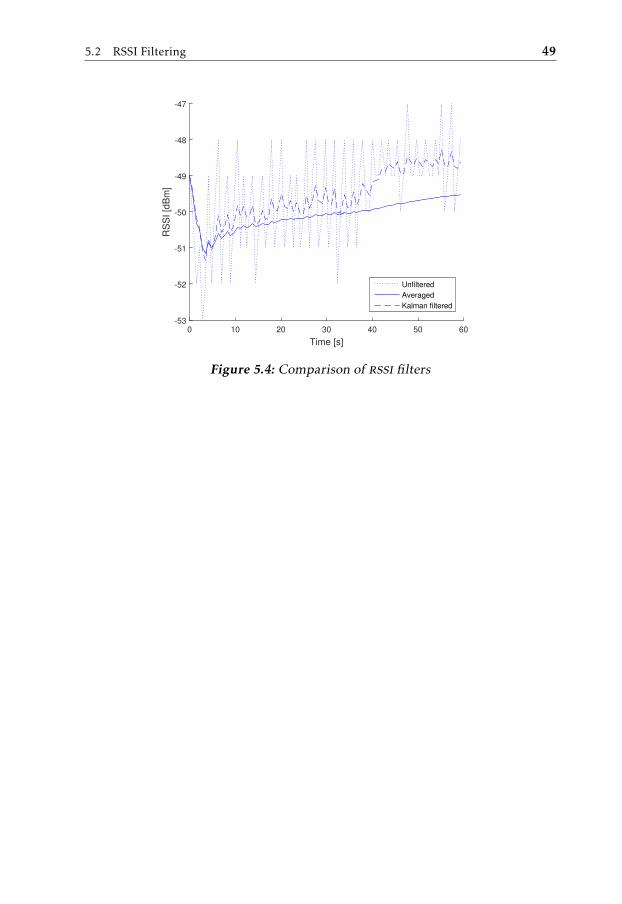
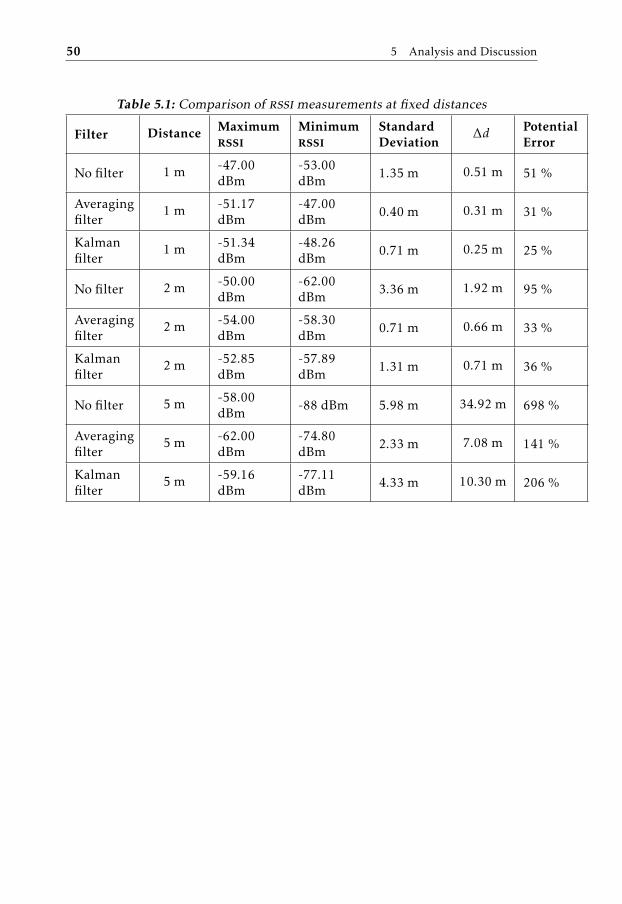
The results discussed above are summarized in table 5.1. Figure 5.4 compares thethree filters side by side. These results clearly shows that filtering is beneficial torssi distance estimation and removing as much noise as possible is desirable.Contrary to the expectation from section2.1.2 the Kalman filter does not alwaysgive better performance than the averaging filter when it comes size of the poten-tial error. The averaging filter has a lower standard deviation because it reacts tochanges in incoming samples slower than the Kalman filter which sometimes canhelp to push down the magnitude of the error.
The results in table 5.1 suggests that the potential error in the distance estimationincreases with increased distance. This is likely due to the increased amount ofinterference from reflections and other rf signals that disturb the ble signal.
5.2 RSSI Filtering 49
0 10 20 30 40 50 60
Time [s]
-53
-52
-51
-50
-49
-48
-47
RS
SI [d
Bm
]
Unfiltered
Averaged
Kalman filtered
Figure 5.4: Comparison of rssi filters
50 5 Analysis and Discussion
Table 5.1: Comparison of rssimeasurements at fixed distances
Filter Distance Maximumrssi
Minimumrssi
StandardDeviation
∆d PotentialError
No filter 1 m -47.00dBm
-53.00dBm
1.35 m 0.51 m 51 %
Averagingfilter
1 m -51.17dBm
-47.00dBm
0.40 m 0.31 m 31 %
Kalmanfilter
1 m -51.34dBm
-48.26dBm
0.71 m 0.25 m 25 %
No filter 2 m -50.00dBm
-62.00dBm
3.36 m 1.92 m 95 %
Averagingfilter
2 m -54.00dBm
-58.30dBm
0.71 m 0.66 m 33 %
Kalmanfilter
2 m -52.85dBm
-57.89dBm
1.31 m 0.71 m 36 %
No filter 5 m -58.00dBm
-88 dBm 5.98 m 34.92 m 698 %
Averagingfilter
5 m -62.00dBm
-74.80dBm
2.33 m 7.08 m 141 %
Kalmanfilter
5 m -59.16dBm
-77.11dBm
4.33 m 10.30 m 206 %
5.3 Localization Algorithms 51
The calculations in this section are dependent on the experimental estimationsof the environment constant n and the one meter rssi A0. See section 4.1.2 forhow these estimations were done. Other values of n and A0 give different resultsfrom the ones presented in table 5.1. However no matter how these constants aredecided there will be noise in the rssi. Therefore an assumption can be madethat similar results would be achieved with other estimations of n and A0 as well.
The antennas of the ble devices used in this thesis are very sensitive to changeof the environment. Small differences in the orientation of the device can causehuge differences in rssi. Human interference can also cause the rssi to dropabout 5 dBm. Another source of interference are other devices operating in the2.4GHz ism- band such as WiFi routers. All the tests have been carried out underconditions where all these sources of interference are present. This is becausethese kinds of interference are likely to be present in an area where an indoorlocalization system like this would be used commercially.
The conclusion about rssi distance estimation is that rssi is very unreliable. Evenfiltered rssi can produce large errors. This in turn leads to difficulties achievinggood localization accuracy.
5.3 Localization Algorithms
The three localization algorithms implemented in the system are as mentionedin chapter 3, Trilateration, Fingerprinting and KNN Fingerprinting. KNN Fin-gerprinting is just a slight variation of the Fingerprinting algorithm while theTrilateration algorithm differs from the other two. Therefore the analysis in thissection will mainly focus on the differences between the Trilateration algorithmand the Fingerprinting algorithm. These algorithms are evaluated according tothe criteria presented in section 5.1. The most interesting criteria to evaluate forindoor localization is the accuracy and the calibration complexity.
5.3.1 Trilateration
Calibration Complexity
The calibration method for trilateration is described in detail in section 4.1.2. Theamount of calibration work needed scales linearly with the number of mesh relaynodes in the network. The central unit needs to have the one meter rssi valuefor each deployed mesh relay node. Due to differences in hardware each tag willhave different one meter rssi for the same mesh relay node. This means that eachtag used in the system has to be calibrated. The total amount of calibration workneeded for the trilateration algorithm is C = NrNt , where Nr is the number ofmesh relay nodes and Nt is the number of tags. C denotes a calibration workquantity. This quantity measures how many times a calibration process has to bedone for a specific algorithm. The calibration process is defined as collecting rssifor 60 seconds at a specific point and averaging the collected values.
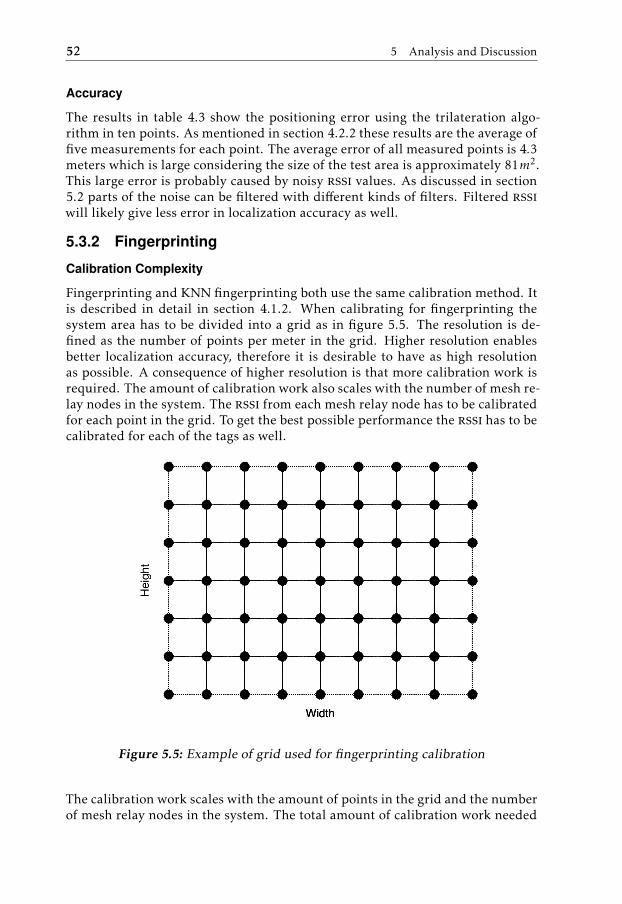
52 5 Analysis and Discussion
Accuracy
The results in table 4.3 show the positioning error using the trilateration algo-rithm in ten points. As mentioned in section 4.2.2 these results are the average offive measurements for each point. The average error of all measured points is 4.3meters which is large considering the size of the test area is approximately 81m2.This large error is probably caused by noisy rssi values. As discussed in section5.2 parts of the noise can be filtered with different kinds of filters. Filtered rssiwill likely give less error in localization accuracy as well.
5.3.2 Fingerprinting
Calibration Complexity
Fingerprinting and KNN fingerprinting both use the same calibration method. Itis described in detail in section 4.1.2. When calibrating for fingerprinting thesystem area has to be divided into a grid as in figure 5.5. The resolution is de-fined as the number of points per meter in the grid. Higher resolution enablesbetter localization accuracy, therefore it is desirable to have as high resolutionas possible. A consequence of higher resolution is that more calibration work isrequired. The amount of calibration work also scales with the number of mesh re-lay nodes in the system. The rssi from each mesh relay node has to be calibratedfor each point in the grid. To get the best possible performance the rssi has to becalibrated for each of the tags as well.
Figure 5.5: Example of grid used for fingerprinting calibration
The calibration work scales with the amount of points in the grid and the numberof mesh relay nodes in the system. The total amount of calibration work needed
5.4 Localization Filtering 53
for the fingerprinting algorithm is C = (hr + 1)(wr + 1)NrNt , where h and w is theheight respectively width of the system area, r is the resolution, Nr is the numberof mesh relay nodes and Nt is the number of tags.
Accuracy
The results in table 4.4 and 4.5 shows the positioning error for the fingerprintingand KNN fingerprinting algorithms respectively. The result in each of the tenpoints is the average of five measurements in that point. The average error forfingerprinting is 2.68 meters and the average error for KNN fingerprinting is 2.89meters.
The fingerprinting localization accuracy is directly dependent on the quality andresolution of the calibration. The accuracy will decrease if the system environ-ment changed since the calibration. For example a human moving in front of oneof the mesh relay nodes can decrease the rssi from that node by about 4dBm.
5.3.3 Comparison
This section compares the trilateration and fingerprinting algorithms and evalu-ates them with regards to calibration complexity and localization accuracy.
The required calibration work for the two algorithms differs with a factor of (hr +1)(wr + 1), where h and w is the height respectively width of the test area and ris the resolution of the test area. This means that the fingerprinting algorithmalways require more calibration work than the trilateration algorithm.
As seen in sections 5.3.1 and 5.3.2 both the fingerprinting and the KNN finger-printing algorithms have better accuracy than the trilateration algorithm. Theaverage error for fingerprinting and KNN fingerprinting were 2.68 respectively2.89 meters while the average error for the trilateration algorithm was 4.3 meters.
The fingerprinting algorithm and the KNN fingerprinting algorithm both requirethe same amount of calibration work. In these test results with unfiltered rssithe fingerprinting algorithm had better accuracy than the KNN fingerprintingalgorithm. This is a contradiction to the theory in section 2.3.2. The cause ofthese contradicting results is probably changes in the test environment betweenthe tests.
5.4 Localization Filtering
This section analyses and discusses the effect of the different rssi filtering meth-ods on the KNN fingerprinting algorithm. The results from the filtering test insection 4.2.3 are summarized in table 5.2.
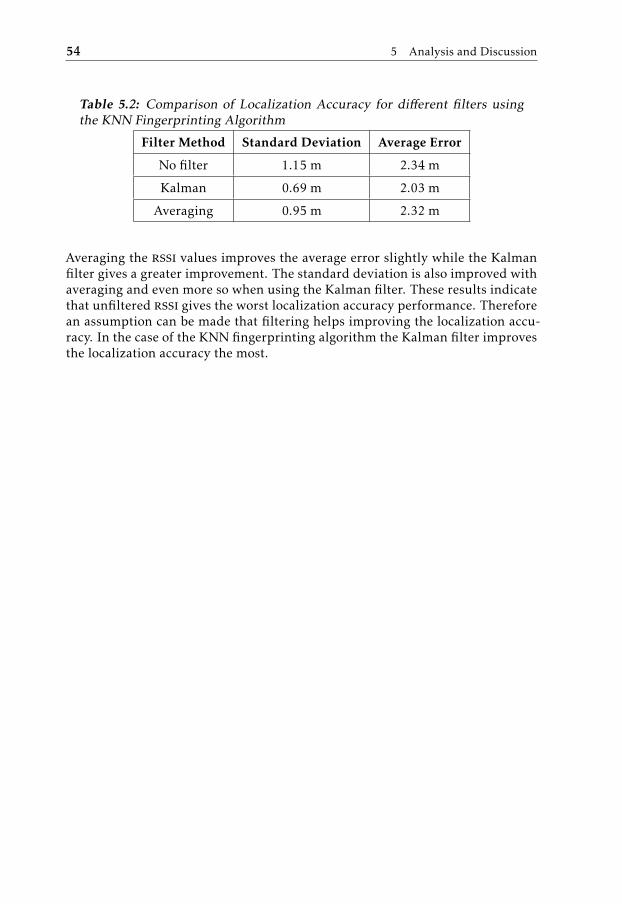
54 5 Analysis and Discussion
Table 5.2: Comparison of Localization Accuracy for different filters usingthe KNN Fingerprinting Algorithm
Filter Method Standard Deviation Average Error
No filter 1.15 m 2.34 m
Kalman 0.69 m 2.03 m
Averaging 0.95 m 2.32 m
Averaging the rssi values improves the average error slightly while the Kalmanfilter gives a greater improvement. The standard deviation is also improved withaveraging and even more so when using the Kalman filter. These results indicatethat unfiltered rssi gives the worst localization accuracy performance. Thereforean assumption can be made that filtering helps improving the localization accu-racy. In the case of the KNN fingerprinting algorithm the Kalman filter improvesthe localization accuracy the most.
6Conclusion
This thesis has verified the possibility to develop and implement a mesh networkprotocol using Bluetooth Low Energy. In order to verify the functionality of thismesh network an indoor localization application that utilize the network hasbeen developed and evaluated. The benefits that an indoor localization applica-tion could have from using a mesh network has been investigated. The questionsin the problem formulation, originally stated in section 1.3, are hereby answered.
- Is it possible to implement a mesh network protocol using ble?
The indoor localization system developed in this thesis, described in chapter 3,is a proof of concept of a working mesh network protocol implemented usingble. The implemented mesh network protocol supports multi-hop messagingwhich enables all nodes in the network to communicate with each other. Thenetwork protocol functions without a central unit and it is easy to add newnodes to an active network.
The mesh network protocol is implemented on top of the ble Link Layer. Itutilizes the scanning and advertising states of ble devices to enable connec-tionless message transfers. A network with a total of ten relay nodes has beendeployed and tested in a live area. In addition to these relay nodes, several bletags that continuously broadcasts mesh packets have been deployed.
The mesh network protocol implemented in this thesis currently only supportpacket forwarding by flooding. As mentioned in section 2.2.1 the flooding algo-rithm is not very efficient. This becomes an issue when the network size scalesas the network becomes congested which in turn leads to packets colliding andnot reaching their destination. In this thesis a random delay between zero and50 milliseconds was implemented in the application layer with the purpose to
55
56 6 Conclusion
avoid packet collisions. Another solution to the congestion problem that hasnot been implemented in this thesis is to implement a routing algorithm in themesh network protocol.
- What accuracy can be achieved in a blemesh based indoor localization system?
The indoor localization system developed in this thesis is based on two algo-rithms, trilateration and fingerprinting. Both these algorithms use rssi to esti-mate the location of a target object. The achieved accuracy is measured as theaverage error when comparing the estimated and true locations of the targetobject.
The accuracy results are discussed in sections 5.3.1 and 5.3.2. The averageerror for the trilateration algorithm with unfiltered rssi is around 4.3 meters.The fingerprinting and KNN fingerprinting algorithms have better accuracywith average errors of 2.68 and 2.89 meters respectively. The drawback of thefingerprinting based algorithms is that they need much more calibration workthan the trilateration algorithm.
Even if these accuracy errors can be considered large, they are no worse than inother rssi based indoor localization systems [2, 21]. The low accuracy in rssibased indoor localization systems is likely due to noisy environments leadingto unstable rssi values [13]. When mitigating some of the noise by applyingfilters as in section 5.2 the accuracy improves. The average error of the KNNfingerprinting algorithm when applying a Kalman filter decreased to 2.03 me-ters. This is much better than the unfiltered accuracy but the error is still large.The conclusion is that rssi on its own is unsuitable for indoor localization ap-plications.
- Can an indoor localization system benefit from a mesh network?
A mesh network based indoor localization system benefits compared to beaconbased indoor localization systems such as iBeacon [5] and Estimote [6] whenit comes to range. In a beacon based localization system the user has to be inthe radio propagation range of the beacons to use the system or use anothertechnology such as internet to access the beacons from far away.
The indoor localization system developed in this thesis only require the userto be in the radio propagation range of a single network node to function. Allother nodes in the network can be accessed via that single node. There is noneed to support any other network layer technology than the ble mesh net-work. This leads to less complexity in the hardware and software of the net-work nodes which can be beneficial when it comes to development costs andenergy consumption.
- Can other localization applications benefit from the mesh network?
In addition to the standard localization application an additional feature hasbeen implemented in the system, ad-hoc mesh node deployment, described insection 3.3.1. This feature allows nodes to automatically install themselves into
6.1 Further Work 57
the network. The newly installed node finds it owns position using the samelocalization algorithms as the localization application. Once installed, the newnode functions like all the other mesh relay nodes.
6.1 Further Work
There are two separate tracks of further work that would be interesting to followup on from this thesis. The first track is to improve upon the developed blemeshnetwork protocol and the second track is to investigate possible improvements tothe localization application accuracy. It could also be interesting to combine thesetwo tracks and develop a localization algorithm that utilize the mesh networkdeeply.
The natural continuation regarding the mesh network protocol would be to de-sign and implement a routing algorithm in the network layer. This would helpto avoid network congestion which in turns enables better scaling of the network.Assuming the ability to create good routes at all times it could also help to reducenetwork latency.
Regarding the localization applications there are several approaches to improve-ment. Firstly it is possible that there are better algorithms than the ones that wereimplemented in this thesis work. Secondly, the calibration methods used in thisthesis could be refined which in turn can lead to better accuracy when using thetrilateration and fingerprinting algorithms. I personally believe that an indoorlocalization system like this would benefit most from utilizing another methodof distance estimation. For example it could be interesting to investigate whetherangle of arrival would give better localization accuracy than rssi distance estima-tion.

Bibliography
[1] H. Liu, H. Darabi, P. Banerjee, and J. Liu, “Survey of wireless indoor posi-tioning techniques and systems,” IEEE Transactions on Systems, Man, andCybernetics, vol. 37, no. 6, pp. 1067–1080, 2007. Cited on page 1.
[2] K. Curran, E. Furey, T. Lunney, and A. McCaughey, “An evaluation of in-door location determination technologies,” Journal of Location Based Ser-vices, vol. 5, no. 2, pp. 61–78, 2011. Cited on pages 1, 11, and 56.
[3] Y. Gu, A. Lo, and I. Niemegeers, “A survey of indoor positioning systems forwireless personal networks,” IEEE Communications Surveys and Tutorials,vol. 11, no. 1, pp. 13–32, 2009. Cited on page 1.
[4] S.-H. Cao, “Research progress of indoor location technology and system,”Computer Systems and Applications, vol. 22, no. 9, pp. 1–5, 2013. Cited onpages 1 and 15.
[5] iBeacon Insider, “What is iBeacon?,” 2016. [Online, 2016-05-10]. Available:http://www.ibeacon.com/what-is-ibeacon-a-guide-to-beacons/.Cited on pages 1 and 56.
[6] “Estimote,” 2016. [Online, 2016-05-10]. Available:http://estimote.com/. Cited on pages 1 and 56.
[7] “Zigbee,” 2016. [Online, 2016-05-10]. Available:http://www.zigbee.org/. Cited on page 1.
[8] J. Gubbi, R. Buyya, S. Marusic, and M. Palaniswami, “Internet of things(iot): A vision, architectural elements, and future directions,” FutureGeneration Computer Systems, vol. 29, no. 7, pp. 1645–1660, 2013. Citedon page 1.
[9] Bluetooth Special Interest Group, Specification of the Bluetooth System,4.2, Volume 0, 2014. Cited on pages 1, 10, 15, and 20.
[10] Bluetooth Special Interest Group, “Bluetooth Low Energy,” 2016.[Online, 2016-05-10]. Available:
59
60 Bibliography
https://www.bluetooth.com/what-is-bluetooth-technology/bluetooth-technology-basics/low-energy. Cited on page 1.
[11] R. Heydon, Bluetooth Low Energy - The Developer’s Handbook. PearsonEducation, Inc., Crawfordsville, first ed., 2013. Cited on pages 6, 7, 9,and 10.
[12] W. Bulten, “Kalman filters explained Removing noise from rssi signals,”2016. [Online, 2016-04-29]. Available:https://wouterbulten.nl/blog/tech/kalman-filters-explained-removing-noise-from-rssi-signals/.Cited on pages 11 and 12.
[13] Q. Dong and D. Waltenegus, “Evaluation of the reliability of rssi for indoorlocalization,” Wireless Communications in Unusual and Confined Areas,pp. 1–6, 2012. Cited on pages 11 and 56.
[14] F. Gustafsson, Statistical Sensor Fusion. Studentlitteratur AB, second ed.,2013. Cited on page 11.
[15] J. Jun and M. L. Sichitiu, “The nominal capacity of wireless meshnetworks,” IEEE Wireless Communications, vol. 10, no. 5, pp. 8–14, 2003.Cited on page 12.
[16] I. F. Akyildiz, X. Wang, and W. Wang, “Wireless mesh networks: a survey,”Computer Networks, vol. 47, no. 4, pp. 445–487, 2005. Cited on page 12.
[17] M. Rouse, “Mesh network topology,” 2016. [Online, 2016-03-22]. Available:http://internetofthingsagenda.techtarget.com/definition/mesh-network-topology-mesh-network. Cited onpage 13.
[18] E. Alotaibi and B. Mukherjee, “A survey on routing algorithms for wirelessad-hoc and mesh networks,” Computer Networks, vol. 56, no. 2,pp. 940–965, 2012. Cited on page 14.
[19] A. Boukerche, B. Turgut, N. Aydin, M. Z. Ahmad, L. Bölöni, and D. Targut,“Routing protocls in ad hoc networks A survey,” Computer Networks,vol. 55, no. 13, pp. 3032–3080, 2011. Cited on page 14.
[20] G. Deak, K. Curran, and J. Condell, “Rssi-based device-free passivelocalisation,” Image Processing and Communications Challenges, vol. 84,no. 2, pp. 469–476, 2010. Cited on page 15.
[21] E. Goldoni, A. Savioli, M. Risi, and G. Paolo, “Experimental analysis ofrssi-based indoor localization with ieee 802.15.4,” Wireless Conference(EW), vol. 1, no. 1, pp. 71–77, 2010. Cited on pages 15 and 56.
[22] S. G. Kuruoglu, M. Erol, and S. Oktug, “Localization in wireless sensornetworks with range measurement errors,” Telecommunications, 2009.AICT ’09. Fifth Advanced International Conference on, vol. 1, no. 1,pp. 261–266, 2009. Cited on page 15.

Bibliography 61
[23] A. Zhang, Y. Yuan, Q. Wu, S. Zhu, and J. Deng, “Wireless localization basedon rssi fingerprint feature vector,” International Journal of DistributedSensor Networks, vol. 2015, no. 1, 2015. 7 pages. Cited on page 17.
[24] B. Shin, J. H. Lee, T. Lee, and H. S. Kim, “Enhanced weighted k-nearestneighbor algorithm for indoor wi-fi positioning systems,” ComputingTechnology and Information Management (ICCM), vol. 2, no. 1,pp. 574–577, 2012. Cited on page 18.
[25] Google, “Android BLE API,” 2016. [Online, 2016-03-23]. Available:http://developer.android.com/reference/android/bluetooth/le/package-summary.html. Cited on page 19.

Upphovsrätt
Detta dokument hålls tillgängligt på Internet — eller dess framtida ersättare —under 25 år från publiceringsdatum under förutsättning att inga extraordinäraomständigheter uppstår.
Tillgång till dokumentet innebär tillstånd för var och en att läsa, ladda ner,skriva ut enstaka kopior för enskilt bruk och att använda det oförändrat för icke-kommersiell forskning och för undervisning. Överföring av upphovsrätten viden senare tidpunkt kan inte upphäva detta tillstånd. All annan användning avdokumentet kräver upphovsmannens medgivande. För att garantera äktheten,säkerheten och tillgängligheten finns det lösningar av teknisk och administrativart.
Upphovsmannens ideella rätt innefattar rätt att bli nämnd som upphovsmani den omfattning som god sed kräver vid användning av dokumentet på ovanbeskrivna sätt samt skydd mot att dokumentet ändras eller presenteras i sådanform eller i sådant sammanhang som är kränkande för upphovsmannens litteräraeller konstnärliga anseende eller egenart.
För ytterligare information om Linköping University Electronic Press se förla-gets hemsida http://www.ep.liu.se/
Copyright
The publishers will keep this document online on the Internet — or its possi-ble replacement — for a period of 25 years from the date of publication barringexceptional circumstances.
The online availability of the document implies a permanent permission foranyone to read, to download, to print out single copies for his/her own use andto use it unchanged for any non-commercial research and educational purpose.Subsequent transfers of copyright cannot revoke this permission. All other usesof the document are conditional on the consent of the copyright owner. Thepublisher has taken technical and administrative measures to assure authenticity,security and accessibility.
According to intellectual property law the author has the right to be men-tioned when his/her work is accessed as described above and to be protectedagainst infringement.
For additional information about the Linköping University Electronic Pressand its procedures for publication and for assurance of document integrity, pleaserefer to its www home page: http://www.ep.liu.se/
© Oscar Silver