an improved solution to estimate relative permeability in tight · pdf file ·...
TRANSCRIPT
ORIGINAL PAPER - PRODUCTION GEOLOGY
An improved solution to estimate relative permeabilityin tight oil reservoirs
Xiaofeng Tian • Linsong Cheng • Yiqun Yan •
Hongjun Liu • Wenqi Zhao • Qiang Guo
Received: 9 January 2014 / Accepted: 20 July 2014 / Published online: 6 August 2014
� The Author(s) 2014. This article is published with open access at Springerlink.com
Abstract The relative permeability is a critical property
to predict field performance by reservoir numerical simu-
lation. However, determining the relative permeability
curve by experiments is time consuming and difficult for
tight oil reservoirs due to the extremely low permeability.
Therefore, many studies focus on the analytical solution to
determine the relative permeability curve. However, no
exiting solutions take the effect of boundary layer, Jamin
and wettability into account. This results in overestimated
results because boundary layer is even up to 60 % of the
throat and throat to pore ratio reaches up to 400 in tight oil
reservoirs. Therefore, an improved analytical solution is
desirable to solve these two problems. In this paper, based
on the collected experimental results, the Purcell’s solution
is modified and an improved solution considering the effect
of boundary layer, Jamin and wettability is developed.
Compared to the results of the relative permeability
experiments, the improved solution is more accurate and
reliable. Because the throat distribution of the tight oil
reservoir in Daqing Field is narrower than that in
Changqing Field, the productivity of the tight oil reservoir
in Daqing Field is less than that in Changqing Field at first.
However, the breakthrough time of the tight oil reservoir in
Daqing Field is longer than that in Changqing Field. This
improved solution can only be applied to tight oil reser-
voirs, because boundary layer and Jamin have little effect
on the flow behavior in conventional reservoirs.
Keywords Tight oil reservoir � Boundary layer � Jamin �Relative permeability
Introduction
There are generally two solutions to determine the
relative permeability curve. One is the experimental
solution and the other one is the analytical solution.
Due to the low permeability in tight oil reservoirs, the
displacement pressure is high and the flow rate is low
in relative permeability experiments. As a result, the
experimental solution is time consuming and difficult to
be conducted. The analytical solution, however, has
several advantages. First, because the analytical solution
is based on the capillary pressure data and mercury
injection experiments are widely used in tight oil res-
ervoirs, it has abundant basic data. Second, it can
reflect the effect of the micropore–throat structure on
relative permeability. The most important advantage is,
it is easy to obtain the relative permeability. Therefore,
many scholars focus on the analytical solution and have
got many achievements. Although in tight oil reservoirs
boundary layer is up to 60 % (Li et al. 2011) of the
throat, and pore-to-throat ratio reaches up to 400 (Li
et al. 2012), no existing solutions take them into
account. Therefore, existing solutions are not suitable
for tight oil reservoirs.
Purcell (1949) developed an equation to calculate mul-
tiphase relative permeability. In two-phase flow, the rela-
tive permeability can be calculated as follows:
Krwe ¼R Swe0
1p2cdSwe
R 1
01p2cdSwe
ð1Þ
X. Tian (&) � L. Cheng � Y. Yan � H. Liu � W. Zhao
China University of Petroleum, Beijing, China
e-mail: [email protected]
Q. Guo
Missouri University of Science and Technology, Rolla, USA
123
J Petrol Explor Prod Technol (2015) 5:305–314
DOI 10.1007/s13202-014-0129-7
Krnwe ¼R 1
Swe1p2cdSwe
R 1
01p2cdSwe
; ð2Þ
where Krwe is relative permeability of wetting phase; Swe is
saturation of wetting phase; pc is capillary pressure, MPa;
Krnwe is relative permeability of nonwetting phase.
Purcell’s solution neglects the effect of pore–throat
structure on the relative permeability. Therefore, Burdine
(1953) modified Purcell’s solution by introducing a tortu-
osity factor as a function of wetting phase saturation. The
relative permeability can be computed as follows:
Krwe ¼ ðkrweÞ2R Swe0
1p2cdSwe
R 1
01p2cdSwe
ð3Þ
Krnwe ¼ ðkrnweÞ2R 1
Swe1p2cdSwe
R 1
01p2cdSwe
; ð4Þ
where krwe is tortuosity ratio of wetting phase; krnwe is
tortuosity ratio of nonwetting phase.
According to Burdine, krw and krnw could be calculated
as follows:
krwe ¼sweð1ÞsweðSweÞ
¼ Swe � Sm
1� Smð5Þ
krnwe ¼snweð1ÞsnweðSweÞ
¼ 1� Swe � Se
1� Sm � Se; ð6Þ
where swe (1) is tortuosities of wetting phase when wetting
phase saturation is equal to 100 %; swe (Swe) is tortuositiesof wetting phase when wetting phase saturation is equal to
Swe; Sm is minimum wetting phase saturation from capil-
lary pressure curve; snwe is tortuosity of nonwetting phase;
Se is equilibrium saturation of nonwetting phase.
Honarpour et al. (1986) pointed out that the expression
for the wetting phase relative permeability fits the experi-
mental data much better than the expression for the
nonwetting phase.
According to Burdine’s solution, an analytical expression
for the wetting and nonwetting phase relative permeability
can be obtained if capillary pressure curves can be repre-
sented by a simple mathematical function. Corey (1954)
found that oil–gas capillary pressure curves can be expressed
approximately using the following linear relation:
1=p2c ¼ CS�we ð7Þ
where C is a constant.
S�we could be expressed as follows for the drainage case
S�we ¼Swe � Swer
1� Swerð8Þ
where Swe* is normalized wetting phase saturation; Swer is
residual saturation of wetting phase.
Although originally the Corey’s solution was not
developed for the imbibition case, it was used to calculate
the imbibition relative permeability by defining the nor-
malized wetting phase saturation as follows:
S�we ¼Swe � Swer
1� Swer � Snwer; ð9Þ
where Snwer is residual saturation of nonwetting phase.
Substituting Eq. 7 into Eqs. 3 and 4 with the assumption
that Se = 0 and Sm = Swr, Corey obtained the following
equations to calculate the wetting (oil) and nonwetting
(gas) phase relative permeability for drainage cases:
Krwe ¼ ðS�weÞ4 ð10Þ
Krnwe ¼ ð1� S�weÞ2½1� ðS�weÞ
2�: ð11Þ
A constraint to the use of Corey’s solution (Eqs. 10 and
11) is that the capillary pressure curve should be
represented by Eq. 7. Therefore, Brooks and Corey
(1966) modified the representation of capillary pressure
function to a more general form as follows:
pc ¼ peðS�weÞ�1=k ð12Þ
where pe is entry capillary pressure, MPa; k is pore size
distribution index.
When k is equal to 2, the Brooks–Corey’s solution
reduces to the Corey’s solution. Substituting Eq. 12 into
the Burdine’s solution (Eqs. 3 and 4) with the assumption
that Se = 0, Brooks and Corey derived equations to cal-
culate the wetting and nonwetting phase relative perme-
ability as follows:
Krwe ¼ ðS�weÞ2þ3kk ð13Þ
Krnwe ¼ ð1� S�weÞ2½1� ðS�weÞ
2þkk �: ð14Þ
Li and Horne (2002) tested different solutions of
calculating relative permeability were. It is found that the
Purcell’s solution is the best fit to the experimental data of
the wetting phase relative permeability for the cases
studied, as long as the measured capillary pressure curve
has the same residual saturation as the relative permeability
curve. The differences between the results of experiments
and the Purcell’s solution are almost negligible.
Li and Horne (2002) found that the Purcell’s solution
is proposed to calculate the wetting phase relative per-
meability and the Brooks–Corey’s solution is proposed to
calculate the nonwetting phase relative permeability.
However, the sum of the wetting and nonwetting phase
relative permeability is equal to one when using Pur-
cell’s solution and the sum of irreducible water satura-
tion and residual oil saturation are equal to zero when
using either of the two solutions. These may not be true
in tight oil reservoirs (Yang and Wei 2007). In addition,
306 J Petrol Explor Prod Technol (2015) 5:305–314
123
no existing solutions take wettability into account. In this
paper, two correlations to estimate boundary layer
thickness and permeability reduction, respectively, are
obtained. Then by incorporating the two correlations into
the Purcell’s solution, an improved solution considering
the effect of boundary layer, Jamin and wettability is
developed.
Assumptions
The major assumptions are as follows: (1) This improved
solution is based on the bundle of capillary tubes. The
bundle of capillary tubes consists of tubes whose radius
ranges from rmin to rmax. The length of all tubes is then
same. (2) Fluids are immiscible. (3) Rocks and fluids are
slightly incompressible. (4) Fluids have a constant viscos-
ity. (5) When water displaces oil, if water is the wetting
phase and the displacement pressure is p, the tubes whose
radius is less than r are filled with water and the others are
filled with oil. The relation between p and r is shown
Eq. 15.
p ¼ 2r cos hr
ð15Þ
where p is displacement pressure, MPa; r is interface
tension, mN/m; e is contact angle; r is the radius whose
capillary pressure is p, lm.
When water displaces oil, if water is the nonwetting
phase and the displacement pressure is p, the tubes whose
radius is less than r are filled with oil and the others are
filled with water. (6) A tube only contains one fluid. (7)
The flow behavior in bundle of capillary tubes obeys
Darcy’s equation and that in a capillary tube obeys
Poiseuille’s equation.
Estimation of irreducible water saturation and residual
oil saturation
Estimation of boundary layer saturation
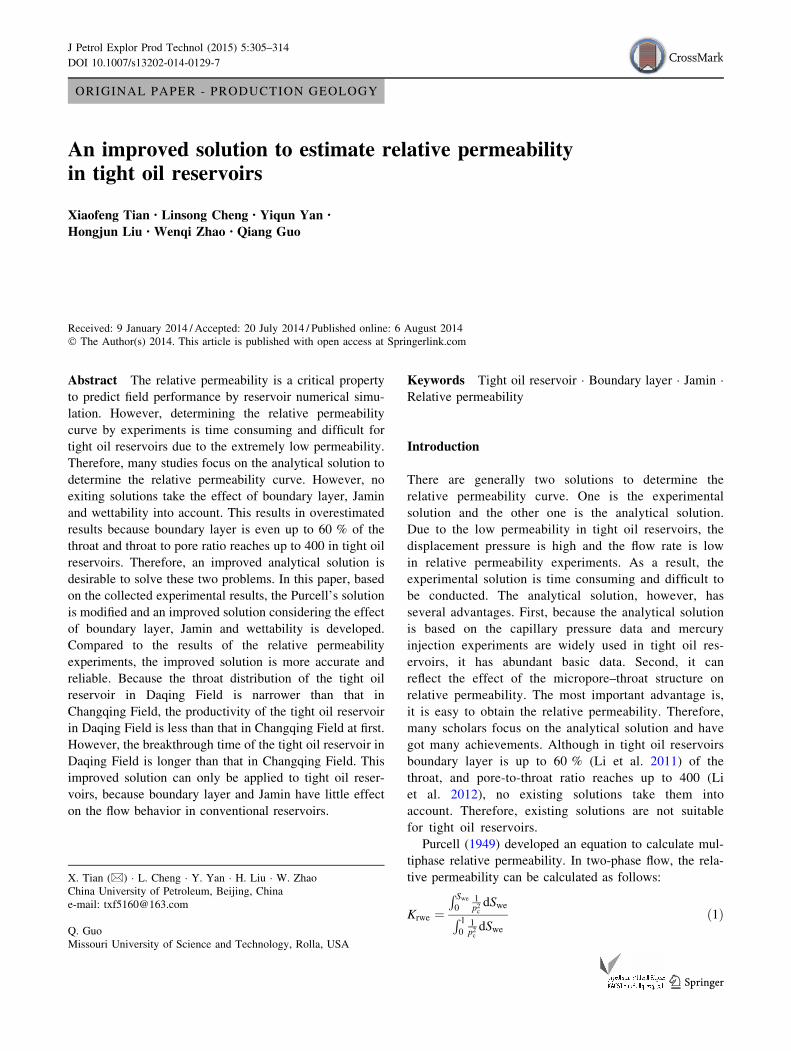
Figure 1 shows the results of microtube experiments to
study the effect of viscosity on boundary layer thickness
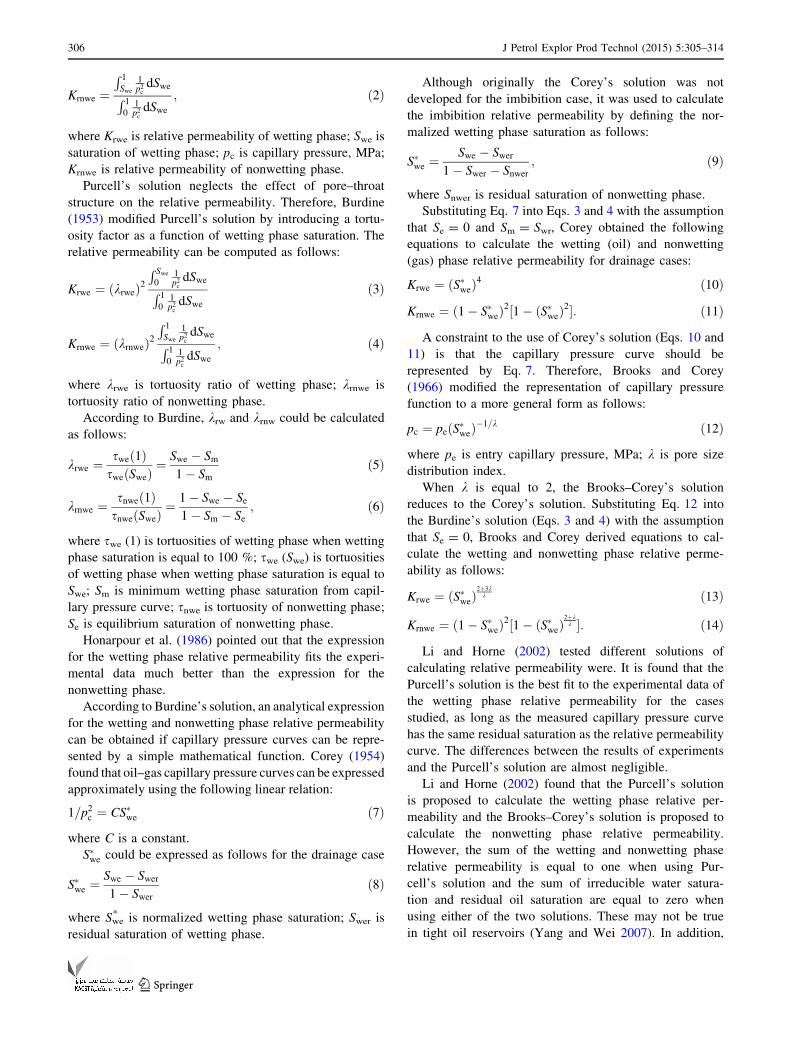
(Li and He 2005). Figure 2 shows the results of micro-
tube experiments to study the effect of pressure gradient
on boundary layer thickness (Li et al. 2011). Figure 3
shows the results of microtube experiments to study the
effect of tube radius on boundary layer thickness (Li
et al. 2011). It is known that the ratio of boundary layer
thickness to tube thickness has an exponential relation
with tube radius, a power relation with pressure gradient
and a linear relation with viscosity. However, when the
pressure gradient is larger than 1 MPa/m, the ratio of
boundary layer thickness to tube radius stays constant.
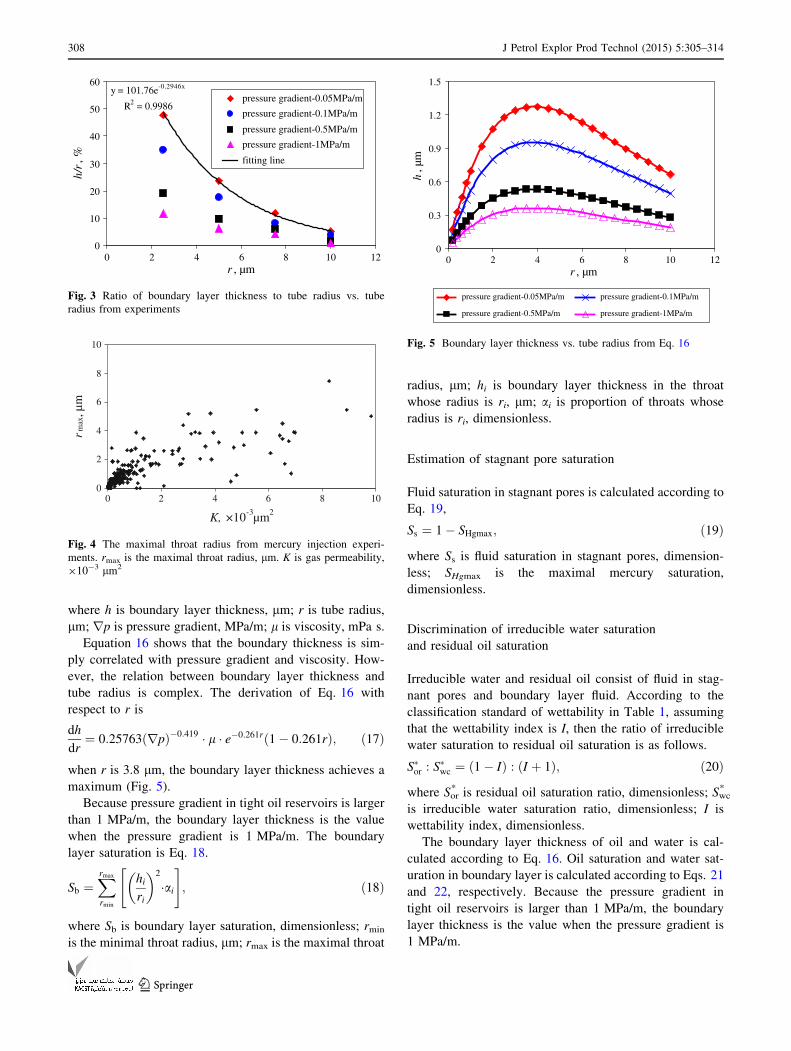
Figure 4 shows the maximal throat radius from 259
mercury injection experiments and shows that the max-
imal throat radius is less than 10 lm in tight oil reser-
voirs. However, the tube radius in the experiments to
study the effect of viscosity does not belong to tight oil
reservoirs. Thus, experimental data whose tube radius is
less than 10 was used to obtain a correlation. Notice that
the relation of boundary layer thickness and viscosity is
the same when tube radius is less than 10 lm. Therefore,
boundary layer thickness and viscosity is simplified to
linear relation with intercept boundary layer thickness is
0, when viscosity is 0. Based on the experimental results,
we obtain a new correlation (Eq. 16) to estimate
boundary layer thickness.
h ¼ r � 0:25763e�0:261rðrpÞ�0:419 � l ð16Þ
y = 0.0257x + 0.6261
R2 = 0.998
0
0.2
0.4
0.6
0.8
1
0 2 4 6 8 10 12
µ , mPa·s
h, µ
m
pressure gradient-0.05MPa/m pressure gradient-0.1MPa/mpressure gradient-0.5MPa/m pressure gradient-1MPa/mfitting line
Fig. 1 Boundary layer thickness vs. viscosity obtained from exper-
iments. h is boundary layer thickness, lm; l is viscosity, mPa s
y = 12.567x-0.4453
R2 = 0.9375
0
10
20
30
40
50
60
70
0 1 2 3 4 5 6
p , MPa/m
h/r,
%
tube radius-2.5µm
tube radius-5.0µm
tube radius-7.5µm
tube radius-10.0µm
fitting line
Fig. 2 Ratio of boundary layer thickness to tube radius vs. pressure
gradient from experiments. r is tube radius, lm; rp is pressure
gradient, MPa/m
J Petrol Explor Prod Technol (2015) 5:305–314 307
123
where h is boundary layer thickness, lm; r is tube radius,
lm; rp is pressure gradient, MPa/m; l is viscosity, mPa s.
Equation 16 shows that the boundary thickness is sim-
ply correlated with pressure gradient and viscosity. How-
ever, the relation between boundary layer thickness and
tube radius is complex. The derivation of Eq. 16 with
respect to r is
dh
dr¼ 0:25763ðrpÞ�0:419 � l � e�0:261rð1� 0:261rÞ; ð17Þ
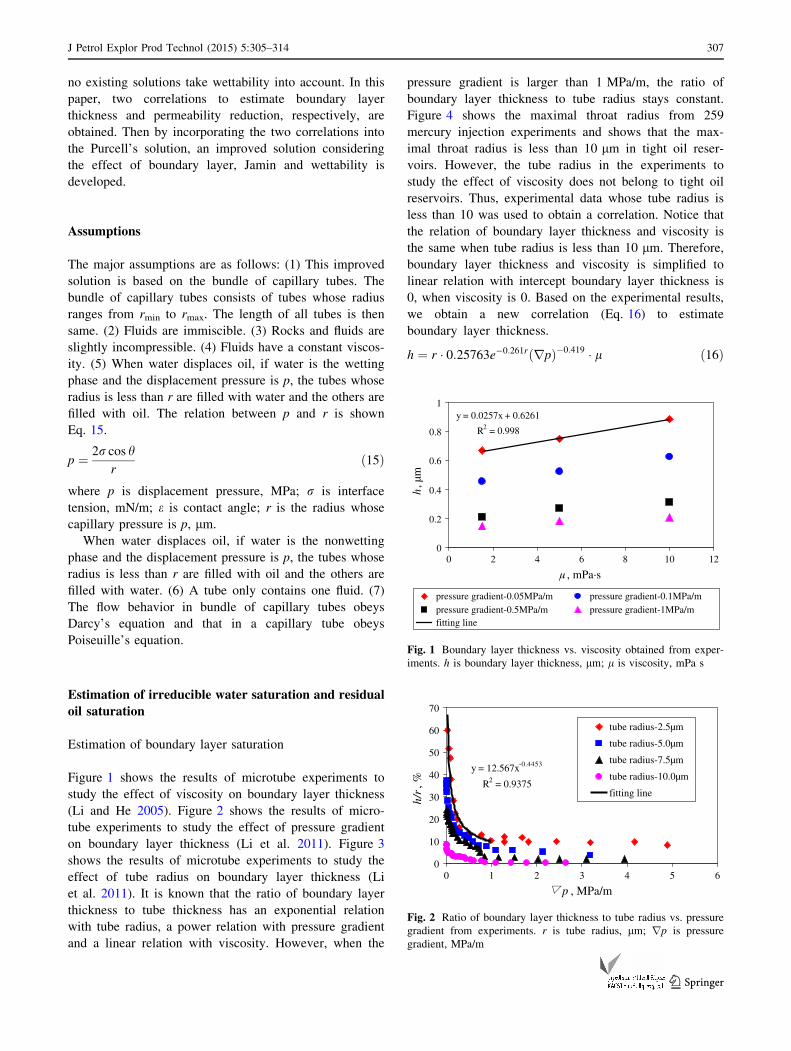
when r is 3.8 lm, the boundary layer thickness achieves a
maximum (Fig. 5).
Because pressure gradient in tight oil reservoirs is larger
than 1 MPa/m, the boundary layer thickness is the value
when the pressure gradient is 1 MPa/m. The boundary
layer saturation is Eq. 18.
Sb ¼Xrmax
rmin
hi
ri
� �2
�ai
" #
; ð18Þ
where Sb is boundary layer saturation, dimensionless; rmin
is the minimal throat radius, lm; rmax is the maximal throat
radius, lm; hi is boundary layer thickness in the throat
whose radius is ri, lm; ai is proportion of throats whose
radius is ri, dimensionless.
Estimation of stagnant pore saturation
Fluid saturation in stagnant pores is calculated according to
Eq. 19,
Ss ¼ 1� SHgmax; ð19Þ
where Ss is fluid saturation in stagnant pores, dimension-
less; SHgmax is the maximal mercury saturation,
dimensionless.
Discrimination of irreducible water saturation
and residual oil saturation
Irreducible water and residual oil consist of fluid in stag-
nant pores and boundary layer fluid. According to the
classification standard of wettability in Table 1, assuming
that the wettability index is I, then the ratio of irreducible
water saturation to residual oil saturation is as follows.
S�or : S�wc ¼ ð1� IÞ : ðI þ 1Þ; ð20Þ
where Sor* is residual oil saturation ratio, dimensionless; Swc
*
is irreducible water saturation ratio, dimensionless; I is
wettability index, dimensionless.
The boundary layer thickness of oil and water is cal-
culated according to Eq. 16. Oil saturation and water sat-
uration in boundary layer is calculated according to Eqs. 21
and 22, respectively. Because the pressure gradient in
tight oil reservoirs is larger than 1 MPa/m, the boundary
layer thickness is the value when the pressure gradient is
1 MPa/m.
0
2
4
6
8
10
0 2 4 6 8 10
K, ×10-3µm2
r max
, µm
Fig. 4 The maximal throat radius from mercury injection experi-
ments. rmax is the maximal throat radius, lm. K is gas permeability,
910-3 lm2
0
0.3
0.6
0.9
1.2
1.5
0 2 4 6 8 10 12r , µm
h, µ
m
pressure gradient-0.05MPa/m pressure gradient-0.1MPa/m
pressure gradient-0.5MPa/m pressure gradient-1MPa/m
Fig. 5 Boundary layer thickness vs. tube radius from Eq. 16
y = 101.76e-0.2946x
R2 = 0.9986
0
10
20
30
40
50
60
0 2 4 6 8 10 12r , µm
h/r,
%
pressure gradient-0.05MPa/m
pressure gradient-0.1MPa/m
pressure gradient-0.5MPa/m
pressure gradient-1MPa/m
fitting line
Fig. 3 Ratio of boundary layer thickness to tube radius vs. tube
radius from experiments
308 J Petrol Explor Prod Technol (2015) 5:305–314
123
S1or ¼S�
or
S�orþ S�
wc
�Xrmax
rmin
hoi
ri
� �2
�ai
" #
ð21Þ
S1wc ¼S�
wc
S�orþ S�
wc
�Xrmax
rmin
hwi
ri
� �2
�ai
" #
; ð22Þ
where Sor1 is oil saturation in boundary layer, dimension-
less; Swc1 is water saturation in boundary layer, dimen-
sionless; hoi is boundary layer thickness of oil in the throat
whose radius is ri, lm; hwi is boundary layer thickness of
water in the throat whose radius is ri, lm.
The residual oil saturation and irreducible water satu-
ration in stagnant pores are calculated according to Eqs. 23
and 24.
S2or¼
S�or
S�orþ S�
wc
� Ss ð23Þ
S2wc ¼S�
wc
S�orþ S�
wc
� Ss; ð24Þ
where Sor2 is oil saturation in stagnant pores, dimensionless;
Swc2 is water saturation in stagnant pores, dimensionless.
Therefore, the residual oil saturation and irreducible
water saturation are obtained in Eqs. 25 and 26.
Sor ¼ S1or þ S2or ð25Þ
Swc ¼ S1wc þ S2wc; ð26Þ
where Sor is residual oil saturation, dimensionless; Swc is
irreducible water saturation, dimensionless.
Fraction of permeability reduction
Fraction of permeability reduction at co-seepage point
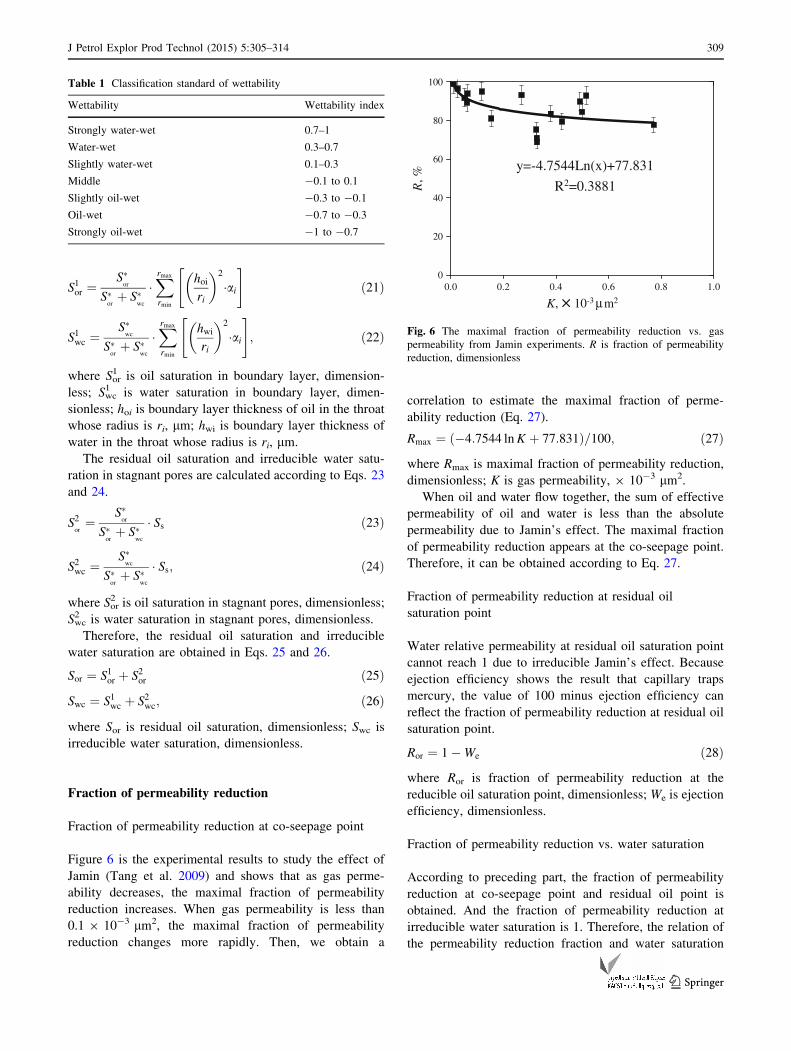
Figure 6 is the experimental results to study the effect of
Jamin (Tang et al. 2009) and shows that as gas perme-
ability decreases, the maximal fraction of permeability
reduction increases. When gas permeability is less than
0.1 9 10-3 lm2, the maximal fraction of permeability
reduction changes more rapidly. Then, we obtain a
correlation to estimate the maximal fraction of perme-
ability reduction (Eq. 27).
Rmax ¼ �4:7544 lnK þ 77:831ð Þ=100; ð27Þ
where Rmax is maximal fraction of permeability reduction,
dimensionless; K is gas permeability, 9 10-3 lm2.
When oil and water flow together, the sum of effective
permeability of oil and water is less than the absolute
permeability due to Jamin’s effect. The maximal fraction
of permeability reduction appears at the co-seepage point.
Therefore, it can be obtained according to Eq. 27.
Fraction of permeability reduction at residual oil
saturation point
Water relative permeability at residual oil saturation point
cannot reach 1 due to irreducible Jamin’s effect. Because
ejection efficiency shows the result that capillary traps
mercury, the value of 100 minus ejection efficiency can
reflect the fraction of permeability reduction at residual oil
saturation point.
Ror ¼ 1�We ð28Þ
where Ror is fraction of permeability reduction at the
reducible oil saturation point, dimensionless; We is ejection
efficiency, dimensionless.
Fraction of permeability reduction vs. water saturation
According to preceding part, the fraction of permeability
reduction at co-seepage point and residual oil point is
obtained. And the fraction of permeability reduction at
irreducible water saturation is 1. Therefore, the relation of
the permeability reduction fraction and water saturation
0.0 0.2 0.4 0.6 0.8 1.00
20
40
60
80
100
R, %
K, × 10-3µm2
y=-4.7544Ln(x)+77.831
R2=0.3881
Fig. 6 The maximal fraction of permeability reduction vs. gas
permeability from Jamin experiments. R is fraction of permeability
reduction, dimensionless
Table 1 Classification standard of wettability
Wettability Wettability index
Strongly water-wet 0.7–1
Water-wet 0.3–0.7
Slightly water-wet 0.1–0.3
Middle -0.1 to 0.1
Slightly oil-wet -0.3 to -0.1
Oil-wet -0.7 to -0.3
Strongly oil-wet -1 to -0.7
J Petrol Explor Prod Technol (2015) 5:305–314 309
123
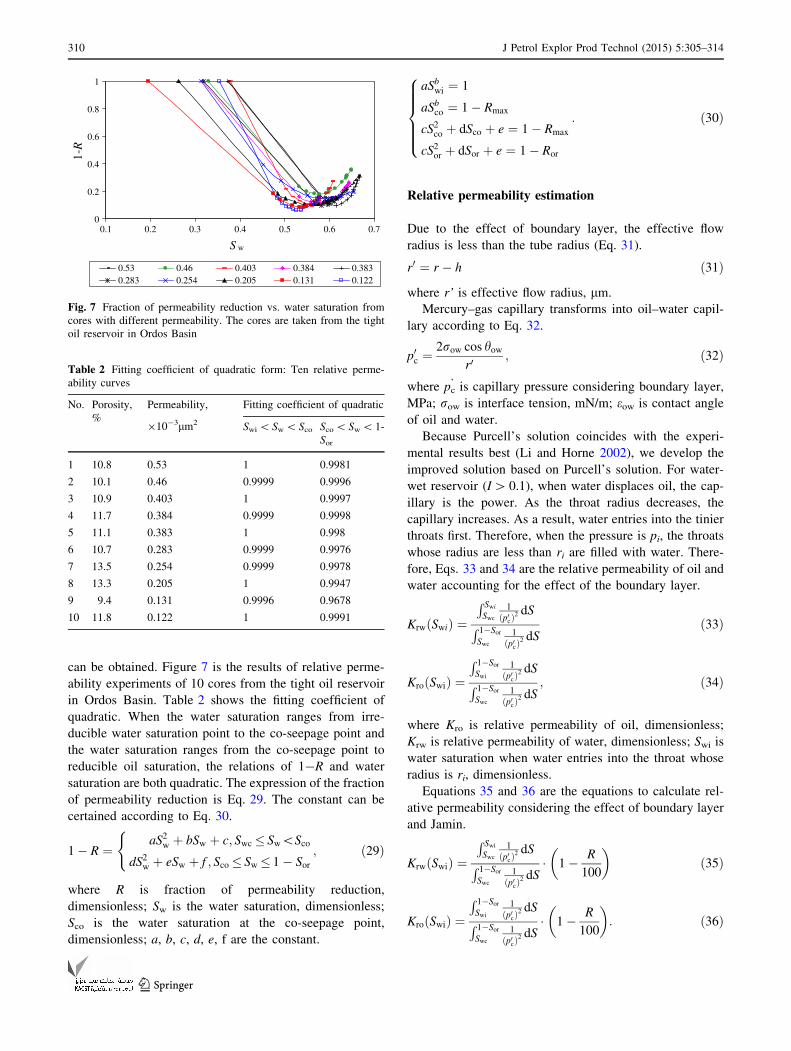
can be obtained. Figure 7 is the results of relative perme-
ability experiments of 10 cores from the tight oil reservoir
in Ordos Basin. Table 2 shows the fitting coefficient of
quadratic. When the water saturation ranges from irre-
ducible water saturation point to the co-seepage point and
the water saturation ranges from the co-seepage point to
reducible oil saturation, the relations of 1-R and water
saturation are both quadratic. The expression of the fraction
of permeability reduction is Eq. 29. The constant can be
certained according to Eq. 30.
1� R ¼aS2w þ bSw þ c; Swc � Sw\Sco
dS2w þ eSw þ f ; Sco � Sw � 1� Sor
(
; ð29Þ
where R is fraction of permeability reduction,
dimensionless; Sw is the water saturation, dimensionless;
Sco is the water saturation at the co-seepage point,
dimensionless; a, b, c, d, e, f are the constant.
aSbwi ¼ 1
aSbco ¼ 1� Rmax
cS2co þ dSco þ e ¼ 1� Rmax
cS2or þ dSor þ e ¼ 1� Ror
8>>>><
>>>>:
: ð30Þ
Relative permeability estimation
Due to the effect of boundary layer, the effective flow
radius is less than the tube radius (Eq. 31).
r0 ¼ r � h ð31Þ
where r’ is effective flow radius, lm.
Mercury–gas capillary transforms into oil–water capil-
lary according to Eq. 32.
p0c ¼2row cos how
r0; ð32Þ
where pc’ is capillary pressure considering boundary layer,
MPa; row is interface tension, mN/m; eow is contact angle
of oil and water.
Because Purcell’s solution coincides with the experi-
mental results best (Li and Horne 2002), we develop the
improved solution based on Purcell’s solution. For water-
wet reservoir (I[ 0.1), when water displaces oil, the cap-
illary is the power. As the throat radius decreases, the
capillary increases. As a result, water entries into the tinier
throats first. Therefore, when the pressure is pi, the throats
whose radius are less than ri are filled with water. There-
fore, Eqs. 33 and 34 are the relative permeability of oil and
water accounting for the effect of the boundary layer.
KrwðSwiÞ ¼
R SwiSwc
1
ðp0cÞ2 dS
R 1�SorSwc
1
ðp0cÞ2 dS
ð33Þ
KroðSwiÞ ¼
R 1�SorSwi
1
ðp0cÞ2 dS
R 1�SorSwc
1
ðp0cÞ2 dS
; ð34Þ
where Kro is relative permeability of oil, dimensionless;
Krw is relative permeability of water, dimensionless; Swi is
water saturation when water entries into the throat whose
radius is ri, dimensionless.
Equations 35 and 36 are the equations to calculate rel-
ative permeability considering the effect of boundary layer
and Jamin.
KrwðSwiÞ ¼
R SwiSwc
1
ðp0cÞ2 dS
R 1�SorSwc
1
ðp0cÞ2 dS
� 1� R
100
� �
ð35Þ
KroðSwiÞ ¼
R 1�SorSwi
1
ðp0cÞ2 dS
R 1�SorSwc
1
ðp0cÞ2 dS
� 1� R
100
� �
: ð36Þ
0
0.2
0.4
0.6
0.8
1
0.1 0.2 0.3 0.4 0.5 0.6 0.7
S w
1-R
0.53 0.46 0.403 0.384 0.3830.283 0.254 0.205 0.131 0.122
Fig. 7 Fraction of permeability reduction vs. water saturation from
cores with different permeability. The cores are taken from the tight
oil reservoir in Ordos Basin
Table 2 Fitting coefficient of quadratic form: Ten relative perme-
ability curves
No. Porosity,
%
Permeability,
910-3lm2
Fitting coefficient of quadratic
Swi\ Sw\ Sco Sco\ Sw\ 1-
Sor
1 10.8 0.53 1 0.9981
2 10.1 0.46 0.9999 0.9996
3 10.9 0.403 1 0.9997
4 11.7 0.384 0.9999 0.9998
5 11.1 0.383 1 0.998
6 10.7 0.283 0.9999 0.9976
7 13.5 0.254 0.9999 0.9978
8 13.3 0.205 1 0.9947
9 9.4 0.131 0.9996 0.9678
10 11.8 0.122 1 0.9991
310 J Petrol Explor Prod Technol (2015) 5:305–314
123
For oil-wet reservoir (I\ 0.1), when water displaces oil,
the capillary is the resistance. As the throat radius
decreases, the capillary increases. As a result, water
entries into the larger throats first. Therefore when the
pressure is pi, the throats whose radius are larger than ri are
filled with water. Therefore, Eqs. 37 and 38 are the relative
permeability of oil and water.
KrwðswiÞ ¼
R 1�SorSwi
1
ðp0cÞ2 dS
R 1�SorSwc
1
ðp0cÞ2 dS
� 1� R
100
� �
ð37Þ
KroðSwiÞ ¼
R SwiSwc
1
ðp0cÞ2 dS
R 1�SorSwc
1
ðp0cÞ2 dS
� 1� R
100
� �
: ð38Þ
Results and discussion
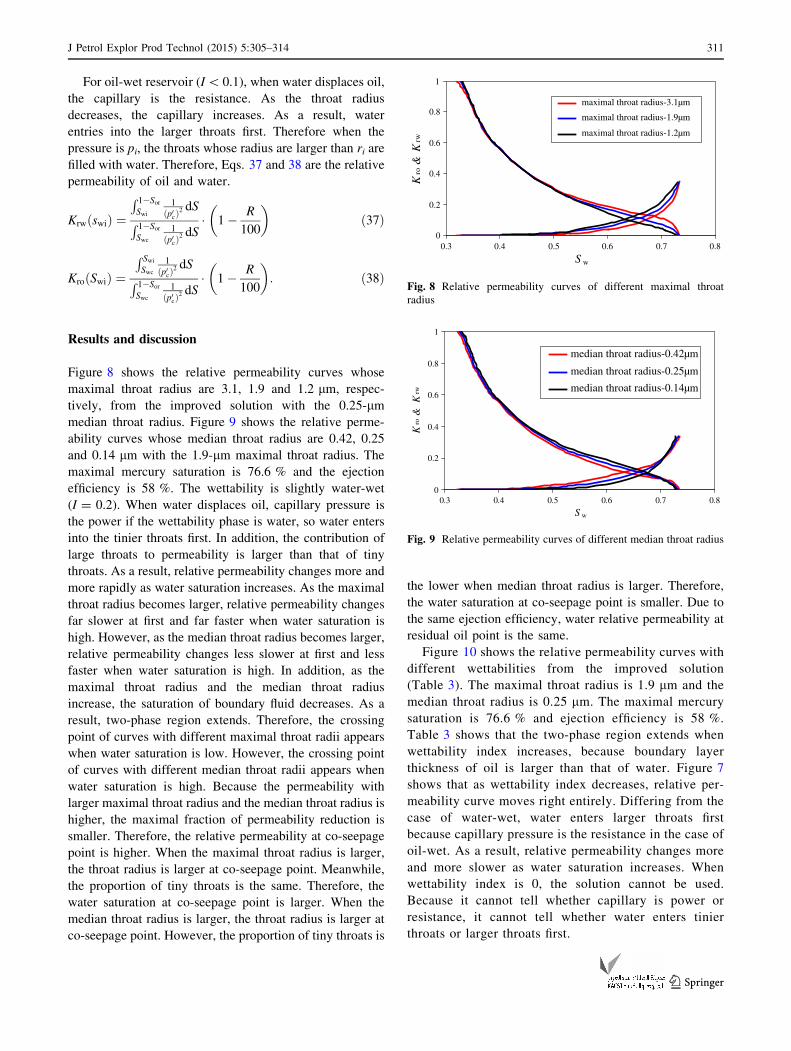
Figure 8 shows the relative permeability curves whose
maximal throat radius are 3.1, 1.9 and 1.2 lm, respec-
tively, from the improved solution with the 0.25-lmmedian throat radius. Figure 9 shows the relative perme-
ability curves whose median throat radius are 0.42, 0.25
and 0.14 lm with the 1.9-lm maximal throat radius. The
maximal mercury saturation is 76.6 % and the ejection
efficiency is 58 %. The wettability is slightly water-wet
(I = 0.2). When water displaces oil, capillary pressure is
the power if the wettability phase is water, so water enters
into the tinier throats first. In addition, the contribution of
large throats to permeability is larger than that of tiny
throats. As a result, relative permeability changes more and
more rapidly as water saturation increases. As the maximal
throat radius becomes larger, relative permeability changes
far slower at first and far faster when water saturation is
high. However, as the median throat radius becomes larger,
relative permeability changes less slower at first and less
faster when water saturation is high. In addition, as the
maximal throat radius and the median throat radius
increase, the saturation of boundary fluid decreases. As a
result, two-phase region extends. Therefore, the crossing
point of curves with different maximal throat radii appears
when water saturation is low. However, the crossing point
of curves with different median throat radii appears when
water saturation is high. Because the permeability with
larger maximal throat radius and the median throat radius is
higher, the maximal fraction of permeability reduction is
smaller. Therefore, the relative permeability at co-seepage
point is higher. When the maximal throat radius is larger,
the throat radius is larger at co-seepage point. Meanwhile,
the proportion of tiny throats is the same. Therefore, the
water saturation at co-seepage point is larger. When the
median throat radius is larger, the throat radius is larger at
co-seepage point. However, the proportion of tiny throats is
the lower when median throat radius is larger. Therefore,
the water saturation at co-seepage point is smaller. Due to
the same ejection efficiency, water relative permeability at
residual oil point is the same.
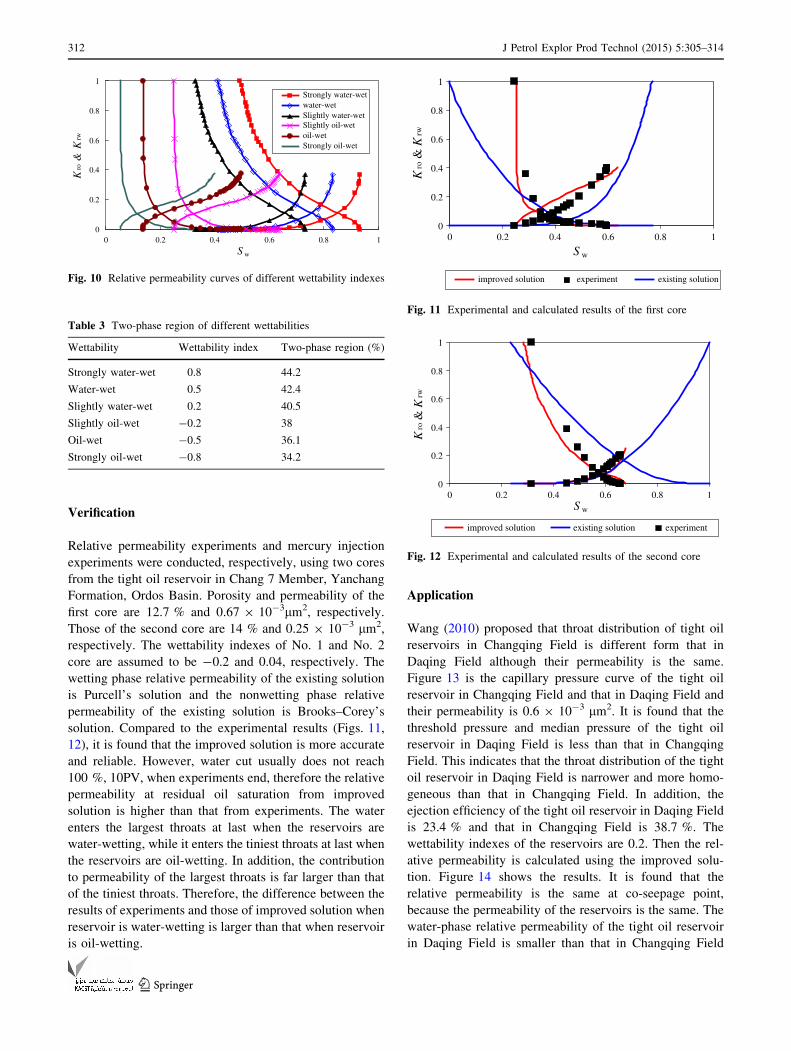
Figure 10 shows the relative permeability curves with
different wettabilities from the improved solution
(Table 3). The maximal throat radius is 1.9 lm and the
median throat radius is 0.25 lm. The maximal mercury
saturation is 76.6 % and ejection efficiency is 58 %.
Table 3 shows that the two-phase region extends when
wettability index increases, because boundary layer
thickness of oil is larger than that of water. Figure 7
shows that as wettability index decreases, relative per-
meability curve moves right entirely. Differing from the
case of water-wet, water enters larger throats first
because capillary pressure is the resistance in the case of
oil-wet. As a result, relative permeability changes more
and more slower as water saturation increases. When
wettability index is 0, the solution cannot be used.
Because it cannot tell whether capillary is power or
resistance, it cannot tell whether water enters tinier
throats or larger throats first.
0
0.2
0.4
0.6
0.8
1
0.3 0.4 0.5 0.6 0.7 0.8
S w
Kro
&K
rw
maximal throat radius-3.1µm
maximal throat radius-1.9µm
maximal throat radius-1.2µm
Fig. 8 Relative permeability curves of different maximal throat
radius
0
0.2
0.4
0.6
0.8
1
0.3 0.4 0.5 0.6 0.7 0.8
S w
Kro
&K
rw
median throat radius-0.42µm
median throat radius-0.25µm
median throat radius-0.14µm
Fig. 9 Relative permeability curves of different median throat radius
J Petrol Explor Prod Technol (2015) 5:305–314 311
123
Verification
Relative permeability experiments and mercury injection
experiments were conducted, respectively, using two cores
from the tight oil reservoir in Chang 7 Member, Yanchang
Formation, Ordos Basin. Porosity and permeability of the
first core are 12.7 % and 0.67 9 10-3lm2, respectively.
Those of the second core are 14 % and 0.25 9 10-3 lm2,
respectively. The wettability indexes of No. 1 and No. 2
core are assumed to be -0.2 and 0.04, respectively. The
wetting phase relative permeability of the existing solution
is Purcell’s solution and the nonwetting phase relative
permeability of the existing solution is Brooks–Corey’s
solution. Compared to the experimental results (Figs. 11,
12), it is found that the improved solution is more accurate
and reliable. However, water cut usually does not reach
100 %, 10PV, when experiments end, therefore the relative
permeability at residual oil saturation from improved
solution is higher than that from experiments. The water
enters the largest throats at last when the reservoirs are
water-wetting, while it enters the tiniest throats at last when
the reservoirs are oil-wetting. In addition, the contribution
to permeability of the largest throats is far larger than that
of the tiniest throats. Therefore, the difference between the
results of experiments and those of improved solution when
reservoir is water-wetting is larger than that when reservoir
is oil-wetting.
Application
Wang (2010) proposed that throat distribution of tight oil
reservoirs in Changqing Field is different form that in
Daqing Field although their permeability is the same.
Figure 13 is the capillary pressure curve of the tight oil
reservoir in Changqing Field and that in Daqing Field and
their permeability is 0.6 9 10-3 lm2. It is found that the
threshold pressure and median pressure of the tight oil
reservoir in Daqing Field is less than that in Changqing
Field. This indicates that the throat distribution of the tight
oil reservoir in Daqing Field is narrower and more homo-
geneous than that in Changqing Field. In addition, the
ejection efficiency of the tight oil reservoir in Daqing Field
is 23.4 % and that in Changqing Field is 38.7 %. The
wettability indexes of the reservoirs are 0.2. Then the rel-
ative permeability is calculated using the improved solu-
tion. Figure 14 shows the results. It is found that the
relative permeability is the same at co-seepage point,
because the permeability of the reservoirs is the same. The
water-phase relative permeability of the tight oil reservoir
in Daqing Field is smaller than that in Changqing Field
0
0.2
0.4
0.6
0.8
1
0 0.2 0.4 0.6 0.8 1
S w
Kro
&K
rw
Strongly water-wetwater-wetSlightly water-wetSlightly oil-wetoil-wetStrongly oil-wet
Fig. 10 Relative permeability curves of different wettability indexes
0
0.2
0.4
0.6
0.8
1
0 0.2 0.4 0.6 0.8 1
S w
Kro
& K
rw
improved solution experiment existing solution
Fig. 11 Experimental and calculated results of the first core
0
0.2
0.4
0.6
0.8
1
0 0.2 0.4 0.6 0.8 1S w
Kro
& K
rw
improved solution existing solution experiment
Fig. 12 Experimental and calculated results of the second core
Table 3 Two-phase region of different wettabilities
Wettability Wettability index Two-phase region (%)
Strongly water-wet 0.8 44.2
Water-wet 0.5 42.4
Slightly water-wet 0.2 40.5
Slightly oil-wet -0.2 38
Oil-wet -0.5 36.1
Strongly oil-wet -0.8 34.2
312 J Petrol Explor Prod Technol (2015) 5:305–314
123
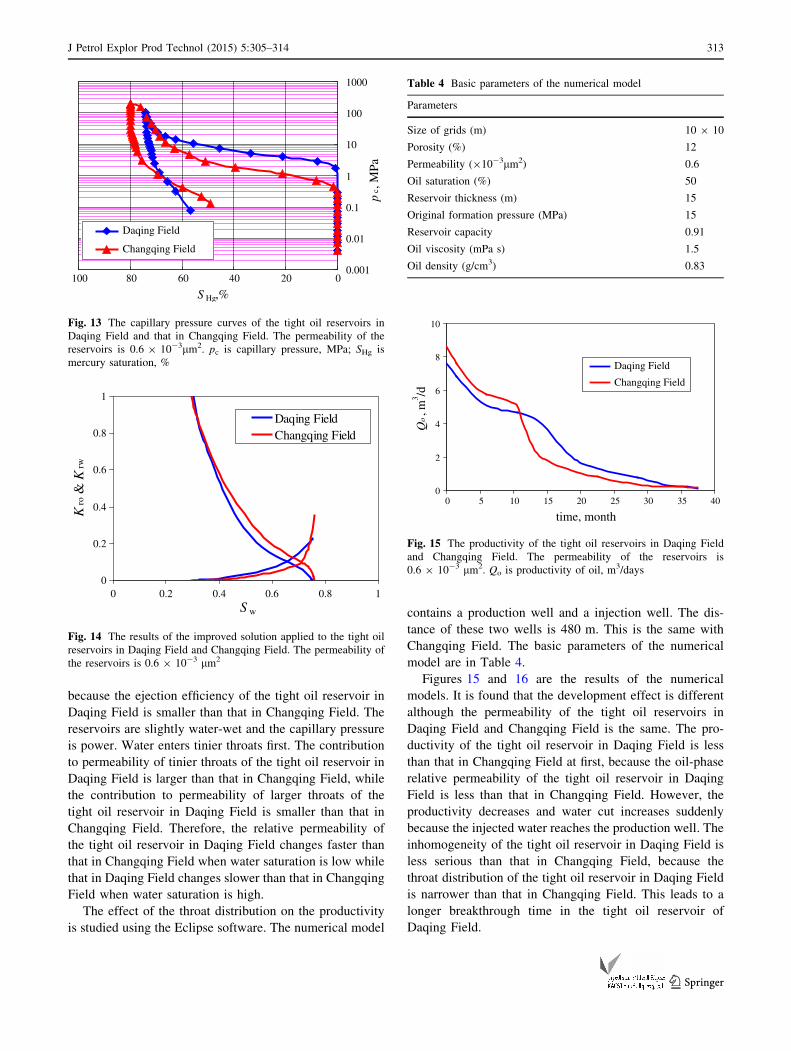
because the ejection efficiency of the tight oil reservoir in
Daqing Field is smaller than that in Changqing Field. The
reservoirs are slightly water-wet and the capillary pressure
is power. Water enters tinier throats first. The contribution
to permeability of tinier throats of the tight oil reservoir in
Daqing Field is larger than that in Changqing Field, while
the contribution to permeability of larger throats of the
tight oil reservoir in Daqing Field is smaller than that in
Changqing Field. Therefore, the relative permeability of
the tight oil reservoir in Daqing Field changes faster than
that in Changqing Field when water saturation is low while
that in Daqing Field changes slower than that in Changqing
Field when water saturation is high.
The effect of the throat distribution on the productivity
is studied using the Eclipse software. The numerical model
contains a production well and a injection well. The dis-
tance of these two wells is 480 m. This is the same with
Changqing Field. The basic parameters of the numerical
model are in Table 4.
Figures 15 and 16 are the results of the numerical
models. It is found that the development effect is different
although the permeability of the tight oil reservoirs in
Daqing Field and Changqing Field is the same. The pro-
ductivity of the tight oil reservoir in Daqing Field is less
than that in Changqing Field at first, because the oil-phase
relative permeability of the tight oil reservoir in Daqing
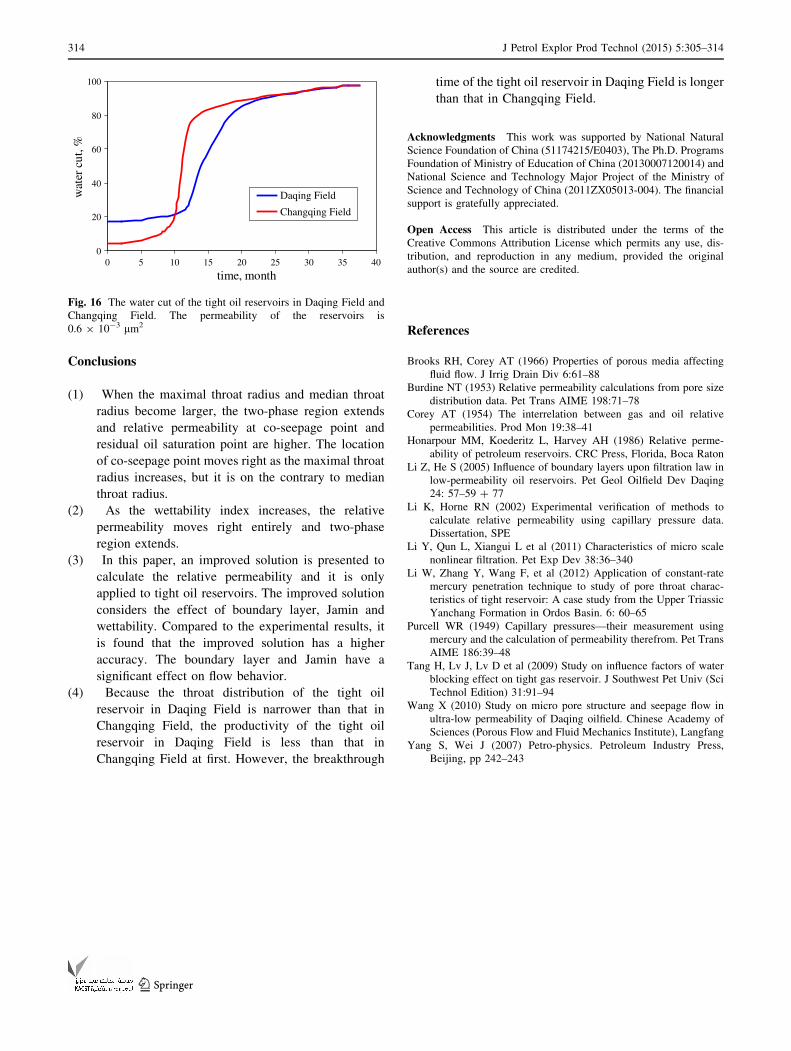
Field is less than that in Changqing Field. However, the
productivity decreases and water cut increases suddenly
because the injected water reaches the production well. The
inhomogeneity of the tight oil reservoir in Daqing Field is
less serious than that in Changqing Field, because the
throat distribution of the tight oil reservoir in Daqing Field
is narrower than that in Changqing Field. This leads to a
longer breakthrough time in the tight oil reservoir of
Daqing Field.
0.001
0.01
0.1
1
10
100
1000
020406080100
S Hg,%
pc,
MPa
Daqing Field
Changqing Field
Fig. 13 The capillary pressure curves of the tight oil reservoirs in
Daqing Field and that in Changqing Field. The permeability of the
reservoirs is 0.6 9 10-3lm2. pc is capillary pressure, MPa; SHg is
mercury saturation, %
0
0.2
0.4
0.6
0.8
1
0 0.2 0.4 0.6 0.8 1S w
Kro
& K
rw
Daqing FieldChangqing Field
Fig. 14 The results of the improved solution applied to the tight oil
reservoirs in Daqing Field and Changqing Field. The permeability of
the reservoirs is 0.6 9 10-3 lm2
0
2
4
6
8
10
0 5 10 15 20 25 30 35 40
time, month
Qo, m
3 /d
Daqing Field
Changqing Field
Fig. 15 The productivity of the tight oil reservoirs in Daqing Field
and Changqing Field. The permeability of the reservoirs is
0.6 9 10-3 lm2. Qo is productivity of oil, m3/days
Table 4 Basic parameters of the numerical model
Parameters
Size of grids (m) 10 9 10
Porosity (%) 12
Permeability (910-3lm2) 0.6
Oil saturation (%) 50
Reservoir thickness (m) 15
Original formation pressure (MPa) 15
Reservoir capacity 0.91
Oil viscosity (mPa s) 1.5
Oil density (g/cm3) 0.83
J Petrol Explor Prod Technol (2015) 5:305–314 313
123
Conclusions
(1) When the maximal throat radius and median throat
radius become larger, the two-phase region extends
and relative permeability at co-seepage point and
residual oil saturation point are higher. The location
of co-seepage point moves right as the maximal throat
radius increases, but it is on the contrary to median
throat radius.
(2) As the wettability index increases, the relative
permeability moves right entirely and two-phase
region extends.
(3) In this paper, an improved solution is presented to
calculate the relative permeability and it is only
applied to tight oil reservoirs. The improved solution
considers the effect of boundary layer, Jamin and
wettability. Compared to the experimental results, it
is found that the improved solution has a higher
accuracy. The boundary layer and Jamin have a
significant effect on flow behavior.
(4) Because the throat distribution of the tight oil
reservoir in Daqing Field is narrower than that in
Changqing Field, the productivity of the tight oil
reservoir in Daqing Field is less than that in
Changqing Field at first. However, the breakthrough
time of the tight oil reservoir in Daqing Field is longer
than that in Changqing Field.
Acknowledgments This work was supported by National Natural
Science Foundation of China (51174215/E0403), The Ph.D. Programs
Foundation of Ministry of Education of China (20130007120014) and
National Science and Technology Major Project of the Ministry of
Science and Technology of China (2011ZX05013-004). The financial
support is gratefully appreciated.
Open Access This article is distributed under the terms of the
Creative Commons Attribution License which permits any use, dis-
tribution, and reproduction in any medium, provided the original
author(s) and the source are credited.
References
Brooks RH, Corey AT (1966) Properties of porous media affecting
fluid flow. J Irrig Drain Div 6:61–88
Burdine NT (1953) Relative permeability calculations from pore size
distribution data. Pet Trans AIME 198:71–78
Corey AT (1954) The interrelation between gas and oil relative
permeabilities. Prod Mon 19:38–41
Honarpour MM, Koederitz L, Harvey AH (1986) Relative perme-
ability of petroleum reservoirs. CRC Press, Florida, Boca Raton
Li Z, He S (2005) Influence of boundary layers upon filtration law in
low-permeability oil reservoirs. Pet Geol Oilfield Dev Daqing
24: 57–59 ? 77
Li K, Horne RN (2002) Experimental verification of methods to
calculate relative permeability using capillary pressure data.
Dissertation, SPE
Li Y, Qun L, Xiangui L et al (2011) Characteristics of micro scale
nonlinear filtration. Pet Exp Dev 38:36–340
Li W, Zhang Y, Wang F, et al (2012) Application of constant-rate
mercury penetration technique to study of pore throat charac-
teristics of tight reservoir: A case study from the Upper Triassic
Yanchang Formation in Ordos Basin. 6: 60–65
Purcell WR (1949) Capillary pressures—their measurement using
mercury and the calculation of permeability therefrom. Pet Trans
AIME 186:39–48
Tang H, Lv J, Lv D et al (2009) Study on influence factors of water
blocking effect on tight gas reservoir. J Southwest Pet Univ (Sci
Technol Edition) 31:91–94
Wang X (2010) Study on micro pore structure and seepage flow in
ultra-low permeability of Daqing oilfield. Chinese Academy of
Sciences (Porous Flow and Fluid Mechanics Institute), Langfang
Yang S, Wei J (2007) Petro-physics. Petroleum Industry Press,
Beijing, pp 242–243
0
20
40
60
80
100
0 5 10 15 20 25 30 35 40
time, month
wat
er c
ut, %
Daqing Field
Changqing Field
Fig. 16 The water cut of the tight oil reservoirs in Daqing Field and
Changqing Field. The permeability of the reservoirs is
0.6 9 10-3 lm2
314 J Petrol Explor Prod Technol (2015) 5:305–314
123